UNITED STATES
SECURITIES AND EXCHANGE COMMISSION
WASHINGTON, D. C. 20549
FORM N-CSR
Investment Company Act file number: 811-05002
Deutsche Variable Series II
(Exact Name of Registrant as Specified in Charter)
345 Park Avenue
New York, NY 10154-0004
(Address of Principal Executive Offices) (Zip Code)
Registrant’s Telephone Number, including Area Code: (212) 250-3220
Paul Schubert
60 Wall Street
New York, NY 10005
(Name and Address of Agent for Service)
| Date of fiscal year end: | 12/31 |
| | |
| Date of reporting period: | 12/31/2014 |
| ITEM 1. | REPORT TO STOCKHOLDERS |
December 31, 2014
Annual Report
Deutsche Variable Series II
(formerly DWS Variable Series II)
Deutsche Alternative Asset Allocation VIP
(formerly DWS Alternative Asset Allocation VIP)
Contents
7 Statement of Assets and Liabilities 8 Statement of Operations 8 Statement of Changes in Net Assets 11 Notes to Financial Statements 15 Report of Independent Registered Public Accounting Firm 16 Information About Your Fund's Expenses 18 Advisory Agreement Board Considerations and Fee Evaluation 21 Board Members and Officers |
This report must be preceded or accompanied by a prospectus. To obtain an additional prospectus or summary prospectus, if available, call (800) 728-3337 or your financial representative. We advise you to consider the Fund's objectives, risks, charges and expenses carefully before investing. The summary prospectus and prospectus contain this and other important information about the Fund. Please read the prospectus carefully before you invest.
Although allocation among different asset categories generally limits risk, portfolio management may favor an asset category that underperforms other assets or markets as a whole. The Fund expects to invest in underlying funds that emphasize alternatives or non-traditional asset categories or investment strategies, and as a result, it is subject to the risk factors of those underlying funds. Some of those risks include stock market risk, credit and interest rate risk, floating rate loan risk, volatility in commodity prices, infrastructure and high-yield debt securities, market direction risk (market advances when short, market declines when long), short sales risk and the political, general economic, liquidity and currency risks of foreign investments, which may be particularly significant for emerging markets. The Fund may use derivatives, including as part of its currency and interest-rate strategies. Investing in derivatives entails special risks relating to liquidity, leverage and credit that may reduce returns and/or increase volatility. The success of the Fund’s currency and interest-rate strategies are dependent, in part, on the effectiveness and implementation of portfolio management’s proprietary models. As part of these strategies, the Fund’s exposure to foreign currencies could cause lower returns or even losses because foreign currency rates may fluctuate significantly over short periods of time for a number of reasons. The risk of loss is heightened during periods of rapid rises in interest rates. In addition, the notional amount of the Fund’s aggregate currency and interest-rate exposure resulting from these strategies may significantly exceed the net assets of the Fund. Because Exchange Traded Funds (ETFs) trade on a securities exchange, their shares may trade at a premium or discount to their net asset value. ETFs also incur fees and expenses so they may not fully match the performance of the indexes they are designed to track. See the prospectus for additional risks and specific details regarding the Fund's risk profile.
Deutsche Asset & Wealth Management represents the asset management and wealth management activities conducted by Deutsche Bank AG or any of its subsidiaries, including the Advisor and DeAWM Distributors, Inc.
NOT FDIC/NCUA INSURED NO BANK GUARANTEE MAY LOSE VALUE NOT A DEPOSIT
NOT INSURED BY ANY FEDERAL GOVERNMENT AGENCY
Performance Summary December 31, 2014 (Unaudited)
Fund performance shown is historical, assumes reinvestment of all dividend and capital gain distributions and does not guarantee future results. Investment return and principal value fluctuate with changing market conditions so that, when redeemed, shares may be worth more or less than their original cost. Current performance may be lower or higher than the performance data quoted. Please contact your participating insurance company for the Fund's most recent month-end performance. Performance doesn't reflect charges and fees ("contract charges") associated with the separate account that invests in the Fund or any variable life insurance policy or variable annuity contract for which the Fund is an investment option. These charges and fees will reduce returns. While all share classes have the same underlying portfolio, their performance will differ.
The gross expense ratios of the Fund, as stated in the fee table of the prospectus dated May 1, 2014 are 1.87% and 2.16% for Class A and Class B shares, respectively, and may differ from the expense ratios disclosed in the Financial Highlights tables in this report. These expense ratios include net expenses of the underlying funds in which the Fund invests.
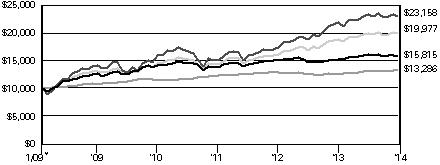
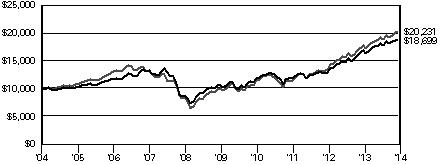
| Growth of an Assumed $10,000 Investment in Deutsche Alternative Asset Allocation VIP from 2/2/09 to 12/31/14 |
| The Morgan Stanley Capital International (MSCI) World Index is a free float-adjusted market capitalization weighted index that is designed to measure the equity market performance of developed markets. The index consists of 24 developed market country indices. The index is calculated using closing local market prices and translates into U.S. dollars using the London close foreign exchange rates. The Barclays U.S. Aggregate Bond Index is an unmanaged index representing domestic taxable investment-grade bonds, with index components for government and corporate securities, mortgage pass-through securities, and asset-backed securities with an average maturity of one year or more. The Blended Index is calculated using the performance of two unmanaged indices, representative of stocks (the MSCI World Index (70%)) and bonds (the Barclays U.S. Aggregate Bond Index (30%)). These results are summed to produce the aggregate benchmark. Index returns do not reflect any fees or expenses and it is not possible to invest directly into an index. |
|
| Yearly periods ended December 31 |
| Comparative Results | |
| Deutsche Alternative Asset Allocation VIP | | 1-Year | | | 3-Year | | | 5-Year | | | Life of Fund* | |
| Class A | Growth of $10,000 | | $ | 10,350 | | | $ | 11,462 | | | $ | 12,521 | | | $ | 15,815 | |
| Average annual total return | | | 3.50 | % | | | 4.65 | % | | | 4.60 | % | | | 8.05 | % |
| MSCI World Index | Growth of $10,000 | | $ | 10,494 | | | $ | 15,397 | | | $ | 16,255 | | | $ | 23,158 | |
| Average annual total return | | | 4.94 | % | | | 15.47 | % | | | 10.20 | % | | | 15.25 | % |
| Barclays U.S. Aggregate Bond Index | Growth of $10,000 | | $ | 10,597 | | | $ | 10,820 | | | $ | 12,431 | | | $ | 13,286 | |
| Average annual total return | | | 5.97 | % | | | 2.66 | % | | | 4.45 | % | | | 4.92 | % |
| Blended Index | Growth of $10,000 | | $ | 10,531 | | | $ | 13,905 | | | $ | 15,200 | | | $ | 19,977 | |
| Average annual total return | | | 5.31 | % | | | 11.62 | % | | | 8.73 | % | | | 12.41 | % |
The growth of $10,000 is cumulative.
* The Fund commenced offering Class A shares on February 2, 2009. The performance shown for each index is for the time period of January 31, 2009 through December 31, 2014, which is based on the performance period of the life of the Fund.
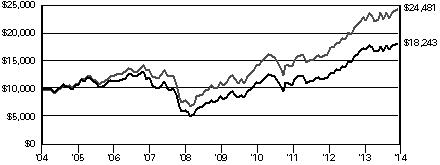
| Comparative Results | |
| Deutsche Alternative Asset Allocation VIP | | 1-Year | | | 3-Year | | | 5-Year | | | Life of Class** | |
| Class B | Growth of $10,000 | | $ | 10,324 | | | $ | 11,375 | | | $ | 12,359 | | | $ | 14,338 | |
| Average annual total return | | | 3.24 | % | | | 4.39 | % | | | 4.33 | % | | | 6.62 | % |
| MSCI World Index | Growth of $10,000 | | $ | 10,494 | | | $ | 15,397 | | | $ | 16,255 | | | $ | 19,778 | |
| Average annual total return | | | 4.94 | % | | | 15.47 | % | | | 10.20 | % | | | 12.99 | % |
| Barclays U.S. Aggregate Bond Index | Growth of $10,000 | | $ | 10,597 | | | $ | 10,820 | | | $ | 12,431 | | | $ | 12,997 | |
| Average annual total return | | | 5.97 | % | | | 2.66 | % | | | 4.45 | % | | | 4.81 | % |
| Blended Index | Growth of $10,000 | | $ | 10,531 | | | $ | 13,905 | | | $ | 15,200 | | | $ | 17,710 | |
| Average annual total return | | | 5.31 | % | | | 11.62 | % | | | 8.73 | % | | | 10.78 | % |
The growth of $10,000 is cumulative.
** The Fund commenced offering Class B shares on May 18, 2009. The performance shown for each index is for the time period of May 31, 2009 through December 31, 2014, which is based on the performance period of the life of Class B.
Management Summary December 31, 2014 (Unaudited)
The Fund returned 3.50% (Class A shares, unadjusted for contract charges) during 2014, while its blended benchmark returned 5.31%.1 We positioned the portfolio for an environment of improving economic growth and gradually rising interest rates during the year ended December 31, 2014. We achieved this in two ways: by tilting the Fund’s exposure toward assets that are influenced by stock market performance and by seeking to minimize its interest rate sensitivity. In addition, we positioned the portfolio to attempt to mitigate the possible effects of rising inflation.
This approach was generally helpful to performance during the first half of the year, cyclical bent served as a counterpoint to the adverse effect of having lower rate sensitivity at a time of favorable performance for the bond market. During the second half, however, concerns about growth pressured the performance of economically sensitive assets. In addition, signs of falling inflation around the globe weighed on the performance of asset classes — including commodities and inflation-protected securities — that tend to perform best when inflation is rising.
For the full year, the largest contributor to the Fund’s results was its allocation to Deutsche Global Infrastructure Fund. Many infrastructure stocks — and the asset class -— outperformed the broader global equity markets during the past year. We reduced this allocation during the fourth quarter, and we redeployed the proceeds into cash. The Fund’s real estate allocation was another positive contributor to performance, as the improving global property markets and investors’ continued demand for higher-yielding securities fueled strength in real estate investment trusts. The Fund also benefited from its allocation to the SPDR Barclays Convertible Securities ETF, which delivered a solid gain at a time of rising stock prices and falling bond yields.2 The Fund’s fixed-income allocation finished the year with a modest gain, with its allocation to Deutsche Global Inflation Fund counterbalanced by the weaker showing of Deutsche Enhanced Emerging Markets Fixed Income Fund and Deutsche Floating Rate Fund.
The largest detractor from performance was our allocation to Deutsche Enhanced Commodity Strategy Fund. While the fund performed well relative to its benchmark, it nonetheless closed the year with a loss due to the substantial second-half weakness in oil and other commodities. We reduced this position during the fourth quarter in order to manage risk. Our position in Deutsche Diversified Market Neutral Fund, while providing a measure of stability to the portfolio during the volatile second half, also finished with a negative return.
Diversification neither assures a profit nor guarantees against loss.
Pankaj Bhatnagar, PhD
Darwei Kung
Portfolio Managers
The views expressed reflect those of the portfolio management team only through the end of the period of the report as stated on the cover. The management team's views are subject to change at any time based on market and other conditions and should not be construed as a recommendation. Past performance is no guarantee of future results. Current and future portfolio holdings are subject to risk.
1 The Blended Index is calculated using the performance of two unmanaged indices, representative of stocks (the Morgan Stanley Capital International (MSCI) World Index (70%) and bonds (the Barclays U.S. Aggregate Bond Index (30%). These results are summed to produce the aggregate benchmark. Index returns do not reflect fees or expenses and it is not possible to invest directly into an index.
2 An ETF is a security that tracks an index, a commodity or a basket of assets like an index fund, but trades like a stock on an exchange.
Portfolio Summary (Unaudited) Asset Allocation* (As a % of Investment Portfolio excluding Cash Equivalents) | 12/31/14 | 12/31/13 |
| |
| Commodity | 10% | 13% |
| Deutsche Enhanced Commodity Strategy Fund | 10% | 13% |
| Real Return | 35% | 25% |
| Deutsche Global Infrastructure Fund | 19% | 16% |
| Deutsche Global Inflation Fund | 7% | 6% |
| Deutsche Real Estate Securities Fund | 5% | — |
| Deutsche Global Real Estate Securities Fund | 3% | 3% |
| Deutsche Real Estate Securities Income Fund | 1% | — |
| Hedge Strategy | 11% | 16% |
| Deutsche Diversified Market Neutral Fund | 10% | 16% |
| Deutsche Strategic Equity Long/Short Fund | 1% | — |
| Currency | 15% | 13% |
| Deutsche Enhanced Emerging Markets Fixed Income Fund | 15% | 11% |
| PowerShares DB U.S. Dollar Index Bullish ETF | — | 2% |
| Opportunistic | 29% | 33% |
| Deutsche Floating Rate Fund | 13% | 16% |
| SPDR Barclays Convertible Securities ETF | 13% | 13% |
| SPDR Barclays Short Term High Yield Bond Fund ETF | 3% | 4% |
| | 100% | 100% |
* Investment strategies will fall into the following categories: Commodities, Real-Return, Hedge Strategy, Currency and Opportunistic. Commodities investments seek to provide exposure to hard assets. Real-Return investments seek to provide a measure of inflation protection. Hedge Strategy investments seek to generate returns independent of the broader markets. Currency investments seek to offer exposure to foreign investments, many of which are not denominated in U.S. dollars. Opportunistic investments seek to offer exposure to categories generally not included in investors' allocations.
Portfolio holdings and characteristics are subject to change.
For more complete details about the Fund's investment portfolio, see page 6.
Following the Fund's fiscal first and third quarter-end, a complete portfolio holdings listing is filed with the SEC on Form N-Q. The form will be available on the SEC's Web site at sec.gov, and it also may be reviewed and copied at the SEC's Public Reference Room in Washington, D.C. Information on the operation of the SEC's Public Reference Room may be obtained by calling (800) SEC-0330. The Fund's portfolio holdings are also posted on deutschefunds.com from time to time. Please see the Fund's current prospectus for more information.
Investment Portfolio December 31, 2014 | | | Shares | | | Value ($) | |
| | | | |
| Mutual Funds 81.3% | |
| Deutsche Diversified Market Neutral Fund "Institutional"* (a) | | | 1,373,826 | | | | 11,773,693 | |
| Deutsche Enhanced Commodity Strategy Fund "Institutional" (a) | | | 819,530 | | | | 11,309,510 | |
| Deutsche Enhanced Emerging Markets Fixed Income Fund "Institutional" (a) | | | 1,657,610 | | | | 16,310,878 | |
| Deutsche Floating Rate Fund "Institutional" (a) | | | 1,595,390 | | | | 14,486,144 | |
| Deutsche Global Inflation Fund "Institutional" (a) | | | 799,778 | | | | 7,965,785 | |
| Deutsche Global Infrastructure Fund "Institutional" (a) | | | 1,383,375 | | | | 20,612,292 | |
| Deutsche Global Real Estate Securities Fund "Institutional" (a) | | | 376,405 | | | | 3,383,883 | |
| Deutsche Real Estate Securities Fund "Institutional" (a) | | | 206,375 | | | | 4,870,451 | |
| Deutsche Real Estate Securities Income Fund "Institutional" (a) | | | 44,979 | | | | 465,079 | |
| Deutsche Strategic Equity Long/Short Fund "Institutional" (a) | | | 87,233 | | | | 836,561 | |
Total Mutual Funds (Cost $91,303,033) | | | | 92,014,276 | |
| | | Shares | | | Value ($) | |
| | | | | | | | | |
| Exchange-Traded Funds 15.2% | |
| SPDR Barclays Convertible Securities | | | 294,890 | | | | 13,827,392 | |
| SPDR Barclays Short Term High Yield Bond Fund | | | 115,467 | | | | 3,338,151 | |
Total Exchange-Traded Funds (Cost $16,534,836) | | | | 17,165,543 | |
| | |
| Cash Equivalents 2.9% | |
| Central Cash Management Fund, 0.06% (a) (b) (Cost $3,316,670) | | | 3,316,670 | | | | 3,316,670 | |
| | | % of Net Assets | | | Value ($) | |
| | | | |
Total Investment Portfolio (Cost $111,154,539)† | | | 99.4 | | | | 112,496,489 | |
| Other Assets and Liabilities, Net | | | 0.6 | | | | 721,377 | |
| Net Assets | | | 100.0 | | | | 113,217,866 | |
† The cost for federal income tax purposes was $112,922,408. At December 31, 2014, net unrealized depreciation for all securities based on tax cost was $425,919. This consisted of aggregate gross unrealized appreciation for all securities in which there was an excess of value over tax cost of $5,936,651 and aggregate gross unrealized depreciation for all securities in which there was an excess of tax cost over value of $6,362,570.
(a) Affiliated fund managed by Deutsche Investment Management Americas Inc.
(b) The rate shown is the annualized seven-day yield at period end.
SPDR: Standard & Poor's Depositary Receipt
Fair Value Measurements
Various inputs are used in determining the value of the Fund's investments. These inputs are summarized in three broad levels. Level 1 includes quoted prices in active markets for identical securities. Level 2 includes other significant observable inputs (including quoted prices for similar securities, interest rates, prepayment speeds and credit risk). Level 3 includes significant unobservable inputs (including the Fund's own assumptions in determining the fair value of investments). The level assigned to the securities valuations may not be an indication of the risk or liquidity associated with investing in those securities.
The following is a summary of the inputs used as of December 31, 2014 in valuing the Fund's investments. For information on the Fund's policy regarding the valuation of investments, please refer to the Security Valuation section of Note A in the accompanying Notes to Financial Statements.
| Assets | | Level 1 | | | Level 2 | | | Level 3 | | | Total | |
| | |
| Mutual Funds | | $ | 92,014,276 | | | $ | — | | | $ | — | | | $ | 92,014,276 | |
| Exchange-Traded Funds | | | 17,165,543 | | | | — | | | | — | | | | 17,165,543 | |
| Short-Term Investment | | | 3,316,670 | | | | — | | | | — | | | | 3,316,670 | |
| Total | | $ | 112,496,489 | | | $ | — | | | $ | — | | | $ | 112,496,489 | |
There have been no transfers between fair value measurement levels during the year ended December 31, 2014.
The accompanying notes are an integral part of the financial statements.
Statement of Assets and Liabilities | as of December 31, 2014 | |
| Assets | |
Investments: Investments in affiliated Underlying Funds, at value (cost $94,619,703) | | $ | 95,330,946 | |
| Investments in non-affiliated Underlying Funds, at value (cost $16,534,836) | | | 17,165,543 | |
| Total investments in securities, at value (cost $111,154,539) | | | 112,496,489 | |
| Cash | | | 5,304 | |
| Receivable for Fund shares sold | | | 129,092 | |
| Dividends receivable | | | 719,335 | |
| Other assets | | | 2,435 | |
| Total assets | | | 113,352,655 | |
| Liabilities | |
| Payable for investments purchased | | | 5,304 | |
| Payable for Fund shares redeemed | | | 19,014 | |
| Accrued Trustees' fees | | | 1,505 | |
| Other accrued expenses and payables | | | 108,966 | |
| Total liabilities | | | 134,789 | |
| Net assets, at value | | $ | 113,217,866 | |
| Net Assets Consist of | |
| Undistributed net investment income | | | 3,120,563 | |
| Net unrealized appreciation (depreciation) on investments | | | 1,341,950 | |
| Accumulated net realized gain (loss) | | | (1,581,347 | ) |
| Paid-in capital | | | 110,336,700 | |
| Net assets, at value | | $ | 113,217,866 | |
Class A Net Asset Value, offering and redemption price per share ($19,668,824 ÷ 1,416,911 outstanding shares of beneficial interest, no par value, unlimited number of shares authorized) | | $ | 13.88 | |
Class B Net Asset Value, offering and redemption price per share ($93,549,042 ÷ 6,744,084 outstanding shares of beneficial interest, no par value, unlimited number of shares authorized) | | $ | 13.87 | |
The accompanying notes are an integral part of the financial statements.
Statement of Operations
| for the year ended December 31, 2014 | |
| Investment Income | |
Income: Income distributions from affiliated Underlying Funds | | $ | 2,284,895 | |
| Dividends | | | 685,990 | |
| Total income | | | 2,970,885 | |
Expenses: Management fee | | | 363,296 | |
| Administration fee | | | 106,055 | |
| Services to shareholders | | | 2,697 | |
| Record keeping fees (Class B) | | | 41,198 | |
| Distribution service fee (Class B) | | | 221,478 | |
| Custodian fee | | | 9,276 | |
| Professional fees | | | 65,082 | |
| Reports to shareholders | | | 42,014 | |
| Trustees' fees and expenses | | | 6,414 | |
| Other | | | 2,514 | |
| Total expenses before expense reductions | | | 860,024 | |
| Expense reductions | | | (299,170 | ) |
| Total expenses after expense reductions | | | 560,854 | |
| Net investment income (loss) | | | 2,410,031 | |
| Realized and Unrealized Gain (Loss) | |
Net realized gain (loss) from: Sale of affiliated Underlying Funds | | | (1,232,736 | ) |
| Sale of non-affiliated Underlying Funds | | | (13,216 | ) |
| Capital gain distributions from affiliated Underlying Funds | | | 1,231,594 | |
| Capital gain distributions from non-affiliated Underlying Funds | | | 381,368 | |
| | | | 367,010 | |
| Change in net unrealized appreciation (depreciation) on investments | | | 335,372 | |
| Net gain (loss) | | | 702,382 | |
| Net increase (decrease) in net assets resulting from operations | | $ | 3,112,413 | |
The accompanying notes are an integral part of the financial statements.
Statement of Changes in Net Assets | | | Years Ended December 31, | |
| Increase (Decrease) in Net Assets | | 2014 | | | 2013 | |
Operations: Net investment income | | $ | 2,410,031 | | | $ | 1,387,313 | |
| Net realized gain (loss) | | | 367,010 | | | | 993,026 | |
| Change in net unrealized appreciation (depreciation) | | | 335,372 | | | | (1,638,087 | ) |
| Net increase (decrease) in net assets resulting from operations | | | 3,112,413 | | | | 742,252 | |
Distributions to shareholders from: Net investment income: Class A | | | (310,914 | ) | | | (218,625 | ) |
| Class B | | | (1,375,733 | ) | | | (1,281,892 | ) |
Net realized gains: Class A | | | (99,727 | ) | | | — | |
| Class B | | | (510,421 | ) | | | — | |
| Total distributions | | | (2,296,795 | ) | | | (1,500,517 | ) |
Fund share transactions: Class A Proceeds from shares sold | | | 5,912,399 | | | | 6,694,957 | |
| Reinvestment of distributions | | | 410,641 | | | | 218,625 | |
| Payments for shares redeemed | | | (1,499,503 | ) | | | (2,104,739 | ) |
| Net increase (decrease) in net assets from Class A share transactions | | | 4,823,537 | | | | 4,808,843 | |
Class B Proceeds from shares sold | | | 15,772,435 | | | | 31,914,829 | |
| Reinvestment of distributions | | | 1,886,154 | | | | 1,281,892 | |
| Payments for shares redeemed | | | (8,841,659 | ) | | | (10,503,907 | ) |
| Net increase (decrease) in net assets from Class B share transactions | | | 8,816,930 | | | | 22,692,814 | |
| Increase (decrease) in net assets | | | 14,456,085 | | | | 26,743,392 | |
| Net assets at beginning of period | | | 98,761,781 | | | | 72,018,389 | |
| Net assets at end of period (including undistributed net investment income of $3,120,563 and $1,652,423, respectively) | | $ | 113,217,866 | | | $ | 98,761,781 | |
| Other Information | |
Class A Shares outstanding at beginning of period | | | 1,072,115 | | | | 720,220 | |
| Shares sold | | | 422,091 | | | | 490,282 | |
| Shares issued to shareholders in reinvestment of distributions | | | 29,692 | | | | 15,638 | |
| Shares redeemed | | | (106,987 | ) | | | (154,025 | ) |
| Net increase (decrease) in Class A shares | | | 344,796 | | | | 351,895 | |
| Shares outstanding at end of period | | | 1,416,911 | | | | 1,072,115 | |
Class B Shares outstanding at beginning of period | | | 6,114,865 | | | | 4,466,071 | |
| Shares sold | | | 1,125,357 | | | | 2,327,269 | |
| Shares issued to shareholders in reinvestment of distributions | | | 136,283 | | | | 91,629 | |
| Shares redeemed | | | (632,421 | ) | | | (770,104 | ) |
| Net increase (decrease) in Class B shares | | | 629,219 | | | | 1,648,794 | |
| Shares outstanding at end of period | | | 6,744,084 | | | | 6,114,865 | |
The accompanying notes are an integral part of the financial statements.
| | | Years Ended December 31, | |
| Class A | | | 2014 | | | 2013 | | | 2012 | | | 2011 | | | 2010 | |
| Selected Per Share Data | |
| Net asset value, beginning of period | | $ | 13.75 | | | $ | 13.90 | | | $ | 13.24 | | | $ | 13.85 | | | $ | 12.63 | |
Income (loss) from investment operations: Net investment incomea | | | .36 | | | | .26 | | | | .33 | | | | .64 | | | | .46 | |
| Net realized and unrealized gain (loss) | | | .13 | | | | (.13 | ) | | | .93 | | | | (1.02 | ) | | | 1.09 | |
| Total from investment operations | | | .49 | | | | .13 | | | | 1.26 | | | | (.38 | ) | | | 1.55 | |
Less distributions from: Net investment income | | | (.27 | ) | | | (.28 | ) | | | (.49 | ) | | | (.19 | ) | | | (.18 | ) |
| Net realized gains | | | (.09 | ) | | | — | | | | (.11 | ) | | | (.04 | ) | | | (.15 | ) |
| Total distributions | | | (.36 | ) | | | (.28 | ) | | | (.60 | ) | | | (.23 | ) | | | (.33 | ) |
| Net asset value, end of period | | $ | 13.88 | | | $ | 13.75 | | | $ | 13.90 | | | $ | 13.24 | | | $ | 13.85 | |
Total Return (%)b,c | | | 3.50 | | | | .93 | | | | 9.72 | | | | (2.87 | ) | | | 12.46 | |
| Ratios to Average Net Assets and Supplemental Data | |
| Net assets, end of period ($ millions) | | | 20 | | | | 15 | | | | 10 | | | | 7 | | | | 5 | |
Ratio of expenses before expense reductions (%)d | | | .56 | | | | .64 | | | | .63 | | | | .61 | | | | .94 | |
Ratio of expenses after expense reductions (%)d | | | .32 | | | | .27 | | | | .30 | | | | .30 | | | | .21 | |
| Ratio of net investment income (%) | | | 2.54 | | | | 1.86 | | | | 2.46 | | | | 4.72 | | | | 3.51 | |
| Portfolio turnover rate (%) | | | 28 | | | | 40 | | | | 22 | | | | 39 | | | | 6 | |
a Based on average shares outstanding during the period. b Total return would have been lower had certain expenses not been reduced. c Total return would have been lower if the Advisor had not reduced some Underlying Deutsche Funds' expenses. d The Fund invests in other Funds and indirectly bears its proportionate share of fees and expenses incurred by the Underlying Funds in which the Fund is invested. This ratio does not include these indirect fees and expenses. | |
| | | Years Ended December 31, | |
| Class B | | | 2014 | | | 2013 | | | 2012 | | | 2011 | | | 2010 | |
| Selected Per Share Data | |
| Net asset value, beginning of period | | $ | 13.74 | | | $ | 13.88 | | | $ | 13.23 | | | $ | 13.84 | | | $ | 12.61 | |
Income (loss) from investment operations: Net investment incomea | | | .31 | | | | .22 | | | | .30 | | | | .61 | | | | .42 | |
| Net realized and unrealized gain (loss) | | | .14 | | | | (.11 | ) | | | .91 | | | | (1.03 | ) | | | 1.09 | |
| Total from investment operations | | | .45 | | | | .11 | | | | 1.21 | | | | (.42 | ) | | | 1.51 | |
Less distributions from: Net investment income | | | (.23 | ) | | | (.25 | ) | | | (.45 | ) | | | (.15 | ) | | | (.13 | ) |
| Net realized gains | | | (.09 | ) | | | — | | | | (.11 | ) | | | (.04 | ) | | | (.15 | ) |
| Total distributions | | | (.32 | ) | | | (.25 | ) | | | (.56 | ) | | | (.19 | ) | | | (.28 | ) |
| Net asset value, end of period | | $ | 13.87 | | | $ | 13.74 | | | $ | 13.88 | | | $ | 13.23 | | | $ | 13.84 | |
Total Return (%)b,c | | | 3.24 | | | | .75 | | | | 9.36 | | | | (3.12 | ) | | | 12.15 | |
| Ratios to Average Net Assets and Supplemental Data | |
| Net assets, end of period ($ millions) | | | 94 | | | | 84 | | | | 62 | | | | 41 | | | | 23 | |
Ratio of expenses before expense reductions (%)d | | | .86 | | | | .93 | | | | .88 | | | | .86 | | | | 1.19 | |
Ratio of expenses after expense reductions (%)d | | | .57 | | | | .52 | | | | .55 | | | | .55 | | | | .46 | |
| Ratio of net investment income (%) | | | 2.22 | | | | 1.57 | | | | 2.25 | | | | 4.47 | | | | 3.26 | |
| Portfolio turnover rate (%) | | | 28 | | | | 40 | | | | 22 | | | | 39 | | | | 6 | |
a Based on average shares outstanding during the period. b Total return would have been lower had certain expenses not been reduced. c Total return would have been lower if the Advisor had not reduced some Underlying Deutsche Funds' expenses. d The Fund invests in other Funds and indirectly bears its proportionate share of fees and expenses incurred by the Underlying Funds in which the Fund is invested. This ratio does not include these indirect fees and expenses. | |
Notes to Financial Statements
A. Organization and Significant Accounting Policies
Deutsche Alternative Asset Allocation VIP (formerly DWS Alternative Asset Allocation VIP) (the "Fund") is a diversified series of Deutsche Variable Series II (formerly DWS Variable Series II) (the "Trust"), which is registered under the Investment Company Act of 1940, as amended (the "1940 Act"), as an open-end management investment company organized as a Massachusetts business trust. The Fund mainly invests in other affiliated Deutsche funds (i.e. mutual funds, exchange-traded funds and other pooled investment vehicles managed by Deutsche Investment Management Americas Inc. or one of its affiliates, together the "Underlying Deutsche Funds"), non-affiliated exchange-traded funds ("Non-affiliated ETFs") and derivative investments. Non-affiliated ETFs and Underlying Deutsche Funds are collectively referred to as "Underlying Funds." During the year ended December 31, 2014, the Fund primarily invested in underlying Deutsche Funds and non-affiliated ETFs. Each Underlying Deutsche Fund's accounting policies and investment holdings are outlined in the Underlying Deutsche Funds' financial statements and are available upon request.
Multiple Classes of Shares of Beneficial Interest. The Fund offers two classes of shares (Class A shares and Class B shares). Sales of Class B shares are subject to recordkeeping fees up to 0.15% and Rule 12b-1 fees under the 1940 Act equal to an annual rate of 0.25% of the average daily net assets of the Class B shares of the Fund. Class A shares are not subject to such fees.
Investment income, realized and unrealized gains and losses, and certain fund-level expenses and expense reductions, if any, are borne pro rata on the basis of relative net assets by the holders of all classes of shares except that each class bears certain expenses unique to that class (including the applicable Rule 12b-1 fee). Differences in class-level expenses may result in payment of different per share dividends by class. All shares have equal rights with respect to voting subject to class-specific arrangements.
The Fund's financial statements are prepared in accordance with accounting principles generally accepted in the United States of America which require the use of management estimates. Actual results could differ from those estimates. The policies described below are followed consistently by the Fund in the preparation of its financial statements.
Security Valuation. Investments are stated at value determined as of the close of regular trading on the New York Stock Exchange on each day the exchange is open for trading.
Various inputs are used in determining the value of the Fund's investments. These inputs are summarized in three broad levels. Level 1 includes quoted prices in active markets for identical securities. Level 2 includes other significant observable inputs (including quoted prices for similar securities, interest rates, prepayment speeds and credit risk). Level 3 includes significant unobservable inputs (including the Fund's own assumptions in determining the fair value of investments). The level assigned to the securities valuations may not be an indication of the risk or liquidity associated with investing in those securities.
Investments in mutual funds are valued at the net asset value per share of each class of the Underlying Deutsche Funds and are categorized as Level 1.
ETFs are valued at the most recent sale price or official closing price reported on the exchange (U.S. or foreign) or over-the-counter market on which they trade. ETFs for which no sales are reported are valued at the calculated mean between the most recent bid and asked quotations on the relevant market or, if a mean cannot be determined, at the most recent bid quotation. ETF securities are generally categorized as Level 1.
Disclosure about the classification of fair value measurements is included in a table following the Fund's Investment Portfolio.
Federal Income Taxes. The Fund's policy is to comply with the requirements of the Internal Revenue Code, as amended, which are applicable to regulated investment companies and to distribute all of its taxable income to its shareholders.
The Fund has reviewed the tax positions for the open tax years as of December 31, 2014 and has determined that no provision for income tax and/or uncertain tax provisions is required in the Fund's financial statements. The Fund's federal tax returns for the prior three fiscal years remain open subject to examination by the Internal Revenue Service.
Distribution of Income and Gains. Distributions from net investment income of the Fund, if any, are declared and distributed to shareholders annually. Net realized gains from investment transactions, in excess of available capital loss carryforwards, would be taxable to the Fund if not distributed and, therefore, will be distributed to shareholders at least annually. The Fund may also make additional distributions for tax purposes if necessary.
The timing and characterization of certain income and capital gain distributions are determined annually in accordance with federal tax regulations which may differ from accounting principles generally accepted in the United States of America. These differences primarily relate to certain securities sold at a loss and capital gain distributions from Underlying Funds. As a result, net investment income (loss) and net realized gain (loss) on investment transactions for a reporting period may differ significantly from distributions during such period. Accordingly, the Fund may periodically make reclassifications among certain of its capital accounts without impacting the net asset value of the Fund.
At December 31, 2014, the Fund's components of distributable earnings on a tax basis were as follows:
| Undistributed ordinary income* | | $ | 3,120,563 | |
| Undistributed long-term capital gains | | $ | 186,522 | |
| Unrealized appreciation (depreciation) on investments | | $ | (425,919 | ) |
In addition, the tax character of distributions paid by the Fund is summarized as follows:
| | | Years Ended December 31, | |
| | | 2014 | | | 2013 | |
| Distributions from ordinary income* | | $ | 1,686,647 | | | $ | 1,500,517 | |
| Distributions from long-term capital gains | | $ | 610,148 | | | $ | — | |
* For tax purposes, short-term capital gain distributions are considered ordinary income distributions.
Expenses. Expenses of the Trust arising in connection with a specific fund are allocated to that fund. Other Trust expenses which cannot be directly attributed to a fund are apportioned among the funds in the Trust based upon the relative net assets or other appropriate measures.
Contingencies. In the normal course of business, the Fund may enter into contracts with service providers that contain general indemnification clauses. The Fund's maximum exposure under these arrangements is unknown as this would involve future claims that may be made against the Fund that have not yet been made. However, based on experience, the Fund expects the risk of loss to be remote.
Other. Investment transactions are accounted for on a trade date plus one basis for daily net asset value calculations. However, for financial reporting purposes, investment transactions are reported on trade date. Interest income is recorded on the accrual basis. Dividend Income is recorded on the ex-dividend date. Distributions of income and capital gains from the Underlying Funds are recorded on the ex-dividend date. Realized gains and losses from investment transactions are recorded on an identified cost basis.
B. Purchases and Sales of Securities
During the year ended December 31, 2014, purchases and sales of affiliated Underlying Funds (excluding money market funds) aggregated $30,047,643 and $18,431,237, respectively. Purchases and sales of Non-affiliated ETFs aggregated $11,891,340 and $10,809,088, respectively.
C. Related Parties
Management Agreement. Under the Investment Management Agreement with Deutsche Investment Management Americas Inc. ("DIMA" or the "Advisor"), an indirect, wholly owned subsidiary of Deutsche Bank AG, the Advisor directs the investments of the Fund in accordance with its investment objectives, policies and restrictions. The Advisor determines the securities, instruments and other contracts relating to investments in Underlying Funds to be purchased, sold or entered into by the Fund or delegates such responsibility to the Fund's subadvisors.
RREEF America L.L.C. ("RREEF") acts as an investment subadvisor to the Fund. As an investment subadvisor to the Fund, RREEF provides investment management services to the portions of the Fund's portfolio allocated to direct investments in global real estate and global infrastructure securities. RREEF is paid by the Advisor for the services RREEF provides to the Fund. As of the date of this report, the Fund obtained its exposure to global real estate and global infrastructure securities indirectly through investments in other Underlying Deutsche Funds.
The Fund does not invest in the Underlying Deutsche Funds for the purpose of exercising management or control; however, investments within the set limits may represent 5% or more of an Underlying Deutsche Fund's outstanding shares. At December 31, 2014, the Fund held 5% or greater of the following Underlying Deutsche Fund's outstanding shares: approximately 7% of Deutsche Enhanced Emerging Markets Fixed Income Fund, 6% of Deutsche Diversified Market Neutral Fund and 5% of Deutsche Global Inflation Fund.
Pursuant to the Investment Management Agreement with the Advisor, the Fund pays a monthly management fee based on the Fund's average daily net assets, computed and accrued daily and payable monthly, at the following annual rates:
| On assets invested in other Deutsche Funds | .20% |
| On assets invested in all other assets not considered Deutsche Funds | 1.20% |
In addition, the Advisor will receive management fees from managing the Underlying Deutsche Funds in which the Fund invests.
Accordingly, for the year ended December 31, 2014, the fee pursuant to the Investment Management Agreement was equivalent to an annual rate (exclusive of any applicable waivers/reimbursements) of 0.34% of the Fund's average daily net assets.
For the period from January 1, 2014 through April 30, 2015, the Advisor has contractually agreed to waive its fee and/or reimburse certain operating expenses to the extent necessary to maintain the operating expenses (excluding certain expenses such as extraordinary expenses, taxes, brokerage, interest expense and Underlying Funds) of each class as follows:
For the year ended December 31, 2014, the Advisor agreed to waive 0.15% of the monthly management fee based on average daily net assets for the Fund.
For the year ended December 31, 2014, fees waived and/or expenses reimbursed for each class are as follows:
| Class A | | $ | 42,504 | |
| Class B | | | 256,666 | |
| | | $ | 299,170 | |
The Fund indirectly bears its proportionate share of fees and expenses incurred by the Underlying Funds in which it is invested.
Administration Fee. Pursuant to an Administrative Services Agreement, DIMA provides most administrative services to the Fund. For all services provided under the Administrative Services Agreement, the Fund pays DIMA an annual fee ("Administration Fee") of 0.10% of the Fund's average daily net assets, computed and accrued daily and payable monthly. For the year ended December 31, 2014, the Administration Fee was $106,055, of which $9,546 is unpaid.
Service Provider Fees. DeAWM Service Company ("DSC"), an affiliate of the Advisor, is the transfer agent, dividend-paying agent and shareholder service agent for the Fund. Pursuant to a sub-transfer agency agreement between DSC and DST Systems, Inc. ("DST"), DSC has delegated certain transfer agent, dividend-paying agent and shareholder service agent functions to DST. DSC compensates DST out of the shareholder servicing fee it receives from the Fund. For the year ended December 31, 2014, the amounts charged to the Fund by DSC were as follows:
| Services to Shareholders | | Total Aggregated | | | Unpaid at December 31, 2014 | |
| Class A | | $ | 107 | | | $ | 16 | |
| Class B | | | 146 | | | | 24 | |
| | | $ | 253 | | | $ | 40 | |
Distribution Service Agreement. Under the Fund's Class B 12b-1 plans, DeAWM Distributors, Inc. ("DDI") received a fee ("Distribution Service Fee") of 0.25% of average daily net assets of Class B shares. For the year ended December 31, 2014, the Distribution Service Fee aggregated $221,478, of which $19,784 is unpaid.
Typesetting and Filing Service Fees. Under an agreement with DIMA, DIMA is compensated for providing typesetting and certain regulatory filing services to the Fund. For the year ended December 31, 2014, the amount charged to the Fund by DIMA included in the Statement of Operations under "Reports to shareholders" aggregated $19,175, of which $6,771 is unpaid.
Trustees' Fees and Expenses. The Fund paid retainer fees to each Trustee not affiliated with the Advisor, plus specified amounts to the Board Chairperson and Vice Chairperson and to each committee Chairperson.
Affiliated Cash Management Vehicles. The Fund may invest uninvested cash balances in Central Cash Management Fund and Deutsche Variable NAV Money Fund, affiliated money market funds which are managed by the Advisor. Each affiliated money market fund seeks to provide a high level of current income consistent with liquidity and the preservation of capital. Each affiliated money market fund is managed in accordance with Rule 2a-7 under the Investment Company Act of 1940, which governs the quality, maturity, diversity and liquidity of instruments in which a money market fund may invest. Central Cash Management Fund seeks to maintain a stable net asset value, and Deutsche Variable NAV Money Fund maintains a floating net asset value. The Fund indirectly bears its proportionate share of the expenses of each affiliated money market fund in which it invests. Central Cash Management Fund does not pay the Advisor an investment management fee. To the extent that Deutsche Variable NAV Money Fund pays an investment management fee to the Advisor, the Advisor will waive an amount of the investment management fee payable to the Advisor by the Fund equal to the amount of the investment management fee payable on the Fund's assets invested in Deutsche Variable NAV Money Fund.
D. Ownership of the Fund
At December 31, 2014, one participating insurance company was the owner of record of 10% or more of the total outstanding Class A shares of the Fund, owning 98%. Two participating insurance companies were the owner of record of 10% or more of the total outstanding Class B shares of the Fund, owning 63% and 31%, respectively.
E. Transactions with Affiliates
The Fund mainly invest in Underlying Deutsche Funds and Non-affiliated ETFs. The Underlying Deutsche Funds in which the Fund invests are considered to be affiliated investments. A summary of the Fund's transactions with affiliated Underlying Deutsche Funds during the year ended December 31, 2014 is as follows:
| Affiliate | | Value ($) at 12/31/2013 | | | Purchases Cost ($) | | | Sales Cost ($) | | | Realized Gain/ (Loss) ($) | | | Income Distributions ($) | | | Capital Gain Distributions ($) | | | Value ($) at 12/31/2014 | |
| Deutsche Diversified Market Neutral Fund | | | 15,082,780 | | | | 1,227,000 | | | | 4,232,000 | | | | (503,884 | ) | | | — | | | | — | | | | 11,773,693 | |
Deutsche Enhanced Commodity Strategy Fund | | | 12,886,360 | | | | 2,795,548 | | | | 3,215,000 | | | | (786,253 | ) | | | 408,548 | | | | — | | | | 11,309,510 | |
| Deutsche Enhanced Emerging Markets Fixed Income Fund | | | 10,792,537 | | | | 6,850,557 | | | | 321,000 | | | | (6,859 | ) | | | 589,557 | | | | — | | | | 16,310,878 | |
| Deutsche Floating Rate Fund | | | 15,542,833 | | | | 3,220,477 | | | | 3,628,000 | | | | (39,662 | ) | | | 656,478 | | | | — | | | | 14,486,144 | |
Deutsche Global Inflation Fund | | | 6,138,642 | | | | 2,525,007 | | | | 774,000 | | | | (61,421 | ) | | | 168,006 | | | | — | | | | 7,965,785 | |
| Deutsche Global Infrastructure Fund | | | 15,685,285 | | | | 4,780,500 | | | | 1,812,000 | | | | 43,995 | | | | 273,226 | | | | 903,274 | | | | 20,612,292 | |
| Deutsche Global Real Estate Securities Fund | | | 2,972,636 | | | | 1,497,143 | | | | 1,393,000 | | | | 168,225 | | | | 110,144 | | | | — | | | | 3,383,883 | |
| Deutsche Real Estate Securities Fund | | | — | | | | 5,733,582 | | | | 1,035,000 | | | | 17,035 | | | | 60,159 | | | | 297,423 | | | | 4,870,451 | |
| Deutsche Real Estate Securities Income Fund | | | — | | | | 484,079 | | | | — | | | | — | | | | 14,253 | | | | 28,826 | | | | 465,079 | |
| Deutsche Strategic Equity Long/Short Fund | | | — | | | | 850,304 | | | | — | | | | — | | | | 3,233 | | | | 2,071 | | | | 836,561 | |
| PowerShares DB U.S. Dollar Index Bullish Fund | | | 1,951,369 | | | | 83,446 | | | | 2,021,237 | | | | (63,912 | ) | | | — | | | | — | | | | — | |
| Central Cash Management Fund | | | 978,747 | | | | 30,080,527 | | | | 27,742,604 | | | | — | | | | 1,291 | | | | — | | | | 3,316,670 | |
| Total | | | 82,031,189 | | | | 60,128,170 | | | | 46,173,841 | | | | (1,232,736 | ) | | | 2,284,895 | | | | 1,231,594 | | | | 95,330,946 | |
Report of Independent Registered Public Accounting Firm
To the Board of Trustees of Deutsche Variable Series II and Shareholders of Deutsche Alternative Asset Allocation VIP:
We have audited the accompanying statement of assets and liabilities, including the investment portfolio, of Deutsche Alternative Asset Allocation VIP (formerly DWS Alternative Asset Allocation VIP) (the "Fund") (one of the series constituting Deutsche Variable Series II (formerly DWS Variable Series II)), as of December 31, 2014, and the related statement of operations for the year then ended, the statements of changes in net assets for each of the two years in the period then ended, and the financial highlights for each of the periods indicated therein. These financial statements and financial highlights are the responsibility of the Fund’s management. Our responsibility is to express an opinion on these financial statements and financial highlights based on our audits.
We conducted our audits in accordance with the standards of the Public Company Accounting Oversight Board (United States). Those standards require that we plan and perform the audit to obtain reasonable assurance about whether the financial statements and financial highlights are free of material misstatement. We were not engaged to perform an audit of the Fund’s internal control over financial reporting. Our audits included consideration of internal control over financial reporting as a basis for designing audit procedures that are appropriate in the circumstances, but not for the purpose of expressing an opinion on the effectiveness of the Fund’s internal control over financial reporting. Accordingly, we express no such opinion. An audit also includes examining, on a test basis, evidence supporting the amounts and disclosures in the financial statements and financial highlights, assessing the accounting principles used and significant estimates made by management, and evaluating the overall financial statement presentation. Our procedures included confirmation of securities owned as of December 31, 2014, by correspondence with the custodian and brokers. We believe that our audits provide a reasonable basis for our opinion.
In our opinion, the financial statements and financial highlights referred to above present fairly, in all material respects, the financial position of Deutsche Alternative Asset Allocation VIP at December 31, 2014, the results of its operations for the year then ended, the changes in its net assets for each of the two years in the period then ended, and the financial highlights for each of the periods indicated therein, in conformity with U.S. generally accepted accounting principles.
| | | |
Boston, Massachusetts February 13, 2015 | | |
Information About Your Fund's Expenses (Unaudited)
As an investor of the Fund, you incur two types of costs: ongoing expenses and transaction costs. Ongoing expenses include management fees, distribution and service (12b-1) fees and other Fund expenses. Examples of transaction costs include contract charges, which are not shown in this section. The following tables are intended to help you understand your ongoing expenses (in dollars) of investing in the Fund and to help you compare these expenses with the ongoing expenses of investing in other mutual funds. In addition to the ongoing expenses which the Fund bears directly, the Fund's shareholders indirectly bear the expense of the Underlying Funds in which the Fund invests. These expenses are not included in the Fund's annualized expense ratios used to calculate the expense estimate in the tables. In the most recent six-month period, the Fund limited the ongoing expenses the Fund bears directly; had it not done so, expenses would have been higher. The examples in the table are based on an investment of $1,000 invested at the beginning of the six-month period and held for the entire period (July 1, 2014 to December 31, 2014).
The tables illustrate your Fund's expenses in two ways:
—Actual Fund Return. This helps you estimate the actual dollar amount of ongoing expenses (but not transaction costs) paid on a $1,000 investment in the Fund using the Fund's actual return during the period. To estimate the expenses you paid over the period, simply divide your account value by $1,000 (for example, an $8,600 account value divided by $1,000 = 8.6), then multiply the result by the number in the "Expenses Paid per $1,000" line under the share class you hold.
—Hypothetical 5% Fund Return. This helps you to compare your Fund's ongoing expenses (but not transaction costs) with those of other mutual funds using the Fund's actual expense ratio and a hypothetical rate of return of 5% per year before expenses. Examples using a 5% hypothetical Fund return may be found in the shareholder reports of other mutual funds. The hypothetical account values and expenses may not be used to estimate the actual ending account balance or expenses you paid for the period.
Please note that the expenses shown in these tables are meant to highlight your ongoing expenses only and do not reflect any transaction costs. The "Expenses Paid per $1,000" line of the tables is useful in comparing ongoing expenses only and will not help you determine the relative total expense of owning different funds. If these transaction costs had been included, your costs would have been higher.
Expenses and Value of a $1,000 Investment for the six months ended December 31, 2014 | |
| Actual Fund Return | | Class A | | | Class B | |
| Beginning Account Value 7/1/14 | | $ | 1,000.00 | | | $ | 1,000.00 | |
| Ending Account Value 12/31/14 | | $ | 976.80 | | | $ | 975.40 | |
| Expenses Paid per $1,000* | | $ | 1.59 | | | $ | 2.84 | |
| Hypothetical 5% Fund Return | | Class A | | | Class B | |
| Beginning Account Value 7/1/14 | | $ | 1,000.00 | | | $ | 1,000.00 | |
| Ending Account Value 12/31/14 | | $ | 1.023.59 | | | $ | 1,022.33 | |
| Expenses Paid per $1,000* | | $ | 1.63 | | | $ | 2.91 | |
* Expenses are equal to the Fund's annualized expense ratio for each share class, multiplied by the average account value over the period, multiplied by 184 (the number of days in the most recent six-month period), then divided by 365.
| Annualized Expense Ratios** | | Class A | | Class B | |
| Deutsche Variable Series II — Deutsche Alternative Asset Allocation VIP | | .32% | | .57% | |
** The Fund invests in other funds and indirectly bears its proportionate share of fees and expenses incurred by the Underlying Funds in which the Fund is invested. These ratios do not include these indirect fees and expenses.
For more information, please refer to the Fund's prospectus.
These tables do not reflect charges and fees ("contract charges") associated with the separate account that invests in the Fund or any variable life insurance policy or variable annuity contract for which the Fund is an investment option.
For an analysis of the fees associated with an investment in the fund or similar funds, please refer to the current and hypothetical expense calculators for Variable Insurance Products which can be found at deutschefunds.com/EN/resources/calculators.jsp.
Tax Information (Unaudited)
The Fund paid distributions of $0.085 per share from net long-term capital gains during its year ended December 31, 2014.
Pursuant to Section 852 of the Internal Revenue Code, the Fund designates $244,000 as capital gain dividends for its year ended December 31, 2014.
For corporate shareholders, 11% of income dividends paid during the Fund's fiscal year ended December 31, 2014 qualified for the dividends received deduction.
Please consult a tax advisor if you have questions about federal or state income tax laws, or on how to prepare your tax returns. If you have specific questions about your account, please contact your insurance provider.
The Trust's policies and procedures for voting proxies for portfolio securities and information about how the Trust voted proxies related to its portfolio securities during the 12-month period ended June 30 are available on our Web site — deutschefunds.com (click on "proxy voting" at the bottom of the page) — or on the SEC's Web site — sec.gov. To obtain a written copy of the Trust's policies and procedures without charge, upon request, call us toll free at (800) 728-3337.
Advisory Agreement Board Considerations and Fee Evaluation
The Board of Trustees approved the renewal of Deutsche Alternative Asset Allocation VIP’s investment management agreement (the "Agreement") with Deutsche Investment Management Americas Inc. ("DIMA") and sub-advisory agreement (the "Sub-Advisory Agreement" and together with the Agreement, the "Agreements") between DIMA and RREEF America L.L.C. ("RREEF"), an affiliate of DIMA, in September 2014.
In terms of the process that the Board followed prior to approving the Agreements, shareholders should know that:
— In September 2014, all of the Fund’s Trustees were independent of DIMA and its affiliates.
— The Trustees met frequently during the past year to discuss fund matters and dedicated a substantial amount of time to contract review matters. Over the course of several months, the Board’s Contract Committee, in coordination with the Board’s Fixed Income and Asset Allocation Oversight Committee, reviewed comprehensive materials received from DIMA, independent third parties and independent counsel. These materials included an analysis of the Fund’s performance, fees and expenses, and profitability compiled by a fee consultant retained by the Fund’s Independent Trustees (the "Fee Consultant"). The Board also received extensive information throughout the year regarding performance of the Fund.
— The Independent Trustees regularly meet privately with counsel to discuss contract review and other matters. In addition, the Independent Trustees were advised by the Fee Consultant in the course of their review of the Fund’s contractual arrangements and considered a comprehensive report prepared by the Fee Consultant in connection with their deliberations.
— In connection with reviewing the Agreements, the Board also reviewed the terms of the Fund’s Rule 12b-1 plan, distribution agreement, administrative services agreement, transfer agency agreement and other material service agreements.
— Based on its evaluation of the information provided, the Contract Committee presented its findings and recommendations to the Board. The Board then reviewed the Contract Committee’s findings and recommendations.
In connection with the contract review process, the Contract Committee and the Board considered the factors discussed below, among others. The Board also considered that DIMA has managed the Fund since its inception, and the Board believes that a long-term relationship with a capable, conscientious advisor is in the best interests of the Fund. The Board considered, generally, that shareholders chose to invest or remain invested in the Fund knowing that DIMA managed the Fund. DIMA and RREEF are part of Deutsche Bank AG ("DB"), a major global banking institution that is engaged in a wide range of financial services. The Board believes that there are advantages to being part of a global asset management business that offers a wide range of investing expertise and resources, including hundreds of portfolio managers and analysts with research capabilities in many countries throughout the world.
As part of the contract review process, the Board carefully considered the fees and expenses of each Deutsche fund overseen by the Board in light of the fund’s performance. In many cases, this led to the negotiation and implementation of expense caps. As part of these negotiations, the Board indicated that it would consider relaxing these caps in future years following sustained improvements in performance, among other considerations.
In 2012, DB combined its Asset Management (of which DIMA was a part) and Wealth Management divisions into a new Asset and Wealth Management ("AWM") division. DB has advised the Independent Trustees that the U.S. asset management business is a critical and integral part of DB, and that DB will continue to invest in AWM a significant portion of the savings it has realized by combining its Asset and Wealth Management divisions, including ongoing enhancements to AWM’s investment capabilities. DB also has confirmed its commitment to maintaining strong legal and compliance groups within the AWM division.
While shareholders may focus primarily on fund performance and fees, the Fund’s Board considers these and many other factors, including the quality and integrity of DIMA’s and RREEF’s personnel and such other issues as back-office operations, fund valuations, and compliance policies and procedures.
Nature, Quality and Extent of Services. The Board considered the terms of the Agreements, including the scope of advisory services provided under the Agreements. The Board noted that, under the Agreements, DIMA and RREEF provide portfolio management services to the Fund and that, pursuant to a separate administrative services agreement, DIMA provides administrative services to the Fund. The Board considered the experience and skills of senior management and investment personnel, the resources made available to such personnel, the ability of DIMA to attract and retain high-quality personnel, and the organizational depth and stability of DIMA. The Board also requested and received information regarding DIMA’s oversight of Fund sub-advisors, including RREEF. The Board reviewed the Fund’s performance over short-term and long-term periods and compared those returns to various agreed-upon performance measures, including market index(es) and a peer universe compiled by the Fee Consultant using information supplied by Morningstar Direct ("Morningstar"), an independent fund data service. The Board also noted that it has put into place a process of identifying "Focus Funds" (e.g., funds performing poorly relative to a peer universe), and receives more frequent reporting and information from DIMA regarding such funds, along with DIMA’s plans to address underperformance. The Board believes this process is an effective manner of identifying and addressing underperforming funds. Based on the information provided, the Board noted that for the one- and three-year periods ended December 31, 2013, the Fund’s performance (Class A shares) was in the 4th quartile and 1st quartile, respectively, of the applicable Morningstar universe (the 1st quartile being the best performers and the 4th quartile being the worst performers). The Board also observed that the Fund has underperformed its benchmark in the one- and three-year periods ended December 31, 2013. The Board noted the disappointing investment performance of the Fund in recent periods and continued to discuss with senior management of DIMA the factors contributing to such underperformance and actions being taken to improve performance. The Board observed that the Fund had experienced improved relative performance during the first seven months of 2014. The Board recognized the efforts by DIMA in recent years to enhance its investment platform and improve long-term performance across the Deutsche fund complex.
Fees and Expenses. The Board considered the Fund’s investment management fee schedule, sub-advisory fee schedule, operating expenses and total expense ratios, and comparative information provided by Lipper Inc. ("Lipper") and the Fee Consultant regarding investment management fee rates paid to other investment advisors by similar funds (1st quartile being the most favorable and 4th quartile being the least favorable). With respect to management fees paid to other investment advisors by similar funds, the Board noted that the contractual fee rates paid by the Fund, which include a 0.10% fee paid to DIMA under the Fund’s administrative services agreement, were higher than the median (4th quartile) of the applicable Lipper peer group (based on Lipper data provided as of December 31, 2013). With respect to the sub-advisory fee paid to RREEF, the Board noted that the fee is paid by DIMA out of its fee and not directly by the Fund. The Board noted that the Fund’s Class A shares total (net) operating expenses were expected to be higher than the median (3rd quartile) of the applicable Lipper expense universe (based on Lipper data provided as of December 31, 2013, and analyzing Lipper expense universe Class A (net) expenses less any applicable 12b-1 fees) ("Lipper Universe Expenses"). The Board also reviewed data comparing each share class’s total (net) operating expenses to the applicable Lipper Universe Expenses. The Board also considered how the Fund’s total (net) operating expenses compared to the total (net) operating expenses of a more customized peer group selected by Lipper (based on such factors as asset size). The Board noted that the expense limitations agreed to by DIMA helped to ensure that the Fund’s total (net) operating expenses would remain competitive. The Board considered the Fund’s management fee rate as compared to fees charged by DIMA to comparable funds and considered differences between the Fund and the comparable funds. The information requested by the Board as part of its review of fees and expenses also included information about institutional accounts and funds offered primarily to European investors ("Deutsche Europe funds") managed by DIMA and its affiliates. The Board noted that DIMA indicated that it does not manage any institutional accounts or Deutsche Europe funds comparable to the Fund.
On the basis of the information provided, the Board concluded that management fees were reasonable and appropriate in light of the nature, quality and extent of services provided by DIMA and RREEF.
Profitability. The Board reviewed detailed information regarding revenues received by DIMA from advising the Deutsche Funds along with the estimated costs and pre-tax profits realized by DIMA from advising the Deutsche U.S. mutual funds ("Deutsche Funds"). The Board also received information regarding the estimated enterprise-wide profitability of DIMA and its affiliates with respect to all fund services in totality. The Board did not receive profitability information with respect to the Fund, but did receive such information with respect to the funds in which the Fund invests.
Economies of Scale. The Board considered whether there are economies of scale with respect to the management of the Fund and whether the Fund benefits from any economies of scale. In this regard, the Board noted that while the Fund’s current investment management fee schedule does not include breakpoints, the Board intends to consider implementation of one or more breakpoints once the Fund reaches an efficient operating size. The Board concluded that the Fund’s fee schedule represents an appropriate sharing between the Fund and DIMA of such economies of scale as may exist in the management of the Fund at current asset levels.
Other Benefits to DIMA and Its Affiliates. The Board also considered the character and amount of other incidental benefits received by DIMA and its affiliates, including any fees received by DIMA for administrative services provided to the Fund and any fees received by an affiliate of DIMA for distribution services. The Board also considered benefits to DIMA related to brokerage and soft-dollar allocations, including allocating brokerage to pay for research generated by parties other than the executing broker dealers, which pertain primarily to funds investing in equity securities, along with the incidental public relations benefits to DIMA related to Deutsche Funds advertising and cross-selling opportunities among DIMA products and services. The Board concluded that management fees were reasonable in light of these fallout benefits.
Compliance. The Board considered the significant attention and resources dedicated by DIMA to documenting and enhancing its compliance processes in recent years. The Board noted in particular (i) the experience and seniority of DIMA’s and the Fund’s chief compliance officer; (ii) the large number of DIMA compliance personnel; and (iii) the substantial commitment of resources by DIMA and its affiliates to compliance matters.
Based on all of the information considered and the conclusions reached, the Board unanimously determined that the continuation of the Agreements is in the best interests of the Fund. In making this determination, the Board did not give particular weight to any single factor identified above. The Board considered these factors over the course of numerous meetings, certain of which were in executive session with only the Independent Trustees and counsel present. It is possible that individual Trustees may have weighed these factors differently in reaching their individual decisions to approve the continuation of the Agreements.
Board Members and Officers
The following table presents certain information regarding the Board Members and Officers of the fund. Each Board Member's year of birth is set forth in parentheses after his or her name. Unless otherwise noted, (i) each Board Member has engaged in the principal occupation(s) noted in the table for at least the most recent five years, although not necessarily in the same capacity; and (ii) the address of each Independent Board Member is c/o Kenneth C. Froewiss, Chairman, Deutsche Mutual Funds, P.O. Box 390601, Cambridge, MA 02139. Except as otherwise noted below, the term of office for each Board Member is until the election and qualification of a successor, or until such Board Member sooner dies, resigns, is removed or as otherwise provided in the governing documents of the fund. Because the fund does not hold an annual meeting of shareholders, each Board Member will hold office for an indeterminate period. The Board Members may also serve in similar capacities with other funds in the fund complex.
| Independent Board Members |
Name, Year of Birth, Position with the Fund and Length of Time Served1 | | Business Experience and Directorships During the Past Five Years | Number of Funds in Deutsche Fund Complex Overseen | Other Directorships Held by Board Member |
Kenneth C. Froewiss (1945) Chairperson since 2013, and Board Member since 2001 | | Adjunct Professor of Finance, NYU Stern School of Business (September 2009–present; Clinical Professor from 1997–September 2009); Member, Finance Committee, Association for Asian Studies (2002–present); Director, Mitsui Sumitomo Insurance Group (US) (2004–present); prior thereto, Managing Director, J.P. Morgan (investment banking firm) (until 1996) | 105 | — |
William McClayton (1944) Vice Chairperson since 2013, and Board Member since 2004 | | Private equity investor (since October 2009); previously, Managing Director, Diamond Management & Technology Consultants, Inc. (global consulting firm) (2001–2009); Directorship: Board of Managers, YMCA of Metropolitan Chicago; formerly: Senior Partner, Arthur Andersen LLP (accounting) (1966–2001); Trustee, Ravinia Festival | 105 | — |
John W. Ballantine (1946) Board Member since 1999 | | Retired; formerly, Executive Vice President and Chief Risk Management Officer, First Chicago NBD Corporation/The First National Bank of Chicago (1996–1998); Executive Vice President and Head of International Banking (1995–1996); former Directorships: Director and former Chairman of the Board, Healthways, Inc.2 (provider of disease and care management services) (2003–2014); Stockwell Capital Investments PLC (private equity); First Oak Brook Bancshares, Inc. and Oak Brook Bank; Prisma Energy International | 105 | Portland General Electric2 (utility company) (2003– present) |
Henry P. Becton, Jr. (1943) Board Member since 1990 | | Vice Chair and former President, WGBH Educational Foundation. Directorships: Public Radio International; Public Radio Exchange (PRX); North Bennett Street School (Boston); former Directorships: Belo Corporation2 (media company); The PBS Foundation; Association of Public Television Stations; Boston Museum of Science; American Public Television; Concord Academy; New England Aquarium; Mass. Corporation for Educational Telecommunications; Committee for Economic Development; Public Broadcasting Service; Connecticut College | 105 | Lead Director, Becton Dickinson and Company2 (medical technology company) |
Dawn-Marie Driscoll (1946) Board Member since 1987 | | Emeritus Executive Fellow, Center for Business Ethics, Bentley University; formerly: President, Driscoll Associates (consulting firm); Partner, Palmer & Dodge (law firm) (1988–1990); Vice President of Corporate Affairs and General Counsel, Filene's (retail) (1978–1988). Directorships: Director of ICI Mutual Insurance Company (since 2007); Advisory Board, Center for Business Ethics, Bentley University; Trustee and former Chairman of the Board, Southwest Florida Community Foundation (charitable organization); former Directorships: Sun Capital Advisers Trust (mutual funds) (2007–2012), Investment Company Institute (audit, executive, nominating committees) and Independent Directors Council (governance, executive committees) | 105 | — |
Keith R. Fox, CFA (1954) Board Member since 1996 | | Managing General Partner, Exeter Capital Partners (a series of private investment funds) (since 1986). Directorships: Progressive International Corporation (kitchen goods importer and distributor); The Kennel Shop (retailer); former Chairman, National Association of Small Business Investment Companies; former Directorships: BoxTop Media Inc. (advertising); Sun Capital Advisers Trust (mutual funds) (2011–2012) | 105 | — |
Paul K. Freeman (1950) Board Member since 1993 | | Consultant, World Bank/Inter-American Development Bank; Chair, Independent Directors Council; Investment Company Institute (executive and nominating committees); formerly, Chairman of Education Committee of Independent Directors Council; Project Leader, International Institute for Applied Systems Analysis (1998–2001); Chief Executive Officer, The Eric Group, Inc. (environmental insurance) (1986–1998); Directorships: Denver Zoo Foundation (December 2012–present); former Directorships: Prisma Energy International | 105 | — |
Richard J. Herring (1946) Board Member since 1990 | | Jacob Safra Professor of International Banking and Professor, Finance Department, The Wharton School, University of Pennsylvania (since July 1972); Co-Director, Wharton Financial Institutions Center; Co-Chair, U.S. Shadow Financial Regulatory Committee; Executive Director, Financial Economists Roundtable; formerly: Vice Dean and Director, Wharton Undergraduate Division (July 1995–June 2000); Director, Lauder Institute of International Management Studies (July 2000–June 2006) | 105 | Director, Aberdeen Singapore and Japan Funds (since 2007); Independent Director of Barclays Bank Delaware (since September 2010) |
Rebecca W. Rimel (1951) Board Member since 1995 | | President and Chief Executive Officer, The Pew Charitable Trusts (charitable organization) (1994 to present); formerly: Executive Vice President, The Glenmede Trust Company (investment trust and wealth management) (1983–2004); Board Member, Investor Education (charitable organization) (2004–2005); Trustee, Executive Committee, Philadelphia Chamber of Commerce (2001–2007); Director, Viasys Health Care2 (January 2007–June 2007); Trustee, Thomas Jefferson Foundation (charitable organization) (1994–2012) | 105 | Director, Becton Dickinson and Company2 (medical technology company) (2012– present); Director, BioTelemetry Inc.2 (health care) (2009– present) |
William N. Searcy, Jr. (1946) Board Member since 1993 | | Private investor since October 2003; formerly: Pension & Savings Trust Officer, Sprint Corporation2 (telecommunications) (November 1989–September 2003); Trustee, Sun Capital Advisers Trust (mutual funds) (1998–2012) | 105 | — |
Jean Gleason Stromberg (1943) Board Member since 1997 | | Retired. Formerly, Consultant (1997–2001); Director, Financial Markets U.S. Government Accountability Office (1996–1997); Partner, Norton Rose Fulbright, L.L.P. (law firm) (1978–1996). Directorships: The William and Flora Hewlett Foundation (charitable organization); former Directorships: Service Source, Inc. (nonprofit), Mutual Fund Directors Forum (2002–2004), American Bar Retirement Association (funding vehicle for retirement plans) (1987–1990 and 1994–1996) | 105 | — |
Robert H. Wadsworth* (1940) Board Member since 1999 | | President, Robert H. Wadsworth & Associates, Inc. (consulting firm) (1983 to present); Director, The Phoenix Boys Choir Association | 105 | — |
Officers4 |
Name, Year of Birth, Position with the Fund and Length of Time Served5 | | Business Experience and Directorships During the Past Five Years |
Brian E. Binder8 (1972) President and Chief Executive Officer, 2013–present | | Managing Director3 and Head of Fund Administration, Deutsche Asset & Wealth Management (2013–present); formerly: Head of Business Management and Consulting at Invesco, Ltd. (2010–2012); Chief Administrative Officer, Van Kampen Funds Inc. (2008–2010); and Chief Administrative Officer, Morgan Stanley Investment Management Americas Distribution (2003–2008) |
John Millette7 (1962) Vice President and Secretary, 1999–present | | Director,3 Deutsche Asset & Wealth Management |
Melinda Morrow6 (1970) Vice President, 2012–present | | Director,3 Deutsche Asset & Wealth Management |
Paul H. Schubert6 (1963) Chief Financial Officer, 2004–present Treasurer, 2005–present | | Managing Director,3 Deutsche Asset & Wealth Management (since July 2004); formerly: Executive Director, Head of Mutual Fund Services and Treasurer for UBS Family of Funds (1998–2004); Vice President and Director of Mutual Fund Finance at UBS Global Asset Management (1994–1998) |
Caroline Pearson7 (1962) Chief Legal Officer, 2010–present | | Managing Director,3 Deutsche Asset & Wealth Management; formerly: Assistant Secretary for DWS family of funds (1997–2010) |
Robert Kloby6 (1962) Chief Compliance Officer, 2006–present | | Managing Director,3 Deutsche Asset & Wealth Management |
Wayne Salit6 (1967) Anti-Money Laundering Compliance Officer, 2014–present | | Director,3 Deutsche Asset & Wealth Management; formerly: Managing Director, AML Compliance Officer at BNY Mellon (2011–2014); and Director, AML Compliance Officer at Deutsche Bank (2004–2011) |
Hepsen Uzcan7 (1974) Assistant Secretary, 2013–present | | Director,3 Deutsche Asset & Wealth Management |
Paul Antosca7 (1957) Assistant Treasurer, 2007–present | | Director,3 Deutsche Asset & Wealth Management |
Jack Clark7 (1967) Assistant Treasurer, 2007–present | | Director,3 Deutsche Asset & Wealth Management |
Diane Kenneally7 (1966) Assistant Treasurer, 2007–present | | Director,3 Deutsche Asset & Wealth Management |
1 The length of time served represents the year in which the Board Member joined the board of one or more Deutsche funds currently overseen by the Board.
2 A publicly held company with securities registered pursuant to Section 12 of the Securities Exchange Act of 1934.
3 Executive title, not a board directorship.
4 As a result of their respective positions held with the Advisor, these individuals are considered "interested persons" of the Advisor within the meaning of the 1940 Act. Interested persons receive no compensation from the fund.
5 The length of time served represents the year in which the officer was first elected in such capacity for one or more Deutsche funds.
6 Address: 60 Wall Street, New York, NY 10005.
7 Address: One Beacon Street, Boston, MA 02108.
8 Address: 222 South Riverside Plaza, Chicago, IL 60606.
* Robert H. Wadsworth retired from the Board effective December 31, 2014.
The fund's Statement of Additional Information ("SAI") includes additional information about the Board Members. The SAI is available, without charge, upon request. If you would like to request a copy of the SAI, you may do so by calling the following toll-free number: (800) 728-3337.
Notes
DeAWM Distributors, Inc.
222 South Riverside Plaza
Chicago, IL 60606
(800) 621-1148
VS2AAA-2 (R-025824-4 2/15)

December 31, 2014
Annual Report
Deutsche Variable Series II
(formerly DWS Variable Series II)
Deutsche Government & Agency Securities VIP
(formerly DWS Government & Agency Securities VIP)
Contents
13 Statement of Assets and Liabilities 14 Statement of Operations 15 Statement of Changes in Net Assets 17 Notes to Financial Statements 25 Report of Independent Registered Public Accounting Firm 26 Information About Your Fund's Expenses 29 Advisory Agreement Board Considerations and Fee Evaluation 32 Board Members and Officers |
This report must be preceded or accompanied by a prospectus. To obtain an additional prospectus or summary prospectus, if available, call (800) 728-3337 or your financial representative. We advise you to consider the Fund's objectives, risks, charges and expenses carefully before investing. The summary prospectus and prospectus contain this and other important information about the Fund. Please read the prospectus carefully before you invest.
Bond investments are subject to interest-rate, credit, liquidity and market risks to varying degrees. When interest rates rise, bond prices generally fall. Credit risk refers to the ability of an issuer to make timely payments of principal and interest. Investing in derivatives entails special risks relating to liquidity, leverage and credit that may reduce returns and/or increase volatility. The Fund may lend securities to approved institutions. The "full faith and credit" guarantee of the U.S. government applies to the timely repayment of interest, and does not eliminate market risk. Because of the rising U.S. government debt burden, it is possible that the U.S. government may not be able to meet its financial obligations or that securities issued by the U.S. government may experience credit downgrades. See the prospectus for details.
Deutsche Asset & Wealth Management represents the asset management and wealth management activities conducted by Deutsche Bank AG or any of its subsidiaries, including the Advisor and DeAWM Distributors, Inc.
NOT FDIC/NCUA INSURED NO BANK GUARANTEE MAY LOSE VALUE NOT A DEPOSIT
NOT INSURED BY ANY FEDERAL GOVERNMENT AGENCY
Performance Summary December 31, 2014 (Unaudited)
Fund performance shown is historical, assumes reinvestment of all dividend and capital gain distributions and does not guarantee future results. Investment return and principal value fluctuate with changing market conditions so that, when redeemed, shares may be worth more or less than their original cost. Current performance may be lower or higher than the performance data quoted. Please contact your participating insurance company for the Fund's most recent month-end performance. Performance doesn't reflect charges and fees ("contract charges") associated with the separate account that invests in the Fund or any variable life insurance policy or variable annuity contract for which the Fund is an investment option. These charges and fees will reduce returns. While all share classes have the same underlying portfolio, their performance will differ.
The gross expense ratios of the Fund, as stated in the fee table of the prospectus dated May 1, 2014 are 0.71% and 1.06% for Class A and Class B shares, respectively, and may differ from the expense ratios disclosed in the Financial Highlights tables in this report.
| Growth of an Assumed $10,000 Investment in Deutsche Government & Agency Securities VIP |
| The Barclays GNMA Index is an unmanaged, market-value-weighted measure of all fixed-rate securities backed by mortgage pools of the Government National Mortgage Association. Index returns do not reflect any fees or expenses and it is not possible to invest directly into an index. |
| |
| Yearly periods ended December 31 | |
| Comparative Results | |
| Deutsche Government & Agency Securities VIP | | 1-Year | | | 3-Year | | | 5-Year | | | 10-Year | |
| Class A | Growth of $10,000 | | $ | 10,529 | | | $ | 10,508 | | | $ | 12,039 | | | $ | 15,456 | |
| Average annual total return | | | 5.29 | % | | | 1.66 | % | | | 3.78 | % | | | 4.45 | % |
| Barclays GNMA Index | Growth of $10,000 | | $ | 10,597 | | | $ | 10,624 | | | $ | 12,228 | | | $ | 16,052 | |
| Average annual total return | | | 5.97 | % | | | 2.04 | % | | | 4.11 | % | | | 4.85 | % |
| Deutsche Government & Agency Securities VIP | | 1-Year | | | 3-Year | | | 5-Year | | | 10-Year | |
| Class B | Growth of $10,000 | | $ | 10,495 | | | $ | 10,406 | | | $ | 11,846 | | | $ | 14,923 | |
| Average annual total return | | | 4.95 | % | | | 1.34 | % | | | 3.45 | % | | | 4.08 | % |
| Barclays GNMA Index | Growth of $10,000 | | $ | 10,597 | | | $ | 10,624 | | | $ | 12,228 | | | $ | 16,052 | |
| Average annual total return | | | 5.97 | % | | | 2.04 | % | | | 4.11 | % | | | 4.85 | % |
The growth of $10,000 is cumulative.
Management Summary December 31, 2014 (Unaudited)
During the 12-month period ended December 31, 2014, the Fund provided a total return of 5.29% (Class A shares, unadjusted for contract charges), compared with the 5.97% return of its benchmark, the Barclays GNMA Index.1
During the period, the U.S. Federal Reserve Board (the Fed) continued to maintain its benchmark short-term rate at or near zero levels, while feeling free to wind down its bond purchases designed to lower longer-term interest rates in view of a gradually improving U.S. economy. Nonetheless, longer-term U.S. Treasury yields declined substantially over the 12-month period, as markets remained comfortable with the pace of the Fed's inevitable unwinding of its extraordinary monetary support. For much of 2014, U.S. assets generally were supported by geopolitical tensions abroad and concern over possible deflation in other major economies. In addition, a sharp decline in energy prices over the second half of 2014 provided a boost to the U.S. consumer and to the economy. GNMAs benefited from prepayment rates on underlying mortgages, which remained modest despite falling rates, and provided positive returns in keeping with the broader bond market for the full period.
The Fund's performance benefited from exposure to longer-duration collateralized mortgage obligations (CMOs) structured to protect against prepayment, which benefited from falling rates. With respect to pass-through holdings, our focus on higher-coupon, seasoned and low-balance mortgage pools with characteristics that defend against increasing prepayments added to the portfolio's income stream. We had a meaningful position in interest-only securities in the belief that voluntary prepayments would remain manageable. Interest-only securities are particularly vulnerable to rising prepayments, as the investor is threatened with the loss of an income stream without receiving any return of principal. This allocation worked well as the Fund earned the higher income offered by these issues and experienced modest prepayments despite the decline in interest rate levels. The Fund was positioned with an overall duration and corresponding interest rate sensitivity above that of the benchmark for much of the period, which helped returns as rates fell. The Fund had a relatively high cash equivalent position for much of the period as we sought to be positioned to take advantage of opportunities provided by volatility, and this acted as a constraint on returns as mortgage-backed securities performed well. Throughout the period, we used derivative positions to hedge against potential adverse interest rate movements on portfolio assets. With inflation remaining below target, there would not appear to be any urgency for the Fed to raise rates, and mortgage rates may well be somewhat range-bound over the near term. Given this backdrop, we are comfortable with our focus on maximizing current income in the Fund. That said, there is much more room for rates to rise than to fall, and we are keeping enough liquidity in the Fund to reposition fairly quickly should higher mortgage rates become a reality.
William Chepolis, CFA
Scott Agi, CFA
Portfolio Managers
The views expressed reflect those of the portfolio management team only through the end of the period of the report as stated on the cover. The management team's views are subject to change at any time based on market and other conditions and should not be construed as a recommendation. Past performance is no guarantee of future results. Current and future portfolio holdings are subject to risk.
1 The Barclays GNMA Index is an unmanaged, market-value-weighted measure of all fixed-rate securities backed by mortgage pools of the Government National Mortgage Association. Index returns do not reflect fees or expenses and it is not possible to invest directly into an index.
Portfolio Summary (Unaudited) Asset Allocation (As a % of Net Assets) | 12/31/14 | 12/31/13 |
| | | |
| Mortgage-Backed Securities Pass-Throughs | 71% | 89% |
| Collateralized Mortgage Obligations | 26% | 15% |
| Government & Agency Obligations | 19% | 21% |
| Cash Equivalents and Other Assets and Liabilities, net | –17% | –25% |
| Short-Term US Treasury Obligations | 1% | — |
| | 100% | 100% |
| Coupons* | 12/31/14 | 12/31/13 |
| | | |
| Less than 4.5% | 50% | 32% |
| 4.5%–5.49% | 34% | 43% |
| 5.5%–6.49% | 14% | 21% |
| 6.5%–7.49% | 2% | 3% |
| 7.5% and Greater | 0% | 1% |
| | 100% | 100% |
| Interest Rate Sensitivity | 12/31/14 | 12/31/13 |
| | | |
| Effective Maturity | 9.7 years | 10.0 years |
| Effective Duration | 7.8 years | 6.3 years |
* Excludes Cash Equivalents, Securities Lending Collateral, U.S. Treasury Bills and Options Purchased.
Effective maturity is the weighted average of the maturity date of bonds held by the Fund taking into consideration any available maturity shortening features.
Effective duration is an approximate measure of the Fund's sensitivity to interest rate changes taking into consideration any maturity shortening features.
Portfolio holdings and characteristics are subject to change.
For more complete details about the Fund's investment portfolio, see page 8.
Following the Fund's fiscal first and third quarter-end, a complete portfolio holdings listing is filed with the SEC on Form N-Q. The form will be available on the SEC's Web site at sec.gov, and it also may be reviewed and copied at the SEC's Public Reference Room in Washington, D.C. Information on the operation of the SEC's Public Reference Room may be obtained by calling (800) SEC-0330. The Fund's portfolio holdings are also posted on deutschefunds.com from time to time. Please see the Fund's current prospectus for more information.
Investment Portfolio December 31, 2014 | | | Principal Amount ($) | | | Value ($) | |
| | | | |
| Mortgage-Backed Securities Pass-Throughs 71.2% | |
| Federal Home Loan Mortgage Corp.: | |
| 4.5%, 8/1/2039 (a) | | | 6,000,000 | | | | 6,505,781 | |
Federal National Mortgage Association: | |
| 3.0%, 7/1/2042 (a) | | | 5,000,000 | | | | 5,060,547 | |
| 4.5%, 2/1/2040 (a) | | | 2,000,000 | | | | 2,171,719 | |
Government National Mortgage Association: | |
| 3.0%, 10/20/2044 | | | 1,989,737 | | | | 2,037,848 | |
| 3.5%, with various maturities from 4/15/2042 until 7/20/2044 | | | 7,578,874 | | | | 7,970,263 | |
| 4.0%, with various maturities from 9/20/2040 until 6/20/2043 | | | 4,399,979 | | | | 4,756,259 | |
| 4.5%, with various maturities from 6/20/2033 until 2/20/2043 (a) | | | 6,942,405 | | | | 7,602,370 | |
| 4.55%, 1/15/2041 | | | 356,874 | | | | 393,161 | |
| 4.625%, 5/15/2041 | | | 192,279 | | | | 212,057 | |
| 5.0%, with various maturities from 11/20/2032 until 4/15/2042 | | | 11,004,430 | | | | 12,166,105 | |
| 5.5%, with various maturities from 10/15/2032 until 7/20/2040 | | | 6,603,331 | | | | 7,423,919 | |
| 6.0%, with various maturities from 2/15/2034 until 2/15/2039 | | | 5,743,687 | | | | 6,542,002 | |
| 6.5%, with various maturities from 9/15/2036 until 2/15/2039 | | | 736,294 | | | | 840,749 | |
| 7.0%, with various maturities from 2/20/2027 until 11/15/2038 | | | 147,630 | | | | 172,233 | |
| 7.5%, 10/20/2031 | | | 7,173 | | | | 8,577 | |
Total Mortgage-Backed Securities Pass-Throughs (Cost $62,363,656) | | | | 63,863,590 | |
| | |
| Collateralized Mortgage Obligations 26.2% | |
| Federal Home Loan Mortgage Corp.: | |
| "OA", Series 3179, Principal Only, Zero Coupon, 7/15/2036 | | | 167,252 | | | | 156,380 | |
| "KO", Series 4180, Principal Only, Zero Coupon, 1/15/2043 | | | 1,276,853 | | | | 823,901 | |
| "YI", Series 3936, Interest Only, 3.0%, 6/15/2025 | | | 95,829 | | | | 6,665 | |
| "AI", Series 4016, Interest Only, 3.0%, 9/15/2025 | | | 1,093,385 | | | | 98,492 | |
| "WI", Series 3939, Interest Only, 3.0%, 10/15/2025 | | | 389,678 | | | | 29,516 | |
| "EI", Series 3953, Interest Only, 3.0%, 11/15/2025 | | | 565,059 | | | | 50,086 | |
| "IO", Series 3974, Interest Only, 3.0%, 12/15/2025 | | | 172,533 | | | | 15,228 | |
| "DI", Series 4010, Interest Only, 3.0%, 2/15/2027 | | | 141,438 | | | | 14,075 | |
| "IK", Series 4048, Interest Only, 3.0%, 5/15/2027 | | | 1,380,367 | | | | 175,992 | |
| "PZ", Series 4094, 3.0%, 8/15/2042 | | | 414,741 | | | | 385,177 | |
| "CZ", Series 4113, 3.0%, 9/15/2042 | | | 375,860 | | | | 364,289 | |
| | | Principal Amount ($) | | | Value ($) | |
| | | | | | | | | |
| "GZ", Series 4184, 3.0%, 3/15/2043 | | | 391,559 | | | | 373,291 | |
| "IK", Series 3754, Interest Only, 3.5%, 6/15/2025 | | | 805,758 | | | | 79,166 | |
| "VZ", Series 4303, 3.5%, 8/15/2042 | | | 1,029,552 | | | | 1,060,734 | |
| "DZ", Series 4199, 3.5%, 5/15/2043 | | | 247,161 | | | | 256,729 | |
| "ZG", Series 4213, 3.5%, 6/15/2043 | | | 303,737 | | | | 304,340 | |
| "KZ", Series 4328, 4.0%, 4/15/2044 | | | 257,120 | | | | 262,072 | |
| "UZ", Series 4341, 4.0%, 5/15/2044 | | | 690,627 | | | | 705,093 | |
| "UA", Series 4298, 4.0%, 2/15/2054 | | | 432,706 | | | | 443,835 | |
| "22", Series 243, Interest Only, 4.385%*, 6/15/2021 | | | 361,108 | | | | 17,731 | |
| "NI", Series 3657, Interest Only, 4.5%, 8/15/2027 | | | 136,595 | | | | 1,622 | |
| "PI", Series 2535, Interest Only, 6.0%, 9/15/2032 | | | 32,819 | | | | 284 | |
| "MI", Series 3871, Interest Only, 6.0%, 4/15/2040 | | | 123,841 | | | | 16,503 | |
| "A", Series 172, Interest Only, 6.5%, 1/1/2024 | | | 17,750 | | | | 3,290 | |
| "DS", Series 3199, Interest Only, 6.989%*, 8/15/2036 | | | 1,774,772 | | | | 383,946 | |
| "S", Series 2416, Interest Only, 7.939%*, 2/15/2032 | | | 251,373 | | | | 54,478 | |
| "ST", Series 2411, Interest Only, 8.589%*, 6/15/2021 | | | 516,926 | | | | 41,878 | |
| "KS", Series 2064, Interest Only, 9.989%*, 5/15/2022 | | | 249,304 | | | | 54,252 | |
Federal National Mortgage Association: | |
| "DI", Series 2011-136, Interest Only, 3.0%, 1/25/2026 | | | 165,269 | | | | 15,069 | |
| "DZ", Series 2013-136, 3.0%, 1/25/2044 | | | 824,333 | | | | 768,593 | |
| "HI", Series 2010-123, Interest Only, 3.5%, 3/25/2024 | | | 276,503 | | | | 17,871 | |
| "KI", Series 2011-72, Interest Only, 3.5%, 3/25/2025 | | | 837,302 | | | | 51,378 | |
| ''IO", Series 2012-146, Interest Only, 3.5%, 1/25/2043 | | | 1,932,482 | | | | 411,803 | |
| "ZB", Series 2010-136, 4.0%, 12/25/2040 | | | 266,532 | | | | 273,930 | |
| "AZ", Series 2012-29, 4.0%, 4/25/2042 | | | 1,482,038 | | | | 1,644,323 | |
| "HZ", Series 2013-20, 4.0%, 3/25/2043 | | | 1,553,419 | | | | 1,755,220 | |
| "25", Series 351, Interest Only, 4.5%, 5/25/2019 | | | 118,389 | | | | 8,247 | |
| "IN", Series 2003-49, Interest Only, 4.75%, 3/25/2018 | | | 395,422 | | | | 7,879 | |
| "21", Series 334, Interest Only, 5.0%, 3/25/2018 | | | 48,743 | | | | 2,849 | |
| "20", Series 334, Interest Only, 5.0%, 3/25/2018 | | | 76,104 | | | | 4,417 | |
| ''23", Series 339, Interest Only, 5.0%, 6/25/2018 | | | 108,761 | | | | 6,485 | |
| "26", Series 381, Interest Only, 5.0%, 12/25/2020 | | | 39,896 | | | | 3,499 | |
| "ZA", Series 2008-24, 5.0%, 4/25/2038 | | | 735,247 | | | | 810,489 | |
| "30", Series 381, Interest Only, 5.5%, 11/25/2019 | | | 228,188 | | | | 20,938 | |
| | | Principal Amount ($) | | | Value ($) | |
| | | | | | | | | |
| "PI", Series 2009-14, Interest Only, 5.5%, 3/25/2024 | | | 398,010 | | | | 46,617 | |
| "PJ", Series 2004-46, Interest Only, 5.831%*, 3/25/2034 | | | 291,517 | | | | 37,574 | |
| "WI", Series 2011-59, Interest Only, 6.0%, 5/25/2040 | | | 249,214 | | | | 25,003 | |
| "101", Series 383, Interest Only, 6.5%, 9/25/2022 | | | 819,286 | | | | 120,887 | |
| "SJ", Series 2007-36, Interest Only, 6.601%*, 4/25/2037 | | | 164,098 | | | | 26,628 | |
| "KI", Series 2005-65, Interest Only, 6.831%*, 8/25/2035 | | | 84,051 | | | | 16,670 | |
| "SA", Series G92-57, IOette, 83.244%*, 10/25/2022 | | | 31,250 | | | | 59,483 | |
| Government National Mortgage Association: | |
| "KZ", Series 2014-102, 3.5%, 7/16/2044 | | | 1,826,404 | | | | 1,874,567 | |
| "ZK", Series 2014-119, 3.5%, 8/16/2044 | | | 1,517,577 | | | | 1,557,743 | |
| "BI", Series 2014-22, Interest Only, 4.0%, 2/20/2029 | | | 1,006,033 | | | | 139,712 | |
| "JY", Series 2010-20, 4.0%, 12/20/2033 | | | 2,095,886 | | | | 2,224,368 | |
| "LI", Series 2009-104, Interest Only, 4.5%, 12/16/2018 | | | 154,994 | | | | 10,108 | |
| "NI", Series 2010-44, Interest Only, 4.5%, 10/20/2037 | | | 433,184 | | | | 33,520 | |
| "CI", Series 2010-87, Interest Only, 4.5%, 11/20/2038 | | | 1,251,588 | | | | 284,614 | |
| "MI", Series 2010-169, Interest Only, 4.5%, 8/20/2040 | | | 640,712 | | | | 87,185 | |
| "GZ", Series 2005-24, 5.0%, 3/20/2035 | | | 544,908 | | | | 647,140 | |
| "ZA", Series 2005-75, 5.0%, 10/16/2035 | | | 613,013 | | | | 710,486 | |
| "MZ", Series 2009-98, 5.0%, 10/16/2039 | | | 1,099,964 | | | | 1,334,034 | |
| "Z", Series 2009-112, 5.0%, 11/20/2039 | | | 1,288,706 | | | | 1,443,205 | |
| "AI", Series 2008-46, Interest Only, 5.5%, 5/16/2023 | | | 158,009 | | | | 12,252 | |
| "GI", Series 2003-19, Interest Only, 5.5%, 3/16/2033 | | | 661,799 | | | | 133,415 | |
| "IB", Series 2010-130, Interest Only, 5.5%, 2/20/2038 | | | 191,212 | | | | 34,294 | |
| "BS", Series 2011-93, Interest Only, 5.939%*, 7/16/2041 | | | 1,041,966 | | | | 178,830 | |
| "DI", Series 2009-10, Interest Only, 6.0%, 4/16/2038 | | | 252,488 | | | | 42,903 | |
| "SA", Series 2012-84, Interest Only, 6.135%*, 12/20/2038 | | | 1,192,234 | | | | 171,839 | |
| "QA", Series 2007-57, Interest Only, 6.335%*, 10/20/2037 | | | 248,497 | | | | 39,480 | |
| "IP", Series 2009-118, Interest Only, 6.5%, 12/16/2039 | | | 71,764 | | | | 13,760 | |
| "IC", Series 1997-4, Interest Only, 7.5%, 3/16/2027 | | | 489,915 | | | | 125,573 | |
| "SK", Series 2003-11, Interest Only, 7.539%*, 2/16/2033 | | | 416,060 | | | | 76,452 | |
Total Collateralized Mortgage Obligations (Cost $20,756,837) | | | | 23,490,377 | |
| | | Principal Amount ($) | | | Value ($) | |
| | | | | | | | | |
| Government & Agency Obligations 18.5% | |
| U.S. Government Sponsored Agency 9.4% | |
| Federal Home Loan Bank, 3.25%, 6/9/2023 | | | 8,000,000 | | | | 8,458,664 | |
| U.S. Treasury Obligations 9.1% | |
| U.S. Treasury Bonds: | |
| 2.875%, 5/15/2043 | | | 1,500,000 | | | | 1,534,218 | |
| 3.375%, 5/15/2044 | | | 1,000,000 | | | | 1,125,781 | |
| U.S. Treasury Notes: | |
| 1.0%, 8/31/2016 (b) | | | 3,450,000 | | | | 3,475,875 | |
| 1.0%, 9/30/2016 | | | 2,000,000 | | | | 2,014,688 | |
| | | | | 8,150,562 | |
Total Government & Agency Obligations (Cost $16,302,403) | | | | 16,609,226 | |
| | |
| Short-Term U.S. Treasury Obligation 1.2% | |
| U.S. Treasury Bill, 0.035%**, 2/12/2015 (c) (Cost $1,044,957) | | | 1,045,000 | | | | 1,044,979 | |
| | | Contract Amount ($) | | | Value ($) | |
| | | | |
| Call Options Purchased 0.1% | |
| Options on Interest Rate Swap Contracts | |
Pay Fixed Rate — 3.72% – Receive Floating — LIBOR, Swap Expiration Date 4/22/2026, Option Expiration Date 4/20/20161 | | | 2,600,000 | | | | 15,923 | |
Pay Fixed Rate — 4.32% – Receive Floating — LIBOR, Swap Expiration Date 2/3/2027, Option Expiration Date 2/1/20172 | | | 6,000,000 | | | | 42,132 | |
Total Call Options Purchased (Cost $390,446) | | | | 58,055 | |
| | |
| Put Options Purchased 0.1% | |
| Options on Interest Rate Swap Contracts | |
Receive Fixed Rate — 2.32% – Pay Floating — LIBOR, Swap Expiration Date 2/3/2027, Option Expiration Date 2/1/20172 (Cost $203,884) | | | 6,000,000 | | | | 144,208 | |
| | | Shares | | | Value ($) | |
| | | | |
| Cash Equivalents 5.2% | |
| Central Cash Management Fund, 0.06% (d) (Cost $4,706,582) | | | 4,706,582 | | | | 4,706,582 | |
| | | % of Net Assets | | | Value ($) | |
| | | | |
Total Investment Portfolio (Cost $105,768,765)† | | | 122.5 | | | | 109,917,017 | |
| Other Assets and Liabilities, Net | | | (22.5 | ) | | | (20,220,787 | ) |
| Net Assets | | | 100.0 | | | | 89,696,230 | |
* These securities are shown at their current rate as of December 31, 2014.
** Annualized yield at time of purchase; not a coupon rate.
† The cost for federal income tax purposes was $105,792,319. At December 31, 2014, net unrealized appreciation for all securities based on tax cost was $4,124,698. This consisted of aggregate gross unrealized appreciation for all securities in which there was an excess of value over tax cost of $5,290,247 and aggregate gross unrealized depreciation for all securities in which there was an excess of tax cost over value of $1,165,549.
(a) When-issued or delayed delivery securities included.
(b) At December 31, 2014, this security has been pledged, in whole or in part, as collateral for open over-the-counter derivatives.
(c) At December 31, 2014, this security has been pledged, in whole or in part, to cover initial margin requirements for open futures contracts and open centrally cleared swap contracts.
(d) Affiliated fund managed by Deutsche Investment Management Americas Inc. The rate shown is the annualized seven-day yield at period end.
Interest Only: Interest Only (IO) bonds represent the "interest only" portion of payments on a pool of underlying mortgages or mortgage-backed securities. IO securities are subject to prepayment risk of the pool of underlying mortgages.
IOettes: These securities represent the right to receive interest payments on an underlying pool of mortgages with similar features as those associated with IO securities. Unlike IO's, a nominal amount of principal is assigned to an IOette which is small in relation to the interest flow that constitutes almost all of the IOette cash flow. The effective yield of this security is lower than the stated interest rate.
LIBOR: London Interbank Offered Rate
Principal Only: Principal Only (PO) bonds represent the "principal only" portion of payments on a pool of underlying mortgages or mortgage-backed securities.
Included in the portfolio are investments in mortgage- or asset-backed securities which are interests in separate pools of mortgages or assets. Effective maturities of these investments may be shorter than stated maturities due to prepayments. Some separate investments in the Government National Mortgage Association issues which have similar coupon rates have been aggregated for presentation purposes in this investment portfolio.
At December 31, 2014, open futures contracts purchased were as follows:
| Futures | Currency | Expiration Date | | Contracts | | | Notional Value ($) | | | Unrealized Appreciation ($) | |
| 10 Year U.S. Treasury Note | USD | 3/20/2015 | | | 50 | | | | 6,339,844 | | | | 10,065 | |
| Currency Abbreviation |
| USD United States Dollar |
At December 31, 2014, open written options contracts were as follows:
| Options on Interest Rate Swap Contracts | Swap Effective/ Expiration Dates | | Contract Amount | | Option Expiration Date | | Premiums Received ($) | | | Value ($) (e) | |
Call Options Receive Fixed — 3.32% – Pay Floating — LIBOR | 2/3/2017 2/3/2027 | | | 3,000,000 | 2 | 2/1/2017 | | | 216,990 | | | | (68,959 | ) |
| Receive Fixed — 4.22% – Pay Floating — LIBOR | 4/22/2016 4/22/2026 | | | 2,600,000 | 1 | 4/20/2016 | | | 92,690 | | | | (6,524 | ) |
| Receive Fixed — 4.48% – Pay Floating — LIBOR | 5/9/2016 5/11/2026 | | | 2,400,000 | 1 | 5/5/2016 | | | 26,940 | | | | (4,147 | ) |
| Receive Fixed — 5.132% – Pay Floating — LIBOR | 3/17/2016 3/17/2026 | | | 2,400,000 | 1 | 3/15/2016 | | | 17,340 | | | | (688 | ) |
| Receive Fixed — 5.132% – Pay Floating — LIBOR | 3/17/2016 3/17/2026 | | | 2,400,000 | 2 | 3/15/2016 | | | 28,320 | | | | (688 | ) |
| Total Call Options | | | 382,280 | | | | (81,006 | ) |
Put Options Pay Fixed — 1.132% – Receive Floating — LIBOR | 3/17/2016 3/17/2026 | | | 2,400,000 | 1 | 3/15/2016 | | | 17,340 | | | | (2,275 | ) |
| Pay Fixed — 1.132% – Receive Floating — LIBOR | 3/17/2016 3/17/2026 | | | 2,400,000 | 2 | 3/15/2016 | | | 6,120 | | | | (2,275 | ) |
| Pay Fixed — 2.48% – Receive Floating — LIBOR | 5/9/2016 5/11/2026 | | | 2,400,000 | 1 | 5/5/2016 | | | 26,940 | | | | (62,128 | ) |
| Pay Fixed — 2.615% – Receive Floating — LIBOR | 12/4/2015 12/4/2045 | | | 1,900,000 | 5 | 12/2/2015 | | | 41,230 | | | | (71,710 | ) |
| Pay Fixed — 2.64% – Receive Floating — LIBOR | 8/10/2015 8/10/2045 | | | 2,200,000 | 1 | 8/6/2015 | | | 20,570 | | | | (72,423 | ) |
| Pay Fixed — 2.675% – Receive Floating — LIBOR | 11/9/2015 11/12/2045 | | | 1,900,000 | 5 | 11/9/2015 | | | 38,095 | | | | (81,235 | ) |
| Pay Fixed — 2.796% – Receive Floating — LIBOR | 6/5/2015 6/5/2045 | | | 2,200,000 | 2 | 6/3/2015 | | | 23,540 | | | | (89,875 | ) |
| Pay Fixed — 2.88% – Receive Floating — LIBOR | 9/30/2015 9/30/2045 | | | 1,900,000 | 3 | 9/28/2015 | | | 39,754 | | | | (115,883 | ) |
| Pay Fixed — 3.005% – Receive Floating — LIBOR | 3/6/2015 3/6/2045 | | | 2,200,000 | 1 | 3/4/2015 | | | 23,100 | | | | (135,894 | ) |
| Pay Fixed — 3.035% – Receive Floating — LIBOR | 2/15/2015 2/3/2045 | | | 2,200,000 | 2 | 1/30/2015 | | | 27,170 | | | | (150,059 | ) |
| Pay Fixed — 3.088% – Receive Floating — LIBOR | 1/28/2015 1/28/2045 | | | 2,400,000 | 4 | 1/26/2015 | | | 24,210 | | | | (185,312 | ) |
| Pay Fixed — 3.32% – Receive Floating — LIBOR | 2/3/2017 2/3/2027 | | | 3,000,000 | 2 | 2/1/2017 | | | 216,990 | | | | (212,452 | ) |
| Total Put Options | | | 505,059 | | | | (1,181,521 | ) |
| Total | | | 887,339 | | | | (1,262,527 | ) |
(e) Unrealized depreciation on written options on interest rate swap contracts at December 31, 2014 was $375,188.
At December 31, 2014, open interest rate swap contracts were as follows:
| Centrally Cleared Swaps | |
Effective/ Expiration Dates | | Notional Amount ($) | | Cash Flows Paid by the Fund | Cash Flows Received by the Fund | | Value ($) | | | Unrealized Appreciation/ Depreciation ($) | |
12/16/2015 9/18/2017 | | | 26,200,000 | | Fixed — 1.557% | Floating — LIBOR | | | 32,232 | | | | 194 | |
12/16/2015 9/16/2020 | | | 2,100,000 | | Fixed — 2.214% | Floating — LIBOR | | | 2,165 | | | | 6 | |
12/16/2015 9/16/2025 | | | 10,600,000 | | Fixed — 2.64% | Floating — LIBOR | | | (62,763 | ) | | | (128 | ) |
12/16/2015 9/17/2035 | | | 1,000,000 | | Fixed — 2.938% | Floating — LIBOR | | | (20,991 | ) | | | (22 | ) |
12/16/2015 9/18/2045 | | | 1,000,000 | | Fixed — 2.998% | Floating — LIBOR | | | (32,154 | ) | | | (23 | ) |
| Total net unrealized appreciation | | | | 27 | |
| Bilateral Swap | |
Effective/ Expiration Dates | | Notional Amount ($) | | Cash Flows Paid by the Fund | Cash Flows Received by the Fund | | Value ($) | | | Upfront Payments Paid/ (Received) ($) | | | Unrealized Depreciation ($) | |
6/3/2013 6/3/2025 | | | 2,300,000 | 1 | Floating — LIBOR | Fixed — 3.0% | | | (9,055 | ) | | | — | | | | (9,055 | ) |
Counterparties:
1 Nomura International PLC
2 BNP Paribas
3 Morgan Stanley
4 Barclays Bank PLC
5 Citigroup, Inc.
For information on the Fund's policy and additional disclosures regarding futures contracts, purchased and written options contracts, and interest rate swap contracts, please refer to the Derivatives section of Note B in the accompanying Notes to Financial Statements.
Fair Value Measurements
Various inputs are used in determining the value of the Fund's investments. These inputs are summarized in three broad levels. Level 1 includes quoted prices in active markets for identical securities. Level 2 includes other significant observable inputs (including quoted prices for similar securities, interest rates, prepayment speeds and credit risk). Level 3 includes significant unobservable inputs (including the Fund's own assumptions in determining the fair value of investments). The level assigned to the securities valuations may not be an indication of the risk or liquidity associated with investing in those securities.
The following is a summary of the inputs used as of December 31, 2014 in valuing the Fund's investments. For information on the Fund's policy regarding the valuation of investments, please refer to the Security Valuation section of Note A in the accompanying Notes to Financial Statements.
| Assets | | Level 1 | | | Level 2 | | | Level 3 | | | Total | |
| | |
| Fixed-Income Investments (f) | |
| Mortgage-Backed Securities Pass-Throughs | | $ | — | | | $ | 63,863,590 | | | $ | — | | | $ | 63,863,590 | |
| Collateralized Mortgage Obligations | | | — | | | | 23,490,377 | | | | — | | | | 23,490,377 | |
| Government & Agency Obligations | | | — | | | | 16,609,226 | | | | — | | | | 16,609,226 | |
| Short-Term U.S. Treasury Obligations | | | — | | | | 1,044,979 | | | | — | | | | 1,044,979 | |
| Short-Term Investments | | | 4,706,582 | | | | — | | | | — | | | | 4,706,582 | |
| Derivatives (g) | |
| Purchased Options | | | — | | | | 202,263 | | | | — | | | | 202,263 | |
| Futures Contracts | | | 10,065 | | | | — | | | | — | | | | 10,065 | |
| Interest Rate Swap Contracts | | | — | | | | 200 | | | | — | | | | 200 | |
| Total | | $ | 4,716,647 | | | $ | 105,210,635 | | | $ | — | | | $ | 109,927,282 | |
| Liabilities | | Level 1 | | | Level 2 | | | Level 3 | | | Total | |
| | |
Derivatives (g) | |
| Written Options | | $ | — | | | $ | (1,262,527 | ) | | $ | — | | | $ | (1,262,527 | ) |
| Interest Rate Swap Contracts | | | — | | | | (9,228 | ) | | | — | | | | (9,228 | ) |
| Total | | $ | — | | | $ | (1,271,755 | ) | | $ | — | | | $ | (1,271,755 | ) |
There have been no transfers between fair value measurement levels during the year ended December 31, 2014.
(f) See Investment Portfolio for additional detailed categorizations.
(g) Derivatives include value of purchased options, unrealized appreciation (depreciation) on open futures contracts and interest rate swap contracts, and written options, at value.
The accompanying notes are an integral part of the financial statements.
Statement of Assets and Liabilities | as of December 31, 2014 | |
| Assets | |
Investments Investments in non-affiliated securities, at value (cost $101,062,183) | | $ | 105,210,435 | |
| Investment in Central Cash Management Fund (cost $4,706,582) | | | 4,706,582 | |
| Total investments in securities, at value (cost $105,768,765) | | | 109,917,017 | |
| Cash | | | 13,322 | |
| Receivable for investments sold — when-issued/delayed delivery securities | | | 14,610,698 | |
| Receivable for Fund shares sold | | | 399 | |
| Interest receivable | | | 378,121 | |
| Receivable for variation margin on futures contracts | | | 10,935 | |
| Receivable for variation margin on centrally cleared swaps | | | 36,428 | |
| Other assets | | | 2,646 | |
| Total assets | | | 124,969,566 | |
| Liabilities | |
| Payable for investments purchased | | | 8,447,418 | |
| Payable for investments purchased — when-issued/delayed delivery securities | | | 25,015,052 | |
| Payable for Fund shares redeemed | | | 391,122 | |
Options written, at value (premiums received $887,339) | | | 1,262,527 | |
| Unrealized depreciation on bilateral swap contracts | | | 9,055 | |
| Accrued management fee | | | 35,973 | |
| Accrued Trustees' fees | | | 2,095 | |
| Other accrued expenses and payables | | | 110,094 | |
| Total liabilities | | | 35,273,336 | |
| Net assets, at value | | $ | 89,696,230 | |
| Net Assets Consist of | |
| Undistributed net investment income | | | 2,332,582 | |
Unrealized appreciation (depreciation) on: Investments | | | 4,148,252 | |
| Swap contracts | | | (9,028 | ) |
| Futures | | | 10,065 | |
| Written options | | | (375,188 | ) |
| Accumulated net realized gain (loss) | | | (888,626 | ) |
| Paid-in capital | | | 84,478,173 | |
| Net assets, at value | | $ | 89,696,230 | |
Class A Net Asset Value, offering and redemption price per share ($86,676,341 ÷ 7,344,193 outstanding shares of beneficial interest, no par value, unlimited number of shares authorized) | | $ | 11.80 | |
Class B Net Asset Value, offering and redemption price per share ($3,019,889 ÷ 256,223 outstanding shares of beneficial interest, no par value, unlimited number of shares authorized) | | $ | 11.79 | |
The accompanying notes are an integral part of the financial statements.
Statement of Operations
| for the year ended December 31, 2014 | |
| Investment Income | |
Income: Interest | | $ | 3,061,370 | |
| Income distributions — Central Cash Management Fund | | | 4,219 | |
| Securities lending income, including income from Daily Assets Fund Institutional, net of borrower rebates | | | 3,921 | |
| Total income | | | 3,069,510 | |
Expenses: Management fee | | | 433,499 | |
| Administration fee | | | 96,333 | |
| Services to shareholders | | | 1,277 | |
| Distribution service fees (Class B) | | | 8,216 | |
| Record keeping fees (Class B) | | | 2,841 | |
| Custodian fee | | | 33,346 | |
| Professional fees | | | 82,819 | |
| Reports to shareholders | | | 28,202 | |
| Trustees' fees and expenses | | | 6,016 | |
| Other | | | 10,035 | |
| Total expenses before expense reductions | | | 702,584 | |
| Expense reductions | | | (18,239 | ) |
| Total expenses after expense reductions | | | 684,345 | |
| Net investment income | | | 2,385,165 | |
| Realized and Unrealized Gain (Loss) | |
Net realized gain (loss) from: Investments | | | 1,766,204 | |
| Swap contracts | | | (1,919,349 | ) |
| Futures | | | (778,304 | ) |
| Written options | | | 153,070 | |
| | | | (778,379 | ) |
Change in net unrealized appreciation (depreciation) on: Investments | | | 3,520,444 | |
| Swap contracts | | | 112,422 | |
| Futures | | | 273,643 | |
| Written options | | | (468,452 | ) |
| | | | 3,438,057 | |
| Net gain (loss) | | | 2,659,678 | |
| Net increase (decrease) in net assets resulting from operations | | $ | 5,044,843 | |
The accompanying notes are an integral part of the financial statements.
Statement of Changes in Net Assets | | | Years Ended December 31, | |
| Increase (Decrease) in Net Assets | | 2014 | | | 2013 | |
Operations: Net investment income | | $ | 2,385,165 | | | $ | 2,293,792 | |
| Net realized gain (loss) | | | (778,379 | ) | | | (119,888 | ) |
| Change in net unrealized appreciation (depreciation) | | | 3,438,057 | | | | (5,696,113 | ) |
| Net increase (decrease) in net assets resulting from operations | | | 5,044,843 | | | | (3,522,209 | ) |
Distributions to shareholders from: Net investment income: Class A | | | (2,179,180 | ) | | | (3,325,537 | ) |
| Class B | | | (66,035 | ) | | | (119,146 | ) |
Net realized gain: Class A | | | — | | | | (4,523,083 | ) |
| Class B | | | — | �� | | | (185,024 | ) |
| Total distributions | | | (2,245,215 | ) | | | (8,152,790 | ) |
Fund share transactions: Class A Proceeds from shares sold | | | 11,625,548 | | | | 9,306,924 | |
| Reinvestment of distributions | | | 2,179,180 | | | | 7,848,620 | |
| Payments for shares redeemed | | | (25,367,687 | ) | | | (31,059,765 | ) |
| Net increase (decrease) in net assets from Class A share transactions | | | (11,562,959 | ) | | | (13,904,221 | ) |
Class B Proceeds from shares sold | | | 277,916 | | | | 311,619 | |
| Reinvestment of distributions | | | 66,035 | | | | 304,170 | |
| Payments for shares redeemed | | | (1,055,485 | ) | | | (1,961,191 | ) |
| Net increase (decrease) in net assets from Class B share transactions | | | (711,534 | ) | | | (1,345,402 | ) |
| Increase (decrease) in net assets | | | (9,474,865 | ) | | | (26,924,622 | ) |
| Net assets at beginning of period | | | 99,171,095 | | | | 126,095,717 | |
| Net assets at end of period (including undistributed net investment income of $2,332,582 and $2,192,301, respectively) | | $ | 89,696,230 | | | $ | 99,171,095 | |
| Other Information | |
Class A Shares outstanding at beginning of period | | | 8,328,640 | | | | 9,511,241 | |
| Shares sold | | | 994,555 | | | | 782,217 | |
| Shares issued to shareholders in reinvestment of distributions | | | 189,659 | | | | 660,658 | |
| Shares redeemed | | | (2,168,661 | ) | | | (2,625,476 | ) |
| Net increase (decrease) in Class A shares | | | (984,447 | ) | | | (1,182,601 | ) |
| Shares outstanding at end of period | | | 7,344,193 | | | | 8,328,640 | |
Class B Shares outstanding at beginning of period | | | 317,145 | | | | 428,962 | |
| Shares sold | | | 23,866 | | | | 26,355 | |
| Shares issued to shareholders in reinvestment of distributions | | | 5,742 | | | | 25,582 | |
| Shares redeemed | | | (90,530 | ) | | | (163,754 | ) |
| Net increase (decrease) in Class B shares | | | (60,922 | ) | | | (111,817 | ) |
| Shares outstanding at end of period | | | 256,223 | | | | 317,145 | |
The accompanying notes are an integral part of the financial statements.
| | | Years Ended December 31, | |
| Class A | | | 2014 | | | 2013 | | | 2012 | | | 2011 | | | 2010 | |
| Selected Per Share Data | |
| Net asset value, beginning of period | | $ | 11.47 | | | $ | 12.69 | | | $ | 13.12 | | | $ | 12.98 | | | $ | 12.78 | |
Income (loss) from investment operations: Net investment incomea | | | .29 | | | | .24 | | | | .34 | | | | .48 | | | | .50 | |
| Net realized and unrealized gain (loss) | | | .31 | | | | (.59 | ) | | | .03 | | | | .45 | | | | .32 | |
| Total from investment operations | | | .60 | | | | (.35 | ) | | | .37 | | | | .93 | | | | .82 | |
Less distributions from: Net investment income | | | (.27 | ) | | | (.37 | ) | | | (.52 | ) | | | (.57 | ) | | | (.62 | ) |
| Net realized gains | | | — | | | | (.50 | ) | | | (.28 | ) | | | (.22 | ) | | | — | |
| Total distributions | | | (.27 | ) | | | (.87 | ) | | | (.80 | ) | | | (.79 | ) | | | (.62 | ) |
| Net asset value, end of period | | $ | 11.80 | | | $ | 11.47 | | | $ | 12.69 | | | $ | 13.12 | | | $ | 12.98 | |
| Total Return (%) | | | 5.29 | b | | | (3.04 | )b | | | 2.93 | b | | | 7.46 | | | | 6.61 | |
| Ratios to Average Net Assets and Supplemental Data | |
| Net assets, end of period ($ millions) | | | 87 | | | | 96 | | | | 121 | | | | 146 | | | | 157 | |
| Ratio of expenses before expense reductions (%) | | | .72 | | | | .71 | | | | .68 | | | | .67 | | | | .64 | |
| Ratio of expenses after expense reductions (%) | | | .70 | | | | .67 | | | | .66 | | | | .67 | | | | .64 | |
| Ratio of net investment income (%) | | | 2.49 | | | | 2.05 | | | | 2.65 | | | | 3.68 | | | | 3.86 | |
| Portfolio turnover rate (%) | | | 393 | | | | 794 | | | | 796 | | | | 673 | | | | 423 | |
a Based on average shares outstanding during the period. b Total return would have been lower had certain expenses not been reduced. | |
| | | Years Ended December 31, | |
| Class B | | | 2014 | | | 2013 | | | 2012 | | | 2011 | | | 2010 | |
| Selected Per Share Data | |
| Net asset value, beginning of period | | $ | 11.46 | | | $ | 12.67 | | | $ | 13.10 | | | $ | 12.95 | | | $ | 12.75 | |
Income (loss) from investment operations: Net investment incomea | | | .25 | | | | .20 | | | | .29 | | | | .43 | | | | .46 | |
| Net realized and unrealized gain (loss) | | | .31 | | | | (.59 | ) | | | .03 | | | | .46 | | | | .31 | |
| Total from investment operations | | | .56 | | | | (.39 | ) | | | .32 | | | | .89 | | | | .77 | |
Less distributions from: Net investment income | | | (.23 | ) | | | (.32 | ) | | | (.47 | ) | | | (.52 | ) | | | (.57 | ) |
| Net realized gains | | | — | | | | (.50 | ) | | | (.28 | ) | | | (.22 | ) | | | — | |
| Total distributions | | | (.23 | ) | | | (.82 | ) | | | (.75 | ) | | | (.74 | ) | | | (.57 | ) |
| Net asset value, end of period | | $ | 11.79 | | | $ | 11.46 | | | $ | 12.67 | | | $ | 13.10 | | | $ | 12.95 | |
| Total Return (%) | | | 4.95 | b | | | (3.25 | )b | | | 2.48 | b | | | 7.15 | | | | 6.24 | |
| Ratios to Average Net Assets and Supplemental Data | |
| Net assets, end of period ($ millions) | | | 3 | | | | 4 | | | | 5 | | | | 7 | | | | 6 | |
| Ratio of expenses before expense reductions (%) | | | 1.06 | | | | 1.06 | | | | 1.03 | | | | 1.01 | | | | .99 | |
| Ratio of expenses after expense reductions (%) | | | 1.03 | | | | .99 | | | | 1.01 | | | | 1.01 | | | | .99 | |
| Ratio of net investment income (%) | | | 2.16 | | | | 1.71 | | | | 2.29 | | | | 3.34 | | | | 3.51 | |
| Portfolio turnover rate (%) | | | 393 | | | | 794 | | | | 796 | | | | 673 | | | | 423 | |
a Based on average shares outstanding during the period. b Total return would have been lower had certain expenses not been reduced. | |
Notes to Financial Statements
A. Organization and Significant Accounting Policies
Deutsche Government & Agency Securities VIP (formerly DWS Government & Agency Securities VIP) (the "Fund") is a diversified series of Deutsche Variable Series II (formerly DWS Variable Series II) (the "Trust"), which is registered under the Investment Company Act of 1940, as amended (the "1940 Act"), as an open-end management investment company organized as a Massachusetts business trust.
Multiple Classes of Shares of Beneficial Interest. The Fund offers two classes of shares (Class A shares and Class B shares). Sales of Class B shares are subject to recordkeeping fees up to 0.15% and Rule 12b-1 fees under the 1940 Act equal to an annual rate of 0.25% of the average daily net assets of the Class B shares of the Fund. Class A shares are not subject to such fees.
Investment income, realized and unrealized gains and losses, and certain fund-level expenses and expense reductions, if any, are borne pro rata on the basis of relative net assets by the holders of all classes of shares except that each class bears certain expenses unique to that class (including the applicable Rule 12b-1 fee and recordkeeping fees). Differences in class-level expenses may result in payment of different per share dividends by class. All shares have equal rights with respect to voting subject to class-specific arrangements.
The Fund's financial statements are prepared in accordance with accounting principles generally accepted in the United States of America which require the use of management estimates. Actual results could differ from those estimates. The policies described below are followed consistently by the Fund in the preparation of its financial statements.
Security Valuation. Investments are stated at value determined as of the close of regular trading on the New York Stock Exchange on each day the exchange is open for trading.
Various inputs are used in determining the value of the Fund's investments. These inputs are summarized in three broad levels. Level 1 includes quoted prices in active markets for identical securities. Level 2 includes other significant observable inputs (including quoted prices for similar securities, interest rates, prepayment speeds and credit risk). Level 3 includes significant unobservable inputs (including the Fund's own assumptions in determining the fair value of investments). The level assigned to the securities valuations may not be an indication of the risk or liquidity associated with investing in those securities.
Debt securities are valued at prices supplied by independent pricing services approved by the Fund's Board. Such services may use various pricing techniques which take into account appropriate factors such as
yield, quality, coupon rate, maturity, type of issue, trading characteristics, prepayment speeds and other data, as well as broker quotes. If the pricing services are unable to provide valuations, debt securities are
valued at the average of the most recent reliable bid quotations or evaluated prices, as applicable, obtained from broker-dealers. These securities are generally categorized as Level 2.
Money market instruments purchased with an original or remaining maturity of sixty days or less, maturing at par, are valued at amortized cost, which approximates value, and are categorized as Level 2. Investments in open-end investment companies are valued at their net asset value each business day and are categorized as Level 1.
Futures contracts are generally valued at the settlement prices established each day on the exchange on which they are traded and are categorized as Level 1.
Swap contracts are valued daily based upon prices supplied by a Board approved pricing vendor, if available, and otherwise are valued at the price provided by the broker-dealer. Swap contracts are generally categorized as Level 2.
Exchange-traded options are valued at the last sale price or, in the absence of a sale, the mean between the closing bid and asked prices or at the most recent asked price (bid for purchased options) if no bid or asked price are available. Exchange-traded options are categorized as Level 1. Over-the-counter written or purchased options are valued at prices supplied by a Board approved pricing vendor, if available, and otherwise are valued at the price provided by the broker-dealer with which the option was traded. Over-the-counter written or purchased options are generally categorized as Level 2.
Securities and other assets for which market quotations are not readily available or for which the above valuation procedures are deemed not to reflect fair value are valued in a manner that is intended to reflect their fair value as determined in accordance with procedures approved by the Board and are generally categorized as Level 3. In accordance with the Fund's valuation procedures, factors considered in determining value may include, but are not limited to, the type of the security; the size of the holding; the initial cost of the security; the existence of any contractual restrictions on the security's disposition; the price and extent of public trading in similar securities of the issuer or of comparable companies; quotations or evaluated prices from broker-dealers and/or pricing services; information obtained from the issuer, analysts, and/or the appropriate stock exchange (for exchange-traded securities); an analysis of the company's or issuer's financial statements; an evaluation of the forces that influence the issuer and the market(s) in which the security is purchased and sold; and with respect to debt securities, the maturity, coupon, creditworthiness, currency denomination and the movement of the market in which the security is normally traded. The value determined under these procedures may differ from published values for the same securities.
Disclosure about the classification of fair value measurements is included in a table following the Fund's Investment Portfolio.
Securities Lending. Deutsche Bank AG, as lending agent, lends securities of the Fund to certain financial institutions under the terms of the Security Lending Agreement. The Fund retains the benefits of owning the securities it has loaned and continues to receive interest and dividends generated by the securities and to participate in any changes in their market value. The Fund requires the borrowers of the securities to maintain collateral with the Fund consisting of either cash or liquid, unencumbered assets having a value at least equal to the value of the securities loaned. When the collateral falls below specified amounts, the lending agent will use its best effort to obtain additional collateral on the next business day to meet required amounts under the security lending agreement. The Fund may invest the cash collateral into a joint trading account in an affiliated money market fund pursuant to Exemptive Orders issued by the SEC. The Fund receives compensation for lending its securities either in the form of fees or by earning interest on invested cash collateral net of borrower rebates and fees paid to a lending agent. Either the Fund or the borrower may terminate the loan. There may be risks of delay and costs in recovery of securities or even loss of rights in the collateral should the borrower of the securities fail financially. If the Fund is not able to recover securities lent, the Fund may sell the collateral and purchase a replacement investment in the market, incurring the risk that the value of the replacement security is greater than the value of the collateral. The Fund is also subject to all investment risks associated with the reinvestment of any cash collateral received, including, but not limited to, interest rate, credit and liquidity risk associated with such investments.
The Fund had no securities on loan at December 31, 2014.
Mortgage Dollar Rolls. The Fund may enter into mortgage dollar rolls in which the Fund sells to a bank or broker/dealer (the "counterparty") mortgage-backed securities for delivery in the current month and simultaneously contracts to repurchase similar, but not identical, securities on a fixed date. The counterparty receives all principal and interest payments, including prepayments, made on the security while it is the holder. The Fund receives compensation as consideration for entering into the commitment to repurchase. The compensation is paid in the form of a lower price for the security upon its repurchase, or alternatively, a fee. Mortgage dollar rolls may be renewed with a new sale and repurchase price and a cash settlement made at each renewal without physical delivery of the securities subject to the contract.
Certain risks may arise upon entering into mortgage dollar rolls from the potential inability of counterparties to meet the terms of their commitments. Additionally, the value of such securities may change adversely before the Fund is able to repurchase them. There can be no assurance that the Fund's use of the cash that it receives from a mortgage dollar roll will provide a return that exceeds its costs.
When-Issued/Delayed Delivery Securities. The Fund may purchase or sell securities with delivery or payment to occur at a later date beyond the normal settlement period. At the time the Fund enters into a commitment to purchase or sell a security, the transaction is recorded and the value of the transaction is reflected in the net asset value. The price of such security and the date when the security will be delivered and paid for are fixed at the time the transaction is negotiated. The value of the security may vary with market fluctuations. At the time the Fund enters into a purchase transaction it is required to segregate cash or other liquid assets at least equal to the amount of the commitment. Additionally, the Fund may be required to post securities and/or cash collateral in accordance with the terms of the commitment.
Certain risks may arise upon entering into when-issued or delayed delivery transactions from the potential inability of counterparties to meet the terms of their contracts or if the issuer does not issue the securities due to political, economic or other factors. Additionally, losses may arise due to changes in the value of the underlying securities.
Federal Income Taxes. The Fund's policy is to comply with the requirements of the Internal Revenue Code, as amended, which are applicable to regulated investment companies and to distribute all of its taxable income to its shareholders.
At December 31, 2014, the Fund had approximately $806,000 of net tax basis capital loss carryforwards, which may be applied against realized net taxable capital gains indefinitely, including short-term losses ($723,000) and long-term losses ($83,000).
The Fund has reviewed the tax positions for the open tax years as of December 31, 2014 and has determined that no provision for income tax and/or uncertain tax provisions is required in the Fund's financial statements. The Fund's federal tax returns for the prior three fiscal years remain open subject to examination by the Internal Revenue Service.
Distribution of Income and Gains. Distributions from net investment income of the Fund, if any, are declared and distributed to shareholders annually. Net realized gains from investment transactions, in excess of available capital loss carryforwards, would be taxable to the Fund if not distributed and, therefore, will be distributed to shareholders at least annually. The Fund may also make additional distributions for tax purposes if necessary.
The timing and characterization of certain income and capital gain distributions are determined annually in accordance with federal tax regulations which may differ from accounting principles generally accepted in the United States of America. These differences primarily relate to investments in futures contracts, investments in swap contracts and certain securities sold at a loss. As a result, net investment income (loss) and net realized gain (loss) on investment transactions for a reporting period may differ significantly from distributions during such period. Accordingly, the Fund may periodically make reclassifications among certain of its capital accounts without impacting the net asset value of the Fund.
At December 31, 2014, the Fund's components of distributable earnings on a tax basis were as follows:
| Undistributed ordinary income* | | $ | 2,337,514 | |
| Capital loss carryforward | | $ | (806,000 | ) |
| Unrealized appreciation (depreciation) on investments | | $ | 4,124,698 | |
In addition, the tax character of distributions paid by the Fund is summarized as follows:
| | | Years Ended December 31, | |
| | | 2014 | | | 2013 | |
| Distributions from ordinary income* | | $ | 2,245,215 | | | $ | 5,193,028 | |
| Distributions from long-term capital gains | | $ | — | | | $ | 2,959,762 | |
* For tax purposes, short-term capital gain distributions are considered ordinary income distributions.
Expenses. Expenses of the Trust arising in connection with a specific fund are allocated to that fund. Other Trust expenses which cannot be directly attributed to a fund are apportioned among the funds in the Trust based upon the relative net assets or other appropriate measures.
Contingencies. In the normal course of business, the Fund may enter into contracts with service providers that contain general indemnification clauses. The Fund's maximum exposure under these arrangements is unknown as this would involve future claims that may be made against the Fund that have not yet been made. However, based on experience, the Fund expects the risk of loss to be remote.
Other. Investment transactions are accounted for on a trade date plus one basis for daily net asset value calculations. However, for financial reporting purposes, investment transactions are reported on trade date. Interest income is recorded on the accrual basis. Realized gains and losses from investment transactions are recorded on an identified cost basis. All discounts and premiums are accreted/amortized for both tax and financial reporting purposes for the Fund.
B. Derivative Instruments
Swaps. A swap is a contract between two parties to exchange future cash flows at periodic intervals based on the notional amount of the swap. A bilateral swap is a transaction between the fund and a counterparty where cash flows are exchanged between the two parties. A centrally cleared swap is a transaction executed between the fund and a counterparty, then cleared by a clearing member through a central clearinghouse. The central clearinghouse serves as the counterparty, with whom the fund exchanges cash flows.
The value of a swap is adjusted daily, and the change in value, if any, is recorded as unrealized appreciation or depreciation in the Statement of Assets and Liabilities. Gains or losses are realized when the swap expires or is closed. Certain risks may arise when entering into swap transactions including counterparty default; liquidity; or unfavorable changes in interest rates or the value of the underlying reference security, commodity or index. In connection with bilateral swaps, securities and/or cash may be identified as collateral in accordance with the terms of the swap agreement to provide assets of value and recourse in the event of default. The maximum counterparty credit risk is the net present value of the cash flows to be received from or paid to the counterparty over the term of the swap, to the extent that this amount is beneficial to the Fund, in addition to any related collateral posted to the counterparty by the Fund. This risk may be partially reduced by a master netting arrangement between the Fund and the counterparty. Upon entering into a centrally cleared swap, the Fund is required to deposit with a financial intermediary cash or securities ("initial margin") in an amount equal to a certain percentage of the notional amount of the swap. Subsequent payments ("variation margin") are made or received by the Fund dependent upon the daily fluctuations in the value of the swap. In a cleared swap transaction, counterparty risk is minimized as the central clearinghouse acts as the counterparty.
An upfront payment, if any, made by the Fund is recorded as an asset in the Statement of Assets and Liabilities. An upfront payment, if any, received by the Fund is recorded as a liability in the Statement of Assets and Liabilities. Payments received or made at the end of the measurement period are recorded as realized gain or loss in the Statement of Operations.
Interest rate swaps are agreements in which the Fund agrees to pay to the counterparty a fixed rate payment in exchange for the counterparty agreeing to pay to the Fund a variable rate payment, or the Fund agrees to receive from the counterparty a fixed rate payment in exchange for the counterparty agreeing to receive from the Fund a variable rate payment. The payment obligations are based on the notional amount of the swap. For the year ended December 31, 2014, the Fund entered into interest rate swap agreements to gain exposure to different parts of the yield curve while managing overall duration.
For the year ended December 31, 2014, the investment in interest rate swap contracts had a total notional amount generally indicative of a range from $31,300,000 to $43,200,000.
Options. An option contract is a contract in which the writer (seller) of the option grants the buyer of the option, upon payment of a premium, the right to purchase from (call option), or sell to (put option), the writer a designated instrument at a specified price within a specified period of time. The Fund may write or purchase interest rate swaption agreements which are options to enter into a pre-defined swap agreement. The interest rate swaption agreement will specify whether the buyer of the swaption will be a fixed-rate receiver or a fixed-rate payer upon exercise. Certain options, including options on indices and interest rate options, will require cash settlement by the Fund if exercised. For the year ended December 31, 2014, the Fund entered into options on interest rate swap contracts in order to hedge against potential adverse interest rate movements of portfolio assets.
If the Fund writes a covered call option, the Fund foregoes, in exchange for the premium, the opportunity to profit during the option period from an increase in the market value of the underlying security above the exercise price. If the Fund writes a put option it accepts the risk of a decline in the value of the underlying security below the exercise price. Over-the-counter options have the risk of the potential inability of counterparties to meet the terms of their contracts. For exchange-traded contracts, the counterparty risk is minimized as the exchange's clearinghouse acts as the counterparty, and guarantees the futures against default. The Fund's maximum exposure to purchased options is limited to the premium initially paid. In addition, certain risks may arise upon entering into option contracts, including the risk that an illiquid secondary market will limit the Fund's ability to close out an option contract prior to the expiration date and that a change in the value of the option contract may not correlate exactly with changes in the value of the securities or currencies hedged.
A summary of the open purchased option contracts as of December 31, 2014 is included in the Fund's Investment Portfolio. A summary of open written option contracts is included in a table following the Fund's Investment Portfolio. For the year ended December 31, 2014, the investment in written option contracts had a total value generally indicative of a range from approximately $472,000 to $1,263,000, and purchased option contracts had a total value generally indicative of a range from approximately $202,000 to $551,000.
Futures Contracts. A futures contract is an agreement between a buyer or seller and an established futures exchange or its clearinghouse in which the buyer or seller agrees to take or make a delivery of a specific amount of a financial instrument at a specified price on a specific date (settlement date). For the year ended December 31, 2014, the Fund entered into interest rate futures to gain exposure to different parts of the yield curve while managing overall duration.
Upon entering into a futures contract, the Fund is required to deposit with a financial intermediary cash or securities ("initial margin") in an amount equal to a certain percentage of the face value indicated in the futures contract. Subsequent payments ("variation margin") are made or received by the Fund dependent upon the daily fluctuations in the value and are recorded for financial reporting purposes as unrealized gains or losses by the Fund. Gains or losses are realized when the contract expires or is closed. Since all futures contracts are exchange-traded, counterparty risk is minimized as the exchange's clearinghouse acts as the counterparty, and guarantees the futures against default.
Certain risks may arise upon entering into futures contracts, including the risk that an illiquid market will limit the Fund's ability to close out a futures contract prior to the settlement date and the risk that the futures contract is not well correlated with the security, index or currency to which it relates. Risk of loss may exceed amounts disclosed in the Statement of Assets and Liabilities.
A summary of the open futures contracts as of December 31, 2014, is included in a table following the Fund's Investment Portfolio. For the year ended December 31, 2014, the investment in futures contracts purchased had a total notional value generally indicative of a range from approximately $3,940,000 to $22,313,000, and the investment in futures contracts sold had a total notional value generally indicative of a range from $0 to approximately $10,835,000.
The following tables summarize the value of the Fund's derivative instruments held as of December 31, 2014 and the related location in the accompanying Statement of Assets and Liabilities, presented by primary underlying risk exposure:
| Asset Derivatives | | Purchased Options | | | Futures Contracts | | | Swap Contracts | | | Total | |
| Interest Rate Contracts (a) (b) | | $ | 202,263 | | | $ | 10,065 | | | $ | 200 | | | $ | 212,528 | |
Each of the above derivatives is located in the following Statement of Assets and Liabilities accounts: (a) Investments in securities, at value (includes purchased options) (b) Includes cumulative appreciation of futures and centrally cleared swap contracts as disclosed in the Investment Portfolio. Unsettled variation margin is disclosed separately within the Statement of Assets and Liabilities. | |
| Liability Derivatives | | Written Options | | | Swap Contracts | | | Total | |
| Interest Rate Contracts (a) (b) | | $ | (1,262,527 | ) | | $ | (9,228 | ) | | $ | (1,271,755 | ) |
Each of the above derivatives is located in the following Statement of Assets and Liabilities accounts: (a) Options written, at value and unrealized depreciation on bilateral swap contracts (b) Includes cumulative depreciation of centrally cleared swap contracts as disclosed in the Investment Portfolio. Unsettled variation margin is disclosed separately within the Statement of Assets and Liabilities. | |
Additionally, the amount of unrealized and realized gains and losses on derivative instruments recognized in Fund earnings during the year ended December 31, 2014 and the related location in the accompanying Statement of Operations is summarized in the following tables by primary underlying risk exposure:
| Realized Gain (Loss) | | Written Options | | | Swap Contracts | | | Futures Contracts | | | Total | |
| Interest Rate Contracts (a) | | $ | 153,070 | | | $ | (1,919,349 | ) | | $ | (778,304 | ) | | $ | (2,544,583 | ) |
Each of the above derivatives is located in the following Statement of Operations accounts: (a) Net realized gain (loss) from written options, swap contracts and futures, respectively | |
| Change in Net Unrealized Appreciation (Depreciation) | | Purchased Options | | | Written Options | | | Swap Contracts | | | Futures Contracts | | | Total | |
| Interest Rate Contracts (a) | | $ | 349,176 | | | $ | (468,452 | ) | | $ | 112,422 | | | $ | 273,643 | | | $ | 266,789 | |
Each of the above derivatives is located in the following Statement of Operations accounts: (a) Change in net unrealized appreciation (depreciation) from investments (includes purchased options), written options, swap contracts and futures, respectively | |
As of December 31, 2014, the Fund has transactions subject to enforceable master netting agreements. A reconciliation of the gross amounts on the Statement of Assets and Liabilities to the net amounts by counterparty, including any collateral exposure, is included in the following tables:
| Counterparty | | Gross Amounts of Assets Presented in the Statement of Assets and Liabilities | | | Financial Instruments and Derivatives Available for Offset | | | Cash Collateral Received | | | Non-Cash Collateral Received | | | Net Amount of Derivative Assets | |
| BNP Paribas | | $ | 186,340 | | | $ | (186,340 | ) | | $ | — | | | $ | — | | | $ | — | |
| Nomura International PLC | | | 15,923 | | | | (15,923 | ) | | | — | | | | — | | | | — | |
| | | $ | 202,263 | | | $ | (202,263 | ) | | $ | — | | | $ | — | | | $ | — | |
| Counterparty | | Gross Amounts of Liabilities Presented in the Statement of Assets and Liabilities | | | Financial Instruments and Derivatives Available for Offset | | | Cash Collateral Pledged | | | Non-Cash Collateral Pledged (a) | | | Net Amount of Derivative Liabilities | |
| Barclays Bank PLC | | $ | 185,312 | | | $ | — | | | $ | — | | | $ | — | | | $ | 185,312 | |
| BNP Paribas | | | 524,308 | | | | (186,340 | ) | | | — | | | | — | | | | 337,968 | |
| Citigroup, Inc. | | | 152,945 | | | | — | | | | — | | | | — | | | | 152,945 | |
| Morgan Stanley | | | 115,883 | | | | — | | | | — | | | | — | | | | 115,883 | |
| Nomura International PLC | | | 293,134 | | | | (15,923 | ) | | | — | | | | (277,211 | ) | | | — | |
| | | $ | 1,271,582 | | | $ | (202,263 | ) | | $ | — | | | $ | (277,211 | ) | | $ | 792,108 | |
(a) The actual collateral pledged may be more than the amount shown.
C. Purchases and Sales of Securities
During the year ended December 31, 2014, purchases and sales of investment securities (excluding short-term investments and U.S. Treasury securities) aggregated $410,110,065 and $430,914,132, respectively. Purchases and sales of U.S. Treasury securities aggregated $37,869,545 and $40,041,363, respectively.
For the year ended December 31, 2014, transactions for written options on interest rate swap contracts were as follows:
| | | Contract Amount | | | Premiums | |
| Outstanding, beginning of period | | | 31,600,000 | | | $ | 748,861 | |
| Options written | | | 21,700,000 | | | | 291,548 | |
| Options closed | | | (11,000,000 | ) | | | (135,370 | ) |
| Options expired | | | (2,400,000 | ) | | | (17,700 | ) |
| Outstanding, end of period | | | 39,900,000 | | | $ | 887,339 | |
D. Related Parties
Management Agreement. Under the Investment Management Agreement with Deutsche Investment Management Americas Inc. ("DIMA" or the "Advisor"), an indirect, wholly owned subsidiary of Deutsche Bank AG, the Advisor directs the investments of the Fund in accordance with its investment objectives, policies and restrictions. The Advisor determines the securities, instruments and other contracts relating to investments to be purchased, sold or entered into by the Fund.
Pursuant to the Investment Management Agreement with the Advisor, the Fund pays a monthly management fee based on the Fund's average daily net assets, computed and accrued daily and payable monthly, at the following annual rates:
| First $250 million | | | .450 | % |
| Next $750 million | | | .430 | % |
| Next $1.5 billion | | | .410 | % |
| Next $2.5 billion | | | .400 | % |
| Next $2.5 billion | | | .380 | % |
| Next $2.5 billion | | | .360 | % |
| Next $2.5 billion | | | .340 | % |
| Over $12.5 billion | | | .320 | % |
Accordingly, for the year ended December 31, 2014, the fee pursuant to the Investment Management Agreement was equivalent to an annual rate (exclusive of any applicable waivers/reimbursements) of 0.45% of the Fund's average daily net assets.
For the period from January 1, 2014 through April 30, 2014, the Advisor had contractually agreed to waive all or a portion of its fees and/or reimburse certain operating expenses of the Fund to the extent necessary to maintain the operating expenses (excluding certain expenses such as extraordinary expenses, taxes, brokerage and interest) of each class as follows:
For the period from May 1, 2014 through September 30, 2014, the Advisor had contractually agreed to waive all or a portion of its fees and/or reimburse certain operating expenses of the Fund to the extent necessary to maintain the total annual operating expenses (excluding certain expenses such as extraordinary expenses, taxes, brokerage and interest) of each class as follows:
Effective October 1, 2014 through September, 2015, the Advisor has contractually agreed to waive all or a portion of its fees and/or reimburse certain operating expenses of the Fund to the extent necessary to maintain the total annual operating expenses (excluding certain expenses such as extraordinary expenses, taxes, brokerage and interest) of each class as follows:
For the year ended December 31, 2014, fees waived and/or expenses reimbursed for each class are as follows:
| Class A | | $ | 17,280 | |
| Class B | | | 959 | |
| | | $ | 18,239 | |
Administration Fee. Pursuant to an Administrative Services Agreement, DIMA provides most administrative services to the Fund. For all services provided under the Administrative Services Agreement, the Fund pays DIMA an annual fee ("Administration Fee") of 0.10% of the Fund's average daily net assets, computed and accrued daily and payable monthly. For the year ended December 31, 2014, the Administration Fee was $96,333, of which $7,735 is unpaid.
Service Provider Fees. DeAWM Service Company ("DSC"), an affiliate of the Advisor, is the transfer agent, dividend-paying agent and shareholder service agent for the Fund. Pursuant to a sub-transfer agency agreement between DSC and DST Systems, Inc. ("DST"), DSC has delegated certain transfer agent, dividend-paying agent and shareholder service agent functions to DST. DSC compensates DST out of the shareholder servicing fee it receives from the Fund. For the year ended December 31, 2014, the amounts charged to the Fund by DSC were as follows:
| | | Total Aggregated | | | Unpaid at December 31, 2014 | |
| Class A | | $ | 294 | | | $ | 48 | |
| Class B | | | 71 | | | | 12 | |
| | | $ | 365 | | | $ | 60 | |
Distribution Service Agreement. Under the Fund's Class B 12b-1 plan, DeAWM Distributors, Inc. ("DDI") received a fee ("Distribution Service Fee") of 0.25% of average daily net assets of Class B shares. For the year ended December 31, 2014, the Distribution Service Fee aggregated $8,216, of which $642 is unpaid.
Typesetting and Filing Service Fees. Under an agreement with DIMA, DIMA is compensated for providing typesetting and certain regulatory filing services to the Fund. For the year ended December 31, 2014, the amount charged to the Fund by DIMA included in the Statement of Operations under "Reports to shareholders" aggregated $15,200, of which $5,682 is unpaid.
Trustees' Fees and Expenses. The Fund paid retainer fees to each Trustee not affiliated with the Advisor, plus specified amounts to the Board Chairperson and Vice Chairperson and to each committee Chairperson.
Affiliated Cash Management Vehicles. The Fund may invest uninvested cash balances in Central Cash Management Fund and Deutsche Variable NAV Money Fund, affiliated money market funds which are managed by the Advisor. Each affiliated money market fund seeks to provide a high level of current income consistent with liquidity and the preservation of capital. Each affiliated money market fund is managed in accordance with Rule 2a-7 under the Investment Company Act of 1940, which governs the quality, maturity, diversity and liquidity of instruments in which a money market fund may invest. Central Cash Management Fund seeks to maintain a stable net asset value, and Deutsche Variable NAV Money Fund maintains a floating net asset value. The Fund indirectly bears its proportionate share of the expenses of each affiliated money market fund in which it invests. Central Cash Management Fund does not pay the Advisor an investment management fee. To the extent that Deutsche Variable NAV Money Fund pays an investment management fee to the Advisor, the Advisor will waive an amount of the investment management fee payable to the Advisor by the Fund equal to the amount of the investment management fee payable on the Fund's assets invested in Deutsche Variable NAV Money Fund.
Securities Lending Agent Fees. Deutsche Bank AG serves as securities lending agent for the Fund. For the year ended December 31, 2014, the Fund incurred securities lending agent fees to Deutsche Bank AG in the amount of $342.
E. Ownership of the Fund
At December 31, 2014, three participating insurance companies were owners of record of 10% or more of the total outstanding Class A shares of the Fund, each owning 43%, 31% and 18%. One participating insurance company was the owner of record of 10% or more of the total outstanding Class B shares of the Fund, owning 95%.
F. Line of Credit
The Fund and other affiliated funds (the "Participants") share in a $400 million revolving credit facility provided by a syndication of banks. The Fund may borrow for temporary or emergency purposes, including the meeting of redemption requests that otherwise might require the untimely disposition of securities. The Participants are charged an annual commitment fee which is allocated based on net assets, among each of the Participants. Interest is calculated at a rate per annum equal to the sum of the Federal Funds Rate plus 1.25 percent plus if LIBOR exceeds the Federal Funds Rate the amount of such excess. The Fund may borrow up to a maximum of 33 percent of its net assets under the agreement. The Fund had no outstanding loans at December 31, 2014.
Report of Independent Registered Public Accounting Firm
To the Board of Trustees of Deutsche Variable Series II and Shareholders of Deutsche Government & Agency Securities VIP:
We have audited the accompanying statement of assets and liabilities, including the investment portfolio, of Deutsche Government & Agency Securities VIP (formerly DWS Government & Agency Securities VIP) (the "Fund") (one of the series constituting Deutsche Variable Series II (formerly DWS Variable Series II)), as of December 31, 2014, and the related statement of operations for the year then ended, the statements of changes in net assets for each of the two years in the period then ended, and the financial highlights for each of the periods indicated therein. These financial statements and financial highlights are the responsibility of the Fund’s management. Our responsibility is to express an opinion on these financial statements and financial highlights based on our audits.
We conducted our audits in accordance with the standards of the Public Company Accounting Oversight Board (United States). Those standards require that we plan and perform the audit to obtain reasonable assurance about whether the financial statements and financial highlights are free of material misstatement. We were not engaged to perform an audit of the Fund’s internal control over financial reporting. Our audits included consideration of internal control over financial reporting as a basis for designing audit procedures that are appropriate in the circumstances, but not for the purpose of expressing an opinion on the effectiveness of the Fund’s internal control over financial reporting. Accordingly, we express no such opinion. An audit also includes examining, on a test basis, evidence supporting the amounts and disclosures in the financial statements and financial highlights, assessing the accounting principles used and significant estimates made by management, and evaluating the overall financial statement presentation. Our procedures included confirmation of securities owned as of December 31, 2014, by correspondence with the custodian and brokers or by other appropriate auditing procedures where replies from brokers were not received. We believe that our audits provide a reasonable basis for our opinion.
In our opinion, the financial statements and financial highlights referred to above present fairly, in all material respects, the financial position of Deutsche Government & Agency Securities VIP at December 31, 2014, the results of its operations for the year then ended, the changes in its net assets for each of the two years in the period then ended, and the financial highlights for each of the periods indicated therein, in conformity with U.S. generally accepted accounting principles.
| | | |
Boston, Massachusetts February 13, 2015 | | |
Information About Your Fund's Expenses (Unaudited)
As an investor of the Fund, you incur two types of costs: ongoing expenses and transaction costs. Ongoing expenses include management fees, distribution and service (12b-1) fees and other Fund expenses. Examples of transaction costs include contract charges, which are not shown in this section. The following tables are intended to help you understand your ongoing expenses (in dollars) of investing in the Fund and to help you compare these expenses with the ongoing expenses of investing in other mutual funds. The example in the table is based on an investment of $1,000 invested at the beginning of the six-month period and held for the entire period (July 1, 2014 to December 31, 2014).
The tables illustrate your Fund's expenses in two ways:
—Actual Fund Return. This helps you estimate the actual dollar amount of ongoing expenses (but not transaction costs) paid on a $1,000 investment in the Fund using the Fund's actual return during the period. To estimate the expenses you paid over the period, simply divide your account value by $1,000 (for example, an $8,600 account value divided by $1,000 = 8.6), then multiply the result by the number in the "Expenses Paid per $1,000" line under the share class you hold.
—Hypothetical 5% Fund Return. This helps you to compare your Fund's ongoing expenses (but not transaction costs) with those of other mutual funds using the Fund's actual expense ratio and a hypothetical rate of return of 5% per year before expenses. Examples using a 5% hypothetical Fund return may be found in the shareholder reports of other mutual funds. The hypothetical account values and expenses may not be used to estimate the actual ending account balance or expenses you paid for the period.
Please note that the expenses shown in these tables are meant to highlight your ongoing expenses only and do not reflect any transaction costs. The "Expenses Paid per $1,000" line of the tables is useful in comparing ongoing expenses only and will not help you determine the relative total expense of owning different funds. If these transaction costs had been included, your costs would have been higher.
Expenses and Value of a $1,000 Investment for the six months ended December 31, 2014 | |
| Actual Fund Return | | Class A | | | Class B | |
| Beginning Account Value 7/1/14 | | $ | 1,000.00 | | | $ | 1,000.00 | |
| Ending Account Value 12/31/14 | | $ | 1,012.90 | | | $ | 1,012.00 | |
| Expenses Paid per $1,000* | | $ | 3.60 | | | $ | 5.27 | |
| Hypothetical 5% Fund Return | | Class A | | | Class B | |
| Beginning Account Value 7/1/14 | | $ | 1,000.00 | | | $ | 1,000.00 | |
| Ending Account Value 12/31/14 | | $ | 1,021.63 | | | $ | 1,019.96 | |
| Expenses Paid per $1,000* | | $ | 3.62 | | | $ | 5.30 | |
* Expenses are equal to the Fund's annualized expense ratio for each share class, multiplied by the average account value over the period, multiplied by 184 (the number of days in the most recent six-month period), then divided by 365.
| Annualized Expense Ratios | Class A | | Class B | |
| Deutsche Variable Series II — Deutsche Government & Agency Securities VIP | .71% | | 1.04% | |
For more information, please refer to the Fund's prospectus.
These tables do not reflect charges and fees ("contract charges") associated with the separate account that invests in the Fund or any variable life insurance policy or variable annuity contract for which the Fund is an investment option.
For an analysis of the fees associated with an investment in the fund or similar funds, please refer to the current and hypothetical expense calculators for Variable Insurance Products which can be found at deutschefunds.com/EN/resources/calculators.jsp.
Tax Information (Unaudited)
Please consult a tax advisor if you have questions about federal or state income tax laws, or on how to prepare your tax returns. If you have specific questions about your account, please contact your insurance provider.
The Trust's policies and procedures for voting proxies for portfolio securities and information about how the Trust voted proxies related to its portfolio securities during the 12-month period ended June 30 are available on our Web site — deutschefunds.com (click on "proxy voting" at the bottom of the page) — or on the SEC's Web site — sec.gov. To obtain a written copy of the Trust's policies and procedures without charge, upon request, call us toll free at (800) 728-3337.
Advisory Agreement Board Considerations and Fee Evaluation
The Board of Trustees approved the renewal of Deutsche Government & Agency Securities VIP’s investment management agreement (the "Agreement") with Deutsche Investment Management Americas Inc. ("DIMA") in September 2014.
In terms of the process that the Board followed prior to approving the Agreement, shareholders should know that:
— In September 2014, all of the Fund’s Trustees were independent of DIMA and its affiliates.
— The Trustees met frequently during the past year to discuss fund matters and dedicated a substantial amount of time to contract review matters. Over the course of several months, the Board’s Contract Committee, in coordination with the Board’s Fixed Income and Asset Allocation Oversight Committee, reviewed comprehensive materials received from DIMA, independent third parties and independent counsel. These materials included an analysis of the Fund’s performance, fees and expenses, and profitability compiled by a fee consultant retained by the Fund’s Independent Trustees (the "Fee Consultant"). The Board also received extensive information throughout the year regarding performance of the Fund.
— The Independent Trustees regularly meet privately with counsel to discuss contract review and other matters. In addition, the Independent Trustees were advised by the Fee Consultant in the course of their review of the Fund’s contractual arrangements and considered a comprehensive report prepared by the Fee Consultant in connection with their deliberations.
— In connection with reviewing the Agreement, the Board also reviewed the terms of the Fund’s Rule 12b-1 plan, distribution agreement, administrative services agreement, transfer agency agreement and other material service agreements.
— Based on its evaluation of the information provided, the Contract Committee presented its findings and recommendations to the Board. The Board then reviewed the Contract Committee’s findings and recommendations.
In connection with the contract review process, the Contract Committee and the Board considered the factors discussed below, among others. The Board also considered that DIMA and its predecessors have managed the Fund since its inception, and the Board believes that a long-term relationship with a capable, conscientious advisor is in the best interests of the Fund. The Board considered, generally, that shareholders chose to invest or remain invested in the Fund knowing that DIMA managed the Fund, and that the Agreement was approved by the Fund’s shareholders. DIMA is part of Deutsche Bank AG ("DB"), a major global banking institution that is engaged in a wide range of financial services. The Board believes that there are advantages to being part of a global asset management business that offers a wide range of investing expertise and resources, including hundreds of portfolio managers and analysts with research capabilities in many countries throughout the world.
As part of the contract review process, the Board carefully considered the fees and expenses of each Deutsche fund overseen by the Board in light of the fund’s performance. In many cases, this led to the negotiation and implementation of expense caps. As part of these negotiations, the Board indicated that it would consider relaxing these caps in future years following sustained improvements in performance, among other considerations.
In 2012, DB combined its Asset Management (of which DIMA was a part) and Wealth Management divisions into a new Asset and Wealth Management ("AWM") division. DB has advised the Independent Trustees that the U.S. asset management business is a critical and integral part of DB, and that DB will continue to invest in AWM a significant portion of the savings it has realized by combining its Asset and Wealth Management divisions, including ongoing enhancements to AWM’s investment capabilities. DB also has confirmed its commitment to maintaining strong legal and compliance groups within the AWM division.
While shareholders may focus primarily on fund performance and fees, the Fund’s Board considers these and many other factors, including the quality and integrity of DIMA’s personnel and such other issues as back-office operations, fund valuations, and compliance policies and procedures.
Nature, Quality and Extent of Services. The Board considered the terms of the Agreement, including the scope of advisory services provided under the Agreement. The Board noted that, under the Agreement, DIMA provides portfolio management services to the Fund and that, pursuant to a separate administrative services agreement, DIMA provides administrative services to the Fund. The Board considered the experience and skills of senior management and investment personnel, the resources made available to such personnel, the ability of DIMA to attract and retain high-quality personnel, and the organizational depth and stability of DIMA. The Board reviewed the Fund’s performance over short-term and long-term periods and compared those returns to various agreed-upon performance measures, including market index(es) and a peer universe compiled by the Fee Consultant using information supplied by Morningstar Direct ("Morningstar"), an independent fund data service. The Board also noted that it has put into place a process of identifying "Focus Funds" (e.g., funds performing poorly relative to a peer universe), and receives more frequent reporting and information from DIMA regarding such funds, along with DIMA’s plans to address underperformance. The Board believes this process is an effective manner of identifying and addressing underperforming funds. Based on the information provided, the Board noted that for the one-, three- and five-year periods ended December 31, 2013, the Fund’s performance (Class A shares) was in the 4th quartile, 3rd quartile and 1st quartile, respectively, of the applicable Morningstar universe (the 1st quartile being the best performers and the 4th quartile being the worst performers). The Board also observed that the Fund has outperformed its benchmark in the five-year period and has underperformed its benchmark in the one- and three-year periods ended December 31, 2013. The Board noted the disappointing investment performance of the Fund in recent periods and continued to discuss with senior management of DIMA the factors contributing to such underperformance and actions being taken to improve performance. The Board observed that the Fund had experienced improved relative performance during the first seven months of 2014. The Board recognized the efforts by DIMA in recent years to enhance its investment platform and improve long-term performance across the Deutsche fund complex.
Fees and Expenses. The Board considered the Fund’s investment management fee schedule, operating expenses and total expense ratios, and comparative information provided by Lipper Inc. ("Lipper") and the Fee Consultant regarding investment management fee rates paid to other investment advisors by similar funds (1st quartile being the most favorable and 4th quartile being the least favorable). With respect to management fees paid to other investment advisors by similar funds, the Board noted that the contractual fee rates paid by the Fund, which include a 0.10% fee paid to DIMA under the Fund’s administrative services agreement, were lower than the median (2nd quartile) of the applicable Lipper peer group (based on Lipper data provided as of December 31, 2013). The Board noted that the Fund’s Class A shares total (net) operating expenses were expected to be higher than the median (3rd quartile) of the applicable Lipper expense universe (based on Lipper data provided as of December 31, 2013, and analyzing Lipper expense universe Class A (net) expenses less any applicable 12b-1 fees) ("Lipper Universe Expenses"). The Board also reviewed data comparing each share class’s total (net) operating expenses to the applicable Lipper Universe Expenses. The Board also considered how the Fund’s total (net) operating expenses compared to the total (net) operating expenses of a more customized peer group selected by Lipper (based on such factors as asset size). The Board noted that the expense limitations agreed to by DIMA helped to ensure that the Fund’s total (net) operating expenses would remain competitive. The Board considered the Fund’s management fee rate as compared to fees charged by DIMA to a comparable fund and considered differences between the Fund and the comparable fund. The information requested by the Board as part of its review of fees and expenses also included information about institutional accounts and funds offered primarily to European investors ("Deutsche Europe funds") managed by DIMA and its affiliates. The Board noted that DIMA indicated that it does not manage any institutional accounts or Deutsche Europe funds comparable to the Fund.
On the basis of the information provided, the Board concluded that management fees were reasonable and appropriate in light of the nature, quality and extent of services provided by DIMA.
Profitability. The Board reviewed detailed information regarding revenues received by DIMA under the Agreement. The Board considered the estimated costs and pre-tax profits realized by DIMA from advising the Deutsche U.S. mutual funds ("Deutsche Funds"), as well as estimates of the pre-tax profits attributable to managing the Fund in particular. The Board also received information regarding the estimated enterprise-wide profitability of DIMA and its affiliates with respect to all fund services in totality and by fund. The Board and the Fee Consultant reviewed DIMA’s methodology in allocating its costs to the management of the Fund. Based on the information provided, the Board concluded that the pre-tax profits realized by DIMA in connection with the management of the Fund were not unreasonable.
Economies of Scale. The Board considered whether there are economies of scale with respect to the management of the Fund and whether the Fund benefits from any economies of scale. The Board noted that the Fund’s management fee schedule includes fee breakpoints. The Board concluded that the Fund’s fee schedule represents an appropriate sharing between the Fund and DIMA of such economies of scale as may exist in the management of the Fund at current asset levels.
Other Benefits to DIMA and Its Affiliates. The Board also considered the character and amount of other incidental benefits received by DIMA and its affiliates, including any fees received by DIMA for administrative services provided to the Fund and any fees received by an affiliate of DIMA for distribution services. The Board also considered benefits to DIMA related to brokerage and soft-dollar allocations, including allocating brokerage to pay for research generated by parties other than the executing broker dealers, which pertain primarily to funds investing in equity securities, along with the incidental public relations benefits to DIMA related to Deutsche Funds advertising and cross-selling opportunities among DIMA products and services. The Board concluded that management fees were reasonable in light of these fallout benefits.
Compliance. The Board considered the significant attention and resources dedicated by DIMA to documenting and enhancing its compliance processes in recent years. The Board noted in particular (i) the experience and seniority of DIMA’s and the Fund’s chief compliance officer; (ii) the large number of DIMA compliance personnel; and (iii) the substantial commitment of resources by DIMA and its affiliates to compliance matters.
Based on all of the information considered and the conclusions reached, the Board unanimously determined that the continuation of the Agreement is in the best interests of the Fund. In making this determination, the Board did not give particular weight to any single factor identified above. The Board considered these factors over the course of numerous meetings, certain of which were in executive session with only the Independent Trustees and counsel present. It is possible that individual Trustees may have weighed these factors differently in reaching their individual decisions to approve the continuation of the Agreement.
Board Members and Officers
The following table presents certain information regarding the Board Members and Officers of the fund. Each Board Member's year of birth is set forth in parentheses after his or her name. Unless otherwise noted, (i) each Board Member has engaged in the principal occupation(s) noted in the table for at least the most recent five years, although not necessarily in the same capacity; and (ii) the address of each Independent Board Member is c/o Kenneth C. Froewiss, Chairman, Deutsche Mutual Funds, P.O. Box 390601, Cambridge, MA 02139. Except as otherwise noted below, the term of office for each Board Member is until the election and qualification of a successor, or until such Board Member sooner dies, resigns, is removed or as otherwise provided in the governing documents of the fund. Because the fund does not hold an annual meeting of shareholders, each Board Member will hold office for an indeterminate period. The Board Members may also serve in similar capacities with other funds in the fund complex.
| Independent Board Members |
Name, Year of Birth, Position with the Fund and Length of Time Served1 | | Business Experience and Directorships During the Past Five Years | Number of Funds in Deutsche Fund Complex Overseen | Other Directorships Held by Board Member |
Kenneth C. Froewiss (1945) Chairperson since 2013, and Board Member since 2001 | | Adjunct Professor of Finance, NYU Stern School of Business (September 2009–present; Clinical Professor from 1997–September 2009); Member, Finance Committee, Association for Asian Studies (2002–present); Director, Mitsui Sumitomo Insurance Group (US) (2004–present); prior thereto, Managing Director, J.P. Morgan (investment banking firm) (until 1996) | 105 | — |
William McClayton (1944) Vice Chairperson since 2013, and Board Member since 2004 | | Private equity investor (since October 2009); previously, Managing Director, Diamond Management & Technology Consultants, Inc. (global consulting firm) (2001–2009); Directorship: Board of Managers, YMCA of Metropolitan Chicago; formerly: Senior Partner, Arthur Andersen LLP (accounting) (1966–2001); Trustee, Ravinia Festival | 105 | — |
John W. Ballantine (1946) Board Member since 1999 | | Retired; formerly, Executive Vice President and Chief Risk Management Officer, First Chicago NBD Corporation/The First National Bank of Chicago (1996–1998); Executive Vice President and Head of International Banking (1995–1996); former Directorships: Director and former Chairman of the Board, Healthways, Inc.2 (provider of disease and care management services) (2003–2014); Stockwell Capital Investments PLC (private equity); First Oak Brook Bancshares, Inc. and Oak Brook Bank; Prisma Energy International | 105 | Portland General Electric2 (utility company) (2003– present) |
Henry P. Becton, Jr. (1943) Board Member since 1990 | | Vice Chair and former President, WGBH Educational Foundation. Directorships: Public Radio International; Public Radio Exchange (PRX); North Bennett Street School (Boston); former Directorships: Belo Corporation2 (media company); The PBS Foundation; Association of Public Television Stations; Boston Museum of Science; American Public Television; Concord Academy; New England Aquarium; Mass. Corporation for Educational Telecommunications; Committee for Economic Development; Public Broadcasting Service; Connecticut College | 105 | Lead Director, Becton Dickinson and Company2 (medical technology company) |
Dawn-Marie Driscoll (1946) Board Member since 1987 | | Emeritus Executive Fellow, Center for Business Ethics, Bentley University; formerly: President, Driscoll Associates (consulting firm); Partner, Palmer & Dodge (law firm) (1988–1990); Vice President of Corporate Affairs and General Counsel, Filene's (retail) (1978–1988). Directorships: Director of ICI Mutual Insurance Company (since 2007); Advisory Board, Center for Business Ethics, Bentley University; Trustee and former Chairman of the Board, Southwest Florida Community Foundation (charitable organization); former Directorships: Sun Capital Advisers Trust (mutual funds) (2007–2012), Investment Company Institute (audit, executive, nominating committees) and Independent Directors Council (governance, executive committees) | 105 | — |
Keith R. Fox, CFA (1954) Board Member since 1996 | | Managing General Partner, Exeter Capital Partners (a series of private investment funds) (since 1986). Directorships: Progressive International Corporation (kitchen goods importer and distributor); The Kennel Shop (retailer); former Chairman, National Association of Small Business Investment Companies; former Directorships: BoxTop Media Inc. (advertising); Sun Capital Advisers Trust (mutual funds) (2011–2012) | 105 | — |
Paul K. Freeman (1950) Board Member since 1993 | | Consultant, World Bank/Inter-American Development Bank; Chair, Independent Directors Council; Investment Company Institute (executive and nominating committees); formerly, Chairman of Education Committee of Independent Directors Council; Project Leader, International Institute for Applied Systems Analysis (1998–2001); Chief Executive Officer, The Eric Group, Inc. (environmental insurance) (1986–1998); Directorships: Denver Zoo Foundation (December 2012–present); former Directorships: Prisma Energy International | 105 | — |
Richard J. Herring (1946) Board Member since 1990 | | Jacob Safra Professor of International Banking and Professor, Finance Department, The Wharton School, University of Pennsylvania (since July 1972); Co-Director, Wharton Financial Institutions Center; Co-Chair, U.S. Shadow Financial Regulatory Committee; Executive Director, Financial Economists Roundtable; formerly: Vice Dean and Director, Wharton Undergraduate Division (July 1995–June 2000); Director, Lauder Institute of International Management Studies (July 2000–June 2006) | 105 | Director, Aberdeen Singapore and Japan Funds (since 2007); Independent Director of Barclays Bank Delaware (since September 2010) |
Rebecca W. Rimel (1951) Board Member since 1995 | | President and Chief Executive Officer, The Pew Charitable Trusts (charitable organization) (1994 to present); formerly: Executive Vice President, The Glenmede Trust Company (investment trust and wealth management) (1983–2004); Board Member, Investor Education (charitable organization) (2004–2005); Trustee, Executive Committee, Philadelphia Chamber of Commerce (2001–2007); Director, Viasys Health Care2 (January 2007–June 2007); Trustee, Thomas Jefferson Foundation (charitable organization) (1994–2012) | 105 | Director, Becton Dickinson and Company2 (medical technology company) (2012– present); Director, BioTelemetry Inc.2 (health care) (2009– present) |
William N. Searcy, Jr. (1946) Board Member since 1993 | | Private investor since October 2003; formerly: Pension & Savings Trust Officer, Sprint Corporation2 (telecommunications) (November 1989–September 2003); Trustee, Sun Capital Advisers Trust (mutual funds) (1998–2012) | 105 | — |
Jean Gleason Stromberg (1943) Board Member since 1997 | | Retired. Formerly, Consultant (1997–2001); Director, Financial Markets U.S. Government Accountability Office (1996–1997); Partner, Norton Rose Fulbright, L.L.P. (law firm) (1978–1996). Directorships: The William and Flora Hewlett Foundation (charitable organization); former Directorships: Service Source, Inc. (nonprofit), Mutual Fund Directors Forum (2002–2004), American Bar Retirement Association (funding vehicle for retirement plans) (1987–1990 and 1994–1996) | 105 | — |
Robert H. Wadsworth* (1940) Board Member since 1999 | | President, Robert H. Wadsworth & Associates, Inc. (consulting firm) (1983 to present); Director, The Phoenix Boys Choir Association | 105 | — |
Officers4 |
Name, Year of Birth, Position with the Fund and Length of Time Served5 | | Business Experience and Directorships During the Past Five Years |
Brian E. Binder8 (1972) President and Chief Executive Officer, 2013–present | | Managing Director3 and Head of Fund Administration, Deutsche Asset & Wealth Management (2013–present); formerly: Head of Business Management and Consulting at Invesco, Ltd. (2010–2012); Chief Administrative Officer, Van Kampen Funds Inc. (2008–2010); and Chief Administrative Officer, Morgan Stanley Investment Management Americas Distribution (2003–2008) |
John Millette7 (1962) Vice President and Secretary, 1999–present | | Director,3 Deutsche Asset & Wealth Management |
Melinda Morrow6 (1970) Vice President, 2012–present | | Director,3 Deutsche Asset & Wealth Management |
Paul H. Schubert6 (1963) Chief Financial Officer, 2004–present Treasurer, 2005–present | | Managing Director,3 Deutsche Asset & Wealth Management (since July 2004); formerly: Executive Director, Head of Mutual Fund Services and Treasurer for UBS Family of Funds (1998–2004); Vice President and Director of Mutual Fund Finance at UBS Global Asset Management (1994–1998) |
Caroline Pearson7 (1962) Chief Legal Officer, 2010–present | | Managing Director,3 Deutsche Asset & Wealth Management; formerly: Assistant Secretary for DWS family of funds (1997–2010) |
Robert Kloby6 (1962) Chief Compliance Officer, 2006–present | | Managing Director,3 Deutsche Asset & Wealth Management |
Wayne Salit6 (1967) Anti-Money Laundering Compliance Officer, 2014–present | | Director,3 Deutsche Asset & Wealth Management; formerly: Managing Director, AML Compliance Officer at BNY Mellon (2011–2014); and Director, AML Compliance Officer at Deutsche Bank (2004–2011) |
Hepsen Uzcan7 (1974) Assistant Secretary, 2013–present | | Director,3 Deutsche Asset & Wealth Management |
Paul Antosca7 (1957) Assistant Treasurer, 2007–present | | Director,3 Deutsche Asset & Wealth Management |
Jack Clark7 (1967) Assistant Treasurer, 2007–present | | Director,3 Deutsche Asset & Wealth Management |
Diane Kenneally7 (1966) Assistant Treasurer, 2007–present | | Director,3 Deutsche Asset & Wealth Management |
1 The length of time served represents the year in which the Board Member joined the board of one or more Deutsche funds currently overseen by the Board.
2 A publicly held company with securities registered pursuant to Section 12 of the Securities Exchange Act of 1934.
3 Executive title, not a board directorship.
4 As a result of their respective positions held with the Advisor, these individuals are considered "interested persons" of the Advisor within the meaning of the 1940 Act. Interested persons receive no compensation from the fund.
5 The length of time served represents the year in which the officer was first elected in such capacity for one or more Deutsche funds.
6 Address: 60 Wall Street, New York, NY 10005.
7 Address: One Beacon Street, Boston, MA 02108.
8 Address: 222 South Riverside Plaza, Chicago, IL 60606.
* Robert H. Wadsworth retired from the Board effective December 31, 2014.
The fund's Statement of Additional Information ("SAI") includes additional information about the Board Members. The SAI is available, without charge, upon request. If you would like to request a copy of the SAI, you may do so by calling the following toll-free number: (800) 728-3337.
Notes
DeAWM Distributors, Inc.
222 South Riverside Plaza
Chicago, IL 60606
(800) 621-1148
VS2GAS-2 (R-025831-4 2/15)
December 31, 2014
Annual Report
Deutsche Variable Series II
(formerly DWS Variable Series II)
Deutsche Global Equity VIP
(formerly DWS Global Equity VIP)
Contents
9 Statement of Assets and Liabilities 10 Statement of Operations 10 Statement of Changes in Net Assets 13 Notes to Financial Statements 18 Report of Independent Registered Public Accounting Firm 19 Information About Your Fund's Expenses 21 Advisory Agreement Board Considerations and Fee Evaluation 23 Board Members and Officers |
This report must be preceded or accompanied by a prospectus. To obtain an additional prospectus or summary prospectus, if available, call (800) 728-3337 or your financial representative. We advise you to consider the Fund's objectives, risks, charges and expenses carefully before investing. The summary prospectus and prospectus contain this and other important information about the Fund. Please read the prospectus carefully before you invest.
Investing in derivatives entails special risks relating to liquidity, leverage and credit that may reduce returns and/or increase volatility. Investing in foreign securities, particularly those of emerging markets, presents certain risks, such as currency fluctuations, political and economic changes, and market risks. The Fund may lend securities to approved institutions. Stocks may decline in value. See the prospectus for details.
Deutsche Asset & Wealth Management represents the asset management and wealth management activities conducted by Deutsche Bank AG or any of its subsidiaries, including the Advisor and DeAWM Distributors, Inc.
NOT FDIC/NCUA INSURED NO BANK GUARANTEE MAY LOSE VALUE NOT A DEPOSIT
NOT INSURED BY ANY FEDERAL GOVERNMENT AGENCY
Performance Summary December 31, 2014 (Unaudited)
Fund performance shown is historical, assumes reinvestment of all dividend and capital gain distributions and does not guarantee future results. Investment return and principal value fluctuate with changing market conditions so that, when redeemed, shares may be worth more or less than their original cost. Current performance may be lower or higher than the performance data quoted. Please contact your participating insurance company for the Fund's most recent month-end performance. Performance doesn't reflect charges and fees ("contract charges") associated with the separate account that invests in the Fund or any variable life insurance policy or variable annuity contract for which the Fund is an investment option. These charges and fees will reduce returns.
The gross expense ratio of the Fund, as stated in the fee table of the prospectus dated May 1, 2014 is 1.08% for Class A shares and may differ from the expense ratio disclosed in the Financial Highlights table in this report.
| Growth of an Assumed $10,000 Investment in Deutsche Global Equity VIP |
| The MSCI All Country World Index is a free float-adjusted market capitalization weighted index that is designed to measure the equity market performance of developed and emerging markets. The index consists of 45 country indices comprising 24 developed and 21 emerging market country indices. Index returns do not reflect any fees or expenses and it is not possible to invest directly into an index. |
| |
| Yearly periods ended December 31 | |
| Comparative Results | |
| Deutsche Global Equity VIP | | 1-Year | | | 3-Year | | | 5-Year | | | 10-Year | |
| Class A | Growth of $10,000 | | $ | 10,114 | | | $ | 14,160 | | | $ | 13,811 | | | $ | 15,347 | |
| Average annual total return | | | 1.14 | % | | | 12.29 | % | | | 6.67 | % | | | 4.38 | % |
| MSCI All Country World Index | Growth of $10,000 | | $ | 10,416 | | | $ | 14,854 | | | $ | 15,507 | | | $ | 18,064 | |
| Average annual total return | | | 4.16 | % | | | 14.10 | % | | | 9.17 | % | | | 6.09 | % |
The growth of $10,000 is cumulative.
Management Summary December 31, 2014 (Unaudited)
Global equities delivered a mixed return during 2014, with underperformance in the international markets offsetting the strong showing of the United States. The Fund’s benchmark, the MSCI All Country World Index, returned 4.16% during the year, while the Class A shares of the Fund returned 1.14% (unadjusted for contract charges).1
The primary cause of the Fund’s underperformance was the weakness of its holdings in the consumer discretionary, information technology and industrial sectors.2 The largest individual detractor in each group were Las Vegas Sands Corp., AVEVA Group PLC and MasTec Corp., respectively. Outside of these sectors, the leading detractor was the mining company Anglo American PLC, which was pressured by the sharp downturn in commodity prices. Our allocation to the emerging markets also detracted from returns, but we believe it remains home to stocks with the growth characteristics we seek. On the plus side, we added value through our individual stock selection in the consumer staples and health care sectors. The leading contributors in these groups were Monster Beverage Corp., which rallied after Coca-Cola Co. took a strategic stake in the firm, and Allergan Inc., which received two competing takeover bids during the period.
The Fund closed the annual period with overweight positions in the consumer staples, health care and industrials sectors.3,4 We reduced the portfolio’s weighting in health care during the fourth quarter, however, as we believed many companies in the group had become more richly valued following their strong performance during 2014. With regard to industrials, the sector underperformed during the second half of the year since many companies in the group derive a large portion of their revenues from energy-related business lines. Broadly speaking, however, our holdings in the sector have a limited exposure to the drop in the oil price. Instead, they are geared more toward structural end-market demand in the commercial construction and aerospace sectors, as well to niche industrial technologies. On the other side of the ledger, the Fund held underweight positions in energy and financials, as well as in slower-growth sectors such as telecommunications services and utilities.
As always, we remained focused on the goal of delivering performance via individual stock selection rather than making large "macro" bets or taking on excessive risk. We continued to believe that the stocks of companies with strong revenue and growth prospects are well positioned in an environment of sluggish global economic activity. Accordingly, our bottom-up strategy was geared toward identifying companies with the type of sustainable, above-average potential growth characteristics that we believe may support performance even during periods of economic and market "noise."
Nils E. Ernst, PhD
Martin Berberich, CFA
Sebastian P. Werner, PhD
Portfolio Managers
The views expressed reflect those of the portfolio management team only through the end of the period of the report as stated on the cover. The management team's views are subject to change at any time based on market and other conditions and should not be construed as a recommendation. Past performance is no guarantee of future results. Current and future portfolio holdings are subject to risk.
1 The MSCI All Country World Index tracks the performance of stocks in select developed markets around the world, including the United States. Index returns do not reflect fees or expenses and it is not possible to invest directly into an index.
2 The consumer discretionary sector represents industries that produce goods and services that are not necessities in everyday life.
3 "Underweight" means the Fund holds a lower weighting in a given sector or security than the benchmark. "Overweight" means it holds a higher weighting.
4 Consumer staples are the industries that manufacture and sell products such as food and beverages, prescription drugs and household products.
Portfolio Summary (Unaudited) Asset Allocation (As a % of Investment Portfolio excluding Securities Lending Collateral) | 12/31/14 | 12/31/13 |
| | | |
| Common Stocks | 96% | 96% |
| Cash Equivalents | 3% | 3% |
| Participatory Notes | 1% | 1% |
| | 100% | 100% |
Sector Diversification (As a % of Common Stocks and Participatory Notes) | 12/31/14 | 12/31/13 |
| | | |
| Health Care | 19% | 13% |
| Industrials | 19% | 9% |
| Consumer Staples | 14% | 10% |
| Financials | 11% | 12% |
| Materials | 11% | 9% |
| Information Technology | 10% | 9% |
| Consumer Discretionary | 8% | 9% |
| Energy | 7% | 7% |
| Telecommunication Services | 1% | 13% |
| Utilities | — | 9% |
| | 100% | 100% |
Geographical Diversification
(As a % of Investment Portfolio excluding Cash Equivalents and Securities Lending Collateral) | 12/31/14 | 12/31/13 |
| | | |
| United States | 46% | 46% |
| Continental Europe | 32% | 32% |
| Canada | 7% | 6% |
| United Kingdom | 7% | 6% |
| Latin America | 3% | 1% |
| Pacific Basin | 3% | 5% |
| Other | 2% | 4% |
| | 100% | 100% |
Portfolio holdings and characteristics are subject to change.
For more complete details about the Fund's investment portfolio, see page 6.
Following the Fund's fiscal first and third quarter-end, a complete portfolio holdings listing is filed with the SEC on Form N-Q. The form will be available on the SEC's Web site at sec.gov, and it also may be reviewed and copied at the SEC's Public Reference Room in Washington, D.C. Information on the operation of the SEC's Public Reference Room may be obtained by calling (800) SEC-0330. The Fund's portfolio holdings are also posted on deutschefunds.com from time to time. Please see the Fund's current prospectus for more information.
Investment Portfolio December 31, 2014 | | | Shares | | | Value ($) | |
| | | | |
| Common Stocks 96.1% | |
| Belgium 2.0% | |
| Anheuser-Busch InBev NV (Cost $867,606) | | | 12,000 | | | | 1,350,405 | |
| Brazil 0.9% | |
| Estacio Participacoes SA (Cost $735,382) | | | 70,000 | | | | 619,478 | |
| Canada 7.1% | |
| Agnico Eagle Mines Ltd. | | | 23,000 | | | | 572,470 | |
| Alimentation Couche-Tard, Inc. "B" | | | 33,000 | | | | 1,383,000 | |
| Brookfield Asset Management, Inc. "A" | | | 32,000 | | | | 1,603,581 | |
| Canadian Pacific Railway Ltd. | | | 6,500 | | | | 1,251,829 | |
| (Cost $3,696,760) | | | | 4,810,880 | |
| Denmark 0.3% | |
| William Demant Holding AS* (Cost $231,756) | | | 3,000 | | | | 227,706 | |
| Finland 1.1% | |
| Stora Enso Oyj "R" (Cost $726,213) | | | 88,000 | | | | 783,297 | |
| France 2.2% | |
| Airbus Group NV | | | 12,000 | | | | 596,006 | |
| Pernod Ricard SA | | | 8,000 | | | | 887,016 | |
| (Cost $1,619,949) | | | | 1,483,022 | |
| Germany 6.6% | |
| adidas AG | | | 12,000 | | | | 836,378 | |
| BASF SE | | | 7,000 | | | | 591,736 | |
| Fresenius Medical Care AG & Co. KGaA | | | 29,000 | | | | 2,170,385 | |
| Lanxess AG | | | 18,641 | | | | 867,240 | |
| (Cost $4,367,428) | | | | 4,465,739 | |
| Hong Kong 0.8% | |
| Michael Kors Holdings Ltd.* (a) (Cost $531,747) | | | 7,000 | | | | 525,700 | |
| Indonesia 0.7% | |
| PT Bank Negara Indonesia Persero Tbk | | | 800,000 | | | | 390,633 | |
| PT Indofood CBP Sukses Makmur Tbk | | | 75,000 | | | | 79,403 | |
| (Cost $470,921) | | | | 470,036 | |
| Ireland 4.2% | |
| Glanbia PLC | | | 69,000 | | | | 1,059,464 | |
| Kerry Group PLC "A" | | | 12,028 | | | | 829,885 | |
| Shire PLC | | | 14,000 | | | | 990,546 | |
| (Cost $2,302,009) | | | | 2,879,895 | |
| Italy 0.4% | |
| World Duty Free SpA* (b) (Cost $327,520) | | | 28,400 | | | | 271,991 | |
| Luxembourg 1.1% | |
| Eurofins Scientific (Cost $712,011) | | | 3,000 | | | | 763,899 | |
| Malaysia 0.6% | |
| IHH Healthcare Bhd. (Cost $390,628) | | | 300,000 | | | | 412,830 | |
| | | Shares | | | Value ($) | |
| | | | | | | | | |
| Netherlands 1.4% | |
| Sensata Technologies Holding NV* (a) (Cost $836,561) | | | 18,000 | | | | 943,380 | |
| Norway 3.3% | |
| DNO ASA* (b) | | | 380,000 | | | | 808,668 | |
| Gjensidige Forsikring ASA | | | 40,000 | | | | 651,547 | |
| Statoil ASA | | | 44,000 | | | | 771,075 | |
| (Cost $2,247,147) | | | | 2,231,290 | |
| Panama 1.2% | |
| Copa Holdings SA "A" (b) (Cost $874,349) | | | 8,000 | | | | 829,120 | |
| Philippines 1.5% | |
| GT Capital Holdings, Inc. | | | 24,000 | | | | 551,403 | |
| Metropolitan Bank & Trust Co. | | | 250,000 | | | | 460,913 | |
| (Cost $1,069,961) | | | | 1,012,316 | |
| South Africa 1.1% | |
| MTN Group Ltd. (Cost $762,005) | | | 40,000 | | | | 759,072 | |
| Spain 0.6% | |
| Atresmedia Corp. de Medios de Comunicacion SA (Cost $405,557) | | | 27,000 | | | | 379,755 | |
| Sweden 3.7% | |
| Assa Abloy AB "B" | | | 14,000 | | | | 739,857 | |
| Atlas Copco AB "A" | | | 35,000 | | | | 974,299 | |
| Svenska Cellulosa AB "B" | | | 37,000 | | | | 799,053 | |
| (Cost $2,395,581) | | | | 2,513,209 | |
| Switzerland 2.4% | |
| Nestle SA (Registered) | | | 15,515 | | | | 1,137,274 | |
| Novartis AG (Registered) | | | 5,500 | | | | 505,821 | |
| (Cost $860,852) | | | | 1,643,095 | |
| United Kingdom 5.3% | |
| Anglo American PLC | | | 50,000 | | | | 925,098 | |
| Aon PLC (a) | | | 7,000 | | | | 663,810 | |
| Aveva Group PLC | | | 26,000 | | | | 532,230 | |
| British American Tobacco PLC | | | 13,000 | | | | 706,340 | |
| Halma PLC | | | 40,000 | | | | 426,428 | |
| Spirax-Sarco Engineering PLC | | | 8,000 | | | | 355,524 | |
| (Cost $4,347,697) | | | | 3,609,430 | |
| United States 47.6% | |
| Actavis PLC* | | | 5,000 | | | | 1,287,050 | |
| Allergan, Inc. | | | 1,000 | | | | 212,590 | |
| Alliance Data Systems Corp.* | | | 3,200 | | | | 915,360 | |
| Amgen, Inc. | | | 4,000 | | | | 637,160 | |
| Amphenol Corp. "A" | | | 33,000 | | | | 1,775,730 | |
| Bristol-Myers Squibb Co. | | | 18,000 | | | | 1,062,540 | |
| Bristow Group, Inc. | | | 5,000 | | | | 328,950 | |
| CBRE Group, Inc. "A"* | | | 20,000 | | | | 685,000 | |
| Cerner Corp.* | | | 14,000 | | | | 905,240 | |
| Colfax Corp.* | | | 21,000 | | | | 1,082,970 | |
| Danaher Corp. | | | 11,000 | | | | 942,810 | |
| DIRECTV* | | | 9,200 | | | | 797,640 | |
| eBay, Inc.* | | | 16,000 | | | | 897,920 | |
| Ecolab, Inc. | | | 9,000 | | | | 940,680 | |
| Express Scripts Holding Co.* | | | 23,000 | | | | 1,947,410 | |
| | | Shares | | | Value ($) | |
| | | | | | | | | |
| Exxon Mobil Corp. | | | 10,000 | | | | 924,500 | |
| Fastenal Co. (b) | | | 11,000 | | | | 523,160 | |
| JPMorgan Chase & Co. | | | 19,000 | | | | 1,189,020 | |
| Las Vegas Sands Corp. | | | 19,000 | | | | 1,105,040 | |
| LKQ Corp.* | | | 25,000 | | | | 703,000 | |
| MasTec, Inc.* | | | 25,000 | | | | 565,250 | |
| MasterCard, Inc. "A" | | | 15,000 | | | | 1,292,400 | |
| Mead Johnson Nutrition Co. | | | 6,000 | | | | 603,240 | |
| Monster Beverage Corp.* | | | 12,000 | | | | 1,300,200 | |
| Nielsen NV | | | 16,000 | | | | 715,680 | |
| Noble Energy, Inc. | | | 22,000 | | | | 1,043,460 | |
| Omnicare, Inc. | | | 12,000 | | | | 875,160 | |
| Pall Corp. | | | 14,000 | | | | 1,416,940 | |
| Praxair, Inc. | | | 11,000 | | | | 1,425,160 | |
| PTC, Inc.* | | | 9,000 | | | | 329,850 | |
| Schlumberger Ltd. | | | 11,000 | | | | 939,510 | |
| The Hershey Co. | | | 4,000 | | | | 415,720 | |
| The Travelers Companies, Inc. | | | 8,000 | | | | 846,800 | |
| United Technologies Corp. | | | 10,000 | | | | 1,150,000 | |
| Zoetis, Inc. | | | 12,000 | | | | 516,360 | |
| (Cost $28,247,758) | | | | 32,299,500 | |
Total Common Stocks (Cost $59,027,398) | | | | 65,285,045 | |
| | |
| | | Shares | | | Value ($) | |
| | | | | | | | | |
| Participatory Note 0.5% | |
| Nigeria | |
| Zenith Bank PLC (issuer Merrill Lynch International) Expiration Date 8/21/2015 (Cost $405,600) | | | 3,000,000 | | | | 301,802 | |
| | |
| Securities Lending Collateral 3.2% | |
| Daily Assets Fund Institutional, 0.10% (c) (d) (Cost $2,200,513) | | | 2,200,513 | | | | 2,200,513 | |
| | |
| Cash Equivalents 3.4% | |
| Central Cash Management Fund, 0.06% (c) (Cost $2,325,942) | | | 2,325,942 | | | | 2,325,942 | |
| | | % of Net Assets | | | Value ($) | |
| | | | |
Total Investment Portfolio (Cost $63,959,453)† | | | 103.2 | | | | 70,113,302 | |
| Other Assets and Liabilities, Net | | | (3.2 | ) | | | (2,195,791 | ) |
| Net Assets | | | 100.0 | | | | 67,917,511 | |
* Non-income producing security.
† The cost for federal income tax purposes was $63,957,305. At December 31, 2014, net unrealized appreciation for all securities based on tax cost was $6,155,997. This consisted of aggregate gross unrealized appreciation for all securities in which there was an excess of value over tax cost of $8,751,267 and aggregate gross unrealized depreciation for all securities in which there was an excess of tax cost over value of $2,595,270.
(a) Listed on the New York Stock Exchange.
(b) All or a portion of these securities were on loan. In addition, "Other Assets and Liabilities, Net" may include pending sales that are also on loan. The value of securities loaned at December 31, 2014 amounted to $2,102,645, which is 3.1% of net assets.
(c) Affiliated fund managed by Deutsche Investment Management Americas Inc. The rate shown is the annualized seven-day yield at period end.
(d) Represents collateral held in connection with securities lending. Income earned by the Fund is net of borrower rebates.
Fair Value Measurements
Various inputs are used in determining the value of the Fund's investments. These inputs are summarized in three broad levels. Level 1 includes quoted prices in active markets for identical securities. Level 2 includes other significant observable inputs (including quoted prices for similar securities, interest rates, prepayment speeds and credit risk). Level 3 includes significant unobservable inputs (including the Fund's own assumptions in determining the fair value of investments). The level assigned to the securities valuations may not be an indication of the risk or liquidity associated with investing in those securities.
The following is a summary of the inputs used as of December 31, 2014 in valuing the Fund's investments. For information on the Fund's policy regarding the valuation of investments, please refer to the Security Valuation section of Note A in the accompanying Notes to Financial Statements.
| Assets | | Level 1 | | | Level 2 | | | Level 3 | | | Total | |
| | |
| Common Stocks | |
| Belgium | | $ | — | | | $ | 1,350,405 | | | $ | — | | | $ | 1,350,405 | |
| Brazil | | | 619,478 | | | | — | | | | — | | | | 619,478 | |
| Canada | | | 4,810,880 | | | | — | | | | — | | | | 4,810,880 | |
| Denmark | | | — | | | | 227,706 | | | | — | | | | 227,706 | |
| Finland | | | — | | | | 783,297 | | | | — | | | | 783,297 | |
| France | | | — | | | | 1,483,022 | | | | — | | | | 1,483,022 | |
| Germany | | | — | | | | 4,465,739 | | | | — | | | | 4,465,739 | |
| Hong Kong | | | 525,700 | | | | — | | | | — | | | | 525,700 | |
| Indonesia | | | — | | | | 470,036 | | | | — | | | | 470,036 | |
| Ireland | | | — | | | | 2,879,895 | | | | — | | | | 2,879,895 | |
| Italy | | | — | | | | 271,991 | | | | — | | | | 271,991 | |
| Luxembourg | | | — | | | | 763,899 | | | | — | | | | 763,899 | |
| Malaysia | | | — | | | | 412,830 | | | | — | | | | 412,830 | |
| Netherlands | | | 943,380 | | | | — | | | | — | | | | 943,380 | |
| Norway | | | — | | | | 2,231,290 | | | | — | | | | 2,231,290 | |
| Panama | | | 829,120 | | | | — | | | | — | | | | 829,120 | |
| Philippines | | | — | | | | 1,012,316 | | | | — | | | | 1,012,316 | |
| South Africa | | | — | | | | 759,072 | | | | — | | | | 759,072 | |
| Spain | | | — | | | | 379,755 | | | | — | | | | 379,755 | |
| Sweden | | | — | | | | 2,513,209 | | | | — | | | | 2,513,209 | |
| Switzerland | | | — | | | | 1,643,095 | | | | — | | | | 1,643,095 | |
| United Kingdom | | | 663,810 | | | | 2,945,620 | | | | — | | | | 3,609,430 | |
| United States | | | 32,299,500 | | | | — | | | | — | | | | 32,299,500 | |
| Participatory Notes | | | — | | | | 301,802 | | | | — | | | | 301,802 | |
| Short-Term Investments (e) | | | 4,526,455 | | | | — | | | | — | | | | 4,526,455 | |
| Total | | $ | 45,218,323 | | | $ | 24,894,979 | | | $ | — | | | $ | 70,113,302 | |
There have been no transfers between fair value measurement levels during the year ended December 31, 2014.
(e) See Investment Portfolio for additional detailed categorizations.
The accompanying notes are an integral part of the financial statements.
Statement of Assets and Liabilities | as of December 31, 2014 | |
| Assets | |
Investments: Investments in non-affiliated securities, at value (cost $59,432,998) — including $2,102,645 of securities loaned | | $ | 65,586,847 | |
| Investment in Daily Assets Fund Institutional (cost $2,200,513)* | | | 2,200,513 | |
| Investment in Central Cash Management Fund (cost $2,325,942) | | | 2,325,942 | |
| Total investments in securities, at value (cost $63,959,453) | | | 70,113,302 | |
| Foreign currency, at value (cost $50,992) | | | 50,397 | |
| Receivable for Fund shares sold | | | 33,458 | |
| Dividends receivable | | | 26,067 | |
| Interest receivable | | | 171 | |
| Foreign taxes recoverable | | | 60,940 | |
| Other assets | | | 1,351 | |
| Total assets | | | 70,285,686 | |
| Liabilities | |
| Cash overdraft | | | 3,300 | |
| Payable upon return of securities loaned | | | 2,200,513 | |
| Payable for Fund shares redeemed | | | 22,385 | |
| Accrued management fee | | | 37,738 | |
| Accrued Trustees' fees | | | 1,222 | |
| Other accrued expenses and payables | | | 103,017 | |
| Total liabilities | | | 2,368,175 | |
| Net assets, at value | | $ | 67,917,511 | |
| Net Assets Consist of | |
| Undistributed net investment income | | | 345,800 | |
Net unrealized appreciation (depreciation) on: Investments | | | 6,153,849 | |
| Foreign currency | | | (5,751 | ) |
| Accumulated net realized gain (loss) | | | (44,157,702 | ) |
| Paid-in capital | | | 105,581,315 | |
| Net assets, at value | | $ | 67,917,511 | |
Class A Net Asset Value, offering and redemption price per share ($67,917,511 ÷ 7,372,593 outstanding shares of beneficial interest, no par value, unlimited number of shares authorized) | | $ | 9.21 | |
* Represents collateral on securities loaned.
The accompanying notes are an integral part of the financial statements.
Statement of Operations
| for the year ended December 31, 2014 | |
| Investment Income | |
Income: Dividends (net of foreign taxes withheld of $80,391) | | $ | 1,063,944 | |
| Income distributions — Central Cash Management Fund | | | 1,398 | |
| Securities lending income, including income from Daily Assets Fund Institutional, net of borrower rebates | | | 28,739 | |
| Total income | | | 1,094,081 | |
Expenses: Management fee | | | 462,144 | |
| Administration fee | | | 71,099 | |
| Services to shareholders | | | 719 | |
| Custodian fee | | | 24,724 | |
| Professional fees | | | 70,031 | |
| Reports to shareholders | | | 20,796 | |
| Trustees' fees and expenses | | | 4,625 | |
| Other | | | 18,387 | |
| Total expenses | | | 672,525 | |
| Net investment income | | | 421,556 | |
| Realized and Unrealized Gain (Loss) | |
Net realized gain (loss) from: Investments | | | 3,346,500 | |
| Futures | | | (4,270 | ) |
| Foreign currency | | | (13,538 | ) |
| | | | 3,328,692 | |
Change in net unrealized appreciation (depreciation) on: Investments | | | (2,958,312 | ) |
| Foreign currency | | | (5,173 | ) |
| | | | (2,963,485 | ) |
| Net gain (loss) | | | 365,207 | |
| Net increase (decrease) in net assets resulting from operations | | $ | 786,763 | |
The accompanying notes are an integral part of the financial statements.
Statement of Changes in Net Assets | | | Years Ended December 31, | |
| Increase (Decrease) in Net Assets | | 2014 | | | 2013 | |
Operations: Net investment income | | $ | 421,556 | | | $ | 1,174,893 | |
| Net realized gain (loss) | | | 3,328,692 | | | | 17,352,793 | |
| Change in net unrealized appreciation (depreciation) | | | (2,963,485 | ) | | | (6,262,438 | ) |
| Net increase (decrease) in net assets resulting from operations | | | 786,763 | | | | 12,265,248 | |
Distributions to shareholders from: Net investment income: Class A | | | (1,256,998 | ) | | | (1,676,904 | ) |
Fund share transactions: Class A Proceeds from shares sold | | | 2,233,568 | | | | 3,395,869 | |
| Reinvestment of distributions | | | 1,256,998 | | | | 1,676,904 | |
| Payments for shares redeemed | | | (8,090,295 | ) | | | (9,660,444 | ) |
| Net increase (decrease) in net assets from Class A share transactions | | | (4,599,729 | ) | | | (4,587,671 | ) |
| Increase (decrease) in net assets | | | (5,069,964 | ) | | | 6,000,673 | |
| Net assets at beginning of period | | | 72,987,475 | | | | 66,986,802 | |
| Net assets at end of period (including undistributed net investment income of $345,800 and $1,217,770, respectively) | | $ | 67,917,511 | | | $ | 72,987,475 | |
| Other Information | |
Class A Shares outstanding at beginning of period | | | 7,869,570 | | | | 8,411,945 | |
| Shares sold | | | 240,333 | | | | 404,553 | |
| Shares issued to shareholders in reinvestment of distributions | | | 138,132 | | | | 202,770 | |
| Shares redeemed | | | (875,442 | ) | | | (1,149,698 | ) |
| Net increase (decrease) in Class A shares | | | (496,977 | ) | | | (542,375 | ) |
| Shares outstanding at end of period | | | 7,372,593 | | | | 7,869,570 | |
The accompanying notes are an integral part of the financial statements.
| | | Years Ended December 31, | |
| Class A | | | 2014 | | | 2013 | | | 2012 | | | 2011 | | | 2010 | |
| Selected Per Share Data | |
| Net asset value, beginning of period | | $ | 9.27 | | | $ | 7.96 | | | $ | 6.98 | | | $ | 8.08 | | | $ | 7.45 | |
Income (loss) from investment operations: Net investment incomea | | | .06 | | | | .14 | | | | .18 | | | | .19 | | | | .14 | |
| Net realized and unrealized gain (loss) | | | .04 | | | | 1.37 | | | | 1.01 | | | | (1.14 | ) | | | .66 | |
| Total from investment operations | | | .10 | | | | 1.51 | | | | 1.19 | | | | (.95 | ) | | | .80 | |
Less distributions from: Net investment income | | | (.16 | ) | | | (.20 | ) | | | (.21 | ) | | | (.15 | ) | | | (.17 | ) |
| Net asset value, end of period | | $ | 9.21 | | | $ | 9.27 | | | $ | 7.96 | | | $ | 6.98 | | | $ | 8.08 | |
| Total Return (%) | | | 1.14 | | | | 19.31 | b | | | 17.34 | | | | (12.07 | ) | | | 10.93 | |
| Ratios to Average Net Assets and Supplemental Data | |
| Net assets, end of period ($ millions) | | | 68 | | | | 73 | | | | 67 | | | | 65 | | | | 83 | |
| Ratio of expenses before expense reductions (%) | | | .95 | | | | 1.06 | | | | 1.02 | | | | 1.03 | | | | .99 | |
| Ratio of expenses after expense reductions (%) | | | .95 | | | | .99 | | | | 1.02 | | | | 1.03 | | | | .99 | |
| Ratio of net investment income (%) | | | .59 | | | | 1.69 | | | | 2.46 | | | | 2.44 | | | | 1.90 | |
| Portfolio turnover rate (%) | | | 78 | | | | 139 | | | | 18 | | | | 26 | | | | 14 | |
a Based on average shares outstanding during the period. b Total return would have been lower had certain expenses not been reimbursed. | |
Notes to Financial Statements
A. Organization and Significant Accounting Policies
Deutsche Global Equity VIP (formerly DWS Global Equity VIP) (the "Fund") is a diversified series of Deutsche Variable Series II (formerly DWS Variable Series II) (the "Trust"), which is registered under the Investment Company Act of 1940, as amended (the "1940 Act"), as an open-end management investment company organized as a Massachusetts business trust.
The Fund's financial statements are prepared in accordance with accounting principles generally accepted in the United States of America which require the use of management estimates. Actual results could differ from those estimates. The policies described below are followed consistently by the Fund in the preparation of its financial statements.
Security Valuation. Investments are stated at value determined as of the close of regular trading on the New York Stock Exchange on each day the exchange is open for trading.
Various inputs are used in determining the value of the Fund's investments. These inputs are summarized in three broad levels. Level 1 includes quoted prices in active markets for identical securities. Level 2 includes other significant observable inputs (including quoted prices for similar securities, interest rates, prepayment speeds and credit risk). Level 3 includes significant unobservable inputs (including the Fund's own assumptions in determining the fair value of investments). The level assigned to the securities valuations may not be an indication of the risk or liquidity associated with investing in those securities.
Equity securities are valued at the most recent sale price or official closing price reported on the exchange (U.S. or foreign) or over-the-counter market on which they trade. Securities for which no sales are reported are valued at the calculated mean between the most recent bid and asked quotations on the relevant market or, if a mean cannot be determined, at the most recent bid quotation. Equity securities are generally categorized as Level 1. For certain international equity securities, in order to adjust for events which may occur between the close of the foreign exchanges and the close of the New York Stock Exchange, a fair valuation model may be used. This fair valuation model takes into account comparisons to the valuation of American Depository Receipts (ADRs), futures contracts and certain indices and these securities are categorized as Level 2.
Futures contracts are generally valued at the settlement prices established each day on the exchange on which they are traded and are categorized as Level 1.
Investments in open-end investment companies are valued at their net asset value each business day and are categorized as Level 1.
Securities and other assets for which market quotations are not readily available or for which the above valuation procedures are deemed not to reflect fair value are valued in a manner that is intended to reflect their fair value as determined in accordance with procedures approved by the Board and are generally categorized as Level 3. In accordance with the Fund's valuation procedures, factors considered in determining value may include, but are not limited to, the type of the security; the size of the holding; the initial cost of the security; the existence of any contractual restrictions on the security's disposition; the price and extent of public trading in similar securities of the issuer or of comparable companies; quotations or evaluated prices from broker-dealers and/or pricing services; information obtained from the issuer, analysts, and/or the appropriate stock exchange (for exchange-traded securities); an analysis of the company's or issuer's financial statements; an evaluation of the forces that influence the issuer and the market(s) in which the security is purchased and sold; and with respect to debt securities, the maturity, coupon, creditworthiness, currency denomination and the movement of the market in which the security is normally traded. The value determined under these procedures may differ from published values for the same securities.
Disclosure about the classification of fair value measurements is included in a table following the Fund's Investment Portfolio.
Participatory Notes. The Fund invests in Participatory Notes (P-Notes). P-Notes are promissory notes designed to offer a return linked to the performance of a particular underlying equity security or market. P-Notes are issued by banks or broker-dealers and allow the Fund to gain exposure to local shares in foreign markets. Investments in P-Notes involve the same risks associated with a direct investment in the underlying foreign companies or foreign markets that they seek to replicate. Although each participation note is structured with a defined maturity date, early redemption may be possible. Risks associated with participation notes include the possible failure of a counterparty to perform in accordance with the terms of the agreement and potential delays or an inability to redeem before maturity under certain market conditions.
Securities Lending. Deutsche Bank AG, as lending agent, lends securities of the Fund to certain financial institutions under the terms of the Security Lending Agreement. The Fund retains the benefits of owning the securities it has loaned and continues to receive interest and dividends generated by the securities and to participate in any changes in their market value. The Fund requires the borrowers of the securities to maintain collateral with the Fund consisting of either cash or liquid, unencumbered assets having a value at least equal to the value of the securities loaned. When the collateral falls below specified amounts, the lending agent will use its best effort to obtain additional collateral on the next business day to meet required amounts under the security lending agreement. The Fund may invest the cash collateral into a joint trading account in an affiliated money market fund pursuant to Exemptive Orders issued by the SEC. The Fund receives compensation for lending its securities either in the form of fees or by earning interest on invested cash collateral net of borrower rebates and fees paid to a lending agent. Either the Fund or the borrower may terminate the loan. There may be risks of delay and costs in recovery of securities or even loss of rights in the collateral should the borrower of the securities fail financially. If the Fund is not able to recover securities lent, the Fund may sell the collateral and purchase a replacement investment in the market, incurring the risk that the value of the replacement security is greater than the value of the collateral. The Fund is also subject to all investment risks associated with the reinvestment of any cash collateral received, including, but not limited to, interest rate, credit and liquidity risk associated with such investments.
As of December 31, 2014, the Fund had securities on loan. The value of the related collateral exceeded the value of the securities loaned at period end.
Foreign Currency Translations. The books and records of the Fund are maintained in U.S. dollars. Investment securities and other assets and liabilities denominated in a foreign currency are translated into U.S. dollars at the prevailing exchange rates at period end. Purchases and sales of investment securities, income and expenses are translated into U.S. dollars at the prevailing exchange rates on the respective dates of the transactions.
Net realized and unrealized gains and losses on foreign currency transactions represent net gains and losses between trade and settlement dates on securities transactions, the acquisition and disposition of foreign currencies, and the difference between the amount of net investment income accrued and the U.S. dollar amount actually received. That portion of both realized and unrealized gains and losses on investments that results from fluctuations in foreign currency exchange rates is not separately disclosed but is included with net realized and unrealized gain/appreciation and loss/depreciation on investments.
Taxes. The Fund's policy is to comply with the requirements of the Internal Revenue Code, as amended, which are applicable to regulated investment companies, and to distribute all of its taxable income to its shareholders.
Additionally, the Fund may be subject to taxes imposed by the governments of countries in which it invests and are generally based on income and/or capital gains earned or repatriated. Estimated tax liabilities on certain foreign securities are recorded on an accrual basis and are reflected as components of interest income or net change in unrealized gain/loss on investments. Tax liabilities realized as a result of security sales are reflected as a component of net realized gain/loss on investments.
Under the Regulated Investment Company Modernization Act of 2010, net capital losses incurred post-enactment may be carried forward indefinitely, and their character is retained as short-term and/or long-term. Previously, net capital losses were carried forward for eight years and treated as short-term losses. As a transition rule, the Act requires that post-enactment net capital losses be used before pre-enactment net capital losses.
At December 31, 2014, the Fund had a net tax basis capital loss carryforward of approximately $44,062,000 of pre-enactment losses, which may be applied against any realized net taxable capital gains of each succeeding year until fully utilized or until December 31, 2016 ($4,898,000) and December 31, 2017 ($39,164,000), the respective expiration dates, whichever occurs first.
In addition, from November 1, 2014 through December 31, 2014, the Fund elected to defer qualified late year losses of approximately $98,000 of net short-term capital losses and treat them as arising in the fiscal year ending December 31, 2015.
The Fund has reviewed the tax positions for the open tax years as of December 31, 2014 and has determined that no provision for income tax and/or uncertain tax provisions is required in the Fund's financial statements. The Fund's federal tax returns for the prior three fiscal years remain open subject to examination by the Internal Revenue Service.
Distribution of Income and Gains. Distributions from net investment income of the Fund, if any, are declared and distributed to shareholders annually. Net realized gains from investment transactions, in excess of available capital loss carryforwards, would be taxable to the Fund if not distributed and, therefore, will be distributed to shareholders at least annually. The Fund may also make additional distributions for tax purposes if necessary.
The timing and characterization of certain income and capital gain distributions are determined annually in accordance with federal tax regulations which may differ from accounting principles generally accepted in the United States of America. These differences primarily relate to investments in foreign denominated investments, investments in futures contracts, income received from passive foreign investment companies and certain securities sold at a loss. As a result, net investment income (loss) and net realized gain (loss) on investment transactions for a reporting period may differ significantly from distributions during such period. Accordingly, the Fund may periodically make reclassifications among certain of its capital accounts without impacting the net asset value of the Fund.
At December 31, 2014, the Fund's components of distributable earnings on a tax basis were as follows:
| Undistributed ordinary income* | | $ | 345,800 | |
| Capital loss carryforwards | | $ | (44,062,000 | ) |
| Unrealized appreciation (depreciation) on investments | | $ | 6,155,997 | |
In addition, the tax character of distributions paid by the Fund is summarized as follows:
| | | Years Ended December 31, | |
| | | 2014 | | | 2013 | |
| Distributions from ordinary income* | | $ | 1,256,998 | | | $ | 1,676,904 | |
* For tax purposes, short-term capital gain distributions are considered ordinary income distributions.
Expenses. Expenses of the Trust arising in connection with a specific fund are allocated to that fund. Other Trust expenses which cannot be directly attributed to a fund are apportioned among the funds in the Trust based upon the relative net assets or other appropriate measures.
Contingencies. In the normal course of business, the Fund may enter into contracts with service providers that contain general indemnification clauses. The Fund's maximum exposure under these arrangements is unknown as this would involve future claims that may be made against the Fund that have not yet been made. However, based on experience, the Fund expects the risk of loss to be remote.
Other. Investment transactions are accounted for on a trade date plus one basis for daily net asset value calculations. However, for financial reporting purposes, investment transactions are reported on trade date. Interest income is recorded on the accrual basis. Dividend income is recorded on the ex-dividend date net of foreign withholding taxes. Certain dividends from foreign securities may be recorded subsequent to the ex-dividend date as soon as the Fund is informed of such dividends. Realized gains and losses from investment transactions are recorded on an identified cost basis. Proceeds from litigation payments, if any, are included in net realized gain (loss) from investments.
B. Derivative Instruments
Futures Contracts. A futures contract is an agreement between a buyer or seller and an established futures exchange or its clearinghouse in which the buyer or seller agrees to take or make a delivery of a specific amount of a financial instrument at a specified price on a specific date (settlement date). For the year ended December 31, 2014, the Fund entered into futures contracts as a means of gaining exposure to a particular asset class or to keep cash on hand to meet shareholder redemptions or other needs while maintaining exposure to the market.
Upon entering into a futures contract, the Fund is required to deposit with a financial intermediary cash or securities ("initial margin") in an amount equal to a certain percentage of the face value indicated in the futures contract. Subsequent payments ("variation margin") are made or received by the Fund dependent upon the daily fluctuations in the value and are recorded for financial reporting purposes as unrealized gains or losses by the Fund. Gains or losses are realized when the contract expires or is closed. Since all futures contracts are exchange-traded, counterparty risk is minimized as the exchange's clearinghouse acts as the counterparty, and guarantees the futures against default.
Certain risks may arise upon entering into futures contracts, including the risk that an illiquid market will limit the Fund's ability to close out a futures contract prior to the settlement date and the risk that the futures contract is not well correlated with the security, index or currency to which it relates. Risk of loss may exceed amounts disclosed in the Statement of Assets and Liabilities.
There are no open futures contracts as of December 31, 2014. For the year ended December 31, 2014, the investment in futures contracts purchased had a total notional value from $0 to approximately $2,239,000.
The amount of unrealized and realized gains and losses on derivative instruments recognized in Fund earnings during the year ended December 31, 2014 and the related location in the accompanying Statement of Operations is summarized in the following tables by primary underlying risk exposure:
| Realized Gain (Loss) | | Futures Contracts | |
| Equity Contracts (a) | | $ | (4,270 | ) |
The above derivative is located in the following Statement of Operations account: (a) Net realized gain (loss) from futures | |
C. Purchases and Sales of Securities
During the year ended December 31, 2014, purchases and sales of investment transactions (excluding short-term investments) aggregated $53,505,514 and $58,665,744, respectively.
D. Related Parties
Management Agreement. Under the Investment Management Agreement with Deutsche Investment Management Americas Inc. ("DIMA" or the "Advisor"), an indirect, wholly owned subsidiary of Deutsche Bank AG, the Advisor directs the investments of the Fund in accordance with its investment objectives, policies and restrictions. The Advisor determines the securities, instruments and other contracts relating to investments to be purchased, sold or entered into by the Fund.
Pursuant to the Investment Management Agreement with the Advisor, the Fund pays a monthly management fee based on the Fund's average daily net assets, computed and accrued daily and payable monthly, at the following annual rates:
| First $1.5 billion | | | .650 | % |
| Next $1.75 billion | | | .635 | % |
| Next $1.75 billion | | | .620 | % |
| Over $5 billion | | | .605 | % |
Accordingly, for the year ended December 31, 2014, the fee pursuant to the Investment Management Agreement was equivalent to an annual rate (exclusive of any applicable waivers/reimbursements) of 0.65% of the Fund's average daily net assets.
For the period from January 1, 2014 through September 30, 2014, the Advisor had contractually agreed to waive its fee and/or reimburse certain operating expenses to the extent necessary to maintain the total annual operating expenses (excluding certain expenses such as extraordinary expenses, taxes, brokerage and interest expense) of Class A shares at 1.00%.
Effective October 1, 2014 through September 30, 2015, the Advisor has contractually agreed to waive its fees and/or reimburse certain operating expenses to the extent necessary to maintain the total annual operating expenses (excluding certain expenses such as extraordinary expenses, taxes, brokerage and interest expense) of Class A shares at 0.91%.
Administration Fee. Pursuant to an Administrative Services Agreement, DIMA provides most administrative services to the Fund. For all services provided under the Administrative Services Agreement, the Fund pays DIMA an annual fee ("Administration Fee") of 0.10% of the Fund's average daily net assets, computed and accrued daily and payable monthly. For the year ended December 31, 2014, the Administration Fee was $71,099, of which $5,806 is unpaid.
Service Provider Fees. DeAWM Service Company ("DSC"), an affiliate of the Advisor, is the transfer agent, dividend-paying agent and shareholder service agent for the Fund. Pursuant to a sub-transfer agency agreement between DSC and DST Systems, Inc. ("DST"), DSC has delegated certain transfer agent, dividend-paying agent and shareholder service agent functions to DST. DSC compensates DST out of the shareholder servicing fee it receives from the Fund. For the year ended December 31, 2014, the amounts charged to the Fund by DSC aggregated $111, of which $19 is unpaid.
Typesetting and Filing Service Fees. Under an agreement with DIMA, DIMA is compensated for providing typesetting and certain regulatory filing services to the Fund. For the year ended December 31, 2014, the amount charged to the Fund by DIMA included in the Statement of Operations under "Reports to shareholders" aggregated $9,435, of which $4,525 is unpaid.
Trustees' Fees and Expenses. The Fund paid retainer fees to each Trustee not affiliated with the Advisor, plus specified amounts to the Board Chairperson and Vice Chairperson and to each committee Chairperson.
Affiliated Cash Management Vehicles. The Fund may invest uninvested cash balances in Central Cash Management Fund and Deutsche Variable NAV Money Fund, affiliated money market funds which are managed by the Advisor. Each affiliated money market fund seeks to provide a high level of current income consistent with liquidity and the preservation of capital. Each affiliated money market fund is managed in accordance with Rule 2a-7 under the Investment Company Act of 1940, which governs the quality, maturity, diversity and liquidity of instruments in which a money market fund may invest. Central Cash Management Fund seeks to maintain a stable net asset value, and Deutsche Variable NAV Money Fund maintains a floating net asset value. The Fund indirectly bears its proportionate share of the expenses of each affiliated money market fund in which it invests. Central Cash Management Fund does not pay the Advisor an investment management fee. To the extent that Deutsche Variable NAV Money Fund pays an investment management fee to the Advisor, the Advisor will waive an amount of the investment management fee payable to the Advisor by the Fund equal to the amount of the investment management fee payable on the Fund's assets invested in Deutsche Variable NAV Money Fund.
Securities Lending Fees. Deutsche Bank AG serves as lending agent for the Fund. For the year ended December 31, 2014, the Fund incurred lending agent fees to Deutsche Bank AG in the amount of $2,501.
E. Ownership of the Fund
At December 31, 2014, two participating insurance companies were owners of record of 10% or more of the total outstanding Class A shares of the Fund, each owning 76% and 23%.
F. Line of Credit
The Fund and other affiliated funds (the "Participants") share in a $400 million revolving credit facility provided by a syndication of banks. The Fund may borrow for temporary or emergency purposes, including the meeting of redemption requests that otherwise might require the untimely disposition of securities. The Participants are charged an annual commitment fee which is allocated based on net assets, among each of the Participants. Interest is calculated at a rate per annum equal to the sum of the Federal Funds Rate plus 1.25 percent plus if LIBOR exceeds the Federal Funds Rate the amount of such excess. The Fund may borrow up to a maximum of 33 percent of its net assets under the agreement. The Fund had no outstanding loans at December 31, 2014.
Report of Independent Registered Public Accounting Firm
To the Board of Trustees of Deutsche Variable Series II and Shareholders of Deutsche Global Equity VIP:
We have audited the accompanying statement of assets and liabilities, including the investment portfolio, of Deutsche Global Equity VIP (formerly DWS Global Equity VIP) (the "Fund") (one of the series constituting Deutsche Variable Series II (formerly DWS Variable Series II)), as of December 31, 2014, and the related statement of operations for the year then ended, the statements of changes in net assets for each of the two years in the period then ended, and the financial highlights for each of the periods indicated therein. These financial statements and financial highlights are the responsibility of the Fund’s management. Our responsibility is to express an opinion on these financial statements and financial highlights based on our audits.
We conducted our audits in accordance with the standards of the Public Company Accounting Oversight Board (United States). Those standards require that we plan and perform the audit to obtain reasonable assurance about whether the financial statements and financial highlights are free of material misstatement. We were not engaged to perform an audit of the Fund’s internal control over financial reporting. Our audits included consideration of internal control over financial reporting as a basis for designing audit procedures that are appropriate in the circumstances, but not for the purpose of expressing an opinion on the effectiveness of the Fund’s internal control over financial reporting. Accordingly, we express no such opinion. An audit also includes examining, on a test basis, evidence supporting the amounts and disclosures in the financial statements and financial highlights, assessing the accounting principles used and significant estimates made by management, and evaluating the overall financial statement presentation. Our procedures included confirmation of securities owned as of December 31, 2014, by correspondence with the custodian and brokers. We believe that our audits provide a reasonable basis for our opinion.
In our opinion, the financial statements and financial highlights referred to above present fairly, in all material respects, the financial position of Deutsche Global Equity VIP at December 31, 2014, the results of its operations for the year then ended, the changes in its net assets for each of the two years in the period then ended, and the financial highlights for each of the periods indicated therein, in conformity with U.S. generally accepted accounting principles.
| | | |
Boston, Massachusetts February 13, 2015 | | |
Information About Your Fund's Expenses (Unaudited)
As an investor of the Fund, you incur two types of costs: ongoing expenses and transaction costs. Ongoing expenses include management fees and other Fund expenses. Examples of transaction costs include contract charges, which are not shown in this section. The following tables are intended to help you understand your ongoing expenses (in dollars) of investing in the Fund and to help you compare these expenses with the ongoing expenses of investing in other mutual funds. The example in the table is based on an investment of $1,000 invested at the beginning of the six-month period and held for the entire period (July 1, 2014 to December 31, 2014).
The tables illustrate your Fund's expenses in two ways:
—Actual Fund Return. This helps you estimate the actual dollar amount of ongoing expenses (but not transaction costs) paid on a $1,000 investment in the Fund using the Fund's actual return during the period. To estimate the expenses you paid over the period, simply divide your account value by $1,000 (for example, an $8,600 account value divided by $1,000 = 8.6), then multiply the result by the number in the "Expenses Paid per $1,000" line under the share class you hold.
—Hypothetical 5% Fund Return. This helps you to compare your Fund's ongoing expenses (but not transaction costs) with those of other mutual funds using the Fund's actual expense ratio and a hypothetical rate of return of 5% per year before expenses. Examples using a 5% hypothetical Fund return may be found in the shareholder reports of other mutual funds. The hypothetical account values and expenses may not be used to estimate the actual ending account balance or expenses you paid for the period.
Please note that the expenses shown in these tables are meant to highlight your ongoing expenses only and do not reflect any transaction costs. The "Expenses Paid per $1,000" line of the tables is useful in comparing ongoing expenses only and will not help you determine the relative total expense of owning different funds. If these transaction costs had been included, your costs would have been higher.
Expenses and Value of a $1,000 Investment for the six months ended December 31, 2014 | |
| Actual Fund Return | | Class A | |
| Beginning Account Value 7/1/14 | | $ | 1,000.00 | |
| Ending Account Value 12/31/14 | | $ | 970.50 | |
| Expenses Paid per $1,000* | | $ | 4.42 | |
| Hypothetical 5% Fund Return | | Class A | |
| Beginning Account Value 7/1/14 | | $ | 1,000.00 | |
| Ending Account Value 12/31/14 | | $ | 1,020.72 | |
| Expenses Paid per $1,000* | | $ | 4.53 | |
* Expenses are equal to the Fund's annualized expense ratio, multiplied by the average account value over the period, multiplied by 184 (the number of days in the most recent six-month period), then divided by 365.
| Annualized Expense Ratio | Class A | |
| Deutsche Variable Series II — Deutsche Global Equity VIP | .89% | |
For more information, please refer to the Fund's prospectus.
These tables do not reflect charges and fees ("contract charges") associated with the separate account that invests in the Fund or any variable life insurance policy or variable annuity contract for which the Fund is an investment option.
For an analysis of the fees associated with an investment in the fund or similar funds, please refer to the current and hypothetical expense calculators for Variable Insurance Products which can be found at deutschefunds.com/EN/resources/calculators.jsp.
Tax Information (Unaudited)
For corporate shareholders, 10% of the ordinary dividends (i.e., income dividends plus short-term capital gains) paid during the Fund's fiscal year ended December 31, 2014, qualified for the dividends received deduction.
Please consult a tax advisor if you have questions about federal or state income tax laws, or on how to prepare your tax returns. If you have specific questions about your account, please contact your insurance provider.
The Trust's policies and procedures for voting proxies for portfolio securities and information about how the Trust voted proxies related to its portfolio securities during the 12-month period ended June 30 are available on our Web site — deutschefunds.com (click on "proxy voting" at the bottom of the page) — or on the SEC's Web site — sec.gov. To obtain a written copy of the Trust's policies and procedures without charge, upon request, call us toll free at (800) 728-3337.
Advisory Agreement Board Considerations and Fee Evaluation
The Board of Trustees approved the renewal of Deutsche Global Equity VIP’s investment management agreement (the "Agreement") with Deutsche Investment Management Americas Inc. ("DIMA") in September 2014.
In terms of the process that the Board followed prior to approving the Agreement, shareholders should know that:
— In September 2014, all of the Fund’s Trustees were independent of DIMA and its affiliates.
— The Trustees met frequently during the past year to discuss fund matters and dedicated a substantial amount of time to contract review matters. Over the course of several months, the Board’s Contract Committee, in coordination with the Board’s Equity Oversight Committee, reviewed comprehensive materials received from DIMA, independent third parties and independent counsel. These materials included an analysis of the Fund’s performance, fees and expenses, and profitability compiled by a fee consultant retained by the Fund’s Independent Trustees (the "Fee Consultant"). The Board also received extensive information throughout the year regarding performance of the Fund.
— The Independent Trustees regularly meet privately with counsel to discuss contract review and other matters. In addition, the Independent Trustees were advised by the Fee Consultant in the course of their review of the Fund’s contractual arrangements and considered a comprehensive report prepared by the Fee Consultant in connection with their deliberations.
— In connection with reviewing the Agreement, the Board also reviewed the terms of the Fund’s distribution agreement, administrative services agreement, transfer agency agreement and other material service agreements.
— Based on its evaluation of the information provided, the Contract Committee presented its findings and recommendations to the Board. The Board then reviewed the Contract Committee’s findings and recommendations.
In connection with the contract review process, the Contract Committee and the Board considered the factors discussed below, among others. The Board also considered that DIMA and its predecessors have managed the Fund since its inception, and the Board believes that a long-term relationship with a capable, conscientious advisor is in the best interests of the Fund. The Board considered, generally, that shareholders chose to invest or remain invested in the Fund knowing that DIMA managed the Fund, and that the Agreement was approved by the Fund’s shareholders. DIMA is part of Deutsche Bank AG ("DB"), a major global banking institution that is engaged in a wide range of financial services. The Board believes that there are advantages to being part of a global asset management business that offers a wide range of investing expertise and resources, including hundreds of portfolio managers and analysts with research capabilities in many countries throughout the world.
As part of the contract review process, the Board carefully considered the fees and expenses of each Deutsche fund overseen by the Board in light of the fund’s performance. In many cases, this led to the negotiation and implementation of expense caps. As part of these negotiations, the Board indicated that it would consider relaxing these caps in future years following sustained improvements in performance, among other considerations.
In 2012, DB combined its Asset Management (of which DIMA was a part) and Wealth Management divisions into a new Asset and Wealth Management ("AWM") division. DB has advised the Independent Trustees that the U.S. asset management business is a critical and integral part of DB, and that DB will continue to invest in AWM a significant portion of the savings it has realized by combining its Asset and Wealth Management divisions, including ongoing enhancements to AWM’s investment capabilities. DB also has confirmed its commitment to maintaining strong legal and compliance groups within the AWM division.
While shareholders may focus primarily on fund performance and fees, the Fund’s Board considers these and many other factors, including the quality and integrity of DIMA’s personnel and such other issues as back-office operations, fund valuations, and compliance policies and procedures.
Nature, Quality and Extent of Services. The Board considered the terms of the Agreement, including the scope of advisory services provided under the Agreement. The Board noted that, under the Agreement, DIMA provides portfolio management services to the Fund and that, pursuant to a separate administrative services agreement, DIMA provides administrative services to the Fund. The Board considered the experience and skills of senior management and investment personnel, the resources made available to such personnel, the ability of DIMA to attract and retain high-quality personnel, and the organizational depth and stability of DIMA. The Board reviewed the Fund’s performance over short-term and long-term periods and compared those returns to various agreed-upon performance measures, including market index(es) and a peer universe compiled by the Fee Consultant using information supplied by Morningstar Direct ("Morningstar"), an independent fund data service. The Board also noted that it has put into place a process of identifying "Focus Funds" (e.g., funds performing poorly relative to a peer universe), and receives more frequent reporting and information from DIMA regarding such funds, along with DIMA’s plans to address underperformance. The Board believes this process is an effective manner of identifying and addressing underperforming funds. Based on the information provided, the Board noted that for the one-, three- and five-year periods ended December 31, 2013, the Fund’s performance (Class A shares) was in the 3rd quartile of the applicable Morningstar universe (the 1st quartile being the best performers and the 4th quartile being the worst performers). The Board also observed that the Fund has underperformed its benchmark in the one-, three- and five-year periods ended December 31, 2013.
Fees and Expenses. The Board considered the Fund’s investment management fee schedule, operating expenses and total expense ratios, and comparative information provided by Lipper Inc. ("Lipper") and the Fee Consultant regarding investment management fee rates paid to other investment advisors by similar funds (1st quartile being the most favorable and 4th quartile being the least favorable). With respect to management fees paid to other investment advisors by similar funds, the Board noted that the contractual fee rates paid by the Fund, which include a 0.10% fee paid to DIMA under the Fund’s administrative services agreement, were higher than the median (3rd quartile) of the applicable Lipper peer group (based on Lipper data provided as of December 31, 2013). The Board noted that the Fund’s Class A shares total (net) operating expenses were expected to be higher than the median (3rd quartile) of the applicable Lipper expense universe (based on Lipper data provided as of December 31, 2013, and analyzing Lipper expense universe Class A (net) expenses less any applicable 12b-1 fees) ("Lipper Universe Expenses"). The Board also considered how the Fund’s total (net) operating expenses compared to the total (net) operating expenses of a more customized peer group selected by Lipper (based on such factors as asset size). The Board noted that the expense limitation agreed to by DIMA helped to ensure that the Fund’s total (net) operating expenses would remain competitive. The Board considered the Fund’s management fee rate as compared to fees charged by DIMA to comparable funds and considered differences between the Fund and the comparable funds. The information requested by the Board as part of its review of fees and expenses also included information about institutional accounts and funds offered primarily to European investors ("Deutsche Europe funds") managed by DIMA and its affiliates. The Board noted that DIMA indicated that it does not manage any institutional accounts or Deutsche Europe funds comparable to the Fund.
On the basis of the information provided, the Board concluded that management fees were reasonable and appropriate in light of the nature, quality and extent of services provided by DIMA.
Profitability. The Board reviewed detailed information regarding revenues received by DIMA under the Agreement. The Board considered the estimated costs and pre-tax profits realized by DIMA from advising the Deutsche U.S. mutual funds ("Deutsche Funds"), as well as estimates of the pre-tax profits attributable to managing the Fund in particular. The Board also received information regarding the estimated enterprise-wide profitability of DIMA and its affiliates with respect to all fund services in totality and by fund. The Board and the Fee Consultant reviewed DIMA’s methodology in allocating its costs to the management of the Fund. Based on the information provided, the Board concluded that the pre-tax profits realized by DIMA in connection with the management of the Fund were not unreasonable.
Economies of Scale. The Board considered whether there are economies of scale with respect to the management of the Fund and whether the Fund benefits from any economies of scale. The Board noted that the Fund’s management fee schedule includes fee breakpoints. The Board concluded that the Fund’s fee schedule represents an appropriate sharing between the Fund and DIMA of such economies of scale as may exist in the management of the Fund at current asset levels.
Other Benefits to DIMA and Its Affiliates. The Board also considered the character and amount of other incidental benefits received by DIMA and its affiliates, including any fees received by DIMA for administrative services provided to the Fund and any fees received by an affiliate of DIMA for distribution services. The Board also considered benefits to DIMA related to brokerage and soft-dollar allocations, including allocating brokerage to pay for research generated by parties other than the executing broker dealers, which pertain primarily to funds investing in equity securities, along with the incidental public relations benefits to DIMA related to Deutsche Funds advertising and cross-selling opportunities among DIMA products and services. The Board concluded that management fees were reasonable in light of these fallout benefits.
Compliance. The Board considered the significant attention and resources dedicated by DIMA to documenting and enhancing its compliance processes in recent years. The Board noted in particular (i) the experience and seniority of DIMA’s and the Fund’s chief compliance officer; (ii) the large number of DIMA compliance personnel; and (iii) the substantial commitment of resources by DIMA and its affiliates to compliance matters.
Based on all of the information considered and the conclusions reached, the Board unanimously determined that the continuation of the Agreement is in the best interests of the Fund. In making this determination, the Board did not give particular weight to any single factor identified above. The Board considered these factors over the course of numerous meetings, certain of which were in executive session with only the Independent Trustees and counsel present. It is possible that individual Trustees may have weighed these factors differently in reaching their individual decisions to approve the continuation of the Agreement.
Board Members and Officers
The following table presents certain information regarding the Board Members and Officers of the fund. Each Board Member's year of birth is set forth in parentheses after his or her name. Unless otherwise noted, (i) each Board Member has engaged in the principal occupation(s) noted in the table for at least the most recent five years, although not necessarily in the same capacity; and (ii) the address of each Independent Board Member is c/o Kenneth C. Froewiss, Chairman, Deutsche Mutual Funds, P.O. Box 390601, Cambridge, MA 02139. Except as otherwise noted below, the term of office for each Board Member is until the election and qualification of a successor, or until such Board Member sooner dies, resigns, is removed or as otherwise provided in the governing documents of the fund. Because the fund does not hold an annual meeting of shareholders, each Board Member will hold office for an indeterminate period. The Board Members may also serve in similar capacities with other funds in the fund complex.
| Independent Board Members |
Name, Year of Birth, Position with the Fund and Length of Time Served1 | | Business Experience and Directorships During the Past Five Years | Number of Funds in Deutsche Fund Complex Overseen | Other Directorships Held by Board Member |
Kenneth C. Froewiss (1945) Chairperson since 2013, and Board Member since 2001 | | Adjunct Professor of Finance, NYU Stern School of Business (September 2009–present; Clinical Professor from 1997–September 2009); Member, Finance Committee, Association for Asian Studies (2002–present); Director, Mitsui Sumitomo Insurance Group (US) (2004–present); prior thereto, Managing Director, J.P. Morgan (investment banking firm) (until 1996) | 105 | — |
William McClayton (1944) Vice Chairperson since 2013, and Board Member since 2004 | | Private equity investor (since October 2009); previously, Managing Director, Diamond Management & Technology Consultants, Inc. (global consulting firm) (2001–2009); Directorship: Board of Managers, YMCA of Metropolitan Chicago; formerly: Senior Partner, Arthur Andersen LLP (accounting) (1966–2001); Trustee, Ravinia Festival | 105 | — |
John W. Ballantine (1946) Board Member since 1999 | | Retired; formerly, Executive Vice President and Chief Risk Management Officer, First Chicago NBD Corporation/The First National Bank of Chicago (1996–1998); Executive Vice President and Head of International Banking (1995–1996); former Directorships: Director and former Chairman of the Board, Healthways, Inc.2 (provider of disease and care management services) (2003–2014); Stockwell Capital Investments PLC (private equity); First Oak Brook Bancshares, Inc. and Oak Brook Bank; Prisma Energy International | 105 | Portland General Electric2 (utility company) (2003– present) |
Henry P. Becton, Jr. (1943) Board Member since 1990 | | Vice Chair and former President, WGBH Educational Foundation. Directorships: Public Radio International; Public Radio Exchange (PRX); North Bennett Street School (Boston); former Directorships: Belo Corporation2 (media company); The PBS Foundation; Association of Public Television Stations; Boston Museum of Science; American Public Television; Concord Academy; New England Aquarium; Mass. Corporation for Educational Telecommunications; Committee for Economic Development; Public Broadcasting Service; Connecticut College | 105 | Lead Director, Becton Dickinson and Company2 (medical technology company) |
Dawn-Marie Driscoll (1946) Board Member since 1987 | | Emeritus Executive Fellow, Center for Business Ethics, Bentley University; formerly: President, Driscoll Associates (consulting firm); Partner, Palmer & Dodge (law firm) (1988–1990); Vice President of Corporate Affairs and General Counsel, Filene's (retail) (1978–1988). Directorships: Director of ICI Mutual Insurance Company (since 2007); Advisory Board, Center for Business Ethics, Bentley University; Trustee and former Chairman of the Board, Southwest Florida Community Foundation (charitable organization); former Directorships: Sun Capital Advisers Trust (mutual funds) (2007–2012), Investment Company Institute (audit, executive, nominating committees) and Independent Directors Council (governance, executive committees) | 105 | — |
Keith R. Fox, CFA (1954) Board Member since 1996 | | Managing General Partner, Exeter Capital Partners (a series of private investment funds) (since 1986). Directorships: Progressive International Corporation (kitchen goods importer and distributor); The Kennel Shop (retailer); former Chairman, National Association of Small Business Investment Companies; former Directorships: BoxTop Media Inc. (advertising); Sun Capital Advisers Trust (mutual funds) (2011–2012) | 105 | — |
Paul K. Freeman (1950) Board Member since 1993 | | Consultant, World Bank/Inter-American Development Bank; Chair, Independent Directors Council; Investment Company Institute (executive and nominating committees); formerly, Chairman of Education Committee of Independent Directors Council; Project Leader, International Institute for Applied Systems Analysis (1998–2001); Chief Executive Officer, The Eric Group, Inc. (environmental insurance) (1986–1998); Directorships: Denver Zoo Foundation (December 2012–present); former Directorships: Prisma Energy International | 105 | — |
Richard J. Herring (1946) Board Member since 1990 | | Jacob Safra Professor of International Banking and Professor, Finance Department, The Wharton School, University of Pennsylvania (since July 1972); Co-Director, Wharton Financial Institutions Center; Co-Chair, U.S. Shadow Financial Regulatory Committee; Executive Director, Financial Economists Roundtable; formerly: Vice Dean and Director, Wharton Undergraduate Division (July 1995–June 2000); Director, Lauder Institute of International Management Studies (July 2000–June 2006) | 105 | Director, Aberdeen Singapore and Japan Funds (since 2007); Independent Director of Barclays Bank Delaware (since September 2010) |
Rebecca W. Rimel (1951) Board Member since 1995 | | President and Chief Executive Officer, The Pew Charitable Trusts (charitable organization) (1994 to present); formerly: Executive Vice President, The Glenmede Trust Company (investment trust and wealth management) (1983–2004); Board Member, Investor Education (charitable organization) (2004–2005); Trustee, Executive Committee, Philadelphia Chamber of Commerce (2001–2007); Director, Viasys Health Care2 (January 2007–June 2007); Trustee, Thomas Jefferson Foundation (charitable organization) (1994–2012) | 105 | Director, Becton Dickinson and Company2 (medical technology company) (2012– present); Director, BioTelemetry Inc.2 (health care) (2009– present) |
William N. Searcy, Jr. (1946) Board Member since 1993 | | Private investor since October 2003; formerly: Pension & Savings Trust Officer, Sprint Corporation2 (telecommunications) (November 1989–September 2003); Trustee, Sun Capital Advisers Trust (mutual funds) (1998–2012) | 105 | — |
Jean Gleason Stromberg (1943) Board Member since 1997 | | Retired. Formerly, Consultant (1997–2001); Director, Financial Markets U.S. Government Accountability Office (1996–1997); Partner, Norton Rose Fulbright, L.L.P. (law firm) (1978–1996). Directorships: The William and Flora Hewlett Foundation (charitable organization); former Directorships: Service Source, Inc. (nonprofit), Mutual Fund Directors Forum (2002–2004), American Bar Retirement Association (funding vehicle for retirement plans) (1987–1990 and 1994–1996) | 105 | — |
Robert H. Wadsworth* (1940) Board Member since 1999 | | President, Robert H. Wadsworth & Associates, Inc. (consulting firm) (1983 to present); Director, The Phoenix Boys Choir Association | 105 | — |
Officers4 |
Name, Year of Birth, Position with the Fund and Length of Time Served5 | | Business Experience and Directorships During the Past Five Years |
Brian E. Binder8 (1972) President and Chief Executive Officer, 2013–present | | Managing Director3 and Head of Fund Administration, Deutsche Asset & Wealth Management (2013–present); formerly: Head of Business Management and Consulting at Invesco, Ltd. (2010–2012); Chief Administrative Officer, Van Kampen Funds Inc. (2008–2010); and Chief Administrative Officer, Morgan Stanley Investment Management Americas Distribution (2003–2008) |
John Millette7 (1962) Vice President and Secretary, 1999–present | | Director,3 Deutsche Asset & Wealth Management |
Melinda Morrow6 (1970) Vice President, 2012–present | | Director,3 Deutsche Asset & Wealth Management |
Paul H. Schubert6 (1963) Chief Financial Officer, 2004–present Treasurer, 2005–present | | Managing Director,3 Deutsche Asset & Wealth Management (since July 2004); formerly: Executive Director, Head of Mutual Fund Services and Treasurer for UBS Family of Funds (1998–2004); Vice President and Director of Mutual Fund Finance at UBS Global Asset Management (1994–1998) |
Caroline Pearson7 (1962) Chief Legal Officer, 2010–present | | Managing Director,3 Deutsche Asset & Wealth Management; formerly: Assistant Secretary for DWS family of funds (1997–2010) |
Robert Kloby6 (1962) Chief Compliance Officer, 2006–present | | Managing Director,3 Deutsche Asset & Wealth Management |
Wayne Salit6 (1967) Anti-Money Laundering Compliance Officer, 2014–present | | Director,3 Deutsche Asset & Wealth Management; formerly: Managing Director, AML Compliance Officer at BNY Mellon (2011–2014); and Director, AML Compliance Officer at Deutsche Bank (2004–2011) |
Hepsen Uzcan7 (1974) Assistant Secretary, 2013–present | | Director,3 Deutsche Asset & Wealth Management |
Paul Antosca7 (1957) Assistant Treasurer, 2007–present | | Director,3 Deutsche Asset & Wealth Management |
Jack Clark7 (1967) Assistant Treasurer, 2007–present | | Director,3 Deutsche Asset & Wealth Management |
Diane Kenneally7 (1966) Assistant Treasurer, 2007–present | | Director,3 Deutsche Asset & Wealth Management |
1 The length of time served represents the year in which the Board Member joined the board of one or more Deutsche funds currently overseen by the Board.
2 A publicly held company with securities registered pursuant to Section 12 of the Securities Exchange Act of 1934.
3 Executive title, not a board directorship.
4 As a result of their respective positions held with the Advisor, these individuals are considered "interested persons" of the Advisor within the meaning of the 1940 Act. Interested persons receive no compensation from the fund.
5 The length of time served represents the year in which the officer was first elected in such capacity for one or more Deutsche funds.
6 Address: 60 Wall Street, New York, NY 10005.
7 Address: One Beacon Street, Boston, MA 02108.
8 Address: 222 South Riverside Plaza, Chicago, IL 60606.
* Robert H. Wadsworth retired from the Board effective December 31, 2014.
The fund's Statement of Additional Information ("SAI") includes additional information about the Board Members. The SAI is available, without charge, upon request. If you would like to request a copy of the SAI, you may do so by calling the following toll-free number: (800) 728-3337.
Notes
DeAWM Distributors, Inc.
222 South Riverside Plaza
Chicago, IL 60606
(800) 621-1148
VS2GE-2 (R-025828-4 2/15)
December 31, 2014
Annual Report
Deutsche Variable Series II
(formerly DWS Variable Series II)
Deutsche Global Growth VIP
(formerly DWS Global Growth VIP)
Contents
11 Statement of Assets and Liabilities 12 Statement of Operations 13 Statement of Changes in Net Assets 15 Notes to Financial Statements 21 Report of Independent Registered Public Accounting Firm 22 Information About Your Fund's Expenses 25 Advisory Agreement Board Considerations and Fee Evaluation 28 Board Members and Officers |
This report must be preceded or accompanied by a prospectus. To obtain an additional prospectus or summary prospectus, if available, call (800) 728-3337 or your financial representative. We advise you to consider the Fund's objectives, risks, charges and expenses carefully before investing. The summary prospectus and prospectus contain this and other important information about the Fund. Please read the prospectus carefully before you invest.
Investing in derivatives entails special risks relating to liquidity, leverage and credit that may reduce returns and/or increase volatility. Investing in foreign securities, particularly those of emerging markets, presents certain risks, such as currency fluctuations, political and economic changes, and market risks. The Fund may lend securities to approved institutions. Smaller company stocks tend to be more volatile than medium-sized or large company stocks. Stocks may decline in value. See the prospectus for details.
Deutsche Asset & Wealth Management represents the asset management and wealth management activities conducted by Deutsche Bank AG or any of its subsidiaries, including the Advisor and DeAWM Distributors, Inc.
NOT FDIC/NCUA INSURED NO BANK GUARANTEE MAY LOSE VALUE NOT A DEPOSIT
NOT INSURED BY ANY FEDERAL GOVERNMENT AGENCY
Performance Summary December 31, 2014 (Unaudited)
Fund performance shown is historical, assumes reinvestment of all dividend and capital gain distributions and does not guarantee future results. Investment return and principal value fluctuate with changing market conditions so that, when redeemed, shares may be worth more or less than their original cost. Current performance may be lower or higher than the performance data quoted. Please contact your participating insurance company for the Fund's most recent month-end performance. Performance doesn't reflect charges and fees ("contract charges") associated with the separate account that invests in the Fund or any variable life insurance policy or variable annuity contract for which the Fund is an investment option. These charges and fees will reduce returns. While all share classes have the same underlying portfolio, their performance will differ.
The gross expense ratios of the Fund, as stated in the fee table of the prospectus dated May 1, 2014 are 1.45% and 1.81% for Class A and Class B shares, respectively, and may differ from the expense ratios disclosed in the Financial Highlights tables in this report.
| Growth of an Assumed $10,000 Investment in Deutsche Global Growth VIP |
| The Morgan Stanley Capital International (MSCI) World Index is an unmanaged index that tracks the performance of stocks in select developed markets around the world, including the U.S. Index returns do not reflect any fees or expenses and it is not possible to invest directly into an index. |
| |
| Yearly periods ended December 31 | |
| Comparative Results | |
| Deutsche Global Growth VIP | | 1-Year | | | 3-Year | | | 5-Year | | | 10-Year | |
| Class A | Growth of $10,000 | | $ | 10,012 | | | $ | 14,494 | | | $ | 14,104 | | | $ | 18,025 | |
| Average annual total return | | | 0.21 | % | | | 13.17 | % | | | 7.12 | % | | | 6.07 | % |
| MSCI World Index | Growth of $10,000 | | $ | 10,494 | | | $ | 15,397 | | | $ | 16,255 | | | $ | 17,955 | |
| Average annual total return | | | 4.94 | % | | | 15.47 | % | | | 10.20 | % | | | 6.03 | % |
| Deutsche Global Growth VIP | | 1-Year | | | 3-Year | | | 5-Year | | | 10-Year | |
| Class B | Growth of $10,000 | | $ | 9,976 | | | $ | 14,336 | | | $ | 13,854 | | | $ | 17,387 | |
| Average annual total return | | | –0.15 | % | | | 12.76 | % | | | 6.74 | % | | | 5.69 | % |
| MSCI World Index | Growth of $10,000 | | $ | 10,494 | | | $ | 15,397 | | | $ | 16,255 | | | $ | 17,955 | |
| Average annual total return | | | 4.94 | % | | | 15.47 | % | | | 10.20 | % | | | 6.03 | % |
The growth of $10,000 is cumulative.
Management Summary December 31, 2014 (Unaudited)
The Fund’s Class A shares returned 0.21% during 2014, underperforming the 4.94% return of the MSCI World Index.1 The leading cause of the Fund’s shortfall was its overweight position in the international markets, which amplified the impact of both the foreign markets’ underperformance and the weakness in non-U.S. currencies relative to the dollar. On a sector basis, the Fund’s investments trailed the benchmark in the information technology, industrial and consumer discretionary sectors.2 The largest individual detractors in each group were AVEVA Group PLC, Colfax Corp. and Las Vegas Sands Corp., respectively.3
On the plus side, the Fund’s sector weightings played a positive role in its 12-month results. An underweight position in the energy sector, which lagged significantly, and an overweight position in health care, which outperformed the broader market by a wide margin, made positive contributions to performance.4 Among individual stocks, many of the leading contributors were companies that were acquired or bid for during the period, including Beam, Inc.,* Monster Beverage Corp., DIRECTV and Allergan, Inc.*
As of December 31, 2014, 47% of the portfolio was invested in the United States, and 53% was invested in the international markets. The Fund’s overweight in the international markets reflects the fact that we continued to find a higher representation of reasonably valued growth companies overseas. Within the international segment, we held an overweight position in emerging-markets stocks. We achieved this exposure through direct investments in emerging-markets companies and positions in developed-market companies with above-average exposure to the developing world. While this can have a negative impact on performance during periods of elevated investor risk aversion, we also believe the asset class is home to some of the most attractively valued growth companies in the global markets. On a sector basis, the Fund closed the year with overweight positions in the industrials, health care and consumer staples sectors, and it was underweight in financials, telecommunication services and energy.5
Although the Fund underperformed during the past 12 months, we believe in the long-term value of our strategy. We do not simply invest in the highest-growth companies without regard to their valuations or fundamentals. Instead, we take a balanced approach that seeks to diversify among companies in varying stages of their growth cycle. Further, we believe our ability to invest in companies of any size and from any region provides an extensive universe from which to select stocks with the optimal combination of growth potential and reasonable valuations.
Joseph Axtell, CFA
Lead Portfolio Manager
Rafaelina M. Lee
Nils E. Ernst, PhD
Martin Berberich, CFA
Sebastian P. Werner, PhD
Portfolio Managers
The views expressed reflect those of the portfolio management team only through the end of the period of the report as stated on the cover. The management team's views are subject to change at any time based on market and other conditions and should not be construed as a recommendation. Past performance is no guarantee of future results. Current and future portfolio holdings are subject to risk.
1 The MSCI World Index is an unmanaged index that tracks the performance of stocks in select developed markets around the world, including the United States Index returns do not reflect fees or expenses and it is not possible to invest directly into an index.
2 Consumer discretionary represents industries that produce goods and services that are not necessities in everyday life.
3 Contributors and detractors incorporate both a stock’s return and its weight. If two stocks have the same return but one has a larger weighting in the Fund, it will have a larger contribution to return in the period.
4 "Underweight" means the Fund holds a lower weighting in a given sector or security than the benchmark. "Overweight" means it holds a higher weighting.
5 Consumer staples are the industries that manufacture and sell products such as food and beverages, prescription drugs and household products.
* Not held in the portfolio as of December 31, 2014.
Portfolio Summary (Unaudited) Asset Allocation (As a % of Investment Portfolio excluding Securities Lending Collateral) | 12/31/14 | 12/31/13 |
| | | |
| Common Stocks | 95% | 96% |
| Cash Equivalents | 4% | 3% |
| Participatory Notes | 1% | 1% |
| | 100% | 100% |
Sector Diversification
(As a % of Investment Portfolio excluding Cash Equivalents and Securities Lending Collateral) | 12/31/14 | 12/31/13 |
| | | |
| Industrials | 20% | 20% |
| Health Care | 18% | 14% |
| Consumer Staples | 13% | 12% |
| Consumer Discretionary | 12% | 14% |
| Financials | 11% | 15% |
| Information Technology | 10% | 14% |
| Materials | 9% | 4% |
| Energy | 6% | 7% |
| Telecommunication Services | 1% | — |
| | 100% | 100% |
Geographical Diversification
(As a % of Investment Portfolio excluding Cash Equivalents and Securities Lending Collateral) | 12/31/14 | 12/31/13 |
| | | |
| United States | 47% | 45% |
| Europe | 29% | 30% |
| United Kingdom | 7% | 9% |
| Canada | 7% | 6% |
| Asia (excluding Japan) | 5% | 6% |
| Latin America | 2% | 1% |
| Japan | 2% | 2% |
| Africa | 1% | 1% |
| | 100% | 100% |
Portfolio holdings and characteristics are subject to change.
For more complete details about the Fund's investment portfolio, see page 7.
Following the Fund's fiscal first and third quarter-end, a complete portfolio holdings listing is filed with the SEC on Form N-Q. The form will be available on the SEC's Web site at sec.gov, and it also may be reviewed and copied at the SEC's Public Reference Room in Washington, D.C. Information on the operation of the SEC's Public Reference Room may be obtained by calling (800) SEC-0330. The Fund's portfolio holdings are also posted on deutschefunds.com from time to time. Please see the Fund's current prospectus for more information.
Investment Portfolio December 31, 2014 | | | Shares | | | Value ($) | |
| | | | |
| Common Stocks 95.1% | |
| Belgium 1.8% | |
| Anheuser-Busch InBev NV (Cost $714,968) | | | 7,600 | | | | 855,256 | |
| Bermuda 0.3% | |
| Lazard Ltd. "A" (Cost $57,740) | | | 2,418 | | | | 120,973 | |
| Brazil 0.7% | |
| Estacio Participacoes SA (Cost $395,451) | | | 38,000 | | | | 336,288 | |
| Canada 6.5% | |
| Agnico Eagle Mines Ltd. | | | 13,000 | | | | 323,570 | |
| Alimentation Couche-Tard, Inc. "B" | | | 17,000 | | | | 712,455 | |
| Brookfield Asset Management, Inc. "A" | | | 17,000 | | | | 851,902 | |
| Canadian Pacific Railway Ltd. | | | 3,700 | | | | 712,580 | |
| Goldcorp, Inc. | | | 10,000 | | | | 185,200 | |
| Quebecor, Inc. "B" | | | 5,134 | | | | 141,143 | |
| SunOpta, Inc.* | | | 11,038 | | | | 130,800 | |
| (Cost $2,557,522) | | | | 3,057,650 | |
| China 0.3% | |
| Minth Group Ltd. (Cost $102,218) | | | 58,373 | | | | 120,392 | |
| Cyprus 0.1% | |
| Prosafe SE (Cost $134,120) | | | 14,729 | | | | 45,064 | |
| Finland 1.0% | |
| Cramo Oyj | | | 3,923 | | | | 57,331 | |
| Stora Enso Oyj "R" | | | 47,000 | | | | 418,352 | |
| (Cost $480,754) | | | | 475,683 | |
| France 1.9% | |
| Airbus Group NV | | | 6,500 | | | | 322,837 | |
| Pernod Ricard SA | | | 5,000 | | | | 554,385 | |
| (Cost $1,013,993) | | | | 877,222 | |
| Germany 6.4% | |
| adidas AG | | | 6,100 | | | | 425,159 | |
| BASF SE | | | 4,700 | | | | 397,309 | |
| Bayer AG (Registered) | | | 1,800 | | | | 246,077 | |
| Fresenius Medical Care AG & Co. KGaA | | | 15,300 | | | | 1,145,065 | |
| LANXESS AG | | | 9,500 | | | | 441,971 | |
| Patrizia Immobilien AG | | | 5,535 | | | | 81,633 | |
| United Internet AG (Registered) | | | 4,055 | | | | 183,886 | |
| Vib Vermoegen AG | | | 4,543 | | | | 77,885 | |
| (Cost $2,939,609) | | | | 2,998,985 | |
| Hong Kong 1.6% | |
| K Wah International Holdings Ltd. | | | 205,757 | | | | 108,932 | |
| Michael Kors Holdings Ltd.* (b) | | | 4,000 | | | | 300,400 | |
| Playmates Toys Ltd. | | | 230,951 | | | | 48,930 | |
| REXLot Holdings Ltd. | | | 1,194,912 | | | | 94,941 | |
| Sun Hung Kai & Co., Ltd. | | | 101,067 | | | | 77,084 | |
| Techtronic Industries Co., Ltd. | | | 41,213 | | | | 132,075 | |
| (Cost $774,685) | | | | 762,362 | |
| Indonesia 0.4% | |
| PT Arwana Citramulia Tbk | | | 1,118,618 | | | | 78,013 | |
| PT Multipolar Tbk | | | 1,697,639 | | | | 113,658 | |
| (Cost $180,557) | | | | 191,671 | |
| | | Shares | | | Value ($) | |
| | | | | | | | | |
| Ireland 2.9% | |
| Greencore Group PLC | | | 16,069 | | | | 71,119 | |
| Kerry Group PLC "A" | | | 7,500 | | | | 517,471 | |
| Paddy Power PLC | | | 1,225 | | | | 101,970 | |
| Ryanair Holdings PLC (ADR)* (a) (c) | | | 2,097 | | | | 149,453 | |
| Shire PLC | | | 7,700 | | | | 544,800 | |
| (Cost $1,022,962) | | | | 1,384,813 | |
| Italy 1.4% | |
| Prysmian SpA | | | 4,827 | | | | 87,857 | |
| Sorin SpA* | | | 80,000 | | | | 186,416 | |
| Unipol Gruppo Finanziario SpA | | | 83,000 | | | | 409,900 | |
| (Cost $613,940) | | | | 684,173 | |
| Japan 1.7% | |
| Ai Holdings Corp. | | | 5,340 | | | | 94,283 | |
| Avex Group Holdings, Inc. | | | 6,079 | | | | 99,613 | |
| Kusuri No Aoki Co., Ltd. | | | 3,604 | | | | 195,957 | |
| MISUMI Group, Inc. | | | 2,280 | | | | 74,892 | |
| Nippon Seiki Co., Ltd. | | | 7,783 | | | | 175,507 | |
| United Arrows Ltd. | | | 2,070 | | | | 57,889 | |
| Universal Entertainment Corp. | | | 5,003 | | | | 74,648 | |
| UT Holdings Co., Ltd. | | | 10,269 | | | | 43,585 | |
| (Cost $772,613) | | | | 816,374 | |
| Luxembourg 1.1% | |
| Eurofins Scientific (Cost $494,226) | | | 2,100 | | | | 534,729 | |
| Malaysia 0.8% | |
| Hartalega Holdings Bhd. | | | 59,558 | | | | 119,262 | |
| IHH Healthcare Bhd. | | | 150,000 | | | | 206,415 | |
| Tune Ins Holdings Bhd. | | | 110,328 | | | | 53,188 | |
| (Cost $381,743) | | | | 378,865 | |
| Netherlands 2.5% | |
| Brunel International NV | | | 3,065 | | | | 50,231 | |
| Constellium NV "A"* (b) | | | 6,849 | | | | 112,529 | |
| ING Groep NV (CVA)* | | | 36,000 | | | | 466,114 | |
| SBM Offshore NV* | | | 6,282 | | | | 74,496 | |
| Sensata Technologies Holding NV* (a) (b) | | | 8,632 | | | | 452,403 | |
| (Cost $1,204,224) | | | | 1,155,773 | |
| Norway 1.4% | |
| DNO ASA* | | | 105,000 | | | | 223,448 | |
| Statoil ASA | | | 24,000 | | | | 420,586 | |
| (Cost $622,524) | | | | 644,034 | |
| Panama 1.4% | |
| Banco Latinoamericano de Comercio Exterior SA "E" | | | 4,357 | | | | 131,146 | |
| Copa Holdings SA "A" (a) | | | 5,300 | | | | 549,292 | |
| (Cost $707,404) | | | | 680,438 | |
| Philippines 1.0% | |
| Alliance Global Group, Inc. | | | 181,474 | | | | 90,575 | |
| Metropolitan Bank & Trust Co. | | | 200,000 | | | | 368,730 | |
| (Cost $501,330) | | | | 459,305 | |
| Singapore 0.2% | |
| Lian Beng Group Ltd. (Cost $105,481) | | | 252,856 | | | | 115,406 | |
| | | Shares | | | Value ($) | |
| | | | | | | | | |
| South Africa 0.9% | |
| MTN Group Ltd. (Cost $416,095) | | | 21,500 | | | | 408,001 | |
| Spain 0.8% | |
| Mediaset Espana Comunicacion SA* (Cost $358,005) | | | 31,000 | | | | 387,154 | |
| Sweden 3.2% | |
| Assa Abloy AB "B" | | | 7,500 | | | | 396,352 | |
| Atlas Copco AB "A" | | | 16,500 | | | | 459,312 | |
| Svenska Cellulosa AB "B" | | | 31,000 | | | | 669,477 | |
| (Cost $1,599,922) | | | | 1,525,141 | |
| Switzerland 2.9% | |
| Dufry AG (Registered)* | | | 645 | | | | 95,615 | |
| Nestle SA (Registered) | | | 11,000 | | | | 806,317 | |
| Novartis AG (Registered) | | | 2,700 | | | | 248,312 | |
| Swatch Group AG (Bearer) | | | 500 | | | | 222,019 | |
| (Cost $1,401,136) | | | | 1,372,263 | |
| Taiwan 0.1% | |
| Kinpo Electronics, Inc.* (Cost $58,427) | | | 145,443 | | | | 66,883 | |
| Thailand 0.1% | |
| Malee Sampran PCL (Foreign Registered) (Cost $82,517) | | | 47,499 | | | | 39,703 | |
| United Kingdom 6.8% | |
| Anglo American PLC | | | 26,500 | | | | 490,302 | |
| Arrow Global Group PLC | | | 25,631 | | | | 90,370 | |
| Aveva Group PLC | | | 10,500 | | | | 214,939 | |
| Babcock International Group PLC | | | 8,401 | | | | 137,448 | |
| British American Tobacco PLC | | | 5,800 | | | | 315,136 | |
| Clinigen Healthcare Ltd. | | | 7,944 | | | | 65,046 | |
| Crest Nicholson Holdings PLC | | | 16,154 | | | | 97,297 | |
| Domino's Pizza Group PLC | | | 6,860 | | | | 75,083 | |
| Halma PLC | | | 22,000 | | | | 234,535 | |
| Hargreaves Lansdown PLC | | | 5,352 | | | | 83,447 | |
| HellermannTyton Group PLC | | | 16,957 | | | | 82,910 | |
| Howden Joinery Group PLC | | | 15,644 | | | | 97,276 | |
| IG Group Holdings PLC | | | 8,745 | | | | 97,472 | |
| IMI PLC | | | 15,000 | | | | 293,643 | |
| Indivior PLC* | | | 5,000 | | | | 11,643 | |
| Jardine Lloyd Thompson Group PLC | | | 4,314 | | | | 59,844 | |
| John Wood Group PLC | | | 7,794 | | | | 71,684 | |
| Monitise PLC* | | | 60,576 | | | | 23,547 | |
| Polypipe Group PLC | | | 21,583 | | | | 82,710 | |
| Reckitt Benckiser Group PLC | | | 5,000 | | | | 403,357 | |
| Rotork PLC | | | 2,254 | | | | 81,111 | |
| Spirax-Sarco Engineering PLC | | | 2,181 | | | | 96,925 | |
| (Cost $3,646,803) | | | | 3,205,725 | |
| United States 44.9% | |
| Actavis PLC* (a) | | | 3,000 | | | | 772,230 | |
| Advance Auto Parts, Inc. | | | 880 | | | | 140,166 | |
| Affiliated Managers Group, Inc.* | | | 583 | | | | 123,736 | |
| Agilent Technologies, Inc. | | | 5,000 | | | | 204,700 | |
| Alliance Data Systems Corp.* | | | 1,900 | | | | 543,495 | |
| Altra Industrial Motion Corp. (a) | | | 1,695 | | | | 48,121 | |
| Amgen, Inc. | | | 3,300 | | | | 525,657 | |
| Amphenol Corp. "A" | | | 18,500 | | | | 995,485 | |
| BE Aerospace, Inc.* | | | 901 | | | | 52,276 | |
| Biogen Idec, Inc.* | | | 600 | | | | 203,670 | |
| | | Shares | | | Value ($) | |
| | | | | | | | | |
| BorgWarner, Inc. | | | 1,739 | | | | 95,558 | |
| Bristol-Myers Squibb Co. | | | 9,300 | | | | 548,979 | |
| Cardtronics, Inc.* (a) | | | 2,723 | | | | 105,053 | |
| Casey's General Stores, Inc. (a) | | | 1,299 | | | | 117,326 | |
| Cerner Corp.* | | | 7,000 | | | | 452,620 | |
| Colfax Corp.* (a) | | | 12,000 | | | | 618,840 | |
| Danaher Corp. | | | 6,000 | | | | 514,260 | |
| DigitalGlobe, Inc.* (a) | | | 2,120 | | | | 65,656 | |
| DIRECTV* | | | 8,000 | | | | 693,600 | |
| eBay, Inc.* | | | 10,000 | | | | 561,200 | |
| Ecolab, Inc. | | | 5,400 | | | | 564,408 | |
| Encore Capital Group, Inc.* | | | 2,640 | | | | 117,216 | |
| Express Scripts Holding Co.* | | | 11,500 | | | | 973,705 | |
| Exxon Mobil Corp. | | | 6,000 | | | | 554,700 | |
| Fox Factory Holding Corp.* (a) | | | 5,680 | | | | 92,186 | |
| Gentherm, Inc.* (a) | | | 2,536 | | | | 92,868 | |
| Hain Celestial Group, Inc.* | | | 1,892 | | | | 110,285 | |
| HeartWare International, Inc.* | | | 869 | | | | 63,811 | |
| Jack in the Box, Inc. | | | 1,486 | | | | 118,821 | |
| JPMorgan Chase & Co. | | | 12,500 | | | | 782,250 | |
| Kindred Healthcare, Inc. | | | 4,316 | | | | 78,465 | |
| KLX, Inc.* | | | 1 | | | | 21 | |
| Las Vegas Sands Corp. | | | 10,500 | | | | 610,680 | |
| Manitowoc Co., Inc. | | | 3,394 | | | | 75,007 | |
| MasTec, Inc.* | | | 15,000 | | | | 339,150 | |
| MasterCard, Inc. "A" | | | 10,300 | | | | 887,448 | |
| Middleby Corp.* | | | 1,500 | | | | 148,650 | |
| Molina Healthcare, Inc.* (a) | | | 2,427 | | | | 129,917 | |
| Monster Beverage Corp.* | | | 4,700 | | | | 509,245 | |
| Nielsen NV | | | 13,000 | | | | 581,490 | |
| Noble Energy, Inc. | | | 14,000 | | | | 664,020 | |
| Oaktree Capital Group LLC (a) | | | 2,483 | | | | 128,694 | |
| Oil States International, Inc.* | | | 1,255 | | | | 61,369 | |
| Omnicare, Inc. | | | 7,000 | | | | 510,510 | |
| Pacira Pharmaceuticals, Inc.* | | | 1,043 | | | | 92,472 | |
| Pall Corp. | | | 7,600 | | | | 769,196 | |
| Polaris Industries, Inc. (a) | | | 831 | | | | 125,680 | |
| Praxair, Inc. (a) | | | 7,000 | | | | 906,920 | |
| Primoris Services Corp. (a) | | | 3,105 | | | | 72,160 | |
| Providence Service Corp.* | | | 3,304 | | | | 120,398 | |
| PTC, Inc.* | | | 2,095 | | | | 76,782 | |
| Retrophin, Inc.* | | | 4,841 | | | | 59,254 | |
| Roadrunner Transportation Systems, Inc.* (a) | | | 3,788 | | | | 88,450 | |
| Schlumberger Ltd. | | | 5,900 | | | | 503,919 | |
| Sinclair Broadcast Group, Inc. "A" | | | 3,377 | | | | 92,395 | |
| Tenneco, Inc.* | | | 2,009 | | | | 113,729 | |
| The Travelers Companies, Inc. | | | 4,600 | | | | 486,910 | |
| Thoratec Corp.* | | | 3,362 | | | | 109,130 | |
| TiVo, Inc.* (a) | | | 5,160 | | | | 61,094 | |
| TriNet Group, Inc.* | | | 3,285 | | | | 102,755 | |
| Tristate Capital Holdings, Inc.* | | | 6,324 | | | | 64,758 | |
| United Rentals, Inc.* | | | 1,273 | | | | 129,859 | |
| United Technologies Corp. | | | 6,200 | | | | 713,000 | |
| Urban Outfitters, Inc.* (a) | | | 3,166 | | | | 111,222 | |
| VeriFone Systems, Inc.* | | | 3,473 | | | | 129,196 | |
| WABCO Holdings, Inc.* | | | 1,138 | | | | 119,240 | |
| Waddell & Reed Financial, Inc. "A" | | | 2,206 | | | | 109,903 | |
| Western Digital Corp. | | | 2,468 | | | | 273,208 | |
| Zeltiq Aesthetics, Inc.* | | | 4,426 | | | | 123,530 | |
| Zoe's Kitchen, Inc.* | | | 1,665 | | | | 49,800 | |
| (Cost $17,842,982) | | | | 21,182,504 | |
Total Common Stocks (Cost $41,183,951) | | | | 44,882,830 | |
| | | Shares | | | Value ($) | |
| | | | | | | | | |
| Participatory Note 0.3% | |
| Nigeria | |
| Zenith Bank PLC (issuer Merrill Lynch International), Expiration Date 8/21/2015 (Cost $195,000) | | | 1,500,000 | | | | 150,901 | |
| | |
| Securities Lending Collateral 9.2% | |
| Daily Assets Fund Institutional, 0.10% (d) (e) (Cost $4,347,994) | | | 4,347,994 | | | | 4,347,994 | |
| | | Shares | | | Value ($) | |
| | | | | | | | | |
| Cash Equivalents 4.4% | |
| Central Cash Management Fund, 0.06% (d) (Cost $2,059,101) | | | 2,059,101 | | | | 2,059,101 | |
| | | % of Net Assets | | | Value ($) | |
| | | | |
Total Investment Portfolio (Cost $47,786,046)† | | | 109.0 | | | | 51,440,826 | |
| Other Assets and Liabilities, Net | | | (9.0 | ) | | | (4,250,029 | ) |
| Net Assets | | | 100.0 | | | | 47,190,797 | |
* Non-income producing security.
† The cost for federal income tax purposes was $47,953,852. At December 31, 2014, net unrealized appreciation for all securities based on tax cost was $3,486,974. This consisted of aggregate gross unrealized appreciation for all securities in which there was an excess of value over tax cost of $6,126,568 and aggregate gross unrealized depreciation for all securities in which there was an excess of tax cost over value of $2,639,594.
(a) All or a portion of these securities were on loan. In addition, "Other Assets and Liabilities, Net" may include pending sales that are also on loan. The value of securities loaned at December 31, 2014 amounted to $4,241,229, which is 9.0% of net assets.
(b) Listed on the New York Stock Exchange.
(c) Listed on the NASDAQ Stock Market, Inc.
(d) Affiliated fund managed by Deutsche Investment Management Americas Inc. The rate shown is the annualized seven-day yield at period end.
(e) Represents collateral held in connection with securities lending. Income earned by the Fund is net of borrower rebates.
ADR: American Depositary Receipt
CVA: Certificaten Van Aandelen (Certificate of Stock)
At December 31, 2014, open futures contracts purchased were as follows:
| Futures | Currency | Expiration Date | | Contracts | | | Notional Value ($) | | | Unrealized (Depreciation) ($) | |
| Nikkei 225 Index | USD | 3/12/2015 | | | 10 | | | | 870,000 | | | | (17,264 | ) |
| Currency Abbreviation |
| USD United States Dollar |
For information on the Fund's policy and additional disclosures regarding futures contracts, please refer to the Derivatives section of Note B in the accompanying Notes to Financial Statements.
Fair Value Measurements
Various inputs are used in determining the value of the Fund's investments. These inputs are summarized in three broad levels. Level 1 includes quoted prices in active markets for identical securities. Level 2 includes other significant observable inputs (including quoted prices for similar securities, interest rates, prepayment speeds and credit risk). Level 3 includes significant unobservable inputs (including the Fund's own assumptions in determining the fair value of investments). The level assigned to the securities valuations may not be an indication of the risk or liquidity associated with investing in those securities.
The following is a summary of the inputs used as of December 31, 2014 in valuing the Fund's investments. For information on the Fund's policy regarding the valuation of investments, please refer to the Security Valuation section of Note A in the accompanying Notes to Financial Statements.
| Assets | | Level 1 | | | Level 2 | | | Level 3 | | | Total | |
| | |
| Common Stocks | |
| Belgium | | $ | — | | | $ | 855,256 | | | $ | — | | | $ | 855,256 | |
| Bermuda | | | 120,973 | | | | — | | | | — | | | | 120,973 | |
| Brazil | | | 336,288 | | | | — | | | | — | | | | 336,288 | |
| Canada | | | 3,057,650 | | | | — | | | | — | | | | 3,057,650 | |
| China | | | — | | | | 120,392 | | | | — | | | | 120,392 | |
| Cyprus | | | — | | | | 45,064 | | | | — | | | | 45,064 | |
| Finland | | | — | | | | 475,683 | | | | — | | | | 475,683 | |
| France | | | — | | | | 877,222 | | | | — | | | | 877,222 | |
| Germany | | | — | | | | 2,998,985 | | | | — | | | | 2,998,985 | |
| Hong Kong | | | 300,400 | | | | 461,962 | | | | — | | | | 762,362 | |
| Indonesia | | | — | | | | 191,671 | | | | — | | | | 191,671 | |
| Ireland | | | 149,453 | | | | 1,235,360 | | | | — | | | | 1,384,813 | |
| Italy | | | — | | | | 684,173 | | | | — | | | | 684,173 | |
| Japan | | | — | | | | 816,374 | | | | — | | | | 816,374 | |
| Luxembourg | | | — | | | | 534,729 | | | | — | | | | 534,729 | |
| Malaysia | | | — | | | | 378,865 | | | | — | | | | 378,865 | |
| Netherlands | | | 564,932 | | | | 590,841 | | | | — | | | | 1,155,773 | |
| Norway | | | — | | | | 644,034 | | | | — | | | | 644,034 | |
| Panama | | | 680,438 | | | | — | | | | — | | | | 680,438 | |
| Philippines | | | — | | | | 459,305 | | | | — | | | | 459,305 | |
| Singapore | | | — | | | | 115,406 | | | | — | | | | 115,406 | |
| South Africa | | | — | | | | 408,001 | | | | — | | | | 408,001 | |
| Spain | | | — | | | | 387,154 | | | | — | | | | 387,154 | |
| Sweden | | | — | | | | 1,525,141 | | | | — | | | | 1,525,141 | |
| Switzerland | | | — | | | | 1,372,263 | | | | — | | | | 1,372,263 | |
| Taiwan | | | — | | | | 66,883 | | | | — | | | | 66,883 | |
| Thailand | | | — | | | | 39,703 | | | | — | | | | 39,703 | |
| United Kingdom | | | — | | | | 3,205,725 | | | | — | | | | 3,205,725 | |
| United States | | | 21,182,504 | | | | — | | | | — | | | | 21,182,504 | |
| Participatory Notes | | | — | | | | 150,901 | | | | — | | | | 150,901 | |
| Short-Term Investments (f) | | | 6,407,095 | | | | — | | | | — | | | | 6,407,095 | |
| Total | | $ | 32,799,733 | | | $ | 18,641,093 | | | $ | — | | | $ | 51,440,826 | |
| Liabilities | | Level 1 | | | Level 2 | | | Level 3 | | | Total | |
| | |
| Derivatives (g) | |
| Futures Contracts | | $ | (17,264 | ) | | $ | — | | | $ | — | | | $ | (17,264 | ) |
| Total | | $ | (17,264 | ) | | $ | — | | | $ | — | | | $ | (17,264 | ) |
There have been no transfers between fair value measurement levels during the year ended December 31, 2014.
(f) See Investment Portfolio for additional detailed categorizations.
(g) Derivatives include unrealized appreciation (depreciation) on open futures contracts.
The accompanying notes are an integral part of the financial statements.
Statement of Assets and Liabilities | as of December 31, 2014 | |
| Assets | |
Investments: Investments in non-affiliated securities, at value (cost $41,378,951) — including $4,241,229 of securities loaned | | $ | 45,033,731 | |
| Investment in Daily Assets Fund Institutional (cost $4,347,994)* | | | 4,347,994 | |
| Investment in Central Cash Management Fund (cost $2,059,101) | | | 2,059,101 | |
| Total investments in securities, at value (cost $47,786,046) | | | 51,440,826 | |
| Foreign currency, at value (cost $142,095) | | | 138,077 | |
| Deposit with broker for futures contracts | | | 40,772 | |
| Receivable for investments sold | | | 1,823 | |
| Receivable for Fund shares sold | | | 21,540 | |
| Dividends receivable | | | 17,466 | |
| Interest receivable | | | 978 | |
| Foreign taxes recoverable | | | 32,785 | |
| Other assets | | | 1,668 | |
| Total assets | | | 51,695,935 | |
| Liabilities | |
| Cash overdraft | | | 19,999 | |
| Payable upon return of securities loaned | | | 4,347,994 | |
| Payable for Fund shares redeemed | | | 736 | |
| Payable for variation margin on futures contracts | | | 1,764 | |
| Accrued management fees | | | 19,097 | |
| Accrued Trustees' fees | | | 1,869 | |
| Other accrued expenses and payables | | | 113,679 | |
| Total liabilities | | | 4,505,138 | |
| Net assets, at value | | | 47,190,797 | |
| Net Assets Consist of | |
| Undistributed net investment income | | | 259,024 | |
Net unrealized appreciation (depreciation) on: Investments | | | 3,654,780 | |
| Futures | | | (17,264 | ) |
| Foreign currency | | | (7,538 | ) |
| Accumulated net realized gain (loss) | | | (41,793,664 | ) |
| Paid-in capital | | | 85,095,459 | |
| Net assets, at value | | | 47,190,797 | |
Class A Net Asset Value, offering and redemption price per share ($47,079,877 ÷ 4,265,093 outstanding shares of beneficial interest, no par value, unlimited number of shares authorized) | | $ | 11.04 | |
Class B Net Asset Value, offering and redemption price per share ($110,920 ÷ 10,038 outstanding shares of beneficial interest, no par value, unlimited number of shares authorized) | | $ | 11.05 | |
* Represents collateral on securities loaned.
The accompanying notes are an integral part of the financial statements.
Statement of Operations
| for the year ended December 31, 2014 | |
| Investment Income | |
Income: Dividends (net of foreign taxes withheld of $54,843) | | $ | 753,760 | |
| Income distributions — Central Cash Management Fund | | | 928 | |
| Securities lending income, including income from Daily Assets Fund Institutional, net of borrower rebates | | | 21,801 | |
| Total income | | | 776,489 | |
Expenses: Management fee | | | 464,209 | |
| Administration fee | | | 50,733 | |
| Services to shareholders | | | 1,392 | |
| Record keeping fees (Class B) | | | 798 | |
| Distribution service fee (Class B) | | | 2,250 | |
| Custodian fee | | | 61,738 | |
| Professional fees | | | 78,740 | |
| Reports to shareholders | | | 24,735 | |
| Trustees' fees and expenses | | | 5,031 | |
| Other | | | 30,378 | |
| Total expenses before expense reductions | | | 720,004 | |
| Expense reductions | | | (299,070 | ) |
| Total expenses after expense reductions | | | 420,934 | |
| Net investment income (loss) | | | 355,555 | |
| Realized and Unrealized Gain (Loss) | |
Net realized gain (loss) from: Investments | | | 2,316,311 | |
| Futures | | | 69,674 | |
| Foreign currency | | | (13,527 | ) |
| | | | 2,372,458 | |
Change in net unrealized appreciation (depreciation) on: Investments | | | (2,557,854 | ) |
| Futures | | | (17,264 | ) |
| Foreign currency | | | (4,877 | ) |
| | | | (2,579,995 | ) |
| Net gain (loss) | | | (207,537 | ) |
| Net increase (decrease) in net assets resulting from operations | | $ | 148,018 | |
The accompanying notes are an integral part of the financial statements.
Statement of Changes in Net Assets | | | Years Ended December 31, | |
| Increase (Decrease) in Net Assets | | 2014 | | | 2013 | |
Operations: Net investment income (loss) | | $ | 355,555 | | | $ | 518,403 | |
| Net realized gain (loss) | | | 2,372,458 | | | | 9,003,948 | |
| Change in net unrealized appreciation (depreciation) | | | (2,579,995 | ) | | | 1,089,980 | |
| Net increase (decrease) in net assets resulting from operations | | | 148,018 | | | | 10,612,331 | |
Distributions to shareholders from: Net investment income: Class A | | | (509,707 | ) | | | (689,482 | ) |
| Class B | | | (15,999 | ) | | | (27,740 | ) |
| Total distributions | | | (525,706 | ) | | | (717,222 | ) |
Fund share transactions: Class A Proceeds from shares sold | | | 2,921,038 | | | | 4,242,450 | |
| Reinvestment of distributions | | | 509,707 | | | | 689,482 | |
| Payments for shares redeemed | | | (7,205,720 | ) | | | (16,663,817 | ) |
| Net increase (decrease) in net assets from Class A share transactions | | | (3,774,975 | ) | | | (11,731,885 | ) |
Class B Proceeds from shares sold | | | 24,993 | | | | 147,425 | |
| Reinvestment of distributions | | | 15,999 | | | | 27,740 | |
| Payments for shares redeemed | | | (2,651,803 | ) | | | (823,023 | ) |
| Net increase (decrease) in net assets from Class B share transactions | | | (2,610,811 | ) | | | (647,858 | ) |
| Increase (decrease) in net assets | | | (6,763,474 | ) | | | (2,484,634 | ) |
| Net assets at beginning of period | | | 53,954,271 | | | | 56,438,905 | |
Net assets at end of period (including undistributed net investment income of $259,024 and $478,685, respectively) | | $ | 47,190,797 | | | $ | 53,954,271 | |
| Other Information | |
Class A Shares outstanding at beginning of period | | | 4,601,327 | | | | 5,793,732 | |
| Shares sold | | | 261,234 | | | | 422,826 | |
| Shares issued to shareholders in reinvestment of distributions | | | 46,464 | | | | 71,746 | |
| Shares redeemed | | | (643,932 | ) | | | (1,686,977 | ) |
| Net increase (decrease) in Class A shares | | | (336,234 | ) | | | (1,192,405 | ) |
| Shares outstanding at end of period | | | 4,265,093 | | | | 4,601,327 | |
Class B Shares outstanding at beginning of period | | | 246,555 | | | | 311,300 | |
| Shares sold | | | 2,774 | | | | 14,554 | |
| Shares issued to shareholders in reinvestment of distributions | | | 1,453 | | | | 2,878 | |
| Shares redeemed | | | (240,744 | ) | | | (82,177 | ) |
| Net increase (decrease) in Class B shares | | | (236,517 | ) | | | (64,745 | ) |
| Shares outstanding at end of period | | | 10,038 | | | | 246,555 | |
The accompanying notes are an integral part of the financial statements.
| | | Years Ended December 31, | |
| Class A | | | 2014 | | | 2013 | | | 2012 | | | 2011 | | | 2010 | |
| Selected Per Share Data | |
| Net asset value, beginning of period | | $ | 11.13 | | | $ | 9.24 | | | $ | 7.90 | | | $ | 9.28 | | | $ | 8.24 | |
Income (loss) from investment operations: Net investment incomea | | | .08 | | | | .10 | | | | .12 | | | | .11 | | | | .06 | |
| Net realized and unrealized gain (loss) | | | (.06 | ) | | | 1.92 | | | | 1.34 | | | | (1.43 | ) | | | 1.06 | |
| Total from investment operations | | | .02 | | | | 2.02 | | | | 1.46 | | | | (1.32 | ) | | | 1.12 | |
Less distributions from: Net investment income | | | (.11 | ) | | | (.13 | ) | | | (.12 | ) | | | (.06 | ) | | | (.08 | ) |
| Net asset value, end of period | | $ | 11.04 | | | $ | 11.13 | | | $ | 9.24 | | | $ | 7.90 | | | $ | 9.28 | |
Total Return (%)b | | | .21 | | | | 22.08 | | | | 18.60 | | | | (14.39 | ) | | | 13.65 | |
| Ratios to Average Net Assets and Supplemental Data | |
| Net assets, end of period ($ millions) | | | 47 | | | | 51 | | | | 54 | | | | 49 | | | | 68 | |
| Ratio of expenses before expense reductions (%) | | | 1.41 | | | | 1.45 | | | | 1.42 | | | | 1.37 | | | | 1.41 | |
| Ratio of expenses after expense reductions (%) | | | .82 | | | | .88 | | | | .99 | | | | 1.03 | | | | 1.05 | |
| Ratio of net investment income (%) | | | .71 | | | | 1.00 | | | | 1.40 | | | | 1.24 | | | | .77 | |
| Portfolio turnover rate (%) | | | 63 | | | | 171 | | | | 107 | | | | 127 | | | | 165 | |
a Based on average shares outstanding during the period. b Total return would have been lower had certain expenses not been reduced. | |
| | | Years Ended December 31, | |
| Class B | | | 2014 | | | 2013 | | | 2012 | | | 2011 | | | 2010 | |
| Selected Per Share Data | |
| Net asset value, beginning of period | | $ | 11.14 | | | $ | 9.25 | | | $ | 7.91 | | | $ | 9.29 | | | $ | 8.25 | |
Income (loss) from investment operations: Net investment incomea | | | .02 | | | | .07 | | | | .09 | | | | .08 | | | | .04 | |
| Net realized and unrealized gain (loss) | | | (.04 | ) | | | 1.92 | | | | 1.34 | | | | (1.44 | ) | | | 1.05 | |
| Total from investment operations | | | (.02 | ) | | | 1.99 | | | | 1.43 | | | | (1.36 | ) | | | 1.09 | |
Less distributions from: Net investment income | | | (.07 | ) | | | (.10 | ) | | | (.09 | ) | | | (.02 | ) | | | (.05 | ) |
| Net asset value, end of period | | $ | 11.05 | | | $ | 11.14 | | | $ | 9.25 | | | $ | 7.91 | | | $ | 9.29 | |
Total Return (%)b | | | (.15 | ) | | | 21.62 | | | | 18.16 | | | | (14.67 | ) | | | 13.24 | |
| Ratios to Average Net Assets and Supplemental Data | |
| Net assets, end of period ($ millions) | | | .1 | | | | 3 | | | | 3 | | | | 3 | | | | 5 | |
| Ratio of expenses before expense reductions (%) | | | 1.76 | | | | 1.81 | | | | 1.76 | | | | 1.72 | | | | 1.76 | |
| Ratio of expenses after expense reductions (%) | | | 1.15 | | | | 1.23 | | | | 1.34 | | | | 1.38 | | | | 1.40 | |
| Ratio of net investment income (%) | | | .14 | | | | .66 | | | | 1.04 | | | | .88 | | | | .42 | |
| Portfolio turnover rate (%) | | | 63 | | | | 171 | | | | 107 | | | | 127 | | | | 165 | |
a Based on average shares outstanding during the period. b Total return would have been lower had certain expenses not been reduced. | |
Notes to Financial Statements
A. Organization and Significant Accounting Policies
Deutsche Global Growth VIP (formerly DWS Global Growth VIP) (the "Fund") is a diversified series of Deutsche Variable Series II (formerly DWS Variable Series II) (the "Trust"), which is registered under the Investment Company Act of 1940, as amended (the "1940 Act"), as an open-end management investment company organized as a Massachusetts business trust.
Multiple Classes of Shares of Beneficial Interest. The Fund offers two classes of shares (Class A shares and Class B shares). Sales of Class B shares are subject to recordkeeping fees up to 0.15% and Rule 12b-1 fees under the 1940 Act equal to an annual rate of 0.25% of the average daily net assets for Class B shares of the Fund. Class A shares are not subject to such fees.
Investment income, realized and unrealized gains and losses, and certain fund-level expenses and expense reductions, if any, are borne pro rata on the basis of relative net assets by the holders of all classes of shares except that each class bears certain expenses unique to that class (including the applicable Rule 12b-1 fee and recordkeeping fees). Differences in class-level expenses may result in payment of different per share dividends by class. All shares have equal rights with respect to voting subject to class-specific arrangements.
The Fund's financial statements are prepared in accordance with accounting principles generally accepted in the United States of America which require the use of management estimates. Actual results could differ from those estimates. The policies described below are followed consistently by the Fund in the preparation of its financial statements.
Security Valuation. Investments are stated at value determined as of the close of regular trading on the New York Stock Exchange on each day the exchange is open for trading.
Various inputs are used in determining the value of the Fund's investments. These inputs are summarized in three broad levels. Level 1 includes quoted prices in active markets for identical securities. Level 2 includes other significant observable inputs (including quoted prices for similar securities, interest rates, prepayment speeds and credit risk). Level 3 includes significant unobservable inputs (including the Fund's own assumptions in determining the fair value of investments). The level assigned to the securities valuations may not be an indication of the risk or liquidity associated with investing in those securities.
Equity securities are valued at the most recent sale price or official closing price reported on the exchange (U.S. or foreign) or over-the-counter market on which they trade. Securities for which no sales are reported are valued at the calculated mean between the most recent bid and asked quotations on the relevant market or, if a mean cannot be determined, at the most recent bid quotation. Equity securities are generally categorized as Level 1. For certain international equity securities, in order to adjust for events which may occur between the close of the foreign exchanges and the close of the New York Stock Exchange, a fair valuation model may be used. This fair valuation model takes into account comparisons to the valuation of American Depository Receipts (ADRs), exchange-traded funds, futures contracts and certain indices and these securities are categorized as Level 2.
Futures contracts are generally valued at the settlement prices established each day on the exchange on which they are traded and are categorized as Level 1.
Investments in open-end investment companies are valued at their net asset value each business day and are categorized as Level 1.
Securities and other assets for which market quotations are not readily available or for which the above valuation procedures are deemed not to reflect fair value are valued in a manner that is intended to reflect their fair value as determined in accordance with procedures approved by the Board and are generally categorized as Level 3. In accordance with the Fund's valuation procedures, factors considered in determining value may include, but are not limited to, the type of the security; the size of the holding; the initial cost of the security; the existence of any contractual restrictions on the security's disposition; the price and extent of public trading in similar securities of the issuer or of comparable companies; quotations or evaluated prices from broker-dealers and/or pricing services; information obtained from the issuer, analysts, and/or the appropriate stock exchange (for exchange-traded securities); an analysis of the company's or issuer's financial statements; an evaluation of the forces that influence the issuer and the market(s) in which the security is purchased and sold; and with respect to debt securities, the maturity, coupon, creditworthiness, currency denomination and the movement of the market in which the security is normally traded. The value determined under these procedures may differ from published values for the same securities.
Disclosure about the classification of fair value measurements is included in a table following the Fund's Investment Portfolio.
Foreign Currency Translations. The books and records of the Fund are maintained in U.S. dollars. Investment securities and other assets and liabilities denominated in a foreign currency are translated into U.S. dollars at the prevailing exchange rates at period end. Purchases and sales of investment securities, income and expenses are translated into U.S. dollars at the prevailing exchange rates on the respective dates of the transactions.
Net realized and unrealized gains and losses on foreign currency transactions represent net gains and losses between trade and settlement dates on securities transactions, the acquisition and disposition of foreign currencies, and the difference between the amount of net investment income accrued and the U.S. dollar amount actually received. That portion of both realized and unrealized gains and losses on investments that results from fluctuations in foreign currency exchange rates is not separately disclosed but is included with net realized and unrealized gain/appreciation and loss/depreciation on investments.
Securities Lending. Brown Brothers Harriman & Co., as lending agent, lends securities of the Fund to certain financial institutions under the terms of the Security Lending Agreement. The Fund retains the benefits of owning the securities it has loaned and continues to receive interest and dividends generated by the securities and to participate in any changes in their market value. The Fund requires the borrowers of the securities to maintain collateral with the Fund consisting of either cash or liquid, unencumbered assets having a value at least equal to the value of the securities loaned. When the collateral falls below specified amounts, the lending agent will use its best effort to obtain additional collateral on the next business day to meet required amounts under the security lending agreement. The Fund may invest the cash collateral into a joint trading account in an affiliated money market fund pursuant to Exemptive Orders issued by the SEC. The Fund receives compensation for lending its securities either in the form of fees or by earning interest on invested cash collateral net of borrower rebates and fees paid to a lending agent. Either the Fund or the borrower may terminate the loan. There may be risks of delay and costs in recovery of securities or even loss of rights in the collateral should the borrower of the securities fail financially. If the Fund is not able to recover securities lent, the Fund may sell the collateral and purchase a replacement investment in the market, incurring the risk that the value of the replacement security is greater than the value of the collateral. The Fund is also subject to all investment risks associated with the reinvestment of any cash collateral received, including, but not limited to, interest rate, credit and liquidity risk associated with such investments.
As of December 31, 2014, the Fund had securities on loan. The value of the related collateral exceeded the value of the securities loaned at period end.
Participatory Notes. The Fund invests in Participatory Notes (P-Notes). P-Notes are promissory notes designed to offer a return linked to the performance of a particular underlying equity security or market. P-Notes are issued by banks or broker-dealers and allow the Fund to gain exposure to local shares in foreign markets. Investments in P-Notes involve the same risks associated with a direct investment in the underlying foreign companies or foreign markets that they seek to replicate. Although each participation note is structured with a defined maturity date, early redemption may be possible. Risks associated with participation notes include the possible failure of a counterparty to perform in accordance with the terms of the agreement and potential delays or an inability to redeem before maturity under certain market conditions.
Taxes. The Fund's policy is to comply with the requirements of the Internal Revenue Code, as amended, which are applicable to regulated investment companies and to distribute all of its taxable income to its shareholders.
Additionally, the Fund may be subject to taxes imposed by the governments of countries in which it invests and are generally based on income and/or capital gains earned or repatriated. Estimated tax liabilities on certain foreign securities are recorded on an accrual basis and are reflected as components of interest income or net change in unrealized gain/loss on investments. Tax liabilities realized as a result of security sales are reflected as a component of net realized gain/loss on investments.
Under the Regulated Investment Company Modernization Act of 2010, net capital losses incurred post-enactment may be carried forward indefinitely, and their character is retained as short-term and/or long-term. Previously, net capital losses were carried forward for eight years and treated as short-term. As a transition rule, the Act requires that post-enactment net capital losses be used before pre-enactment net capital losses.
At December 31, 2014, the Fund had a net tax basis capital loss carryforward of approximately $41,532,000 of pre-enactment losses, which may be applied against any realized net taxable capital gains of each succeeding year until fully utilized or until December 31, 2016 ($23,743,000) and December 31, 2017 ($17,789,000), the respective expiration dates, whichever occurs first.
The Fund has reviewed the tax positions for the open tax years as of December 31, 2014 and has determined that no provision for income tax and/or uncertain tax provisions is required in the Fund's financial statements. The Fund's federal tax returns for the prior three fiscal years remain open subject to examination by the Internal Revenue Service.
Distribution of Income and Gains. Distributions from net investment income of the Fund, if any, are declared and distributed to shareholders annually. Net realized gains from investment transactions, in excess of available capital loss carryforwards, would be taxable to the Fund if not distributed and, therefore, will be distributed to shareholders at least annually. The Fund may also make additional distributions for tax purposes if necessary.
The timing and characterization of certain income and capital gain distributions are determined annually in accordance with federal tax regulations which may differ from accounting principles generally accepted in the United States of America. These differences primarily relate to investments in foreign denominated investments, investments in futures contracts, income received from Passive Foreign Investment Companies and certain securities sold at a loss. As a result, net investment income (loss) and net realized gain (loss) on investment transactions for a reporting period may differ significantly from distributions during such period. Accordingly, the Fund may periodically make reclassifications among certain of its capital accounts without impacting the net asset value of the Fund.
At December 31, 2014, the Fund's components of distributable earnings on a tax basis were as follows:
| Undistributed ordinary income* | | $ | 357,234 | |
| Capital loss carryforwards | | $ | (41,532,000 | ) |
| Unrealized appreciation (depreciation) on investments | | $ | 3,486,974 | |
In addition, the tax character of distributions paid by the Fund is summarized as follows:
| | | Years Ended December 31, | |
| | | 2014 | | | 2013 | |
| Distributions from ordinary income* | | $ | 525,706 | | | $ | 717,222 | |
* For tax purposes, short-term capital gain distributions are considered ordinary income distributions.
Expenses. Expenses of the Trust arising in connection with a specific fund are allocated to that fund. Other Trust expenses which cannot be directly attributed to a fund are apportioned among the funds in the Trust based upon the relative net assets or other appropriate measures.
Contingencies. In the normal course of business, the Fund may enter into contracts with service providers that contain general indemnification clauses. The Fund's maximum exposure under these arrangements is unknown as this would involve future claims that may be made against the Fund that have not yet been made. However, based on experience, the Fund expects the risk of loss to be remote.
Other. Investment transactions are accounted for on a trade date plus one basis for daily net asset value calculations. However, for financial reporting purposes, investment transactions are reported on trade date. Interest income is recorded on the accrual basis. Dividend income is recorded on the ex-dividend date net of foreign withholding taxes. Realized gains and losses from investment transactions are recorded on an identified cost basis. Proceeds from litigation payments, if any, are included in net realized gain (loss) from investments.
B. Derivative Instruments
Futures Contracts. A futures contract is an agreement between a buyer or seller and an established futures exchange or its clearinghouse in which the buyer or seller agrees to take or make a delivery of a specific amount of a financial instrument at a specified price on a specific date (settlement date). For the year ended December 31, 2014, the Fund invested in futures as a substitute for direct investment in a particular asset class or to keep cash on hand to meet shareholder redemptions or other needs while maintaining exposure to the market. The Fund also invested in futures contracts for non-hedging purposes to seek to enhance potential gains.
Upon entering into a futures contract, the Fund is required to deposit with a financial intermediary cash or securities ("initial margin") in an amount equal to a certain percentage of the face value indicated in the futures contract. Subsequent payments ("variation margin") are made or received by the Fund dependent upon the daily fluctuations in the value and are recorded for financial reporting purposes as unrealized gains or losses by the Fund. Gains or losses are realized when the contract expires or is closed. Since all futures contracts are exchange-traded, counterparty risk is minimized as the exchange's clearinghouse acts as the counterparty, and guarantees the futures against default.
Certain risks may arise upon entering into futures contracts, including the risk that an illiquid market will limit the Fund's ability to close out a futures contract prior to the settlement date and the risk that the futures contract is not well correlated with the security, index or currency to which it relates. Risk of loss may exceed amounts recognized in the Statement of Assets and Liabilities.
A summary of the open futures contracts as of December 31, 2014, is included in a table following the Fund's Investment Portfolio. For the year ended December 31, 2014, the investment in futures contracts purchased had a total notional value from $0 to approximately $870,000.
The following tables summarize the value of the Fund's derivative instruments held as of December 31, 2014 and the related location in the accompanying Statement of Assets and Liabilities, presented by primary underlying risk exposure:
| Liability Derivative | | Futures Contracts | |
Equity Contracts (a) | | $ | (17,264 | ) |
The above derivative is located in the following Statement of Assets and Liabilities account: (a) Includes cumulative appreciation (depreciation) of futures contracts as disclosed in the Investment Portfolio. Unsettled variation margin is disclosed separately within the Statement of Assets and Liabilities. | |
Additionally, the amount of unrealized and realized gains and losses on derivative instruments recognized in Fund earnings during the year ended December 31, 2014 and the related location in the accompanying Statement of Operations is summarized in the following tables by primary underlying risk exposure:
| Realized Gain (Loss) | | Futures Contracts | |
Equity Contracts (a) | | $ | 69,674 | |
The above derivative is located in the following Statement of Operations account: (a) Net realized gain (loss) from futures | |
| Change in Net Unrealized Appreciation (Depreciation) | | Futures Contracts | |
Equity Contracts (a) | | $ | (17,264 | ) |
The above derivative is located in the following Statement of Operations account: (a) Change in net unrealized appreciation (depreciation) on futures | |
C. Purchases and Sales of Securities
During the year ended December 31, 2014, purchases and sales of investment transactions (excluding short-term investments) aggregated $30,718,408 and $37,584,353, respectively.
D. Related Parties
Management Agreement. Under the Investment Management Agreement with Deutsche Investment Management Americas Inc. ("DIMA" or the "Advisor"), an indirect, wholly owned subsidiary of Deutsche Bank AG, the Advisor directs the investments of the Fund in accordance with its investment objectives, policies and restrictions. The Advisor determines the securities, instruments and other contracts relating to investments to be purchased, sold or entered into by the Fund.
Pursuant to the Investment Management Agreement with the Advisor, the Fund pays a monthly management fee based on the Fund's average daily net assets, computed and accrued daily and payable monthly, at the following annual rates:
| First $250 million | | | .915 | % |
| Next $500 million | | | .865 | % |
| Next $750 million | | | .815 | % |
| Next $1.5 billion | | | .765 | % |
| Over $3 billion | | | .715 | % |
Accordingly, for the year ended December 31, 2014, the fee pursuant to the Investment Management Agreement was equivalent to an annual rate (exclusive of any applicable waivers/reimbursements) of 0.915% of the Fund's average daily net assets.
For the period from January 1, 2014 through September 30, 2014, the Advisor had contractually agreed to waive its fees and/or reimburse certain operating expenses to the extent necessary to maintain the total annual operating expenses (excluding certain expenses such as extraordinary expenses, taxes, brokerage and interest expense) of each class as follows:
Effective October 1, 2014 through September 30, 2015, the Advisor has contractually agreed to waive its fees and/or reimburse certain operating expenses to the extent necessary to maintain the total annual operating expenses (excluding certain expenses such as extraordinary expenses, taxes, brokerage and interest expense) of each class as follows:
For the year ended December 31, 2014, fees waived and/or expenses reimbursed for each class are as follows:
| Class A | | $ | 293,634 | |
| Class B | | | 5,436 | |
| | | $ | 299,070 | |
Administration Fee. Pursuant to an Administrative Services Agreement, DIMA provides most administrative services to the Fund. For all services provided under the Administrative Services Agreement, the Fund pays DIMA an annual fee ("Administration Fee") of 0.10% of the Fund's average daily net assets, computed and accrued daily and payable monthly. For the year ended December 31, 2014, the Administration Fee was $50,733, of which $4,023 is unpaid.
Service Provider Fees. DeAWM Service Company ("DSC"), an affiliate of the Advisor, is the transfer agent, dividend-paying agent and shareholder service agent for the Fund. Pursuant to a sub-transfer agency agreement between DSC and DST Systems, Inc. ("DST"), DSC has delegated certain transfer agent, dividend-paying agent and shareholder service agent functions to DST. DSC compensates DST out of the shareholder servicing fee it receives from the Fund. For the year ended December 31, 2014, the amounts charged to the Fund by DSC were as follows:
| Services to Shareholders | | Total Aggregated | | | Unpaid at December 31, 2014 | |
| Class A | | $ | 303 | | | $ | 50 | |
| Class B | | | 60 | | | | 9 | |
| | | $ | 363 | | | $ | 59 | |
Distribution Service Agreement. Under the Fund's Class B 12b-1 plan, DeAWM Distributors, Inc. ("DDI") received a fee ("Distribution Service Fee") of 0.25% of average daily net assets of Class B shares. For the year ended December 31, 2014, the Distribution Service Fee aggregated $2,250, of which $24 is unpaid.
Typesetting and Filing Service Fees. Under an agreement with DIMA, DIMA is compensated for providing typesetting and certain regulatory filing services to the Fund. For the year ended December 31, 2014, the amount charged to the Fund by DIMA included in the Statement of Operations under "Reports to shareholders" aggregated $15,398, of which $5,266 is unpaid.
Trustees' Fees and Expenses. The Fund paid retainer fees to each Trustee not affiliated with the Advisor, plus specified amounts to the Board Chairperson and Vice Chairperson and to each committee Chairperson.
Affiliated Cash Management Vehicles. The Fund may invest uninvested cash balances in Central Cash Management Fund and Deutsche Variable NAV Money Fund, affiliated money market funds which are managed by the Advisor. Each affiliated money market fund seeks to provide a high level of current income consistent with liquidity and the preservation of capital. Each affiliated money market fund is managed in accordance with Rule 2a-7 under the Investment Company Act of 1940, which governs the quality, maturity, diversity and liquidity of instruments in which a money market fund may invest. Central Cash Management Fund seeks to maintain a stable net asset value, and Deutsche Variable NAV Money Fund maintains a floating net asset value. The Fund indirectly bears its proportionate share of the expenses of each affiliated money market fund in which it invests. Central Cash Management Fund does not pay the Advisor an investment management fee. To the extent that Deutsche Variable NAV Money Fund pays an investment management fee to the Advisor, the Advisor will waive an amount of the investment management fee payable to the Advisor by the Fund equal to the amount of the investment management fee payable on the Fund's assets invested in Deutsche Variable NAV Money Fund.
E. Investing in Emerging Markets
Investing in emerging markets may involve special risks and considerations not typically associated with investing in developed markets. These risks include revaluation of currencies, high rates of inflation or deflation, repatriation restrictions on income and capital, and future adverse political, social and economic developments. Moreover, securities issued in these markets may be less liquid, subject to government ownership controls or delayed settlements, and may have prices that are more volatile or less easily assessed than those of comparable securities of issuers in developed markets.
F. Ownership of the Fund
At December 31, 2014, two participating insurance companies were owners of record of 10% or more of the total outstanding Class A shares of the Fund, each owning 72% and 23%. Two participating insurance companies were owners of record of 10% or more of the total outstanding Class B shares of the Fund, owning 53% and 39%.
G. Line of Credit
The Fund and other affiliated funds (the "Participants") share in a $400 million revolving credit facility provided by a syndication of banks. The Fund may borrow for temporary or emergency purposes, including the meeting of redemption requests that otherwise might require the untimely disposition of securities. The Participants are charged an annual commitment fee which is allocated based on net assets, among each of the Participants. Interest is calculated at a rate per annum equal to the sum of the Federal Funds Rate plus 1.25 percent plus if LIBOR exceeds the Federal Funds Rate the amount of such excess. The Fund may borrow up to a maximum of 33 percent of its net assets under the agreement. The Fund had no outstanding loans at December 31, 2014.
Report of Independent Registered Public Accounting Firm
To the Board of Trustees of Deutsche Variable Series II and Shareholders of Deutsche Global Growth VIP:
We have audited the accompanying statement of assets and liabilities, including the investment portfolio, of Deutsche Global Growth VIP (formerly DWS Global Growth VIP) (the "Fund") (one of the series constituting Deutsche Variable Series II (formerly DWS Variable Series II)), as of December 31, 2014, and the related statement of operations for the year then ended, the statements of changes in net assets for each of the two years in the period then ended, and the financial highlights for each of the periods indicated therein. These financial statements and financial highlights are the responsibility of the Fund’s management. Our responsibility is to express an opinion on these financial statements and financial highlights based on our audits.
We conducted our audits in accordance with the standards of the Public Company Accounting Oversight Board (United States). Those standards require that we plan and perform the audit to obtain reasonable assurance about whether the financial statements and financial highlights are free of material misstatement. We were not engaged to perform an audit of the Fund’s internal control over financial reporting. Our audits included consideration of internal control over financial reporting as a basis for designing audit procedures that are appropriate in the circumstances, but not for the purpose of expressing an opinion on the effectiveness of the Fund’s internal control over financial reporting. Accordingly, we express no such opinion. An audit also includes examining, on a test basis, evidence supporting the amounts and disclosures in the financial statements and financial highlights, assessing the accounting principles used and significant estimates made by management, and evaluating the overall financial statement presentation. Our procedures included confirmation of securities owned as of December 31, 2014, by correspondence with the custodian and brokers. We believe that our audits provide a reasonable basis for our opinion.
In our opinion, the financial statements and financial highlights referred to above present fairly, in all material respects, the financial position of Deutsche Global Growth VIP at December 31, 2014, the results of its operations for the year then ended, the changes in its net assets for each of the two years in the period then ended, and the financial highlights for each of the periods indicated therein, in conformity with U.S. generally accepted accounting principles.
| | | |
Boston, Massachusetts February 13, 2015 | | |
Information About Your Fund's Expenses (Unaudited)
As an investor of the Fund, you incur two types of costs: ongoing expenses and transaction costs. Ongoing expenses include management fees, distribution and service (12b-1) fees and other Fund expenses. Examples of transaction costs include contract charges, which are not shown in this section. The following tables are intended to help you understand your ongoing expenses (in dollars) of investing in the Fund and to help you compare these expenses with the ongoing expenses of investing in other mutual funds. In the most recent six-month period, the Fund limited these expenses; had it not done so, expenses would have been higher. The example in the table is based on an investment of $1,000 invested at the beginning of the six-month period and held for the entire period (July 1, 2014 to December 31, 2014).
The tables illustrate your Fund's expenses in two ways:
—Actual Fund Return. This helps you estimate the actual dollar amount of ongoing expenses (but not transaction costs) paid on a $1,000 investment in the Fund using the Fund's actual return during the period. To estimate the expenses you paid over the period, simply divide your account value by $1,000 (for example, an $8,600 account value divided by $1,000 = 8.6), then multiply the result by the number in the "Expenses Paid per $1,000" line under the share class you hold.
—Hypothetical 5% Fund Return. This helps you to compare your Fund's ongoing expenses (but not transaction costs) with those of other mutual funds using the Fund's actual expense ratio and a hypothetical rate of return of 5% per year before expenses. Examples using a 5% hypothetical Fund return may be found in the shareholder reports of other mutual funds. The hypothetical account values and expenses may not be used to estimate the actual ending account balance or expenses you paid for the period.
Please note that the expenses shown in these tables are meant to highlight your ongoing expenses only and do not reflect any transaction costs. The "Expenses Paid per $1,000" line of the tables is useful in comparing ongoing expenses only and will not help you determine the relative total expense of owning different funds. If these transaction costs had been included, your costs would have been higher.
Expenses and Value of a $1,000 Investment for the six months ended December 31, 2014 | |
| Actual Fund Return | | Class A | | | Class B | |
| Beginning Account Value 7/1/14 | | $ | 1,000.00 | | | $ | 1,000.00 | |
| Ending Account Value 12/31/14 | | $ | 956.60 | | | $ | 954.20 | |
| Expenses Paid per $1,000* | | $ | 4.19 | | | $ | 5.91 | |
| Hypothetical 5% Fund Return | | Class A | | | Class B | |
| Beginning Account Value 7/1/14 | | $ | 1,000.00 | | | $ | 1,000.00 | |
| Ending Account Value 12/31/14 | | $ | 1,020.92 | | | $ | 1,019.16 | |
| Expenses Paid per $1,000* | | $ | 4.33 | | | $ | 6.11 | |
* Expenses are equal to the Fund's annualized expense ratio for each share class, multiplied by the average account value over the period, multiplied by 184 (the number of days in the most recent six-month period), then divided by 365.
| Annualized Expense Ratios | Class A | | Class B | |
| Deutsche Variable Series II — Deutsche Global Growth VIP | .85% | | 1.20% | |
For more information, please refer to the Fund's prospectus.
These tables do not reflect charges and fees ("contract charges") associated with the separate account that invests in the Fund or any variable life insurance policy or variable annuity contract for which the Fund is an investment option.
For an analysis of the fees associated with an investment in the fund or similar funds, please refer to the current and hypothetical expense calculators for Variable Insurance Products which can be found at deutschefunds.com/EN/resources/calculators.jsp.
Tax Information (Unaudited)
The Fund paid foreign taxes of $32,608 and earned $196,098 of foreign source income during the year ended December 31, 2014. Pursuant to section 853 of the Internal Revenue Code, the Fund designates $0.01 per share as foreign taxes paid and $0.05 per share as income earned from foreign sources for the year ended December 31, 2014.
For corporate shareholders, 25% of the ordinary dividends (i.e., income dividends plus short-term capital gains) paid during the Fund's fiscal year ended December 31, 2014, qualified for the dividends received deduction.
Please consult a tax advisor if you have questions about federal or state income tax laws, or on how to prepare your tax returns. If you have specific questions about your account, please contact your insurance provider.
The Trust's policies and procedures for voting proxies for portfolio securities and information about how the Trust voted proxies related to its portfolio securities during the 12-month period ended June 30 are available on our Web site — deutschefunds.com (click on "proxy voting" at the bottom of the page) — or on the SEC's Web site — sec.gov. To obtain a written copy of the Trust's policies and procedures without charge, upon request, call us toll free at (800) 728-3337.
Advisory Agreement Board Considerations and Fee Evaluation
The Board of Trustees approved the renewal of Deutsche Global Growth VIP’s investment management agreement (the "Agreement") with Deutsche Investment Management Americas Inc. ("DIMA") in September 2014.
In terms of the process that the Board followed prior to approving the Agreement, shareholders should know that:
— In September 2014, all of the Fund’s Trustees were independent of DIMA and its affiliates.
— The Trustees met frequently during the past year to discuss fund matters and dedicated a substantial amount of time to contract review matters. Over the course of several months, the Board’s Contract Committee, in coordination with the Board’s Equity Oversight Committee, reviewed comprehensive materials received from DIMA, independent third parties and independent counsel. These materials included an analysis of the Fund’s performance, fees and expenses, and profitability compiled by a fee consultant retained by the Fund’s Independent Trustees (the "Fee Consultant"). The Board also received extensive information throughout the year regarding performance of the Fund.
— The Independent Trustees regularly meet privately with counsel to discuss contract review and other matters. In addition, the Independent Trustees were advised by the Fee Consultant in the course of their review of the Fund’s contractual arrangements and considered a comprehensive report prepared by the Fee Consultant in connection with their deliberations.
— In connection with reviewing the Agreement, the Board also reviewed the terms of the Fund’s Rule 12b-1 plan, distribution agreement, administrative services agreement, transfer agency agreement and other material service agreements.
— Based on its evaluation of the information provided, the Contract Committee presented its findings and recommendations to the Board. The Board then reviewed the Contract Committee’s findings and recommendations.
In connection with the contract review process, the Contract Committee and the Board considered the factors discussed below, among others. The Board also considered that DIMA and its predecessors have managed the Fund since its inception, and the Board believes that a long-term relationship with a capable, conscientious advisor is in the best interests of the Fund. The Board considered, generally, that shareholders chose to invest or remain invested in the Fund knowing that DIMA managed the Fund, and that the Agreement was approved by the Fund’s shareholders. DIMA is part of Deutsche Bank AG ("DB"), a major global banking institution that is engaged in a wide range of financial services. The Board believes that there are advantages to being part of a global asset management business that offers a wide range of investing expertise and resources, including hundreds of portfolio managers and analysts with research capabilities in many countries throughout the world.
As part of the contract review process, the Board carefully considered the fees and expenses of each Deutsche fund overseen by the Board in light of the fund’s performance. In many cases, this led to the negotiation and implementation of expense caps. As part of these negotiations, the Board indicated that it would consider relaxing these caps in future years following sustained improvements in performance, among other considerations.
In 2012, DB combined its Asset Management (of which DIMA was a part) and Wealth Management divisions into a new Asset and Wealth Management ("AWM") division. DB has advised the Independent Trustees that the U.S. asset management business is a critical and integral part of DB, and that DB will continue to invest in AWM a significant portion of the savings it has realized by combining its Asset and Wealth Management divisions, including ongoing enhancements to AWM’s investment capabilities. DB also has confirmed its commitment to maintaining strong legal and compliance groups within the AWM division.
While shareholders may focus primarily on fund performance and fees, the Fund’s Board considers these and many other factors, including the quality and integrity of DIMA’s personnel and such other issues as back-office operations, fund valuations, and compliance policies and procedures.
Nature, Quality and Extent of Services. The Board considered the terms of the Agreement, including the scope of advisory services provided under the Agreement. The Board noted that, under the Agreement, DIMA provides portfolio management services to the Fund and that, pursuant to a separate administrative services agreement, DIMA provides administrative services to the Fund. The Board considered the experience and skills of senior management and investment personnel, the resources made available to such personnel, the ability of DIMA to attract and retain high-quality personnel, and the organizational depth and stability of DIMA. The Board reviewed the Fund’s performance over short-term and long-term periods and compared those returns to various agreed-upon performance measures, including market index(es) and a peer universe compiled by the Fee Consultant using information supplied by Morningstar Direct ("Morningstar"), an independent fund data service. The Board also noted that it has put into place a process of identifying "Focus Funds" (e.g., funds performing poorly relative to a peer universe), and receives more frequent reporting and information from DIMA regarding such funds, along with DIMA’s plans to address underperformance. The Board believes this process is an effective manner of identifying and addressing underperforming funds. Based on the information provided, the Board noted that for the one-, three- and five-year periods ended December 31, 2013, the Fund’s performance (Class A shares) was in the 3rd quartile, 4th quartile and 3rd quartile, respectively, of the applicable Morningstar universe (the 1st quartile being the best performers and the 4th quartile being the worst performers). The Board also observed that the Fund has outperformed its benchmark in the five-year period and has underperformed its benchmark in the one- and three-year periods ended December 31, 2013. The Board noted the disappointing investment performance of the Fund in recent periods and continued to discuss with senior management of DIMA the factors contributing to such underperformance and actions being taken to improve performance. The Board recognized the efforts by DIMA in recent years to enhance its investment platform and improve long-term performance across the Deutsche fund complex.
Fees and Expenses. The Board considered the Fund’s investment management fee schedule, operating expenses and total expense ratios, and comparative information provided by Lipper Inc. ("Lipper") and the Fee Consultant regarding investment management fee rates paid to other investment advisors by similar funds (1st quartile being the most favorable and 4th quartile being the least favorable). With respect to management fees paid to other investment advisors by similar funds, the Board noted that the contractual fee rates paid by the Fund, which include a 0.10% fee paid to DIMA under the Fund’s administrative services agreement, were higher than the median (4th quartile) of the applicable Lipper peer group (based on Lipper data provided as of December 31, 2013). The Board noted that the Fund’s Class A shares total (net) operating expenses were expected to be lower than the median (2nd quartile) of the applicable Lipper expense universe (based on Lipper data provided as of December 31, 2013, and analyzing Lipper expense universe Class A (net) expenses less any applicable 12b-1 fees) ("Lipper Universe Expenses"). The Board also reviewed data comparing each share class’s total (net) operating expenses to the applicable Lipper Universe Expenses. The Board also considered how the Fund’s total (net) operating expenses compared to the total (net) operating expenses of a more customized peer group selected by Lipper (based on such factors as asset size). The Board noted that the expense limitations agreed to by DIMA helped to ensure that the Fund’s total (net) operating expenses would remain competitive. The Board considered the Fund’s management fee rate as compared to fees charged by DIMA to comparable funds and considered differences between the Fund and the comparable funds. The information requested by the Board as part of its review of fees and expenses also included information about institutional accounts and funds offered primarily to European investors ("Deutsche Europe funds") managed by DIMA and its affiliates. The Board noted that DIMA indicated that it does not manage any institutional accounts or Deutsche Europe funds comparable to the Fund.
On the basis of the information provided, the Board concluded that management fees were reasonable and appropriate in light of the nature, quality and extent of services provided by DIMA.
Profitability. The Board reviewed detailed information regarding revenues received by DIMA under the Agreement. The Board considered the estimated costs and pre-tax profits realized by DIMA from advising the Deutsche U.S. mutual funds ("Deutsche Funds"), as well as estimates of the pre-tax profits attributable to managing the Fund in particular. The Board also received information regarding the estimated enterprise-wide profitability of DIMA and its affiliates with respect to all fund services in totality and by fund. The Board and the Fee Consultant reviewed DIMA’s methodology in allocating its costs to the management of the Fund. Based on the information provided, the Board concluded that the pre-tax profits realized by DIMA in connection with the management of the Fund were not unreasonable.
Economies of Scale. The Board considered whether there are economies of scale with respect to the management of the Fund and whether the Fund benefits from any economies of scale. The Board noted that the Fund’s management fee schedule includes fee breakpoints. The Board concluded that the Fund’s fee schedule represents an appropriate sharing between the Fund and DIMA of such economies of scale as may exist in the management of the Fund at current asset levels.
Other Benefits to DIMA and Its Affiliates. The Board also considered the character and amount of other incidental benefits received by DIMA and its affiliates, including any fees received by DIMA for administrative services provided to the Fund and any fees received by an affiliate of DIMA for distribution services. The Board also considered benefits to DIMA related to brokerage and soft-dollar allocations, including allocating brokerage to pay for research generated by parties other than the executing broker dealers, which pertain primarily to funds investing in equity securities, along with the incidental public relations benefits to DIMA related to Deutsche Funds advertising and cross-selling opportunities among DIMA products and services. The Board concluded that management fees were reasonable in light of these fallout benefits.
Compliance. The Board considered the significant attention and resources dedicated by DIMA to documenting and enhancing its compliance processes in recent years. The Board noted in particular (i) the experience and seniority of DIMA’s and the Fund’s chief compliance officer; (ii) the large number of DIMA compliance personnel; and (iii) the substantial commitment of resources by DIMA and its affiliates to compliance matters.
Based on all of the information considered and the conclusions reached, the Board unanimously determined that the continuation of the Agreement is in the best interests of the Fund. In making this determination, the Board did not give particular weight to any single factor identified above. The Board considered these factors over the course of numerous meetings, certain of which were in executive session with only the Independent Trustees and counsel present. It is possible that individual Trustees may have weighed these factors differently in reaching their individual decisions to approve the continuation of the Agreement.
Board Members and Officers
The following table presents certain information regarding the Board Members and Officers of the fund. Each Board Member's year of birth is set forth in parentheses after his or her name. Unless otherwise noted, (i) each Board Member has engaged in the principal occupation(s) noted in the table for at least the most recent five years, although not necessarily in the same capacity; and (ii) the address of each Independent Board Member is c/o Kenneth C. Froewiss, Chairman, Deutsche Mutual Funds, P.O. Box 390601, Cambridge, MA 02139. Except as otherwise noted below, the term of office for each Board Member is until the election and qualification of a successor, or until such Board Member sooner dies, resigns, is removed or as otherwise provided in the governing documents of the fund. Because the fund does not hold an annual meeting of shareholders, each Board Member will hold office for an indeterminate period. The Board Members may also serve in similar capacities with other funds in the fund complex.
| Independent Board Members |
Name, Year of Birth, Position with the Fund and Length of Time Served1 | | Business Experience and Directorships During the Past Five Years | Number of Funds in Deutsche Fund Complex Overseen | Other Directorships Held by Board Member |
Kenneth C. Froewiss (1945) Chairperson since 2013, and Board Member since 2001 | | Adjunct Professor of Finance, NYU Stern School of Business (September 2009–present; Clinical Professor from 1997–September 2009); Member, Finance Committee, Association for Asian Studies (2002–present); Director, Mitsui Sumitomo Insurance Group (US) (2004–present); prior thereto, Managing Director, J.P. Morgan (investment banking firm) (until 1996) | 105 | — |
William McClayton (1944) Vice Chairperson since 2013, and Board Member since 2004 | | Private equity investor (since October 2009); previously, Managing Director, Diamond Management & Technology Consultants, Inc. (global consulting firm) (2001–2009); Directorship: Board of Managers, YMCA of Metropolitan Chicago; formerly: Senior Partner, Arthur Andersen LLP (accounting) (1966–2001); Trustee, Ravinia Festival | 105 | — |
John W. Ballantine (1946) Board Member since 1999 | | Retired; formerly, Executive Vice President and Chief Risk Management Officer, First Chicago NBD Corporation/The First National Bank of Chicago (1996–1998); Executive Vice President and Head of International Banking (1995–1996); former Directorships: Director and former Chairman of the Board, Healthways, Inc.2 (provider of disease and care management services) (2003–2014); Stockwell Capital Investments PLC (private equity); First Oak Brook Bancshares, Inc. and Oak Brook Bank; Prisma Energy International | 105 | Portland General Electric2 (utility company) (2003– present) |
Henry P. Becton, Jr. (1943) Board Member since 1990 | | Vice Chair and former President, WGBH Educational Foundation. Directorships: Public Radio International; Public Radio Exchange (PRX); North Bennett Street School (Boston); former Directorships: Belo Corporation2 (media company); The PBS Foundation; Association of Public Television Stations; Boston Museum of Science; American Public Television; Concord Academy; New England Aquarium; Mass. Corporation for Educational Telecommunications; Committee for Economic Development; Public Broadcasting Service; Connecticut College | 105 | Lead Director, Becton Dickinson and Company2 (medical technology company) |
Dawn-Marie Driscoll (1946) Board Member since 1987 | | Emeritus Executive Fellow, Center for Business Ethics, Bentley University; formerly: President, Driscoll Associates (consulting firm); Partner, Palmer & Dodge (law firm) (1988–1990); Vice President of Corporate Affairs and General Counsel, Filene's (retail) (1978–1988). Directorships: Director of ICI Mutual Insurance Company (since 2007); Advisory Board, Center for Business Ethics, Bentley University; Trustee and former Chairman of the Board, Southwest Florida Community Foundation (charitable organization); former Directorships: Sun Capital Advisers Trust (mutual funds) (2007–2012), Investment Company Institute (audit, executive, nominating committees) and Independent Directors Council (governance, executive committees) | 105 | — |
Keith R. Fox, CFA (1954) Board Member since 1996 | | Managing General Partner, Exeter Capital Partners (a series of private investment funds) (since 1986). Directorships: Progressive International Corporation (kitchen goods importer and distributor); The Kennel Shop (retailer); former Chairman, National Association of Small Business Investment Companies; former Directorships: BoxTop Media Inc. (advertising); Sun Capital Advisers Trust (mutual funds) (2011–2012) | 105 | — |
Paul K. Freeman (1950) Board Member since 1993 | | Consultant, World Bank/Inter-American Development Bank; Chair, Independent Directors Council; Investment Company Institute (executive and nominating committees); formerly, Chairman of Education Committee of Independent Directors Council; Project Leader, International Institute for Applied Systems Analysis (1998–2001); Chief Executive Officer, The Eric Group, Inc. (environmental insurance) (1986–1998); Directorships: Denver Zoo Foundation (December 2012–present); former Directorships: Prisma Energy International | 105 | — |
Richard J. Herring (1946) Board Member since 1990 | | Jacob Safra Professor of International Banking and Professor, Finance Department, The Wharton School, University of Pennsylvania (since July 1972); Co-Director, Wharton Financial Institutions Center; Co-Chair, U.S. Shadow Financial Regulatory Committee; Executive Director, Financial Economists Roundtable; formerly: Vice Dean and Director, Wharton Undergraduate Division (July 1995–June 2000); Director, Lauder Institute of International Management Studies (July 2000–June 2006) | 105 | Director, Aberdeen Singapore and Japan Funds (since 2007); Independent Director of Barclays Bank Delaware (since September 2010) |
Rebecca W. Rimel (1951) Board Member since 1995 | | President and Chief Executive Officer, The Pew Charitable Trusts (charitable organization) (1994 to present); formerly: Executive Vice President, The Glenmede Trust Company (investment trust and wealth management) (1983–2004); Board Member, Investor Education (charitable organization) (2004–2005); Trustee, Executive Committee, Philadelphia Chamber of Commerce (2001–2007); Director, Viasys Health Care2 (January 2007–June 2007); Trustee, Thomas Jefferson Foundation (charitable organization) (1994–2012) | 105 | Director, Becton Dickinson and Company2 (medical technology company) (2012– present); Director, BioTelemetry Inc.2 (health care) (2009– present) |
William N. Searcy, Jr. (1946) Board Member since 1993 | | Private investor since October 2003; formerly: Pension & Savings Trust Officer, Sprint Corporation2 (telecommunications) (November 1989–September 2003); Trustee, Sun Capital Advisers Trust (mutual funds) (1998–2012) | 105 | — |
Jean Gleason Stromberg (1943) Board Member since 1997 | | Retired. Formerly, Consultant (1997–2001); Director, Financial Markets U.S. Government Accountability Office (1996–1997); Partner, Norton Rose Fulbright, L.L.P. (law firm) (1978–1996). Directorships: The William and Flora Hewlett Foundation (charitable organization); former Directorships: Service Source, Inc. (nonprofit), Mutual Fund Directors Forum (2002–2004), American Bar Retirement Association (funding vehicle for retirement plans) (1987–1990 and 1994–1996) | 105 | — |
Robert H. Wadsworth* (1940) Board Member since 1999 | | President, Robert H. Wadsworth & Associates, Inc. (consulting firm) (1983 to present); Director, The Phoenix Boys Choir Association | 105 | — |
Officers4 |
Name, Year of Birth, Position with the Fund and Length of Time Served5 | | Business Experience and Directorships During the Past Five Years |
Brian E. Binder8 (1972) President and Chief Executive Officer, 2013–present | | Managing Director3 and Head of Fund Administration, Deutsche Asset & Wealth Management (2013–present); formerly: Head of Business Management and Consulting at Invesco, Ltd. (2010–2012); Chief Administrative Officer, Van Kampen Funds Inc. (2008–2010); and Chief Administrative Officer, Morgan Stanley Investment Management Americas Distribution (2003–2008) |
John Millette7 (1962) Vice President and Secretary, 1999–present | | Director,3 Deutsche Asset & Wealth Management |
Melinda Morrow6 (1970) Vice President, 2012–present | | Director,3 Deutsche Asset & Wealth Management |
Paul H. Schubert6 (1963) Chief Financial Officer, 2004–present Treasurer, 2005–present | | Managing Director,3 Deutsche Asset & Wealth Management (since July 2004); formerly: Executive Director, Head of Mutual Fund Services and Treasurer for UBS Family of Funds (1998–2004); Vice President and Director of Mutual Fund Finance at UBS Global Asset Management (1994–1998) |
Caroline Pearson7 (1962) Chief Legal Officer, 2010–present | | Managing Director,3 Deutsche Asset & Wealth Management; formerly: Assistant Secretary for DWS family of funds (1997–2010) |
Robert Kloby6 (1962) Chief Compliance Officer, 2006–present | | Managing Director,3 Deutsche Asset & Wealth Management |
Wayne Salit6 (1967) Anti-Money Laundering Compliance Officer, 2014–present | | Director,3 Deutsche Asset & Wealth Management; formerly: Managing Director, AML Compliance Officer at BNY Mellon (2011–2014); and Director, AML Compliance Officer at Deutsche Bank (2004–2011) |
Hepsen Uzcan7 (1974) Assistant Secretary, 2013–present | | Director,3 Deutsche Asset & Wealth Management |
Paul Antosca7 (1957) Assistant Treasurer, 2007–present | | Director,3 Deutsche Asset & Wealth Management |
Jack Clark7 (1967) Assistant Treasurer, 2007–present | | Director,3 Deutsche Asset & Wealth Management |
Diane Kenneally7 (1966) Assistant Treasurer, 2007–present | | Director,3 Deutsche Asset & Wealth Management |
1 The length of time served represents the year in which the Board Member joined the board of one or more Deutsche funds currently overseen by the Board.
2 A publicly held company with securities registered pursuant to Section 12 of the Securities Exchange Act of 1934.
3 Executive title, not a board directorship.
4 As a result of their respective positions held with the Advisor, these individuals are considered "interested persons" of the Advisor within the meaning of the 1940 Act. Interested persons receive no compensation from the fund.
5 The length of time served represents the year in which the officer was first elected in such capacity for one or more Deutsche funds.
6 Address: 60 Wall Street, New York, NY 10005.
7 Address: One Beacon Street, Boston, MA 02108.
8 Address: 222 South Riverside Plaza, Chicago, IL 60606.
* Robert H. Wadsworth retired from the Board effective December 31, 2014.
The fund's Statement of Additional Information ("SAI") includes additional information about the Board Members. The SAI is available, without charge, upon request. If you would like to request a copy of the SAI, you may do so by calling the following toll-free number: (800) 728-3337.
DeAWM Distributors, Inc.
222 South Riverside Plaza
Chicago, IL 60606
(800) 621-1148
VS2GG-2 (R-025830-5 2/15)
December 31, 2014
Annual Report
Deutsche Variable Series II
(formerly DWS Variable Series II)
Deutsche Global Income Builder VIP
(formerly DWS Global Income Builder VIP)
Contents
30 Statement of Assets and Liabilities 31 Statement of Operations 32 Statement of Changes in Net Assets 34 Notes to Financial Statements 43 Report of Independent Registered Public Accounting Firm 44 Information About Your Fund's Expenses 47 Advisory Agreement Board Considerations and Fee Evaluation 50 Board Members and Officers |
This report must be preceded or accompanied by a prospectus. To obtain an additional prospectus or summary prospectus, if available, call (800) 728-3337 or your financial representative. We advise you to consider the Fund's objectives, risks, charges and expenses carefully before investing. The summary prospectus and prospectus contain this and other important information about the Fund. Please read the prospectus carefully before you invest.
Although allocation among different asset categories generally limits risk, fund management may favor an asset category that underperforms other assets or markets as a whole. Bond investments are subject to interest-rate, credit, liquidity and market risks to varying degrees. When interest rates rise, bond prices generally fall. Credit risk refers to the ability of an issuer to make timely payments of principal and interest. Investing in derivatives entails special risks relating to liquidity, leverage and credit that may reduce returns and/or increase volatility. Dividends are not guaranteed. If the dividend-paying stocks held by the Fund reduce or stop paying dividends, the Fund’s ability to generate income may be adversely affected. Preferred stocks, a type of dividend-paying stock, present certain additional risks. Because Exchange Traded Funds (ETFs) trade on a securities exchange, their shares may trade at a premium or discount to their net asset value. ETFs also incur fees and expenses so they may not fully match the performance of the indexes they are designed to track. Any fund that focuses in a particular segment of the market or region of the world will generally be more volatile than a fund that invests more broadly. Investing in foreign securities, particularly those of emerging markets, presents certain risks, such as currency fluctuations, political and economic changes, and market risks. The Fund may lend securities to approved institutions. Smaller company stocks tend to be more volatile than medium-sized or large company stocks. Stocks may decline in value. Stocks may decline in value. See the prospectus for details.
Deutsche Asset & Wealth Management represents the asset management and wealth management activities conducted by Deutsche Bank AG or any of its subsidiaries, including the Advisor and DeAWM Distributors, Inc.
NOT FDIC/NCUA INSURED NO BANK GUARANTEE MAY LOSE VALUE NOT A DEPOSIT
NOT INSURED BY ANY FEDERAL GOVERNMENT AGENCY
Performance Summary December 31, 2014 (Unaudited)
Fund performance shown is historical, assumes reinvestment of all dividend and capital gain distributions and does not guarantee future results. Investment return and principal value fluctuate with changing market conditions so that, when redeemed, shares may be worth more or less than their original cost. Current performance may be lower or higher than the performance data quoted. Please contact your participating insurance company for the Fund's most recent month-end performance. Performance doesn't reflect charges and fees ("contract charges") associated with the separate account that invests in the Fund or any variable life insurance policy or variable annuity contract for which the Fund is an investment option. These charges and fees will reduce returns.
The gross expense ratio of the Fund, as stated in the fee table of the prospectus dated May 1, 2014 is 0.60% for Class A shares and may differ from the expense ratio disclosed in the Financial Highlights table in this report.
| Growth of an Assumed $10,000 Investment in Deutsche Global Income Builder VIP |
| The Russell 1000® Index is an unmanaged index that measures the performance of the 1,000 largest companies in the Russell 3000® Index, which represents approximately 92% of the total market capitalization of the Russell 3000® Index. The Barclays U.S. Aggregate Bond Index is an unmanaged index representing domestic taxable investment-grade bonds, with index components for government and corporate securities, mortgage pass-through securities, and asset-backed securities with an average maturity of one year or more. The S&P® Target Risk Moderate Index is designed to measure the performance of S&P's proprietary moderate target risk allocation model. The S&P® Target Risk Moderate Index seeks to provide significant exposure to fixed income, while also allocating a smaller portion of exposure to equities in order to seek current income, some capital preservation, and an opportunity for moderate to low capital appreciation. Index returns do not reflect any fees or expenses and it is not possible to invest directly into an index. |
| |
| Yearly periods ended December 31 | |
| Comparative Results | |
| Deutsche Global Income Builder VIP | | 1-Year | | | 3-Year | | | 5-Year | | | 10-Year | |
| Class A | Growth of $10,000 | | $ | 10,383 | | | $ | 13,681 | | | $ | 15,000 | | | $ | 16,219 | |
| Average annual total return | | | 3.83 | % | | | 11.01 | % | | | 8.45 | % | | | 4.95 | % |
Russell 1000® Index | Growth of $10,000 | | $ | 11,324 | | | $ | 17,549 | | | $ | 20,679 | | | $ | 21,509 | |
| Average annual total return | | | 13.24 | % | | | 20.62 | % | | | 15.64 | % | | | 7.96 | % |
| Barclays U.S. Aggregate Bond Index | Growth of $10,000 | | $ | 10,597 | | | $ | 10,820 | | | $ | 12,431 | | | $ | 15,842 | |
| Average annual total return | | | 5.97 | % | | | 2.66 | % | | | 4.45 | % | | | 4.71 | % |
S&P® Target Risk Moderate Index | Growth of $10,000 | | $ | 10,449 | | | $ | 12,534 | | | $ | 13,871 | | | $ | 16,185 | |
| Average annual total return | | | 4.49 | % | | | 7.82 | % | | | 6.76 | % | | | 4.93 | % |
The growth of $10,000 is cumulative.
Management Summary December 31, 2014 (Unaudited)
The Fund returned 3.83% during the 12 months ended December 31, 2014 (Class A shares, unadjusted for contract charges), underperforming the 4.49% return of S&P® Target Risk Moderate Index. Its two other benchmarks — the Barclays U.S. Aggregate Bond Index, which represents domestic taxable investment-grade bonds, and the Russell 1000® Index, which tracks the performance of the 1,000 largest stocks in the Russell 3000® Index — returned 5.97% and 13.24%, respectively.1,2,3
As of December 31, 2014, 53% of the portfolio was allocated to global equities and 36% was allocated to bonds, with the remainder in cash. When our team took over the Fund in March 2012, we established an equal, 50-50 weighting between stocks and bonds. We subsequently allowed the Fund’s equity allocation to increase to 65% of assets by the end of April 2014 as the stock market rallied, which enabled the Fund to participate in stocks’ outperformance during this time. In May 2014, we reduced the Fund's equity allocation on the belief that a more balanced weighting was appropriate given stocks’ long streak of outperformance. We reduced the equity weighting further during July 2014 in response to the rising risks for the global equity markets. We believe this reduced weighting is appropriate given our views regarding valuations, interest rates and economic growth.
The Fund’s equity portfolio outperformed the benchmark during the period. Stock selection, particularly in the health care, industrials and financials sectors, was the primary driver of positive performance. Among individual stocks, the leading contributors to performance were Southwest Airlines Co. and Delta Air Lines, Inc., both of which were helped by falling industry capacity and lower oil prices. However, some of this positive impact was offset by the portfolio’s allocation to international stocks, which underperformed the U.S.-only equity benchmark, as well as its underweight position in the outperforming health care sector.4 The largest individual detractors from performance were an underweight in Apple, Inc. and overweights in the energy stock Ensco PLC* and Deutsche Lufthansa AG.
Throughout the period, the Fund used derivatives — including forward currency contracts — to hedge currency risk in certain portfolio positions, offsetting the potential impact of the downturn in foreign currencies relative to the U.S. dollar. It also used interest rate contracts to hedge against potential adverse interest rate movements on portfolio assets. In addition, the Fund used derivatives, including forward currency and interest rate contracts, for non-hedging purposes, to seek to enhance potential gains. Derivatives used for non-hedging purposes contributed to returns.
After performing very well through the first six months of the year, the bond portfolio’s subsequent underperformance caused it to finish behind its benchmark. During the first half, the Fund’s overweight positions in high-yield bonds and emerging-markets debt outperformed in an environment of improving global growth. This backdrop shifted later in the year, however, as slowing growth and falling oil prices weighed on these asset classes. Nevertheless, we continue to see opportunities in all three market segments given the backdrop of improving domestic growth and investors’ ongoing reach for yield at a time of ultralow interest rates.
Di Kumble, CFA William Chepolis, CFA
Philip G. Condon | Gary Russell, CFA John D. Ryan
Darwei Kung |
| Portfolio Managers | |
The views expressed reflect those of the portfolio management team only through the end of the period of the report as stated on the cover. The management team's views are subject to change at any time based on market and other conditions and should not be construed as a recommendation. Past performance is no guarantee of future results. Current and future portfolio holdings are subject to risk.
1 The S&P Target Risk Moderate Index is designed to measure the performance of S&P’s proprietary moderate target risk allocation model. The S&P Target Risk Moderate Index seeks to provide significant exposure to fixed income, while also allocating a smaller portion of exposure to equities in order to seek current income, some capital preservation and an opportunity for moderate-to-low capital appreciation.
2 The Barclays U.S. Aggregate Bond Index is an unmanaged index representing domestic taxable investment-grade bonds, with index components for government and corporate securities, mortgage pass-through securities, and asset-backed securities with an average maturity of one year or more.
3 The Russell 1000 Index is an unmanaged index that measures the performance of the 1,000 largest companies in the Russell 3000 Index, which represents approximately 92% of the total market capitalization of the Russell 3000 Index.
Index returns do not reflect any fees or expenses and it is not possible to invest directly into an index.
4 "Underweight" means the Fund holds a lower weighting in a given sector or security than the benchmark. "Overweight" means the Fund holds a higher weighting.
* Not held in the portfolio as of December 31, 2014.
Portfolio Summary (Unaudited) Asset Allocation (As a % of Investment Portfolio excluding Securities Lending Collateral) | 12/31/14 | 12/31/13 |
| | | |
| Equity | 53% | 63% |
| Common Stocks | 53% | 63% |
| | | |
| Fixed Income | 36% | 33% |
| Corporate Bonds | 25% | 23% |
| Government & Agency Obligations | 8% | 5% |
| Collateralized Mortgage Obligations | 1% | 2% |
| Mortgage-Backed Securities Pass-Throughs | 1% | 1% |
| Asset-Backed | 1% | 0% |
| Commercial Mortgage-Backed Securities | 0% | 1% |
| Municipal Bonds and Notes | 0% | 1% |
| Loan Participations and Assignments | — | 0% |
| | | |
| Cash Equivalents | 11% | 4% |
| | 100% | 100% |
Sector Diversification
(As a % of Equities, Corporate Bonds, Preferred Securities, Convertible Bonds and Other Investments) | 12/31/14 | 12/31/13 |
| | | |
| Financials | 22% | 22% |
| Consumer Discretionary | 12% | 13% |
| Energy | 10% | 9% |
| Industrials | 10% | 11% |
| Telecommunication Services | 10% | 9% |
| Information Technology | 9% | 12% |
| Health Care | 8% | 6% |
| Consumer Staples | 8% | 7% |
| Materials | 6% | 5% |
| Utilities | 5% | 6% |
| | 100% | 100% |
Portfolio holdings and characteristics are subject to change.
For more complete details about the Fund's investment portfolio, see page 7.
Following the Fund's fiscal first and third quarter-end, a complete portfolio holdings listing is filed with the SEC on Form N-Q. The form will be available on the SEC's Web site at sec.gov, and it also may be reviewed and copied at the SEC's Public Reference Room in Washington, D.C. Information on the operation of the SEC's Public Reference Room may be obtained by calling (800) SEC-0330. The Fund's portfolio holdings are also posted on deutschefunds.com from time to time. Please see the Fund's current prospectus for more information.
Investment Portfolio December 31, 2014 | | | Shares | | | Value ($) | |
| | | | |
| Common Stocks 53.1% | |
| Consumer Discretionary 5.5% | |
| Auto Components 0.6% | |
| Aisin Seiki Co., Ltd. | | | 2,664 | | | | 95,751 | |
| Bridgestone Corp. | | | 7,805 | | | | 271,230 | |
| Cie Generale des Etablissements Michelin | | | 243 | | | | 22,031 | |
| Delphi Automotive PLC | | | 3,154 | | | | 229,359 | |
| Denso Corp. | | | 79 | | | | 3,682 | |
| Johnson Controls, Inc. | | | 1,959 | | | | 94,698 | |
| Magna International, Inc. | | | 1,176 | | | | 127,429 | |
| Sumitomo Electric Industries Ltd. | | | 16,605 | | | | 207,178 | |
| Sumitomo Rubber Industries Ltd. | | | 12,693 | | | | 188,985 | |
| Toyota Industries Corp. | | | 79 | | | | 4,037 | |
| TRW Automotive Holdings Corp.* | | | 1,936 | | | | 199,117 | |
| Yokohama Rubber Co., Ltd. | | | 23,087 | | | | 210,924 | |
| | | | | | | | 1,654,421 | |
| Automobiles 1.3% | |
| Bayerische Motoren Werke (BMW) AG | | | 1,177 | | | | 127,827 | |
| Daihatsu Motor Co., Ltd. | | | 7,600 | | | | 99,691 | |
| Daimler AG (Registered) | | | 1,727 | | | | 144,085 | |
| Ford Motor Co. | | | 29,568 | | | | 458,304 | |
| General Motors Co. | | | 14,040 | | | | 490,136 | |
| Honda Motor Co., Ltd. | | | 10,350 | | | | 300,975 | |
| Isuzu Motors Ltd. | | | 3,500 | | | | 42,702 | |
| Mitsubishi Motors Corp. | | | 3,838 | | | | 35,160 | |
| Nissan Motor Co., Ltd. | | | 40,585 | | | | 353,505 | |
| Renault SA | | | 4,500 | | | | 328,840 | |
| Toyota Motor Corp. | | | 6,190 | | | | 386,012 | |
| Volkswagen AG | | | 2,482 | | | | 540,814 | |
| | | | | | | | 3,308,051 | |
| Hotels, Restaurants & Leisure 0.4% | |
| Carnival Corp. | | | 4,858 | | | | 220,213 | |
| Compass Group PLC | | | 710 | | | | 12,102 | |
| Dawn Holdings, Inc.* (a) | | | 1 | | | | 1,831 | |
| McDonald's Corp. | | | 3,056 | | | | 286,347 | |
| Royal Caribbean Cruises Ltd. | | | 799 | | | | 65,862 | |
| Starbucks Corp. | | | 2,821 | | | | 231,463 | |
| Trump Entertainment Resorts, Inc.* | | | 2 | | | | 0 | |
| Yum! Brands, Inc. | | | 1,959 | | | | 142,713 | |
| | | | | | | | 960,531 | |
| Household Durables 0.3% | |
| Mohawk Industries, Inc.* | | | 784 | | | | 121,802 | |
| Persimmon PLC | | | 6,152 | | | | 150,490 | |
| Sekisui House Ltd. | | | 13,454 | | | | 176,218 | |
| Toll Brothers, Inc.* | | | 4,100 | | | | 140,507 | |
| Whirlpool Corp. | | | 446 | | | | 86,408 | |
| | | | | | | | 675,425 | |
| Leisure Products 0.1% | |
| Hasbro, Inc. (b) | | | 2,821 | | | | 155,127 | |
| Media 1.5% | |
| CBS Corp. "B" | | | 1,176 | | | | 65,080 | |
| Comcast Corp. "A" (b) | | | 7,914 | | | | 455,569 | |
| Comcast Corp. "A" | | | 6,974 | | | | 404,562 | |
| DIRECTV* | | | 1,545 | | | | 133,951 | |
| Discovery Communications, Inc. "A"* | | | 4,200 | | | | 144,690 | |
| | | Shares | | | Value ($) | |
| | | | | | | | | |
| Discovery Communications, Inc. "C"* | | | 6,500 | | | | 219,180 | |
| News Corp. "A"* | | | 5,485 | | | | 86,060 | |
| Omnicom Group, Inc. | | | 627 | | | | 48,574 | |
| Scripps Networks Interactive, Inc. "A" | | | 2,273 | | | | 171,089 | |
| SES SA | | | 5 | | | | 179 | |
| Shaw Communications, Inc. "B" | | | 7,444 | | | | 200,869 | |
| Sky PLC | | | 10,533 | | | | 146,601 | |
| Thomson Reuters Corp. | | | 4,231 | | | | 170,689 | |
| Time Warner Cable, Inc. | | | 1,254 | | | | 190,683 | |
| Time Warner, Inc. | | | 4,047 | | | | 345,695 | |
| Twenty-First Century Fox, Inc. "A" | | | 3,056 | | | | 117,366 | |
| Twenty-First Century Fox, Inc. "B" | | | 4,701 | | | | 173,420 | |
| Viacom, Inc. "B" | | | 1,881 | | | | 141,545 | |
| Walt Disney Co. | | | 3,683 | | | | 346,902 | |
| WPP PLC | | | 4,538 | | | | 94,146 | |
| | | | | | | | 3,656,850 | |
| Multiline Retail 0.3% | |
| Canadian Tire Corp., Ltd. "A" | | | 157 | | | | 16,586 | |
| Dollar General Corp.* | | | 1,959 | | | | 138,501 | |
| Kohl's Corp. | | | 3,291 | | | | 200,883 | |
| Macy's, Inc. | | | 2,194 | | | | 144,255 | |
| Target Corp. | | | 3,683 | | | | 279,577 | |
| | | | | | | | 779,802 | |
| Specialty Retail 0.6% | |
| Advance Auto Parts, Inc. | | | 1,200 | | | | 191,136 | |
| AutoZone, Inc.* | | | 314 | | | | 194,400 | |
| Bed Bath & Beyond, Inc.* | | | 941 | | | | 71,676 | |
| Best Buy Co., Inc. | | | 4,800 | | | | 187,104 | |
| GameStop Corp. "A" (b) | | | 3,392 | | | | 114,649 | |
| Hikari Tsushin, Inc. | | | 1,900 | | | | 115,651 | |
| Home Depot, Inc. | | | 2,038 | | | | 213,929 | |
| Lowe's Companies, Inc. | | | 1,332 | | | | 91,642 | |
| O'Reilly Automotive, Inc.* | | | 314 | | | | 60,483 | |
| The Gap, Inc. | | | 862 | | | | 36,299 | |
| TJX Companies, Inc. | | | 1,567 | | | | 107,465 | |
| Yamada Denki Co., Ltd. (b) | | | 40,400 | | | | 134,843 | |
| | | | | | | | 1,519,277 | |
| Textiles, Apparel & Luxury Goods 0.4% | |
| Christian Dior SA | | | 933 | | | | 159,410 | |
| Cie Financiere Richemont SA (Registered) | | | 1,534 | | | | 135,878 | |
| Hermes International | | | 51 | | | | 18,185 | |
| Michael Kors Holdings Ltd.* | | | 706 | | | | 53,021 | |
| NIKE, Inc. "B" | | | 564 | | | | 54,228 | |
| Swatch Group AG (Bearer) | | | 205 | | | | 91,028 | |
| Swatch Group AG (Registered) | | | 1,724 | | | | 149,116 | |
| VF Corp. | | | 2,642 | | | | 197,886 | |
| Yue Yuen Industrial (Holdings) Ltd. | | | 18,804 | | | | 67,579 | |
| | | | | | | | 926,331 | |
| Consumer Staples 4.7% | |
| Beverages 0.6% | |
| Anheuser-Busch InBev NV | | | 450 | | | | 50,640 | |
| Carlsberg AS "B" | | | 1,729 | | | | 134,267 | |
| Coca-Cola Co. | | | 6,268 | | | | 264,635 | |
| Constellation Brands, Inc. "A"* | | | 2,100 | | | | 206,157 | |
| Diageo PLC | | | 2,821 | | | | 80,910 | |
| Dr. Pepper Snapple Group, Inc. | | | 2,586 | | | | 185,364 | |
| Heineken Holding NV | | | 1,747 | | | | 109,506 | |
| | | Shares | | | Value ($) | |
| | | | | | | | | |
| Heineken NV | | | 355 | | | | 25,219 | |
| Molson Coors Brewing Co. "B" | | | 2,899 | | | | 216,033 | |
| PepsiCo, Inc. | | | 3,567 | | | | 337,296 | |
| | | | | | | | 1,610,027 | |
| Food & Staples Retailing 1.7% | |
| Aeon Co., Ltd. | | | 12,615 | | | | 126,975 | |
| Alimentation Couche-Tard, Inc. "B" | | | 3,152 | | | | 132,097 | |
| Casino Guichard-Perrachon SA | | | 524 | | | | 48,221 | |
| Costco Wholesale Corp. | | | 1,332 | | | | 188,811 | |
| CVS Health Corp. | | | 5,642 | | | | 543,381 | |
| Empire Co., Ltd. "A" | | | 3,134 | | | | 236,358 | |
| George Weston Ltd. | | | 3,448 | | | | 297,820 | |
| ICA Gruppen AB | | | 4,973 | | | | 194,647 | |
| J Sainsbury PLC | | | 52,473 | | | | 199,489 | |
| Koninklijke Ahold NV | | | 4,417 | | | | 78,517 | |
| Kroger Co. | | | 5,877 | | | | 377,362 | |
| Lawson, Inc. | | | 862 | | | | 52,124 | |
| Loblaw Companies Ltd. | | | 1,756 | | | | 93,967 | |
| Metro, Inc. | | | 1,332 | | | | 106,968 | |
| Safeway, Inc. | | | 7,499 | | | | 263,365 | |
| Seven & I Holdings Co., Ltd. | | | 1,567 | | | | 56,523 | |
| Sysco Corp. | | | 3,761 | | | | 149,274 | |
| Wal-Mart Stores, Inc. | | | 6,112 | | | | 524,899 | |
| Walgreens Boots Alliance, Inc. | | | 2,245 | | | | 171,069 | |
| WM Morrison Supermarkets PLC | | | 60,530 | | | | 172,266 | |
| Woolworths Ltd. | | | 4,247 | | | | 105,815 | |
| | | | | | | | 4,119,948 | |
| Food Products 1.3% | |
| Archer-Daniels-Midland Co. | | | 5,328 | | | | 277,056 | |
| Aryzta AG | | | 1,318 | | | | 101,272 | |
| Bunge Ltd. | | | 3,296 | | | | 299,639 | |
| Chocoladefabriken Lindt & Sprungli AG | | | 23 | | | | 113,546 | |
| ConAgra Foods, Inc. | | | 4,466 | | | | 162,026 | |
| General Mills, Inc. | | | 4,780 | | | | 254,917 | |
| Golden Agri-Resources Ltd. | | | 312,000 | | | | 108,201 | |
| Hormel Foods Corp. | | | 2,038 | | | | 106,180 | |
| Kellogg Co. | | | 2,899 | | | | 189,711 | |
| Kraft Foods Group, Inc. | | | 2,116 | | | | 132,589 | |
| McCormick & Co., Inc. | | | 941 | | | | 69,916 | |
| Mondelez International, Inc. "A" | | | 7,679 | | | | 278,940 | |
| Nestle SA (Registered) | | | 4,850 | | | | 355,512 | |
| Tate & Lyle PLC | | | 6,434 | | | | 60,438 | |
| The Hershey Co. | | | 706 | | | | 73,375 | |
| The JM Smucker Co. | | | 1,567 | | | | 158,236 | |
| Tyson Foods, Inc. "A" | | | 7,052 | | | | 282,715 | |
| Wilmar International Ltd. | | | 61,112 | | | | 149,081 | |
| | | | | | | | 3,173,350 | |
| Household Products 0.5% | |
| Church & Dwight Co., Inc. | | | 1,803 | | | | 142,094 | |
| Clorox Co. | | | 784 | | | | 81,701 | |
| Colgate-Palmolive Co. | | | 2,429 | | | | 168,062 | |
| Kimberly-Clark Corp. | | | 2,038 | | | | 235,471 | |
| Procter & Gamble Co. | | | 4,566 | | | | 415,917 | |
| Reckitt Benckiser Group PLC | | | 1,733 | | | | 139,804 | |
| | | | | | | | 1,183,049 | |
| Tobacco 0.6% | |
| Altria Group, Inc. | | | 5,410 | | | | 266,551 | |
| British American Tobacco PLC | | | 4,589 | | | | 249,338 | |
| Imperial Tobacco Group PLC | | | 4,735 | | | | 207,361 | |
| Japan Tobacco, Inc. | | | 5,877 | | | | 161,371 | |
| Lorillard, Inc. | | | 3,134 | | | | 197,254 | |
| | | Shares | | | Value ($) | |
| | | | | | | | | |
| Philip Morris International, Inc. | | | 3,918 | | | | 319,121 | |
| Reynolds American, Inc. | | | 1,723 | | | | 110,737 | |
| | | | | | | | 1,511,733 | |
| Energy 4.4% | |
| Energy Equipment & Services 0.4% | |
| Baker Hughes, Inc. | | | 4,454 | | | | 249,736 | |
| Halliburton Co. | | | 1,254 | | | | 49,320 | |
| Nabors Industries Ltd. (b) | | | 24,300 | | | | 315,414 | |
| National Oilwell Varco, Inc. | | | 1,254 | | | | 82,174 | |
| Schlumberger Ltd. | | | 2,273 | | | | 194,137 | |
| | | | | | | | 890,781 | |
| Oil, Gas & Consumable Fuels 4.0% | |
| Apache Corp. | | | 1,567 | | | | 98,204 | |
| BG Group PLC | | | 6,894 | | | | 91,764 | |
| BP PLC | | | 119,052 | | | | 755,949 | |
| Cabot Oil & Gas Corp. | | | 3,996 | | | | 118,322 | |
| Canadian Natural Resources Ltd. | | | 1,646 | | | | 50,890 | |
| Cenovus Energy, Inc. | | | 4,800 | | | | 99,033 | |
| Chevron Corp. | | | 4,780 | | | | 536,220 | |
| ConocoPhillips | | | 3,536 | | | | 244,196 | |
| Devon Energy Corp. | | | 2,038 | | | | 124,746 | |
| Enbridge, Inc. | | | 392 | | | | 20,157 | |
| Eni SpA | | | 9,313 | | | | 162,653 | |
| Exxon Mobil Corp. | | | 4,701 | | | | 434,607 | |
| Hess Corp. | | | 1,834 | | | | 135,386 | |
| HollyFrontier Corp. | | | 7,389 | | | | 276,940 | |
| Husky Energy, Inc. | | | 12,856 | | | | 304,304 | |
| Idemitsu Kosan Co., Ltd. | | | 30,827 | | | | 510,803 | |
| Imperial Oil Ltd. | | | 6,974 | | | | 300,438 | |
| JX Holdings, Inc. | | | 144,285 | | | | 562,118 | |
| Kinder Morgan, Inc. (b) | | | 2,935 | | | | 124,180 | |
| Marathon Oil Corp. | | | 3,103 | | | | 87,784 | |
| Marathon Petroleum Corp. | | | 3,621 | | | | 326,831 | |
| Murphy Oil Corp. | | | 2,806 | | | | 141,759 | |
| Occidental Petroleum Corp. | | | 5,169 | | | | 416,673 | |
| OMV AG | | | 10,626 | | | | 281,182 | |
| Origin Energy Ltd. | | | 152 | | | | 1,434 | |
| Pacific Rubiales Energy Corp. | | | 4,623 | | | | 28,610 | |
| Phillips 66 | | | 4,075 | | | | 292,178 | |
| Repsol SA | | | 5,901 | | | | 109,689 | |
| Royal Dutch Shell PLC "A" | | | 17,458 | | | | 578,671 | |
| Royal Dutch Shell PLC "B" | | | 14,953 | | | | 513,694 | |
| Showa Shell Sekiyu KK (b) | | | 54,039 | | | | 532,587 | |
| Spectra Energy Corp. | | | 3,448 | | | | 125,162 | |
| Statoil ASA | | | 6,006 | | | | 105,252 | |
| Suncor Energy, Inc. | | | 4,780 | | | | 151,818 | |
| Tesoro Corp. | | | 2,615 | | | | 194,425 | |
| TonenGeneral Sekiyu KK | | | 23,000 | | | | 196,614 | |
| Total SA | | | 5,089 | | | | 262,385 | |
| TransCanada Corp. | | | 2,273 | | | | 111,713 | |
| Valero Energy Corp. | | | 9,863 | | | | 488,219 | |
| Woodside Petroleum Ltd. | | | 2,606 | | | | 81,016 | |
| | | | | | | | 9,978,606 | |
| Financials 13.8% | |
| Banks 6.2% | |
| Aozora Bank Ltd. | | | 90,174 | | | | 279,859 | |
| Australia & New Zealand Banking Group Ltd. | | | 8,236 | | | | 214,241 | |
| Banco Bilbao Vizcaya Argentaria SA | | | 9,682 | | | | 91,122 | |
| Bank Hapoalim BM | | | 89,396 | | | | 421,612 | |
| Bank Leumi Le-Israel BM* | | | 156,186 | | | | 535,822 | |
| Bank of America Corp. | | | 18,553 | | | | 331,913 | |
| | | Shares | | | Value ($) | |
| | | | | | | | | |
| Bank of East Asia Ltd. | | | 21,938 | | | | 88,132 | |
| Bank of Montreal (b) | | | 5,328 | | | | 376,876 | |
| Bank of Nova Scotia | | | 5,646 | | | | 322,247 | |
| Barclays PLC | | | 38,749 | | | | 145,677 | |
| BB&T Corp. | | | 6,190 | | | | 240,729 | |
| Bendigo & Adelaide Bank Ltd. | | | 5,567 | | | | 57,858 | |
| BNP Paribas SA | | | 4,637 | | | | 272,490 | |
| BOC Hong Kong (Holdings) Ltd. | | | 93,627 | | | | 311,122 | |
| Canadian Imperial Bank of Commerce | | | 4,075 | | | | 350,188 | |
| CIT Group, Inc. | | | 5,582 | | | | 266,987 | |
| Citigroup, Inc. | | | 7,648 | | | | 413,833 | |
| Comerica, Inc. | | | 1,097 | | | | 51,383 | |
| Commonwealth Bank of Australia | | | 2,037 | | | | 141,470 | |
| Credit Agricole SA | | | 14,547 | | | | 187,012 | |
| Danske Bank AS | | | 11,160 | | | | 300,367 | |
| DBS Group Holdings Ltd. | | | 20,371 | | | | 314,578 | |
| Fifth Third Bancorp. | | | 20,603 | | | | 419,786 | |
| Hang Seng Bank Ltd. | | | 12,924 | | | | 214,893 | |
| HSBC Holdings PLC | | | 57,583 | | | | 544,187 | |
| Huntington Bancshares, Inc. | | | 17,000 | | | | 178,840 | |
| ING Groep NV (CVA)* | | | 3,416 | | | | 44,229 | |
| JPMorgan Chase & Co. | | | 6,967 | | | | 435,995 | |
| KeyCorp | | | 12,301 | | | | 170,984 | |
| Lloyds Banking Group PLC* | | | 166,742 | | | | 196,900 | |
| M&T Bank Corp. | | | 1,959 | | | | 246,090 | |
| Mitsubishi UFJ Financial Group, Inc. | | | 36,354 | | | | 199,261 | |
| Mizrahi Tefahot Bank Ltd.* | | | 15,580 | | | | 163,424 | |
| Mizuho Financial Group, Inc. | | | 238,273 | | | | 400,370 | |
| National Australia Bank Ltd. | | | 6,869 | | | | 187,162 | |
| National Bank of Canada (b) | | | 5,205 | | | | 221,497 | |
| Natixis SA | | | 12,868 | | | | 84,618 | |
| Nordea Bank AB | | | 21,868 | | | | 252,564 | |
| Oversea-Chinese Banking Corp., Ltd. | | | 25,855 | | | | 203,204 | |
| PNC Financial Services Group, Inc. | | | 4,780 | | | | 436,079 | |
| Regions Financial Corp. | | | 31,810 | | | | 335,914 | |
| Resona Holdings, Inc. | | | 47,156 | | | | 238,002 | |
| Royal Bank of Canada | | | 4,858 | | | | 335,519 | |
| Royal Bank of Scotland Group PLC* | | | 34,496 | | | | 209,409 | |
| Shinsei Bank Ltd. | | | 74,000 | | | | 129,190 | |
| Skandinaviska Enskilda Banken AB "A" | | | 13,319 | | | | 168,479 | |
| Societe Generale | | | 6,354 | | | | 267,003 | |
| Standard Chartered PLC | | | 28,317 | | | | 424,670 | |
| Sumitomo Mitsui Financial Group, Inc. | | | 5,407 | | | | 195,368 | |
| SunTrust Banks, Inc. | | | 9,077 | | | | 380,326 | |
| Svenska Handelsbanken AB "A" | | | 1,488 | | | | 69,479 | |
| Swedbank AB "A" | | | 8,410 | | | | 209,266 | |
| The Bank of Yokohama Ltd. | | | 2,744 | | | | 14,893 | |
| The Chugoku Bank Ltd. | | | 7,600 | | | | 103,773 | |
| The Toronto-Dominion Bank (b) | | | 8,229 | | | | 393,176 | |
| U.S. Bancorp. | | | 8,070 | | | | 362,746 | |
| United Overseas Bank Ltd. | | | 9,402 | | | | 173,823 | |
| Wells Fargo & Co. | | | 10,969 | | | | 601,321 | |
| Westpac Banking Corp. | | | 6,452 | | | | 173,454 | |
| Yamaguchi Financial Group, Inc. | | | 18,021 | | | | 185,650 | |
| | | | | | | | 15,287,062 | |
| Capital Markets 0.6% | |
| 3i Group PLC | | | 33,208 | | | | 230,790 | |
| Ameriprise Financial, Inc. | | | 627 | | | | 82,921 | |
| | | Shares | | | Value ($) | |
| | | | | | | | | |
| Bank of New York Mellon Corp. | | | 3,369 | | | | 136,680 | |
| BlackRock, Inc. | | | 314 | | | | 112,274 | |
| Credit Suisse Group AG (Registered) | | | 6,854 | | | | 171,822 | |
| Morgan Stanley | | | 8,070 | | | | 313,116 | |
| State Street Corp. | | | 1,724 | | | | 135,334 | |
| The Goldman Sachs Group, Inc. | | | 1,097 | | | | 212,631 | |
| | | | | | | | 1,395,568 | |
| Consumer Finance 0.4% | |
| Ally Financial, Inc.* | | | 19,200 | | | | 453,504 | |
| American Express Co. | | | 549 | | | | 51,079 | |
| Capital One Financial Corp. | | | 3,526 | | | | 291,071 | |
| Discover Financial Services | | | 1,959 | | | | 128,295 | |
| Navient Corp. | | | 9,100 | | | | 196,651 | |
| | | | | | | | 1,120,600 | |
| Diversified Financial Services 0.5% | |
| Berkshire Hathaway, Inc. "B"* | | | 1,534 | | | | 230,330 | |
| CME Group, Inc. | | | 2,038 | | | | 180,669 | |
| EXOR SpA | | | 5,932 | | | | 242,010 | |
| Intercontinental Exchange, Inc. | | | 314 | | | | 68,857 | |
| Investor AB "B" | | | 6,167 | | | | 223,488 | |
| Leucadia National Corp. | | | 627 | | | | 14,057 | |
| Pargesa Holding SA (Bearer) | | | 1,698 | | | | 130,802 | |
| The NASDAQ OMX Group, Inc. | | | 1,176 | | | | 56,401 | |
| Voya Financial, Inc. | | | 4,800 | | | | 203,424 | |
| | | | | | | | 1,350,038 | |
| Insurance 5.1% | |
| ACE Ltd. | | | 3,526 | | | | 405,067 | |
| Aegon NV | | | 60,006 | | | | 450,225 | |
| Aflac, Inc. | | | 4,578 | | | | 279,670 | |
| Ageas | | | 3,743 | | | | 132,741 | |
| Alleghany Corp.* | | | 471 | | | | 218,309 | |
| Allianz SE (Registered) | | | 1,307 | | | | 217,163 | |
| Allstate Corp. | | | 6,582 | | | | 462,386 | |
| American International Group, Inc. | | | 7,444 | | | | 416,938 | |
| Aon PLC | | | 471 | | | | 44,665 | |
| Arch Capital Group Ltd.* | | | 2,586 | | | | 152,833 | |
| Assurant, Inc. | | | 3,134 | | | | 214,460 | |
| AXA SA | | | 10,958 | | | | 253,092 | |
| Axis Capital Holdings Ltd. | | | 7,914 | | | | 404,326 | |
| Baloise Holding AG (Registered) | | | 1,623 | | | | 207,282 | |
| Chubb Corp. | | | 3,213 | | | | 332,449 | |
| CNP Assurances | | | 6,858 | | | | 121,440 | |
| Delta Lloyd NV | | | 10,049 | | | | 220,854 | |
| Direct Line Insurance Group PLC | | | 30,764 | | | | 138,756 | |
| Everest Re Group Ltd. | | | 2,269 | | | | 386,411 | |
| FNF Group | | | 4,700 | | | | 161,915 | |
| Great-West Lifeco, Inc. | | | 4,466 | | | | 129,121 | |
| Hannover Rueck SE | | | 2,286 | | | | 207,356 | |
| Hartford Financial Services Group, Inc. | | | 6,626 | | | | 276,238 | |
| Insurance Australia Group Ltd. | | | 2,518 | | | | 12,766 | |
| Intact Financial Corp. | | | 3,134 | | | | 226,189 | |
| Legal & General Group PLC | | | 1,991 | | | | 7,647 | |
| Lincoln National Corp. | | | 4,351 | | | | 250,922 | |
| Loews Corp. | | | 5,877 | | | | 246,952 | |
| Manulife Financial Corp. | | | 4,100 | | | | 78,273 | |
| Mapfre SA | | | 24,168 | | | | 81,387 | |
| Marsh & McLennan Companies, Inc. | | | 1,097 | | | | 62,792 | |
| MetLife, Inc. | | | 6,836 | | | | 369,759 | |
Muenchener Rueckversicherungs- Gesellschaft AG (Registered) | | | 1,302 | | | | 260,845 | |
| | | Shares | | | Value ($) | |
| | | | | | | | | |
| NN Group NV* | | | 7,530 | | | | 224,375 | |
| Old Mutual PLC | | | 11,627 | | | | 34,194 | |
| PartnerRe Ltd. | | | 3,706 | | | | 422,966 | |
| Power Corp. of Canada | | | 7,229 | | | | 197,618 | |
| Power Financial Corp. | | | 4,075 | | | | 126,901 | |
| Principal Financial Group, Inc. | | | 1,097 | | | | 56,978 | |
| Progressive Corp. | | | 4,936 | | | | 133,223 | |
| Prudential Financial, Inc. | | | 2,351 | | | | 212,671 | |
| RenaissanceRe Holdings Ltd. (b) | | | 3,526 | | | | 342,798 | |
| Sampo Oyj "A" | | | 3,489 | | | | 163,598 | |
| SCOR SE | | | 8,888 | | | | 268,975 | |
| Suncorp Group Ltd. | | | 22,938 | | | | 261,382 | |
| Swiss Life Holding AG (Registered) | | | 1,932 | | | | 456,559 | |
| Swiss Re AG. | | | 5,222 | | | | 436,942 | |
| The Travelers Companies, Inc. | | | 3,918 | | | | 414,720 | |
| Tokio Marine Holdings, Inc. | | | 4,300 | | | | 139,641 | |
| Torchmark Corp. | | | 2,821 | | | | 152,814 | |
| Unum Group | | | 7,757 | | | | 270,564 | |
| W.R. Berkley Corp. | | | 5,015 | | | | 257,069 | |
| XL Group PLC | | | 6,504 | | | | 223,543 | |
| Zurich Insurance Group AG | | | 1,371 | | | | 429,319 | |
| | | | | | | | 12,658,079 | |
| Real Estate Investment Trusts 0.3% | |
| Dexus Property Group (REIT) | | | 12,966 | | | | 73,319 | |
| Federation Centres (REIT) | | | 44,060 | | | | 102,544 | |
| GPT Group (REIT) | | | 19,958 | | | | 70,511 | |
| H&R Real Estate Investment Trust (REIT) (Units) | | | 5,686 | | | | 106,349 | |
| Novion Property Group (REIT) | | | 49,808 | | | | 85,749 | |
| RioCan Real Estate Investment Trust (REIT) | | | 4,858 | | | | 110,516 | |
| Scentre Group (REIT)* | | | 47,534 | | | | 135,165 | |
| Westfield Corp. (REIT) | | | 23,967 | | | | 175,228 | |
| | | | | | | | 859,381 | |
| Real Estate Management & Development 0.5% | |
| Cheung Kong (Holdings) Ltd. | | | 4,670 | | | | 78,044 | |
| First Capital Realty, Inc. | | | 6,425 | | | | 103,194 | |
| Henderson Land Development Co., Ltd. | | | 14,774 | | | | 102,364 | |
| New World Development Co., Ltd. | | | 47,793 | | | | 54,667 | |
| Sun Hung Kai Properties Ltd. | | | 12,536 | | | | 189,562 | |
| Swire Pacific Ltd. "A" | | | 13,320 | | | | 172,550 | |
| Swiss Prime Site AG (Registered) | | | 3,231 | | | | 236,741 | |
| Wharf Holdings Ltd. | | | 7,835 | | | | 56,265 | |
| Wheelock & Co., Ltd. | | | 41,103 | | | | 190,845 | |
| | | | | | | | 1,184,232 | |
| Thrifts & Mortgage Finance 0.2% | |
| New York Community Bancorp., Inc. (b) | | | 10,499 | | | | 167,984 | |
| People's United Financial, Inc. | | | 14,025 | | | | 212,899 | |
| | | | | | | | 380,883 | |
| Health Care 4.5% | |
| Biotechnology 1.0% | |
| Actelion Ltd. (Registered) | | | 584 | | | | 67,188 | |
| Alexion Pharmaceuticals, Inc.* | | | 941 | | | | 174,113 | |
| Amgen, Inc. | | | 2,283 | | | | 363,659 | |
| Biogen Idec, Inc.* | | | 1,127 | | | | 382,560 | |
| Celgene Corp.* | | | 4,142 | | | | 463,324 | |
| CSL Ltd. | | | 4,391 | | | | 309,175 | |
| Gilead Sciences, Inc.* | | | 4,914 | | | | 463,194 | |
| Regeneron Pharmaceuticals, Inc.* | | | 500 | | | | 205,125 | |
| | | | | | | | 2,428,338 | |
| | | Shares | | | Value ($) | |
| | | | | | | | | |
| Health Care Equipment & Supplies 0.4% | |
| Abbott Laboratories | | | 5,642 | | | | 254,003 | |
| Baxter International, Inc. | | | 2,664 | | | | 195,244 | |
| Becton, Dickinson & Co. | | | 862 | | | | 119,956 | |
| Medtronic, Inc. | | | 3,683 | | | | 265,913 | |
| Stryker Corp. | | | 1,190 | | | | 112,253 | |
| Zimmer Holdings, Inc. | | | 549 | | | | 62,267 | |
| | | | | | | | 1,009,636 | |
| Health Care Providers & Services 1.1% | |
| Aetna, Inc. | | | 3,918 | | | | 348,036 | |
| AmerisourceBergen Corp. | | | 1,411 | | | | 127,216 | |
| Anthem, Inc. | | | 2,553 | | | | 320,835 | |
| Cardinal Health, Inc. | | | 1,959 | | | | 158,150 | |
| CIGNA Corp. | | | 2,508 | | | | 258,098 | |
| Express Scripts Holding Co.* | | | 3,134 | | | | 265,356 | |
| HCA Holdings, Inc.* | | | 1,213 | | | | 89,022 | |
| Humana, Inc. | | | 894 | | | | 128,405 | |
| Laboratory Corp. of America Holdings* | | | 862 | | | | 93,010 | |
| McKesson Corp. | | | 1,019 | | | | 211,524 | |
| Omnicare, Inc. | | | 941 | | | | 68,627 | |
| Quest Diagnostics, Inc. | | | 4,231 | | | | 283,731 | |
| UnitedHealth Group, Inc. | | | 3,201 | | | | 323,589 | |
| | | | | | | | 2,675,599 | |
| Life Sciences Tools & Services 0.1% | |
| Thermo Fisher Scientific, Inc. | | | 2,038 | | | | 255,341 | |
| Pharmaceuticals 1.9% | |
| AbbVie, Inc. | | | 2,741 | | | | 179,371 | |
| Actavis PLC* | | | 1,019 | | | | 262,301 | |
| Allergan, Inc. | | | 1,000 | | | | 212,590 | |
| AstraZeneca PLC | | | 1,718 | | | | 120,854 | |
| Bristol-Myers Squibb Co. | | | 3,369 | | | | 198,872 | |
| Eli Lilly & Co. | | | 3,213 | | | | 221,665 | |
| GlaxoSmithKline PLC | | | 11,399 | | | | 243,882 | |
| Indivior PLC* | | | 1,733 | | | | 4,035 | |
| Jazz Pharmaceuticals PLC* | | | 1,100 | | | | 180,103 | |
| Johnson & Johnson | | | 3,605 | | | | 376,975 | |
| Mallinckrodt PLC* | | | 4,000 | | | | 396,120 | |
| Merck & Co., Inc. | | | 5,563 | | | | 315,923 | |
| Mylan, Inc.* | | | 1,176 | | | | 66,291 | |
| Novartis AG (Registered) | | | 3,719 | | | | 342,027 | |
| Novo Nordisk AS ''B" | | | 3,854 | | | | 163,069 | |
| Perrigo Co. PLC | | | 392 | | | | 65,527 | |
| Pfizer, Inc. | | | 13,555 | | | | 422,238 | |
| Roche Holding AG (Genusschein) | | | 1,112 | | | | 301,397 | |
| Sanofi | | | 1,531 | | | | 139,529 | |
| Teva Pharmaceutical Industries Ltd. | | | 5,337 | | | | 306,633 | |
| Valeant Pharmaceuticals International, Inc.* | | | 1,200 | | | | 171,799 | |
| | | | | | | | 4,691,201 | |
| Industrials 5.1% | |
| Aerospace & Defense 0.7% | |
| BAE Systems PLC | | | 11,961 | | | | 87,316 | |
| Boeing Co. | | | 1,489 | | | | 193,540 | |
| General Dynamics Corp. | | | 67 | | | | 9,220 | |
| Honeywell International, Inc. | | | 2,821 | | | | 281,874 | |
| L-3 Communications Holdings, Inc. | | | 281 | | | | 35,465 | |
| Lockheed Martin Corp. | | | 767 | | | | 147,701 | |
| Northrop Grumman Corp. | | | 938 | | | | 138,252 | |
| Precision Castparts Corp. | | | 627 | | | | 151,032 | |
| Raytheon Co. | | | 2,664 | | | | 288,165 | |
| Rockwell Collins, Inc. | | | 941 | | | | 79,496 | |
| | | Shares | | | Value ($) | |
| | | | | | | | | |
| Thales SA | | | 506 | | | | 27,302 | |
| United Technologies Corp. | | | 2,586 | | | | 297,390 | |
| | | | | | | | 1,736,753 | |
| Air Freight & Logistics 0.2% | |
| FedEx Corp. | | | 784 | | | | 136,149 | |
| Royal Mail PLC | | | 23,937 | | | | 159,394 | |
| United Parcel Service, Inc. "B" | | | 1,176 | | | | 130,736 | |
| | | | | | | | 426,279 | |
| Airlines 0.9% | |
| American Airlines Group, Inc. | | | 1,500 | | | | 80,445 | |
| ANA Holdings, Inc. | | | 59,000 | | | | 145,221 | |
| Cathay Pacific Airways Ltd. | | | 123,791 | | | | 269,046 | |
| Delta Air Lines, Inc. | | | 6,644 | | | | 326,818 | |
| Deutsche Lufthansa AG (Registered) | | | 22,684 | | | | 379,884 | |
| easyJet PLC | | | 3,918 | | | | 101,129 | |
| Japan Airlines Co., Ltd. | | | 14,700 | | | | 429,396 | |
| Singapore Airlines Ltd. | | | 6,474 | | | | 56,573 | |
| Southwest Airlines Co. | | | 9,753 | | | | 412,747 | |
| United Continental Holdings, Inc.* | | | 2,209 | | | | 147,760 | |
| | | | | | | | 2,349,019 | |
| Building Products 0.0% | |
| Congoleum Corp.* | | | 3,800 | | | | 0 | |
| Commercial Services & Supplies 0.2% | |
| G4S PLC | | | 30 | | | | 129 | |
| Quad Graphics, Inc. | | | 13 | | | | 298 | |
| Republic Services, Inc. | | | 5,171 | | | | 208,133 | |
| Tyco International PLC | | | 2,351 | | | | 103,115 | |
| Waste Management, Inc. | | | 2,194 | | | | 112,596 | |
| | | | | | | | 424,271 | |
| Electrical Equipment 0.2% | |
| ABB Ltd. (Registered) | | | 8,638 | | | | 182,709 | |
| AMETEK, Inc. | | | 1,332 | | | | 70,103 | |
| Eaton Corp. PLC | | | 421 | | | | 28,611 | |
| Emerson Electric Co. | | | 2,273 | | | | 140,312 | |
| | | | | | | | 421,735 | |
| Industrial Conglomerates 0.5% | |
| 3M Co. | | | 824 | | | | 135,400 | |
| Danaher Corp. | | | 2,664 | | | | 228,331 | |
| General Electric Co. | | | 9,038 | | | | 228,390 | |
| Hutchison Whampoa Ltd. | | | 18,021 | | | | 206,547 | |
| Keppel Corp., Ltd. | | | 21,000 | | | | 140,126 | |
| Roper Industries, Inc. | | | 862 | | | | 134,774 | |
| Sembcorp Industries Ltd. | | | 21,938 | | | | 73,568 | |
| Siemens AG (Registered) | | | 1,248 | | | | 141,536 | |
| | | | | | | | 1,288,672 | |
| Machinery 0.5% | |
| AGCO Corp. | | | 3,761 | | | | 169,997 | |
| Caterpillar, Inc. | | | 862 | | | | 78,899 | |
| Deere & Co. | | | 3,996 | | | | 353,526 | |
| Illinois Tool Works, Inc. | | | 549 | | | | 51,990 | |
| PACCAR, Inc. | | | 1,254 | | | | 85,284 | |
| Schindler Holding AG (Registered) | | | 503 | | | | 72,144 | |
| SKF AB "B" | | | 29 | | | | 610 | |
| Stanley Black & Decker, Inc. | | | 1,332 | | | | 127,979 | |
| Yangzijiang Shipbuilding Holdings Ltd. | | | 286,107 | | | | 259,837 | |
| | | | | | | | 1,200,266 | |
| Marine 0.5% | |
| A P Moller-Maersk AS "A" | | | 219 | | | | 419,024 | |
| A P Moller-Maersk AS "B" | | | 186 | | | | 369,714 | |
| | | Shares | | | Value ($) | |
| | | | | | | | | |
| Mitsui O.S.K Lines Ltd. | | | 40,000 | | | | 118,817 | |
| Nippon Yusen Kabushiki Kaisha | | | 83,050 | | | | 234,903 | |
| | | | | | | | 1,142,458 | |
| Professional Services 0.1% | |
| Adecco SA (Registered) | | | 393 | | | | 26,922 | |
| Nielsen NV | | | 4,145 | | | | 185,406 | |
| | | | | | | | 212,328 | |
| Road & Rail 0.3% | |
| Canadian National Railway Co. | | | 236 | | | | 16,255 | |
| CSX Corp. | | | 3,840 | | | | 139,123 | |
| East Japan Railway Co. | | | 1,097 | | | | 82,188 | |
| MTR Corp., Ltd. | | | 27,814 | | | | 113,598 | |
| Norfolk Southern Corp. | | | 862 | | | | 94,484 | |
| Union Pacific Corp. | | | 2,194 | | | | 261,371 | |
| West Japan Railway Co. | | | 3,761 | | | | 178,219 | |
| | | | | | | | 885,238 | |
| Trading Companies & Distributors 1.0% | |
| ITOCHU Corp. | | | 41,839 | | | | 447,328 | |
| Marubeni Corp. | | | 100,549 | | | | 602,720 | |
| Mitsubishi Corp. | | | 23,428 | | | | 429,667 | |
| Mitsui & Co., Ltd. | | | 39,851 | | | | 532,735 | |
| Sumitomo Corp. | | | 29,466 | | | | 302,645 | |
| W.W. Grainger, Inc. | | | 627 | | | | 159,816 | |
| | | | | | | | 2,474,911 | |
| Information Technology 6.1% | |
| Communications Equipment 0.9% | |
| Cisco Systems, Inc. | | | 17,899 | | | | 497,861 | |
| Harris Corp. | | | 3,369 | | | | 241,962 | |
| Juniper Networks, Inc. | | | 7,764 | | | | 173,292 | |
| Motorola Solutions, Inc. | | | 2,990 | | | | 200,569 | |
| Nokia Oyj | | | 19,776 | | | | 155,648 | |
| QUALCOMM, Inc. | | | 8,070 | | | | 599,843 | |
| Telefonaktiebolaget LM Ericsson "B" | | | 19,294 | | | | 233,668 | |
| | | | | | | | 2,102,843 | |
| Electronic Equipment, Instruments & Components 0.5% | |
| Amphenol Corp. "A" | | | 1,568 | | | | 84,374 | |
| Arrow Electronics, Inc.* | | | 2,528 | | | | 146,346 | |
| Avnet, Inc. | | | 6,660 | | | | 286,513 | |
| Corning, Inc. | | | 9,440 | | | | 216,459 | |
| Flextronics International Ltd.* | | | 14,608 | | | | 163,318 | |
| Hitachi Ltd. | | | 5,485 | | | | 40,135 | |
| Murata Manufacturing Co., Ltd. | | | 706 | | | | 77,119 | |
| TE Connectivity Ltd. | | | 4,388 | | | | 277,541 | |
| | | | | | | | 1,291,805 | |
| Internet Software & Services 0.5% | |
| eBay, Inc.* | | | 2,942 | | | | 165,105 | |
| Facebook, Inc. "A"* | | | 5,469 | | | | 426,691 | |
| Google, Inc. "A"* | | | 792 | | | | 420,283 | |
| Google, Inc. "C"* | | | 484 | | | | 254,778 | |
| LinkedIn Corp. "A"* | | | 127 | | | | 29,173 | |
| VeriSign, Inc.* (b) | | | 521 | | | | 29,697 | |
| | | | | | | | 1,325,727 | |
| IT Services 1.8% | |
| Accenture PLC "A" | | | 4,075 | | | | 363,938 | |
| Alliance Data Systems Corp.* | | | 549 | | | | 157,041 | |
| AtoS | | | 1,677 | | | | 132,706 | |
| Automatic Data Processing, Inc. | | | 3,232 | | | | 269,452 | |
| CGI Group, Inc. "A"* | | | 4,701 | | | | 179,211 | |
| Cognizant Technology Solutions Corp. "A"* | | | 3,291 | | | | 173,304 | |
| | | Shares | | | Value ($) | |
| | | | | | | | | |
| Computer Sciences Corp. | | | 3,840 | | | | 242,112 | |
| Fidelity National Information Services, Inc. | | | 5,798 | | | | 360,636 | |
| Fiserv, Inc.* | | | 3,761 | | | | 266,918 | |
| Fujitsu Ltd. | | | 26,000 | | | | 138,498 | |
| International Business Machines Corp. | | | 3,056 | | | | 490,305 | |
| Itochu Techno-Solutions Corp. | | | 627 | | | | 22,217 | |
| MasterCard, Inc. "A" | | | 3,134 | | | | 270,025 | |
| Nomura Research Institute Ltd. | | | 1,803 | | | | 55,363 | |
| Paychex, Inc. | | | 3,056 | | | | 141,096 | |
| Total System Services, Inc. | | | 5,250 | | | | 178,290 | |
| Vantiv, Inc. "A"* | | | 3,369 | | | | 114,277 | |
| Visa, Inc. "A" (b) | | | 1,046 | | | | 274,261 | |
| Western Union Co. (b) | | | 12,458 | | | | 223,123 | |
| Xerox Corp. | | | 22,704 | | | | 314,677 | |
| | | | | | | | 4,367,450 | |
| Semiconductors & Semiconductor Equipment 0.6% | |
| Analog Devices, Inc. | | | 2,586 | | | | 143,575 | |
| ASML Holding NV | | | 15 | | | | 1,607 | |
| Avago Technologies Ltd. | | | 1,646 | | | | 165,571 | |
| Broadcom Corp. "A" | | | 1,409 | | | | 61,052 | |
| Intel Corp. | | | 10,673 | | | | 387,323 | |
| KLA-Tencor Corp. | | | 456 | | | | 32,066 | |
| Lam Research Corp. | | | 64 | | | | 5,078 | |
| Marvell Technology Group Ltd. | | | 4,623 | | | | 67,033 | |
| Maxim Integrated Products, Inc. | | | 4,388 | | | | 139,846 | |
| Microchip Technology, Inc. (b) | | | 3,291 | | | | 148,457 | |
| Micron Technology, Inc.* | | | 6,093 | | | | 213,316 | |
| Texas Instruments, Inc. | | | 1,646 | | | | 88,003 | |
| | | | | | | | 1,452,927 | |
| Software 0.9% | |
| Activision Blizzard, Inc. | | | 10,127 | | | | 204,059 | |
| ANSYS, Inc.* | | | 784 | | | | 64,288 | |
| CA, Inc. | | | 7,236 | | | | 220,336 | |
| GungHo Online Entertainment, Inc.* | | | 10,734 | | | | 39,129 | |
| Intuit, Inc. | | | 1,034 | | | | 95,324 | |
| Microsoft Corp. | | | 10,949 | | | | 508,581 | |
| Nexon Co., Ltd. | | | 3,794 | | | | 35,376 | |
| NICE Systems Ltd. | | | 2,086 | | | | 105,596 | |
| Oracle Corp. | | | 10,813 | | | | 486,261 | |
| SAP SE | | | 751 | | | | 53,100 | |
| Symantec Corp. | | | 8,041 | | | | 206,292 | |
| Synopsys, Inc.* | | | 5,407 | | | | 235,042 | |
| The Sage Group PLC | | | 1,325 | | | | 9,555 | |
| VMware, Inc. "A"* | | | 784 | | | | 64,696 | |
| | | | | | | | 2,327,635 | |
| Technology Hardware, Storage & Peripherals 0.9% | |
| Apple, Inc. | | | 6,278 | | | | 692,966 | |
| Canon, Inc. | | | 6,974 | | | | 221,507 | |
| EMC Corp. | | | 8,058 | | | | 239,645 | |
| Hewlett-Packard Co. | | | 9,206 | | | | 369,437 | |
| NetApp, Inc. | | | 2,586 | | | | 107,190 | |
| Ricoh Co., Ltd. | | | 12,047 | | | | 122,381 | |
| Seagate Technology PLC | | | 3,683 | | | | 244,919 | |
| Western Digital Corp. | | | 1,959 | | | | 216,861 | |
| | | | | | | | 2,214,906 | |
| Materials 1.7% | |
| Chemicals 0.7% | |
| Asahi Kasei Corp. | | | 19,219 | | | | 176,130 | |
| Ashland, Inc. | | | 862 | | | | 103,233 | |
| | | Shares | | | Value ($) | |
| | | | | | | | | |
| BASF SE | | | 8 | | | | 676 | |
| CF Industries Holdings, Inc. | | | 236 | | | | 64,319 | |
| Dow Chemical Co. | | | 3,784 | | | | 172,588 | |
| E.I. du Pont de Nemours & Co. | | | 1,489 | | | | 110,097 | |
| Ecolab, Inc. | | | 392 | | | | 40,972 | |
| Israel Chemicals Ltd. | | | 17,163 | | | | 123,796 | |
| LyondellBasell Industries NV "A" | | | 2,873 | | | | 228,088 | |
| Mitsubishi Gas Chemical Co., Inc. | | | 28,000 | | | | 140,657 | |
| Monsanto Co. | | | 1,019 | | | | 121,740 | |
| Praxair, Inc. | | | 549 | | | | 71,129 | |
| Solvay SA | | | 986 | | | | 133,200 | |
| Sumitomo Chemical Co., Ltd. | | | 41,000 | | | | 162,329 | |
| Syngenta AG (Registered) | | | 306 | | | | 98,257 | |
| | | | | | | | 1,747,211 | |
| Construction Materials 0.1% | |
| Fletcher Building Ltd. | | | 8,805 | | | | 56,792 | |
| Holcim Ltd. (Registered) | | | 3,225 | | | | 229,007 | |
| | | | | | | | 285,799 | |
| Containers & Packaging 0.1% | |
| Rock-Tenn Co. "A" | | | 2,356 | | | | 143,669 | |
| Metals & Mining 0.7% | |
| Anglo American PLC | | | 6,850 | | | | 126,738 | |
| Barrick Gold Corp. | | | 15,984 | | | | 172,250 | |
| BHP Billiton Ltd. | | | 1,942 | | | | 46,081 | |
| BHP Billiton PLC | | | 3,311 | | | | 70,822 | |
| Freeport-McMoRan, Inc. | | | 3,000 | | | | 70,080 | |
| Glencore PLC | | | 26,125 | | | | 120,247 | |
| Goldcorp, Inc. | | | 5,485 | | | | 101,551 | |
| JFE Holdings, Inc. | | | 3,600 | | | | 80,130 | |
| Mitsubishi Materials Corp. | | | 18,804 | | | | 62,509 | |
| Newmont Mining Corp. | | | 17,883 | | | | 337,989 | |
| Nippon Steel & Sumitomo Metal Corp. | | | 53,000 | | | | 131,531 | |
| Nucor Corp. | | | 4,075 | | | | 199,879 | |
| Rio Tinto PLC | | | 3,478 | | | | 160,240 | |
| Silver Wheaton Corp. | | | 9,011 | | | | 183,276 | |
| | | | | | | | 1,863,323 | |
| Paper & Forest Products 0.1% | |
| International Paper Co. | | | 2,874 | | | | 153,989 | |
| Telecommunication Services 2.8% | |
| Diversified Telecommunication Services 2.4% | |
| AT&T, Inc. | | | 18,726 | | | | 629,006 | |
| BCE, Inc. | | | 7,365 | | | | 337,758 | |
| Belgacom SA | | | 1,992 | | | | 72,130 | |
| BT Group PLC | | | 57,981 | | | | 359,921 | |
| CenturyLink, Inc. | | | 5,691 | | | | 225,250 | |
| Deutsche Telekom AG (Registered) | | | 10,731 | | | | 171,999 | |
| Elisa Oyj | | | 800 | | | | 21,773 | |
| HKT Trust & HKT Ltd. (Units) | | | 147,000 | | | | 190,887 | |
| Inmarsat PLC | | | 11,052 | | | | 136,961 | |
| Nippon Telegraph & Telephone Corp. | | | 10,383 | | | | 534,289 | |
| Orange SA | | | 11,104 | | | | 188,838 | |
| PCCW Ltd. | | | 254,633 | | | | 174,120 | |
| Singapore Telecommunications Ltd. | | | 76,045 | | | | 223,060 | |
| Spark New Zealand Ltd. | | | 56,978 | | | | 138,053 | |
| Swisscom AG (Registered) | | | 606 | | | | 318,211 | |
| TDC AS | | | 33,026 | | | | 251,680 | |
| Telecom Italia SpA (RSP) | | | 248,767 | | | | 207,928 | |
| Telefonica SA | | | 14,181 | | | | 202,845 | |
| Telenor ASA | | | 8,848 | | | | 178,405 | |
| | | Shares | | | Value ($) | |
| | | | | | | | | |
| TeliaSonera AB | | | 52,444 | | | | 337,265 | |
| Telstra Corp., Ltd. | | | 66,244 | | | | 321,694 | |
| TELUS Corp. | | | 7,287 | | | | 262,741 | |
| Verizon Communications, Inc. | | | 10,902 | | | | 509,996 | |
| | | | | | | | 5,994,810 | |
| Wireless Telecommunication Services 0.4% | |
| KDDI Corp. | | | 4,780 | | | | 299,086 | |
| Millicom International Cellular SA (SDR) | | | 1,478 | | | | 109,920 | |
| NTT DoCoMo, Inc. | | | 16,169 | | | | 236,684 | |
| Rogers Communications, Inc. "B" (b) | | | 6,503 | | | | 252,832 | |
| SoftBank Corp. | | | 471 | | | | 28,031 | |
| Vodafone Group PLC | | | 36,381 | | | | 124,658 | |
| | | | | | | | 1,051,211 | |
| Utilities 4.5% | |
| Electric Utilities 2.3% | |
| American Electric Power Co., Inc. | | | 4,388 | | | | 266,439 | |
| Cheung Kong Infrastructure Holdings Ltd. | | | 51,556 | | | | 380,940 | |
| CLP Holdings Ltd. | | | 36,469 | | | | 316,462 | |
| Duke Energy Corp. | | | 5,407 | | | | 451,701 | |
| E.ON SE | | | 3,110 | | | | 53,405 | |
| Edison International | | | 3,056 | | | | 200,107 | |
| EDP — Energias de Portugal SA | | | 53,479 | | | | 206,826 | |
| Electricite de France SA | | | 10,019 | | | | 275,110 | |
| Enel SpA | | | 13,335 | | | | 59,624 | |
| Entergy Corp. | | | 2,971 | | | | 259,903 | |
| Exelon Corp. | | | 10,603 | | | | 393,159 | |
| FirstEnergy Corp. | | | 4,936 | | | | 192,455 | |
| Fortum Oyj | | | 12,885 | | | | 278,437 | |
| Iberdrola SA | | | 14,717 | | | | 99,019 | |
| NextEra Energy, Inc. | | | 2,743 | | | | 291,554 | |
| Northeast Utilities | | | 3,369 | | | | 180,309 | |
| OGE Energy Corp. | | | 6,660 | | | | 236,297 | |
| Pepco Holdings, Inc. | | | 5,200 | | | | 140,036 | |
| Pinnacle West Capital Corp. | | | 2,555 | | | | 174,532 | |
| Power Assets Holdings Ltd. | | | 36,747 | | | | 354,762 | |
| PPL Corp. | | | 6,112 | | | | 222,049 | |
| Southern Co. | | | 6,245 | | | | 306,692 | |
| SSE PLC | | | 7,389 | | | | 185,498 | |
| Tokyo Electric Power Co., Inc.* | | | 17,300 | | | | 70,495 | |
| Xcel Energy, Inc. | | | 6,738 | | | | 242,029 | |
| | | | | | | | 5,837,840 | |
| Gas Utilities 0.1% | |
| Enagas SA | | | 22 | | | | 696 | |
| Osaka Gas Co., Ltd. | | | 31,000 | | | | 115,866 | |
| Tokyo Gas Co., Ltd. | | | 22,000 | | | | 118,716 | |
| | | | | | | | 235,278 | |
| Independent Power & Renewable Eletricity Producers 0.3% | |
| AES Corp. | | | 7,914 | | | | 108,976 | |
| Calpine Corp.* | | | 15,500 | | | | 343,015 | |
| Electric Power Development Co., Ltd. | | | 2,602 | | | | 88,072 | |
| Meridian Energy Ltd. | | | 132,189 | | | | 181,237 | |
| | | | | | | | 721,300 | |
| Multi-Utilities 1.7% | |
| AGL Energy Ltd. | | | 20,375 | | | | 221,497 | |
| Alliant Energy Corp. | | | 2,508 | | | | 166,581 | |
| Ameren Corp. | | | 5,955 | | | | 274,704 | |
| Atco Ltd. "I" | | | 3,000 | | | | 123,068 | |
| CenterPoint Energy, Inc. | | | 8,900 | | | | 208,527 | |
| | | Shares | | | Value ($) | |
| | | | | | | | | |
| Centrica PLC | | | 42,247 | | | | 181,829 | |
| CMS Energy Corp. | | | 2,664 | | | | 92,574 | |
| Consolidated Edison, Inc. | | | 4,310 | | | | 284,503 | |
| Dominion Resources, Inc. | | | 3,291 | | | | 253,078 | |
| DTE Energy Co. | | | 2,194 | | | | 189,496 | |
| GDF Suez | | | 5,853 | | | | 136,699 | |
| Integrys Energy Group, Inc. | | | 3,045 | | | | 237,053 | |
| National Grid PLC | | | 19,631 | | | | 279,856 | |
| NiSource, Inc. | | | 5,250 | | | | 222,705 | |
| PG&E Corp. | | | 6,738 | | | | 358,731 | |
| Public Service Enterprise Group, Inc. | | | 5,720 | | | | 236,865 | |
| SCANA Corp. | | | 3,605 | | | | 217,742 | |
| Sempra Energy | | | 1,567 | | | | 174,501 | |
| Wisconsin Energy Corp. (b) | | | 5,132 | | | | 270,662 | |
| | | | | | | | 4,130,671 | |
| Water Utilities 0.1% | |
| American Water Works Co., Inc. | | | 2,803 | | | | 149,400 | |
Total Common Stocks (Cost $118,757,854) | | | | 131,358,991 | |
| | |
| Preferred Stocks 0.6% | |
| Consumer Discretionary 0.6% | |
| Bayerische Motoren Werke (BMW) AG | | | 4,148 | | | | 340,432 | |
| Porsche Automobil Holding SE | | | 7,216 | | | | 586,307 | |
| Volkswagen AG | | | 1,914 | | | | 427,534 | |
| | | | | | | | 1,354,273 | |
| Financials 0.0% | |
| Ally Financial, Inc. Series G, 144A, 7.0% | | | 75 | | | | 75,345 | |
Total Preferred Stocks (Cost $1,470,243) | | | | 1,429,618 | |
| | |
| Rights 0.0% | |
| Energy 0.0% | |
| Repsol SA, Expiration Date 1/8/2015* | | | 5,901 | | | | 3,263 | |
| Financials 0.0% | |
| Banco Bilbao Vizcaya Argentaria SA, Expiration Date 1/7/2015* | | | 9,682 | | | | 926 | |
Total Rights (Cost $1,049) | | | | 4,189 | |
| | |
| Warrants 0.0% | |
| Materials | |
| GEO Specialty Chemicals, Inc., Expiration Date 3/31/2015* | | | 19,324 | | | | 12,671 | |
| Hercules Trust II, Expiration Date 3/31/2029* | | | 170 | | | | 1,670 | |
Total Warrants (Cost $30,283) | | | | 14,341 | |
| | | Principal Amount ($)(c) | | | Value ($) | |
| | | | |
| Corporate Bonds 25.4% | |
| Consumer Discretionary 3.4% | |
| AmeriGas Finance LLC: | |
| 6.75%, 5/20/2020 | | | | 110,000 | | | | 113,300 | |
| 7.0%, 5/20/2022 | | | | 195,000 | | | | 201,825 | |
| Apex Tool Group LLC, 144A, 7.0%, 2/1/2021 | | | | 50,000 | | | | 42,750 | |
| | | Principal Amount ($)(c) | | | Value ($) | |
| | | | | | | | | |
| APX Group, Inc., 6.375%, 12/1/2019 | | | 50,000 | | | | 47,875 | |
| Ashtead Capital, Inc., 144A, 6.5%, 7/15/2022 | | | | 80,000 | | | | 85,000 | |
| Ashton Woods U.S.A. LLC, 144A, 6.875%, 2/15/2021 | | | | 80,000 | | | | 76,200 | |
| Avis Budget Car Rental LLC, 5.5%, 4/1/2023 (b) | | | | 50,000 | | | | 51,000 | |
| Bed Bath & Beyond, Inc.: | |
| 4.915%, 8/1/2034 | | | | 80,000 | | | | 82,550 | |
| 5.165%, 8/1/2044 | | | | 100,000 | | | | 104,629 | |
| Block Communications, Inc., 144A, 7.25%, 2/1/2020 | | | | 20,000 | | | | 20,400 | |
| CCO Holdings LLC, 7.375%, 6/1/2020 | | | | 10,000 | | | | 10,600 | |
| Cequel Communications Holdings I LLC: | |
| 144A, 5.125%, 12/15/2021 | | | | 385,000 | | | | 373,450 | |
| 144A, 6.375%, 9/15/2020 | | | | 285,000 | | | | 294,975 | |
| Clear Channel Worldwide Holdings, Inc.: | |
| Series A, 6.5%, 11/15/2022 | | | 65,000 | | | | 66,138 | |
| Series B, 6.5%, 11/15/2022 | | | 370,000 | | | | 381,100 | |
| Series A, 7.625%, 3/15/2020 | | | 10,000 | | | | 10,375 | |
| Series B, 7.625%, 3/15/2020 | | | 255,000 | | | | 268,387 | |
| Cogeco Cable, Inc., 144A, 4.875%, 5/1/2020 | | | | 5,000 | | | | 5,000 | |
| Columbus International, Inc., 144A, 7.375%, 3/30/2021 | | | | 450,000 | | | | 468,000 | |
| Cumulus Media Holdings, Inc., 7.75%, 5/1/2019 | | | | 50,000 | | | | 50,500 | |
| Dana Holding Corp., 5.5%, 12/15/2024 | | | | 80,000 | | | | 80,800 | |
| Delphi Corp., 5.0%, 2/15/2023 | | | 70,000 | | | | 74,724 | |
| DISH DBS Corp.: | |
| 4.25%, 4/1/2018 | | | | 70,000 | | | | 71,487 | |
| 5.0%, 3/15/2023 | | | | 715,000 | | | | 691,762 | |
| 7.875%, 9/1/2019 | | | | 270,000 | | | | 306,450 | |
| Getty Images, Inc., 144A, 7.0%, 10/15/2020 | | | | 60,000 | | | | 47,100 | |
| Group 1 Automotive, Inc., 144A, 5.0%, 6/1/2022 | | | | 40,000 | | | | 39,100 | |
| Harron Communications LP, 144A, 9.125%, 4/1/2020 | | | | 45,000 | | | | 49,050 | |
| HD Supply, Inc., 11.5%, 7/15/2020 | | | 40,000 | | | | 45,800 | |
| Hot Topic, Inc., 144A, 9.25%, 6/15/2021 | | | | 40,000 | | | | 42,800 | |
| iHeartCommunications, Inc.: | |
| 9.0%, 12/15/2019 | | | | 250,000 | | | | 246,250 | |
| 11.25%, 3/1/2021 | | | | 70,000 | | | | 72,100 | |
| Jo-Ann Stores Holdings, Inc., 144A, 9.75%, 10/15/2019 (PIK) | | | 40,000 | | | | 34,000 | |
| Live Nation Entertainment, Inc., 144A, 7.0%, 9/1/2020 | | | | 90,000 | | | | 94,950 | |
| MDC Partners, Inc., 144A, 6.75%, 4/1/2020 | | | | 40,000 | | | | 41,200 | |
| Mediacom Broadband LLC, 6.375%, 4/1/2023 | | | | 35,000 | | | | 35,875 | |
| MGM Resorts International: | |
| 6.625%, 12/15/2021 | | | | 250,000 | | | | 262,500 | |
| 6.75%, 10/1/2020 | | | | 130,000 | | | | 136,500 | |
| 8.625%, 2/1/2019 | | | | 240,000 | | | | 272,100 | |
| Numericable-SFR: | |
| 144A, 6.0%, 5/15/2022 | | | | 200,000 | | | | 201,100 | |
| 144A, 6.25%, 5/15/2024 | | | | 350,000 | | | | 352,625 | |
| Pinnacle Entertainment, Inc., 6.375%, 8/1/2021 | | | | 45,000 | | | | 46,350 | |
| Quebecor Media, Inc., 5.75%, 1/15/2023 | | | | 50,000 | | | | 51,125 | |
| | | Principal Amount ($)(c) | | | Value ($) | |
| | | | | | | | | |
| Schaeffler Finance BV, 144A, 7.75%, 2/15/2017 | | | | 845,000 | | | | 925,275 | |
| Seminole Hard Rock Entertainment, Inc., 144A, 5.875%, 5/15/2021 | | | | 35,000 | | | | 34,650 | |
| Serta Simmons Holdings LLC, 144A, 8.125%, 10/1/2020 | | | | 55,000 | | | | 58,163 | |
| Servicios Corporativos Javer SAPI de CV, 144A, 9.875%, 4/6/2021 | | | | 100,000 | | | | 105,000 | |
| Sirius XM Radio, Inc., 144A, 5.875%, 10/1/2020 | | | | 60,000 | | | | 61,800 | |
| Springs Industries, Inc., 6.25%, 6/1/2021 | | | | 85,000 | | | | 84,575 | |
| Starz LLC, 5.0%, 9/15/2019 | | | | 40,000 | | | | 40,300 | |
| Taylor Morrison Communities, Inc., 144A, 5.25%, 4/15/2021 | | | | 65,000 | | | | 64,025 | |
| Time Warner Cable, Inc., 7.3%, 7/1/2038 | | | | 45,000 | | | | 62,048 | |
| TRI Pointe Holdings, Inc., 144A, 4.375%, 6/15/2019 | | | | 50,000 | | | | 49,313 | |
Unitymedia Hessen GmbH & Co., KG: | |
| 144A, 5.5%, 1/15/2023 | | | | 200,000 | | | | 209,000 | |
| 144A, 7.5%, 3/15/2019 | EUR | | | 400,000 | | | | 508,850 | |
| Viking Cruises Ltd., 144A, 8.5%, 10/15/2022 | | | | 50,000 | | | | 54,125 | |
| | | | | 8,306,926 | |
| Consumer Staples 1.6% | |
| Big Heart Pet Brands, 7.625%, 2/15/2019 | | | | 66,000 | | | | 64,845 | |
| Cencosud SA, 144A, 4.875%, 1/20/2023 | | | | 250,000 | | | | 245,767 | |
| Chiquita Brands International, Inc., 7.875%, 2/1/2021 | | | | 25,000 | | | | 26,875 | |
| Corp. Lindley SA, 144A, 6.75%, 11/23/2021 | | | | 500,000 | | | | 535,000 | |
| Cott Beverages, Inc.: | |
| 144A, 5.375%, 7/1/2022 | | | | 85,000 | | | | 77,987 | |
| 144A, 6.75%, 1/1/2020 | | | | 80,000 | | | | 80,000 | |
| JBS Investments GmbH, 144A, 7.75%, 10/28/2020 | | | | 250,000 | | | | 258,875 | |
| JBS U.S.A. LLC: | |
| 144A, 7.25%, 6/1/2021 | | | | 145,000 | | | | 149,350 | |
| 144A, 8.25%, 2/1/2020 | | | | 370,000 | | | | 389,425 | |
| Marfrig Overseas Ltd., 144A, 9.5%, 5/4/2020 | | | | 100,000 | | | | 101,000 | |
| Minerva Luxembourg SA: | |
| 144A, 7.75%, 1/31/2023 | | | | 250,000 | | | | 245,000 | |
| 144A, 12.25%, 2/10/2022 | | | | 250,000 | | | | 287,750 | |
| Reynolds Group Issuer, Inc., 5.75%, 10/15/2020 | | | | 1,145,000 | | | | 1,173,625 | |
| Smithfield Foods, Inc., 6.625%, 8/15/2022 | | | | 90,000 | | | | 94,050 | |
| The WhiteWave Foods Co., 5.375%, 10/1/2022 | | | | 80,000 | | | | 82,400 | |
| Tonon Bioenergia SA, 144A, 9.25%, 1/24/2020 | | | | 200,000 | | | | 111,000 | |
| | | | | 3,922,949 | |
| Energy 3.4% | |
| Access Midstream Partners LP, 6.125%, 7/15/2022 | | | | 15,000 | | | | 15,938 | |
| Afren PLC, 144A, 10.25%, 4/8/2019 | | | | 340,000 | | | | 221,000 | |
| Antero Resources Corp., 144A, 5.125%, 12/1/2022 | | | | 140,000 | | | | 131,950 | |
| | | Principal Amount ($)(c) | | | Value ($) | |
| | | | | | | | | |
| Antero Resources Finance Corp., 5.375%, 11/1/2021 | | | | 60,000 | | | | 58,050 | |
| Baytex Energy Corp.: | |
| 144A, 5.125%, 6/1/2021 | | | | 30,000 | | | | 25,500 | |
| 144A, 5.625%, 6/1/2024 | | | | 35,000 | | | | 29,750 | |
| Berry Petroleum Co., LLC: | |
| 6.375%, 9/15/2022 | | | | 50,000 | | | | 38,000 | |
| 6.75%, 11/1/2020 | | | | 50,000 | | | | 40,000 | |
| BreitBurn Energy Partners LP, 7.875%, 4/15/2022 | | | | 110,000 | | | | 84,975 | |
| California Resources Corp.: | |
| 144A, 5.0%, 1/15/2020 | | | | 60,000 | | | | 52,050 | |
| 144A, 5.5%, 9/15/2021 | | | | 143,000 | | | | 122,265 | |
| 144A, 6.0%, 11/15/2024 | | | | 15,000 | | | | 12,675 | |
| Chaparral Energy, Inc., 7.625%, 11/15/2022 | | | | 85,000 | | | | 55,675 | |
| DCP Midstream LLC, 144A, 9.75%, 3/15/2019 | | | | 200,000 | | | | 250,161 | |
| Delek & Avner Tamar Bond Ltd., 144A, 5.082%, 12/30/2023 | | | 850,000 | | | | 848,142 | |
| Ecopetrol SA, 5.875%, 5/28/2045 | | | 700,000 | | | | 647,500 | |
| Endeavor Energy Resources LP, 144A, 7.0%, 8/15/2021 | | | | 85,000 | | | | 75,225 | |
| EP Energy LLC, 6.875%, 5/1/2019 | | | 15,000 | | | | 15,225 | |
| EV Energy Partners LP, 8.0%, 4/15/2019 | | | | 385,000 | | | | 327,250 | |
| GeoPark Latin America Ltd. Agencia en Chile, 144A, 7.5%, 2/11/2020 | | | | 200,000 | | | | 175,000 | |
| Halcon Resources Corp., 8.875%, 5/15/2021 | | | | 450,000 | | | | 338,625 | |
| Hilcorp Energy I LP, 144A, 5.0%, 12/1/2024 | | | | 65,000 | | | | 57,200 | |
| Holly Energy Partners LP, 6.5%, 3/1/2020 | | | | 10,000 | | | | 9,900 | |
| Jupiter Resources, Inc., 144A, 8.5%, 10/1/2022 | | | | 80,000 | | | | 60,200 | |
| Kinder Morgan, Inc.: | |
| 3.05%, 12/1/2019 | | | | 145,000 | | | | 143,847 | |
| 5.55%, 6/1/2045 | | | | 90,000 | | | | 92,181 | |
| Linn Energy LLC, 6.25%, 11/1/2019 | | | 145,000 | | | | 122,525 | |
| MEG Energy Corp., 144A, 7.0%, 3/31/2024 | | | | 435,000 | | | | 393,675 | |
| Memorial Resource Development Corp., 144A, 5.875%, 7/1/2022 | | | 65,000 | | | | 58,825 | |
| Midstates Petroleum Co., Inc., 9.25%, 6/1/2021 | | | | 5,000 | | | | 2,500 | |
| Murphy Oil U.S.A., Inc., 6.0%, 8/15/2023 | | | | 85,000 | | | | 88,825 | |
| Northern Oil & Gas, Inc., 8.0%, 6/1/2020 | | | | 140,000 | | | | 106,050 | |
| Nostrum Oil & Gas Finance BV, 144A, 6.375%, 2/14/2019 | | | 200,000 | | | | 172,000 | |
| Offshore Drilling Holding SA, 144A, 8.625%, 9/20/2020 | | | | 600,000 | | | | 522,000 | |
| Pacific Rubiales Energy Corp., 144A, 5.625%, 1/19/2025 (b) | | | 565,000 | | | | 433,637 | |
| Petroleos de Venezuela SA: | |
| 144A, 9.0%, 11/17/2021 | | | | 250,000 | | | | 109,375 | |
| 144A, 9.75%, 5/17/2035 | | | | 200,000 | | | | 89,000 | |
| PT Pertamina Persero, 144A, 5.625%, 5/20/2043 | | | | 600,000 | | | | 564,000 | |
| QGOG Constellation SA, 144A, 6.25%, 11/9/2019 | | | | 200,000 | | | | 126,000 | |
| Regency Energy Partners LP, 5.0%, 10/1/2022 | | | | 45,000 | | | | 42,525 | |
| Reliance Holding U.S.A., Inc., 144A, 5.4%, 2/14/2022 | | | | 250,000 | | | | 270,827 | |
| | | Principal Amount ($)(c) | | | Value ($) | |
| | | | | | | | | |
| RSP Permian, Inc., 144A, 6.625%, 10/1/2022 | | | | 50,000 | | | | 46,500 | |
| Sabine Pass Liquefaction LLC: | |
| 5.625%, 2/1/2021 | | | | 175,000 | | | | 171,938 | |
| 5.75%, 5/15/2024 | | | | 200,000 | | | | 196,250 | |
| SESI LLC, 7.125%, 12/15/2021 | | | 380,000 | | | | 364,800 | |
| Seventy Seven Energy, Inc., 6.5%, 7/15/2022 (b) | | | | 15,000 | | | | 8,775 | |
| Talisman Energy, Inc., 3.75%, 2/1/2021 | | | | 120,000 | | | | 116,044 | |
| Talos Production LLC, 144A, 9.75%, 2/15/2018 | | | | 95,000 | | | | 86,450 | |
| Targa Resources Partners LP, 144A, 4.125%, 11/15/2019 | | | | 30,000 | | | | 28,875 | |
| Transocean, Inc., 3.8%, 10/15/2022 (b) | | | | 370,000 | | | | 299,820 | |
| Triangle U.S.A. Petroleum Corp., 144A, 6.75%, 7/15/2022 | | | 55,000 | | | | 36,300 | |
| WPX Energy, Inc., 5.25%, 9/15/2024 | | | 60,000 | | | | 55,800 | |
| | | | | 8,441,600 | |
| Financials 3.7% | |
| AerCap Ireland Capital Ltd., 144A, 3.75%, 5/15/2019 | | | | 80,000 | | | | 79,200 | |
| Aflac, Inc., 3.625%, 11/15/2024 | | | | 145,000 | | | | 147,844 | |
| Banco Continental SAECA, 144A, 8.875%, 10/15/2017 | | | | 200,000 | | | | 210,000 | |
| Banco do Brasil SA, 144A, 9.0%, 6/29/2049 | | | | 700,000 | | | | 651,000 | |
| Banco Santander Brasil SA, 144A, 8.0%, 3/18/2016 | BRL | | | 300,000 | | | | 107,836 | |
| Barclays Bank PLC, 7.625%, 11/21/2022 | | | | 250,000 | | | | 273,356 | |
| BBVA Bancomer SA: | |
| 144A, 6.008%, 5/17/2022 | | | | 500,000 | | | | 511,150 | |
| 144A, 6.75%, 9/30/2022 | | | | 150,000 | | | | 165,000 | |
| CBL & Associates LP, (REIT), 4.6%, 10/15/2024 | | | | 255,000 | | | | 258,255 | |
| China Overseas Finance Cayman II Ltd., REG S, 5.5%, 11/10/2020 | | | | 250,000 | | | | 270,229 | |
| CIT Group, Inc.: | |
| 5.0%, 5/15/2017 | | | | 935,000 | | | | 970,062 | |
| 5.25%, 3/15/2018 | | | | 10,000 | | | | 10,425 | |
| Credito Real SAB de CV, 144A, 7.5%, 3/13/2019 | | | | 200,000 | | | | 202,500 | |
| Development Bank of Kazakhstan JSC, Series 3, REG S, 6.5%, 6/3/2020 | | | | 500,000 | | | | 508,750 | |
| E*TRADE Financial Corp., 6.375%, 11/15/2019 | | | | 140,000 | | | | 148,400 | |
| Everest Reinsurance Holdings, Inc., 4.868%, 6/1/2044 | | | | 100,000 | | | | 104,731 | |
| Fondo MIVIVIENDA SA, 144A, 3.5%, 1/31/2023 | | | | 250,000 | | | | 237,500 | |
| Hospitality Properties Trust, (REIT), 5.0%, 8/15/2022 | | | | 230,000 | | | | 242,369 | |
| HSBC Holdings PLC: | |
| 5.625%, 12/29/2049 | | | | 255,000 | | | | 255,892 | |
| 6.375%, 12/29/2049 | | | | 285,000 | | | | 287,850 | |
International Lease Finance Corp.: | |
| 3.875%, 4/15/2018 | | | | 100,000 | | | | 100,000 | |
| 6.25%, 5/15/2019 | | | | 410,000 | | | | 447,925 | |
| 8.75%, 3/15/2017 | | | | 40,000 | | | | 44,300 | |
| | | Principal Amount ($)(c) | | | Value ($) | |
| | | | | | | | | |
| Kaisa Group Holdings Ltd., 144A, 8.875%, 3/19/2018 | | | | 250,000 | | | | 166,875 | |
| Macquarie Group Ltd., 144A, 6.0%, 1/14/2020 | | | | 235,000 | | | | 266,178 | |
| MPT Operating Partnership LP, (REIT), 6.375%, 2/15/2022 | | | 40,000 | | | | 42,500 | |
| Nationwide Financial Services, Inc., 144A, 5.3%, 11/18/2044 | | | 135,000 | | | | 142,419 | |
| Navient Corp., 5.5%, 1/25/2023 (b) | | | 125,000 | | | | 119,688 | |
| Neuberger Berman Group LLC, 144A, 5.625%, 3/15/2020 | | | 10,000 | | | | 10,450 | |
| Omega Healthcare Investors, Inc., (REIT), 4.95%, 4/1/2024 | | | 130,000 | | | | 135,283 | |
| Popular, Inc., 7.0%, 7/1/2019 | | | | 50,000 | | | | 50,000 | |
| Royal Bank of Scotland Group PLC, 6.1%, 6/10/2023 | | | 100,000 | | | | 108,460 | |
| Scentre Group Trust 1, 144A, 3.5%, 2/12/2025 | | | | 330,000 | | | | 331,291 | |
| Schahin II Finance Co. SPV Ltd., 144A, 5.875%, 9/25/2022 (b) | | | 359,733 | | | | 289,136 | |
TIAA Asset Management Finance Co., LLC: | |
| 144A, 2.95%, 11/1/2019 | | | | 245,000 | | | | 245,474 | |
| 144A, 4.125%, 11/1/2024 | | | | 200,000 | | | | 204,883 | |
| Trust F/1401, (REIT), 144A, 5.25%, 12/15/2024 | | | | 500,000 | | | | 515,050 | |
| Turkiye Is Bankasi, 144A, 6.0%, 10/24/2022 | | | | 250,000 | | | | 250,875 | |
| | | | | 9,113,136 | |
| Health Care 1.8% | |
| Aviv Healthcare Properties LP, 7.75%, 2/15/2019 | | | | 10,000 | | | | 10,420 | |
| Biomet, Inc.: | |
| 6.5%, 8/1/2020 | | | | 85,000 | | | | 90,950 | |
| 6.5%, 10/1/2020 | | | | 25,000 | | | | 26,375 | |
| Community Health Systems, Inc.: | |
| 5.125%, 8/15/2018 | | | | 290,000 | | | | 300,150 | |
| 6.875%, 2/1/2022 (b) | | | | 620,000 | | | | 656,813 | |
| 7.125%, 7/15/2020 | | | | 170,000 | | | | 181,263 | |
| Endo Finance LLC, 144A, 5.375%, 1/15/2023 | | | | 80,000 | | | | 78,400 | |
| Fresenius Medical Care U.S. Finance II, Inc., 144A, 5.625%, 7/31/2019 | | | | 10,000 | | | | 10,675 | |
| Fresenius Medical Care U.S. Finance, Inc., 144A, 6.5%, 9/15/2018 | | | | 10,000 | | | | 11,050 | |
| HCA, Inc.: | |
| 5.25%, 4/15/2025 | | | | 60,000 | | | | 62,700 | |
| 6.5%, 2/15/2020 | | | | 880,000 | | | | 986,040 | |
| 7.5%, 2/15/2022 | | | | 725,000 | | | | 828,312 | |
| Hologic, Inc., 6.25%, 8/1/2020 | | | 40,000 | | | | 41,600 | |
| IMS Health, Inc., 144A, 6.0%, 11/1/2020 | | | | 60,000 | | | | 61,800 | |
| Mallinckrodt International Finance SA, 4.75%, 4/15/2023 | | | 110,000 | | | | 105,600 | |
| Medtronic, Inc., 144A, 4.625%, 3/15/2045 | | | | 80,000 | | | | 86,719 | |
| Par Pharmaceutical Companies, Inc., 7.375%, 10/15/2020 | | | 90,000 | | | | 94,050 | |
| Physio-Control International, Inc., 144A, 9.875%, 1/15/2019 | | | 14,000 | | | | 14,840 | |
| Tenet Healthcare Corp., 6.25%, 11/1/2018 | | | | 230,000 | | | | 249,550 | |
| Valeant Pharmaceuticals International, 144A, 6.375%, 10/15/2020 | | | | 90,000 | | | | 94,050 | |
| | | Principal Amount ($)(c) | | | Value ($) | |
| | | | | | | | | |
| Valeant Pharmaceuticals International, Inc., 144A, 7.5%, 7/15/2021 | | | | 450,000 | | | | 486,000 | |
| | | | | 4,477,357 | |
| Industrials 2.6% | |
| ADT Corp.: | |
| 3.5%, 7/15/2022 (b) | | | | 50,000 | | | | 42,625 | |
| 5.25%, 3/15/2020 | | | | 130,000 | | | | 131,625 | |
| 6.25%, 10/15/2021 | | | | 45,000 | | | | 46,238 | |
| Artesyn Embedded Technologies, Inc., 144A, 9.75%, 10/15/2020 | | | 70,000 | | | | 66,325 | |
| Avianca Holdings SA, 144A, 8.375%, 5/10/2020 | | | | 200,000 | | | | 206,000 | |
| Belden, Inc., 144A, 5.5%, 9/1/2022 | | | 85,000 | | | | 84,362 | |
| Bombardier, Inc., 144A, 5.75%, 3/15/2022 (b) | | | | 328,000 | | | | 332,100 | |
| DigitalGlobe, Inc., 144A, 5.25%, 2/1/2021 | | | | 35,000 | | | | 33,250 | |
| Empresas ICA SAB de CV, 144A, 8.875%, 5/29/2024 | | | | 200,000 | | | | 183,000 | |
| FTI Consulting, Inc., 6.0%, 11/15/2022 | | | | 50,000 | | | | 51,125 | |
| Gates Global LLC, 144A, 6.0%, 7/15/2022 | | | | 65,000 | | | | 62,251 | |
| GenCorp, Inc., 7.125%, 3/15/2021 | | | 120,000 | | | | 125,676 | |
| Grupo KUO SAB de CV, 144A, 6.25%, 12/4/2022 | | | | 600,000 | | | | 590,700 | |
| Kazakhstan Temir Zholy Finance BV, 144A, 6.375%, 10/6/2020 | | | 500,000 | | | | 492,500 | |
| Kenan Advantage Group, Inc., 144A, 8.375%, 12/15/2018 | | | | 100,000 | | | | 103,000 | |
| Meritor, Inc., 6.75%, 6/15/2021 | | | 55,000 | | | | 57,475 | |
| Mersin Uluslararasi Liman Isletmeciligi AS, 144A, 5.875%, 8/12/2020 | | | | 500,000 | | | | 534,500 | |
| Navios Maritime Holdings, Inc., 144A, 7.375%, 1/15/2022 | | | 450,000 | | | | 411,750 | |
| Noble Group Ltd., 144A, 6.625%, 8/5/2020 | | | | 250,000 | | | | 256,250 | |
| Nortek, Inc., 8.5%, 4/15/2021 | | | | 155,000 | | | | 165,850 | |
| OAS Finance Ltd., 144A, 8.0%, 7/2/2021 | | | | 200,000 | | | | 64,000 | |
| Odebrecht Offshore Drilling Finance Ltd., 144A, 6.75%, 10/1/2022 | | | 188,500 | | | | 172,477 | |
| Ply Gem Industries, Inc., 144A, 6.5%, 2/1/2022 | | | | 60,000 | | | | 55,800 | |
| SBA Communications Corp., 5.625%, 10/1/2019 | | | | 50,000 | | | | 51,125 | |
| TAM Capital 3, Inc., 144A, 8.375%, 6/3/2021 | | | | 200,000 | | | | 205,500 | |
| Titan International, Inc., 6.875%, 10/1/2020 | | | | 170,000 | | | | 149,600 | |
| TransDigm, Inc.: | |
| 6.0%, 7/15/2022 | | | | 210,000 | | | | 209,475 | |
| 7.5%, 7/15/2021 | | | | 275,000 | | | | 292,875 | |
| United Rentals North America, Inc.: | |
| 6.125%, 6/15/2023 | | | | 10,000 | | | | 10,500 | |
| 7.375%, 5/15/2020 | | | | 25,000 | | | | 27,000 | |
| 7.625%, 4/15/2022 | | | | 620,000 | | | | 681,690 | |
| Votorantim Cimentos SA, 144A, 7.25%, 4/5/2041 | | | | 500,000 | | | | 515,000 | |
| XPO Logistics, Inc., 144A, 7.875%, 9/1/2019 | | | | 40,000 | | | | 41,800 | |
| | | | | 6,453,444 | |
| | | Principal Amount ($)(c) | | | Value ($) | |
| | | | | | | | | |
| Information Technology 1.3% | |
| ACI Worldwide, Inc., 144A, 6.375%, 8/15/2020 | | | | 30,000 | | | | 31,350 | |
| Activision Blizzard, Inc., 144A, 5.625%, 9/15/2021 | | | | 330,000 | | | | 346,500 | |
| Alliance Data Systems Corp., 144A, 5.25%, 12/1/2017 | | | | 60,000 | | | | 61,800 | |
| Audatex North America, Inc., 144A, 6.0%, 6/15/2021 | | | | 15,000 | | | | 15,450 | |
| BMC Software Finance, Inc., 144A, 8.125%, 7/15/2021 | | | | 100,000 | | | | 94,000 | |
| Cardtronics, Inc., 144A, 5.125%, 8/1/2022 | | | | 55,000 | | | | 53,625 | |
| CDW LLC: | |
| 6.0%, 8/15/2022 | | | | 90,000 | | | | 92,925 | |
| 8.5%, 4/1/2019 | | | | 242,000 | | | | 255,008 | |
| CyrusOne LP, 6.375%, 11/15/2022 | | | 25,000 | | | | 26,688 | |
| EarthLink Holdings Corp., 7.375%, 6/1/2020 | | | | 70,000 | | | | 71,050 | |
| Equinix, Inc., 5.375%, 4/1/2023 | | | 175,000 | | | | 175,000 | |
| First Data Corp.: | |
| 144A, 6.75%, 11/1/2020 | | | | 237,000 | | | | 252,998 | |
| 144A, 7.375%, 6/15/2019 | | | | 725,000 | | | | 763,062 | |
| Hughes Satellite Systems Corp.: | |
| 6.5%, 6/15/2019 | | | | 60,000 | | | | 64,350 | |
| 7.625%, 6/15/2021 | | | | 190,000 | | | | 209,000 | |
| KLA-Tencor Corp., 4.65%, 11/1/2024 | | | 240,000 | | | | 248,459 | |
| NXP BV, 144A, 3.75%, 6/1/2018 | | | 90,000 | | | | 90,000 | |
| Seagate HDD Cayman, 144A, 5.75%, 12/1/2034 | | | | 250,000 | | | | 263,658 | |
| Tencent Holdings Ltd., 144A, 3.375%, 5/2/2019 | | | | 200,000 | | | | 203,287 | |
| | | | | 3,318,210 | |
| Materials 2.3% | |
| Alpek SAB de CV, 144A, 5.375%, 8/8/2023 | | | | 200,000 | | | | 209,500 | |
| Anglo American Capital PLC: | |
| 144A, 4.125%, 4/15/2021 | | | | 200,000 | | | | 200,672 | |
| 144A, 4.125%, 9/27/2022 | | | | 250,000 | | | | 247,557 | |
| Berry Plastics Corp., 5.5%, 5/15/2022 | | | | 320,000 | | | | 324,800 | |
| Cascades, Inc., 144A, 5.5%, 7/15/2022 | | | | 50,000 | | | | 49,750 | |
| Cemex SAB de CV, 144A, 6.5%, 12/10/2019 | | | | 200,000 | | | | 204,900 | |
| Clearwater Paper Corp., 144A, 5.375%, 2/1/2025 | | | | 110,000 | | | | 108,350 | |
| First Quantum Minerals Ltd.: | |
| 144A, 6.75%, 2/15/2020 | | | | 259,000 | | | | 234,395 | |
| 144A, 7.0%, 2/15/2021 | | | | 111,000 | | | | 99,900 | |
| FMG Resources (August 2006) Pty Ltd., 144A, 6.0%, 4/1/2017 (b) | | | 195,000 | | | | 186,469 | |
| Fresnillo PLC, 144A, 5.5%, 11/13/2023 | | | | 500,000 | | | | 490,000 | |
| Glencore Funding LLC, 144A, 4.125%, 5/30/2023 | | | | 50,000 | | | | 48,788 | |
| GTL Trade Finance, Inc., 144A, 5.893%, 4/29/2024 | | | | 600,000 | | | | 579,000 | |
| Hexion U.S. Finance Corp.: | |
| 6.625%, 4/15/2020 | | | | 425,000 | | | | 416,500 | |
| 8.875%, 2/1/2018 | | | | 90,000 | | | | 80,100 | |
| Kaiser Aluminum Corp., 8.25%, 6/1/2020 | | | | 40,000 | | | | 43,400 | |
| Novelis, Inc., 8.75%, 12/15/2020 | | | 955,000 | | | | 1,012,300 | |
| | | Principal Amount ($)(c) | | | Value ($) | |
| | | | | | | | | |
| Plastipak Holdings, Inc., 144A, 6.5%, 10/1/2021 | | | | 70,000 | | | | 69,650 | |
| Polymer Group, Inc., 7.75%, 2/1/2019 | | | | 229,000 | | | | 237,301 | |
| Sealed Air Corp., 144A, 8.375%, 9/15/2021 | | | | 10,000 | | | | 11,175 | |
| Tronox Finance LLC, 6.375%, 8/15/2020 | | | | 55,000 | | | | 55,138 | |
| Turkiye Sise ve Cam Fabrikalari AS, 144A, 4.25%, 5/9/2020 | | | 200,000 | | | | 195,189 | |
| Vedanta Resources PLC, 144A, 8.25%, 6/7/2021 | | | | 200,000 | | | | 198,000 | |
| WR Grace & Co-Conn: | |
| 144A, 5.125%, 10/1/2021 | | | | 40,000 | | | | 41,000 | |
| 144A, 5.625%, 10/1/2024 | | | | 20,000 | | | | 20,850 | |
| Yamana Gold, Inc., 4.95%, 7/15/2024 | | | | 250,000 | | | | 243,994 | |
| | | | | 5,608,678 | |
| Telecommunication Services 4.7% | |
| Bharti Airtel International Netherlands BV, 144A, 5.35%, 5/20/2024 | | | 1,000,000 | | | | 1,081,920 | |
| CenturyLink, Inc., Series V, 5.625%, 4/1/2020 | | | | 25,000 | | | | 25,938 | |
| Cincinnati Bell, Inc.: | |
| 8.375%, 10/15/2020 | | | | 775,000 | | | | 813,750 | |
| 8.75%, 3/15/2018 (b) | | | | 206,000 | | | | 211,665 | |
| Digicel Group Ltd.: | |
| 144A, 7.125%, 4/1/2022 | | | | 250,000 | | | | 232,500 | |
| 144A, 8.25%, 9/30/2020 | | | | 400,000 | | | | 388,000 | |
| Digicel Ltd., 144A, 8.25%, 9/1/2017 | | | | 750,000 | | | | 759,375 | |
| Frontier Communications Corp.: | |
| 6.25%, 9/15/2021 | | | | 60,000 | | | | 60,300 | |
| 6.875%, 1/15/2025 | | | | 60,000 | | | | 60,000 | |
| 7.125%, 1/15/2023 | | | | 390,000 | | | | 396,825 | |
| 8.5%, 4/15/2020 | | | | 290,000 | | | | 323,350 | |
| Intelsat Jackson Holdings SA: | |
| 5.5%, 8/1/2023 | | | | 265,000 | | | | 263,384 | |
| 7.25%, 10/15/2020 | | | | 690,000 | | | | 728,812 | |
| 7.5%, 4/1/2021 | | | | 340,000 | | | | 363,800 | |
| Intelsat Luxembourg SA: | |
| 7.75%, 6/1/2021 | | | | 165,000 | | | | 165,413 | |
| 8.125%, 6/1/2023 | | | | 25,000 | | | | 25,500 | |
| Level 3 Communications, Inc., 8.875%, 6/1/2019 | | | | 205,000 | | | | 217,341 | |
| Level 3 Escrow II, Inc., 144A, 5.375%, 8/15/2022 | | | | 265,000 | | | | 266,325 | |
| Level 3 Financing, Inc.: | |
| 6.125%, 1/15/2021 | | | | 100,000 | | | | 103,500 | |
| 7.0%, 6/1/2020 | | | | 185,000 | | | | 194,944 | |
| 8.625%, 7/15/2020 | | | | 450,000 | | | | 485,437 | |
| Millicom International Cellular SA, 144A, 4.75%, 5/22/2020 | | | 200,000 | | | | 188,500 | |
| MTN Mauritius Investments Ltd., 144A, 4.755%, 11/11/2024 | | | 250,000 | | | | 245,000 | |
| Sprint Communications, Inc.: | |
| 6.0%, 11/15/2022 | | | | 85,000 | | | | 78,200 | |
| 144A, 7.0%, 3/1/2020 | | | | 85,000 | | | | 91,800 | |
| 144A, 9.0%, 11/15/2018 | | | | 420,000 | | | | 477,708 | |
| Sprint Corp., 7.125%, 6/15/2024 | | | 285,000 | | | | 265,050 | |
| T-Mobile U.S.A., Inc., 6.625%, 11/15/2020 | | | | 655,000 | | | | 666,462 | |
| Turk Telekomunikasyon AS, 144A, 4.875%, 6/19/2024 | | | | 200,000 | | | | 201,051 | |
| | | Principal Amount ($)(c) | | | Value ($) | |
| | | | | | | | | |
| UPCB Finance III Ltd., 144A, 6.625%, 7/1/2020 | | | | 370,000 | | | | 388,500 | |
| UPCB Finance V Ltd., 144A, 7.25%, 11/15/2021 | | | | 280,000 | | | | 306,250 | |
| Wind Acquisition Finance SA, 144A, 6.5%, 4/30/2020 | | | | 50,000 | | | | 51,125 | |
| Windstream Corp.: | |
| 6.375%, 8/1/2023 | | | | 60,000 | | | | 56,100 | |
| 7.5%, 4/1/2023 | | | | 20,000 | | | | 19,900 | |
| 7.75%, 10/15/2020 | | | | 1,075,000 | | | | 1,107,250 | |
| 7.75%, 10/1/2021 | | | | 185,000 | | | | 188,700 | |
| 7.875%, 11/1/2017 | | | | 130,000 | | | | 140,725 | |
| | | | | 11,640,400 | |
| Utilities 0.6% | |
| AES Corp.: | |
| 8.0%, 10/15/2017 | | | | 6,000 | | | | 6,735 | |
| 8.0%, 6/1/2020 | | | | 30,000 | | | | 34,275 | |
| Calpine Corp.: | |
| 5.375%, 1/15/2023 | | | | 85,000 | | | | 85,850 | |
| 5.75%, 1/15/2025 | | | | 85,000 | | | | 86,063 | |
| Dynegy Finance I, Inc., 144A, 7.625%, 11/1/2024 | | | | 20,000 | | | | 20,400 | |
| Empresa Electrica Angamos SA, 144A, 4.875%, 5/25/2029 | | | 200,000 | | | | 196,500 | |
| Hrvatska Elektroprivreda, 144A, 6.0%, 11/9/2017 | | | | 250,000 | | | | 260,750 | |
| Inkia Energy Ltd., 144A, 8.375%, 4/4/2021 | | | | 250,000 | | | | 265,000 | |
| NGL Energy Partners LP, 144A, 5.125%, 7/15/2019 | | | | 65,000 | | | | 62,400 | |
| NRG Energy, Inc., 144A, 6.25%, 5/1/2024 | | | | 360,000 | | | | 366,300 | |
| RJS Power Holdings LLC, 144A, 5.125%, 7/15/2019 | | | | 70,000 | | | | 69,125 | |
| | | | | 1,453,398 | |
Total Corporate Bonds (Cost $64,602,426) | | | | 62,736,098 | |
| | |
| Asset-Backed 0.6% | |
| Automobile Receivables 0.2% | |
| AmeriCredit Automobile Receivables Trust, "E", Series 2011-2, 144A, 5.48%, 9/10/2018 | | | 528,181 | | | | 540,748 | |
| Miscellaneous 0.4% | |
| ARES CLO Ltd., "D", Series 2012-3A, 144A, 4.878%**, 1/17/2024 | | | 250,000 | | | | 250,000 | |
| Hilton Grand Vacations Trust, "B", Series 2014-AA, 144A, 2.07%, 11/25/2026 | | | 443,771 | | | | 436,528 | |
| VOLT XXIV LLC, "A1", Series 2014-NPL3, 144A, 3.25%, 11/25/2053 | | | 271,105 | | | | 271,361 | |
| | | | | 957,889 | |
Total Asset-Backed (Cost $1,512,738) | | | | 1,498,637 | |
| | |
| | | Principal Amount ($)(c) | | | Value ($) | |
| | | | | | | | | |
| Mortgage-Backed Securities Pass-Throughs 1.0% | |
| Federal Home Loan Mortgage Corp., 6.0%, 3/1/2038 | | | 8,936 | | | | 10,072 | |
| Federal National Mortgage Association: | |
| 3.0%, 7/1/2042 (d) | | | | 1,000,000 | | | | 1,012,109 | |
| 4.0%, 3/1/2042 (d) | | | | 1,200,000 | | | | 1,281,188 | |
| 4.5%, 9/1/2035 | | | | 23,962 | | | | 26,182 | |
| 6.0%, 1/1/2024 | | | | 27,969 | | | | 31,649 | |
| 6.5%, with various maturities from 5/1/2017 until 1/1/2038 | | | | 5,256 | | | | 5,585 | |
Total Mortgage-Backed Securities Pass-Throughs (Cost $2,346,856) | | | | 2,366,785 | |
| | |
| Commercial Mortgage-Backed Securities 0.4% | |
| Del Coronado Trust, "M", Series 2013-HDMZ, 144A, 5.161%**, 3/15/2018 | | | 120,000 | | | | 120,096 | |
JPMorgan Chase Commercial Mortgage Securities Corp.: | |
| "C", Series 2012-HSBC, 144A, 4.021%, 7/5/2032 | | | | 380,000 | | | | 397,379 | |
| "A4", Series 2007-C1, 5.716%, 2/15/2051 | | | | 224,071 | | | | 240,985 | |
| LB-UBS Commercial Mortgage Trust, "A4", Series 2007-C6, 5.858%, 7/15/2040 | | | 243,621 | | | | 257,071 | |
Total Commercial Mortgage-Backed Securities (Cost $1,007,094) | | | | 1,015,531 | |
| | |
| Collateralized Mortgage Obligations 1.0% | |
| Federal Home Loan Mortgage Corp.: | |
| "HI", Series 3979, Interest Only, 3.0%, 12/15/2026 | | | | 585,155 | | | | 62,276 | |
| "IK", Series 4048, Interest Only, 3.0%, 5/15/2027 | | | | 690,184 | | | | 87,996 | |
| "ZG", Series 4213, 3.5%, 6/15/2043 | | | | 91,121 | | | | 91,302 | |
| "LI", Series 3720, Interest Only, 4.5%, 9/15/2025 | | | | 1,142,707 | | | | 166,748 | |
| "PI", Series 3843, Interest Only, 4.5%, 5/15/2038 | | | | 620,269 | | | | 67,187 | |
| "H", Series 2278, 6.5%, 1/15/2031 | | | | 138 | | | | 154 | |
| Federal National Mortgage Association: | |
| "WO", Series 2013-27, Principal Only, Zero Coupon, 12/25/2042 | | | 220,000 | | | | 116,937 | |
| "I", Series 2003-84, Interest Only, 6.0%, 9/25/2033 | | | 204,522 | | | | 40,564 | |
| "PI", Series 2006-20, Interest Only, 6.511%***, 11/25/2030 | | | 379,977 | | | | 63,212 | |
| Freddie Mac Structured Agency Credit Risk Debt Notes, "M3", Series 2014-DN4, 4.705%**, 10/25/2024 | | | 240,000 | | | | 235,017 | |
Government National Mortgage Association: | |
| "ZJ", Series 2013-106, 3.5%, 7/20/2043 | | | | 73,498 | | | | 73,485 | |
| "QI", Series 2011-112, Interest Only, 4.0%, 5/16/2026 | | | 647,059 | | | | 67,707 | |
| "NI", Series 2011-80, Interest Only, 4.5%, 5/16/2038 | | | 836,136 | | | | 52,654 | |
| "BI", Series 2010-30, Interest Only, 4.5%, 7/20/2039 | | | 114,078 | | | | 15,504 | |
| | | Principal Amount ($)(c) | | | Value ($) | |
| | | | | | | | | |
| "ND", Series 2010-130, 4.5%, 8/16/2039 | | | | 600,000 | | | | 661,715 | |
| "IQ", Series 2011-18, Interest Only, 5.5%, 1/16/2039 | | | 267,617 | | | | 29,357 | |
| "IV", Series 2009-69, Interest Only, 5.5%, 8/20/2039 | | | 479,467 | | | | 82,780 | |
| "IN", Series 2009-69, Interest Only, 5.5%, 8/20/2039 | | | 486,851 | | | | 80,524 | |
| "IJ", Series 2009-75, Interest Only, 6.0%, 8/16/2039 | | | 359,353 | | | | 64,584 | |
| "AI", Series 2007-38, Interest Only, 6.299%***, 6/16/2037 | | | 83,386 | | | | 13,381 | |
| Residential Funding Mortgage Securities I, Inc., "M1", Series 2003-S17, 5.5%, 9/25/2033 | | | 412,134 | | | | 384,885 | |
Total Collateralized Mortgage Obligations (Cost $2,147,057) | | | | 2,457,969 | |
| | |
| Government & Agency Obligations 7.7% | |
| Other Government Related (e) 0.1% | |
| Banco de Costa Rica, 144A, 5.25%, 8/12/2018 | | | | 200,000 | | | | 201,500 | |
| TMK OAO, 144A, 6.75%, 4/3/2020 | | | 200,000 | | | | 112,000 | |
| | | | | 313,500 | |
| Sovereign Bonds 3.7% | |
| Government of New Zealand: | |
| Series 0427, REG S, 4.5%, 4/15/2027 | NZD | | | 1,380,000 | | | | 1,148,216 | |
| 5.5%, 4/15/2023 | NZD | | | 1,710,000 | | | | 1,432,273 | |
| Series 1217, REG S, 6.0%, 12/15/2017 | NZD | | | 3,100,000 | | | | 2,582,976 | |
| Perusahaan Penerbit SBSN, 144A, 6.125%, 3/15/2019 | | | | 500,000 | | | | 552,500 | |
| Republic of Belarus, REG S, 8.75%, 8/3/2015 | | | | 100,000 | | | | 94,170 | |
| Republic of Costa Rica, 144A, 4.25%, 1/26/2023 | | | | 200,000 | | | | 183,000 | |
| Republic of El Salvador: | |
| 144A, 6.375%, 1/18/2027 | | | | 100,000 | | | | 100,250 | |
| 144A, 7.65%, 6/15/2035 | | | | 200,000 | | | | 212,000 | |
| Republic of Hungary, Series 19/A, 6.5%, 6/24/2019 | HUF | | | 16,900,000 | | | | 73,811 | |
| Republic of Italy, REG S, 144A, 4.75%, 9/1/2044 | EUR | | | 1,040,000 | | | | 1,629,872 | |
| Republic of Peru, 144A, 5.7%, 8/12/2024 | PEN | | | 300,000 | | | | 100,461 | |
| Republic of Slovenia, 144A, 5.5%, 10/26/2022 | | | | 200,000 | | | | 221,750 | |
| Republic of South Africa: | |
| 5.875%, 9/16/2025 (b) | | | | 100,000 | | | | 112,625 | |
| Series R204, 8.0%, 12/21/2018 | ZAR | | | 1,300,000 | | | | 115,147 | |
| Republic of Sri Lanka, 144A, 5.125%, 4/11/2019 | | | | 200,000 | | | | 201,500 | |
| United Mexican States: | |
| Series M, 4.75%, 6/14/2018 | MXN | | | 2,000,000 | | | | 135,257 | |
| Series M 20, 8.5%, 5/31/2029 | MXN | | | 1,000,000 | | | | 81,901 | |
| | | | | 8,977,709 | |
| | | Principal Amount ($)(c) | | | Value ($) | |
| | | | | | | | | |
| U.S. Government Sponsored Agency 0.4% | |
| Federal National Mortgage Association, 3.0%, 11/15/2027 | | | 1,000,000 | | | | 966,413 | |
| U.S. Treasury Obligations 3.5% | |
| U.S. Treasury Bills: | |
| 0.035%****, 2/12/2015 (f) | | | | 1,327,000 | | | | 1,326,974 | |
| 0.085%****, 6/11/2015 (f) | | | | 241,000 | | | | 240,930 | |
| U.S. Treasury Bonds: | |
| 3.125%, 8/15/2044 | | | | 70,000 | | | | 75,359 | |
| 3.625%, 2/15/2044 | | | | 251,000 | | | | 295,376 | |
| 5.375%, 2/15/2031 | | | | 1,071,000 | | | | 1,492,790 | |
| U.S. Treasury Notes: | |
| 1.0%, 8/31/2016 (g) (h) | | | | 3,400,000 | | | | 3,425,500 | |
| 1.0%, 9/30/2016 | | | | 1,200,000 | | | | 1,208,813 | |
| 2.25%, 11/15/2024 | | | | 432,000 | | | | 434,903 | |
| 2.5%, 5/15/2024 | | | | 170,000 | | | | 175,126 | |
| | | | | 8,675,771 | |
Total Government & Agency Obligations (Cost $18,952,432) | | | | 18,933,393 | |
| | |
| Municipal Bonds and Notes 0.1% | |
| Kentucky, Asset/Liability Commission, General Fund Revenue, 3.165%, 4/1/2018 (Cost $323,761) | | | 323,761 | | | | 333,613 | |
| | |
| Convertible Bond 0.1% | |
| Materials | |
| GEO Specialty Chemicals, Inc., 144A 7.5%, 3/31/2015 (PIK) (Cost $208,728) | | | 209,283 | | | | 361,536 | |
| | |
| Preferred Security 0.0% | |
| Materials | |
| Hercules, Inc., 6.5%, 6/30/2029 (Cost $20,611) | | | 40,000 | | | | 36,000 | |
| | | Shares | | | Value ($) | |
| | | | |
| Securities Lending Collateral 2.7% | |
| Daily Assets Fund Institutional, 0.10% (i) (j) (Cost $6,638,160) | | | 6,638,160 | | | | 6,638,160 | |
| | |
| Cash Equivalents 10.8% | |
| Central Cash Management Fund, 0.06% (i) (Cost $26,756,478) | | | 26,756,478 | | | | 26,756,478 | |
| | | % of Net Assets | | | Value ($) | |
| | | | |
Total Investment Portfolio (Cost $244,775,770)† | | | 103.5 | | | | 255,941,339 | |
| Other Assets and Liabilities, Net | | | (3.5 | ) | | | (8,771,110 | ) |
| Net Assets | | | 100.0 | | | | 247,170,229 | |
* Non-income producing security.
** Floating rate securities' yields vary with a designated market index or market rate, such as the coupon-equivalent of the U.S. Treasury Bill rate. These securities are shown at their current rate as of December 31, 2014.
*** These securities are shown at their current rate as of December 31, 2014.
****Annualized yield at time of purchase; not a coupon rate.
† The cost for federal income tax purposes was $245,230,335. At December 31, 2014, net unrealized appreciation for all securities based on tax cost was $10,711,004. This consisted of aggregate gross unrealized appreciation for all securities in which there was an excess of value over tax cost of $18,617,211 and aggregate gross unrealized depreciation for all securities in which there was an excess of tax cost over value of $7,906,207.
(a) The Fund may purchase securities that are subject to legal or contractual restrictions on resale ("restricted securities"). Restricted securities are securities which have not been registered with the Securities and Exchange Commission under the Securities Act of 1933. The Fund may be unable to sell a restricted security and it may be more difficult to determine a market value for a restricted security. Moreover, if adverse market conditions were to develop during the period between the Fund's decision to sell a restricted security and the point at which the Fund is permitted or able to sell such security, the Fund might obtain a price less favorable than the price that prevailed when it decided to sell. This investment practice, therefore, could have the effect of increasing the level of illiquidity of the Fund. The future value of these securities is uncertain and there may be changes in the estimated value of these securities.
| Schedule of Restricted Securities | Acquisition Date | | Cost ($) | | | Value ($) | | | Value as % of Net Assets | |
| Dawn Holdings, Inc. | August 2013 | | | 2,342 | | | | 1,831 | | | | 0.001 | |
(b) All or a portion of these securities were on loan. In addition, "Other Assets and Liabilities, Net" may include pending sales that are also on loan. The value of securities loaned at December 31, 2014 amounted to $6,355,717, which is 2.6% of net assets.
(c) Principal amount stated in U.S. dollars unless otherwise noted.
(d) When-issued or delayed delivery security included.
(e) Government-backed debt issued by financial companies or government sponsored enterprises.
(f) At December 31, 2014, this security has been pledged, in whole or in part, to cover initial margin requirements for open futures contracts.
(g) At December 31, 2014, this security has been pledged, in whole or in part, as collateral for open over-the-counter derivatives.
(h) At December 31, 2014, this security has been pledged, in whole or in part, to cover initial margin requirements for open centrally cleared swap contracts.
(i) Affiliated fund managed by Deutsche Investment Management Americas Inc. The rate shown is the annualized seven-day yield at period end.
(j) Represents collateral held in connection with securities lending. Income earned by the Fund is net of borrower rebates.
144A: Security exempt from registration under Rule 144A of the Securities Act of 1933. These securities may be resold in transactions exempt from registration, normally to qualified institutional buyers.
CLO: Collateralized Loan Obligation
CVA: Certificaten Van Aandelen (Certificate of Stock)
Interest Only: Interest Only (IO) bonds represent the "interest only" portion of payments on a pool of underlying mortgages or mortgage-backed securities. IO securities are subject to prepayment risk of the pool of underlying mortgages.
PIK: Denotes that all or a portion of the income is paid in-kind in the form of additional principal.
Principal Only: Principal Only (PO) bonds represent the "principal only" portion of payments on a pool of underlying mortgages or mortgage-backed securities.
REG S: Securities sold under Regulation S may not be offered, sold or delivered within the United States or to, or for the account or benefit of, U.S. persons, except pursuant to an exemption from, or in a transaction not subject to, the registration requirements of the Securities Act of 1933.
REIT: Real Estate Investment Trust
RSP: Risparmio (Convertible Savings Shares)
SDR: Swedish Depositary Receipt
Included in the portfolio are investments in mortgage- or asset-backed securities which are interests in separate pools of mortgages or assets. Effective maturities of these investments may be shorter than stated maturities due to prepayments. Some separate investments in the Federal National Mortgage Association issues which have similar coupon rates have been aggregated for presentation purposes in this investment portfolio.
At December 31, 2014, open futures contracts purchased were as follows:
| Futures | Currency | Expiration Date | | Contracts | | | Notional Value ($) | | | Unrealized Appreciation ($) | |
| 10 Year U.S. Treasury Note | USD | 3/20/2015 | | | 100 | | | | 12,679,688 | | | | 62,304 | |
| United Kingdom Long Gilt Bond | GBP | 3/27/2015 | | | 6 | | | | 1,117,798 | | | | 25,613 | |
| Total unrealized appreciation | | | | 87,917 | |
At December 31, 2014, open futures contracts sold were as follows:
| Futures | Currency | Expiration Date | | Contracts | | | Notional Value ($) | | | Unrealized (Depreciation) ($) | |
| 10 Year Australian Bond | AUD | 3/16/2015 | | | 11 | | | | 1,150,793 | | | | (17,293 | ) |
| 10 Year U.S. Treasury Note | USD | 3/20/2015 | | | 107 | | | | 13,567,266 | | | | (18,600 | ) |
| Euro-BTP Italian Government Bond | EUR | 3/6/2015 | | | 22 | | | | 3,609,822 | | | | (24,632 | ) |
| U.S. Treasury Long Bond | USD | 3/20/2015 | | | 20 | | | | 2,891,250 | | | | (73,311 | ) |
| Total unrealized depreciation | | | | (133,836 | ) |
At December 31, 2014, open written options contracts were as follows:
| Options on Interest Rate Swap Contracts | Swap Effective/ Expiration Date | | Contract Amount | | Option Expiration Date | | Premiums Received ($) | | | Value ($) (k) | |
Call Options Receive Fixed — 4.48% – Pay Floating — LIBOR | 5/9/2016 5/11/2026 | | | 2,100,000 | 1 | 5/5/2016 | | | 23,572 | | | | (3,629 | ) |
| Receive Fixed — 5.132% – Pay Floating — LIBOR | 3/17/2016 3/17/2026 | | | 2,100,000 | 1 | 3/15/2016 | | | 15,173 | | | | (602 | ) |
| Receive Fixed — 5.132% – Pay Floating — LIBOR | 3/17/2016 3/17/2026 | | | 2,100,000 | 2 | 3/15/2016 | | | 24,780 | | | | (602 | ) |
| Total Call Options | | | 63,525 | | | | (4,833 | ) |
Put Options Pay Fixed — 1.132% – Receive Floating — LIBOR | 3/17/2016 3/17/2026 | | | 2,100,000 | 1 | 3/15/2016 | | | 15,172 | | | | (1,991 | ) |
| Pay Fixed — 1.132% – Receive Floating — LIBOR | 3/17/2016 3/17/2026 | | | 2,100,000 | 2 | 3/15/2016 | | | 5,355 | | | | (1,991 | ) |
| Pay Fixed — 2.48% – Receive Floating — LIBOR | 5/9/2016 5/11/2026 | | | 2,100,000 | 1 | 5/5/2016 | | | 23,573 | | | | (54,362 | ) |
| Pay Fixed — 2.615% – Receive Floating — LIBOR | 12/2/2015 12/4/2045 | | | 4,900,000 | 3 | 12/2/2015 | | | 106,330 | | | | (184,937 | ) |
| Pay Fixed — 2.64% – Receive Floating — LIBOR | 8/10/2015 8/10/2045 | | | 1,900,000 | 1 | 8/6/2015 | | | 17,765 | | | | (62,547 | ) |
| Pay Fixed — 2.675% – Receive Floating — LIBOR | 11/9/2015 11/12/2045 | | | 4,900,000 | 3 | 11/9/2015 | | | 98,245 | | | | (209,501 | ) |
| Pay Fixed — 2.796% – Receive Floating — LIBOR | 6/5/2015 6/5/2045 | | | 1,900,000 | 2 | 6/3/2015 | | | 20,330 | | | | (77,619 | ) |
| Pay Fixed — 2.88% – Receive Floating — LIBOR | 9/30/2015 9/30/2045 | | | 4,900,000 | 4 | 9/28/2015 | | | 102,523 | | | | (298,855 | ) |
| Pay Fixed — 3.005% – Receive Floating — LIBOR | 3/6/2015 3/6/2045 | | | 1,900,000 | 1 | 3/4/2015 | | | 19,950 | | | | (117,363 | ) |
| Pay Fixed — 3.035% – Receive Floating — LIBOR | 2/15/2015 2/3/2045 | | | 1,900,000 | 2 | 1/30/2015 | | | 23,465 | | | | (129,596 | ) |
| Pay Fixed — 3.088% – Receive Floating — LIBOR | 1/28/2015 1/28/2045 | | | 2,100,000 | 5 | 1/26/2015 | | | 21,184 | | | | (162,148 | ) |
| Total Put Options | | | 453,892 | | | | (1,300,910 | ) |
| Total | | | 517,417 | | | | (1,305,743 | ) |
(k) Unrealized depreciation on written options on interest rate swap contracts at December 31, 2014 was $788,326.
At December 31, 2014, open interest rate swap contracts were as follows:
| Centrally Cleared Swaps | |
Effective/ Expiration Dates | | Notional Amount ($) | | Cash Flows Paid by the Fund | Cash Flows Received by the Fund | | Value ($) | | | Unrealized Appreciation/ (Depreciation) ($) | |
12/16/2015 9/18/2017 | | | 700,000 | | Fixed — 1.557% | Floating — LIBOR | | | 861 | | | | 5 | |
12/16/2015 9/18/2045 | | | 4,300,000 | | Fixed — 2.998% | Floating — LIBOR | | | (138,264 | ) | | | (99 | ) |
12/16/2015 9/17/2035 | | | 400,000 | | Fixed — 2.938% | Floating — LIBOR | | | (8,397 | ) | | | (9 | ) |
12/16/2015 9/16/2020 | | | 17,900,000 | | Floating — LIBOR | Fixed — 2.214% | | | (9,560 | ) | | | (27 | ) |
12/16/2015 9/16/2025 | | | 800,000 | | Fixed — 2.64% | Floating — LIBOR | | | (4,737 | ) | | | (10 | ) |
| Total net unrealized depreciation | | | | (140 | ) |
| Bilateral Swap | |
Effective/ Expiration Dates | | Notional Amount ($) | | Cash Flows Paid by the Fund | Cash Flows Received by the Fund | | Value ($) | | | Upfront Payment Paid/(Received) ($) | | | Unrealized Depreciation ($) | |
6/3/2013 6/3/2025 | | | 2,100,000 | 1 | Floating — LIBOR | Fixed — 3.0% | | | (8,267 | ) | | | — | | | | (8,267 | ) |
Counterparties:
1 Nomura International PLC
2 BNP Paribas
3 Citigroup, Inc.
4 Morgan Stanley
5 Barclays Bank PLC
LIBOR: London Interbank Offered Rate
As of December 31, 2014, the Fund had the following open forward foreign currency exchange contracts:
| Contracts to Deliver | | In Exchange For | | Settlement Date | | Unrealized Appreciation ($) | | Counterparty |
| EUR | | | 2,000,000 | | JPY | | | 296,244,000 | | 1/5/2015 | | | 53,134 | | Barclays Bank PLC |
| AUD | | | 2,200,000 | | NZD | | | 2,343,260 | | 1/5/2015 | | | 31,780 | | BNP Paribas |
| CAD | | | 2,891,632 | | GBP | | | 1,600,000 | | 1/5/2015 | | | 4,997 | | Societe Generale |
| USD | | | 23,260 | | JPY | | | 2,788,000 | | 1/5/2015 | | | 16 | | Societe Generale |
| EUR | | | 1,900,000 | | USD | | | 2,379,131 | | 1/5/2015 | | | 80,035 | | Barclays Bank PLC |
| USD | | | 3,114,711 | | NZD | | | 4,000,000 | | 1/5/2015 | | | 5,489 | | Australia & New Zealand Banking Group Ltd. |
| MXN | | | 7,950,000 | | USD | | | 576,495 | | 1/15/2015 | | | 37,976 | | JPMorgan Chase Securities, Inc. |
| EUR | | | 421,000 | | USD | | | 533,181 | | 1/15/2015 | | | 23,695 | | Citigroup, Inc. |
| EUR | | | 2,391,400 | | USD | | | 3,008,432 | | 1/20/2015 | | | 114,255 | | Societe Generale |
| SGD | | | 4,592,490 | | USD | | | 3,612,450 | | 1/20/2015 | | | 146,897 | | Australia & New Zealand Banking Group Ltd. |
| CAD | | | 1,902,000 | | USD | | | 1,684,886 | | 1/20/2015 | | | 48,401 | | Societe Generale |
| CAD | | | 1,659,070 | | USD | | | 1,468,105 | | 1/20/2015 | | | 40,637 | | Australia & New Zealand Banking Group Ltd. |
| NZD | | | 2,400,000 | | USD | | | 1,872,943 | | 2/5/2015 | | | 6,331 | | Australia & New Zealand Banking Group Ltd. |
| NZD | | | 2,301,200 | | AUD | | | 2,200,000 | | 2/5/2015 | | | 2,262 | | Australia & New Zealand Banking Group Ltd. |
| USD | | | 10,445 | | RUB | | | 697,740 | | 2/17/2015 | | | 802 | | Barclays Bank PLC |
| Total unrealized appreciation | | | | | 596,707 | |
| Contracts to Deliver | | In Exchange For | | Settlement Date | | Unrealized Depreciation ($) | | Counterparty |
| GBP | | | 1,600,000 | | CAD | | | 2,869,232 | | 1/5/2015 | | | (24,276 | ) | UBS AG |
| NZD | | | 2,386,549 | | AUD | | | 2,200,000 | | 1/5/2015 | | | (65,548 | ) | Australia & New Zealand Banking Group Ltd. |
| JPY | | | 299,032,000 | | EUR | | | 2,000,000 | | 1/5/2015 | | | (76,410 | ) | Barclays Bank PLC |
| NZD | | | 2,322,188 | | AUD | | | 2,200,000 | | 1/5/2015 | | | (15,343 | ) | Morgan Stanley |
| USD | | | 2,432,768 | | JPY | | | 290,000,000 | | 1/5/2015 | | | (11,662 | ) | UBS AG |
| USD | | | 2,315,483 | | EUR | | | 1,900,000 | | 1/5/2015 | | | (16,387 | ) | Societe Generale |
| AUD | | | 2,200,000 | | NZD | | | 2,299,279 | | 1/5/2015 | | | (2,527 | ) | Australia & New Zealand Banking Group Ltd. |
| USD | | | 17,904 | | NZD | | | 22,909 | | 1/5/2015 | | | (34 | ) | Citigroup, Inc. |
| USD | | | 19,335 | | CAD | | | 22,400 | | 1/5/2015 | | | (56 | ) | Citigroup, Inc. |
| NZD | | | 4,000,000 | | USD | | | 3,069,940 | | 1/5/2015 | | | (50,260 | ) | Australia & New Zealand Banking Group Ltd. |
| USD | | | 470,448 | | ZAR | | | 5,350,000 | | 1/15/2015 | | | (8,693 | ) | UBS AG |
| USD | | | 57,358 | | ZAR | | | 650,000 | | 1/15/2015 | | | (1,257 | ) | Commonwealth Bank of Australia |
| USD | | | 412,960 | | ZAR | | | 4,700,000 | | 1/15/2015 | | | (7,306 | ) | Citigroup, Inc. |
| USD | | | 618,140 | | ZAR | | | 7,050,000 | | 1/15/2015 | | | (9,659 | ) | BNP Paribas |
| USD | | | 1,167,997 | | MXN | | | 15,900,000 | | 1/15/2015 | | | (90,959 | ) | JPMorgan Chase Securities, Inc. |
| USD | | | 3,508,189 | | SGD | | | 4,592,490 | | 1/20/2015 | | | (42,636 | ) | BNP Paribas |
| NZD | | | 3,259,000 | | USD | | | 2,524,187 | | 1/20/2015 | | | (14,500 | ) | Australia & New Zealand Banking Group Ltd. |
| USD | | | 1,434,717 | | EUR | | | 1,121,400 | | 1/20/2015 | | | (77,550 | ) | Citigroup, Inc. |
| USD | | | 1,464,655 | | CAD | | | 1,659,070 | | 1/20/2015 | | | (37,188 | ) | Societe Generale |
| GBP | | | 1,600,000 | | CAD | | | 2,892,846 | | 2/5/2015 | | | (5,006 | ) | Societe Generale |
| USD | | | 43,093 | | ZAR | | | 500,000 | | 2/10/2015 | | | (118 | ) | Citigroup, Inc. |
| RUB | | | 697,740 | | USD | | | 10,839 | | 2/17/2015 | | | (407 | ) | Barclays Bank PLC |
| Total unrealized depreciation | | | | | (557,782 | ) |
| Currency Abbreviations |
AUD Australian Dollar BRL Brazilian Real CAD Canadian Dollar EUR Euro GBP British Pound HUF Hungarian Forint JPY Japanese Yen MXN Mexican Peso NZD New Zealand Dollar PEN Peruvian Nuevo Sol RUB Russian Ruble SGD Singapore Dollar USD United States Dollar ZAR South African Rand |
For information on the Fund's policy and additional disclosures regarding futures contracts, interest rate swap contracts, forward foreign currency exchange contracts and written options contracts, please refer to Note B in the accompanying Notes to Financial Statements.
Fair Value Measurements
Various inputs are used in determining the value of the Fund's investments. These inputs are summarized in three broad levels. Level 1 includes quoted prices in active markets for identical securities. Level 2 includes other significant observable inputs (including quoted prices for similar securities, interest rates, prepayment speeds and credit risk). Level 3 includes significant unobservable inputs (including the Fund's own assumptions in determining the fair value of investments). The level assigned to the securities valuations may not be an indication of the risk or liquidity associated with investing in those securities.
The following is a summary of the inputs used as of December 31, 2014 in valuing the Fund's investments. For information on the Fund's policy regarding the valuation of investments, please refer to the Security Valuation section of Note A in the accompanying Notes to Financial Statements. | Assets | | Level 1 | | | Level 2 | | | Level 3 | | | Total | |
| | |
| Common Stocks | | | | | | | | | | | | |
| Consumer Discretionary | | $ | 8,819,129 | | | $ | 4,814,855 | | | $ | 1,831 | | | $ | 13,635,815 | |
| Consumer Staples | | | 8,517,064 | | | | 3,081,043 | | | | — | | | | 11,598,107 | |
| Energy | | | 6,123,576 | | | | 4,745,811 | | | | — | | | | 10,869,387 | |
| Financials | | | 18,372,205 | | | | 15,863,638 | | | | — | | | | 34,235,843 | |
| Health Care | | | 9,062,326 | | | | 1,997,789 | | | | 0 | | | | 11,060,115 | |
| Industrials | | | 5,970,983 | | | | 6,590,947 | | | | — | | | | 12,561,930 | |
| Information Technology | | | 13,639,688 | | | | 1,443,605 | | | | — | | | | 15,083,293 | |
| Materials | | | 2,274,849 | | | | 1,919,142 | | | | — | | | | 4,193,991 | |
| Telecommunication Services | | | 2,217,583 | | | | 4,828,438 | | | | — | | | | 7,046,021 | |
| Utilities | | | 7,469,443 | | | | 3,605,046 | | | | — | | | | 11,074,489 | |
| Preferred Stocks (l) | | | — | | | | 1,429,618 | | | | — | | | | 1,429,618 | |
| Rights (l) | | | — | | | | 4,189 | | | | — | | | | 4,189 | |
| Warrants (l) | | | — | | | | — | | | | 14,341 | | | | 14,341 | |
| Fixed Income Investments (l) | | | | | | | | | | | | | | | | |
| Corporate Bonds | | | — | | | | 62,736,098 | | | | — | | | | 62,736,098 | |
| Asset-Backed | | | — | | | | 1,498,637 | | | | — | | | | 1,498,637 | |
| Mortgage-Backed Securities Pass-Throughs | | | — | | | | 2,366,785 | | | | — | | | | 2,366,785 | |
| Commercial Mortgage-Backed Securities | | | — | | | | 1,015,531 | | | | — | | | | 1,015,531 | |
| Collateralized Mortgage Obligations | | | — | | | | 2,457,969 | | | | — | | | | 2,457,969 | |
| Government & Agency Obligations | | | — | | | | 18,933,393 | | | | — | | | | 18,933,393 | |
| Municipal Bonds and Notes | | | — | | | | 333,613 | | | | — | | | | 333,613 | |
| Convertible Bond | | | — | | | | — | | | | 361,536 | | | | 361,536 | |
| Preferred Security | | | — | | | | 36,000 | | | | — | | | | 36,000 | |
| Short-Term Investments (l) | | | 33,394,638 | | | | — | | | | — | | | | 33,394,638 | |
| Derivatives (m) | | | | | | | | | | | | | | | | |
| Futures Contracts | | | 87,917 | | | | — | | | | — | | | | 87,917 | |
| Interest Rate Swap Contracts | | | — | | | | 5 | | | | — | | | | 5 | |
| Forward Foreign Currency Exchange Contracts | | | — | | | | 596,707 | | | | — | | | | 596,707 | |
| Total | | $ | 115,949,401 | | | $ | 140,298,859 | | | $ | 377,708 | | | $ | 256,625,968 | |
| Liabilities | | Level 1 | | | Level 2 | | | Level 3 | | | Total | |
| | |
Derivatives (m) | |
| Futures Contracts | | $ | (133,836 | ) | | $ | — | | | $ | — | | | $ | (133,836 | ) |
| Written Options | | | — | | | | (1,305,743 | ) | | | — | | | | (1,305,743 | ) |
| Interest Rate Swap Contracts | | | — | | | | (8,412 | ) | | | — | | | | (8,412 | ) |
| Forward Foreign Currency Exchange Contracts | | | — | | | | (557,782 | ) | | | — | | | | (557,782 | ) |
| Total | | $ | (133,836 | ) | | $ | (1,871,937 | ) | | $ | — | | | $ | (2,005,773 | ) |
There have been no transfers between fair value measurement levels during the year ended December 31, 2014.
(l) See Investment Portfolio for additional detailed categorizations.
(m) Derivatives include value of unrealized appreciation (depreciation) on open futures contracts, interest rate swap contracts and forward foreign currency exchange contracts, and written options, at value.
The accompanying notes are an integral part of the financial statements.
Statement of Assets and Liabilities | as of December 31, 2014 | |
| Assets | |
Investments: Investments in non-affiliated securities, at value (cost 211,381,132) — including $6,355,717 of securities loaned | | $ | 222,546,701 | |
| Investment in Daily Assets Fund Institutional (cost $6,638,160)* | | | 6,638,160 | |
| Investment in Central Cash Management Fund (cost $26,756,478) | | | 26,756,478 | |
| Total investments in securities, at value (cost $244,775,770) | | | 255,941,339 | |
| Cash | | | 316,324 | |
| Foreign currency, at value (cost $499,953) | | | 494,773 | |
| Receivable for investments sold | | | 168,801 | |
| Receivable for investments sold — when-issued/delayed delivery security | | | 1,251,204 | |
| Receivable for Fund shares sold | | | 95,425 | |
| Dividends receivable | | | 197,959 | |
| Interest receivable | | | 1,158,208 | |
| Receivable for variation margin on centrally cleared swaps | | | 43,090 | |
| Unrealized appreciation on forward foreign currency exchange contracts | | | 596,707 | |
| Foreign taxes recoverable | | | 111,037 | |
| Other assets | | | 5,166 | |
| Total assets | | | 260,380,033 | |
| Liabilities | |
| Payable upon return of securities loaned | | | 6,638,160 | |
| Payable for investments purchased | | | 702,534 | |
| Payable for investments purchased — when-issued/delayed delivery securities | | | 3,528,052 | |
| Payable for Fund shares redeemed | | | 140,520 | |
| Payable for variation margin on futures contracts | | | 39,418 | |
| Options written, at value (premium received $517,417) | | | 1,305,743 | |
| Unrealized depreciation on bilateral swap contracts | | | 8,267 | |
| Unrealized depreciation on forward foreign currency exchange contracts | | | 557,782 | |
| Accrued management fee | | | 78,270 | |
| Accrued Trustees' fees | | | 5,701 | |
| Other accrued expenses and payables | | | 205,357 | |
| Total liabilities | | | 13,209,804 | |
| Net assets, at value | | $ | 247,170,229 | |
| Net Assets Consist of | |
| Undistributed net investment income | | | 7,197,938 | |
Net unrealized appreciation (depreciation) on: Investments | | | 11,165,569 | |
| Swap contracts | | | (8,407 | ) |
| Futures | | | (45,919 | ) |
| Foreign currency | | | 23,222 | |
| Written options | | | (788,326 | ) |
| Accumulated net realized gain (loss) | | | 5,835,531 | |
| Paid-in capital | | | 223,790,621 | |
| Net assets, at value | | $ | 247,170,229 | |
Class A Net Asset Value, offering and redemption price per share ($247,170,229 ÷ 10,040,081 outstanding shares of beneficial interest, no par value, unlimited number of shares authorized) | | $ | 24.62 | |
* Represents collateral on securities loaned.
The accompanying notes are an integral part of the financial statements.
| for the year ended December 31, 2014 | |
| Investment Income | |
Income: Dividends (net of foreign taxes withheld of $213,282) | | $ | 4,370,167 | |
| Interest | | | 4,530,878 | |
| Income distributions — Central Cash Management Fund | | | 13,280 | |
| Securities lending income, including income from Daily Assets Fund Institutional, net of borrower rebates | | | 71,864 | |
| Total income | | | 8,986,189 | |
Expenses: Management fee | | | 961,149 | |
| Administration fee | | | 260,499 | |
| Services to shareholders | | | 1,636 | |
| Custodian fee | | | 121,687 | |
| Professional fees | | | 98,388 | |
| Reports to shareholders | | | 63,323 | |
| Trustees' fees and expenses | | | 15,477 | |
| Other | | | 84,295 | |
| Total expenses | | | 1,606,454 | |
| Net investment income | | | 7,379,735 | |
| Realized and Unrealized Gain (Loss) | |
Net realized gain (loss) from: Investments | | | 6,967,711 | |
| Swap contracts | | | (1,346,021 | ) |
| Futures | | | 860,875 | |
| Written options | | | 219,730 | |
| Foreign currency | | | 556,145 | |
| | | | 7,258,440 | |
Change in net unrealized appreciation (depreciation) on: Investments | | | (2,573,833 | ) |
| Swap contracts | | | 67,369 | |
| Futures | | | (1,038,811 | ) |
| Written options | | | (904,713 | ) |
| Foreign currency | | | (203,244 | ) |
| | | | (4,653,232 | ) |
| Net gain (loss) | | | 2,605,208 | |
| Net increase (decrease) in net assets resulting from operations | | $ | 9,984,943 | |
The accompanying notes are an integral part of the financial statements.
Statement of Changes in Net Assets | | | Years Ended December 31, | |
| Increase (Decrease) in Net Assets | | 2014 | | | 2013 | |
Operations: Net investment income | | $ | 7,379,735 | | | $ | 8,106,989 | |
| Net realized gain (loss) | | | 7,258,440 | | | | 30,650,529 | |
| Change in net unrealized appreciation (depreciation) | | | (4,653,232 | ) | | | 1,922,701 | |
| Net increase (decrease) in net assets resulting from operations | | | 9,984,943 | | | | 40,680,219 | |
Distributions to shareholders from: Net investment income: Class A | | | (8,047,271 | ) | | | (5,498,634 | ) |
| Net realized gains: Class A | | | (26,528,998 | ) | | | — | |
| Total distributions | | | (34,576,269 | ) | | | (5,498,634 | ) |
Fund share transactions: Class A Proceeds from shares sold | | | 5,731,970 | | | | 7,161,669 | |
| Shares issued to shareholders in reinvestment of distributions | | | 34,576,269 | | | | 5,498,634 | |
| Payments for shares redeemed | | | (37,629,458 | ) | | | (39,157,373 | ) |
| Net increase (decrease) in net assets from Class A share transactions | | | 2,678,781 | | | | (26,497,070 | ) |
| Increase (decrease) in net assets | | | (21,912,545 | ) | | | 8,684,515 | |
| Net assets at beginning of period | | | 269,082,774 | | | | 260,398,259 | |
| Net assets at end of period (including undistributed net investment income of $7,197,938 and $7,643,314, respectively) | | $ | 247,170,229 | | | $ | 269,082,774 | |
| Other Information | |
Class A Shares outstanding at beginning of period | | | 9,857,478 | | | | 10,896,924 | |
| Shares sold | | | 223,936 | | | | 284,532 | |
| Shares issued to shareholders in reinvestment of distributions | | | 1,433,510 | | | | 220,917 | |
| Shares redeemed | | | (1,474,843 | ) | | | (1,544,895 | ) |
| Net increase (decrease) in Class A shares | | | 182,603 | | | | (1,039,446 | ) |
| Shares outstanding at end of period | | | 10,040,081 | | | | 9,857,478 | |
The accompanying notes are an integral part of the financial statements.
| | | Years Ended December 31, | |
| Class A | | | 2014 | | | 2013 | | | 2012 | | | 2011 | | | 2010 | |
| Selected Per Share Data | |
| Net asset value, beginning of period | | $ | 27.30 | | | $ | 23.90 | | | $ | 21.49 | | | $ | 22.13 | | | $ | 20.52 | |
Income (loss) from investment operations: Net investment incomea | | | .72 | | | | .78 | | | | .57 | | | | .46 | | | | .39 | |
| Net realized and unrealized gain (loss) | | | .25 | | | | 3.14 | | | | 2.20 | | | | (.75 | ) | | | 1.88 | |
| Total from investment operations | | | .97 | | | | 3.92 | | | | 2.77 | | | | (.29 | ) | | | 2.27 | |
Less distributions from: Net investment income | | | (.85 | ) | | | (.52 | ) | | | (.36 | ) | | | (.35 | ) | | | (.66 | ) |
| Net realized gains | | | (2.80 | ) | | | — | | | | — | | | | — | | | | — | |
| Total distributions | | | (3.65 | ) | | | (.52 | ) | | | (.36 | ) | | | (.35 | ) | | | (.66 | ) |
| Net asset value, end of period | | $ | 24.62 | | | $ | 27.30 | | | $ | 23.90 | | | $ | 21.49 | | | $ | 22.13 | |
| Total Return (%) | | | 3.83 | | | | 16.63 | | | | 12.98 | | | | (1.42 | ) | | | 11.22 | |
| Ratios to Average Net Assets and Supplemental Data | |
| Net assets, end of period ($ millions) | | | 247 | | | | 269 | | | | 260 | | | | 264 | | | | 308 | |
| Ratio of expenses (%) | | | .62 | | | | .60 | | | | .59 | | | | .58 | | | | .65 | |
| Ratio of net investment income (%) | | | 2.83 | | | | 3.07 | | | | 2.48 | | | | 2.09 | | | | 1.89 | |
| Portfolio turnover rate (%) | | | 88 | | | | 182 | | | | 188 | | | | 109 | | | | 203 | |
a Based on average shares outstanding during the period. | |
Notes to Financial Statements
A. Organization and Significant Accounting Policies
Deutsche Global Income Builder VIP (formerly DWS Global Income Builder VIP) (the "Fund") is a diversified series of Deutsche Variable Series II (formerly DWS Variable Series II) (the "Trust"), which is registered under the Investment Company Act of 1940, as amended (the "1940 Act"), as an open-end management investment company organized as a Massachusetts business trust.
The Fund's financial statements are prepared in accordance with accounting principles generally accepted in the United States of America which require the use of management estimates. Actual results could differ from those estimates. The policies described below are followed consistently by the Fund in the preparation of its financial statements.
Security Valuation. Investments are stated at value determined as of the close of regular trading on the New York Stock Exchange on each day the exchange is open for trading.
Various inputs are used in determining the value of the Fund's investments. These inputs are summarized in three broad levels. Level 1 includes quoted prices in active markets for identical securities. Level 2 includes other significant observable inputs (including quoted prices for similar securities, interest rates, prepayment speeds and credit risk). Level 3 includes significant unobservable inputs (including the Fund's own assumptions in determining the fair value of investments). The level assigned to the securities valuations may not be an indication of the risk or liquidity associated with investing in those securities.
Equity securities are valued at the most recent sale price or official closing price reported on the exchange (U.S. or foreign) or over-the-counter market on which they trade. Securities for which no sales are reported are valued at the calculated mean between the most recent bid and asked quotations on the relevant market or, if a mean cannot be determined, at the most recent bid quotation. Equity securities are generally categorized as Level 1. For certain international equity securities, in order to adjust for events which may occur between the close of the foreign exchanges and the close of the New York Stock Exchange, a fair valuation model may be used. This fair valuation model takes into account comparisons to the valuation of American Depository Receipts (ADRs), exchange-traded funds, futures contracts and certain indices and these securities are categorized as Level 2.
Debt securities are valued at prices supplied by independent pricing services approved by the Fund's Board. Such services may use various pricing techniques which take into account appropriate factors such as yield, quality, coupon rate, maturity, type of issue, trading characteristics, prepayment speeds and other data, as well as broker quotes. If the pricing services are unable to provide valuations, debt securities are valued at the average of the most recent reliable bid quotations or evaluated prices, as applicable, obtained from broker-dealers. These securities are generally categorized as Level 2.
Money market instruments purchased with an original or remaining maturity of sixty days or less, maturing at par, are valued at amortized cost, which approximates value, and are categorized as Level 2. Investments in open-end investment companies are valued at their net asset value each business day and are categorized as Level 1.
Futures contracts are generally valued at the settlement prices established each day on the exchange on which they are traded and are categorized as Level 1.
Forward currency contracts are valued at the prevailing forward exchange rate of the underlying currencies and are categorized as Level 2.
Swap contracts are valued daily based upon prices supplied by a Board approved pricing vendor, if available, and otherwise are valued at the price provided by the broker-dealer. Swap contracts are generally categorized as Level 2.
Exchange-traded options are valued at the last sale price or, in the absence of a sale, the mean between the closing bid and asked prices or at the most recent asked price (bid for purchased options) if no bid or asked price are available. Exchange-traded options are categorized as Level 1. Over-the-counter written or purchased options are valued at prices supplied by a Board approved pricing vendor, if available, and otherwise are valued at the price provided by the broker-dealer with which the option was traded. Over-the-counter written or purchased options are generally categorized as Level 2.
Securities and other assets for which market quotations are not readily available or for which the above valuation procedures are deemed not to reflect fair value are valued in a manner that is intended to reflect their fair value as determined in accordance with procedures approved by the Board and are generally categorized as Level 3. In accordance with the Fund's valuation procedures, factors considered in determining value may include, but are not limited to, the type of the security; the size of the holding; the initial cost of the security; the existence of any contractual restrictions on the security's disposition; the price and extent of public trading in similar securities of the issuer or of comparable companies; quotations or evaluated prices from broker-dealers and/or pricing services; information obtained from the issuer, analysts, and/or the appropriate stock exchange (for exchange-traded securities); an analysis of the company's or issuer's financial statements; an evaluation of the forces that influence the issuer and the market(s) in which the security is purchased and sold; and with respect to debt securities, the maturity, coupon, creditworthiness, currency denomination and the movement of the market in which the security is normally traded. The value determined under these procedures may differ from published values for the same securities.
Disclosure about the classification of fair value measurements is included in a table following the Fund's Investment Portfolio.
Foreign Currency Translations. The books and records of the Fund are maintained in U.S. dollars. Investment securities and other assets and liabilities denominated in a foreign currency are translated into U.S. dollars at the prevailing exchange rates at period end. Purchases and sales of investment securities, income and expenses are translated into U.S. dollars at the prevailing exchange rates on the respective dates of the transactions.
Net realized and unrealized gains and losses on foreign currency transactions represent net gains and losses between trade and settlement dates on securities transactions, the acquisition and disposition of foreign currencies, and the difference between the amount of net investment income accrued and the U.S. dollar amount actually received. That portion of both realized and unrealized gains and losses on investments that results from fluctuations in foreign currency exchange rates is not separately disclosed but is included with net realized and unrealized gain/appreciation and loss/depreciation on investments.
Securities Lending. Deutsche Bank AG, as lending agent, lends securities of the Fund to certain financial institutions under the terms of the Security Lending Agreement. The Fund retains the benefits of owning the securities it has loaned and continues to receive interest and dividends generated by the securities and to participate in any changes in their market value. The Fund requires the borrowers of the securities to maintain collateral with the Fund consisting of either cash or liquid, unencumbered assets having a value at least equal to the value of the securities loaned. When the collateral falls below specified amounts, the lending agent will use its best effort to obtain additional collateral on the next business day to meet required amounts under the security lending agreement. The Fund may invest the cash collateral into a joint trading account in an affiliated money market fund pursuant to Exemptive Orders issued by the SEC. The Fund receives compensation for lending its securities either in the form of fees or by earning interest on invested cash collateral net of borrower rebates and fees paid to a lending agent. Either the Fund or the borrower may terminate the loan. There may be risks of delay and costs in recovery of securities or even loss of rights in the collateral should the borrower of the securities fail financially. If the Fund is not able to recover securities lent, the Fund may sell the collateral and purchase a replacement investment in the market, incurring the risk that the value of the replacement security is greater than the value of the collateral. The Fund is also subject to all investment risks associated with the reinvestment of any cash collateral received, including, but not limited to, interest rate, credit and liquidity risk associated with such investments.
As of December 31, 2014, the Fund had securities on loan. The value of the related collateral exceeded the value of the securities loaned at period end.
When-Issued/Delayed Delivery Securities. The Fund may purchase or sell securities with delivery or payment to occur at a later date beyond the normal settlement period. At the time the Fund enters into a commitment to purchase or sell a security, the transaction is recorded and the value of the transaction is reflected in the net asset value. The price of such security and the date when the security will be delivered and paid for are fixed at the time the transaction is negotiated. The value of the security may vary with market fluctuations. At the time the Fund enters into a purchase transaction it is required to segregate cash or other liquid assets at least equal to the amount of the commitment. Additionally, the Fund may be required to post securities and/or cash collateral in accordance with the terms of the commitment.
Certain risks may arise upon entering into when-issued or delayed delivery transactions from the potential inability of counterparties to meet the terms of their contracts or if the issuer does not issue the securities due to political, economic, or other factors. Additionally, losses may arise due to changes in the value of the underlying securities.
Taxes. The Fund's policy is to comply with the requirements of the Internal Revenue Code, as amended, which are applicable to regulated investment companies and to distribute all of its taxable income to its shareholders.
Additionally, the Fund may be subject to taxes imposed by the governments of countries in which it invests and are generally based on income and/or capital gains earned or repatriated. Estimated tax liabilities on certain foreign securities are recorded on an accrual basis and are reflected as components of interest income or net change in unrealized gain/loss on investments. Tax liabilities realized as a result of security sales are reflected as a component of net realized gain/loss on investments.
The Fund has reviewed the tax positions for the open tax years as of December 31, 2014 and has determined that no provision for income tax and/or uncertain tax provisions is required in the Fund's financial statements. The Fund's federal tax returns for the prior three fiscal years remain open subject to examination by the Internal Revenue Service.
Distribution of Income and Gains. Distributions from net investment income of the Fund, if any, are declared and distributed to shareholders annually. Net realized gains from investment transactions, in excess of available capital loss carryforwards, would be taxable to the Fund if not distributed and, therefore, will be distributed to shareholders at least annually. The Fund may also make additional distributions for tax purposes if necessary.
The timing and characterization of certain income and capital gain distributions are determined annually in accordance with federal tax regulations which may differ from accounting principles generally accepted in the United States of America. These differences primarily relate to investments in foreign denominated investments, forward currency contracts, futures contracts, swap contracts and certain securities sold at a loss. As a result, net investment income (loss) and net realized gain (loss) on investment transactions for a reporting period may differ significantly from distributions during such period. Accordingly, the Fund may periodically make reclassifications among certain of its capital accounts without impacting the net asset value of the Fund.
At December 31, 2014, the Fund's components of distributable earnings on a tax basis were as follows:
| Undistributed ordinary income* | | $ | 11,604,615 | |
| Undistributed net long-term capital gains | | $ | 1,847,642 | |
| Unrealized appreciation (depreciation) on investments | | $ | 10,711,004 | |
In addition, the tax character of distributions paid by the Fund is summarized as follows:
| | | Years Ended December 31, | |
| | | 2014 | | | 2013 | |
| Distributions from ordinary income* | | $ | 12,402,934 | | | $ | 5,498,634 | |
| Distributions from long-term capital gains | | $ | 22,173,335 | | | $ | — | |
* For tax purposes, short-term capital gain distributions are considered ordinary income distributions.
Expenses. Expenses of the Trust arising in connection with a specific fund are allocated to that fund. Other Trust expenses which cannot be directly attributed to a fund are apportioned among the funds in the Trust based upon the relative net assets or other appropriate measures.
Contingencies. In the normal course of business, the Fund may enter into contracts with service providers that contain general indemnification clauses. The Fund's maximum exposure under these arrangements is unknown as this would involve future claims that may be made against the Fund that have not yet been made. However, based on experience, the Fund expects the risk of loss to be remote.
Other. Investment transactions are accounted for on a trade date plus one basis for daily net asset value calculations. However, for financial reporting purposes, investment transactions are reported on trade date. Interest income is recorded on the accrual basis. Dividend income is recorded on the ex-dividend date net of foreign withholding taxes. Certain dividends from foreign securities may be recorded subsequent to the ex-dividend date as soon as the Fund is informed of such dividends. Realized gains and losses from investment transactions are recorded on an identified cost basis. Proceeds from litigation payments, if any, are included in net realized gain (loss) from investments. All discounts and premiums are accreted/amortized for both tax and financial reporting purposes, with the exception of securities in default of principal.
B. Derivative Instruments
Swaps. A swap is a contract between two parties to exchange future cash flows at periodic intervals based on the notional amount of the swap. A bilateral swap is a transaction between the fund and a counterparty where cash flows are exchanged between the two parties. A centrally cleared swap is a transaction executed between the fund and a counterparty, then cleared by a clearing member through a central clearinghouse. The central clearinghouse serves as the counterparty, with whom the fund exchanges cash flows.
The value of a swap is adjusted daily, and the change in value, if any, is recorded as unrealized appreciation or depreciation in the Statement of Assets and Liabilities. Gains or losses are realized when the swap expires or is closed. Certain risks may arise when entering into swap transactions including counterparty default; liquidity; or unfavorable changes in interest rates or the value of the underlying reference security, commodity or index. In connection with bilateral swaps, securities and/or cash may be identified as collateral in accordance with the terms of the swap agreement to provide assets of value and recourse in the event of default. The maximum counterparty credit risk is the net present value of the cash flows to be received from or paid to the counterparty over the term of the swap, to the extent that this amount is beneficial to the Fund, in addition to any related collateral posted to the counterparty by the Fund. This risk may be partially reduced by a master netting arrangement between the Fund and the counterparty. Upon entering into a centrally cleared swap, the Fund is required to deposit with a financial intermediary cash or securities ("initial margin") in an amount equal to a certain percentage of the notional amount of the swap. Subsequent payments ("variation margin") are made or received by the Fund dependent upon the daily fluctuations in the value of the swap. In a cleared swap transaction, counterparty risk is minimized as the central clearinghouse acts as the counterparty.
An upfront payment, if any, made by the Fund is recorded as an asset in the Statement of Assets and Liabilities. An upfront payment, if any, received by the Fund is recorded as a liability in the Statement of Assets and Liabilities. Payments received or made at the end of the measurement period are recorded as realized gain or loss in the Statement of Operations.
Interest Rate Swaps. Interest rate swaps are agreements in which the Fund agrees to pay to the counterparty a fixed rate payment in exchange for the counterparty agreeing to pay to the Fund a variable rate payment, or the Fund agrees to receive from the counterparty a fixed rate payment in exchange for the counterparty agreeing to receive from the Fund a variable rate payment. The payment obligations are based on the notional amount of the swap. For the year ended December 31, 2014, the Fund entered into interest rate swap agreements to gain exposure to different parts of the yield curve while managing overall duration.
A summary of the open interest rate swap contracts as of December 31, 2014 is included in a table following the Fund's Investment Portfolio. For the year ended December 31, 2014, the investment in interest rate swap contracts had a total notional amount generally indicative of a range from approximately $10,500,000 to $26,200,000.
Credit Default Swaps. Credit default swaps are agreements between a buyer and a seller of protection against predefined credit events for the reference entity. The Fund may enter into credit default swaps to gain exposure to an underlying issuer's credit quality characteristics without directly investing in that issuer or to hedge against the risk of a credit event on debt securities. As a seller of a credit default swap, the Fund is required to pay the par (or other agreed-upon) value of the referenced entity to the counterparty with the occurrence of a credit event by a third party, such as a U.S. or foreign corporate issuer, on the reference entity, which would likely result in a loss to the Fund. In return, the Fund receives from the counterparty a periodic stream of payments over the term of the swap provided that no credit event has occurred. If no credit event occurs, the Fund keeps the stream of payments with no payment obligations. The Fund may also buy credit default swaps, in which case the Fund functions as the counterparty referenced above. This involves the risk that the swap may expire worthless. It also involves counterparty risk that the seller may fail to satisfy its payment obligations to the Fund with the occurrence of a credit event. When the Fund sells a credit default swap, it will cover its commitment. This may be achieved by, among other methods, maintaining cash or liquid assets equal to the aggregate notional value of the reference entities for all outstanding credit default swaps sold by the Fund. For the year ended December 31, 2014, the Fund entered into credit default swap agreements to gain exposure to the underlying issuer's credit quality characteristics.
Under the terms of a credit default swap, the Fund receives or makes periodic payments based on a specified interest rate on a fixed notional amount. These payments are recorded as a realized gain or loss in the Statement of Operations. Payments received or made as a result of a credit event or termination of the swap are recognized, net of a proportional amount of the upfront payment, as realized gains or losses in the Statement of Operations.
There were no open credit default swap contracts as of December 31, 2014. For the year ended December 31, 2014, the investment in credit default swap contracts sold had a total notional value of generally indicative of a range from $0 to $125,000.
Futures Contracts. A futures contract is an agreement between a buyer or seller and an established futures exchange or its clearinghouse in which the buyer or seller agrees to take or make a delivery of a specific amount of a financial instrument at a specified price on a specific date (settlement date). For the year ended December 31, 2014, the Fund entered into interest rate futures to gain exposure to different parts of the yield curve while managing overall duration. The Fund also entered into interest rate futures contracts for non-hedging purposes to seek to enhance potential gains.
Upon entering into a futures contract, the Fund is required to deposit with a financial intermediary cash or securities ("initial margin") in an amount equal to a certain percentage of the face value indicated in the futures contract. Subsequent payments ("variation margin") are made or received by the Fund dependent upon the daily fluctuations in the value and are recorded for financial reporting purposes as unrealized gains or losses by the Fund. Gains or losses are realized when the contract expires or is closed. Since all futures contracts are exchange-traded, counterparty risk is minimized as the exchange's clearinghouse acts as the counterparty, and guarantees the futures against default.
Certain risks may arise upon entering into futures contracts, including the risk that an illiquid market will limit the Fund's ability to close out a futures contract prior to the settlement date and the risk that the futures contract is not well correlated with the security, index or currency to which it relates. Risk of loss may exceed amounts disclosed in the Statement of Assets and Liabilities.
A summary of the open futures contracts as of December 31, 2014 is included in a table following the Fund's Investment Portfolio. For the year ended December 31, 2014, the investment in futures contracts purchased had a total notional value generally indicative of a range from approximately $7,994,000 to $43,210,000, and the investment in futures contracts sold had a total notional value generally indicative of a range from approximately $5,641,000 to $57,469,000.
Options. An option contract is a contract in which the writer (seller) of the option grants the buyer of the option, upon payment of a premium, the right to purchase from (call option), or sell to (put option), the writer a designated instrument at a specified price within a specified period of time. The Fund may write or purchase interest rate swaption agreements which are options to enter into a pre-defined swap agreement. The interest rate swaption agreement will specify whether the buyer of the swaption will be a fixed-rate receiver or a fixed-rate payer upon exercise. Certain options, including options on indices and interest rate options, will require cash settlement by the Fund if exercised. For the year ended December 31, 2014, the Fund entered into options on interest rate swaps in order to hedge against potential adverse interest rate movements of portfolio assets.
If the Fund writes a covered call option, the Fund foregoes, in exchange for the premium, the opportunity to profit during the option period from an increase in the market value of the underlying security above the exercise price. If the Fund writes a put option it accepts the risk of a decline in the value of the underlying security below the exercise price. Over-the-counter options have the risk of the potential inability of counterparties to meet the terms of their contracts. For exchange traded contracts, the counterparty risk is minimized as the exchange's clearinghouse acts as the counterparty, and guarantees the futures against default. The Fund's maximum exposure to purchased options is limited to the premium initially paid. In addition, certain risks may arise upon entering into option contracts including the risk that an illiquid secondary market will limit the Fund's ability to close out an option contract prior to the expiration date and that a change in the value of the option contract may not correlate exactly with changes in the value of the securities or currencies hedged.
A summary of open written option contracts is included in a table following the Fund's Investment Portfolio. For the year ended December 31, 2014, the investment in written option contracts had a total value generally indicative of a range from approximately $133,000 to $1,306,000.
Forward Foreign Currency Exchange Contracts. A forward foreign currency exchange contract ("forward currency contract") is a commitment to purchase or sell a foreign currency at the settlement date at a negotiated rate. For the year ended December 31, 2014, the Fund entered into forward currency contracts in order to hedge its exposure to changes in foreign currency exchange rates on its foreign currency denominated portfolio holdings, to facilitate transactions in foreign currency denominated securities and to enhance total returns.
Forward currency contracts are valued at the prevailing forward exchange rate of the underlying currencies and unrealized gain (loss) is recorded daily. On the settlement date of the forward currency contract, the Fund records a realized gain or loss equal to the difference between the value of the contract at the time it was opened and the value of the contract at the time it was closed. Certain risks may arise upon entering into forward currency contracts from the potential inability of counterparties to meet the terms of their contracts. The maximum counterparty credit risk to the Fund is measured by the unrealized gain on appreciated contracts. Additionally, when utilizing forward currency contracts to hedge, the Fund gives up the opportunity to profit from favorable exchange rate movements during the term of the contract.
A summary of the open forward currency contracts as of December 31, 2014 is included in a table following the Fund's Investment Portfolio. For the year ended December 31, 2014, the investment in forward currency contracts short vs. U.S. dollars had a total contract value generally indicative of a range from approximately $11,372,000 to $30,883,000, and the investment in forward currency contracts long vs. U.S. dollars had a total contract value generally indicative of a range from approximately $4,127,000 to $29,316,000. The investment in forward currency contracts long vs. other foreign currencies sold had a total contract value generally indicative of a range from $0 to approximately $21,540,000.
The following tables summarize the value of the Fund's derivative instruments held as of December 31, 2014 and the related location in the accompanying Statement of Assets and Liabilities, presented by primary underlying risk exposure:
| Asset Derivatives | | Forward Contracts | | | Swap Contracts | | | Futures Contracts | | | Total | |
| Interest Rate Contracts (a) | | $ | — | | | $ | 5 | | | $ | 87,917 | | | $ | 87,922 | |
| Foreign Exchange Contracts (b) | | | 596,707 | | | | — | | | | — | | | | 596,707 | |
| | | $ | 596,707 | | | $ | 5 | | | $ | 87,917 | | | $ | 684,629 | |
Each of the above derivatives is located in the following Statement of Assets and Liabilities accounts: (a) Includes cumulative appreciation of futures and centrally cleared swap contracts as disclosed in the Investment Portfolio. Unsettled variation margin is disclosed separately within the Statement of Assets and Liabilities. (b) Unrealized appreciation on forward foreign currency exchange contracts | |
| Liability Derivatives | | Written Options | | | Forward Contracts | | | Swap Contracts | | | Futures Contracts | | | Total | |
| Interest Rate Contracts (a) (b) | | $ | (1,305,743 | ) | | $ | — | | | $ | (8,412 | ) | | $ | (133,836 | ) | | $ | (1,447,991 | ) |
| Foreign Exchange Contracts (c) | | | — | | | | (557,782 | ) | | | — | | | | — | | | | (557,782 | ) |
| | | $ | (1,305,743 | ) | | $ | (557,782 | ) | | $ | (8,412 | ) | | $ | (133,836 | ) | | $ | (2,005,773 | ) |
Each of the above derivatives is located in the following Statement of Assets and Liabilities accounts: (a) Includes cumulative depreciation of futures and centrally cleared swap contracts as disclosed in the Investment Portfolio. Unsettled variation margin is disclosed separately within the Statement of Assets and Liabilities. (b) Options written, at value and unrealized depreciation on bilateral swap contracts, respectively (c) Unrealized depreciation on forward foreign currency exchange contracts | |
Additionally, the amount of unrealized and realized gains and losses on derivative instruments recognized in Fund earnings during the year ended December 31, 2014 and the related location in the accompanying Statement of Operations is summarized in the following tables by primary underlying risk exposure:
| Realized Gain (Loss) | | Written Options | | | Forward Contracts | | | Swap Contracts | | | Futures Contracts | | | Total | |
| Interest Rate Contracts (a) | | $ | 219,730 | | | $ | — | | | $ | (1,355,195 | ) | | $ | 860,875 | | | $ | (274,590 | ) |
| Credit Contracts (a) | | | — | | | | — | | | | 9,174 | | | | — | | | | 9,174 | |
| Foreign Exchange Contracts (b) | | | — | | | | 770,535 | | | | — | | | | — | | | | 770,535 | |
| | | $ | 219,730 | | | $ | 770,535 | | | $ | (1,346,021 | ) | | $ | 860,875 | | | $ | 505,119 | |
Each of the above derivatives is located in the following Statement of Operations accounts: (a) Net realized gain (loss) from written options, swap contracts and futures, respectively (b) Net realized gain (loss) from foreign currency (Statement of Operations includes both forward currency contracts and foreign currency transactions) | |
| Change in Net Unrealized Appreciation (Depreciation) | | Written Options | | | Forward Contracts | | | Swap Contracts | | | Futures Contracts | | | Total | |
| Interest Rate Contracts (a) | | $ | (904,713 | ) | | $ | — | | | $ | 78,376 | | | $ | (1,038,811 | ) | | $ | (1,865,148 | ) |
| Credit Contracts (a) | | | — | | | | — | | | | (11,007 | ) | | | — | | | | (11,007 | ) |
| Foreign Exchange Contracts (b) | | | — | | | | (184,668 | ) | | | — | | | | — | | | | (184,668 | ) |
| | | $ | (904,713 | ) | | $ | (184,668 | ) | | $ | 67,369 | | | $ | (1,038,811 | ) | | $ | (2,060,823 | ) |
Each of the above derivatives is located in the following Statement of Operations accounts: (a) Change in net unrealized appreciation (depreciation) on written options, swap contracts and futures, respectively (b) Change in net unrealized appreciation (depreciation) on foreign currency (Statement of Operations includes both forward currency contracts and foreign currency transactions) | |
As of December 31, 2014, the Fund has transactions subject to enforceable master netting agreements. A reconciliation of the gross amounts on the Statement of Assets and Liabilities to the net amounts by counterparty, including any collateral exposure, is included in the following tables:
| Counterparty | | Gross Amounts of Assets Presented in the Statement of Assets and Liabilities | | | Financial Instruments and Derivatives Available for Offset | | | Cash Collateral Received | | | Non-Cash Collateral Received | | | Net Amount of Derivative Assets | |
| Australia & New Zealand Banking Group Ltd | | $ | 201,616 | | | $ | (132,835 | ) | | $ | — | | | $ | — | | | $ | 68,781 | |
| Barclays Bank PLC | | | 133,971 | | | | (133,971 | ) | | | — | | | | — | | | | — | |
| BNP Paribas | | | 31,780 | | | | (31,780 | ) | | | — | | | | — | | | | — | |
| Citigroup. Inc. | | | 23,695 | | | | (23,695 | ) | | | — | | | | — | | | | — | |
| JPMorgan Chase Securities, Inc. | | | 37,976 | | | | (37,976 | ) | | | — | | | | — | | | | — | |
| Societe Generale | | | 167,669 | | | | (58,581 | ) | | | — | | | | — | | | | 109,088 | |
| | | $ | 596,707 | | | $ | (418,838 | ) | | $ | — | | | $ | — | | | $ | 177,869 | |
| Counterparty | | Gross Amounts of Liabilities Presented in the Statement of Assets and Liabilities | | | Financial Instruments and Derivatives Available for Offset | | | Cash Collateral Pledged | | | Non-Cash Collateral Pledged (a) | | | Net Amount of Derivative Liabilities | |
| Australia & New Zealand Banking Group Ltd | | $ | 132,835 | | | $ | (132,835 | ) | | $ | — | | | $ | — | | | $ | — | |
| Barclays Bank PLC | | | 238,965 | | | | (133,971 | ) | | | — | | | | — | | | | 104,994 | |
| BNP Paribas | | | 262,103 | | | | (31,780 | ) | | | — | | | | — | | | | 230,323 | |
| Citigroup. Inc. | | | 479,502 | | | | (23,695 | ) | | | — | | | | (141,050 | ) | | | 314,757 | |
| Commonwealth Bank of Australia | | | 1,257 | | | | — | | | | — | | | | — | | | | 1,257 | |
| JPMorgan Chase Securities, Inc. | | | 90,959 | | | | (37,976 | ) | | | — | | | | — | | | | 52,983 | |
| Morgan Stanley | | | 314,198 | | | | — | | | | — | | | | (312,325 | ) | | | 1,873 | |
| Nomura International PLC | | | 248,761 | | | | — | | | | — | | | | (248,761 | ) | | | — | |
| Societe Generale | | | 58,581 | | | | (58,581 | ) | | | — | | | | — | | | | — | |
| UBS AG | | | 44,631 | | | | — | | | | — | | | | — | | | | 44,631 | |
| | | $ | 1,871,792 | | | $ | (418,838 | ) | | $ | — | | | $ | (702,136 | ) | | $ | 750,818 | |
(a) The actual collateral pledged may be more than the amount shown.
C. Purchases and Sales of Securities
During the year ended December 31, 2014, purchases and sales of investment transactions (excluding short-term investments and U.S. Treasury obligations) aggregated $196,455,463 and $237,438,164, respectively. Purchases and sales of U.S. Treasury obligations aggregated $11,693,534 and $9,385,783, respectively.
For the year ended December 31, 2014, transactions for written options on interest rate swap contracts were as follows:
| | | Contract Amount | | | Premium | |
| Outstanding, beginning of period | | | 26,600,000 | | | $ | 280,210 | |
| Options written | | | 28,600,000 | | | | 456,937 | |
| Options closed | | | (16,100,000 | ) | | | (204,242 | ) |
| Options expired | | | (2,100,000 | ) | | | (15,488 | ) |
| Outstanding, end of period | | | 37,000,000 | | | $ | 517,417 | |
D. Related Parties
Management Agreement. Under the Investment Management Agreement with Deutsche Investment Management Americas Inc. ("DIMA" or the "Advisor"), an indirect, wholly owned subsidiary of Deutsche Bank AG, the Advisor directs the investments of the Fund in accordance with its investment objectives, policies and restrictions. The Advisor determines the securities, instruments and other contracts relating to investments to be purchased, sold or entered into by the Fund.
Under the Investment Management Agreement, the Fund pays a monthly management fee based on the Fund's average daily net assets, computed and accrued daily and payable monthly, at the following annual rates:
| First $250 million | | | .370 | % |
| Next $750 million | | | .345 | % |
| Over $1 billion | | | .310 | % |
Accordingly, for the year ended December 31, 2014, the fee pursuant to the Investment Management Agreement was equivalent to an annual rate (exclusive of any applicable waivers/reimbursements) of 0.37% of the Fund's average daily net assets.
For the period from January 1, 2014 through September 30, 2014, the Advisor had contractually agreed to waive its fees and/or reimburse certain operating expenses to the extent necessary to maintain the total annual operating expenses (excluding certain expenses such as extraordinary expenses, taxes, brokerage and interest expense) of Class A shares at 0.71%.
Effective October 1, 2014 through September 30, 2015, the Advisor has contractually agreed to waive its fees and/or reimburse certain operating expenses to the extent necessary to maintain the total annual operating expenses (excluding certain expenses such as extraordinary expenses, taxes, brokerage and interest expense) of Class A shares at 0.73%.
Administration Fee. Pursuant to an Administrative Services Agreement, DIMA provides most administrative services to the Fund. For all services provided under the Administrative Services Agreement, the Fund pays DIMA an annual fee ("Administration Fee") of 0.10% of the Fund's average daily net assets, computed and accrued daily and payable monthly. For the year ended December 31, 2014, the Administration Fee was $260,499, of which $21,158 is unpaid.
Service Provider Fees. DeAWM Service Company ("DSC"), an affiliate of the Advisor, is the transfer agent, dividend-paying agent and shareholder service agent for the Fund. Pursuant to a sub-transfer agency agreement between DSC and DST Systems, Inc. ("DST"), DSC has delegated certain transfer agent, dividend-paying agent and shareholder service agent functions to DST. DSC compensates DST out of the shareholder servicing fee it receives from the Fund. For the year ended December 31, 2014, the amounts charged to the Fund by DSC aggregated $395, of which $66 is unpaid.
Typesetting and Filing Service Fees. Under an agreement with DIMA, DIMA is compensated for providing typesetting and certain regulatory filing services to the Fund. For the year ended December 31, 2014, the amount charged to the Fund by DIMA included in the Statement of Operations under "Reports to shareholders" aggregated $20,383, of which $8,500 is unpaid.
Trustees' Fees and Expenses. The Fund paid retainer fees to each Trustee not affiliated with the Advisor, plus specified amounts to the Board Chairperson and Vice Chairperson and to each committee Chairperson.
Affiliated Cash Management Vehicles. The Fund may invest uninvested cash balances in Central Cash Management Fund and Deutsche Variable NAV Money Fund, affiliated money market funds which are managed by the Advisor. Each affiliated money market fund seeks to provide a high level of current income consistent with liquidity and the preservation of capital. Each affiliated money market fund is managed in accordance with Rule 2a-7 under the Investment Company Act of 1940, which governs the quality, maturity, diversity and liquidity of instruments in which a money market fund may invest. Central Cash Management Fund seeks to maintain a stable net asset value, and Deutsche Variable NAV Money Fund maintains a floating net asset value. The Fund indirectly bears its proportionate share of the expenses of each affiliated money market fund in which it invests. Central Cash Management Fund does not pay the Advisor an investment management fee. To the extent that Deutsche Variable NAV Money Fund pays an investment management fee to the Advisor, the Advisor will waive an amount of the investment management fee payable to the Advisor by the Fund equal to the amount of the investment management fee payable on the Fund's assets invested in Deutsche Variable NAV Money Fund.
Securities Lending Agent Fees. Deutsche Bank AG serves as securities lending agent for the Fund. For the year ended December 31, 2014, the Fund incurred securities lending agent fees to Deutsche Bank AG in the amount of $6,261.
E. Ownership of the Fund
At December 31, 2014, three participating insurance companies were owners of record of 10% or more of the total outstanding shares of the Fund, each owning 44%, 21 and 16%.
F. Line of Credit
The Fund and other affiliated funds (the "Participants") share in a $400 million revolving credit facility provided by a syndication of banks. The Fund may borrow for temporary or emergency purposes, including the meeting of redemption requests that otherwise might require the untimely disposition of securities. The Participants are charged an annual commitment fee which is allocated based on net assets, among each of the Participants. Interest is calculated at a rate per annum equal to the sum of the Federal Funds Rate plus 1.25 percent plus if LIBOR exceeds the Federal Funds Rate the amount of such excess. The Fund may borrow up to a maximum of 33 percent of its net assets under the agreement. The Fund had no outstanding loans at December 31, 2014.
Report of Independent Registered Public Accounting Firm
To the Board of Trustees of Deutsche Variable Series II and the Shareholders of Deutsche Global Income Builder VIP:
We have audited the accompanying statement of assets and liabilities, including the investment portfolio, of Deutsche Global Income Builder VIP (formerly DWS Global Income Builder VIP) (the "Fund") (one of the series constituting Deutsche Variable Series II (formerly DWS Variable Series II)), as of December 31, 2014, and the related statement of operations for the year then ended, the statements of changes in net assets for each of the two years in the period then ended, and the financial highlights for each of the periods indicated therein. These financial statements and financial highlights are the responsibility of the Fund’s management. Our responsibility is to express an opinion on these financial statements and financial highlights based on our audits.
We conducted our audits in accordance with the standards of the Public Company Accounting Oversight Board (United States). Those standards require that we plan and perform the audit to obtain reasonable assurance about whether the financial statements and financial highlights are free of material misstatement. We were not engaged to perform an audit of the Fund’s internal control over financial reporting. Our audits included consideration of internal control over financial reporting as a basis for designing audit procedures that are appropriate in the circumstances, but not for the purpose of expressing an opinion on the effectiveness of the Fund’s internal control over financial reporting. Accordingly, we express no such opinion. An audit also includes examining, on a test basis, evidence supporting the amounts and disclosures in the financial statements and financial highlights, assessing the accounting principles used and significant estimates made by management, and evaluating the overall financial statement presentation. Our procedures included confirmation of securities owned as of December 31, 2014, by correspondence with the custodian and brokers or by other appropriate auditing procedures where replies from brokers were not received. We believe that our audits provide
a reasonable basis for our opinion.
In our opinion, the financial statements and financial highlights referred to above present fairly, in all material respects, the financial position of Deutsche Global Income Builder VIP at December 31, 2014, the results of its operations for the year then ended, the changes in its net assets for each of the two years in the period then ended, and the financial highlights for each of the periods indicated therein, in conformity with U.S. generally accepted accounting principles.
| | | |
Boston, Massachusetts February 13, 2015 | | |
Information About Your Fund's Expenses (Unaudited)
As an investor of the Fund, you incur two types of costs: ongoing expenses and transaction costs. Ongoing expenses include management fees and other Fund expenses. Examples of transaction costs include contract charges, which are not shown in this section. The following tables are intended to help you understand your ongoing expenses (in dollars) of investing in the Fund and to help you compare these expenses with the ongoing expenses of investing in other mutual funds. The example in the table is based on an investment of $1,000 invested at the beginning of the six-month period and held for the entire period (July 1, 2014 to December 31, 2014).
The tables illustrate your Fund's expenses in two ways:
—Actual Fund Return. This helps you estimate the actual dollar amount of ongoing expenses (but not transaction costs) paid on a $1,000 investment in the Fund using the Fund's actual return during the period. To estimate the expenses you paid over the period, simply divide your account value by $1,000 (for example, an $8,600 account value divided by $1,000 = 8.6), then multiply the result by the number in the "Expenses Paid per $1,000" line under the share class you hold.
—Hypothetical 5% Fund Return. This helps you to compare your Fund's ongoing expenses (but not transaction costs) with those of other mutual funds using the Fund's actual expense ratio and a hypothetical rate of return of 5% per year before expenses. Examples using a 5% hypothetical Fund return may be found in the shareholder reports of other mutual funds. The hypothetical account values and expenses may not be used to estimate the actual ending account balance or expenses you paid for the period.
Please note that the expenses shown in these tables are meant to highlight your ongoing expenses only and do not reflect any transaction costs. The "Expenses Paid per $1,000" line of the tables is useful in comparing ongoing expenses only and will not help you determine the relative total expense of owning different funds. If these transaction costs had been included, your costs would have been higher.
Expenses and Value of a $1,000 Investment for the six months ended December 31, 2014 | |
| Actual Fund Return | | Class A | |
| Beginning Account Value 7/1/14 | | $ | 1,000.00 | |
| Ending Account Value 12/31/14 | | $ | 985.20 | |
| Expenses Paid per $1,000* | | $ | 3.15 | |
| Hypothetical 5% Fund Return | | Class A | |
| Beginning Account Value 7/1/14 | | $ | 1,000.00 | |
| Ending Account Value 12/31/14 | | $ | 1,022.03 | |
| Expenses Paid per $1,000* | | $ | 3.21 | |
* Expenses are equal to the Fund's annualized expense ratio, multiplied by the average account value over the period, multiplied by 184 (the number of days in the most recent six-month period), then divided by 365.
| Annualized Expense Ratio | Class A | |
| Deutsche Variable Series II — Deutsche Global Income Builder VIP | .63% | |
For more information, please refer to the Fund's prospectus.
These tables do not reflect charges and fees ("contract charges") associated with the separate account that invests in the Fund or any variable life insurance policy or variable annuity contract for which the Fund is an investment option.
For an analysis of the fees associated with an investment in the fund or similar funds, please refer to the current and hypothetical expense calculators for Variable Insurance Products which can be found at deutschefunds.com/EN/resources/calculators.jsp.
Tax Information (Unaudited)
The Fund paid distributions of $2.34 per share from net long-term capital gains during its year ended December 31, 2014.
Pursuant to Section 852 of the Internal Revenue Code, the Fund designates $2,022,000 as capital gain dividends for its year ended December 31, 2014.
For corporate shareholders, 13% of the ordinary dividends (i.e., income dividends plus short-term capital gains) paid during the Fund's fiscal year ended December 31, 2014 qualified for the dividends received deduction.
Please consult a tax advisor if you have questions about federal or state income tax laws, or on how to prepare your tax returns. If you have specific questions about your account, please contact your insurance provider.
The Trust's policies and procedures for voting proxies for portfolio securities and information about how the Trust voted proxies related to its portfolio securities during the 12-month period ended June 30 are available on our Web site — deutschefunds.com (click on "proxy voting" at the bottom of the page) — or on the SEC's Web site — sec.gov. To obtain a written copy of the Trust's policies and procedures without charge, upon request, call us toll free at (800) 728-3337.
Advisory Agreement Board Considerations and Fee Evaluation
The Board of Trustees approved the renewal of Deutsche Global Income Builder VIP’s investment management agreement (the "Agreement") with Deutsche Investment Management Americas Inc. ("DIMA") in September 2014.
In terms of the process that the Board followed prior to approving the Agreement, shareholders should know that:
— In September 2014, all of the Fund’s Trustees were independent of DIMA and its affiliates.
— The Trustees met frequently during the past year to discuss fund matters and dedicated a substantial amount of time to contract review matters. Over the course of several months, the Board’s Contract Committee, in coordination with the Board’s Fixed Income and Asset Allocation Oversight Committee, reviewed comprehensive materials received from DIMA, independent third parties and independent counsel. These materials included an analysis of the Fund’s performance, fees and expenses, and profitability compiled by a fee consultant retained by the Fund’s Independent Trustees (the "Fee Consultant"). The Board also received extensive information throughout the year regarding performance of the Fund.
— The Independent Trustees regularly meet privately with counsel to discuss contract review and other matters. In addition, the Independent Trustees were advised by the Fee Consultant in the course of their review of the Fund’s contractual arrangements and considered a comprehensive report prepared by the Fee Consultant in connection with their deliberations.
— In connection with reviewing the Agreement, the Board also reviewed the terms of the Fund’s distribution agreement, administrative services agreement, transfer agency agreement and other material service agreements.
— Based on its evaluation of the information provided, the Contract Committee presented its findings and recommendations to the Board. The Board then reviewed the Contract Committee’s findings and recommendations.
In connection with the contract review process, the Contract Committee and the Board considered the factors discussed below, among others. The Board also considered that DIMA and its predecessors have managed the Fund since its inception, and the Board believes that a long-term relationship with a capable, conscientious advisor is in the best interests of the Fund. The Board considered, generally, that shareholders chose to invest or remain invested in the Fund knowing that DIMA managed the Fund, and that the Agreement was approved by the Fund’s shareholders. DIMA is part of Deutsche Bank AG ("DB"), a major global banking institution that is engaged in a wide range of financial services. The Board believes that there are advantages to being part of a global asset management business that offers a wide range of investing expertise and resources, including hundreds of portfolio managers and analysts with research capabilities in many countries throughout the world.
As part of the contract review process, the Board carefully considered the fees and expenses of each Deutsche fund overseen by the Board in light of the fund’s performance. In many cases, this led to the negotiation and implementation of expense caps. As part of these negotiations, the Board indicated that it would consider relaxing these caps in future years following sustained improvements in performance, among other considerations.
In 2012, DB combined its Asset Management (of which DIMA was a part) and Wealth Management divisions into a new Asset and Wealth Management ("AWM") division. DB has advised the Independent Trustees that the U.S. asset management business is a critical and integral part of DB, and that DB will continue to invest in AWM a significant portion of the savings it has realized by combining its Asset and Wealth Management divisions, including ongoing enhancements to AWM’s investment capabilities. DB also has confirmed its commitment to maintaining strong legal and compliance groups within the AWM division.
While shareholders may focus primarily on fund performance and fees, the Fund’s Board considers these and many other factors, including the quality and integrity of DIMA’s personnel and such other issues as back-office operations, fund valuations, and compliance policies and procedures.
Nature, Quality and Extent of Services. The Board considered the terms of the Agreement, including the scope of advisory services provided under the Agreement. The Board noted that, under the Agreement, DIMA provides portfolio management services to the Fund and that, pursuant to a separate administrative services agreement, DIMA provides administrative services to the Fund. The Board considered the experience and skills of senior management and investment personnel, the resources made available to such personnel, the ability of DIMA to attract and retain high-quality personnel, and the organizational depth and stability of DIMA. The Board reviewed the Fund’s performance over short-term and long-term periods and compared those returns to various agreed-upon performance measures, including market index(es) and a peer universe compiled by the Fee Consultant using information supplied by Morningstar Direct ("Morningstar"), an independent fund data service. The Board also noted that it has put into place a process of identifying "Focus Funds" (e.g., funds performing poorly relative to a peer universe), and receives more frequent reporting and information from DIMA regarding such funds, along with DIMA’s plans to address underperformance. The Board believes this process is an effective manner of identifying and addressing underperforming funds. Based on the information provided, the Board noted that for the one-, three- and five-year periods ended December 31, 2013, the Fund’s performance (Class A shares) was in the 1st quartile of the applicable Morningstar universe (the 1st quartile being the best performers and the 4th quartile being the worst performers). The Board also observed that the Fund has outperformed its benchmark in the one-, three- and five-year periods ended December 31, 2013.
Fees and Expenses. The Board considered the Fund’s investment management fee schedule, operating expenses and total expense ratios, and comparative information provided by Lipper Inc. ("Lipper") and the Fee Consultant regarding investment management fee rates paid to other investment advisors by similar funds (1st quartile being the most favorable and 4th quartile being the least favorable). With respect to management fees paid to other investment advisors by similar funds, the Board noted that the contractual fee rates paid by the Fund, which include a 0.10% fee paid to DIMA under the Fund’s administrative services agreement, were lower than the median (1st quartile) of the applicable Lipper peer group (based on Lipper data provided as of December 31, 2013). The Board noted that the Fund’s Class A shares total (net) operating expenses were expected to be lower than the median (2nd quartile) of the applicable Lipper expense universe (based on Lipper data provided as of December 31, 2013, and analyzing Lipper expense universe Class A (net) expenses less any applicable 12b-1 fees) ("Lipper Universe Expenses"). The Board also considered how the Fund’s total (net) operating expenses compared to the total (net) operating expenses of a more customized peer group selected by Lipper (based on such factors as asset size). The Board noted that the expense limitation agreed to by DIMA helped to ensure that the Fund’s total (net) operating expenses would remain competitive. The Board considered the Fund’s management fee rate as compared to fees charged by DIMA to a comparable fund and considered differences between the Fund and the comparable fund. The information requested by the Board as part of its review of fees and expenses also included information about institutional accounts and funds offered primarily to European investors ("Deutsche Europe funds") managed by DIMA and its affiliates. The Board noted that DIMA indicated that it does not manage any institutional accounts or Deutsche Europe funds comparable to the Fund.
On the basis of the information provided, the Board concluded that management fees were reasonable and appropriate in light of the nature, quality and extent of services provided by DIMA.
Profitability. The Board reviewed detailed information regarding revenues received by DIMA under the Agreement. The Board considered the estimated costs and pre-tax profits realized by DIMA from advising the Deutsche U.S. mutual funds ("Deutsche Funds"), as well as estimates of the pre-tax profits attributable to managing the Fund in particular. The Board also received information regarding the estimated enterprise-wide profitability of DIMA and its affiliates with respect to all fund services in totality and by fund. The Board and the Fee Consultant reviewed DIMA’s methodology in allocating its costs to the management of the Fund. Based on the information provided, the Board concluded that the pre-tax profits realized by DIMA in connection with the management of the Fund were not unreasonable.
Economies of Scale. The Board considered whether there are economies of scale with respect to the management of the Fund and whether the Fund benefits from any economies of scale. The Board noted that the Fund’s management fee schedule includes fee breakpoints. The Board concluded that the Fund’s fee schedule represents an appropriate sharing between the Fund and DIMA of such economies of scale as may exist in the management of the Fund at current asset levels.
Other Benefits to DIMA and Its Affiliates. The Board also considered the character and amount of other incidental benefits received by DIMA and its affiliates, including any fees received by DIMA for administrative services provided to the Fund and any fees received by an affiliate of DIMA for distribution services. The Board also considered benefits to DIMA related to brokerage and soft-dollar allocations, including allocating brokerage to pay for research generated by parties other than the executing broker dealers, which pertain primarily to funds investing in equity securities, along with the incidental public relations benefits to DIMA related to Deutsche Funds advertising and cross-selling opportunities among DIMA products and services. The Board concluded that management fees were reasonable in light of these fallout benefits.
Compliance. The Board considered the significant attention and resources dedicated by DIMA to documenting and enhancing its compliance processes in recent years. The Board noted in particular (i) the experience and seniority of DIMA’s and the Fund’s chief compliance officer; (ii) the large number of DIMA compliance personnel; and (iii) the substantial commitment of resources by DIMA and its affiliates to compliance matters.
Based on all of the information considered and the conclusions reached, the Board unanimously determined that the continuation of the Agreement is in the best interests of the Fund. In making this determination, the Board did not give particular weight to any single factor identified above. The Board considered these factors over the course of numerous meetings, certain of which were in executive session with only the Independent Trustees and counsel present. It is possible that individual Trustees may have weighed these factors differently in reaching their individual decisions to approve the continuation of the Agreement.
Board Members and Officers
The following table presents certain information regarding the Board Members and Officers of the fund. Each Board Member's year of birth is set forth in parentheses after his or her name. Unless otherwise noted, (i) each Board Member has engaged in the principal occupation(s) noted in the table for at least the most recent five years, although not necessarily in the same capacity; and (ii) the address of each Independent Board Member is c/o Kenneth C. Froewiss, Chairman, Deutsche Mutual Funds, P.O. Box 390601, Cambridge, MA 02139. Except as otherwise noted below, the term of office for each Board Member is until the election and qualification of a successor, or until such Board Member sooner dies, resigns, is removed or as otherwise provided in the governing documents of the fund. Because the fund does not hold an annual meeting of shareholders, each Board Member will hold office for an indeterminate period. The Board Members may also serve in similar capacities with other funds in the fund complex.
| Independent Board Members |
Name, Year of Birth, Position with the Fund and Length of Time Served1 | | Business Experience and Directorships During the Past Five Years | Number of Funds in Deutsche Fund Complex Overseen | Other Directorships Held by Board Member |
Kenneth C. Froewiss (1945) Chairperson since 2013, and Board Member since 2001 | | Adjunct Professor of Finance, NYU Stern School of Business (September 2009–present; Clinical Professor from 1997–September 2009); Member, Finance Committee, Association for Asian Studies (2002–present); Director, Mitsui Sumitomo Insurance Group (US) (2004–present); prior thereto, Managing Director, J.P. Morgan (investment banking firm) (until 1996) | 105 | — |
William McClayton (1944) Vice Chairperson since 2013, and Board Member since 2004 | | Private equity investor (since October 2009); previously, Managing Director, Diamond Management & Technology Consultants, Inc. (global consulting firm) (2001–2009); Directorship: Board of Managers, YMCA of Metropolitan Chicago; formerly: Senior Partner, Arthur Andersen LLP (accounting) (1966–2001); Trustee, Ravinia Festival | 105 | — |
John W. Ballantine (1946) Board Member since 1999 | | Retired; formerly, Executive Vice President and Chief Risk Management Officer, First Chicago NBD Corporation/The First National Bank of Chicago (1996–1998); Executive Vice President and Head of International Banking (1995–1996); former Directorships: Director and former Chairman of the Board, Healthways, Inc.2 (provider of disease and care management services) (2003–2014); Stockwell Capital Investments PLC (private equity); First Oak Brook Bancshares, Inc. and Oak Brook Bank; Prisma Energy International | 105 | Portland General Electric2 (utility company) (2003– present) |
Henry P. Becton, Jr. (1943) Board Member since 1990 | | Vice Chair and former President, WGBH Educational Foundation. Directorships: Public Radio International; Public Radio Exchange (PRX); North Bennett Street School (Boston); former Directorships: Belo Corporation2 (media company); The PBS Foundation; Association of Public Television Stations; Boston Museum of Science; American Public Television; Concord Academy; New England Aquarium; Mass. Corporation for Educational Telecommunications; Committee for Economic Development; Public Broadcasting Service; Connecticut College | 105 | Lead Director, Becton Dickinson and Company2 (medical technology company) |
Dawn-Marie Driscoll (1946) Board Member since 1987 | | Emeritus Executive Fellow, Center for Business Ethics, Bentley University; formerly: President, Driscoll Associates (consulting firm); Partner, Palmer & Dodge (law firm) (1988–1990); Vice President of Corporate Affairs and General Counsel, Filene's (retail) (1978–1988). Directorships: Director of ICI Mutual Insurance Company (since 2007); Advisory Board, Center for Business Ethics, Bentley University; Trustee and former Chairman of the Board, Southwest Florida Community Foundation (charitable organization); former Directorships: Sun Capital Advisers Trust (mutual funds) (2007–2012), Investment Company Institute (audit, executive, nominating committees) and Independent Directors Council (governance, executive committees) | 105 | — |
Keith R. Fox, CFA (1954) Board Member since 1996 | | Managing General Partner, Exeter Capital Partners (a series of private investment funds) (since 1986). Directorships: Progressive International Corporation (kitchen goods importer and distributor); The Kennel Shop (retailer); former Chairman, National Association of Small Business Investment Companies; former Directorships: BoxTop Media Inc. (advertising); Sun Capital Advisers Trust (mutual funds) (2011–2012) | 105 | — |
Paul K. Freeman (1950) Board Member since 1993 | | Consultant, World Bank/Inter-American Development Bank; Chair, Independent Directors Council; Investment Company Institute (executive and nominating committees); formerly, Chairman of Education Committee of Independent Directors Council; Project Leader, International Institute for Applied Systems Analysis (1998–2001); Chief Executive Officer, The Eric Group, Inc. (environmental insurance) (1986–1998); Directorships: Denver Zoo Foundation (December 2012–present); former Directorships: Prisma Energy International | 105 | — |
Richard J. Herring (1946) Board Member since 1990 | | Jacob Safra Professor of International Banking and Professor, Finance Department, The Wharton School, University of Pennsylvania (since July 1972); Co-Director, Wharton Financial Institutions Center; Co-Chair, U.S. Shadow Financial Regulatory Committee; Executive Director, Financial Economists Roundtable; formerly: Vice Dean and Director, Wharton Undergraduate Division (July 1995–June 2000); Director, Lauder Institute of International Management Studies (July 2000–June 2006) | 105 | Director, Aberdeen Singapore and Japan Funds (since 2007); Independent Director of Barclays Bank Delaware (since September 2010) |
Rebecca W. Rimel (1951) Board Member since 1995 | | President and Chief Executive Officer, The Pew Charitable Trusts (charitable organization) (1994 to present); formerly: Executive Vice President, The Glenmede Trust Company (investment trust and wealth management) (1983–2004); Board Member, Investor Education (charitable organization) (2004–2005); Trustee, Executive Committee, Philadelphia Chamber of Commerce (2001–2007); Director, Viasys Health Care2 (January 2007–June 2007); Trustee, Thomas Jefferson Foundation (charitable organization) (1994–2012) | 105 | Director, Becton Dickinson and Company2 (medical technology company) (2012– present); Director, BioTelemetry Inc.2 (health care) (2009– present) |
William N. Searcy, Jr. (1946) Board Member since 1993 | | Private investor since October 2003; formerly: Pension & Savings Trust Officer, Sprint Corporation2 (telecommunications) (November 1989–September 2003); Trustee, Sun Capital Advisers Trust (mutual funds) (1998–2012) | 105 | — |
Jean Gleason Stromberg (1943) Board Member since 1997 | | Retired. Formerly, Consultant (1997–2001); Director, Financial Markets U.S. Government Accountability Office (1996–1997); Partner, Norton Rose Fulbright, L.L.P. (law firm) (1978–1996). Directorships: The William and Flora Hewlett Foundation (charitable organization); former Directorships: Service Source, Inc. (nonprofit), Mutual Fund Directors Forum (2002–2004), American Bar Retirement Association (funding vehicle for retirement plans) (1987–1990 and 1994–1996) | 105 | — |
Robert H. Wadsworth* (1940) Board Member since 1999 | | President, Robert H. Wadsworth & Associates, Inc. (consulting firm) (1983 to present); Director, The Phoenix Boys Choir Association | 105 | — |
Officers4 |
Name, Year of Birth, Position with the Fund and Length of Time Served5 | | Business Experience and Directorships During the Past Five Years |
Brian E. Binder8 (1972) President and Chief Executive Officer, 2013–present | | Managing Director3 and Head of Fund Administration, Deutsche Asset & Wealth Management (2013–present); formerly: Head of Business Management and Consulting at Invesco, Ltd. (2010–2012); Chief Administrative Officer, Van Kampen Funds Inc. (2008–2010); and Chief Administrative Officer, Morgan Stanley Investment Management Americas Distribution (2003–2008) |
John Millette7 (1962) Vice President and Secretary, 1999–present | | Director,3 Deutsche Asset & Wealth Management |
Melinda Morrow6 (1970) Vice President, 2012–present | | Director,3 Deutsche Asset & Wealth Management |
Paul H. Schubert6 (1963) Chief Financial Officer, 2004–present Treasurer, 2005–present | | Managing Director,3 Deutsche Asset & Wealth Management (since July 2004); formerly: Executive Director, Head of Mutual Fund Services and Treasurer for UBS Family of Funds (1998–2004); Vice President and Director of Mutual Fund Finance at UBS Global Asset Management (1994–1998) |
Caroline Pearson7 (1962) Chief Legal Officer, 2010–present | | Managing Director,3 Deutsche Asset & Wealth Management; formerly: Assistant Secretary for DWS family of funds (1997–2010) |
Robert Kloby6 (1962) Chief Compliance Officer, 2006–present | | Managing Director,3 Deutsche Asset & Wealth Management |
Wayne Salit6 (1967) Anti-Money Laundering Compliance Officer, 2014–present | | Director,3 Deutsche Asset & Wealth Management; formerly: Managing Director, AML Compliance Officer at BNY Mellon (2011–2014); and Director, AML Compliance Officer at Deutsche Bank (2004–2011) |
Hepsen Uzcan7 (1974) Assistant Secretary, 2013–present | | Director,3 Deutsche Asset & Wealth Management |
Paul Antosca7 (1957) Assistant Treasurer, 2007–present | | Director,3 Deutsche Asset & Wealth Management |
Jack Clark7 (1967) Assistant Treasurer, 2007–present | | Director,3 Deutsche Asset & Wealth Management |
Diane Kenneally7 (1966) Assistant Treasurer, 2007–present | | Director,3 Deutsche Asset & Wealth Management |
1 The length of time served represents the year in which the Board Member joined the board of one or more Deutsche funds currently overseen by the Board.
2 A publicly held company with securities registered pursuant to Section 12 of the Securities Exchange Act of 1934.
3 Executive title, not a board directorship.
4 As a result of their respective positions held with the Advisor, these individuals are considered "interested persons" of the Advisor within the meaning of the 1940 Act. Interested persons receive no compensation from the fund.
5 The length of time served represents the year in which the officer was first elected in such capacity for one or more Deutsche funds.
6 Address: 60 Wall Street, New York, NY 10005.
7 Address: One Beacon Street, Boston, MA 02108.
8 Address: 222 South Riverside Plaza, Chicago, IL 60606.
* Robert H. Wadsworth retired from the Board effective December 31, 2014.
The fund's Statement of Additional Information ("SAI") includes additional information about the Board Members. The SAI is available, without charge, upon request. If you would like to request a copy of the SAI, you may do so by calling the following toll-free number: (800) 728-3337.
DeAWM Distributors, Inc.
222 South Riverside Plaza
Chicago, IL 60606
(800) 621-1148
VS2GIB-2 (R-025825-4 2/15)
December 31, 2014
Annual Report
Deutsche Variable Series II
(formerly DWS Variable Series II)
Deutsche High Income VIP
(formerly DWS High Income VIP)
Contents
18 Statement of Assets and Liabilities 19 Statement of Operations 20 Statement of Changes in Net Assets 22 Notes to Financial Statements 30 Report of Independent Registered Public Accounting Firm 31 Information About Your Fund's Expenses 33 Advisory Agreement Board Considerations and Fee Evaluation 35 Board Members and Officers |
This report must be preceded or accompanied by a prospectus. To obtain an additional prospectus or summary prospectus, if available, call (800) 728-3337 or your financial representative. We advise you to consider the Fund's objectives, risks, charges and expenses carefully before investing. The summary prospectus and prospectus contain this and other important information about the Fund. Please read the prospectus carefully before you invest.
Bond investments are subject to interest-rate, credit, liquidity and market risks to varying degrees. When interest rates rise, bond prices generally fall. Credit risk refers to the ability of an issuer to make timely payments of principal and interest. Investments in lower-quality ("junk bonds") and non-rated securities present greater risk of loss than investments in higher-quality securities. Investing in derivatives entails special risks relating to liquidity, leverage and credit that may reduce returns and/or increase volatility. The Fund may lend securities to approved institutions. See the prospectus for details.
Deutsche Asset & Wealth Management represents the asset management and wealth management activities conducted by Deutsche Bank AG or any of its subsidiaries, including the Advisor and DeAWM Distributors, Inc.
NOT FDIC/NCUA INSURED NO BANK GUARANTEE MAY LOSE VALUE NOT A DEPOSIT
NOT INSURED BY ANY FEDERAL GOVERNMENT AGENCY
Performance Summary December 31, 2014 (Unaudited)
Fund performance shown is historical, assumes reinvestment of all dividend and capital gain distributions and does not guarantee future results. Investment return and principal value fluctuate with changing market conditions so that, when redeemed, shares may be worth more or less than their original cost. Current performance may be lower or higher than the performance data quoted. Please contact your participating insurance company for the Fund's most recent month-end performance. Performance doesn't reflect charges and fees ("contract charges") associated with the separate account that invests in the Fund or any variable life insurance policy or variable annuity contract for which the Fund is an investment option. These charges and fees will reduce returns. While all share classes have the same underlying portfolio, their performance will differ.
The gross expense ratios of the Fund, as stated in the fee table of the prospectus dated May 1, 2014 are 0.73% and 1.10% for Class A and Class B shares, respectively, and may differ from the expense ratios disclosed in the Financial Highlights tables in this report.
| Growth of an Assumed $10,000 Investment in Deutsche High Income VIP |
| The Credit Suisse High Yield Index tracks the performance of the global high-yield debt market. Index returns do not reflect any fees or expenses and it is not possible to invest directly into an index. |
| |
| Yearly periods ended December 31 | |
| Comparative Results | |
| Deutsche High Income VIP | | 1-Year | | | 3-Year | | | 5-Year | | | 10-Year | |
| Class A | Growth of $10,000 | | $ | 10,147 | | | $ | 12,583 | | | $ | 14,895 | | | $ | 18,376 | |
| Average annual total return | | | 1.47 | % | | | 7.96 | % | | | 8.30 | % | | | 6.27 | % |
| Credit Suisse High Yield Index | Growth of $10,000 | | $ | 10,186 | | | $ | 12,565 | | | $ | 15,163 | | | $ | 20,281 | |
| Average annual total return | | | 1.86 | % | | | 7.91 | % | | | 8.68 | % | | | 7.33 | % |
| Deutsche High Income VIP | | 1-Year | | | 3-Year | | | 5-Year | | | 10-Year | |
| Class B | Growth of $10,000 | | $ | 10,122 | | | $ | 12,474 | | | $ | 14,680 | | | $ | 17,807 | |
| Average annual total return | | | 1.22 | % | | | 7.65 | % | | | 7.98 | % | | | 5.94 | % |
| Credit Suisse High Yield Index | Growth of $10,000 | | $ | 10,186 | | | $ | 12,565 | | | $ | 15,163 | | | $ | 20,281 | |
| Average annual total return | | | 1.86 | % | | | 7.91 | % | | | 8.68 | % | | | 7.33 | % |
The growth of $10,000 is cumulative.
Management Summary December 31, 2014 (Unaudited)
Although high-yield bonds performed very well through the first six months of the year, a challenging second half caused the Credit Suisse High Yield Index (the Fund’s benchmark) to close with a modest gain of 1.86% — its lowest calendar-year return since 2008.1 The second-half downturn stemmed from two key factors. First, inconsistent fund flows and a heavy pace of new issuance led to an unfavorable balance of supply and demand in the market. Second, the sharp decline in the price of oil weighed on the prices of bonds issued by energy companies, which make up a sizeable portion of the high-yield market. Despite these headwinds, the favorable credit quality statistics for high-yield issuers, combined with inexpensive refinancing, contributed to high-yield default rates remaining below the historical average.
The Fund returned 1.47% during 2014 (Class A shares, unadjusted for contract charges). In managing the Fund, we focus on using credit research to identify the most compelling investment opportunities. We manage the portfolio from a long-term perspective, which means that we do not take on excessive risk to boost short-term returns. Instead, we strive to generate outperformance over a multi-year period by achieving an appropriate trade-off of risk and return. Consistent with this bottom-up approach, individual security selection was the primary driver of fund performance. Frontier Communications Corp., Windstream Corp. and Community Health Systems, Inc. were among the leading contributors to performance. On the negative side, the Fund’s positions in shorter-duration securities outweighed the positive contribution from its positions in longer-duration bonds (i.e., those with higher interest-rate sensitivity).2,3 Positions in bonds with exposure to political and economic instability and/or weakening commodity prices also detracted from fund performance. Among individual securities, the largest detractors included MEG Energy Corp., SandRidge Energy, Inc. and FMG Resources Pty Ltd. The Fund employed derivatives during the period, using credit default swaps to achieve exposure to certain companies within the high-yield market.
We retain a cautiously optimistic view on the U.S. high-yield market. Credit fundamentals remain strong, as improving corporate results have resulted in decreasing leverage and higher interest coverage in the asset class. High-yield companies have taken advantage of low rates by refinancing their debt and pushing the bulk of their maturities further into the future, thus reducing near-term default risk. However, supply-and-demand factors and shifting expectations regarding U.S. Federal Reserve Board (the Fed) policy continue to represent potential challenges for the market. We therefore expect volatility will remain a factor on a short-term basis, but we also believe yield spreads can trend lower in the intermediate term as favorable corporate results continue to support improving credit fundamentals and low default rates.4
Gary Russell, CFA
Portfolio Manager
The views expressed reflect those of the portfolio management team only through the end of the period of the report as stated on the cover. The management team's views are subject to change at any time based on market and other conditions and should not be construed as a recommendation. Past performance is no guarantee of future results. Current and future portfolio holdings are subject to risk.
1 The Credit Suisse High Yield Index tracks the performance of the global high-yield debt market. Index returns do not reflect fees or expenses and it is not possible to invest directly into an index.
2 Bank loans are loans to corporations that banks repackage and sell as securities.
3 Duration is a measure of a bond’s sensitivity to movements in prevailing interest rates.
4 Yield spread refers to the excess yield various bond sectors offer over financial instruments with similar maturities.
Portfolio Summary (Unaudited) Asset Allocation (As a % of Investment Portfolio excluding Securities Lending Collateral) | 12/31/14 | 12/31/13 |
| | | |
| Corporate Bonds | 87% | 82% |
| Cash Equivalents | 7% | 10% |
| Convertible Bonds | 2% | 2% |
| Preferred Stock | 1% | 1% |
| Government & Agency Obligations | 1% | 4% |
| Preferred Security | 1% | 1% |
| Loan Participations and Assignments | 1% | — |
| | 100% | 100% |
Sector Diversification (As a % of Investment Portfolio excluding Government & Agency Obligations, Cash Equivalents and Securities Lending Collateral) | 12/31/14 | 12/31/13 |
| | | |
| Telecommunication Services | 20% | 20% |
| Consumer Discretionary | 20% | 19% |
| Industrials | 12% | 10% |
| Energy | 10% | 15% |
| Materials | 9% | 10% |
| Information Technology | 8% | 6% |
| Health Care | 8% | 5% |
| Consumer Staples | 5% | 7% |
| Financials | 5% | 6% |
| Utilities | 3% | 2% |
| | 100% | 100% |
Quality (As a % of Investment Portfolio excluding Cash Equivalents and Securities Lending Collateral) | 12/31/14 | 12/31/13 |
| | | |
| AAA | 1% | 4% |
| BBB | 2% | 2% |
| BB | 43% | 36% |
| B | 41% | 44% |
| CCC | 12% | 12% |
| Not Rated | 1% | 2% |
| | 100% | 100% |
The quality ratings represent the higher of Moody's Investors Service, Inc. ("Moody's") or Standard & Poor's Corporation ("S&P") credit ratings. The ratings of Moody's and S&P represent their opinions as to the quality of the securities they rate. Credit quality measures a bond issuer's ability to repay interest and principal in a timely manner. Ratings are relative and subjective and are not absolute standards of quality. Credit quality does not remove market risk and is subject to change.
Portfolio holdings and characteristics are subject to change.
For more complete details about the Fund's investment portfolio, see page 6.
Following the Fund's fiscal first and third quarter-end, a complete portfolio holdings listing is filed with the SEC on Form N-Q. The form will be available on the SEC's Web site at sec.gov, and it also may be reviewed and copied at the SEC's Public Reference Room in Washington, D.C. Information on the operation of the SEC's Public Reference Room may be obtained by calling (800) SEC-0330. The Fund's portfolio holdings are also posted on deutschefunds.com from time to time. Please see the Fund's current prospectus for more information.
Investment Portfolio December 31, 2014 | | Principal Amount ($)(a) | Value ($) |
| | |
| Corporate Bonds 86.1% |
| Consumer Discretionary 17.7% |
| AMC Entertainment, Inc., 5.875%, 2/15/2022 | | 220,000 | 223,300 |
| AMC Networks, Inc., 7.75%, 7/15/2021 | | 80,000 | 85,600 |
| AmeriGas Finance LLC: |
| | 6.75%, 5/20/2020 | | 460,000 | 473,800 |
| | 7.0%, 5/20/2022 | | 350,000 | 362,250 |
| Apex Tool Group LLC, 144A, 7.0%, 2/1/2021 (b) | | 210,000 | 179,550 |
| APX Group, Inc., 6.375%, 12/1/2019 | | 205,000 | 196,288 |
| Asbury Automotive Group, Inc., 144A, 6.0%, 12/15/2024 | 495,000 | 503,662 |
| Ashtead Capital, Inc., 144A, 6.5%, 7/15/2022 | | 330,000 | 350,625 |
| Ashton Woods U.S.A. LLC, 144A, 6.875%, 2/15/2021 | | 350,000 | 333,375 |
| Avis Budget Car Rental LLC: |
| | 5.5%, 4/1/2023 (b) | | 205,000 | 209,100 |
| | 144A, 5.5%, 4/1/2023 | | 455,000 | 464,100 |
| Block Communications, Inc., 144A, 7.25%, 2/1/2020 | | 375,000 | 382,500 |
| Cablevision Systems Corp.: |
| | 5.875%, 9/15/2022 (b) | | 110,000 | 111,375 |
| | 8.0%, 4/15/2020 | | 65,000 | 73,450 |
| CCO Holdings LLC: |
| | 7.0%, 1/15/2019 | | 120,000 | 124,500 |
| | 7.375%, 6/1/2020 | | 50,000 | 53,000 |
| CCOH Safari LLC: |
| | 5.5%, 12/1/2022 | | 270,000 | 274,050 |
| | 5.75%, 12/1/2024 | | 270,000 | 273,038 |
| Cequel Communications Holdings I LLC: | |
| | 144A, 5.125%, 12/15/2021 | | 602,000 | 583,940 |
| | 144A, 6.375%, 9/15/2020 | | 1,215,000 | 1,257,525 |
| Clear Channel Worldwide Holdings, Inc.: | |
| | Series A, 6.5%, 11/15/2022 | 250,000 | 254,375 |
| | Series B, 6.5%, 11/15/2022 | 365,000 | 375,950 |
| | Series A, 7.625%, 3/15/2020 | 110,000 | 114,125 |
| | Series B, 7.625%, 3/15/2020 | 1,115,000 | 1,173,537 |
| Cogeco Cable, Inc., 144A, 4.875%, 5/1/2020 | | 20,000 | 20,000 |
| CSC Holdings LLC, 144A, 5.25%, 6/1/2024 | | 510,000 | 512,550 |
| Cumulus Media Holdings, Inc., 7.75%, 5/1/2019 (b) | | 375,000 | 378,750 |
| Dana Holding Corp., 5.5%, 12/15/2024 | 180,000 | 181,800 |
| DISH DBS Corp.: |
| | 4.25%, 4/1/2018 | | 270,000 | 275,737 |
| | 5.0%, 3/15/2023 | | 1,225,000 | 1,185,187 |
| | 6.75%, 6/1/2021 | | 50,000 | 53,750 |
| | 7.875%, 9/1/2019 | | 270,000 | 306,450 |
| Getty Images, Inc., 144A, 7.0%, 10/15/2020 | | 305,000 | 239,425 |
| Group 1 Automotive, Inc., 144A, 5.0%, 6/1/2022 | | 300,000 | 293,250 |
| Harron Communications LP, 144A, 9.125%, 4/1/2020 | | 395,000 | 430,550 |
| | Principal Amount ($)(a) | Value ($) |
| | |
| HD Supply, Inc.: |
| | 144A, 5.25%, 12/15/2021 | | 275,000 | 279,812 |
| | 7.5%, 7/15/2020 (b) | | 95,000 | 99,513 |
| | 11.5%, 7/15/2020 | | 90,000 | 103,050 |
| Hertz Corp., 6.75%, 4/15/2019 | 305,000 | 314,150 |
| Hot Topic, Inc., 144A, 9.25%, 6/15/2021 | | 140,000 | 149,800 |
| iHeartCommunications, Inc.: |
| | 9.0%, 12/15/2019 | | 530,000 | 522,050 |
| | 11.25%, 3/1/2021 | | 280,000 | 288,400 |
| Jo-Ann Stores Holdings, Inc., 144A, 9.75%, 10/15/2019 (PIK) | 160,000 | 136,000 |
| Live Nation Entertainment, Inc.: |
| | 144A, 5.375%, 6/15/2022 | | 50,000 | 50,000 |
| | 144A, 7.0%, 9/1/2020 | | 345,000 | 363,975 |
| MDC Partners, Inc., 144A, 6.75%, 4/1/2020 | | 370,000 | 381,100 |
| Mediacom Broadband LLC: |
| | 5.5%, 4/15/2021 | | 50,000 | 50,250 |
| | 6.375%, 4/1/2023 | | 425,000 | 435,625 |
| Mediacom LLC, 7.25%, 2/15/2022 | 110,000 | 117,425 |
| MGM Resorts International: |
| | 6.0%, 3/15/2023 | | 280,000 | 281,400 |
| | 6.75%, 10/1/2020 (b) | | 526,000 | 552,300 |
| | 8.625%, 2/1/2019 | | 510,000 | 578,212 |
| Numericable-SFR: |
| | 144A, 4.875%, 5/15/2019 | | 520,000 | 515,450 |
| | 144A, 6.0%, 5/15/2022 | | 775,000 | 779,262 |
| | 144A, 6.25%, 5/15/2024 | | 225,000 | 226,688 |
| Penske Automotive Group, Inc., 5.375%, 12/1/2024 | | 660,000 | 668,250 |
| Petco Animal Supplies, Inc., 144A, 9.25%, 12/1/2018 | | 315,000 | 329,962 |
| Pinnacle Entertainment, Inc., 6.375%, 8/1/2021 | | 160,000 | 164,800 |
| Quebecor Media, Inc., 5.75%, 1/15/2023 | | 205,000 | 209,613 |
| Schaeffler Finance BV, 144A, 7.75%, 2/15/2017 | | 420,000 | 459,900 |
| Seminole Hard Rock Entertainment, Inc., 144A, 5.875%, 5/15/2021 | | 125,000 | 123,750 |
| Serta Simmons Holdings LLC, 144A, 8.125%, 10/1/2020 (b) | 230,000 | 243,225 |
| Sirius XM Radio, Inc., 144A, 5.875%, 10/1/2020 | | 195,000 | 200,850 |
| Springs Industries, Inc., 6.25%, 6/1/2021 (b) | | 295,000 | 293,525 |
| Starz LLC, 5.0%, 9/15/2019 | | 175,000 | 176,313 |
| Taylor Morrison Communities, Inc., 144A, 5.25%, 4/15/2021 | 250,000 | 246,250 |
| TRI Pointe Holdings, Inc., 144A, 4.375%, 6/15/2019 | | 145,000 | 143,006 |
| UCI International, Inc., 8.625%, 2/15/2019 | | 310,000 | 296,050 |
| Unitymedia Hessen GmbH & Co., KG: |
| | 144A, 5.5%, 1/15/2023 | | 945,000 | 987,525 |
| | 144A, 7.5%, 3/15/2019 | | 435,000 | 456,750 |
| Univision Communications, Inc., 144A, 7.875%, 11/1/2020 | 140,000 | 149,100 |
| Viking Cruises Ltd., 144A, 8.5%, 10/15/2022 | | 205,000 | 221,913 |
| Visant Corp., 10.0%, 10/1/2017 | 115,000 | 99,763 |
| | 24,005,471 |
| | Principal Amount ($)(a) | Value ($) |
| | |
| Consumer Staples 4.8% |
| Big Heart Pet Brands, 7.625%, 2/15/2019 | | 284,000 | 279,030 |
| Chiquita Brands International, Inc., 7.875%, 2/1/2021 | | 110,000 | 118,250 |
| Cott Beverages, Inc.: |
| | 144A, 5.375%, 7/1/2022 | | 240,000 | 220,200 |
| | 144A, 6.75%, 1/1/2020 | | 180,000 | 180,000 |
| FAGE Dairy Industry SA, 144A, 9.875%, 2/1/2020 | | 810,000 | 846,450 |
| JBS Investments GmbH: |
| | 144A, 7.25%, 4/3/2024 | | 525,000 | 515,812 |
| | 144A, 7.75%, 10/28/2020 | | 405,000 | 419,378 |
| JBS U.S.A. LLC: |
| | 144A, 7.25%, 6/1/2021 | | 485,000 | 499,550 |
| | 144A, 8.25%, 2/1/2020 | | 160,000 | 168,400 |
| Post Holdings, Inc., 144A, 6.75%, 12/1/2021 | | 110,000 | 106,700 |
| Reynolds Group Issuer, Inc.: |
| | 5.75%, 10/15/2020 | | 1,390,000 | 1,424,750 |
| | 6.875%, 2/15/2021 | | 540,000 | 563,625 |
| | 8.25%, 2/15/2021 (b) | | 225,000 | 230,625 |
| Roundy's Supermarkets, Inc., 144A, 10.25%, 12/15/2020 | | 55,000 | 47,850 |
| Smithfield Foods, Inc., 6.625%, 8/15/2022 | | 190,000 | 198,550 |
| The WhiteWave Foods Co., 5.375%, 10/1/2022 | | 185,000 | 190,550 |
| U.S. Foods, Inc., 8.5%, 6/30/2019 (b) | | 400,000 | 424,000 |
| | 6,433,720 |
| Energy 8.7% |
| Access Midstream Partners LP, 6.125%, 7/15/2022 | | 325,000 | 345,312 |
| Antero Resources Corp., 144A, 5.125%, 12/1/2022 | | 330,000 | 311,025 |
| Antero Resources Finance Corp., 5.375%, 11/1/2021 | | 250,000 | 241,875 |
| Baytex Energy Corp.: |
| | 144A, 5.125%, 6/1/2021 | | 70,000 | 59,500 |
| | 144A, 5.625%, 6/1/2024 | | 95,000 | 80,750 |
| Berry Petroleum Co., LLC: |
| | 6.375%, 9/15/2022 | | 205,000 | 155,800 |
| | 6.75%, 11/1/2020 | | 680,000 | 544,000 |
| Blue Racer Midstream LLC, 144A, 6.125%, 11/15/2022 | | 115,000 | 110,975 |
| BreitBurn Energy Partners LP: |
| | 7.875%, 4/15/2022 | | 215,000 | 166,087 |
| | 8.625%, 10/15/2020 | | 205,000 | 176,300 |
| California Resources Corp.: |
| | 144A, 5.0%, 1/15/2020 | | 140,000 | 121,450 |
| | 144A, 5.5%, 9/15/2021 | | 323,000 | 276,165 |
| | 144A, 6.0%, 11/15/2024 | | 35,000 | 29,575 |
| Chaparral Energy, Inc., 7.625%, 11/15/2022 | | 465,000 | 304,575 |
| Crestwood Midstream Partners LP: |
| | 6.125%, 3/1/2022 | | 165,000 | 157,575 |
| | 7.75%, 4/1/2019 | | 325,000 | 333,125 |
| Denbury Resources, Inc.: |
| | 4.625%, 7/15/2023 | | 65,000 | 56,388 |
| | 5.5%, 5/1/2022 | | 70,000 | 64,050 |
| Dresser-Rand Group, Inc., 6.5%, 5/1/2021 | | 230,000 | 247,250 |
| | Principal Amount ($)(a) | Value ($) |
| | |
| Endeavor Energy Resources LP, 144A, 7.0%, 8/15/2021 | | 545,000 | 482,325 |
| EP Energy LLC, 6.875%, 5/1/2019 | 330,000 | 334,950 |
| EV Energy Partners LP, 8.0%, 4/15/2019 | | 955,000 | 811,750 |
| Halcon Resources Corp., 8.875%, 5/15/2021 | | 1,086,000 | 817,215 |
| Hilcorp Energy I LP, 144A, 5.0%, 12/1/2024 | | 195,000 | 171,600 |
| Holly Energy Partners LP, 6.5%, 3/1/2020 | | 105,000 | 103,950 |
| Jupiter Resources, Inc., 144A, 8.5%, 10/1/2022 | | 185,000 | 139,213 |
| Linn Energy LLC, 6.25%, 11/1/2019 | 140,000 | 118,300 |
| MEG Energy Corp.: |
| | 144A, 6.5%, 3/15/2021 | | 235,000 | 214,437 |
| | 144A, 7.0%, 3/31/2024 | | 610,000 | 552,050 |
| Memorial Resource Development Corp., 144A, 5.875%, 7/1/2022 | 195,000 | 176,475 |
| Midstates Petroleum Co., Inc., 10.75%, 10/1/2020 | | 320,000 | 169,600 |
| Murphy Oil U.S.A., Inc., 6.0%, 8/15/2023 | | 290,000 | 303,050 |
| Northern Oil & Gas, Inc., 8.0%, 6/1/2020 | | 595,000 | 450,712 |
| Regency Energy Partners LP: |
| | 5.0%, 10/1/2022 | | 125,000 | 118,125 |
| | 5.875%, 3/1/2022 | | 25,000 | 24,938 |
| RSP Permian, Inc., 144A, 6.625%, 10/1/2022 | | 115,000 | 106,950 |
| Sabine Pass Liquefaction LLC: |
| | 5.625%, 2/1/2021 | | 690,000 | 677,925 |
| | 5.625%, 4/15/2023 | | 155,000 | 151,513 |
| | 5.75%, 5/15/2024 | | 175,000 | 171,719 |
| SandRidge Energy, Inc., 7.5%, 3/15/2021 | | 575,000 | 368,000 |
| SESI LLC, 6.375%, 5/1/2019 | | 235,000 | 227,950 |
| Seventy Seven Energy, Inc., 6.5%, 7/15/2022 (b) | | 50,000 | 29,250 |
| Seventy Seven Operating LLC, 6.625%, 11/15/2019 | | 150,000 | 114,000 |
| Swift Energy Co., 7.875%, 3/1/2022 | 290,000 | 150,075 |
| Talos Production LLC, 144A, 9.75%, 2/15/2018 | | 410,000 | 373,100 |
| Targa Resources Partners LP, 144A, 4.125%, 11/15/2019 | | 70,000 | 67,375 |
| Triangle U.S.A. Petroleum Corp., 144A, 6.75%, 7/15/2022 | 145,000 | 95,700 |
| Welltec AS, 144A, 8.0%, 2/1/2019 | 400,000 | 372,000 |
| WPX Energy, Inc., 5.25%, 9/15/2024 | 140,000 | 130,200 |
| | 11,806,224 |
| Financials 3.2% |
| Credit Agricole SA, 144A, 7.875%, 1/29/2049 | | 330,000 | 335,786 |
| Credit Suisse Group AG, 144A, 6.25%, 12/29/2049 | | 230,000 | 221,203 |
| Denali Borrower LLC, 144A, 5.625%, 10/15/2020 | | 285,000 | 296,542 |
| E*TRADE Financial Corp.: |
| | 5.375%, 11/15/2022 | | 170,000 | 173,825 |
| | 6.375%, 11/15/2019 | | 585,000 | 620,100 |
| Hellas Telecommunications Finance, 144A, 8.082%**, 7/15/2015 (PIK)* | EUR | 322,107 | 0 |
| | Principal Amount ($)(a) | Value ($) |
| | |
| International Lease Finance Corp.: | |
| | 3.875%, 4/15/2018 | | 385,000 | 385,000 |
| | 6.25%, 5/15/2019 | | 320,000 | 349,600 |
| | 8.75%, 3/15/2017 | | 245,000 | 271,338 |
| MPT Operating Partnership LP: |
| | (REIT), 6.375%, 2/15/2022 | | 290,000 | 308,125 |
| | (REIT), 6.875%, 5/1/2021 | | 295,000 | 315,650 |
| Neuberger Berman Group LLC, 144A, 5.625%, 3/15/2020 | 160,000 | 167,200 |
| Popular, Inc., 7.0%, 7/1/2019 | | 145,000 | 145,000 |
| Seminole Tribe of Florida, Inc., 144A, 7.804%, 10/1/2020 | 305,000 | 323,300 |
| Societe Generale SA, 144A, 7.875%, 12/29/2049 | | 460,000 | 445,625 |
| | 4,358,294 |
| Health Care 6.8% |
| Aviv Healthcare Properties LP: |
| | 6.0%, 10/15/2021 | | 100,000 | 104,000 |
| | 7.75%, 2/15/2019 | | 500,000 | 521,000 |
| Biomet, Inc.: |
| | 6.5%, 8/1/2020 | | 355,000 | 379,850 |
| | 6.5%, 10/1/2020 | | 100,000 | 105,500 |
| Community Health Systems, Inc.: |
| | 5.125%, 8/15/2018 | | 1,155,000 | 1,195,425 |
| | 5.125%, 8/1/2021 | | 55,000 | 57,063 |
| | 6.875%, 2/1/2022 (b) | | 220,000 | 233,063 |
| | 7.125%, 7/15/2020 | | 635,000 | 677,069 |
| Crimson Merger Sub, Inc., 144A, 6.625%, 5/15/2022 | | 525,000 | 471,844 |
| Endo Finance LLC: |
| | 144A, 5.375%, 1/15/2023 | | 215,000 | 210,700 |
| | 144A, 5.75%, 1/15/2022 | | 220,000 | 220,000 |
| Fresenius Medical Care U.S. Finance II, Inc., 144A, 5.625%, 7/31/2019 | 220,000 | 234,850 |
| Fresenius U.S. Finance II, Inc., 144A, 9.0%, 7/15/2015 | 420,000 | 432,600 |
| HCA, Inc.: |
| | 5.25%, 4/15/2025 | | 145,000 | 151,525 |
| | 6.5%, 2/15/2020 | | 890,000 | 997,245 |
| | 7.5%, 2/15/2022 | | 305,000 | 348,462 |
| Hologic, Inc., 6.25%, 8/1/2020 | 200,000 | 208,000 |
| IMS Health, Inc., 144A, 6.0%, 11/1/2020 | | 250,000 | 257,500 |
| LifePoint Hospitals, Inc, 5.5%, 12/1/2021 | | 275,000 | 281,187 |
| Par Pharmaceutical Companies, Inc., 7.375%, 10/15/2020 | 345,000 | 360,525 |
| Physio-Control International, Inc., 144A, 9.875%, 1/15/2019 | 299,000 | 316,940 |
| Valeant Pharmaceuticals International, Inc.: |
| | 144A, 6.375%, 10/15/2020 | | 245,000 | 256,025 |
| | 144A, 7.5%, 7/15/2021 | | 1,050,000 | 1,134,000 |
| | 9,154,373 |
| Industrials 11.0% |
| ADT Corp.: |
| | 3.5%, 7/15/2022 (b) | | 150,000 | 127,875 |
| | 4.125%, 4/15/2019 | | 45,000 | 44,550 |
| | 5.25%, 3/15/2020 | | 300,000 | 303,750 |
| | 6.25%, 10/15/2021 (b) | | 145,000 | 148,988 |
| Aguila 3 SA, 144A, 7.875%, 1/31/2018 | | 480,000 | 464,400 |
| Armored Autogroup, Inc., 9.25%, 11/1/2018 | | 355,000 | 353,225 |
| | Principal Amount ($)(a) | Value ($) |
| | |
| Artesyn Embedded Technologies, Inc., 144A, 9.75%, 10/15/2020 | 245,000 | 232,138 |
| AWAS Aviation Capital Ltd., 144A, 7.0%, 10/17/2016 | | 317,240 | 324,378 |
| BakerCorp International, Inc., 8.25%, 6/1/2019 | | 335,000 | 303,175 |
| Belden, Inc., 144A, 5.5%, 9/1/2022 | | 355,000 | 352,337 |
| Bombardier, Inc.: |
| | 144A, 4.75%, 4/15/2019 | | 160,000 | 160,600 |
| | 144A, 5.75%, 3/15/2022 (b) | 225,000 | 227,813 |
| | 144A, 6.0%, 10/15/2022 | | 265,000 | 267,650 |
| Casella Waste Systems, Inc., 7.75%, 2/15/2019 (b) | | 220,000 | 223,300 |
| Covanta Holding Corp., 5.875%, 3/1/2024 | | 220,000 | 223,850 |
| CTP Transportation Products LLC, 144A, 8.25%, 12/15/2019 | 275,000 | 290,125 |
| DigitalGlobe, Inc., 144A, 5.25%, 2/1/2021 | | 160,000 | 152,000 |
| Ducommun, Inc., 9.75%, 7/15/2018 | 305,000 | 326,350 |
| Florida East Coast Holdings Corp., 144A, 6.75%, 5/1/2019 | 470,000 | 465,300 |
| FTI Consulting, Inc., 6.0%, 11/15/2022 | | 205,000 | 209,613 |
| Garda World Security Corp., 144A, 7.25%, 11/15/2021 | | 290,000 | 287,100 |
| Gates Global LLC, 144A, 6.0%, 7/15/2022 | | 190,000 | 181,963 |
| GenCorp, Inc., 7.125%, 3/15/2021 | 535,000 | 560,305 |
| Huntington Ingalls Industries, Inc.: |
| | 144A, 5.0%, 12/15/2021 | | 395,000 | 401,912 |
| | 7.125%, 3/15/2021 | | 60,000 | 64,800 |
| Kenan Advantage Group, Inc., 144A, 8.375%, 12/15/2018 | | 575,000 | 592,250 |
| Meritor, Inc.: |
| | 6.25%, 2/15/2024 | | 215,000 | 218,225 |
| | 6.75%, 6/15/2021 | | 300,000 | 313,500 |
| Moog, Inc., 144A, 5.25%, 12/1/2022 | 165,000 | 167,063 |
| Navios Maritime Holdings, Inc.: |
| | 144A, 7.375%, 1/15/2022 | | 830,000 | 759,450 |
| | 8.125%, 2/15/2019 | | 345,000 | 303,600 |
| Nortek, Inc., 8.5%, 4/15/2021 | | 440,000 | 470,800 |
| Oshkosh Corp., 5.375%, 3/1/2022 | 165,000 | 168,300 |
| Ply Gem Industries, Inc.: |
| | 6.5%, 2/1/2022 (b) | | 275,000 | 258,500 |
| | 144A, 6.5%, 2/1/2022 | | 140,000 | 130,200 |
| SBA Communications Corp., 5.625%, 10/1/2019 | | 200,000 | 204,500 |
| Spirit AeroSystems, Inc.: |
| | 5.25%, 3/15/2022 | | 285,000 | 289,987 |
| | 6.75%, 12/15/2020 | | 205,000 | 217,300 |
| Titan International, Inc., 6.875%, 10/1/2020 | | 590,000 | 519,200 |
| TransDigm, Inc.: |
| | 6.0%, 7/15/2022 | | 260,000 | 259,350 |
| | 6.5%, 7/15/2024 | | 155,000 | 155,775 |
| | 7.5%, 7/15/2021 | | 1,115,000 | 1,187,475 |
| Triumph Group, Inc., 5.25%, 6/1/2022 | | 130,000 | 129,675 |
| United Rentals North America, Inc.: |
| | 5.75%, 7/15/2018 | | 365,000 | 380,512 |
| | 6.125%, 6/15/2023 | | 25,000 | 26,250 |
| | 7.375%, 5/15/2020 | | 595,000 | 642,600 |
| | 7.625%, 4/15/2022 | | 595,000 | 654,202 |
| | Principal Amount ($)(a) | Value ($) |
| | |
| XPO Logistics, Inc., 144A, 7.875%, 9/1/2019 | | 90,000 | 94,050 |
| | 14,840,261 |
| Information Technology 7.0% |
| ACI Worldwide, Inc., 144A, 6.375%, 8/15/2020 | | 105,000 | 109,725 |
| Activision Blizzard, Inc., 144A, 5.625%, 9/15/2021 | | 805,000 | 845,250 |
| Alliance Data Systems Corp., 144A, 5.25%, 12/1/2017 | | 255,000 | 262,650 |
| Audatex North America, Inc.: |
| | 144A, 6.0%, 6/15/2021 | | 315,000 | 324,450 |
| | 144A, 6.125%, 11/1/2023 | | 115,000 | 118,738 |
| BMC Software Finance, Inc., 144A, 8.125%, 7/15/2021 | | 450,000 | 423,000 |
| Boxer Parent Co., Inc., 144A, 9.0%, 10/15/2019 (PIK) | | 320,000 | 272,000 |
| Cardtronics, Inc., 144A, 5.125%, 8/1/2022 | | 145,000 | 141,375 |
| CDW LLC: |
| | 5.5%, 12/1/2024 | | 665,000 | 665,831 |
| | 6.0%, 8/15/2022 | | 230,000 | 237,475 |
| | 8.5%, 4/1/2019 | | 177,000 | 186,514 |
| CyrusOne LP, 6.375%, 11/15/2022 | 105,000 | 112,088 |
| EarthLink Holdings Corp., 7.375%, 6/1/2020 | | 245,000 | 248,675 |
| Entegris, Inc., 144A, 6.0%, 4/1/2022 | | 160,000 | 162,000 |
| Equinix, Inc.: |
| | 5.375%, 1/1/2022 | | 225,000 | 227,115 |
| | 5.375%, 4/1/2023 | | 725,000 | 725,000 |
| | 5.75%, 1/1/2025 | | 170,000 | 171,487 |
| First Data Corp.: |
| | 144A, 6.75%, 11/1/2020 | | 611,000 | 652,242 |
| | 144A, 7.375%, 6/15/2019 | | 250,000 | 263,125 |
| | 144A, 8.75%, 1/15/2022 (PIK) | 910,000 | 978,250 |
| | 144A, 8.875%, 8/15/2020 | | 495,000 | 530,887 |
| Freescale Semiconductor, Inc., 144A, 6.0%, 1/15/2022 | 275,000 | 287,375 |
| Hughes Satellite Systems Corp.: |
| | 6.5%, 6/15/2019 | | 445,000 | 477,262 |
| | 7.625%, 6/15/2021 | | 230,000 | 253,000 |
| NCR Corp.: |
| | 5.875%, 12/15/2021 | | 55,000 | 56,513 |
| | 6.375%, 12/15/2023 | | 135,000 | 140,400 |
| NXP BV, 144A, 3.75%, 6/1/2018 | 250,000 | 250,000 |
| Sanmina Corp., 144A, 4.375%, 6/1/2019 | | 25,000 | 24,813 |
| Ymobile Corp., 144A, 8.25%, 4/1/2018 | | 335,000 | 350,912 |
| | 9,498,152 |
| Materials 5.6% |
| Ardagh Packaging Finance PLC, 144A, 3.241%**, 12/15/2019 | 310,000 | 299,150 |
| Berry Plastics Corp.: |
| | 5.5%, 5/15/2022 | | 435,000 | 441,525 |
| | 9.75%, 1/15/2021 | | 460,000 | 511,750 |
| Cascades, Inc., 144A, 5.5%, 7/15/2022 | | 145,000 | 144,275 |
| Clearwater Paper Corp., 144A, 5.375%, 2/1/2025 | | 290,000 | 285,650 |
| Coveris Holdings SA, 144A, 7.875%, 11/1/2019 | | 275,000 | 283,250 |
| Crown Americas LLC, 6.25%, 2/1/2021 | | 50,000 | 52,625 |
| | Principal Amount ($)(a) | Value ($) |
| | |
| Exopack Holding Corp., 144A, 10.0%, 6/1/2018 | | 230,000 | 243,800 |
| First Quantum Minerals Ltd.: |
| | 144A, 6.75%, 2/15/2020 | | 551,000 | 498,655 |
| | 144A, 7.0%, 2/15/2021 | | 475,000 | 427,500 |
| FMG Resources (August 2006) Pty Ltd.: |
| | 144A, 6.0%, 4/1/2017 (b) | | 315,000 | 301,219 |
| | 144A, 8.25%, 11/1/2019 (b) | 270,000 | 245,700 |
| Hexion U.S. Finance Corp.: |
| | 6.625%, 4/15/2020 | | 600,000 | 588,000 |
| | 8.875%, 2/1/2018 | | 270,000 | 240,300 |
| Kaiser Aluminum Corp., 8.25%, 6/1/2020 | | 260,000 | 282,100 |
| Packaging Dynamics Corp., 144A, 8.75%, 2/1/2016 | | 428,000 | 428,000 |
| Perstorp Holding AB, 144A, 8.75%, 5/15/2017 (b) | | 455,000 | 447,037 |
| Plastipak Holdings, Inc., 144A, 6.5%, 10/1/2021 | | 250,000 | 248,750 |
| Polymer Group, Inc., 7.75%, 2/1/2019 | | 270,000 | 279,787 |
| Rain CII Carbon LLC: |
| | 144A, 8.0%, 12/1/2018 | | 270,000 | 272,700 |
| | 144A, 8.25%, 1/15/2021 | | 200,000 | 204,500 |
| Sealed Air Corp.: |
| | 144A, 4.875%, 12/1/2022 | | 115,000 | 114,138 |
| | 144A, 5.125%, 12/1/2024 | | 55,000 | 55,550 |
| | 144A, 8.375%, 9/15/2021 | | 150,000 | 167,625 |
| Signode Industrial Group Lux SA, 144A, 6.375%, 5/1/2022 | 210,000 | 204,750 |
| Tronox Finance LLC, 6.375%, 8/15/2020 | | 200,000 | 200,500 |
| WR Grace & Co-Conn: |
| | 144A, 5.125%, 10/1/2021 | | 90,000 | 92,250 |
| | 144A, 5.625%, 10/1/2024 | | 45,000 | 46,913 |
| | 7,607,999 |
| Telecommunication Services 18.7% |
| Altice Financing SA: |
| | 144A, 6.5%, 1/15/2022 | | 200,000 | 195,500 |
| | 144A, 7.875%, 12/15/2019 | | 235,000 | 240,616 |
| Altice Finco SA, 144A, 9.875%, 12/15/2020 | | 235,000 | 251,199 |
| Altice SA, 144A, 7.75%, 5/15/2022 | 245,000 | 245,459 |
| B Communications Ltd., 144A, 7.375%, 2/15/2021 | 270,000 | 285,525 |
| CenturyLink, Inc.: |
| | Series V, 5.625%, 4/1/2020 | 105,000 | 108,938 |
| | Series W, 6.75%, 12/1/2023 (b) | 280,000 | 306,600 |
| Cincinnati Bell, Inc., 8.375%, 10/15/2020 | | 1,505,000 | 1,580,250 |
| CommScope, Inc., 144A, 5.0%, 6/15/2021 | | 260,000 | 256,100 |
| CPI International, Inc., 8.75%, 2/15/2018 | | 260,000 | 267,150 |
| Digicel Group Ltd.: |
| | 144A, 7.125%, 4/1/2022 | | 265,000 | 246,450 |
| | 144A, 8.25%, 9/30/2020 | | 1,560,000 | 1,513,200 |
| Digicel Ltd.: |
| | 144A, 7.0%, 2/15/2020 | | 200,000 | 197,800 |
| | 144A, 8.25%, 9/1/2017 | | 1,090,000 | 1,103,625 |
| Frontier Communications Corp.: |
| | 6.25%, 9/15/2021 | | 140,000 | 140,700 |
| | 6.875%, 1/15/2025 | | 140,000 | 140,000 |
| | 7.125%, 1/15/2023 | | 1,370,000 | 1,393,975 |
| | 8.5%, 4/15/2020 | | 100,000 | 111,500 |
| | Principal Amount ($)(a) | Value ($) |
| | |
| Intelsat Jackson Holdings SA: |
| | 5.5%, 8/1/2023 | | 465,000 | 462,164 |
| | 7.25%, 10/15/2020 | | 1,230,000 | 1,299,187 |
| | 7.5%, 4/1/2021 | | 1,270,000 | 1,358,900 |
| Intelsat Luxembourg SA: |
| | 7.75%, 6/1/2021 | | 670,000 | 671,675 |
| | 8.125%, 6/1/2023 | | 105,000 | 107,100 |
| Level 3 Communications, Inc.: |
| | 144A, 5.75%, 12/1/2022 | | 280,000 | 281,750 |
| | 8.875%, 6/1/2019 | | 55,000 | 58,311 |
| Level 3 Escrow II, Inc., 144A, 5.375%, 8/15/2022 | | 675,000 | 678,375 |
| Level 3 Financing, Inc.: |
| | 6.125%, 1/15/2021 | | 165,000 | 170,775 |
| | 7.0%, 6/1/2020 | | 515,000 | 542,681 |
| | 8.125%, 7/1/2019 | | 425,000 | 451,563 |
| | 8.625%, 7/15/2020 | | 510,000 | 550,162 |
| Millicom International Cellular SA, 144A, 4.75%, 5/22/2020 | 370,000 | 348,725 |
| Pacnet Ltd., 144A, 9.0%, 12/12/2018 | 200,000 | 222,750 |
| Sprint Communications, Inc.: |
| | 144A, 7.0%, 3/1/2020 | | 245,000 | 264,600 |
| | 144A, 9.0%, 11/15/2018 | | 845,000 | 961,103 |
| Sprint Corp., 7.125%, 6/15/2024 | 1,345,000 | 1,250,850 |
| T-Mobile U.S.A., Inc.: |
| | 6.125%, 1/15/2022 | | 110,000 | 111,650 |
| | 6.625%, 11/15/2020 | | 705,000 | 717,337 |
| UPCB Finance III Ltd., 144A, 6.625%, 7/1/2020 | | 185,000 | 194,250 |
| UPCB Finance V Ltd., 144A, 7.25%, 11/15/2021 | | 1,480,000 | 1,618,750 |
| UPCB Finance VI Ltd., 144A, 6.875%, 1/15/2022 | | 300,000 | 326,250 |
| Wind Acquisition Finance SA, 144A, 6.5%, 4/30/2020 | | 195,000 | 199,388 |
| Windstream Corp.: |
| | 6.375%, 8/1/2023 (b) | | 265,000 | 247,775 |
| | 7.5%, 4/1/2023 | | 420,000 | 417,900 |
| | 7.75%, 10/15/2020 | | 1,880,000 | 1,936,399 |
| | 7.75%, 10/1/2021 | | 675,000 | 688,500 |
| | 7.875%, 11/1/2017 | | 495,000 | 535,837 |
| | 25,259,294 |
| Utilities 2.6% |
| AES Corp.: |
| | 3.234%**, 6/1/2019 | | 175,000 | 170,625 |
| | 8.0%, 10/15/2017 | | 51,000 | 57,248 |
| | 8.0%, 6/1/2020 | | 525,000 | 599,812 |
| Calpine Corp.: |
| | 5.375%, 1/15/2023 | | 240,000 | 242,400 |
| | 5.75%, 1/15/2025 | | 240,000 | 243,000 |
| Dynegy Finance I, Inc., 144A, 7.625%, 11/1/2024 | | 50,000 | 51,000 |
| Enel SpA, 144A, 8.75%**, 9/24/2073 | | 295,000 | 342,569 |
| Energy Future Holdings Corp., Series Q, 6.5%, 11/15/2024* | 550,000 | 429,000 |
| NGL Energy Partners LP, 144A, 5.125%, 7/15/2019 | | 190,000 | 182,400 |
| NRG Energy, Inc.: |
| | 144A, 6.25%, 5/1/2024 | | 770,000 | 783,475 |
| | 7.875%, 5/15/2021 | | 215,000 | 231,662 |
| | Principal Amount ($)(a) | Value ($) |
| | |
| RJS Power Holdings LLC, 144A, 5.125%, 7/15/2019 | 195,000 | 192,563 |
| | 3,525,754 |
Total Corporate Bonds (Cost $117,735,894) | 116,489,542 |
| |
| Government & Agency Obligation 0.8% |
| U.S. Treasury Obligation |
| U.S. Treasury Note, 1.0%, 8/31/2016 (c) (Cost $1,058,015) | 1,050,000 | 1,057,875 |
| |
| Loan Participations and Assignments 0.5% |
| Senior Loans** |
| Alliance Mortgage Cycle Loan, Term Loan A, 9.5%, 6/15/2010* | 700,000 | 0 |
| Level 3 Financing, Inc., Term Loan B5, 4.5%, 1/31/2022 | 365,000 | 365,912 |
| Ply Gem Industries, Inc., Term Loan, 4.0%, 2/1/2021 | 307,675 | 300,445 |
Total Loan Participations and Assignments (Cost $1,368,267) | 666,357 |
| |
| Convertible Bond 1.7% |
| Materials |
| GEO Specialty Chemicals, Inc., 144A, 7.5%, 3/31/2015 (PIK) (Cost $1,294,402) | 1,297,793 | 2,241,938 |
| |
| Preferred Security 0.8% |
| Materials |
| Hercules, Inc., 6.5%, 6/30/2029 (Cost $772,845) | 1,135,000 | 1,021,500 |
| | | Shares | | | Value ($) | |
| | | | |
| Common Stocks 0.0% | |
| Consumer Discretionary 0.0% | |
| Dawn Holdings, Inc.* (d) | | | 15 | | | | 41,683 | |
| Trump Entertainment Resorts, Inc.* | | | 45 | | | | 0 | |
| | | | | | | | 41,683 | |
| Industrials 0.0% | |
| Congoleum Corp.* | | | 24,000 | | | | 0 | |
| Quad Graphics, Inc. | | | 224 | | | | 5,143 | |
| | | | | | | | 5,143 | |
| Materials 0.0% | |
| GEO Specialty Chemicals, Inc.* | | | 24,225 | | | | 16,066 | |
| GEO Specialty Chemicals, Inc. 144A* | | | 2,206 | | | | 1,463 | |
| | | | | | | | 17,529 | |
Total Common Stocks (Cost $345,217) | | | | 64,355 | |
| | |
| Preferred Stock 0.8% | |
| Financials | |
| Ally Financial, Inc. Series G, 144A, 7.0% (Cost $1,058,296) | | | 1,134 | | | | 1,139,209 | |
| | | Shares | | | Value ($) | |
| | | | | | | | | |
| Warrants 0.1% | |
| Materials | |
| GEO Specialty Chemicals, Inc., Expiration Date 3/31/2015* | | | 119,802 | | | | 78,554 | |
| Hercules Trust II, Expiration Date 3/31/2029* | | | 1,100 | | | | 10,810 | |
Total Warrants (Cost $244,286) | | | | 89,364 | |
| | |
| Securities Lending Collateral 3.7% | |
| Daily Assets Fund Institutional, 0.10% (e) (f) (Cost $5,014,149) | | | 5,014,149 | | | | 5,014,149 | |
| | |
| | | Shares | | | Value ($) | |
| | | | | | | | | |
| Cash Equivalents 7.4% | |
| Central Cash Management Fund, 0.06% (e) (Cost $9,940,357) | | | 9,940,357 | | | | 9,940,357 | |
| | | % of Net Assets | | | Value ($) | |
| | | | |
Total Investment Portfolio (Cost $138,831,728)† | | | 101.9 | | | | 137,724,646 | |
| Other Assets and Liabilities, Net | | | (1.9 | ) | | | (2,503,057 | ) |
| Net Assets | | | 100.0 | | | | 135,221,589 | |
The following table represents bonds and senior loans that are in default:
| Security | | Coupon | | Maturity Date | Principal Amount | | | Cost ($) | | | Value ($) | |
| Alliance Mortgage Cycle Loan* | | | 9.5 | % | 6/15/2010 | USD | | | 700,000 | | | | 700,000 | | | | 0 | |
| Energy Future Holdings Corp.* | | | 6.5 | % | 11/15/2024 | USD | | | 550,000 | | | | 329,201 | | | | 429,000 | |
| Hellas Telecommunications Finance* | | | 8.082 | % | 7/15/2015 | EUR | | | 322,107 | | | | 92,199 | | | | 0 | |
| | | | | | | | | | | | | | 1,121,400 | | | | 429,000 | |
* Non-income producing security.
** Floating rate securities' yields vary with a designated market index or market rate, such as the coupon-equivalent of the U.S. Treasury Bill rate. These securities are shown at their current rate as of December 31, 2014.
† The cost for federal income tax purposes was $138,769,514. At December 31, 2014, net unrealized depreciation for all securities based on tax cost was $1,044,868. This consisted of aggregate gross unrealized appreciation for all securities in which there was an excess of value over tax cost of $4,126,638 and aggregate gross unrealized depreciation for all securities in which there was an excess of tax cost over value of $5,171,506.
(a) Principal amount stated in U.S. dollars unless otherwise noted.
(b) All or a portion of these securities were on loan. In addition, "Other Assets and Liabilities, Net" may include pending sales that are also on loan. The value of securities loaned at December 31, 2014 amounted to $4,829,671, which is 3.6% of net assets.
(c) At December 31, 2014, this security has been pledged, in whole or in part, as collateral for open swap contracts.
(d) The Fund may purchase securities that are subject to legal or contractual restrictions on resale ("restricted securities"). Restricted securities are securities which have not been registered with the Securities and Exchange Commission under the Securities Act of 1933. The Fund may be unable to sell a restricted security and it may be more difficult to determine a market value for a restricted security. Moreover, if adverse market conditions were to develop during the period between the Fund's decision to sell a restricted security and the point at which the Fund is permitted or able to sell such security, the Fund might obtain a price less favorable than the price that prevailed when it decided to sell. This investment practice, therefore, could have the effect of increasing the level of illiquidity of the Fund. The future value of these securities is uncertain and there may be changes in the estimated value of these securities.
| Schedule of Restricted Securities | Acquisition Date | | Cost ($) | | | Value ($) | | | Value as % of Net Assets | |
| Dawn Holdings, Inc.* | August 2013 | | | 53,353 | | | | 41,683 | | | | 0.03 | |
(e) Affiliated fund managed by Deutsche Investment Management Americas Inc. The rate shown is the annualized seven-day yield at period end.
(f) Represents collateral held in connection with securities lending. Income earned by the Fund is net of borrower rebates.
144A: Security exempt from registration under Rule 144A of the Securities Act of 1933. These securities may be resold in transactions exempt from registration, normally to qualified institutional buyers.
PIK: Denotes that all or a portion of the income is paid in-kind in the form of additional principal.
REIT: Real Estate Investment Trust
At December 31, 2014, open credit default swap contracts sold were as follows:
| Bilateral Swaps | |
Effective/ Expiration Dates | | Notional Amount ($) (g) | | | Fixed Cash Flows Received | | Underlying Debt Obligation/ Quality Rating (h) | | Value ($) | | | Upfront Payments Paid/ (Received) ($) | | | Unrealized Appreciation/ (Depreciation) ($) | |
12/20/2011 3/20/2017 | | | 370,000 | 1 | | | 5.0 | % | CIT Group, Inc., 5.5%, 2/15/2019, BB– | | | 30,937 | | | | 6,913 | | | | 24,024 | |
11/14/2014 12/20/2019 | | | 630,000 | 2 | | | 5.0 | % | Community Health Systems, Inc., 8.0%, 11/15/2019, B– | | | 61,790 | | | | 42,162 | | | | 19,628 | |
6/20/2013 9/20/2018 | | | 245,000 | 1 | | | 5.0 | % | DISH DBS Corp., 6.75%, 6/1/2021, BB– | | | 29,878 | | | | 16,279 | | | | 13,599 | |
6/20/2011 9/20/2015 | | | 1,145,000 | 3 | | | 5.0 | % | HCA, Inc., 6.375%, 1/15/2015, B– | | | 40,222 | | | | 10,468 | | | | 29,754 | |
3/21/2011 6/20/2016 | | | 610,000 | 4 | | | 5.0 | % | HCA, Inc., 6.375%, 1/15/2015, B– | | | 40,531 | | | | 6,704 | | | | 33,827 | |
6/20/2013 9/20/2018 | | | 470,000 | 3 | | | 5.0 | % | HCA, Inc., 8.0%, 10/1/2018, B– | | | 60,122 | | | | 27,942 | | | | 32,180 | |
6/20/2013 9/20/2018 | | | 730,000 | 5 | | | 5.0 | % | Sprint Communications, Inc., 6.0%, 12/1/2016, BB– | | | 35,357 | | | | 32,254 | | | | 3,103 | |
12/20/2013 3/20/2019 | | | 3,000,000 | 3 | | | 5.0 | % | Sprint Communications, Inc., 6.0%, 12/1/2016, BB– | | | 119,987 | | | | 262,467 | | | | (142,480 | ) |
| Total unrealized appreciation | | | | 13,635 | |
(g) The maximum potential amount of future undiscounted payments that the Fund could be required to make under a credit default swap contract would be the notional amount of the contract. These potential amounts would be partially offset by any recovery values of the referenced debt obligation or net amounts received from the settlement of buy protection credit default swap contracts entered into by the Fund for the same referenced debt obligation, if any.
(h) The quality ratings represent the higher of Moody's Investors Service, Inc. ("Moody's") or Standard & Poor's Corporation ("S&P") credit ratings and are unaudited.
Counterparties:
1 Credit Suisse
2 Morgan Stanley
3 Goldman Sachs & Co.
4 JPMorgan Chase Securities, Inc.
5 Bank of America
| Currency Abbreviations |
EUR Euro USD United States Dollar |
For information on the Fund's policy and additional disclosures regarding credit default swap contracts and forward foreign currency exchange contracts, please refer to Note B in the accompanying Notes to Financial Statements.
Fair Value Measurements
Various inputs are used in determining the value of the Fund's investments. These inputs are summarized in three broad levels. Level 1 includes quoted prices in active markets for identical securities. Level 2 includes other significant observable inputs (including quoted prices for similar securities, interest rates, prepayment speeds and credit risk). Level 3 includes significant unobservable inputs (including the Fund's own assumptions in determining the fair value of investments). The level assigned to the securities valuations may not be an indication of the risk or liquidity associated with investing in those securities.
The following is a summary of the inputs used as of December 31, 2014 in valuing the Fund's investments. For information on the Fund's policy regarding the valuation of investments, please refer to the Security Valuation section of Note A in the accompanying Notes to Financial Statements.
| Assets | | Level 1 | | | Level 2 | | | Level 3 | | | Total | |
| | |
| Fixed Income Investments (i) | | | | | | | | | | | | |
| Corporate Bonds | | $ | — | | | $ | 116,489,542 | | | $ | 0 | | | $ | 116,489,542 | |
| Government & Agency Obligation | | | — | | | | 1,057,875 | | | | — | | | | 1,057,875 | |
| Loan Participations and Assignments | | | — | | | | 666,357 | | | | 0 | | | | 666,357 | |
| Convertible Bond | | | — | | | | — | | | | 2,241,938 | | | | 2,241,938 | |
| Preferred Security | | | — | | | | 1,021,500 | | | | — | | | | 1,021,500 | |
| Common Stocks (i) | | | 5,143 | | | | — | | | | 59,212 | | | | 64,355 | |
| Preferred Stock | | | — | | | | 1,139,209 | | | | — | | | | 1,139,209 | |
| Warrants (i) | | | — | | | | — | | | | 89,364 | | | | 89,364 | |
| Short-Term Investments (i) | | | 14,954,506 | | | | — | | | | — | | | | 14,954,506 | |
| Derivatives (j) | | | | | | | | | | | | | | | | |
| Credit Default Swap Contracts | | | — | | | | 156,115 | | | | — | | | | 156,115 | |
| Total | | $ | 14,959,649 | | | $ | 120,530,598 | | | $ | 2,390,514 | | | $ | 137,880,761 | |
| Liabilities | | Level 1 | | | Level 2 | | | Level 3 | | | Total | |
| | |
| Derivatives (j) | |
| Credit Default Swap Contracts | | $ | — | | | $ | (142,480 | ) | | $ | — | | | $ | (142,480 | ) |
| Total | | $ | — | | | $ | (142,480 | ) | | $ | — | | | $ | (142,480 | ) |
(i) See Investment Portfolio for additional detailed categorizations.
(j) Derivatives include unrealized appreciation (depreciation) on credit default swap contracts.
Level 3 Reconciliation
The following is a reconciliation of the Fund's Level 3 investments for which significant unobservable inputs were used in determining value:
| | | Corporate Bonds | | | Loan Participations and Assignments | | | Convertible Bonds | | | Common Stocks | | | Warrants | | | Total | |
| Balance as of December 31, 2013 | | $ | 0 | | | $ | 0 | | | $ | 2,514,085 | | | $ | 289,546 | | | $ | 99,821 | | | $ | 2,903,452 | |
| Realized gains (loss) | | | (965,174 | ) | | | — | | | | — | | | | 44,875 | | | | — | | | | (920,299 | ) |
| Change in unrealized appreciation (depreciation) | | | 965,174 | | | | — | | | | (283,646 | ) | | | (48,008 | ) | | | (10,457 | ) | | | 623,063 | |
| Amortization of premium/accretion of discount | | | — | | | | — | | | | 11,499 | | | | — | | | | — | | | | 11,499 | |
| Purchases | | | — | | | | — | | | | — | | | | — | | | | — | | | | — | |
| (Sales) | | | — | | | | — | | | | — | | | | (227,201 | ) | | | — | | | | (227,201 | ) |
| Transfer into Level 3 | | | — | | | | — | | | | — | | | | — | | | | — | | | | — | |
| Balance as of December 31, 2014 | | $ | 0 | | | $ | 0 | | | $ | 2,241,938 | | | $ | 59,212 | | | $ | 89,364 | | | $ | 2,390,514 | |
| Net change in unrealized appreciation (depreciation) from investments still held as of December 31, 2014 | | $ | 0 | | | $ | 0 | | | $ | (283,646 | ) | | $ | (3,133 | ) | | $ | (10,457 | ) | | $ | (297,236 | ) |
| Quantitative Disclosure About Significant Unobservable Inputs | |
| Asset Class | | Fair Value at 12/31/14 | | Valuation Technique(s) | Unobservable Input | | Range (Weighted Average) | |
| Common Stocks | |
| Consumer Discretionary | | $ | 41,683 | | Market Approach | EV/EBITDA Multiple | | | 11.24 | |
| | | | | | | Discount to public comparables | | | 15 | % |
| | | | | | | Discount for lack of marketability | | | 15 | % |
| | | $ | 0 | | Asset Valuation | Book Value of Equity | | | 0 | % |
| Industrials | | $ | 0 | | Asset Valuation | Book Value of Equity | | | 0 | % |
| Materials | | $ | 17,529 | | Market Approach | EV/EBITDA Multiple | | | 6.26 | |
| Discount to public comparables | | | 20 | % |
| Discount for lack of marketability | | | 25 | % |
| Warrants | |
| Materials | | $ | 10,810 | | Black Scholes Option Pricing Model | Implied Volatility | | | 30 | % |
| | Discount for lack of marketability | | | 20 | % |
| | | $ | 78,554 | | Market Approach | EV/EBITDA Multiple | | | 6.26 | |
| | Discount to public comparables | | | 20 | % |
| | Discount for lack of marketability | | | 25 | % |
| Loan Participations & Assignments | |
| Senior Loans | | $ | 0 | | Market Approach | Evaluated Price | | | 0 | |
| Corporate Bonds | |
| Finance | | $ | 0 | | Asset Valuation | Book Value | | | 0 | |
| Convertible Bonds | |
| Materials | | $ | 2,241,938 | | Convertible Bond Methodology | EV/EBITDA Multiple | | | 6.26 | |
| | | | | | | Discount to public comparable | | | 20 | % |
| | | | | | | Discount for lack of marketability | | | 25 | % |
Qualitative Disclosure About Unobservable Inputs
Significant unobservable inputs developed by the Pricing Committee and used in the fair value measurement of the Fund's investments include enterprise value (EV) to earnings before interest, taxes, depreciation and amortization (EBITDA) ratio with a discount for lack of marketability. A significant change in the EV to EBITDA ratio and/or a significant change in the discount for lack of marketability could have a material change on the fair value measurement.
The accompanying notes are an integral part of the financial statements.
Statement of Assets and Liabilities | as of December 31, 2014 | |
| Assets | |
Investments: Investments in non-affiliated securities, at value (cost $123,877,222) — including $4,829,671 of securities loaned | | $ | 122,770,140 | |
| Investment in Daily Assets Fund Institutional (cost $5,014,149)* | | | 5,014,149 | |
| Investment in Central Cash Management Fund (cost $9,940,357) | | | 9,940,357 | |
| Total investments in securities, at value (cost $138,831,728) | | | 137,724,646 | |
| Cash | | | 247,824 | |
| Foreign currency, at value (cost $76) | | | 72 | |
| Receivable for investments sold | | | 94,664 | |
| Receivable for Fund shares sold | | | 95 | |
| Interest receivable | | | 2,037,142 | |
| Unrealized appreciation on bilateral swap contracts | | | 156,115 | |
| Upfront payments paid on bilateral swap contracts | | | 405,189 | |
| Foreign taxes recoverable | | | 277 | |
| Other assets | | | 2,760 | |
| Total assets | | | 140,668,784 | |
| Liabilities | |
| Payable upon return of securities loaned | | | 5,014,149 | |
| Payable for Fund shares redeemed | | | 98,362 | |
| Unrealized depreciation on bilateral swap contracts | | | 142,480 | |
| Accrued management fee | | | 49,768 | |
| Accrued Trustees' fees | | | 3,051 | |
| Other accrued expenses and payables | | | 139,385 | |
| Total liabilities | | | 5,447,195 | |
| Net assets, at value | | $ | 135,221,589 | |
| Net Assets Consist of | |
| Undistributed net investment income | | | 8,342,159 | |
Net unrealized appreciation (depreciation) on: Investments | | | (1,107,082 | ) |
| Swap contracts | | | 13,635 | |
| Foreign currency | | | (4 | ) |
| Accumulated net realized gain (loss) | | | (37,529,883 | ) |
| Paid-in capital | | | 165,502,764 | |
| Net assets, at value | | $ | 135,221,589 | |
Class A Net Asset Value, offering and redemption price per share ($135,196,648 ÷ 20,495,541 outstanding shares of beneficial interest, no par value, unlimited number of shares authorized) | | $ | 6.60 | |
Class B Net Asset Value, offering and redemption price per share ($24,941 ÷ 3,764 outstanding shares of beneficial interest, no par value, unlimited number of shares authorized) | | $ | 6.63 | |
* Represents collateral on securities loaned.
The accompanying notes are an integral part of the financial statements.
| for the year ended December 31, 2014 | |
| Investment Income | |
| Interest | | $ | 9,089,997 | |
| Dividends | | | 75,928 | |
| Income distributions — Central Cash Management Fund | | | 8,966 | |
| Securities lending income, including income from Daily Assets Fund Institutional, net of borrower rebates | | | 29,130 | |
| Total income | | | 9,204,021 | |
Expenses: Management fee | | | 774,879 | |
| Administration fee | | | 154,976 | |
| Distribution service fee (Class B) | | | 2,610 | |
| Recordkeeping fees (Class B) | | | 1,498 | |
| Services to shareholders | | | 1,606 | |
| Custodian fee | | | 29,677 | |
| Professional fees | | | 109,956 | |
| Reports to shareholders | | | 36,864 | |
| Trustees' fees and expenses | | | 9,645 | |
| Other | | | 42,192 | |
| Total expenses before expense reductions | | | 1,163,903 | |
| Expense reductions | | | (28,084 | ) |
| Total expenses after expense reductions | | | 1,135,819 | |
| Net investment income (loss) | | | 8,068,202 | |
| Realized and Unrealized Gain (Loss) | |
Net realized gain (loss) from: Investments | | | 128,941 | |
| Swap contracts | | | 1,013,217 | |
| Foreign currency | | | 46,159 | |
| | | | 1,188,317 | |
Change in net unrealized appreciation (depreciation) on: Investments | | | (5,350,380 | ) |
| Swap contracts | | | (1,001,496 | ) |
| Foreign currency | | | 2,788 | |
| | | | (6,349,088 | ) |
| Net gain (loss) | | | (5,160,771 | ) |
| Net increase (decrease) in net assets resulting from operations | | $ | 2,907,431 | |
The accompanying notes are an integral part of the financial statements.
Statement of Changes in Net Assets | | | Years Ended December 31, | |
| Increase (Decrease) in Net Assets | | 2014 | | | 2013 | |
Operations: Net investment income | | $ | 8,068,202 | | | $ | 9,500,105 | |
| Net realized gain (loss) | | | 1,188,317 | | | | 3,917,069 | |
| Change in net unrealized appreciation (depreciation) | | | (6,349,088 | ) | | | (804,655 | ) |
| Net increase (decrease) in net assets resulting from operations | | | 2,907,431 | | | | 12,612,519 | |
Distributions to shareholders from: Net investment income: Class A | | | (10,554,088 | ) | | | (12,380,542 | ) |
| Class B | | | (119,183 | ) | | | (6,491 | ) |
| Total distributions | | | (10,673,271 | ) | | | (12,387,033 | ) |
Fund share transactions: Class A Proceeds from shares sold | | | 12,833,015 | | | | 37,136,318 | |
| Reinvestment of distributions | | | 10,554,088 | | | | 12,380,542 | |
| Payments for shares redeemed | | | (45,572,381 | ) | | | (63,021,014 | ) |
| Net increase (decrease) in net assets from Class A share transactions | | | (22,185,278 | ) | | | (13,504,154 | ) |
Class B Proceeds from shares sold | | | 7,949,939 | | | | 674,207 | |
| Reinvestment of distributions | | | 119,183 | | | | 6,491 | |
| Payments for shares redeemed | | | (8,248,423 | ) | | | (452,620 | ) |
| Net increase (decrease) in net assets from Class B share transactions | | | (179,301 | ) | | | 228,078 | |
| Increase (decrease) in net assets | | | (30,130,419 | ) | | | (13,050,590 | ) |
| Net assets at beginning of period | | | 165,352,008 | | | | 178,402,598 | |
| Net assets at end of period (including undistributed net investment income of $8,342,159 and $9,541,574, respectively) | | $ | 135,221,589 | | | $ | 165,352,008 | |
| Other Information | |
Class A Shares outstanding at beginning of period | | | 23,727,813 | | | | 25,717,511 | |
| Shares sold | | | 1,881,827 | | | | 5,481,259 | |
| Shares issued to shareholders in reinvestment of distributions | | | 1,575,237 | | | | 1,834,154 | |
| Shares redeemed | | | (6,689,336 | ) | | | (9,305,111 | ) |
| Net increase (decrease) in Class A shares | | | (3,232,272 | ) | | | (1,989,698 | ) |
| Shares outstanding at end of period | | | 20,495,541 | | | | 23,727,813 | |
Class B Shares outstanding at beginning of period | | | 46,339 | | | | 13,214 | |
| Shares sold | | | 1,159,065 | | | | 98,852 | |
| Shares issued to shareholders in reinvestment of distributions | | | 17,657 | | | | 955 | |
| Shares redeemed | | | (1,219,297 | ) | | | (66,682 | ) |
| Net increase (decrease) in Class B shares | | | (42,575 | ) | | | 33,125 | |
| Shares outstanding at end of period | | | 3,764 | | | | 46,339 | |
The accompanying notes are an integral part of the financial statements.
| | | Years Ended December 31, | |
| Class A | | | 2014 | | | 2013 | | | 2012 | | | 2011 | | | 2010 | |
| Selected Per Share Data | |
| Net asset value, beginning of period | | $ | 6.96 | | | $ | 6.93 | | | $ | 6.56 | | | $ | 6.90 | | | $ | 6.55 | |
Income (loss) from investment operations: Net investment incomea | | | .36 | | | | .39 | | | | .45 | | | | .51 | | | | .52 | |
| Net realized and unrealized gain (loss) | | | (.25 | ) | | | .14 | | | | .48 | | | | (.24 | ) | | | .36 | |
| Total from investment operations | | | .11 | | | | .53 | | | | .93 | | | | .27 | | | | .88 | |
Less distributions from: Net investment income | | | (.47 | ) | | | (.50 | ) | | | (.56 | ) | | | (.61 | ) | | | (.53 | ) |
| Net asset value, end of period | | $ | 6.60 | | | $ | 6.96 | | | $ | 6.93 | | | $ | 6.56 | | | $ | 6.90 | |
| Total Return (%) | | | 1.47 | b | | | 7.91 | b | | | 14.91 | | | | 3.84 | | | | 14.00 | |
| Ratios to Average Net Assets and Supplemental Data | |
| Net assets, end of period ($ millions) | | | 135 | | | | 165 | | | | 178 | | | | 169 | | | | 195 | |
| Ratio of expenses before expense reductions (%) | | | .75 | | | | .73 | | | | .72 | | | | .72 | | | | .72 | |
| Ratio of expenses after expense reductions (%) | | | .73 | | | | .72 | | | | .72 | | | | .72 | | | | .72 | |
| Ratio of net investment income (%) | | | 5.21 | | | | 5.69 | | | | 6.68 | | | | 7.59 | | | | 7.90 | |
| Portfolio turnover rate (%) | | | 52 | | | | 58 | | | | 58 | | | | 59 | | | | 93 | |
a Based on average shares outstanding during the period. b Total return would have been lower had certain expenses not been reduced. | |
| | | Years Ended December 31, | |
| Class B | | | 2014 | | | 2013 | | | 2012 | | | 2011 | | | 2010 | |
| Selected Per Share Data | |
| Net asset value, beginning of period | | $ | 6.99 | | | $ | 6.97 | | | $ | 6.59 | | | $ | 6.93 | | | $ | 6.58 | |
Income (loss) from investment operations: Net investment incomea | | | .35 | | | | .36 | | | | .43 | | | | .49 | | | | .50 | |
| Net realized and unrealized gain (loss) | | | (.26 | ) | | | .15 | | | | .49 | | | | (.24 | ) | | | .36 | |
| Total from investment operations | | | .09 | | | | .51 | | | | .92 | | | | .25 | | | | .86 | |
Less distributions from: Net investment income | | | (.45 | ) | | | (.49 | ) | | | (.54 | ) | | | (.59 | ) | | | (.51 | ) |
| Net asset value, end of period | | $ | 6.63 | | | $ | 6.99 | | | $ | 6.97 | | | $ | 6.59 | | | $ | 6.93 | |
| Total Return (%) | | | 1.22 | b | | | 7.44 | b | | | 14.70 | b | | | 3.57 | | | | 13.64 | |
| Ratios to Average Net Assets and Supplemental Data | |
| Net assets, end of period ($ thousands) | | | 25 | | | | 324 | | | | 92 | | | | 85 | | | | 144 | |
| Ratio of expenses before expense reductions (%) | | | 1.13 | | | | 1.10 | | | | .99 | | | | .99 | | | | .99 | |
| Ratio of expenses after expense reductions (%) | | | .97 | | | | .97 | | | | .99 | | | | .99 | | | | .99 | |
| Ratio of net investment income (%) | | | 5.09 | | | | 5.29 | | | | 6.42 | | | | 7.33 | | | | 7.63 | |
| Portfolio turnover rate (%) | | | 52 | | | | 58 | | | | 58 | | | | 59 | | | | 93 | |
a Based on average shares outstanding during the period. b Total return would have been lower had certain expenses not been reduced. | |
Notes to Financial Statements
A. Organization and Significant Accounting Policies
Deutsche High Income VIP (formerly DWS High Income VIP) (the "Fund") is a diversified series of Deutsche Variable Series II (formerly DWS Variable Series II) (the "Trust"), which is registered under the Investment Company Act of 1940, as amended (the "1940 Act"), as an open-end management investment company organized as a Massachusetts business trust.
Multiple Classes of Shares of Beneficial Interest. The Fund offers two classes of shares (Class A shares and Class B shares). Sales of Class B shares are subject to recordkeeping fees up to 0.15% and Rule 12b-1 fees under the 1940 Act equal to an annual rate of 0.25% of the average daily net assets of the Class B shares of the Fund. Class A shares are not subject to such fees.
Investment income, realized and unrealized gains and losses, and certain fund-level expenses and expense reductions, if any, are borne pro rata on the basis of relative net assets by the holders of all classes of shares except that each class bears certain expenses unique to that class (including the applicable Rule 12b-1 fee and recordkeeping fees). Differences in class-level expenses may result in payment of different per share dividends by class. All shares have equal rights with respect to voting subject to class-specific arrangements.
The Fund's financial statements are prepared in accordance with accounting principles generally accepted in the United States of America which require the use of management estimates. Actual results could differ from those estimates. The policies described below are followed consistently by the Fund in the preparation of its financial statements.
Security Valuation. Investments are stated at value determined as of the close of regular trading on the New York Stock Exchange on each day the exchange is open for trading.
Various inputs are used in determining the value of the Fund's investments. These inputs are summarized in three broad levels. Level 1 includes quoted prices in active markets for identical securities. Level 2 includes other significant observable inputs (including quoted prices for similar securities, interest rates, prepayment speeds and credit risk). Level 3 includes significant unobservable inputs (including the Fund's own assumptions in determining the fair value of investments). The level assigned to the securities valuations may not be an indication of the risk or liquidity associated with investing in those securities.
Debt securities and loan participations and assignments are valued at prices supplied by independent pricing services approved by the Fund's Board. Such services may use various pricing techniques which take into account appropriate factors such as yield, quality, coupon rate, maturity, type of issue, trading characteristics, prepayment speeds and other data, as well as broker quotes. If the pricing services are unable to provide valuations, debt securities are valued at the average of the most recent reliable bid quotations or evaluated prices, as applicable, obtained from broker-dealers and loan participations and assignments are valued at the mean of the most recent bid and ask quotations or evaluated prices, as applicable, obtained from broker-dealers. Certain securities may be valued on the basis of a price provided by a single source or broker-dealer. No active trading market may exist for some senior loans and they may be subject to restrictions on resale. The inability to dispose of senior loans in a timely fashion could result in losses. These securities are generally categorized as Level 2.
Equity securities are valued at the most recent sale price or official closing price reported on the exchange (U.S. or foreign) or over-the-counter market on which they trade. Securities for which no sales are reported are valued at the calculated mean between the most recent bid and asked quotations on the relevant market or, if a mean cannot be determined, at the most recent bid quotation. Equity securities are generally categorized as Level 1 securities.
Investments in open-end investment companies are valued at their net asset value each business day and are categorized as Level 1.
Forward currency contracts are valued at the prevailing forward exchange rate of the underlying currencies and are categorized as Level 2.
Swap contracts are valued daily based upon prices supplied by a Board approved pricing vendor, if available, and otherwise are valued at the price provided by the broker-dealer. Swap contracts are generally categorized as Level 2.
Securities and other assets for which market quotations are not readily available or for which the above valuation procedures are deemed not to reflect fair value are valued in a manner that is intended to reflect their fair value as determined in accordance with procedures approved by the Board and are generally categorized as Level 3. In accordance with the Fund's valuation procedures, factors considered in determining value may include, but are not limited to, the type of the security; the size of the holding; the initial cost of the security; the existence of any contractual restrictions on the security's disposition; the price and extent of public trading in similar securities of the issuer or of comparable companies; quotations or evaluated prices from broker-dealers and/or pricing services; information obtained from the issuer, analysts, and/or the appropriate stock exchange (for exchange-traded securities); an analysis of the company's or issuer's financial statements; an evaluation of the forces that influence the issuer and the market(s) in which the security is purchased and sold; and with respect to debt securities, the maturity, coupon, creditworthiness, currency denomination and the movement of the market in which the security is normally traded. The value determined under these procedures may differ from published values for the same securities.
Disclosure about the classification of fair value measurements is included in a table following the Fund's Investment Portfolio.
Foreign Currency Translations. The books and records of the Fund are maintained in U.S. dollars. Investment securities and other assets and liabilities denominated in a foreign currency are translated into U.S. dollars at the prevailing exchange rates at period end. Purchases and sales of investment securities, income and expenses are translated into U.S. dollars at the prevailing exchange rates on the respective dates of the transactions.
Net realized and unrealized gains and losses on foreign currency transactions represent net gains and losses between trade and settlement dates on securities transactions, the acquisition and disposition of foreign currencies, and the difference between the amount of net investment income accrued and the U.S. dollar amount actually received. That portion of both realized and unrealized gains and losses on investments that results from fluctuations in foreign currency exchange rates is not separately disclosed but is included with net realized and unrealized gain/appreciation and loss/depreciation on investments.
Securities Lending. Deutsche Bank AG, as lending agent, lends securities of the Fund to certain financial institutions under the terms of the Security Lending Agreement. The Fund retains the benefits of owning the securities it has loaned and continues to receive interest and dividends generated by the securities and to participate in any changes in their market value. The Fund requires the borrowers of the securities to maintain collateral with the Fund consisting of either cash or liquid, unencumbered assets having a value at least equal to the value of the securities loaned. When the collateral falls below specified amounts, the lending agent will use its best effort to obtain additional collateral on the next business day to meet required amounts under the security lending agreement. The Fund may invest the cash collateral into a joint trading account in an affiliated money market fund pursuant to Exemptive Orders issued by the SEC. The Fund receives compensation for lending its securities either in the form of fees or by earning interest on invested cash collateral net of borrower rebates and fees paid to a lending agent. Either the Fund or the borrower may terminate the loan. There may be risks of delay and costs in recovery of securities or even loss of rights in the collateral should the borrower of the securities fail financially. If the Fund is not able to recover securities lent, the Fund may sell the collateral and purchase a replacement investment in the market, incurring the risk that the value of the replacement security is greater than the value of the collateral. The Fund is also subject to all investment risks associated with the reinvestment of any cash collateral received, including, but not limited to, interest rate, credit and liquidity risk associated with such investments.
As of December 31, 2014, the Fund had securities on loan. The value of the related collateral exceeded the value of the securities loaned at period end.
Loan Participations and Assignments. Loan Participations and Assignments are portions of loans originated by banks and sold in pieces to investors. These floating-rate loans ("Loans") in which the Fund invests are arranged between the borrower and one or more financial institutions ("Lenders"). These Loans may take the form of Senior Loans, which are corporate obligations often issued in connection with recapitalizations, acquisitions, leveraged buy outs and refinancing. The Fund invests in such Loans in the form of participations in Loans ("Participations") or assignments of all or a portion of Loans from third parties ("Assignments"). Participations typically result in the Fund having a contractual relationship with only the Lender, not with the borrower. The Fund has the right to receive payments of principal, interest and any fees to which it is entitled from the Lender selling the Participation and only upon receipt by the Lender of the payments from the borrower. In connection with purchasing Participations, the Fund generally has no right to enforce compliance by the borrower with the terms of the loan agreement relating to the Loan, or any rights of set off against the borrower, and the Fund will not benefit directly from any collateral supporting the Loan in which it has purchased the Participation. As a result, the Fund assumes the credit risk of both the borrower and the Lender that is selling the Participation. Assignments typically result in the Fund having a direct contractual relationship with the borrower, and the Fund may enforce compliance by the borrower with the terms of the loan agreement. Loans held by the Fund are generally in the form of Assignments, but the Fund may also invest in Participations. All Loans involve interest rate risk, liquidity risk and credit risk, including the potential default or insolvency of the borrower.
When-Issued/Delayed Delivery Securities. The Fund may purchase securities with delivery or payment to occur at a later date beyond the normal settlement period. At the time the Fund enters into a commitment to purchase a security, the transaction is recorded and the value of the transaction is reflected in the net asset value. The price of such security and the date when the security will be delivered and paid for are fixed at the time the transaction is negotiated. The value of the security may vary with market fluctuations. At the time the Fund enters into a purchase transaction it is required to segregate cash or other liquid assets at least equal to the amount of the commitment. Additionally, the Fund may be required to post securities and/or cash collateral in accordance with the terms of the commitment.
Certain risks may arise upon entering into when-issued or delayed delivery transaction from the potential inability of counterparties to meet the terms of their contracts or if the issuer does not issue the securities due to political, economic, or other factors. Additionally, losses may arise due to changes in the value of the underlying securities.
Taxes. The Fund's policy is to comply with the requirements of the Internal Revenue Code, as amended, which are applicable to regulated investment companies and to distribute all of its taxable income to its shareholders.
Under the Regulated Investment Company Modernization Act of 2010, net capital losses incurred post-enactment may be carried forward indefinitely, and their character is retained as short-term and/or long-term. Previously, net capital losses were carried forward for eight years and treated as short-term losses. As a transition rule, the Act requires that post-enactment net capital losses be used before pre-enactment net capital losses.
At December 31, 2014, the Fund had a net tax basis capital loss carryforward of approximately $37,593,000, including $35,391,000 of pre-enactment losses, which may be applied against any realized net taxable capital gains of each succeeding year until fully utilized or until December 31, 2015 ($858,000), December 31, 2016 ($17,301,000) and December 31, 2017 ($17,232,000), the respective expiration dates, whichever occurs first; and approximately $2,202,000 of post-enactment long-term losses, which may be applied against realized net taxable capital gains indefinitely, including short-term losses ($614,000) and long-term losses ($1,588,000).
The Fund has reviewed the tax positions for the open tax years as of December 31, 2014 and has determined that no provision for income tax and/or uncertain tax provisions is required in the Fund's financial statements. The Fund's federal tax returns for the prior three fiscal years remain open subject to examination by the Internal Revenue Service.
Distribution of Income and Gains. Distributions from net investment income of the Fund, if any, are declared and distributed to shareholders annually. Net realized gains from investment transactions, in excess of available capital loss carryforwards, would be taxable to the Fund if not distributed and, therefore, will be distributed to shareholders at least annually. The Fund may also make additional distributions for tax purposes if necessary.
The timing and characterization of certain income and capital gain distributions are determined annually in accordance with federal tax regulations which may differ from accounting principles generally accepted in the United States of America. These differences primarily relate to investments in foreign denominated investments, investments in forward currency contracts, investments in swap contracts and certain securities sold at a loss. As a result, net investment income (loss) and net realized gain (loss) on investment transactions for a reporting period may differ significantly from distributions during such period. Accordingly, the Fund may periodically make reclassifications among certain of its capital accounts without impacting the net asset value of the Fund.
At December 31, 2014, the Fund's components of distributable earnings on a tax basis were as follows:
| Undistributed ordinary income* | | $ | 8,396,274 | |
| Capital loss carryforwards | | $ | (37,593,000 | ) |
| Unrealized appreciation (depreciation) on investments | | $ | (1,044,868 | ) |
In addition, the tax character of distributions paid by the Fund is summarized as follows:
| | | Years Ended December 31, | |
| | | 2014 | | | 2013 | |
| Distributions from ordinary income* | | $ | 10,673,271 | | | $ | 12,387,033 | |
* For tax purposes, short-term capital gain distributions are considered ordinary income distributions.
Expenses. Expenses of the Trust arising in connection with a specific fund are allocated to that fund. Other Trust expenses which cannot be directly attributed to a fund are apportioned among the funds in the Trust based upon the relative net assets or other appropriate measures.
Contingencies. In the normal course of business, the Fund may enter into contracts with service providers that contain general indemnification clauses. The Fund's maximum exposure under these arrangements is unknown as this would involve future claims that may be made against the Fund that have not yet been made. However, based on experience, the Fund expects the risk of loss to be remote.
Other. Investment transactions are accounted for on a trade date plus one basis for daily net asset value calculations. However, for financial reporting purposes, investment transactions are reported on trade date. Interest income is recorded on the accrual basis. Dividend income is recorded on ex-dividend date. Realized gains and losses from investment transactions are recorded on an identified cost basis. Proceeds from litigation payments, if any, are included in net realized gain (loss) from investments. All discounts and premiums are accreted/amortized for both tax and financial reporting purposes for the Fund, with the exception of securities in default of principal.
B. Derivative Instruments
Swaps. A swap is a contract between two parties to exchange future cash flows at periodic intervals based on the notional amount of the swap. A bilateral swap is a transaction between the fund and a counterparty where cash flows are exchanged between the two parties. A centrally cleared swap is a transaction executed between the fund and a counterparty, then cleared by a clearing member through a central clearinghouse. The central clearinghouse serves as the counterparty, with whom the fund exchanges cash flows.
The value of a swap is adjusted daily, and the change in value, if any, is recorded as unrealized appreciation or depreciation in the Statement of Assets and Liabilities. Gains or losses are realized when the swap expires or is closed. Certain risks may arise when entering into swap transactions including counterparty default; liquidity; or unfavorable changes in interest rates or the value of the underlying reference security, commodity or index. In connection with bilateral swaps, securities and/or cash may be identified as collateral in accordance with the terms of the swap agreement to provide assets of value and recourse in the event of default. The maximum counterparty credit risk is the net present value of the cash flows to be received from or paid to the counterparty over the term of the swap, to the extent that this amount is beneficial to the Fund, in addition to any related collateral posted to the counterparty by the Fund. This risk may be partially reduced by a master netting arrangement between the Fund and the counterparty. Upon entering into a centrally cleared swap, the Fund is required to deposit with a financial intermediary cash or securities ("initial margin") in an amount equal to a certain percentage of the notional amount of the swap. Subsequent payments ("variation margin") are made or received by the Fund dependent upon the daily fluctuations in the value of the swap. In a cleared swap transaction, counterparty risk is minimized as the central clearinghouse acts as the counterparty.
An upfront payment, if any, made by the Fund is recorded as an asset in the Statement of Assets and Liabilities. An upfront payment, if any, received by the Fund is recorded as a liability in the Statement of Assets and Liabilities. Payments received or made at the end of the measurement period are recorded as realized gain or loss in the Statement of Operations.
Credit default swaps are agreements between a buyer and a seller of protection against predefined credit events for the reference entity. The Fund may enter into credit default swaps to gain exposure to an underlying issuer's credit quality characteristics without directly investing in that issuer or to hedge against the risk of a credit event on debt securities. As a seller of a credit default swap, the Fund is required to pay the par (or other agreed-upon) value of the referenced entity to the counterparty with the occurrence of a credit event by a third party, such as a U.S. or foreign corporate issuer, on the reference entity, which would likely result in a loss to the Fund. In return, the Fund receives from the counterparty a periodic stream of payments over the term of the swap provided that no credit event has occurred. If no credit event occurs, the Fund keeps the stream of payments with no payment obligations. The Fund may also buy credit default swaps, in which case the Fund functions as the counterparty referenced above. This involves the risk that the swap may expire worthless. It also involves counterparty risk that the seller may fail to satisfy its payment obligations to the Fund with the occurrence of a credit event. When the Fund sells a credit default swap, it will cover its commitment. This may be achieved by, among other methods, maintaining cash or liquid assets equal to the aggregate notional value of the reference entities for all outstanding credit default swaps sold by the Fund. For the year ended December 31, 2014, the Fund entered into credit default swap agreements to gain exposure to the underlying issuer's credit quality characteristics.
Under the terms of a credit default swap, the Fund receives or makes periodic payments based on a specified interest rate on a fixed notional amount. These payments are recorded as a realized gain or loss in the Statement of Operations. Payments received or made as a result of a credit event or termination of the swap are recognized, net of a proportional amount of the upfront payment, as realized gains or losses in the Statement of Operations.
A summary of the open credit default swap contracts as of December 31, 2014 is included in a table following the Fund's Investment Portfolio. For the year ended December 31, 2014, the Fund's investment in credit default swap contracts sold had a total notional value generally indicative of a range from approximately $7,200,000 to $26,735,000.
Forward Foreign Currency Exchange Contracts. A forward foreign currency exchange contract ("forward currency contract") is a commitment to purchase or sell a foreign currency at the settlement date at a negotiated rate. For the year ended December 31, 2014, the Fund entered into forward currency contracts in order to hedge its exposure to changes in foreign currency exchange rates on its foreign currency denominated portfolio holdings and to facilitate transactions in foreign currency denominated securities.
Forward currency contracts are valued at the prevailing forward exchange rate of the underlying currencies and unrealized gain (loss) is recorded daily. On the settlement date of the forward currency contract, the Fund records a realized gain or loss equal to the difference between the value of the contract at the time it was opened and the value of the contract at the time it was closed. Certain risks may arise upon entering into forward currency contracts from the potential inability of counterparties to meet the terms of their contracts. The maximum counterparty credit risk to the Fund is measured by the unrealized gain on appreciated contracts. Additionally, when utilizing forward currency contracts to hedge, the Fund gives up the opportunity to profit from favorable exchange rate movements during the term of the contract.
There were no open forward currency contracts as of December 31, 2014. For the year ended December 31, 2014, the Fund's investment in forward currency contracts short vs. U.S. dollars had a total contract value generally indicative of a range from $0 to approximately $1,634,000, and the investment in forward currency contracts long vs. U.S. dollars had a total contract value generally indicative of a range from $0 to approximately $777,000.
The following tables summarize the value of the Fund's derivative instruments held as of December 31, 2014 and the related location in the accompanying Statement of Assets and Liabilities, presented by primary underlying risk exposure:
| Asset Derivative | | Swap Contracts | |
| Credit Contract (a) | | $ | 156,115 | |
The above derivative is located in the following Statement of Assets and Liabilities account: (a) Unrealized appreciation on bilateral swap contracts | |
| Liability Derivative | | Swap Contracts | |
| Credit Contracts (a) | | $ | 142,480 | |
Each of the above derivatives is located in the following Statement of Assets and Liabilities account: (a) Unrealized depreciation on bilateral swap contracts | |
Additionally, the amount of unrealized and realized gains and losses on derivative instruments recognized in Fund earnings during the year ended December 31, 2014 and the related location in the accompanying Statement of Operations is summarized in the following tables by primary underlying risk exposure:
| Realized Gain (Loss) | | Forward Contracts | | | Swap Contracts | | | Total | |
| Credit Contracts (a) | | $ | — | | | $ | 1,013,217 | | | $ | 1,013,217 | |
| Foreign Exchange Contracts (b) | | | 52,580 | | | | — | | | | 52,580 | |
| | | $ | 52,580 | | | $ | 1,013,217 | | | $ | 1,065,797 | |
Each of the above derivatives is located in the following Statement of Operations accounts: (a) Net realized gain (loss) from swap contracts (b) Net realized gain (loss) from foreign currency (Statement of Operations includes both forward currency contracts and foreign currency transactions) | |
| Change in Net Unrealized Appreciation (Depreciation) | | Forward Contracts | | | Swap Contracts | | | Total | |
| Credit Contracts (a) | | $ | — | | | $ | (1,001,496 | ) | | $ | (1,001,496 | ) |
| Foreign Exchange Contracts (b) | | | 2,853 | | | | — | | | | 2,853 | |
| | | $ | 2,853 | | | $ | (1,001,496 | ) | | $ | (998,643 | ) |
Each of the above derivatives is located in the following Statement of Operations accounts: (a) Change in net unrealized appreciation (depreciation) on swap contracts (b) Change in net unrealized appreciation (depreciation) on foreign currency (Statement of Operations includes both forward currency contracts and foreign currency transactions) | |
As of December 31, 2014, the Fund has transactions subject to enforceable master netting agreements. A reconciliation of the gross amounts on the Statement of Assets and Liabilities to the net amounts by counterparty, including any collateral exposure, is included in the following table:
| Counterparty | | Gross Amounts of Assets Presented in the Statement of Assets and Liabilities | | | Financial Instruments and Derivatives Available for Offset | | | Collateral Received | | | Net Amount of Derivative Assets | |
| Bank of America | | $ | 3,103 | | | $ | — | | | $ | — | | | $ | 3,103 | |
| Credit Suisse | | | 37,623 | | | | — | | | | — | | | | 37,623 | |
| Goldman Sachs & Co. | | | 61,934 | | | | (61,934 | ) | | | — | | | | — | |
| JPMorgan Chase Securities, Inc. | | | 33,827 | | | | — | | | | — | | | | 33,827 | |
| Morgan Stanley | | | 19,628 | | | | — | | | | — | | | | 19,628 | |
| | | $ | 156,115 | | | $ | (61,934 | ) | | $ | — | | | $ | 94,181 | |
| Counterparty | | Gross Amounts of Liabilities Presented in the Statement of Assets and Liabilities | | | Financial Instruments and Derivatives Available for Offset | | | Collateral Pledged | | | Net Amount of Derivative Liabilities | |
| Goldman Sachs & Co. | | $ | 142,480 | | | $ | (61,934 | ) | | $ | — | | | $ | 80,546 | |
C. Purchases and Sales of Securities
During the year ended December 31, 2014, purchases and sales of investment transactions (excluding short-term investments and U.S. Treasury securities) aggregated $71,746,218 and $83,609,067, respectively. Purchases of U.S. Treasury obligations aggregated $1,062,179.
D. Related Parties
Management Agreement. Under the Investment Management Agreement with Deutsche Investment Management Americas Inc. ("DIMA" or the "Advisor"), an indirect, wholly owned subsidiary of Deutsche Bank AG, the Advisor directs the investments of the Fund in accordance with its investment objectives, policies and restrictions. The Advisor determines the securities, instruments and other contracts relating to investments to be purchased, sold or entered into by the Fund.
Pursuant to the Investment Management Agreement with the Advisor, the Fund pays a monthly management fee based on the Fund's average daily net assets, computed and accrued daily and payable monthly, at the following annual rates:
| First $250 million | | | .500 | % |
| Next $750 million | | | .470 | % |
| Next $1.5 billion | | | .450 | % |
| Next $2.5 billion | | | .430 | % |
| Next $2.5 billion | | | .400 | % |
| Next $2.5 billion | | | .380 | % |
| Next $2.5 billion | | | .360 | % |
| Over $12.5 billion | | | .340 | % |
Accordingly, for the year ended December 31, 2014, the fee pursuant to the Investment Management Agreement was equivalent to an annual rate (exclusive of any applicable waivers/reimbursements) of 0.50% of the Fund's average daily net assets.
For the period from January 1, 2014 through September 30, 2014, the Advisor had contractually agreed to waive all or a portion of its fees and/or reimburse certain operating expenses of the Fund to the extent necessary to maintain the total annual operating expenses (excluding certain expenses such as extraordinary expenses, taxes, brokerage and interest) of each class as follows:
Effective October 1, 2014 through September 30, 2015 for Class A shares, and effective October 1, 2014 through April 30, 2015 for Class B shares, the Advisor has contractually agreed to waive all or a portion of its fees and/or reimburse certain operating expenses of the Fund to the extent necessary to maintain the total annual operating expenses (excluding certain expenses such as extraordinary expenses, taxes, brokerage and interest) of each class as follows:
For the year ended December 31, 2014, fees waived and/or expenses reimbursed for each class are as follows:
| Class A | | $ | 26,380 | |
| Class B | | | 1,704 | |
| | | $ | 28,084 | |
Administration Fee. Pursuant to an Administrative Services Agreement, DIMA provides most administrative services to the Fund. For all services provided under the Administrative Services Agreement, the Fund pays DIMA an annual fee ("Administration Fee") of 0.10% of the Fund's average daily net assets, computed and accrued daily and payable monthly. For the year ended December 31, 2014, the Administration Fee was $154,976, of which $11,531 is unpaid.
Service Provider Fees. DeAWM Service Company ("DSC"), an affiliate of the Advisor, is the transfer agent, dividend-paying agent and shareholder service agent for the Fund. Pursuant to a sub-transfer agency agreement between DSC and DST Systems, Inc. ("DST"), DSC has delegated certain transfer agent, dividend-paying agent and shareholder service agent functions to DST. DSC compensates DST out of the shareholder servicing fee it receives from the Fund. For the year ended December 31, 2014, the amounts charged to the Fund by DSC were as follows:
| Services to Shareholders | | Total Aggregated | | | Unpaid at December 31, 2014 | |
| Class A | | $ | 289 | | | $ | 48 | |
| Class B | | | 53 | | | | 8 | |
| | | $ | 342 | | | $ | 56 | |
Distribution Service Agreement. Under the Fund's Class B 12b-1 plans, DeAWM Distributors, Inc. ("DDI") received a fee ("Distribution Service Fee") of 0.25% of average daily net assets of Class B shares. For the year ended December 31, 2014, the Distribution Service Fee was $2,610, of which $8 is unpaid.
Typesetting and Filing Service Fees. Under an agreement with DIMA, DIMA is compensated for providing typesetting and certain regulatory filing services to the Fund. For the year ended December 31, 2014, the amount charged to the Fund by DIMA included in the Statement of Operations under "Reports to shareholders" aggregated $17,494, of which $6,832 is unpaid.
Trustees' Fees and Expenses. The Fund paid retainer fees to each Trustee not affiliated with the Advisor, plus specified amounts to the Board Chairperson and Vice Chairperson and to each committee Chairperson.
Affiliated Cash Management Vehicles. The Fund may invest uninvested cash balances in Central Cash Management Fund and Deutsche Variable NAV Money Fund, affiliated money market funds which are managed by the Advisor. Each affiliated money market fund seeks to provide a high level of current income consistent with liquidity and the preservation of capital. Each affiliated money market fund is managed in accordance with Rule 2a-7 under the Investment Company Act of 1940, which governs the quality, maturity, diversity and liquidity of instruments in which a money market fund may invest. Central Cash Management Fund seeks to maintain a stable net asset value, and Deutsche Variable NAV Money Fund maintains a floating net asset value. The Fund indirectly bears its proportionate share of the expenses of each affiliated money market fund in which it invests. Central Cash Management Fund does not pay the Advisor an investment management fee. To the extent that Deutsche Variable NAV Money Fund pays an investment management fee to the Advisor, the Advisor will waive an amount of the investment management fee payable to the Advisor by the Fund equal to the amount of the investment management fee payable on the Fund's assets invested in Deutsche Variable NAV Money Fund.
Security Lending Fees. Deutsche Bank AG serves as lending agent for the Fund. For the year ended December 31, 2014, the Fund incurred lending agent fees to Deutsche Bank AG for the amount of $2,553.
E. Investing in High-Yield Securities
The Fund's performance could be hurt if a security declines in credit quality or goes into default, or if an issuer does not make timely payments of interest or principal. Because the issuers of high-yield debt securities or junk bonds (debt securities rated below the fourth-highest category) may be in uncertain financial health, the risk of loss from default by the issuer is significantly greater. Prices and yields of high-yield securities will fluctuate over time and, during periods of economic uncertainty, volatility of high-yield securities may adversely affect a fund's net asset value. Because the Fund may invest in securities not paying current interest or in securities already in default, these risks may be more pronounced.
F. Ownership of the Fund
At December 31, 2014, two participating insurance companies were owners of record of 10% or more of the total outstanding Class A shares of the Fund, each owning 62% and 27%. One participating insurance company was the owner of record of 10% or more of the total outstanding Class B shares of the Fund, owning 97%.
G. Line of Credit
The Fund and other affiliated funds (the "Participants") share in a $400 million revolving credit facility provided by a syndication of banks. The Fund may borrow for temporary or emergency purposes, including the meeting of redemption requests that otherwise might require the untimely disposition of securities. The Participants are charged an annual commitment fee which is allocated based on net assets, among each of the Participants. Interest is calculated at a rate per annum equal to the sum of the Federal Funds Rate plus 1.25 percent plus if LIBOR exceeds the Federal Funds Rate the amount of such excess. The Fund may borrow up to a maximum of 33 percent of its net assets under the agreement. The Fund had no outstanding loans at December 31, 2014.
Report of Independent Registered Public Accounting Firm
To the Board of Trustees of Deutsche Variable Series II and Shareholders of Deutsche High Income VIP:
We have audited the accompanying statement of assets and liabilities, including the investment portfolio, of Deutsche High Income VIP (formerly DWS High Income VIP) (the "Fund") (one of the series constituting Deutsche Variable Series II (formerly DWS Variable Series II)), as of December 31, 2014, and the related statement of operations for the year then ended, the statements of changes in net assets for each of the two years in the period then ended, and the financial highlights for each of the periods indicated therein. These financial statements and financial highlights are the responsibility of the Fund’s management. Our responsibility is to express an opinion on these financial statements and financial highlights based on our audits.
We conducted our audits in accordance with the standards of the Public Company Accounting Oversight Board (United States). Those standards require that we plan and perform the audit to obtain reasonable assurance about whether the financial statements and financial highlights are free of material misstatement. We were not engaged to perform an audit of the Fund’s internal control over financial reporting. Our audits included consideration of internal control over financial reporting as a basis for designing audit procedures that are appropriate in the circumstances, but not for the purpose of expressing an opinion on the effectiveness of the Fund’s internal control over financial reporting. Accordingly, we express no such opinion. An audit also includes examining, on a test basis, evidence supporting the amounts and disclosures in the financial statements and financial highlights, assessing the accounting principles used and significant estimates made by management, and evaluating the overall financial statement presentation. Our procedures included confirmation of securities owned as of December 31, 2014, by correspondence with the custodian and brokers. We believe that our audits provide a reasonable basis for our opinion.
In our opinion, the financial statements and financial highlights referred to above present fairly, in all material respects, the financial position of Deutsche High Income VIP at December 31, 2014, the results of its operations for the year then ended, the changes in its net assets for each of the two years in the period then ended, and the financial highlights for each of the periods indicated therein, in conformity with U.S. generally accepted accounting principles.
| | | |
Boston, Massachusetts February 13, 2015 | | |
Information About Your Fund's Expenses (Unaudited)
As an investor of the Fund, you incur two types of costs: ongoing expenses and transaction costs. Ongoing expenses include management fees, distribution and service (12b-1) fees and other Fund expenses. Examples of transaction costs include contract charges, which are not shown in this section. The following tables are intended to help you understand your ongoing expenses (in dollars) of investing in the Fund and to help you compare these expenses with the ongoing expenses of investing in other mutual funds. In the most recent six-month period, the Fund limited these expenses; had it not done so, expenses would have been higher. The example in the table is based on an investment of $1,000 invested at the beginning of the six-month period and held for the entire period (July 1, 2014 to December 31, 2014).
The tables illustrate your Fund's expenses in two ways:
—Actual Fund Return. This helps you estimate the actual dollar amount of ongoing expenses (but not transaction costs) paid on a $1,000 investment in the Fund using the Fund's actual return during the period. To estimate the expenses you paid over the period, simply divide your account value by $1,000 (for example, an $8,600 account value divided by $1,000 = 8.6), then multiply the result by the number in the "Expenses Paid per $1,000" line under the share class you hold.
—Hypothetical 5% Fund Return. This helps you to compare your Fund's ongoing expenses (but not transaction costs) with those of other mutual funds using the Fund's actual expense ratio and a hypothetical rate of return of 5% per year before expenses. Examples using a 5% hypothetical Fund return may be found in the shareholder reports of other mutual funds. The hypothetical account values and expenses may not be used to estimate the actual ending account balance or expenses you paid for the period.
Please note that the expenses shown in these tables are meant to highlight your ongoing expenses only and do not reflect any transaction costs. The "Expenses Paid per $1,000" line of the tables is useful in comparing ongoing expenses only and will not help you determine the relative total expense of owning different funds. If these transaction costs had been included, your costs would have been higher.
Expenses and Value of a $1,000 Investment for the six months ended December 31, 2014 | |
| Actual Fund Return | | Class A | | | Class B | |
| Beginning Account Value 7/1/14 | | $ | 1,000.00 | | | $ | 1,000.00 | |
| Ending Account Value 12/31/14 | | $ | 966.30 | | | $ | 963.70 | |
| Expenses Paid per $1,000* | | $ | 3.62 | | | $ | 4.80 | |
| Hypothetical 5% Fund Return | | Class A | | | Class B | |
| Beginning Account Value 7/1/14 | | $ | 1,000.00 | | | $ | 1,000.00 | |
| Ending Account Value 12/31/14 | | $ | 1,021.53 | | | $ | 1,020.32 | |
| Expenses Paid per $1,000* | | $ | 3.72 | | | $ | 4.94 | |
* Expenses are equal to the Fund's annualized expense ratio for each share class, multiplied by the average account value over the period, multiplied by 184 (the number of days in the most recent six-month period), then divided by 365.
| Annualized Expense Ratios | Class A | | Class B | |
| Deutsche Variable Series II — Deutsche High Income VIP | .73% | | .97% | |
For more information, please refer to the Fund's prospectus.
These tables do not reflect charges and fees ("contract charges") associated with the separate account that invests in the Fund or any variable life insurance policy or variable annuity contract for which the Fund is an investment option.
For an analysis of the fees associated with an investment in the fund or similar funds, please refer to the current and hypothetical expense calculators for Variable Insurance Products which can be found at deutschefunds.com/EN/resources/calculators.jsp.
Tax Information (Unaudited)
Please consult a tax advisor if you have questions about federal or state income tax laws, or on how to prepare your tax returns. If you have specific questions about your account, please contact your insurance provider.
The Trust's policies and procedures for voting proxies for portfolio securities and information about how the Trust voted proxies related to its portfolio securities during the 12-month period ended June 30 are available on our Web site — deutschefunds.com (click on "proxy voting" at the bottom of the page) — or on the SEC's Web site — sec.gov. To obtain a written copy of the Trust's policies and procedures without charge, upon request, call us toll free at (800) 728-3337.
Advisory Agreement Board Considerations and Fee Evaluation
The Board of Trustees approved the renewal of Deutsche High Income VIP’s investment management agreement (the "Agreement") with Deutsche Investment Management Americas Inc. ("DIMA") in September 2014.
In terms of the process that the Board followed prior to approving the Agreement, shareholders should know that:
— In September 2014, all of the Fund’s Trustees were independent of DIMA and its affiliates.
— The Trustees met frequently during the past year to discuss fund matters and dedicated a substantial amount of time to contract review matters. Over the course of several months, the Board’s Contract Committee, in coordination with the Board’s Fixed Income and Asset Allocation Oversight Committee, reviewed comprehensive materials received from DIMA, independent third parties and independent counsel. These materials included an analysis of the Fund’s performance, fees and expenses, and profitability compiled by a fee consultant retained by the Fund’s Independent Trustees (the "Fee Consultant"). The Board also received extensive information throughout the year regarding performance of the Fund.
— The Independent Trustees regularly meet privately with counsel to discuss contract review and other matters. In addition, the Independent Trustees were advised by the Fee Consultant in the course of their review of the Fund’s contractual arrangements and considered a comprehensive report prepared by the Fee Consultant in connection with their deliberations.
— In connection with reviewing the Agreement, the Board also reviewed the terms of the Fund’s Rule 12b-1 plan, distribution agreement, administrative services agreement, transfer agency agreement and other material service agreements.
— Based on its evaluation of the information provided, the Contract Committee presented its findings and recommendations to the Board. The Board then reviewed the Contract Committee’s findings and recommendations.
In connection with the contract review process, the Contract Committee and the Board considered the factors discussed below, among others. The Board also considered that DIMA and its predecessors have managed the Fund since its inception, and the Board believes that a long-term relationship with a capable, conscientious advisor is in the best interests of the Fund. The Board considered, generally, that shareholders chose to invest or remain invested in the Fund knowing that DIMA managed the Fund, and that the Agreement was approved by the Fund’s shareholders. DIMA is part of Deutsche Bank AG ("DB"), a major global banking institution that is engaged in a wide range of financial services. The Board believes that there are advantages to being part of a global asset management business that offers a wide range of investing expertise and resources, including hundreds of portfolio managers and analysts with research capabilities in many countries throughout the world.
As part of the contract review process, the Board carefully considered the fees and expenses of each Deutsche fund overseen by the Board in light of the fund’s performance. In many cases, this led to the negotiation and implementation of expense caps. As part of these negotiations, the Board indicated that it would consider relaxing these caps in future years following sustained improvements in performance, among other considerations.
In 2012, DB combined its Asset Management (of which DIMA was a part) and Wealth Management divisions into a new Asset and Wealth Management ("AWM") division. DB has advised the Independent Trustees that the U.S. asset management business is a critical and integral part of DB, and that DB will continue to invest in AWM a significant portion of the savings it has realized by combining its Asset and Wealth Management divisions, including ongoing enhancements to AWM’s investment capabilities. DB also has confirmed its commitment to maintaining strong legal and compliance groups within the AWM division.
While shareholders may focus primarily on fund performance and fees, the Fund’s Board considers these and many other factors, including the quality and integrity of DIMA’s personnel and such other issues as back-office operations, fund valuations, and compliance policies and procedures.
Nature, Quality and Extent of Services. The Board considered the terms of the Agreement, including the scope of advisory services provided under the Agreement. The Board noted that, under the Agreement, DIMA provides portfolio management services to the Fund and that, pursuant to a separate administrative services agreement, DIMA provides administrative services to the Fund. The Board considered the experience and skills of senior management and investment personnel, the resources made available to such personnel, the ability of DIMA to attract and retain high-quality personnel, and the organizational depth and stability of DIMA. The Board reviewed the Fund’s performance over short-term and long-term periods and compared those returns to various agreed-upon performance measures, including market index(es) and a peer universe compiled by the Fee Consultant using information supplied by Morningstar Direct ("Morningstar"), an independent fund data service. The Board also noted that it has put into place a process of identifying "Focus Funds" (e.g., funds performing poorly relative to a peer universe), and receives more frequent reporting and information from DIMA regarding such funds, along with DIMA’s plans to address underperformance. The Board believes this process is an effective manner of identifying and addressing underperforming funds. Based on the information provided, the Board noted that for the one-, three- and five-year periods ended December 31, 2013, the Fund’s performance (Class A shares) was in the 2nd quartile, 2nd quartile and 3rd quartile, respectively, of the applicable Morningstar universe (the 1st quartile being the best performers and the 4th quartile being the worst performers). The Board also observed that the Fund has outperformed its benchmark in the one-year period and has underperformed its benchmark in the three- and five-year periods ended December 31, 2013.
Fees and Expenses. The Board considered the Fund’s investment management fee schedule, operating expenses and total expense ratios, and comparative information provided by Lipper Inc. ("Lipper") and the Fee Consultant regarding investment management fee rates paid to other investment advisors by similar funds (1st quartile being the most favorable and 4th quartile being the least favorable). With respect to management fees paid to other investment advisors by similar funds, the Board noted that the contractual fee rates paid by the Fund, which include a 0.10% fee paid to DIMA under the Fund’s administrative services agreement, were lower than the median (1st quartile) of the applicable Lipper peer group (based on Lipper data provided as of December 31, 2013). The Board noted that the Fund’s Class A shares total (net) operating expenses were expected to be higher than the median (3rd quartile) of the applicable Lipper expense universe (based on Lipper data provided as of December 31, 2013, and analyzing Lipper expense universe Class A (net) expenses less any applicable 12b-1 fees) ("Lipper Universe Expenses"). The Board also reviewed data comparing each share class’s total (net) operating expenses to the applicable Lipper Universe Expenses. The Board also considered how the Fund’s total (net) operating expenses compared to the total (net) operating expenses of a more customized peer group selected by Lipper (based on such factors as asset size). The Board noted that the expense limitations agreed to by DIMA helped to ensure that the Fund’s total (net) operating expenses would remain competitive. The Board considered the Fund’s management fee rate as compared to fees charged by DIMA to comparable funds and considered differences between the Fund and the comparable funds. The information requested by the Board as part of its review of fees and expenses also included information about institutional accounts and funds offered primarily to European investors ("Deutsche Europe funds") managed by DIMA and its affiliates. The Board noted that DIMA indicated that it does not manage any institutional accounts or Deutsche Europe funds comparable to the Fund.
On the basis of the information provided, the Board concluded that management fees were reasonable and appropriate in light of the nature, quality and extent of services provided by DIMA.
Profitability. The Board reviewed detailed information regarding revenues received by DIMA under the Agreement. The Board considered the estimated costs and pre-tax profits realized by DIMA from advising the Deutsche U.S. mutual funds ("Deutsche Funds"), as well as estimates of the pre-tax profits attributable to managing the Fund in particular. The Board also received information regarding the estimated enterprise-wide profitability of DIMA and its affiliates with respect to all fund services in totality and by fund. The Board and the Fee Consultant reviewed DIMA’s methodology in allocating its costs to the management of the Fund. Based on the information provided, the Board concluded that the pre-tax profits realized by DIMA in connection with the management of the Fund were not unreasonable.
Economies of Scale. The Board considered whether there are economies of scale with respect to the management of the Fund and whether the Fund benefits from any economies of scale. The Board noted that the Fund’s management fee schedule includes fee breakpoints. The Board concluded that the Fund’s fee schedule represents an appropriate sharing between the Fund and DIMA of such economies of scale as may exist in the management of the Fund at current asset levels.
Other Benefits to DIMA and Its Affiliates. The Board also considered the character and amount of other incidental benefits received by DIMA and its affiliates, including any fees received by DIMA for administrative services provided to the Fund and any fees received by an affiliate of DIMA for distribution services. The Board also considered benefits to DIMA related to brokerage and soft-dollar allocations, including allocating brokerage to pay for research generated by parties other than the executing broker dealers, which pertain primarily to funds investing in equity securities, along with the incidental public relations benefits to DIMA related to Deutsche Funds advertising and cross-selling opportunities among DIMA products and services. The Board concluded that management fees were reasonable in light of these fallout benefits.
Compliance. The Board considered the significant attention and resources dedicated by DIMA to documenting and enhancing its compliance processes in recent years. The Board noted in particular (i) the experience and seniority of DIMA’s and the Fund’s chief compliance officer; (ii) the large number of DIMA compliance personnel; and (iii) the substantial commitment of resources by DIMA and its affiliates to compliance matters.
Based on all of the information considered and the conclusions reached, the Board unanimously determined that the continuation of the Agreement is in the best interests of the Fund. In making this determination, the Board did not give particular weight to any single factor identified above. The Board considered these factors over the course of numerous meetings, certain of which were in executive session with only the Independent Trustees and counsel present. It is possible that individual Trustees may have weighed these factors differently in reaching their individual decisions to approve the continuation of the Agreement.
Board Members and Officers
The following table presents certain information regarding the Board Members and Officers of the fund. Each Board Member's year of birth is set forth in parentheses after his or her name. Unless otherwise noted, (i) each Board Member has engaged in the principal occupation(s) noted in the table for at least the most recent five years, although not necessarily in the same capacity; and (ii) the address of each Independent Board Member is c/o Kenneth C. Froewiss, Chairman, Deutsche Mutual Funds, P.O. Box 390601, Cambridge, MA 02139. Except as otherwise noted below, the term of office for each Board Member is until the election and qualification of a successor, or until such Board Member sooner dies, resigns, is removed or as otherwise provided in the governing documents of the fund. Because the fund does not hold an annual meeting of shareholders, each Board Member will hold office for an indeterminate period. The Board Members may also serve in similar capacities with other funds in the fund complex.
| Independent Board Members |
Name, Year of Birth, Position with the Fund and Length of Time Served1 | | Business Experience and Directorships During the Past Five Years | Number of Funds in Deutsche Fund Complex Overseen | Other Directorships Held by Board Member |
Kenneth C. Froewiss (1945) Chairperson since 2013, and Board Member since 2001 | | Adjunct Professor of Finance, NYU Stern School of Business (September 2009–present; Clinical Professor from 1997–September 2009); Member, Finance Committee, Association for Asian Studies (2002–present); Director, Mitsui Sumitomo Insurance Group (US) (2004–present); prior thereto, Managing Director, J.P. Morgan (investment banking firm) (until 1996) | 105 | — |
William McClayton (1944) Vice Chairperson since 2013, and Board Member since 2004 | | Private equity investor (since October 2009); previously, Managing Director, Diamond Management & Technology Consultants, Inc. (global consulting firm) (2001–2009); Directorship: Board of Managers, YMCA of Metropolitan Chicago; formerly: Senior Partner, Arthur Andersen LLP (accounting) (1966–2001); Trustee, Ravinia Festival | 105 | — |
John W. Ballantine (1946) Board Member since 1999 | | Retired; formerly, Executive Vice President and Chief Risk Management Officer, First Chicago NBD Corporation/The First National Bank of Chicago (1996–1998); Executive Vice President and Head of International Banking (1995–1996); former Directorships: Director and former Chairman of the Board, Healthways, Inc.2 (provider of disease and care management services) (2003–2014); Stockwell Capital Investments PLC (private equity); First Oak Brook Bancshares, Inc. and Oak Brook Bank; Prisma Energy International | 105 | Portland General Electric2 (utility company) (2003– present) |
Henry P. Becton, Jr. (1943) Board Member since 1990 | | Vice Chair and former President, WGBH Educational Foundation. Directorships: Public Radio International; Public Radio Exchange (PRX); North Bennett Street School (Boston); former Directorships: Belo Corporation2 (media company); The PBS Foundation; Association of Public Television Stations; Boston Museum of Science; American Public Television; Concord Academy; New England Aquarium; Mass. Corporation for Educational Telecommunications; Committee for Economic Development; Public Broadcasting Service; Connecticut College | 105 | Lead Director, Becton Dickinson and Company2 (medical technology company) |
Dawn-Marie Driscoll (1946) Board Member since 1987 | | Emeritus Executive Fellow, Center for Business Ethics, Bentley University; formerly: President, Driscoll Associates (consulting firm); Partner, Palmer & Dodge (law firm) (1988–1990); Vice President of Corporate Affairs and General Counsel, Filene's (retail) (1978–1988). Directorships: Director of ICI Mutual Insurance Company (since 2007); Advisory Board, Center for Business Ethics, Bentley University; Trustee and former Chairman of the Board, Southwest Florida Community Foundation (charitable organization); former Directorships: Sun Capital Advisers Trust (mutual funds) (2007–2012), Investment Company Institute (audit, executive, nominating committees) and Independent Directors Council (governance, executive committees) | 105 | — |
Keith R. Fox, CFA (1954) Board Member since 1996 | | Managing General Partner, Exeter Capital Partners (a series of private investment funds) (since 1986). Directorships: Progressive International Corporation (kitchen goods importer and distributor); The Kennel Shop (retailer); former Chairman, National Association of Small Business Investment Companies; former Directorships: BoxTop Media Inc. (advertising); Sun Capital Advisers Trust (mutual funds) (2011–2012) | 105 | — |
Paul K. Freeman (1950) Board Member since 1993 | | Consultant, World Bank/Inter-American Development Bank; Chair, Independent Directors Council; Investment Company Institute (executive and nominating committees); formerly, Chairman of Education Committee of Independent Directors Council; Project Leader, International Institute for Applied Systems Analysis (1998–2001); Chief Executive Officer, The Eric Group, Inc. (environmental insurance) (1986–1998); Directorships: Denver Zoo Foundation (December 2012–present); former Directorships: Prisma Energy International | 105 | — |
Richard J. Herring (1946) Board Member since 1990 | | Jacob Safra Professor of International Banking and Professor, Finance Department, The Wharton School, University of Pennsylvania (since July 1972); Co-Director, Wharton Financial Institutions Center; Co-Chair, U.S. Shadow Financial Regulatory Committee; Executive Director, Financial Economists Roundtable; formerly: Vice Dean and Director, Wharton Undergraduate Division (July 1995–June 2000); Director, Lauder Institute of International Management Studies (July 2000–June 2006) | 105 | Director, Aberdeen Singapore and Japan Funds (since 2007); Independent Director of Barclays Bank Delaware (since September 2010) |
Rebecca W. Rimel (1951) Board Member since 1995 | | President and Chief Executive Officer, The Pew Charitable Trusts (charitable organization) (1994 to present); formerly: Executive Vice President, The Glenmede Trust Company (investment trust and wealth management) (1983–2004); Board Member, Investor Education (charitable organization) (2004–2005); Trustee, Executive Committee, Philadelphia Chamber of Commerce (2001–2007); Director, Viasys Health Care2 (January 2007–June 2007); Trustee, Thomas Jefferson Foundation (charitable organization) (1994–2012) | 105 | Director, Becton Dickinson and Company2 (medical technology company) (2012– present); Director, BioTelemetry Inc.2 (health care) (2009– present) |
William N. Searcy, Jr. (1946) Board Member since 1993 | | Private investor since October 2003; formerly: Pension & Savings Trust Officer, Sprint Corporation2 (telecommunications) (November 1989–September 2003); Trustee, Sun Capital Advisers Trust (mutual funds) (1998–2012) | 105 | — |
Jean Gleason Stromberg (1943) Board Member since 1997 | | Retired. Formerly, Consultant (1997–2001); Director, Financial Markets U.S. Government Accountability Office (1996–1997); Partner, Norton Rose Fulbright, L.L.P. (law firm) (1978–1996). Directorships: The William and Flora Hewlett Foundation (charitable organization); former Directorships: Service Source, Inc. (nonprofit), Mutual Fund Directors Forum (2002–2004), American Bar Retirement Association (funding vehicle for retirement plans) (1987–1990 and 1994–1996) | 105 | — |
Robert H. Wadsworth* (1940) Board Member since 1999 | | President, Robert H. Wadsworth & Associates, Inc. (consulting firm) (1983 to present); Director, The Phoenix Boys Choir Association | 105 | — |
Officers4 |
Name, Year of Birth, Position with the Fund and Length of Time Served5 | | Business Experience and Directorships During the Past Five Years |
Brian E. Binder8 (1972) President and Chief Executive Officer, 2013–present | | Managing Director3 and Head of Fund Administration, Deutsche Asset & Wealth Management (2013–present); formerly: Head of Business Management and Consulting at Invesco, Ltd. (2010–2012); Chief Administrative Officer, Van Kampen Funds Inc. (2008–2010); and Chief Administrative Officer, Morgan Stanley Investment Management Americas Distribution (2003–2008) |
John Millette7 (1962) Vice President and Secretary, 1999–present | | Director,3 Deutsche Asset & Wealth Management |
Melinda Morrow6 (1970) Vice President, 2012–present | | Director,3 Deutsche Asset & Wealth Management |
Paul H. Schubert6 (1963) Chief Financial Officer, 2004–present Treasurer, 2005–present | | Managing Director,3 Deutsche Asset & Wealth Management (since July 2004); formerly: Executive Director, Head of Mutual Fund Services and Treasurer for UBS Family of Funds (1998–2004); Vice President and Director of Mutual Fund Finance at UBS Global Asset Management (1994–1998) |
Caroline Pearson7 (1962) Chief Legal Officer, 2010–present | | Managing Director,3 Deutsche Asset & Wealth Management; formerly: Assistant Secretary for DWS family of funds (1997–2010) |
Robert Kloby6 (1962) Chief Compliance Officer, 2006–present | | Managing Director,3 Deutsche Asset & Wealth Management |
Wayne Salit6 (1967) Anti-Money Laundering Compliance Officer, 2014–present | | Director,3 Deutsche Asset & Wealth Management; formerly: Managing Director, AML Compliance Officer at BNY Mellon (2011–2014); and Director, AML Compliance Officer at Deutsche Bank (2004–2011) |
Hepsen Uzcan7 (1974) Assistant Secretary, 2013–present | | Director,3 Deutsche Asset & Wealth Management |
Paul Antosca7 (1957) Assistant Treasurer, 2007–present | | Director,3 Deutsche Asset & Wealth Management |
Jack Clark7 (1967) Assistant Treasurer, 2007–present | | Director,3 Deutsche Asset & Wealth Management |
Diane Kenneally7 (1966) Assistant Treasurer, 2007–present | | Director,3 Deutsche Asset & Wealth Management |
1 The length of time served represents the year in which the Board Member joined the board of one or more Deutsche funds currently overseen by the Board.
2 A publicly held company with securities registered pursuant to Section 12 of the Securities Exchange Act of 1934.
3 Executive title, not a board directorship.
4 As a result of their respective positions held with the Advisor, these individuals are considered "interested persons" of the Advisor within the meaning of the 1940 Act. Interested persons receive no compensation from the fund.
5 The length of time served represents the year in which the officer was first elected in such capacity for one or more Deutsche funds.
6 Address: 60 Wall Street, New York, NY 10005.
7 Address: One Beacon Street, Boston, MA 02108.
8 Address: 222 South Riverside Plaza, Chicago, IL 60606.
* Robert H. Wadsworth retired from the Board effective December 31, 2014.
The fund's Statement of Additional Information ("SAI") includes additional information about the Board Members. The SAI is available, without charge, upon request. If you would like to request a copy of the SAI, you may do so by calling the following toll-free number: (800) 728-3337.
DeAWM Distributors, Inc.
222 South Riverside Plaza
Chicago, IL 60606
(800) 621-1148
VS2HI-2 (R-025832-4 2/15)
December 31, 2014
Annual Report
Deutsche Variable Series II
(formerly DWS Variable Series II)
Deutsche Large Cap Value VIP
(formerly DWS Large Cap Value VIP)
Contents
8 Statement of Assets and Liabilities 9 Statement of Operations 9 Statement of Changes in Net Assets 12 Notes to Financial Statements 16 Report of Independent Registered Public Accounting Firm 17 Information About Your Fund's Expenses 19 Advisory Agreement Board Considerations and Fee Evaluation 22 Board Members and Officers |
This report must be preceded or accompanied by a prospectus. To obtain an additional prospectus or summary prospectus, if available, call (800) 728-3337 or your financial representative. We advise you to consider the Fund's objectives, risks, charges and expenses carefully before investing. The summary prospectus and prospectus contain this and other important information about the Fund. Please read the prospectus carefully before you invest.
Investing in derivatives entails special risks relating to liquidity, leverage and credit that may reduce returns and/or increase volatility. The Fund may lend securities to approved institutions. Stocks may decline in value. See the prospectus for details.
Deutsche Asset & Wealth Management represents the asset management and wealth management activities conducted by Deutsche Bank AG or any of its subsidiaries, including the Advisor and DeAWM Distributors, Inc.
NOT FDIC/NCUA INSURED NO BANK GUARANTEE MAY LOSE VALUE NOT A DEPOSIT
NOT INSURED BY ANY FEDERAL GOVERNMENT AGENCY
Performance Summary December 31, 2014 (Unaudited)
Fund performance shown is historical, assumes reinvestment of all dividend and capital gain distributions and does not guarantee future results. Investment return and principal value fluctuate with changing market conditions so that, when redeemed, shares may be worth more or less than their original cost. Current performance may be lower or higher than the performance data quoted. Please contact your participating insurance company for the Fund's most recent month-end performance. Performance doesn't reflect charges and fees ("contract charges") associated with the separate account that invests in the Fund or any variable life insurance policy or variable annuity contract for which the Fund is an investment option. These charges and fees will reduce returns. While all share classes have the same underlying portfolio, their performance will differ.
The gross expense ratios of the Fund, as stated in the fee table of the prospectus dated May 1, 2014 are 0.78% and 1.09% for Class A and Class B shares, respectively, and may differ from the expense ratios disclosed in the Financial Highlights tables in this report.
| Growth of an Assumed $10,000 Investment in Deutsche Large Cap Value VIP |
| The Russell 1000® Value Index is an unmanaged index that consists of those stocks in the Russell 1000® Index with less-than-average growth orientation. The Russell 1000® Index is an unmanaged price-only index of the 1,000 largest capitalized companies that are domiciled in the U.S. and whose common stocks are traded. Index returns do not reflect any fees or expenses and it is not possible to invest directly into an index. |
| |
| Yearly periods ended December 31 | |
| Comparative Results | |
| Deutsche Large Cap Value VIP | | 1-Year | | | 3-Year | | | 5-Year | | | 10-Year | |
| Class A | Growth of $10,000 | | $ | 11,072 | | | $ | 15,910 | | | $ | 17,612 | | | $ | 18,699 | |
| Average annual total return | | | 10.72 | % | | | 16.74 | % | | | 11.99 | % | | | 6.46 | % |
Russell 1000® Value Index | Growth of $10,000 | | $ | 11,345 | | | $ | 17,668 | | | $ | 20,487 | | | $ | 20,231 | |
| Average annual total return | | | 13.45 | % | | | 20.89 | % | | | 15.42 | % | | | 7.30 | % |
| Deutsche Large Cap Value VIP | | 1-Year | | | 3-Year | | | 5-Year | | | 10-Year | |
| Class B | Growth of $10,000 | | $ | 11,036 | | | $ | 15,765 | | | $ | 17,363 | | | $ | 18,086 | |
| Average annual total return | | | 10.36 | % | | | 16.39 | % | | | 11.67 | % | | | 6.10 | % |
Russell 1000® Value Index | Growth of $10,000 | | $ | 11,345 | | | $ | 17,668 | | | $ | 20,487 | | | $ | 20,231 | |
| Average annual total return | | | 13.45 | % | | | 20.89 | % | | | 15.42 | % | | | 7.30 | % |
The growth of $10,000 is cumulative.
Management Summary December 31, 2014 (Unaudited)
Deutsche Large Cap Value VIP returned 10.72% in 2014 (Class A shares, unadjusted for contract charges), below the 13.45% return of its benchmark, the Russell 1000™ Value Index.1
Over the past 12 months, the United States managed steady but slow GDP growth, Europe’s economic performance was flat to slightly positive, and China’s GDP pulled back significantly.2 Overall, value stocks that outperformed during the period displayed steady revenue growth coupled with operating leverage and favorable capital deployment strategies such as share buybacks and increased dividend payouts.
As of September 29, 2014, a new portfolio team led by Deepak Khanna assumed day-to-day management of Deutsche Large Cap Value VIP. Through our day-to-day management of the Fund, we seek to achieve superior long-term risk-adjusted returns by exploiting market inefficiencies through a bottom-up, relative-value, research-driven approach. Over the past 12 months, the Fund’s positions in financials and energy represented the largest detractors from performance. Within financials, an underweight to REITs (real estate investment trusts) hurt performance. The largest contributions to the Fund’s 12-month returns came from holdings in the health care sector, where the performance of pharmaceutical companies was strong. In particular, holdings in Mallinckrodt PLC outperformed based on the market’s favorable reaction to the firm’s acquisition of Questcor Pharmaceuticals, Inc.
In terms of market returns, we expect 2015 to be very similar to 2014. Given the current global economic situation, as managers we feel it is increasingly important to focus on countries that will benefit the most from domestic demand, and the United States should continue to be the best example of this. The Fund is currently positioned with overweights in health care, based on continued benefits to the health care industry from the Affordable Care Act; in technology, due to the growth in cloud computing; and in consumer discretionary, based on lower oil prices and a more favorable picture for U.S. employment.3,4
Deepak Khanna, CFA
Lead Portfolio Manager
The views expressed reflect those of the portfolio management team only through the end of the period of the report as stated on the cover. The management team's views are subject to change at any time based on market and other conditions and should not be construed as a recommendation. Past performance is no guarantee of future results. Current and future portfolio holdings are subject to risk.
1 The Russell 1000 Value Index is an unmanaged index that consists of those stocks in the Russell 1000® Index with less-than-average growth orientation. The Russell 1000 Index is an unmanaged price-only index of the 1,000 largest capitalized companies that are domiciled in the U.S. and whose common stocks are traded. Index returns do not reflect fees or expenses and it is not possible to invest directly into an index.
2 GDP, or gross domestic product, is the value of all goods and services produced by a country’s economy.
3 "Underweight" means the Fund holds a lower weighting in a given sector or security than the benchmark. "Overweight" means the Fund holds a higher weighting.
4 The consumer discretionary sector represents industries that produce goods and services that are not necessities in everyday life.
Portfolio Summary (Unaudited) Asset Allocation (As a % of Investment Portfolio excluding Securities Lending Collateral) | 12/31/14 | 12/31/13 |
| | | |
| Common Stocks | 100% | 99% |
| Cash Equivalents | 0% | 1% |
| | 100% | 100% |
Sector Diversification (As a % of Common Stocks) | 12/31/14 | 12/31/13 |
| | | |
| Health Care | 24% | 14% |
| Financials | 21% | 24% |
| Information Technology | 14% | 11% |
| Energy | 11% | 14% |
| Industrials | 10% | 7% |
| Consumer Discretionary | 10% | 8% |
| Consumer Staples | 5% | 11% |
| Materials | 3% | 4% |
| Utilities | 2% | 5% |
| Telecommunication Services | — | 2% |
| | 100% | 100% |
Portfolio holdings and characteristics are subject to change.
For more complete details about the Fund's investment portfolio, see page 6.
Following the Fund's fiscal first and third quarter-end, a complete portfolio holdings listing is filed with the SEC on Form N-Q. The form will be available on the SEC's Web site at sec.gov, and it also may be reviewed and copied at the SEC's Public Reference Room in Washington, D.C. Information on the operation of the SEC's Public Reference Room may be obtained by calling (800) SEC-0330. The Fund's portfolio holdings are also posted on deutschefunds.com from time to time. Please see the Fund's current prospectus for more information.
Investment Portfolio December 31, 2014 | | | Shares | | | Value ($) | |
| | | | |
| Common Stocks 99.7% | |
| Consumer Discretionary 9.8% | |
| Hotels, Restaurants & Leisure 3.4% | |
| Las Vegas Sands Corp. | | | 88,128 | | | | 5,125,524 | |
| Starwood Hotels & Resorts Worldwide, Inc. | | | 53,265 | | | | 4,318,194 | |
| Yum! Brands, Inc. | | | 73,048 | | | | 5,321,547 | |
| | | | | | | | 14,765,265 | |
| Media 4.7% | |
| Comcast Corp. "A" | | | 232,986 | | | | 13,515,518 | |
| Starz "A"* | | | 242,381 | | | | 7,198,715 | |
| | | | | | | | 20,714,233 | |
| Specialty Retail 1.7% | |
| Best Buy Co., Inc. | | | 186,504 | | | | 7,269,926 | |
| Consumer Staples 5.2% | |
| Beverages 2.3% | |
| Molson Coors Brewing Co. "B" | | | 73,432 | | | | 5,472,153 | |
| PepsiCo, Inc. | | | 45,741 | | | | 4,325,269 | |
| | | | | | | | 9,797,422 | |
| Food & Staples Retailing 1.3% | |
| CVS Health Corp. | | | 50,096 | | | | 4,824,746 | |
| Diplomat Pharmacy, Inc.* | | | 37,264 | | | | 1,019,915 | |
| | | | | | | | 5,844,661 | |
| Household Products 1.1% | |
| Colgate-Palmolive Co. | | | 67,126 | | | | 4,644,448 | |
| Tobacco 0.5% | |
| Altria Group, Inc. | | | 45,426 | | | | 2,238,139 | |
| Energy 11.2% | |
| Energy Equipment & Services 0.6% | |
| Oil States International, Inc.* | | | 53,067 | | | | 2,594,976 | |
| Oil, Gas & Consumable Fuels 10.6% | |
| Cimarex Energy Co. | | | 57,170 | | | | 6,060,020 | |
| Devon Energy Corp. | | | 79,699 | | | | 4,878,376 | |
| EOG Resources, Inc. | | | 68,158 | | | | 6,275,307 | |
| EQT Corp. | | | 48,315 | | | | 3,657,446 | |
| Marathon Oil Corp. | | | 114,945 | | | | 3,251,794 | |
| Pioneer Natural Resources Co. | | | 40,085 | | | | 5,966,652 | |
| Range Resources Corp. | | | 111,973 | | | | 5,984,957 | |
| SM Energy Co. | | | 69,502 | | | | 2,681,387 | |
| Valero Energy Corp. | | | 151,975 | | | | 7,522,762 | |
| | | | | | | | 46,278,701 | |
| Financials 20.8% | |
| Banks 11.0% | |
| Bank of America Corp. | | | 600,909 | | | | 10,750,262 | |
| CIT Group, Inc. | | | 113,775 | | | | 5,441,858 | |
| Citigroup, Inc. | | | 225,237 | | | | 12,187,574 | |
| East West Bancorp., Inc. | | | 170,753 | | | | 6,609,849 | |
| JPMorgan Chase & Co. | | | 84,206 | | | | 5,269,611 | |
| SVB Financial Group* | | | 67,336 | | | | 7,815,690 | |
| | | | | | | | 48,074,844 | |
| Capital Markets 3.3% | |
| Charles Schwab Corp. | | | 214,121 | | | | 6,464,313 | |
| The Goldman Sachs Group, Inc. | | | 41,834 | | | | 8,108,684 | |
| | | | | | | | 14,572,997 | |
| | | Shares | | | Value ($) | |
| | | | | | | | | |
| Consumer Finance 2.9% | |
| Capital One Financial Corp. | | | 74,254 | | | | 6,129,668 | |
| Discover Financial Services | | | 96,207 | | | | 6,300,596 | |
| | | | | | | | 12,430,264 | |
| Insurance 2.6% | |
| Allstate Corp. | | | 83,021 | | | | 5,832,225 | |
| Hartford Financial Services Group, Inc. | | | 130,111 | | | | 5,424,328 | |
| | | | | | | | 11,256,553 | |
| Real Estate Management & Development 1.0% | |
| Realogy Holdings Corp.* | | | 99,973 | | | | 4,447,799 | |
| Health Care 23.9% | |
| Biotechnology 8.8% | |
| Aegerion Pharmaceuticals, Inc.* (a) | | | 67,423 | | | | 1,411,838 | |
| Alexion Pharmaceuticals, Inc.* | | | 39,564 | | | | 7,320,527 | |
| Biogen Idec, Inc.* | | | 13,087 | | | | 4,442,382 | |
| Celgene Corp.* | | | 84,926 | | | | 9,499,822 | |
| Gilead Sciences, Inc.* | | | 73,339 | | | | 6,912,934 | |
| Medivation, Inc.* | | | 44,949 | | | | 4,477,370 | |
| Puma Biotechnology, Inc.* | | | 16,081 | | | | 3,043,651 | |
| Sarepta Therapeutics, Inc.* (a) | | | 100,061 | | | | 1,447,883 | |
| | | | | | | | 38,556,407 | |
| Health Care Equipment & Supplies 1.4% | |
| Zimmer Holdings, Inc. | | | 53,628 | | | | 6,082,488 | |
| Health Care Providers & Services 8.1% | |
| Anthem, Inc. | | | 60,728 | | | | 7,631,688 | |
| Community Health Systems, Inc.* | | | 124,505 | | | | 6,713,310 | |
| DaVita HealthCare Partners, Inc.* | | | 102,768 | | | | 7,783,648 | |
| McKesson Corp. | | | 30,612 | | | | 6,354,439 | |
| Omnicare, Inc. | | | 32,498 | | | | 2,370,079 | |
| Universal Health Services, Inc. "B" | | | 39,206 | | | | 4,362,059 | |
| | | | | | | | 35,215,223 | |
| Life Sciences Tools & Services 1.7% | |
| Thermo Fisher Scientific, Inc. | | | 59,700 | | | | 7,479,813 | |
| Pharmaceuticals 3.9% | |
| Actavis PLC* | | | 36,023 | | | | 9,272,680 | |
| Mallinckrodt PLC* | | | 77,432 | | | | 7,668,091 | |
| | | | | | | | 16,940,771 | |
| Industrials 9.9% | |
| Aerospace & Defense 2.8% | |
| Northrop Grumman Corp. | | | 34,058 | | | | 5,019,809 | |
| Raytheon Co. | | | 64,814 | | | | 7,010,930 | |
| | | | | | | | 12,030,739 | |
| Air Freight & Logistics 1.3% | |
| FedEx Corp. | | | 31,874 | | | | 5,535,239 | |
| Building Products 0.6% | |
| USG Corp.* | | | 91,719 | | | | 2,567,215 | |
| Road & Rail 2.7% | |
| CSX Corp. | | | 173,259 | | | | 6,277,174 | |
| Kansas City Southern | | | 46,236 | | | | 5,642,179 | |
| | | | | | | | 11,919,353 | |
| Trading Companies & Distributors 2.5% | |
| W.W. Grainger, Inc. | | | 21,954 | | | | 5,595,855 | |
| WESCO International, Inc.* (a) | | | 70,174 | | | | 5,347,960 | |
| | | | | | | | 10,943,815 | |
| | | Shares | | | Value ($) | |
| | | | | | | | | |
| Information Technology 13.9% | |
| Communications Equipment 2.4% | |
| Cisco Systems, Inc. | | | 383,644 | | | | 10,671,058 | |
| IT Services 3.0% | |
| Alliance Data Systems Corp.* | | | 24,939 | | | | 7,133,801 | |
| Vantiv, Inc. "A"* | | | 176,922 | | | | 6,001,194 | |
| | | | | | | | 13,134,995 | |
| Semiconductors & Semiconductor Equipment 0.8% | |
| Intel Corp. | | | 91,210 | | | | 3,310,011 | |
| Software 1.3% | |
| Microsoft Corp. | | | 119,202 | | | | 5,536,933 | |
| Technology Hardware, Storage & Peripherals 6.4% | |
| Apple, Inc. | | | 57,414 | | | | 6,337,357 | |
| EMC Corp. | | | 167,517 | | | | 4,981,956 | |
| Hewlett-Packard Co. | | | 138,607 | | | | 5,562,299 | |
| NetApp, Inc. | | | 129,697 | | | | 5,375,941 | |
| SanDisk Corp. | | | 56,631 | | | | 5,548,705 | |
| | | | | | | | 27,806,258 | |
| Materials 2.7% | |
| Chemicals | |
| Dow Chemical Co. | | | 41,286 | | | | 1,883,055 | |
| LyondellBasell Industries NV "A" | | | 51,978 | | | | 4,126,533 | |
| PPG Industries, Inc. | | | 24,719 | | | | 5,713,797 | |
| | | | | | | | 11,723,385 | |
| | | Shares | | | Value ($) | |
| | | | | | | | | |
| Utilities 2.3% | |
| Electric Utilities 0.8% | |
| NextEra Energy, Inc. | | | 33,646 | | | | 3,576,233 | |
| Multi-Utilities 1.5% | |
| Sempra Energy | | | 56,957 | | | | 6,342,732 | |
Total Common Stocks (Cost $395,855,028) | | | | 434,302,896 | |
| | |
| Securities Lending Collateral 1.5% | |
| Daily Assets Fund Institutional, 0.10% (b) (c) (Cost $6,740,738) | | | 6,740,738 | | | | 6,740,738 | |
| | |
| Cash Equivalents 0.4% | |
| Central Cash Management Fund, 0.06% (b) (Cost $1,572,467) | | | 1,572,467 | | | | 1,572,467 | |
| | | % of Net Assets | | | Value ($) | |
| | | | |
Total Investment Portfolio (Cost $404,168,233)† | | | 101.6 | | | | 442,616,101 | |
| Other Assets and Liabilities, Net | | | (1.6 | ) | | | (6,989,658 | ) |
| Net Assets | | | 100.0 | | | | 435,626,443 | |
* Non-income producing security.
† The cost for federal income tax purposes was $404,577,154. At December 31, 2014, net unrealized appreciation for all securities based on tax cost was $38,038,947. This consisted of aggregate gross unrealized appreciation for all securities in which there was an excess of value over tax cost of $54,034,545 and aggregate gross unrealized depreciation for all securities in which there was an excess of tax cost over value of $15,995,598.
(a) All or a portion of these securities were on loan. In addition, "Other Assets and Liabilities, Net" may include pending sales that are also on loan. The value of securities loaned at December 31, 2014 amounted to $6,516,728, which is 1.5% of net assets.
(b) Affiliated fund managed by Deutsche Investment Management Americas Inc. The rate shown is the annualized seven-day yield at period end.
(c) Represents collateral held in connection with securities lending. Income earned by the Fund is net of borrower rebates.
Fair Value Measurements
Various inputs are used in determining the value of the Fund's investments. These inputs are summarized in three broad levels. Level 1 includes quoted prices in active markets for identical securities. Level 2 includes other significant observable inputs (including quoted prices for similar securities, interest rates, prepayment speeds and credit risk). Level 3 includes significant unobservable inputs (including the Fund's own assumptions in determining the fair value of investments). The level assigned to the securities valuations may not be an indication of the risk or liquidity associated with investing in those securities.
The following is a summary of the inputs used as of December 31, 2014 in valuing the Fund's investments. For information on the Fund's policy regarding the valuation of investments, please refer to the Security Valuation section of Note A in the accompanying Notes to Financial Statements.
| Assets | | Level 1 | | | Level 2 | | | Level 3 | | | Total | |
| | |
| Common Stocks (d) | | $ | 434,302,896 | | | $ | — | | | $ | — | | | $ | 434,302,896 | |
| Short-Term Investments (d) | | | 8,313,205 | | | | — | | | | — | | | | 8,313,205 | |
| Total | | $ | 442,616,101 | | | $ | — | | | $ | — | | | $ | 442,616,101 | |
There have been no transfers between fair value measurement levels during the year ended December 31, 2014.
(d) See Investment Portfolio for additional detailed categorizations.
The accompanying notes are an integral part of the financial statements.
Statement of Assets and Liabilities | as of December 31, 2014 | |
| Assets | |
Investments: Investments in non-affiliated securities, at value (cost $395,855,028) — including $6,516,728 of securities loaned | | $ | 434,302,896 | |
| Investment in Daily Assets Fund Institutional (cost $6,740,738)* | | | 6,740,738 | |
| Investment in Central Cash Management Fund (cost $1,572,467) | | | 1,572,467 | |
| Total investments in securities, at value (cost $404,168,233) | | | 442,616,101 | |
| Cash | | | 5,036 | |
| Foreign currency, at value (cost $37,046) | | | 34,543 | |
| Receivable for Fund shares sold | | | 131 | |
| Dividends receivable | | | 269,784 | |
| Interest receivable | | | 3,857 | |
| Other assets | | | 10,485 | |
| Total assets | | | 442,939,937 | |
| Liabilities | |
| Payable upon return of securities loaned | | | 6,740,738 | |
| Payable for Fund shares redeemed | | | 220,786 | |
| Accrued management fee | | | 214,667 | |
| Accrued Trustees' fees | | | 6,718 | |
| Other accrued expenses and payables | | | 130,585 | |
| Total liabilities | | | 7,313,494 | |
| Net assets, at value | | $ | 435,626,443 | |
| Net Assets Consist of | |
| Undistributed net investment income | | | 5,982,096 | |
Net unrealized appreciation (depreciation) on: Investments | | | 38,447,868 | |
| Foreign currency | | | (2,503 | ) |
| Accumulated net realized gain (loss) | | | 17,514,525 | |
| Paid-in capital | | | 373,684,457 | |
| Net assets, at value | | $ | 435,626,443 | |
Class A Net Asset Value, offering and redemption price per share ($430,457,288 ÷ 24,769,255 outstanding shares of beneficial interest, no par value, unlimited number of shares authorized) | | $ | 17.38 | |
Class B Net Asset Value, offering and redemption price per share ($5,169,155 ÷ 297,108 outstanding shares of beneficial interest, no par value, unlimited number of shares authorized) | | $ | 17.40 | |
* Represents collateral on securities loaned.
The accompanying notes are an integral part of the financial statements.
Statement of Operations
| for the year ended December 31, 2014 | |
| Investment Income | |
Income: Dividends (net of foreign taxes withheld of $70,146) | | $ | 9,337,515 | |
| Income distributions — Central Cash Management Fund | | | 7,199 | |
| Securities lending income, including income from Daily Assets Fund Institutional, net of borrower rebates | | | 123,588 | |
| Total income | | | 9,468,302 | |
Expenses: Management fee | | | 2,806,317 | |
| Administration fee | | | 439,011 | |
| Services to shareholders | | | 3,894 | |
| Record keeping fees (Class B) | | | 2,917 | |
| Distribution and service fee (Class B) | | | 12,504 | |
| Custodian fee | | | 17,998 | |
| Professional fees | | | 74,075 | |
| Reports to shareholders | | | 35,476 | |
| Trustees' fees and expenses | | | 20,307 | |
| Other | | | 16,115 | |
| Total expenses before expense reductions | | | 3,428,614 | |
| Expense reductions | | | (208,214 | ) |
| Total expenses after expense reductions | | | 3,220,400 | |
| Net investment income | | $ | 6,247,902 | |
| Realized and Unrealized Gain (Loss) | |
Net realized gain (loss) from: Investments | | | 115,242,003 | |
| Foreign currency | | | (5,323 | ) |
| | | | 115,236,680 | |
Change in net unrealized appreciation (depreciation) on: Investments | | | (77,033,485 | ) |
| Foreign currency | | | (3,220 | ) |
| | | | (77,036,705 | ) |
| Net gain (loss) | | | 38,199,975 | |
| Net increase (decrease) in net assets resulting from operations | | | 44,447,877 | |
The accompanying notes are an integral part of the financial statements.
Statement of Changes in Net Assets | | | Years Ended December 31, | |
| Increase (Decrease) in Net Assets | | 2014 | | | 2013 | |
Operations: Net investment income | | $ | 6,247,902 | | | $ | 7,492,381 | |
| Net realized gain (loss) | | | 115,236,680 | | | | 43,142,013 | |
| Change in net unrealized appreciation (depreciation) | | | (77,036,705 | ) | | | 59,914,889 | |
| Net increase (decrease) in net assets resulting from operations | | | 44,447,877 | | | | 110,549,283 | |
Distributions to shareholders from: Net investment income: Class A | | | (7,350,279 | ) | | | (8,048,782 | ) |
| Class B | | | (66,263 | ) | | | (66,664 | ) |
| Total distributions | | | (7,416,542 | ) | | | (8,115,446 | ) |
Fund share transactions: Class A Proceeds from shares sold | | | 11,756,922 | | | | 7,515,770 | |
| Reinvestment of distributions | | | 7,350,279 | | | | 8,048,782 | |
| Payments for shares redeemed | | | (57,676,534 | ) | | | (61,510,110 | ) |
| Net increase (decrease) in net assets from Class A share transactions | | | (38,569,333 | ) | | | (45,945,558 | ) |
Class B Proceeds from shares sold | | | 1,147,061 | | | | 822,748 | |
| Reinvestment of distributions | | | 66,263 | | | | 66,664 | |
| Payments for shares redeemed | | | (1,111,822 | ) | | | (844,581 | ) |
| Net increase (decrease) in net assets from Class B share transactions | | | 101,502 | | | | 44,831 | |
| Increase (decrease) in net assets | | | (1,436,496 | ) | | | 56,533,110 | |
| Net assets at beginning of period | | | 437,062,939 | | | | 380,529,829 | |
| Net assets at end of period (including undistributed net investment income of $5,982,096 and $7,303,655, respectively) | | $ | 435,626,443 | | | $ | 437,062,939 | |
| Other Information | |
Class A Shares outstanding at beginning of period | | | 27,072,074 | | | | 30,284,545 | |
| Shares sold | | | 711,170 | | | | 520,949 | |
| Shares issued to shareholders in reinvestment of distributions | | | 455,690 | | | | 590,520 | |
| Shares redeemed | | | (3,469,679 | ) | | | (4,323,940 | ) |
| Net increase (decrease) in Class A shares | | | (2,302,819 | ) | | | (3,212,471 | ) |
| Shares outstanding at end of period | | | 24,769,255 | | | | 27,072,074 | |
Class B Shares outstanding at beginning of period | | | 289,672 | | | | 286,965 | |
| Shares sold | | | 68,963 | | | | 55,598 | |
| Shares issued to shareholders in reinvestment of distributions | | | 4,095 | | | | 4,877 | |
| Shares redeemed | | | (65,622 | ) | | | (57,768 | ) |
| Net increase (decrease) in Class B shares | | | 7,436 | | | | 2,707 | |
| Shares outstanding at end of period | | | 297,108 | | | | 289,672 | |
The accompanying notes are an integral part of the financial statements.
| | | Years Ended December 31, | |
| Class A | | | 2014 | | | 2013 | | | 2012 | | | 2011 | | | 2010 | |
| Selected Per Share Data | |
| Net asset value, beginning of period | | $ | 15.97 | | | $ | 12.45 | | | $ | 11.56 | | | $ | 11.80 | | | $ | 10.86 | |
Income (loss) from investment operations: Net investment income (loss)a | | | .24 | | | | .26 | | | | .25 | | | | .25 | | | | .23 | |
| Net realized and unrealized gain (loss) | | | 1.45 | | | | 3.54 | | | | .87 | | | | (.24 | ) | | | .93 | |
| Total from investment operations | | | 1.69 | | | | 3.80 | | | | 1.12 | | | | .01 | | | | 1.16 | |
Less distributions from: Net investment income | | | (.28 | ) | | | (.28 | ) | | | (.23 | ) | | | (.25 | ) | | | (.22 | ) |
| Total distributions | | | (.28 | ) | | | (.28 | ) | | | (.23 | ) | | | (.25 | ) | | | (.22 | ) |
| Net asset value, end of period | | $ | 17.38 | | | $ | 15.97 | | | $ | 12.45 | | | $ | 11.56 | | | $ | 11.80 | |
| Total Return (%) | | | 10.72 | b | | | 30.89 | b | | | 9.79 | b | | | (.07 | ) | | | 10.77 | |
| Ratios to Average Net Assets and Supplemental Data | |
| Net assets, end of period ($ millions) | | | 430 | | | | 432 | | | | 377 | | | | 396 | | | | 206 | |
| Ratio of expenses before expense reductions (%) | | | .78 | | | | .78 | | | | .78 | | | | .79 | | | | .82 | |
| Ratio of expenses after expense reductions (%) | | | .73 | | | | .74 | | | | .77 | | | | .79 | | | | .82 | |
| Ratio of net investment income (loss) (%) | | | 1.43 | | | | 1.82 | | | | 2.04 | | | | 2.15 | | | | 2.13 | |
| Portfolio turnover rate (%) | | | 133 | | | | 54 | | | | 63 | | | | 28 | | | | 32 | |
a Based on average shares outstanding during the period. b Total return would have been lower had certain expenses not been reduced. | |
| | | Years Ended December 31, | |
| Class B | | | 2014 | | | 2013 | | | 2012 | | | 2011 | | | 2010 | |
| Selected Per Share Data | |
| Net asset value, beginning of period | | $ | 15.99 | | | $ | 12.46 | | | $ | 11.57 | | | $ | 11.81 | | | $ | 10.86 | |
Income (loss) from investment operations: Net investment income (loss)a | | | .18 | | | | .22 | | | | .21 | | | | .22 | | | | .20 | |
| Net realized and unrealized gain (loss) | | | 1.46 | | | | 3.55 | | | | .88 | | | | (.25 | ) | | | .93 | |
| Total from investment operations | | | 1.64 | | | | 3.77 | | | | 1.09 | | | | (.03 | ) | | | 1.13 | |
Less distributions from: Net investment income | | | (.23 | ) | | | (.24 | ) | | | (.20 | ) | | | (.21 | ) | | | (.18 | ) |
| Total distributions | | | (.23 | ) | | | (.24 | ) | | | (.20 | ) | | | (.21 | ) | | | (.18 | ) |
| Net asset value, end of period | | $ | 17.40 | | | $ | 15.99 | | | $ | 12.46 | | | $ | 11.57 | | | $ | 11.81 | |
| Total Return (%) | | | 10.36 | b | | | 30.54 | b | | | 9.44 | b | | | (.36 | ) | | | 10.53 | |
| Ratios to Average Net Assets and Supplemental Data | |
| Net assets, end of period ($ millions) | | | 5 | | | | 5 | | | | 4 | | | | 3 | | | | 1 | |
| Ratio of expenses before expense reductions (%) | | | 1.09 | | | | 1.09 | | | | 1.09 | | | | 1.10 | | | | 1.11 | |
| Ratio of expenses after expense reductions (%) | | | 1.04 | | | | 1.05 | | | | 1.08 | | | | 1.10 | | | | 1.11 | |
| Ratio of net investment income (loss) (%) | | | 1.10 | | | | 1.52 | | | | 1.73 | | | | 1.84 | | | | 1.84 | |
| Portfolio turnover rate (%) | | | 133 | | | | 54 | | | | 63 | | | | 28 | | | | 32 | |
a Based on average shares outstanding during the period. b Total return would have been lower had certain expenses not been reduced. | |
Notes to Financial Statements
A. Organization and Significant Accounting Policies
Deutsche Large Cap Value VIP (formerly DWS Large Cap Value VIP) (the "Fund") is a diversified series of Deutsche Variable Series II (formerly DWS Variable Series II) (the "Trust"), which is registered under the Investment Company Act of 1940, as amended (the "1940 Act"), as an open-end management investment company organized as a Massachusetts business trust.
Multiple Classes of Shares of Beneficial Interest. The Fund offers two classes of shares (Class A shares and Class B shares). Sales of Class B shares are subject to recordkeeping fees up to 0.15% and Rule 12b-1 fees under the 1940 Act equal to an annual rate of 0.25% of the average daily net assets of the Class B shares of the Fund. Class A shares are not subject to such fees.
Investment income, realized and unrealized gains and losses, and certain fund-level expenses and expense reductions, if any, are borne pro rata on the basis of relative net assets by the holders of all classes of shares except that each class bears certain expenses unique to that class (including the applicable Rule 12b-1 fee and recordkeeping fees). Differences in class-level expenses may result in payment of different per share dividends by class. All shares have equal rights with respect to voting subject to class-specific arrangements.
The Fund's financial statements are prepared in accordance with accounting principles generally accepted in the United States of America which require the use of management estimates. Actual results could differ from those estimates. The policies described below are followed consistently by the Fund in the preparation of its financial statements.
Security Valuation. Investments are stated at value determined as of the close of regular trading on the New York Stock Exchange on each day the exchange is open for trading.
Various inputs are used in determining the value of the Fund's investments. These inputs are summarized in three broad levels. Level 1 includes quoted prices in active markets for identical securities. Level 2 includes other significant observable inputs (including quoted prices for similar securities, interest rates, prepayment speeds and credit risk). Level 3 includes significant unobservable inputs (including the Fund's own assumptions in determining the fair value of investments). The level assigned to the securities valuations may not be an indication of the risk or liquidity associated with investing in those securities.
Equity securities and exchange traded funds ("ETFs") are valued at the most recent sale price or official closing price reported on the exchange (U.S. or foreign) or over-the-counter market on which they trade. Securities for which no sales are reported are valued at the calculated mean between the most recent bid and asked quotations on the relevant market or, if a mean cannot be determined, at the most recent bid quotation. Equity securities and ETFs are generally categorized as Level 1.
Investments in open-end investment companies are valued at their net asset value each business day and are categorized as Level 1.
Securities and other assets for which market quotations are not readily available or for which the above valuation procedures are deemed not to reflect fair value are valued in a manner that is intended to reflect their fair value as determined in accordance with procedures approved by the Board and are generally categorized as Level 3. In accordance with the Fund's valuation procedures, factors considered in determining value may include, but are not limited to, the type of the security; the size of the holding; the initial cost of the security; the existence of any contractual restrictions on the security's disposition; the price and extent of public trading in similar securities of the issuer or of comparable companies; quotations or evaluated prices from broker-dealers and/or pricing services; information obtained from the issuer, analysts, and/or the appropriate stock exchange (for exchange-traded securities); an analysis of the company's or issuer's financial statements; an evaluation of the forces that influence the issuer and the market(s) in which the security is purchased and sold; and with respect to debt securities, the maturity, coupon, creditworthiness, currency denomination and the movement of the market in which the security is normally traded. The value determined under these procedures may differ from published values for the same securities.
Disclosure about the classification of fair value measurements is included in a table following the Fund's Investment Portfolio.
Foreign Currency Translations. The books and records of the Fund are maintained in U.S. dollars. Investment securities and other assets and liabilities denominated in a foreign currency are translated into U.S. dollars at the prevailing exchange rates at period end. Purchases and sales of investment securities, income and expenses are translated into U.S. dollars at the prevailing exchange rates on the respective dates of the transactions.
Net realized and unrealized gains and losses on foreign currency transactions represent net gains and losses between trade and settlement dates on securities transactions, the acquisition and disposition of foreign currencies, and the difference between the amount of net investment income accrued and the U.S. dollar amount actually received. That portion of both realized and unrealized gains and losses on investments that results from fluctuations in foreign currency exchange rates is not separately disclosed but is included with net realized and unrealized gain/appreciation and loss/depreciation on investments.
Securities Lending. Deutsche Bank AG, as lending agent, lends securities of the Fund to certain financial institutions under the terms of the Security Lending Agreement. The Fund retains the benefits of owning securities it has loaned and continues to receive interest and dividends generated by the securities and to participate in any changes in their market value. The Fund requires the borrowers of the securities to maintain collateral with the Fund consisting of either cash or liquid, unencumbered assets having a value at least equal to the value of the securities loaned. When the collateral falls below specified amounts, the lending agent will use its best effort to obtain additional collateral on the next business day to meet required amounts under the security lending agreement. The Fund may invest the cash collateral into a joint trading account in an affiliated money market fund pursuant to Exemptive Orders issued by the SEC. The Fund receives compensation for lending its securities either in the form of fees or by earning interest on invested cash collateral net of borrower rebates and fees paid to a lending agent. Either the Fund or the borrower may terminate the loan. There may be risks of delay and costs in recovery of securities or even loss of rights in the collateral should the borrower of the securities fail financially. If the Fund is not able to recover securities lent, the Fund may sell the collateral and purchase a replacement investment in the market, incurring the risk that the value of the replacement security is greater than the value of the collateral. The Fund is also subject to all investment risks associated with the reinvestment of any cash collateral received, including, but not limited to, interest rate, credit and liquidity risk associated with such investments.
As of December 31, 2014, the Fund had securities on loan. The value of the related collateral exceeded the value of the securities loaned at period end.
Federal Income Taxes. The Fund's policy is to comply with the requirements of the Internal Revenue Code, as amended, which are applicable to regulated investment companies and to distribute all of its taxable income to its shareholders.
The Fund has reviewed the tax positions for the open tax years as of December 31, 2014 and has determined that no provision for income tax and/or uncertain tax provisions is required in the Fund's financial statements. The Fund's federal tax returns for the prior three fiscal years remain open subject to examination by the Internal Revenue Service.
Distribution of Income and Gains. Distributions from net investment income of the Fund, if any, is declared and distributed to shareholders annually. Net realized gains from investment transactions, in excess of available capital loss carryforwards, would be taxable to the Fund if not distributed and, therefore, will be distributed to shareholders at least annually. The Fund may also make additional distributions for tax purposes if necessary.
The timing and characterization of certain income and capital gain distributions are determined annually in accordance with federal tax regulations which may differ from accounting principles generally accepted in the United States of America. These differences primarily relate to certain securities sold at a loss. As a result, net investment income (loss) and net realized gain (loss) on investment transactions for a reporting period may differ significantly from distributions during such period. Accordingly, the Fund may periodically make reclassifications among certain of its capital accounts without impacting the net asset value of the Fund.
At December 31, 2014, the Fund's components of distributable earnings on a tax basis were as follows:
| Undistributed ordinary income* | | $ | 5,982,096 | |
| Undistributed long-term capital gains | | $ | 17,923,446 | |
| Unrealized appreciation (depreciation) on investments | | $ | 38,038,947 | |
In addition, the tax character of distributions paid by the Fund is summarized as follows:
| | | Years Ended December 31, | |
| | | 2014 | | | 2013 | |
| Distributions from ordinary income | | $ | 7,416,542 | | | $ | 8,115,446 | |
* For tax purposes, short-term capital gain distributions are considered ordinary income distributions.
Expenses. Expenses of the Trust arising in connection with a specific fund are allocated to that fund. Other Trust expenses which cannot be directly attributed to a fund are apportioned among the funds in the Trust based upon the relative net assets or other appropriate measures.
Contingencies. In the normal course of business, the Fund may enter into contracts with service providers that contain general indemnification clauses. The Fund's maximum exposure under these arrangements is unknown as this would involve future claims that may be made against the Fund that have not yet been made. However, based on experience, the Fund expects the risk of loss to be remote.
Other. Investment transactions are accounted for on a trade date plus one basis for daily net asset value calculations. However, for financial reporting purposes, investment transactions are reported on trade date. Interest income is recorded on the accrual basis. Dividend income is recorded on the ex-dividend date net of foreign withholding taxes. Realized gains and losses from investment transactions are recorded on an identified cost basis. Proceeds from litigation payments, if any, are included in net realized gain (loss) from investments.
B. Purchases and Sales of Securities
During the year ended December 31, 2014, purchases and sales of investment transactions (excluding short-term investments) aggregated $568,219,116 and $601,638,051, respectively.
C. Related Parties
Management Agreement. Under the Investment Management Agreement with Deutsche Investment Management Americas Inc. ("DIMA" or the "Advisor"), an indirect, wholly owned subsidiary of Deutsche Bank AG, the Advisor directs the investments of the Fund in accordance with its investment objectives, policies and restrictions. The Advisor determines the securities, instruments and other contracts relating to investments to be purchased, sold or entered into by the Fund.
Under the Investment Management Agreement with the Advisor, the Fund pays a monthly management fee based on the Fund's average daily net assets, computed and accrued daily and payable monthly, at the following annual rates:
| First $250 million | | | .650 | % |
| Next $750 million | | | .625 | % |
| Next $1.5 billion | | | .600 | % |
| Next $2.5 billion | | | .575 | % |
| Next $2.5 billion | | | .550 | % |
| Next $2.5 billion | | | .525 | % |
| Next $2.5 billion | | | .500 | % |
| Over $12.5 billion | | | .475 | % |
Accordingly, for the year ended December 31, 2014, the fee pursuant to the Investment Management Agreement was equivalent to an annual rate (exclusive of any applicable waivers/reimbursements) of 0.64% of the Fund's average daily net assets.
For the period from January 1, 2014 through September 30, 2015, the Advisor has contractually agreed to waive all or a portion of its fees and/or reimburse certain operating expenses of the Fund to the extent necessary to maintain the total annual operating expenses (excluding certain expenses such as extraordinary expenses, taxes, brokerage and interest) of each class as follows:
For the year ended December 31, 2014, fees waived and/or expenses reimbursed for each class are as follows:
| Class A | | $ | 205,692 | |
| Class B | | | 2,522 | |
| | | $ | 208,214 | |
Administration Fee. Pursuant to an Administrative Services Agreement, DIMA provides most administrative services to the Fund. For all services provided under the Administrative Services Agreement, the Fund pays DIMA an annual fee ("Administration Fee") of 0.10% of the Fund's average daily net assets, computed and accrued daily and payable monthly. For the year ended December 31, 2014, the Administration Fee was $439,011, of which $37,221 is unpaid.
Service Provider Fees. DeAWM Service Company ("DSC"), an affiliate of the Advisor, is the transfer agent, dividend-paying agent and shareholder service agent for the Fund. Pursuant to a sub-transfer agency agreement between DSC and DST Systems, Inc. ("DST"), DSC has delegated certain transfer agent, dividend-paying agent and shareholder service agent functions to DST. DSC compensates DST out of the shareholder servicing fee it receives from the Fund. For the year ended December 31, 2014, the amounts charged to the Fund by DSC were as follows:
| Services to Shareholders | | Total Aggregated | | | Unpaid at December 31, 2014 | |
| Class A | | $ | 393 | | | $ | 71 | |
| Class B | | | 224 | | | | 36 | |
| | | $ | 617 | | | $ | 107 | |
Distribution Service Agreement. Under the Fund's Class B 12b-1 plan, DeAWM Distributors, Inc. ("DDI") received a fee ("Distribution Service Fee") of 0.25% of average daily net assets of Class B shares. For the year ended December 31, 2014, the Distribution Service Fee aggregated $12,504, of which $1,126 is unpaid.
Typesetting and Filing Service Fees. Under an agreement with DIMA, DIMA is compensated for providing typesetting and certain regulatory filing services to the Fund. For the year ended December 31, 2014, the amount charged to the Fund by DIMA included in the Statement of Operations under "Reports to shareholders" aggregated $13,138, of which $4,024 is unpaid.
Trustees' Fees and Expenses. The Fund paid retainer fees to each Trustee not affiliated with the Advisor, plus specified amounts to the Board Chairperson and Vice Chairperson and to each committee Chairperson.
Affiliated Cash Management Vehicles. The Fund may invest uninvested cash balances in Central Cash Management Fund and Deutsche Variable NAV Money Fund, affiliated money market funds which are managed by the Advisor. Each affiliated money market fund seeks to provide a high level of current income consistent with liquidity and the preservation of capital. Each affiliated money market fund is managed in accordance with Rule 2a-7 under the Investment Company Act of 1940, which governs the quality, maturity, diversity and liquidity of instruments in which a money market fund may invest. Central Cash Management Fund seeks to maintain a stable net asset value, and Deutsche Variable NAV Money Fund maintains a floating net asset value. The Fund indirectly bears its proportionate share of the expenses of each affiliated money market fund in which it invests. Central Cash Management Fund does not pay the Advisor an investment management fee. To the extent that Deutsche Variable NAV Money Fund pays an investment management fee to the Advisor, the Advisor will waive an amount of the investment management fee payable to the Advisor by the Fund equal to the amount of the investment management fee payable on the Fund's assets invested in Deutsche Variable NAV Money Fund.
Securities Lending Agent Fees. Deutsche Bank AG serves as securities lending agent for the Fund. For the year ended December 31, 2014, the Fund incurred securities lending agent fees to Deutsche Bank AG in the amount of $10,855.
D. Ownership of the Fund
At December 31, 2014, two participating insurance companies were owners of record of 10% or more of the total outstanding Class A shares of the Fund, each owning 60% and 25%. Three participating insurance companies were owners of record of 10% or more of the total outstanding Class B shares of the Fund, each owning 59%, 13% and 10%.
E. Line of Credit
The Fund and other affiliated funds (the "Participants") share in a $400 million revolving credit facility provided by a syndication of banks. The Fund may borrow for temporary or emergency purposes, including the meeting of redemption requests that otherwise might require the untimely disposition of securities. The Participants are charged an annual commitment fee which is allocated based on net assets, among each of the Participants. Interest is calculated at a rate per annum equal to the sum of the Federal Funds Rate plus 1.25 percent plus if LIBOR exceeds the Federal Funds Rate the amount of such excess. The Fund may borrow up to a maximum of 33 percent of its net assets under the agreement. The Fund had no outstanding loans at December 31, 2014.
Report of Independent Registered Public Accounting Firm
To the Board of Trustees of Deutsche Variable Series II and the Shareholders of Deutsche Large Cap Value VIP:
We have audited the accompanying statement of assets and liabilities, including the investment portfolio, of Deutsche Large Cap Value VIP (formerly DWS Large Cap Value VIP) (the "Fund") (one of the series constituting Deutsche Variable Series II (formerly DWS Variable Series II)), as of December 31, 2014, and the related statement of operations for the year then ended, the statements of changes in net assets for each of the two years in the period then ended, and the financial highlights for each of the periods indicated therein. These financial statements and financial highlights are the responsibility of the Fund’s management. Our responsibility is to express an opinion on these financial statements and financial highlights based on our audits.
We conducted our audits in accordance with the standards of the Public Company Accounting Oversight Board (United States). Those standards require that we plan and perform the audit to obtain reasonable assurance about whether the financial statements and financial highlights are free of material misstatement. We were not engaged to perform an audit of the Fund’s internal control over financial reporting. Our audits included consideration of internal control over financial reporting as a basis for designing audit procedures that are appropriate in the circumstances, but not for the purpose of expressing an opinion on the effectiveness of the Fund’s internal control over financial reporting. Accordingly, we express no such opinion. An audit also includes examining, on a test basis, evidence supporting the amounts and disclosures in the financial statements and financial highlights, assessing the accounting principles used and significant estimates made by management, and evaluating the overall financial statement presentation. Our procedures included confirmation of securities owned as of December 31, 2014, by correspondence with the custodian and brokers. We believe that our audits provide a reasonable basis for our opinion.
In our opinion, the financial statements and financial highlights referred to above present fairly, in all material respects, the financial position of Deutsche Large Cap Value VIP at December 31, 2014, the results of its operations for the year then ended, the changes in its net assets for each of the two years in the period then ended, and the financial highlights for each of the periods indicated therein, in conformity with U.S. generally accepted accounting principles.
| | | |
Boston, Massachusetts February 13, 2015 | | |
Information About Your Fund's Expenses (Unaudited)
The tables illustrate your Fund's expenses in two ways:
As an investor of the Fund, you incur two types of costs: ongoing expenses and transaction costs. Ongoing expenses include management fees, distribution and service (12b-1) fees and other Fund expenses. Examples of transaction costs include contract charges, which are not shown in this section. The following tables are intended to help you understand your ongoing expenses (in dollars) of investing in the Fund and to help you compare these expenses with the ongoing expenses of investing in other mutual funds. In the most recent six-month period, the Fund limited these expenses; had it not done so, expenses would have been higher. The example in the table is based on an investment of $1,000 invested at the beginning of the six-month period and held for the entire period (July 1, 2014 to December 31, 2014).
—Actual Fund Return. This helps you estimate the actual dollar amount of ongoing expenses (but not transaction costs) paid on a $1,000 investment in the Fund using the Fund's actual return during the period. To estimate the expenses you paid over the period, simply divide your account value by $1,000 (for example, an $8,600 account value divided by $1,000 = 8.6), then multiply the result by the number in the "Expenses Paid per $1,000" line under the share class you hold.
—Hypothetical 5% Fund Return. This helps you to compare your Fund's ongoing expenses (but not transaction costs) with those of other mutual funds using the Fund's actual expense ratio and a hypothetical rate of return of 5% per year before expenses. Examples using a 5% hypothetical Fund return may be found in the shareholder reports of other mutual funds. The hypothetical account values and expenses may not be used to estimate the actual ending account balance or expenses you paid for the period.
Please note that the expenses shown in these tables are meant to highlight your ongoing expenses only and do not reflect any transaction costs. The "Expenses Paid per $1,000" line of the tables is useful in comparing ongoing expenses only and will not help you determine the relative total expense of owning different funds. If these transaction costs had been included, your costs would have been higher.
Expenses and Value of a $1,000 Investment for the six months ended December 31, 2014 | |
| Actual Fund Return | | Class A | | | Class B | |
| Beginning Account Value 7/1/14 | | $ | 1,000.00 | | | $ | 1,000.00 | |
| Ending Account Value 12/31/14 | | $ | 1,029.60 | | | $ | 1,028.40 | |
| Expenses Paid per $1,000* | | $ | 3.73 | | | $ | 5.32 | |
| Hypothetical 5% Fund Return | | Class A | | | Class B | |
| Beginning Account Value 7/1/14 | | $ | 1,000.00 | | | $ | 1,000.00 | |
| Ending Account Value 12/31/14 | | $ | 1,021.53 | | | $ | 1,019.96 | |
| Expenses Paid per $1,000* | | $ | 3.72 | | | $ | 5.30 | |
* Expenses are equal to the Fund's annualized expense ratio for each share class, multiplied by the average account value over the period, multiplied by 184 (the number of days in the most recent six-month period), then divided by 365.
| Annualized Expense Ratios | Class A | | Class B | |
| Deutsche Variable Series II — Deutsche Large Cap Value VIP | .73% | | 1.04% | |
For more information, please refer to the Fund's prospectus.
These tables do not reflect charges and fees ("contract charges") associated with the separate account that invests in the Fund or any variable life insurance policy or variable annuity contract for which the Fund is an investment option.
For an analysis of the fees associated with an investment in the fund or similar funds, please refer to the current and hypothetical expense calculators for Variable Insurance Products which can be found at deutschefunds.com/EN/resources/calculators.jsp.
Tax Information (Unaudited)
Pursuant to Section 852 of the Internal Revenue Code, the Fund designates $19,716,000 as capital gain dividends for its year ended December 31, 2014.
For corporate shareholders, 100% of the ordinary dividends (i.e., income dividends plus short-term capital gains) paid during the Fund's fiscal year ended December 31, 2014, qualified for the dividends received deduction.
Please consult a tax advisor if you have questions about federal or state income tax laws, or on how to prepare your tax returns. If you have specific questions about your account, please contact your insurance provider.
The Trust's policies and procedures for voting proxies for portfolio securities and information about how the Trust voted proxies related to its portfolio securities during the 12-month period ended June 30 are available on our Web site — deutschefunds.com (click on "proxy voting" at the bottom of the page) — or on the SEC's Web site — sec.gov. To obtain a written copy of the Trust's policies and procedures without charge, upon request, call us toll free at (800) 728-3337.
Advisory Agreement Board Considerations and Fee Evaluation
The Board of Trustees approved the renewal of Deutsche Large Cap Value VIP’s investment management agreement (the "Agreement") with Deutsche Investment Management Americas Inc. ("DIMA") in September 2014.
In terms of the process that the Board followed prior to approving the Agreement, shareholders should know that:
— In September 2014, all of the Fund’s Trustees were independent of DIMA and its affiliates.
— The Trustees met frequently during the past year to discuss fund matters and dedicated a substantial amount of time to contract review matters. Over the course of several months, the Board’s Contract Committee, in coordination with the Board’s Equity Oversight Committee, reviewed comprehensive materials received from DIMA, independent third parties and independent counsel. These materials included an analysis of the Fund’s performance, fees and expenses, and profitability compiled by a fee consultant retained by the Fund’s Independent Trustees (the "Fee Consultant"). The Board also received extensive information throughout the year regarding performance of the Fund.
— The Independent Trustees regularly meet privately with counsel to discuss contract review and other matters. In addition, the Independent Trustees were advised by the Fee Consultant in the course of their review of the Fund’s contractual arrangements and considered a comprehensive report prepared by the Fee Consultant in connection with their deliberations.
— In connection with reviewing the Agreement, the Board also reviewed the terms of the Fund’s Rule 12b-1 plan, distribution agreement, administrative services agreement, transfer agency agreement and other material service agreements.
— Based on its evaluation of the information provided, the Contract Committee presented its findings and recommendations to the Board. The Board then reviewed the Contract Committee’s findings and recommendations.
In connection with the contract review process, the Contract Committee and the Board considered the factors discussed below, among others. The Board also considered that DIMA and its predecessors have managed the Fund since its inception, and the Board believes that a long-term relationship with a capable, conscientious advisor is in the best interests of the Fund. The Board considered, generally, that shareholders chose to invest or remain invested in the Fund knowing that DIMA managed the Fund, and that the Agreement was approved by the Fund’s shareholders. DIMA is part of Deutsche Bank AG ("DB"), a major global banking institution that is engaged in a wide range of financial services. The Board believes that there are advantages to being part of a global asset management business that offers a wide range of investing expertise and resources, including hundreds of portfolio managers and analysts with research capabilities in many countries throughout the world.
As part of the contract review process, the Board carefully considered the fees and expenses of each Deutsche fund overseen by the Board in light of the fund’s performance. In many cases, this led to the negotiation and implementation of expense caps. As part of these negotiations, the Board indicated that it would consider relaxing these caps in future years following sustained improvements in performance, among other considerations.
In 2012, DB combined its Asset Management (of which DIMA was a part) and Wealth Management divisions into a new Asset and Wealth Management ("AWM") division. DB has advised the Independent Trustees that the U.S. asset management business is a critical and integral part of DB, and that DB will continue to invest in AWM a significant portion of the savings it has realized by combining its Asset and Wealth Management divisions, including ongoing enhancements to AWM’s investment capabilities. DB also has confirmed its commitment to maintaining strong legal and compliance groups within the AWM division.
While shareholders may focus primarily on fund performance and fees, the Fund’s Board considers these and many other factors, including the quality and integrity of DIMA’s personnel and such other issues as back-office operations, fund valuations, and compliance policies and procedures.
Nature, Quality and Extent of Services. The Board considered the terms of the Agreement, including the scope of advisory services provided under the Agreement. The Board noted that, under the Agreement, DIMA provides portfolio management services to the Fund and that, pursuant to a separate administrative services agreement, DIMA provides administrative services to the Fund. The Board considered the experience and skills of senior management and investment personnel, the resources made available to such personnel, the ability of DIMA to attract and retain high-quality personnel, and the organizational depth and stability of DIMA. The Board reviewed the Fund’s performance over short-term and long-term periods and compared those returns to various agreed-upon performance measures, including market index(es) and a peer universe compiled by the Fee Consultant using information supplied by Morningstar Direct ("Morningstar"), an independent fund data service. The Board also noted that it has put into place a process of identifying "Focus Funds" (e.g., funds performing poorly relative to a peer universe), and receives more frequent reporting and information from DIMA regarding such funds, along with DIMA’s plans to address underperformance. The Board believes this process is an effective manner of identifying and addressing underperforming funds. Based on the information provided, the Board noted that for the one-, three- and five-year periods ended December 31, 2013, the Fund’s performance (Class A shares) was in the 3rd quartile, 4th quartile and 4th quartile, respectively, of the applicable Morningstar universe (the 1st quartile being the best performers and the 4th quartile being the worst performers). The Board also observed that the Fund has underperformed its benchmark in the one-, three- and five-year periods ended December 31, 2013. The Board noted the disappointing investment performance of the Fund in recent periods and continued to discuss with senior management of DIMA the factors contributing to such underperformance and actions being taken to improve performance. The Board observed that the Fund had experienced improved relative performance during the first seven months of 2014. The Board recognized the efforts by DIMA in recent years to enhance its investment platform and improve long-term performance across the Deutsche fund complex.
Fees and Expenses. The Board considered the Fund’s investment management fee schedule, operating expenses and total expense ratios, and comparative information provided by Lipper Inc. ("Lipper") and the Fee Consultant regarding investment management fee rates paid to other investment advisors by similar funds (1st quartile being the most favorable and 4th quartile being the least favorable). With respect to management fees paid to other investment advisors by similar funds, the Board noted that the contractual fee rates paid by the Fund, which include a 0.10% fee paid to DIMA under the Fund’s administrative services agreement, were lower than the median (2nd quartile) of the applicable Lipper peer group (based on Lipper data provided as of December 31, 2013). The Board noted that the Fund’s Class A shares total (net) operating expenses were expected to be lower than the median (2nd quartile) of the applicable Lipper expense universe (based on Lipper data provided as of December 31, 2013, and analyzing Lipper expense universe Class A (net) expenses less any applicable 12b-1 fees) ("Lipper Universe Expenses"). The Board also reviewed data comparing each share class’s total (net) operating expenses to the applicable Lipper Universe Expenses. The Board also considered how the Fund’s total (net) operating expenses compared to the total (net) operating expenses of a more customized peer group selected by Lipper (based on such factors as asset size). The Board noted that the expense limitations agreed to by DIMA helped to ensure that the Fund’s total (net) operating expenses would remain competitive. The Board considered the Fund’s management fee rate as compared to fees charged by DIMA to comparable funds and considered differences between the Fund and the comparable funds. The information requested by the Board as part of its review of fees and expenses also included information about institutional accounts and funds offered primarily to European investors ("Deutsche Europe funds") managed by DIMA and its affiliates. The Board noted that DIMA indicated that it does not manage any institutional accounts or Deutsche Europe funds comparable to the Fund.
On the basis of the information provided, the Board concluded that management fees were reasonable and appropriate in light of the nature, quality and extent of services provided by DIMA.
Profitability. The Board reviewed detailed information regarding revenues received by DIMA under the Agreement. The Board considered the estimated costs and pre-tax profits realized by DIMA from advising the Deutsche U.S. mutual funds ("Deutsche Funds"), as well as estimates of the pre-tax profits attributable to managing the Fund in particular. The Board also received information regarding the estimated enterprise-wide profitability of DIMA and its affiliates with respect to all fund services in totality and by fund. The Board and the Fee Consultant reviewed DIMA’s methodology in allocating its costs to the management of the Fund. Based on the information provided, the Board concluded that the pre-tax profits realized by DIMA in connection with the management of the Fund were not unreasonable.
Economies of Scale. The Board considered whether there are economies of scale with respect to the management of the Fund and whether the Fund benefits from any economies of scale. The Board noted that the Fund’s management fee schedule includes fee breakpoints. The Board concluded that the Fund’s fee schedule represents an appropriate sharing between the Fund and DIMA of such economies of scale as may exist in the management of the Fund at current asset levels.
Other Benefits to DIMA and Its Affiliates. The Board also considered the character and amount of other incidental benefits received by DIMA and its affiliates, including any fees received by DIMA for administrative services provided to the Fund and any fees received by an affiliate of DIMA for distribution services. The Board also considered benefits to DIMA related to brokerage and soft-dollar allocations, including allocating brokerage to pay for research generated by parties other than the executing broker dealers, which pertain primarily to funds investing in equity securities, along with the incidental public relations benefits to DIMA related to Deutsche Funds advertising and cross-selling opportunities among DIMA products and services. The Board concluded that management fees were reasonable in light of these fallout benefits.
Compliance. The Board considered the significant attention and resources dedicated by DIMA to documenting and enhancing its compliance processes in recent years. The Board noted in particular (i) the experience and seniority of DIMA’s and the Fund’s chief compliance officer; (ii) the large number of DIMA compliance personnel; and (iii) the substantial commitment of resources by DIMA and its affiliates to compliance matters.
Based on all of the information considered and the conclusions reached, the Board unanimously determined that the continuation of the Agreement is in the best interests of the Fund. In making this determination, the Board did not give particular weight to any single factor identified above. The Board considered these factors over the course of numerous meetings, certain of which were in executive session with only the Independent Trustees and counsel present. It is possible that individual Trustees may have weighed these factors differently in reaching their individual decisions to approve the continuation of the Agreement.
Board Members and Officers
The following table presents certain information regarding the Board Members and Officers of the fund. Each Board Member's year of birth is set forth in parentheses after his or her name. Unless otherwise noted, (i) each Board Member has engaged in the principal occupation(s) noted in the table for at least the most recent five years, although not necessarily in the same capacity; and (ii) the address of each Independent Board Member is c/o Kenneth C. Froewiss, Chairman, Deutsche Mutual Funds, P.O. Box 390601, Cambridge, MA 02139. Except as otherwise noted below, the term of office for each Board Member is until the election and qualification of a successor, or until such Board Member sooner dies, resigns, is removed or as otherwise provided in the governing documents of the fund. Because the fund does not hold an annual meeting of shareholders, each Board Member will hold office for an indeterminate period. The Board Members may also serve in similar capacities with other funds in the fund complex.
| Independent Board Members |
Name, Year of Birth, Position with the Fund and Length of Time Served1 | | Business Experience and Directorships During the Past Five Years | Number of Funds in Deutsche Fund Complex Overseen | Other Directorships Held by Board Member |
Kenneth C. Froewiss (1945) Chairperson since 2013, and Board Member since 2001 | | Adjunct Professor of Finance, NYU Stern School of Business (September 2009–present; Clinical Professor from 1997–September 2009); Member, Finance Committee, Association for Asian Studies (2002–present); Director, Mitsui Sumitomo Insurance Group (US) (2004–present); prior thereto, Managing Director, J.P. Morgan (investment banking firm) (until 1996) | 105 | — |
William McClayton (1944) Vice Chairperson since 2013, and Board Member since 2004 | | Private equity investor (since October 2009); previously, Managing Director, Diamond Management & Technology Consultants, Inc. (global consulting firm) (2001–2009); Directorship: Board of Managers, YMCA of Metropolitan Chicago; formerly: Senior Partner, Arthur Andersen LLP (accounting) (1966–2001); Trustee, Ravinia Festival | 105 | — |
John W. Ballantine (1946) Board Member since 1999 | | Retired; formerly, Executive Vice President and Chief Risk Management Officer, First Chicago NBD Corporation/The First National Bank of Chicago (1996–1998); Executive Vice President and Head of International Banking (1995–1996); former Directorships: Director and former Chairman of the Board, Healthways, Inc.2 (provider of disease and care management services) (2003–2014); Stockwell Capital Investments PLC (private equity); First Oak Brook Bancshares, Inc. and Oak Brook Bank; Prisma Energy International | 105 | Portland General Electric2 (utility company) (2003– present) |
Henry P. Becton, Jr. (1943) Board Member since 1990 | | Vice Chair and former President, WGBH Educational Foundation. Directorships: Public Radio International; Public Radio Exchange (PRX); North Bennett Street School (Boston); former Directorships: Belo Corporation2 (media company); The PBS Foundation; Association of Public Television Stations; Boston Museum of Science; American Public Television; Concord Academy; New England Aquarium; Mass. Corporation for Educational Telecommunications; Committee for Economic Development; Public Broadcasting Service; Connecticut College | 105 | Lead Director, Becton Dickinson and Company2 (medical technology company) |
Dawn-Marie Driscoll (1946) Board Member since 1987 | | Emeritus Executive Fellow, Center for Business Ethics, Bentley University; formerly: President, Driscoll Associates (consulting firm); Partner, Palmer & Dodge (law firm) (1988–1990); Vice President of Corporate Affairs and General Counsel, Filene's (retail) (1978–1988). Directorships: Director of ICI Mutual Insurance Company (since 2007); Advisory Board, Center for Business Ethics, Bentley University; Trustee and former Chairman of the Board, Southwest Florida Community Foundation (charitable organization); former Directorships: Sun Capital Advisers Trust (mutual funds) (2007–2012), Investment Company Institute (audit, executive, nominating committees) and Independent Directors Council (governance, executive committees) | 105 | — |
Keith R. Fox, CFA (1954) Board Member since 1996 | | Managing General Partner, Exeter Capital Partners (a series of private investment funds) (since 1986). Directorships: Progressive International Corporation (kitchen goods importer and distributor); The Kennel Shop (retailer); former Chairman, National Association of Small Business Investment Companies; former Directorships: BoxTop Media Inc. (advertising); Sun Capital Advisers Trust (mutual funds) (2011–2012) | 105 | — |
Paul K. Freeman (1950) Board Member since 1993 | | Consultant, World Bank/Inter-American Development Bank; Chair, Independent Directors Council; Investment Company Institute (executive and nominating committees); formerly, Chairman of Education Committee of Independent Directors Council; Project Leader, International Institute for Applied Systems Analysis (1998–2001); Chief Executive Officer, The Eric Group, Inc. (environmental insurance) (1986–1998); Directorships: Denver Zoo Foundation (December 2012–present); former Directorships: Prisma Energy International | 105 | — |
Richard J. Herring (1946) Board Member since 1990 | | Jacob Safra Professor of International Banking and Professor, Finance Department, The Wharton School, University of Pennsylvania (since July 1972); Co-Director, Wharton Financial Institutions Center; Co-Chair, U.S. Shadow Financial Regulatory Committee; Executive Director, Financial Economists Roundtable; formerly: Vice Dean and Director, Wharton Undergraduate Division (July 1995–June 2000); Director, Lauder Institute of International Management Studies (July 2000–June 2006) | 105 | Director, Aberdeen Singapore and Japan Funds (since 2007); Independent Director of Barclays Bank Delaware (since September 2010) |
Rebecca W. Rimel (1951) Board Member since 1995 | | President and Chief Executive Officer, The Pew Charitable Trusts (charitable organization) (1994 to present); formerly: Executive Vice President, The Glenmede Trust Company (investment trust and wealth management) (1983–2004); Board Member, Investor Education (charitable organization) (2004–2005); Trustee, Executive Committee, Philadelphia Chamber of Commerce (2001–2007); Director, Viasys Health Care2 (January 2007–June 2007); Trustee, Thomas Jefferson Foundation (charitable organization) (1994–2012) | 105 | Director, Becton Dickinson and Company2 (medical technology company) (2012– present); Director, BioTelemetry Inc.2 (health care) (2009– present) |
William N. Searcy, Jr. (1946) Board Member since 1993 | | Private investor since October 2003; formerly: Pension & Savings Trust Officer, Sprint Corporation2 (telecommunications) (November 1989–September 2003); Trustee, Sun Capital Advisers Trust (mutual funds) (1998–2012) | 105 | — |
Jean Gleason Stromberg (1943) Board Member since 1997 | | Retired. Formerly, Consultant (1997–2001); Director, Financial Markets U.S. Government Accountability Office (1996–1997); Partner, Norton Rose Fulbright, L.L.P. (law firm) (1978–1996). Directorships: The William and Flora Hewlett Foundation (charitable organization); former Directorships: Service Source, Inc. (nonprofit), Mutual Fund Directors Forum (2002–2004), American Bar Retirement Association (funding vehicle for retirement plans) (1987–1990 and 1994–1996) | 105 | — |
Robert H. Wadsworth* (1940) Board Member since 1999 | | President, Robert H. Wadsworth & Associates, Inc. (consulting firm) (1983 to present); Director, The Phoenix Boys Choir Association | 105 | — |
Officers4 |
Name, Year of Birth, Position with the Fund and Length of Time Served5 | | Business Experience and Directorships During the Past Five Years |
Brian E. Binder8 (1972) President and Chief Executive Officer, 2013–present | | Managing Director3 and Head of Fund Administration, Deutsche Asset & Wealth Management (2013–present); formerly: Head of Business Management and Consulting at Invesco, Ltd. (2010–2012); Chief Administrative Officer, Van Kampen Funds Inc. (2008–2010); and Chief Administrative Officer, Morgan Stanley Investment Management Americas Distribution (2003–2008) |
John Millette7 (1962) Vice President and Secretary, 1999–present | | Director,3 Deutsche Asset & Wealth Management |
Melinda Morrow6 (1970) Vice President, 2012–present | | Director,3 Deutsche Asset & Wealth Management |
Paul H. Schubert6 (1963) Chief Financial Officer, 2004–present Treasurer, 2005–present | | Managing Director,3 Deutsche Asset & Wealth Management (since July 2004); formerly: Executive Director, Head of Mutual Fund Services and Treasurer for UBS Family of Funds (1998–2004); Vice President and Director of Mutual Fund Finance at UBS Global Asset Management (1994–1998) |
Caroline Pearson7 (1962) Chief Legal Officer, 2010–present | | Managing Director,3 Deutsche Asset & Wealth Management; formerly: Assistant Secretary for DWS family of funds (1997–2010) |
Robert Kloby6 (1962) Chief Compliance Officer, 2006–present | | Managing Director,3 Deutsche Asset & Wealth Management |
Wayne Salit6 (1967) Anti-Money Laundering Compliance Officer, 2014–present | | Director,3 Deutsche Asset & Wealth Management; formerly: Managing Director, AML Compliance Officer at BNY Mellon (2011–2014); and Director, AML Compliance Officer at Deutsche Bank (2004–2011) |
Hepsen Uzcan7 (1974) Assistant Secretary, 2013–present | | Director,3 Deutsche Asset & Wealth Management |
Paul Antosca7 (1957) Assistant Treasurer, 2007–present | | Director,3 Deutsche Asset & Wealth Management |
Jack Clark7 (1967) Assistant Treasurer, 2007–present | | Director,3 Deutsche Asset & Wealth Management |
Diane Kenneally7 (1966) Assistant Treasurer, 2007–present | | Director,3 Deutsche Asset & Wealth Management |
1 The length of time served represents the year in which the Board Member joined the board of one or more Deutsche funds currently overseen by the Board.
2 A publicly held company with securities registered pursuant to Section 12 of the Securities Exchange Act of 1934.
3 Executive title, not a board directorship.
4 As a result of their respective positions held with the Advisor, these individuals are considered "interested persons" of the Advisor within the meaning of the 1940 Act. Interested persons receive no compensation from the fund.
5 The length of time served represents the year in which the officer was first elected in such capacity for one or more Deutsche funds.
6 Address: 60 Wall Street, New York, NY 10005.
7 Address: One Beacon Street, Boston, MA 02108.
8 Address: 222 South Riverside Plaza, Chicago, IL 60606.
* Robert H. Wadsworth retired from the Board effective December 31, 2014.
The fund's Statement of Additional Information ("SAI") includes additional information about the Board Members. The SAI is available, without charge, upon request. If you would like to request a copy of the SAI, you may do so by calling the following toll-free number: (800) 728-3337.
DeAWM Distributors, Inc.
222 South Riverside Plaza
Chicago, IL 60606
(800) 621-1148
VS2LCV-2 (R-025833-4 2/15)
December 31, 2014
Annual Report
Deutsche Variable Series II
(formerly DWS Variable Series II)
Deutsche Money Market VIP
(formerly DWS Money Market VIP)
Contents
11 Statement of Assets and Liabilities 12 Statement of Operations 13 Statement of Changes in Net Assets 15 Notes to Financial Statements 18 Report of Independent Registered Public Accounting Firm 19 Information About Your Fund's Expenses 22 Advisory Agreement Board Considerations and Fee Evaluation 24 Board Members and Officers |
This report must be preceded or accompanied by a prospectus. To obtain an additional prospectus or summary prospectus, if available, call (800) 728-3337 or your financial representative. We advise you to consider the Fund's objectives, risks, charges and expenses carefully before investing. The summary prospectus and prospectus contain this and other important information about the Fund. Please read the prospectus carefully before you invest.
An investment in this Fund is not insured or guaranteed by the Federal Deposit Insurance Corporation (FDIC) or by any other government agency. Although the Fund seeks to preserve the value of your investment at $1.00 per share, it is possible to lose money by investing in the Fund. The share price of money market funds can fall below the $1.00 share price. You should not rely on or expect the Advisor to enter into support agreements or take other actions to maintain the Fund's $1.00 share price. The credit quality of the Fund's holdings can change rapidly in certain markets, and the default of a single holding could have an adverse impact on the Fund's share price. The Fund's share price can also be negatively affected during periods of high redemption pressures and/or illiquid markets. The actions of a few large investors in the Fund may have a significant adverse effect on the share price of the Fund. See the prospectus for specific details regarding the Fund's risk profile.
Deutsche Asset & Wealth Management represents the asset management and wealth management activities conducted by Deutsche Bank AG or any of its subsidiaries, including the Advisor and DeAWM Distributors, Inc.
NOT FDIC/NCUA INSURED NO BANK GUARANTEE MAY LOSE VALUE NOT A DEPOSIT
NOT INSURED BY ANY FEDERAL GOVERNMENT AGENCY
Performance Summary December 31, 2014 (Unaudited)
Deutsche Money Market VIP
All performance shown is historical, assumes reinvestment of all dividend and capital gain distributions and does not guarantee future results. Investment return and principal value fluctuate with changing market conditions so that, when redeemed, shares may be worth more or less than their original cost. Current performance may be lower or higher than the performance data quoted. Please contact your participating insurance company for the Fund's most recent month-end performance. Performance doesn't reflect charges and fees ("contract charges") associated with the separate account that invests in the Fund or any variable life insurance policy or variable annuity contract for which the Fund is an investment option. These charges and fees will reduce returns. The yield quotation more closely reflects the current earnings of the Fund than the total return quotation.
An investment in this Fund is not insured or guaranteed by the Federal Deposit Insurance Corporation (FDIC) or by any other government agency. Although the Fund seeks to preserve the value of your investment at $1.00 per share, it is possible to lose money by investing in the Fund. The share price of money market funds can fall below the $1.00 share price.
| | 7-Day Current Yield |
| December 31, 2014 | .01%* |
| December 31, 2013 | .01%* |
* The investment advisor has agreed to waive fees/reimburse expenses. Without such fee waivers/expense reimbursements, the 7-day current yield would have been lower.
Yields are historical, will fluctuate and do not guarantee future performance. The 7-day current yield refers to the income paid by the Fund over a 7-day period expressed as an annual percentage rate of the Fund's shares outstanding.
Management Summary December 31, 2014 (Unaudited)
During the 12-month period ended December 31, 2014, the Fund provided a total return of 0.01% (Class A shares, unadjusted for contract charges). All performance is historical and does not guarantee future results. Yields fluctuate and are not guaranteed.
Over the Fund’s most recent fiscal year ended December 31, 2014, the fixed-income yield curve responded to generally improving economic data and shifting interest rate expectations.1 The release of the minutes from the June 2014 FOMC (Federal Open Market Committee) meeting gave market participants a framework for how the U.S. Federal Reserve Board (the Fed) will end its "policy accommodation," (i.e., begin to raise short-term interest rates), possibly in mid-to-late 2015. Near the end of 2014, positive employment and GDP figures accelerated expectations regarding when the Fed will raise rates, and short-term market rates rose.2 Within the money markets, the Fed continued to experiment with its overnight repurchase agreement program — which is essentially setting the "floor" for money market rates — in order to set up an orderly market environment for the time when the federal funds rate is actually raised.3
We were able to maintain a competitive yield for the Fund during the annual period ended December 31, 2014. We continued to seek ample liquidity, high credit quality and strong diversification across sectors and geographic regions by maintaining a neutral-to-long portfolio duration (or interest rate sensitivity). We pursued this strategy in light of the outlook for continued near-zero short-term interest rates and limited money market supply. In addition, outside of mandated liquidity requirements, we looked to keep the Fund’s cash position relatively low in order to take advantage of higher yields available from six-month-to-one-year money market securities. Our current forecast is for the federal funds rate to be increased sometime during the second half of this year. In preparation for this critical moment in the fixed-income markets, we are maintaining a cautious approach, with a shorter duration, an emphasis on short fixed maturities and floating-rate notes, and increased selectivity regarding longer maturities. On July 23, 2014, the Securities and Exchange Commission released a series of new rules regarding money market funds. The new rules were long anticipated, and do not appear to have had a major impact on market conditions initially. In the coming months, we will be closely monitoring the effect of the changes on the market and will consider any structural and operational changes required for the fund to adhere to the new rules prior to its compliance date.
A group of investment professionals is responsible for the day-to-day management of the Fund. These investment professionals have a broad range of experience managing money market funds.
The views expressed reflect those of the portfolio management team only through the end of the period of the report as stated on the cover. The management team's views are subject to change at any time based on market and other conditions and should not be construed as a recommendation. Past performance is no guarantee of future results. Current and future portfolio holdings are subject to risk.
1 The yield curve is a graphical representation of how yields on bonds of different maturities compare. Normally, yield curves slant up, as bonds with longer maturities typically offer higher yields than short-term bonds.
2 GDP, or gross domestic product, is the value of all goods and services produced by a country’s economy.
3 A repurchase agreement (repo) is an agreement between a seller and a buyer, usually of government securities, where the seller agrees to repurchase the securities at a given price and usually at a stated time. Repos are widely used money market instruments that serve as an interest-bearing, short-term "parking place" for large sums of money.
Portfolio Summary (Unaudited) Asset Allocation (As a % of Investment Portfolio) | 12/31/14 | 12/31/13 |
| | | |
| Commercial Paper | 54% | 50% |
| Repurchase Agreements | 20% | 7% |
| Certificates of Deposit and Bank Notes | 10% | 15% |
| Short-Term Notes | 6% | 16% |
| Government & Agency Obligations | 5% | 8% |
| Time Deposits | 4% | 4% |
| Municipal Bonds and Notes | 1% | — |
| | 100% | 100% |
| Weighted Average Maturity* | 12/31/14 | 12/31/13 |
| | | |
| Deutsche Variable Series II — Deutsche Money Market VIP | 46 days | 43 days |
| First Tier Retail Money Fund Average | 40 days | 43 days |
* The Fund is compared to its respective iMoneyNet Category: First Tier Retail Money Fund Average — Category includes a widely recognized composite of money market funds that invest in only first tier (highest rating) securities. Portfolio Holdings of First Tier funds include U.S. Treasury, U.S. Other, Repos, Time Deposits, Domestic Bank Obligations, Foreign Bank Obligations, First Tier Commercial Paper, Floating Rate Notes and Asset Backed Commercial Paper.
Weighted average maturity, also known as effective maturity, is the weighted average of the maturity date of bonds held by the Fund taking into consideration any available maturity shortening features.
Portfolio holdings and characteristics are subject to change.
For more complete details about the Fund's investment portfolio, see page 7.
Following the Fund's fiscal first and third quarter-end, a complete portfolio holdings listing is filed with the SEC on Form N-Q. In addition, each month, information about the Fund and its portfolio holdings is filed with the SEC on Form N-MFP. The SEC delays the public availability of the information filed on Form N-MFP for 60 days after the end of the reporting period included in the filing. These forms will be available on the SEC's Web site at sec.gov, and they may also be reviewed and copied at the SEC's Public Reference Room in Washington, D.C. Information on the operation of the SEC's Public Reference Room may be obtained by calling (800) SEC-0330. The Fund's portfolio holdings are also posted on deutschefunds.com from time to time. Please see the Fund's current prospectus for more information.
Investment Portfolio December 31, 2014 | | | Principal Amount ($) | | | Value ($) | |
| | | | |
| Certificates of Deposit and Bank Notes 9.5% | |
| Banco del Estado de Chile, 0.24%, 5/4/2015 | | | 1,200,000 | | | | 1,200,000 | |
| Bank of Montreal: | |
| 0.2%, 4/13/2015 | | | 2,000,000 | | | | 2,000,000 | |
| 0.23%, 5/13/2015 | | | 1,500,000 | | | | 1,500,000 | |
| Bank of Nova Scotia: | |
| 0.24%, 3/3/2015 | | | 1,250,000 | | | | 1,250,000 | |
| 0.25%, 2/17/2015 | | | 1,500,000 | | | | 1,500,000 | |
| Bank of Tokyo-Mitsubishi UFJ Ltd., 0.18%, 2/17/2015 | | | 3,000,000 | | | | 3,000,000 | |
| Canadian Imperial Bank of Commerce, 0.22%, 2/9/2015 | | | 1,000,000 | | | | 1,000,005 | |
| DZ Bank AG: | |
| 0.28%, 4/29/2015 | | | 1,800,000 | | | | 1,800,000 | |
| 0.31%, 2/19/2015 | | | 1,800,000 | | | | 1,800,000 | |
| Svenska Handelsbanken AB, 0.19%, 1/8/2015 | | | 1,000,000 | | | | 1,000,000 | |
| The Toronto-Dominion Bank, 0.295%, 7/13/2015 | | | 800,000 | | | | 800,000 | |
Total Certificates of Deposit and Bank Notes (Cost $16,850,005) | | | | 16,850,005 | |
| | |
| Commercial Paper 50.6% | |
| Issued at Discount** 39.5% | |
| Apache Corp., 0.7%, 1/8/2015 | | | 500,000 | | | | 499,932 | |
| Apple, Inc., 0.22%, 6/17/2015 | | | 750,000 | | | | 749,235 | |
| Bedford Row Funding Corp.: | |
| 144A, 0.3%, 4/14/2015 | | | 1,000,000 | | | | 999,142 | |
| 144A, 0.35%, 8/27/2015 | | | 500,000 | | | | 498,843 | |
| 144A, 0.35%, 10/19/2015 | | | 750,000 | | | | 747,878 | |
| 144A, 0.47%, 12/11/2015 | | | 1,000,000 | | | | 995,509 | |
| Caisse Centrale Desjardins, 0.175%, 2/12/2015 | | | 2,000,000 | | | | 1,999,592 | |
| Catholic Health Initiatives, 0.22%, 5/5/2015 | | | 2,000,000 | | | | 1,998,484 | |
| Charta Corp., 144A, 0.2%, 3/6/2015 | | | 1,200,000 | | | | 1,199,573 | |
| Chevron Corp.: | |
| 144A, 0.12%, 3/11/2015 | | | 2,000,000 | | | | 1,999,540 | |
| 144A, 0.13%, 1/8/2015 | | | 1,000,000 | | | | 999,975 | |
| CNPC Finance HK Ltd., 144A, 0.4%, 1/5/2015 | | | 500,000 | | | | 499,978 | |
| Coca-Cola Co., 0.31%, 9/16/2015 | | | 800,000 | | | | 798,223 | |
| CPPIB Capital, Inc., 0.3%, 2/11/2015 | | | 750,000 | | | | 749,744 | |
| DBS Bank Ltd., 144A, 0.25%, 6/9/2015 | | | 1,500,000 | | | | 1,498,344 | |
| Dexia Credit Local: | |
| 0.24%, 5/5/2015 | | | 1,000,000 | | | | 999,173 | |
| 0.265%, 4/8/2015 | | | 500,000 | | | | 499,643 | |
| 0.31%, 4/20/2015 | | | 1,500,000 | | | | 1,498,592 | |
| 0.31%, 5/29/2015 | | | 500,000 | | | | 499,363 | |
| Erste Abwicklungsanstalt: | |
| 144A, 0.17%, 1/22/2015 | | | 2,500,000 | | | | 2,499,752 | |
| 144A, 0.18%, 2/19/2015 | | | 1,500,000 | | | | 1,499,632 | |
| 144A, 0.2%, 4/8/2015 | | | 2,000,000 | | | | 1,998,922 | |
| General Electric Capital Corp., 0.23%, 2/11/2015 | | | 3,000,000 | | | | 2,999,214 | |
| | | Principal Amount ($) | | | Value ($) | |
| | | | | | | | | |
| Hannover Funding Co., LLC, 0.2%, 2/5/2015 | | | 2,000,000 | | | | 1,999,611 | |
| Macquarie Bank Ltd., 144A, 0.25%, 2/23/2015 | | | 1,500,000 | | | | 1,499,448 | |
| Microsoft Corp.: | |
| 0.09%, 2/25/2015 | | | 2,000,000 | | | | 1,999,725 | |
| 0.1%, 2/10/2015 | | | 2,000,000 | | | | 1,999,778 | |
| Nederlandse Waterschapsbank NV, 0.28%, 7/9/2015 | | | 800,000 | | | | 798,824 | |
| Nestle Finance International Ltd., 0.19%, 2/11/2015 | | | 2,500,000 | | | | 2,499,459 | |
| Nissan Motor Acceptance Corp., 0.4%, 1/8/2015 | | | 500,000 | | | | 499,961 | |
| Nordea Bank AB, 0.225%, 4/1/2015 | | | 1,500,000 | | | | 1,499,156 | |
| Old Line Funding LLC: | |
| 144A, 0.22%, 4/7/2015 | | | 500,000 | | | | 499,707 | |
| 144A, 0.23%, 3/9/2015 | | | 1,500,000 | | | | 1,499,358 | |
| Roche Holdings, Inc.: | |
| 144A, 0.13%, 1/5/2015 | | | 5,000,000 | | | | 4,999,928 | |
| 144A, 0.165%, 1/26/2015 | | | 1,000,000 | | | | 999,885 | |
| Sinopec Century Bright Capital Investment Ltd., 0.35%, 1/13/2015 | | | 1,000,000 | | | | 999,883 | |
| Standard Chartered Bank: | |
| 0.22%, 3/3/2015 | | | 2,500,000 | | | | 2,499,068 | |
| 0.25%, 2/2/2015 | | | 1,500,000 | | | | 1,499,667 | |
| 0.26%, 4/6/2015 | | | 1,500,000 | | | | 1,498,971 | |
| 0.32%, 6/8/2015 | | | 1,500,000 | | | | 1,497,893 | |
| The Army & Air Force Exchange Service, 0.11%, 1/7/2015 | | | 2,000,000 | | | | 1,999,963 | |
| Toronto-Dominion Holdings (U.S.A.), Inc., 0.08%, 1/2/2015 | | | 6,000,000 | | | | 5,999,987 | |
| United Overseas Bank Ltd., 0.26%, 1/5/2015 | | | 1,000,000 | | | | 999,971 | |
| Victory Receivables Corp., 144A, 0.18%, 1/13/2015 | | | 3,500,000 | | | | 3,499,790 | |
| | | | | 70,018,316 | |
| Issued at Par* 11.1% | |
| ANZ New Zealand International Ltd., 144A, 0.221%, 1/12/2015 | | | 1,300,000 | | | | 1,300,000 | |
| ASB Finance Ltd., 144A, 0.256%, 5/22/2015 | | | 1,250,000 | | | | 1,250,000 | |
| Australia & New Zealand Banking Group Ltd., 144A, 0.331%, 8/18/2015 | | | 800,000 | | | | 800,000 | |
| Banco del Estado de Chile, 0.28%, 3/5/2015 | | | 1,000,000 | | | | 1,000,000 | |
| Bedford Row Funding Corp., 144A, 0.247%, 6/24/2015 | | | 1,250,000 | | | | 1,250,000 | |
| BNZ International Funding Ltd.: | |
| 144A, 0.251%, 1/20/2015 | | | 1,250,000 | | | | 1,250,000 | |
| 144A, 0.252%, 2/2/2015 | | | 1,000,000 | | | | 1,000,000 | |
| Caisse Centrale Desjardins, 144A, 0.234%, 1/26/2015 | | | 800,000 | | | | 799,995 | |
| Canadian Imperial Bank of Commerce, 0.232%, 5/8/2015 | | | 500,000 | | | | 500,000 | |
| Kells Funding LLC: | |
| 144A, 0.238%, 1/27/2015 | | | 1,250,000 | | | | 1,249,995 | |
| 144A, 0.243%, 2/13/2015 | | | 2,000,000 | | | | 2,000,021 | |
| Rabobank Nederland NV, 0.355%, 10/1/2015 | | | 500,000 | | | | 500,195 | |
| Royal Bank of Canada: | |
| 0.248%, 9/3/2015 | | | 2,000,000 | | | | 1,999,872 | |
| 0.272%, 12/10/2015 | | | 1,500,000 | | | | 1,500,000 | |
| | | Principal Amount ($) | | | Value ($) | |
| | | | | | | | | |
| Wells Fargo Bank NA: | |
| 0.31%, 9/9/2015 | | | 1,000,000 | | | | 1,000,000 | |
| 0.31%, 12/10/2015 | | | 1,000,000 | | | | 1,000,000 | |
| Westpac Banking Corp., 144A, 0.234%, 2/19/2015 | | | 1,250,000 | | | | 1,250,001 | |
| | | | | 19,650,079 | |
Total Commercial Paper (Cost $89,668,395) | | | | 89,668,395 | |
| | |
| Short-Term Notes* 5.8% | |
| Bank of Nova Scotia, 0.347%, 1/22/2016 | | | 1,000,000 | | | | 1,000,000 | |
| Canadian Imperial Bank of Commerce, 0.37%, 8/18/2015 | | | 1,800,000 | | | | 1,800,000 | |
| Commonwealth Bank of Australia, 144A, 0.239%, 7/10/2015 | | | 1,200,000 | | | | 1,200,000 | |
| JPMorgan Chase Bank NA, 0.352%, 1/22/2016 | | | 1,000,000 | | | | 1,000,000 | |
| Rabobank Nederland NV, 0.281%, 7/6/2015 | | | 1,500,000 | | | | 1,500,000 | |
| Svenska Handelsbanken AB, 144A, 0.353%, 10/2/2015 | | | 1,500,000 | | | | 1,500,000 | |
| Wal-Mart Stores, Inc., 5.319%, 6/1/2015 | | | 500,000 | | | | 510,604 | |
| Wells Fargo Bank NA, 0.26%, 6/16/2015 | | | 1,000,000 | | | | 1,000,000 | |
| Westpac Banking Corp., 0.238%, 5/11/2015 | | | 800,000 | | | | 800,000 | |
Total Short-Term Notes (Cost $10,310,604) | | | | 10,310,604 | |
| | |
| Time Deposit 3.9% | |
| Credit Agricole Corporate & Investment Bank, 0.05%, 1/2/2015 (Cost $6,961,743) | | | 6,961,743 | | | | 6,961,743 | |
| | |
| Government & Agency Obligations 5.1% | |
| U.S. Government Sponsored Agencies 4.1% | |
| Federal Home Loan Bank: | |
| 0.19%, 9/3/2015 | | | 500,000 | | | | 499,941 | |
| 0.2%, 9/17/2015 | | | 325,000 | | | | 324,958 | |
| 0.21%, 10/13/2015 | | | 500,000 | | | | 499,890 | |
| 0.25%, 10/2/2015 | | | 500,000 | | | | 500,000 | |
| 0.263%, 10/9/2015 | | | 575,000 | | | | 575,000 | |
| Federal Home Loan Mortgage Corp.: | |
| 0.095%**, 4/16/2015 | | | 1,700,000 | | | | 1,699,529 | |
| 0.12%**, 6/1/2015 | | | 750,000 | | | | 749,623 | |
| Federal National Mortgage Association: | |
| 0.08%**, 5/1/2015 | | | 1,000,000 | | | | 999,733 | |
| 0.121%*, 10/21/2016 | | | 1,300,000 | | | | 1,299,873 | |
| | | | | 7,148,547 | |
| | | Principal Amount ($) | | | Value ($) | |
| | | | | | | | | |
| U.S. Treasury Obligations 1.0% | |
| U.S. Treasury Bill, 0.04%**, 3/19/2015 | | | 1,500,000 | | | | 1,499,872 | |
| U.S. Treasury Note, 0.375%, 3/15/2015 | | | 300,000 | | | | 300,197 | |
| | | | | 1,800,069 | |
Total Government & Agency Obligations (Cost $8,948,616) | | | | 8,948,616 | |
| | |
| Municipal Bonds and Notes 0.6% | |
| New York, State Housing Finance Agency Revenue, 605 West 42nd Street, Series B, 144A, 0.35%***, 5/1/2048, LOC: Bank of China (Cost $1,000,000) | | | 1,000,000 | | | | 1,000,000 | |
| | |
| Repurchase Agreements 18.8% | |
| BNP Paribas, 0.05%, dated 12/31/2014, to be repurchased at $14,000,039 on 1/2/2015 (b) | | | 14,000,000 | | | | 14,000,000 | |
| BNP Paribas, 0.2%, dated 12/23/2013, to be repurchased at $1,503,400 on 2/4/2015 (a) (c) | | | 1,500,000 | | | | 1,500,000 | |
| JPMorgan Securities, Inc., 0.382%, dated 2/13/2014, to be repurchased at $1,254,723 on 2/4/2015 (a) (d) | | | 1,250,000 | | | | 1,250,000 | |
| JPMorgan Securities, Inc., 0.413%, dated 7/3/2014, to be repurchased at $2,507,794 on 4/1/2015 (a) (e) | | | 2,500,000 | | | | 2,500,000 | |
| Wells Fargo Bank, 0.08%, dated 12/31/2014, to be repurchased at $13,000,58 on 1/2/2015 (f) | | | 13,000,000 | | | | 13,000,000 | |
| Wells Fargo Bank, 0.4%, dated 11/4/2014, to be repurchased at $1,001,000 on 2/2/2015 (g) | | | 1,000,000 | | | | 1,000,000 | |
Total Repurchase Agreements (Cost $33,250,000) | | | | 33,250,000 | |
| | | % of Net Assets | | | Value ($) | |
| | | | |
Total Investment Portfolio (Cost $166,989,363)† | | | 94.3 | | | | 166,989,363 | |
| Other Assets and Liabilities, Net | | | 5.7 | | | | 10,057,287 | |
| Net Assets | | | 100.0 | | | | 177,046,650 | |
* Floating rate securities' yields vary with a designated market index or market rate, such as the coupon-equivalent of the U.S. Treasury Bill rate. These securities are shown at their current rate as of December 31, 2014.
** Annualized yield at time of purchase; not a coupon rate.
*** Variable rate demand notes are securities whose interest rates are reset periodically at market levels. These securities are payable on demand and are shown at their current rates as of December 31, 2014.
† The cost for federal income tax purposes was $166,989,363.
(a) Open maturity repurchase agreement whose interest rate resets periodically and is shown at the current rate as of December 31, 2014. The dated date is the original day the repurchase agreement was entered into, the maturity date represents the next repurchase date. Upon notice, both the Fund and counterparty have the right to terminate the repurchase agreement at any time.
(b) Collateralized by:
| Principal Amount ($) | | Security | | Rate (%) | | Maturity Date | | Collateral Value ($) | |
| | 3,920,000 | | Federal Home Loan Bank | | | 4.0 | | 4/11/2029 | | | 4,116,031 | |
| | 10,205,800 | | U.S. Treasury Note | | | 0.25 | | 2/29/2016 | | | 10,208,607 | |
| Total Collateral Value | | | | | | | | 14,324,638 | |
(c) Collateralized by:
| Principal Amount ($) | | Security | | Rate (%) | | Maturity Date | | Collateral Value ($) | |
| | 8,196 | | BNP Paribas SA | | | 1.375 | | 3/17/2017 | | | 8,235 | |
| | 1,362,015 | | Petroleos Mexicanos | | | 6.5 | | 6/2/2041 | | | 1,573,771 | |
| Total Collateral Value | | | | | | | | 1,582,006 | |
(d) Collateralized by:
| Principal Amount ($) | | Security | | Rate (%) | | Maturity Date | | Collateral Value ($) | |
| | 200,000 | | AmeriCredit Automobile Receivables Trust | | | 2.15 | | 3/9/2020 | | | 199,998 | |
| | 1,110,000 | | Chase Issuance Trust | | | 0.411 | | 4/15/2019 | | | 1,103,146 | |
| Total Collateral Value | | | | | | | | 1,303,144 | |
(e) Collateralized by $2,620,000 Chase Issuance Trust, 0.411%, maturing on 4/15/2019 with a value of $2,603,822.
(f) Collateralized by:
| Principal Amount ($) | | Security | | Rate (%) | | Maturity Date | | Collateral Value ($) | |
| | 2,401,000 | | Federal Home Loan Mortgage Corp. | | | 3.0 | | 3/15/2043 | | | 2,369,365 | |
| | 10,570,324 | | Federal National Mortgage Association | | | 2.473 | | 5/1/2042 | | | 10,918,422 | |
| Total Collateral Value | | | | | | | | 13,287,787 | |
(g) Collateralized by $730,595 Wells Fargo Bank NA, 6.6%, maturing on 1/15/2038 with a value of $1,054,940.
144A: Security exempt from registration under Rule 144A of the Securities Act of 1933. These securities may be resold in transactions exempt from registration, normally to qualified institutional buyers.
Fair Value Measurements
Various inputs are used in determining the value of the Fund's investments. These inputs are summarized in three broad levels. Level 1 includes quoted prices in active markets for identical securities. Level 2 includes other significant observable inputs (including quoted prices for similar securities, interest rates, prepayment speeds and credit risk). Level 3 includes significant unobservable inputs (including the Fund's own assumptions in determining the fair value of investments). The level assigned to the securities valuations may not be an indication of the risk or liquidity associated with investing in those securities. Securities held by the Fund are reflected as Level 2 because the securities are valued at amortized cost (which approximates fair value) and, accordingly, the inputs used to determine value are not quoted prices in an active market.
The following is a summary of the inputs used as of December 31, 2014 in valuing the Fund's investments. For information on the Fund's policy regarding the valuation of investments, please refer to the Security Valuation section of Note A in the accompanying Notes to Financial Statements.
| Assets | | Level 1 | | | Level 2 | | | Level 3 | | | Total | |
| | |
| Investments in Securities (h) | | $ | — | | | $ | 133,739,363 | | | $ | — | | | $ | 133,739,363 | |
| Repurchase Agreements | | | — | | | | 33,250,000 | | | | — | | | | 33,250,000 | |
| Total | | $ | — | | | $ | 166,989,363 | | | $ | — | | | $ | 166,989,363 | |
(h) See Investment Portfolio for additional detailed categorizations.
The accompanying notes are an integral part of the financial statements.
Statement of Assets and Liabilities | as of December 31, 2014 | |
| Assets | |
| Investments in non-affiliated securities, valued at amortized cost | | $ | 133,739,363 | |
| Repurchase agreements, valued at amortized cost | | | 33,250,000 | |
| Total investments, valued at amortized cost | | | 166,989,363 | |
| Cash | | | 9,982,131 | |
| Receivable for Fund shares sold | | | 182,389 | |
| Interest receivable | | | 42,317 | |
| Other assets | | | 3,230 | |
| Total assets | | | 177,199,430 | |
| Liabilities | |
| Payable for Fund shares redeemed | | | 32,628 | |
| Distributions payable | | | 805 | |
| Accrued Trustees' fees | | | 3,046 | |
| Other accrued expenses and payables | | | 116,301 | |
| Total liabilities | | | 152,780 | |
| Net assets, at value | | $ | 177,046,650 | |
| Net Assets Consist of | |
| Undistributed net investment income | | | 793 | |
| Paid-in capital | | | 177,045,857 | |
| Net assets, at value | | $ | 177,046,650 | |
Class A Net Asset Value, offering and redemption price per share ($177,046,650 ÷ 177,129,573 outstanding shares of beneficial interest, no par value, unlimited number of shares authorized) | | $ | 1.00 | |
The accompanying notes are an integral part of the financial statements.
Statement of Operations
| for the year ended December 31, 2014 | |
| Investment Income | |
Income: Interest | | $ | 328,849 | |
Expenses: Management fee | | | 485,263 | |
| Administration fee | | | 170,268 | |
| Services to shareholders | | | 2,257 | |
| Custodian fee | | | 31,111 | |
| Professional fees | | | 53,557 | |
| Reports to shareholders | | | 79,162 | |
| Trustees' fee and expenses | | | 9,721 | |
| Other | | | 8,257 | |
| Total expenses before expense reductions | | | 839,596 | |
| Expense reductions | | | (527,782 | ) |
| Total expenses after expense reductions | | | 311,814 | |
| Net investment income | | | 17,035 | |
| Net realized gain (loss) | | | 81 | |
| Net increase (decrease) in net assets resulting from operations | | $ | 17,116 | |
The accompanying notes are an integral part of the financial statements.
Statement of Changes in Net Assets | | | Years Ended December 31, | |
| Increase (Decrease) in Net Assets | | 2014 | | | 2013 | |
Operations: Net investment income | | $ | 17,035 | | | $ | 18,768 | |
| Net realized gain (loss) | | | 81 | | | | 509 | |
| Net increase (decrease) in net assets resulting from operations | | | 17,116 | | | | 19,277 | |
Distributions to shareholders from: Net investment income Class A | | | (17,036 | ) | | | (18,768 | ) |
Fund share transactions: Class A Proceeds from shares sold | | | 130,299,481 | | | | 93,469,677 | |
| Reinvestment of distributions | | | 16,947 | | | | 18,849 | |
| Cost of shares redeemed | | | (126,949,638 | ) | | | (115,953,059 | ) |
| Net increase (decrease) in net assets from Class A share transactions | | | 3,366,790 | | | | (22,464,533 | ) |
| Increase (decrease) in net assets | | | 3,366,870 | | | | (22,464,024 | ) |
| Net assets at beginning of period | | | 173,679,780 | | | | 196,143,804 | |
| Net assets at end of period (including undistributed net investment income of $793 and $712, respectively) | | $ | 177,046,650 | | | $ | 173,679,780 | |
| Other Information | |
Class A Shares outstanding at beginning of period | | | 173,762,783 | | | | 196,227,316 | |
| Shares sold | | | 130,299,481 | | | | 93,469,677 | |
| Shares issued to shareholders in reinvestment of distributions | | | 16,947 | | | | 18,849 | |
| Shares redeemed | | | (126,949,638 | ) | | | (115,953,059 | ) |
| Net increase (decrease) in Class A shares | | | 3,366,790 | | | | (22,464,533 | ) |
| Shares outstanding at end of period | | | 177,129,573 | | | | 173,762,783 | |
The accompanying notes are an integral part of the financial statements.
| | | Years Ended December 31, | |
| Class A | | | 2014 | | | 2013 | | | 2012 | | | 2011 | | | 2010 | |
| Selected Per Share Data | |
| Net asset value, beginning of period | | $ | 1.00 | | | $ | 1.00 | | | $ | 1.00 | | | $ | 1.00 | | | $ | 1.00 | |
Income from investment operations: Net investment income | | | .000 | * | | | .000 | * | | | .000 | * | | | .000 | * | | | .000 | * |
| Net realized gain (loss) | | | .000 | * | | | .000 | * | | | .000 | * | | | .000 | * | | | .000 | * |
| Total from investment operations | | | .000 | * | | | .000 | * | | | .000 | * | | | .000 | * | | | .000 | * |
Less distributions from: Net investment income | | | (.000 | )* | | | (.000 | )* | | | (.000 | )* | | | (.000 | )* | | | (.000 | )* |
| Net asset value, end of period | | $ | 1.00 | | | $ | 1.00 | | | $ | 1.00 | | | $ | 1.00 | | | $ | 1.00 | |
Total Return (%)a | | | .01 | | | | .01 | | | | .01 | | | | .01 | | | | .01 | |
| Ratios to Average Net Assets and Supplemental Data | |
| Net assets, end of period ($ millions) | | | 177 | | | | 174 | | | | 196 | | | | 217 | | | | 220 | |
| Ratio of expenses before expense reductions (%) | | | .49 | | | | .49 | | | | .45 | | | | .51 | | | | .46 | |
| Ratio of expenses after expense reductions (%) | | | .18 | | | | .20 | | | | .31 | | | | .25 | | | | .34 | |
| Ratio of net investment income (%) | | | .01 | | | | .01 | | | | .01 | | | | .01 | | | | .01 | |
a Total return would have been lower had certain expenses not been reduced. * Amount is less than $.0005. | |
Notes to Financial Statements
A. Organization and Significant Accounting Policies
Deutsche Money Market VIP (formerly DWS Money Market VIP) (the "Fund") is a diversified series of Deutsche Variable Series II (formerly DWS Variable Series II) (the "Trust"), which is registered under the Investment Company Act of 1940, as amended (the "1940 Act"), as an open-end management investment company organized as a Massachusetts business trust.
The Fund's financial statements are prepared in accordance with accounting principles generally accepted in the United States of America which require the use of management estimates. Actual results could differ from those estimates. The policies described below are followed consistently by the Fund in the preparation of its financial statements.
Security Valuation. Various inputs are used in determining the value of the Fund's investments. These inputs are summarized in three broad levels. Level 1 includes quoted prices in active markets for identical securities. Level 2 includes other significant observable inputs (including quoted prices for similar securities, interest rates, prepayment speeds and credit risk). Level 3 includes significant unobservable inputs (including the Fund's own assumptions in determining the fair value of investments). The level assigned to the securities valuations may not be an indication of the risk or liquidity associated with investing in those securities.
The Fund values all securities utilizing the amortized cost method permitted in accordance with Rule 2a-7 under the 1940 Act and certain conditions therein. Under this method, which does not take into account unrealized capital gains or losses on securities, an instrument is initially valued at its cost and thereafter assumes a constant accretion/amortization rate to maturity of any discount or premium. Securities held by the Fund are reflected as Level 2 because the securities are valued at amortized cost (which approximates fair value) and, accordingly, the inputs used to determine value are not quoted prices in an active market.
Disclosure about the classification of fair value measurements is included in a table following the Fund's Investment Portfolio.
Repurchase Agreements. The Fund may enter into repurchase agreements, under the terms of a Master Repurchase Agreement, with certain banks and broker/dealers whereby the Fund, through its custodian or a sub-custodian bank, receives delivery of the underlying securities, the amount of which at the time of purchase and each subsequent business day is required to be maintained at such a level that the value is equal to at least the principal amount of the repurchase price plus accrued interest. The custodian bank or another designated sub-custodian holds the collateral in a separate account until the agreement matures. If the value of the securities falls below the principal amount of the repurchase agreement plus accrued interest, the financial institution deposits additional collateral by the following business day. If the financial institution either fails to deposit the required additional collateral or fails to repurchase the securities as agreed, the Fund has the right to sell the securities and recover any resulting loss from the financial institution. If the financial institution enters into bankruptcy, the Fund's claim on the collateral may be subject to legal proceedings.
As of December 31, 2014, the Fund held repurchase agreements with a gross value of $33,250,000. The value of the related collateral exceeded the value of the repurchase agreements at period end. The detail of the related collateral is included in the footnotes following the Fund's Investment Portfolio.
Federal Income Taxes. The Fund's policy is to comply with the requirements of the Internal Revenue Code, as amended, which are applicable to regulated investment companies and to distribute all of its taxable income to its shareholders.
The Fund has reviewed the tax positions for the open tax years as of December 31, 2014 and has determined that no provision for income tax and/or uncertain tax provisions is required in the Fund's financial statements. The Fund's federal tax returns for the prior three fiscal years remain open subject to examination by the Internal Revenue Service.
Distribution of Income and Gains. Net investment income of the Fund is declared as a daily dividend and is distributed to shareholders monthly. The Fund may take into account capital gains and losses in its daily dividend declarations. The Fund may also make additional distributions for tax purposes if necessary.
Permanent book and tax differences relating to shareholder distributions will result in reclassifications to paid-in capital. Temporary book and tax differences will reverse in a subsequent period. There were no significant book to tax differences for the Fund.
At December 31, 2014, the Fund's components of distributable earnings on a tax basis were as follows:
| Undistributed ordinary income* | | $ | 793 | |
In addition, the tax character of distributions paid by the Fund is summarized as follows:
| | | Years Ended December 31, | |
| | | 2014 | | | 2013 | |
| Distributions from ordinary income* | | $ | 17,036 | | | $ | 18,768 | |
* For tax purposes, short-term capital gain distributions are considered ordinary income distributions.
Expenses. Expenses of the Trust arising in connection with a specific fund are allocated to that fund. Other Trust expenses which cannot be directly attributed to a fund are apportioned among the funds in the Trust based upon the relative net assets or other appropriate measures.
Contingencies. In the normal course of business, the Fund may enter into contracts with service providers that contain general indemnification clauses. The Fund's maximum exposure under these arrangements is unknown as this would involve future claims that may be made against the Fund that have not yet been made. However, based on experience, the Fund expects the risk of loss to be remote.
Other. Investment transactions are accounted for on a trade date. Interest income is recorded on the accrual basis. Realized gains and losses from investment transactions are recorded on an identified cost basis. All discounts and premiums are accreted/amortized for both tax and financial reporting purposes.
B. Related Parties
Management Agreement. Under the Investment Management Agreement with Deutsche Investment Management Americas Inc. ("DIMA" or the "Advisor"), an indirect, wholly owned subsidiary of Deutsche Bank AG, the Advisor directs the investments of the Fund in accordance with its investment objectives, policies and restrictions. The Advisor determines the securities, instruments and other contracts relating to investments to be purchased, sold or entered into by the Fund.
Pursuant to the Investment Management Agreement with the Advisor, the Fund pays a monthly management fee based on the Fund's average daily net assets, computed and accrued daily and payable monthly, at the following annual rates:
| First $500 million | | | .285 | % |
| Next $500 million | | | .270 | % |
| Next $1.0 billion | | | .255 | % |
| Over $2.0 billion | | | .240 | % |
For the period from January 1, 2014 through September 30, 2015, the Advisor has contractually agreed to waive its fee and/or reimburse certain operating expenses to the extent necessary to maintain the total annual operating expenses (excluding certain expenses such as extraordinary expenses, taxes, brokerage and interest expense) at 0.51%.
In addition, the Advisor has agreed to voluntarily waive additional expenses. The waiver may be changed or terminated at any time without notice. Under this arrangement, the Advisor waived certain expenses of the Fund.
Accordingly, for the year ended December 31, 2014, the fee pursuant to the Investment Management Agreement aggregated $485,263, all of which was waived, resulting in an annual effective rate of 0.00% of the Fund's average daily net assets.
Administration Fee. Pursuant to an Administrative Services Agreement, DIMA provides most administrative services to the Fund. For all services provided under the Administrative Services Agreement, the Fund pays DIMA an annual fee ("Administration Fee") of 0.10% of the Fund's average daily net assets, computed and accrued daily and payable monthly. For the year ended December 31, 2014, the Administration Fee was $170,268, of which $41,842 was waived and $10,651 is unpaid.
Service Provider Fees. DeAWM Service Company ("DSC"), an affiliate of the Advisor, is the transfer agent, dividend-paying agent and shareholder service agent for the Fund. Pursuant to a sub-transfer agency agreement between DSC and DST Systems, Inc. ("DST"), DSC has delegated certain transfer agent, dividend-paying agent and shareholder service agent functions to DST. DSC compensates DST out of the shareholder servicing fee it receives from the Fund. For the year ended December 31, 2014, the amounts charged to the Fund by DSC aggregated $677, all of which was waived.
Typesetting and Filing Service Fees. Under an agreement with DIMA, DIMA is compensated for providing typesetting and certain regulatory filing services to the Fund. For the year ended December 31, 2014, the amount charged to the Fund by DIMA included in the Statement of Operations under "Reports to shareholders" aggregated $9,613, of which $4,727 is unpaid.
Trustees' Fees and Expenses. The Fund paid retainer fees to each Trustee not affiliated with the Advisor, plus specified amounts to the Board Chairperson and Vice Chairperson and to each committee Chairperson.
C. Ownership of the Fund
At December 31, 2014, four participating insurance companies were owners of record of 10% or more of the total outstanding Class A shares of the Fund, each owning 31%, 22%, 12% and 11%.
D. Line of Credit
The Fund and other affiliated funds (the "Participants") share in a $400 million revolving credit facility provided by a syndication of banks. The Fund may borrow for temporary or emergency purposes, including the meeting of redemption requests that otherwise might require the untimely disposition of securities. The Participants are charged an annual commitment fee which is allocated based on net assets, among each of the Participants. Interest is calculated at a rate per annum equal to the sum of the Federal Funds Rate, plus 1.25 percent plus if LIBOR exceeds the Federal Funds Rate, the amount of such excess. The Fund may borrow up to a maximum of 33 percent of its net assets under the agreement: The Fund had no outstanding loans at December 31, 2014.
E. Money Market Fund Reform
In July 2014, the SEC adopted money market fund reform intended to address potential systemic risks associated with money market funds and to improve transparency for money market fund investors. The Fund is required to comply with money market reforms by the specified compliance dates. As a result, the Fund may be required to take certain steps that will impact its structure and/or operations, which could impact the return potential of the Fund.
Report of Independent Registered Public Accounting Firm
To the Board of Trustees of Deutsche Variable Series II and the Shareholders of Deutsche Money Market VIP:
We have audited the accompanying statement of assets and liabilities, including the investment portfolio, of Deutsche Money Market VIP (formerly DWS Money Market VIP) (the "Fund") (one of the series constituting Deutsche Variable Series II (formerly DWS Variable Series II)), as of December 31, 2014, and the related statement of operations for the year then ended, the statements of changes in net assets for each of the two years in the period then ended, and the financial highlights for each of the periods indicated therein. These financial statements and financial highlights are the responsibility of the Fund’s management. Our responsibility is to express an opinion on these financial statements and financial highlights based on our audits.
We conducted our audits in accordance with the standards of the Public Company Accounting Oversight Board (United States). Those standards require that we plan and perform the audit to obtain reasonable assurance about whether the financial statements and financial highlights are free of material misstatement. We were not engaged to perform an audit of the Fund’s internal control over financial reporting. Our audits included consideration of internal control over financial reporting as a basis for designing audit procedures that are appropriate in the circumstances, but not for the purpose of expressing an opinion on the effectiveness of the Fund’s internal control over financial reporting. Accordingly, we express no such opinion. An audit also includes examining, on a test basis, evidence supporting the amounts and disclosures in the financial statements and financial highlights, assessing the accounting principles used and significant estimates made by management, and evaluating the overall financial statement presentation. Our procedures included confirmation of securities owned as of December 31, 2014, by correspondence with the custodian and brokers. We believe that our audits provide a reasonable basis for our opinion.
In our opinion, the financial statements and financial highlights referred to above present fairly, in all material respects, the financial position of Deutsche Money Market VIP at December 31, 2014, the results of its operations for the year then ended, the changes in its net assets for each of the two years in the period then ended, and the financial highlights for each of the periods indicated therein, in conformity with U.S. generally accepted accounting principles.
| | | |
Boston, Massachusetts February 13, 2015 | | |
Information About Your Fund's Expenses (Unaudited)
As an investor of the Fund, you incur two types of costs: ongoing expenses and transaction costs. Ongoing expenses include management fees and other Fund expenses. Examples of transaction costs include contract charges, which are not shown in this section. The following tables are intended to help you understand your ongoing expenses (in dollars) of investing in the Fund and to help you compare these expenses with the ongoing expenses of investing in other mutual funds. In the most recent six-month period the Fund limited these expenses; had it not done so, expenses would have been higher. The example in the table is based on an investment of $1,000 invested at the beginning of the six-month period and held for the entire period (July 1, 2014 to December 31, 2014).
The tables illustrate your Fund's expenses in two ways:
—Actual Fund Return. This helps you estimate the actual dollar amount of ongoing expenses (but not transaction costs) paid on a $1,000 investment in the Fund using the Fund's actual return during the period. To estimate the expenses you paid over the period, simply divide your account value by $1,000 (for example, an $8,600 account value divided by $1,000 = 8.6), then multiply the result by the number in the "Expenses Paid per $1,000" line under the share class you hold.
—Hypothetical 5% Fund Return. This helps you to compare your Fund's ongoing expenses (but not transaction costs) with those of other mutual funds using the Fund's actual expense ratio and a hypothetical rate of return of 5% per year before expenses. Examples using a 5% hypothetical Fund return may be found in the shareholder reports of other mutual funds. The hypothetical account values and expenses may not be used to estimate the actual ending account balance or expenses you paid for the period.
Please note that the expenses shown in these tables are meant to highlight your ongoing expenses only and do not reflect any transaction costs. The "Expenses Paid per $1,000" line of the tables is useful in comparing ongoing expenses only and will not help you determine the relative total expense of owning different funds. If these transaction costs had been included, your costs would have been higher.
Expenses and Value of a $1,000 Investment for the six months ended December 31, 2014 | |
| Actual Fund Return | | Class A | |
| Beginning Account Value 7/1/14 | | $ | 1,000.00 | |
| Ending Account Value 12/31/14 | | $ | 1,000.05 | |
| Expenses Paid per $1,000* | | $ | .91 | |
| Hypothetical 5% Fund Return | | Class A | |
| Beginning Account Value 7/1/14 | | $ | 1,000.00 | |
| Ending Account Value 12/31/14 | | $ | 1,024.30 | |
| Expenses Paid per $1,000* | | $ | .92 | |
* Expenses are equal to the Fund's annualized expense ratio, multiplied by the average account value over the period, multiplied by 184 (the number of days in the most recent six-month period), then divided by 365.
| Annualized Expense Ratio | Class A | |
| Deutsche Variable Series II — Deutsche Money Market VIP | .18% | |
For more information, please refer to the Fund's prospectus.
These tables do not reflect charges and fees ("contract charges") associated with the separate account that invests in the Fund or any variable life insurance policy or variable annuity contract for which the Fund is an investment option.
For an analysis of the fees associated with an investment in the fund or similar funds, please refer to the current and hypothetical expense calculators for Variable Insurance Products which can be found at deutschefunds.com/EN/resources/calculators.jsp.
Tax Information (Unaudited)
Please consult a tax advisor if you have questions about federal or state income tax laws, or on how to prepare your tax returns. If you have specific questions about your account, please contact your insurance provider.
Proxy Voting
The Trust's policies and procedures for voting proxies for portfolio securities and information about how the Trust voted proxies related to its portfolio securities during the 12-month period ended June 30 are available on our Web site — deutschefunds.com (click on "proxy voting" at the bottom of the page) — or on the SEC's Web site — sec.gov. To obtain a written copy of the Trust's policies and procedures without charge, upon request, call us toll free at (800) 728-3337.
Advisory Agreement Board Considerations and Fee Evaluation
The Board of Trustees approved the renewal of Deutsche Money Market VIP’s investment management agreement (the "Agreement") with Deutsche Investment Management Americas Inc. ("DIMA") in September 2014.
In terms of the process that the Board followed prior to approving the Agreement, shareholders should know that:
— In September 2014, all of the Fund’s Trustees were independent of DIMA and its affiliates.
— The Trustees met frequently during the past year to discuss fund matters and dedicated a substantial amount of time to contract review matters. Over the course of several months, the Board’s Contract Committee, in coordination with the Board’s Fixed Income and Asset Allocation Oversight Committee, reviewed comprehensive materials received from DIMA, independent third parties and independent counsel. These materials included an analysis of the Fund’s performance, fees and expenses, and profitability compiled by a fee consultant retained by the Fund’s Independent Trustees (the "Fee Consultant"). The Board also received extensive information throughout the year regarding performance of the Fund.
— The Independent Trustees regularly meet privately with counsel to discuss contract review and other matters. In addition, the Independent Trustees were advised by the Fee Consultant in the course of their review of the Fund’s contractual arrangements and considered a comprehensive report prepared by the Fee Consultant in connection with their deliberations.
— In connection with reviewing the Agreement, the Board also reviewed the terms of the Fund’s distribution agreement, administrative services agreement, transfer agency agreement and other material service agreements.
— Based on its evaluation of the information provided, the Contract Committee presented its findings and recommendations to the Board. The Board then reviewed the Contract Committee’s findings and recommendations.
In connection with the contract review process, the Contract Committee and the Board considered the factors discussed below, among others. The Board also considered that DIMA and its predecessors have managed the Fund since its inception, and the Board believes that a long-term relationship with a capable, conscientious advisor is in the best interests of the Fund. The Board considered, generally, that shareholders chose to invest or remain invested in the Fund knowing that DIMA managed the Fund, and that the Agreement was approved by the Fund’s shareholders. DIMA is part of Deutsche Bank AG ("DB"), a major global banking institution that is engaged in a wide range of financial services. The Board believes that there are advantages to being part of a global asset management business that offers a wide range of investing expertise and resources, including hundreds of portfolio managers and analysts with research capabilities in many countries throughout the world.
As part of the contract review process, the Board carefully considered the fees and expenses of each Deutsche fund overseen by the Board in light of the fund’s performance. In many cases, this led to the negotiation and implementation of expense caps. As part of these negotiations, the Board indicated that it would consider relaxing these caps in future years following sustained improvements in performance, among other considerations.
In 2012, DB combined its Asset Management (of which DIMA was a part) and Wealth Management divisions into a new Asset and Wealth Management ("AWM") division. DB has advised the Independent Trustees that the U.S. asset management business is a critical and integral part of DB, and that DB will continue to invest in AWM a significant portion of the savings it has realized by combining its Asset and Wealth Management divisions, including ongoing enhancements to AWM’s investment capabilities. DB also has confirmed its commitment to maintaining strong legal and compliance groups within the AWM division.
While shareholders may focus primarily on fund performance and fees, the Fund’s Board considers these and many other factors, including the quality and integrity of DIMA’s personnel and such other issues as back-office operations, fund valuations, and compliance policies and procedures.
Nature, Quality and Extent of Services. The Board considered the terms of the Agreement, including the scope of advisory services provided under the Agreement. The Board noted that, under the Agreement, DIMA provides portfolio management services to the Fund and that, pursuant to a separate administrative services agreement, DIMA provides administrative services to the Fund. The Board considered the experience and skills of senior management and investment personnel, the resources made available to such personnel, the ability of DIMA to attract and retain high-quality personnel, and the organizational depth and stability of DIMA. The Board reviewed the Fund’s performance over short-term and long-term periods and compared those returns to various agreed-upon performance measures, including a peer universe compiled by the Fee Consultant using information supplied by iMoneyNet, an independent fund data service. The Board also noted that it has put into place a process of identifying "Focus Funds" (e.g., funds performing poorly relative to a peer universe), and receives more frequent reporting and information from DIMA regarding such funds, along with DIMA’s plans to address underperformance. The Board believes this process is an effective manner of identifying and addressing underperforming funds. Based on the information provided by the Fee Consultant, the Board noted that for the one- and three-year periods ended December 31, 2013, the Fund’s gross performance (Class A shares) was in the 2nd quartile of the applicable iMoneyNet universe (the 1st quartile being the best performers and the 4th quartile being the worst performers).
Fees and Expenses. The Board considered the Fund’s investment management fee schedule, operating expenses and total expense ratios, and comparative information provided by Lipper Inc. ("Lipper") and the Fee Consultant regarding investment management fee rates paid to other investment advisors by similar funds (1st quartile being the most favorable and 4th quartile being the least favorable). With respect to management fees paid to other investment advisors by similar funds, the Board noted that the contractual fee rates paid by the Fund, which include a 0.10% fee paid to DIMA under the Fund’s administrative services agreement, were lower than the median (2nd quartile) of the applicable Lipper peer group (based on Lipper data provided as of December 31, 2013). The Board noted that the Fund’s Class A shares total (net) operating expenses were higher than the median (3rd quartile) of the applicable Lipper expense universe (based on Lipper data provided as of December 31, 2013). The Board also considered how the Fund’s total (net) operating expenses compared to the total (net) operating expenses of a more customized peer group selected by Lipper (based on such factors as asset size). The Board noted the expense limitation agreed to by DIMA. The Board also noted the significant voluntary fee waivers implemented by DIMA to ensure the Fund maintained a positive yield. The Board considered the Fund’s management fee rate as compared to fees charged by DIMA to comparable funds and considered differences between the Fund and the comparable funds. The information requested by the Board as part of its review of fees and expenses also included information about institutional accounts and funds offered primarily to European investors ("Deutsche Europe funds") managed by DIMA and its affiliates. The Board noted that DIMA indicated that it does not manage any institutional accounts or Deutsche Europe funds comparable to the Fund.
On the basis of the information provided, the Board concluded that management fees were reasonable and appropriate in light of the nature, quality and extent of services provided by DIMA.
Profitability. The Board reviewed detailed information regarding revenues received by DIMA under the Agreement. The Board considered the estimated costs and pre-tax profits realized by DIMA from advising the Deutsche U.S. mutual funds ("Deutsche Funds"), as well as estimates of the pre-tax profits attributable to managing the Fund in particular. The Board also received information regarding the estimated enterprise-wide profitability of DIMA and its affiliates with respect to all fund services in totality and by fund. The Board and the Fee Consultant reviewed DIMA’s methodology in allocating its costs to the management of the Fund. Based on the information provided, the Board concluded that the pre-tax profits realized by DIMA in connection with the management of the Fund were not unreasonable.
Economies of Scale. The Board considered whether there are economies of scale with respect to the management of the Fund and whether the Fund benefits from any economies of scale. The Board noted that the Fund’s management fee schedule includes fee breakpoints. The Board concluded that the Fund’s fee schedule represents an appropriate sharing between the Fund and DIMA of such economies of scale as may exist in the management of the Fund at current asset levels.
Other Benefits to DIMA and Its Affiliates. The Board also considered the character and amount of other incidental benefits received by DIMA and its affiliates, including any fees received by DIMA for administrative services provided to the Fund and any fees received by an affiliate of DIMA for distribution services. The Board also considered benefits to DIMA related to brokerage and soft-dollar allocations, including allocating brokerage to pay for research generated by parties other than the executing broker dealers, which pertain primarily to funds investing in equity securities, along with the incidental public relations benefits to DIMA related to Deutsche Funds advertising and cross-selling opportunities among DIMA products and services. The Board concluded that management fees were reasonable in light of these fallout benefits.
Compliance. The Board considered the significant attention and resources dedicated by DIMA to documenting and enhancing its compliance processes in recent years. The Board noted in particular (i) the experience and seniority of DIMA’s and the Fund’s chief compliance officer; (ii) the large number of DIMA compliance personnel; and (iii) the substantial commitment of resources by DIMA and its affiliates to compliance matters.
Based on all of the information considered and the conclusions reached, the Board unanimously determined that the continuation of the Agreement is in the best interests of the Fund. In making this determination, the Board did not give particular weight to any single factor identified above. The Board considered these factors over the course of numerous meetings, certain of which were in executive session with only the Independent Trustees and counsel present. It is possible that individual Trustees may have weighed these factors differently in reaching their individual decisions to approve the continuation of the Agreement.
Board Members and Officers
The following table presents certain information regarding the Board Members and Officers of the fund. Each Board Member's year of birth is set forth in parentheses after his or her name. Unless otherwise noted, (i) each Board Member has engaged in the principal occupation(s) noted in the table for at least the most recent five years, although not necessarily in the same capacity; and (ii) the address of each Independent Board Member is c/o Kenneth C. Froewiss, Chairman, Deutsche Mutual Funds, P.O. Box 390601, Cambridge, MA 02139. Except as otherwise noted below, the term of office for each Board Member is until the election and qualification of a successor, or until such Board Member sooner dies, resigns, is removed or as otherwise provided in the governing documents of the fund. Because the fund does not hold an annual meeting of shareholders, each Board Member will hold office for an indeterminate period. The Board Members may also serve in similar capacities with other funds in the fund complex.
| Independent Board Members |
Name, Year of Birth, Position with the Fund and Length of Time Served1 | | Business Experience and Directorships During the Past Five Years | Number of Funds in Deutsche Fund Complex Overseen | Other Directorships Held by Board Member |
Kenneth C. Froewiss (1945) Chairperson since 2013, and Board Member since 2001 | | Adjunct Professor of Finance, NYU Stern School of Business (September 2009–present; Clinical Professor from 1997–September 2009); Member, Finance Committee, Association for Asian Studies (2002–present); Director, Mitsui Sumitomo Insurance Group (US) (2004–present); prior thereto, Managing Director, J.P. Morgan (investment banking firm) (until 1996) | 105 | — |
William McClayton (1944) Vice Chairperson since 2013, and Board Member since 2004 | | Private equity investor (since October 2009); previously, Managing Director, Diamond Management & Technology Consultants, Inc. (global consulting firm) (2001–2009); Directorship: Board of Managers, YMCA of Metropolitan Chicago; formerly: Senior Partner, Arthur Andersen LLP (accounting) (1966–2001); Trustee, Ravinia Festival | 105 | — |
John W. Ballantine (1946) Board Member since 1999 | | Retired; formerly, Executive Vice President and Chief Risk Management Officer, First Chicago NBD Corporation/The First National Bank of Chicago (1996–1998); Executive Vice President and Head of International Banking (1995–1996); former Directorships: Director and former Chairman of the Board, Healthways, Inc.2 (provider of disease and care management services) (2003–2014); Stockwell Capital Investments PLC (private equity); First Oak Brook Bancshares, Inc. and Oak Brook Bank; Prisma Energy International | 105 | Portland General Electric2 (utility company) (2003– present) |
Henry P. Becton, Jr. (1943) Board Member since 1990 | | Vice Chair and former President, WGBH Educational Foundation. Directorships: Public Radio International; Public Radio Exchange (PRX); North Bennett Street School (Boston); former Directorships: Belo Corporation2 (media company); The PBS Foundation; Association of Public Television Stations; Boston Museum of Science; American Public Television; Concord Academy; New England Aquarium; Mass. Corporation for Educational Telecommunications; Committee for Economic Development; Public Broadcasting Service; Connecticut College | 105 | Lead Director, Becton Dickinson and Company2 (medical technology company) |
Dawn-Marie Driscoll (1946) Board Member since 1987 | | Emeritus Executive Fellow, Center for Business Ethics, Bentley University; formerly: President, Driscoll Associates (consulting firm); Partner, Palmer & Dodge (law firm) (1988–1990); Vice President of Corporate Affairs and General Counsel, Filene's (retail) (1978–1988). Directorships: Director of ICI Mutual Insurance Company (since 2007); Advisory Board, Center for Business Ethics, Bentley University; Trustee and former Chairman of the Board, Southwest Florida Community Foundation (charitable organization); former Directorships: Sun Capital Advisers Trust (mutual funds) (2007–2012), Investment Company Institute (audit, executive, nominating committees) and Independent Directors Council (governance, executive committees) | 105 | — |
Keith R. Fox, CFA (1954) Board Member since 1996 | | Managing General Partner, Exeter Capital Partners (a series of private investment funds) (since 1986). Directorships: Progressive International Corporation (kitchen goods importer and distributor); The Kennel Shop (retailer); former Chairman, National Association of Small Business Investment Companies; former Directorships: BoxTop Media Inc. (advertising); Sun Capital Advisers Trust (mutual funds) (2011–2012) | 105 | — |
Paul K. Freeman (1950) Board Member since 1993 | | Consultant, World Bank/Inter-American Development Bank; Chair, Independent Directors Council; Investment Company Institute (executive and nominating committees); formerly, Chairman of Education Committee of Independent Directors Council; Project Leader, International Institute for Applied Systems Analysis (1998–2001); Chief Executive Officer, The Eric Group, Inc. (environmental insurance) (1986–1998); Directorships: Denver Zoo Foundation (December 2012–present); former Directorships: Prisma Energy International | 105 | — |
Richard J. Herring (1946) Board Member since 1990 | | Jacob Safra Professor of International Banking and Professor, Finance Department, The Wharton School, University of Pennsylvania (since July 1972); Co-Director, Wharton Financial Institutions Center; Co-Chair, U.S. Shadow Financial Regulatory Committee; Executive Director, Financial Economists Roundtable; formerly: Vice Dean and Director, Wharton Undergraduate Division (July 1995–June 2000); Director, Lauder Institute of International Management Studies (July 2000–June 2006) | 105 | Director, Aberdeen Singapore and Japan Funds (since 2007); Independent Director of Barclays Bank Delaware (since September 2010) |
Rebecca W. Rimel (1951) Board Member since 1995 | | President and Chief Executive Officer, The Pew Charitable Trusts (charitable organization) (1994 to present); formerly: Executive Vice President, The Glenmede Trust Company (investment trust and wealth management) (1983–2004); Board Member, Investor Education (charitable organization) (2004–2005); Trustee, Executive Committee, Philadelphia Chamber of Commerce (2001–2007); Director, Viasys Health Care2 (January 2007–June 2007); Trustee, Thomas Jefferson Foundation (charitable organization) (1994–2012) | 105 | Director, Becton Dickinson and Company2 (medical technology company) (2012– present); Director, BioTelemetry Inc.2 (health care) (2009– present) |
William N. Searcy, Jr. (1946) Board Member since 1993 | | Private investor since October 2003; formerly: Pension & Savings Trust Officer, Sprint Corporation2 (telecommunications) (November 1989–September 2003); Trustee, Sun Capital Advisers Trust (mutual funds) (1998–2012) | 105 | — |
Jean Gleason Stromberg (1943) Board Member since 1997 | | Retired. Formerly, Consultant (1997–2001); Director, Financial Markets U.S. Government Accountability Office (1996–1997); Partner, Norton Rose Fulbright, L.L.P. (law firm) (1978–1996). Directorships: The William and Flora Hewlett Foundation (charitable organization); former Directorships: Service Source, Inc. (nonprofit), Mutual Fund Directors Forum (2002–2004), American Bar Retirement Association (funding vehicle for retirement plans) (1987–1990 and 1994–1996) | 105 | — |
Robert H. Wadsworth* (1940) Board Member since 1999 | | President, Robert H. Wadsworth & Associates, Inc. (consulting firm) (1983 to present); Director, The Phoenix Boys Choir Association | 105 | — |
Officers4 |
Name, Year of Birth, Position with the Fund and Length of Time Served5 | | Business Experience and Directorships During the Past Five Years |
Brian E. Binder8 (1972) President and Chief Executive Officer, 2013–present | | Managing Director3 and Head of Fund Administration, Deutsche Asset & Wealth Management (2013–present); formerly: Head of Business Management and Consulting at Invesco, Ltd. (2010–2012); Chief Administrative Officer, Van Kampen Funds Inc. (2008–2010); and Chief Administrative Officer, Morgan Stanley Investment Management Americas Distribution (2003–2008) |
John Millette7 (1962) Vice President and Secretary, 1999–present | | Director,3 Deutsche Asset & Wealth Management |
Melinda Morrow6 (1970) Vice President, 2012–present | | Director,3 Deutsche Asset & Wealth Management |
Paul H. Schubert6 (1963) Chief Financial Officer, 2004–present Treasurer, 2005–present | | Managing Director,3 Deutsche Asset & Wealth Management (since July 2004); formerly: Executive Director, Head of Mutual Fund Services and Treasurer for UBS Family of Funds (1998–2004); Vice President and Director of Mutual Fund Finance at UBS Global Asset Management (1994–1998) |
Caroline Pearson7 (1962) Chief Legal Officer, 2010–present | | Managing Director,3 Deutsche Asset & Wealth Management; formerly: Assistant Secretary for DWS family of funds (1997–2010) |
Robert Kloby6 (1962) Chief Compliance Officer, 2006–present | | Managing Director,3 Deutsche Asset & Wealth Management |
Wayne Salit6 (1967) Anti-Money Laundering Compliance Officer, 2014–present | | Director,3 Deutsche Asset & Wealth Management; formerly: Managing Director, AML Compliance Officer at BNY Mellon (2011–2014); and Director, AML Compliance Officer at Deutsche Bank (2004–2011) |
Hepsen Uzcan7 (1974) Assistant Secretary, 2013–present | | Director,3 Deutsche Asset & Wealth Management |
Paul Antosca7 (1957) Assistant Treasurer, 2007–present | | Director,3 Deutsche Asset & Wealth Management |
Jack Clark7 (1967) Assistant Treasurer, 2007–present | | Director,3 Deutsche Asset & Wealth Management |
Diane Kenneally7 (1966) Assistant Treasurer, 2007–present | | Director,3 Deutsche Asset & Wealth Management |
1 The length of time served represents the year in which the Board Member joined the board of one or more Deutsche funds currently overseen by the Board.
2 A publicly held company with securities registered pursuant to Section 12 of the Securities Exchange Act of 1934.
3 Executive title, not a board directorship.
4 As a result of their respective positions held with the Advisor, these individuals are considered "interested persons" of the Advisor within the meaning of the 1940 Act. Interested persons receive no compensation from the fund.
5 The length of time served represents the year in which the officer was first elected in such capacity for one or more Deutsche funds.
6 Address: 60 Wall Street, New York, NY 10005.
7 Address: One Beacon Street, Boston, MA 02108.
8 Address: 222 South Riverside Plaza, Chicago, IL 60606.
* Robert H. Wadsworth retired from the Board effective December 31, 2014.
The fund's Statement of Additional Information ("SAI") includes additional information about the Board Members. The SAI is available, without charge, upon request. If you would like to request a copy of the SAI, you may do so by calling the following toll-free number: (800) 728-3337.
Notes
DeAWM Distributors, Inc.
222 South Riverside Plaza
Chicago, IL 60606
(800) 621-1148
VS2MM-2 (R-025834-4 2/15)
December 31, 2014
Annual Report
Deutsche Variable Series II
(formerly DWS Variable Series II)
Deutsche Small Mid Cap Growth VIP
(formerly DWS Small Mid Cap Growth VIP)
Contents
9 Statement of Assets and Liabilities 9 Statement of Operations 9 Statement of Changes in Net Assets 12 Notes to Financial Statements 16 Report of Independent Registered Public Accounting Firm 17 Information About Your Fund's Expenses 19 Advisory Agreement Board Considerations and Fee Evaluation 21 Board Members and Officers |
This report must be preceded or accompanied by a prospectus. To obtain an additional prospectus or summary prospectus, if available, call (800) 728-3337 or your financial representative. We advise you to consider the Fund's objectives, risks, charges and expenses carefully before investing. The summary prospectus and prospectus contain this and other important information about the Fund. Please read the prospectus carefully before you invest.
Investing in derivatives entails special risks relating to liquidity, leverage and credit that may reduce returns and/or increase volatility. Smaller and medium company stocks tend to be more volatile than large company stocks. The Fund may lend securities to approved institutions. Stocks may decline in value. See the prospectus for details.
Deutsche Asset & Wealth Management represents the asset management and wealth management activities conducted by Deutsche Bank AG or any of its subsidiaries, including the Advisor and DeAWM Distributors, Inc.
NOT FDIC/NCUA INSURED NO BANK GUARANTEE MAY LOSE VALUE NOT A DEPOSIT
NOT INSURED BY ANY FEDERAL GOVERNMENT AGENCY
Performance Summary December 31, 2014 (Unaudited)
Fund performance shown is historical, assumes reinvestment of all dividend and capital gain distributions and does not guarantee future results. Investment return and principal value fluctuate with changing market conditions so that, when redeemed, shares may be worth more or less than their original cost. Current performance may be lower or higher than the performance data quoted. Please contact your participating insurance company for the Fund's most recent month-end performance. Performance doesn't reflect charges and fees ("contract charges") associated with the separate account that invests in the Fund or any variable life insurance policy or variable annuity contract for which the Fund is an investment option. These charges and fees will reduce returns.
The gross expense ratio of the Fund, as stated in the fee table of the prospectus dated May 1, 2014 is 0.72% for Class A shares and may differ from the expense ratio disclosed in the Financial Highlights table in this report.
| Growth of an Assumed $10,000 Investment in Deutsche Small Mid Cap Growth VIP |
| The Russell 2500™ Growth Index is an unmanaged index that measures the performance of the small- to mid-cap growth segment of the U.S. equity universe. It includes those Russell 2500 companies with higher price-to-book ratios and higher forecasted growth values. Index returns do not reflect any fees or expenses and it is not possible to invest directly into an index. |
| |
| Yearly periods ended December 31 | |
| Comparative Results | |
| Deutsche Small Mid Cap Growth VIP | | 1-Year | | | 3-Year | | | 5-Year | | | 10-Year | |
| Class A | Growth of $10,000 | | $ | 10,570 | | | $ | 17,257 | | | $ | 21,465 | | | $ | 18,243 | |
| Average annual total return | | | 5.74 | % | | | 19.95 | % | | | 16.51 | % | | | 6.20 | % |
| Russell 2500 Growth Index | Growth of $10,000 | | $ | 10,705 | | | $ | 17,486 | | | $ | 22,178 | | | $ | 24,481 | |
| Average annual total return | | | 7.05 | % | | | 20.47 | % | | | 17.27 | % | | | 9.37 | % |
The growth of $10,000 is cumulative.
Management Summary December 31, 2014 (Unaudited)
For the 12-month period ended December 31, 2014, the Fund returned 5.74% (Class A shares, unadjusted for contract charges), underperforming the 7.05% return of the Russell 2500™ Growth Index.1
The year 2014 represented a period of moderation for small- and mid-cap stock returns following strong market momentum during 2013. Last January, the impact of severe winter weather on the U.S. economy, along with weakness in emerging markets, gave investors pause. Then, with equities reaching record territory by late February, loftier valuations in small biotechnology and technology stocks sparked a round of profit-taking throughout March, April and May. Renewed strength in payrolls and manufacturing gave stocks support during the summer. At the beginning of September, an environment of Russian/Ukrainian tensions, political uncertainty in Syria and Iraq, the Ebola virus epidemic and worries concerning the rate of global growth weighed on sentiment. Favorable corporate earnings reports and strong U.S. economic data then ignited a robust rally during mid-October. However, OPEC’s decision not to cut its crude oil production sparked a precipitous decline in oil prices as investors worried about the potential destabilization of oil-dependent nations including Russia, Iran and Venezuela.2 Uncertainty regarding Greece’s elections added to market woes. In late December, stocks renewed their rally based on encouraging U.S. economic reports, and equities closed 2014 near all-time highs.
The Fund’s underperformance was derived primarily from unfavorable stock selection in financials, industrials and materials. In contrast, Fund positions in consumer discretionary, consumer staples and health care contributed to returns.3 Overall sector allocation had a negative effect on performance, based on underweights to materials and financials and overweights in information technology and energy.4 An overweight position in health care and an underweight to industrials contributed to performance.
We continue to position the Fund for sustained economic recovery and remain focused on our bottom-up stock selection process. We maintain a long-term perspective, investing in quality small- and mid-cap growth stocks that trade at attractive valuations and which are well positioned to benefit from a strong merger and acquisition cycle.
Joseph Axtell, CFA
Rafaelina M. Lee
Portfolio Managers
The views expressed reflect those of the portfolio management team only through the end of the period of the report as stated on the cover. The management team's views are subject to change at any time based on market and other conditions and should not be construed as a recommendation. Past performance is no guarantee of future results. Current and future portfolio holdings are subject to risk.
1 The Russell 2500 Growth Index is an unmanaged, capitalization-weighted measure of the performance of the small- and mid-cap growth segment of the U.S. equity universe. It includes Russell 2500™ Index companies with higher price-to-book ratios and higher forecasted growth values. Index returns do not reflect fees or expenses and it is not possible to invest directly in an index.
2 OPEC (Organization of the Petroleum Exporting Countries) is a cartel that aims to manage global oil production, in an effort to maintain oil prices on the world market at levels beneficial to its members.
3 The consumer discretionary sector represents industries that produce goods and services that are not necessities in everyday life. Consumer staples are the industries that manufacture and sell products such as food and beverages, prescription drugs, and household products.
4 "Overweight" means that the Fund holds a higher weighting in a given sector or security than the benchmark. "Underweight" means that the Fund holds a lower weighting.
Portfolio Summary (Unaudited) Asset Allocation (As a % of Investment Portfolio excluding Securities Lending Collateral) | 12/31/14 | 12/31/13 |
| | | |
| Common Stocks | 97% | 97% |
| Cash Equivalents | 2% | 2% |
| Exchange-Traded Fund | 1% | 1% |
| | 100% | 100% |
Sector Diversification (As a % of Common Stocks and Exchange-Traded Fund) | 12/31/14 | 12/31/13 |
| | | |
| Information Technology | 21% | 23% |
| Consumer Discretionary | 21% | 20% |
| Health Care | 20% | 16% |
| Industrials | 18% | 16% |
| Financials | 7% | 10% |
| Consumer Staples | 5% | 5% |
| Materials | 4% | 4% |
| Energy | 3% | 5% |
| Telecommunication Services | 1% | 1% |
| | 100% | 100% |
Portfolio holdings and characteristics are subject to change.
For more complete details about the Fund's investment portfolio, see page 6.
Following the Fund's fiscal first and third quarter-end, a complete portfolio holdings listing is filed with the SEC on Form N-Q. The form will be available on the SEC's Web site at sec.gov, and it also may be reviewed and copied at the SEC's Public Reference Room in Washington, D.C. Information on the operation of the SEC's Public Reference Room may be obtained by calling (800) SEC-0330. The Fund's portfolio holdings are also posted on deutschefunds.com from time to time. Please see the Fund's current prospectus for more information.
Investment Portfolio December 31, 2014 | | | Shares | | | Value ($) | |
| | | | |
| Common Stocks 96.7% | |
| Consumer Discretionary 20.1% | |
| Auto Components 2.9% | |
| American Axle & Manufacturing Holdings, Inc.* | | | 83,558 | | | | 1,887,575 | |
| Gentherm, Inc.* | | | 35,063 | | | | 1,284,007 | |
| Tenneco, Inc.* | | | 32,782 | | | | 1,855,789 | |
| | | | | | | | 5,027,371 | |
| Hotels, Restaurants & Leisure 3.5% | |
| Jack in the Box, Inc. | | | 33,622 | | | | 2,688,415 | |
| Life Time Fitness, Inc.* (a) | | | 26,743 | | | | 1,514,189 | |
| Panera Bread Co. "A"* | | | 10,726 | | | | 1,874,905 | |
| | | | | | | | 6,077,509 | |
| Household Durables 3.1% | |
| iRobot Corp.* (a) | | | 33,069 | | | | 1,148,156 | |
| Jarden Corp.* (a) | | | 59,502 | | | | 2,848,956 | |
| Ryland Group, Inc. | | | 33,224 | | | | 1,281,117 | |
| | | | | | | | 5,278,229 | |
| Leisure Products 1.2% | |
| Polaris Industries, Inc. | | | 13,432 | | | | 2,031,456 | |
| Media 0.9% | |
| Cinemark Holdings, Inc. | | | 40,900 | | | | 1,455,222 | |
| Specialty Retail 6.2% | |
| Advance Auto Parts, Inc. | | | 10,860 | | | | 1,729,781 | |
| DSW, Inc. "A" | | | 26,492 | | | | 988,152 | |
| Outerwall, Inc.* (a) | | | 19,131 | | | | 1,439,034 | |
| Penske Automotive Group, Inc. | | | 30,944 | | | | 1,518,422 | |
| The Children's Place, Inc. | | | 27,136 | | | | 1,546,752 | |
| Ulta Salon, Cosmetics & Fragrance, Inc.* | | | 17,168 | | | | 2,194,757 | |
| Urban Outfitters, Inc.* | | | 37,243 | | | | 1,308,346 | |
| | | | | | | | 10,725,244 | |
| Textiles, Apparel & Luxury Goods 2.3% | |
| Carter's, Inc. | | | 15,730 | | | | 1,373,386 | |
| Hanesbrands, Inc. | | | 22,300 | | | | 2,489,126 | |
| | | | | | | | 3,862,512 | |
| Consumer Staples 4.9% | |
| Food & Staples Retailing 2.2% | |
| Casey's General Stores, Inc. | | | 17,851 | | | | 1,612,302 | |
| Diamond Foods Inc. | | | 4,625 | | | | 130,564 | |
| United Natural Foods, Inc.* | | | 28,232 | | | | 2,183,040 | |
| | | | | | | | 3,925,906 | |
| Food Products 2.1% | |
| Hain Celestial Group, Inc.* | | | 39,440 | | | | 2,298,958 | |
| The WhiteWave Foods Co.* | | | 38,749 | | | | 1,355,827 | |
| | | | | | | | 3,654,785 | |
| Household Products 0.6% | |
| Church & Dwight Co., Inc. | | | 11,622 | | | | 915,930 | |
| Energy 3.0% | |
| Energy Equipment & Services 1.5% | |
| Dril-Quip, Inc.* | | | 12,826 | | | | 984,139 | |
| Oceaneering International, Inc. | | | 17,739 | | | | 1,043,230 | |
| RPC, Inc. | | | 39,647 | | | | 516,997 | |
| | | | | | | | 2,544,366 | |
| | | Shares | | | Value ($) | |
| | | | | | | | | |
| Oil, Gas & Consumable Fuels 1.5% | |
| Diamondback Energy, Inc.* | | | 13,489 | | | | 806,372 | |
| Gulfport Energy Corp.* | | | 19,659 | | | | 820,567 | |
| Western Refining, Inc. | | | 24,105 | | | | 910,687 | |
| | | | | | | | 2,537,626 | |
| Financials 6.6% | |
| Banks 2.2% | |
| Signature Bank* | | | 16,921 | | | | 2,131,369 | |
| Talmer Bancorp., Inc. "A" | | | 112,437 | | | | 1,578,616 | |
| | | | | | | | 3,709,985 | |
| Capital Markets 2.1% | |
| Lazard Ltd. "A" | | | 37,921 | | | | 1,897,187 | |
| Oaktree Capital Group LLC (a) | | | 34,742 | | | | 1,800,678 | |
| | | | | | | | 3,697,865 | |
| Consumer Finance 2.3% | |
| Encore Capital Group, Inc.* | | | 33,531 | | | | 1,488,777 | |
| PRA Group, Inc.* (a) | | | 42,655 | | | | 2,471,004 | |
| | | | | | | | 3,959,781 | |
| Health Care 18.4% | |
| Biotechnology 5.6% | |
| Alkermes PLC* | | | 21,020 | | | | 1,230,931 | |
| Isis Pharmaceuticals, Inc.* | | | 22,855 | | | | 1,411,068 | |
| Orexigen Therapeutics, Inc.* (a) | | | 192,153 | | | | 1,164,447 | |
| Puma Biotechnology, Inc.* | | | 7,982 | | | | 1,510,753 | |
| Retrophin, Inc.* | | | 79,277 | | | | 970,350 | |
| Spectrum Pharmaceuticals, Inc.* | | | 142,448 | | | | 987,165 | |
| Threshold Pharmaceuticals, Inc.* | | | 223,612 | | | | 711,086 | |
| United Therapeutics Corp.* | | | 12,548 | | | | 1,624,841 | |
| | | | | | | | 9,610,641 | |
| Health Care Equipment & Supplies 4.8% | |
| HeartWare International, Inc.* | | | 17,274 | | | | 1,268,430 | |
| SurModics, Inc.* | | | 67,578 | | | | 1,493,474 | |
| Thoratec Corp.* | | | 56,331 | | | | 1,828,504 | |
| Zeltiq Aesthetics, Inc.* | | | 133,044 | | | | 3,713,258 | |
| | | | | | | | 8,303,666 | |
| Health Care Providers & Services 6.3% | |
| Catamaran Corp.* (a) | | | 29,601 | | | | 1,531,852 | |
| Centene Corp.* | | | 31,023 | | | | 3,221,738 | |
| Kindred Healthcare, Inc. (a) | | | 76,047 | | | | 1,382,534 | |
| Molina Healthcare, Inc.* (a) | | | 39,939 | | | | 2,137,935 | |
| Providence Service Corp.* | | | 68,595 | | | | 2,499,602 | |
| | | | | | | | 10,773,661 | |
| Life Sciences Tools & Services 0.7% | |
| PAREXEL International Corp.* | | | 21,889 | | | | 1,216,153 | |
| Pharmaceuticals 1.0% | |
| Pacira Pharmaceuticals, Inc.* | | | 19,940 | | | | 1,767,880 | |
| Industrials 17.3% | |
| Aerospace & Defense 2.1% | |
| DigitalGlobe, Inc.* | | | 37,856 | | | | 1,172,400 | |
| HEICO Corp. | | | 39,298 | | | | 2,373,599 | |
| | | | | | | | 3,545,999 | |
| Airlines 0.6% | |
| JetBlue Airways Corp.* | | | 65,237 | | | | 1,034,659 | |
| Building Products 0.6% | |
| Fortune Brands Home & Security, Inc. | | | 23,791 | | | | 1,077,018 | |
| | | Shares | | | Value ($) | |
| | | | | | | | | |
| Commercial Services & Supplies 0.7% | |
| Team, Inc.* | | | 31,684 | | | | 1,281,935 | |
| Construction & Engineering 0.9% | |
| Primoris Services Corp. | | | 63,365 | | | | 1,472,603 | |
| Electrical Equipment 3.1% | |
| Acuity Brands, Inc. | | | 15,429 | | | | 2,161,140 | |
| AZZ, Inc. | | | 37,161 | | | | 1,743,594 | |
| Thermon Group Holdings, Inc.* | | | 58,925 | | | | 1,425,396 | |
| | | | | | | | 5,330,130 | |
| Machinery 5.2% | |
| Altra Industrial Motion Corp. (a) | | | 44,741 | | | | 1,270,197 | |
| Chart Industries, Inc.* | | | 12,600 | | | | 430,920 | |
| Manitowoc Co., Inc. (a) | | | 77,759 | | | | 1,718,474 | |
| Middleby Corp.* | | | 25,302 | | | | 2,507,428 | |
| Trinity Industries, Inc. | | | 24,999 | | | | 700,222 | |
| WABCO Holdings, Inc.* | | | 22,322 | | | | 2,338,899 | |
| | | | | | | | 8,966,140 | |
| Professional Services 1.4% | |
| On Assignment, Inc.* | | | 24,823 | | | | 823,876 | |
| TriNet Group, Inc.* | | | 50,894 | | | | 1,591,964 | |
| | | | | | | | 2,415,840 | |
| Road & Rail 1.5% | |
| Swift Transportation Co.* | | | 88,044 | | | | 2,520,700 | |
| Trading Companies & Distributors 1.2% | |
| NOW, Inc.* (a) | | | 20,717 | | | | 533,048 | |
| United Rentals, Inc.* | | | 14,857 | | | | 1,515,563 | |
| | | | | | | | 2,048,611 | |
| Information Technology 21.4% | |
| Communications Equipment 2.0% | |
| Aruba Networks, Inc.* | | | 27,383 | | | | 497,823 | |
| Harris Corp. | | | 21,533 | | | | 1,546,500 | |
| Palo Alto Networks, Inc.* | | | 11,922 | | | | 1,461,279 | |
| | | | | | | | 3,505,602 | |
| Electronic Equipment, Instruments & Components 2.5% | |
| Cognex Corp.* | | | 49,012 | | | | 2,025,666 | |
| IPG Photonics Corp.* | | | 30,231 | | | | 2,264,906 | |
| | | | | | | | 4,290,572 | |
| Internet Software & Services 2.2% | |
| Cornerstone OnDemand, Inc.* (a) | | | 29,332 | | | | 1,032,487 | |
| CoStar Group, Inc.* | | | 14,713 | | | | 2,701,748 | |
| | | | | | | | 3,734,235 | |
| IT Services 6.1% | |
| Cardtronics, Inc.* | | | 73,694 | | | | 2,843,114 | |
| MAXIMUS, Inc. | | | 47,859 | | | | 2,624,588 | |
| VeriFone Systems, Inc.* | | | 65,781 | | | | 2,447,053 | |
| Virtusa Corp.* | | | 59,473 | | | | 2,478,240 | |
| | | | | | | | 10,392,995 | |
| | | Shares | | | Value ($) | |
| | | | | | | | | |
| Semiconductors & Semiconductor Equipment 1.3% | |
| Advanced Energy Industries, Inc.* | | | 42,485 | | | | 1,006,895 | |
| Ultra Clean Holdings, Inc.* | | | 125,180 | | | | 1,161,670 | |
| | | | | | | | 2,168,565 | |
| Software 6.0% | |
| Aspen Technology, Inc.* | | | 32,511 | | | | 1,138,535 | |
| PTC, Inc.* | | | 65,897 | | | | 2,415,125 | |
| Splunk, Inc.* | | | 26,410 | | | | 1,556,869 | |
| Tyler Technologies, Inc.* | | | 20,711 | | | | 2,266,612 | |
| Ultimate Software Group, Inc.* | | | 12,959 | | | | 1,902,576 | |
| Varonis Systems, Inc.* (a) | | | 32,508 | | | | 1,067,238 | |
| | | | | | | | 10,346,955 | |
| Technology Hardware, Storage & Peripherals 1.3% | |
| Western Digital Corp. | | | 20,480 | | | | 2,267,136 | |
| Materials 4.0% | |
| Chemicals 2.2% | |
| A. Schulman, Inc. | | | 33,779 | | | | 1,369,063 | |
| Huntsman Corp. | | | 33,241 | | | | 757,230 | |
| Minerals Technologies, Inc. | | | 24,078 | | | | 1,672,217 | |
| | | | | | | | 3,798,510 | |
| Construction Materials 0.7% | |
| Eagle Materials, Inc. | | | 16,544 | | | | 1,257,840 | |
| Metals & Mining 1.1% | |
| Constellium NV "A"* | | | 69,296 | | | | 1,138,533 | |
| Haynes International, Inc. | | | 15,660 | | | | 759,510 | |
| | | | | | | | 1,898,043 | |
| Telecommunication Services 1.0% | |
| Wireless Telecommunication Services | |
| SBA Communications Corp. "A"* | | | 15,663 | | | | 1,734,834 | |
Total Common Stocks (Cost $116,861,637) | | | | 166,164,710 | |
| | |
| Exchange-Traded Fund 1.1% | |
| SPDR S&P Biotech (a) (Cost $1,077,454) | | | 10,001 | | | | 1,866,587 | |
| | |
| Securities Lending Collateral 12.9% | |
| Daily Assets Fund Institutional, 0.10% (b) (c) (Cost $22,207,990) | | | 22,207,990 | | | | 22,207,990 | |
| | |
| Cash Equivalents 1.9% | |
| Central Cash Management Fund, 0.06% (b) (Cost $3,305,009) | | | 3,305,009 | | | | 3,305,009 | |
| | | % of Net Assets | | | Value ($) | |
| | | | |
Total Investment Portfolio (Cost $143,452,090)† | | | 112.6 | | | | 193,544,296 | |
| Other Assets and Liabilities, Net | | | (12.6 | ) | | | (21,657,369 | ) |
| Net Assets | | | 100.0 | | | | 171,886,927 | |
* Non-income producing security.
† The cost for federal income tax purposes was $144,370,735. At December 31, 2014, net unrealized appreciation for all securities based on tax cost was $49,173,561. This consisted of aggregate gross unrealized appreciation for all securities in which there was an excess of value over tax cost of $54,479,079 and aggregate gross unrealized depreciation for all securities in which there was an excess of tax cost over value of $5,305,518.
(a) All or a portion of these securities were on loan. In addition, "Other Assets and Liabilities, Net" may include pending sales that are also on loan. The value of securities loaned at December 31, 2014 amounted to $21,663,550, which is 12.6% of net assets.
(b) Affiliated fund managed by Deutsche Investment Management Americas Inc. The rate shown is the annualized seven-day yield at period end.
(c) Represents collateral held in connection with securities lending. Income earned by the Fund is net of borrower rebates.
S&P: Standard & Poor's
SPDR: Standard & Poor's Depositary Receipt
Fair Value Measurements
Various inputs are used in determining the value of the Fund's investments. These inputs are summarized in three broad levels. Level 1 includes quoted prices in active markets for identical securities. Level 2 includes other significant observable inputs (including quoted prices for similar securities, interest rates, prepayment speeds and credit risk). Level 3 includes significant unobservable inputs (including the Fund's own assumptions in determining the fair value of investments). The level assigned to the securities valuations may not be an indication of the risk or liquidity associated with investing in those securities.
The following is a summary of the inputs used as of December 31, 2014 in valuing the Fund's investments. For information on the Fund's policy regarding the valuation of investments, please refer to the Security Valuation section of Note A in the accompanying Notes to Financial Statements.
| Assets | | Level 1 | | | Level 2 | | | Level 3 | | | Total | |
| | |
| Common Stocks (d) | | $ | 166,164,710 | | | $ | — | | | $ | — | | | $ | 166,164,710 | |
| Exchange-Traded Fund | | | 1,866,587 | | | | — | | | | — | | | | 1,866,587 | |
| Short-Term Investments (d) | | | 25,512,999 | | | | — | | | | — | | | | 25,512,999 | |
| Total | | $ | 193,544,296 | | | $ | — | | | $ | — | | | $ | 193,544,296 | |
There have been no transfers between fair value measurement levels during the year ended December 31, 2014.
(d) See Investment Portfolio for additional detailed categorizations.
The accompanying notes are an integral part of the financial statements.
Statement of Assets and Liabilities | as of December 31, 2014 | |
| Assets | |
Investments: Investments in non-affiliated securities, at value (cost $117,939,091) — including $21,663,550 of securities loaned | | $ | 168,031,297 | |
| Investment in Daily Assets Fund Institutional (cost $22,207,990)* | | | 22,207,990 | |
| Investment in Central Cash Management Fund (cost $3,305,009) | | | 3,305,009 | |
| Total investments in securities, at value (cost $143,452,090) | | | 193,544,296 | |
| Receivable for investments sold | | | 822,011 | |
| Receivable for Fund shares sold | | | 1,085,386 | |
| Dividends receivable | | | 24,748 | |
| Interest receivable | | | 15,763 | |
| Other assets | | | 3,225 | |
| Total assets | | | 195,495,429 | |
| Liabilities | |
| Payable upon return of securities loaned | | | 22,207,990 | |
| Payable for investments purchased | | | 1,125,098 | |
| Payable for Fund shares redeemed | | | 84,557 | |
| Accrued management fee | | | 79,052 | |
| Accrued Trustees' fees | | | 2,842 | |
| Other accrued expenses and payables | | | 108,963 | |
| Total liabilities | | | 23,608,502 | |
| Net assets, at value | | $ | 171,886,927 | |
| Net Assets Consist of | |
| Net unrealized appreciation (depreciation) on investments | | | 50,092,206 | |
| Accumulated net realized gain (loss) | | | 12,557,703 | |
| Paid-in capital | | | 109,237,018 | |
| Net assets, at value | | $ | 171,886,927 | |
Class A Net Asset Value, offering and redemption price per share ($171,886,927 ÷ 7,527,702 outstanding shares of beneficial interest, no par value, unlimited number of shares authorized) | | $ | 22.83 | |
* Represents collateral on securities loaned.
The accompanying notes are an integral part of the financial statements.
Statement of Operations
| for the year ended December 31, 2014 | |
| Investment Income | |
Income: Dividends | | $ | 869,107 | |
| Income distributions — Central Cash Management Fund | | | 2,067 | |
| Securities lending income, including income from Daily Assets Fund Institutional, net of borrower rebates | | | 197,916 | |
| Total income | | | 1,069,090 | |
Expenses: Management fee | | | 957,691 | |
| Administration fee | | | 174,126 | |
| Services to shareholders | | | 1,701 | |
| Custodian fee | | | 12,047 | |
| Professional fees | | | 73,943 | |
| Reports to shareholders | | | 28,277 | |
| Trustees' fees and expenses | | | 9,275 | |
| Other | | | 8,095 | |
| Total expenses | | | 1,265,155 | |
| Net investment income (loss) | | | (196,065 | ) |
| Realized and Unrealized Gain (Loss) | |
| Net realized gain (loss) from investments | | | 20,390,112 | |
| Change in net unrealized appreciation (depreciation) on investments | | | (10,889,918 | ) |
| Net gain (loss) | | | 9,500,194 | |
| Net increase (decrease) in net assets resulting from operations | | $ | 9,304,129 | |
The accompanying notes are an integral part of the financial statements.
Statement of Changes in Net Assets | | | Years Ended December 31, | |
| Increase (Decrease) in Net Assets | | 2014 | | | 2013 | |
Operations: Net investment income (loss) | | $ | (196,065 | ) | | $ | (363,396 | ) |
| Net realized gain (loss) | | | 20,390,112 | | | | 23,261,132 | |
| Change in net unrealized appreciation (depreciation) | | | (10,889,918 | ) | | | 35,857,105 | |
| Net increase (decrease) in net assets resulting from operations | | | 9,304,129 | | | | 58,754,841 | |
Distributions to shareholders from: Net investment income: Class A | | | — | | | | (194,886 | ) |
| Total distributions | | | — | | | | (194,886 | ) |
Fund share transactions: Class A Proceeds from shares sold | | | 5,733,576 | | | | 5,697,979 | |
| Reinvestment of distributions | | | — | | | | 194,886 | |
| Cost of shares redeemed | | | (30,428,185 | ) | | | (22,634,498 | ) |
| Net increase (decrease) in net assets from Class A share transactions | | | (24,694,609 | ) | | | (16,741,633 | ) |
| Increase (decrease) in net assets | | | (15,390,480 | ) | | | 41,818,322 | |
| Net assets at beginning of period | | | 187,277,407 | | | | 145,459,085 | |
| Net assets at end of period | | $ | 171,886,927 | | | $ | 187,277,407 | |
| Other Information | |
Class A Shares outstanding at beginning of period | | | 8,676,171 | | | | 9,604,576 | |
| Shares sold | | | 261,454 | | | | 313,223 | |
| Shares issued to shareholders in reinvestment of distributions | | | — | | | | 11,761 | |
| Shares redeemed | | | (1,409,923 | ) | | | (1,253,389 | ) |
| Net increase (decrease) in Class A shares | | | (1,148,469 | ) | | | (928,405 | ) |
| Shares outstanding at end of period | | | 7,527,702 | | | | 8,676,171 | |
The accompanying notes are an integral part of the financial statements.
| | | Years Ended December 31, | |
| Class A | | | 2014 | | | 2013 | | | 2012 | | | 2011 | | | 2010 | |
| Selected Per Share Data | |
| Net asset value, beginning of period | | $ | 21.59 | | | $ | 15.14 | | | $ | 13.24 | | | $ | 13.85 | | | $ | 10.70 | |
Income (loss) from investment operations: Net investment income (loss)a | | | (.02 | ) | | | (.04 | ) | | | .02 | | | | (.03 | ) | | | (.01 | ) |
| Net realized and unrealized gain (loss) | | | 1.26 | | | | 6.51 | | | | 1.88 | | | | (.50 | ) | | | 3.16 | |
| Total from investment operations | | | 1.24 | | | | 6.47 | | | | 1.90 | | | | (.53 | ) | | | 3.15 | |
Less distributions from: Net investment income | | | — | | | | (.02 | ) | | | — | | | | (.08 | ) | | | — | |
| Net asset value, end of period | | $ | 22.83 | | | $ | 21.59 | | | $ | 15.14 | | | $ | 13.24 | | | $ | 13.85 | |
| Total Return (%) | | | 5.74 | | | | 42.78 | | | | 14.35 | | | | (3.91 | ) | | | 29.44 | |
| Ratios to Average Net Assets and Supplemental Data | |
| Net assets, end of period ($ millions) | | | 172 | | | | 187 | | | | 145 | | | | 147 | | | | 88 | |
| Ratio of expenses (%) | | | .73 | | | | .72 | | | | .74 | | | | .73 | | | | .78 | |
| Ratio of net investment income (loss) (%) | | | (.11 | ) | | | (.22 | ) | | | .11 | | | | (.23 | ) | | | (.12 | ) |
| Portfolio turnover rate (%) | | | 44 | | | | 56 | | | | 57 | | | | 84 | | | | 64 | |
a Based on average shares outstanding during the period. | |
Notes to Financial Statements
A. Organization and Significant Accounting Policies
Deutsche Small Mid Cap Growth VIP (formerly DWS Small Mid Cap Growth VIP) (the "Fund") is a diversified series of Deutsche Variable Series II (formerly DWS Variable Series II) (the "Trust"), which is registered under the Investment Company Act of 1940, as amended (the "1940 Act"), as an open-end management investment company organized as a Massachusetts business trust.
The Fund's financial statements are prepared in accordance with accounting principles generally accepted in the United States of America which require the use of management estimates. Actual results could differ from those estimates. The policies described below are followed consistently by the Fund in the preparation of its financial statements.
Security Valuation. Investments are stated at value determined as of the close of regular trading on the New York Stock Exchange on each day the exchange is open for trading.
Various inputs are used in determining the value of the Fund's investments. These inputs are summarized in three broad levels. Level 1 includes quoted prices in active markets for identical securities. Level 2 includes other significant observable inputs (including quoted prices for similar securities, interest rates, prepayment speeds and credit risk). Level 3 includes significant unobservable inputs (including the Fund's own assumptions in determining the fair value of investments). The level assigned to the securities valuations may not be an indication of the risk or liquidity associated with investing in those securities.
Equity securities and exchange-traded funds ("ETFs") are valued at the most recent sale price or official closing price reported on the exchange (U.S. or foreign) or over-the-counter market on which they trade. Securities or ETFs for which no sales are reported are valued at the calculated mean between the most recent bid and asked quotations on the relevant market or, if a mean cannot be determined, at the most recent bid quotation. Equity and ETF securities are generally categorized as Level 1.
Investments in open-end investment companies are valued at their net asset value each business day and are categorized as Level 1.
Securities and other assets for which market quotations are not readily available or for which the above valuation procedures are deemed not to reflect fair value are valued in a manner that is intended to reflect their fair value as determined in accordance with procedures approved by the Board and are generally categorized as Level 3. In accordance with the Fund's valuation procedures, factors considered in determining value may include, but are not limited to, the type of the security; the size of the holding; the initial cost of the security; the existence of any contractual restrictions on the security's disposition; the price and extent of public trading in similar securities of the issuer or of comparable companies; quotations or evaluated prices from broker-dealers and/or pricing services; information obtained from the issuer, analysts, and/or the appropriate stock exchange (for exchange-traded securities); an analysis of the company's or issuer's financial statements; an evaluation of the forces that influence the issuer and the market(s) in which the security is purchased and sold; and with respect to debt securities, the maturity, coupon, creditworthiness, currency denomination and the movement of the market in which the security is normally traded. The value determined under these procedures may differ from published values for the same securities.
Disclosure about the classification of fair value measurements is included in a table following the Fund's Investment Portfolio.
Securities Lending. Deutsche Bank AG, as lending agent, lends securities of the Fund to certain financial institutions under the terms of the Security Lending Agreement. The Fund retains the benefits of owning the securities it has loaned and continues to receive interest and dividends generated by the securities and to participate in any changes in their market value. The Fund requires the borrowers of the securities to maintain collateral with the Fund consisting of either cash or liquid, unencumbered assets having a value at least equal to the value of the securities loaned. When the collateral falls below specified amounts, the lending agent will use its best effort to obtain additional collateral on the next business day to meet required amounts under the security lending agreement. The Fund may invest the cash collateral into a joint trading account in an affiliated money market fund pursuant to Exemptive Orders issued by the SEC. The Fund receives compensation for lending its securities either in the form of fees or by earning interest on invested cash collateral net of borrower rebates and fees paid to a lending agent. Either the Fund or the borrower may terminate the loan. There may be risks of delay and costs in recovery of securities or even loss of rights in the collateral should the borrower of the securities fail financially. If the Fund is not able to recover securities lent, the Fund may sell the collateral and purchase a replacement investment in the market, incurring the risk that the value of the replacement security is greater than the value of the collateral. The Fund is also subject to all investment risks associated with the reinvestment of any cash collateral received, including, but not limited to, interest rate, credit and liquidity risk associated with such investments.
As of December 31, 2014, the Fund had securities on loan. The value of the related collateral exceeded the value of the securities loaned at period end.
Federal Income Taxes. The Fund's policy is to comply with the requirements of the Internal Revenue Code, as amended, which are applicable to regulated investment companies, and to distribute all of its taxable income to its shareholders.
Under the Regulated Investment Company Modernization Act of 2010, net capital losses incurred post-enactment may be carried forward indefinitely, and their character is retained as short-term and/or long-term. Previously, net capital losses were carried forward for eight years and treated as short-term losses. As a transition rule, the Act requires that post-enactment net capital losses be used before pre-enactment net capital losses.
At December 31, 2014, the Fund had a net tax basis capital loss carryforward of approximately $405,000 of pre-enactment losses, inherited from its mergers with DWS Mid Cap Growth VIP, which may be applied against any realized net taxable capital gains of each succeeding year until fully utilized or until December 31, 2016 ($405,000), the expiration date, whichever occurs first, and which may be subject to certain limitations under Section 382–384 of Internal Revenue Code.
The Fund has reviewed the tax positions for the open tax years as of December 31, 2014 and has determined that no provision for income tax and/or uncertain tax provisions is required in the Fund's financial statements. The Fund's federal tax returns for the prior three fiscal years remain open subject to examination by the Internal Revenue Service.
Distribution of Income and Gains. Distributions from net investment income of the Fund, if any, are declared and distributed to shareholders annually. Net realized gains from investment transactions, in excess of available capital loss carryforwards, would be taxable to the Fund if not distributed and, therefore, will be distributed to shareholders at least annually. The Fund may also make additional distributions for tax purposes if necessary.
The timing and characterization of certain income and capital gain distributions are determined annually in accordance with federal tax regulations which may differ from accounting principles generally accepted in the United States of America. These differences primarily relate to net operating losses and certain securities sold at a loss. As a result, net investment income (loss) and net realized gain (loss) on investment transactions for a reporting period may differ significantly from distributions during such period. Accordingly, the Fund may periodically make reclassifications among certain of its capital accounts without impacting the net asset value of the Fund.
At December 31, 2014, the Fund's components of distributable earnings on a tax basis were as follows:
| Undistributed net long-term capital gains | | $ | 13,881,452 | |
| Capital loss carryforwards | | $ | (405,000 | ) |
| Unrealized appreciation (depreciation) on investments | | $ | 49,173,561 | |
In addition, the tax character of distributions paid by the Fund is summarized as follows:
| | | Years Ended December 31, | |
| | | 2014 | | | 2013 | |
| Distributions from ordinary income* | | $ | — | | | $ | 194,886 | |
* For tax purposes, short-term capital gain distributions are considered ordinary income distributions.
Expenses. Expenses of the Trust arising in connection with a specific fund are allocated to that fund. Other Trust expenses which cannot be directly attributed to a fund are apportioned among the funds in the Trust based upon the relative net assets or other appropriate measures.
Contingencies. In the normal course of business, the Fund may enter into contracts with service providers that contain general indemnification clauses. The Fund's maximum exposure under these arrangements is unknown as this would involve future claims that may be made against the Fund that have not yet been made. However, based on experience, the Fund expects the risk of loss to be remote.
Other. Investment transactions are accounted for on a trade date plus one basis for daily net asset value calculations. However, for financial reporting purposes, investment transactions are reported on trade date. Interest income is recorded on the accrual basis. Dividend income is recorded on the ex-dividend date net of foreign withholding taxes. Realized gains and losses from investment transactions are recorded on an identified cost basis. Proceeds from litigation payments, if any, are included in net realized gain (loss) from investments.
B. Purchases and Sales of Securities
During the year ended December 31, 2014, purchases and sales of investment transactions (excluding short-term investments) aggregated $75,181,765 and $100,975,009, respectively.
C. Related Parties
Management Agreement. Under the Investment Management Agreement with Deutsche Investment Management Americas Inc. ("DIMA" or the "Advisor"), an indirect, wholly owned subsidiary of Deutsche Bank AG, the Advisor directs the investments of the Fund in accordance with its investment objectives, policies and restrictions. The Advisor determines the securities, instruments and other contracts relating to investments to be purchased, sold or entered into by the Fund.
Pursuant to the Investment Management Agreement with the Advisor, the Fund pays a monthly management fee based on the Fund's average daily net assets, computed and accrued daily and payable monthly, at the following annual rates:
| First $250 million | | | .550 | % |
| Next $750 million | | | .525 | % |
| Over $1 billion | | | .500 | % |
Accordingly, for the year ended December 31, 2014, the fee pursuant to the Investment Management Agreement was equivalent to an annual rate (exclusive of any applicable waivers/reimbursements) of 0.55% of the Fund's average daily net assets.
For the period from January 1, 2014 through September 30, 2014, the Advisor has contractually agreed to waive its fees and/or reimburse certain operating expenses to the extent necessary to maintain the total annual operating expenses (excluding certain expenses such as extraordinary expenses, taxes, brokerage and interest expense) of Class A at 0.89%.
Administration Fee. Pursuant to an Administrative Services Agreement, DIMA provides most administrative services to the Fund. For all services provided under the Administrative Services Agreement, the Fund pays DIMA an annual fee ("Administration Fee") of 0.10% of the Fund's average daily net assets, computed and accrued daily and payable monthly. For the year ended December 31, 2014, the Administration Fee was $174,126, of which $14,373 is unpaid.
Service Provider Fees. DeAWM Service Company ("DSC"), an affiliate of the Advisor, is the transfer agent, dividend-paying agent and shareholder service agent for the Fund. Pursuant to a sub-transfer agency agreement between DSC and DST Systems, Inc. ("DST"), DSC has delegated certain transfer agent, dividend-paying agent and shareholder service agent functions to DST. DSC compensates DST out of the shareholder servicing fee it receives from the Fund. For the year ended December 31, 2014, the amounts charged to the Fund by DSC aggregated $373, of which $67 is unpaid.
Typesetting and Filing Service Fees. Under an agreement with DIMA, DIMA is compensated for providing typesetting and certain regulatory filing services to the Fund. For the year ended December 31, 2014, the amount charged to the Fund by DIMA included in the Statement of Operations under "Reports to shareholders" aggregated $9,976, of which $4,375 is unpaid.
Trustees' Fees and Expenses. The Fund paid retainer fees to each Trustee not affiliated with the Advisor, plus specified amounts to the Board Chairperson and Vice Chairperson and to each committee Chairperson.
Affiliated Cash Management Vehicles. The Fund may invest uninvested cash balances in Central Cash Management Fund and Deutsche Variable NAV Money Fund, affiliated money market funds which are managed by the Advisor. Each affiliated money market fund seeks to provide a high level of current income consistent with liquidity and the preservation of capital. Each affiliated money market fund is managed in accordance with Rule 2a-7 under the Investment Company Act of 1940, which governs the quality, maturity, diversity and liquidity of instruments in which a money market fund may invest. Central Cash Management Fund seeks to maintain a stable net asset value, and Deutsche Variable NAV Money Fund maintains a floating net asset value. The Fund indirectly bears its proportionate share of the expenses of each affiliated money market fund in which it invests. Central Cash Management Fund does not pay the Advisor an investment management fee. To the extent that Deutsche Variable NAV Money Fund pays an investment management fee to the Advisor, the Advisor will waive an amount of the investment management fee payable to the Advisor by the Fund equal to the amount of the investment management fee payable on the Fund's assets invested in Deutsche Variable NAV Money Fund.
Securities Lending Agent Fees. Deutsche Bank AG serves as securities lending agent for the Fund. For the year ended December 31, 2014, the Fund incurred securities lending agent fees to Deutsche Bank AG in the amount of $17,447.
D. Ownership of the Fund
At December 31, 2014, two participating insurance companies were owners of record of 10% or more of the total outstanding Class A shares of the Fund, each owning 56%, 22% and 15%.
E. Line of Credit
The Fund and other affiliated funds (the "Participants") share in a $400 million revolving credit facility provided by a syndication of banks. The Fund may borrow for temporary or emergency purposes, including the meeting of redemption requests that otherwise might require the untimely disposition of securities. The Participants are charged an annual commitment fee which is allocated based on net assets, among each of the Participants. Interest is calculated at a rate per annum equal to the sum of the Federal Funds Rate plus 1.25 percent plus if LIBOR exceeds the Federal Funds Rate the amount of such excess. The Fund may borrow up to a maximum of 33 percent of its net assets under the agreement. The Fund had no outstanding loans at December 31, 2014.
Report of Independent Registered Public Accounting Firm
To the Board of Trustees of Deutsche Variable Series II and Shareholders of Deutsche Small Mid Cap Growth VIP:
We have audited the accompanying statement of assets and liabilities, including the investment portfolio, of Deutsche Small Mid Cap Growth VIP (formerly DWS Small Mid Cap Growth VIP) (the "Fund") (one of the series constituting Deutsche Variable Series II (formerly DWS Variable Series II)), as of December 31, 2014, and the related statement of operations for the year then ended, the statements of changes in net assets for each of the two years in the period then ended, and the financial highlights for each of the periods indicated therein. These financial statements and financial highlights are the responsibility of the Fund’s management. Our responsibility is to express an opinion on these financial statements and financial highlights based on our audits.
We conducted our audits in accordance with the standards of the Public Company Accounting Oversight Board (United States). Those standards require that we plan and perform the audit to obtain reasonable assurance about whether the financial statements and financial highlights are free of material misstatement. We were not engaged to perform an audit of the Fund’s internal control over financial reporting. Our audits included consideration of internal control over financial reporting as a basis for designing audit procedures that are appropriate in the circumstances, but not for the purpose of expressing an opinion on the effectiveness of the Fund’s internal control over financial reporting. Accordingly, we express no such opinion. An audit also includes examining, on a test basis, evidence supporting the amounts and disclosures in the financial statements and financial highlights, assessing the accounting principles used and significant estimates made by management, and evaluating the overall financial statement presentation. Our procedures included confirmation of securities owned as of December 31, 2014, by correspondence with the custodian and brokers or by other appropriate auditing procedures where replies from brokers were not received. We believe that our audits provide
a reasonable basis for our opinion.
In our opinion, the financial statements and financial highlights referred to above present fairly, in all material respects, the financial position of Deutsche Small Mid Cap Growth VIP at December 31, 2014, the results of its operations for the year then ended, the changes in its net assets for each of the two years in the period then ended, and the financial highlights for each of the periods indicated therein, in conformity with U.S. generally accepted accounting principles.
| | | |
Boston, Massachusetts February 13, 2015 | | |
Information About Your Fund's Expenses (Unaudited)
As an investor of the Fund, you incur two types of costs: ongoing expenses and transaction costs. Ongoing expenses include management fees and other Fund expenses. Examples of transaction costs include contract charges, which are not shown in this section. The following tables are intended to help you understand your ongoing expenses (in dollars) of investing in the Fund and to help you compare these expenses with the ongoing expenses of investing in other mutual funds. The example in the table is based on an investment of $1,000 invested at the beginning of the six-month period and held for the entire period (July 1, 2014 to December 31, 2014).
The tables illustrate your Fund's expenses in two ways:
—Actual Fund Return. This helps you estimate the actual dollar amount of ongoing expenses (but not transaction costs) paid on a $1,000 investment in the Fund using the Fund's actual return during the period. To estimate the expenses you paid over the period, simply divide your account value by $1,000 (for example, an $8,600 account value divided by $1,000 = 8.6), then multiply the result by the number in the "Expenses Paid per $1,000" line under the share class you hold.
—Hypothetical 5% Fund Return. This helps you to compare your Fund's ongoing expenses (but not transaction costs) with those of other mutual funds using the Fund's actual expense ratio and a hypothetical rate of return of 5% per year before expenses. Examples using a 5% hypothetical Fund return may be found in the shareholder reports of other mutual funds. The hypothetical account values and expenses may not be used to estimate the actual ending account balance or expenses you paid for the period.
Please note that the expenses shown in these tables are meant to highlight your ongoing expenses only and do not reflect any transaction costs. The "Expenses Paid per $1,000" line of the tables is useful in comparing ongoing expenses only and will not help you determine the relative total expense of owning different funds. If these transaction costs had been included, your costs would have been higher.
Expenses and Value of a $1,000 Investment for the six months ended December 31, 2014 | |
| Actual Fund Return | | Class A | |
| Beginning Account Value 7/1/14 | | $ | 1,000.00 | |
| Ending Account Value 12/31/14 | | $ | 1,038.20 | |
| Expenses Paid per $1,000* | | $ | 3.75 | |
| Hypothetical 5% Fund Return | | Class A | |
| Beginning Account Value 7/1/14 | | $ | 1,000.00 | |
| Ending Account Value 12/31/14 | | $ | 1,021.53 | |
| Expenses Paid per $1,000* | | $ | 3.72 | |
* Expenses are equal to the Fund's annualized expense ratio, multiplied by the average account value over the period, multiplied by 184 (the number of days in the most recent six-month period), then divided by 365.
| Annualized Expense Ratio | Class A | |
| Deutsche Variable Series II — Deutsche Small Mid Cap Growth VIP | .73% | |
For more information, please refer to the Fund's prospectus.
These tables do not reflect charges and fees ("contract charges") associated with the separate account that invests in the Fund or any variable life insurance policy or variable annuity contract for which the Fund is an investment option.
For an analysis of the fees associated with an investment in the fund or similar funds, please refer to the current and hypothetical expense calculators for Variable Insurance Products which can be found at deutschefunds.com/EN/resources/calculators.jsp.
Tax Information (Unaudited)
Pursuant to Section 852 of the Internal Revenue Code, the Fund designates $15,270,000 as capital gain dividends for its year ended December 31, 2014.
Please consult a tax advisor if you have questions about federal or state income tax laws, or on how to prepare your tax returns. If you have specific questions about your account, please contact your insurance provider.
The Trust's policies and procedures for voting proxies for portfolio securities and information about how the Trust voted proxies related to its portfolio securities during the 12-month period ended June 30 are available on our Web site — deutschefunds.com (click on "proxy voting" at the bottom of the page) — or on the SEC's Web site — sec.gov. To obtain a written copy of the Trust's policies and procedures without charge, upon request, call us toll free at (800) 728-3337.
Advisory Agreement Board Considerations and Fee Evaluation
The Board of Trustees approved the renewal of Deutsche Small Mid Cap Growth VIP’s investment management agreement (the "Agreement") with Deutsche Investment Management Americas Inc. ("DIMA") in September 2014.
In terms of the process that the Board followed prior to approving the Agreement, shareholders should know that:
— In September 2014, all of the Fund’s Trustees were independent of DIMA and its affiliates.
— The Trustees met frequently during the past year to discuss fund matters and dedicated a substantial amount of time to contract review matters. Over the course of several months, the Board’s Contract Committee, in coordination with the Board’s Equity Oversight Committee, reviewed comprehensive materials received from DIMA, independent third parties and independent counsel. These materials included an analysis of the Fund’s performance, fees and expenses, and profitability compiled by a fee consultant retained by the Fund’s Independent Trustees (the "Fee Consultant"). The Board also received extensive information throughout the year regarding performance of the Fund.
— The Independent Trustees regularly meet privately with counsel to discuss contract review and other matters. In addition, the Independent Trustees were advised by the Fee Consultant in the course of their review of the Fund’s contractual arrangements and considered a comprehensive report prepared by the Fee Consultant in connection with their deliberations.
— In connection with reviewing the Agreement, the Board also reviewed the terms of the Fund’s distribution agreement, administrative services agreement, transfer agency agreement and other material service agreements.
— Based on its evaluation of the information provided, the Contract Committee presented its findings and recommendations to the Board. The Board then reviewed the Contract Committee’s findings and recommendations.
In connection with the contract review process, the Contract Committee and the Board considered the factors discussed below, among others. The Board also considered that DIMA and its predecessors have managed the Fund since its inception, and the Board believes that a long-term relationship with a capable, conscientious advisor is in the best interests of the Fund. The Board considered, generally, that shareholders chose to invest or remain invested in the Fund knowing that DIMA managed the Fund, and that the Agreement was approved by the Fund’s shareholders. DIMA is part of Deutsche Bank AG ("DB"), a major global banking institution that is engaged in a wide range of financial services. The Board believes that there are advantages to being part of a global asset management business that offers a wide range of investing expertise and resources, including hundreds of portfolio managers and analysts with research capabilities in many countries throughout the world.
As part of the contract review process, the Board carefully considered the fees and expenses of each Deutsche fund overseen by the Board in light of the fund’s performance. In many cases, this led to the negotiation and implementation of expense caps. As part of these negotiations, the Board indicated that it would consider relaxing these caps in future years following sustained improvements in performance, among other considerations.
In 2012, DB combined its Asset Management (of which DIMA was a part) and Wealth Management divisions into a new Asset and Wealth Management ("AWM") division. DB has advised the Independent Trustees that the U.S. asset management business is a critical and integral part of DB, and that DB will continue to invest in AWM a significant portion of the savings it has realized by combining its Asset and Wealth Management divisions, including ongoing enhancements to AWM’s investment capabilities. DB also has confirmed its commitment to maintaining strong legal and compliance groups within the AWM division.
While shareholders may focus primarily on fund performance and fees, the Fund’s Board considers these and many other factors, including the quality and integrity of DIMA’s personnel and such other issues as back-office operations, fund valuations, and compliance policies and procedures.
Nature, Quality and Extent of Services. The Board considered the terms of the Agreement, including the scope of advisory services provided under the Agreement. The Board noted that, under the Agreement, DIMA provides portfolio management services to the Fund and that, pursuant to a separate administrative services agreement, DIMA provides administrative services to the Fund. The Board considered the experience and skills of senior management and investment personnel, the resources made available to such personnel, the ability of DIMA to attract and retain high-quality personnel, and the organizational depth and stability of DIMA. The Board reviewed the Fund’s performance over short-term and long-term periods and compared those returns to various agreed-upon performance measures, including market index(es) and a peer universe compiled by the Fee Consultant using information supplied by Morningstar Direct ("Morningstar"), an independent fund data service. The Board also noted that it has put into place a process of identifying "Focus Funds" (e.g., funds performing poorly relative to a peer universe), and receives more frequent reporting and information from DIMA regarding such funds, along with DIMA’s plans to address underperformance. The Board believes this process is an effective manner of identifying and addressing underperforming funds. Based on the information provided, the Board noted that for the one-, three- and five-year periods ended December 31, 2013, the Fund’s performance (Class A shares) was in the 1st quartile, 1st quartile and 2nd quartile, respectively, of the applicable Morningstar universe (the 1st quartile being the best performers and the 4th quartile being the worst performers). The Board also observed that the Fund has outperformed its benchmark in the one-year period and has underperformed its benchmark in the three- and five-year periods ended December 31, 2013.
Fees and Expenses. The Board considered the Fund’s investment management fee schedule, operating expenses and total expense ratios, and comparative information provided by Lipper Inc. ("Lipper") and the Fee Consultant regarding investment management fee rates paid to other investment advisors by similar funds (1st quartile being the most favorable and 4th quartile being the least favorable). With respect to management fees paid to other investment advisors by similar funds, the Board noted that the contractual fee rates paid by the Fund, which include a 0.10% fee paid to DIMA under the Fund’s administrative services agreement, were lower than the median (1st quartile) of the applicable Lipper peer group (based on Lipper data provided as of December 31, 2013). The Board noted that the Fund’s Class A shares total (net) operating expenses were expected to be lower than the median (1st quartile) of the applicable Lipper expense universe (based on Lipper data provided as of December 31, 2013, and analyzing Lipper expense universe Class A (net) expenses less any applicable 12b-1 fees) ("Lipper Universe Expenses"). The Board also considered how the Fund’s total (net) operating expenses compared to the total (net) operating expenses of a more customized peer group selected by Lipper (based on such factors as asset size). The Board noted that the expense limitation agreed to by DIMA helped to ensure that the Fund’s total (net) operating expenses would remain competitive. The Board considered the Fund’s management fee rate as compared to fees charged by DIMA to a comparable fund and considered differences between the Fund and the comparable fund. The information requested by the Board as part of its review of fees and expenses also included information about institutional accounts and funds offered primarily to European investors ("Deutsche Europe funds") managed by DIMA and its affiliates. The Board noted that DIMA indicated that it does not manage any institutional accounts or Deutsche Europe funds comparable to the Fund.
On the basis of the information provided, the Board concluded that management fees were reasonable and appropriate in light of the nature, quality and extent of services provided by DIMA.
Profitability. The Board reviewed detailed information regarding revenues received by DIMA under the Agreement. The Board considered the estimated costs and pre-tax profits realized by DIMA from advising the Deutsche U.S. mutual funds ("Deutsche Funds"), as well as estimates of the pre-tax profits attributable to managing the Fund in particular. The Board also received information regarding the estimated enterprise-wide profitability of DIMA and its affiliates with respect to all fund services in totality and by fund. The Board and the Fee Consultant reviewed DIMA’s methodology in allocating its costs to the management of the Fund. Based on the information provided, the Board concluded that the pre-tax profits realized by DIMA in connection with the management of the Fund were not unreasonable.
Economies of Scale. The Board considered whether there are economies of scale with respect to the management of the Fund and whether the Fund benefits from any economies of scale. The Board noted that the Fund’s management fee schedule includes fee breakpoints. The Board concluded that the Fund’s fee schedule represents an appropriate sharing between the Fund and DIMA of such economies of scale as may exist in the management of the Fund at current asset levels.
Other Benefits to DIMA and Its Affiliates. The Board also considered the character and amount of other incidental benefits received by DIMA and its affiliates, including any fees received by DIMA for administrative services provided to the Fund and any fees received by an affiliate of DIMA for distribution services. The Board also considered benefits to DIMA related to brokerage and soft-dollar allocations, including allocating brokerage to pay for research generated by parties other than the executing broker dealers, which pertain primarily to funds investing in equity securities, along with the incidental public relations benefits to DIMA related to Deutsche Funds advertising and cross-selling opportunities among DIMA products and services. The Board concluded that management fees were reasonable in light of these fallout benefits.
Compliance. The Board considered the significant attention and resources dedicated by DIMA to documenting and enhancing its compliance processes in recent years. The Board noted in particular (i) the experience and seniority of DIMA’s and the Fund’s chief compliance officer; (ii) the large number of DIMA compliance personnel; and (iii) the substantial commitment of resources by DIMA and its affiliates to compliance matters.
Based on all of the information considered and the conclusions reached, the Board unanimously determined that the continuation of the Agreement is in the best interests of the Fund. In making this determination, the Board did not give particular weight to any single factor identified above. The Board considered these factors over the course of numerous meetings, certain of which were in executive session with only the Independent Trustees and counsel present. It is possible that individual Trustees may have weighed these factors differently in reaching their individual decisions to approve the continuation of the Agreement.
Board Members and Officers
The following table presents certain information regarding the Board Members and Officers of the fund. Each Board Member's year of birth is set forth in parentheses after his or her name. Unless otherwise noted, (i) each Board Member has engaged in the principal occupation(s) noted in the table for at least the most recent five years, although not necessarily in the same capacity; and (ii) the address of each Independent Board Member is c/o Kenneth C. Froewiss, Chairman, Deutsche Mutual Funds, P.O. Box 390601, Cambridge, MA 02139. Except as otherwise noted below, the term of office for each Board Member is until the election and qualification of a successor, or until such Board Member sooner dies, resigns, is removed or as otherwise provided in the governing documents of the fund. Because the fund does not hold an annual meeting of shareholders, each Board Member will hold office for an indeterminate period. The Board Members may also serve in similar capacities with other funds in the fund complex.
| Independent Board Members |
Name, Year of Birth, Position with the Fund and Length of Time Served1 | | Business Experience and Directorships During the Past Five Years | Number of Funds in Deutsche Fund Complex Overseen | Other Directorships Held by Board Member |
Kenneth C. Froewiss (1945) Chairperson since 2013, and Board Member since 2001 | | Adjunct Professor of Finance, NYU Stern School of Business (September 2009–present; Clinical Professor from 1997–September 2009); Member, Finance Committee, Association for Asian Studies (2002–present); Director, Mitsui Sumitomo Insurance Group (US) (2004–present); prior thereto, Managing Director, J.P. Morgan (investment banking firm) (until 1996) | 105 | — |
William McClayton (1944) Vice Chairperson since 2013, and Board Member since 2004 | | Private equity investor (since October 2009); previously, Managing Director, Diamond Management & Technology Consultants, Inc. (global consulting firm) (2001–2009); Directorship: Board of Managers, YMCA of Metropolitan Chicago; formerly: Senior Partner, Arthur Andersen LLP (accounting) (1966–2001); Trustee, Ravinia Festival | 105 | — |
John W. Ballantine (1946) Board Member since 1999 | | Retired; formerly, Executive Vice President and Chief Risk Management Officer, First Chicago NBD Corporation/The First National Bank of Chicago (1996–1998); Executive Vice President and Head of International Banking (1995–1996); former Directorships: Director and former Chairman of the Board, Healthways, Inc.2 (provider of disease and care management services) (2003–2014); Stockwell Capital Investments PLC (private equity); First Oak Brook Bancshares, Inc. and Oak Brook Bank; Prisma Energy International | 105 | Portland General Electric2 (utility company) (2003– present) |
Henry P. Becton, Jr. (1943) Board Member since 1990 | | Vice Chair and former President, WGBH Educational Foundation. Directorships: Public Radio International; Public Radio Exchange (PRX); North Bennett Street School (Boston); former Directorships: Belo Corporation2 (media company); The PBS Foundation; Association of Public Television Stations; Boston Museum of Science; American Public Television; Concord Academy; New England Aquarium; Mass. Corporation for Educational Telecommunications; Committee for Economic Development; Public Broadcasting Service; Connecticut College | 105 | Lead Director, Becton Dickinson and Company2 (medical technology company) |
Dawn-Marie Driscoll (1946) Board Member since 1987 | | Emeritus Executive Fellow, Center for Business Ethics, Bentley University; formerly: President, Driscoll Associates (consulting firm); Partner, Palmer & Dodge (law firm) (1988–1990); Vice President of Corporate Affairs and General Counsel, Filene's (retail) (1978–1988). Directorships: Director of ICI Mutual Insurance Company (since 2007); Advisory Board, Center for Business Ethics, Bentley University; Trustee and former Chairman of the Board, Southwest Florida Community Foundation (charitable organization); former Directorships: Sun Capital Advisers Trust (mutual funds) (2007–2012), Investment Company Institute (audit, executive, nominating committees) and Independent Directors Council (governance, executive committees) | 105 | — |
Keith R. Fox, CFA (1954) Board Member since 1996 | | Managing General Partner, Exeter Capital Partners (a series of private investment funds) (since 1986). Directorships: Progressive International Corporation (kitchen goods importer and distributor); The Kennel Shop (retailer); former Chairman, National Association of Small Business Investment Companies; former Directorships: BoxTop Media Inc. (advertising); Sun Capital Advisers Trust (mutual funds) (2011–2012) | 105 | — |
Paul K. Freeman (1950) Board Member since 1993 | | Consultant, World Bank/Inter-American Development Bank; Chair, Independent Directors Council; Investment Company Institute (executive and nominating committees); formerly, Chairman of Education Committee of Independent Directors Council; Project Leader, International Institute for Applied Systems Analysis (1998–2001); Chief Executive Officer, The Eric Group, Inc. (environmental insurance) (1986–1998); Directorships: Denver Zoo Foundation (December 2012–present); former Directorships: Prisma Energy International | 105 | — |
Richard J. Herring (1946) Board Member since 1990 | | Jacob Safra Professor of International Banking and Professor, Finance Department, The Wharton School, University of Pennsylvania (since July 1972); Co-Director, Wharton Financial Institutions Center; Co-Chair, U.S. Shadow Financial Regulatory Committee; Executive Director, Financial Economists Roundtable; formerly: Vice Dean and Director, Wharton Undergraduate Division (July 1995–June 2000); Director, Lauder Institute of International Management Studies (July 2000–June 2006) | 105 | Director, Aberdeen Singapore and Japan Funds (since 2007); Independent Director of Barclays Bank Delaware (since September 2010) |
Rebecca W. Rimel (1951) Board Member since 1995 | | President and Chief Executive Officer, The Pew Charitable Trusts (charitable organization) (1994 to present); formerly: Executive Vice President, The Glenmede Trust Company (investment trust and wealth management) (1983–2004); Board Member, Investor Education (charitable organization) (2004–2005); Trustee, Executive Committee, Philadelphia Chamber of Commerce (2001–2007); Director, Viasys Health Care2 (January 2007–June 2007); Trustee, Thomas Jefferson Foundation (charitable organization) (1994–2012) | 105 | Director, Becton Dickinson and Company2 (medical technology company) (2012– present); Director, BioTelemetry Inc.2 (health care) (2009– present) |
William N. Searcy, Jr. (1946) Board Member since 1993 | | Private investor since October 2003; formerly: Pension & Savings Trust Officer, Sprint Corporation2 (telecommunications) (November 1989–September 2003); Trustee, Sun Capital Advisers Trust (mutual funds) (1998–2012) | 105 | — |
Jean Gleason Stromberg (1943) Board Member since 1997 | | Retired. Formerly, Consultant (1997–2001); Director, Financial Markets U.S. Government Accountability Office (1996–1997); Partner, Norton Rose Fulbright, L.L.P. (law firm) (1978–1996). Directorships: The William and Flora Hewlett Foundation (charitable organization); former Directorships: Service Source, Inc. (nonprofit), Mutual Fund Directors Forum (2002–2004), American Bar Retirement Association (funding vehicle for retirement plans) (1987–1990 and 1994–1996) | 105 | — |
Robert H. Wadsworth* (1940) Board Member since 1999 | | President, Robert H. Wadsworth & Associates, Inc. (consulting firm) (1983 to present); Director, The Phoenix Boys Choir Association | 105 | — |
Officers4 |
Name, Year of Birth, Position with the Fund and Length of Time Served5 | | Business Experience and Directorships During the Past Five Years |
Brian E. Binder8 (1972) President and Chief Executive Officer, 2013–present | | Managing Director3 and Head of Fund Administration, Deutsche Asset & Wealth Management (2013–present); formerly: Head of Business Management and Consulting at Invesco, Ltd. (2010–2012); Chief Administrative Officer, Van Kampen Funds Inc. (2008–2010); and Chief Administrative Officer, Morgan Stanley Investment Management Americas Distribution (2003–2008) |
John Millette7 (1962) Vice President and Secretary, 1999–present | | Director,3 Deutsche Asset & Wealth Management |
Melinda Morrow6 (1970) Vice President, 2012–present | | Director,3 Deutsche Asset & Wealth Management |
Paul H. Schubert6 (1963) Chief Financial Officer, 2004–present Treasurer, 2005–present | | Managing Director,3 Deutsche Asset & Wealth Management (since July 2004); formerly: Executive Director, Head of Mutual Fund Services and Treasurer for UBS Family of Funds (1998–2004); Vice President and Director of Mutual Fund Finance at UBS Global Asset Management (1994–1998) |
Caroline Pearson7 (1962) Chief Legal Officer, 2010–present | | Managing Director,3 Deutsche Asset & Wealth Management; formerly: Assistant Secretary for DWS family of funds (1997–2010) |
Robert Kloby6 (1962) Chief Compliance Officer, 2006–present | | Managing Director,3 Deutsche Asset & Wealth Management |
Wayne Salit6 (1967) Anti-Money Laundering Compliance Officer, 2014–present | | Director,3 Deutsche Asset & Wealth Management; formerly: Managing Director, AML Compliance Officer at BNY Mellon (2011–2014); and Director, AML Compliance Officer at Deutsche Bank (2004–2011) |
Hepsen Uzcan7 (1974) Assistant Secretary, 2013–present | | Director,3 Deutsche Asset & Wealth Management |
Paul Antosca7 (1957) Assistant Treasurer, 2007–present | | Director,3 Deutsche Asset & Wealth Management |
Jack Clark7 (1967) Assistant Treasurer, 2007–present | | Director,3 Deutsche Asset & Wealth Management |
Diane Kenneally7 (1966) Assistant Treasurer, 2007–present | | Director,3 Deutsche Asset & Wealth Management |
1 The length of time served represents the year in which the Board Member joined the board of one or more Deutsche funds currently overseen by the Board.
2 A publicly held company with securities registered pursuant to Section 12 of the Securities Exchange Act of 1934.
3 Executive title, not a board directorship.
4 As a result of their respective positions held with the Advisor, these individuals are considered "interested persons" of the Advisor within the meaning of the 1940 Act. Interested persons receive no compensation from the fund.
5 The length of time served represents the year in which the officer was first elected in such capacity for one or more Deutsche funds.
6 Address: 60 Wall Street, New York, NY 10005.
7 Address: One Beacon Street, Boston, MA 02108.
8 Address: 222 South Riverside Plaza, Chicago, IL 60606.
* Robert H. Wadsworth retired from the Board effective December 31, 2014.
The fund's Statement of Additional Information ("SAI") includes additional information about the Board Members. The SAI is available, without charge, upon request. If you would like to request a copy of the SAI, you may do so by calling the following toll-free number: (800) 728-3337.
DeAWM Distributors, Inc.
222 South Riverside Plaza
Chicago, IL 60606
(800) 621-1148
VS2SMCG-2 (R-025835-4 2/15)
December 31, 2014
Annual Report
Deutsche Variable Series II
(formerly DWS Variable Series II)
Deutsche Small Mid Cap Value VIP
(formerly DWS Small Mid Cap Value VIP)
Contents
9 Statement of Assets and Liabilities 10 Statement of Operations 10 Statement of Changes in Net Assets 13 Notes to Financial Statements 17 Report of Independent Registered Public Accounting Firm 18 Information About Your Fund's Expenses 20 Advisory Agreement Board Considerations and Fee Evaluation 23 Board Members and Officers |
This report must be preceded or accompanied by a prospectus. To obtain an additional prospectus or summary prospectus, if available, call (800) 728-3337 or your financial representative. We advise you to consider the Fund's objectives, risks, charges and expenses carefully before investing. The summary prospectus and prospectus contain this and other important information about the Fund. Please read the prospectus carefully before you invest.
Any fund that focuses in a particular segment of the market or region of the world will generally be more volatile than a fund that invests more broadly. Smaller and medium company stocks tend to be more volatile than large company stocks. The Fund may lend securities to approved institutions. Stocks may decline in value. See the prospectus for details.
Deutsche Asset & Wealth Management represents the asset management and wealth management activities conducted by Deutsche Bank AG or any of its subsidiaries, including the Advisor and DeAWM Distributors, Inc.
NOT FDIC/NCUA INSURED NO BANK GUARANTEE MAY LOSE VALUE NOT A DEPOSIT
NOT INSURED BY ANY FEDERAL GOVERNMENT AGENCY
Performance Summary December 31, 2014 (Unaudited)
Fund performance shown is historical, assumes reinvestment of all dividend and capital gain distributions and does not guarantee future results. Investment return and principal value fluctuate with changing market conditions so that, when redeemed, shares may be worth more or less than their original cost. Current performance may be lower or higher than the performance data quoted. Please contact your participating insurance company for the Fund's most recent month-end performance. Performance doesn't reflect charges and fees ("contract charges") associated with the separate account that invests in the Fund or any variable life insurance policy or variable annuity contract for which the Fund is an investment option. These charges and fees will reduce returns. While all share classes have the same underlying portfolio, their performance will differ.
The gross expense ratios of the Fund, as stated in the fee table of the prospectus dated May 1, 2014 are 0.82% and 1.17% for Class A and Class B shares, respectively, and may differ from the expense ratios disclosed in the Financial Highlights tables in this report.
| Growth of an Assumed $10,000 Investment in Deutsche Small Mid Cap Value VIP |
| The Russell 2500™ Value Index is an unmanaged Index of those securities in the Russell 3000® Index with lower price-to-book ratios and lower forecasted growth values. Index returns do not reflect any fees or expenses and it is not possible to invest directly into an index. |
| |
| Yearly periods ended December 31 | |
| Comparative Results | |
| Deutsche Small Mid Cap Value VIP | | 1-Year | | | 3-Year | | | 5-Year | | | 10-Year | |
| Class A | Growth of $10,000 | | $ | 10,553 | | | $ | 16,236 | | | $ | 18,766 | | | $ | 23,028 | |
| Average annual total return | | | 5.53 | % | | | 17.53 | % | | | 13.42 | % | | | 8.70 | % |
| Russell 2500 Value Index | Growth of $10,000 | | $ | 10,711 | | | $ | 17,024 | | | $ | 20,535 | | | $ | 21,409 | |
| Average annual total return | | | 7.11 | % | | | 19.40 | % | | | 15.48 | % | | | 7.91 | % |
| Deutsche Small Mid Cap Value VIP | | 1-Year | | | 3-Year | | | 5-Year | | | 10-Year | |
| Class B | Growth of $10,000 | | $ | 10,509 | | | $ | 16,050 | | | $ | 18,441 | | | $ | 22,205 | |
| Average annual total return | | | 5.09 | % | | | 17.08 | % | | | 13.02 | % | | | 8.30 | % |
| Russell 2500 Value Index | Growth of $10,000 | | $ | 10,711 | | | $ | 17,024 | | | $ | 20,535 | | | $ | 21,409 | |
| Average annual total return | | | 7.11 | % | | | 19.40 | % | | | 15.48 | % | | | 7.91 | % |
The growth of $10,000 is cumulative.
Management Summary December 31, 2014 (Unaudited)
Class A shares DWS Small Mid Cap Value VIP returned 5.53% in 2014 (unadjusted for contract charges), underperforming the 7.11% return of the benchmark, the Russell 2500™ Value Index.1
We employ a bottom-up, research-driven strategy designed to identify high-quality, undervalued small- and mid-cap companies. While this approach has worked well over time, it didn’t translate to outperformance during the past year. One of the most important factors in the Fund’s modest shortfall was its underweight position in real estate investment trusts (REITs) and utilities, both of which have above-average sensitivity to interest rates.2 Bond yields fell during the course of the year, which helped both sectors deliver robust, market-beating performance. The rationale for these underweights was that we didn’t see a compelling opportunity in either sector given their underlying valuations. Believing the disparity between above-average valuations and below-average growth has become even more pronounced following the sectors’ outperformance of the year ended December 31, 2014, we retained the underweight positions at the close of the period. The Fund was also hurt by the underperformance of its holdings in the industrials sector, where positions in Harsco Corp., The Brink’s Co. and ADT Corp.* detracted from returns.
On the plus side, the Fund’s investments outperformed the benchmark in a number of sectors, including materials, health care, energy and consumer discretionary. Among individual stocks, the largest contributors to performance were CareFusion Corp.,* Verint Systems, Inc. and Sealed Air Corp.
We believe the investment backdrop remains supportive for equities. The U.S. economy continues to grow and add jobs, yet growth is unlikely to experience the type of "boom" that would prompt the U.S. Federal Reserve Board (the Fed) to raise interest rates at a faster pace than investors expect. We think this provides a particularly favorable backdrop for companies in the industrials sector, which tends to have above-average sensitivity to economic trends.
Although market volatility increased during the second half of the reporting period, we believe this created a growing number of medium-to-longer-term opportunities among individual stocks. Choppier market conditions also indicated a potential shift away from the environment of recent years, during which the "rising tide" of broader-market gains blurred the lines of performance between higher- and lower-quality stocks. We welcome this shift, as it provides greater latitude for us to add value through fundamental research and individual stock selection.
Richard Glass, CFA
Portfolio Manager, Deutsche Investment Management Americas Inc.
The views expressed reflect those of the portfolio management team only through the end of the period of the report as stated on the cover. The management team's views are subject to change at any time based on market and other conditions and should not be construed as a recommendation. Past performance is no guarantee of future results. Current and future portfolio holdings are subject to risk.
1 The Russell 2500 Value Index is an unmanaged index of those securities in the Russell 3000® Index with lower price-to-book ratios and lower forecasted growth values. Index returns do not reflect fees or expenses and it is not possible to invest directly into an index.
2 "Underweight" means the Fund holds a lower weighting in a given sector or security than the benchmark. "Overweight" means the Fund holds a higher weighting.
* Not held in the portfolio as of December 31, 2014
Portfolio Summary (Unaudited) Asset Allocation (As a % of Investment Portfolio) | 12/31/14 | 12/31/13 |
| | | |
| Common Stocks | 96% | 96% |
| Cash Equivalents | 4% | 4% |
| | 100% | 100% |
Sector Diversification (As a % of Common Stocks) | 12/31/14 | 12/31/13 |
| | | |
| Financials | 23% | 16% |
| Information Technology | 21% | 14% |
| Industrials | 20% | 29% |
| Consumer Discretionary | 12% | 12% |
| Materials | 11% | 7% |
| Health Care | 6% | 10% |
| Energy | 5% | 5% |
| Consumer Staples | 2% | 2% |
| Utilities | 0% | 5% |
| | 100% | 100% |
Portfolio holdings and characteristics are subject to change.
For more complete details about the Fund's investment portfolio, see page 6.
Following the Fund's fiscal first and third quarter-end, a complete portfolio holdings listing is filed with the SEC on Form N-Q. The form will be available on the SEC's Web site at sec.gov, and it also may be reviewed and copied at the SEC's Public Reference Room in Washington, D.C. Information on the operation of the SEC's Public Reference Room may be obtained by calling (800) SEC-0330. The Fund's portfolio holdings are also posted on deutschefunds.com from time to time. Please see the Fund's current prospectus for more information.
Investment Portfolio December 31, 2014 | | | Shares | | | Value ($) | |
| | | | |
| Common Stocks 96.4% | |
| Consumer Discretionary 12.0% | |
| Auto Components 2.5% | |
| Visteon Corp.* | | | 50,570 | | | | 5,403,910 | |
| Diversified Consumer Services 1.4% | |
| Ascent Capital Group, Inc. "A"* | | | 59,351 | | | | 3,141,448 | |
| Hotels, Restaurants & Leisure 1.7% | |
| The Wendy's Co. | | | 421,696 | | | | 3,807,915 | |
| Household Durables 2.8% | |
| Newell Rubbermaid, Inc. | | | 162,213 | | | | 6,178,693 | |
| Specialty Retail 2.2% | |
| Ross Stores, Inc. | | | 52,295 | | | | 4,929,327 | |
| Textiles, Apparel & Luxury Goods 1.4% | |
| Hanesbrands, Inc. | | | 28,238 | | | | 3,151,926 | |
| Consumer Staples 1.6% | |
| Food Products | |
| Ingredion, Inc. | | | 41,076 | | | | 3,484,888 | |
| Energy 4.8% | |
| Energy Equipment & Services 2.1% | |
| Superior Energy Services, Inc. | | | 124,276 | | | | 2,504,162 | |
| TETRA Technologies, Inc.* | | | 316,162 | | | | 2,111,962 | |
| | | | | | | | 4,616,124 | |
| Oil, Gas & Consumable Fuels 2.7% | |
| Cimarex Energy Co. | | | 29,351 | | | | 3,111,206 | |
| QEP Resources, Inc. | | | 140,350 | | | | 2,837,877 | |
| | | | | | | | 5,949,083 | |
| Financials 21.6% | |
| Banks 8.1% | |
| Capital Bank Financial Corp. "A"* | | | 150,950 | | | | 4,045,460 | |
| First Republic Bank | | | 74,593 | | | | 3,887,787 | |
| Great Western Bancorp., Inc.* | | | 74,559 | | | | 1,699,200 | |
| Investors Bancorp., Inc. | | | 432,051 | | | | 4,849,772 | |
| Sterling Bancorp. | | | 249,515 | | | | 3,588,026 | |
| | | | | | | | 18,070,245 | |
| Capital Markets 2.0% | |
| Lazard Ltd. "A" | | | 88,545 | | | | 4,429,906 | |
| Consumer Finance 2.6% | |
| Synchrony Financial* | | | 190,536 | | | | 5,668,446 | |
| Insurance 5.8% | |
| CNO Financial Group, Inc. | | | 368,608 | | | | 6,347,430 | |
| PartnerRe Ltd. | | | 21,600 | | | | 2,465,208 | |
| Reinsurance Group of America, Inc. | | | 46,427 | | | | 4,067,934 | |
| | | | | | | | 12,880,572 | |
| Real Estate Investment Trusts 1.7% | |
| Plum Creek Timber Co., Inc. (REIT) | | | 86,738 | | | | 3,711,519 | |
| Thrifts & Mortgage Finance 1.4% | |
| Walker & Dunlop, Inc.* | | | 178,737 | | | | 3,135,047 | |
| Health Care 5.6% | |
| Health Care Providers & Services 4.1% | |
| HealthSouth Corp. | | | 131,013 | | | | 5,038,760 | |
| Omnicare, Inc. | | | 55,065 | | | | 4,015,890 | |
| | | | | | | | 9,054,650 | |
| | | Shares | | | Value ($) | |
| | | | | | | | | |
| Life Sciences Tools & Services 1.5% | |
| PerkinElmer, Inc. | | | 76,297 | | | | 3,336,468 | |
| Industrials 19.6% | |
| Aerospace & Defense 1.7% | |
| Curtiss-Wright Corp. | | | 53,300 | | | | 3,762,447 | |
| Air Freight & Logistics 1.7% | |
| Forward Air Corp. | | | 77,160 | | | | 3,886,549 | |
| Commercial Services & Supplies 3.7% | |
| Covanta Holding Corp. | | | 209,925 | | | | 4,620,449 | |
| The Brink's Co. | | | 143,338 | | | | 3,498,881 | |
| | | | | | | | 8,119,330 | |
| Electrical Equipment 2.2% | |
| The Babcock & Wilcox Co. | | | 158,183 | | | | 4,792,945 | |
| Machinery 7.4% | |
| Harsco Corp. | | | 220,691 | | | | 4,168,853 | |
| ITT Corp. | | | 78,773 | | | | 3,187,156 | |
| Stanley Black & Decker, Inc. | | | 50,554 | | | | 4,857,228 | |
| Xylem, Inc. | | | 111,667 | | | | 4,251,163 | |
| | | | | | | | 16,464,400 | |
| Marine 1.1% | |
| Kirby Corp.* | | | 29,551 | | | | 2,385,948 | |
| Trading Companies & Distributors 1.8% | |
| AerCap Holdings NV* | | | 104,598 | | | | 4,060,494 | |
| Information Technology 20.5% | |
| Communications Equipment 1.6% | |
| Harris Corp. | | | 49,741 | | | | 3,572,399 | |
| Electronic Equipment, Instruments & Components 8.3% | |
| Belden, Inc. | | | 62,616 | | | | 4,934,767 | |
| Dolby Laboratories, Inc. "A" | | | 98,179 | | | | 4,233,479 | |
| Rogers Corp.* | | | 40,421 | | | | 3,291,886 | |
| Zebra Technologies Corp. "A"* | | | 78,418 | | | | 6,070,337 | |
| | | | | | | | 18,530,469 | |
| IT Services 6.5% | |
| Convergys Corp. | | | 271,794 | | | | 5,536,444 | |
| Global Payments, Inc. | | | 57,321 | | | | 4,627,524 | |
| NeuStar, Inc. "A"* | | | 150,621 | | | | 4,187,264 | |
| | | | | | | | 14,351,232 | |
| Software 4.1% | |
| ACI Worldwide, Inc.* | | | 137,925 | | | | 2,781,947 | |
| Verint Systems, Inc.* | | | 109,912 | | | | 6,405,671 | |
| | | | | | | | 9,187,618 | |
| Materials 10.6% | |
| Chemicals 5.3% | |
| Ashland, Inc. | | | 39,852 | | | | 4,772,675 | |
| Celanese Corp. "A" | | | 60,868 | | | | 3,649,645 | |
| Cytec Industries, Inc. | | | 74,486 | | | | 3,439,019 | |
| | | | | | | | 11,861,339 | |
| Containers & Packaging 3.0% | |
| Sealed Air Corp. | | | 158,230 | | | | 6,713,699 | |
| Metals & Mining 2.3% | |
| Materion Corp. | | | 143,173 | | | | 5,043,985 | |
| Utilities 0.1% | |
| Electric Utilities 0.0% | |
| Northeast Utilities | | | 2,145 | | | | 114,800 | |
| | | Shares | | | Value ($) | |
| | | | | | | | | |
| Gas Utilities 0.0% | |
| UGI Corp. | | | 2,945 | | | | 111,851 | |
| Multi-Utilities 0.1% | |
| CMS Energy Corp. | | | 3,332 | | | | 115,787 | |
Total Common Stocks (Cost $185,242,299) | | | | 214,025,459 | |
| | |
| | | Shares | | | Value ($) | |
| | | | | | | | | |
| Cash Equivalents 3.8% | |
| Central Cash Management Fund, 0.06% (a) (Cost $8,468,958) | | | 8,468,958 | | | | 8,468,958 | |
| | | % of Net Assets | | | Value ($) | |
| | | | |
Total Investment Portfolio (Cost $193,711,257)† | | | 100.2 | | | | 222,494,417 | |
| Other Assets and Liabilities, Net | | | (0.2 | ) | | | (415,999 | ) |
| Net Assets | | | 100.0 | | | | 222,078,418 | |
* Non-income producing security.
† The cost for federal income tax purposes was $193,698,332. At December 31, 2014, net unrealized appreciation for all securities based on tax cost was $28,796,085. This consisted of aggregate gross unrealized appreciation for all securities in which there was an excess of value over tax cost of $38,379,382 and aggregate gross unrealized depreciation for all securities in which there was an excess of tax cost over value of $9,583,297.
(a) Affiliated fund managed by Deutsche Investment Management Americas Inc. The rate shown is the annualized seven-day yield at period end.
REIT: Real Estate Investment Trust
Fair Value Measurements
Various inputs are used in determining the value of the Fund's investments. These inputs are summarized in three broad levels. Level 1 includes quoted prices in active markets for identical securities. Level 2 includes other significant observable inputs (including quoted prices for similar securities, interest rates, prepayment speeds and credit risk). Level 3 includes significant unobservable inputs (including the Fund's own assumptions in determining the fair value of investments). The level assigned to the securities valuations may not be an indication of the risk or liquidity associated with investing in those securities.
The following is a summary of the inputs used as of December 31, 2014 in valuing the Fund's investments. For information on the Fund's policy regarding the valuation of investments, please refer to the Security Valuation section of Note A in the accompanying Notes to Financial Statements.
| Assets | | Level 1 | | | Level 2 | | | Level 3 | | | Total | |
| | |
| Common Stocks (b) | | $ | 214,025,459 | | | $ | — | | | $ | — | | | $ | 214,025,459 | |
| Short-Term Investments | | | 8,468,958 | | | | — | | | | — | | | | 8,468,958 | |
| Total | | $ | 222,494,417 | | | $ | — | | | $ | — | | | $ | 222,494,417 | |
There have been no transfers between fair value measurement levels during the year ended December 31, 2014.
(b) See Investment Portfolio for additional detailed categorizations.
The accompanying notes are an integral part of the financial statements.
Statement of Assets and Liabilities | as of December 31, 2014 | |
| Assets | |
Investments: Investments in non-affiliated securities, at value (cost $185,242,299) | | $ | 214,025,459 | |
| Investment in Central Cash Management Fund (cost $8,468,958) | | | 8,468,958 | |
| Total investments in securities, at value (cost $193,711,257) | | | 222,494,417 | |
| Receivable for Fund shares sold | | | 9,512 | |
| Dividends receivable | | | 120,043 | |
| Interest receivable | | | 522 | |
| Other assets | | | 3,976 | |
| Total assets | | | 222,628,470 | |
| Liabilities | |
| Payable for Fund shares redeemed | | | 290,124 | |
| Accrued management fee | | | 121,828 | |
| Accrued Trustees' fees | | | 3,697 | |
| Other accrued expenses and payables | | | 134,403 | |
| Total liabilities | | | 550,052 | |
| Net assets, at value | | $ | 222,078,418 | |
| Net Assets Consist of | |
| Undistributed net investment income | | | 618,223 | |
| Net unrealized appreciation (depreciation) on investments | | | 28,783,160 | |
| Accumulated net realized gain (loss) | | | 18,535,588 | |
| Paid-in capital | | | 174,141,447 | |
| Net assets, at value | | $ | 222,078,418 | |
Class A Net Asset Value, offering and redemption price per share ($205,126,537 ÷ 11,531,437 outstanding shares of beneficial interest, no par value, unlimited number of shares authorized) | | $ | 17.79 | |
Class B Net Asset Value, offering and redemption price per share ($16,951,881 ÷ 953,703 outstanding shares of beneficial interest, no par value, unlimited number of shares authorized) | | $ | 17.77 | |
The accompanying notes are an integral part of the financial statements.
Statement of Operations
| for the year ended December 31, 2014 | |
| Investment Income | |
Income: Dividends | | $ | 2,666,766 | |
| Income distributions — Central Cash Management Fund | | | 5,104 | |
| Total income | | | 2,671,870 | |
Expenses: Management fee | | | 1,529,992 | |
| Administration fee | | | 235,405 | |
| Services to shareholders | | | 5,726 | |
| Record keeping fees (Class B) | | | 18,190 | |
| Distribution service fee (Class B) | | | 44,841 | |
| Custodian fee | | | 8,909 | |
| Professional fees | | | 68,263 | |
| Reports to shareholders | | | 53,184 | |
| Trustees' fees and expenses | | | 11,783 | |
| Other | | | 8,519 | |
| Total expenses | | | 1,984,812 | |
| Net investment income (loss) | | | 687,058 | |
| Realized and Unrealized Gain (Loss) | |
| Net realized gain (loss) from investments | | | 18,607,552 | |
| Change in net unrealized appreciation (depreciation) on investments | | | (7,308,422 | ) |
| Net gain (loss) | | | 11,299,130 | |
| Net increase (decrease) in net assets resulting from operations | | $ | 11,986,188 | |
The accompanying notes are an integral part of the financial statements.
Statement of Changes in Net Assets | | | Years Ended December 31, | |
| Increase (Decrease) in Net Assets | | 2014 | | | 2013 | |
Operations: Net investment income (loss) | | $ | 687,058 | | | $ | 1,914,959 | |
| Net realized gain (loss) | | | 18,607,552 | | | | 72,681,616 | |
| Change in net unrealized appreciation (depreciation) | | | (7,308,422 | ) | | | (601,679 | ) |
| Net increase (decrease) in net assets resulting from operations | | | 11,986,188 | | | | 73,994,896 | |
Distributions to shareholders from: Net investment income: Class A | | | (1,782,045 | ) | | | (2,660,096 | ) |
| Class B | | | (85,579 | ) | | | (150,280 | ) |
Net realized gains: Class A | | | (1,065,847 | ) | | | — | |
| Class B | | | (91,018 | ) | | | — | |
| Total distributions | | | (3,024,489 | ) | | | (2,810,376 | ) |
Fund share transactions: Class A Proceeds from shares sold | | | 7,581,114 | | | | 17,897,526 | |
| Reinvestment of distributions | | | 2,847,892 | | | | 2,660,096 | |
| Payments for shares redeemed | | | (53,470,098 | ) | | | (65,359,482 | ) |
| Net increase (decrease) in net assets from Class A share transactions | | | (43,041,092 | ) | | | (44,801,860 | ) |
Class B Proceeds from shares sold | | | 2,985,548 | | | | 4,288,905 | |
| Reinvestment of distributions | | | 176,597 | | | | 150,280 | |
| Payments for shares redeemed | | | (6,702,666 | ) | | | (6,805,298 | ) |
| Net increase (decrease) in net assets from Class B share transactions | | | (3,540,521 | ) | | | (2,366,113 | ) |
| Increase (decrease) in net assets | | | (37,619,914 | ) | | | 24,016,547 | |
| Net assets at beginning of period | | | 259,698,332 | | | | 235,681,785 | |
| Net assets at end of period (including undistributed net investment income of $618,223 and $1,850,167, respectively) | | $ | 222,078,418 | | | $ | 259,698,332 | |
| Other Information | |
Class A Shares outstanding at beginning of period | | | 14,042,897 | | | | 17,113,875 | |
| Shares sold | | | 442,556 | | | | 1,211,679 | |
| Shares issued to shareholders in reinvestment of distributions | | | 170,839 | | | | 190,143 | |
| Shares redeemed | | | (3,124,855 | ) | | | (4,472,800 | ) |
| Net increase (decrease) in Class A shares | | | (2,511,460 | ) | | | (3,070,978 | ) |
| Shares outstanding at end of period | | | 11,531,437 | | | | 14,042,897 | |
Class B Shares outstanding at beginning of period | | | 1,160,889 | | | | 1,321,925 | |
| Shares sold | | | 174,632 | | | | 288,710 | |
| Shares issued to shareholders in reinvestment of distributions | | | 10,581 | | | | 10,719 | |
| Shares redeemed | | | (392,399 | ) | | | (460,465 | ) |
| Net increase (decrease) in Class B shares | | | (207,186 | ) | | | (161,036 | ) |
| Shares outstanding at end of period | | | 953,703 | | | | 1,160,889 | |
The accompanying notes are an integral part of the financial statements.
| | | Years Ended December 31, | |
| Class A | | | 2014 | | | 2013 | | | 2012 | | | 2011 | | | 2010 | |
| Selected Per Share Data | |
| Net asset value, beginning of period | | $ | 17.08 | | | $ | 12.78 | | | $ | 11.36 | | | $ | 12.21 | | | $ | 10.04 | |
Income (loss) from investment operations: Net investment incomea | | | .05 | | | | .12 | | | | .14 | | | | .13 | | | | .12 | |
| Net realized and unrealized gain (loss) | | | .88 | | | | 4.35 | | | | 1.42 | | | | (.85 | ) | | | 2.19 | |
| Total from investment operations | | | .93 | | | | 4.47 | | | | 1.56 | | | | (.72 | ) | | | 2.31 | |
Less distributions from: Net investment income | | | (.14 | ) | | | (.17 | ) | | | (.14 | ) | | | (.13 | ) | | | (.14 | ) |
| Net realized gains on investment transactions | | | (.08 | ) | | | — | | | | — | | | | — | | | | — | |
| Total distributions | | | (.22 | ) | | | (.17 | ) | | | (.14 | ) | | | (.13 | ) | | | (.14 | ) |
| Net asset value, end of period | | $ | 17.79 | | | $ | 17.08 | | | $ | 12.78 | | | $ | 11.36 | | | $ | 12.21 | |
| Total Return (%) | | | 5.53 | | | | 35.24 | | | | 13.77 | | | | (6.08 | ) | | | 23.07 | |
| Ratios to Average Net Assets and Supplemental Data | |
| Net assets, end of period ($ millions) | | | 205 | | | | 240 | | | | 219 | | | | 216 | | | | 247 | |
| Ratio of expenses (%) | | | .82 | | | | .82 | | | | .82 | | | | .81 | | | | .82 | |
| Ratio of net investment income (%) | | | .32 | | | | .81 | | | | 1.18 | | | | 1.08 | | | | 1.14 | |
| Portfolio turnover rate (%) | | | 34 | | | | 115 | | | | 11 | | | | 36 | | | | 38 | |
a Based on average shares outstanding during the period. | |
| | | Years Ended December 31, | |
| Class B | | | 2014 | | | 2013 | | | 2012 | | | 2011 | | | 2010 | |
| Selected Per Share Data | |
| Net asset value, beginning of period | | $ | 17.07 | | | $ | 12.78 | | | $ | 11.36 | | | $ | 12.20 | | | $ | 10.03 | |
Income (loss) from investment operations: Net investment incomea | | | (.01 | ) | | | .07 | | | | .10 | | | | .09 | | | | .08 | |
| Net realized and unrealized gain (loss) | | | .87 | | | | 4.34 | | | | 1.42 | | | | (.85 | ) | | | 2.19 | |
| Total from investment operations | | | .86 | | | | 4.41 | | | | 1.52 | | | | (.76 | ) | | | 2.27 | |
Less distributions from: Net investment income | | | (.08 | ) | | | (.12 | ) | | | (.10 | ) | | | (.08 | ) | | | (.10 | ) |
| Net realized gains on investment transactions | | | (.08 | ) | | | — | | | | — | | | | — | | | | — | |
| Total distributions | | | (.16 | ) | | | (.12 | ) | | | (.10 | ) | | | (.08 | ) | | | (.10 | ) |
| Net asset value, end of period | | $ | 17.77 | | | $ | 17.07 | | | $ | 12.78 | | | $ | 11.36 | | | $ | 12.20 | |
| Total Return (%) | | | 5.09 | | | | 34.70 | | | | 13.38 | | | | (6.33 | ) | | | 22.66 | |
| Ratios to Average Net Assets and Supplemental Data | |
| Net assets, end of period ($ millions) | | | 17 | | | | 20 | | | | 17 | | | | 20 | | | | 26 | |
| Ratio of expenses (%) | | | 1.17 | | | | 1.17 | | | | 1.16 | | | | 1.15 | | | | 1.17 | |
| Ratio of net investment income (%) | | | (.04 | ) | | | .45 | | | | .81 | | | | .74 | | | | .79 | |
| Portfolio turnover rate (%) | | | 34 | | | | 115 | | | | 11 | | | | 36 | | | | 38 | |
a Based on average shares outstanding during the period. | |
Notes to Financial Statements
A. Organization and Significant Accounting Policies
Deutsche Small Mid Cap Value VIP (formerly DWS Small Mid Cap Value VIP) (the "Fund") is a diversified series of Deutsche Variable Series II (formerly DWS Variable Series II) (the "Trust"), which is registered under the Investment Company Act of 1940, as amended (the "1940 Act"), as an open-end management investment company organized as a Massachusetts business trust.
Multiple Classes of Shares of Beneficial Interest. The Fund offers two classes of shares (Class A shares and Class B shares). Sales of Class B shares are subject to recordkeeping fees up to 0.15% and Rule 12b-1 fees under the 1940 Act equal to an annual rate of 0.25% of the average daily net assets of the Class B shares of the Fund. Class A shares are not subject to such fees.
Investment income, realized and unrealized gains and losses, and certain fund-level expenses and expense reductions, if any, are borne pro rata on the basis of relative net assets by the holders of all classes of shares except that each class bears certain expenses unique to that class (including the applicable Rule 12b-1 fee and recordkeeping fees). Differences in class-level expenses may result in payment of different per share dividends by class. All shares have equal rights with respect to voting subject to class-specific arrangements.
The Fund's financial statements are prepared in accordance with accounting principles generally accepted in the United States of America which require the use of management estimates. Actual results could differ from those estimates. The policies described below are followed consistently by the Fund in the preparation of its financial statements.
Security Valuation. Investments are stated at value determined as of the close of regular trading on the New York Stock Exchange on each day the exchange is open for trading.
Various inputs are used in determining the value of the Fund's investments. These inputs are summarized in three broad levels. Level 1 includes quoted prices in active markets for identical securities. Level 2 includes other significant observable inputs (including quoted prices for similar securities, interest rates, prepayment speeds and credit risk). Level 3 includes significant unobservable inputs (including the Fund's own assumptions in determining the fair value of investments). The level assigned to the securities valuations may not be an indication of the risk or liquidity associated with investing in those securities.
Equity securities are valued at the most recent sale price or official closing price reported on the exchange (U.S. or foreign) or over-the-counter market on which they trade. Securities for which no sales are reported are valued at the calculated mean between the most recent bid and asked quotations on the relevant market or, if a mean cannot be determined, at the most recent bid quotation. Equity securities are generally categorized as Level 1.
Investments in open-end investment companies are valued at their net asset value each business day and are categorized as Level 1.
Securities and other assets for which market quotations are not readily available or for which the above valuation procedures are deemed not to reflect fair value are valued in a manner that is intended to reflect their fair value as determined in accordance with procedures approved by the Board and are generally categorized as Level 3. In accordance with the Fund's valuation procedures, factors considered in determining value may include, but are not limited to, the type of the security; the size of the holding; the initial cost of the security; the existence of any contractual restrictions on the security's disposition; the price and extent of public trading in similar securities of the issuer or of comparable companies; quotations or evaluated prices from broker-dealers and/or pricing services; information obtained from the issuer, analysts, and/or the appropriate stock exchange (for exchange-traded securities); an analysis of the company's or issuer's financial statements; an evaluation of the forces that influence the issuer and the market(s) in which the security is purchased and sold; and with respect to debt securities, the maturity, coupon, creditworthiness, currency denomination and the movement of the market in which the security is normally traded. The value determined under these procedures may differ from published values for the same securities.
Disclosure about the classification of fair value measurements is included in a table following the Fund's Investment Portfolio.
Foreign Currency Translations. The books and records of the Fund are maintained in U.S. dollars. Investment securities and other assets and liabilities denominated in a foreign currency are translated into U.S. dollars at the prevailing exchange rates at period end. Purchases and sales of investment securities, income and expenses are translated into U.S. dollars at the prevailing exchange rates on the respective dates of the transactions.
Net realized and unrealized gains and losses on foreign currency transactions represent net gains and losses between trade and settlement dates on securities transactions, the acquisition and disposition of foreign currencies, and the difference between the amount of net investment income accrued and the U.S. dollar amount actually received. That portion of both realized and unrealized gains and losses on investments that results from fluctuations in foreign currency exchange rates is not separately disclosed but is included with net realized and unrealized gain/appreciation and loss/depreciation on investments.
Securities Lending. Brown Brothers Harriman & Co., as lending agent, lends securities of the Fund to certain financial institutions under the terms of the Security Lending Agreement. The Fund retains the benefits of owning the securities it has loaned and continues to receive interest and dividends generated by the securities and to participate in any changes in their market value. The Fund requires the borrowers of the securities to maintain collateral with the Fund consisting of either cash or liquid, unencumbered assets having a value at least equal to the value of the securities loaned. When the collateral falls below specified amounts, the lending agent will use its best effort to obtain additional collateral on the next business day to meet required amounts under the security lending agreement. The Fund may invest the cash collateral into a joint trading account in an affiliated money market fund pursuant to Exemptive Orders issued by the SEC. The Fund receives compensation for lending its securities either in the form of fees or by earning interest on invested cash collateral net of borrower rebates and fees paid to a lending agent. Either the Fund or the borrower may terminate the loan. There may be risks of delay and costs in recovery of securities or even loss of rights in the collateral should the borrower of the securities fail financially. If the Fund is not able to recover securities lent, the Fund may sell the collateral and purchase a replacement investment in the market, incurring the risk that the value of the replacement security is greater than the value of the collateral. The Fund is also subject to all investment risks associated with the reinvestment of any cash collateral received, including, but not limited to, interest rate, credit and liquidity risk associated with such investments. For the year ended December 31, 2014, the Fund had no securities on loan.
Taxes. The Fund's policy is to comply with the requirements of the Internal Revenue Code, as amended, which are applicable to regulated investment companies and to distribute all of its taxable income to its shareholders.
The Fund has reviewed the tax positions for the open tax years as of December 31, 2014 and has determined that no provision for income tax and/or uncertain tax provisions is required in the Fund's financial statements. The Fund's federal tax returns for the prior three fiscal years remain open subject to examination by the Internal Revenue Service.
Distribution of Income and Gains. Distributions from net investment income of the Fund, if any, are declared and distributed to shareholders annually. Net realized gains from investment transactions, in excess of available capital loss carryforwards, would be taxable to the Fund if not distributed and, therefore, will be distributed to shareholders at least annually. The Fund may also make additional distributions for tax purposes if necessary.
The timing and characterization of certain income and capital gain distributions are determined annually in accordance with federal tax regulations which may differ from accounting principles generally accepted in the United States of America. These differences primarily relate to income received from Real Estate Investment Trusts and certain securities sold at a loss. As a result, net investment income (loss) and net realized gain (loss) on investment transactions for a reporting period may differ significantly from distributions during such period. Accordingly, the Fund may periodically make reclassifications among certain of its capital accounts without impacting the net asset value of the Fund.
At December 31, 2014, the Fund's components of distributable earnings on a tax basis were as follows:
| Undistributed ordinary income* | | $ | 9,467,194 | |
| Undistributed net long-term capital gains | | $ | 9,673,692 | |
| Unrealized appreciation (depreciation) on investments | | $ | 28,796,085 | |
In addition, the tax character of distributions paid by the Fund is summarized as follows:
| | | Years Ended December 31, | |
| | | 2014 | | | 2013 | |
| Distributions from ordinary income* | | $ | 1,867,624 | | | $ | 2,810,376 | |
| Distributions from long-term capital gains | | $ | 1,156,865 | | | $ | — | |
* For tax purposes, short-term capital gain distributions are considered ordinary income distributions.
Expenses. Expenses of the Trust arising in connection with a specific fund are allocated to that fund. Other Trust expenses which cannot be directly attributed to a fund are apportioned among the funds in the Trust based upon the relative net assets or other appropriate measures.
Contingencies. In the normal course of business, the Fund may enter into contracts with service providers that contain general indemnification clauses. The Fund's maximum exposure under these arrangements is unknown as this would involve future claims that may be made against the Fund that have not yet been made. However, based on experience, the Fund expects the risk of loss to be remote.
Real Estate Investment Trusts. The Fund periodically recharacterizes distributions received from a Real Estate Investment Trust ("REIT") investment based on information provided by the REIT into the following categories: ordinary income, long-term and short-term capital gains, and return of capital. If information is not available timely from a REIT, the recharacterization will be estimated for financial reporting purposes and a recharacterization will be made to the accounting records in the following year when such information becomes available. Distributions received from REITs in excess of income are recorded as either a reduction of cost of investments or realized gains. The Fund distinguishes between dividends received on a tax basis and a financial reporting basis and only distributions in excess of tax basis earnings and profits are reported in the financial statements as a return of capital.
Other. Investment transactions are accounted for on a trade date plus one basis for daily net asset value calculations. However, for financial reporting purposes, investment transactions are reported on trade date. Interest income is recorded on the accrual basis. Dividend income is recorded on the ex-dividend date net of foreign withholding taxes. Realized gains and losses from investment transactions are recorded on an identified cost basis. Proceeds from litigation payments, if any, are included in net realized gain (loss) from investments.
B. Purchases and Sales of Securities
During the year ended December 31, 2014, purchases and sales of investment transactions (excluding short-term investments) aggregated $75,991,609 and $121,788,244, respectively.
C. Related Parties
Management Agreement. Under the Investment Management Agreement with Deutsche Investment Management Americas Inc. ("DIMA" or the "Advisor"), an indirect, wholly owned subsidiary of Deutsche Bank AG, the Advisor directs the investments of the Fund in accordance with its investment objectives, policies and restrictions. The Advisor determines the securities, instruments and other contracts relating to investments to be purchased, sold or entered into by the Fund.
Pursuant to the Investment Management Agreement with the Advisor, the Fund pays a monthly management fee based on the Fund's average daily net assets, computed and accrued daily and payable monthly, at the following annual rates:
| First $250 million | | | .650 | % |
| Next $750 million | | | .620 | % |
| Next $1.5 billion | | | .600 | % |
| Next $2.5 billion | | | .580 | % |
| Next $2.5 billion | | | .550 | % |
| Next $2.5 billion | | | .540 | % |
| Next $2.5 billion | | | .530 | % |
| Over $12.5 billion | | | .520 | % |
Accordingly, for the year ended December 31, 2014, the fee pursuant to the Investment Management Agreement was equivalent to an annual rate (exclusive of any applicable waivers/reimbursements) of 0.65% of the Fund's average daily net assets.
For the period from January 1, 2014 through September 30, 2014, the Advisor had contractually agreed to waive its fees and/or reimburse certain operating expenses to the extent necessary to maintain the total annual operating expenses (excluding certain expenses such as extraordinary expenses, taxes, brokerage and interest expense) of each class as follows:
Effective October 1, 2014 through September 30, 2015, the Advisor has contractually agreed to waive its fees and/or reimburse certain operating expenses to the extent necessary to maintain the total annual operating expenses (excluding certain expenses such as extraordinary expenses, taxes, brokerage and interest) of each class as follows:
Administration Fee. Pursuant to an Administrative Services Agreement, DIMA provides most administrative services to the Fund. For all services provided under the Administrative Services Agreement, the Fund pays DIMA an annual fee ("Administration Fee") of 0.10% of the Fund's average daily net assets, computed and accrued daily and payable monthly. For the year ended December 31, 2014, the Administration Fee was $235,405, of which $18,743 is unpaid.
Service Provider Fees. DeAWM Service Company ("DSC"), an affiliate of the Advisor, is the transfer agent, dividend-paying agent and shareholder service agent for the Fund. Pursuant to a sub-transfer agency agreement between DSC and DST Systems, Inc. ("DST"), DSC has delegated certain transfer agent, dividend-paying agent and shareholder service agent functions to DST. DSC compensates DST out of the shareholder servicing fee it receives from the Fund. For the year ended December 31, 2014, the amounts charged to the Fund by DSC were as follows:
| Service to Shareholders | | Total Aggregated | | | Unpaid at December 31, 2014 | |
| Class A | | $ | 637 | | | $ | 115 | |
| Class B | | | 574 | | | | 94 | |
| | | $ | 1,211 | | | $ | 209 | |
Distribution Service Agreement. Under the Fund's Class B 12b-1 plan, DeAWM Distributors, Inc. ("DDI") received a fee ("Distribution Service Fee") of 0.25% of average daily net assets of Class B shares. For the year ended December 31, 2014, the Distribution Service Fee aggregated $44,841, of which $3,591 is unpaid.
Typesetting and Filing Service Fees. Under an agreement with DIMA, DIMA is compensated for providing typesetting and certain regulatory filing services to the Fund. For the year ended December 31, 2014, the amount charged to the Fund by DIMA included in the Statement of Operations under "Reports to shareholders" aggregated $13,019, of which $4,186 is unpaid.
Trustees' Fees and Expenses. The Fund paid retainer fees to each Trustee not affiliated with the Advisor, plus specified amounts to the Board Chairperson and Vice Chairperson and to each committee Chairperson.
Affiliated Cash Management Vehicles. The Fund may invest uninvested cash balances in Central Cash Management Fund and Deutsche Variable NAV Money Fund, affiliated money market funds which are managed by the Advisor. Each affiliated money market fund seeks to provide a high level of current income consistent with liquidity and the preservation of capital. Each affiliated money market fund is managed in accordance with Rule 2a-7 under the Investment Company Act of 1940, which governs the quality, maturity, diversity and liquidity of instruments in which a money market fund may invest. Central Cash Management Fund seeks to maintain a stable net asset value, and Deutsche Variable NAV Money Fund maintains a floating net asset value. The Fund indirectly bears its proportionate share of the expenses of each affiliated money market fund in which it invests. Central Cash Management Fund does not pay the Advisor an investment management fee. To the extent that Deutsche Variable NAV Money Fund pays an investment management fee to the Advisor, the Advisor will waive an amount of the investment management fee payable to the Advisor by the Fund equal to the amount of the investment management fee payable on the Fund's assets invested in Deutsche Variable NAV Money Fund.
D. Ownership of the Fund
At December 31, 2014, two participating insurance companies were owners of record of 10% or more of the total outstanding Class A shares of the Fund, each owning 59% and 21%. Three participating insurance companies were owners of record of 10% or more of the total outstanding Class B shares of the Fund, each owning 39%, 24% and 14%.
E. Line of Credit
The Fund and other affiliated funds (the "Participants") share in a $400 million revolving credit facility provided by a syndication of banks. The Fund may borrow for temporary or emergency purposes, including the meeting of redemption requests that otherwise might require the untimely disposition of securities. The Participants are charged an annual commitment fee which is allocated based on net assets, among each of the Participants. Interest is calculated at a rate per annum equal to the sum of the Federal Funds Rate plus 1.25 percent plus if LIBOR exceeds the Federal Funds Rate the amount of such excess. The Fund may borrow up to a maximum of 33 percent of its net assets under the agreement. The Fund had no outstanding loans at December 31, 2014.
Report of Independent Registered Public Accounting Firm
To the Board of Trustees of Deutsche Variable Series II and Shareholders of Deutsche Small Mid Cap Value VIP:
We have audited the accompanying statement of assets and liabilities, including the investment portfolio, of Deutsche Small Mid Cap Value VIP (formerly DWS Small Mid Cap Value VIP) (the "Fund") (one of the series constituting Deutsche Variable Series II (formerly DWS Variable Series II)), as of December 31, 2014, and the related statement of operations for the year then ended, the statements of changes in net assets for each of the two years in the period then ended, and the financial highlights for each of the periods indicated therein. These financial statements and financial highlights are the responsibility of the Fund’s management. Our responsibility is to express an opinion on these financial statements and financial highlights based on our audits.
We conducted our audits in accordance with the standards of the Public Company Accounting Oversight Board (United States). Those standards require that we plan and perform the audit to obtain reasonable assurance about whether the financial statements and financial highlights are free of material misstatement. We were not engaged to perform an audit of the Fund’s internal control over financial reporting. Our audits included consideration of internal control over financial reporting as a basis for designing audit procedures that are appropriate in the circumstances, but not for the purpose of expressing an opinion on the effectiveness of the Fund’s internal control over financial reporting. Accordingly, we express no such opinion. An audit also includes examining, on a test basis, evidence supporting the amounts and disclosures in the financial statements and financial highlights, assessing the accounting principles used and significant estimates made by management, and evaluating the overall financial statement presentation. Our procedures included confirmation of securities owned as of December 31, 2014, by correspondence with the custodian and brokers. We believe that our audits provide a reasonable basis for our opinion.
In our opinion, the financial statements and financial highlights referred to above present fairly, in all material respects, the financial position of Deutsche Small Mid Cap Value VIP at December 31, 2014, the results of its operations for the year then ended, the changes in its net assets for each of the two years in the period then ended, and the financial highlights for each of the periods indicated therein, in conformity with U.S. generally accepted accounting principles.
| | | |
Boston, Massachusetts February 13, 2015 | | |
Information About Your Fund's Expenses (Unaudited)
As an investor of the Fund, you incur two types of costs: ongoing expenses and transaction costs. Ongoing expenses include management fees, distribution and service (12b-1) fees and other Fund expenses. Examples of transaction costs include contract charges, which are not shown in this section. The following tables are intended to help you understand your ongoing expenses (in dollars) of investing in the Fund and to help you compare these expenses with the ongoing expenses of investing in other mutual funds. The example in the table is based on an investment of $1,000 invested at the beginning of the six-month period and held for the entire period (July 1, 2014 to December 31, 2014).
The tables illustrate your Fund's expenses in two ways:
—Actual Fund Return. This helps you estimate the actual dollar amount of ongoing expenses (but not transaction costs) paid on a $1,000 investment in the Fund using the Fund's actual return during the period. To estimate the expenses you paid over the period, simply divide your account value by $1,000 (for example, an $8,600 account value divided by $1,000 = 8.6), then multiply the result by the number in the "Expenses Paid per $1,000" line under the share class you hold.
—Hypothetical 5% Fund Return. This helps you to compare your Fund's ongoing expenses (but not transaction costs) with those of other mutual funds using the Fund's actual expense ratio and a hypothetical rate of return of 5% per year before expenses. Examples using a 5% hypothetical Fund return may be found in the shareholder reports of other mutual funds. The hypothetical account values and expenses may not be used to estimate the actual ending account balance or expenses you paid for the period.
Please note that the expenses shown in these tables are meant to highlight your ongoing expenses only and do not reflect any transaction costs. The "Expenses Paid per $1,000" line of the tables is useful in comparing ongoing expenses only and will not help you determine the relative total expense of owning different funds. If these transaction costs had been included, your costs would have been higher.
Expenses and Value of a $1,000 Investment for the six months ended December 31, 2014 | |
| Actual Fund Return | | Class A | | | Class B | |
| Beginning Account Value 7/1/14 | | $ | 1,000.00 | | | $ | 1,000.00 | |
| Ending Account Value 12/31/14 | | $ | 1,002.80 | | | $ | 1,001.10 | |
| Expenses Paid per $1,000* | | $ | 4.14 | | | $ | 5.90 | |
| Hypothetical 5% Fund Return | | Class A | | | Class B | |
| Beginning Account Value 7/1/14 | | $ | 1,000.00 | | | $ | 1,000.00 | |
| Ending Account Value 12/31/14 | | $ | 1,021.07 | | | $ | 1,019.31 | |
| Expenses Paid per $1,000* | | $ | 4.18 | | | $ | 5.96 | |
* Expenses are equal to the Fund's annualized expense ratio for each share class, multiplied by the average account value over the period, multiplied by 184 (the number of days in the most recent six-month period), then divided by 365.
| Annualized Expense Ratios | Class A | | Class B | |
| Deutsche Variable Series II — Deutsche Small Mid Cap Value VIP | .82% | | 1.17% | |
For more information, please refer to the Fund's prospectus.
These tables do not reflect charges and fees ("contract charges") associated with the separate account that invests in the Fund or any variable life insurance policy or variable annuity contract for which the Fund is an investment option.
For an analysis of the fees associated with an investment in the fund or similar funds, please refer to the current and hypothetical expense calculators for Variable Insurance Products which can be found at deutschefunds.com/EN/resources/calculators.jsp.
Tax Information (Unaudited)
Please consult a tax advisor if you have questions about federal or state income tax laws, or on how to prepare your tax returns. If you have specific questions about your account, please contact your insurance provider.
The Fund paid distributions of $0.08 per share from net long-term capital gains during its year ended December 31, 2014.
Pursuant to Section 852 of the Internal Revenue Code, the Fund designates $10,718,000 as capital gain dividends for its year ended December 31, 2014.
For corporate shareholders, 84% of the ordinary dividends (i.e., income dividends plus short-term capital gains) paid during the Fund's fiscal year ended December 31, 2014, qualified for the dividends received deduction.
The Trust's policies and procedures for voting proxies for portfolio securities and information about how the Trust voted proxies related to its portfolio securities during the 12-month period ended June 30 are available on our Web site — deutschefunds.com (click on "proxy voting" at the bottom of the page) — or on the SEC's Web site — sec.gov. To obtain a written copy of the Trust's policies and procedures without charge, upon request, call us toll free at (800) 728-3337.
Advisory Agreement Board Considerations and Fee Evaluation
The Board of Trustees approved the renewal of Deutsche Small Mid Cap Value VIP’s investment management agreement (the "Agreement") with Deutsche Investment Management Americas Inc. ("DIMA") in September 2014.
In terms of the process that the Board followed prior to approving the Agreement, shareholders should know that:
— In September 2014, all of the Fund’s Trustees were independent of DIMA and its affiliates.
— The Trustees met frequently during the past year to discuss fund matters and dedicated a substantial amount of time to contract review matters. Over the course of several months, the Board’s Contract Committee, in coordination with the Board’s Equity Oversight Committee, reviewed comprehensive materials received from DIMA, independent third parties and independent counsel. These materials included an analysis of the Fund’s performance, fees and expenses, and profitability compiled by a fee consultant retained by the Fund’s Independent Trustees (the "Fee Consultant"). The Board also received extensive information throughout the year regarding performance of the Fund.
— The Independent Trustees regularly meet privately with counsel to discuss contract review and other matters. In addition, the Independent Trustees were advised by the Fee Consultant in the course of their review of the Fund’s contractual arrangements and considered a comprehensive report prepared by the Fee Consultant in connection with their deliberations.
— In connection with reviewing the Agreement, the Board also reviewed the terms of the Fund’s Rule 12b-1 plan, distribution agreement, administrative services agreement, transfer agency agreement and other material service agreements.
— Based on its evaluation of the information provided, the Contract Committee presented its findings and recommendations to the Board. The Board then reviewed the Contract Committee’s findings and recommendations.
In connection with the contract review process, the Contract Committee and the Board considered the factors discussed below, among others. The Board also considered that DIMA and its predecessors have managed the Fund since its inception, and the Board believes that a long-term relationship with a capable, conscientious advisor is in the best interests of the Fund. The Board considered, generally, that shareholders chose to invest or remain invested in the Fund knowing that DIMA managed the Fund, and that the Agreement was approved by the Fund’s shareholders. DIMA is part of Deutsche Bank AG ("DB"), a major global banking institution that is engaged in a wide range of financial services. The Board believes that there are advantages to being part of a global asset management business that offers a wide range of investing expertise and resources, including hundreds of portfolio managers and analysts with research capabilities in many countries throughout the world.
As part of the contract review process, the Board carefully considered the fees and expenses of each Deutsche fund overseen by the Board in light of the fund’s performance. In many cases, this led to the negotiation and implementation of expense caps. As part of these negotiations, the Board indicated that it would consider relaxing these caps in future years following sustained improvements in performance, among other considerations.
In 2012, DB combined its Asset Management (of which DIMA was a part) and Wealth Management divisions into a new Asset and Wealth Management ("AWM") division. DB has advised the Independent Trustees that the U.S. asset management business is a critical and integral part of DB, and that DB will continue to invest in AWM a significant portion of the savings it has realized by combining its Asset and Wealth Management divisions, including ongoing enhancements to AWM’s investment capabilities. DB also has confirmed its commitment to maintaining strong legal and compliance groups within the AWM division.
While shareholders may focus primarily on fund performance and fees, the Fund’s Board considers these and many other factors, including the quality and integrity of DIMA’s personnel and such other issues as back-office operations, fund valuations, and compliance policies and procedures.
Nature, Quality and Extent of Services. The Board considered the terms of the Agreement, including the scope of advisory services provided under the Agreement. The Board noted that, under the Agreement, DIMA provides portfolio management services to the Fund and that, pursuant to a separate administrative services agreement, DIMA provides administrative services to the Fund. The Board considered the experience and skills of senior management and investment personnel, the resources made available to such personnel, the ability of DIMA to attract and retain high-quality personnel, and the organizational depth and stability of DIMA. The Board reviewed the Fund’s performance over short-term and long-term periods and compared those returns to various agreed-upon performance measures, including market index(es) and a peer universe compiled by the Fee Consultant using information supplied by Morningstar Direct ("Morningstar"), an independent fund data service. The Board also noted that it has put into place a process of identifying "Focus Funds" (e.g., funds performing poorly relative to a peer universe), and receives more frequent reporting and information from DIMA regarding such funds, along with DIMA’s plans to address underperformance. The Board believes this process is an effective manner of identifying and addressing underperforming funds. Based on the information provided, the Board noted that for the one-, three- and five-year periods ended December 31, 2013, the Fund’s performance (Class A shares) was in the 2nd quartile, 4th quartile and 4th quartile, respectively, of the applicable Morningstar universe (the 1st quartile being the best performers and the 4th quartile being the worst performers). The Board also observed that the Fund has outperformed its benchmark in the one-year period and has underperformed its benchmark in the three- and five-year periods ended December 31, 2013. The Board noted the disappointing investment performance of the Fund in some past periods and continued to discuss with senior management of DIMA the factors contributing to such underperformance and actions being taken to improve performance. The Board observed that the Fund had experienced improved relative performance in 2013. The Board recognized the efforts by DIMA in recent years to enhance its investment platform and improve long-term performance across the Deutsche fund complex.
Fees and Expenses. The Board considered the Fund’s investment management fee schedule, operating expenses and total expense ratios, and comparative information provided by Lipper Inc. ("Lipper") and the Fee Consultant regarding investment management fee rates paid to other investment advisors by similar funds (1st quartile being the most favorable and 4th quartile being the least favorable). With respect to management fees paid to other investment advisors by similar funds, the Board noted that the contractual fee rates paid by the Fund, which include a 0.10% fee paid to DIMA under the Fund’s administrative services agreement, were lower than the median (1st quartile) of the applicable Lipper peer group (based on Lipper data provided as of December 31, 2013). The Board noted that the Fund’s Class A shares total (net) operating expenses were expected to be lower than the median (2nd quartile) of the applicable Lipper expense universe (based on Lipper data provided as of December 31, 2013, and analyzing Lipper expense universe Class A (net) expenses less any applicable 12b-1 fees) ("Lipper Universe Expenses"). The Board also reviewed data comparing each share class’s total (net) operating expenses to the applicable Lipper Universe Expenses. The Board also considered how the Fund’s total (net) operating expenses compared to the total (net) operating expenses of a more customized peer group selected by Lipper (based on such factors as asset size). The Board noted that the expense limitations agreed to by DIMA helped to ensure that the Fund’s total (net) operating expenses would remain competitive. The Board considered the Fund’s management fee rate as compared to fees charged by DIMA to a comparable fund and considered differences between the Fund and the comparable fund. The information requested by the Board as part of its review of fees and expenses also included information about institutional accounts and funds offered primarily to European investors ("Deutsche Europe funds") managed by DIMA and its affiliates. The Board noted that DIMA indicated that it does not manage any institutional accounts or Deutsche Europe funds comparable to the Fund.
On the basis of the information provided, the Board concluded that management fees were reasonable and appropriate in light of the nature, quality and extent of services provided by DIMA.
Profitability. The Board reviewed detailed information regarding revenues received by DIMA under the Agreement. The Board considered the estimated costs and pre-tax profits realized by DIMA from advising the Deutsche U.S. mutual funds ("Deutsche Funds"), as well as estimates of the pre-tax profits attributable to managing the Fund in particular. The Board also received information regarding the estimated enterprise-wide profitability of DIMA and its affiliates with respect to all fund services in totality and by fund. The Board and the Fee Consultant reviewed DIMA’s methodology in allocating its costs to the management of the Fund. Based on the information provided, the Board concluded that the pre-tax profits realized by DIMA in connection with the management of the Fund were not unreasonable.
Economies of Scale. The Board considered whether there are economies of scale with respect to the management of the Fund and whether the Fund benefits from any economies of scale. The Board noted that the Fund’s management fee schedule includes fee breakpoints. The Board concluded that the Fund’s fee schedule represents an appropriate sharing between the Fund and DIMA of such economies of scale as may exist in the management of the Fund at current asset levels.
Other Benefits to DIMA and Its Affiliates. The Board also considered the character and amount of other incidental benefits received by DIMA and its affiliates, including any fees received by DIMA for administrative services provided to the Fund and any fees received by an affiliate of DIMA for distribution services. The Board also considered benefits to DIMA related to brokerage and soft-dollar allocations, including allocating brokerage to pay for research generated by parties other than the executing broker dealers, which pertain primarily to funds investing in equity securities, along with the incidental public relations benefits to DIMA related to Deutsche Funds advertising and cross-selling opportunities among DIMA products and services. The Board concluded that management fees were reasonable in light of these fallout benefits.
Compliance. The Board considered the significant attention and resources dedicated by DIMA to documenting and enhancing its compliance processes in recent years. The Board noted in particular (i) the experience and seniority of DIMA’s and the Fund’s chief compliance officer; (ii) the large number of DIMA compliance personnel; and (iii) the substantial commitment of resources by DIMA and its affiliates to compliance matters.
Based on all of the information considered and the conclusions reached, the Board unanimously determined that the continuation of the Agreement is in the best interests of the Fund. In making this determination, the Board did not give particular weight to any single factor identified above. The Board considered these factors over the course of numerous meetings, certain of which were in executive session with only the Independent Trustees and counsel present. It is possible that individual Trustees may have weighed these factors differently in reaching their individual decisions to approve the continuation of the Agreement.
Board Members and Officers
The following table presents certain information regarding the Board Members and Officers of the fund. Each Board Member's year of birth is set forth in parentheses after his or her name. Unless otherwise noted, (i) each Board Member has engaged in the principal occupation(s) noted in the table for at least the most recent five years, although not necessarily in the same capacity; and (ii) the address of each Independent Board Member is c/o Kenneth C. Froewiss, Chairman, Deutsche Mutual Funds, P.O. Box 390601, Cambridge, MA 02139. Except as otherwise noted below, the term of office for each Board Member is until the election and qualification of a successor, or until such Board Member sooner dies, resigns, is removed or as otherwise provided in the governing documents of the fund. Because the fund does not hold an annual meeting of shareholders, each Board Member will hold office for an indeterminate period. The Board Members may also serve in similar capacities with other funds in the fund complex.
| Independent Board Members |
Name, Year of Birth, Position with the Fund and Length of Time Served1 | | Business Experience and Directorships During the Past Five Years | Number of Funds in Deutsche Fund Complex Overseen | Other Directorships Held by Board Member |
Kenneth C. Froewiss (1945) Chairperson since 2013, and Board Member since 2001 | | Adjunct Professor of Finance, NYU Stern School of Business (September 2009–present; Clinical Professor from 1997–September 2009); Member, Finance Committee, Association for Asian Studies (2002–present); Director, Mitsui Sumitomo Insurance Group (US) (2004–present); prior thereto, Managing Director, J.P. Morgan (investment banking firm) (until 1996) | 105 | — |
William McClayton (1944) Vice Chairperson since 2013, and Board Member since 2004 | | Private equity investor (since October 2009); previously, Managing Director, Diamond Management & Technology Consultants, Inc. (global consulting firm) (2001–2009); Directorship: Board of Managers, YMCA of Metropolitan Chicago; formerly: Senior Partner, Arthur Andersen LLP (accounting) (1966–2001); Trustee, Ravinia Festival | 105 | — |
John W. Ballantine (1946) Board Member since 1999 | | Retired; formerly, Executive Vice President and Chief Risk Management Officer, First Chicago NBD Corporation/The First National Bank of Chicago (1996–1998); Executive Vice President and Head of International Banking (1995–1996); former Directorships: Director and former Chairman of the Board, Healthways, Inc.2 (provider of disease and care management services) (2003–2014); Stockwell Capital Investments PLC (private equity); First Oak Brook Bancshares, Inc. and Oak Brook Bank; Prisma Energy International | 105 | Portland General Electric2 (utility company) (2003– present) |
Henry P. Becton, Jr. (1943) Board Member since 1990 | | Vice Chair and former President, WGBH Educational Foundation. Directorships: Public Radio International; Public Radio Exchange (PRX); North Bennett Street School (Boston); former Directorships: Belo Corporation2 (media company); The PBS Foundation; Association of Public Television Stations; Boston Museum of Science; American Public Television; Concord Academy; New England Aquarium; Mass. Corporation for Educational Telecommunications; Committee for Economic Development; Public Broadcasting Service; Connecticut College | 105 | Lead Director, Becton Dickinson and Company2 (medical technology company) |
Dawn-Marie Driscoll (1946) Board Member since 1987 | | Emeritus Executive Fellow, Center for Business Ethics, Bentley University; formerly: President, Driscoll Associates (consulting firm); Partner, Palmer & Dodge (law firm) (1988–1990); Vice President of Corporate Affairs and General Counsel, Filene's (retail) (1978–1988). Directorships: Director of ICI Mutual Insurance Company (since 2007); Advisory Board, Center for Business Ethics, Bentley University; Trustee and former Chairman of the Board, Southwest Florida Community Foundation (charitable organization); former Directorships: Sun Capital Advisers Trust (mutual funds) (2007–2012), Investment Company Institute (audit, executive, nominating committees) and Independent Directors Council (governance, executive committees) | 105 | — |
Keith R. Fox, CFA (1954) Board Member since 1996 | | Managing General Partner, Exeter Capital Partners (a series of private investment funds) (since 1986). Directorships: Progressive International Corporation (kitchen goods importer and distributor); The Kennel Shop (retailer); former Chairman, National Association of Small Business Investment Companies; former Directorships: BoxTop Media Inc. (advertising); Sun Capital Advisers Trust (mutual funds) (2011–2012) | 105 | — |
Paul K. Freeman (1950) Board Member since 1993 | | Consultant, World Bank/Inter-American Development Bank; Chair, Independent Directors Council; Investment Company Institute (executive and nominating committees); formerly, Chairman of Education Committee of Independent Directors Council; Project Leader, International Institute for Applied Systems Analysis (1998–2001); Chief Executive Officer, The Eric Group, Inc. (environmental insurance) (1986–1998); Directorships: Denver Zoo Foundation (December 2012–present); former Directorships: Prisma Energy International | 105 | — |
Richard J. Herring (1946) Board Member since 1990 | | Jacob Safra Professor of International Banking and Professor, Finance Department, The Wharton School, University of Pennsylvania (since July 1972); Co-Director, Wharton Financial Institutions Center; Co-Chair, U.S. Shadow Financial Regulatory Committee; Executive Director, Financial Economists Roundtable; formerly: Vice Dean and Director, Wharton Undergraduate Division (July 1995–June 2000); Director, Lauder Institute of International Management Studies (July 2000–June 2006) | 105 | Director, Aberdeen Singapore and Japan Funds (since 2007); Independent Director of Barclays Bank Delaware (since September 2010) |
Rebecca W. Rimel (1951) Board Member since 1995 | | President and Chief Executive Officer, The Pew Charitable Trusts (charitable organization) (1994 to present); formerly: Executive Vice President, The Glenmede Trust Company (investment trust and wealth management) (1983–2004); Board Member, Investor Education (charitable organization) (2004–2005); Trustee, Executive Committee, Philadelphia Chamber of Commerce (2001–2007); Director, Viasys Health Care2 (January 2007–June 2007); Trustee, Thomas Jefferson Foundation (charitable organization) (1994–2012) | 105 | Director, Becton Dickinson and Company2 (medical technology company) (2012– present); Director, BioTelemetry Inc.2 (health care) (2009– present) |
William N. Searcy, Jr. (1946) Board Member since 1993 | | Private investor since October 2003; formerly: Pension & Savings Trust Officer, Sprint Corporation2 (telecommunications) (November 1989–September 2003); Trustee, Sun Capital Advisers Trust (mutual funds) (1998–2012) | 105 | — |
Jean Gleason Stromberg (1943) Board Member since 1997 | | Retired. Formerly, Consultant (1997–2001); Director, Financial Markets U.S. Government Accountability Office (1996–1997); Partner, Norton Rose Fulbright, L.L.P. (law firm) (1978–1996). Directorships: The William and Flora Hewlett Foundation (charitable organization); former Directorships: Service Source, Inc. (nonprofit), Mutual Fund Directors Forum (2002–2004), American Bar Retirement Association (funding vehicle for retirement plans) (1987–1990 and 1994–1996) | 105 | — |
Robert H. Wadsworth* (1940) Board Member since 1999 | | President, Robert H. Wadsworth & Associates, Inc. (consulting firm) (1983 to present); Director, The Phoenix Boys Choir Association | 105 | — |
Officers4 |
Name, Year of Birth, Position with the Fund and Length of Time Served5 | | Business Experience and Directorships During the Past Five Years |
Brian E. Binder8 (1972) President and Chief Executive Officer, 2013–present | | Managing Director3 and Head of Fund Administration, Deutsche Asset & Wealth Management (2013–present); formerly: Head of Business Management and Consulting at Invesco, Ltd. (2010–2012); Chief Administrative Officer, Van Kampen Funds Inc. (2008–2010); and Chief Administrative Officer, Morgan Stanley Investment Management Americas Distribution (2003–2008) |
John Millette7 (1962) Vice President and Secretary, 1999–present | | Director,3 Deutsche Asset & Wealth Management |
Melinda Morrow6 (1970) Vice President, 2012��present | | Director,3 Deutsche Asset & Wealth Management |
Paul H. Schubert6 (1963) Chief Financial Officer, 2004–present Treasurer, 2005–present | | Managing Director,3 Deutsche Asset & Wealth Management (since July 2004); formerly: Executive Director, Head of Mutual Fund Services and Treasurer for UBS Family of Funds (1998–2004); Vice President and Director of Mutual Fund Finance at UBS Global Asset Management (1994–1998) |
Caroline Pearson7 (1962) Chief Legal Officer, 2010–present | | Managing Director,3 Deutsche Asset & Wealth Management; formerly: Assistant Secretary for DWS family of funds (1997–2010) |
Robert Kloby6 (1962) Chief Compliance Officer, 2006–present | | Managing Director,3 Deutsche Asset & Wealth Management |
Wayne Salit6 (1967) Anti-Money Laundering Compliance Officer, 2014–present | | Director,3 Deutsche Asset & Wealth Management; formerly: Managing Director, AML Compliance Officer at BNY Mellon (2011–2014); and Director, AML Compliance Officer at Deutsche Bank (2004–2011) |
Hepsen Uzcan7 (1974) Assistant Secretary, 2013–present | | Director,3 Deutsche Asset & Wealth Management |
Paul Antosca7 (1957) Assistant Treasurer, 2007–present | | Director,3 Deutsche Asset & Wealth Management |
Jack Clark7 (1967) Assistant Treasurer, 2007–present | | Director,3 Deutsche Asset & Wealth Management |
Diane Kenneally7 (1966) Assistant Treasurer, 2007–present | | Director,3 Deutsche Asset & Wealth Management |
1 The length of time served represents the year in which the Board Member joined the board of one or more Deutsche funds currently overseen by the Board.
2 A publicly held company with securities registered pursuant to Section 12 of the Securities Exchange Act of 1934.
3 Executive title, not a board directorship.
4 As a result of their respective positions held with the Advisor, these individuals are considered "interested persons" of the Advisor within the meaning of the 1940 Act. Interested persons receive no compensation from the fund.
5 The length of time served represents the year in which the officer was first elected in such capacity for one or more Deutsche funds.
6 Address: 60 Wall Street, New York, NY 10005.
7 Address: One Beacon Street, Boston, MA 02108.
8 Address: 222 South Riverside Plaza, Chicago, IL 60606.
* Robert H. Wadsworth retired from the Board effective December 31, 2014.
The fund's Statement of Additional Information ("SAI") includes additional information about the Board Members. The SAI is available, without charge, upon request. If you would like to request a copy of the SAI, you may do so by calling the following toll-free number: (800) 728-3337.
DeAWM Distributors, Inc.
222 South Riverside Plaza
Chicago, IL 60606
(800) 621-1148
VS2SMCV-2 (R-025829-4 2/15)
December 31, 2014
Annual Report
Deutsche Variable Series II
(formerly DWS Variable Series II)
Deutsche Unconstrained Income VIP
(formerly DWS Unconstrained Income VIP)
Contents
21 Statement of Assets and Liabilities 22 Statement of Operations 23 Statement of Changes in Net Assets 25 Notes to Financial Statements 34 Report of Independent Registered Public Accounting Firm 35 Information About Your Fund's Expenses 37 Advisory Agreement Board Considerations and Fee Evaluation 40 Board Members and Officers |
This report must be preceded or accompanied by a prospectus. To obtain an additional prospectus or summary prospectus, if available, call (800) 728-3337 or your financial representative. We advise you to consider the Fund's objectives, risks, charges and expenses carefully before investing. The summary prospectus and prospectus contain this and other important information about the Fund. Please read the prospectus carefully before you invest.
Bond investments are subject to interest-rate, credit, liquidity and market risks to varying degrees. When interest rates rise, bond prices generally fall. Credit risk refers to the ability of an issuer to make timely payments of principal and interest. Investments in lower-quality ("junk bonds") and non-rated securities present greater risk of loss than investments in higher-quality securities. Investing in derivatives entails special risks relating to liquidity, leverage and credit that may reduce returns and/or increase volatility. Investing in foreign securities, particularly those of emerging markets, presents certain risks, such as currency fluctuations, political and economic changes, and market risks. The Fund may lend securities to approved institutions. See the prospectus for details.
Deutsche Asset & Wealth Management represents the asset management and wealth management activities conducted by Deutsche Bank AG or any of its subsidiaries, including the Advisor and DeAWM Distributors, Inc.
NOT FDIC/NCUA INSURED NO BANK GUARANTEE MAY LOSE VALUE NOT A DEPOSIT
NOT INSURED BY ANY FEDERAL GOVERNMENT AGENCY
Performance Summary December 31, 2014 (Unaudited)
Fund performance shown is historical, assumes reinvestment of all dividend and capital gain distributions and does not guarantee future results. Investment return and principal value fluctuate with changing market conditions so that, when redeemed, shares may be worth more or less than their original cost. Current performance may be lower or higher than the performance data quoted. Please contact your participating insurance company for the Fund's most recent month-end performance. Performance doesn't reflect charges and fees ("contract charges") associated with the separate account that invests in the Fund or any variable life insurance policy or variable annuity contract for which the Fund is an investment option. These charges and fees will reduce returns.
The gross expense ratio of the Fund, as stated in the fee table of the prospectus dated May 1, 2014 is 1.02% for Class A shares and may differ from the expense ratio disclosed in the Financial Highlights table in this report.
| Growth of an Assumed $10,000 Investment in Deutsche Unconstrained Income VIP |
| The Barclays U.S. Universal Index represents the union of the U.S. Aggregate Index, the U.S. High-Yield Corporate Index, the 144A Index, the Eurodollar Index, the Emerging Markets Index and the non-ERISA portion of the CMBS Index. The Barclays U.S. Aggregate Bond Index is an unmanaged index representing domestic taxable investment-grade bonds, with index components for government and corporate securities, mortgage pass-through securities, and asset-backed securities with an average maturity of one year or more. Index returns do not reflect any fees or expenses and it is not possible to invest directly into an index. |
| |
| Yearly periods ended December 31 | |
| Comparative Results | |
| Deutsche Unconstrained Income VIP | | 1-Year | | | 3-Year | | | 5-Year | | | 10-Year | |
| Class A | Growth of $10,000 | | $ | 10,223 | | | $ | 11,439 | | | $ | 13,256 | | | $ | 17,657 | |
| Average annual total return | | | 2.23 | % | | | 4.58 | % | | | 5.80 | % | | | 5.85 | % |
| Barclays U.S. Universal Index | Growth of $10,000 | | $ | 10,556 | | | $ | 10,990 | | | $ | 12,649 | | | $ | 16,150 | |
| Average annual total return | | | 5.56 | % | | | 3.20 | % | | | 4.81 | % | | | 4.91 | % |
| Barclays U.S. Aggregate Bond Index | Growth of $10,000 | | $ | 10,597 | | | $ | 10,820 | | | $ | 12,431 | | | $ | 15,842 | |
| Average annual total return | | | 5.97 | % | | | 2.66 | % | | | 4.45 | % | | | 4.71 | % |
The growth of $10,000 is cumulative.
Management Summary December 31, 2014 (Unaudited)
The Class A shares of the Fund returned 2.23% (unadjusted for contract charges) during 2014, underperforming the 5.56% return of the primary benchmark, the Barclays Capital U.S. Universal Index, and the 5.97% return of the Barclays U.S. Aggregate Bond Index.1 On a longer-term basis, the Fund has outpaced the primary benchmark in the three-, five- and 10-year periods ended December 31, 2014.
After performing very well through the first six months of the year, the Fund underperformed in the second half and ultimately finished behind its primary benchmark. Early in 2014, the Fund’s performance was boosted by the same factors that had fueled its strong showing in the past two calendar years: namely, its overweight vs. the primary benchmark in high-yield bonds, senior loans and emerging-markets debt.2 During the first half of 2014, all three asset classes were propelled by the environment of improving global growth and investors’ willingness to take on higher risks to earn above-average yields.
This backdrop shifted in the second half of the year, however, as the sharp drop in oil prices pressured the outlook for both oil-exporting emerging nations and energy-sensitive issues within the high-yield market. Although we took various steps to mitigate risk, such as reducing the Fund’s weighting in high yield and focusing on higher-quality issuers in the emerging markets, the Fund’s large allocations to these segments was a headwind to performance from July onward. Nevertheless, we continue to see opportunities in all three market segments given the backdrop of improving domestic growth and investors’ ongoing "reach for yield" at a time of ultra-low interest rates. We therefore remain on the lookout for opportunities to capitalize on unwarranted sell-offs in securities that we believe offer a favorable trade-off of risk and reward.
On the plus side, the Fund’s performance was helped by its positions in investment-grade corporates, mortgage- and asset-backed securities, and international government bonds.
Throughout the period, the Fund used derivatives — including forward currency contracts — to hedge currency risk in certain portfolio positions, offsetting the potential impact of the downturn in foreign currencies relative to the U.S. dollar. It also used interest rate contracts to hedge against potential adverse interest rate movements on portfolio assets. In addition, the Fund used derivatives, including forward currency and interest rate contracts, for non-hedging purposes to seek to enhance potential gains. Derivatives used for non-hedging purposes contributed to returns.
The fund closed the period with a cash weighting of about 17%, which we believe may help dampen the impact of volatility in the near term. In addition, it provides us with cash on hand to take advantage of selective opportunities in securities that we believe have been punished by volatility in the broader market.
We kept the Fund’s duration well below that of the primary benchmark throughout the year, and we reduced it further during the fourth quarter.3 While yields fell significantly in 2014, we believe the move has largely played itself out — meaning that the most likely scenario is that yields will trade higher over time.
We believe our active approach, along with the Fund’s go-anywhere investment mandate, provides the flexibility to take advantage of a broad range of market opportunities as they arise. This element of our strategy may become even more important if, as we expect, market conditions become more volatile in the months ahead.
Gary Russell, CFA Philip G. Condon John D. Ryan
William Chepolis, CFA Darwei Kung
Portfolio Managers
The views expressed reflect those of the portfolio management team only through the end of the period of the report as stated on the cover. The management team's views are subject to change at any time based on market and other conditions and should not be construed as a recommendation. Past performance is no guarantee of future results. Current and future portfolio holdings are subject to risk.
1 The Barclays U.S. Universal Index represents the union of the U.S. Aggregate Index, the U.S. High-Yield Corporate Index, the 144A Index, the Eurodollar Index, the Emerging Markets Index and the non-ERISA portion of the CMBS Index.
The Barclays U.S. Aggregate Bond Index is an unmanaged index representing domestic taxable investment-grade bonds, with index components for government and corporate securities, mortgage pass-through securities and asset-backed securities with an average maturity of one year or more.
Index returns do not reflect fees or expenses and it is not possible to invest directly in an index.
2 "Underweight" means the Fund holds a lower weighting in a given sector or security than the primary benchmark. "Overweight" means it holds a higher weighting.
3 Duration, which is expressed in years, measures the sensitivity of the price of a bond or bond fund to a change in interest rates.
Portfolio Summary (Unaudited) Asset Allocation (As a % of Investment Portfolio excluding Securities Lending Collateral) | 12/31/14 | 12/31/13 |
| | | |
| Corporate Bonds | 52% | 60% |
| Cash Equivalents | 17% | 2% |
| Government & Agency Obligations | 13% | 19% |
| Exchange-Traded Fund | 5% | 1% |
| Loan Participations and Assignments | 4% | 5% |
| Collateralized Mortgage Obligations | 3% | 5% |
| Municipal Bonds and Notes | 2% | 2% |
| Mortgage-Backed Securities Pass-Throughs | 2% | 2% |
| Asset-Backed | 1% | 1% |
| Commercial Mortgage-Backed Securities | 1% | 3% |
| | 100% | 100% |
Quality (Excludes Cash Equivalents and Securities Lending Collateral) | 12/31/14 | 12/31/13 |
| | | |
| AAA | 8% | 20% |
| AA | 4% | 3% |
| A | 5% | 3% |
| BBB | 19% | 18% |
| BB | 32% | 25% |
| B | 19% | 19% |
| CCC or Below | 5% | 4% |
| Not Rated | 8% | 8% |
| | 100% | 100% |
| Interest Rate Sensitivity | 12/31/14 | 12/31/13 |
| | | |
| Effective Maturity | 5.7 years | 6.6 years |
| Effective Duration | 3.0 years | 4.3 years |
The quality ratings represent the higher of Moody's Investors Service, Inc. ("Moody's") or Standard & Poor's Corporation ("S&P") credit ratings. The ratings of Moody's and S&P represent their opinions as to the quality of the securities they rate. Credit quality measures a bond issuer's ability to repay interest and principal in a timely manner. Ratings are relative and subjective and are not absolute standards of quality. Credit quality does not remove market risk and is subject to change.
Effective maturity is the weighted average of the maturity date of bonds held by the Fund taking into consideration any available maturity shortening features.
Effective duration is an approximate measure of the Fund's sensitivity to interest rate changes taking into consideration any maturity shortening features.
Portfolio holdings and characteristics are subject to change.
For more complete details about the Fund's investment portfolio, see page 6.
Following the Fund's fiscal first and third quarter-end, a complete portfolio holdings listing is filed with the SEC on Form N-Q. The form will be available on the SEC's Web site at sec.gov, and it also may be reviewed and copied at the SEC's Public Reference Room in Washington, D.C. Information on the operation of the SEC's Public Reference Room may be obtained by calling (800) SEC-0330. The Fund's portfolio holdings are also posted on deutschefunds.com from time to time. Please see the Fund's current prospectus for more information.
Investment Portfolio December 31, 2014 | | | Principal Amount ($)(a) | | | Value ($) | |
| | | | |
| Corporate Bonds 52.2% | |
| Consumer Discretionary 5.6% | |
| Ally Financial, Inc., 8.3%, 2/12/2015 | | | 135,000 | | | | 135,675 | |
| AMC Entertainment, Inc., 5.875%, 2/15/2022 | | | 30,000 | | | | 30,450 | |
| AMC Networks, Inc., 7.75%, 7/15/2021 | | | 15,000 | | | | 16,050 | |
| AmeriGas Finance LLC: | |
| 6.75%, 5/20/2020 | | | | 70,000 | | | | 72,100 | |
| 7.0%, 5/20/2022 | | | | 60,000 | | | | 62,100 | |
| Apex Tool Group LLC, 144A, 7.0%, 2/1/2021 | | | | 30,000 | | | | 25,650 | |
| Ashtead Capital, Inc., 144A, 6.5%, 7/15/2022 | | | | 45,000 | | | | 47,812 | |
| Ashton Woods U.S.A. LLC, 144A, 6.875%, 2/15/2021 | | | | 50,000 | | | | 47,625 | |
| Avis Budget Car Rental LLC, 5.5%, 4/1/2023 (b) | | | | 30,000 | | | | 30,600 | |
| Bed Bath & Beyond, Inc.: | |
| 4.915%, 8/1/2034 | | | | 40,000 | | | | 41,275 | |
| 5.165%, 8/1/2044 | | | | 50,000 | | | | 52,314 | |
| Block Communications, Inc., 144A, 7.25%, 2/1/2020 | | | | 65,000 | | | | 66,300 | |
| Cablevision Systems Corp.: | |
| 5.875%, 9/15/2022 | | | | 15,000 | | | | 15,188 | |
| 8.0%, 4/15/2020 | | | | 10,000 | | | | 11,300 | |
| CCO Holdings LLC: | |
| 7.0%, 1/15/2019 | | | | 20,000 | | | | 20,750 | |
| 7.25%, 10/30/2017 | | | | 90,000 | | | | 93,645 | |
| 7.375%, 6/1/2020 | | | | 10,000 | | | | 10,600 | |
| Cequel Communications Holdings I LLC: | |
| 144A, 5.125%, 12/15/2021 | | | | 89,000 | | | | 86,330 | |
| 144A, 6.375%, 9/15/2020 | | | | 160,000 | | | | 165,600 | |
| Clear Channel Worldwide Holdings, Inc.: | |
| Series A, 6.5%, 11/15/2022 | | | 15,000 | | | | 15,263 | |
| Series A, 7.625%, 3/15/2020 | | | 20,000 | | | | 20,750 | |
| Series B, 7.625%, 3/15/2020 | | | 185,000 | | | | 194,712 | |
| Cogeco Cable, Inc., 144A, 4.875%, 5/1/2020 | | | | 5,000 | | | | 5,000 | |
| Crown Media Holdings, Inc., 10.5%, 7/15/2019 | | | | 55,000 | | | | 59,812 | |
| CSC Holdings LLC, 144A, 5.25%, 6/1/2024 | | | | 75,000 | | | | 75,375 | |
| Cumulus Media Holdings, Inc., 7.75%, 5/1/2019 | | | | 65,000 | | | | 65,650 | |
| Dana Holding Corp., 5.5%, 12/15/2024 | | | 25,000 | | | | 25,250 | |
| DISH DBS Corp.: | |
| 4.25%, 4/1/2018 | | | | 40,000 | | | | 40,850 | |
| 5.0%, 3/15/2023 | | | | 50,000 | | | | 48,375 | |
| 6.75%, 6/1/2021 | | | | 10,000 | | | | 10,750 | |
| 7.125%, 2/1/2016 | | | | 155,000 | | | | 162,944 | |
| General Motors Financial Co., Inc., 3.25%, 5/15/2018 | | | | 15,000 | | | | 15,019 | |
| Getty Images, Inc., 144A, 7.0%, 10/15/2020 | | | | 50,000 | | | | 39,250 | |
| Group 1 Automotive, Inc., 144A, 5.0%, 6/1/2022 | | | | 40,000 | | | | 39,100 | |
| Harron Communications LP, 144A, 9.125%, 4/1/2020 | | | | 60,000 | | | | 65,400 | |
| HD Supply, Inc.: | |
| 7.5%, 7/15/2020 (b) | | | | 15,000 | | | | 15,713 | |
| 11.5%, 7/15/2020 | | | | 15,000 | | | | 17,175 | |
| | | Principal Amount ($)(a) | | | Value ($) | |
| | | | | | | | | |
| Hertz Corp., 6.75%, 4/15/2019 | | | 50,000 | | | | 51,500 | |
| Hot Topic, Inc., 144A, 9.25%, 6/15/2021 | | | | 20,000 | | | | 21,400 | |
| iHeartCommunications, Inc.: | |
| 9.0%, 12/15/2019 | | | | 70,000 | | | | 68,950 | |
| 11.25%, 3/1/2021 | | | | 40,000 | | | | 41,200 | |
| Jo-Ann Stores Holdings, Inc., 144A, 9.75%, 10/15/2019 (PIK) | | | 25,000 | | | | 21,250 | |
| Live Nation Entertainment, Inc.: | |
| 144A, 5.375%, 6/15/2022 | | | | 5,000 | | | | 5,000 | |
| 144A, 7.0%, 9/1/2020 | | | | 50,000 | | | | 52,750 | |
| MDC Partners, Inc., 144A, 6.75%, 4/1/2020 | | | | 30,000 | | | | 30,900 | |
| Mediacom Broadband LLC: | |
| 5.5%, 4/15/2021 | | | | 5,000 | | | | 5,025 | |
| 6.375%, 4/1/2023 | | | | 65,000 | | | | 66,625 | |
| Mediacom LLC, 7.25%, 2/15/2022 | | | 20,000 | | | | 21,350 | |
| MGM Resorts International: | |
| 6.75%, 10/1/2020 | | | | 76,000 | | | | 79,800 | |
| 8.625%, 2/1/2019 | | | | 85,000 | | | | 96,369 | |
| Numericable-SFR, 144A, 4.875%, 5/15/2019 | | | | 70,000 | | | | 69,387 | |
| Pinnacle Entertainment, Inc., 6.375%, 8/1/2021 | | | | 20,000 | | | | 20,600 | |
| Quebecor Media, Inc., 5.75%, 1/15/2023 | | | | 30,000 | | | | 30,675 | |
| Sabre Holdings Corp., 8.35%, 3/15/2016 | | | | 55,000 | | | | 59,125 | |
| Seminole Hard Rock Entertainment, Inc., 144A, 5.875%, 5/15/2021 | | | | 15,000 | | | | 14,850 | |
| Serta Simmons Holdings LLC, 144A, 8.125%, 10/1/2020 | | | 35,000 | | | | 37,012 | |
| Sirius XM Radio, Inc., 144A, 5.875%, 10/1/2020 | | | | 30,000 | | | | 30,900 | |
| Springs Industries, Inc., 6.25%, 6/1/2021 | | | | 35,000 | | | | 34,825 | |
| Starz LLC, 5.0%, 9/15/2019 | | | | 25,000 | | | | 25,188 | |
| Taylor Morrison Communities, Inc., 144A, 5.25%, 4/15/2021 | | | 40,000 | | | | 39,400 | |
| Time Warner Cable, Inc., 7.3%, 7/1/2038 | | | | 35,000 | | | | 48,260 | |
| UCI International, Inc., 8.625%, 2/15/2019 | | | | 20,000 | | | | 19,100 | |
| Univision Communications, Inc., 144A, 7.875%, 11/1/2020 | | | 25,000 | | | | 26,625 | |
| Viking Cruises Ltd., 144A, 8.5%, 10/15/2022 | | | | 30,000 | | | | 32,475 | |
| | | | | 2,998,293 | |
| Consumer Staples 2.1% | |
| Big Heart Pet Brands, 7.625%, 2/15/2019 | | | | 55,000 | | | | 54,037 | |
| Chiquita Brands International, Inc., 7.875%, 2/1/2021 | | | | 14,000 | | | | 15,050 | |
| Cott Beverages, Inc.: | |
| 144A, 5.375%, 7/1/2022 | | | | 35,000 | | | | 32,113 | |
| 144A, 6.75%, 1/1/2020 | | | | 25,000 | | | | 25,000 | |
| FAGE Dairy Industry SA, 144A, 9.875%, 2/1/2020 | | | | 85,000 | | | | 88,825 | |
| JBS Investments GmbH: | |
| 144A, 7.25%, 4/3/2024 | | | | 70,000 | | | | 68,775 | |
| 144A, 7.75%, 10/28/2020 | | | | 200,000 | | | | 207,100 | |
| JBS U.S.A. LLC: | |
| 144A, 7.25%, 6/1/2021 | | | | 80,000 | | | | 82,400 | |
| 144A, 8.25%, 2/1/2020 | | | | 25,000 | | | | 26,313 | |
| | | Principal Amount ($)(a) | | | Value ($) | |
| | | | | | | | | |
| Marfrig Overseas Ltd., 144A, 9.5%, 5/4/2020 | | | | 100,000 | | | | 101,000 | |
| Post Holdings, Inc., 144A, 6.75%, 12/1/2021 | | | | 15,000 | | | | 14,550 | |
| Reynolds Group Issuer, Inc.: | |
| 5.75%, 10/15/2020 | | | | 235,000 | | | | 240,875 | |
| 6.875%, 2/15/2021 | | | | 100,000 | | | | 104,375 | |
| Roundy's Supermarkets, Inc., 144A, 10.25%, 12/15/2020 | | | | 10,000 | | | | 8,700 | |
| Smithfield Foods, Inc., 6.625%, 8/15/2022 | | | | 30,000 | | | | 31,350 | |
| The WhiteWave Foods Co., 5.375%, 10/1/2022 | | | | 30,000 | | | | 30,900 | |
| | | | | 1,131,363 | |
| Energy 6.7% | |
| Access Midstream Partners LP, 6.125%, 7/15/2022 | | | | 55,000 | | | | 58,437 | |
| Afren PLC, 144A, 10.25%, 4/8/2019 | | | 140,000 | | | | 91,000 | |
| Antero Resources Corp., 144A, 5.125%, 12/1/2022 | | | | 45,000 | | | | 42,412 | |
| Antero Resources Finance Corp., 5.375%, 11/1/2021 | | | | 35,000 | | | | 33,862 | |
| Baytex Energy Corp.: | |
| 144A, 5.125%, 6/1/2021 | | | | 10,000 | | | | 8,500 | |
| 144A, 5.625%, 6/1/2024 | | | | 15,000 | | | | 12,750 | |
| Berry Petroleum Co., LLC: | |
| 6.375%, 9/15/2022 | | | | 30,000 | | | | 22,800 | |
| 6.75%, 11/1/2020 | | | | 140,000 | | | | 112,000 | |
| BreitBurn Energy Partners LP: | |
| 7.875%, 4/15/2022 | | | | 30,000 | | | | 23,175 | |
| 8.625%, 10/15/2020 | | | | 30,000 | | | | 25,800 | |
| California Resources Corp.: | |
| 144A, 5.0%, 1/15/2020 | | | | 20,000 | | | | 17,350 | |
| 144A, 5.5%, 9/15/2021 | | | | 43,000 | | | | 36,765 | |
| 144A, 6.0%, 11/15/2024 | | | | 5,000 | | | | 4,225 | |
| Chaparral Energy, Inc., 7.625%, 11/15/2022 | | | | 20,000 | | | | 13,100 | |
| Crestwood Midstream Partners LP: | |
| 6.125%, 3/1/2022 | | | | 20,000 | | | | 19,100 | |
| 7.75%, 4/1/2019 | | | | 65,000 | | | | 66,625 | |
| Delek & Avner Tamar Bond Ltd., 144A, 5.082%, 12/30/2023 | | | 200,000 | | | | 199,563 | |
| Dresser-Rand Group, Inc., 6.5%, 5/1/2021 | | | | 45,000 | | | | 48,375 | |
| Ecopetrol SA, 5.875%, 5/28/2045 | | | 450,000 | | | | 416,250 | |
| Endeavor Energy Resources LP, 144A, 7.0%, 8/15/2021 | | | | 75,000 | | | | 66,375 | |
| EP Energy LLC, 6.875%, 5/1/2019 | | | 60,000 | | | | 60,900 | |
| EV Energy Partners LP, 8.0%, 4/15/2019 | | | | 155,000 | | | | 131,750 | |
| GeoPark Latin America Ltd. Agencia en Chile, 144A, 7.5%, 2/11/2020 | | | 200,000 | | | | 175,000 | |
| Halcon Resources Corp., 8.875%, 5/15/2021 | | | | 25,000 | | | | 18,813 | |
| Hilcorp Energy I LP, 144A, 5.0%, 12/1/2024 | | | | 25,000 | | | | 22,000 | |
| Holly Energy Partners LP, 6.5%, 3/1/2020 | | | | 20,000 | | | | 19,800 | |
| Jupiter Resources, Inc., 144A, 8.5%, 10/1/2022 | | | | 25,000 | | | | 18,813 | |
| Kinder Morgan, Inc.: | |
| 3.05%, 12/1/2019 | | | | 75,000 | | | | 74,404 | |
| 5.55%, 6/1/2045 | | | | 50,000 | | | | 51,211 | |
| 7.25%, 6/1/2018 | | | | 55,000 | | | | 62,318 | |
| | | Principal Amount ($)(a) | | | Value ($) | |
| | | | | | | | | |
| Linn Energy LLC, 6.25%, 11/1/2019 | | | 25,000 | | | | 21,125 | |
| MEG Energy Corp.: | |
| 144A, 6.5%, 3/15/2021 | | | | 40,000 | | | | 36,500 | |
| 144A, 7.0%, 3/31/2024 | | | | 95,000 | | | | 85,975 | |
| Memorial Resource Development Corp., 144A, 5.875%, 7/1/2022 | | | 25,000 | | | | 22,625 | |
| Midstates Petroleum Co., Inc., 10.75%, 10/1/2020 | | | | 30,000 | | | | 15,900 | |
| Murphy Oil U.S.A., Inc., 6.0%, 8/15/2023 | | | | 40,000 | | | | 41,800 | |
| Northern Oil & Gas, Inc., 8.0%, 6/1/2020 | | | | 90,000 | | | | 68,175 | |
| Offshore Drilling Holding SA, 144A, 8.625%, 9/20/2020 | | | | 200,000 | | | | 174,000 | |
| Pacific Rubiales Energy Corp., 144A, 5.625%, 1/19/2025 | | | 282,000 | | | | 216,435 | |
| Pertamina Persero PT, 144A, 5.625%, 5/20/2043 | | | | 200,000 | | | | 188,000 | |
| Petroleos de Venezuela SA, 144A, 9.0%, 11/17/2021 | | | | 300,000 | | | | 131,250 | |
| Regency Energy Partners LP: | |
| 5.0%, 10/1/2022 | | | | 15,000 | | | | 14,175 | |
| 5.875%, 3/1/2022 | | | | 5,000 | | | | 4,988 | |
| RSP Permian, Inc., 144A, 6.625%, 10/1/2022 | | | | 15,000 | | | | 13,950 | |
| Sabine Pass Liquefaction LLC, 5.625%, 2/1/2021 | | | | 105,000 | | | | 103,162 | |
| SESI LLC: | |
| 6.375%, 5/1/2019 | | | | 40,000 | | | | 38,800 | |
| 7.125%, 12/15/2021 | | | | 115,000 | | | | 110,400 | |
| Seventy Seven Energy, Inc., 6.5%, 7/15/2022 (b) | | | | 5,000 | | | | 2,925 | |
| Seventy Seven Operating LLC, 6.625%, 11/15/2019 | | | | 25,000 | | | | 19,000 | |
| Swift Energy Co., 7.875%, 3/1/2022 | | | 55,000 | | | | 28,463 | |
| Talos Production LLC, 144A, 9.75%, 2/15/2018 | | | | 60,000 | | | | 54,600 | |
| Targa Resources Partners LP, 144A, 4.125%, 11/15/2019 | | | | 10,000 | | | | 9,625 | |
| Tesoro Corp., 4.25%, 10/1/2017 | | | 35,000 | | | | 36,137 | |
| Transocean, Inc., 3.8%, 10/15/2022 | | | 145,000 | | | | 117,497 | |
| Triangle U.S.A. Petroleum Corp., 144A, 6.75%, 7/15/2022 | | | 20,000 | | | | 13,200 | |
| WPX Energy, Inc.: | |
| 5.25%, 1/15/2017 (b) | | | | 40,000 | | | | 40,400 | |
| 5.25%, 9/15/2024 | | | | 15,000 | | | | 13,950 | |
| | | | | 3,576,530 | |
| Financials 10.9% | |
| Aflac, Inc., 3.625%, 11/15/2024 | | | | 65,000 | | | | 66,275 | |
| Banco Continental SAECA, 144A, 8.875%, 10/15/2017 | | | | 200,000 | | | | 210,000 | |
| Banco do Brasil SA, 144A, 9.0%, 6/29/2049 | | | | 200,000 | | | | 186,000 | |
| Banco Santander Brasil SA, 144A, 8.0%, 3/18/2016 | BRL | | | 400,000 | | | | 143,782 | |
| Bank of China Ltd., 144A, 5.0%, 11/13/2024 | | | | 200,000 | | | | 205,514 | |
| Barclays Bank PLC, 7.625%, 11/21/2022 | | | | 400,000 | | | | 437,370 | |
| BBVA Bancomer SA, 144A, 6.75%, 9/30/2022 | | | | 150,000 | | | | 165,000 | |
| CBL & Associates LP, (REIT), 4.6%, 10/15/2024 | | | | 120,000 | | | | 121,532 | |
| China Overseas Finance Cayman II Ltd., REG S, 5.5%, 11/10/2020 | | | | 250,000 | | | | 270,229 | |
| | | Principal Amount ($)(a) | | | Value ($) | |
| | | | | | | | | |
| CIMPOR Financial Operations BV, 144A, 5.75%, 7/17/2024 | | | | 250,000 | | | | 219,350 | |
| CIT Group, Inc.: | |
| 3.875%, 2/19/2019 | | | | 145,000 | | | | 144,637 | |
| 5.0%, 5/15/2017 | | | | 80,000 | | | | 83,000 | |
| 5.25%, 3/15/2018 | | | | 90,000 | | | | 93,825 | |
| Country Garden Holdings Co., Ltd., 144A, 11.125%, 2/23/2018 | | | | 200,000 | | | | 212,102 | |
| Development Bank of Kazakhstan JSC, Series 3, REG S, 6.5%, 6/3/2020 | | | | 500,000 | | | | 508,749 | |
| Everest Reinsurance Holdings, Inc., 4.868%, 6/1/2044 | | | | 50,000 | | | | 52,365 | |
| Hellas Telecommunications Finance, 144A, 8.082%**, 7/15/2015 (PIK)* | EUR | | | 109,187 | | | | 0 | |
| Hospitality Properties Trust, (REIT), 5.0%, 8/15/2022 | | | | 110,000 | | | | 115,916 | |
International Lease Finance Corp.: | |
| 3.875%, 4/15/2018 | | | | 65,000 | | | | 65,000 | |
| 5.75%, 5/15/2016 | | | | 20,000 | | | | 20,750 | |
| 6.25%, 5/15/2019 | | | | 50,000 | | | | 54,625 | |
| 8.625%, 9/15/2015 | | | | 40,000 | | | | 41,700 | |
| 8.75%, 3/15/2017 | | | | 120,000 | | | | 132,900 | |
| Kaisa Group Holdings Ltd., 144A, 8.875%, 3/19/2018 | | | | 250,000 | | | | 166,875 | |
| Macquarie Group Ltd., 144A, 6.0%, 1/14/2020 | | | | 200,000 | | | | 226,535 | |
| Morgan Stanley, Series H, 5.45%, 7/29/2049 | | | | 20,000 | | | | 20,036 | |
| MPT Operating Partnership LP: | |
| (REIT), 6.375%, 2/15/2022 | | | | 45,000 | | | | 47,812 | |
| (REIT), 6.875%, 5/1/2021 | | | | 50,000 | | | | 53,500 | |
| Nationwide Financial Services, Inc., 144A, 5.3%, 11/18/2044 | | | | 65,000 | | | | 68,572 | |
| Navient Corp., 5.5%, 1/25/2023 | | | | 125,000 | | | | 119,687 | |
| Neuberger Berman Group LLC: | |
| 144A, 5.625%, 3/15/2020 | | | | 25,000 | | | | 26,125 | |
| 144A, 5.875%, 3/15/2022 | | | | 45,000 | | | | 47,362 | |
| Omega Healthcare Investors, Inc., (REIT), 4.95%, 4/1/2024 | | | | 130,000 | | | | 135,283 | |
| Popular, Inc., 7.0%, 7/1/2019 | | | | 20,000 | | | | 20,000 | |
| Royal Bank of Scotland Group PLC, 6.1%, 6/10/2023 | | | | 100,000 | | | | 108,459 | |
| Scentre Group Trust 1, 144A, 3.5%, 2/12/2025 | | | | 155,000 | | | | 155,607 | |
| Schahin II Finance Co. SPV Ltd., 144A, 5.875%, 9/25/2022 (b) | | | | 179,867 | | | | 144,568 | |
| Seminole Tribe of Florida, Inc., 144A, 7.804%, 10/1/2020 | | | | 70,000 | | | | 74,200 | |
| The Goldman Sachs Group, Inc., Series L, 5.7%, 12/29/2049 (b) | | | | 35,000 | | | | 35,403 | |
TIAA Asset Management Finance Co., LLC: | |
| 144A, 2.95%, 11/1/2019 | | | | 115,000 | | | | 115,223 | |
| 144A, 4.125%, 11/1/2024 | | | | 95,000 | | | | 97,320 | |
| Trust F/1401, (REIT), 144A, 5.25%, 12/15/2024 | | | | 200,000 | | | | 206,020 | |
| | | Principal Amount ($)(a) | | | Value ($) | |
| | | | | | | | | |
| Turkiye Is Bankasi, 144A, 6.0%, 10/24/2022 | | | | 250,000 | | | | 250,875 | |
| Yapi ve Kredi Bankasi AS, 144A, 5.5%, 12/6/2022 | | | | 200,000 | | | | 191,520 | |
| | | | | 5,861,603 | |
| Health Care 3.0% | |
| Aviv Healthcare Properties LP: | |
| 6.0%, 10/15/2021 | | | | 15,000 | | | | 15,600 | |
| 7.75%, 2/15/2019 | | | | 85,000 | | | | 88,570 | |
| Biomet, Inc.: | |
| 6.5%, 8/1/2020 | | | | 55,000 | | | | 58,850 | |
| 6.5%, 10/1/2020 | | | | 15,000 | | | | 15,825 | |
| Community Health Systems, Inc.: | |
| 5.125%, 8/15/2018 | | | | 185,000 | | | | 191,475 | |
| 5.125%, 8/1/2021 | | | | 5,000 | | | | 5,188 | |
| 6.875%, 2/1/2022 (b) | | | | 30,000 | | | | 31,781 | |
| 7.125%, 7/15/2020 | | | | 60,000 | | | | 63,975 | |
| Crimson Merger Sub, Inc., 144A, 6.625%, 5/15/2022 | | | | 70,000 | | | | 62,912 | |
| Endo Finance LLC: | |
| 144A, 5.375%, 1/15/2023 | | | | 35,000 | | | | 34,300 | |
| 144A, 5.75%, 1/15/2022 | | | | 35,000 | | | | 35,000 | |
| HCA, Inc.: | |
| 5.25%, 4/15/2025 | | | | 20,000 | | | | 20,900 | |
| 6.5%, 2/15/2020 | | | | 210,000 | | | | 235,305 | |
| 7.5%, 2/15/2022 | | | | 80,000 | | | | 91,400 | |
| Hologic, Inc., 6.25%, 8/1/2020 | | | 30,000 | | | | 31,200 | |
| LifePoint Hospitals, Inc, 5.5%, 12/1/2021 | | | 35,000 | | | | 35,787 | |
| Mallinckrodt International Finance SA, 4.75%, 4/15/2023 | | | 75,000 | | | | 72,000 | |
| Medtronic, Inc., 144A, 4.625%, 3/15/2045 | | | | 40,000 | | | | 43,360 | |
| Par Pharmaceutical Companies, Inc., 7.375%, 10/15/2020 | | | 55,000 | | | | 57,475 | |
| Physio-Control International, Inc., 144A, 9.875%, 1/15/2019 | | | 48,000 | | | | 50,880 | |
| Tenet Healthcare Corp., 6.25%, 11/1/2018 | | | | 80,000 | | | | 86,800 | |
| Valeant Pharmaceuticals International, Inc.: | |
| 144A, 6.375%, 10/15/2020 | | | | 35,000 | | | | 36,575 | |
| 144A, 6.75%, 8/15/2018 | | | | 70,000 | | | | 74,464 | |
| 144A, 7.5%, 7/15/2021 | | | | 140,000 | | | | 151,200 | |
| | | | | 1,590,822 | |
| Industrials 5.6% | |
| ADT Corp.: | |
| 3.5%, 7/15/2022 (b) | | | | 20,000 | | | | 17,050 | |
| 4.125%, 4/15/2019 | | | | 5,000 | | | | 4,950 | |
| 5.25%, 3/15/2020 | | | | 40,000 | | | | 40,500 | |
| 6.25%, 10/15/2021 | | | | 25,000 | | | | 25,688 | |
| Armored Autogroup, Inc., 9.25%, 11/1/2018 | | | | 60,000 | | | | 59,700 | |
| Artesyn Embedded Technologies, Inc., 144A, 9.75%, 10/15/2020 | | | 40,000 | | | | 37,900 | |
| Belden, Inc., 144A, 5.5%, 9/1/2022 | | | 55,000 | | | | 54,588 | |
| Bombardier, Inc.: | |
| 144A, 4.75%, 4/15/2019 | | | | 20,000 | | | | 20,075 | |
| 144A, 5.75%, 3/15/2022 | | | | 55,000 | | | | 55,687 | |
| 144A, 6.0%, 10/15/2022 | | | | 35,000 | | | | 35,350 | |
| 144A, 7.75%, 3/15/2020 | | | | 45,000 | | | | 48,825 | |
| Casella Waste Systems, Inc., 7.75%, 2/15/2019 | | | | 80,000 | | | | 81,200 | |
| Covanta Holding Corp., 5.875%, 3/1/2024 | | | | 30,000 | | | | 30,525 | |
| | | Principal Amount ($)(a) | | | Value ($) | |
| | | | | | | | | |
| CTP Transportation Products LLC, 144A, 8.25%, 12/15/2019 | | | 35,000 | | | | 36,925 | |
| DigitalGlobe, Inc., 144A, 5.25%, 2/1/2021 | | | | 25,000 | | | | 23,750 | |
| Ducommun, Inc., 9.75%, 7/15/2018 | | | 65,000 | | | | 69,550 | |
| Empresas ICA SAB de CV, 144A, 8.875%, 5/29/2024 | | | | 200,000 | | | | 183,000 | |
| Florida East Coast Holdings Corp., 144A, 6.75%, 5/1/2019 | | | 65,000 | | | | 64,350 | |
| FTI Consulting, Inc., 6.75%, 10/1/2020 | | | | 145,000 | | | | 151,887 | |
| Garda World Security Corp., 144A, 7.25%, 11/15/2021 | | | | 45,000 | | | | 44,550 | |
| Gates Global LLC, 144A, 6.0%, 7/15/2022 | | | | 30,000 | | | | 28,731 | |
| GenCorp, Inc., 7.125%, 3/15/2021 | | | 80,000 | | | | 83,784 | |
| Grupo KUO SAB De CV, 144A, 6.25%, 12/4/2022 | | | | 200,000 | | | | 196,900 | |
| Huntington Ingalls Industries, Inc., 7.125%, 3/15/2021 | | | | 10,000 | | | | 10,800 | |
| Kenan Advantage Group, Inc., 144A, 8.375%, 12/15/2018 | | | | 25,000 | | | | 25,750 | |
| Meritor, Inc.: | |
| 6.25%, 2/15/2024 | | | | 30,000 | | | | 30,450 | |
| 6.75%, 6/15/2021 | | | | 40,000 | | | | 41,800 | |
| Navios Maritime Holdings, Inc.: | |
| 144A, 7.375%, 1/15/2022 | | | | 110,000 | | | | 100,650 | |
| 8.125%, 2/15/2019 | | | | 60,000 | | | | 52,800 | |
| Noble Group Ltd., 144A, 6.625%, 8/5/2020 | | | | 250,000 | | | | 256,250 | |
| Nortek, Inc., 8.5%, 4/15/2021 | | | | 75,000 | | | | 80,250 | |
| Odebrecht Offshore Drilling Finance Ltd., 144A, 6.625%, 10/1/2022 | | | | 192,480 | | | | 172,270 | |
| Oshkosh Corp., 5.375%, 3/1/2022 | | | 22,500 | | | | 22,950 | |
| Ply Gem Industries, Inc.: | |
| 6.5%, 2/1/2022 | | | | 40,000 | | | | 37,600 | |
| 144A, 6.5%, 2/1/2022 | | | | 20,000 | | | | 18,600 | |
| SBA Communications Corp., 5.625%, 10/1/2019 | | | | 30,000 | | | | 30,675 | |
| Spirit AeroSystems, Inc.: | |
| 5.25%, 3/15/2022 | | | | 40,000 | | | | 40,700 | |
| 6.75%, 12/15/2020 | | | | 75,000 | | | | 79,500 | |
| Titan International, Inc., 6.875%, 10/1/2020 | | | | 90,000 | | | | 79,200 | |
| TransDigm, Inc.: | |
| 6.0%, 7/15/2022 | | | | 40,000 | | | | 39,900 | |
| 6.5%, 7/15/2024 | | | | 25,000 | | | | 25,125 | |
| 7.5%, 7/15/2021 | | | | 125,000 | | | | 133,125 | |
| Triumph Group, Inc., 5.25%, 6/1/2022 | | | | 20,000 | | | | 19,950 | |
| United Rentals North America, Inc.: | |
| 5.75%, 7/15/2018 | | | | 60,000 | | | | 62,550 | |
| 7.375%, 5/15/2020 | | | | 95,000 | | | | 102,600 | |
| 7.625%, 4/15/2022 | | | | 95,000 | | | | 104,452 | |
| XPO Logistics, Inc., 144A, 7.875%, 9/1/2019 | | | | 15,000 | | | | 15,675 | |
| | | | | 2,979,087 | |
| Information Technology 2.9% | |
| ACI Worldwide, Inc., 144A, 6.375%, 8/15/2020 | | | | 15,000 | | | | 15,675 | |
| Activision Blizzard, Inc., 144A, 5.625%, 9/15/2021 | | | | 130,000 | | | | 136,500 | |
| Audatex North America, Inc., 144A, 6.0%, 6/15/2021 | | | | 25,000 | | | | 25,750 | |
| BMC Software Finance, Inc., 144A, 8.125%, 7/15/2021 | | | | 65,000 | | | | 61,100 | |
| | | Principal Amount ($)(a) | | | Value ($) | |
| | | | | | | | | |
| Boxer Parent Co., Inc., 144A, 9.0%, 10/15/2019 (PIK) | | | | 40,000 | | | | 34,000 | |
| Cardtronics, Inc., 144A, 5.125%, 8/1/2022 | | | | 20,000 | | | | 19,500 | |
| CDW LLC: | |
| 6.0%, 8/15/2022 | | | | 30,000 | | | | 30,975 | |
| 8.5%, 4/1/2019 | | | | 18,000 | | | | 18,968 | |
| EarthLink Holdings Corp., 7.375%, 6/1/2020 | | | | 30,000 | | | | 30,450 | |
| Entegris, Inc., 144A, 6.0%, 4/1/2022 | | | 20,000 | | | | 20,250 | |
| Equinix, Inc., 5.375%, 4/1/2023 | | | 105,000 | | | | 105,000 | |
| First Data Corp.: | |
| 144A, 6.75%, 11/1/2020 | | | | 72,000 | | | | 76,860 | |
| 144A, 7.375%, 6/15/2019 | | | | 45,000 | | | | 47,362 | |
| 144A, 8.75%, 1/15/2022 (PIK) | | | 60,000 | | | | 64,500 | |
| 144A, 8.875%, 8/15/2020 | | | | 85,000 | | | | 91,162 | |
| Freescale Semiconductor, Inc., 144A, 6.0%, 1/15/2022 | | | 40,000 | | | | 41,800 | |
| Hughes Satellite Systems Corp.: | |
| 6.5%, 6/15/2019 | | | | 70,000 | | | | 75,075 | |
| 7.625%, 6/15/2021 | | | | 40,000 | | | | 44,000 | |
| Jabil Circuit, Inc., 7.75%, 7/15/2016 | | | 30,000 | | | | 32,138 | |
| KLA-Tencor Corp., 4.65%, 11/1/2024 | | | | 115,000 | | | | 119,053 | |
| NCR Corp.: | |
| 5.875%, 12/15/2021 | | | | 10,000 | | | | 10,275 | |
| 6.375%, 12/15/2023 | | | | 20,000 | | | | 20,800 | |
| NXP BV, 144A, 3.75%, 6/1/2018 | | | 35,000 | | | | 35,000 | |
| Sanmina Corp., 144A, 4.375%, 6/1/2019 | | | | 5,000 | | | | 4,963 | |
| Seagate HDD Cayman, 144A, 5.75%, 12/1/2034 | | | | 120,000 | | | | 126,556 | |
| Tencent Holdings Ltd., 144A, 3.375%, 5/2/2019 | | | | 200,000 | | | | 203,287 | |
| Ymobile Corp., 144A, 8.25%, 4/1/2018 | | | | 60,000 | | | | 62,850 | |
| | | | | 1,553,849 | |
| Materials 5.4% | |
| Anglo American Capital PLC, 144A, 4.125%, 9/27/2022 | | | | 250,000 | | | | 247,558 | |
| Ashland, Inc., 3.875%, 4/15/2018 | | | 20,000 | | | | 20,200 | |
| Berry Plastics Corp., 5.5%, 5/15/2022 | | | | 60,000 | | | | 60,900 | |
| Cascades, Inc., 144A, 5.5%, 7/15/2022 | | | | 20,000 | | | | 19,900 | |
| Cemex SAB de CV, 144A, 6.5%, 12/10/2019 | | | | 200,000 | | | | 204,900 | |
| Clearwater Paper Corp., 144A, 5.375%, 2/1/2025 | | | | 40,000 | | | | 39,400 | |
| Crown Americas LLC, 6.25%, 2/1/2021 | | | | 10,000 | | | | 10,525 | |
| Exopack Holding Corp., 144A, 10.0%, 6/1/2018 | | | | 40,000 | | | | 42,400 | |
| First Quantum Minerals Ltd.: | |
| 144A, 6.75%, 2/15/2020 | | | | 70,000 | | | | 63,350 | |
| 144A, 7.0%, 2/15/2021 | | | | 60,000 | | | | 54,000 | |
FMG Resources (August 2006) Pty Ltd.: | |
| 144A, 6.0%, 4/1/2017 | | | | 55,000 | | | | 52,594 | |
| 144A, 8.25%, 11/1/2019 (b) | | | 45,000 | | | | 40,950 | |
| Fresnillo PLC, 144A, 5.5%, 11/13/2023 | | | | 200,000 | | | | 196,000 | |
| Glencore Funding LLC, 144A, 4.125%, 5/30/2023 | | | | 110,000 | | | | 107,333 | |
| Greif, Inc., 7.75%, 8/1/2019 | | | | 195,000 | | | | 220,350 | |
| | | Principal Amount ($)(a) | | | Value ($) | |
| | | | | | | | | |
| GTL Trade Finance, Inc., 144A, 5.893%, 4/29/2024 | | | | 200,000 | | | | 193,000 | |
| Hexion U.S. Finance Corp.: | |
| 6.625%, 4/15/2020 | | | | 85,000 | | | | 83,300 | |
| 8.875%, 2/1/2018 | | | | 60,000 | | | | 53,400 | |
| Huntsman International LLC, 8.625%, 3/15/2021 (b) | | | | 25,000 | | | | 26,813 | |
| Kaiser Aluminum Corp., 8.25%, 6/1/2020 | | | | 40,000 | | | | 43,400 | |
| KGHM International Ltd., 144A, 7.75%, 6/15/2019 | | | | 115,000 | | | | 118,450 | |
| Novelis, Inc., 8.75%, 12/15/2020 | | | 215,000 | | | | 227,900 | |
| Owens-Brockway Glass Container, Inc., 7.375%, 5/15/2016 | | | 30,000 | | | | 31,725 | |
| Packaging Dynamics Corp., 144A, 8.75%, 2/1/2016 | | | | 72,000 | | | | 72,000 | |
| Plastipak Holdings, Inc., 144A, 6.5%, 10/1/2021 | | | | 40,000 | | | | 39,800 | |
| Polymer Group, Inc., 7.75%, 2/1/2019 | | | | 49,000 | | | | 50,776 | |
| Rain CII Carbon LLC, 144A, 8.0%, 12/1/2018 | | | | 45,000 | | | | 45,450 | |
| Sealed Air Corp., 144A, 8.375%, 9/15/2021 | | | | 30,000 | | | | 33,525 | |
| Signode Industrial Group Lux SA, 144A, 6.375%, 5/1/2022 | | | 30,000 | | | | 29,250 | |
| Tronox Finance LLC, 6.375%, 8/15/2020 | | | | 30,000 | | | | 30,075 | |
| Turkiye Sise ve Cam Fabrikalari AS, 144A, 4.25%, 5/9/2020 | | | 300,000 | | | | 292,783 | |
| WR Grace & Co-Conn: | |
| 144A, 5.125%, 10/1/2021 | | | | 15,000 | | | | 15,375 | |
| 144A, 5.625%, 10/1/2024 | | | | 5,000 | | | | 5,213 | |
| Yamana Gold, Inc., 4.95%, 7/15/2024 | | | 120,000 | | | | 117,117 | |
| | | | | 2,889,712 | |
| Telecommunication Services 7.1% | |
| B Communications Ltd., 144A, 7.375%, 2/15/2021 | | | | 35,000 | | | | 37,013 | |
| CenturyLink, Inc.: | |
| Series V, 5.625%, 4/1/2020 | | | 15,000 | | | | 15,563 | |
| Series W, 6.75%, 12/1/2023 (b) | | | 35,000 | | | | 38,325 | |
| Cincinnati Bell, Inc.: | |
| 8.375%, 10/15/2020 | | | | 235,000 | | | | 246,750 | |
| 8.75%, 3/15/2018 (b) | | | | 171,000 | | | | 175,702 | |
| CommScope, Inc., 144A, 5.0%, 6/15/2021 | | | | 35,000 | | | | 34,475 | |
| CPI International, Inc., 8.75%, 2/15/2018 | | | | 45,000 | | | | 46,238 | |
| Digicel Group Ltd.: | |
| 144A, 7.125%, 4/1/2022 | | | | 35,000 | | | | 32,550 | |
| 144A, 8.25%, 9/30/2020 | | | | 305,000 | | | | 295,850 | |
| Digicel Ltd., 144A, 8.25%, 9/1/2017 | | | 300,000 | | | | 303,750 | |
| Frontier Communications Corp.: | |
| 6.25%, 9/15/2021 | | | | 20,000 | | | | 20,100 | |
| 6.875%, 1/15/2025 | | | | 20,000 | | | | 20,000 | |
| 7.125%, 1/15/2023 | | | | 200,000 | | | | 203,500 | |
| 8.25%, 4/15/2017 | | | | 62,000 | | | | 68,975 | |
| 8.5%, 4/15/2020 | | | | 20,000 | | | | 22,300 | |
| Intelsat Jackson Holdings SA: | |
| 5.5%, 8/1/2023 | | | | 55,000 | | | | 54,664 | |
| 7.25%, 10/15/2020 | | | | 195,000 | | | | 205,969 | |
| 7.5%, 4/1/2021 | | | | 215,000 | | | | 230,050 | |
| Intelsat Luxembourg SA, 8.125%, 6/1/2023 | | | | 10,000 | | | | 10,200 | |
| | | Principal Amount ($)(a) | | | Value ($) | |
| | | | | | | | | |
| Level 3 Communications, Inc., 8.875%, 6/1/2019 | | | | 10,000 | | | | 10,602 | |
| Level 3 Escrow II, Inc., 144A, 5.375%, 8/15/2022 | | | | 90,000 | | | | 90,450 | |
| Level 3 Financing, Inc.: | |
| 6.125%, 1/15/2021 | | | | 20,000 | | | | 20,700 | |
| 7.0%, 6/1/2020 | | | | 75,000 | | | | 79,031 | |
| 8.125%, 7/1/2019 | | | | 45,000 | | | | 47,813 | |
| 8.625%, 7/15/2020 | | | | 50,000 | | | | 53,937 | |
| Millicom International Cellular SA, 144A, 4.75%, 5/22/2020 | | | 200,000 | | | | 188,500 | |
| MTN Mauritius Investments Ltd., 144A, 4.755%, 11/11/2024 | | | 200,000 | | | | 196,000 | |
| Sprint Communications, Inc.: | |
| 144A, 7.0%, 3/1/2020 | | | | 40,000 | | | | 43,200 | |
| 144A, 9.0%, 11/15/2018 | | | | 175,000 | | | | 199,045 | |
| Sprint Corp., 7.125%, 6/15/2024 | | | 200,000 | | | | 186,000 | |
| T-Mobile U.S.A., Inc.: | |
| 6.125%, 1/15/2022 | | | | 15,000 | | | | 15,225 | |
| 6.625%, 11/15/2020 | | | | 65,000 | | | | 66,137 | |
| UPCB Finance V Ltd., 144A, 7.25%, 11/15/2021 | | | | 30,000 | | | | 32,813 | |
| UPCB Finance VI Ltd., 144A, 6.875%, 1/15/2022 | | | | 10,000 | | | | 10,875 | |
| Wind Acquisition Finance SA, 144A, 6.5%, 4/30/2020 | | | | 30,000 | | | | 30,675 | |
| Windstream Corp.: | |
| 6.375%, 8/1/2023 | | | | 40,000 | | | | 37,400 | |
| 7.5%, 4/1/2023 | | | | 75,000 | | | | 74,625 | |
| 7.75%, 10/15/2020 | | | | 20,000 | | | | 20,600 | |
| 7.75%, 10/1/2021 | | | | 55,000 | | | | 56,100 | |
| 7.875%, 11/1/2017 | | | | 205,000 | | | | 221,912 | |
| 8.125%, 9/1/2018 | | | | 70,000 | | | | 72,625 | |
| | | | | 3,816,239 | |
| Utilities 2.9% | |
| AES Corp.: | |
| 3.234%**, 6/1/2019 | | | | 20,000 | | | | 19,500 | |
| 8.0%, 10/15/2017 | | | | 2,000 | | | | 2,245 | |
| 8.0%, 6/1/2020 | | | | 175,000 | | | | 199,937 | |
| Calpine Corp.: | |
| 5.375%, 1/15/2023 | | | | 35,000 | | | | 35,350 | |
| 5.75%, 1/15/2025 | | | | 35,000 | | | | 35,438 | |
| Dynegy Finance I, Inc., 144A, 7.625%, 11/1/2024 | | | | 5,000 | | | | 5,100 | |
| Empresa Electrica Angamos SA, 144A, 4.875%, 5/25/2029 | | | 200,000 | | | | 196,500 | |
| Energy Future Holdings Corp., Series Q, 6.5%, 11/15/2024* | | | 100,000 | | | | 78,000 | |
| Inkia Energy Ltd., 144A, 8.375%, 4/4/2021 | | | | 200,000 | | | | 212,000 | |
| IPALCO Enterprises, Inc., 5.0%, 5/1/2018 | | | | 145,000 | | | | 152,975 | |
| NGL Energy Partners LP, 144A, 5.125%, 7/15/2019 | | | | 30,000 | | | | 28,800 | |
| NRG Energy, Inc.: | |
| 144A, 6.25%, 5/1/2024 | | | | 100,000 | | | | 101,750 | |
| 7.875%, 5/15/2021 | | | | 30,000 | | | | 32,325 | |
| Perusahaan Listrik Negara PT, 144A, 5.25%, 10/24/2042 | | | 500,000 | | | | 455,625 | |
| RJS Power Holdings LLC, 144A, 5.125%, 7/15/2019 | | | | 30,000 | | | | 29,625 | |
| | | | | 1,585,170 | |
Total Corporate Bonds (Cost $28,560,435) | | | | 27,982,668 | |
| | |
| | | Principal Amount ($)(a) | | | Value ($) | |
| | | | | | | | | |
| Mortgage-Backed Securities Pass-Throughs 1.4% | |
| Federal National Mortgage Association, 4.0%, 3/1/2042 (c) (Cost $745,773) | | | 700,000 | | | | 747,359 | |
| | |
| Asset-Backed 1.3% | |
| Home Equity Loans 0.1% | |
| CIT Group Home Equity Loan Trust, "AF6", Series 2002-1, 6.2%, 2/25/2030 | | | 47,702 | | | | 47,559 | |
| Miscellaneous 1.2% | |
| ARES CLO Ltd., "D", Series 2012-3A, 144A, 4.878%**, 1/17/2024 | | | 250,000 | | | | 249,999 | |
| Domino's Pizza Master Issuer LLC, "A2", Series 2012-1A, 144A, 5.216%, 1/25/2042 | | | 144,938 | | | | 151,946 | |
| Hilton Grand Vacations Trust, "B", Series 2014-AA, 144A, 2.07%, 11/25/2026 | | | 266,263 | | | | 261,917 | |
| | | | | 663,862 | |
Total Asset-Backed (Cost $707,410) | | | | 711,421 | |
| | |
| Commercial Mortgage-Backed Securities 1.3% | |
| Commercial Mortgage Trust, "AM", Series 2007-GG11, 5.867%, 12/10/2049 | | | | 290,000 | | | | 314,318 | |
| Del Coronado Trust, "M", Series 2013-HDMZ, 144A, 5.161%**, 3/15/2018 | | | | 80,000 | | | | 80,064 | |
| JPMorgan Chase Commercial Mortgage Securities Corp., "C", Series 2012-HSBC, 144A, 4.021%, 7/5/2032 | | | 150,000 | | | | 156,860 | |
| Wachovia Bank Commercial Mortgage Trust, "A4", Series 2005-C22, 5.269%**, 12/15/2044 | | | | 126,388 | | | | 129,086 | |
Total Commercial Mortgage-Backed Securities (Cost $638,638) | | | | 680,328 | |
| | |
| Collateralized Mortgage Obligations 2.8% | |
| Banc of America Mortgage Securities, "2A2", Series 2004-A, 2.693%**, 2/25/2034 | | | 90,373 | | | | 89,566 | |
| Bear Stearns Adjustable Rate Mortgage Trust, "2A1", Series 2005-11, 2.92%**, 12/25/2035 | | | 121,347 | | | | 121,957 | |
| Countrywide Home Loans, "2A5", Series 2004-13, 5.75%, 8/25/2034 | | | 79,177 | | | | 79,040 | |
| Federal Home Loan Mortgage Corp.: | |
| "AI", Series 4016, Interest Only, 3.0%, 9/15/2025 | | | | 1,093,385 | | | | 98,492 | |
| "ZG", Series 4213, 3.5%, 6/15/2043 | | | | 91,121 | | | | 91,302 | |
| "JI", Series 3558, Interest Only, 4.5%, 12/15/2023 | | | | 31,231 | | | | 1,104 | |
| "PI", Series 3843, Interest Only, 4.5%, 5/15/2038 | | | | 393,117 | | | | 42,582 | |
| "HI", Series 2934, Interest Only, 5.0%, 2/15/2020 | | | | 100,134 | | | | 8,833 | |
| | | Principal Amount ($)(a) | | | Value ($) | |
| | | | | | | | | |
| "WI", Series 3010, Interest Only, 5.0%, 7/15/2020 | | | 157,492 | | | | 14,029 | |
| "JS", Series 3572, Interest Only, 6.639%***, 9/15/2039 | | | 617,635 | | | | 95,892 | |
| Federal National Mortgage Association: | |
| "BI", Series 2010-13, Interest Only, 5.0%, 12/25/2038 | | | 60,628 | | | | 3,699 | |
| "PI", Series 2006-20, Interest Only, 6.511%***, 11/25/2030 | | | 379,977 | | | | 63,212 | |
| "SI", Series 2007-23, Interest Only, 6.601%***, 3/25/2037 | | | 244,244 | | | | 33,523 | |
| Government National Mortgage Association: | |
| "ZJ", Series 2013-106, 3.5%, 7/20/2043 | | | | 183,744 | | | | 183,712 | |
| "IV", Series 2009-69, Interest Only, 5.5%, 8/20/2039 | | | 319,645 | | | | 55,187 | |
| "IN", Series 2009-69, Interest Only, 5.5%, 8/20/2039 | | | 324,567 | | | | 53,682 | |
| "IJ", Series 2009-75, Interest Only, 6.0%, 8/16/2039 | | | 300,958 | | | | 54,089 | |
| "AI", Series 2007-38, Interest Only, 6.299%***, 6/16/2037 | | | 83,386 | | | | 13,382 | |
| JPMorgan Mortgage Trust, "2A1", Series 2006-A2, 2.609%**, 4/25/2036 | | | 272,199 | | | | 249,533 | |
| Merrill Lynch Mortgage Investors Trust, "2A", Series 2003-A6, 2.524%**, 10/25/2033 | | | 72,643 | | | | 72,847 | |
| Wells Fargo Mortgage-Backed Securities Trust, "2A3",Series 2004-EE, 2.612%**, 12/25/2034 | | | 102,217 | | | | 101,951 | |
Total Collateralized Mortgage Obligations (Cost $1,416,742) | | | | 1,527,614 | |
| | |
| Government & Agency Obligations 12.9% | |
| Other Government Related (d) 0.2% | |
| TMK OAO, 144A, 6.75%, 4/3/2020 | | | | 200,000 | | | | 112,000 | |
| Sovereign Bonds 7.7% | |
| Federative Republic of Brazil, 12.5%, 1/5/2016 | BRL | | | 250,000 | | | | 94,754 | |
| Government of New Zealand: | |
| Series 0427, REG S, 4.5%, 4/15/2027 | NZD | | | 620,000 | | | | 515,865 | |
| 5.5%, 4/15/2023 | NZD | | | 770,000 | | | | 644,942 | |
Republic of Argentina- Inflation Linked Bond, 5.83%, 12/31/2033 | ARS | | | 375 | | | | 119 | |
| Republic of Belarus, REG S, 8.75%, 8/3/2015 | | | | 145,000 | | | | 136,546 | |
| Republic of Costa Rica, 144A, 4.25%, 1/26/2023 | | | | 200,000 | | | | 183,000 | |
| Republic of Croatia, 144A, 6.75%, 11/5/2019 | | | | 400,000 | | | | 438,000 | |
| Republic of El Salvador: | |
| 144A, 6.375%, 1/18/2027 | | | | 75,000 | | | | 75,187 | |
| 144A, 7.65%, 6/15/2035 | | | | 200,000 | | | | 212,000 | |
| Republic of Hungary: | |
| 4.0%, 3/25/2019 | | | | 200,000 | | | | 205,500 | |
| Series 19/A, 6.5%, 6/24/2019 | HUF | | | 11,600,000 | | | | 50,664 | |
| Republic of Italy, REG S, 144A, 4.75%, 9/1/2044 | EUR | | | 460,000 | | | | 720,905 | |
| Republic of Peru, 144A, 5.7%, 8/12/2024 | PEN | | | 350,000 | | | | 117,204 | |
| | | Principal Amount ($)(a) | | | Value ($) | |
| | | | | | | | | |
| Republic of Slovenia: | |
| 144A, 4.75%, 5/10/2018 | | | | 200,000 | | | | 214,000 | |
| 144A, 5.5%, 10/26/2022 | | | | 100,000 | | | | 110,875 | |
| Republic of South Africa: | |
| 5.875%, 9/16/2025 | | | | 20,000 | | | | 22,525 | |
| Series R204, 8.0%, 12/21/2018 | ZAR | | | 250,000 | | | | 22,144 | |
| Republic of Sri Lanka, 144A, 5.125%, 4/11/2019 | | | | 200,000 | | | | 201,500 | |
| United Mexican States: | |
| Series M, 4.75%, 6/14/2018 | MXN | | | 1,300,000 | | | | 87,917 | |
| Series M 20, 8.5%, 5/31/2029 | MXN | | | 650,000 | | | | 53,235 | |
| | | | | 4,106,882 | |
| U.S. Treasury Obligations 5.0% | |
| U.S. Treasury Bills: | |
| 0.035%****, 2/12/2015 (e) | | | 254,000 | | | | 253,995 | |
| 0.085%****, 6/11/2015 (e) | | | 365,000 | | | | 364,895 | |
| 0.086%****, 6/11/2015 (e) | | | 57,000 | | | | 56,984 | |
| U.S. Treasury Bonds: | |
| 3.125%, 8/15/2044 | | | | 40,000 | | | | 43,062 | |
| 3.625%, 2/15/2044 | | | | 86,000 | | | | 101,205 | |
| U.S. Treasury Notes: | |
| 1.0%, 8/31/2016 (f) | | | | 1,000,000 | | | | 1,007,500 | |
| 1.0%, 9/30/2016 | | | | 500,000 | | | | 503,672 | |
| 1.5%, 5/31/2019 | | | | 232,600 | | | | 232,018 | |
| 1.625%, 6/30/2019 | | | | 19,000 | | | | 19,048 | |
| 2.25%, 11/15/2024 | | | | 107,200 | | | | 107,920 | |
| | | | | 2,690,299 | |
Total Government & Agency Obligations (Cost $6,955,678) | | | | 6,909,181 | |
| | |
| Loan Participations and Assignments 4.0% | |
| Senior Loans** | |
| American Rock Salt Holdings LLC, First Lien Term Loan, 4.75%, 5/20/2021 | | | 104,475 | | | | 102,298 | |
| Avis Budget Car Rental LLC, Term Loan B, 3.0%, 3/15/2019 | | | 59,246 | | | | 58,580 | |
| Calpine Corp., Term Loan B1, 4.0%, 4/1/2018 | | | | 191,518 | | | | 190,081 | |
| Crown Castle International Corp., Term Loan B, 3.0%, 1/31/2019 | | | 48,759 | | | | 48,362 | |
| CSC Holdings, Inc., Term Loan B, 2.669%, 4/17/2020 | | | 111,439 | | | | 109,310 | |
| Cumulus Media Holdings, Inc., Term Loan, 4.25%, 12/23/2020 | | | 28,206 | | | | 27,442 | |
| DaVita HealthCare Partners, Inc., Term Loan B, 3.5%, 6/24/2021 | | | 69,650 | | | | 69,096 | |
| Goodyear Tire & Rubber Co., Second Lien Term Loan, 4.75%, 4/30/2019 | | | 220,000 | | | | 220,137 | |
| HJ Heinz Co., Term Loan B2, 3.5%, 6/5/2020 | | | | 213,774 | | | | 212,858 | |
| Level 3 Financing, Inc., Term Loan B5, 4.5%, 1/31/2022 | | | | 60,000 | | | | 60,150 | |
| MacDermid, Inc., First Lien Term Loan, 4.0%, 6/7/2020 | | | 54,175 | | | | 53,210 | |
| MEG Energy Corp., Term Loan, 3.75%, 3/31/2020 | | | 255,394 | | | | 244,646 | |
| NRG Energy, Inc., Term Loan B, 2.75%, 7/2/2018 | | | 117,230 | | | | 115,194 | |
| | | Principal Amount ($)(a) | | | Value ($) | |
| | | | | | | | | |
| Par Pharmaceutical Companies, Inc., Term Loan B2, 4.0%, 9/30/2019 | | | 116,849 | | | | 113,928 | |
| Quebecor Media, Inc., Term Loan B1, 3.25%, 8/17/2020 | | | 88,875 | | | | 85,653 | |
| Tallgrass Operations LLC: | |
| Term Delayed Draw, 3.75%, 11/13/2017 | | | | 41,157 | | | | 39,922 | |
| Term Loan B, 4.25%, 11/13/2018 | | | 132,532 | | | | 129,881 | |
Valeant Pharmaceuticals International, Inc.: | |
| Term Loan B, 3.5%, 2/13/2019 | | | 137,133 | | | | 136,173 | |
| Term Loan B, 3.5%, 12/11/2019 | | | 115,706 | | | | 114,934 | |
Total Loan Participations and Assignments (Cost $2,166,988) | | | | 2,131,855 | |
| | |
| Municipal Bonds and Notes 1.8% | |
| Chicago, IL, Airport Revenue, O'Hare International Airport Revenue, Series B, 6.0%, 1/1/2041 | | | 145,000 | | | | 169,026 | |
| Massachusetts, State School Building Authority, Sales Tax Revenue, Qualified School Construction Bond, Series A, 4.885%, 7/15/2028 | | | 300,000 | | | | 331,530 | |
| Orlando & Orange County, FL, Expressway Authority Revenue, Series C, 5.0%, 7/1/2040 | | | 145,000 | | | | 162,270 | |
| Port Authority of New York & New Jersey, 4.926%, 10/1/2051 | | | 260,000 | | | | 297,846 | |
Total Municipal Bonds and Notes (Cost $850,171) | | | | 960,672 | |
| | |
| Convertible Bond 0.4% | |
| Materials | |
| GEO Specialty Chemicals, Inc., 144A, 7.5%, 3/31/2015 (PIK) (Cost $119,886) | | | 120,175 | | | | 207,602 | |
| | |
| Preferred Security 0.2% | |
| Materials | |
| Hercules, Inc., 6.5%, 6/30/2029 (Cost $60,337) | | | 95,000 | | | | 85,500 | |
| | | Shares | | | Value ($) | |
| | | | |
| Common Stocks 0.0% | |
| Consumer Discretionary 0.0% | |
| Dawn Holdings, Inc.* (g) | | | 1 | | | | 4,121 | |
| Trump Entertainment Resorts, Inc.* | | | 6 | | | | 0 | |
| | | | | | | | 4,121 | |
| Industrials 0.0% | |
| Congoleum Corp.* | | | 2,500 | | | | 0 | |
| Quad Graphics, Inc. | | | 24 | | | | 551 | |
| | | | | | | | 551 | |
| Materials 0.0% | |
| GEO Specialty Chemicals, Inc.* | | | 2,058 | | | | 1,365 | |
Total Common Stocks (Cost $25,217) | | | | 6,037 | |
| | | Shares | | | Value ($) | |
| | | | | | | | | |
| Preferred Stock 0.2% | |
| Financials | |
| Ally Financial, Inc., Series G, 144A, 7.0% (Cost $85,128) | | | 89 | | | | 89,409 | |
| | |
| Warrants 0.0% | |
| Materials | |
| GEO Specialty Chemicals, Inc., Expiration Date 3/31/2015* | | | 11,138 | | | | 7,303 | |
| Hercules Trust II, Expiration Date 3/31/2029* | | | 85 | | | | 835 | |
Total Warrants (Cost $17,432) | | | | 8,138 | |
| | |
| Exchange-Traded Fund 5.1% | |
| SPDR Barclays Convertible Securities (Cost $2,777,628) | | | 58,300 | | | | 2,733,687 | |
| | | Contract Amount | | | Value ($) | |
| | | | |
| Call Options Purchased 0.1% | |
| Options on Interest Rate Swap Contracts | |
Pay Fixed Rate — 3.72% – Receive Floating — LIBOR, Swap Expiration Date 4/22/2026, Option Expiration Date 4/20/20161 | | | 1,300,000 | | | | 7,961 | |
Pay Fixed Rate — 4.19% – Receive Floating — LIBOR, Swap Expiration Date 2/3/2027, Option Expiration Date 2/1/20172 | | | 1,500,000 | | | | 12,377 | |
Pay Fixed Rate — 4.32% – Receive Floating — LIBOR, Swap Expiration Date 2/3/2027, Option Expiration Date 2/1/20173 | | | 1,400,000 | | | | 9,831 | |
Total Call Options Purchased (Cost $191,320) | | | | 30,169 | |
| | | Contract Amount | | | Value ($) | |
| | | | | | | | | |
| Put Options Purchased 0.1% | |
| Options on Interest Rate Swap Contracts | |
Receive Fixed Rate — 2.19% – Pay Floating — LIBOR, Swap Expiration Date 2/3/2027, Option Expiration Date 2/1/20172 | | | 1,500,000 | | | | 30,127 | |
Receive Fixed Rate — 2.32% – Pay Floating — LIBOR, Swap Expiration Date 2/3/2027, Option Expiration Date 2/1/20173 | | | 1,400,000 | | | | 33,649 | |
Total Put Options Purchased (Cost $98,573) | | | | 63,776 | |
| | | Shares | | | Value ($) | |
| | | | |
| Securities Lending Collateral 1.2% | |
| Daily Assets Fund Institutional, 0.10% (h) (i) (Cost $633,968) | | | 633,968 | | | | 633,968 | |
| | |
| Cash Equivalents 16.7% | |
| Central Cash Management Fund, 0.06% (h) (Cost $8,976,583) | | | 8,976,583 | | | | 8,976,583 | |
| | | % of Net Assets | | | Value ($) | |
| | | | |
Total Investment Portfolio (Cost $55,027,907)† | | | 101.7 | | | | 54,485,967 | |
| Other Assets and Liabilities, Net | | | (1.7 | ) | | | (900,338 | ) |
| Net Assets | | | 100.0 | | | | 53,585,629 | |
The following table represents bonds that are in default:
| Security | | Coupon | | Maturity Date | Principal Amount | | | Cost ($) | | | Value ($) | |
| Energy Future Holdings Corp.* | | | 6.5 | % | 11/15/2024 | USD | | | 100,000 | | | | 59,374 | | | | 78,000 | |
| Hellas Telecommunications Finance* | | | 8.082 | % | 7/15/2015 | EUR | | | 109,187 | | | | 32,169 | | | | 0 | |
| | | | | | | | | | | | | | 91,543 | | | | 78,000 | |
* Non-income producing security.
** Floating rate securities' yields vary with a designated market index or market rate, such as the coupon-equivalent of the U.S. Treasury Bill rate. These securities are shown at their current rate as of December 31, 2014.
*** These securities are shown at their current rate as of December 31, 2014.
****Annualized yield at time of purchase; not a coupon rate.
† The cost for federal income tax purposes was $55,023,972. At December 31, 2014, net unrealized depreciation for all securities based on tax cost was $538,005. This consisted of aggregate gross unrealized appreciation for all securities in which there was an excess of value over tax cost of $1,252,648 and aggregate gross unrealized depreciation for all securities in which there was an excess of tax cost over value of $1,790,653.
(a) Principal amount stated in U.S. dollars unless otherwise noted.
(b) All or a portion of these securities were on loan. In addition, "Other Assets and Liabilities, Net" may include pending sales that are also on loan. The value of securities loaned at December 31, 2014 amounted to $609,294, which is 1.1% of net assets.
(c) When-issued security.
(d) Government-backed debt issued by financial companies or government-sponsored enterprises.
(e) At December 31, 2014, this security has been pledged, in whole or in part, to cover initial margin requirements for open futures contracts.
(f) At December 31, 2014, this security has been pledged, in whole or in part, to cover initial margin requirements for open centrally cleared swap contracts.
(g) The Fund may purchase securities that are subject to legal or contractual restrictions on resale ("restricted securities"). Restricted securities are securities which have not been registered with the Securities and Exchange Commission under the Securities Act of 1933. The Fund may be unable to sell a restricted security and it may be more difficult to determine a market value for a restricted security. Moreover, if adverse market conditions were to develop during the period between the Fund's decision to sell a restricted security and the point at which the Fund is permitted or able to sell such security, the Fund might obtain a price less favorable than the price that prevailed when it decided to sell. This investment practice, therefore, could have the effect of increasing the level of illiquidity of the Fund. The future value of these securities is uncertain and there may be changes in the estimated value of these securities.
| Schedule of Restricted Securities | Acquisition Date | | Cost ($) | | | Value ($) | | | Value as % of Net Assets | |
| Dawn Holdings, Inc.* | August 2013 | | | 5,273 | | | | 4,121 | | | | .01 | |
(h) Affiliated fund managed by Deutsche Investment Management Americas Inc. The rate shown is the annualized seven-day yield at period end.
(i) Represents collateral held in connection with securities lending. Income earned by the Fund is net of borrower rebates.
144A: Security exempt from registration under Rule 144A of the Securities Act of 1933. These securities may be resold in transactions exempt from registration, normally to qualified institutional buyers.
CLO: Collateralized Loan Obligation
Interest Only: Interest Only (IO) bonds represent the "interest only" portion of payments on a pool of underlying mortgages or mortgage-backed securities. IO securities are subject to prepayment risk of the pool of underlying mortgages.
LIBOR: London Interbank Offered Rate
PIK: Denotes that all or a portion of the income is paid in-kind in the form of additional principal.
REG S: Securities sold under Regulation S may not be offered, sold or delivered within the United States or to, or for the account or benefit of, U.S. persons, except pursuant to an exemption from, or in a transaction not subject to, the registration requirements of the Securities Act of 1933.
REIT: Real Estate Investment Trust
SPDR: Standard & Poor's Depositary Receipt
At December 31, 2014, open futures contracts purchased were as follows:
| Futures | Currency | Expiration Date | | Contracts | | | Notional Value ($) | | | Unrealized Appreciation ($) | |
| 10 Year U.S. Treasury Note | USD | 3/20/2015 | | | 20 | | | | 2,535,938 | | | | 6,419 | |
| United Kingdom Long Gilt Bond | GBP | 3/27/2015 | | | 3 | | | | 558,899 | | | | 12,807 | |
| Total unrealized appreciation | | | | 19,226 | |
At December 31, 2014, open futures contracts sold were as follows:
| Futures | Currency | Expiration Date | | Contracts | | | Notional Value ($) | | | Unrealized Depreciation ($) | |
| 10 Year Australian Bond | AUD | 3/16/2015 | | | 5 | | | | 523,088 | | | | (7,860 | ) |
| 10 Year U.S. Treasury Note | USD | 3/20/2015 | | | 3 | | | | 380,391 | | | | (1,015 | ) |
| Euro-BTP Italian Government Bond | EUR | 3/6/2015 | | | 10 | | | | 1,640,828 | | | | (11,197 | ) |
| U.S. Treasury Long Bond | USD | 3/20/2015 | | | 4 | | | | 578,250 | | | | (14,690 | ) |
| Total unrealized depreciation | | | | (34,762 | ) |
At December 31, 2014, open written options contracts were as follows:
| Options on Interest Rate Swap Contracts | Swap Effective/ Expiration Date | | Contract Amount | | Option Expiration Date | | Premiums Received ($) | | | Value ($) (j) | |
Call Options Receive Fixed — 3.19% – Pay Floating — LIBOR | 2/3/2017 2/3/2027 | | | 700,000 | 2 | 2/1/2017 | | | 50,400 | | | | (18,547 | ) |
| Receive Fixed — 3.32% – Pay Floating — LIBOR | 2/3/2017 2/3/2027 | | | 700,000 | 3 | 2/1/2017 | | | 50,631 | | | | (16,090 | ) |
| Receive Fixed — 4.22% – Pay Floating — LIBOR | 4/22/2016 4/22/2026 | | | 1,300,000 | 1 | 4/20/2016 | | | 46,345 | | | | (3,263 | ) |
| Total Call Options | | | 147,376 | | | | (37,900 | ) |
Put Options Pay Fixed — 3.19% – Receive Floating — LIBOR | 2/3/2017 2/3/2027 | | | 700,000 | 2 | 2/1/2017 | | | 50,400 | | | | (44,226 | ) |
| Pay Fixed — 3.32% – Receive Floating — LIBOR | 2/3/2017 2/3/2027 | | | 700,000 | 3 | 2/1/2017 | | | 50,631 | | | | (49,572 | ) |
| Total Put Options | | | 101,031 | | | | (93,798 | ) |
| Total | | | 248,407 | | | | (131,698 | ) |
(j) Unrealized appreciation on written options on interest rate swap contracts at December 31, 2014 was $116,709.
At December 31, 2014, open credit default swap contracts sold were as follows:
| Bilateral Swaps | |
Effective/ Expiration Dates | | Notional Amount ($) (k) | | | Fixed Cash Flows Received | | Underlying Debt Obligation/ Quality Rating (l) | | Value ($) | | | Upfront Payments Paid ($) | | | Unrealized Appreciation ($) | |
3/21/2011 6/20/2016 | | | 120,000 | 2 | | | 5.0 | % | HCA, Inc., 6.375%, 1/15/2015, B | | | 8,007 | | | | 1,319 | | | | 6,688 | |
12/20/2011 3/20/2017 | | | 60,000 | 4 | | | 5.0 | % | CIT Group, Inc., 5.5%, 2/15/2019, BB– | | | 5,034 | | | | 1,121 | | | | 3,913 | |
6/20/2013 9/20/2018 | | | 40,000 | 4 | | | 5.0 | % | DISH DBS Corp., 6.75%, 6/1/2021, BB– | | | 4,890 | | | | 2,658 | | | | 2,232 | |
6/20/2013 9/20/2018 | | | 125,000 | 5 | | | 5.0 | % | HCA, Inc., 8.0%, 10/1/2018, B | | | 16,024 | | | | 7,431 | | | | 8,593 | |
6/20/2013 9/20/2018 | | | 100,000 | 6 | | | 5.0 | % | Sprint Communications, Inc., 6.0%, 12/1/2016, BB– | | | 4,871 | | | | 4,418 | | | | 453 | |
| Total unrealized appreciation | | | | 21,879 | |
(k) The maximum potential amount of future undiscounted payments that the Fund could be required to make under a credit default swap contract would be the notional amount of the contract. These potential amounts would be partially offset by any recovery values of the referenced debt obligation or net amounts received from the settlement of buy protection credit default swap contracts entered into by the Fund for the same referenced debt obligation, if any.
(l) The quality ratings represent the higher of Moody's Investors Service, Inc. ("Moody's") or Standard & Poor's Corporation ("S&P") credit ratings and are unaudited.
At December 31, 2014, open interest rate swap contracts were as follows:
| Centrally Cleared Swaps | |
Effective/ Expiration Dates | | Notional Amount ($) | | Cash Flows Paid by the Fund | Cash Flows Received by the Fund | | Value ($) | | | Unrealized Appreciation/ (Depreciation) ($) | |
12/16/2015
9/18/2017 | | | 3,600,000 | | Fixed — 1.557% | Floating — LIBOR | | | 4,429 | | | | 27 | |
12/16/2015
9/16/2020 | | | 2,000,000 | | Floating — LIBOR | Fixed — 2.214% | | | (1,068 | ) | | | (3 | ) |
6/17/2015
6/18/2025 | | | 4,000,000 | | Fixed — 2.404% | Floating — LIBOR | | | 6,498 | | | | 6,498 | |
12/16/2015
9/16/2025 | | | 3,000,000 | | Fixed — 2.64% | Floating — LIBOR | | | (17,763 | ) | | | (36 | ) |
12/16/2015
9/17/2035 | | | 200,000 | | Fixed — 2.938% | Floating — LIBOR | | | (4,198 | ) | | | (4 | ) |
12/16/2015
9/18/2045 | | | 500,000 | | Floating — LIBOR | Fixed — 2.998% | | | 16,646 | | | | 9 | |
| Total net unrealized appreciation | | | | 6,491 | |
Counterparties:
1 Nomura International PLC
2 JPMorgan Chase Securities, Inc.
3 BNP Paribas
4 Credit Suisse
5 Goldman Sachs & Co.
6 Bank of America
At December 31, 2014, the Fund had the following open forward foreign currency exchange contracts:
| Contracts to Deliver | | In Exchange For | | Settlement Date | | Unrealized Appreciation ($) | | Counterparty |
| CAD | | | 1,265,089 | | GBP | | | 700,000 | | 1/5/2015 | | | 2,186 | | Societe Generale |
| USD | | | 10,467 | | JPY | | | 1,254,600 | | 1/5/2015 | | | 7 | | Societe Generale |
| EUR | | | 900,000 | | USD | | | 1,126,957 | | 1/5/2015 | | | 37,911 | | Barclays Bank PLC |
| EUR | | | 900,000 | | JPY | | | 133,309,800 | | 1/5/2015 | | | 23,910 | | Barclays Bank PLC |
| AUD | | | 1,000,000 | | NZD | | | 1,065,118 | | 1/5/2015 | | | 14,446 | | BNP Paribas |
| USD | | | 1,401,826 | | NZD | | | 1,800,000 | | 1/5/2015 | | | 2,264 | | Australia & New Zealand Banking Group Ltd. |
| MXN | | | 5,700,000 | | USD | | | 413,336 | | 1/15/2015 | | | 27,228 | | JPMorgan Chase Securities, Inc. |
| EUR | | | 562,000 | | USD | | | 698,291 | | 1/20/2015 | | | 18,134 | | Societe Generale |
| SGD | | | 1,787,000 | | USD | | | 1,405,653 | | 1/20/2015 | | | 57,160 | | Australia & New Zealand Banking Group Ltd. |
| CAD | | | 850,000 | | USD | | | 752,972 | | 1/20/2015 | | | 21,630 | | Societe Generale |
| CAD | | | 775,040 | | USD | | | 685,830 | | 1/20/2015 | | | 18,984 | | Australia & New Zealand Banking Group Ltd. |
| NZD | | | 1,100,000 | | USD | | | 858,432 | | 2/5/2015 | | | 2,902 | | Australia & New Zealand Banking Group Ltd. |
| NZD | | | 1,046,000 | | AUD | | | 1,000,000 | | 2/5/2015 | | | 1,028 | | Australia & New Zealand Banking Group Ltd. |
| USD | | | 7,204 | | RUB | | | 481,200 | | 2/17/2015 | | | 500 | | Barclays Bank PLC |
| Total unrealized appreciation | | | | | 228,290 | |
| Contracts to Deliver | | In Exchange For | | Settlement Date | | Unrealized Depreciation ($) | | Counterparty |
| NZD | | | 1,055,540 | | AUD | | | 1,000,000 | | 1/5/2015 | | | (6,974 | ) | Morgan Stanley |
| USD | | | 1,090,551 | | JPY | | | 130,000,000 | | 1/5/2015 | | | (5,228 | ) | UBS AG |
| USD | | | 1,096,808 | | EUR | | | 900,000 | | 1/5/2015 | | | (7,762 | ) | Societe Generale |
| AUD | | | 1,000,000 | | NZD | | | 1,045,127 | | 1/5/2015 | | | (1,148 | ) | Australia & New Zealand Banking Group Ltd. |
| USD | | | 8,138 | | NZD | | | 10,413 | | 1/5/2015 | | | (16 | ) | Citigroup, Inc. |
| USD | | | 8,459 | | CAD | | | 9,800 | | 1/5/2015 | | | (24 | ) | Citigroup, Inc. |
| NZD | | | 1,800,000 | | USD | | | 1,381,573 | | 1/5/2015 | | | (22,518 | ) | Australia & New Zealand Banking Group Ltd. |
| GBP | | | 700,000 | | CAD | | | 1,255,289 | | 1/5/2015 | | | (10,621 | ) | UBS AG |
| NZD | | | 1,084,795 | | AUD | | | 1,000,000 | | 1/5/2015 | | | (29,795 | ) | Australia & New Zealand Banking Group Ltd. |
| JPY | | | 134,564,400 | | EUR | | | 900,000 | | 1/5/2015 | | | (34,384 | ) | Barclays Bank PLC |
| USD | | | 281,282 | | ZAR | | | 3,200,000 | | 1/15/2015 | | | (5,092 | ) | UBS AG |
| USD | | | 272,378 | | ZAR | | | 3,100,000 | | 1/15/2015 | | | (4,819 | ) | Citigroup, Inc. |
| USD | | | 8,824 | | ZAR | | | 100,000 | | 1/15/2015 | | | (193 | ) | Commonwealth Bank of Australia |
| USD | | | 837,432 | | MXN | | | 11,400,000 | | 1/15/2015 | | | (65,216 | ) | JPMorgan Chase Securities, Inc. |
| USD | | | 407,709 | | ZAR | | | 4,650,000 | | 1/15/2015 | | | (6,371 | ) | BNP Paribas |
| NZD | | | 1,466,000 | | USD | | | 1,135,451 | | 1/20/2015 | | | (6,530 | ) | Australia & New Zealand Banking Group Ltd. |
| USD | | | 684,219 | | CAD | | | 775,040 | | 1/20/2015 | | | (17,372 | ) | Societe Generale |
| USD | | | 1,365,084 | | SGD | | | 1,787,000 | | 1/20/2015 | | | (16,590 | ) | BNP Paribas |
| GBP | | | 700,000 | | CAD | | | 1,265,620 | | 2/5/2015 | | | (2,190 | ) | Societe Generale |
| USD | | | 8,619 | | ZAR | | | 100,000 | | 2/10/2015 | | | (24 | ) | Citigroup, Inc. |
| RUB | | | 481,200 | | USD | | | 7,475 | | 2/17/2015 | | | (229 | ) | Barclays Bank PLC |
| Total unrealized depreciation | | | | | (243,096 | ) |
| Currency Abbreviations |
ARS Argentine Peso AUD Australian Dollar BRL Brazilian Real CAD Canadian Dollar EUR Euro GBP British Pound HUF Hungarian Forint JPY Japanese Yen MXN Mexican Peso NZD New Zealand Dollar PEN Peruvian Nuevo Sol RUB Russian Ruble SGD Singapore Dollar USD United States Dollar ZAR South African Rand |
For information on the Fund's policy and additional disclosures regarding options purchased, futures contracts, credit default swap contracts, interest rate swap contracts, forward foreign currency exchange contracts and written option contracts, please refer to Note B in the accompanying Notes to Financial Statements.
Fair Value Measurements
Various inputs are used in determining the value of the Fund's investments. These inputs are summarized in three broad levels. Level 1 includes quoted prices in active markets for identical securities. Level 2 includes other significant observable inputs (including quoted prices for similar securities, interest rates, prepayment speeds and credit risk). Level 3 includes significant unobservable inputs (including the Fund's own assumptions in determining the fair value of investments). The level assigned to the securities valuations may not be an indication of the risk or liquidity associated with investing in those securities.
The following is a summary of the inputs used as of December 31, 2014 in valuing the Fund's investments. For information on the Fund's policy regarding the valuation of investments, please refer to the Security Valuation section of Note A in the accompanying Notes to Financial Statements.
| Assets | | Level 1 | | | Level 2 | | | Level 3 | | | Total | |
| | |
| Fixed Income Investments (m) | |
| Corporate Bonds | | $ | — | | | $ | 27,982,668 | | | $ | 0 | | | $ | 27,982,668 | |
| Mortgage-Backed Securities Pass-Throughs | | | — | | | | 747,359 | | | | — | | | | 747,359 | |
| Asset-Backed | | | — | | | | 711,421 | | | | — | | | | 711,421 | |
| Commercial Mortgage-Backed Securities | | | — | | | | 680,328 | | | | — | | | | 680,328 | |
| Collateralized Mortgage Obligations | | | — | | | | 1,527,614 | | | | — | | | | 1,527,614 | |
| Government & Agency Obligations | | | — | | | | 6,909,181 | | | | — | | | | 6,909,181 | |
| Loan Participations and Assignments | | | — | | | | 2,091,933 | | | | 39,922 | | | | 2,131,855 | |
| Municipal Bonds and Notes | | | — | | | | 960,672 | | | | — | | | | 960,672 | |
| Convertible Bond | | | — | | | | — | | | | 207,602 | | | | 207,602 | |
| Preferred Security | | | — | | | | 85,500 | | | | — | | | | 85,500 | |
| Common Stocks (m) | | | 551 | | | | — | | | | 5,486 | | | | 6,037 | |
| Preferred Stock | | | — | | | | 89,409 | | | | — | | | | 89,409 | |
| Warrants | | | — | | | | — | | | | 8,138 | | | | 8,138 | |
| Exchange-Traded Fund | | | 2,733,687 | | | | — | | | | — | | | | 2,733,687 | |
| Short-Term Investments (m) | | | 9,610,551 | | | | — | | | | — | | | | 9,610,551 | |
Derivatives (n) Purchased Options | | | — | | | | 93,945 | | | | — | | | | 93,945 | |
| Futures Contracts | | | 19,226 | | | | — | | | | — | | | | 19,226 | |
| Credit Default Swap Contracts | | | — | | | | 21,879 | | | | — | | | | 21,879 | |
| Interest Rate Swap Contracts | | | — | | | | 6,534 | | | | — | | | | 6,534 | |
| Forward Foreign Currency Exchange Contracts | | | — | | | | 228,290 | | | | — | | | | 228,290 | |
| Total | | $ | 12,364,015 | | | $ | 42,136,733 | | | $ | 261,148 | | | $ | 54,761,896 | |
| Liabilities | | Level 1 | | | Level 2 | | | Level 3 | | | Total | |
| | |
Derivatives (n) Futures Contracts | | $ | (34,762 | ) | | $ | — | | | $ | — | | | $ | (34,762 | ) |
| Written Options | | | — | | | | (131,698 | ) | | | — | | | | (131,698 | ) |
| Interest Rate Swap Contracts | | | — | | | | (43 | ) | | | — | | | | (43 | ) |
| Forward Foreign Currency Exchange Contracts | | | — | | | | (243,096 | ) | | | — | | | | (243,096 | ) |
| Total | | $ | (34,762 | ) | | $ | (374,837 | ) | | $ | — | | | $ | (409,599 | ) |
There have been no transfers between fair value measurement levels during the year ended December 31, 2014.
(m) See Investment Portfolio for additional detailed categorizations.
(n) Derivatives include value of options purchased, unrealized appreciation (depreciation) on futures contracts, credit default swap contracts, interest rate swap contracts and forward foreign currency exchange contracts, and written options, at value.
The accompanying notes are an integral part of the financial statements.
Statement of Assets and Liabilities | as of December 31, 2014 | |
| Assets | |
Investments: Investments in non-affiliated securities, at value (cost $45,417,356) — including $609,294 of securities loaned | | $ | 44,875,416 | |
| Investment in Daily Assets Fund Institutional (cost $633,968)* | | | 633,968 | |
| Investment in Central Cash Management Fund (cost $8,976,583) | | | 8,976,583 | |
| Total investments in securities, at value (cost $55,027,907) | | | 54,485,967 | |
| Cash | | | 49,394 | |
| Foreign currency, at value (cost $56,183) | | | 54,069 | |
| Receivable for investments sold | | | 379,684 | |
| Receivable for investments sold — when-issued/delayed delivery securities | | | 729,869 | |
| Receivable for Fund shares sold | | | 430 | |
| Dividends receivable | | | 139,190 | |
| Interest receivable | | | 556,949 | |
| Receivable for variation margin on centrally cleared swaps | | | 383 | |
| Unrealized appreciation on bilateral swap contracts | | | 21,879 | |
| Unrealized appreciation on forward foreign currency exchange contracts | | | 228,290 | |
| Upfront payments paid on bilateral swap contracts | | | 16,947 | |
| Other assets | | | 1,229 | |
| Total assets | | $ | 56,664,280 | |
| Liabilities | |
| Payable upon return of securities loaned | | | 633,968 | |
| Payable for investments purchased | | | 370,263 | |
| Payable for investments purchased — when-issued/delayed delivery securities | | | 1,472,607 | |
| Payable for Fund shares redeemed | | | 83,785 | |
| Payable for variation margin on futures contracts | | | 11,873 | |
| Options written, at value (premiums received $248,407) | | | 131,698 | |
| Unrealized depreciation on forward foreign currency exchange contracts | | | 243,096 | |
| Accrued management fee | | | 5,280 | |
| Accrued Trustees' fees | | | 1,070 | |
| Other accrued expenses and payables | | | 125,011 | |
| Total liabilities | | | 3,078,651 | |
| Net assets, at value | | $ | 53,585,629 | |
| Net Assets Consist of | |
| Undistributed net investment income | | | 2,083,561 | |
Net unrealized appreciation (depreciation) on: Investments | | | (541,940 | ) |
| Swap contracts | | | 28,370 | |
| Futures | | | (15,536 | ) |
| Foreign currency | | | (18,013 | ) |
| Written options | | | 116,709 | |
| Accumulated net realized gain (loss) | | | (1,119,380 | ) |
| Paid-in capital | | | 53,051,858 | |
| Net assets, at value | | $ | 53,585,629 | |
Class A Net Asset Value, offering and redemption price per share ($53,585,629 ÷ 4,786,192 outstanding shares of beneficial interest, no par value, unlimited number of shares authorized) | | $ | 11.20 | |
* Represents collateral on securities loaned.
The accompanying notes are an integral part of the financial statements.
| for the year ended December 31, 2014 | |
| Investment Income | |
Income: Interest | | $ | 2,791,372 | |
| Dividends | | | 122,153 | |
| Income distributions — Central Cash Management Fund | | | 3,081 | |
| Securities lending income, including income from Daily Assets Fund Institutional, net of borrower rebates | | | 2,861 | |
| Total income | | | 2,919,467 | |
Expenses: Management fee | | | 321,002 | |
| Administration fee | | | 58,363 | |
| Services to shareholders | | | 635 | |
| Custodian fee | | | 72,334 | |
| Professional fees | | | 97,587 | |
| Reports to shareholders | | | 24,770 | |
| Trustees' fees and expenses | | | 3,957 | |
| Pricing fee | | | 46,060 | |
| Other | | | 6,008 | |
| Total expenses before expense reductions | | | 630,716 | |
| Expense reductions | | | (182,724 | ) |
| Total expenses after expense reductions | | | 447,992 | |
| Net investment income | | | 2,471,475 | |
| Realized and Unrealized Gain (Loss) | |
Net realized gain (loss) from: Capital gain distributions from exchange-traded fund | | | 75,397 | |
| Investments | | | (115,468 | ) |
| Swap contracts | | | (131,202 | ) |
| Futures | | | (393,448 | ) |
| Foreign currency | | | 397,865 | |
| | | | (166,856 | ) |
Change in net unrealized appreciation (depreciation) on: Investments | | | (774,558 | ) |
| Swap contracts | | | (20,955 | ) |
| Unfunded loan commitment | | | 125 | |
| Futures | | | (11,419 | ) |
| Written options | | | 106,002 | |
| Foreign currency | | | (269,330 | ) |
| | | | (970,135 | ) |
| Net gain (loss) | | | (1,136,991 | ) |
| Net increase (decrease) in net assets resulting from operations | | $ | 1,334,484 | |
The accompanying notes are an integral part of the financial statements.
Statement of Changes in Net Assets | | | Years Ended December 31, | |
| Increase (Decrease) in Net Assets | | 2014 | | | 2013 | |
Operations: Net investment income | | $ | 2,471,475 | | | $ | 2,911,005 | |
| Net realized gain (loss) | | | (166,856 | ) | | | (1,186,626 | ) |
| Change in net unrealized appreciation (depreciation) | | | (970,135 | ) | | | (2,619,441 | ) |
| Net increase (decrease) in net assets resulting from operations | | | 1,334,484 | | | | (895,062 | ) |
Distributions to shareholders from: Net investment income: Class A | | | (2,905,554 | ) | | | (3,703,120 | ) |
Net realized gains: Class A | | | — | | | | (2,113,421 | ) |
| Total distributions | | | (2,905,554 | ) | | | (5,816,541 | ) |
Fund share transactions: Class A Proceeds from shares sold | | | 3,829,411 | | | | 8,233,284 | |
| Reinvestment of distributions | | | 2,905,554 | | | | 5,816,541 | |
| Payments for shares redeemed | | | (12,535,275 | ) | | | (19,881,192 | ) |
| Net increase (decrease) in net assets from Class A share transactions | | | (5,800,310 | ) | | | (5,831,367 | ) |
| Increase (decrease) in net assets | | | (7,371,380 | ) | | | (12,542,970 | ) |
| Net assets at beginning of period | | | 60,957,009 | | | | 73,499,979 | |
| Net assets at end of period (including undistributed net investment income of $2,083,561 and $2,602,311, respectively) | | $ | 53,585,629 | | | $ | 60,957,009 | |
| Other Information | |
Class A Shares outstanding at beginning of period | | | 5,284,551 | | | | 5,832,490 | |
| Shares sold | | | 334,959 | | | | 666,814 | |
| Shares issued to shareholders in reinvestment of distributions | | | 258,501 | | | | 491,677 | |
| Shares redeemed | | | (1,091,819 | ) | | | (1,706,430 | ) |
| Net increase (decrease) in Class A shares | | | (498,359 | ) | | | (547,939 | ) |
| Shares outstanding at end of period | | | 4,786,192 | | | | 5,284,551 | |
The accompanying notes are an integral part of the financial statements.
| | | Years Ended December 31, | |
| Class A | | | 2014 | | | 2013 | | | 2012 | | | 2011 | | | 2010 | |
| Selected Per Share Data | |
| Net asset value, beginning of period | | $ | 11.53 | | | $ | 12.60 | | | $ | 11.90 | | | $ | 11.96 | | | $ | 11.61 | |
Income (loss) from investment operations: Net investment incomea | | | .49 | | | | .49 | | | | .57 | | | | .63 | | | | .66 | |
| Net realized and unrealized gain (loss) | | | (.23 | ) | | | (.59 | ) | | | .92 | | | | (.01 | ) | | | .47 | |
| Total from investment operations | | | .26 | | | | (.10 | ) | | | 1.49 | | | | .62 | | | | 1.13 | |
Less distributions from: Net investment income | | | (.59 | ) | | | (.62 | ) | | | (.76 | ) | | | (.68 | ) | | | (.78 | ) |
| Net realized gains | | | — | | | | (.35 | ) | | | (.03 | ) | | | — | | | | — | |
| Total distributions | | | (.59 | ) | | | (.97 | ) | | | (.79 | ) | | | (.68 | ) | | | (.78 | ) |
| Net asset value, end of period | | $ | 11.20 | | | $ | 11.53 | | | $ | 12.60 | | | $ | 11.90 | | | $ | 11.96 | |
Total Return (%)b | | | 2.23 | | | | (1.04 | ) | | | 13.08 | | | | 5.31 | | | | 10.05 | |
| Ratios to Average Net Assets and Supplemental Data | |
| Net assets, end of period ($ millions) | | | 54 | | | | 61 | | | | 73 | | | | 69 | | | | 76 | |
| Ratio of expenses before expense reductions (%) | | | 1.08 | | | | 1.02 | | | | .99 | | | | .99 | | | | .95 | |
| Ratio of expenses after expense reductions (%) | | | .77 | | | | .74 | | | | .77 | | | | .79 | | | | .86 | |
| Ratio of net investment income (%) | | | 4.23 | | | | 4.16 | | | | 4.72 | | | | 5.38 | | | | 5.62 | |
| Portfolio turnover rate (%) | | | 185 | | | | 183 | | | | 164 | | | | 144 | | | | 167 | |
a Based on average shares outstanding during the period. b Total return would have been lower had certain expenses not been reduced. | |
Notes to Financial Statements
A. Organization and Significant Accounting Policies
Deutsche Unconstrained Income VIP (formerly DWS Unconstrained Income VIP) (the "Fund") is a diversified series of Deutsche Variable Series II (formerly DWS Variable Series II) (the "Trust"), which is registered under the Investment Company Act of 1940, as amended (the "1940 Act"), as an open-end management investment company organized as a Massachusetts business trust.
The Fund's financial statements are prepared in accordance with accounting principles generally accepted in the United States of America which require the use of management estimates. Actual results could differ from those estimates. The policies described below are followed consistently by the Fund in the preparation of its financial statements.
Security Valuation. Investments are stated at value determined as of the close of regular trading on the New York Stock Exchange on each day the exchange is open for trading.
Various inputs are used in determining the value of the Fund's investments. These inputs are summarized in three broad levels. Level 1 includes quoted prices in active markets for identical securities. Level 2 includes other significant observable inputs (including quoted prices for similar securities, interest rates, prepayment speeds and credit risk). Level 3 includes significant unobservable inputs (including the Fund's own assumptions in determining the fair value of investments). The level assigned to the securities valuations may not be an indication of the risk or liquidity associated with investing in those securities.
Debt securities and loan participations and assignments are valued at prices supplied by independent pricing services approved by the Fund's Board. Such services may use various pricing techniques which take into account appropriate factors such as yield, quality, coupon rate, maturity, type of issue, trading characteristics, prepayment speeds and other data, as well as broker quotes. If the pricing services are unable to provide valuations, debt securities are valued at the average of the most recent reliable bid quotations or evaluated prices, as applicable, obtained from broker-dealers and loan participations and assignments are valued at the mean of the most recent bid and ask quotations or evaluated prices, as applicable, obtained from one or more broker-dealers. Certain securities may be valued on the basis of a price provided by a single source or broker-dealer. No active trading market may exist for some senior loans and they may be subject to restrictions on resale. The inability to dispose of senior loans in a timely fashion could result in losses. These securities are generally categorized as Level 2.
Equity securities and exchange-traded funds ("ETFs") are valued at the most recent sale price or official closing price reported on the exchange (U.S. or foreign) or over-the-counter market on which they trade. Equity securities or ETFs for which no sales are reported are valued at the calculated mean between the most recent bid and asked quotations on the relevant market or, if a mean cannot be determined, at the most recent bid quotation. Equity securities and ETFs are generally categorized as Level 1.
Money market instruments purchased with an original or remaining maturity of sixty days or less, maturing at par, are valued at amortized cost, which approximates value, and are categorized as Level 2. Investments in open-end investment companies are valued at their net asset value each business day and are categorized as Level 1.
Futures contracts are generally valued at the settlement prices established each day on the exchange on which they are traded and are categorized as Level 1.
Forward currency contracts are valued at the prevailing forward exchange rate of the underlying currencies and are categorized as Level 2.
Swap contracts are valued daily based upon prices supplied by a Board approved pricing vendor, if available, and otherwise are valued at the price provided by the broker-dealer. Swap contracts are generally categorized as Level 2.
Exchange-traded options are valued at the last sale price or, in the absence of a sale, the mean between the closing bid and asked prices or at the most recent asked price (bid for purchased options) if no bid or asked price are available. Exchange-traded options are categorized as Level 1. Over-the-counter written or purchased options are valued at prices supplied by a Board approved pricing vendor, if available, and otherwise are valued at the price provided by the broker-dealer with which the option was traded. Over-the-counter written or purchased options are generally categorized as Level 2.
Securities and other assets for which market quotations are not readily available or for which the above valuation procedures are deemed not to reflect fair value are valued in a manner that is intended to reflect their fair value as determined in accordance with procedures approved by the Board and are generally categorized as Level 3. In accordance with the Fund's valuation procedures, factors considered in determining value may include, but are not limited to, the type of the security; the size of the holding; the initial cost of the security; the existence of any contractual restrictions on the security's disposition; the price and extent of public trading in similar securities of the issuer or of comparable companies; quotations or evaluated prices from broker-dealers and/or pricing services; information obtained from the issuer, analysts, and/or the appropriate stock exchange (for exchange-traded securities); an analysis of the company's or issuer's financial statements; an evaluation of the forces that influence the issuer and the market(s) in which the security is purchased and sold; and with respect to debt securities, the maturity, coupon, creditworthiness, currency denomination and the movement of the market in which the security is normally traded. The value determined under these procedures may differ from published values for the same securities.
Disclosure about the classification of fair value measurements is included in a table following the Fund's Investment Portfolio.
Foreign Currency Translations. The books and records of the Fund are maintained in U.S. dollars. Investment securities and other assets and liabilities denominated in a foreign currency are translated into U.S. dollars at the prevailing exchange rates at period end. Purchases and sales of investment securities, income and expenses are translated into U.S. dollars at the prevailing exchange rates on the respective dates of the transactions.
Net realized and unrealized gains and losses on foreign currency transactions represent net gains and losses between trade and settlement dates on securities transactions, the acquisition and disposition of foreign currencies, and the difference between the amount of net investment income accrued and the U.S. dollar amount actually received. That portion of both realized and unrealized gains and losses on investments that results from fluctuations in foreign currency exchange rates is not separately disclosed but is included with net realized and unrealized gain/appreciation and loss/depreciation on investments.
Securities Lending. Deutsche Bank AG, as lending agent, lends securities of the Fund to certain financial institutions under the terms of the Security Lending Agreement. The Fund retains benefits of owning the securities it has loaned and continues to receive interest and dividends generated by the securities and to participate in any changes in their market value. The Fund requires the borrowers of the securities to maintain collateral with the Fund consisting of either cash or liquid, unencumbered assets having a value at least equal to the value of the securities loaned. When the collateral falls below specified amounts, the lending agent will use its best effort to obtain additional collateral on the next business day to meet required amounts under the security lending agreement. The Fund may invest the cash collateral into a joint trading account in an affiliated money market fund pursuant to Exemptive Orders issued by the SEC. The Fund receives compensation for lending its securities either in the form of fees or by earning interest on invested cash collateral net of borrower rebates and fees paid to a lending agent. Either the Fund or the borrower may terminate the loan. There may be risks of delay and costs in recovery of securities or even loss of rights in the collateral should the borrower of the securities fail financially. If the Fund is not able to recover securities lent, the Fund may sell the collateral and purchase a replacement investment in the market, incurring the risk that the value of the replacement security is greater than the value of the collateral. The Fund is also subject to all investment risks associated with the reinvestment of any cash collateral received, including, but not limited to, interest rate, credit and liquidity risk associated with such investments.
As of December 31, 2014, the Fund had securities on loan. The value of the related collateral exceeded the value of the securities loaned at period end.
Loan Participations and Assignments. Loan Participations and Assignments are portions of loans originated by banks and sold in pieces to investors. These floating-rate loans ("Loans") in which the Fund invests are arranged between the borrower and one or more financial institutions ("Lenders"). These Loans may take the form of Senior Loans, which are corporate obligations often issued in connection with recapitalizations, acquisitions, leveraged buy outs and refinancing. The Fund invests in such Loans in the form of participations in Loans ("Participations") or assignments of all or a portion of Loans from third parties ("Assignments"). Participations typically result in the Fund having a contractual relationship with only the Lender, not with the borrower. The Fund has the right to receive payments of principal, interest and any fees to which it is entitled from the Lender selling the Participation and only upon receipt by the Lender of the payments from the borrower. In connection with purchasing Participations, the Fund generally has no right to enforce compliance by the borrower with the terms of the loan agreement relating to the Loan, or any rights of set off against the borrower, and the Fund will not benefit directly from any collateral supporting the Loan in which it has purchased the Participation. As a result, the Fund assumes the credit risk of both the borrower and the Lender that is selling the Participation. Assignments typically result in the Fund having a direct contractual relationship with the borrower, and the Fund may enforce compliance by the borrower with the terms of the loan agreement. Loans held by the Fund are generally in the form of Assignments, but the Fund may also invest in Participations. All Loans involve interest rate risk, liquidity risk and credit risk, including the potential default or insolvency of the borrower.
When-Issued/Delayed Delivery Securities. The Fund may purchase or sell securities with delivery or payment to occur at a later date beyond the normal settlement period. At the time the Fund enters into a commitment to purchase or sell a security, the transaction is recorded and the value of the transaction is reflected in the net asset value. The price of such security and the date when the security will be delivered and paid for are fixed at the time the transaction is negotiated. The value of the security may vary with market fluctuations. At the time the Fund enters into this type of transaction, it is required to segregate cash or other liquid assets at least equal to the amount of the commitment. Additionally, the Fund may be required to post securities and/or cash collateral in accordance with the terms of the commitment.
Certain risks may arise upon entering into when-issued or delayed delivery transactions from the potential inability of counterparties to meet the terms of their contracts or if the issuer does not issue the securities due to political, economic, or other factors. Additionally, losses may arise due to changes in the value of the underlying securities.
Taxes. The Fund's policy is to comply with the requirements of the Internal Revenue Code, as amended, which are applicable to regulated investment companies and to distribute all of its taxable income to its shareholders.
Additionally, the Fund may be subject to taxes imposed by the governments of countries in which it invests and are generally based on income and/or capital gains earned or repatriated. Estimated tax liabilities on certain foreign securities are recorded on an accrual basis and are reflected as components of interest income or net change in unrealized gain/loss on investments. Tax liabilities realized as a result of security sales are reflected as a component of net realized gain/loss on investments.
At December 31, 2014, the Fund had net tax basis capital loss carryforwards of approximately $1,129,000, which may be applied against realized net taxable capital gains indefinitely, including short-term losses ($829,000) and long-term losses ($300,000).
The Fund has reviewed the tax positions for the open tax years as of December 31, 2014 and has determined that no provision for income tax and/or uncertain tax provisions is required in the Fund's financial statements. The Fund's federal tax returns for the prior three fiscal years remain open subject to examination by the Internal Revenue Service.
Distribution of Income and Gains. Distributions from net investment income of the Fund, if any, are declared and distributed to shareholders annually. Net realized gains from investment transactions, in excess of available capital loss carryforwards, would be taxable to the Fund if not distributed and, therefore, will be distributed to shareholders at least annually. The Fund may also make additional distributions for tax purposes if necessary.
The timing and characterization of certain income and capital gain distributions are determined annually in accordance with federal tax regulations which may differ from accounting principles generally accepted in the United States of America. These differences primarily relate to investments in foreign denominated investments, forward currency contracts, futures contracts, swap contracts and certain securities sold at a loss. As a result, net investment income (loss) and net realized gain (loss) on investment transactions for a reporting period may differ significantly from distributions during such period. Accordingly, the Fund may periodically make reclassifications among certain of its capital accounts without impacting the net asset value of the Fund.
At December 31, 2014, the Fund's components of distributable earnings on a tax basis were as follows:
| Undistributed ordinary income* | | $ | 2,057,423 | |
| Capital loss carryforwards | | $ | (1,129,000 | ) |
| Unrealized appreciation (depreciation) on investments | | $ | (538,005 | ) |
In addition, the tax character of distributions paid by the Fund is summarized as follows:
| | | Years Ended December 31, | |
| | | 2014 | | | 2013 | |
| Distributions from ordinary income* | | $ | 2,905,554 | | | $ | 5,146,797 | |
| Distributions from long-term capital gains | | $ | — | | | $ | 669,744 | |
* For tax purposes, short-term capital gain distributions are considered ordinary income distributions.
Expenses. Expenses of the Trust arising in connection with a specific fund are allocated to that fund. Other Trust expenses which cannot be directly attributed to a fund are apportioned among the funds in the Trust based upon the relative net assets or other appropriate measures.
Contingencies. In the normal course of business, the Fund may enter into contracts with service providers that contain general indemnification clauses. The Fund's maximum exposure under these arrangements is unknown, as this would involve future claims that may be made against the Fund that have not yet been made. However, based on experience, the Fund expects the risk of loss to be remote.
Other. Investment transactions are accounted for on a trade date plus one basis for daily net asset value calculations. However, for financial reporting purposes, investment transactions are reported on trade date. Interest income is recorded on the accrual basis. Dividend income is recorded on the ex-dividend date net of foreign withholding taxes. Realized gains and losses from investment transactions are recorded on an identified cost basis. Proceeds from litigation payments, if any, are included in net realized gain (loss) from investments. All discounts and premiums are accreted/amortized for both tax and financial reporting purposes for the Fund, with the exception of securities in default of principal.
B. Derivative Instruments
Swaps. A swap is a contract between two parties to exchange future cash flows at periodic intervals based on the notional amount of the swap. A bilateral swap is a transaction between the fund and a counterparty where cash flows are exchanged between the two parties. A centrally cleared swap is a transaction executed between the fund and a counterparty, then cleared by a clearing member through a central clearinghouse. The central clearinghouse serves as the counterparty, with whom the fund exchanges cash flows.
The value of a swap is adjusted daily, and the change in value, if any, is recorded as unrealized appreciation or depreciation in the Statement of Assets and Liabilities. Gains or losses are realized when the swap expires or is closed. Certain risks may arise when entering into swap transactions including counterparty default; liquidity; or unfavorable changes in interest rates or the value of the underlying reference security, commodity or index. In connection with bilateral swaps, securities and/or cash may be identified as collateral in accordance with the terms of the swap agreement to provide assets of value and recourse in the event of default. The maximum counterparty credit risk is the net present value of the cash flows to be received from or paid to the counterparty over the term of the swap, to the extent that this amount is beneficial to the Fund, in addition to any related collateral posted to the counterparty by the Fund. This risk may be partially reduced by a master netting arrangement between the Fund and the counterparty. Upon entering into a centrally cleared swap, the Fund is required to deposit with a financial intermediary cash or securities ("initial margin") in an amount equal to a certain percentage of the notional amount of the swap. Subsequent payments ("variation margin") are made or received by the Fund dependent upon the daily fluctuations in the value of the swap. In a cleared swap transaction, counterparty risk is minimized as the central clearinghouse acts as the counterparty.
An upfront payment, if any, made by the Fund is recorded as an asset in the Statement of Assets and Liabilities. An upfront payment, if any, received by the Fund is recorded as a liability in the Statement of Assets and Liabilities. Payments received or made at the end of the measurement period are recorded as realized gain or loss in the Statement of Operations.
Interest Rate Swaps. Interest rate swaps are agreements in which the Fund agrees to pay to the counterparty a fixed rate payment in exchange for the counterparty agreeing to pay to the Fund a variable rate payment, or the Fund agrees to receive from the counterparty a fixed rate payment in exchange for the counterparty agreeing to receive from the Fund a variable rate payment. The payment obligations are based on the notional amount of the swap. For the year ended December 31, 2014, the Fund entered into interest rate swap agreements to gain exposure to different parts of the yield curve while managing overall duration.
A summary of the open interest rate swap contracts as of December 31, 2014 is included in a table following the Fund's Investment Portfolio. For the year ended December 31, 2014, the investment in interest rate swap contracts had a total notional amount generally indicative of a range from $5,000,000 to $13,300,000.
Credit Default Swaps. Credit default swaps are agreements between a buyer and a seller of protection against predefined credit events for the reference entity. The Fund may enter into credit default swaps to gain exposure to an underlying issuer's credit quality characteristics without directly investing in that issuer or to hedge against the risk of a credit event on debt securities. As a seller of a credit default swap, the Fund is required to pay the par (or other agreed-upon) value of the referenced entity to the counterparty with the occurrence of a credit event by a third party, such as a U.S. or foreign corporate issuer, on the reference entity, which would likely result in a loss to the Fund. In return, the Fund receives from the counterparty a periodic stream of payments over the term of the swap provided that no credit event has occurred. If no credit event occurs, the Fund keeps the stream of payments with no payment obligations. The Fund may also buy credit default swaps, in which case the Fund functions as the counterparty referenced above. This involves the risk that the swap may expire worthless. It also involves counterparty risk that the seller may fail to satisfy its payment obligations to the Fund with the occurrence of a credit event. When the Fund sells a credit default swap, it will cover its commitment. This may be achieved by, among other methods, maintaining cash or liquid assets equal to the aggregate notional value of the reference entities for all outstanding credit default swaps sold by the Fund. For the year ended December 31, 2014, the Fund entered into credit default swap agreements to gain exposure to the underlying issuer's credit quality characteristics.
Under the terms of a credit default swap, the Fund receives or makes periodic payments based on a specified interest rate on a fixed notional amount. These payments are recorded as a realized gain or loss in the Statement of Operations. Payments received or made as a result of a credit event or termination of the swap are recognized, net of a proportional amount of the upfront payment, as realized gains or losses in the Statement of Operations.
A summary of the open credit default swap contracts as of December 31, 2014 is included in a table following the Fund's Investment Portfolio. For the year ended December 31, 2014, the investment in credit default swap contracts sold had a total notional value generally indicative of a range from $445,000 to $610,000.
Options. An option contract is a contract in which the writer (seller) of the option grants the buyer of the option, upon payment of a premium, the right to purchase from (call option), or sell to (put option), the writer a designated instrument at a specified price within a specified period of time. The Fund may write or purchase interest rate swaption agreements which are options to enter into a pre-defined swap agreement. The interest rate swaption agreement will specify whether the buyer of the swaption will be a fixed-rate receiver or a fixed-rate payer upon exercise. Certain options, including options on indices, will require cash settlement by the Fund if the option is exercised. For the year ended December 31, 2014, the Fund entered into options on interest rate swaps in order to hedge against potential adverse interest rate movements of portfolio assets.
If the Fund writes a covered call option, the Fund foregoes, in exchange for the premium, the opportunity to profit during the option period from an increase in the market value of the underlying security above the exercise price. If the Fund writes a put option it accepts the risk of a decline in the value of the underlying security below the exercise price. Over-the-counter options have the risk of the potential inability of counterparties to meet the terms of their contracts. The Fund's maximum exposure to purchased options is limited to the premium initially paid. In addition, certain risks may arise upon entering into option contracts including the risk that an illiquid secondary market will limit the Fund's ability to close out an option contract prior to the expiration date and that a change in the value of the option contract may not correlate exactly with changes in the value of the securities.
A summary of the open purchased option contracts as of December 31, 2014 is included in the Fund's Investment Portfolio. A summary of open written option contracts is included in a table following the Fund's Investment Portfolio. For the year ended December 31, 2014, the investment in written option contracts had a total value generally indicative of a range from approximately $132,000 to $238,000, and purchased option contracts had a total value generally indicative of a range from approximately $94,000 to $276,000.
Futures Contracts. A futures contract is an agreement between a buyer or seller and an established futures exchange or its clearinghouse in which the buyer or seller agrees to take or make a delivery of a specific amount of a financial instrument at a specified price on a specific date (settlement date). For the year ended December 31, 2014, the Fund entered into interest rate futures to gain exposure to different parts of the yield curve while managing overall duration and for non-hedging purposes to seek to enhance potential gains.
Upon entering into a futures contract, the Fund is required to deposit with a financial intermediary cash or securities ("initial margin") in an amount equal to a certain percentage of the face value indicated in the futures contract. Subsequent payments ("variation margin") are made or received by the Fund dependent upon the daily fluctuations in the value and are recorded for financial reporting purposes as unrealized gains or losses by the Fund. Gains or losses are realized when the contract expires or is closed. Since all futures contracts are exchange-traded, counterparty risk is minimized as the exchange's clearinghouse acts as the counterparty, and guarantees the futures against default.
Certain risks may arise upon entering into futures contracts, including the risk that an illiquid market will limit the Fund's ability to close out a futures contract prior to the settlement date and the risk that the futures contract is not well correlated with the security, index or currency to which it relates. Risk of loss may exceed amounts disclosed in the Statement of Assets and Liabilities.
A summary of the open futures contracts as of December 31, 2014 is included in a table following the Fund's Investment Portfolio. For the year ended December 31, 2014, the investment in futures contracts purchased had a total notional value generally indicative of a range from approximately $357,000 to $12,897,000, and the investment in futures contracts sold had a total notional value generally indicative of a range from approximately $3,123,000 to $12,234,000.
Forward Foreign Currency Exchange Contracts. A forward foreign currency exchange contract ("forward currency contract") is a commitment to purchase or sell a foreign currency at the settlement date at a negotiated rate. For the year ended December 31, 2014, the Fund entered into forward currency contracts in order to hedge against anticipated currency market changes and for non-hedging purposes to seek to enhance potential gains.
Forward currency contracts are valued at the prevailing forward exchange rate of the underlying currencies and unrealized gain (loss) is recorded daily. On the settlement date of the forward currency contract, the Fund records a realized gain or loss equal to the difference between the value of the contract at the time it was opened and the value of the contract at the time it was closed. Certain risks may arise upon entering into forward currency contracts from the potential inability of counterparties to meet the terms of their contracts. The maximum counterparty credit risk to the Fund is measured by the unrealized gain on appreciated contracts. Additionally, when utilizing forward currency contracts to hedge, the Fund gives up the opportunity to profit from favorable exchange rate movements during the term of the contract.
A summary of the open forward currency contracts as of December 31, 2014, is included in a table following the Fund’s Investment Portfolio. For the year ended December 31, 2014, the investment in forward currency contracts short vs. U.S. dollars had a total contract value generally indicative of a range from approximately $6,281,000 to $22,228,000, and the investment in forward currency contracts long vs. U.S. dollars had a total contract value generally indicative of a range from approximately $2,864,000 to $20,021,000. The investment in forward currency contracts long vs. other foreign currencies sold had a total contract value generally indicative of a range from $0 to approximately to $9,640,000.
The following tables summarize the value of the Fund's derivative instruments held as of December 31, 2014 and the related location in the accompanying Statement of Assets and Liabilities, presented by primary underlying risk exposure:
| Asset Derivatives | | Purchased Options | | | Forward Contracts | | | Swap Contracts | | | Futures Contracts | | | Total | |
| Interest Rate Contracts (a) (b) | | $ | 93,945 | | | $ | — | | | $ | 6,534 | | | $ | 19,226 | | | $ | 119,705 | |
| Credit Contracts (b) | | | — | | | | — | | | | 21,879 | | | | — | | | | 21,879 | |
| Foreign Exchange Contracts (c) | | | — | | | | 228,290 | | | | — | | | | — | | | | 228,290 | |
| | | $ | 93,945 | | | $ | 228,290 | | | $ | 28,413 | | | $ | 19,226 | | | $ | 369,874 | |
Each of the above derivatives is located in the following Statement of Assets and Liabilities accounts: (a) Includes cumulative appreciation of futures and centrally cleared swap contracts as disclosed in the Investment Portfolio. Unsettled variation margin is disclosed separately within the Statement of Assets and Liabilities. (b) Investments in securities, at value (includes purchased options) and unrealized appreciation on bilateral swap contracts, respectively (c) Unrealized appreciation on forward foreign currency exchange contracts | |
| Liability Derivatives | | Written Options | | | Forward Contracts | | | Swap Contracts | | | Futures Contracts | | | Total | |
| Interest Rate Contracts (a) (b) | | $ | (131,698 | ) | | $ | — | | | $ | (43 | ) | | $ | (34,762 | ) | | $ | (166,503 | ) |
| Foreign Exchange Contracts (c) | | | — | | | | (243,096 | ) | | | — | | | | — | | | | (243,096 | ) |
| | | $ | (131,698 | ) | | $ | (243,096 | ) | | $ | (43 | ) | | $ | (34,762 | ) | | $ | (409,599 | ) |
Each of the above derivatives is located in the following Statement of Assets and Liabilities accounts: (a) Includes cumulative depreciation of futures and centrally cleared swap contracts as disclosed in the Investment Portfolio. Unsettled variation margin is disclosed separately within the Statement of Assets and Liabilities. (b) Options written, at value (c) Unrealized depreciation on forward foreign currency exchange contracts | |
Additionally, the amount of unrealized and realized gains and losses on derivative instruments recognized in Fund earnings during the year ended December 31, 2014 and the related location in the accompanying Statement of Operations is summarized in the following tables by primary underlying risk exposure:
| Realized Gain (Loss) | | Forward Contracts | | | Swap Contracts | | | Futures Contracts | | | Total | |
| Interest Rate Contracts (a) | | $ | — | | | $ | (165,659 | ) | | $ | (393,448 | ) | | $ | (559,107 | ) |
| Credit Contracts (a) | | | — | | | | 34,457 | | | | — | | | | 34,457 | |
| Foreign Exchange Contracts (b) | | | 435,858 | | | | — | | | | — | | | | 435,858 | |
| | | $ | 435,858 | | | $ | (131,202 | ) | | $ | (393,448 | ) | | $ | (88,792 | ) |
Each of the above derivatives is located in the following Statement of Operations accounts: (a) Net realized gain (loss) from swap contracts and futures, respectively (b) Net realized gain (loss) from foreign currency (Statement of Operations includes both forward currency contracts and foreign currency transactions) | |
| Change in Net Unrealized Appreciation (Depreciation) | | Purchased Options | | | Written Options | | | Forward Contracts | | | Swap Contracts | | | Futures Contracts | | | Total | |
| Interest Rate Contracts (a) | | $ | (181,752 | ) | | $ | 106,002 | | | $ | — | | | $ | 2,987 | | | $ | (11,419 | ) | | $ | (84,182 | ) |
| Credit Contracts (a) | | | — | | | | — | | | | — | | | | (23,942 | ) | | | — | | | | (23,942 | ) |
| Foreign Exchange Contracts (b) | | | — | | | | — | | | | (256,909 | ) | | | — | | | | — | | | | (256,909 | ) |
| | | $ | (181,752 | ) | | $ | 106,002 | | | $ | (256,909 | ) | | $ | (20,955 | ) | | $ | (11,419 | ) | | $ | (365,033 | ) |
Each of the above derivatives is located in the following Statement of Operations accounts: (a) Change in net unrealized appreciation (depreciation) on investments (includes purchased options), written options, swap contracts and futures, respectively (b) Change in net unrealized appreciation (depreciation) on foreign currency (Statement of Operations includes both forward currency contracts and foreign currency transactions) | |
As of December 31, 2014, the Fund has transactions subject to enforceable master netting agreements. A reconciliation of the gross amounts on the Statement of Assets and Liabilities to the net amounts by counterparty, including any collateral exposure, is included in the following tables:
| Counterparty | | Gross Amounts of Assets Presented in the Statement of Assets and Liabilities | | | Financial Instruments and Derivatives Available for Offset | | | Collateral Received | | | Net Amount of Derivative Assets | |
| Australia & New Zealand Banking Group Ltd. | | $ | 82,338 | | | $ | (59,991 | ) | | $ | — | | | $ | 22,347 | |
| Bank of America | | | 453 | | | | — | | | | — | | | | 453 | |
| Barclays Bank PLC | | | 62,321 | | | | (34,613 | ) | | | — | | | | 27,708 | |
| BNP Paribas | | | 57,926 | | | | (57,926 | ) | | | — | | | | — | |
| Credit Suisse | | | 6,145 | | | | — | | | | — | | | | 6,145 | |
| Goldman Sachs & Co. | | | 8,593 | | | | — | | | | — | | | | 8,593 | |
| JPMorgan Chase Securities, Inc. | | | 76,420 | | | | (76,420 | ) | | | — | | | | — | |
| Nomura International PLC | | | 7,961 | | | | (3,263 | ) | | | — | | | | 4,698 | |
| Societe Generale | | | 41,957 | | | | (27,324 | ) | | | — | | | | 14,633 | |
| | | $ | 344,114 | | | $ | (259,537 | ) | | $ | — | | | $ | 84,577 | |
| Counterparty | | Gross Amounts of Liabilities Presented in the Statement of Assets and Liabilities | | | Financial Instruments and Derivatives Available for Offset | | | Collateral Pledged | | | Net Amount of Derivative Liabilities | |
| Australia & New Zealand Banking Group Ltd. | | $ | 59,991 | | | $ | (59,991 | ) | | $ | — | | | $ | — | |
| Barclays Bank PLC | | | 34,613 | | | | (34,613 | ) | | | — | | | | — | |
| BNP Paribas | | | 88,623 | | | | (57,926 | ) | | | — | | | | 30,697 | |
| Citigroup, Inc. | | | 4,883 | | | | — | | | | — | | | | 4,883 | |
| Commonwealth Bank of Australia | | | 193 | | | | — | | | | — | | | | 193 | |
| JPMorgan Chase Securities, Inc. | | | 127,989 | | | | (76,420 | ) | | | — | | | | 51,569 | |
| Morgan Stanley | | | 6,974 | | | | — | | | | — | | | | 6,974 | |
| Nomura International PLC | | | 3,263 | | | | (3,263 | ) | | | — | | | | — | |
| Societe Generale | | | 27,324 | | | | (27,324 | ) | | | — | | | | — | |
| UBS AG | | | 20,941 | | | | — | | | | — | | | | 20,941 | |
| | | $ | 374,794 | | | $ | (259,537 | ) | | $ | — | | | $ | 115,257 | |
C. Purchases and Sales of Securities
During the year ended December 31, 2014, purchases and sales of investment transactions (excluding short-term investments and U.S. Treasury obligations) aggregated $91,436,325 and $104,026,011, respectively. Purchases and sales of U.S. Treasury obligations aggregated $6,062,706 and $8,021,578, respectively.
For the year ended December 31, 2014, transactions for written options on interest rate swap contracts were as follows:
| | | Contract Amount | | | Premiums | |
| Outstanding, beginning of period | | | 4,100,000 | | | $ | 248,407 | |
| Outstanding, end of period | | | 4,100,000 | | | $ | 248,407 | |
D. Related Parties
Management Agreement. Under the Investment Management Agreement with Deutsche Investment Management Americas Inc. ("DIMA" or the "Advisor"), an indirect, wholly owned subsidiary of Deutsche Bank AG, the Advisor directs the investments of the Fund in accordance with its investment objectives, policies and restrictions. The Advisor determines the securities, instruments and other contracts relating to investments to be purchased, sold or entered into by the Fund.
Pursuant to the Investment Management Agreement with the Advisor, the Fund pays a monthly management fee based on the Fund's average daily net assets, computed and accrued daily and payable monthly, at the following annual rates:
| First $250 million | | | .550 | % |
| Next $750 million | | | .520 | % |
| Next $1.5 billion | | | .500 | % |
| Next $2.5 billion | | | .480 | % |
| Next $2.5 billion | | | .450 | % |
| Next $2.5 billion | | | .430 | % |
| Next $2.5 billion | | | .410 | % |
| Over $12.5 billion | | | .390 | % |
Accordingly, for the year ended December 31, 2014, the fee pursuant to the Investment Management Agreement was equivalent to an annual rate (exclusive of any applicable waivers/reimbursements) of 0.55% of the Fund's average daily net assets.
For the period from January 1, 2014 through September 30, 2014, the Advisor had contractually agreed to waive its fee and/or reimburse certain operating expenses to the extent necessary to maintain the total annual operating expenses (excluding certain expenses such as extraordinary expenses, taxes, brokerage and interest expense) at 0.76%.
Effective October 1, 2014 through September 30, 2015, the Advisor has contractually agreed to waive its fee and/or reimburse certain operating expenses to the extent necessary to maintain the total annual operating expenses (excluding certain expenses such as extraordinary expenses, taxes, brokerage and interest expense) at 0.70%.
For the year ended December 31, 2014, fees waived and/or expenses reimbursed amounted to $182,724.
Administration Fee. Pursuant to an Administrative Services Agreement, DIMA provides most administrative services to the Fund. For all services provided under the Administrative Services Agreement, the Fund pays DIMA an annual fee ("Administration Fee") of 0.10% of the Fund's average daily net assets, computed and accrued daily and payable monthly. For the year ended December 31, 2014, the Administration Fee was $58,363, of which $4,622 is unpaid.
Service Provider Fees. DeAWM Service Company ("DSC"), an affiliate of the Advisor, is the transfer agent, dividend-paying agent and shareholder service agent for the Fund. Pursuant to a sub-transfer agency agreement between DSC and DST Systems, Inc. ("DST"), DSC has delegated certain transfer agent, dividend-paying agent and shareholder service agent functions to DST. DSC compensates DST out of the shareholder servicing fee it receives from the Fund. For the year ended December 31, 2014, the amounts charged to the Fund by DSC aggregated $151, of which $25 is unpaid.
Typesetting and Filing Service Fees. Under an agreement with DIMA, DIMA is compensated for providing typesetting and certain regulatory filing services to the Fund. For the year ended December 31, 2014, the amount charged to the Fund by DIMA included in the Statement of Operations under "Reports to shareholders" aggregated $15,660, of which $7,359 is unpaid.
Trustees' Fees and Expenses. The Fund paid retainer fees to each Trustee not affiliated with the Advisor, plus specified amounts to the Board Chairperson and Vice Chairperson and to each committee Chairperson.
Affiliated Cash Management Vehicles. The Fund may invest uninvested cash balances in Central Cash Management Fund and Deutsche Variable NAV Money Fund, affiliated money market funds which are managed by the Advisor. Each affiliated money market fund seeks to provide a high level of current income consistent with liquidity and the preservation of capital. Each affiliated money market fund is managed in accordance with Rule 2a-7 under the Investment Company Act of 1940, which governs the quality, maturity, diversity and liquidity of instruments in which a money market fund may invest. Central Cash Management Fund seeks to maintain a stable net asset value, and Deutsche Variable NAV Money Fund maintains a floating net asset value. The Fund indirectly bears its proportionate share of the expenses of each affiliated money market fund in which it invests. Central Cash Management Fund does not pay the Advisor an investment management fee. To the extent that Deutsche Variable NAV Money Fund pays an investment management fee to the Advisor, the Advisor will waive an amount of the investment management fee payable to the Advisor by the Fund equal to the amount of the investment management fee payable on the Fund's assets invested in Deutsche Variable NAV Money Fund.
Security Lending Fees. Deutsche Bank AG serves as securities lending agent for the Fund. For the year ended December 31, 2014, the Fund incurred securities lending agent fees to Deutsche Bank AG in the amount of $251.
E. Investing in High-Yield Securities
The Fund's performance could be hurt if a security declines in credit quality or goes into default, or if an issuer does not make timely payments of interest or principal. Because the issuers of high-yield debt securities or junk bonds (debt securities rated below the fourth-highest category) may be in uncertain financial health, the risk of loss from default by the issuer is significantly greater. Prices and yields of high-yield securities will fluctuate over time and, during periods of economic uncertainty, volatility of high-yield securities may adversely affect a fund's net asset value. Because the Fund may invest in securities not paying current interest or in securities already in default, these risks may be more pronounced.
F. Investing in Emerging Markets
Investing in emerging markets may involve special risks and considerations not typically associated with investing in developed markets. These risks include revaluation of currencies, high rates of inflation or deflation, repatriation restrictions on income and capital, and future adverse political, social and economic developments. Moreover, securities issued in these markets may be less liquid, subject to government ownership controls or delayed settlements, and may have prices that are more volatile or less easily assessed than those of comparable securities of issuers in developed markets.
G. Ownership of the Fund
At December 31, 2014, two participating insurance companies were owners of record of 10% or more of the total outstanding Class A shares of the Fund, each owning 65% and 32%.
H. Line of Credit
The Fund and other affiliated funds (the "Participants") share in a $400 million revolving credit facility provided by a syndication of banks. The Fund may borrow for temporary or emergency purposes, including the meeting of redemption requests that otherwise might require the untimely disposition of securities. The Participants are charged an annual commitment fee which is allocated based on net assets, among each of the Participants. Interest is calculated at a rate per annum equal to the sum of the Federal Funds Rate plus 1.25 percent plus if LIBOR exceeds the Federal Funds Rate the amount of such excess. The Fund may borrow up to a maximum of 33 percent of its net assets under the agreement. The Fund had no outstanding loans at December 31, 2014.
Report of Independent Registered Public Accounting Firm
To the Board of Trustees of Deutsche Variable Series II and Shareholders of Deutsche Unconstrained Income VIP:
We have audited the accompanying statement of assets and liabilities, including the investment portfolio, of Deutsche Unconstrained Income VIP (formerly DWS Unconstrained Income VIP) (the "Fund") (one of the series constituting Deutsche Variable Series II (formerly DWS Variable Series II)), as of December 31, 2014, and the related statement of operations for the year then ended, the statements of changes in net assets for each of the two years in the period then ended, and the financial highlights for each of the periods indicated therein. These financial statements and financial highlights are the responsibility of the Fund's management. Our responsibility is to express an opinion on these financial statements and financial highlights based on our audits.
We conducted our audits in accordance with the standards of the Public Company Accounting Oversight Board (United States). Those standards require that we plan and perform the audit to obtain reasonable assurance about whether the financial statements and financial highlights are free of material misstatement. We were not engaged to perform an audit of the Fund's internal control over financial reporting. Our audits included consideration of internal control over financial reporting as a basis for designing audit procedures that are appropriate in the circumstances, but not for the purpose of expressing an opinion on the effectiveness of the Fund's internal control over financial reporting. Accordingly, we express no such opinion. An audit also includes examining, on a test basis, evidence supporting the amounts and disclosures in the financial statements and financial highlights, assessing the accounting principles used and significant estimates made by management, and evaluating the overall financial statement presentation. Our procedures included confirmation of securities owned as of December 31, 2014, by correspondence with the custodian and brokers, or by other appropriate auditing procedures where replies from brokers were not received. We believe that our audits provide a reasonable basis for our opinion.
In our opinion, the financial statements and financial highlights referred to above present fairly, in all material respects, the financial position of Deutsche Unconstrained Income VIP at December 31, 2014, the results of its operations for the year then ended, the changes in its net assets for each of the two years in the period then ended, and the financial highlights for each of the periods indicated therein, in conformity with U.S. generally accepted accounting principles.
| | | |
Boston, Massachusetts February 13, 2015 | | |
Information About Your Fund's Expenses (Unaudited)
As an investor of the Fund, you incur two types of costs: ongoing expenses and transaction costs. Ongoing expenses include management fees and other Fund expenses. Examples of transaction costs include contract charges, which are not shown in this section. The following tables are intended to help you understand your ongoing expenses (in dollars) of investing in the Fund and to help you compare these expenses with the ongoing expenses of investing in other mutual funds. In the most recent six-month period, the Fund limited these expenses; had it not done so, expenses would have been higher. The example in the table is based on an investment of $1,000 invested at the beginning of the six-month period and held for the entire period (July 1, 2014 to December 31, 2014).
The tables illustrate your Fund's expenses in two ways:
—Actual Fund Return. This helps you estimate the actual dollar amount of ongoing expenses (but not transaction costs) paid on a $1,000 investment in the Fund using the Fund's actual return during the period. To estimate the expenses you paid over the period, simply divide your account value by $1,000 (for example, an $8,600 account value divided by $1,000 = 8.6), then multiply the result by the number in the "Expenses Paid per $1,000" line under the share class you hold.
—Hypothetical 5% Fund Return. This helps you to compare your Fund's ongoing expenses (but not transaction costs) with those of other mutual funds using the Fund's actual expense ratio and a hypothetical rate of return of 5% per year before expenses. Examples using a 5% hypothetical Fund return may be found in the shareholder reports of other mutual funds. The hypothetical account values and expenses may not be used to estimate the actual ending account balance or expenses you paid for the period.
Please note that the expenses shown in these tables are meant to highlight your ongoing expenses only and do not reflect any transaction costs. The "Expenses Paid per $1,000" line of the tables is useful in comparing ongoing expenses only and will not help you determine the relative total expense of owning different funds. If these transaction costs had been included, your costs would have been higher.
Expenses and Value of a $1,000 Investment for the six months ended December 31, 2014 | |
| Actual Fund Return | | Class A | |
| Beginning Account Value 7/1/14 | | $ | 1,000.00 | |
| Ending Account Value 12/31/14 | | $ | 974.80 | |
| Expenses Paid per $1,000* | | $ | 3.83 | |
| Hypothetical 5% Fund Return | | Class A | |
| Beginning Account Value 7/1/14 | | $ | 1,000.00 | |
| Ending Account Value 12/31/14 | | $ | 1,021.32 | |
| Expenses Paid per $1,000* | | $ | 3.92 | |
* Expenses are equal to the Fund's annualized expense ratio, multiplied by the average account value over the period, multiplied by 184 (the number of days in the most recent six-month period), then divided by 365.
| Annualized Expense Ratio | Class A | |
| Deutsche Variable Series II — Deutsche Unconstrained Income VIP | .77% | |
For more information, please refer to the Fund's prospectus.
These tables do not reflect charges and fees ("contract charges") associated with the separate account that invests in the Fund or any variable life insurance policy or variable annuity contract for which the Fund is an investment option.
For an analysis of the fees associated with an investment in the fund or similar funds, please refer to the current and hypothetical expense calculators for Variable Insurance Products which can be found at deutschefunds.com/EN/resources/calculators.jsp.
Tax Information (Unaudited)
Please consult a tax advisor if you have questions about federal or state income tax laws, or on how to prepare your tax returns. If you have specific questions about your account, please contact your insurance provider.
The Trust's policies and procedures for voting proxies for portfolio securities and information about how the Trust voted proxies related to its portfolio securities during the 12-month period ended June 30 are available on our Web site — deutschefunds.com (click on "proxy voting" at the bottom of the page) — or on the SEC's Web site — sec.gov. To obtain a written copy of the Trust's policies and procedures without charge, upon request, call us toll free at (800) 728-3337.
Advisory Agreement Board Considerations and Fee Evaluation
The Board of Trustees approved the renewal of Deutsche Unconstrained Income VIP’s investment management agreement (the "Agreement") with Deutsche Investment Management Americas Inc. ("DIMA") in September 2014.
In terms of the process that the Board followed prior to approving the Agreement, shareholders should know that:
— In September 2014, all of the Fund’s Trustees were independent of DIMA and its affiliates.
— The Trustees met frequently during the past year to discuss fund matters and dedicated a substantial amount of time to contract review matters. Over the course of several months, the Board’s Contract Committee, in coordination with the Board’s Fixed Income and Asset Allocation Oversight Committee, reviewed comprehensive materials received from DIMA, independent third parties and independent counsel. These materials included an analysis of the Fund’s performance, fees and expenses, and profitability compiled by a fee consultant retained by the Fund’s Independent Trustees (the "Fee Consultant"). The Board also received extensive information throughout the year regarding performance of the Fund.
— The Independent Trustees regularly meet privately with counsel to discuss contract review and other matters. In addition, the Independent Trustees were advised by the Fee Consultant in the course of their review of the Fund’s contractual arrangements and considered a comprehensive report prepared by the Fee Consultant in connection with their deliberations.
— In connection with reviewing the Agreement, the Board also reviewed the terms of the Fund’s distribution agreement, administrative services agreement, transfer agency agreement and other material service agreements.
— Based on its evaluation of the information provided, the Contract Committee presented its findings and recommendations to the Board. The Board then reviewed the Contract Committee’s findings and recommendations.
In connection with the contract review process, the Contract Committee and the Board considered the factors discussed below, among others. The Board also considered that DIMA and its predecessors have managed the Fund since its inception, and the Board believes that a long-term relationship with a capable, conscientious advisor is in the best interests of the Fund. The Board considered, generally, that shareholders chose to invest or remain invested in the Fund knowing that DIMA managed the Fund, and that the Agreement was approved by the Fund’s shareholders. DIMA is part of Deutsche Bank AG ("DB"), a major global banking institution that is engaged in a wide range of financial services. The Board believes that there are advantages to being part of a global asset management business that offers a wide range of investing expertise and resources, including hundreds of portfolio managers and analysts with research capabilities in many countries throughout the world.
As part of the contract review process, the Board carefully considered the fees and expenses of each Deutsche fund overseen by the Board in light of the fund’s performance. In many cases, this led to the negotiation and implementation of expense caps. As part of these negotiations, the Board indicated that it would consider relaxing these caps in future years following sustained improvements in performance, among other considerations.
In 2012, DB combined its Asset Management (of which DIMA was a part) and Wealth Management divisions into a new Asset and Wealth Management ("AWM") division. DB has advised the Independent Trustees that the U.S. asset management business is a critical and integral part of DB, and that DB will continue to invest in AWM a significant portion of the savings it has realized by combining its Asset and Wealth Management divisions, including ongoing enhancements to AWM’s investment capabilities. DB also has confirmed its commitment to maintaining strong legal and compliance groups within the AWM division.
While shareholders may focus primarily on fund performance and fees, the Fund’s Board considers these and many other factors, including the quality and integrity of DIMA’s personnel and such other issues as back-office operations, fund valuations, and compliance policies and procedures.
Nature, Quality and Extent of Services. The Board considered the terms of the Agreement, including the scope of advisory services provided under the Agreement. The Board noted that, under the Agreement, DIMA provides portfolio management services to the Fund and that, pursuant to a separate administrative services agreement, DIMA provides administrative services to the Fund. The Board considered the experience and skills of senior management and investment personnel, the resources made available to such personnel, the ability of DIMA to attract and retain high-quality personnel, and the organizational depth and stability of DIMA. The Board reviewed the Fund’s performance over short-term and long-term periods and compared those returns to various agreed-upon performance measures, including market index(es) and a peer universe compiled by the Fee Consultant using information supplied by Morningstar Direct ("Morningstar"), an independent fund data service. The Board also noted that it has put into place a process of identifying "Focus Funds" (e.g., funds performing poorly relative to a peer universe), and receives more frequent reporting and information from DIMA regarding such funds, along with DIMA’s plans to address underperformance. The Board believes this process is an effective manner of identifying and addressing underperforming funds. Based on the information provided, the Board noted that for the one-, three- and five-year periods ended December 31, 2013, the Fund’s performance (Class A shares) was in the 4th quartile, 2nd quartile and 4th quartile, respectively, of the applicable Morningstar universe (the 1st quartile being the best performers and the 4th quartile being the worst performers). The Board also observed that the Fund has outperformed its benchmark in the one-, three- and five-year periods ended December 31, 2013. The Board noted the disappointing investment performance of the Fund in recent periods and continued to discuss with senior management of DIMA the factors contributing to such underperformance and actions being taken to improve performance. The Board recognized the efforts by DIMA in recent years to enhance its investment platform and improve long-term performance across the Deutsche fund complex.
Fees and Expenses. The Board considered the Fund’s investment management fee schedule, operating expenses and total expense ratios, and comparative information provided by Lipper Inc. ("Lipper") and the Fee Consultant regarding investment management fee rates paid to other investment advisors by similar funds (1st quartile being the most favorable and 4th quartile being the least favorable). With respect to management fees paid to other investment advisors by similar funds, the Board noted that the contractual fee rates paid by the Fund, which include a 0.10% fee paid to DIMA under the Fund’s administrative services agreement, were equal to the median of the applicable Lipper peer group (based on Lipper data provided as of December 31, 2013). The Board noted that the Fund’s Class A shares total (net) operating expenses were expected to be higher than the median (3rd quartile) of the applicable Lipper expense universe (based on Lipper data provided as of December 31, 2013, and analyzing Lipper expense universe Class A (net) expenses less any applicable 12b-1 fees) ("Lipper Universe Expenses"). The Board also considered how the Fund’s total (net) operating expenses compared to the total (net) operating expenses of a more customized peer group selected by Lipper (based on such factors as asset size). The Board noted that the expense limitation agreed to by DIMA helped to ensure that the Fund’s total (net) operating expenses would remain competitive. The Board considered the Fund’s management fee rate as compared to fees charged by DIMA to comparable funds and considered differences between the Fund and the comparable funds. The information requested by the Board as part of its review of fees and expenses also included information about institutional accounts and funds offered primarily to European investors ("Deutsche Europe funds") managed by DIMA and its affiliates. The Board noted that DIMA indicated that it does not manage any institutional accounts or Deutsche Europe funds comparable to the Fund.
On the basis of the information provided, the Board concluded that management fees were reasonable and appropriate in light of the nature, quality and extent of services provided by DIMA.
Profitability. The Board reviewed detailed information regarding revenues received by DIMA under the Agreement. The Board considered the estimated costs and pre-tax profits realized by DIMA from advising the Deutsche U.S. mutual funds ("Deutsche Funds"), as well as estimates of the pre-tax profits attributable to managing the Fund in particular. The Board also received information regarding the estimated enterprise-wide profitability of DIMA and its affiliates with respect to all fund services in totality and by fund. The Board and the Fee Consultant reviewed DIMA’s methodology in allocating its costs to the management of the Fund. Based on the information provided, the Board concluded that the pre-tax profits realized by DIMA in connection with the management of the Fund were not unreasonable.
Economies of Scale. The Board considered whether there are economies of scale with respect to the management of the Fund and whether the Fund benefits from any economies of scale. The Board noted that the Fund’s management fee schedule includes fee breakpoints. The Board concluded that the Fund’s fee schedule represents an appropriate sharing between the Fund and DIMA of such economies of scale as may exist in the management of the Fund at current asset levels.
Other Benefits to DIMA and Its Affiliates. The Board also considered the character and amount of other incidental benefits received by DIMA and its affiliates, including any fees received by DIMA for administrative services provided to the Fund and any fees received by an affiliate of DIMA for distribution services. The Board also considered benefits to DIMA related to brokerage and soft-dollar allocations, including allocating brokerage to pay for research generated by parties other than the executing broker dealers, which pertain primarily to funds investing in equity securities, along with the incidental public relations benefits to DIMA related to Deutsche Funds advertising and cross-selling opportunities among DIMA products and services. The Board concluded that management fees were reasonable in light of these fallout benefits.
Compliance. The Board considered the significant attention and resources dedicated by DIMA to documenting and enhancing its compliance processes in recent years. The Board noted in particular (i) the experience and seniority of DIMA’s and the Fund’s chief compliance officer; (ii) the large number of DIMA compliance personnel; and (iii) the substantial commitment of resources by DIMA and its affiliates to compliance matters.
Based on all of the information considered and the conclusions reached, the Board unanimously determined that the continuation of the Agreement is in the best interests of the Fund. In making this determination, the Board did not give particular weight to any single factor identified above. The Board considered these factors over the course of numerous meetings, certain of which were in executive session with only the Independent Trustees and counsel present. It is possible that individual Trustees may have weighed these factors differently in reaching their individual decisions to approve the continuation of the Agreement.
Board Members and Officers
The following table presents certain information regarding the Board Members and Officers of the fund. Each Board Member's year of birth is set forth in parentheses after his or her name. Unless otherwise noted, (i) each Board Member has engaged in the principal occupation(s) noted in the table for at least the most recent five years, although not necessarily in the same capacity; and (ii) the address of each Independent Board Member is c/o Kenneth C. Froewiss, Chairman, Deutsche Mutual Funds, P.O. Box 390601, Cambridge, MA 02139. Except as otherwise noted below, the term of office for each Board Member is until the election and qualification of a successor, or until such Board Member sooner dies, resigns, is removed or as otherwise provided in the governing documents of the fund. Because the fund does not hold an annual meeting of shareholders, each Board Member will hold office for an indeterminate period. The Board Members may also serve in similar capacities with other funds in the fund complex.
| Independent Board Members |
Name, Year of Birth, Position with the Fund and Length of Time Served1 | | Business Experience and Directorships During the Past Five Years | Number of Funds in Deutsche Fund Complex Overseen | Other Directorships Held by Board Member |
Kenneth C. Froewiss (1945) Chairperson since 2013, and Board Member since 2001 | | Adjunct Professor of Finance, NYU Stern School of Business (September 2009–present; Clinical Professor from 1997–September 2009); Member, Finance Committee, Association for Asian Studies (2002–present); Director, Mitsui Sumitomo Insurance Group (US) (2004–present); prior thereto, Managing Director, J.P. Morgan (investment banking firm) (until 1996) | 105 | — |
William McClayton (1944) Vice Chairperson since 2013, and Board Member since 2004 | | Private equity investor (since October 2009); previously, Managing Director, Diamond Management & Technology Consultants, Inc. (global consulting firm) (2001–2009); Directorship: Board of Managers, YMCA of Metropolitan Chicago; formerly: Senior Partner, Arthur Andersen LLP (accounting) (1966–2001); Trustee, Ravinia Festival | 105 | — |
John W. Ballantine (1946) Board Member since 1999 | | Retired; formerly, Executive Vice President and Chief Risk Management Officer, First Chicago NBD Corporation/The First National Bank of Chicago (1996–1998); Executive Vice President and Head of International Banking (1995–1996); former Directorships: Director and former Chairman of the Board, Healthways, Inc.2 (provider of disease and care management services) (2003–2014); Stockwell Capital Investments PLC (private equity); First Oak Brook Bancshares, Inc. and Oak Brook Bank; Prisma Energy International | 105 | Portland General Electric2 (utility company) (2003– present) |
Henry P. Becton, Jr. (1943) Board Member since 1990 | | Vice Chair and former President, WGBH Educational Foundation. Directorships: Public Radio International; Public Radio Exchange (PRX); North Bennett Street School (Boston); former Directorships: Belo Corporation2 (media company); The PBS Foundation; Association of Public Television Stations; Boston Museum of Science; American Public Television; Concord Academy; New England Aquarium; Mass. Corporation for Educational Telecommunications; Committee for Economic Development; Public Broadcasting Service; Connecticut College | 105 | Lead Director, Becton Dickinson and Company2 (medical technology company) |
Dawn-Marie Driscoll (1946) Board Member since 1987 | | Emeritus Executive Fellow, Center for Business Ethics, Bentley University; formerly: President, Driscoll Associates (consulting firm); Partner, Palmer & Dodge (law firm) (1988–1990); Vice President of Corporate Affairs and General Counsel, Filene's (retail) (1978–1988). Directorships: Director of ICI Mutual Insurance Company (since 2007); Advisory Board, Center for Business Ethics, Bentley University; Trustee and former Chairman of the Board, Southwest Florida Community Foundation (charitable organization); former Directorships: Sun Capital Advisers Trust (mutual funds) (2007–2012), Investment Company Institute (audit, executive, nominating committees) and Independent Directors Council (governance, executive committees) | 105 | — |
Keith R. Fox, CFA (1954) Board Member since 1996 | | Managing General Partner, Exeter Capital Partners (a series of private investment funds) (since 1986). Directorships: Progressive International Corporation (kitchen goods importer and distributor); The Kennel Shop (retailer); former Chairman, National Association of Small Business Investment Companies; former Directorships: BoxTop Media Inc. (advertising); Sun Capital Advisers Trust (mutual funds) (2011–2012) | 105 | — |
Paul K. Freeman (1950) Board Member since 1993 | | Consultant, World Bank/Inter-American Development Bank; Chair, Independent Directors Council; Investment Company Institute (executive and nominating committees); formerly, Chairman of Education Committee of Independent Directors Council; Project Leader, International Institute for Applied Systems Analysis (1998–2001); Chief Executive Officer, The Eric Group, Inc. (environmental insurance) (1986–1998); Directorships: Denver Zoo Foundation (December 2012–present); former Directorships: Prisma Energy International | 105 | — |
Richard J. Herring (1946) Board Member since 1990 | | Jacob Safra Professor of International Banking and Professor, Finance Department, The Wharton School, University of Pennsylvania (since July 1972); Co-Director, Wharton Financial Institutions Center; Co-Chair, U.S. Shadow Financial Regulatory Committee; Executive Director, Financial Economists Roundtable; formerly: Vice Dean and Director, Wharton Undergraduate Division (July 1995–June 2000); Director, Lauder Institute of International Management Studies (July 2000–June 2006) | 105 | Director, Aberdeen Singapore and Japan Funds (since 2007); Independent Director of Barclays Bank Delaware (since September 2010) |
Rebecca W. Rimel (1951) Board Member since 1995 | | President and Chief Executive Officer, The Pew Charitable Trusts (charitable organization) (1994 to present); formerly: Executive Vice President, The Glenmede Trust Company (investment trust and wealth management) (1983–2004); Board Member, Investor Education (charitable organization) (2004–2005); Trustee, Executive Committee, Philadelphia Chamber of Commerce (2001–2007); Director, Viasys Health Care2 (January 2007–June 2007); Trustee, Thomas Jefferson Foundation (charitable organization) (1994–2012) | 105 | Director, Becton Dickinson and Company2 (medical technology company) (2012– present); Director, BioTelemetry Inc.2 (health care) (2009– present) |
William N. Searcy, Jr. (1946) Board Member since 1993 | | Private investor since October 2003; formerly: Pension & Savings Trust Officer, Sprint Corporation2 (telecommunications) (November 1989–September 2003); Trustee, Sun Capital Advisers Trust (mutual funds) (1998–2012) | 105 | — |
Jean Gleason Stromberg (1943) Board Member since 1997 | | Retired. Formerly, Consultant (1997–2001); Director, Financial Markets U.S. Government Accountability Office (1996–1997); Partner, Norton Rose Fulbright, L.L.P. (law firm) (1978–1996). Directorships: The William and Flora Hewlett Foundation (charitable organization); former Directorships: Service Source, Inc. (nonprofit), Mutual Fund Directors Forum (2002–2004), American Bar Retirement Association (funding vehicle for retirement plans) (1987–1990 and 1994–1996) | 105 | — |
Robert H. Wadsworth* (1940) Board Member since 1999 | | President, Robert H. Wadsworth & Associates, Inc. (consulting firm) (1983 to present); Director, The Phoenix Boys Choir Association | 105 | — |
Officers4 |
Name, Year of Birth, Position with the Fund and Length of Time Served5 | | Business Experience and Directorships During the Past Five Years |
Brian E. Binder8 (1972) President and Chief Executive Officer, 2013–present | | Managing Director3 and Head of Fund Administration, Deutsche Asset & Wealth Management (2013–present); formerly: Head of Business Management and Consulting at Invesco, Ltd. (2010–2012); Chief Administrative Officer, Van Kampen Funds Inc. (2008–2010); and Chief Administrative Officer, Morgan Stanley Investment Management Americas Distribution (2003–2008) |
John Millette7 (1962) Vice President and Secretary, 1999–present | | Director,3 Deutsche Asset & Wealth Management |
Melinda Morrow6 (1970) Vice President, 2012–present | | Director,3 Deutsche Asset & Wealth Management |
Paul H. Schubert6 (1963) Chief Financial Officer, 2004–present Treasurer, 2005–present | | Managing Director,3 Deutsche Asset & Wealth Management (since July 2004); formerly: Executive Director, Head of Mutual Fund Services and Treasurer for UBS Family of Funds (1998–2004); Vice President and Director of Mutual Fund Finance at UBS Global Asset Management (1994–1998) |
Caroline Pearson7 (1962) Chief Legal Officer, 2010–present | | Managing Director,3 Deutsche Asset & Wealth Management; formerly: Assistant Secretary for DWS family of funds (1997–2010) |
Robert Kloby6 (1962) Chief Compliance Officer, 2006–present | | Managing Director,3 Deutsche Asset & Wealth Management |
Wayne Salit6 (1967) Anti-Money Laundering Compliance Officer, 2014–present | | Director,3 Deutsche Asset & Wealth Management; formerly: Managing Director, AML Compliance Officer at BNY Mellon (2011–2014); and Director, AML Compliance Officer at Deutsche Bank (2004–2011) |
Hepsen Uzcan7 (1974) Assistant Secretary, 2013–present | | Director,3 Deutsche Asset & Wealth Management |
Paul Antosca7 (1957) Assistant Treasurer, 2007–present | | Director,3 Deutsche Asset & Wealth Management |
Jack Clark7 (1967) Assistant Treasurer, 2007–present | | Director,3 Deutsche Asset & Wealth Management |
Diane Kenneally7 (1966) Assistant Treasurer, 2007–present | | Director,3 Deutsche Asset & Wealth Management |
1 The length of time served represents the year in which the Board Member joined the board of one or more Deutsche funds currently overseen by the Board.
2 A publicly held company with securities registered pursuant to Section 12 of the Securities Exchange Act of 1934.
3 Executive title, not a board directorship.
4 As a result of their respective positions held with the Advisor, these individuals are considered "interested persons" of the Advisor within the meaning of the 1940 Act. Interested persons receive no compensation from the fund.
5 The length of time served represents the year in which the officer was first elected in such capacity for one or more Deutsche funds.
6 Address: 60 Wall Street, New York, NY 10005.
7 Address: One Beacon Street, Boston, MA 02108.
8 Address: 222 South Riverside Plaza, Chicago, IL 60606.
* Robert H. Wadsworth retired from the Board effective December 31, 2014.
The fund's Statement of Additional Information ("SAI") includes additional information about the Board Members. The SAI is available, without charge, upon request. If you would like to request a copy of the SAI, you may do so by calling the following toll-free number: (800) 728-3337.
DeAWM Distributors, Inc.
222 South Riverside Plaza
Chicago, IL 60606
(800) 621-1148
VS2UI-2 (R-025836-4 2/15)
| | |
| ITEM 2. | CODE OF ETHICS |
| | |
| | As of the end of the period covered by this report, the registrant has adopted a code of ethics, as defined in Item 2 of Form N-CSR, that applies to its Principal Executive Officer and Principal Financial Officer. There have been no amendments to, or waivers from, a provision of the code of ethics during the period covered by this report that would require disclosure under Item 2. A copy of the code of ethics is filed as an exhibit to this Form N-CSR. |
| | |
| ITEM 3. | AUDIT COMMITTEE FINANCIAL EXPERT |
| | |
| | The fund’s audit committee is comprised solely of trustees who are "independent" (as such term has been defined by the Securities and Exchange Commission ("SEC") in regulations implementing Section 407 of the Sarbanes-Oxley Act (the "Regulations")). The fund’s Board of Trustees has determined that there are several "audit committee financial experts" (as such term has been defined by the Regulations) serving on the fund’s audit committee including Mr. Paul K. Freeman, the chair of the fund’s audit committee. An “audit committee financial expert” is not an “expert” for any purpose, including for purposes of Section 11 of the Securities Act of 1933 and the designation or identification of a person as an “audit committee financial expert” does not impose on such person any duties, obligations or liability that are greater than the duties, obligations and liability imposed on such person as a member of the audit committee and board of directors in the absence of such designation or identification. |
| | |
| ITEM 4. | PRINCIPAL ACCOUNTANT FEES AND SERVICES |
| | |
DEUTSCHE VARIABLE SERIES II
FORM N-CSR DISCLOSURE RE: AUDIT FEES
The following table shows the amount of fees that Ernst & Young LLP (“EY”), the Fund’s Independent Registered Public Accounting Firm, billed to the Fund during the Fund’s last two fiscal years. The Audit Committee approved in advance all audit services and non-audit services that EY provided to the Fund.
Services that the Fund’s Independent Registered Public Accounting Firm Billed to the Fund
| Fiscal Year Ended December 31, | | Audit Fees Billed to Fund | | | Audit-Related Fees Billed to Fund | | | Tax Fees Billed to Fund | | | All Other Fees Billed to Fund | |
| 2014 | | $ | 628,116 | | | $ | 0 | | | $ | 68,848 | | | $ | 0 | |
| 2013 | | $ | 628,116 | | | $ | 0 | | | $ | 68,848 | | | $ | 0 | |
The above “Tax Fees” were billed for professional services rendered for tax return preparation.
Services that the Fund’s Independent Registered Public Accounting Firm Billed to the Adviser and Affiliated Fund Service Providers
The following table shows the amount of fees billed by EY to Deutsche Investment Management Americas, Inc. (“DIMA” or the “Adviser”), and any entity controlling, controlled by or under common control with DIMA (“Control Affiliate”) that provides ongoing services to the Fund (“Affiliated Fund Service Provider”), for engagements directly related to the Fund’s operations and financial reporting, during the Fund’s last two fiscal years.
| Fiscal Year Ended December 31, | | Audit-Related Fees Billed to Adviser and Affiliated Fund Service Providers | | | Tax Fees Billed to Adviser and Affiliated Fund Service Providers | | | All Other Fees Billed to Adviser and Affiliated Fund Service Providers | |
| 2014 | | $ | 0 | | | $ | 274,022 | | | $ | 7,992,076 | |
| 2013 | | $ | 0 | | | $ | 379,516 | | | $ | 0 | |
The above “Tax Fees” were billed in connection with tax compliance services and agreed upon procedures. All other engagement fees were billed for services in connection with agreed upon procedures for DIMA and other related entities.
Non-Audit Services
The following table shows the amount of fees that EY billed during the Fund’s last two fiscal years for non-audit services. The Audit Committee pre-approved all non-audit services that EY provided to the Adviser and any Affiliated Fund Service Provider that related directly to the Fund’s operations and financial reporting. The Audit Committee requested and received information from EY about any non-audit services that EY rendered during the Fund’s last fiscal year to the Adviser and any Affiliated Fund Service Provider. The Committee considered this information in evaluating EY’s independence.
| Fiscal Year Ended December 31, | | Total Non-Audit Fees Billed to Fund (A) | | | Total Non-Audit Fees billed to Adviser and Affiliated Fund Service Providers (engagements related directly to the operations and financial reporting of the Fund) (B) | | | Total Non-Audit Fees billed to Adviser and Affiliated Fund Service Providers (all other engagements) (C) | | | Total of (A), (B) and (C) | |
| 2014 | | $ | 68,848 | | | $ | 8,266,098 | | | $ | 265,425 | | | $ | 8,600,371 | |
| 2013 | | $ | 68,848 | | | $ | 379,516 | | | $ | 715,427 | | | $ | 1,163,791 | |
All other engagement fees were billed for services in connection with agreed upon procedures and tax compliance for DIMA and other related entities.
Audit Committee Pre-Approval Policies and Procedures. Generally, each Fund’s Audit Committee must pre approve (i) all services to be performed for a Fund by a Fund’s Independent Registered Public Accounting Firm and (ii) all non-audit services to be performed by a Fund’s Independent Registered Public Accounting Firm for the DIMA Entities with respect to operations and financial reporting of the Fund, except that the Chairperson or Vice Chairperson of each Fund’s Audit Committee may grant the pre-approval for non-audit services described in items (i) and (ii) above for non-prohibited services for engagements of less than $100,000. All such delegated pre approvals shall be presented to each Fund’s Audit Committee no later than the next Audit Committee meeting.
There were no amounts that were approved by the Audit Committee pursuant to the de minimis exception under Rule 2-01 of Regulation S-X.
According to the registrant’s principal Independent Registered Public Accounting Firm, substantially all of the principal Independent Registered Public Accounting Firm's hours spent on auditing the registrant's financial statements were attributed to work performed by full-time permanent employees of the principal Independent Registered Public Accounting Firm.
***
In connection with the audit of the 2013 and 2014 financial statements, the Fund entered into an engagement letter with EY. The terms of the engagement letter required by EY, and agreed to by the Audit Committee, include provisions in which the parties consent to the sole jurisdiction of federal courts in New York, Boston or the Northern District of Illinois, as well as a waiver of right to a trial by jury and an exclusion of punitive damages.
***
| | |
| ITEM 5. | AUDIT COMMITTEE OF LISTED REGISTRANTS |
| | |
| | Not applicable |
| | |
| ITEM 6. | SCHEDULE OF INVESTMENTS |
| | |
| | Not applicable |
| | |
| ITEM 7. | DISCLOSURE OF PROXY VOTING POLICIES AND PROCEDURES FOR CLOSED-END MANAGEMENT INVESTMENT COMPANIES |
| | |
| | Not applicable |
| | |
| ITEM 8. | PORTFOLIO MANAGERS OF CLOSED-END MANAGEMENT INVESTMENT COMPANIES |
| | |
| | Not applicable |
| | |
| ITEM 9. | PURCHASES OF EQUITY SECURITIES BY CLOSED-END MANAGEMENT INVESTMENT COMPANY AND AFFILIATED PURCHASERS |
| | |
| | Not applicable |
| | |
| ITEM 10. | SUBMISSION OF MATTERS TO A VOTE OF SECURITY HOLDERS |
| | |
| | There were no material changes to the procedures by which shareholders may recommend nominees to the Fund’s Board. The primary function of the Nominating and Governance Committee is to identify and recommend individuals for membership on the Board and oversee the administration of the Board Governance Guidelines. Shareholders may recommend candidates for Board positions by forwarding their correspondence by U.S. mail or courier service to Kenneth C. Froewiss, Independent Chairman, Deutsche Mutual Funds, P.O. Box 390601, Cambridge, MA 02139. |
| | |
| ITEM 11. | CONTROLS AND PROCEDURES |
| | |
| | (a) | The Chief Executive and Financial Officers concluded that the Registrant’s Disclosure Controls and Procedures are effective based on the evaluation of the Disclosure Controls and Procedures as of a date within 90 days of the filing date of this report. |
| | |
| | (b) | There have been no changes in the registrant’s internal control over financial reporting that occurred during the second fiscal quarter of the period covered by this report that has materially affected, or is reasonably likely to materially affect, the registrant’s internal controls over financial reporting. |
| | |
| ITEM 12. | EXHIBITS |
| | |
| | (a)(1) | Code of Ethics pursuant to Item 2 of Form N-CSR is filed and attached hereto as EX-99.CODE ETH. |
| | |
| | (a)(2) | Certification pursuant to Rule 30a-2(a) under the Investment Company Act of 1940 (17 CFR 270.30a-2(a)) is filed and attached hereto as Exhibit 99.CERT. |
| | |
| | (b) | Certification pursuant to Rule 30a-2(b) under the Investment Company Act of 1940 (17 CFR 270.30a-2(b)) is furnished and attached hereto as Exhibit 99.906CERT. |
SIGNATURES
Pursuant to the requirements of the Securities Exchange Act of 1934 and the Investment Company Act of 1940, the registrant has duly caused this report to be signed on its behalf by the undersigned, thereunto duly authorized.
| Registrant: | Deutsche Variable Series II |
| | |
| | |
| By: | /s/Brian E. Binder Brian E. Binder President |
| | |
| Date: | February 20, 2015 |
Pursuant to the requirements of the Securities Exchange Act of 1934 and the Investment Company Act of 1940, this report has been signed below by the following persons on behalf of the registrant and in the capacities and on the dates indicated.
| By: | /s/Brian E. Binder Brian E. Binder President |
| | |
| Date: | February 20, 2015 |
| | |
| | |
| | |
| By: | /s/Paul Schubert Paul Schubert Chief Financial Officer and Treasurer |
| | |
| Date: | February 20, 2015 |