UNITED STATES
SECURITIES AND EXCHANGE COMMISSION
WASHINGTON, D. C. 20549
FORM N-CSR
Investment Company Act file number: 811-05002
Deutsche Variable Series II
(Exact Name of Registrant as Specified in Charter)
345 Park Avenue
New York, NY 10154-0004
(Address of Principal Executive Offices) (Zip Code)
Registrant’s Telephone Number, including Area Code: (212) 250-3220
Paul Schubert
345 Park Avenue
New York, NY 10154-0004
(Name and Address of Agent for Service)
| Date of fiscal year end: | 12/31 |
| | |
| Date of reporting period: | 12/31/2017 |
| ITEM 1. | REPORT TO STOCKHOLDERS |

December 31, 2017
Annual Report
Deutsche Variable Series II
Deutsche Alternative Asset Allocation VIP

Contents
This report must be preceded or accompanied by a prospectus. To obtain an additional prospectus or summary prospectus, if available, call (800) 728-3337 or your financial representative. We advise you to consider the Fund’s objectives, risks, charges and expenses carefully before investing. The summary prospectus and prospectus contain this and other important information about the Fund. Please read the prospectus carefully before you invest.
Although allocation among different asset categories generally limits risk, portfolio management may favor an asset category that underperforms other assets or markets as a whole. The Fund expects to invest in underlying funds that emphasize alternatives or non-traditional asset categories or investment strategies, and as a result, it is subject to the risk factors of those underlying funds. Some of those risks include: stock market risk; the political, general economic, liquidity and currency risks of foreign investments, which may be particularly significant for emerging markets; credit and interest rate risk; floating rate loan risk; volatility in commodity prices, infrastructure and high-yield debt securities; market direction risk (market advances when short, market declines when long); and short sales risk. Because Exchange Traded Funds (ETFs) trade on a securities exchange, their shares may trade at a premium or discount to their net asset value. ETFs also incur fees and expenses so they may not fully match the performance of the indexes they are designed to track. Because Exchange Traded Notes (ETNs) are senior, unsecured, unsubordinated debt securities of an issuer (typically a bank or bank holding company), ETNs are subject to the credit risk of the issuer and may lose value due to a downgrade in the issuer’s credit rating. The returns of an ETN are linked to the performance of an underlying instrument (typically an index), minus applicable fees. ETNs typically do not make periodic interest payments and principal typically is not protected. The value of an ETN may fluctuate based on factors such as time to maturity, level of supply and demand for the ETN, volatility and lack of liquidity in the underlying assets, changes in the applicable interest rates, and economic, legal, political or geographic events that affect the underlying assets. The fund bears its proportionate share of any fees and expenses borne by the ETN. Because ETNs trade on a securities exchange, their shares may trade at a premium or discount to their net asset value. The Fund may use derivatives, including as part of its currency and interest-rate strategies. Investing in derivatives entails special risks relating to liquidity, leverage and credit that may reduce returns and/or increase volatility. The success of the Fund’s currency and interest-rate strategies are dependent, in part, on the effectiveness and implementation of portfolio management’s proprietary models. As part of these strategies, the Fund’s exposure to foreign currencies could cause lower returns or even losses because foreign currency rates may fluctuate significantly over short periods of time for a number of reasons. The risk of loss is heightened during periods of rapid rises in interest rates. In addition, the notional amount of the Fund’s aggregate currency and interest-rate exposure resulting from these strategies may significantly exceed the net assets of the Fund. Please read prospectus for additional risks and specific details regarding the Fund’s risk profile.
Deutsche Asset Management represents the asset management activities conducted by Deutsche Bank AG or any of its subsidiaries.
Deutsche AM Distributors, Inc., 222 South Riverside Plaza, Chicago, IL 60606, (800) 621-1148
NOT FDIC/NCUA INSURED NO BANK GUARANTEE MAY LOSE VALUE NOT A DEPOSIT
NOT INSURED BY ANY FEDERAL GOVERNMENT AGENCY
| | | | | | |
| | 2 | | | | | | Deutsche Variable Series II — Deutsche Alternative Asset Allocation VIP |
| | |
| Performance Summary | | December 31, 2017 (Unaudited) |
Fund performance shown is historical, assumes reinvestment of all dividend and capital gain distributions and does not guarantee future results. Investment return and principal value fluctuate with changing market conditions so that, when redeemed, shares may be worth more or less than their original cost. Current performance may be lower or higher than the performance data quoted. Please contact your participating insurance company for the Fund’s most recent month-end performance. Performance doesn’t reflect charges and fees (“contract charges”) associated with the separate account that invests in the Fund or any variable life insurance policy or variable annuity contract for which the Fund is an investment option. These charges and fees will reduce returns. While all share classes have the same underlying portfolio, their performance will differ.
The gross expense ratios of the Fund, as stated in the fee table of the prospectus dated May 1, 2017 are 1.64% and 1.93% for Class A and Class B shares, respectively, and may differ from the expense ratios disclosed in the Financial Highlights tables in this report. These expense ratios include net expenses of the underlying funds in which the Fund invests.
Generally accepted accounting principles require adjustments to be made to the net assets of the Fund at period end for financial reporting purposes only, and as such, the total return based on the unadjusted net asset value per share may differ from the total return reported in the financial highlights.
Growth of an Assumed $10,000 Investment in Deutsche Alternative Asset Allocation VIP from 2/2/09 to 12/31/17
| | |
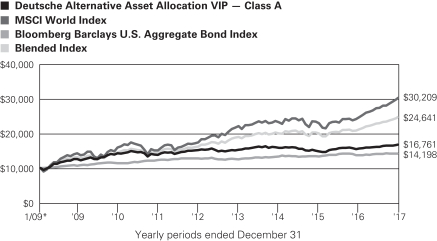 | | The Morgan Stanley Capital International (MSCI) World Index captures large and mid cap representation across 23 Developed Market countries. The Bloomberg Barclays U.S. Aggregate Bond Index is an unmanaged index representing domestic taxable investment-grade bonds, with index components for government and corporate securities, mortgage pass-through securities, and asset-backed securities with an average maturity of one year or more. The Blended Index is calculated using the performance of two unmanaged indices, representative of stocks (the MSCI World Index (70%)) and bonds (the Bloomberg Barclays U.S. Aggregate Bond Index (30%)). These results are summed to produce the aggregate benchmark. Index returns do not reflect any fees or expenses and it is not possible to invest directly into an index. |
| | | | | | | | | | |
| Comparative Results | | | | | | | | | | |
| | | | | |
Deutsche Alternative Asset
Allocation VIP | | | | 1-Year | | 3-Year | | 5-Year | | Life of Fund* |
| Class A | | Growth of $10,000 | | $10,741 | | $10,598 | | $11,072 | | $16,761 |
| | | Average annual total return | | 7.41% | | 1.96% | | 2.06% | | 5.97% |
| MSCI World Index | | Growth of $10,000 | | $12,719 | | $12,538 | | $13,896 | | $30,209 |
| | | Average annual total return | | 27.19% | | 7.83% | | 6.80% | | 13.21% |
| Bloomberg Barclays U.S. Aggregate Bond Index | | Growth of $10,000 | | $10,354 | | $10,687 | | $11,095 | | $14,198 |
| | Average annual total return | | 3.54% | | 2.24% | | 2.10% | | 4.01% |
| Blended Index | | Growth of $10,000 | | $11,645 | | $12,335 | | $15,252 | | $24,641 |
| | | Average annual total return | | 16.45% | | 7.24% | | 8.81% | | 10.64% |
The growth of $10,000 is cumulative.
| * | The Fund commenced offering Class A shares on February 2, 2009. The performance shown for each index is for the time period of January 31, 2009 through December 31, 2017, which is based on the performance period of the life of the Fund. |
| | | | |
Deutsche Variable Series II — Deutsche Alternative Asset Allocation VIP | | | | | 3 |
| | | | | | | | | | |
| | | | | |
Deutsche Alternative Asset
Allocation VIP | | | | 1-Year | | 3-Year | | 5-Year | | Life of Class** |
| Class B | | Growth of $10,000 | | $10,701 | | $10,500 | | $10,921 | | $15,054 |
| | | Average annual total return | | 7.01% | | 1.64% | | 1.78% | | 4.86% |
| MSCI World Index | | Growth of $10,000 | | $12,719 | | $12,538 | | $13,896 | | $27,217 |
| | | Average annual total return | | 27.19% | | 7.83% | | 6.80% | | 12.31% |
| Bloomberg Barclays U.S. Aggregate Bond Index | | Growth of $10,000 | | $10,354 | | $10,687 | | $11,095 | | $13,871 |
| | Average annual total return | | 3.54% | | 2.24% | | 2.10% | | 3.87% |
| Blended Index | | Growth of $10,000 | | $11,645 | | $12,335 | | $15,252 | | $21,845 |
| | | Average annual total return | | 16.45% | | 7.24% | | 8.81% | | 9.53% |
The growth of $10,000 is cumulative.
| ** | The Fund commenced offering Class B shares on May 18, 2009. The performance shown for each index is for the time period of May 31, 2009 through December 31, 2017, which is based on the performance period of the life of Class B. |
| | | | | | |
| | 4 | | | | | | Deutsche Variable Series II — Deutsche Alternative Asset Allocation VIP |
| | |
| Management Summary | | December 31, 2017 (Unaudited) |
The Fund returned 7.41% (Class A shares, unadjusted for contract charges) during 2017, trailing the 16.45% gain of its blended benchmark. When assessing performance, it is important to keep in mind that the Fund’s objective is not to match the short-term returns of either stocks or bonds, but rather to provide investors with a way to augment longer-term portfolio diversification through investments in alternative assets. (Diversification cannot protect against loss.)
The Fund generated positive returns across multiple segments of the portfolio during the past year. Among the Fund’s various allocations, the SPDR Bloomberg Barclays Convertible Securities ETF made the largest contribution to performance. Convertible bonds benefited from the gains in global equities and the hearty demand for income-producing assets. The ETF has been a robust contributor since it was first added to the portfolio in September 2011, and we continue to see convertibles as a way to generate income with a lower degree of interest-rate risk than bonds.
Our allocation to infrastructure stocks, which we achieved through a position in Deutsche Global Infrastructure Fund and a more recently added holding in iShares Global Infrastructure ETF, was another notable contributor. The category produced healthy returns amid signs of strengthening global growth. We continue to view infrastructure stocks as an attractive way to achieve exposure to the global equity markets due to their historically steady revenues, above-average income and potential to benefit from the expanding need for infrastructure to serve the world’s growing population.
The Fund’s allocation to real estate investment trusts (REITs) also generated healthy gains. The category was boosted by the combination of investors’ continued preference for income, the improving health of the world property markets and expectations that the U.S. Federal Reserve will be able to maintain a gradual and well-communicated approach to raising interest rates.
The Fund’s allocation to commodities—which it achieved through Deutsche Enhanced Commodity Strategy Fund—posted a slight gain but was a drag on returns relative to the benchmark. While the asset class finished in positive territory thanks to a rally in oil and industrial metals in the second half of the year, it did not keep pace with the strong rally in equities. We continue to view commodities as an attractive source of longer-term diversification. (Diversification cannot protect against loss.)
On the fixed-income side, positions in emerging-markets bond funds made the largest contribution to performance. The category registered a healthy advance and comfortably outpaced investment-grade bonds thanks to the combination of stronger growth in the emerging markets and investors’ appetite for higher-yielding market segments. Allocations to floating-rate debt and inflation-linked bonds, while positive, delivered more muted returns on the year.
In determining the Fund’s allocations, our general approach was to emphasize risk- and credit-sensitive asset categories. At the same time, we sought to maintain a low degree of interest-rate risk in response to the backdrop of stronger economic growth and the potential for tighter monetary policy by the world’s central banks. In our view, these factors made the case for higher-yielding and economically sensitive market segments over those with more direct interest-rate exposure.
During the second half of the year, we took steps to augment diversification by adding to new categories such as preferred stocks and as diversifying existing allocations between active and passively managed portfolios. We also eliminated the Fund’s position in inflation-linked bonds and rotated the proceeds into areas where we saw greater potential upside.
More broadly speaking, we continued to seek well-diversified exposure to the alternative asset classes, with an emphasis on investments that we think can help the Fund achieve competitive results over a multi-year period. We believe this approach offers a continued source of diversification for those who are primarily invested in traditional asset classes.
Pankaj Bhatnagar, PhD, Managing Director
Darwei Kung, Managing Director
Portfolio Managers
| | | | |
Deutsche Variable Series II — Deutsche Alternative Asset Allocation VIP | | | | | 5 |
The views expressed reflect those of the portfolio management team only through the end of the period of the report as stated on the cover. The management team’s views are subject to change at any time based on market and other conditions and should not be construed as a recommendation. Past performance is no guarantee of future results. Current and future portfolio holdings are subject to risk.
Terms to Know
The Blended Index is calculated using the performance of two unmanaged indices, representative of stocks (the Morgan Stanley Capital International (MSCI) World Index (70%) and bonds (the Barclays U.S. Aggregate Bond Index (30%). These results are summed to produce the aggregate benchmark. Index returns do not reflect fees or expenses and it is not possible to invest directly into an index.
An exchanged-traded fund (ETF) is a security that tracks an index, a commodity or a basket of assets like an index fund, but trades like a stock on an exchange.
Inflation-protected securities are types of fixed-income investments that offer a nominal return plus the inflation rate.
Convertible bonds are bonds that are issued by corporations and that can be converted to shares of the issuing company’s stock at the bondholder’s discretion.
Preferred stocks are hybrid securities that offer some of the features of both stocks and bonds.
| | | | | | |
| | 6 | | | | | | Deutsche Variable Series II — Deutsche Alternative Asset Allocation VIP |
| | |
| Portfolio Summary | | (Unaudited) |
| | | | | | | | |
| Asset Allocation* (As a % of Investment Portfolio excluding Cash Equivalents) | | 12/31/17 | | | 12/31/16 | |
Real Asset | | | 49% | | | | 50% | |
Deutsche Enhanced Commodity Strategy Fund | | | 14% | | | | 17% | |
Deutsche Global Infrastructure Fund | | | 12% | | | | 11% | |
iShares Global Infrastructure ETF | | | 10% | | | | — | |
Deutsche Global Real Estate Securities Fund | | | 9% | | | | 0% | |
Deutsche Real Estate Securities Fund | | | 4% | | | | 6% | |
Deutsche Global Inflation Fund | | | — | | | | 16% | |
| | |
Alternative Fixed Income | | | 25% | | | | 38% | |
Deutsche Emerging Markets Fixed Income Fund | | | 9% | | | | 18% | |
Deutsche Floating Rate Fund | | | 8% | | | | 11% | |
VanEck Vectors JPMorgan EM Local Currency Bond ETF | | | 4% | | | | 7% | |
iShares JPMorgan USD Emerging Markets Bond ETF | | | 4% | | | | — | |
WisdomTree Emerging Markets Local Debt ETF | | | — | | | | 2% | |
| | |
Alternative Equity | | | 20% | | | | 12% | |
SPDR Bloomberg Barclays Convertible Securities ETF | | | 15% | | | | 12% | |
iShares U.S. Preferred Stock ETF | | | 5% | | | | — | |
| | |
Absolute Return | | | 6% | | | | — | |
VelocityShares Daily Inverse VIX Short Term ETN | | | 3% | | | | — | |
PowersShares DB U.S. Dollar Index Bullish Fund | | | 2% | | | | — | |
ProShares Short VIX Short-Term Futures ETF | | | 1% | | | | — | |
| | | | 100% | | | | 100% | |
| * | During the periods indicated, asset categories and investment strategies represented in the fund’s portfolio fell into the following categories: Real Assets, Alternative Fixed Income, Alternative Equity, and Absolute Return. Real Asset investments have a tangible or physical aspect such as real estate or commodities. Alternative Fixed Income investments seek to offer exposure to categories generally not included in investors’ allocations and to foreign investments, many of which are not denominated in US dollars. Alternative Equity investments are investments primarily in convertible and preferred instruments that offer equity exposure. Absolute Return investments seek positive returns in all market environments or seek to increase the diversification or liquidity of the fund’s portfolio. |
Portfolio holdings and characteristics are subject to change.
For more complete details about the Fund’s investment portfolio, see page 8.
Following the Fund’s fiscal first and third quarter-end, a complete portfolio holdings listing is filed with the SEC on Form N-Q. The form will be available on the SEC’s Web site at sec.gov, and it also may be reviewed and copied at the SEC’s Public Reference Room in Washington, D.C. Information on the operation of the SEC’s Public Reference Room may be obtained by calling (800) SEC-0330. The Fund’s portfolio holdings are also posted on deutschefunds.com from time to time. Please see the Fund’s current prospectus for more information.
| | | | |
Deutsche Variable Series II — Deutsche Alternative Asset Allocation VIP | | | | | 7 |
| | |
| Investment Portfolio | | December 31, 2017 |
| | | | | | | | |
| | | Shares | | | Value ($) | |
| Mutual Funds 53.4% | |
Deutsche Emerging Markets Fixed Income Fund “Institutional” (a) | | | 1,725,894 | | | | 16,551,326 | |
Deutsche Enhanced Commodity Strategy Fund “Institutional” (a) | | | 2,102,819 | | | | 25,128,692 | |
Deutsche Floating Rate Fund “Institutional” (a) | | | 1,622,166 | | | | 13,334,203 | |
Deutsche Global Infrastructure Fund “Institutional” (a) | | | 1,391,133 | | | | 20,825,265 | |
Deutsche Global Real Estate Securities Fund “Institutional” (a) | | | 1,623,513 | | | | 14,968,792 | |
Deutsche Real Estate Securities Fund “Institutional” (a) | | | 362,322 | | | | 7,376,866 | |
Total Mutual Funds
(Cost $94,858,409) | | | | | | | 98,185,144 | |
|
| Exchange-Traded Funds 39.7% | |
iShares Global Infrastructure ETF | | | 385,600 | | | | 17,436,832 | |
iShares JPMorgan USD Emerging Markets Bond ETF | | | 61,600 | | | | 7,151,760 | |
iShares U.S. Preferred Stock ETF | | | 249,000 | | | | 9,479,430 | |
PowerShares DB U.S. Dollar Index Bullish Fund* | | | 145,599 | | | | 3,498,744 | |
ProShares Short VIX Short-Term Futures ETF* | | | 14,000 | | | | 1,794,940 | |
| | | | | | | | |
| | | Shares | | | Value ($) | |
SPDR Bloomberg Barclays Convertible Securities ETF | | | 521,820 | | | | 26,404,092 | |
VanEck Vectors JPMorgan EM Local Currency Bond ETF | | | 380,598 | | | | 7,223,750 | |
Total Exchange-Traded Funds
(Cost $71,567,934) | | | | 72,989,548 | |
|
| Exchange-Traded Note 2.7% | |
VelocityShares Daily Inverse VIX Short Term ETN*
(Cost $4,076,285) | | | 37,200 | | | | 5,001,168 | |
|
| Cash Equivalents 7.1% | |
Deutsche Central Cash Management Government Fund, 1.30% (a) (b) (Cost $12,941,460) | | | 12,941,460 | | | | 12,941,460 | |
| | |
| | | % of Net
Assets | | | Value ($) | |
Total Investment Portfolio
(Cost $183,444,088) | | | 102.9 | | | | 189,117,320 | |
| Other Assets and Liabilities, Net | | | (2.9 | ) | | | (5,273,176 | ) |
| Net Assets | | | 100.0 | | | | 183,844,144 | |
| * | Non-income producing security. |
| (a) | Affiliated fund managed by Deutsche Investment Management Americas Inc. |
| (b) | The rate shown is the annualized seven-day yield at period end. |
EM: Emerging Markets
SPDR: Standard & Poor’s Depositary Receipt
The Fund mainly invests in Underlying Deutsche Funds and Non-affiliated ETFs. The Underlying Deutsche Funds in which the Fund invests are considered to be affiliated investments.
A summary of the Fund’s transactions with affiliated Underlying Deutsche Funds during the year ended December 31, 2017 are as follows:
| | | | | | | | | | | | | | | | | | | | | | | | | | | | | | | | |
| Affiliate | | Value ($) at
12/31/2016 | | | Purchases
Cost ($) | | | Sales Cost ($) | | | Realized Gain/ (Loss) ($) | | | Change in
Unrealized
Appreciation
(Depreciation)
($) | | | Income
Distributions
($) | | | Capital
Gain
Distributions
($) | | | Value ($) at
12/31/2017 | |
Deutsche Emerging Markets Fixed
Income Fund | | | 20,632,739 | | | | 11,751,962 | | | | 16,939,000 | | | | (717,219 | ) | | | 1,822,844 | | | | 634,709 | | | | — | | | | 16,551,326 | |
Deutsche Enhanced Commodity Strategy
Fund | | | 18,836,483 | | | | 14,989,582 | | | | 9,000,000 | | | | (3,662,671 | ) | | | 3,965,298 | | | | 97,582 | | | | — | | | | 25,128,692 | |
Deutsche Floating
Rate Fund | | | 12,592,284 | | | | 3,147,147 | | | | 2,000,000 | | | | (237,374 | ) | | | (167,854 | ) | | | 630,196 | | | | — | | | | 13,334,203 | |
Deutsche Global
Inflation Fund | | | 18,478,680 | | | | 4,990,000 | | | | 24,122,428 | | | | 594,650 | | | | 59,098 | | | | — | | | | — | | | | — | |
| Deutsche Global Infrastructure Fund | | | 12,207,777 | | | | 6,954,381 | | | | — | | | | — | | | | 1,663,107 | | | | 398,381 | | | | — | | | | 20,825,265 | |
Deutsche Global
Real Estate
Securities Fund | | | 422,249 | | | | 14,563,718 | | | | — | | | | — | | | | (17,175 | ) | | | 367,718 | | | | — | | | | 14,968,792 | |
The accompanying notes are an integral part of the financial statements.
| | | | | | |
| | 8 | | | | | | Deutsche Variable Series II — Deutsche Alternative Asset Allocation VIP |
| | | | | | | | | | | | | | | | | | | | | | | | | | | | | | | | |
| Affiliate | | Value ($) at
12/31/2016 | | | Purchases
Cost ($) | | | Sales Cost ($) | | | Realized Gain/ (Loss) ($) | | | Change in
Unrealized
Appreciation
(Depreciation)
($) | | | Income
Distributions
($) | | | Capital
Gain
Distributions
($) | | | Value ($) at
12/31/2017 | |
Deutsche Real
Estate Securities
Fund | | | 6,637,281 | | | | 3,025,409 | | | | 2,500,000 | | | | (180,103 | ) | | | 394,279 | | | | 357,102 | | | | 197,440 | | | | 7,376,866 | |
Deutsche Central
Cash Management Government Fund | | | 18,239,998 | | | | 95,047,021 | | | | 100,345,559 | | | | — | | | | — | | | | 132,263 | | | | — | | | | 12,941,460 | |
| Total | | | 108,047,491 | | | | 154,469,220 | | | | 154,906,987 | | | | (4,202,717 | ) | | | 7,719,597 | | | | 2,617,951 | | | | 197,440 | | | | 111,126,604 | |
Fair Value Measurements
Various inputs are used in determining the value of the Fund’s investments. These inputs are summarized in three broad levels. Level 1 includes quoted prices in active markets for identical securities. Level 2 includes other significant observable inputs (including quoted prices for similar securities, interest rates, prepayment speeds and credit risk). Level 3 includes significant unobservable inputs (including the Fund’s own assumptions in determining the fair value of investments). The level assigned to the securities valuations may not be an indication of the risk or liquidity associated with investing in those securities.
The following is a summary of the inputs used as of December 31, 2017 in valuing the Fund’s investments. For information on the Fund’s policy regarding the valuation of investments, please refer to the Security Valuation section of Note A in the accompanying Notes to Financial Statements.
| | | | | | | | | | | | | | | | |
| Assets | | Level 1 | | | Level 2 | | | Level 3 | | | Total | |
| Mutual Funds | | $ | 98,185,144 | | | $ | — | | | $ | — | | | $ | 98,185,144 | |
| Exchange-Traded Funds | | | 72,989,548 | | | | — | | | | — | | | | 72,989,548 | |
| Exchange-Traded Note | | | 5,001,168 | | | | — | | | | — | | | | 5,001,168 | |
| Short-Term Investment | | | 12,941,460 | | | | — | | | | — | | | | 12,941,460 | |
| Total | | $ | 189,117,320 | | | $ | — | | | $ | — | | | $ | 189,117,320 | |
There have been no transfers between fair value measurement levels during the year ended December 31, 2017.
| | | | |
Deutsche Variable Series II — Deutsche Alternative Asset Allocation VIP | | | | | 9 |
Statement of Assets and Liabilities
| | | | |
| as of December 31, 2017 | | | | |
| |
| Assets | | | | |
| Investments in affiliated Underlying Funds, at value (cost $107,799,869) | | $ | 111,126,604 | |
| Investments in non-affiliated Underlying Funds, at value (cost $75,644,219) | | | 77,990,716 | |
| Cash | | | 10,000 | |
| Receivable for investments sold | | | 818,921 | |
| Receivable for Fund shares sold | | | 110,402 | |
| Dividends receivable | | | 31,818 | |
| Interest receivable | | | 14,421 | |
| Other assets | | | 3,892 | |
| Total assets | | | 190,106,774 | |
| |
| Liabilities | | | | |
| Payable for investments purchased | | | 6,121,536 | |
| Payable for Fund shares redeemed | | | 13,237 | |
| Accrued Trustees’ fees | | | 2,170 | |
| Other accrued expenses and payables | | | 125,687 | |
| Total liabilities | | | 6,262,630 | |
| Net assets, at value | | $ | 183,844,144 | |
| |
| Net Assets Consist of | | | | |
| Undistributed net investment income | | | 3,670,578 | |
| Net unrealized appreciation (depreciation) on investments | | | 5,673,232 | |
| Accumulated net realized gain (loss) | | | (6,552,275 | ) |
| Paid-in capital | | | 181,052,609 | |
| Net assets, at value | | $ | 183,844,144 | |
Class A | | | | |
| Net Asset Value, offering and redemption price per share ($26,972,476 ÷ 1,982,448 outstanding shares of beneficial interest, no par value, unlimited number of shares authorized) | | $ | 13.61 | |
Class B | | | | |
| Net Asset Value, offering and redemption price per share ($156,871,668 ÷ 11,540,895 outstanding shares of beneficial interest, no par value, unlimited number of shares authorized) | | $ | 13.59 | |
Statement of Operations
| | | | |
| for the year ended December 31, 2017 | | | | |
| |
| Investment Income | | | | |
| Income: | | | | |
| Income distributions from affiliated Underlying Funds | | $ | 2,617,951 | |
| Dividends | | | 1,795,674 | |
| Total income | | | 4,413,625 | |
| Expenses: | | | | |
| Management fee | | | 734,580 | |
| Administration fee | | | 158,954 | |
| Record keeping fees (Class B) | | | 48,193 | |
| Services to shareholders | | | 2,968 | |
| Distribution service fee (Class B) | | | 333,316 | |
| Custodian fee | | | 5,796 | |
| Professional fees | | | 72,095 | |
| Reports to shareholders | | | 31,057 | |
| Registration fees | | | 5 | |
| Trustees’ fees and expenses | | | 8,728 | |
| Other | | | 3,987 | |
| Total expenses before expense reductions | | | 1,399,679 | |
| Expense reductions | | | (714,830 | ) |
| Total expenses after expense reductions | | | 684,849 | |
| Net investment income (loss) | | | 3,728,776 | |
| |
| Realized and Unrealized Gain (Loss) | | | | |
Net realized gain (loss) from:
Sale of affiliated Underlying Funds | | | (4,202,717 | ) |
| Sale of non-affiliated Underlying Funds | | | 1,114,179 | |
| Capital gain distributions from affiliated Underlying Funds | | | 197,440 | |
| | | | (2,891,098 | ) |
| Change in net unrealized appreciation (depreciation) on investments | | | | |
| Affiliated Underlying Funds | | | 7,719,597 | |
| Non-affiliated Underlying Funds | | | 2,370,556 | |
| | | | 10,090,153 | |
| Net gain (loss) | | | 7,199,055 | |
| Net increase (decrease) in net assets resulting from operations | | $ | 10,927,831 | |
The accompanying notes are an integral part of the financial statements.
| | | | | | |
| | 10 | | | | | | Deutsche Variable Series II — Deutsche Alternative Asset Allocation VIP |
Statements of Changes in Net Assets
| | | | | | | | |
| | | Years Ended December 31, | |
| Increase (Decrease) in Net Assets | | 2017 | | | 2016 | |
| Operations: | | | | | | | | |
| Net investment income | | $ | 3,728,776 | | | $ | 2,874,142 | |
| Net realized gain (loss) | | | (2,891,098 | ) | | | (1,444,719 | ) |
| Change in net unrealized appreciation (depreciation) | | | 10,090,153 | | | | 3,861,095 | |
| Net increase (decrease) in net assets resulting from operations | | | 10,927,831 | | | | 5,290,518 | |
| Distributions to shareholders from: | | | | | | | | |
| Net investment income: | | | | | | | | |
Class A | | | (586,944 | ) | | | (500,963 | ) |
Class B | | | (2,539,240 | ) | | | (1,722,118 | ) |
| Total distributions | | | (3,126,184 | ) | | | (2,223,081 | ) |
| Fund share transactions: | | | | | | | | |
Class A | | | | | | | | |
| Proceeds from shares sold | | | 4,259,606 | | | | 4,188,144 | |
| Reinvestment of distributions | | | 586,944 | | | | 500,963 | |
| Payments for shares redeemed | | | (3,329,766 | ) | | | (2,114,144 | ) |
| Net increase (decrease) in net assets from Class A share transactions | | | 1,516,784 | | | | 2,574,963 | |
Class B | | | | | | | | |
| Proceeds from shares sold | | | 53,356,061 | | | | 27,389,957 | |
| Reinvestment of distributions | | | 2,539,240 | | | | 1,722,118 | |
| Payments for shares redeemed | | | (12,561,333 | ) | | | (12,422,361 | ) |
| Net increase (decrease) in net assets from Class B share transactions | | | 43,333,968 | | | | 16,689,714 | |
| Increase (decrease) in net assets | | | 52,652,399 | | | | 22,332,114 | |
| Net assets at beginning of period | | | 131,191,745 | | | | 108,859,631 | |
| Net assets at end of period (including undistributed net investment income of $3,670,578 and $3,070,645, respectively) | | $ | 183,844,144 | | | $ | 131,191,745 | |
| | |
| Other Information | | | | | | | | |
Class A | | | | | | | | |
| Shares outstanding at beginning of period | | | 1,866,984 | | | | 1,666,853 | |
| Shares sold | | | 321,873 | | | | 325,638 | |
| Shares issued to shareholders in reinvestment of distributions | | | 45,046 | | | | 39,415 | |
| Shares redeemed | | | (251,455 | ) | | | (164,922 | ) |
| Net increase (decrease) in Class A shares | | | 115,464 | | | | 200,131 | |
| Shares outstanding at end of period | | | 1,982,448 | | | | 1,866,984 | |
Class B | | | | | | | | |
| Shares outstanding at beginning of period | | | 8,257,413 | | | | 6,979,222 | |
| Shares sold | | | 4,038,118 | | | | 2,113,626 | |
| Shares issued to shareholders in reinvestment of distributions | | | 194,727 | | | | 135,280 | |
| Shares redeemed | | | (949,363 | ) | | | (970,715 | ) |
| Net increase (decrease) in Class B shares | | | 3,283,482 | | | | 1,278,191 | |
| Shares outstanding at end of period | | | 11,540,895 | | | | 8,257,413 | |
The accompanying notes are an integral part of the financial statements.
| | | | |
Deutsche Variable Series II — Deutsche Alternative Asset Allocation VIP | | | | | 11 |
Financial Highlights
| | | | | | | | | | | | | | | | | | | | |
| | | Years Ended December 31, | |
| Class A | | 2017 | | | 2016 | | | 2015 | | | 2014 | | | 2013 | |
| | | | | |
| Selected Per Share Data | | | | | | | | | | | | | | | | | | | | |
| Net asset value, beginning of period | | $ | 12.97 | | | $ | 12.60 | | | $ | 13.88 | | | $ | 13.75 | | | $ | 13.90 | |
| Income (loss) from investment operations: | | | | | | | | | | | | | | | | | | | | |
Net investment incomea | | | .33 | | | | .35 | | | | .29 | | | | .36 | | | | .26 | |
Net realized and unrealized gain (loss) | | | .62 | | | | .31 | | | | (1.13 | ) | | | .13 | | | | (.13 | ) |
Total from investment operations | | | .95 | | | | .66 | | | | (.84 | ) | | | .49 | | | | .13 | |
| Less distributions from: | | | | | | | | | | | | | | | | | | | | |
Net investment income | | | (.31 | ) | | | (.29 | ) | | | (.41 | ) | | | (.27 | ) | | | (.28 | ) |
Net realized gains | | | — | | | | — | | | | (.03 | ) | | | (.09 | ) | | | — | |
Total distributions | | | (.31 | ) | | | (.29 | ) | | | (.44 | ) | | | (.36 | ) | | | (.28 | ) |
| Net asset value, end of period | | $ | 13.61 | | | $ | 12.97 | | | $ | 12.60 | | | $ | 13.88 | | | $ | 13.75 | |
| Total Return (%)b,c | | | 7.41 | | | | 5.30 | | | | (6.29 | ) | | | 3.50 | | | | .93 | |
| | | | | |
| Ratios to Average Net Assets and Supplemental Data | | | | | | | | | | | | | | | | | | | | |
| Net assets, end of period ($ millions) | | | 27 | | | | 24 | | | | 21 | | | | 20 | | | | 15 | |
| Ratio of expenses before expense reductions (%)d,e | | | .64 | | | | .56 | | | | .53 | | | | .56 | | | | .64 | |
| Ratio of expenses after expense reductions (%)d,e | | | .19 | | | | .27 | | | | .33 | | | | .32 | | | | .27 | |
| Ratio of net investment income (%) | | | 2.50 | | | | 2.70 | | | | 2.19 | | | | 2.54 | | | | 1.86 | |
| Portfolio turnover rate (%) | | | 55 | | | | 51 | | | | 21 | | | | 28 | | | | 40 | |
| | | | | | | | | | | | | | | | | | | | |
| | | Years Ended December 31, | |
| Class B | | 2017 | | | 2016 | | | 2015 | | | 2014 | | | 2013 | |
| | | | | |
| Selected Per Share Data | | | | | | | | | | | | | | | | | | | | |
| Net asset value, beginning of period | | $ | 12.96 | | | $ | 12.59 | | | $ | 13.87 | | | $ | 13.74 | | | $ | 13.88 | |
| Income (loss) from investment operations: | | | | | | | | | | | | | | | | | | | | |
Net investment incomea | | | .31 | | | | .31 | | | | .25 | | | | .31 | | | | .22 | |
Net realized and unrealized gain (loss) | | | .59 | | | | .31 | | | | (1.12 | ) | | | .14 | | | | (.11 | ) |
Total from investment operations | | | .90 | | | | .62 | | | | (.87 | ) | | | .45 | | | | .11 | |
| Less distributions from: | | | | | | | | | | | | | | | | | | | | |
Net investment income | | | (.27 | ) | | | (.25 | ) | | | (.38 | ) | | | (.23 | ) | | | (.25 | ) |
Net realized gains | | | — | | | | — | | | | (.03 | ) | | | (.09 | ) | | | — | |
Total distributions | | | (.27 | ) | | | (.25 | ) | | | (.41 | ) | | | (.32 | ) | | | (.25 | ) |
| Net asset value, end of period | | $ | 13.59 | | | $ | 12.96 | | | $ | 12.59 | | | $ | 13.87 | | | $ | 13.74 | |
| Total Return (%)b,c | | | 7.01 | | | | 4.99 | | | | (6.54 | ) | | | 3.24 | | | | .75 | |
| | | | | |
| Ratios to Average Net Assets and Supplemental Data | | | | | | | | | | | | | | | | | | | | |
| Net assets, end of period ($ millions) | | | 157 | | | | 107 | | | | 88 | | | | 94 | | | | 84 | |
| Ratio of expenses before expense reductions (%)d,e | | | .93 | | | | .85 | | | | .83 | | | | .86 | | | | .93 | |
| Ratio of expenses after expense reductions (%)d,e | | | .48 | | | | .57 | | | | .62 | | | | .57 | | | | .52 | |
| Ratio of net investment income (%) | | | 2.31 | | | | 2.45 | | | | 1.84 | | | | 2.22 | | | | 1.57 | |
| Portfolio turnover rate (%) | | | 55 | | | | 51 | | | | 21 | | | | 28 | | | | 40 | |
| a | Based on average shares outstanding during the period. |
| b | Total return would have been lower had certain expenses not been reduced. |
| c | Total return would have been lower if the Advisor had not reduced some Underlying Deutsche Funds’ expenses. |
| d | The Fund invests in other Funds and indirectly bears its proportionate share of fees and expenses incurred by the Underlying Funds in which the Fund is invested. This ratio does not include these indirect fees and expenses. |
| e | Expense ratio does not reflect charges and fees associated with the separate account that invests in the Fund or any variable life insurance policy or variable annuity contract for which the Fund is an investment option. |
The accompanying notes are an integral part of the financial statements.
| | | | | | |
| | 12 | | | | | | Deutsche Variable Series II — Deutsche Alternative Asset Allocation VIP |
Notes to Financial Statements
A. Organization and Significant Accounting Policies
Deutsche Alternative Asset Allocation VIP (the “Fund”) is a diversified series of Deutsche Variable Series II (the “Trust”), which is registered under the Investment Company Act of 1940, as amended (the “1940 Act”), as an open-end management investment company organized as a Massachusetts business trust. The Fund mainly invests in other affiliated Deutsche funds (i.e., mutual funds, exchange-traded funds and other pooled investment vehicles managed by Deutsche Investment Management Americas Inc. or one of its affiliates, together the “Underlying Deutsche Funds”), non-affiliated exchange-traded funds (“Non-affiliated ETFs”), non-affiliated exchange-traded notes (“Non-affiliated ETNs”) and derivative investments. Non-affiliated ETFs, Non-affiliated ETNs and Underlying Deutsche Funds are collectively referred to as “Underlying Funds.” During the year ended December 31, 2017, the Fund primarily invested in underlying Deutsche Funds and non-affiliated ETFs. Each Underlying Deutsche Fund’s accounting policies and investment holdings are outlined in the Underlying Deutsche Funds’ financial statements and are available upon request.
Multiple Classes of Shares of Beneficial Interest. The Fund offers two classes of shares (Class A shares and Class B shares). Sales of Class B shares are subject to recordkeeping fees up to 0.15% and Rule 12b-1 fees under the 1940 Act equal to an annual rate of 0.25% of the average daily net assets of the Class B shares of the Fund. Class A shares are not subject to such fees.
Investment income, realized and unrealized gains and losses, and certain fund-level expenses and expense reductions, if any, are borne pro rata on the basis of relative net assets by the holders of all classes of shares except that each class bears certain expenses unique to that class (including the applicable Rule 12b-1 fee). Differences in class-level expenses may result in payment of different per share dividends by class. All shares have equal rights with respect to voting subject to class-specific arrangements.
The Fund’s financial statements are prepared in accordance with accounting principles generally accepted in the United States of America (“U.S. GAAP”) which require the use of management estimates. Actual results could differ from those estimates. The Fund qualifies as an investment company under Topic 946 of Accounting Standards Codification of U.S. GAAP. The policies described below are followed consistently by the Fund in the preparation of its financial statements.
Security Valuation. Investments are stated at value determined as of the close of regular trading on the New York Stock Exchange on each day the exchange is open for trading.
Various inputs are used in determining the value of the Fund’s investments. These inputs are summarized in three broad levels. Level 1 includes quoted prices in active markets for identical securities. Level 2 includes other significant observable inputs (including quoted prices for similar securities, interest rates, prepayment speeds and credit risk). Level 3 includes significant unobservable inputs (including the Fund’s own assumptions in determining the fair value of investments). The level assigned to the securities valuations may not be an indication of the risk or liquidity associated with investing in those securities.
Investments in mutual funds are valued at the net asset value per share of each class of the Underlying Deutsche Funds and are categorized as Level 1.
ETFs and ETNs are valued at the most recent sale price or official closing price reported on the exchange (U.S. or foreign) or over-the-counter market on which they trade. ETFs and ETNs for which no sales are reported are valued at the calculated mean between the most recent bid and asked quotations on the relevant market or, if a mean cannot be determined, at the most recent bid quotation. ETFs and ETNs securities are generally categorized as Level 1.
Disclosure about the classification of fair value measurements is included in a table following the Fund’s Investment Portfolio.
Federal Income Taxes. The Fund’s policy is to comply with the requirements of the Internal Revenue Code, as amended, which are applicable to regulated investment companies and to distribute all of its taxable income to its shareholders.
At December 31, 2017, the Fund had approximately $3,706,000 of long-term tax basis capital loss carryforwards, which may be applied against realized net taxable capital gains indefinitely.
The Fund has reviewed the tax positions for the open tax years as of December 31, 2017 and has determined that no provision for income tax and/or uncertain tax positions is required in the Fund’s financial statements. The Fund’s federal tax returns for the prior three fiscal years remain open subject to examination by the Internal Revenue Service.
| | | | |
Deutsche Variable Series II — Deutsche Alternative Asset Allocation VIP | | | | | 13 |
Distribution of Income and Gains. Distributions from net investment income of the Fund, if any, are declared and distributed to shareholders annually. Net realized gains from investment transactions, in excess of available capital loss carryforwards, would be taxable to the Fund if not distributed and, therefore, will be distributed to shareholders at least annually. The Fund may also make additional distributions for tax purposes if necessary.
The timing and characterization of certain income and capital gain distributions are determined annually in accordance with federal tax regulations which may differ from accounting principles generally accepted in the United States of America. These differences primarily relate to certain securities sold at a loss and capital gain distributions from Underlying Funds. As a result, net investment income (loss) and net realized gain (loss) on investment transactions for a reporting period may differ significantly from distributions during such period. Accordingly, the Fund may periodically make reclassifications among certain of its capital accounts without impacting the net asset value of the Fund.
At December 31, 2017, the Fund’s components of distributable earnings on a tax basis were as follows:
| | | | |
| Undistributed ordinary income* | | $ | 3,670,578 | |
| Capital loss carryforward | | $ | (3,706,000 | ) |
| Unrealized appreciation (depreciation) on investments | | $ | 2,826,696 | |
At December 31, 2017, the aggregate cost of investments for federal income tax purposes was $186,290,624. The net unrealized appreciation for all investments based on tax cost was $2,826,696. This consisted of aggregate gross unrealized appreciation for all investments in which there was an excess of value over tax cost of $7,332,590 and aggregate gross unrealized depreciation for all investments in which there was an excess of tax cost over value of $4,505,894.
In addition, the tax character of distributions paid by the Fund is summarized as follows:
| | | | | | | | |
| | | Years Ended December 31, | |
| | | 2017 | | | 2016 | |
| Distributions from ordinary income* | | $ | 3,126,184 | | | $ | 2,223,081 | |
| * | For tax purposes, short-term capital gain distributions are considered ordinary income distributions. |
Expenses. Expenses of the Trust arising in connection with a specific fund are allocated to that fund. Other Trust expenses which cannot be directly attributed to a fund are apportioned among the funds in the Trust based upon the relative net assets or other appropriate measures.
Contingencies. In the normal course of business, the Fund may enter into contracts with service providers that contain general indemnification clauses. The Fund’s maximum exposure under these arrangements is unknown, as this would involve future claims that may be made against the Fund that have not yet been made. However, based on experience, the Fund expects the risk of loss to be remote.
Other. Investment transactions are accounted for on a trade date plus one basis for daily net asset value calculations. However, for financial reporting purposes, investment transactions are reported on trade date. Interest income is recorded on the accrual basis. Dividend Income is recorded on the ex-dividend date. Distributions of income and capital gains from the Underlying Funds are recorded on the ex-dividend date. Realized gains and losses from investment transactions are recorded on an identified cost basis.
B. Purchases and Sales of Securities
During the year ended December 31, 2017, purchases and sales of affiliated Underlying Funds (excluding money market funds) aggregated $66,281,862 and $57,789,993, respectively. Purchases and sales of Non-affiliated ETFs aggregated $71,196,158 and $22,311,623, respectively.
C. Related Parties
Management Agreement. Under the Investment Management Agreement with Deutsche Investment Management Americas Inc. (“DIMA” or the “Advisor”), an indirect, wholly owned subsidiary of Deutsche Bank AG, the Advisor directs the investments of the Fund in accordance with its investment objectives, policies and restrictions. The Advisor determines the securities, instruments and other contracts relating to investments in Underlying Funds to be purchased, sold or entered into by the Fund or delegates such responsibility to the Fund’s subadvisors.
RREEF America L.L.C. (“RREEF”), an indirect, wholly owned subsidiary of Deutsche Bank AG, acts as an investment subadvisor to the Fund. As an investment subadvisor to the Fund, RREEF provides investment management services to the portions of the Fund’s portfolio allocated to direct investments in global real estate and global infrastructure securities. RREEF is paid by the Advisor for the services RREEF provides to the Fund. As of the date of this report, the Fund obtained its exposure to global real estate and global infrastructure securities indirectly through investments in other Underlying Deutsche Funds.
| | | | | | |
| | 14 | | | | | | Deutsche Variable Series II — Deutsche Alternative Asset Allocation VIP |
The Fund does not invest in the Underlying Deutsche Funds for the purpose of exercising management or control; however, investments within the set limits may represent 5% or more of an Underlying Deutsche Fund’s outstanding shares. At December 31, 2017, the Fund held approximately 20% of Deutsche Emerging Markets Fixed Income Fund. Pursuant to the Investment Management Agreement with the Advisor, the Fund pays a monthly management fee based on the Fund’s average daily net assets, computed and accrued daily and payable monthly, at the following annual rates:
| | | | |
| On assets invested in other Deutsche Funds | | | .20 | % |
| On assets invested in all other assets not considered Deutsche Funds | | | 1.20 | % |
Accordingly, for the year ended December 31, 2017, the fee pursuant to the Investment Management Agreement was equivalent to an annual rate (exclusive of any applicable waivers/reimbursements) of 0.46% of the Fund’s average daily net assets.
In addition, the Advisor will receive management fees from managing the Underlying Deutsche Funds in which the Fund invests.
For the period from January 1, 2017 through September 30, 2018, the Advisor has contractually agreed to waive its fees and/or reimburse certain operating expenses to the extent necessary to maintain the total annual operating expenses (excluding certain expenses such as extraordinary expenses, taxes, brokerage, interest expense and Underlying Funds) of each class as follows:
| | | | |
| Class A | | | .23 | % |
| Class B | | | .53 | % |
In addition, the Advisor has contractually agreed to waive its fees and/or reimburse fund expenses for the period July 17, 2017 through September 30, 2018 to the extent necessary to maintain the fund’s total annual operating expenses (including indirect expenses of Underlying Funds and excluding certain expenses such as extraordinary expenses, taxes, brokerage and interest expenses) of each class as follows:
| | | | |
| Class A | | | .86 | % |
| Class B | | | 1.15 | % |
For the year ended December 31, 2017, the Advisor has voluntarily agreed to waive 0.15% of its management fee.
For the year ended December 31, 2017, fees waived and/or expenses reimbursed for each class are as follows:
| | | | |
| Class A | | $ | 115,360 | |
| Class B | | | 599,470 | |
| | | $ | 714,830 | |
The Fund indirectly bears its proportionate share of fees and expenses incurred by the Underlying Funds in which it is invested.
Administration Fee. Pursuant to an Administrative Services Agreement, DIMA provides most administrative services to the Fund. For all services provided under the Administrative Services Agreement, the Fund pays DIMA an annual fee (“Administration Fee”) of 0.10% of the Fund’s average daily net assets, computed and accrued daily and payable monthly. For the year ended December 31, 2017, the Administration Fee was $158,954, of which $15,302 is unpaid.
Service Provider Fees. Deutsche AM Service Company (“DSC”), an affiliate of the Advisor, is the transfer agent, dividend-paying agent and shareholder service agent for the Fund. Pursuant to a sub-transfer agency agreement between DSC and DST Systems, Inc. (“DST”), DSC has delegated certain transfer agent, dividend-paying agent and shareholder service agent functions to DST. DSC compensates DST out of the shareholder servicing fee it receives from the Fund. For the year ended December 31, 2017, the amounts charged to the Fund by DSC were as follows:
| | | | | | | | |
| Services to Shareholders | | Total
Aggregated | | | Unpaid at
December 31,
2017 | |
| Class A | | $ | 131 | | | $ | 33 | |
| Class B | | | 247 | | | | 61 | |
| | | $ | 378 | | | $ | 94 | |
| | | | |
Deutsche Variable Series II — Deutsche Alternative Asset Allocation VIP | | | | | 15 |
Distribution Service Agreement. Under the Fund’s Class B 12b-1 plan, Deutsche AM Distributors, Inc. (“DDI”) received a fee (“Distribution Service Fee”) of 0.25% of average daily net assets of Class B shares. For the year ended December 31, 2017, the Distribution Service Fee aggregated $333,316, of which $32,586 is unpaid.
Typesetting and Filing Service Fees. Under an agreement with DIMA, DIMA is compensated for providing certain pre-press and regulatory filing services to the Fund. For the year ended December 31, 2017, the amount charged to the Fund by DIMA included in the Statement of Operations under “Reports to shareholders” aggregated $11,146, of which $3,672 is unpaid.
Trustees’ Fees and Expenses. The Fund paid retainer fees to each Trustee not affiliated with the Advisor, plus specified amounts to the Board Chairperson and Vice Chairperson and to each committee Chairperson.
Affiliated Cash Management Vehicles. The Fund may invest uninvested cash balances in Deutsche Central Cash Management Government Fund and Deutsche Variable NAV Money Fund, affiliated money market funds which are managed by the Advisor. Each affiliated money market fund is managed in accordance with Rule 2a-7 under the 1940 Act, which governs the quality, maturity, diversity and liquidity of instruments in which a money market fund may invest. Deutsche Central Cash Management Government Fund seeks to maintain a stable net asset value, and Deutsche Variable NAV Money Fund maintains a floating net asset value. The Fund indirectly bears its proportionate share of the expenses of each affiliated money market fund in which it invests. Deutsche Central Cash Management Government Fund does not pay the Advisor an investment management fee.
D. Ownership of the Fund
At December 31, 2017, one participating insurance company was the owner of record of 10% or more of the total outstanding Class A shares of the Fund, owning 90%. Three participating insurance companies were the owner of record of 10% or more of the total outstanding Class B shares of the Fund, each owning 45%, 36% and 13%, respectively.
| | | | | | |
| | 16 | | | | | | Deutsche Variable Series II — Deutsche Alternative Asset Allocation VIP |
Report of Independent Registered Public Accounting Firm
To the Board of Trustees of Deutsche Variable Series II and Shareholders of Deutsche Alternative Asset Allocation VIP:
Opinion on the Financial Statements
We have audited the accompanying statement of assets and liabilities of Deutsche Alternative Asset Allocation VIP (the “Fund”) (one of the funds constituting the Deutsche Variable Series II) (the “Trust”), including the schedule of investments, as of December 31, 2017, and the related statement of operations for the year then ended, the statements of changes in net assets for each of the two years in the period then ended, the financial highlights for each of the five years in the period then ended and the related notes (collectively referred to as the “financial statements”). In our opinion, the financial statements present fairly, in all material respects, the financial position of the Fund (one of the funds constituting the Deutsche Variable Series II) at December 31, 2017, the results of its operations for the year then ended, the changes in its net assets for each of the two years in the period then ended and its financial highlights for each of the five years in the period then ended, in conformity with U.S. generally accepted accounting principles.
Basis for Opinion
These financial statements are the responsibility of the Trust’s management. Our responsibility is to express an opinion on the Fund’s financial statements based on our audits. We are a public accounting firm registered with the Public Company Accounting Oversight Board (United States) (“PCAOB”) and are required to be independent with respect to the Trust in accordance with the U.S. federal securities laws and the applicable rules and regulations of the Securities and Exchange Commission and the PCAOB.
We conducted our audits in accordance with the standards of the PCAOB. Those standards require that we plan and perform the audit to obtain reasonable assurance about whether the financial statements are free of material misstatement, whether due to error or fraud. The Trust is not required to have, nor were we engaged to perform, an audit of the Trust’s internal control over financial reporting. As part of our audits, we are required to obtain an understanding of internal control over financial reporting, but not for the purpose of expressing an opinion on the effectiveness of the Trust’s internal control over financial reporting. Accordingly, we express no such opinion.
Our audits included performing procedures to assess the risks of material misstatement of the financial statements, whether due to error or fraud, and performing procedures that respond to those risks. Such procedures included examining, on a test basis, evidence regarding the amounts and disclosures in the financial statements. Our procedures included confirmation of securities owned as of December 31, 2017, by correspondence with the custodian and brokers or by other appropriate auditing procedures where replies from brokers were not received.
Our audits also included evaluating the accounting principles used and significant estimates made by management, as well as evaluating the overall presentation of the financial statements. We believe that our audits provide a reasonable basis for our opinion.

We have served as the auditor of one or more investment companies in the Deutsche family of funds since at least 1979, but we are unable to determine the specific year.
Boston, Massachusetts
February 15, 2018
| | | | |
Deutsche Variable Series II — Deutsche Alternative Asset Allocation VIP | | | | | 17 |
| | |
| Information About Your Fund’s Expenses | | (Unaudited) |
As an investor of the Fund, you incur two types of costs: ongoing expenses and transaction costs. Ongoing expenses include management fees, distribution and service (12b-1) fees and other Fund expenses. Examples of transaction costs include contract charges, which are not shown in this section. The following tables are intended to help you understand your ongoing expenses (in dollars) of investing in the Fund and to help you compare these expenses with the ongoing expenses of investing in other mutual funds. In addition to the ongoing expenses which the Fund bears directly, the Fund’s shareholders indirectly bear the expense of the Underlying Funds in which the Fund invests. These expenses are not included in the Fund’s annualized expense ratios used to calculate the expense estimate in the tables. In the most recent six-month period, the Fund limited the ongoing expenses the Fund bears directly; had it not done so, expenses would have been higher. The examples in the table are based on an investment of $1,000 invested at the beginning of the six-month period and held for the entire period (July 1, 2017 to December 31, 2017).
The tables illustrate your Fund’s expenses in two ways:
| – | Actual Fund Return. This helps you estimate the actual dollar amount of ongoing expenses (but not transaction costs) paid on a $1,000 investment in the Fund using the Fund’s actual return during the period. To estimate the expenses you paid over the period, simply divide your account value by $1,000 (for example, an $8,600 account value divided by $1,000 = 8.6), then multiply the result by the number in the “Expenses Paid per $1,000” line under the share class you hold. |
| – | Hypothetical 5% Fund Return. This helps you to compare your Fund’s ongoing expenses (but not transaction costs) with those of other mutual funds using the Fund’s actual expense ratio and a hypothetical rate of return of 5% per year before expenses. Examples using a 5% hypothetical Fund return may be found in the shareholder reports of other mutual funds. The hypothetical account values and expenses may not be used to estimate the actual ending account balance or expenses you paid for the period. |
Please note that the expenses shown in these tables are meant to highlight your ongoing expenses only and do not reflect any transaction costs. The “Expenses Paid per $1,000” line of the tables is useful in comparing ongoing expenses only and will not help you determine the relative total expense of owning different funds. If these transaction costs had been included, your costs would have been higher.
| | | | | | | | |
| Expenses and Value of a $1,000 Investment for the six months ended December 31, 2017 | |
| | |
| Actual Fund Return | | Class A | | | Class B | |
| Beginning Account Value 7/1/17 | | $ | 1,000.00 | | | $ | 1,000.00 | |
| Ending Account Value 12/31/17 | | $ | 1,041.30 | | | $ | 1,039.00 | |
| Expenses Paid per $1,000* | | $ | .77 | | | $ | 2.26 | |
| | |
| Hypothetical 5% Fund Return | | | Class A | | | | Class B | |
| Beginning Account Value 7/1/17 | | $ | 1,000.00 | | | $ | 1,000.00 | |
| Ending Account Value 12/31/17 | | $ | 1,024.45 | | | $ | 1,022.99 | |
| Expenses Paid per $1,000* | | $ | .77 | | | $ | 2.24 | |
| * | Expenses are equal to the Fund’s annualized expense ratio for each share class, multiplied by the average account value over the period, multiplied by 184 (the number of days in the most recent six-month period), then divided by 365. |
| | | | | | | | |
| Annualized Expense Ratios** | | Class A | | | Class B | |
| Deutsche Variable Series II — Deutsche Alternative Asset Allocation VIP | | | .15 | % | | | .44 | % |
| ** | The Fund invests in other funds and indirectly bears its proportionate share of fees and expenses incurred by the Underlying Funds in which the Fund is invested. These ratios do not include these indirect fees and expenses. |
For more information, please refer to the Fund’s prospectus.
These tables do not reflect charges and fees (“contract charges”) associated with the separate account that invests in the Fund or any variable life insurance policy or variable annuity contract for which the Fund is an investment option.
For an analysis of the fees associated with an investment in the fund or similar funds, please refer to the current and hypothetical expense calculators for Variable Insurance Products which can be found at deutschefunds.com/EN/resources/calculators.jsp.
| | | | | | |
| | 18 | | | | | | Deutsche Variable Series II — Deutsche Alternative Asset Allocation VIP |
| | |
| Tax Information | | (Unaudited) |
For corporate shareholders, 7% of income dividends paid during the Fund’s fiscal year ended December 31, 2017 qualified for the dividends received deduction.
Please consult a tax advisor if you have questions about federal or state income tax laws, or on how to prepare your tax returns. If you have specific questions about your account, please contact your insurance provider.
Proxy Voting
The Trust’s policies and procedures for voting proxies for portfolio securities and information about how the Trust voted proxies related to its portfolio securities during the most recent 12-month period ended June 30 are available on our Web site — deutschefunds.com (click on “proxy voting” at the bottom of the page) — or on the SEC’s Web site — sec.gov. To obtain a written copy of the Trust’s policies and procedures without charge, upon request, call us toll free at (800) 728-3337.
| | | | |
Deutsche Variable Series II — Deutsche Alternative Asset Allocation VIP | | | | | 19 |
Advisory Agreement Board Considerations and Fee Evaluation
The Board of Trustees (hereinafter referred to as the “Board” or “Trustees”) approved the renewal of Deutsche Alternative Asset Allocation VIP’s (the “Fund”) investment management agreement (the “Agreement”) with Deutsche Investment Management Americas Inc. (“DIMA”) and sub-advisory agreement (the “Sub-Advisory Agreement” and together with the Agreement, the “Agreements”) between DIMA and RREEF America L.L.C. (“RREEF”), an affiliate of DIMA, in September 2017.
In terms of the process that the Board followed prior to approving the Agreements, shareholders should know that:
– During the entire process, all of the Fund’s Trustees were independent of DIMA and its affiliates (the “Independent Trustees”).
– The Board met frequently during the past year to discuss fund matters and dedicated a substantial amount of time to contract review matters. Over the course of several months, the Board’s Contract Committee reviewed extensive materials received from DIMA, independent third parties and independent counsel. These materials included an analysis of the Fund’s performance, fees and expenses, and profitability from a fee consultant retained by the Fund’s Independent Trustees (the “Fee Consultant”). Based on its evaluation of the information provided, the Contract Committee presented its findings and recommendations to the Board. The Board then reviewed the Contract Committee’s findings and recommendations.
– The Board also received extensive information throughout the year regarding performance of the Fund.
– The Independent Trustees regularly met privately with counsel to discuss contract review and other matters. In addition, the Independent Trustees were advised by the Fee Consultant in the course of their review of the Fund’s contractual arrangements and considered a comprehensive report prepared by the Fee Consultant in connection with their deliberations.
– In connection with reviewing the Agreements, the Board also reviewed the terms of the Fund’s Rule 12b-1 plan, distribution agreement, administrative services agreement, transfer agency agreement and other material service agreements.
In connection with the contract review process, the Contract Committee and the Board considered the factors discussed below, among others. The Board also considered that DIMA has managed the Fund since its inception, and the Board believes that a long-term relationship with a capable, conscientious advisor is in the best interests of the Fund. The Board considered, generally, that shareholders chose to invest or remain invested in the Fund knowing that DIMA managed the Fund. DIMA and RREEF are part of Deutsche Bank AG’s (“Deutsche Bank”) Asset Management (“Deutsche AM”) division. Deutsche AM is a global asset management business that offers a wide range of investing expertise and resources, including research capabilities in many countries throughout the world.
As part of the contract review process, the Board carefully considered the fees and expenses of each Deutsche fund overseen by the Board in light of the fund’s performance. In many cases, this led to the negotiation and implementation of expense caps. As part of these negotiations, the Board indicated that it would consider relaxing these caps in future years following sustained improvements in performance, among other considerations.
While shareholders may focus primarily on fund performance and fees, the Fund’s Board considers these and many other factors, including the quality and integrity of DIMA’s and RREEF’s personnel and administrative support services provided by DIMA, such as back-office operations, fund valuations, and compliance policies and procedures.
Nature, Quality and Extent of Services. The Board considered the terms of the Agreements, including the scope of advisory services provided under the Agreements. The Board noted that, under the Agreements, DIMA and RREEF provide portfolio management services to the Fund and that, pursuant to a separate administrative services agreement, DIMA provides administrative services to the Fund. The Board considered the experience and skills of senior management and investment personnel and the resources made available to such personnel. Throughout the course of the year, the Board also received information regarding DIMA’s oversight of fund sub-advisers, including RREEF. The Board reviewed the Fund’s performance over short-term and long-term periods and compared those returns to various agreed-upon performance measures, including market index(es) and a peer universe compiled using information supplied by Morningstar Direct (“Morningstar”), an independent fund data service. The Board also noted that it has
| | | | | | |
| | 20 | | | | | | Deutsche Variable Series II — Deutsche Alternative Asset Allocation VIP |
put into place a process of identifying “Funds in Review” (e.g., funds performing poorly relative to a peer universe), and receives additional reporting from DIMA regarding such funds and, where appropriate, DIMA’s plans to address underperformance. The Board believes this process is an effective manner of identifying and addressing underperforming funds. Based on the information provided, the Board noted that, for the one-, three- and five-year periods ended December 31, 2016, the Fund’s performance (Class A shares) was in the 1st quartile, 2nd quartile and 1st quartile, respectively, of the applicable Morningstar universe (the 1st quartile being the best performers and the 4th quartile being the worst performers). The Board also observed that the Fund has underperformed its benchmark in the one-, three- and five-year periods ended December 31, 2016.
Fees and Expenses. The Board considered the Fund’s investment management fee schedule, sub-advisory fee schedule, operating expenses and total expense ratios, and comparative information provided by Broadridge Financial Solutions, Inc. (“Broadridge”) and the Fee Consultant regarding investment management fee rates paid to other investment advisors by similar funds (1st quartile being the most favorable and 4th quartile being the least favorable). With respect to management fees paid to other investment advisors by similar funds, the Board noted that the contractual fee rates paid by the Fund, which include a 0.10% fee paid to DIMA under the Fund’s administrative services agreement, were higher than the median (3rd quartile) of the applicable Broadridge peer group (based on Broadridge data provided as of December 31, 2016). The Board noted that, since inception, DIMA has waived voluntarily a portion (0.15%) of the Fund’s management fee. With respect to any sub-advisory fee paid to RREEF, the Board noted that the fee is paid by DIMA out of its fee and not directly by the Fund. The Board noted the Fund’s total (net) operating expenses and noted that the expense limitations agreed to by DIMA were expected to help the Fund’s total (net) operating expenses remain competitive. The Board considered the Fund’s management fee rate as compared to fees charged by DIMA to comparable Deutsche U.S. registered funds (“Deutsche Funds”) and considered differences between the Fund and the comparable Deutsche Funds. The information requested by the Board as part of its review of fees and expenses also included information about institutional accounts (including any sub-advised funds and accounts) and funds offered primarily to European investors (“Deutsche Europe funds”) managed by Deutsche AM. The Board noted that DIMA indicated that Deutsche AM does not manage any institutional accounts or Deutsche Europe funds comparable to the Fund.
On the basis of the information provided, the Board concluded that management fees were reasonable and appropriate in light of the nature, quality and extent of services provided by DIMA and RREEF.
Profitability. The Board reviewed detailed information regarding revenues received by DIMA from advising the Deutsche Funds along with the estimated costs to DIMA, and pre-tax profits realized by DIMA, from advising the Deutsche Funds. The Board also received information regarding the estimated enterprise-wide profitability of DIMA and its affiliates with respect to all fund services in totality. The Board did not receive profitability information with respect to the Fund, but did receive such information with respect to the funds in which the Fund invests. The Board also reviewed certain publicly available information regarding the profitability of certain similar investment management firms. The Board noted that, while information regarding the profitability of such firms is limited (and in some cases is not necessarily prepared on a comparable basis), DIMA and its affiliates’ overall profitability with respect to the Deutsche Funds (after taking into account distribution and other services provided to the funds by DIMA and its affiliates) was lower than the overall profitability levels of most comparable firms for which such data was available.
Economies of Scale. The Board considered whether there are economies of scale with respect to the management of the Fund and whether the Fund benefits from any economies of scale. In this regard, the Board observed that while the Fund’s current investment management fee schedule does not include breakpoints, the Fund’s fee schedule represents an appropriate sharing between the Fund and DIMA of such economies of scale as may exist in the management of the Fund at current asset levels.
Other Benefits to DIMA and Its Affiliates. The Board also considered the character and amount of other incidental benefits received by DIMA and its affiliates, including any fees received by DIMA for administrative services provided to the Fund, any fees received by an affiliate of DIMA for transfer agency services provided to the Fund and any fees received by an affiliate of DIMA for distribution services. The Board also considered benefits to DIMA related to brokerage and soft-dollar allocations, including allocating brokerage to pay for research generated by parties other than the executing broker dealers, which pertain primarily to funds investing in equity securities. In addition, the Board considered the incidental public relations benefits to DIMA related to Deutsche Funds advertising and cross-selling opportunities among DIMA products and services. The Board considered these benefits in reaching its conclusion that the Fund’s management fees were reasonable.
| | | | |
Deutsche Variable Series II — Deutsche Alternative Asset Allocation VIP | | | | | 21 |
Compliance. The Board considered the significant attention and resources dedicated by DIMA to documenting and enhancing its compliance processes in recent years. The Board noted in particular (i) the experience, seniority and time commitment of the individuals serving as DIMA’s and the Fund’s chief compliance officers; (ii) the large number of DIMA compliance personnel; and (iii) the substantial commitment of resources by DIMA and its affiliates to compliance matters.
Based on all of the information considered and the conclusions reached, the Board unanimously determined that the continuation of the Agreements is in the best interests of the Fund. In making this determination, the Board did not give particular weight to any single factor identified above. The Board considered these factors over the course of numerous meetings, certain of which were in executive session with only the Independent Trustees and counsel present. It is possible that individual Independent Trustees may have weighed these factors differently in reaching their individual decisions to approve the continuation of the Agreements.
| | | | | | |
| | 22 | | | | | | Deutsche Variable Series II — Deutsche Alternative Asset Allocation VIP |
Board Members and Officers
The following table presents certain information regarding the Board Members and Officers of the Fund. Each Board Member’s year of birth is set forth in parentheses after his or her name. Unless otherwise noted, (i) each Board Member has engaged in the principal occupation(s) noted in the table for at least the most recent five years, although not necessarily in the same capacity; and (ii) the address of each Independent Board Member is c/o Keith R. Fox, Deutsche Funds Board Chair, c/o Thomas R. Hiller, Ropes & Gray LLP, Prudential Tower, 800 Boylston Street, Boston, MA 02199-3600. Except as otherwise noted below, the term of office for each Board Member is until the election and qualification of a successor, or until such Board Member sooner dies, resigns, is removed or as otherwise provided in the governing documents of the Fund. Because the Fund does not hold an annual meeting of shareholders, each Board Member will hold office for an indeterminate period. The Board Members may also serve in similar capacities with other funds in the fund complex.
| | | | | | | | |
| Independent Board Members | | | | | | | |
Name, Year of Birth,
Position with the Fund and
Length of Time Served1 | | Business Experience and Directorships During the Past Five Years | | Number of
Funds in
Deutsche
Fund
Complex
Overseen | | | Other
Directorships
Held by Board
Member |
Keith R. Fox, CFA (1954) Chairperson since 2017, and Board Member since 1996 | | Managing General Partner, Exeter Capital Partners (a series of private investment funds) (since 1986). Directorships: Progressive International Corporation (kitchen goods importer and distributor); The Kennel Shop (retailer); former Chairman, National Association of Small Business Investment Companies; former Directorships: BoxTop Media Inc. (advertising); Sun Capital Advisers Trust (mutual funds) (2011–2012) | | | 89 | | | — |
Kenneth C. Froewiss (1945) Vice Chairperson since 2017, and Board Member since 2001 | | Retired Clinical Professor of Finance, NYU Stern School of Business (1997–2014); Member, Finance Committee, Association for Asian Studies (2002–present); Director, Mitsui Sumitomo Insurance Group (US) (2004–present); prior thereto, Managing Director, J.P. Morgan (investment banking firm) (until 1996) | | | 92 | | | — |
John W. Ballantine (1946) Board Member since 1999 | | Retired; formerly, Executive Vice President and Chief Risk Management Officer, First Chicago NBD Corporation/The First National Bank of Chicago (1996–1998); Executive Vice President and Head of International Banking (1995–1996); former Directorships: Director and former Chairman of the Board, Healthways, Inc.2 (population well-being and wellness services) (2003–2014); Stockwell Capital Investments PLC (private equity); Enron Corporation; FNB Corporation; Tokheim Corporation; First Oak Brook Bancshares, Inc. and Oak Brook Bank; Prisma Energy International. Not-for-Profit Director, Trustee: Palm Beach Civic Association; Public Radio International; Window to the World Communications (public media); Harris Theater for Music and Dance (Chicago) | | | 89 | | | Portland
General
Electric2
(utility
company)
(2003–
present) |
Henry P. Becton, Jr. (1943) Board Member since 1990 | | Vice Chair and former President, WGBH Educational Foundation. Directorships: Public Radio International; Public Radio Exchange (PRX); The Pew Charitable Trusts (charitable organization); former Directorships: Becton Dickinson and Company2 (medical technology company); Belo Corporation2 (media company); The PBS Foundation; Association of Public Television Stations; Boston Museum of Science; American Public Television; Concord Academy; New England Aquarium; Mass. Corporation for Educational Telecommunications; Committee for Economic Development; Public Broadcasting Service; Connecticut College; North Bennett Street School (Boston) | | | 89 | | | — |
Dawn-Marie Driscoll (1946) Board Member since 1987 | | Emeritus Executive Fellow, Center for Business Ethics, Bentley University; formerly: President, Driscoll Associates (consulting firm); Partner, Palmer & Dodge (law firm) (1988–1990); Vice President of Corporate Affairs and General Counsel, Filene’s (retail) (1978–1988). Directorships: Advisory Board, Center for Business Ethics, Bentley University; Trustee and former Chairman of the Board, Southwest Florida Community Foundation (charitable organization); former Directorships: ICI Mutual Insurance Company (2007–2015); Sun Capital Advisers Trust (mutual funds) (2007–2012), Investment Company Institute (audit, executive, nominating committees) and Independent Directors Council (governance, executive committees) | | | 89 | | | — |
| | | | |
Deutsche Variable Series II — Deutsche Alternative Asset Allocation VIP | | | | | 23 |
| | | | | | | | |
Name, Year of Birth,
Position with the Fund and
Length of Time Served1 | | Business Experience and Directorships During the Past Five Years | | Number of
Funds in
Deutsche
Fund
Complex
Overseen | | | Other
Directorships
Held by Board
Member |
Paul K. Freeman (1950) Board Member since 1993 | | Consultant, World Bank/Inter-American Development Bank; Independent Directors Council (former chair); Investment Company Institute (executive and nominating committees); formerly: Chairman of Education Committee of Independent Directors Council; Project Leader, International Institute for Applied Systems Analysis (1998–2001); Chief Executive Officer, The Eric Group, Inc. (environmental insurance) (1986–1998); Directorships: Denver Zoo Foundation (December 2012–present); Knoebel Institute for Healthy Aging, University of Denver (2017–present); former Directorships: Prisma Energy International | | | 89 | | | — |
Richard J. Herring (1946) Board Member since 1990 | | Jacob Safra Professor of International Banking and Professor, Finance Department, The Wharton School, University of Pennsylvania (since July 1972); Co-Director, Wharton Financial Institutions Center; formerly: Vice Dean and Director, Wharton Undergraduate Division (July 1995–June 2000); Director, Lauder Institute of International Management Studies (July 2000–June 2006) | | | 89 | | | Director,
Aberdeen
Singapore
and Japan
Funds (since
2007);
Independent
Director of
Barclays
Bank
Delaware
(since
September
2010) |
William McClayton (1944) Board Member since 2004 | | Private equity investor (since October 2009); previously, Managing Director, Diamond Management & Technology Consultants, Inc. (global consulting firm) (2001–2009); Directorship: Board of Managers, YMCA of Metropolitan Chicago; formerly: Senior Partner, Arthur Andersen LLP (accounting) (1966–2001); Trustee, Ravinia Festival | | | 89 | | | — |
Rebecca W. Rimel (1951) Board Member since 1995 | | President, Chief Executive Officer and Director, The Pew Charitable Trusts (charitable organization) (1994–present); formerly: Executive Vice President, The Glenmede Trust Company (investment trust and wealth management) (1983–2004); Board Member, Investor Education (charitable organization) (2004–2005); Trustee, Executive Committee, Philadelphia Chamber of Commerce (2001–2007); Director, Viasys Health Care2 (January 2007–June 2007); Trustee, Thomas Jefferson Foundation (charitable organization) (1994–2012) | | | 89 | | | Director,
Becton
Dickinson
and
Company2
(medical
technology
company)
(2012–
present);
Director,
BioTelemetry
Inc2 (health
care) (2009–
present) |
William N. Searcy, Jr. (1946) Board Member since 1993 | | Private investor since October 2003; formerly: Pension & Savings Trust Officer, Sprint Corporation2 (telecommunications) (November 1989–September 2003); Trustee, Sun Capital Advisers Trust (mutual funds) (1998–2012) | | | 89 | | | — |
Jean Gleason Stromberg (1943) Board Member since 1997 | | Retired. Formerly, Consultant (1997–2001); Director, Financial Markets U.S. Government Accountability Office (1996–1997); Partner, Norton Rose Fulbright, L.L.P. (law firm) (1978–1996); former Directorships: The William and Flora Hewlett Foundation (charitable organization) (2000–2015); Service Source, Inc. (nonprofit), Mutual Fund Directors Forum (2002–2004), American Bar Retirement Association (funding vehicle for retirement plans) (1987–1990 and 1994–1996) | | | 89 | | | — |
| | | | | | |
| | 24 | | | | | | Deutsche Variable Series II — Deutsche Alternative Asset Allocation VIP |
| | |
| Officers4 | | |
Name, Year of Birth,
Position with the Fund and
Length of Time Served5 | | Business Experience and Directorships During the Past Five Years |
Hepsen Uzcan6,9 (1974) President and Chief Executive Officer, 2017–present Assistant Secretary, 2013–present | | Director,3 Deutsche Asset Management; formerly: Vice President for the Deutsche funds (2016–2017) |
John Millette8 (1962) Vice President and Secretary, 1999–present | | Director,3 Deutsche Asset Management; Chief Legal Officer, Deutsche Investment Management Americas Inc. (2015–present); and Director and Vice President, Deutsche AM Trust Company (since 2016); formerly: Secretary, Deutsche Investment Management Americas Inc. (2015–2017) |
Paul H. Schubert6 (1963) Chief Financial Officer, 2004–present Treasurer, 2005–present | | Managing Director,3 Deutsche Asset Management, and Chairman, Director and President, Deutsche AM Trust Company (since 2013); Vice President, Deutsche AM Distributors, Inc. (since 2016); Director, Deutsche AM Service Company (since 2017); Director and President, DB Investment Managers, Inc. (since 2017); formerly: Director, Deutsche AM Trust Company (2004–2013) |
Caroline Pearson8 (1962) Chief Legal Officer, 2010–present | | Managing Director,3 Deutsche Asset Management; formerly: Secretary, Deutsche AM Distributors, Inc.; and Secretary, Deutsche AM Service Company |
Scott D. Hogan8 (1970) Chief Compliance Officer, 2016–present | | Director,3 Deutsche Asset Management |
Wayne Salit7 (1967) Anti-Money Laundering Compliance Officer, 2014–present | | Director,3 Deutsche Asset Management; formerly: Managing Director, AML Compliance Officer at BNY Mellon (2011–2014); and Director, AML Compliance Officer at Deutsche Bank (2004–2011) |
Sheila Cadogan8 (1966) Assistant Treasurer, since July 12, 2017 | | Director,3 Deutsche Asset Management |
Paul Antosca8 (1957) Assistant Treasurer, 2007–present | | Director,3 Deutsche Asset Management |
Diane Kenneally8 (1966) Assistant Treasurer, 2007–present | | Director,3 Deutsche Asset Management |
| 1 | The length of time served represents the year in which the Board Member joined the board of one or more Deutsche funds currently overseen by the Board. |
| 2 | A publicly held company with securities registered pursuant to Section 12 of the Securities Exchange Act of 1934. |
| 3 | Executive title, not a board directorship. |
| 4 | As a result of their respective positions held with the Advisor, these individuals are considered “interested persons” of the Advisor within the meaning of the 1940 Act. Interested persons receive no compensation from the Fund. |
| 5 | The length of time served represents the year in which the officer was first elected in such capacity for one or more Deutsche funds. |
| 6 | Address: 345 Park Avenue, New York, NY 10154. |
| 7 | Address: 60 Wall Street, New York, NY 10005. |
| 8 | Address: One International Place, Boston, MA 02110. |
| 9 | Appointed President and Chief Executive Officer effective December 1, 2017. |
The Fund’s Statement of Additional Information (“SAI”) includes additional information about the Board Members. The SAI is available, without charge, upon request. If you would like to request a copy of the SAI, you may do so by calling the following toll-free number: (800) 728-3337.
| | | | |
Deutsche Variable Series II — Deutsche Alternative Asset Allocation VIP | | | | | 25 |
| | |
 | | |
VS2AAA-2 (R-025824-7 2/18) | | |

December 31, 2017
Annual Report
Deutsche Variable Series II
Deutsche CROCI® U.S. VIP

Contents
This report must be preceded or accompanied by a prospectus. To obtain an additional prospectus or summary prospectus, if available, call (800) 728-3337 or your financial representative. We advise you to consider the Fund’s objectives, risks, charges and expenses carefully before investing. The summary prospectus and prospectus contain this and other important information about the Fund. Please read the prospectus carefully before you invest.
The fund will be managed using the CROCI® Investment Process which is based on portfolio management’s belief that, over time, stocks which display more favorable financial metrics (for example, the CROCI® Economic P/E Ratio) as generated by this process may outperform stocks which display less favorable metrics. This premise may not prove to be correct and prospective investors should evaluate this assumption prior to investing in the fund. Stocks may decline in value. The fund may lend securities to approved institutions. Please read the prospectus for details.
Deutsche Asset Management represents the asset management activities conducted by Deutsche Bank AG or any of its subsidiaries.
Deutsche AM Distributors, Inc., 222 South Riverside Plaza, Chicago, IL 60606, (800) 621-1148
NOT FDIC/NCUA INSURED NO BANK GUARANTEE MAY LOSE VALUE NOT A DEPOSIT NOT INSURED BY ANY FEDERAL GOVERNMENT AGENCY
| | | | | | |
| | 2 | | | | | | Deutsche Variable Series II — Deutsche CROCI® U.S. VIP |
| | |
| Performance Summary | | December 31, 2017 (Unaudited) |
Fund performance shown is historical, assumes reinvestment of all dividend and capital gain distributions and does not guarantee future results. Investment return and principal value fluctuate with changing market conditions so that, when redeemed, shares may be worth more or less than their original cost. Current performance may be lower or higher than the performance data quoted. Please contact your participating insurance company for the Fund’s most recent month-end performance. Performance doesn’t reflect charges and fees (“contract charges”) associated with the separate account that invests in the Fund or any variable life insurance policy or variable annuity contract for which the Fund is an investment option. These charges and fees will reduce returns. While all share classes have the same underlying portfolio, their performance will differ.
The gross expense ratios of the Fund, as stated in the fee table of the prospectus dated May 1, 2017 are 0.81% and 1.13% for Class A and Class B shares, respectively, and may differ from the expense ratios disclosed in the Financial Highlights tables in this report.
Generally accepted accounting principles require adjustments to be made to the net assets of the Fund at period end for financial reporting purposes only, and as such, the total return based on the unadjusted net asset value per share may differ from the total return reported in the financial highlights.
Growth of an Assumed $10,000 Investment in Deutsche CROCI® U.S. VIP
| | |
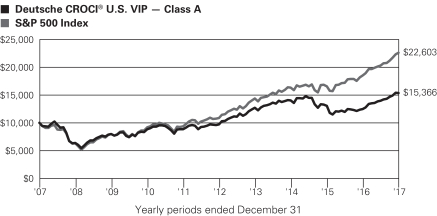 | | The Standard & Poor’s 500 Index (S&P 500) is an unmanaged, capitalization-weighted index of 500 stocks. The index is designed to measure performance of the broad domestic economy through changes in the aggregate market value of 500 stocks representing all major industries. Index returns do not reflect any fees or expenses and it is not possible to invest directly into an index. Prior to October 3, 2016, the Fund had a team that operated with a different investment strategy. Performance would have been different if the Fund’s current strategy had been in effect. |
| | | | | | | | | | |
| Comparative Results | | | | | | | | | | |
| | | | | |
| Deutsche CROCI® U.S. VIP | | | | 1-Year | | 3-Year | | 5-Year | | 10-Year |
| Class A | | Growth of $10,000 | | $12,288 | | $10,942 | | $15,857 | | $15,366 |
| | | Average annual total return | | 22.88% | | 3.05% | | 9.66% | | 4.39% |
| S&P 500® Index | | Growth of $10,000 | | $12,183 | | $13,829 | | $20,814 | | $22,603 |
| | | Average annual total return | | 21.83% | | 11.41% | | 15.79% | | 8.50% |
| | | | | |
| Deutsche CROCI® U.S. VIP | | | | 1-Year | | 3-Year | | 5-Year | | 10-Year |
| Class B | | Growth of $10,000 | | $12,245 | | $10,842 | | $15,619 | | $14,892 |
| | | Average annual total return | | 22.45% | | 2.73% | | 9.33% | | 4.06% |
| S&P 500® Index | | Growth of $10,000 | | $12,183 | | $13,829 | | $20,814 | | $22,603 |
| | Average annual total return | | 21.83% | | 11.41% | | 15.79% | | 8.50% |
The growth of $10,000 is cumulative.
| | | | |
Deutsche Variable Series II — Deutsche CROCI® U.S. VIP | | | | | 3 |
| | |
| Management Summary | | December 31, 2017 (Unaudited) |
The Fund returned 22.88% (Class A shares, unadjusted for contract charges) in 2017, outpacing the 21.83% return for its benchmark, the S&P 500 Index. Effective May 1, 2017, the fund’s name changed from Deutsche Large Cap Value VIP to Deutsche CROCI® U.S. VIP.
U.S. equities produced unusually positive performance in the past year, with steady gains, low volatility and a remarkable lack of any significant sell-offs. This favorable backdrop was especially supportive for the growth style, but value stocks — though experiencing healthy, double-digit returns — trailed the overall market. While the underperformance of value stocks would ordinarily be expected to act as a headwind to the Fund due to the nature of our approach, we overcame this obstacle and posted competitive results relative to the S&P 500 Index. We believe a key reason for this positive outcome is that even though value as a whole lagged, many of the stocks identified by the CROCI® process in fact performed quite well.
We generated the widest margin of outperformance in the consumer staples sector, where the leading contributor was our overweight position in Wal-Mart Stores, Inc.* The stock registered market-beating returns despite the challenging environment for retailers, as investors gained confidence that the company could compete effectively with Amazon.com.* Kimberly-Clark Corp. and Estee Lauder Companies, Inc.* also contributed to our strong showing in the sector. Outside of consumer staples, the largest contribution came from a position in the homebuilder D.R. Horton, Inc.,* which produced returns well above the index behind rising housing prices and growing investor optimism regarding the industry outlook. Positions in the semiconductor stocks Lam Research Corp.,* KLA-Tencor Corp.,* Intel Corp.* also rallied amid an upturn in end-market demand.
Our security selection in utilities detracted from performance, due largely to the negative returns for our positions in PPL Corp. and Edison International. The financial sector was a further area of weakness for the Fund, primarily as a result of our position in U.S. Bancorp. Certain media stocks, including Discovery Communications, Inc. and Time Warner, Inc., were additional detractors of note. The retailer Target Corp.* — which suffered from a combination of weaker sales and rising costs — was our most notable individual detractor despite the stock’s recovery in the second half of the year.
Sector allocations, while a residual effect of our bottom-up stock selection process, nonetheless contributed to the Fund’s results in 2017. We gained a sizable advantage from having a zero-weighting in energy stocks, the only one of the 11 major sectors to post a negative return on the year. However, the benefit was offset to some extent by our overweight in the underperforming utilities sector. Although this aspect of our positioning was a detractor in the short term, we continue to find the sector home to a high representation of the undervalued stocks we seek. As of May 1, 2017, the fund’s strategy broadened to include companies in the financial sector.
The fundamental picture for the stock market improved considerably in 2017, highlighted by stronger economic growth and rising corporate earnings. These developments were accompanied by higher valuations, however, indicating that investors need to be selective in order to find the most compelling opportunities at the individual stock level. We think the Fund, by virtue of its emphasis on “real value,” is positioned to identify companies with the potential to outperform in a variety of market conditions. As of December 31, 2017, the Fund had a price-to-earnings ratio of 15.3 based on one-year forward earnings estimates, versus 19.0 for the S&P 500 Index. The portfolio also compared favorably to the benchmark in terms of its fundamentals, illustrated by its higher return on equity (22.11% vs. 19.2%). We believe the intrinsic value in the portfolio helps provide the Fund with a firm foundation for performance in the event that broader-market returns begin to slow from their unusually strong pace of the past year.
Di Kumble, CFA, Managing Director
John Moody, Vice President
Portfolio Managers
The views expressed reflect those of the portfolio management team only through the end of the period of the report as stated on the cover. The management team’s views are subject to change at any time based on market and other conditions and should not be construed as a recommendation. Past performance is no guarantee of future results. Current and future portfolio holdings are subject to risk.
| | | | | | |
| | 4 | | | | | | Deutsche Variable Series II — Deutsche CROCI® U.S. VIP |
Terms to Know
The Standard & Poor’s 500 (S&P 500) Index is an unmanaged, capitalization-weighted index of 500 stocks. The index is designed to measure performance of the broad domestic economy through changes in the aggregate market value of 500 stocks representing all major industries. Index returns do not reflect fees or expenses and it is not possible to invest directly into an index.
Cash Return On Capital Invested (CROCI®), an investment process based on a proprietary valuation technique, attempts to understand the real value of a company by converting financial-statement data into a set of economic inputs that are used to calculate a valuation metric called “Economic P/E ratio,” which is comparable across markets, sectors and stocks. Economic value as calculated by the CROCI® process via the adjustments to and normalizations of reported financial statements, conducted by CROCI’s team of company analysts. The management teams believes this process helps identify companies’ “real value.”
Contribution and detraction incorporate both a stock’s total return and its weighting in the index.
Overweight means the fund holds a higher weighting in a given sector or security than the benchmark. Underweight means the fund holds a lower weighting.
Price-to-earnings ratio (P/E) ratio (or accounting P/E ratio) compares a company’s current share price to its per-share earnings. The CROCI economic P/E ratio is a measure of valuation that incorporates all of the assets and liabilities of a company which are adjusted systematically by the CROCI team.
Return on equity is the amount of net income returned as a percentage of shareholders’ equity.
| * | Not held in the portfolio as of December 31, 2017 |
| | | | |
Deutsche Variable Series II — Deutsche CROCI® U.S. VIP | | | | | 5 |
| | |
| Portfolio Summary | | (Unaudited) |
| | | | | | | | |
| Asset Allocation (As a % of Investment Portfolio excluding Securities Lending Collateral) | | 12/31/17 | | | 12/31/16 | |
| Common Stocks | | | 99% | | | | 99% | |
| Cash Equivalents | | | 1% | | | | 1% | |
| | | | 100% | | | | 100% | |
| | |
Sector Diversification (As a % of Investment Portfolio excluding Cash Equivalents and Securities Lending Collateral) | | 12/31/17 | | | 12/31/16 | |
| Financials | | | 18% | | | | — | |
| Consumer Discretionary | | | 15% | | | | 15% | |
| Industrials | | | 15% | | | | 12% | |
| Health Care | | | 15% | | | | 17% | |
| Utilities | | | 14% | | | | 21% | |
| Consumer Staples | | | 10% | | | | 17% | |
| Information Technology | | | 8% | | | | 12% | |
| Materials | | | 5% | | | | 3% | |
| Telecommunication Services | | | — | | | | 3% | |
| | | | 100% | | | | 100% | |
Portfolio holdings and characteristics are subject to change.
For more complete details about the Fund’s investment portfolio, see page 7.
Following the Fund’s fiscal first and third quarter-end, a complete portfolio holdings listing is filed with the SEC on Form N-Q. The form will be available on the SEC’s Web site at sec.gov, and it also may be reviewed and copied at the SEC’s Public Reference Room in Washington, D.C. Information on the operation of the SEC’s Public Reference Room may be obtained by calling (800) SEC-0330. The Fund’s portfolio holdings are also posted on deutschefunds.com from time to time. Please see the Fund’s current prospectus for more information.
| | | | | | |
| | 6 | | | | | | Deutsche Variable Series II — Deutsche CROCI® U.S. VIP |
| | |
| Investment Portfolio | | December 31, 2017 |
| | | | | | | | |
| | | Shares | | | Value ($) | |
| Common Stocks 99.2% | | | | | | | | |
| Consumer Discretionary 15.2% | | | | | |
Automobiles 2.2% | | | | | | | | |
General Motors Co. | | | 85,197 | | | | 3,492,225 | |
| | |
Household Durables 2.3% | | | | | | | | |
Garmin Ltd. | | | 61,385 | | | | 3,656,704 | |
| | |
Media 10.7% | | | | | | | | |
CBS Corp. “B” | | | 66,530 | | | | 3,925,270 | |
Discovery Communications,
Inc. “A”* (a) | | | 217,475 | | | | 4,867,091 | |
Time Warner, Inc. | | | 42,809 | | | | 3,915,739 | |
Walt Disney Co. | | | 36,702 | | | | 3,945,832 | |
| | | | | | | | |
| | | | | | | 16,653,932 | |
| | |
| Consumer Staples 10.0% | | | | | | | | |
Beverages 4.9% | | | | | | | | |
Coca-Cola Co. | | | 83,049 | | | | 3,810,288 | |
PepsiCo, Inc. | | | 32,782 | | | | 3,931,218 | |
| | | | | | | | |
| | | | | | | 7,741,506 | |
| | |
Household Products 5.1% | | | | | | | | |
Kimberly-Clark Corp. | | | 32,947 | | | | 3,975,385 | |
Procter & Gamble Co. | | | 42,893 | | | | 3,941,009 | |
| | | | | | | | |
| | | | | | | 7,916,394 | |
| | |
| Financials 18.2% | | | | | | | | |
Banks 10.4% | | | | | | | | |
Citigroup, Inc. | | | 52,991 | | | | 3,943,061 | |
JPMorgan Chase & Co. | | | 38,655 | | | | 4,133,766 | |
U.S. Bancorp. | | | 73,078 | | | | 3,915,519 | |
Wells Fargo & Co. | | | 70,090 | | | | 4,252,360 | |
| | | | | | | | |
| | | | | | | 16,244,706 | |
| | |
Capital Markets 2.5% | | | | | | | | |
Bank of New York Mellon Corp. | | | 72,050 | | | | 3,880,613 | |
| | |
Consumer Finance 5.3% | | | | | | | | |
American Express Co. | | | 40,203 | | | | 3,992,560 | |
Capital One Financial Corp. | | | 43,178 | | | | 4,299,665 | |
| | | | | | | | |
| | | | | | | 8,292,225 | |
| | |
| Health Care 14.8% | | | | | | | | |
Biotechnology 7.4% | | | | | | | | |
Amgen, Inc. | | | 22,368 | | | | 3,889,796 | |
Biogen, Inc.* | | | 12,095 | | | | 3,853,104 | |
Gilead Sciences, Inc. | | | 52,547 | | | | 3,764,467 | |
| | | | | | | | |
| | | | | | | 11,507,367 | |
| | |
Pharmaceuticals 7.4% | | | | | | | | |
Johnson & Johnson | | | 27,405 | | | | 3,829,027 | |
Merck & Co., Inc. | | | 69,986 | | | | 3,938,112 | |
Pfizer, Inc. | | | 107,061 | | | | 3,877,749 | |
| | | | | | | | |
| | | | | | | 11,644,888 | |
| | |
| Industrials 15.2% | | | | | | | | |
Aerospace & Defense 7.6% | | | | | | | | |
Lockheed Martin Corp. | | | 12,154 | | | | 3,902,042 | |
Raytheon Co. | | | 20,592 | | | | 3,868,207 | |
United Technologies Corp. | | | 32,431 | | | | 4,137,223 | |
| | | | | | | | |
| | | | | | | 11,907,472 | |
| | | | | | | | |
| | | Shares | | | Value ($) | |
| | |
Electrical Equipment 2.5% | | | | | | | | |
Eaton Corp. PLC | | | 50,077 | | | | 3,956,584 | |
| | |
Industrial Conglomerates 2.5% | | | | | | | | |
Honeywell International, Inc. | | | 25,615 | | | | 3,928,316 | |
| | |
Machinery 2.6% | | | | | | | | |
Illinois Tool Works, Inc. | | | 23,972 | | | | 3,999,728 | |
| |
| Information Technology 7.5% | | | | | |
Communications Equipment 2.6% | | | | | |
Cisco Systems, Inc. | | | 103,860 | | | | 3,977,838 | |
| | |
IT Services 4.9% | | | | | | | | |
Amdocs Ltd. | | | 59,058 | | | | 3,867,118 | |
International Business Machines Corp. | | | 25,088 | | | | 3,849,001 | |
| | | | | | | | |
| | | | | | | 7,716,119 | |
| | |
| Materials 5.0% | | | | | | | | |
Chemicals | | | | | | | | |
LyondellBasell Industries NV “A” | | | 36,486 | | | | 4,025,135 | |
Monsanto Co. | | | 32,005 | | | | 3,737,544 | |
| | | | | | | | |
| | | | | | | 7,762,679 | |
| | |
| Utilities 13.3% | | | | | | | | |
Electric Utilities 8.8% | | | | | | | | |
American Electric Power Co., Inc. | | | 49,687 | | | | 3,655,472 | |
Edison International | | | 46,908 | | | | 2,966,462 | |
NextEra Energy, Inc. | | | 24,305 | | | | 3,796,198 | |
PPL Corp. | | | 105,217 | | | | 3,256,466 | |
| | | | | | | | |
| | | | | | | 13,674,598 | |
| | |
Multi-Utilities 4.5% | | | | | | | | |
DTE Energy Co. | | | 33,722 | | | | 3,691,210 | |
Sempra Energy | | | 31,780 | | | | 3,397,918 | |
| | | | | | | | |
| | | | | | | | 7,089,128 | |
Total Common Stocks (Cost $142,979,705) | | | | 155,043,022 | |
| |
| Securities Lending Collateral 3.2% | | | | | |
Deutsche Government & Agency Securities Portfolio “Deutsche Government Cash Institutional Shares”, 1.21% (b) (c) (Cost $4,968,641) | | | 4,968,641 | | | | 4,968,641 | |
| | |
| Cash Equivalents 0.9% | | | | | | | | |
Deutsche Central Cash Management Government Fund, 1.30% (b) (Cost $1,372,351) | | | 1,372,351 | | | | 1,372,351 | |
| | |
| | | % of Net
Assets | | | Value ($) | |
Total Investment Portfolio (Cost $149,320,697) | | | 103.3 | | | | 161,384,014 | |
| Other Assets and Liabilities, Net | | | (3.3 | ) | | | (5,098,730 | ) |
| Net Assets | | | 100.0 | | | | 156,285,284 | |
The accompanying notes are an integral part of the financial statements.
| | | | |
Deutsche Variable Series II — Deutsche CROCI® U.S. VIP | | | | | 7 |
| * | Non-income producing security. |
| (a) | All or a portion of these securities were on loan. In addition, “Other Assets and Liabilities, Net” may include pending sales that are also on loan. The value of securities loaned at December 31, 2017 amounted to $4,782,718, which is 3.1% of net assets. |
| (b) | Affiliated fund managed by Deutsche Investment Management Americas Inc. The rate shown is the annualized seven-day yield at period end. |
| (c) | Represents collateral held in connection with securities lending. Income earned by the Fund is net of borrower rebates. |
Fair Value Measurements
Various inputs are used in determining the value of the Fund’s investments. These inputs are summarized in three broad levels. Level 1 includes quoted prices in active markets for identical securities. Level 2 includes other significant observable inputs (including quoted prices for similar securities, interest rates, prepayment speeds and credit risk). Level 3 includes significant unobservable inputs (including the Fund’s own assumptions in determining the fair value of investments). The level assigned to the securities valuations may not be an indication of the risk or liquidity associated with investing in those securities.
The following is a summary of the inputs used as of December 31, 2017 in valuing the Fund’s investments. For information on the Fund’s policy regarding the valuation of investments, please refer to the Security Valuation section of Note A in the accompanying Notes to Financial Statements.
| | | | | | | | | | | | | | | | |
| Assets | | Level 1 | | | Level 2 | | | Level 3 | | | Total | |
| Common Stocks (d) | | $ | 155,043,022 | | | $ | — | | | $ | — | | | $ | 155,043,022 | |
| Short-Term Investment (d) | | | 6,340,992 | | | | — | | | | — | | | | 6,340,992 | |
| Total | | $ | 161,384,014 | | | $ | — | | | $ | — | | | $ | 161,384,014 | |
There have been no transfers between fair value measurement levels during the year ended December 31, 2017.
| (d) | See Investment Portfolio for additional detailed categorizations. |
The accompanying notes are an integral part of the financial statements.
| | | | | | |
| | 8 | | | | | | Deutsche Variable Series II — Deutsche CROCI® U.S. VIP |
Statement of Assets and Liabilities
| | | | |
| |
| Assets | | | | |
| Investments in non-affiliated securities, at value (cost $142,979,705) — including $4,782,718 of securities loaned | | $ | 155,043,022 | |
| Investment in Deutsche Government & Agency Securities Portfolio (cost $4,968,641)* | | | 4,968,641 | |
| Investment in Deutsche Central Cash Management Government Fund (cost $1,372,351) | | | 1,372,351 | |
| Cash | | | 10,000 | |
| Dividends receivable | | | 318,408 | |
| Interest receivable | | | 2,097 | |
| Other assets | | | 3,911 | |
| Total assets | | | 161,718,430 | |
| |
| Liabilities | | | | |
| Payable upon return of securities loaned | | | 4,968,641 | |
| Payable for Fund shares redeemed | | | 279,976 | |
| Accrued management fee | | | 72,501 | |
| Accrued Trustees’ fees | | | 3,453 | |
| Other accrued expenses and payables | | | 108,575 | |
| Total liabilities | | | 5,433,146 | |
| Net assets, at value | | $ | 156,285,284 | |
| |
| Net Assets Consist of | | | | |
| Undistributed net investment income | | | 3,682,681 | |
| Net unrealized appreciation (depreciation) on investments | | | 12,063,317 | |
| Accumulated net realized gain (loss) | | | 9,589,585 | |
| Paid-in capital | | | 130,949,701 | |
| Net assets, at value | | $ | 156,285,284 | |
| |
| Net Asset Value | | | | |
Class A | | | | |
| Net Asset Value and redemption price per share ($152,776,814 ÷ 9,181,648 shares of capital stock outstanding, no par value, unlimited shares authorized) | | $ | 16.64 | |
Class B | | | | |
| Net Asset Value offering and redemption price per share ($3,508,470 ÷ 210,410 shares of capital stock outstanding, no par value, unlimited shares authorized) | | $ | 16.67 | |
| * | Represents collateral on securities loaned. |
Statement of Operations
| | |
| for the year ended December 31, 2017 |
| | | | |
| |
| Investment Income | | | | |
| Income: | | | | |
| Dividends | | $ | 5,203,037 | |
| Income distributions — Deutsche Central Cash Management Government Fund | | | 14,005 | |
| Securities lending income, net of borrower rebates | | | 3,580 | |
| Total income | | | 5,220,622 | |
| Expenses: | | | | |
| Management fee | | | 1,469,890 | |
| Administration fee | | | 226,137 | |
| Services to Shareholders | | | 4,086 | |
| Record keeping fee (Class B) | | | 2,556 | |
| Distribution service fees (Class B) | | | 8,870 | |
| Custodian fee | | | 6,689 | |
| Professional fees | | | 78,615 | |
| Reports to shareholders | | | 32,480 | |
| Trustees’ fees and expenses | | | 13,177 | |
| Other | | | 15,442 | |
| Total expenses before expense reductions | | | 1,857,942 | |
| Expense reductions | | | (218,494 | ) |
| Total expenses after expense reductions | | | 1,639,448 | |
| Net investment income | | | 3,581,174 | |
| |
| Realized and Unrealized Gain (Loss) | | | | |
| Net realized gain (loss) from: | | | | |
| Investments | | | 32,400,819 | |
| Payments by affiliates (see Note F) | | | 62,466 | |
| | | | 32,463,285 | |
| Change in net unrealized appreciation (depreciation) on investments | | | 10,347,153 | |
| Net gain (loss) | | | 42,810,438 | |
| Net increase (decrease) in net assets resulting from operations | | $ | 46,391,612 | |
The accompanying notes are an integral part of the financial statements.
| | | | |
Deutsche Variable Series II — Deutsche CROCI® U.S. VIP | | | | | 9 |
Statements of Changes in Net Assets
| | | | | | | | |
| | | Years Ended December 31, | |
| Increase (Decrease) in Net Assets | | 2017 | | | 2016 | |
| Operations: | | | | | | | | |
| Net investment income | | $ | 3,581,174 | | | $ | 4,001,244 | |
| Net realized gain (loss) | | | 32,463,285 | | | | (20,531,633 | ) |
| Change in net unrealized appreciation (depreciation) | | | 10,347,153 | | | | 1,399,099 | |
| Net increase (decrease) in net assets resulting from operations | | | 46,391,612 | | | | (15,131,290 | ) |
| Distributions to shareholders from: | | | | | | | | |
| Net investment income: | | | | | | | | |
Class A | | | (3,625,439 | ) | | | (2,434,486 | ) |
Class B | | | (42,548 | ) | | | (25,893 | ) |
| Net realized gains: | | | | | | | | |
Class A | | | — | | | | (12,035,759 | ) |
Class B | | | — | | | | (185,570 | ) |
| Total distributions | | | (3,667,987 | ) | | | (14,681,708 | ) |
| Fund share transactions: | | | | | | | | |
Class A | | | | | | | | |
| Proceeds from shares sold | | | 3,856,097 | | | | 5,510,987 | |
| Reinvestment of distributions | | | 3,625,439 | | | | 14,470,245 | |
| Payments for shares redeemed | | | (124,081,648 | ) | | | (56,264,127 | ) |
| Net increase (decrease) in net assets from Class A share transactions | | | (116,600,112 | ) | | | (36,282,895 | ) |
Class B | | | | | | | | |
| Proceeds from shares sold | | | 97,651 | | | | 525,700 | |
| Reinvestment of distributions | | | 42,548 | | | | 211,463 | |
| Payments for shares redeemed | | | (815,252 | ) | | | (1,258,566 | ) |
| Net increase (decrease) in net assets from Class B share transactions | | | (675,053 | ) | | | (521,403 | ) |
| Increase (decrease) in net assets | | | (74,551,540 | ) | | | (66,617,296 | ) |
| Net assets at beginning of period | | | 230,836,824 | | | | 297,454,120 | |
| Net assets at end of period (including undistributed net investment income of $3,682,681 and $3,845,993, respectively) | | $ | 156,285,284 | | | $ | 230,836,824 | |
| | |
| Other Information | | | | | | | | |
Class A | | | | | | | | |
| Shares outstanding at beginning of period | | | 16,529,732 | | | | 19,157,658 | |
| Shares sold | | | 255,906 | | | | 405,203 | |
| Shares issued to shareholders in reinvestment of distributions | | | 245,460 | | | | 1,079,869 | |
| Shares redeemed | | | (7,849,450 | ) | | | (4,112,998 | ) |
| Net increase (decrease) in Class A shares | | | (7,348,084 | ) | | | (2,627,926 | ) |
| Shares outstanding at end of period | | | 9,181,648 | | | | 16,529,732 | |
Class B | | | | | | | | |
| Shares outstanding at beginning of period | | | 254,820 | | | | 291,996 | |
| Shares sold | | | 6,516 | | | | 38,734 | |
| Shares issued to shareholders in reinvestment of distributions | | | 2,869 | | | | 15,722 | |
| Shares redeemed | | | (53,795 | ) | | | (91,632 | ) |
| Net increase (decrease) in Class B shares | | | (44,410 | ) | | | (37,176 | ) |
| Shares outstanding at end of period | | | 210,410 | | | | 254,820 | |
The accompanying notes are an integral part of the financial statements.
| | | | | | |
| | 10 | | | | | | Deutsche Variable Series II — Deutsche CROCI® U.S. VIP |
Financial Highlights
| | | | | | | | | | | | | | | | | | | | |
| | | | | | Years Ended December 31, | |
| Class A | | 2017 | | | 2016 | | | 2015 | | | 2014 | | | 2013 | |
| | | | | |
| Selected Per Share Data | | | | | | | | | | | | | | | | | | | | |
| Net asset value, beginning of period | | $ | 13.75 | | | $ | 15.29 | | | $ | 17.38 | | | $ | 15.97 | | | $ | 12.45 | |
| Income (loss) from investment operations: | | | | | | | | | | | | | | | | | | | | |
Net investment income (loss)a | | | .24 | | | | .23 | | | | .11 | | | | .24 | | | | .26 | |
Net realized and unrealized gain (loss) | | | 2.88 | | | | (.93 | ) | | | (1.20 | ) | | | 1.45 | | | | 3.54 | |
Total from investment operations | | | 3.12 | | | | (.70 | ) | | | (1.09 | ) | | | 1.69 | | | | 3.80 | |
| Less distributions from: | | | | | | | | | | | | | | | | | | | | |
Net investment income | | | (.23 | ) | | | (.14 | ) | | | (.25 | ) | | | (.28 | ) | | | (.28 | ) |
Net realized gains on investment transactions | | | — | | | | (.70 | ) | | | (.75 | ) | | | — | | | | — | |
Total distributions | | | (.23 | ) | | | (.84 | ) | | | (1.00 | ) | | | (.28 | ) | | | (.28 | ) |
| Net asset value, end of period | | $ | 16.64 | | | $ | 13.75 | | | $ | 15.29 | | | $ | 17.38 | | | $ | 15.97 | |
| Total Return (%)b | | | 22.88 | c | | | (4.39 | ) | | | (6.87 | ) | | | 10.72 | | | | 30.89 | |
| | | | | |
| Ratios to Average Net Assets and Supplemental Data | | | | | | | | | | | | | | | | | | | | |
| Net assets, end of period ($ millions) | | | 153 | | | | 227 | | | | 293 | | | | 430 | | | | 432 | |
| Ratio of expenses before expense reductions (%)d | | | .82 | | | | .81 | | | | .78 | | | | .78 | | | | .78 | |
| Ratio of expenses after expense reductions (%)d | | | .72 | | | | .74 | | | | .73 | | | | .73 | | | | .74 | |
| Ratio of net investment income (loss) (%) | | | 1.59 | | | | 1.66 | | | | .65 | | | | 1.43 | | | | 1.82 | |
| Portfolio turnover rate (%) | | | 97 | | | | 293 | | | | 121 | | | | 133 | | | | 54 | |
| a | Based on average shares outstanding during the period. |
| b | Total return would have been lower had certain expenses not been reduced. |
| c | The Fund’s total return includes a reimbursement by the Adviser for commission costs incurred in connection with purchases and sales of portfolio assets due to the change in investment strategy, which otherwise would have reduced total return by 0.03%. |
| d | Expense ratio does not reflect charges and fees associated with the separate account that invests in the Fund or any variable life insurance policy or variable annuity contract for which the Fund is an investment option. |
| | | | | | | | | | | | | | | | | | | | |
| | | | | | Years Ended December 31, | |
| Class B | | 2017 | | | 2016 | | | 2015 | | | 2014 | | | 2013 | |
| | | | | |
| Selected Per Share Data | | | | | | | | | | | | | | | | | | | | |
| Net asset value, beginning of period | | $ | 13.78 | | | $ | 15.31 | | | $ | 17.40 | | | $ | 15.99 | | | $ | 12.46 | |
| Income (loss) from investment operations: | | | | | | | | | | | | | | | | | | | | |
Net investment income (loss)a | | | .20 | | | | .19 | | | | .06 | | | | .18 | | | | .22 | |
Net realized and unrealized gain (loss) | | | 2.87 | | | | (.92 | ) | | | (1.21 | ) | | | 1.46 | | | | 3.55 | |
Total from investment operations | | | 3.07 | | | | (.73 | ) | | | (1.15 | ) | | | 1.64 | | | | 3.77 | |
| Less distributions from: | | | | | | | | | | | | | | | | | | | | |
Net investment income | | | (.18 | ) | | | (.10 | ) | | | (.19 | ) | | | (.23 | ) | | | (.24 | ) |
Net realized gains on investment transactions | | | — | | | | (.70 | ) | | | (.75 | ) | | | — | | | | — | |
Total distributions | | | (.18 | ) | | | (.80 | ) | | | (.94 | ) | | | (.23 | ) | | | (.24 | ) |
| Net asset value, end of period | | $ | 16.67 | | | $ | 13.78 | | | $ | 15.31 | | | $ | 17.40 | | | $ | 15.99 | |
| Total Return (%)b | | | 22.45 | c | | | (4.62 | ) | | | (7.16 | ) | | | 10.36 | | | | 30.54 | |
| | | | | |
| Ratios to Average Net Assets and Supplemental Data | | | | | | | | | | | | | | | | | | | | |
| Net assets, end of period ($ millions) | | | 4 | | | | 4 | | | | 4 | | | | 5 | | | | 5 | |
| Ratio of expenses before expense reductions (%)d | | | 1.15 | | | | 1.13 | | | | 1.10 | | | | 1.09 | | | | 1.09 | |
| Ratio of expenses after expense reductions (%)d | | | 1.03 | | | | 1.05 | | | | 1.04 | | | | 1.04 | | | | 1.05 | |
| Ratio of net investment income (loss) (%) | | | 1.31 | | | | 1.37 | | | | .35 | | | | 1.10 | | | | 1.52 | |
| Portfolio turnover rate (%) | | | 97 | | | | 293 | | | | 121 | | | | 133 | | | | 54 | |
| a | Based on average shares outstanding during the period. |
| b | Total return would have been lower had certain expenses not been reduced. |
| c | The Fund’s total return includes a reimbursement by the Adviser for commission costs incurred in connection with purchases and sales of portfolio assets due to the change in investment strategy, which otherwise would have reduced total return by 0.03%. |
| d | Expense ratio does not reflect charges and fees associated with the separate account that invests in the Fund or any variable life insurance policy or variable annuity contract for which the Fund is an investment option. |
| | | | |
Deutsche Variable Series II — Deutsche CROCI® U.S. VIP | | | | | 11 |
Notes to Financial Statements
A. Organization and Significant Accounting Policies
Deutsche CROCI® U.S. VIP (formerly Deutsche Large Cap Value VIP) (the “Fund”) is a diversified series of Deutsche Variable Series II (the “Trust”), which is registered under the Investment Company Act of 1940, as amended (the “1940 Act”), as an open-end management investment company organized as a Massachusetts business trust.
Multiple Classes of Shares of Beneficial Interest. The Fund offers two classes of shares (Class A shares and Class B shares). Sales of Class B shares are subject to recordkeeping fees up to 0.15% and Rule 12b-1 fees under the 1940 Act equal to an annual rate of 0.25% of the average daily net assets of the Class B shares of the Fund. Class A shares are not subject to such fees.
Investment income, realized and unrealized gains and losses, and certain fund-level expenses and expense reductions, if any, are borne pro rata on the basis of relative net assets by the holders of all classes of shares except that each class bears certain expenses unique to that class (including the applicable Rule 12b-1 fee and recordkeeping fees). Differences in class-level expenses may result in payment of different per share dividends by class. All shares have equal rights with respect to voting subject to class-specific arrangements.
The Fund’s financial statements are prepared in accordance with accounting principles generally accepted in the United States of America (“U.S. GAAP”) which require the use of management estimates. Actual results could differ from those estimates. The Fund qualifies as an investment company under Topic 946 of Accounting Standards Codification of U.S. GAAP. The policies described below are followed consistently by the Fund in the preparation of its financial statements.
Security Valuation. Investments are stated at value determined as of the close of regular trading on the New York Stock Exchange on each day the exchange is open for trading.
Various inputs are used in determining the value of the Fund’s investments. These inputs are summarized in three broad levels. Level 1 includes quoted prices in active markets for identical securities. Level 2 includes other significant observable inputs (including quoted prices for similar securities, interest rates, prepayment speeds and credit risk). Level 3 includes significant unobservable inputs (including the Fund’s own assumptions in determining the fair value of investments). The level assigned to the securities valuations may not be an indication of the risk or liquidity associated with investing in those securities.
Equity securities are valued at the most recent sale price or official closing price reported on the exchange (U.S. or foreign) or over-the-counter market on which they trade. Securities for which no sales are reported are valued at the calculated mean between the most recent bid and asked quotations on the relevant market or, if a mean cannot be determined, at the most recent bid quotation. Equity securities are generally categorized as Level 1.
Investments in open-end investment companies are valued at their net asset value each business day and are categorized as Level 1.
Securities and other assets for which market quotations are not readily available or for which the above valuation procedures are deemed not to reflect fair value are valued in a manner that is intended to reflect their fair value as determined in accordance with procedures approved by the Board and are generally categorized as Level 3. In accordance with the Fund’s valuation procedures, factors considered in determining value may include, but are not limited to, the type of the security; the size of the holding; the initial cost of the security; the existence of any contractual restrictions on the security’s disposition; the price and extent of public trading in similar securities of the issuer or of comparable companies; quotations or evaluated prices from broker-dealers and/or pricing services; information obtained from the issuer, analysts, and/or the appropriate stock exchange (for exchange-traded securities); an analysis of the company’s or issuer’s financial statements; an evaluation of the forces that influence the issuer and the market(s) in which the security is purchased and sold; and with respect to debt securities, the maturity, coupon, creditworthiness, currency denomination and the movement of the market in which the security is normally traded. The value determined under these procedures may differ from published values for the same securities.
Disclosure about the classification of fair value measurements is included in a table following the Fund’s Investment Portfolio.
Foreign Currency Translations. The books and records of the Fund are maintained in U.S. dollars. Investment securities and other assets and liabilities denominated in a foreign currency are translated into
| | | | | | |
| | 12 | | | | | | Deutsche Variable Series II — Deutsche CROCI® U.S. VIP |
U.S. dollars at the prevailing exchange rates at period end. Purchases and sales of investment securities, income and expenses are translated into U.S. dollars at the prevailing exchange rates on the respective dates of the transactions.
Net realized and unrealized gains and losses on foreign currency transactions represent net gains and losses between trade and settlement dates on securities transactions, the acquisition and disposition of foreign
currencies, and the difference between the amount of net investment income accrued and the U.S. dollar amount actually received. The portion of both realized and unrealized gains and losses on investments that results from fluctuations in foreign currency exchange rates is not separately disclosed but is included with net realized and unrealized gain/appreciation and loss/depreciation on investments.
Securities Lending. Deutsche Bank AG, as lending agent, lends securities of the Fund to certain financial institutions under the terms of its securities lending agreement. During the term of the loans, the Fund continues to receive interest and dividends generated by the securities and to participate in any changes in their market value. The Fund requires the borrowers of the securities to maintain collateral with the Fund consisting of either cash or liquid, unencumbered assets having a value at least equal to the value of the securities loaned. When the collateral falls below specified amounts, the lending agent will use its best effort to obtain additional collateral on the next business day to meet required amounts under the securities lending agreement. As of period end, any securities on loan were collateralized by cash. During the year ended December 31, 2017, the Fund invested the cash collateral into a joint trading account in affiliated money market funds managed by Deutsche Investment Management Americas Inc. As of December 31, 2017, the Fund invested the cash collateral in Deutsche Government & Agency Securities Portfolio. Deutsche Investment Management Americas Inc. receives a management/administration fee (0.13% annualized effective rate as of December 31, 2017) on the cash collateral invested in Deutsche Government & Agency Securities Portfolio. The Fund receives compensation for lending its securities either in the form of fees or by earning interest on invested cash collateral net of borrower rebates and fees paid to a lending agent. Either the Fund or the borrower may terminate the loan at any time, and the borrower, after notice, is required to return borrowed securities within a standard time period. There may be risks of delay and costs in recovery of securities or even loss of rights in the collateral should the borrower of the securities fail financially. If the Fund is not able to recover securities lent, the Fund may sell the collateral and purchase a replacement investment in the market, incurring the risk that the value of the replacement security is greater than the value of the collateral. The Fund is also subject to all investment risks associated with the reinvestment of any cash collateral received, including, but not limited to, interest rate, credit and liquidity risk associated with such investments.
As of December 31, 2017, the Fund had securities on loan, which were classified as common stock in the Investment Portfolio. The value of the related collateral exceeded the value of the securities loaned at period end. As of period end, the remaining contractual maturity of the collateral agreements were overnight and continuous.
Federal Income Taxes. The Fund’s policy is to comply with the requirements of the Internal Revenue Code, as amended, which are applicable to regulated investment companies and to distribute all of its taxable income to its shareholders.
The Fund has reviewed the tax positions for the open tax years as of December 31, 2017 and has determined that no provision for income tax and/or uncertain tax positions is required in the Fund’s financial statements. The Fund’s federal tax returns for the prior three fiscal years remain open subject to examination by the Internal Revenue Service.
Distribution of Income and Gains. Distributions from net investment income of the Fund, if any, is declared and distributed to shareholders annually. Net realized gains from investment transactions, in excess of available capital loss carryforwards, would be taxable to the Fund if not distributed and, therefore, will be distributed to shareholders at least annually. The Fund may also make additional distributions for tax purposes if necessary.
The timing and characterization of certain income and capital gain distributions are determined annually in accordance with federal tax regulations which may differ from accounting principles generally accepted in the United States of America. These differences primarily relate to certain securities sold at a loss. As a result, net investment income (loss) and net realized gain (loss) on investment transactions for a reporting period may differ significantly from distributions during such period. Accordingly, the Fund may periodically make reclassifications among certain of its capital accounts without impacting the net asset value of the Fund.
| | | | |
Deutsche Variable Series II — Deutsche CROCI® U.S. VIP | | | | | 13 |
At December 31, 2017, the Fund’s components of distributable earnings on a tax basis were as follows:
| | | | |
| Undistributed ordinary income* | | $ | 7,031,142 | |
| Undistributed long-term capital gains | | $ | 7,220,108 | |
| Unrealized appreciation (depreciation) on investments | | $ | 11,084,333 | |
At December 31, 2017, the aggregate cost of investments for federal income tax purposes was $150,299,681. The net unrealized appreciation for all investments based on tax cost was $11,084,333. This consisted of aggregate gross unrealized appreciation for all investments in which there was an excess of value over tax cost of $14,811,764 aggregate gross unrealized depreciation for all investments in which was an excess of tax cost over value of $3,727,431.
In addition, the tax character of distributions paid by the Fund is summarized as follows:
| | | | | | | | |
| | | Years Ended December 31, | |
| | | 2017 | | | 2016 | |
| Distributions from ordinary income* | | $ | 3,667,987 | | | $ | 2,525,931 | |
| Distribution from long-term capital gains | | $ | — | | | $ | 12,155,777 | |
| * | For tax purposes, short-term capital gain distributions are considered ordinary income distributions. |
Expenses. Expenses of the Trust arising in connection with a specific fund are allocated to that fund. Other Trust expenses which cannot be directly attributed to a fund are apportioned among the funds in the Trust based upon the relative net assets or other appropriate measures.
Contingencies. In the normal course of business, the Fund may enter into contracts with service providers that contain general indemnification clauses. The Fund’s maximum exposure under these arrangements is unknown, as this would involve future claims that may be made against the Fund that have not yet been made. However, based on experience, the Fund expects the risk of loss to be remote.
Other. Investment transactions are accounted for on a trade date plus one basis for daily net asset value calculations. However, for financial reporting purposes, investment transactions are reported on trade date. Interest income is recorded on the accrual basis. Dividend income is recorded on the ex-dividend date net of foreign withholding taxes. Realized gains and losses from investment transactions are recorded on an identified cost basis. Proceeds from litigation payments, if any, are included in net realized gain (loss) from investments.
B. Purchases and Sales of Securities
During the year ended December 31, 2017, purchases and sales of investment transactions (excluding short-term investments) aggregated $216,765,289 and $331,343,649, respectively.
C. Related Parties
Management Agreement. Under the Investment Management Agreement with Deutsche Investment Management Americas Inc. (“DIMA” or the “Advisor”), an indirect, wholly owned subsidiary of Deutsche Bank AG, the Advisor directs the investments of the Fund in accordance with its investment objectives, policies and restrictions. The Advisor determines the securities, instruments and other contracts relating to investments to be purchased, sold or entered into by the Fund.
Under the Investment Management Agreement with the Advisor, the Fund pays a monthly management fee based on the Fund’s average daily net assets, computed and accrued daily and payable monthly, at the following annual rates:
| | | | |
| First $250 million | | | .650 | % |
| Next $750 million | | | .625 | % |
| Next $1.5 billion | | | .600 | % |
| Next $2.5 billion | | | .575 | % |
| Next $2.5 billion | | | .550 | % |
| Next $2.5 billion | | | .525 | % |
| Next $2.5 billion | | | .500 | % |
| Over $12.5 billion | | | .475 | % |
| | | | | | |
| | 14 | | | | | | Deutsche Variable Series II — Deutsche CROCI® U.S. VIP |
Accordingly, for the year ended December 31, 2017, the fee pursuant to the Investment Management Agreement was equivalent to an annual rate (exclusive of any applicable waivers/reimbursements) of 0.65% of the Fund’s average daily net assets.
For the period from January 1, 2017 through April 30, 2018, the Advisor has contractually agreed to waive all or a portion of its fee and/or reimburse certain operating expenses of the Fund to the extent necessary to maintain the total annual operating expenses (excluding certain expenses such as extraordinary expenses, taxes, brokerage and interest expense) of each class as follows:
| | | | |
| Class A | | | .72 | % |
| Class B | | | 1.03 | % |
For the year ended December 31, 2017, fees waived and/or expenses reimbursed for each class are as follows:
| | | | |
| Class A | | $ | 214,395 | |
| Class B | | | 4,099 | |
| | | $ | 218,494 | |
Administration Fee. Pursuant to an Administrative Services Agreement, DIMA provides most administrative services to the Fund. For all services provided under the Administrative Services Agreement, the Fund pays DIMA an annual fee (“Administration Fee”) of 0.10% of the Fund’s average daily net assets, computed and accrued daily and payable monthly. For the year ended December 31, 2017, the Administration Fee was $226,137, of which $13,456 is unpaid.
Service Provider Fees. Deutsche AM Service Company (“DSC”), an affiliate of the Advisor, is the transfer agent, dividend-paying agent and shareholder service agent for the Fund. Pursuant to a sub-transfer agency agreement between DSC and DST Systems, Inc. (“DST”), DSC has delegated certain transfer agent, dividend-paying agent and shareholder service agent functions to DST. DSC compensates DST out of the shareholder servicing fee it receives from the Fund. For the year ended December 31, 2017, the amounts charged to the Fund by DSC were as follows:
| | | | | | | | |
| Services to Shareholders | | Total
Aggregated | | | Unpaid at
December 31,
2017 | |
| Class A | | $ | 393 | | | $ | 98 | |
| Class B | | | 228 | | | | 56 | |
| | | $ | 621 | | | $ | 154 | |
Distribution Service Agreement. Under the Fund’s Class B 12b-1 plan, Deutsche AM Distributors, Inc. (“DDI”) received a fee (“Distribution Service Fee”) of 0.25% of average daily net assets of Class B shares. For the year ended December 31, 2017, the Distribution Service Fee aggregated $8,870, of which $755 is unpaid.
Typesetting and Filing Service Fees. Under an agreement with DIMA, DIMA is compensated for providing certain pre-press and regulatory filing services to the Fund. For the year ended December 31, 2017, the amount charged to the Fund by DIMA included in the Statement of Operations under “Reports to shareholders” aggregated $10,695, of which $3,559 is unpaid.
Trustees’ Fees and Expenses. The Fund paid retainer fees to each Trustee not affiliated with the Advisor, plus specified amounts to the Board Chairperson and Vice Chairperson and to each committee Chairperson.
Affiliated Cash Management Vehicles. The Fund may invest uninvested cash balances in Deutsche Central Cash Management Government Fund and Deutsche Variable NAV Money Fund, affiliated money market funds which are managed by the Advisor. Each affiliated money market fund is managed in accordance with Rule 2a-7 under the 1940 Act, which governs the quality, maturity, diversity and liquidity of instruments in which a money market fund may invest. Deutsche Central Cash Management Government Fund seeks to maintain a stable net asset value, and Deutsche Variable NAV Money Fund maintains a floating net asset value. The Fund indirectly bears its proportionate share of the expenses of each affiliated money market fund in which it invests. Deutsche Central Cash Management Government Fund does not pay the Advisor an investment management fee. To the extent that Deutsche Variable NAV Money Fund pays an investment management fee to the Advisor, the Advisor will waive an amount of the investment management fee payable to the Advisor by the Fund equal to the amount of the investment management fee payable on the Fund’s assets invested in Deutsche Variable NAV Money Fund.
| | | | |
Deutsche Variable Series II — Deutsche CROCI® U.S. VIP | | | | | 15 |
Securities Lending Agent Fees. Deutsche Bank AG serves as securities lending agent for the Fund. For the year ended December 31, 2017, the Fund incurred securities lending agent fees to Deutsche Bank AG in the amount of $269.
D. Ownership of the Fund
At December 31, 2017, two participating insurance companies were owners of record of 10% or more of the total outstanding Class A shares of the Fund, each owning 63% and 27%. Two participating insurance companies was the owner of record of 10% or more of the total outstanding Class B shares of the Fund, each owning 61% and 15%.
E. Line of Credit
The Fund and other affiliated funds (the “Participants”) share in a $400 million revolving credit facility provided by a syndication of banks. The Fund may borrow for temporary or emergency purposes, including the meeting of redemption requests that otherwise might require the untimely disposition of securities. The Participants are charged an annual commitment fee which is allocated based on net assets, among each of the Participants. Interest is calculated at a rate per annum equal to the sum of the Federal Funds Rate plus 1.25 percent plus if the one-month LIBOR exceeds the Federal Funds Rate, the amount of such excess. The Fund may borrow up to a maximum of 33 percent of its net assets under the agreement. The Fund had no outstanding loans at December 31, 2017.
F. Payment by Affiliate
During the year ended December 31, 2017, the Advisor agreed to reimburse the Fund $62,466 for commission costs incurred in connection with purchases and sales of portfolio assets due to the change in investment strategy. The amount reimbursed was 0.03% of the Fund’s average net assets.
| | | | | | |
| | 16 | | | | | | Deutsche Variable Series II — Deutsche CROCI® U.S. VIP |
Report of Independent Registered Public Accounting Firm
To the Board of Trustees of Deutsche Variable Series II and the Shareholders of Deutsche CROCI® U.S. VIP:
Opinion on the Financial Statements
We have audited the accompanying statement of assets and liabilities of Deutsche CROCI U.S VIP, formerly Deutsche Large Cap Value VIP (the “Fund”) (one of the funds constituting the Deutsche Variable Series II) (the “Trust”), including the schedule of investments, as of December 31, 2017, and the related statement of operations for the year then ended, the statements of changes in net assets for each of the two years in the period then ended, the financial highlights for each of the five years in the period then ended and the related notes (collectively referred to as the “financial statements”). In our opinion, the financial statements present fairly, in all material respects, the financial position of the Fund (one of the funds constituting the Deutsche Variable Series II) at December 31, 2017, the results of its operations for the year then ended, the changes in its net assets for each of the two years in the period then ended and its financial highlights for each of the five years in the period then ended, in conformity with U.S. generally accepted accounting principles.
Basis for Opinion
These financial statements are the responsibility of the Trust’s management. Our responsibility is to express an opinion on the Fund’s financial statements based on our audits. We are a public accounting firm registered with the Public Company Accounting Oversight Board (United States) (“PCAOB”) and are required to be independent with respect to the Trust in accordance with the U.S. federal securities laws and the applicable rules and regulations of the Securities and Exchange Commission and the PCAOB.
We conducted our audits in accordance with the standards of the PCAOB. Those standards require that we plan and perform the audit to obtain reasonable assurance about whether the financial statements are free of material misstatement, whether due to error or fraud. The Trust is not required to have, nor were we engaged to perform, an audit of the Trust’s internal control over financial reporting. As part of our audits, we are required to obtain an understanding of internal control over financial reporting, but not for the purpose of expressing an opinion on the effectiveness of the Trust’s internal control over financial reporting. Accordingly, we express no such opinion.
Our audits included performing procedures to assess the risks of material misstatement of the financial statements, whether due to error or fraud, and performing procedures that respond to those risks. Such procedures included examining, on a test basis, evidence regarding the amounts and disclosures in the financial statements. Our procedures included confirmation of securities owned as of December 31, 2017, by correspondence with the custodian and brokers or by other appropriate auditing procedures where replies from brokers were not received.
Our audits also included evaluating the accounting principles used and significant estimates made by management, as well as evaluating the overall presentation of the financial statements. We believe that our audits provide a reasonable basis for our opinion.
|

|
We have served as the auditor of one or more investment companies in the Deutsche family of funds since at least 1979, but we are unable to determine the specific year. Boston, Massachusetts February 15, 2018 |
| | | | |
Deutsche Variable Series II — Deutsche CROCI® U.S. VIP | | | | | 17 |
| | |
| Information About Your Fund’s Expenses | | (Unaudited) |
As an investor of the Fund, you incur two types of costs: ongoing expenses and transaction costs. Ongoing expenses include management fees, distribution and service (12b-1) fees and other Fund expenses. Examples of transaction costs include contract charges, which are not shown in this section. The following tables are intended to help you understand your ongoing expenses (in dollars) of investing in the Fund and to help you compare these expenses with the ongoing expenses of investing in other mutual funds. In the most recent six-month period, the Fund limited these expenses; had it not done so, expenses would have been higher. The example in the table is based on an investment of $1,000 invested at the beginning of the six-month period and held for the entire period (July 1, 2017 to December 31, 2017).
The tables illustrate your Fund’s expenses in two ways:
| – | Actual Fund Return. This helps you estimate the actual dollar amount of ongoing expenses (but not transaction costs) paid on a $1,000 investment in the Fund using the Fund’s actual return during the period. To estimate the expenses you paid over the period, simply divide your account value by $1,000 (for example, an $8,600 account value divided by $1,000 = 8.6), then multiply the result by the number in the “Expenses Paid per $1,000” line under the share class you hold. |
| – | Hypothetical 5% Fund Return. This helps you to compare your Fund’s ongoing expenses (but not transaction costs) with those of other mutual funds using the Fund’s actual expense ratio and a hypothetical rate of return of 5% per year before expenses. Examples using a 5% hypothetical Fund return may be found in the shareholder reports of other mutual funds. The hypothetical account values and expenses may not be used to estimate the actual ending account balance or expenses you paid for the period. |
Please note that the expenses shown in these tables are meant to highlight your ongoing expenses only and do not reflect any transaction costs. The “Expenses Paid per $1,000” line of the tables is useful in comparing ongoing expenses only and will not help you determine the relative total expense of owning different funds. If these transaction costs had been included, your costs would have been higher.
| | | | | | | | |
| Expenses and Value of a $1,000 Investment for the six months ended December 31, 2017 | |
| | |
| Actual Fund Return | | | Class A | | | | Class B | |
| Beginning Account Value 7/1/17 | | $ | 1,000.00 | | | $ | 1,000.00 | |
| Ending Account Value 12/31/17 | | $ | 1,097.60 | | | $ | 1,095.30 | |
| Expenses Paid per $1,000* | | $ | 3.81 | | | $ | 5.44 | |
| | |
| Hypothetical 5% Fund Return | | | Class A | | | | Class B | |
| Beginning Account Value 7/1/17 | | $ | 1,000.00 | | | $ | 1,000.00 | |
| Ending Account Value 12/31/17 | | $ | 1,021.58 | | | $ | 1,020.01 | |
| Expenses Paid per $1,000* | | $ | 3.67 | | | $ | 5.24 | |
| * | Expenses are equal to the Fund’s annualized expense ratio for each share class, multiplied by the average account value over the period, multiplied by 184 (the number of days in the most recent six-month period), then divided by 365. |
| | | | | | | | |
| Annualized Expense Ratios | | Class A | | | Class B | |
| Deutsche Variable Series II — Deutsche CROCI® U.S. VIP | | | .72 | % | | | 1.03 | % |
For more information, please refer to the Fund’s prospectus.
These tables do not reflect charges and fees (“contract charges”) associated with the separate account that invests in the Fund or any variable life insurance policy or variable annuity contract for which the Fund is an investment option.
For an analysis of the fees associated with an investment in the fund or similar funds, please refer to the current and hypothetical expense calculators for Variable Insurance Products which can be found at deutschefunds.com/EN/resources/calculators.jsp.
| | | | | | |
| | 18 | | | | | | Deutsche Variable Series II — Deutsche CROCI® U.S. VIP |
| | |
| Tax Information | | (Unaudited) |
Pursuant to Section 852 of the Internal Revenue Code, the Fund designates $7,942,000 as capital gain dividends for its year ended December 31, 2017.
For corporate shareholders, 100% of the ordinary dividends (i.e., income dividends plus short-term capital gains) paid during the Fund’s fiscal year ended December 31, 2017, qualified for the dividends received deduction.
Please consult a tax advisor if you have questions about federal or state income tax laws, or on how to prepare your tax returns. If you have specific questions about your account, please contact your insurance provider.
Proxy Voting
The Trust’s policies and procedures for voting proxies for portfolio securities and information about how the Trust voted proxies related to its portfolio securities during the most recent 12-month period ended June 30 are available on our Web site — deutschefunds.com (click on “proxy voting” at the bottom of the page) — or on the SEC’s Web site — sec.gov. To obtain a written copy of the Trust’s policies and procedures without charge, upon request, call us toll free at (800) 728-3337.
| | | | |
Deutsche Variable Series II — Deutsche CROCI® U.S. VIP | | | | | 19 |
Advisory Agreement Board Considerations and Fee Evaluation
The Board of Trustees (hereinafter referred to as the “Board” or “Trustees”) approved the renewal of Deutsche CROCI® U.S. VIP’s (formerly Deutsche Large Cap Value VIP) (the “Fund”) investment management agreement (the “Agreement”) with Deutsche Investment Management Americas Inc. (“DIMA”) in September 2017.
In terms of the process that the Board followed prior to approving the Agreement, shareholders should know that:
| – | | During the entire process, all of the Fund’s Trustees were independent of DIMA and its affiliates (the “Independent Trustees”). |
| – | | The Board met frequently during the past year to discuss fund matters and dedicated a substantial amount of time to contract review matters. Over the course of several months, the Board’s Contract Committee reviewed extensive materials received from DIMA, independent third parties and independent counsel. These materials included an analysis of the Fund’s performance, fees and expenses, and profitability from a fee consultant retained by the Fund’s Independent Trustees (the “Fee Consultant”). Based on its evaluation of the information provided, the Contract Committee presented its findings and recommendations to the Board. The Board then reviewed the Contract Committee’s findings and recommendations. |
| – | | The Board also received extensive information throughout the year regarding performance of the Fund. |
| – | | The Independent Trustees regularly met privately with counsel to discuss contract review and other matters. In addition, the Independent Trustees were advised by the Fee Consultant in the course of their review of the Fund’s contractual arrangements and considered a comprehensive report prepared by the Fee Consultant in connection with their deliberations. |
| – | | In connection with reviewing the Agreement, the Board also reviewed the terms of the Fund’s Rule 12b-1 plan, distribution agreement, administrative services agreement, transfer agency agreement and other material service agreements. |
In connection with the contract review process, the Contract Committee and the Board considered the factors discussed below, among others. The Board also considered that DIMA and its predecessors have managed the Fund since its inception, and the Board believes that a long-term relationship with a capable, conscientious advisor is in the best interests of the Fund. The Board considered, generally, that shareholders chose to invest or remain invested in the Fund knowing that DIMA managed the Fund, and that the Agreement was approved by the Fund’s shareholders. DIMA is part of Deutsche Bank AG’s (“Deutsche Bank”) Asset Management (“Deutsche AM”) division. Deutsche AM is a global asset management business that offers a wide range of investing expertise and resources, including research capabilities in many countries throughout the world.
As part of the contract review process, the Board carefully considered the fees and expenses of each Deutsche fund overseen by the Board in light of the fund’s performance. In many cases, this led to the negotiation and implementation of expense caps. As part of these negotiations, the Board indicated that it would consider relaxing these caps in future years following sustained improvements in performance, among other considerations.
While shareholders may focus primarily on fund performance and fees, the Fund’s Board considers these and many other factors, including the quality and integrity of DIMA’s personnel and administrative support services provided by DIMA, such as back-office operations, fund valuations, and compliance policies and procedures.
Nature, Quality and Extent of Services. The Board considered the terms of the Agreement, including the scope of advisory services provided under the Agreement. The Board noted that, under the Agreement, DIMA provides portfolio management services to the Fund and that, pursuant to a separate administrative services agreement, DIMA provides administrative services to the Fund. The Board considered the experience and skills of senior management and investment personnel and the resources made available to such personnel. The Board reviewed the Fund’s performance over short-term and long-term periods and compared those returns to various agreed-upon performance measures, including market index(es) and a peer universe compiled using information supplied by Morningstar Direct (“Morningstar”), an independent fund data service. The Board also noted that it has put into place a process of identifying “Funds in Review” (e.g., funds performing poorly relative to a peer universe), and receives additional reporting from DIMA
| | | | | | |
| | 20 | | | | | | Deutsche Variable Series II — Deutsche CROCI® U.S. VIP |
regarding such funds and, where appropriate, DIMA’s plans to address underperformance. The Board believes this process is an effective manner of identifying and addressing underperforming funds. Based on the information provided, the Board noted that, for the one-, three- and five-year periods ended December 31, 2016, the Fund’s performance (Class A shares) was in the 4th quartile of the applicable Morningstar universe (the 1st quartile being the best performers and the 4th quartile being the worst performers). The Board also observed that the Fund has underperformed its benchmark in the one-, three- and five-year periods ended December 31, 2016. The Board noted the disappointing investment performance of the Fund in recent periods and continued to discuss with senior management of DIMA the factors contributing to such underperformance and actions being taken to improve performance. The Board considered that, effective October 3, 2016, the Fund changed its investment strategy and portfolio managers and noted that the Fund further changed its investment strategy, effective May 1, 2017. The Board observed that the Fund had experienced improved relative performance during the first eight months of 2017. The Board recognized the efforts by DIMA in recent years to enhance its investment platform and improve long-term performance across the Deutsche fund complex.
Fees and Expenses. The Board considered the Fund’s investment management fee schedule, operating expenses and total expense ratios, and comparative information provided by Broadridge Financial Solutions, Inc. (“Broadridge”) and the Fee Consultant regarding investment management fee rates paid to other investment advisors by similar funds (1st quartile being the most favorable and 4th quartile being the least favorable). With respect to management fees paid to other investment advisors by similar funds, the Board noted that the contractual fee rates paid by the Fund, which include a 0.10% fee paid to DIMA under the Fund’s administrative services agreement, were equal to the median of the applicable Broadridge peer group (based on Broadridge data provided as of December 31, 2016). The Board noted that the Fund’s Class A shares total (net) operating expenses were expected to be lower than the median (2nd quartile) of the applicable Broadridge expense universe (based on Broadridge data provided as of December 31, 2016, and analyzing Broadridge expense universe Class A (net) expenses less any applicable 12b-1 fees) (“Broadridge Universe Expenses”). The Board also reviewed data comparing each share class’s total (net) operating expenses to the applicable Broadridge Universe Expenses. The Board noted that the expense limitations agreed to by DIMA were expected to help the Fund’s total (net) operating expenses remain competitive. The Board considered the Fund’s management fee rate as compared to fees charged by DIMA to comparable Deutsche U.S. registered funds (“Deutsche Funds”) and considered differences between the Fund and the comparable Deutsche Funds. The information requested by the Board as part of its review of fees and expenses also included information about institutional accounts (including any sub-advised funds and accounts) and funds offered primarily to European investors (“Deutsche Europe funds”) managed by Deutsche AM. The Board noted that DIMA indicated that Deutsche AM does not manage any institutional accounts or Deutsche Europe funds comparable to the Fund.
On the basis of the information provided, the Board concluded that management fees were reasonable and appropriate in light of the nature, quality and extent of services provided by DIMA.
Profitability. The Board reviewed detailed information regarding revenues received by DIMA under the Agreement. The Board considered the estimated costs to DIMA, and pre-tax profits realized by DIMA, from advising the Deutsche Funds, as well as estimates of the pre-tax profits attributable to managing the Fund in particular. The Board also received information regarding the estimated enterprise-wide profitability of DIMA and its affiliates with respect to all fund services in totality and by fund. The Board and the Fee Consultant reviewed DIMA’s methodology in allocating its costs to the management of the Fund. Based on the information provided, the Board concluded that the pre-tax profits realized by DIMA in connection with the management of the Fund were not unreasonable. The Board also reviewed certain publicly available information regarding the profitability of certain similar investment management firms. The Board noted that, while information regarding the profitability of such firms is limited (and in some cases is not necessarily prepared on a comparable basis), DIMA and its affiliates’ overall profitability with respect to the Deutsche Funds (after taking into account distribution and other services provided to the funds by DIMA and its affiliates) was lower than the overall profitability levels of most comparable firms for which such data was available.
Economies of Scale. The Board considered whether there are economies of scale with respect to the management of the Fund and whether the Fund benefits from any economies of scale. The Board noted that the Fund’s investment management fee schedule includes fee breakpoints. The Board concluded that the Fund’s fee schedule represents an appropriate sharing between the Fund and DIMA of such economies of scale as may exist in the management of the Fund at current asset levels.
| | | | |
Deutsche Variable Series II — Deutsche CROCI® U.S. VIP | | | | | 21 |
Other Benefits to DIMA and Its Affiliates. The Board also considered the character and amount of other incidental benefits received by DIMA and its affiliates, including any fees received by DIMA for administrative services provided to the Fund, any fees received by an affiliate of DIMA for transfer agency services provided to the Fund and any fees received by an affiliate of DIMA for distribution services. The Board noted that DIMA pays a licensing fee to an affiliate related to the Fund’s use of the CROCI® strategy. The Board also considered benefits to DIMA related to brokerage and soft-dollar allocations, including allocating brokerage to pay for research generated by parties other than the executing broker dealers, which pertain primarily to funds investing in equity securities. In addition, the Board considered the incidental public relations benefits to DIMA related to Deutsche Funds advertising and cross-selling opportunities among DIMA products and services. The Board considered these benefits in reaching its conclusion that the Fund’s management fees were reasonable.
Compliance. The Board considered the significant attention and resources dedicated by DIMA to documenting and enhancing its compliance processes in recent years. The Board noted in particular (i) the experience, seniority and time commitment of the individuals serving as DIMA’s and the Fund’s chief compliance officers; (ii) the large number of DIMA compliance personnel; and (iii) the substantial commitment of resources by DIMA and its affiliates to compliance matters.
Based on all of the information considered and the conclusions reached, the Board unanimously determined that the continuation of the Agreement is in the best interests of the Fund. In making this determination, the Board did not give particular weight to any single factor identified above. The Board considered these factors over the course of numerous meetings, certain of which were in executive session with only the Independent Trustees and counsel present. It is possible that individual Independent Trustees may have weighed these factors differently in reaching their individual decisions to approve the continuation of the Agreement.
| | | | | | |
| | 22 | | | | | | Deutsche Variable Series II — Deutsche CROCI® U.S. VIP |
Board Members and Officers
The following table presents certain information regarding the Board Members and Officers of the Fund. Each Board Member’s year of birth is set forth in parentheses after his or her name. Unless otherwise noted, (i) each Board Member has engaged in the principal occupation(s) noted in the table for at least the most recent five years, although not necessarily in the same capacity; and (ii) the address of each Independent Board Member is c/o Keith R. Fox, Deutsche Funds Board Chair, c/o Thomas R. Hiller, Ropes & Gray LLP, Prudential Tower, 800 Boylston Street, Boston, MA 02199-3600. Except as otherwise noted below, the term of office for each Board Member is until the election and qualification of a successor, or until such Board Member sooner dies, resigns, is removed or as otherwise provided in the governing documents of the Fund. Because the Fund does not hold an annual meeting of shareholders, each Board Member will hold office for an indeterminate period. The Board Members may also serve in similar capacities with other funds in the fund complex.
| | | | | | | | |
| Independent Board Members | | | | | | | |
Name, Year of Birth,
Position with the Fund and
Length of Time Served1 | | Business Experience and Directorships During the Past Five Years | | Number of
Funds in
Deutsche
Fund
Complex
Overseen | | | Other
Directorships
Held by Board
Member |
Keith R. Fox, CFA (1954) Chairperson since 2017, and Board Member since 1996 | | Managing General Partner, Exeter Capital Partners (a series of private investment funds) (since 1986). Directorships: Progressive International Corporation (kitchen goods importer and distributor); The Kennel Shop (retailer); former Chairman, National Association of Small Business Investment Companies; former Directorships: BoxTop Media Inc. (advertising); Sun Capital Advisers Trust (mutual funds) (2011–2012) | | | 89 | | | — |
Kenneth C. Froewiss (1945) Vice Chairperson since 2017, and Board Member since 2001 | | Retired Clinical Professor of Finance, NYU Stern School of Business (1997–2014); Member, Finance Committee, Association for Asian Studies (2002–present); Director, Mitsui Sumitomo Insurance Group (US) (2004–present); prior thereto, Managing Director, J.P. Morgan (investment banking firm) (until 1996) | | | 92 | | | — |
John W. Ballantine (1946) Board Member since 1999 | | Retired; formerly, Executive Vice President and Chief Risk Management Officer, First Chicago NBD Corporation/The First National Bank of Chicago (1996–1998); Executive Vice President and Head of International Banking (1995–1996); former Directorships: Director and former Chairman of the Board, Healthways, Inc.2 (population well-being and wellness services) (2003–2014); Stockwell Capital Investments PLC (private equity); Enron Corporation; FNB Corporation; Tokheim Corporation; First Oak Brook Bancshares, Inc. and Oak Brook Bank; Prisma Energy International. Not-for-Profit Director, Trustee: Palm Beach Civic Association; Public Radio International; Window to the World Communications (public media); Harris Theater for Music and Dance (Chicago) | | | 89 | | | Portland
General
Electric2
(utility
company)
(2003–
present) |
Henry P. Becton, Jr. (1943) Board Member since 1990 | | Vice Chair and former President, WGBH Educational Foundation. Directorships: Public Radio International; Public Radio Exchange (PRX); The Pew Charitable Trusts (charitable organization); former Directorships: Becton Dickinson and Company2 (medical technology company); Belo Corporation2 (media company); The PBS Foundation; Association of Public Television Stations; Boston Museum of Science; American Public Television; Concord Academy; New England Aquarium; Mass. Corporation for Educational Telecommunications; Committee for Economic Development; Public Broadcasting Service; Connecticut College; North Bennett Street School (Boston) | | | 89 | | | — |
Dawn-Marie Driscoll (1946) Board Member since 1987 | | Emeritus Executive Fellow, Center for Business Ethics, Bentley University; formerly: President, Driscoll Associates (consulting firm); Partner, Palmer & Dodge (law firm) (1988–1990); Vice President of Corporate Affairs and General Counsel, Filene’s (retail) (1978–1988). Directorships: Advisory Board, Center for Business Ethics, Bentley University; Trustee and former Chairman of the Board, Southwest Florida Community Foundation (charitable organization); former Directorships: ICI Mutual Insurance Company (2007–2015); Sun Capital Advisers Trust (mutual funds) (2007–2012), Investment Company Institute (audit, executive, nominating committees) and Independent Directors Council (governance, executive committees) | | | 89 | | | — |
| | | | |
Deutsche Variable Series II — Deutsche CROCI® U.S. VIP | | | | | 23 |
| | | | | | | | |
Name, Year of Birth,
Position with the Fund and
Length of Time Served1 | | Business Experience and Directorships During the Past Five Years | | Number of
Funds in
Deutsche
Fund
Complex
Overseen | | | Other
Directorships
Held by Board
Member |
Paul K. Freeman (1950) Board Member since 1993 | | Consultant, World Bank/Inter-American Development Bank; Independent Directors Council (former chair); Investment Company Institute (executive and nominating committees); formerly: Chairman of Education Committee of Independent Directors Council; Project Leader, International Institute for Applied Systems Analysis (1998–2001); Chief Executive Officer, The Eric Group, Inc. (environmental insurance) (1986–1998); Directorships: Denver Zoo Foundation (December 2012–present); Knoebel Institute for Healthy Aging, University of Denver (2017–present); former Directorships: Prisma Energy International | | | 89 | | | — |
Richard J. Herring (1946) Board Member since 1990 | | Jacob Safra Professor of International Banking and Professor, Finance Department, The Wharton School, University of Pennsylvania (since July 1972); Co-Director, Wharton Financial Institutions Center; formerly: Vice Dean and Director, Wharton Undergraduate Division (July 1995–June 2000); Director, Lauder Institute of International Management Studies (July 2000–June 2006) | | | 89 | | | Director,
Aberdeen
Singapore
and Japan
Funds (since
2007);
Independent
Director of
Barclays
Bank
Delaware
(since
September
2010) |
William McClayton (1944) Board Member since 2004 | | Private equity investor (since October 2009); previously, Managing Director, Diamond Management & Technology Consultants, Inc. (global consulting firm) (2001–2009); Directorship: Board of Managers, YMCA of Metropolitan Chicago; formerly: Senior Partner, Arthur Andersen LLP (accounting) (1966–2001); Trustee, Ravinia Festival | | | 89 | | | — |
Rebecca W. Rimel (1951) Board Member since 1995 | | President, Chief Executive Officer and Director, The Pew Charitable Trusts (charitable organization) (1994–present); formerly: Executive Vice President, The Glenmede Trust Company (investment trust and wealth management) (1983–2004); Board Member, Investor Education (charitable organization) (2004–2005); Trustee, Executive Committee, Philadelphia Chamber of Commerce (2001–2007); Director, Viasys Health Care2 (January 2007–June 2007); Trustee, Thomas Jefferson Foundation (charitable organization) (1994–2012) | | | 89 | | | Director,
Becton
Dickinson
and
Company2
(medical
technology
company)
(2012–
present);
Director,
BioTelemetry
Inc2 (health
care) (2009–
present) |
William N. Searcy, Jr. (1946) Board Member since 1993 | | Private investor since October 2003; formerly: Pension & Savings Trust Officer, Sprint Corporation2 (telecommunications) (November 1989–September 2003); Trustee, Sun Capital Advisers Trust (mutual funds) (1998–2012) | | | 89 | | | — |
Jean Gleason Stromberg (1943) Board Member since 1997 | | Retired. Formerly, Consultant (1997–2001); Director, Financial Markets U.S. Government Accountability Office (1996–1997); Partner, Norton Rose Fulbright, L.L.P. (law firm) (1978–1996); former Directorships: The William and Flora Hewlett Foundation (charitable organization) (2000–2015); Service Source, Inc. (nonprofit), Mutual Fund Directors Forum (2002–2004), American Bar Retirement Association (funding vehicle for retirement plans) (1987–1990 and 1994–1996) | | | 89 | | | — |
| | | | | | |
| | 24 | | | | | | Deutsche Variable Series II — Deutsche CROCI® U.S. VIP |
| | |
| Officers4 | | |
Name, Year of Birth,
Position with the Fund and
Length of Time Served5 | | Business Experience and Directorships During the Past Five Years |
Hepsen Uzcan6,9 (1974) President and Chief Executive Officer, 2017–present Assistant Secretary, 2013–present | | Director,3 Deutsche Asset Management; formerly: Vice President for the Deutsche funds (2016–2017) |
John Millette8 (1962) Vice President and Secretary, 1999–present | | Director,3 Deutsche Asset Management; Chief Legal Officer, Deutsche Investment Management Americas Inc. (2015–present); and Director and Vice President, Deutsche AM Trust Company (since 2016); formerly: Secretary, Deutsche Investment Management Americas Inc. (2015–2017) |
Paul H. Schubert6 (1963) Chief Financial Officer, 2004–present Treasurer, 2005–present | | Managing Director,3 Deutsche Asset Management, and Chairman, Director and President, Deutsche AM Trust Company (since 2013); Vice President, Deutsche AM Distributors, Inc. (since 2016); Director, Deutsche AM Service Company (since 2017); Director and President, DB Investment Managers, Inc. (since 2017); formerly: Director, Deutsche AM Trust Company (2004–2013) |
Caroline Pearson8 (1962) Chief Legal Officer, 2010–present | | Managing Director,3 Deutsche Asset Management; formerly: Secretary, Deutsche AM Distributors, Inc.; and Secretary, Deutsche AM Service Company |
Scott D. Hogan8 (1970) Chief Compliance Officer, 2016–present | | Director,3 Deutsche Asset Management |
Wayne Salit7 (1967) Anti-Money Laundering Compliance Officer, 2014–present | | Director,3 Deutsche Asset Management; formerly: Managing Director, AML Compliance Officer at BNY Mellon (2011–2014); and Director, AML Compliance Officer at Deutsche Bank (2004–2011) |
Sheila Cadogan8 (1966) Assistant Treasurer, since July 12, 2017 | | Director,3 Deutsche Asset Management |
Paul Antosca8 (1957) Assistant Treasurer, 2007–present | | Director,3 Deutsche Asset Management |
Diane Kenneally8 (1966) Assistant Treasurer, 2007–present | | Director,3 Deutsche Asset Management |
| 1 | The length of time served represents the year in which the Board Member joined the board of one or more Deutsche funds currently overseen by the Board. |
| 2 | A publicly held company with securities registered pursuant to Section 12 of the Securities Exchange Act of 1934. |
| 3 | Executive title, not a board directorship. |
| 4 | As a result of their respective positions held with the Advisor, these individuals are considered “interested persons” of the Advisor within the meaning of the 1940 Act. Interested persons receive no compensation from the Fund. |
| 5 | The length of time served represents the year in which the officer was first elected in such capacity for one or more Deutsche funds. |
| 6 | Address: 345 Park Avenue, New York, NY 10154. |
| 7 | Address: 60 Wall Street, New York, NY 10005. |
| 8 | Address: One International Place, Boston, MA 02110. |
| 9 | Appointed President and Chief Executive Officer effective December 1, 2017. |
The Fund’s Statement of Additional Information (“SAI”) includes additional information about the Board Members. The SAI is available, without charge, upon request. If you would like to request a copy of the SAI, you may do so by calling the following toll-free number: (800) 728-3337.
| | | | |
Deutsche Variable Series II — Deutsche CROCI® U.S. VIP | | | | | 25 |
| | |
 | | |
VS2CUS-2 (R-025833-7 2/18) | | |

December 31, 2017
Annual Report
Deutsche Variable Series II
Deutsche Global Equity VIP

Contents
This report must be preceded or accompanied by a prospectus. To obtain an additional prospectus or summary prospectus, if available, call (800) 728-3337 or your financial representative. We advise you to consider the Fund’s objectives, risks, charges and expenses carefully before investing. The summary prospectus and prospectus contain this and other important information about the Fund. Please read the prospectus carefully before you invest.
Stocks may decline in value. Investing in foreign securities, particularly those of emerging markets, presents certain risks, such as currency fluctuations, political and economic changes, and market risks. Emerging markets tend to be more volatile and less liquid than the markets of more mature economies, and generally have less diverse and less mature economic structures and less stable political systems than those of developed countries. Investing in derivatives entails special risks relating to liquidity, leverage and credit that may reduce returns and/or increase volatility. The Fund may lend securities to approved institutions. Please read the prospectus for details.
Deutsche Asset Management represents the asset management activities conducted by Deutsche Bank AG or any of its subsidiaries.
Deutsche AM Distributors, Inc., 222 South Riverside Plaza, Chicago, IL 60606, (800) 621-1148
NOT FDIC/NCUA INSURED NO BANK GUARANTEE MAY LOSE VALUE NOT A DEPOSIT
NOT INSURED BY ANY FEDERAL GOVERNMENT AGENCY
| | | | | | |
| | 2 | | | | | | Deutsche Variable Series II — Deutsche Global Equity VIP |
| | |
| Performance Summary | | December 31, 2017 (Unaudited) |
Fund performance shown is historical, assumes reinvestment of all dividend and capital gain distributions and does not guarantee future results. Investment return and principal value fluctuate with changing market conditions so that, when redeemed, shares may be worth more or less than their original cost. Current performance may be lower or higher than the performance data quoted. Please contact your participating insurance company for the Fund’s most recent month-end performance. Performance doesn’t reflect charges and fees (“contract charges”) associated with the separate account that invests in the Fund or any variable life insurance policy or variable annuity contract for which the Fund is an investment option. These charges and fees will reduce returns.
The gross expense ratio of the Fund, as stated in the fee table of the prospectus dated May 1, 2017 is 1.03% for Class A shares and may differ from the expense ratio disclosed in the Financial Highlights table in this report.
Generally accepted accounting principles require adjustments to be made to the net assets of the Fund at period end for financial reporting purposes only, and as such, the total return based on the unadjusted net asset value per share may differ from the total return reported in the financial highlights.
Growth of an Assumed $10,000 Investment in Deutsche Global Equity VIP
| | |
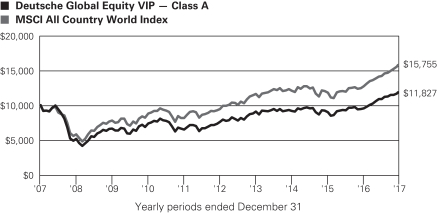 | | The MSCI All Country World Index captures large and mid cap representation across 23 Developed Markets and 23 Emerging Markets countries. Index returns do not reflect any fees or expenses and it is not possible to invest directly into an index. |
| | | | | | | | | | |
| Comparative Results | | | | | | | | | | |
| | | | | |
| Deutsche Global Equity VIP | | | | 1-Year | | 3-Year | | 5-Year | | 10-Year |
| Class A | | Growth of $10,000 | | $12,404 | | $12,932 | | $15,605 | | $11,827 |
| | | Average annual total return | | 24.04% | | 8.95% | | 9.31% | | 1.69% |
| MSCI All Country World Index | | Growth of $10,000 | | $12,397 | | $13,056 | | $16,700 | | $15,755 |
| | | Average annual total return | | 23.97% | | 9.30% | | 10.80% | | 4.65% |
The growth of $10,000 is cumulative.
| | | | |
Deutsche Variable Series II — Deutsche Global Equity VIP | | | | | 3 |
| | |
| Management Summary | | December 31, 2017 (Unaudited) |
Global equities delivered strong performance in 2017, as gauged by the 23.97% return of the Fund’s benchmark, the MSCI AC World Index. Class A shares of the Fund returned 24.04% (unadjusted for contract charges).
The markets’ positive showing reflected the supportive backdrop of improving global growth and robust corporate earnings. Political developments were also supportive, highlighted by market-friendly outcomes of elections in Europe and the passage of a reduction of the corporate tax rate in the United States. In addition, economic growth — while accelerating — did not pick up to a large enough extent that the U.S. Federal Reserve and other major central banks were compelled to tighten monetary policy aggressively. In this environment, U.S. stocks climbed to a series of record highs with unusually low volatility, led by faster-growing and higher-risk market segments. Overseas, both developed- and emerging-market stocks registered robust gains and outpaced the United States due to the combination of better-than-expected economic data and weakness in the U.S. dollar.
The Fund’s sector allocations proved to be a significant tailwind for performance. Since we use a bottom-up process designed to identify what we think are the most compelling individual-stock growth opportunities in the world markets, the portfolio’s sector weightings can deviate widely from the index. This worked to our benefit, as we held a sizable overweight in the information technology sector — which outpaced the broader market — along with underweights in slower-growing sectors that lagged, such as utilities, telecommunications services and real estate. An underweight position in energy further aided the Fund’s return.
Stock selection made a modest contribution to results, highlighted by our investments in information technology and financials. In the former, Activision Blizzard, Inc. generated market-beating gains thanks to the release of new games, a strong presence in online gaming and the increasing popularity of eSports. Applied Materials, Inc., whose status as the leading supplier of semiconductor fabrication equipment enabled it to take advantage of the robust order cycle in the chip industry, also rallied. Tencent Holdings, Ltd. which capitalized on the rapid growth of e-commerce in China and exceeded analysts’ growth expectations, was an additional contributor of note. In financials, our position in Progressive Corp. benefited from an improving growth outlook, and the Canadian company Brookfield Asset Management, Inc. was boosted by rising earnings, continued gains in its assets under management and the expansion of its emerging-markets business.
Our stock selection was less effective in the materials sector. The Fund’s holdings, while producing a positive return in the aggregate, did not keep up with the materials stocks in the benchmark. In energy, we fell short of the index return due to positions in Noble Energy, Inc. and Schlumberger Ltd. The health care sector also proved to be a challenging area for the Fund. Shares of Celgene Corp. declined after the company lowered its long-term earnings expectations, and the pharmaceutical developer Allergan PLC* slid due to heightened generic competition for one of its key medications. A position in the U.S. media giant Time Warner, Inc.* also cost the Fund some performance due to regulatory challenges that reduced the likelihood of AT&T, Inc.* executing its planned acquisition of the company.
We continued to focus our efforts on identifying stocks positioned for sustainable, above-average growth that were trading below what we believed were their intrinsic values. As always, we remained focused on delivering outperformance through the quality of our stock picking rather than making macroeconomic calls or taking excessive risk. With the markets in general — and growth stocks in particular — having come so far in the past two years, we think intensive company research and bottom-up security selection have become even more important in generating positive investment results. Accordingly, we emphasized companies with sustainable, above-average growth that we believe can provide a firm foundation for longer-term performance.
Sebastian P. Werner, PhD, Director
Mark Schumann, CFA, Director
Portfolio Managers
The views expressed reflect those of the portfolio management team only through the end of the period of the report as stated on the cover. The management team’s views are subject to change at any time based on market and other conditions and should not be construed as a recommendation. Past performance is no guarantee of future results. Current and future portfolio holdings are subject to risk.
| | | | | | |
| | 4 | | | | | | Deutsche Variable Series II — Deutsche Global Equity VIP |
Terms to Know
The MSCI All Country (AC) World Index is a free float-adjusted market capitalization weighted index that is designed to measure the equity market performance of developed and emerging markets. The index consists of 46 country indices comprising 23 developed and 23 emerging market country indices. Index returns do not reflect fees or expenses and it is not possible to invest directly into an index.
Index returns do not reflect fees or expenses and it is not possible to invest directly into an index.
Underweight means the Fund holds a lower weighting in a given sector or security than the benchmark. Overweight means it holds a higher weighting.
Contribution incorporates both a stock’s total return and its weighting in the Fund.
| * | Held and sold prior to December 31, 2017. AT&T was not held in 2017. |
| | | | |
Deutsche Variable Series II — Deutsche Global Equity VIP | | | | | 5 |
| | | | |
| Portfolio Summary | | | (Unaudited | ) |
| | | | | | | | |
| Asset Allocation (As a % of Investment Portfolio excluding Securities Lending Collateral) | | 12/31/17 | | | 12/31/16 | |
| Common Stocks | | | 98% | | | | 98% | |
| Cash Equivalents | | | 2% | | | | 1% | |
| Preferred Stock | | | 0% | | | | 1% | |
| | | | 100% | | | | 100% | |
| | |
Sector Diversification (As a % of Investment Portfolio excluding Cash Equivalents and Securities
Lending Collateral) | | 12/31/17 | | | 12/31/16 | |
| Information Technology | | | 26% | | | | 21% | |
| Financials | | | 19% | | | | 13% | |
| Health Care | | | 19% | | | | 20% | |
| Industrials | | | 11% | | | | 8% | |
| Consumer Discretionary | | | 7% | | | | 9% | |
| Consumer Staples | | | 6% | | | | 12% | |
| Materials | | | 6% | | | | 7% | |
| Energy | | | 3% | | | | 6% | |
| Telecommunication Services | | | 2% | | | | 2% | |
| Real Estate | | | 1% | | | | 2% | |
| | | | 100% | | | | 100% | |
| | |
Geographical Diversification (As a % of Investment Portfolio excluding Cash Equivalents and
Securities Lending Collateral) | | 12/31/17 | | | 12/31/16 | |
| United States | | | 51% | | | | 55% | |
| Canada | | | 9% | | | | 7% | |
| Switzerland | | | 7% | | | | 7% | |
| Germany | | | 7% | | | | 6% | |
| United Kingdom | | | 7% | | | | 6% | |
| China | | | 6% | | | | 1% | |
| France | | | 3% | | | | — | |
| Finland | | | 2% | | | | 2% | |
| Ireland | | | 2% | | | | 2% | |
| Luxembourg | | | 1% | | | | 2% | |
| Sweden | | | 1% | | | | 3% | |
| Japan | | | 1% | | | | 3% | |
| Others | | | 3% | | | | 6% | |
| | | | 100% | | | | 100% | |
Portfolio holdings and characteristics are subject to change.
For more complete details about the Fund’s investment portfolio, see page 7.
Following the Fund’s fiscal first and third quarter-end, a complete portfolio holdings listing is filed with the SEC on Form N-Q. The form will be available on the SEC’s Web site at sec.gov, and it also may be reviewed and copied at the SEC’s Public Reference Room in Washington, D.C. Information on the operation of the SEC’s Public Reference Room may be obtained by calling (800) SEC-0330. The Fund’s portfolio holdings are also posted on deutschefunds.com from time to time. Please see the Fund’s current prospectus for more information.
| | | | | | |
| | 6 | | | | | | Deutsche Variable Series II — Deutsche Global Equity VIP |
| | |
| Investment Portfolio | | December 31, 2017 |
| | | | | | | | |
| | | Shares | | | Value ($) | |
| Common Stocks 98.1% | | | | | | | | |
Australia 1.0% | | | | | | | | |
Australia & New Zealand Banking Group Ltd. (Cost $291,975) | | | 13,300 | | | | 297,925 | |
| | |
Canada 9.0% | | | | | | | | |
Agnico Eagle Mines Ltd. | | | 12,100 | | | | 558,778 | |
Alimentation Couche-Tard, Inc. “B” | | | 10,200 | | | | 532,234 | |
Brookfield Asset Management, Inc. “A” | | | 21,400 | | | | 931,589 | |
Canada Goose Holdings, Inc.* | | | 10,700 | | | | 338,025 | |
Toronto-Dominion Bank | | | 6,700 | | | | 392,566 | |
| | | | | | | | |
(Cost $1,682,802) | | | | | | | 2,753,192 | |
| | |
China 5.6% | | | | | | | | |
Alibaba Group Holding Ltd. (ADR)* | | | 2,600 | | | | 448,318 | |
China Life Insurance Co., Ltd. “H” | | | 94,000 | | | | 295,293 | |
China Literature Ltd. 144A* | | | 14 | | | | 149 | |
New Oriental Education & Technology Group, Inc. (ADR) | | | 1,900 | | | | 178,600 | |
Ping An Insurance (Group) Co. of China Ltd. “H” | | | 15,500 | | | | 161,514 | |
Tencent Holdings Ltd. | | | 12,300 | | | | 639,764 | |
| | | | | | | | |
(Cost $1,227,682) | | | | | | | 1,723,638 | |
| | |
Finland 1.9% | | | | | | | | |
Sampo Oyj “A” (Cost $494,083) | | | 10,700 | | | | 588,597 | |
| | |
France 3.1% | | | | | | | | |
Air Liquide SA | | | 1,500 | | | | 189,178 | |
VINCI SA | | | 4,500 | | | | 460,051 | |
Vivendi SA | | | 11,500 | | | | 308,895 | |
| | | | | | | | |
(Cost $952,517) | | | | | | | 958,124 | |
| | |
Germany 6.6% | | | | | | | | |
Allianz SE (Registered) | | | 2,800 | | | | 644,520 | |
BASF SE | | | 2,400 | | | | 264,818 | |
Fresenius Medical Care AG & Co. KGaA | | | 8,000 | | | | 843,709 | |
Siemens AG (Registered) | | | 1,900 | | | | 265,202 | |
| | | | | | | | |
(Cost $1,338,957) | | | | | | | 2,018,249 | |
| | |
Ireland 1.7% | | | | | | | | |
Kerry Group PLC “A” (a) | | | 4,321 | | | | 485,083 | |
Kerry Group PLC “A” (a) | | | 479 | | | | 53,753 | |
| | | | | | | | |
(Cost $326,642) | | | | | | | 538,836 | |
| | |
Japan 1.2% | | | | | | | | |
Komatsu Ltd. | | | 6,000 | | | | 217,603 | |
SMC Corp. | | | 400 | | | | 164,586 | |
| | | | | | | | |
(Cost $341,579) | | | | | | | 382,189 | |
| | |
Luxembourg 1.4% | | | | | | | | |
Eurofins Scientific (Cost $150,981) | | | 700 | | | | 426,435 | |
| | |
Malaysia 0.7% | | | | | | | | |
IHH Healthcare Bhd. (Cost $184,246) | | | 141,500 | | | | 204,788 | |
| | |
Norway 0.5% | | | | | | | | |
Marine Harvest ASA* (Cost $95,936) | | | 8,400 | | | | 142,129 | |
| | |
Sweden 1.4% | | | | | | | | |
Assa Abloy AB “B” (Cost $330,340) | | | 20,100 | | | | 418,168 | |
| | | | | | | | |
| | | Shares | | | Value ($) | |
Switzerland 7.3% | | | | | | | | |
Comet Holding AG (Registered)* | | | 1,400 | | | | 220,862 | |
Lonza Group AG (Registered)* | | | 2,100 | | | | 567,932 | |
Nestle SA (Registered) | | | 8,015 | | | | 689,594 | |
Roche Holding AG (Genusschein) | | | 2,300 | | | | 582,176 | |
u-blox Holding AG* | | | 830 | | | | 163,397 | |
| | | | | | | | |
(Cost $1,357,520) | | | | | | | 2,223,961 | |
| | |
United Kingdom 6.5% | | | | | | | | |
Aon PLC (b) | | | 4,400 | | | | 589,600 | |
Compass Group PLC | | | 24,600 | | | | 531,466 | |
Halma PLC | | | 26,500 | | | | 450,945 | |
Spirax-Sarco Engineering PLC | | | 5,600 | | | | 425,139 | |
| | | | | | | | |
(Cost $1,337,029) | | | | | | | 1,997,150 | |
| | |
United States 50.2% | | | | | | | | |
A.O. Smith Corp. | | | 4,400 | | | | 269,632 | |
Acadia Healthcare Co., Inc.* (c) | | | 8,000 | | | | 261,040 | |
Activision Blizzard, Inc. | | | 7,400 | | | | 468,568 | |
Alphabet, Inc. “A”* | | | 580 | | | | 610,972 | |
American Express Co. | | | 3,300 | | | | 327,723 | |
AMETEK, Inc. | | | 7,700 | | | | 558,019 | |
Amphenol Corp. “A” | | | 9,600 | | | | 842,880 | |
Apple, Inc. | | | 4,450 | | | | 753,073 | |
Applied Materials, Inc. | | | 11,000 | | | | 562,320 | |
Biogen, Inc.* | | | 840 | | | | 267,599 | |
Bristol-Myers Squibb Co. | | | 4,200 | | | | 257,376 | |
CBRE Group, Inc. “A”* | | | 4,800 | | | | 207,888 | |
Celgene Corp.* | | | 4,800 | | | | 500,928 | |
Danaher Corp. | | | 6,400 | | | | 594,048 | |
Ecolab, Inc. | | | 3,400 | | | | 456,212 | |
EOG Resources, Inc. | | | 3,400 | | | | 366,894 | |
EPAM Systems, Inc.* | | | 2,100 | | | | 225,603 | |
Evolent Health, Inc. “A”* (c) | | | 13,400 | | | | 164,820 | |
Exxon Mobil Corp. | | | 2,100 | | | | 175,644 | |
Facebook, Inc. “A”* | | | 2,830 | | | | 499,382 | |
Fidelity National Information Services, Inc. | | | 3,100 | | | | 291,679 | |
Hologic, Inc.* | | | 5,100 | | | | 218,025 | |
Intuit, Inc. | | | 1,600 | | | | 252,448 | |
JPMorgan Chase & Co. | | | 6,000 | | | | 641,640 | |
LKQ Corp.* | | | 9,400 | | | | 382,298 | |
Mastercard, Inc. “A” | | | 5,700 | | | | 862,752 | |
Noble Energy, Inc. | | | 5,600 | | | | 163,184 | |
Oracle Corp. | | | 5,400 | | | | 255,312 | |
Palo Alto Networks, Inc.* | | | 1,500 | | | | 217,410 | |
Progressive Corp. | | | 14,500 | | | | 816,640 | |
QUALCOMM, Inc. | | | 3,500 | | | | 224,070 | |
Schlumberger Ltd. | | | 4,600 | | | | 309,994 | |
Scotts Miracle-Gro Co. | | | 3,000 | | | | 320,970 | |
T-Mobile U.S., Inc.* | | | 10,100 | | | | 641,451 | |
TJX Companies, Inc. | | | 4,300 | | | | 328,778 | |
Union Pacific Corp. | | | 2,400 | | | | 321,840 | |
United Technologies Corp. | | | 1,300 | | | | 165,841 | |
Zoetis, Inc. | | | 8,000 | | | | 576,320 | |
| | | | | | | | |
(Cost $10,766,115) | | | | | | | 15,361,273 | |
Total Common Stocks
(Cost $20,878,404) | | | | | | | 30,034,654 | |
The accompanying notes are an integral part of the financial statements.
| | | | |
Deutsche Variable Series II — Deutsche Global Equity VIP | | | | | 7 |
| | | | | | | | |
| | | Shares | | | Value ($) | |
| Preferred Stock 0.3% | | | | | | | | |
| Germany | | | | | | | | |
Draegerwerk AG & Co. KGaA (Cost $78,140) | | | 1,100 | | | | 95,546 | |
| |
| Securities Lending Collateral 1.3% | | | | | |
Deutsche Government & Agency Securities Portfolio “Deutsche Government Cash Institutional Shares”, 1.21% (d) (e) (Cost $395,119) | | | 395,119 | | | | 395,119 | |
| | | | | | | | |
| | | Shares | | | Value ($) | |
| Cash Equivalents 1.6% | | | | | | | | |
Deutsche Central Cash Management Government Fund, 1.30% (d) (Cost $480,743) | | | 480,743 | | | | 480,743 | |
| | |
| | | % of Net
Assets | | | Value ($) | |
Total Investment Portfolio (Cost $21,832,406) | | | 101.3 | | | | 31,006,062 | |
| Other Assets and Liabilities, Net | | | (1.3 | ) | | | (397,667 | ) |
| Net Assets | | | 100.0 | | | | 30,608,395 | |
| * | Non-income producing security. |
| (a) | Securities with the same description are the same corporate entity but trade on different stock exchanges. |
| (b) | Listed on the New York Stock Exchange. |
| (c) | All or a portion of these securities were on loan. In addition, “Other Assets and Liabilities, Net” may include pending sales that are also on loan. The value of securities loaned at December 31, 2017 amounted to $376,740, which is 1.2% of net assets. |
| (d) | Affiliated fund managed by Deutsche Investment Management Americas Inc. The rate shown is the annualized seven-day yield at period end. |
| (e) | Represents collateral held in connection with securities lending. Income earned by the Fund is net of borrower rebates. |
144A: Security exempt from registration under Rule 144A of the Securities Act of 1933. These securities may be resold in transactions exempt from registration, normally to qualified institutional buyers.
ADR: American Depositary Receipt
Fair Value Measurements
Various inputs are used in determining the value of the Fund’s investments. These inputs are summarized in three broad levels. Level 1 includes quoted prices in active markets for identical securities. Level 2 includes other significant observable inputs (including quoted prices for similar securities, interest rates, prepayment speeds and credit risk). Level 3 includes significant unobservable inputs (including the Fund’s own assumptions in determining the fair value of investments). The level assigned to the securities valuations may not be an indication of the risk or liquidity associated with investing in those securities.
The following is a summary of the inputs used as of December 31, 2017 in valuing the Fund’s investments. For information on the Fund’s policy regarding the valuation of investments, please refer to the Security Valuation section of Note A in the accompanying Notes to Financial Statements.
| | | | | | | | | | | | | | | | |
| Assets | | Level 1 | | | Level 2 | | | Level 3 | | | Total | |
| Common Stocks | | | | | | | | | | | | | | | | |
Australia | | $ | — | | | $ | 297,925 | | | $ | — | | | $ | 297,925 | |
Canada | | | 2,753,192 | | | | — | | | | — | | | | 2,753,192 | |
China | | | 627,067 | | | | 1,096,571 | | | | — | | | | 1,723,638 | |
Finland | | | — | | | | 588,597 | | | | — | | | | 588,597 | |
France | | | — | | | | 958,124 | | | | — | | | | 958,124 | |
Germany | | | — | | | | 2,018,249 | | | | — | | | | 2,018,249 | |
Ireland | | | — | | | | 538,836 | | | | — | | | | 538,836 | |
Japan | | | — | | | | 382,189 | | | | — | | | | 382,189 | |
Luxembourg | | | — | | | | 426,435 | | | | — | | | | 426,435 | |
Malaysia | | | — | | | | 204,788 | | | | — | | | | 204,788 | |
Norway | | | — | | | | 142,129 | | | | — | | | | 142,129 | |
Sweden | | | — | | | | 418,168 | | | | — | | | | 418,168 | |
Switzerland | | | — | | | | 2,223,961 | | | | — | | | | 2,223,961 | |
United Kingdom | | | 589,600 | | | | 1,407,550 | | | | — | | | | 1,997,150 | |
United States | | | 15,361,273 | | | | — | | | | — | | | | 15,361,273 | |
| Preferred Stocks (f) | | | — | | | | 95,546 | | | | — | | | | 95,546 | |
| Short-Term Investments (f) | | | 875,862 | | | | — | | | | — | | | | 875,862 | |
| Total | | $ | 20,206,994 | | | $ | 10,799,068 | | | $ | — | | | $ | 31,006,062 | |
There have been no transfers between fair value measurement levels during the year ended December 31, 2017.
| (f) | See Investment Portfolio for additional detailed categorizations. |
The accompanying notes are an integral part of the financial statements.
| | | | | | |
| | 8 | | | | | | Deutsche Variable Series II — Deutsche Global Equity VIP |
| | | | |
Statement of Assets and Liabilities | |
| as of December 31, 2017 | | | | |
| |
| Assets | | | | |
| Investments in non-affiliated securities, at value (cost $20,956,544) — including $376,740 of securities loaned | | $ | 30,130,200 | |
| Investment in Deutsche Government & Agency Securities Portfolio (cost $395,119)* | | | 395,119 | |
| Investment in Deutsche Central Cash Management Government Fund (cost $480,743) | | | 480,743 | |
| Foreign currency, at value (cost $145,464) | | | 146,740 | |
| Dividends receivable | | | 8,457 | |
| Interest receivable | | | 789 | |
| Foreign taxes recoverable | | | 21,289 | |
| Other assets | | | 956 | |
| Total assets | | | 31,184,293 | |
| |
| Liabilities | | | | |
| Payable upon return of securities loaned | | | 395,119 | |
| Payable for Fund shares redeemed | | | 71,259 | |
| Accrued management fee | | | 19,405 | |
| Accrued Trustees’ fees | | | 1,054 | |
| Other accrued expenses and payables | | | 89,061 | |
| Total liabilities | | | 575,898 | |
| Net assets, at value | | $ | 30,608,395 | |
| |
| Net Assets Consist of | | | | |
| Undistributed net investment income | | | 209,108 | |
| Net unrealized appreciation (depreciation) on: | | | | |
Investments | | | 9,173,656 | |
Foreign currency | | | 750 | |
| Accumulated net realized gain (loss) | | | (91,638 | ) |
| Paid-in capital | | | 21,316,519 | |
| Net assets, at value | | $ | 30,608,395 | |
Class A | | | | |
| Net Asset Value, offering and redemption price per share ($30,608,395 ÷ 2,616,821 outstanding shares of beneficial interest, no par value, unlimited number of shares authorized) | | $ | 11.70 | |
* Represents collateral on securities loaned. | | | | |
| | | | |
Statement of Operations | |
| for the year ended December 31, 2017 | |
| |
| Investment Income | | | | |
| Income: | | | | |
| Dividends (net of foreign taxes withheld of $38,865) | | $ | 617,693 | |
| Income distributions — Deutsche Central Cash Management Government Fund | | | 5,392 | |
| Securities lending income, net of borrower rebates | | | 5,617 | |
| Total income | | | 628,702 | |
| Expenses: | | | | |
| Management fee | | | 283,683 | |
| Administration fee | | | 43,644 | |
| Services to Shareholders | | | 326 | |
| Custodian fee | | | 22,782 | |
| Professional fees | | | 73,321 | |
| Reports to shareholders | | | 16,620 | |
| Trustees’ fees and expenses | | | 4,247 | |
| Other | | | 17,328 | |
| Total expenses before expense reductions | | | 461,951 | |
| Expense reductions | | | (49,159 | ) |
| Total expenses after expense reductions | | | 412,792 | |
| Net investment income | | | 215,910 | |
| |
| Realized and Unrealized Gain (Loss) | | | | |
| Net realized gain (loss) from: | | | | |
| Investments | | | 5,312,794 | |
| Foreign currency | | | 8,849 | |
| | | | 5,321,643 | |
| Change in net unrealized appreciation (depreciation) on: | | | | |
| Investments | | | 3,909,848 | |
| Foreign currency | | | 7,479 | |
| | | | 3,917,327 | |
| Net gain (loss) | | | 9,238,970 | |
| Net increase (decrease) in net assets resulting from operations | | $ | 9,454,880 | |
The accompanying notes are an integral part of the financial statements.
| | | | |
Deutsche Variable Series II — Deutsche Global Equity VIP | | | | | 9 |
| | | | | | | | |
| Statements of Changes in Net Assets | | | | | | | | |
| | | | | | | | |
| | | Years Ended December 31, | |
| Increase (Decrease) in Net Assets | | 2017 | | | 2016 | |
| Operations: | | | | | | | | |
| Net investment income (loss) | | $ | 215,910 | | | $ | 218,495 | |
| Net realized gain (loss) | | | 5,321,643 | | | | 1,040,800 | |
| Change in net unrealized appreciation (depreciation) | | | 3,917,327 | | | | 1,213,259 | |
| Net increase (decrease) in net assets resulting from operations | | | 9,454,880 | | | | 2,472,554 | |
| Distributions to shareholders from: | | | | | | | | |
| Net investment income: | | | | | | | | |
Class A | | | (233,988 | ) | | | (336,718 | ) |
| Fund share transactions: | | | | | | | | |
Class A | | | | | | | | |
| Proceeds from shares sold | | | 1,174,131 | | | | 1,414,193 | |
| Reinvestment of distributions | | | 233,988 | | | | 336,718 | |
| Cost of shares redeemed | | | (23,512,478 | ) | | | (9,403,270 | ) |
| Net increase (decrease) in net assets from Class A share transactions | | | (22,104,359 | ) | | | (7,652,359 | ) |
| Increase (decrease) in net assets | | | (12,883,467 | ) | | | (5,516,523 | ) |
| Net assets at beginning of year | | | 43,491,862 | | | | 49,008,385 | |
| Net assets at end of year (including undistributed net investment income of $209,108 and $215,993, respectively) | | $ | 30,608,395 | | | $ | 43,491,862 | |
| | |
| Other Information | | | | | | | | |
Class A | | | | | | | | |
| Shares outstanding at beginning of period | | | 4,587,493 | | | | 5,446,357 | |
| Shares sold | | | 110,161 | | | | 152,025 | |
| Shares issued to shareholders in reinvestment of distributions | | | 22,499 | | | | 36,640 | |
| Shares redeemed | | | (2,103,332 | ) | | | (1,047,529 | ) |
| Net increase (decrease) in Class A shares | | | (1,970,672 | ) | | | (858,864 | ) |
| Shares outstanding at end of period | | | 2,616,821 | | | | 4,587,493 | |
The accompanying notes are an integral part of the financial statements.
| | | | | | |
| | 10 | | | | | | Deutsche Variable Series II — Deutsche Global Equity VIP |
| | | | | | | | | | | | | | | | | | | | |
| | | Years Ended December 31, | |
| Class A | | 2017 | | | 2016 | | | 2015 | | | 2014 | | | 2013 | |
| | | | | |
| Selected Per Share Data | | | | | | | | | | | | | | | | | | | | |
| Net asset value, beginning of period | | $ | 9.48 | | | $ | 9.00 | | | $ | 9.21 | | | $ | 9.27 | | | $ | 7.96 | |
| Income (loss) from investment operations: | | | | | | | | | | | | | | | | | | | | |
Net investment incomea | | | .05 | | | | .04 | | | | .05 | | | | .06 | | | | .14 | |
Net realized and unrealized gain (loss) | | | 2.22 | | | | .51 | | | | (.21 | ) | | | .04 | | | | 1.37 | |
Total from investment operations | | | 2.27 | | | | .55 | | | | (.16 | ) | | | .10 | | | | 1.51 | |
| Less distributions from: | | | | | | | | | | | | | | | | | | | | |
| Net investment income | | | (.05 | ) | | | (.07 | ) | | | (.05 | ) | | | (.16 | ) | | | (.20 | ) |
| Net asset value, end of period | | $ | 11.70 | | | $ | 9.48 | | | $ | 9.00 | | | $ | 9.21 | | | $ | 9.27 | |
| Total Return (%) | | | 24.04 | b | | | 6.11 | b,c | | | (1.75 | )b | | | 1.14 | | | | 19.31 | b |
| | | | | |
| Ratios to Average Net Assets and Supplemental Data | | | | | | | | | | | | | | | | | | | | |
| Net assets, end of period ($ millions) | | | 31 | | | | 43 | | | | 49 | | | | 68 | | | | 73 | |
| Ratio of expenses before expense reductions (%)d | | | 1.06 | | | | 1.03 | | | | 1.00 | | | | .95 | | | | 1.06 | |
| Ratio of expenses after expense reductions (%)d | | | .95 | | | | .95 | | | | .91 | | | | .95 | | | | .99 | |
| Ratio of net investment income (%) | | | .49 | | | | .49 | | | | .58 | | | | .59 | | | | 1.69 | |
| Portfolio turnover rate (%) | | | 19 | | | | 46 | | | | 79 | | | | 78 | | | | 139 | |
| a | Based on average shares outstanding during the period. |
| b | Total return would have been lower had certain expenses not been reimbursed. |
| c | Includes a reimbursement by the Advisor for a realized loss on a trade executed incorrectly, which otherwise would have reduced total return by 0.31%. |
| d | Expense ratio does not reflect charges and fees associated with the separate account that invests in the Fund or any variable life insurance policy or variable annuity contract for which the Fund is an investment option. |
| | | | |
Deutsche Variable Series II — Deutsche Global Equity VIP | | | | | 11 |
| | |
| Notes to Financial Statements | | |
A. Organization and Significant Accounting Policies
Deutsche Global Equity VIP (the “Fund”) is a diversified series of Deutsche Variable Series II (the “Trust”), which is registered under the Investment Company Act of 1940, as amended (the “1940 Act”), as an open-end management investment company organized as a Massachusetts business trust.
The Fund’s financial statements are prepared in accordance with accounting principles generally accepted in the United States of America (“U.S. GAAP”) which require the use of management estimates. Actual results could differ from those estimates. The Fund qualifies as an investment company under Topic 946 of Accounting Standards Codification of U.S. GAAP. The policies described below are followed consistently by the Fund in the preparation of its financial statements.
Security Valuation. Investments are stated at value determined as of the close of regular trading on the New York Stock Exchange on each day the exchange is open for trading.
Various inputs are used in determining the value of the Fund’s investments. These inputs are summarized in three broad levels. Level 1 includes quoted prices in active markets for identical securities. Level 2 includes other significant observable inputs (including quoted prices for similar securities, interest rates,
prepayment speeds and credit risk). Level 3 includes significant unobservable inputs (including the Fund’s own assumptions in determining the fair value of investments). The level assigned to the securities valuations may not be an indication of the risk or liquidity associated with investing in those securities.
Equity securities are valued at the most recent sale price or official closing price reported on the exchange (U.S. or foreign) or over-the-counter market on which they trade. Securities for which no sales are reported are valued at the calculated mean between the most recent bid and asked quotations on the relevant market or, if a mean cannot be determined, at the most recent bid quotation. Equity securities are generally categorized as Level 1. For certain international equity securities, in order to adjust for events which may occur between the close of the foreign exchanges and the close of the New York Stock Exchange, a fair valuation model may be used. This fair valuation model takes into account comparisons to the valuation of American Depository Receipts (ADRs), futures contracts and certain indices and these securities are categorized as Level 2.
Investments in open-end investment companies are valued at their net asset value each business day and are categorized as Level 1.
Securities and other assets for which market quotations are not readily available or for which the above valuation procedures are deemed not to reflect fair value are valued in a manner that is intended to reflect their fair value as determined in accordance with procedures approved by the Board and are generally categorized as Level 3. In accordance with the Fund’s valuation procedures, factors considered in determining value may include, but are not limited to, the type of the security; the size of the holding; the initial cost of the security; the existence of any contractual restrictions on the security’s disposition; the price and extent of public trading in similar securities of the issuer or of comparable companies; quotations or evaluated prices from broker-dealers and/or pricing services; information obtained from the issuer, analysts, and/or the appropriate stock exchange (for exchange-traded securities); an analysis of the company’s or issuer’s financial statements; an evaluation of the forces that influence the issuer and the market(s) in which the security is purchased and sold; and with respect to debt securities, the maturity, coupon, creditworthiness, currency denomination and the movement of the market in which the security is normally traded. The value determined under these procedures may differ from published values for the same securities.
Disclosure about the classification of fair value measurements is included in a table following the Fund’s Investment Portfolio.
Securities Lending. Deutsche Bank AG, as lending agent, lends securities of the Fund to certain financial institutions under the terms of its securities lending agreement. During the term of the loans, the Fund continues to receive interest and dividends generated by the securities and to participate in any changes in their market value. The Fund requires the borrowers of the securities to maintain collateral with the Fund consisting of either cash or liquid, unencumbered assets having a value at least equal to the value of the securities loaned. When the collateral falls below specified amounts, the lending agent will use its best effort to obtain additional collateral on the next business day to meet required amounts under the securities lending agreement. As of period end, any securities on loan were collateralized by cash. During the year ended December 31, 2017, the Fund invested the cash collateral into a joint trading account in affiliated money market funds managed by Deutsche Investment Management Americas Inc. As of December 31, 2017, the
| | | | | | |
| | 12 | | | | | | Deutsche Variable Series II — Deutsche Global Equity VIP |
Fund invested the cash collateral in Deutsche Government & Agency Securities Portfolio. Deutsche Investment Management Americas Inc. receives a management/administration fee (0.13% annualized effective rate as of December 31, 2017) on the cash collateral invested in Deutsche Government & Agency Securities Portfolio. The Fund receives compensation for lending its securities either in the form of fees or by earning interest on invested cash collateral net of borrower rebates and fees paid to a lending agent. Either the Fund or the borrower may terminate the loan at any time, and the borrower, after notice, is required to return borrowed securities within a standard time period. There may be risks of delay and costs in recovery of securities or even loss of rights in the collateral should the borrower of the securities fail financially. If the Fund is not able to recover securities lent, the Fund may sell the collateral and purchase a replacement investment in the market, incurring the risk that the value of the replacement security is greater than the value of the collateral. The Fund is also subject to all investment risks associated with the reinvestment of any cash collateral received, including, but not limited to, interest rate, credit and liquidity risk associated with such investments.
As of December 31, 2017, the Fund had securities on loan, which were classified as common stocks in the Investment Portfolio. The value of the related collateral exceeded the value of the securities loaned at period end. As of period end, the remaining contractual maturity of the collateral agreements were overnight and continuous.
Foreign Currency Translations. The books and records of the Fund are maintained in U.S. dollars. Investment securities and other assets and liabilities denominated in a foreign currency are translated into U.S. dollars at the prevailing exchange rates at period end. Purchases and sales of investment securities, income and expenses are translated into U.S. dollars at the prevailing exchange rates on the respective dates of the transactions.
Net realized and unrealized gains and losses on foreign currency transactions represent net gains and losses between trade and settlement dates on securities transactions, the acquisition and disposition of foreign currencies, and the difference between the amount of net investment income accrued and the U.S. dollar amount actually received. The portion of both realized and unrealized gains and losses on investments that results from fluctuations in foreign currency exchange rates is not separately disclosed but is included with net realized and unrealized gain/appreciation and loss/depreciation on investments.
Taxes. The Fund’s policy is to comply with the requirements of the Internal Revenue Code, as amended, which are applicable to regulated investment companies, and to distribute all of its taxable income to its shareholders.
Additionally, the Fund may be subject to taxes imposed by the governments of countries in which it invests and are generally based on income and/or capital gains earned or repatriated, a portion of which may be recoverable. Based upon the current interpretation of the tax rules and regulations, estimated tax liabilities and recoveries on certain foreign securities are recorded on an accrual basis and are reflected as components of interest income or net change in unrealized gain/loss on investments. Tax liabilities realized as a result of security sales are reflected as a component of net realized gain/loss on investments.
The Fund has reviewed the tax positions for the open tax years as of December 31, 2017 and has determined that no provision for income tax and/or uncertain tax positions is required in the Fund’s financial statements. The Fund’s federal tax returns for the prior three fiscal years remain open subject to examination by the Internal Revenue Service.
Distribution of Income and Gains. Distributions from net investment income of the Fund, if any, are declared and distributed to shareholders annually. Net realized gains from investment transactions, in excess of available capital loss carryforwards, would be taxable to the Fund if not distributed and, therefore, will be distributed to shareholders at least annually. The Fund may also make additional distributions for tax purposes if necessary.
The timing and characterization of certain income and capital gain distributions are determined annually in accordance with federal tax regulations which may differ from accounting principles generally accepted in the United States of America. These differences primarily relate to investments in foreign denominated investments, expiration of capital loss carryforward and certain securities sold at a loss. As a result, net investment income (loss) and net realized gain (loss) on investment transactions for a reporting period may differ significantly from distributions during such period. Accordingly, the Fund may periodically make reclassifications among certain of its capital accounts without impacting the net asset value of the Fund.
| | | | |
Deutsche Variable Series II — Deutsche Global Equity VIP | | | | | 13 |
At December 31, 2017, the Fund’s components of distributable earnings on a tax basis were as follows:
| | | | |
| Undistributed ordinary income* | | $ | 209,108 | |
| Unrealized appreciation (depreciation) on investments | | $ | 9,082,018 | |
At December 31, 2017, the aggregate cost of investments for federal income tax purposes was $21,924,044. The net unrealized appreciation for all investments based on tax cost was $9,082,018. This consisted of aggregate gross unrealized appreciation for all investments in which there was an excess of value over tax cost of $9,650,964 and aggregate gross unrealized depreciation for all investments in which there was an excess of tax cost over value of $568,946.
In addition, the tax character of distributions paid by the Fund is summarized as follows:
| | | | | | | | |
| | | Years Ended December 31, | |
| | | 2017 | | | 2016 | |
| Distributions from ordinary income* | | $ | 233,988 | | | $ | 336,718 | |
| * | For tax purposes, short-term capital gain distributions are considered ordinary income distributions. |
Expenses. Expenses of the Trust arising in connection with a specific fund are allocated to that fund. Other Trust expenses which cannot be directly attributed to a fund are apportioned among the funds in the Trust based upon the relative net assets or other appropriate measures.
Contingencies. In the normal course of business, the Fund may enter into contracts with service providers that contain general indemnification clauses. The Fund’s maximum exposure under these arrangements is unknown, as this would involve future claims that may be made against the Fund that have not yet been made. However, based on experience, the Fund expects the risk of loss to be remote.
Other. Investment transactions are accounted for on a trade date plus one basis for daily net asset value calculations. However, for financial reporting purposes, investment transactions are reported on trade date. Interest income is recorded on the accrual basis. Dividend income is recorded on the ex-dividend date net of foreign withholding taxes. Certain dividends from foreign securities may be recorded subsequent to the ex-dividend date as soon as the Fund is informed of such dividends. Realized gains and losses from investment transactions are recorded on an identified cost basis. Proceeds from litigation payments, if any, are included in net realized gain (loss) from investments.
B. Purchases and Sales of Securities
During the year ended December 31, 2017, purchases and sales of investment transactions (excluding short-term investments) aggregated $8,256,563 and $30,064,274, respectively.
C. Related Parties
Management Agreement. Under the Investment Management Agreement with Deutsche Investment Management Americas Inc. (“DIMA” or the “Advisor”), an indirect, wholly owned subsidiary of Deutsche Bank AG, the Advisor directs the investments of the Fund in accordance with its investment objectives, policies and restrictions. The Advisor determines the securities, instruments and other contracts relating to investments to be purchased, sold or entered into by the Fund.
Pursuant to the Investment Management Agreement with the Advisor, the Fund pays a monthly management fee based on the Fund’s average daily net assets, computed and accrued daily and payable monthly, at the following annual rates:
| | | | |
| First $1.5 billion | | | .650 | % |
| Next $1.75 billion | | | .635 | % |
| Next $1.75 billion | | | .620 | % |
| Over $5 billion | | | .605 | % |
Accordingly, for the year ended December 31, 2017, the fee pursuant to the Investment Management Agreement was equivalent to an annual rate (exclusive of any applicable waivers/reimbursements) of 0.65% of the Fund’s average daily net assets.
For the period from January 1, 2017 through September 30, 2017, the Advisor had contractually agreed to waive its fee and/or reimburse certain operating expenses to the extent necessary to maintain the total annual operating expenses (excluding certain expenses such as extraordinary expenses, taxes, brokerage and interest expense) of Class A shares at 0.95%.
| | | | | | |
| | 14 | | | | | | Deutsche Variable Series II — Deutsche Global Equity VIP |
Effective October 1, 2017 through September 30, 2018, the Advisor has contractually agreed to waive its fee and/or reimburse certain operating expenses to the extent necessary to maintain the total annual operating expenses (excluding certain expenses such as extraordinary expenses, taxes, brokerage and interest expense) of Class A shares at 0.93%.
For the year ended December 31, 2017, fees waived and/or expenses reimbursed were $49,159.
Administration Fee. Pursuant to an Administrative Services Agreement, DIMA provides most administrative services to the Fund. For all services provided under the Administrative Services Agreement, the Fund pays DIMA an annual fee (“Administration Fee”) of 0.10% of the Fund’s average daily net assets, computed and accrued daily and payable monthly. For the year ended December 31, 2017, the Administration Fee was $43,644, of which $2,605 is unpaid.
Service Provider Fees. Deutsche AM Service Company (“DSC”), an affiliate of the Advisor, is the transfer agent, dividend-paying agent and shareholder service agent for the Fund. Pursuant to a sub-transfer agency agreement between DSC and DST Systems, Inc. (“DST”), DSC has delegated certain transfer agent, dividend-paying agent and shareholder service agent functions to DST. DSC compensates DST out of the shareholder servicing fee it receives from the Fund. For the year ended December 31, 2017, the amounts charged to the Fund by DSC aggregated $81, of which $20 is unpaid.
Typesetting and Filing Service Fees. Under an agreement with DIMA, DIMA is compensated for providing certain pre-press and regulatory filing services to the Fund. For the year ended December 31, 2017, the amount charged to the Fund by DIMA included in the Statement of Operations under “Reports to shareholders” aggregated $9,727, of which $4,022 is unpaid.
Trustees’ Fees and Expenses. The Fund paid retainer fees to each Trustee not affiliated with the Advisor, plus specified amounts to the Board Chairperson and Vice Chairperson and to each committee Chairperson.
Affiliated Cash Management Vehicles. The Fund may invest uninvested cash balances in Deutsche Central Cash Management Government Fund and Deutsche Variable NAV Money Fund, affiliated money market funds which are managed by the Advisor. Each affiliated money market fund is managed in accordance with Rule 2a-7 under the 1940 Act, which governs the quality, maturity, diversity and liquidity of instruments in which a money market fund may invest. Deutsche Central Cash Management Government Fund seeks to maintain a stable net asset value, and Deutsche Variable NAV Money Fund maintains a floating net asset value. The Fund indirectly bears its proportionate share of the expenses of each affiliated money market fund in which it invests. Deutsche Central Cash Management Government Fund does not pay the Advisor an investment management fee. To the extent that Deutsche Variable NAV Money Fund pays an investment management fee to the Advisor, the Advisor will waive an amount of the investment management fee payable to the Advisor by the Fund equal to the amount of the investment management fee payable on the Fund’s assets invested in Deutsche Variable NAV Money Fund.
Securities Lending Fees. Deutsche Bank AG serves as lending agent for the Fund. For the year ended December 31, 2017, the Fund incurred lending agent fees to Deutsche Bank AG in the amount of $423.
D. Ownership of the Fund
At December 31, 2017, one participating insurance company was owner of record of 10% or more of the total outstanding Class A shares of the Fund, owning 99%.
E. Line of Credit
The Fund and other affiliated funds (the “Participants”) share in a $400 million revolving credit facility provided by a syndication of banks. The Fund may borrow for temporary or emergency purposes, including the meeting of redemption requests that otherwise might require the untimely disposition of securities. The Participants are charged an annual commitment fee which is allocated based on net assets, among each of the Participants. Interest is calculated at a rate per annum equal to the sum of the Federal Funds Rate plus 1.25 percent plus if the one-month LIBOR exceeds the Federal Funds Rate, the amount of such excess. The Fund may borrow up to a maximum of 33 percent of its net assets under the agreement. The Fund had no outstanding loans at December 31, 2017.
| | | | |
Deutsche Variable Series II — Deutsche Global Equity VIP | | | | | 15 |
Report of Independent Registered Public Accounting Firm
To the Board of Trustees of Deutsche Variable Series II and the Shareholders of Deutsche Global Equity VIP
Opinion on the Financial Statements
We have audited the accompanying statement of assets and liabilities of Deutsche Global Equity VIP (the “Fund”) (one of the funds constituting the Deutsche Variable Series II ) (the “Trust”), including the schedule of investments, as of December 31, 2017, and the related statement of operations for the year then ended, the statements of changes in net assets for each of the two years in the period then ended, the financial highlights for each of the five years in the period then ended and the related notes (collectively referred to as the “financial statements”). In our opinion, the financial statements present fairly, in all material respects, the financial position of the Fund (one of the funds constituting the Deutsche Variable Series II) at December 31, 2017, the results of its operations for the year then ended, the changes in its net assets for each of the two years in the period then ended and its financial highlights for each of the five years in the period then ended, in conformity with U.S. generally accepted accounting principles.
Basis for Opinion
These financial statements are the responsibility of the Trust’s management. Our responsibility is to express an opinion on the Fund’s financial statements based on our audits. We are a public accounting firm registered with the Public Company Accounting Oversight Board (United States) (“PCAOB”) and are required to be independent with respect to the Trust in accordance with the U.S. federal securities laws and the applicable rules and regulations of the Securities and Exchange Commission and the PCAOB.
We conducted our audits in accordance with the standards of the PCAOB. Those standards require that we plan and perform the audit to obtain reasonable assurance about whether the financial statements are free of material misstatement, whether due to error or fraud. The Trust is not required to have, nor were we engaged to perform, an audit of the Trust’s internal control over financial reporting. As part of our audits, we are required to obtain an understanding of internal control over financial reporting, but not for the purpose of expressing an opinion on the effectiveness of the Trust’s internal control over financial reporting. Accordingly, we express no such opinion.
Our audits included performing procedures to assess the risks of material misstatement of the financial statements, whether due to error or fraud, and performing procedures that respond to those risks. Such procedures included examining, on a test basis, evidence regarding the amounts and disclosures in the financial statements. Our procedures included confirmation of securities owned as of December 31, 2017, by correspondence with the custodian and brokers or by other appropriate auditing procedures where replies from brokers were not received.
Our audits also included evaluating the accounting principles used and significant estimates made by management, as well as evaluating the overall presentation of the financial statements. We believe that our audits provide a reasonable basis for our opinion.
| | |
| |  |
We have served as the auditor of one or more investment companies in the Deutsche family of funds since at least 1979, but we are unable to determine the specific year. Boston, Massachusetts |
February 15, 2018 | | |
| | | | | | |
| | 16 | | | | | | Deutsche Variable Series II — Deutsche Global Equity VIP |
| | |
| Information About Your Fund’s Expenses | | (Unaudited) |
As an investor of the Fund, you incur two types of costs: ongoing expenses and transaction costs. Ongoing expenses include management fees and other Fund expenses. Examples of transaction costs include contract charges, which are not shown in this section. The following tables are intended to help you understand your ongoing expenses (in dollars) of investing in the Fund and to help you compare these expenses with the ongoing expenses of investing in other mutual funds. In the most recent six-month period, the Fund limited these expenses; had it not done so, expenses would have been higher. The example in the table is based on an investment of $1,000 invested at the beginning of the six-month period and held for the entire period (July 1, 2017 to December 31, 2017).
The tables illustrate your Fund’s expenses in two ways:
| – | Actual Fund Return. This helps you estimate the actual dollar amount of ongoing expenses (but not transaction costs) paid on a $1,000 investment in the Fund using the Fund’s actual return during the period. To estimate the expenses you paid over the period, simply divide your account value by $1,000 (for example, an $8,600 account value divided by $1,000 = 8.6), then multiply the result by the number in the “Expenses Paid per $1,000” line under the share class you hold. |
| – | Hypothetical 5% Fund Return. This helps you to compare your Fund’s ongoing expenses (but not transaction costs) with those of other mutual funds using the Fund’s actual expense ratio and a hypothetical rate of return of 5% per year before expenses. Examples using a 5% hypothetical Fund return may be found in the shareholder reports of other mutual funds. The hypothetical account values and expenses may not be used to estimate the actual ending account balance or expenses you paid for the period. |
Please note that the expenses shown in these tables are meant to highlight your ongoing expenses only and do not reflect any transaction costs. The “Expenses Paid per $1,000” line of the tables is useful in comparing ongoing expenses only and will not help you determine the relative total expense of owning different funds. If these transaction costs had been included, your costs would have been higher.
| | | | |
| Expenses and Value of a $1,000 Investment for the six months ended December 31, 2017 | | | |
| |
| Actual Fund Return | | | Class A | |
| Beginning Account Value 7/1/17 | | $ | 1,000.00 | |
| Ending Account Value 12/31/17 | | $ | 1,087.40 | |
| Expenses Paid per $1,000* | | $ | 4.95 | |
| |
| Hypothetical 5% Fund Return | | | Class A | |
| Beginning Account Value 7/1/17 | | $ | 1,000.00 | |
| Ending Account Value 12/31/17 | | $ | 1,020.47 | |
| Expenses Paid per $1,000* | | $ | 4.79 | |
| * | Expenses are equal to the Fund’s annualized expense ratio, multiplied by the average account value over the period, multiplied by 184 (the number of days in the most recent six-month period), then divided by 365. |
| | | | |
| Annualized Expense Ratio | | Class A | |
| Deutsche Variable Series II — Deutsche Global Equity VIP | | | .94 | % |
For more information, please refer to the Fund’s prospectus.
These tables do not reflect charges and fees (“contract charges”) associated with the separate account that invests in the Fund or any variable life insurance policy or variable annuity contract for which the Fund is an investment option.
For an analysis of the fees associated with an investment in the fund or similar funds, please refer to the current and hypothetical expense calculators for Variable Insurance Products which can be found at deutschefunds.com/EN/resources/calculators.jsp.
| | | | |
Deutsche Variable Series II — Deutsche Global Equity VIP | | | | | 17 |
| | |
| Tax Information | | (Unaudited) |
For corporate shareholders, 100% of the ordinary dividends (i.e., income dividends plus short-term capital gains) paid during the Fund’s fiscal year ended December 31, 2017, qualified for the dividends received deduction.
Please consult a tax advisor if you have questions about federal or state income tax laws, or on how to prepare your tax returns. If you have specific questions about your account, please contact your insurance provider.
Proxy Voting
The Trust’s policies and procedures for voting proxies for portfolio securities and information about how the Trust voted proxies related to its portfolio securities during the most recent 12-month period ended June 30 are available on our Web site — deutschefunds.com (click on “proxy voting” at the bottom of the page) — or on the SEC’s Web site — sec.gov. To obtain a written copy of the Trust’s policies and procedures without charge, upon request, call us toll free at (800) 728-3337.
| | | | | | |
| | 18 | | | | | | Deutsche Variable Series II — Deutsche Global Equity VIP |
Advisory Agreement Board Considerations and Fee Evaluation
The Board of Trustees (hereinafter referred to as the “Board” or “Trustees”) approved the renewal of Deutsche Global Equity VIP’s (the “Fund”) investment management agreement (the “Agreement”) with Deutsche Investment Management Americas Inc. (“DIMA”) in September 2017.
In terms of the process that the Board followed prior to approving the Agreement, shareholders should know that:
| – | | During the entire process, all of the Fund’s Trustees were independent of DIMA and its affiliates (the “Independent Trustees”). |
| – | | The Board met frequently during the past year to discuss fund matters and dedicated a substantial amount of time to contract review matters. Over the course of several months, the Board’s Contract Committee reviewed extensive materials received from DIMA, independent third parties and independent counsel. These materials included an analysis of the Fund’s performance, fees and expenses, and profitability from a fee consultant retained by the Fund’s Independent Trustees (the “Fee Consultant”). Based on its evaluation of the information provided, the Contract Committee presented its findings and recommendations to the Board. The Board then reviewed the Contract Committee’s findings and recommendations. |
| – | | The Board also received extensive information throughout the year regarding performance of the Fund. |
| – | | The Independent Trustees regularly met privately with counsel to discuss contract review and other matters. In addition, the Independent Trustees were advised by the Fee Consultant in the course of their review of the Fund’s contractual arrangements and considered a comprehensive report prepared by the Fee Consultant in connection with their deliberations. |
| – | | In connection with reviewing the Agreement, the Board also reviewed the terms of the Fund’s distribution agreement, administrative services agreement, transfer agency agreement and other material service agreements. |
In connection with the contract review process, the Contract Committee and the Board considered the factors discussed below, among others. The Board also considered that DIMA and its predecessors have managed the Fund since its inception, and the Board believes that a long-term relationship with a capable, conscientious advisor is in the best interests of the Fund. The Board considered, generally, that shareholders chose to invest or remain invested in the Fund knowing that DIMA managed the Fund, and that the Agreement was approved by the Fund’s shareholders. DIMA is part of Deutsche Bank AG’s (“Deutsche Bank”) Asset Management (“Deutsche AM”) division. Deutsche AM is a global asset management business that offers a wide range of investing expertise and resources, including research capabilities in many countries throughout the world.
As part of the contract review process, the Board carefully considered the fees and expenses of each Deutsche fund overseen by the Board in light of the fund’s performance. In many cases, this led to the negotiation and implementation of expense caps. As part of these negotiations, the Board indicated that it would consider relaxing these caps in future years following sustained improvements in performance, among other considerations.
While shareholders may focus primarily on fund performance and fees, the Fund’s Board considers these and many other factors, including the quality and integrity of DIMA’s personnel and administrative support services provided by DIMA, such as back-office operations, fund valuations, and compliance policies and procedures.
Nature, Quality and Extent of Services. The Board considered the terms of the Agreement, including the scope of advisory services provided under the Agreement. The Board noted that, under the Agreement, DIMA provides portfolio management services to the Fund and that, pursuant to a separate administrative services agreement, DIMA provides administrative services to the Fund. The Board considered the experience and skills of senior management and investment personnel and the resources made available to such personnel. The Board reviewed the Fund’s performance over short-term and long-term periods and compared those returns to various agreed-upon performance measures, including market index(es) and a peer universe compiled using information supplied by Morningstar Direct (“Morningstar”), an independent fund data service. The Board also noted that it has put into place a process of identifying “Funds in Review” (e.g., funds performing poorly relative to a peer universe), and receives additional reporting from DIMA regarding such funds and, where appropriate, DIMA’s plans to address underperformance. The Board
| | | | |
Deutsche Variable Series II — Deutsche Global Equity VIP | | | | | 19 |
believes this process is an effective manner of identifying and addressing underperforming funds. Based on the information provided, the Board noted that, for the one-, three- and five-year periods ended December 31, 2016, the Fund’s performance (Class A shares) was in the 2nd quartile, 3rd quartile and 4th quartile, respectively, of the applicable Morningstar universe (the 1st quartile being the best performers and the 4th quartile being the worst performers). The Board also observed that the Fund has underperformed its benchmark in the one-, three- and five-year periods ended December 31, 2016.
Fees and Expenses. The Board considered the Fund’s investment management fee schedule, operating expenses and total expense ratios, and comparative information provided by Broadridge Financial Solutions, Inc. (“Broadridge”) and the Fee Consultant regarding investment management fee rates paid to other investment advisors by similar funds (1st quartile being the most favorable and 4th quartile being the least favorable). With respect to management fees paid to other investment advisors by similar funds, the Board noted that the contractual fee rates paid by the Fund, which include a 0.10% fee paid to DIMA under the Fund’s administrative services agreement, were equal to the median of the applicable Broadridge peer group (based on Broadridge data provided as of December 31, 2016). The Board noted that the Fund’s Class A shares total (net) operating expenses were expected to be higher than the median (3rd quartile) of the applicable Broadridge expense universe (based on Broadridge data provided as of December 31, 2016, and analyzing Broadridge expense universe Class A (net) expenses less any applicable 12b-1 fees) (“Broadridge Universe Expenses”). The Board noted that the expense limitation agreed to by DIMA was expected to help the Fund’s total (net) operating expenses remain competitive. The Board considered the Fund’s management fee rate as compared to fees charged by DIMA to comparable Deutsche U.S. registered funds (“Deutsche Funds”) and considered differences between the Fund and the comparable Deutsche Funds. The information requested by the Board as part of its review of fees and expenses also included information about institutional accounts (including any sub-advised funds and accounts) and funds offered primarily to European investors (“Deutsche Europe funds”) managed by Deutsche AM. The Board noted that DIMA indicated that Deutsche AM does not manage any institutional accounts or Deutsche Europe funds comparable to the Fund.
On the basis of the information provided, the Board concluded that management fees were reasonable and appropriate in light of the nature, quality and extent of services provided by DIMA.
Profitability. The Board reviewed detailed information regarding revenues received by DIMA under the Agreement. The Board considered the estimated costs to DIMA, and pre-tax profits realized by DIMA, from advising the Deutsche Funds, as well as estimates of the pre-tax profits attributable to managing the Fund in particular. The Board also received information regarding the estimated enterprise-wide profitability of DIMA and its affiliates with respect to all fund services in totality and by fund. The Board and the Fee Consultant reviewed DIMA’s methodology in allocating its costs to the management of the Fund. Based on the information provided, the Board concluded that the pre-tax profits realized by DIMA in connection with the management of the Fund were not unreasonable. The Board also reviewed certain publicly available information regarding the profitability of certain similar investment management firms. The Board noted that, while information regarding the profitability of such firms is limited (and in some cases is not necessarily prepared on a comparable basis), DIMA and its affiliates’ overall profitability with respect to the Deutsche Funds (after taking into account distribution and other services provided to the funds by DIMA and its affiliates) was lower than the overall profitability levels of most comparable firms for which such data was available.
Economies of Scale. The Board considered whether there are economies of scale with respect to the management of the Fund and whether the Fund benefits from any economies of scale. The Board noted that the Fund’s investment management fee schedule includes fee breakpoints. The Board concluded that the Fund’s fee schedule represents an appropriate sharing between the Fund and DIMA of such economies of scale as may exist in the management of the Fund at current asset levels.
Other Benefits to DIMA and Its Affiliates. The Board also considered the character and amount of other incidental benefits received by DIMA and its affiliates, including any fees received by DIMA for administrative services provided to the Fund and any fees received by an affiliate of DIMA for transfer agency services provided to the Fund. The Board also considered benefits to DIMA related to brokerage and soft-dollar allocations, including allocating brokerage to pay for research generated by parties other than the executing broker dealers, which pertain primarily to funds investing in equity securities. In addition, the Board considered the incidental public relations benefits to DIMA related to Deutsche Funds advertising and cross-selling opportunities among DIMA products and services. The Board considered these benefits in reaching its conclusion that the Fund’s management fees were reasonable.
| | | | | | |
| | 20 | | | | | | Deutsche Variable Series II — Deutsche Global Equity VIP |
Compliance. The Board considered the significant attention and resources dedicated by DIMA to documenting and enhancing its compliance processes in recent years. The Board noted in particular (i) the experience, seniority and time commitment of the individuals serving as DIMA’s and the Fund’s chief compliance officers; (ii) the large number of DIMA compliance personnel; and (iii) the substantial commitment of resources by DIMA and its affiliates to compliance matters.
Based on all of the information considered and the conclusions reached, the Board unanimously determined that the continuation of the Agreement is in the best interests of the Fund. In making this determination, the Board did not give particular weight to any single factor identified above. The Board considered these factors over the course of numerous meetings, certain of which were in executive session with only the Independent Trustees and counsel present. It is possible that individual Independent Trustees may have weighed these factors differently in reaching their individual decisions to approve the continuation of the Agreement.
| | | | |
Deutsche Variable Series II — Deutsche Global Equity VIP | | | | | 21 |
Board Members and Officers
The following table presents certain information regarding the Board Members and Officers of the Fund. Each Board Member’s year of birth is set forth in parentheses after his or her name. Unless otherwise noted, (i) each Board Member has engaged in the principal occupation(s) noted in the table for at least the most recent five years, although not necessarily in the same capacity; and (ii) the address of each Independent Board Member is c/o Keith R. Fox, Deutsche Funds Board Chair, c/o Thomas R. Hiller, Ropes & Gray LLP, Prudential Tower, 800 Boylston Street, Boston, MA 02199-3600. Except as otherwise noted below, the term of office for each Board Member is until the election and qualification of a successor, or until such Board Member sooner dies, resigns, is removed or as otherwise provided in the governing documents of the Fund. Because the Fund does not hold an annual meeting of shareholders, each Board Member will hold office for an indeterminate period. The Board Members may also serve in similar capacities with other funds in the fund complex.
| | | | | | | | |
| Independent Board Members | | | | | | | |
Name, Year of Birth,
Position with the Fund and
Length of Time Served1 | | Business Experience and Directorships During the Past Five Years | | Number of
Funds in
Deutsche
Fund
Complex
Overseen | | | Other
Directorships
Held by Board
Member |
Keith R. Fox, CFA (1954) Chairperson since 2017, and Board Member since 1996 | | Managing General Partner, Exeter Capital Partners (a series of private investment funds) (since 1986). Directorships: Progressive International Corporation (kitchen goods importer and distributor); The Kennel Shop (retailer); former Chairman, National Association of Small Business Investment Companies; former Directorships: BoxTop Media Inc. (advertising); Sun Capital Advisers Trust (mutual funds) (2011–2012) | | | 89 | | | — |
Kenneth C. Froewiss (1945) Vice Chairperson since 2017, and Board Member since 2001 | | Retired Clinical Professor of Finance, NYU Stern School of Business (1997–2014); Member, Finance Committee, Association for Asian Studies (2002–present); Director, Mitsui Sumitomo Insurance Group (US) (2004–present); prior thereto, Managing Director, J.P. Morgan (investment banking firm) (until 1996) | | | 92 | | | — |
John W. Ballantine (1946) Board Member since 1999 | | Retired; formerly, Executive Vice President and Chief Risk Management Officer, First Chicago NBD Corporation/The First National Bank of Chicago (1996–1998); Executive Vice President and Head of International Banking (1995–1996); former Directorships: Director and former Chairman of the Board, Healthways, Inc.2 (population well-being and wellness services) (2003–2014); Stockwell Capital Investments PLC (private equity); Enron Corporation; FNB Corporation; Tokheim Corporation; First Oak Brook Bancshares, Inc. and Oak Brook Bank; Prisma Energy International. Not-for-Profit Director, Trustee: Palm Beach Civic Association; Public Radio International; Window to the World Communications (public media); Harris Theater for Music and Dance (Chicago) | | | 89 | | | Portland
General
Electric2
(utility
company)
(2003–
present) |
Henry P. Becton, Jr. (1943) Board Member since 1990 | | Vice Chair and former President, WGBH Educational Foundation. Directorships: Public Radio International; Public Radio Exchange (PRX); The Pew Charitable Trusts (charitable organization); former Directorships: Becton Dickinson and Company2 (medical technology company); Belo Corporation2 (media company); The PBS Foundation; Association of Public Television Stations; Boston Museum of Science; American Public Television; Concord Academy; New England Aquarium; Mass. Corporation for Educational Telecommunications; Committee for Economic Development; Public Broadcasting Service; Connecticut College; North Bennett Street School (Boston) | | | 89 | | | — |
Dawn-Marie Driscoll (1946) Board Member since 1987 | | Emeritus Executive Fellow, Center for Business Ethics, Bentley University; formerly: President, Driscoll Associates (consulting firm); Partner, Palmer & Dodge (law firm) (1988–1990); Vice President of Corporate Affairs and General Counsel, Filene’s (retail) (1978–1988). Directorships: Advisory Board, Center for Business Ethics, Bentley University; Trustee and former Chairman of the Board, Southwest Florida Community Foundation (charitable organization); former Directorships: ICI Mutual Insurance Company (2007–2015); Sun Capital Advisers Trust (mutual funds) (2007–2012), Investment Company Institute (audit, executive, nominating committees) and Independent Directors Council (governance, executive committees) | | | 89 | | | — |
| | | | | | |
| | 22 | | | | | | Deutsche Variable Series II — Deutsche Global Equity VIP |
| | | | | | | | |
Name, Year of Birth,
Position with the Fund and
Length of Time Served1 | | Business Experience and Directorships During the Past Five Years | | Number of
Funds in
Deutsche
Fund
Complex
Overseen | | | Other
Directorships
Held by Board
Member |
Paul K. Freeman (1950) Board Member since 1993 | | Consultant, World Bank/Inter-American Development Bank; Independent Directors Council (former chair); Investment Company Institute (executive and nominating committees); formerly: Chairman of Education Committee of Independent Directors Council; Project Leader, International Institute for Applied Systems Analysis (1998–2001); Chief Executive Officer, The Eric Group, Inc. (environmental insurance) (1986–1998); Directorships: Denver Zoo Foundation (December 2012–present); Knoebel Institute for Healthy Aging, University of Denver (2017–present); former Directorships: Prisma Energy International | | | 89 | | | — |
Richard J. Herring (1946) Board Member since 1990 | | Jacob Safra Professor of International Banking and Professor, Finance Department, The Wharton School, University of Pennsylvania (since July 1972); Co-Director, Wharton Financial Institutions Center; formerly: Vice Dean and Director, Wharton Undergraduate Division (July 1995–June 2000); Director, Lauder Institute of International Management Studies (July 2000–June 2006) | | | 89 | | | Director,
Aberdeen
Singapore
and Japan
Funds (since
2007);
Independent
Director of
Barclays
Bank
Delaware
(since
September
2010) |
William McClayton (1944) Board Member since 2004 | | Private equity investor (since October 2009); previously, Managing Director, Diamond Management & Technology Consultants, Inc. (global consulting firm) (2001–2009); Directorship: Board of Managers, YMCA of Metropolitan Chicago; formerly: Senior Partner, Arthur Andersen LLP (accounting) (1966–2001); Trustee, Ravinia Festival | | | 89 | | | — |
Rebecca W. Rimel (1951) Board Member since 1995 | | President, Chief Executive Officer and Director, The Pew Charitable Trusts (charitable organization) (1994–present); formerly: Executive Vice President, The Glenmede Trust Company (investment trust and wealth management) (1983–2004); Board Member, Investor Education (charitable organization) (2004–2005); Trustee, Executive Committee, Philadelphia Chamber of Commerce (2001–2007); Director, Viasys Health Care2 (January 2007–June 2007); Trustee, Thomas Jefferson Foundation (charitable organization) (1994–2012) | | | 89 | | | Director,
Becton
Dickinson
and
Company2
(medical
technology
company)
(2012–
present);
Director,
BioTelemetry
Inc2 (health
care) (2009–
present) |
William N. Searcy, Jr. (1946) Board Member since 1993 | | Private investor since October 2003; formerly: Pension & Savings Trust Officer, Sprint Corporation2 (telecommunications) (November 1989–September 2003); Trustee, Sun Capital Advisers Trust (mutual funds) (1998–2012) | | | 89 | | | — |
Jean Gleason Stromberg (1943) Board Member since 1997 | | Retired. Formerly, Consultant (1997–2001); Director, Financial Markets U.S. Government Accountability Office (1996–1997); Partner, Norton Rose Fulbright, L.L.P. (law firm) (1978–1996); former Directorships: The William and Flora Hewlett Foundation (charitable organization) (2000–2015); Service Source, Inc. (nonprofit), Mutual Fund Directors Forum (2002–2004), American Bar Retirement Association (funding vehicle for retirement plans) (1987–1990 and 1994–1996) | | | 89 | | | — |
| | | | |
Deutsche Variable Series II — Deutsche Global Equity VIP | | | | | 23 |
| | |
| Officers4 | | |
Name, Year of Birth,
Position with the Fund and
Length of Time Served5 | | Business Experience and Directorships During the Past Five Years |
Hepsen Uzcan6,9 (1974) President and Chief Executive Officer, 2017–present Assistant Secretary, 2013–present | | Director,3 Deutsche Asset Management; formerly: Vice President for the Deutsche funds (2016–2017) |
John Millette8 (1962) Vice President and Secretary, 1999–present | | Director,3 Deutsche Asset Management; Chief Legal Officer, Deutsche Investment Management Americas Inc. (2015–present); and Director and Vice President, Deutsche AM Trust Company (since 2016); formerly: Secretary, Deutsche Investment Management Americas Inc. (2015–2017) |
Paul H. Schubert6 (1963) Chief Financial Officer, 2004–present Treasurer, 2005–present | | Managing Director,3 Deutsche Asset Management, and Chairman, Director and President, Deutsche AM Trust Company (since 2013); Vice President, Deutsche AM Distributors, Inc. (since 2016); Director, Deutsche AM Service Company (since 2017); Director and President, DB Investment Managers, Inc. (since 2017); formerly: Director, Deutsche AM Trust Company (2004–2013) |
Caroline Pearson8 (1962) Chief Legal Officer, 2010–present | | Managing Director,3 Deutsche Asset Management; formerly: Secretary, Deutsche AM Distributors, Inc.; and Secretary, Deutsche AM Service Company |
Scott D. Hogan8 (1970) Chief Compliance Officer, 2016–present | | Director,3 Deutsche Asset Management |
Wayne Salit7 (1967) Anti-Money Laundering Compliance Officer, 2014–present | | Director,3 Deutsche Asset Management; formerly: Managing Director, AML Compliance Officer at BNY Mellon (2011–2014); and Director, AML Compliance Officer at Deutsche Bank (2004–2011) |
Sheila Cadogan8 (1966) Assistant Treasurer, since July 12, 2017 | | Director,3 Deutsche Asset Management |
Paul Antosca8 (1957) Assistant Treasurer, 2007–present | | Director,3 Deutsche Asset Management |
Diane Kenneally8 (1966) Assistant Treasurer, 2007–present | | Director,3 Deutsche Asset Management |
| 1 | The length of time served represents the year in which the Board Member joined the board of one or more Deutsche funds currently overseen by the Board. |
| 2 | A publicly held company with securities registered pursuant to Section 12 of the Securities Exchange Act of 1934. |
| 3 | Executive title, not a board directorship. |
| 4 | As a result of their respective positions held with the Advisor, these individuals are considered “interested persons” of the Advisor within the meaning of the 1940 Act. Interested persons receive no compensation from the Fund. |
| 5 | The length of time served represents the year in which the officer was first elected in such capacity for one or more Deutsche funds. |
| 6 | Address: 345 Park Avenue, New York, NY 10154. |
| 7 | Address: 60 Wall Street, New York, NY 10005. |
| 8 | Address: One International Place, Boston, MA 02110. |
| 9 | Appointed President and Chief Executive Officer effective December 1, 2017. |
The Fund’s Statement of Additional Information (“SAI”) includes additional information about the Board Members. The SAI is available, without charge, upon request. If you would like to request a copy of the SAI, you may do so by calling the following toll-free number: (800) 728-3337.
| | | | | | |
| | 24 | | | | | | Deutsche Variable Series II — Deutsche Global Equity VIP |
| | |
 | | |
VS2GE-2 (R-025828-7 2/18) | | |

December 31, 2017
Annual Report
Deutsche Variable Series II
Deutsche Global Income Builder VIP

Contents
This report must be preceded or accompanied by a prospectus. To obtain an additional prospectus or summary prospectus, if available, call (800) 728-3337 or your financial representative. We advise you to consider the Fund’s objectives, risks, charges and expenses carefully before investing. The summary prospectus and prospectus contain this and other important information about the Fund. Please read the prospectus carefully before you invest.
Although allocation among different asset categories generally limits risk, fund management may favor an asset category that underperforms other assets or markets as a whole. Stocks may decline in value. Smaller company stocks tend to be more volatile than medium-sized or large company stocks. Dividends are not guaranteed. If the dividend-paying stocks held by the Fund reduce or stop paying dividends, the Fund’s ability to generate income may be adversely affected. Preferred stocks, a type of dividend-paying stock, present certain additional risks. Investing in foreign securities, particularly those of emerging markets, presents certain risks, such as currency fluctuations, political and economic changes, and market risks. Emerging markets tend to be more volatile and less liquid than the markets of more mature economies, and generally have less diverse and less mature economic structures and less stable political systems than those of developed countries. Investing in derivatives entails special risks relating to liquidity, leverage and credit that may reduce returns and/or increase volatility. Bond investments are subject to interest-rate, credit, liquidity and market risks to varying degrees. When interest rates rise, bond prices generally fall. Credit risk refers to the ability of an issuer to make timely payments of principal and interest. Because Exchange Traded Funds (ETFs) trade on a securities exchange, their shares may trade at a premium or discount to their net asset value. ETFs also incur fees and expenses so they may not fully match the performance of the indexes they are designed to track. The Fund may lend securities to approved institutions. Any fund that focuses in a particular segment of the market or region of the world will generally be more volatile than a fund that invests more broadly. See the prospectus for details.
Deutsche Asset Management represents the asset management activities conducted by Deutsche Bank AG or any of its subsidiaries.
Deutsche AM Distributors, Inc., 222 South Riverside Plaza, Chicago, IL 60606, (800) 621-1148
NOT FDIC/NCUA INSURED NO BANK GUARANTEE MAY LOSE VALUE NOT A DEPOSIT
NOT INSURED BY ANY FEDERAL GOVERNMENT AGENCY
| | | | | | |
| | 2 | | | | | | Deutsche Variable Series II — Deutsche Global Income Builder VIP |
| | |
| Performance Summary | | December 31, 2017 (Unaudited) |
Fund performance shown is historical, assumes reinvestment of all dividend and capital gain distributions and does not guarantee future results. Investment return and principal value fluctuate with changing market conditions so that, when redeemed, shares may be worth more or less than their original cost. Current performance may be lower or higher than the performance data quoted. Please contact your participating insurance company for the Fund’s most recent month-end performance. Performance doesn’t reflect charges and fees (“contract charges”) associated with the separate account that invests in the Fund or any variable life insurance policy or variable annuity contract for which the Fund is an investment option. These charges and fees will reduce returns.
The gross expense ratio of the Fund, as stated in the fee table of the prospectus dated May 1, 2017 is 0.66% for Class A shares and may differ from the expense ratio disclosed in the Financial Highlights table in this report.
Generally accepted accounting principles require adjustments to be made to the net assets of the Fund at period end for financial reporting purposes only, and as such, the total return based on the unadjusted net asset value per share may differ from the total return reported in the financial highlights.
Growth of an Assumed $10,000 Investment in Deutsche Global Income Builder VIP
| | |
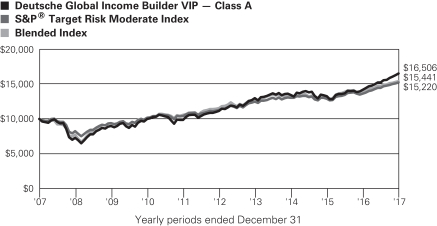 | | The S&P® Target Risk Moderate Index is designed to measure the performance of S&P’s proprietary moderate target risk allocation model. The S&P® Target Risk Moderate Index seeks to provide significant exposure to fixed income, while also allocating a smaller portion of exposure to equities in order to seek current income, some capital preservation, and an opportunity for moderate to low capital appreciation. The Blended Index consists of an equally weighted blend (50%/50%) of the MSCI World High Dividend Yield Index and Bloomberg Barclays U.S. Universal Index. MSCI World High Dividend Yield Index includes securities that offer a meaningfully higher-than-average dividend yield relative to the MSCI World Index and pass dividend sustainability and persistence screens. The index offers broad market coverage, and is free-float market capitalization-weighted to ensure that its performance can be replicated in institutional and retail portfolios. The index is calculated using closing local market prices and translates into US dollars using the London close foreign exchange rates. Bloomberg Barclays U.S. Universal Index represents the union of the U.S. Aggregate Index, the U.S. High-Yield Corporate Index, the 144A Index, the Eurodollar Index, the Emerging Markets Index and the non-ERISA portion of the CMBS Index. Index returns do not reflect any fees or expenses and it is not possible to invest directly into an index. |
| | | | | | | | | | |
| Comparative Results | | | | | | | | | | |
| | | | | |
| Deutsche Global Income Builder VIP | | | | 1-Year | | 3-Year | | 5-Year | | 10-Year |
| Class A | | Growth of $10,000 | | $11,654 | | $12,268 | | $14,856 | | $16,506 |
| | | Average annual total return | | 16.54% | | 7.05% | | 8.24% | | 5.14% |
| S&P® Target Risk Moderate Index | | Growth of $10,000 | | $11,178 | | $11,698 | | $13,502 | | $15,220 |
| | | Average annual total return | | 11.78% | | 5.37% | | 6.19% | | 4.29% |
| Blended Index | | Growth of $10,000 | | $11,093 | | $11,689 | | $13,362 | | $15,441 |
| | | Average annual total return | | 10.93% | | 5.34% | | 5.97% | | 4.44% |
The growth of $10,000 is cumulative.
| | | | |
Deutsche Variable Series II — Deutsche Global Income Builder VIP | | | | | 3 |
| | |
| Management Summary | | December 31, 2017 (Unaudited) |
The Fund returned 16.54% during the 12 months ended December 31, 2017 (Class A shares, unadjusted for contract charges), outperforming the 11.78% return of S&P® Target Risk Moderate Index. Its other benchmark — the Blended Index — gained 10.93%.
Our preference for equities over bonds was a key factor in the Fund’s outperformance. We held an average weighting of 65% of assets in stocks through the past 12 months, with a peak of 77% in November. This aspect of our positioning added meaningful value versus the 50-50 benchmark given that stocks outperformed bonds. The rationale for the overweight in equities was our view that the asset class offered a better risk/reward profile than bonds at a time of accelerating growth, tighter monetary policy and robust investor risk appetites.
Within the equity portfolio, relative performance was helped by positive individual security selection. We added the most value in energy, telecommunications services and industrials, whereas our stock picks in consumer sectors detracted. However, we lost some ground against the benchmark from our emphasis on relatively conservative, dividend-paying stocks at a time in which the growth style outpaced the broader market by a wide margin. At year end, the Fund had a globally diversified equity portfolio with overweights in Japan, the emerging markets and higher-quality U.S. large caps. (Diversification does not protect against a loss.) Late in the year, we boosted the Fund’s weighting in higher-dividend stocks both to maintain an attractive level of income and to capitalize on the relative weakness in dividend payers versus faster-growing companies. This move created more of a value tilt in the portfolio, a contrast to the growth-oriented posture it held for much of 2017.
In the bond portfolio, we maintained a focus on the credit-oriented segments of the market, including the emerging markets, high-yield bonds and the higher-yielding portions of the investment-grade space. We believed these categories offered a potential return advantage due to both the greater contribution from yield and their ability to benefit from strengthening economic growth, and that indeed proved to be the case in the past 12 months. While we continued to emphasize higher-yielding asset classes throughout the year, we moved to a more defensive approach later in the period given the meaningful decline in yield spreads since the beginning of 2016.
The Fund used derivatives in the annual period. We used equity futures and total return swaps to implement tactical decisions on equity sector overweight and underweights. These positions generated positive absolute results in the rising market. We used futures and options on the CBOE Volatility Index to manage the risk of stock-market volatility, and this strategy had a positive effect on returns. We also used credit derivatives to take tactical positions in the fixed income portfolio, and we used interest rate swaps, swaptions, and futures to help manage the Fund’s interest rate exposure. These positions contributed positively. In addition, the Fund used currency forward contracts to hedge the non-dollar exposures of its non-U.S. positions, which was a small detractor. Overall, the use of derivatives was a modest contributor.
We believe the Fund’s outperformance helps illustrate the value of our active strategy. Rather than simply taking a static 60/40 approach that seeks to match the weightings of the benchmarks, we actively adjust the Fund’s broader allocations and use an opportunistic approach that strives to capitalize on values as they emerge. We believe this multifaceted strategy can help the Fund achieve its goals of positive relative performance and above-average income by taking advantage of opportunities across the full spectrum of the global financial markets.
John D. Ryan, Managing Director
Darwei Kung, Managing Director
Di Kumble, CFA, Managing Director
Kevin Bliss, Director
Portfolio Managers
| | | | | | |
| | 4 | | | | | | Deutsche Variable Series II — Deutsche Global Income Builder VIP |
Prior to October 25, 2017, the portfolio management team was as follows:
Di Kumble, CFA, Managing Director
Gary Russell, CFA, Managing Director
John D. Ryan, Managing Director
Darwei Kung, Managing Director
Portfolio Managers
The views expressed reflect those of the portfolio management team only through the end of the period of the report as stated on the cover. The management team’s views are subject to change at any time based on market and other conditions and should not be construed as a recommendation. Past performance is no guarantee of future results. Current and future portfolio holdings are subject to risk.
Terms to Know
The S&P® Target Risk Moderate Index is designed to measure the performance of S&P’s proprietary moderate target risk allocation model. The S&P Target Risk Moderate Index seeks to provide significant exposure to fixed income, while also allocating a smaller portion of exposure to equities in order to seek current income, some capital preservation and an opportunity for moderate-to-low capital appreciation.
The Blended Index consists of an equally weighted blend (50%/50%) of the MSCI World High Dividend Yield Index and Barclays U.S. Universal Index.
The MSCI World High Dividend Yield Index includes securities that offer a meaningfully higher-than-average dividend yield relative to the MSCI World Index and pass dividend sustainability and persistence screens. The index offers broad market coverage, and is free-float market capitalization-weighted to ensure that its performance can be replicated in institutional and retail portfolios. The index is calculated using closing local market prices and translates into US dollars using the London close foreign exchange rates.
The Bloomberg Barclays U.S. Universal Index represents the union of the U.S. Aggregate Index, the U.S. High-Yield Corporate Index, the 144A Index, the Eurodollar Index, the Emerging Markets Index and the non-ERISA portion of the CMBS Index.
Index returns do not reflect any fees or expenses and it is not possible to invest directly into an index.
Contribution and detraction incorporate both an investment’s total return and its weighting in the Fund.
Overweight means the Fund holds a higher weighting in a given sector or security than the benchmark. Underweight means the Fund holds a lower weighting.
Yield spread refers to differences between yields on differing debt instruments, calculated by deducting the yield of one instrument from another. The higher the yield spread, the greater the difference between the yields offered by each instrument.
Derivatives are contracts whose values can be based on a variety of instruments, including indices, currencies or securities. They can be utilized for a variety of reasons, including for hedging purposes, for risk management; for non-hedging purposes to seek to enhance potential gains, or as a substitute for direct investment in a particular asset class or to keep cash on hand to meet shareholder redemptions. Investing in derivatives entails special risks relating to liquidity, leverage and credit that may reduce returns and/or increase volatility.
Futures contracts are contractual agreements to buy or sell a particular commodity or financial instrument at a pre-determined price in the future. The CBOE Volatility Index (VIX Index) is a measure of market expectations of near-term volatility conveyed by S&P 500 stock index option prices. Options are financial derivatives that offer the right to buy or sell a security or financial asset at an agreed-upon price and during a certain period of time or on a specific date. A swap is a derivative in which two counterparties exchange cash flows of one party’s financial instrument for those of the other party’s financial instrument for a set period of time. A swaption is an option contract on a swap. Currency forward contracts are agreements between two parties to exchange two designated currencies at a specific time in the future.
| | | | |
Deutsche Variable Series II — Deutsche Global Income Builder VIP | | | | | 5 |
| | |
| Portfolio Summary | | (Unaudited) |
| | | | | | | | |
| Asset Allocation (As a % of Investment Portfolio excluding Securities Lending Collateral) | �� | 12/31/17 | | | 12/31/16 | |
Equity | | | 62% | | | | 58% | |
Common Stocks | | | 56% | | | | 58% | |
Preferred Stocks | | | 6% | | | | 0% | |
| | |
Fixed Income | | | 37% | | | | 41% | |
Government & Agency Obligations | | | 6% | | | | 13% | |
Convertible Bonds | | | 0% | | | | 0% | |
Corporate Bonds | | | 13% | | | | 14% | |
Exchange-Traded Funds | | | 10% | | | | 10% | |
Collateralized Mortgage Obligations | | | 1% | | | | 1% | |
Commercial Mortgage-Backed Securities | | | 1% | | | | 1% | |
Asset-Backed | | | 1% | | | | 1% | |
Municipal Bonds and Notes | | | 0% | | | | 0% | |
Mortgage-Backed Securities Pass-Throughs | | | 1% | | | | 1% | |
Short-Term U.S. Treasury Obligations | | | 4% | | | | 0% | |
| Cash Equivalents | | | 1% | | | | 1% | |
| | | | 100% | | | | 100% | |
| | |
| Sector Diversification (As a % of Equities, Corporate Bonds, Preferred Securities and Convertible Bonds) | | 12/31/17 | | | 12/31/16 | |
| Financials | | | 17% | | | | 20% | |
| Information Technology | | | 14% | | | | 13% | |
| Consumer Discretionary | | | 14% | | | | 12% | |
| Energy | | | 11% | | | | 13% | |
| Industrials | | | 10% | | | | 10% | |
| Telecommunication Services | | | 7% | | | | 6% | |
| Real Estate | | | 7% | | | | 3% | |
| Health Care | | | 6% | | | | 8% | |
| Consumer Staples | | | 6% | | | | 7% | |
| Materials | | | 4% | | | | 5% | |
| Utilities | | | 4% | | | | 3% | |
| | | | 100% | | | | 100% | |
Portfolio holdings and characteristics are subject to change.
For more complete details about the Fund’s investment portfolio, see page 7.
Following the Fund’s fiscal first and third quarter-end, a complete portfolio holdings listing is filed with the SEC on Form N-Q. The form will be available on the SEC’s Web site at sec.gov, and it also may be reviewed and copied at the SEC’s Public Reference Room in Washington, D.C. Information on the operation of the SEC’s Public Reference Room may be obtained by calling (800) SEC-0330. The Fund’s portfolio holdings are also posted on deutschefunds.com from time to time. Please see the Fund’s current prospectus for more information.
| | | | | | |
| | 6 | | | | | | Deutsche Variable Series II — Deutsche Global Income Builder VIP |
| | |
| Investment Portfolio | | December 31, 2017 |
| | | | | | | | |
| | | Shares | | | Value ($) | |
| Common Stocks 55.1% | |
| Consumer Discretionary 7.4% | |
Auto Components 0.3% | |
Bridgestone Corp. | | | 5,005 | | | | 232,628 | |
Nokian Renkaat Oyj | | | 4,100 | | | | 186,202 | |
| | | | | | | | |
| | | | 418,830 | |
|
Automobiles 1.4% | |
Daimler AG (Registered) | | | 3,013 | | | | 256,722 | |
Ford Motor Co. | | | 30,036 | | | | 375,150 | |
General Motors Co. | | | 7,044 | | | | 288,733 | |
Honda Motor Co., Ltd. | | | 7,450 | | | | 255,272 | |
Nissan Motor Co., Ltd. | | | 36,185 | | | | 360,771 | |
Subaru Corp. | | | 5,800 | | | | 184,457 | |
Toyota Motor Corp. | | | 4,500 | | | | 287,840 | |
| | | | | | | | |
| | | | 2,008,945 | |
|
Hotels, Restaurants & Leisure 1.3% | |
Carnival Corp. | | | 3,620 | | | | 240,259 | |
Darden Restaurants, Inc. | | | 2,464 | | | | 236,593 | |
Las Vegas Sands Corp. | | | 3,860 | | | | 268,232 | |
McDonald’s Corp. | | | 1,733 | | | | 298,284 | |
Sands China Ltd. | | | 35,200 | | | | 181,643 | |
Starbucks Corp. | | | 3,655 | | | | 209,907 | |
TUI AG | | | 11,892 | | | | 247,524 | |
Yum! Brands, Inc. | | | 2,190 | | | | 178,726 | |
| | | | | | | | |
| | | | 1,861,168 | |
|
Household Durables 1.3% | |
Barratt Developments PLC | | | 38,156 | | | | 334,121 | |
Berkeley Group Holdings PLC | | | 4,978 | | | | 282,175 | |
Garmin Ltd. | | | 4,539 | | | | 270,388 | |
Leggett & Platt, Inc. | | | 4,092 | | | | 195,311 | |
Persimmon PLC | | | 8,252 | | | | 305,283 | |
Sekisui House Ltd. | | | 12,954 | | | | 233,996 | |
Taylor Wimpey PLC | | | 120,281 | | | | 335,544 | |
| | | | | | | | |
| | | | 1,956,818 | |
|
Internet & Direct Marketing Retail 0.4% | |
Amazon.com, Inc.* | | | 200 | | | | 233,894 | |
Ctrip.com International Ltd. (ADR)* | | | 3,700 | | | | 163,170 | |
JD.com, Inc. (ADR)* | | | 4,200 | | | | 173,964 | |
| | | | | | | | |
| | | | 571,028 | |
|
Media 1.5% | |
Comcast Corp. “A” | | | 6,275 | | | | 251,314 | |
Eutelsat Communications SA | | | 8,591 | | | | 198,923 | |
Interpublic Group of Companies, Inc. | | | 9,195 | | | | 185,371 | |
Omnicom Group, Inc. | | | 2,609 | | | | 190,013 | |
Pearson PLC | | | 29,510 | | | | 293,406 | |
ProSiebenSat.1 Media SE | | | 10,190 | | | | 351,725 | |
Shaw Communications, Inc. “B” | | | 13,387 | | | | 305,547 | |
Time Warner, Inc. | | | 1,844 | | | | 168,671 | |
Walt Disney Co. | | | 1,600 | | | | 172,016 | |
| | | | | | | | |
| | | | 2,116,986 | |
|
Multiline Retail 0.5% | |
Kohl’s Corp. | | | 4,575 | | | | 248,102 | |
Marks & Spencer Group PLC | | | 48,847 | | | | 207,687 | |
| | | | | | | | |
| | | Shares | | | Value ($) | |
Target Corp. | | | 3,946 | | | | 257,477 | |
| | | | | | | | |
| | | | 713,266 | |
|
Specialty Retail 0.4% | |
Hennes & Mauritz AB “B” | | | 8,944 | | | | 184,352 | |
Home Depot, Inc. | | | 1,454 | | | | 275,577 | |
Lowe’s Companies, Inc. | | | 1,972 | | | | 183,278 | |
| | | | | | | | |
| | | | 643,207 | |
|
Textiles, Apparel & Luxury Goods 0.3% | |
Tapestry, Inc. | | | 5,189 | | | | 229,509 | |
VF Corp. | | | 3,510 | | | | 259,740 | |
| | | | | | | | |
| | | | 489,249 | |
|
| Consumer Staples 4.1% | |
Beverages 0.8% | |
Ambev SA (ADR) | | | 58,202 | | | | 375,985 | |
Coca-Cola Co. | | | 9,698 | | | | 444,944 | |
PepsiCo, Inc. | | | 2,644 | | | | 317,069 | |
| | | | | | | | |
| | | | 1,137,998 | |
|
Food & Staples Retailing 0.8% | |
CVS Health Corp. | | | 2,711 | | | | 196,547 | |
Lawson, Inc. | | | 3,000 | | | | 199,512 | |
Sysco Corp. | | | 4,011 | | | | 243,588 | |
Wal-Mart Stores, Inc. | | | 3,201 | | | | 316,099 | |
Wesfarmers Ltd. | | | 6,849 | | | | 237,113 | |
| | | | | | | | |
| | | | 1,192,859 | |
|
Food Products 0.9% | |
General Mills, Inc. | | | 3,789 | | | | 224,650 | |
Kellogg Co. | | | 3,055 | | | | 207,679 | |
Kraft Heinz Co. | | | 2,443 | | | | 189,968 | |
Nestle SA (Registered) | | | 5,133 | | | | 441,632 | |
The Hershey Co. | | | 2,049 | | | | 232,582 | |
| | | | | | | | |
| | | | 1,296,511 | |
|
Household Products 0.6% | |
Colgate-Palmolive Co. | | | 3,045 | | | | 229,745 | |
Kimberly-Clark Corp. | | | 1,686 | | | | 203,433 | |
Procter & Gamble Co. | | | 5,484 | | | | 503,870 | |
| | | | | | | | |
| | | | 937,048 | |
|
Tobacco 1.0% | |
Altria Group, Inc. | | | 5,475 | | | | 390,970 | |
British American Tobacco PLC | | | 1,018 | | | | 68,982 | |
British American Tobacco PLC (ADR) | | | 1,864 | | | | 124,869 | |
Imperial Brands PLC | | | 4,772 | | | | 203,979 | |
Japan Tobacco, Inc. | | | 6,477 | | | | 208,445 | |
Philip Morris International, Inc. | | | 4,334 | | | | 457,887 | |
| | | | | | | | |
| | | | 1,455,132 | |
|
| Energy 4.8% | |
Energy Equipment & Services 0.1% | |
Schlumberger Ltd. | | | 2,488 | | | | 167,666 | |
|
Oil, Gas & Consumable Fuels 4.7% | |
BP PLC | | | 59,802 | | | | 422,508 | |
Chevron Corp. | | | 3,662 | | | | 458,446 | |
Enagas SA | | | 6,138 | | | | 176,071 | |
Enbridge, Inc. | | | 5,395 | | | | 210,993 | |
Eni SpA | | | 9,759 | | | | 161,814 | |
The accompanying notes are an integral part of the financial statements.
| | | | |
Deutsche Variable Series II — Deutsche Global Income Builder VIP | | | | | 7 |
| | | | | | | | |
| | | Shares | | | Value ($) | |
Exxon Mobil Corp. | | | 9,040 | | | | 756,106 | |
Gazprom PJSC (ADR) | | | 93,610 | | | | 412,820 | |
JXTG Holdings, Inc. | | | 35,685 | | | | 230,220 | |
Kinder Morgan, Inc. | | | 9,231 | | | | 166,804 | |
LUKOIL PJSC (ADR) | | | 9,296 | | | | 535,914 | |
Neste Oyj | | | 2,660 | | | | 170,336 | |
Occidental Petroleum Corp. | | | 3,666 | | | | 270,038 | |
ONEOK, Inc. | | | 3,475 | | | | 185,739 | |
Pembina Pipeline Corp. | | | 7,040 | | | | 254,885 | |
Phillips 66 | | | 2,753 | | | | 278,466 | |
Royal Dutch Shell PLC “A” | | | 13,348 | | | | 448,073 | |
Royal Dutch Shell PLC “B” | | | 11,028 | | | | 374,420 | |
Snam SpA | | | 31,724 | | | | 155,338 | |
Statoil ASA | | | 9,431 | | | | 201,947 | |
Suncor Energy, Inc. | | | 4,626 | | | | 169,841 | |
TOTAL SA | | | 4,978 | | | | 274,981 | |
TransCanada Corp. | | | 4,710 | | | | 229,242 | |
Valero Energy Corp. | | | 3,565 | | | | 327,659 | |
| | | | | | | | |
| | | | 6,872,661 | |
|
| Financials 7.9% | |
Banks 4.9% | |
Australia & New Zealand Banking Group Ltd. | | | 10,142 | | | | 227,185 | |
Banco Bradesco SA (ADR) | | | 16,348 | | | | 167,404 | |
Bank of Montreal | | | 3,152 | | | | 252,235 | |
Bank of Nova Scotia | | | 4,036 | | | | 260,462 | |
BB&T Corp. | | | 4,217 | | | | 209,669 | |
Canadian Imperial Bank of Commerce | | | 2,775 | | | | 270,524 | |
Commonwealth Bank of Australia | | | 3,499 | | | | 219,174 | |
Danske Bank AS | | | 5,876 | | | | 229,024 | |
Hang Seng Bank Ltd. | | | 7,100 | | | | 176,282 | |
HSBC Holdings PLC | | | 38,380 | | | | 397,642 | |
Intesa Sanpaolo SpA | | | 47,758 | | | | 159,189 | |
Itau Unibanco Holding SA (ADR) (Preferred) | | | 23,662 | | | | 307,606 | |
Japan Post Bank Co., Ltd. | | | 15,900 | | | | 206,702 | |
JPMorgan Chase & Co. | | | 3,400 | | | | 363,596 | |
KBC Group NV | | | 2,377 | | | | 203,211 | |
Mizuho Financial Group, Inc. | | | 118,673 | | | | 215,284 | |
National Australia Bank Ltd. | | | 9,057 | | | | 208,832 | |
Nordea Bank AB | | | 17,384 | | | | 210,583 | |
People’s United Financial, Inc. | | | 12,896 | | | | 241,155 | |
PNC Financial Services Group, Inc. | | | 1,450 | | | | 209,220 | |
Royal Bank of Canada | | | 3,234 | | | | 264,097 | |
Sberbank of Russia PJSC (ADR) | | | 21,686 | | | | 369,313 | |
Skandinaviska Enskilda Banken AB “A” | | | 18,731 | | | | 219,988 | |
Sumitomo Mitsui Financial Group, Inc. | | | 5,000 | | | | 215,982 | |
SunTrust Banks, Inc. | | | 2,471 | | | | 159,602 | |
Swedbank AB “A” | | | 9,281 | | | | 224,068 | |
Toronto-Dominion Bank | | | 4,734 | | | | 277,374 | |
U.S. Bancorp. | | | 4,373 | | | | 234,305 | |
Wells Fargo & Co. | | | 4,668 | | | | 283,208 | |
Westpac Banking Corp. | | | 8,851 | | | | 216,048 | |
| | | | | | | | |
| | | | 7,198,964 | |
|
Capital Markets 0.3% | |
CME Group, Inc. | | | 1,917 | | | | 279,978 | |
UBS Group AG (Registered)* | | | 9,137 | | | | 168,358 | |
| | | | | | | | |
| | | | 448,336 | |
| | | | | | | | |
| | | Shares | | | Value ($) | |
Insurance 2.5% | |
Ageas | | | 5,239 | | | | 256,187 | |
Allianz SE (Registered) | | | 1,179 | | | | 271,389 | |
Baloise Holding AG (Registered) | | | 1,095 | | | | 170,457 | |
Japan Post Holdings Co., Ltd. | | | 17,500 | | | | 200,670 | |
Legal & General Group PLC | | | 68,412 | | | | 252,576 | |
MetLife, Inc. | | | 3,353 | | | | 169,528 | |
Muenchener Rueckversicherungs-Gesellschaft AG (Registered) | | | 1,141 | | | | 247,663 | |
Poste Italiane SpA 144A | | | 25,538 | | | | 192,368 | |
Power Financial Corp. | | | 5,950 | | | | 163,495 | |
Prudential Financial, Inc. | | | 1,340 | | | | 154,073 | |
Sampo Oyj “A” | | | 4,491 | | | | 247,046 | |
Swiss Life Holding AG (Registered)* | | | 692 | | | | 245,179 | |
Swiss Re AG | | | 3,705 | | | | 347,306 | |
The Travelers Companies, Inc. | | | 1,849 | | | | 250,798 | |
UnipolSai Assicurazioni SpA | | | 70,321 | | | | 164,205 | |
Zurich Insurance Group AG | | | 997 | | | | 303,535 | |
| | | | | | | | |
| | | | 3,636,475 | |
|
Thrifts & Mortgage Finance 0.2% | |
New York Community Bancorp., Inc. | | | 16,896 | | | | 219,986 | |
|
| Health Care 4.4% | |
Biotechnology 0.8% | |
AbbVie, Inc. | | | 5,370 | | | | 519,333 | |
Amgen, Inc. | | | 1,629 | | | | 283,283 | |
Gilead Sciences, Inc. | | | 5,211 | | | | 373,316 | |
| | | | | | | | |
| | | | 1,175,932 | |
|
Health Care Equipment & Supplies 0.1% | |
Medtronic PLC | | | 2,704 | | | | 218,348 | |
|
Health Care Providers & Services 0.1% | |
UnitedHealth Group, Inc. | | | 700 | | | | 154,322 | |
|
Pharmaceuticals 3.4% | |
Astellas Pharma, Inc. | | | 17,200 | | | | 219,225 | |
AstraZeneca PLC | | | 3,780 | | | | 261,530 | |
Bristol-Myers Squibb Co. | | | 4,024 | | | | 246,591 | |
Daiichi Sankyo Co., Ltd. | | | 9,600 | | | | 250,282 | |
Eli Lilly & Co. | | | 2,754 | | | | 232,603 | |
GlaxoSmithKline PLC | | | 26,716 | | | | 476,278 | |
Johnson & Johnson | | | 5,504 | | | | 769,019 | |
Merck & Co., Inc. | | | 6,511 | | | | 366,374 | |
Mitsubishi Tanabe Pharma Corp. | | | 9,700 | | | | 200,070 | |
Novartis AG (Registered) | | | 4,568 | | | | 385,739 | |
Otsuka Holdings Co., Ltd. | | | 4,900 | | | | 215,101 | |
Pfizer, Inc. | | | 16,243 | | | | 588,321 | |
Roche Holding AG (Genusschein) | | | 1,160 | | | | 293,619 | |
Sanofi | | | 2,245 | | | | 193,491 | |
Takeda Pharmaceutical Co., Ltd. | | | 4,400 | | | | 249,990 | |
| | | | | | | | |
| | | | 4,948,233 | |
|
| Industrials 6.5% | |
Aerospace & Defense 1.0% | |
BAE Systems PLC | | | 26,571 | | | | 205,821 | |
Boeing Co. | | | 908 | | | | 267,779 | |
Harris Corp. | | | 1,245 | | | | 176,354 | |
Lockheed Martin Corp. | | | 856 | | | | 274,819 | |
Raytheon Co. | | | 1,353 | | | | 254,161 | |
United Technologies Corp. | | | 1,844 | | | | 235,239 | |
| | | | | | | | |
| | | | 1,414,173 | |
The accompanying notes are an integral part of the financial statements.
| | | | | | |
| | 8 | | | | | | Deutsche Variable Series II — Deutsche Global Income Builder VIP |
| | | | | | | | |
| | | Shares | | | Value ($) | |
Air Freight & Logistics 0.3% | |
Royal Mail PLC | | | 31,817 | | | | 194,563 | |
United Parcel Service, Inc. “B” | | | 2,074 | | | | 247,117 | |
| | | | | | | | |
| | | | 441,680 | |
|
Building Products 0.1% | |
Johnson Controls International PLC | | | 5,340 | | | | 203,507 | |
|
Commercial Services & Supplies 0.4% | |
Republic Services, Inc. | | | 3,946 | | | | 266,789 | |
Waste Management, Inc. | | | 3,418 | | | | 294,974 | |
| | | | | | | | |
| | | | 561,763 | |
|
Construction & Engineering 0.5% | |
Kajima Corp. | | | 21,000 | | | | 202,144 | |
Obayashi Corp. | | | 21,200 | | | | 256,772 | |
Taisei Corp. | | | 5,200 | | | | 258,884 | |
| | | | | | | | |
| | | | 717,800 | |
|
Electrical Equipment 0.5% | |
ABB Ltd. (Registered) | | | 9,637 | | | | 258,456 | |
Eaton Corp. PLC | | | 2,948 | | | | 232,922 | |
Emerson Electric Co. | | | 3,883 | | | | 270,606 | |
| | | | | | | | |
| | | | 761,984 | |
|
Industrial Conglomerates 0.6% | |
3M Co. | | | 1,514 | | | | 356,350 | |
General Electric Co. | | | 14,596 | | | | 254,700 | |
Honeywell International, Inc. | | | 2,012 | | | | 308,561 | |
| | | | | | | | |
| | | | 919,611 | |
|
Machinery 1.2% | |
Caterpillar, Inc. | | | 2,036 | | | | 320,833 | |
Cummins, Inc. | | | 1,390 | | | | 245,530 | |
Deere & Co. | | | 1,530 | | | | 239,460 | |
Illinois Tool Works, Inc. | | | 1,550 | | | | 258,618 | |
Ingersoll-Rand PLC | | | 2,470 | | | | 220,299 | |
Kone Oyj “B” | | | 4,809 | | | | 258,603 | |
Stanley Black & Decker, Inc. | | | 968 | | | | 164,260 | |
| | | | | | | | |
| | | | 1,707,603 | |
|
Marine 0.2% | |
Kuehne + Nagel International AG (Registered) | | | 1,330 | | | | 235,555 | |
|
Professional Services 0.5% | |
Adecco Group AG (Registered) | | | 3,181 | | | | 243,158 | |
Nielsen Holdings PLC | | | 6,511 | | | | 237,000 | |
SGS SA (Registered) | | | 94 | | | | 245,341 | |
| | | | | | | | |
| | | | 725,499 | |
|
Road & Rail 0.2% | |
Union Pacific Corp. | | | 2,029 | | | | 272,089 | |
|
Trading Companies & Distributors 1.0% | |
Fastenal Co. | | | 4,803 | | | | 262,676 | |
ITOCHU Corp. | | | 12,139 | | | | 226,708 | |
Marubeni Corp. | | | 35,049 | | | | 253,828 | |
Mitsubishi Corp. | | | 8,400 | | | | 232,402 | |
Mitsui & Co., Ltd. | | | 15,251 | | | | 247,920 | |
Sumitomo Corp. | | | 15,966 | | | | 271,485 | |
| | | | | | | | |
| | | | 1,495,019 | |
|
| Information Technology 10.0% | |
Communications Equipment 0.4% | |
Cisco Systems, Inc. | | | 7,562 | | | | 289,625 | |
| | | | | | | | |
| | | Shares | | | Value ($) | |
Motorola Solutions, Inc. | | | 2,148 | | | | 194,050 | |
Nokia Oyj | | | 34,482 | | | | 161,498 | |
| | | | | | | | |
| | | | 645,173 | |
|
Electronic Equipment, Instruments & Components 0.5% | |
Corning, Inc. | | | 5,383 | | | | 172,202 | |
FLIR Systems, Inc. | | | 3,545 | | | | 165,268 | |
Kyocera Corp. | | | 2,300 | | | | 150,541 | |
TE Connectivity Ltd. | | | 1,682 | | | | 159,857 | |
| | | | | | | | |
| | | | 647,868 | |
|
Internet Software & Services 2.1% | |
Alibaba Group Holding Ltd. (ADR)* | | | 2,039 | | | | 351,585 | |
Alphabet, Inc. “A”* | | | 200 | | | | 210,680 | |
Alphabet, Inc. “C”* | | | 335 | | | | 350,544 | |
Baidu, Inc. (ADR)* | | | 1,236 | | | | 289,484 | |
Facebook, Inc. “A”* | | | 2,598 | | | | 458,443 | |
Mixi, Inc. | | | 3,400 | | | | 152,782 | |
NetEase, Inc. (ADR) | | | 1,552 | | | | 535,549 | |
Tencent Holdings Ltd. (ADR) (a) | | | 10,493 | | | | 544,796 | |
Yahoo Japan Corp. | | | 51,600 | | | | 236,179 | |
| | | | | | | | |
| | | | 3,130,042 | |
|
IT Services 2.0% | |
Accenture PLC “A” | | | 1,920 | | | | 293,933 | |
Automatic Data Processing, Inc. | | | 2,305 | | | | 270,123 | |
Broadridge Financial Solutions, Inc. | | | 3,043 | | | | 275,635 | |
DXC Technology Co. | | | 1,701 | | | | 161,425 | |
Fidelity National Information Services, Inc. | | | 2,626 | | | | 247,080 | |
Fiserv, Inc.* | | | 1,250 | | | | 163,913 | |
International Business Machines Corp. | | | 2,825 | | | | 433,411 | |
Mastercard, Inc. “A” | | | 1,930 | | | | 292,125 | |
Paychex, Inc. | | | 3,801 | | | | 258,772 | |
Visa, Inc. “A” | | | 2,753 | | | | 313,897 | |
Western Union Co. | | | 11,379 | | | | 216,315 | |
| | | | | | | | |
| | | | 2,926,629 | |
|
Semiconductors & Semiconductor Equipment 1.8% | |
Analog Devices, Inc. | | | 2,410 | | | | 214,562 | |
Disco Corp. | | | 1,100 | | | | 244,463 | |
Intel Corp. | | | 9,334 | | | | 430,857 | |
KLA-Tencor Corp. | | | 2,178 | | | | 228,842 | |
Maxim Integrated Products, Inc. | | | 4,828 | | | | 252,408 | |
Microchip Technology, Inc. | | | 1,896 | | | | 166,621 | |
QUALCOMM, Inc. | | | 4,181 | | | | 267,668 | |
Texas Instruments, Inc. | | | 2,796 | | | | 292,014 | |
Tokyo Electron Ltd. | | | 1,600 | | | | 288,092 | |
Xilinx, Inc. | | | 3,397 | | | | 229,026 | |
| | | | | | | | |
| | | | 2,614,553 | |
|
Software 1.5% | |
CA, Inc. | | | 6,883 | | | | 229,066 | |
Dell Technologies, Inc. “V”* | | | 2,065 | | | | 167,843 | |
Intuit, Inc. | | | 1,676 | | | | 264,439 | |
Microsoft Corp. | | | 14,014 | | | | 1,198,758 | |
Oracle Corp. | | | 6,029 | | | | 285,051 | |
| | | | | | | | |
| | | | 2,145,157 | |
|
Technology Hardware, Storage & Peripherals 1.7% | |
Apple, Inc. | | | 7,790 | | | | 1,318,302 | |
Canon, Inc. | | | 6,474 | | | | 241,527 | |
FUJIFILM Holdings Corp. | | | 4,100 | | | | 167,569 | |
The accompanying notes are an integral part of the financial statements.
| | | | |
Deutsche Variable Series II — Deutsche Global Income Builder VIP | | | | | 9 |
| | | | | | | | |
| | | Shares | | | Value ($) | |
HP, Inc. | | | 7,776 | | | | 163,374 | |
Samsung Electronics Co., Ltd. (GDR) | | | 226 | | | | 270,748 | |
Seagate Technology PLC | | | 3,900 | | | | 163,176 | |
Xerox Corp. | | | 5,338 | | | | 155,603 | |
| | | | | | | | |
| | | | 2,480,299 | |
|
| Materials 1.6% | |
Chemicals 0.9% | |
Air Products & Chemicals, Inc. | | | 1,544 | | | | 253,339 | |
DowDuPont, Inc. | | | 6,004 | | | | 427,605 | |
GEO Specialty Chemicals, Inc.* (b) | | | 19,324 | | | | 6,524 | |
Givaudan SA (Registered) | | | 107 | | | | 247,378 | |
LyondellBasell Industries NV “A” | | | 2,544 | | | | 280,654 | |
Praxair, Inc. | | | 1,304 | | | | 201,703 | |
| | | | | | | | |
| | | | 1,417,203 | |
|
Containers & Packaging 0.2% | |
International Paper Co. | | | 4,234 | | | | 245,318 | |
|
Metals & Mining 0.3% | |
MMC Norilsk Nickel PJSC (ADR) | | | 21,913 | | | | 414,375 | |
|
Paper & Forest Products 0.2% | |
UPM-Kymmene Oyj | | | 8,215 | | | | 255,704 | |
|
| Real Estate 2.8% | |
Equity Real Estate Investment Trusts (REITs) | |
AvalonBay Communities, Inc. | | | 1,111 | | | | 198,214 | |
Brixmor Property Group, Inc. | | | 10,900 | | | | 203,394 | |
Crown Castle International Corp. | | | 2,299 | | | | 255,212 | |
HCP, Inc. | | | 6,254 | | | | 163,104 | |
Iron Mountain, Inc. | | | 7,907 | | | | 298,331 | |
Japan Retail Fund Investment Corp. | | | 101 | | | | 185,258 | |
Kimco Realty Corp. | | | 10,900 | | | | 197,835 | |
National Retail Properties, Inc. | | | 5,594 | | | | 241,269 | |
Prologis, Inc. | | | 3,915 | | | | 252,557 | |
Public Storage | | | 1,081 | | | | 225,929 | |
Realty Income Corp. | | | 5,057 | | | | 288,350 | |
RioCan Real Estate Investment Trust | | | 10,979 | | | | 212,767 | |
Simon Property Group, Inc. | | | 1,000 | | | | 171,740 | |
Stockland | | | 45,744 | | | | 160,099 | |
Ventas, Inc. | | | 3,475 | | | | 208,535 | |
VEREIT, Inc. | | | 54,591 | | | | 425,264 | |
Vicinity Centres | | | 100,022 | | | | 212,468 | |
Welltower, Inc. | | | 4,324 | | | | 275,741 | |
| | | | | | | | |
| | | | | | | 4,176,067 | |
|
| Telecommunication Services 3.7% | |
Diversified Telecommunication Services 2.8% | |
AT&T, Inc. | | | 21,730 | | | | 844,862 | |
BCE, Inc. | | | 5,269 | | | | 253,096 | |
BT Group PLC | | | 62,537 | | | | 229,365 | |
Deutsche Telekom AG (Registered) | | | 12,163 | | | | 216,529 | |
Nippon Telegraph & Telephone Corp. | | | 3,100 | | | | 145,948 | |
Proximus SA | | | 4,927 | | | | 161,813 | |
Singapore Telecommunications Ltd. | | | 85,445 | | | | 228,707 | |
Swisscom AG (Registered) | | | 524 | | | | 278,928 | |
Telefonica Deutschland Holding AG | | | 36,320 | | | | 182,957 | |
Telefonica SA | | | 15,726 | | | | 153,691 | |
| | | | | | | | |
| | | Shares | | | Value ($) | |
Telenor ASA | | | 13,305 | | | | 285,224 | |
Telia Co. AB | | | 52,151 | | | | 232,527 | |
TELUS Corp. | | | 6,688 | | | | 253,367 | |
Verizon Communications, Inc. | | | 13,133 | | | | 695,130 | |
| | | | | | | | |
| | | | 4,162,144 | |
|
Wireless Telecommunication Services 0.9% | |
NTT DoCoMo, Inc. | | | 28,369 | | | | 670,319 | |
Tele2 AB “B” | | | 14,364 | | | | 176,585 | |
Vodafone Group PLC | | | 146,963 | | | | 467,233 | |
| | | | | | | | |
| | | | 1,314,137 | |
|
| Utilities 1.9% | |
Electric Utilities 1.3% | |
American Electric Power Co., Inc. | | | 2,084 | | | | 153,320 | |
Duke Energy Corp. | | | 2,621 | | | | 220,452 | |
Endesa SA | | | 11,551 | | | | 247,862 | |
Entergy Corp. | | | 1,950 | | | | 158,710 | |
Exelon Corp. | | | 4,029 | | | | 158,783 | |
FirstEnergy Corp. | | | 4,999 | | | | 153,069 | |
NextEra Energy, Inc. | | | 986 | | | | 154,003 | |
PPL Corp. | | | 5,688 | | | | 176,044 | |
Southern Co. | | | 4,385 | | | | 210,875 | |
SSE PLC | | | 11,751 | | | | 209,593 | |
| | | | | | | | |
| | | | 1,842,711 | |
|
Multi-Utilities 0.6% | |
CenterPoint Energy, Inc. | | | 5,490 | | | | 155,696 | |
Consolidated Edison, Inc. | | | 1,765 | | | | 149,937 | |
Dominion Energy, Inc. | | | 1,899 | | | | 153,933 | |
National Grid PLC | | | 13,729 | | | | 162,250 | |
Public Service Enterprise Group, Inc. | | | 3,199 | | | | 164,749 | |
WEC Energy Group, Inc. | | | 2,406 | | | | 159,831 | |
| | | | | | | | |
| | | | | | | | 946,396 | |
Total Common Stocks (Cost $66,046,600) | | | | 80,660,027 | |
|
| Preferred Stocks 5.7% | |
| Financials 2.3% | |
Bank of America Corp. Series Y, 6.5% | | | 15,000 | | | | 405,300 | |
BB&T Corp. 5.625% | | | 10,000 | | | | 270,000 | |
Capital One Financial Corp. Series G, 5.2% | | | 10,000 | | | | 250,300 | |
Citigroup, Inc. Series S, 6.3% | | | 15,000 | | | | 403,950 | |
Fifth Third Bancorp. Series I, 6.625% | | | 10,000 | | | | 285,000 | |
JPMorgan Chase & Co. Series AA, 6.1% | | | 15,000 | | | | 404,550 | |
KeyCorp Series E, 6.125% | | | 10,000 | | | | 289,200 | |
Morgan Stanley Series K, 5.85% | | | 10,000 | | | | 271,000 | |
The Goldman Sachs Group, Inc. Series J, 5.5% | | | 17,000 | | | | 450,670 | |
Wells Fargo & Co. Series Y, 5.625% | | | 15,000 | | | | 389,100 | |
| | | | | | | | |
| | | | 3,419,070 | |
|
| Industrials 0.5% | |
General Electric Co. 4.7% | | | 30,000 | | | | 748,800 | |
|
| Real Estate 1.5% | |
AGNC Investment Corp. Series C, 7.0% (REIT) | | | 14,427 | | | | 371,063 | |
The accompanying notes are an integral part of the financial statements.
| | | | | | |
| | 10 | | | | | | Deutsche Variable Series II — Deutsche Global Income Builder VIP |
| | | | | | | | |
| | | Shares | | | Value ($) | |
AGNC Investment Corp. Series B, 7.75% (REIT) | | | 18,000 | | | | 465,120 | |
Kimco Realty Corp. Series L, 5.125% (REIT) | | | 15,000 | | | | 371,100 | |
Prologis, Inc. Series Q, 8.54% (REIT) | | | 164 | | | | 12,462 | |
Simon Property Group, Inc. Series J, 8.375% (REIT) | | | 8,000 | | | | 572,080 | |
VEREIT, Inc. Series F, 6.7% (REIT) | | | 15,000 | | | | 383,550 | |
| | | | | | | | |
| | | | | | | 2,175,375 | |
|
| Telecommunication Services 0.6% | |
Verizon Communications, Inc. 5.9% | | | 30,000 | | | | 791,400 | |
|
| Utilities 0.8% | |
Dominion Energy, Inc. Series A, 5.25% | | | 30,000 | | | | 767,100 | |
Southern Co. 5.25% | | | 15,000 | | | | 381,750 | |
| | | | | | | | |
| | | | | | | | 1,148,850 | |
Total Preferred Stocks (Cost $8,377,556) | | | | 8,283,495 | |
|
| Right 0.0% | |
| Consumer Staples | |
Safeway Casa Ley, Expiration Date 1/30/2018* (b) (Cost $7,611) | | | 7,499 | | | | 7,611 | |
|
| Warrant 0.0% | |
| Materials | |
Hercules Trust II, Expiration Date 3/31/2029* (b) (Cost $30,283) | | | 170 | | | | 4,595 | |
| | |
| | | Principal
Amount ($)(c) | | | Value ($) | |
| Corporate Bonds 12.9% | |
| Consumer Discretionary 2.8% | |
1011778 B.C. Unlimited Liability Co., 144A, 5.0%, 10/15/2025 | | | 200,000 | | | | 201,500 | |
Altice Financing SA, 144A, 7.5%, 5/15/2026 | | | 400,000 | | | | 426,000 | |
American Axle & Manufacturing, Inc., 144A, 6.25%, 4/1/2025 (a) | | | 350,000 | | | | 368,375 | |
Asbury Automotive Group, Inc., 6.0%, 12/15/2024 | | | 300,000 | | | | 312,360 | |
Cablevision Systems Corp., 5.875%, 9/15/2022 | | | 300,000 | | | | 295,500 | |
CCO Holdings LLC, 144A, 5.875%, 5/1/2027 | | | 500,000 | | | | 515,000 | |
Charter Communications Operating LLC, 3.75%, 2/15/2028 | | | 160,000 | | | | 153,313 | |
CSC Holdings LLC: | | | | | | | | |
144A, 5.5%, 4/15/2027 | | | 400,000 | | | | 408,000 | |
144A, 10.125%, 1/15/2023 | | | 200,000 | | | | 225,250 | |
Expedia, Inc., 3.8%, 2/15/2028 | | | 180,000 | | | | 173,935 | |
General Motors Co., 6.6%, 4/1/2036 | | | 30,000 | | | | 36,552 | |
Nordstrom, Inc.: | | | | | | | | |
4.0%, 3/15/2027 | | | 65,000 | | | | 64,756 | |
5.0%, 1/15/2044 | | | 100,000 | | | | 96,407 | |
SFR Group SA, 144A, 7.375%, 5/1/2026 | | | 300,000 | | | | 307,875 | |
| | | | | | | | |
| | | Principal
Amount ($)(c) | | | Value ($) | |
Toll Brothers Finance Corp., 4.875%, 11/15/2025 | | | 200,000 | | | | 209,000 | |
Virgin Media Secured Finance PLC, 144A, 5.25%, 1/15/2026 | | | 350,000 | | | | 353,500 | |
| | | | | | | | |
| | | | 4,147,323 | |
|
| Consumer Staples 0.5% | |
B&G Foods, Inc., 5.25%, 4/1/2025 | | | 100,000 | | | | 101,715 | |
BAT Capital Corp., 144A, 4.54%, 8/15/2047 | | | 75,000 | | | | 78,968 | |
FAGE International SA, 144A, 5.625%, 8/15/2026 | | | 300,000 | | | | 289,500 | |
Kraft Heinz Foods Co., 4.375%, 6/1/2046 | | | 210,000 | | | | 208,016 | |
Molson Coors Brewing Co., 4.2%, 7/15/2046 | | | 40,000 | | | | 40,761 | |
| | | | | | | | |
| | | | 718,960 | |
|
| Energy 3.4% | |
Canadian Natural Resources Ltd., 4.95%, 6/1/2047 | | | 60,000 | | | | 67,148 | |
Cheniere Corpus Christi Holdings LLC, 5.875%, 3/31/2025 | | | 200,000 | | | | 216,750 | |
Chesapeake Energy Corp., 144A, 8.0%, 1/15/2025 | | | 65,000 | | | | 65,650 | |
Continental Resources, Inc., 5.0%, 9/15/2022 | | | 400,000 | | | | 406,000 | |
Crestwood Midstream Partners LP, 6.25%, 4/1/2023 | | | 700,000 | | | | 727,440 | |
Enbridge, Inc., 5.5%, 7/15/2077 | | | 200,000 | | | | 198,750 | |
Energy Transfer Equity LP, 5.5%, 6/1/2027 | | | 100,000 | | | | 102,000 | |
Energy Transfer LP: | | | | | | | | |
4.5%, 11/1/2023 | | | 40,000 | | | | 41,358 | |
5.95%, 10/1/2043 | | | 30,000 | | | | 31,897 | |
EnLink Midstream Partners LP, 5.45%, 6/1/2047 | | | 90,000 | | | | 95,102 | |
Halliburton Co., 4.85%, 11/15/2035 | | | 35,000 | | | | 39,264 | |
Hess Corp., 5.8%, 4/1/2047 | | | 75,000 | | | | 83,459 | |
Hilcorp Energy I LP, 144A, 5.75%, 10/1/2025 | | | 200,000 | | | | 204,500 | |
Kinder Morgan Energy Partners LP, 4.7%, 11/1/2042 | | | 110,000 | | | | 106,489 | |
MEG Energy Corp., 144A, 6.5%, 1/15/2025 (a) | | | 200,000 | | | | 197,500 | |
Noble Energy, Inc., 3.85%, 1/15/2028 | | | 185,000 | | | | 185,566 | |
Noble Holding International Ltd., 5.75%, 3/16/2018 | | | 10,000 | | | | 10,025 | |
Oasis Petroleum, Inc., 6.875%, 3/15/2022 | | | 100,000 | | | | 102,625 | |
Plains All American Pipeline LP: | | | | | | | | |
2.85%, 1/31/2023 | | | 55,000 | | | | 52,628 | |
4.3%, 1/31/2043 | | | 95,000 | | | | 83,897 | |
Range Resources Corp., 5.0%, 8/15/2022 | | | 200,000 | | | | 199,000 | |
Southwestern Energy Co., 7.75%, 10/1/2027 | | | 100,000 | | | | 106,750 | |
State Oil Co. of the Azerbaijan Republic, REG S, 4.75%, 3/13/2023 | | | 700,000 | | | | 708,772 | |
Sunoco Logistics Partners Operations LP, 5.3%, 4/1/2044 | | | 20,000 | | | | 19,738 | |
Sunoco LP, 6.375%, 4/1/2023 | | | 100,000 | | | | 105,375 | |
The accompanying notes are an integral part of the financial statements.
| | | | |
Deutsche Variable Series II — Deutsche Global Income Builder VIP | | | | | 11 |
| | | | | | | | |
| | | Principal
Amount ($)(c) | | | Value ($) | |
Targa Resources Partners LP, 5.375%, 2/1/2027 | | | 200,000 | | | | 205,250 | |
Weatherford International Ltd., 9.875%, 2/15/2024 | | | 200,000 | | | | 212,500 | |
WPX Energy, Inc.: | | | | | | | | |
5.25%, 9/15/2024 | | | 200,000 | | | | 199,310 | |
6.0%, 1/15/2022 | | | 200,000 | | | | 209,000 | |
| | | | | | | | |
| | | | | | | 4,983,743 | |
|
| Financials 2.0% | |
BPCE SA, 144A, 4.875%, 4/1/2026 | | | 700,000 | | | | 749,711 | |
Everest Reinsurance Holdings, Inc., 4.868%, 6/1/2044 | | | 50,000 | | | | 53,203 | |
FS Investment Corp., 4.75%, 5/15/2022 | | | 70,000 | | | | 72,064 | |
HSBC Holdings PLC, 4.375%, 11/23/2026 | | | 200,000 | | | | 208,804 | |
KKR Group Finance Co. III LLC, 144A, 5.125%, 6/1/2044 | | | 30,000 | | | | 33,255 | |
Legg Mason, Inc., 5.625%, 1/15/2044 | | | 50,000 | | | | 55,744 | |
Nationwide Financial Services, Inc., 144A, 5.3%, 11/18/2044 | | | 40,000 | | | | 47,451 | |
Royal Bank of Scotland Group PLC, 7.5%, 8/10/2020 | | | 800,000 | | | | 846,000 | |
Swiss Re Treasury U.S. Corp., 144A, 4.25%, 12/6/2042 | | | 30,000 | | | | 31,195 | |
TC Ziraat Bankasi AS: | | | | | | | | |
144A, 5.125%, 5/3/2022 | | | 200,000 | | | | 198,290 | |
144A, 5.125%, 9/29/2023 | | | 350,000 | | | | 340,854 | |
Voya Financial, Inc., 4.8%, 6/15/2046 | | | 45,000 | | | | 50,126 | |
Westpac Banking Corp., 5.0%, 9/21/2027 | | | 300,000 | | | | 299,233 | |
| | | | | | | | |
| | | | | | | 2,985,930 | |
|
| Health Care 0.4% | |
Allergan Funding SCS, 4.75%, 3/15/2045 | | | 9,000 | | | | 9,581 | |
Celgene Corp., 5.0%, 8/15/2045 | | | 30,000 | | | | 34,038 | |
Express Scripts Holding Co., 4.8%, 7/15/2046 | | | 50,000 | | | | 53,189 | |
HCA, Inc., 4.5%, 2/15/2027 | | | 350,000 | | | | 351,750 | |
Mylan NV, 5.25%, 6/15/2046 | | | 55,000 | | | | 60,264 | |
| | | | | | | | |
| | | | | | | 508,822 | |
|
| Industrials 0.6% | |
Bombardier, Inc., 144A, 6.0%, 10/15/2022 | | | 300,000 | | | | 294,750 | |
Park Aerospace Holdings Ltd., 144A, 5.25%, 8/15/2022 | | | 175,000 | | | | 173,906 | |
United Rentals North America, Inc., 5.875%, 9/15/2026 | | | 350,000 | | | | 374,500 | |
| | | | | | | | |
| | | | | | | 843,156 | |
|
| Information Technology 0.3% | |
Dell International LLC, 144A, 8.1%, 7/15/2036 | | | 30,000 | | | | 37,884 | |
DXC Technology Co., 4.75%, 4/15/2027 | | | 210,000 | | | | 223,316 | |
Netflix, Inc., 4.375%, 11/15/2026 | | | 100,000 | | | | 97,750 | |
Pitney Bowes, Inc., 3.625%, 9/15/2020 | | | 45,000 | | | | 44,550 | |
| | | | | | | | |
| | | Principal
Amount ($)(c) | | | Value ($) | |
Seagate HDD Cayman, 144A, 4.25%, 3/1/2022 | | | 90,000 | | | | 91,098 | |
| | | | | | | | |
| | | | | | | 494,598 | |
|
| Materials 1.2% | |
AK Steel Corp., 7.0%, 3/15/2027 (a) | | | 200,000 | | | | 203,500 | |
Ardagh Packaging Finance PLC, 144A, 7.25%, 5/15/2024 | | | 200,000 | | | | 217,750 | |
CF Industries, Inc., 144A, 4.5%, 12/1/2026 | | | 20,000 | | | | 20,848 | |
Constellium NV, 144A, 6.625%, 3/1/2025 | | | 250,000 | | | | 263,438 | |
Evraz Group SA, 144A, 5.375%, 3/20/2023 | | | 300,000 | | | | 312,000 | |
Glencore Funding LLC, 144A, 4.625%, 4/29/2024 | | | 20,000 | | | | 21,116 | |
United States Steel Corp., 6.875%, 8/15/2025 | | | 200,000 | | | | 208,760 | |
Vedanta Resources PLC, 144A, 7.125%, 5/31/2023 | | | 400,000 | | | | 430,520 | |
| | | | | | | | |
| | | | | | | 1,677,932 | |
|
| Real Estate 0.5% | |
CBL & Associates LP: | | | | | | | | |
(REIT), 5.25%, 12/1/2023 | | | 45,000 | | | | 42,496 | |
(REIT), 5.95%, 12/15/2026 (a) | | | 110,000 | | | | 102,330 | |
Government Properties Income Trust, (REIT), 4.0%, 7/15/2022 | | | 150,000 | | | | 150,907 | |
Hospitality Properties Trust, (REIT), 3.95%, 1/15/2028 | | | 100,000 | | | | 97,007 | |
Omega Healthcare Investors, Inc.: | | | | | | | | |
(REIT), 4.75%, 1/15/2028 | | | 110,000 | | | | 109,039 | |
(REIT), 4.95%, 4/1/2024 | | | 60,000 | | | | 62,681 | |
Select Income REIT: | | | | | | | | |
(REIT), 4.15%, 2/1/2022 | | | 60,000 | | | | 60,673 | |
(REIT), 4.25%, 5/15/2024 | | | 45,000 | | | | 44,633 | |
VEREIT Operating Partnership LP, (REIT), 3.95%, 8/15/2027 | | | 125,000 | | | | 123,572 | |
| | | | | | | | |
| | | | | | | 793,338 | |
|
| Telecommunication Services 1.0% | |
AT&T, Inc.: | | | | | | | | |
4.5%, 5/15/2035 | | | 105,000 | | | | 104,377 | |
5.15%, 2/14/2050 | | | 115,000 | | | | 116,434 | |
CenturyLink, Inc., Series Y, 7.5%, 4/1/2024 (a) | | | 300,000 | | | | 299,250 | |
Intelsat Jackson Holdings SA, 7.25%, 10/15/2020 | | | 600,000 | | | | 564,000 | |
Sprint Corp., 7.625%, 2/15/2025 (a) | | | 300,000 | | | | 314,250 | |
Verizon Communications, Inc., 4.272%, 1/15/2036 | | | 60,000 | | | | 59,688 | |
| | | | | | | | |
| | | | | | | 1,457,999 | |
|
| Utilities 0.2% | |
AmeriGas Partners LP, 5.75%, 5/20/2027 | | | 200,000 | | | | 202,000 | |
Electricite de France SA, 144A, 4.75%, 10/13/2035 | | | 95,000 | | | | 104,903 | |
Southern Power Co., Series F, 4.95%, 12/15/2046 | | | 29,000 | | | | 31,810 | |
| | | | | | | | |
| | | | | | | | 338,713 | |
Total Corporate Bonds (Cost $18,930,128) | | | | 18,950,514 | |
The accompanying notes are an integral part of the financial statements.
| | | | | | |
| | 12 | | | | | | Deutsche Variable Series II — Deutsche Global Income Builder VIP |
| | | | | | | | |
| | | Principal
Amount ($)(c) | | | Value ($) | |
| Asset-Backed 0.6% | |
| Miscellaneous | | | | | | | | |
Dell Equipment Finance Trust, “D”, Series 2017-1, 144A, 3.44%, 4/24/2023 | | | 280,000 | | | | 278,228 | |
Domino’s Pizza Master Issuer LLC, “A23”, Series 2017-1A, 144A, 4.118%, 7/25/2047 | | | 339,150 | | | | 346,503 | |
Hilton Grand Vacations Trust, “B”, Series 2014-AA, 144A, 2.07%, 11/25/2026 | | | 159,414 | | | | 156,796 | |
Wendys Funding LLC, “A2I”, Series 2018-1A, 144A, 3.573%, 3/15/2048 (d) | | | 160,000 | | | | 159,950 | |
Total Asset-Backed (Cost $938,513) | | | | 941,477 | |
|
Mortgage-Backed Securities
Pass-Throughs 1.1% | |
Federal Home Loan Mortgage Corp.: | | | | | | | | |
3.5%, 5/1/2046 | | | 1,494,014 | | | | 1,540,469 | |
6.0%, 3/1/2038 | | | 4,067 | | | | 4,557 | |
Federal National Mortgage Association: | | | | | | | | |
4.5%, 9/1/2035 | | | 7,299 | | | | 7,771 | |
6.0%, 1/1/2024 | | | 12,655 | | | | 14,137 | |
Total Mortgage-Backed Securities Pass-Throughs (Cost $1,567,526) | | | | 1,566,934 | |
|
| Commercial Mortgage-Backed Securities 0.9% | |
CHT Mortgage Trust, “D”, Series 2017-CSMO, 144A, 1-month USD-LIBOR + 2.250%, 3.63%**, 11/15/2036 | | | 300,000 | | | | 300,561 | |
CSAIL Commercial Mortgage Trust, “A4”, Series 2015-C4, 3.808%, 11/15/2048 | | | 300,000 | | | | 313,630 | |
FHLMC Multifamily Structured Pass-Through Certificates, “X1”, Series K043, Interest Only, 0.546%**, 12/25/2024 | | | 4,955,820 | | | | 163,213 | |
GMAC Commercial Mortgage Securities, Inc., “G”, Series 2004-C1, 144A, 5.455%, 3/10/2038 | | | 490,430 | | | | 458,945 | |
JPMBB Commercial Mortgage Securities Trust, “A3”, Series 2014-C19, 3.669%, 4/15/2047 | | | 125,000 | | | | 129,410 | |
Total Commercial Mortgage-Backed Securities (Cost $1,399,434) | | | | 1,365,759 | |
|
| Collateralized Mortgage Obligations 1.5% | |
Federal Home Loan Mortgage Corp.: | | | | | | | | |
“HI”, Series 3979, Interest Only, 3.0%, 12/15/2026 | | | 261,886 | | | | 20,397 | |
“IK”, Series 4048, Interest Only, 3.0%, 5/15/2027 | | | 383,207 | | | | 35,350 | |
| | | | | | | | |
| | | Principal
Amount ($)(c) | | | Value ($) | |
“H”, Series 4865, 4.0%, 8/15/2044 | | | 883,343 | | | | 920,974 | |
“LI”, Series 3720, Interest Only, 4.5%, 9/15/2025 | | | 524,967 | | | | 55,224 | |
“PI”, Series 3843, Interest Only, 4.5%, 5/15/2038 | | | 227,512 | | | | 16,545 | |
“C31”, Series 303, Interest Only, 4.5%, 12/15/2042 | | | 1,231,140 | | | | 246,835 | |
“H”, Series 2278, 6.5%, 1/15/2031 | | | 120 | | | | 123 | |
Federal National Mortgage Association: | | | | | | | | |
“WO”, Series 2013-27, Principal Only, Zero Coupon, 12/25/2042 | | | 220,000 | | | | 142,445 | |
“4”, Series 406, Interest Only, 4.0%, 9/25/2040 | | | 107,895 | | | | 21,279 | |
“I”, Series 2003-84, Interest Only, 6.0%, 9/25/2033 | | | 119,600 | | | | 20,180 | |
Government National Mortgage Association: | | | | | | | | |
“QI”, Series 2011-112, Interest Only, 4.0%, 5/16/2026 | | | 191,917 | | | | 17,681 | |
“PI”, Series 2015-40, Interest Only, 4.0%, 4/20/2044 | | | 267,923 | | | | 30,956 | |
“BI”, Series 2010-30, Interest Only, 4.5%, 7/20/2039 | | | 38,023 | | | | 4,044 | |
“PI”, Series 2014-108, Interest Only, 4.5%, 12/20/2039 | | | 70,221 | | | | 12,170 | |
“IP”, Series 2014-11, Interest Only, 4.5%, 1/20/2043 | | | 186,245 | | | | 23,571 | |
“IQ”, Series 2011-18, Interest Only, 5.5%, 1/16/2039 | | | 78,731 | | | | 7,299 | |
“IV”, Series 2009-69, Interest Only, 5.5%, 8/20/2039 | | | 204,480 | | | | 34,615 | |
“IN”, Series 2009-69, Interest Only, 5.5%, 8/20/2039 | | | 209,327 | | | | 38,278 | |
“IJ”, Series 2009-75, Interest Only, 6.0%, 8/16/2039 | | | 147,414 | | | | 25,774 | |
RESIMAC, “A2”, Series 2017-2, 1-month Bank Bill Swap Rate + 1.200%, 2.89%**, 1/15/2049 | | | AUD 600,000 | | | | 469,112 | |
Total Collateralized Mortgage Obligations (Cost $1,850,875) | | | | 2,142,852 | |
|
| Government & Agency Obligations 5.7% | |
| Other Government Related (e) 0.1% | |
Sberbank of Russia, 144A, 5.125%, 10/29/2022 | | | 200,000 | | | | 206,420 | |
|
| Sovereign Bonds 4.9% | |
Export Credit Bank of Turkey, 144A, 5.375%, 10/24/2023 | | | 350,000 | | | | 353,692 | |
The accompanying notes are an integral part of the financial statements.
| | | | |
Deutsche Variable Series II — Deutsche Global Income Builder VIP | | | | | 13 |
| | | | | | | | |
| | | Principal
Amount ($)(c) | | | Value ($) | |
Government of Indonesia, Series FR56, 8.375%, 9/15/2026 | | | IDR 21,340,000,000 | | | | 1,777,127 | |
Mexican Udibonos Inflation-Linked Bond, Series S, 2.0%, 6/9/2022 | | | MXN 8,924,378 | | | | 426,927 | |
Republic of Angola, 144A, 9.5%, 11/12/2025 | | | 650,000 | | | | 748,593 | |
Republic of Argentina, Series NY, Step-up Coupon, 2.5% to 3/31/2019, 3.75% to 3/31/2029, 5.25% to 12/31/2038 | | | 1,500,000 | | | | 1,102,725 | |
Republic of Hungary, Series 19/A, 6.5%, 6/24/2019 | | | HUF 16,900,000 | | | | 71,468 | |
Republic of Namibia, 144A, 5.25%, 10/29/2025 | | | 550,000 | | | | 560,395 | |
Republic of Nigeria, 144A, 6.5%, 11/28/2027 | | | 200,000 | | | | 208,405 | |
Republic of Senegal, 144A, 6.25%, 7/30/2024 | | | 800,000 | | | | 863,454 | |
Republic of Zambia, 144A, 5.375%, 9/20/2022 | | | 500,000 | | | | 487,780 | |
United Mexican States, Series M, 5.75%, 3/5/2026 | | | MXN 13,525,200 | | | | 608,048 | |
| | | | | | | | |
| | | | | | | 7,208,614 | |
|
| U.S. Treasury Obligation 0.7% | |
U.S. Treasury Note, 0.75%, 4/30/2018 | | | 1,000,000 | | | | 997,813 | |
Total Government & Agency Obligations (Cost $8,053,727) | | | | 8,412,847 | |
|
| Municipal Bonds and Notes 0.1% | |
Kentucky, Asset/Liability Commission, General Fund Revenue, 3.165%, 4/1/2018 (Cost $64,810) | | | 64,810 | | | | 65,043 | |
|
| Convertible Bond 0.2% | |
| Materials | |
GEO Specialty Chemicals, Inc., 3-month USD-LIBOR + 14.0%, 15.709% PIK, 10/18/2025 (b) (Cost $247,405) | | | 248,767 | | | | 314,566 | |
| | | | | | | | |
| | |
| | | Principal
Amount ($) | | | Value ($) | |
| Short-Term U.S. Treasury Obligations 4.3% | |
U.S. Treasury Bills: | | | | | | | | |
1.18%***, 8/16/2018 (f) | | | 3,338,000 | | | | 3,304,891 | |
1.381%***, 10/11/2018 (f) (g) | | | 3,056,000 | | | | 3,016,142 | |
Total Short-Term U.S. Treasury Obligations (Cost $6,336,061) | | | | 6,321,033 | |
| | |
| | | Shares | | | Value ($) | |
| Exchange-Traded Funds 9.8% | |
SPDR Bloomberg Barclays High Yield Bond ETF (a) | | | 115,000 | | | | 4,222,800 | |
VanEck Vectors JPMorgan EM Local Currency Bond ETF | | | 270,000 | | | | 5,124,600 | |
Vanguard REIT ETF | | | 60,500 | | | | 5,020,290 | |
Total Exchange-Traded Funds (Cost $14,182,078) | | | | 14,367,690 | |
|
| Securities Lending Collateral 2.2% | |
Deutsche Government & Agency Securities Portfolio “Deutsche Government Cash Institutional Shares”, 1.21% (h) (i) (Cost $3,253,298) | | | 3,253,298 | | | | 3,253,298 | |
|
| Cash Equivalents 1.1% | |
Deutsche Central Cash Management Government Fund, 1.30% (h) (Cost $1,616,434) | | | 1,616,434 | | | | 1,616,434 | |
| | |
| | | % of Net
Assets | | | Value ($) | |
Total Investment Portfolio (Cost $132,902,339) | | | 101.2 | | | | 148,274,175 | |
| Other Assets and Liabilities, Net | | | (1.2 | ) | | | (1,754,932 | ) |
| Net Assets | | | 100.0 | | | | 146,519,243 | |
| * | Non-income producing security. |
| ** | Variable or floating rate security. These securities are shown at their current rate as of December 31, 2017. For securities based on a published reference rate and spread, the reference rate and spread are indicated within the description above. Certain variable rate securities are not based on a published reference rate and spread but adjust periodically based on current market conditions, prepayment of underlying positions and/or other variables. |
| *** | Annualized yield at time of purchase; not a coupon rate. |
| (a) | All or a portion of these securities were on loan. In addition, “Other Assets and Liabilities, Net” may include pending sales that are also on loan. The value of securities loaned at December 31, 2017 amounted to $3,154,529, which is 2.2% of net assets. |
| (b) | Investment was valued using significant unobservable inputs. |
| (c) | Principal amount stated in U.S. dollars unless otherwise noted. |
| (e) | Government-backed debt issued by financial companies or government sponsored enterprises. |
The accompanying notes are an integral part of the financial statements.
| | | | | | |
| | 14 | | | | | | Deutsche Variable Series II — Deutsche Global Income Builder VIP |
| (f) | At December 31, 2017, this security has been pledged, in whole or in part, to cover initial margin requirements for open futures and centrally cleared swap contracts. |
| (g) | At December 31, 2017, this security has been pledged, in whole or in part, as collateral for open over-the-counter derivatives. |
| (h) | Affiliated fund managed by Deutsche Investment Management Americas Inc. The rate shown is the annualized seven-day yield at period end. |
| (i) | Represents collateral held in connection with securities lending. Income earned by the Fund is net of borrower rebates. |
144A: Security exempt from registration under Rule 144A of the Securities Act of 1933. These securities may be resold in transactions exempt from registration, normally to qualified institutional buyers.
ADR: American Depositary Receipt
ASX: Australian Securities Exchange
CBOE: Chicago Board Options Exchange
EM: Emerging Markets
GDR: Global Depositary Receipt
Interest Only: Interest Only (IO) bonds represent the “interest only” portion of payments on a pool of underlying mortgages or mortgage-backed securities. IO securities are subject to prepayment risk of the pool of underlying mortgages.
PIK: Denotes that all or a portion of the income is paid in-kind in the form of additional principal.
PJSC: Public Joint Stock Company
Principal Only: Principal Only (PO) bonds represent the “principal only” portion of payments on a pool of underlying mortgages or mortgage-backed securities.
REG S: Securities sold under Regulation S may not be offered, sold or delivered within the United States or to, or for the account or benefit of, U.S. persons, except pursuant to an exemption from, or in a transaction not subject to, the registration requirements of the Securities Act of 1933.
REIT: Real Estate Investment Trust
SPDR: Standard & Poor’s Depositary Receipt
At December 31, 2017, open futures contracts purchased were as follows:
| | | | | | | | | | | | | | | | | | | | | | | | |
| Futures | | Currency | | | Expiration
Date | | | Contracts | | | Notional
Amount ($) | | | Notional
Value ($) | | | Unrealized
Appreciation
(Depreciation) ($) | |
| 10 Year U.S. Treasury Note | | | USD | | | | 3/20/2018 | | | | 39 | | | | 4,870,639 | | | | 4,837,828 | | | | (32,811 | ) |
| Mini MSCI Emerging Market Index | | | USD | | | | 3/16/2018 | | | | 169 | | | | 9,489,440 | | | | 9,833,265 | | | | 343,825 | |
| Nikkei 225 Index | | | JPY | | | | 3/8/2018 | | | | 405 | | | | 8,106,290 | | | | 8,177,280 | | | | 70,990 | |
| U.S. Treasury Long Bond | | | USD | | | | 3/20/2018 | | | | 5 | | | | 766,416 | | | | 765,000 | | | | (1,416 | ) |
| Ultra 10 Year U.S. Treasury Note | | | USD | | | | 3/20/2018 | | | | 73 | | | | 9,793,557 | | | | 9,750,062 | | | | (43,495 | ) |
| Ultra Long U.S. Treasury Bond | | | USD | | | | 3/20/2018 | | | | 11 | | | | 1,832,985 | | | | 1,844,219 | | | | 11,234 | |
| Total net unrealized appreciation | | | | | | | | | | | | | | | | | | | | | | | 348,327 | |
At December 31, 2017, open futures contracts sold were as follows:
| | | | | | | | | | | | | | | | | | | | | | | | |
| Futures | | Currency | | | Expiration
Date | | | Contracts | | | Notional
Amount ($) | | | Notional
Value ($) | | | Unrealized
Appreciation
(Depreciation) ($) | |
| 2 Year U.S. Treasury Note | | | USD | | | | 3/29/2018 | | | | 31 | | | | 6,651,381 | | | | 6,637,390 | | | | 13,991 | |
| 3 Month Euro Euribor Interest Rate | | | EUR | | | | 12/17/2018 | | | | 7 | | | | 2,105,288 | | | | 2,104,776 | | | | 512 | |
| 3 Month Euro Swiss Franc (Euroswiss) Interest Rate | | | CHF | | | | 12/17/2018 | | | | 8 | | | | 2,064,537 | | | | 2,064,549 | | | | (12 | ) |
| 3 Month Euroyen | | | JPY | | | | 12/17/2018 | | | | 10 | | | | 2,216,868 | | | | 2,216,996 | | | | (128 | ) |
| 3 Month Sterling (Short Sterling) Interest Rate | | | GBP | | | | 12/19/2018 | | | | 13 | | | | 2,174,449 | | | | 2,176,881 | | | | (2,432 | ) |
| 5 Year U.S. Treasury Note | | | USD | | | | 3/29/2018 | | | | 68 | | | | 7,941,447 | | | | 7,899,156 | | | | 42,291 | |
| 90 Day Eurodollar | | | USD | | | | 12/17/2018 | | | | 9 | | | | 2,202,840 | | | | 2,201,738 | | | | 1,102 | |
| ASX 90 Day Bank Accepted Bills | | | AUD | | | | 12/13/2018 | | | | 11 | | | | 8,541,660 | | | | 8,540,007 | | | | 1,653 | |
| CBOE SPX Volatility Index | | | USD | | | | 1/17/2018 | | | | 90 | | | | 1,264,355 | | | | 1,032,750 | | | | 231,605 | |
| Federal Republic of Germany Euro-Bund | | | EUR | | | | 3/8/2018 | | | | 12 | | | | 2,345,303 | | | | 2,327,900 | | | | 17,403 | |
| Total net unrealized appreciation | | | | | | | | | | | | | | | | | | | | | | | 305,985 | |
The accompanying notes are an integral part of the financial statements.
| | | | |
Deutsche Variable Series II — Deutsche Global Income Builder VIP | | | | | 15 |
At December 31, 2017, open credit default swap contracts sold were as follows:
| | | | | | | | | | | | | | | | | | | | | | | | |
| Centrally Cleared Swaps | | | | | | | | | | | | |
| Underlying Reference Obligation | | Fixed Cash
Flows
Received/
Frequency | | Expiration
Date | | | Notional
Amount (j) | | Currency | | | Value ($) | | | Upfront
Payments
Paid ($) | | | Unrealized
Appreciation ($) | |
| Markit CDX North America High Yield Index | | 5.0%/
Quarterly | |
| 6/20/2017
6/20/2022 |
| | 5,375,700 | | | USD | | | | 480,544 | | | | 335,694 | | | | 144,850 | |
| (j) | The maximum potential amount of future undiscounted payments that the Fund could be required to make under a credit default swap contract would be the notional amount of the contract. These potential amounts would be partially offset by any recovery values of the referenced debt obligation or net amounts received from the settlement of buy protection credit default swap contracts entered into by the Fund for the same referenced debt obligation, if any. |
At December 31, 2017, open interest rate swap contracts were as follows:
| | | | | | | | | | | | | | | | | | | | | | |
| Centrally Cleared Swaps | | | | | | | | | | | | |
Cash Flows Paid by the
Fund/Frequency | | Cash Flows Received
by the Fund/
Frequency | | Effective/
Expiration
Date | | Notional
Amount | | | Currency | | Value ($) | | | Upfront
Payments
Paid/
(Received) ($) | | | Unrealized
Appreciation/
(Depreciation) ($) | |
| Floating — 3-Month LIBOR/Quarterly | | Fixed — 2.25%/ Semi-Annually | | 12/20/2017
12/20/2022 | | | 11,800,000 | | | USD | | | 774 | | | | 258,887 | | | | (258,113 | ) |
| Fixed — 2.5%/Semi-Annually | | Floating — 3-Month LIBOR/Quarterly | | 12/20/2017
12/20/2027 | | | 12,600,000 | | | USD | | | (95,225 | ) | | | (494,876 | ) | | | 399,651 | |
| Fixed — 1.75%/Semi-Annually | | Floating — 3-Month LIBOR/Quarterly | | 12/20/2017
12/20/2018 | | | 1,900,000 | | | USD | | | 2,243 | | | | (3,933 | ) | | | 6,176 | |
| Fixed — 2.75%/Semi-Annually | | Floating — 3-Month LIBOR/Quarterly | | 12/20/2017
12/20/2047 | | | 3,000,000 | | | USD | | | (119,832 | ) | | | (78,275 | ) | | | (41,557 | ) |
| Fixed — 2.75%/Semi-Annually | | Floating — 3-Month LIBOR/Quarterly | | 12/20/2017
12/20/2037 | | | 200,000 | | | USD | | | (6,256 | ) | | | (14,426 | ) | | | 8,170 | |
| Total net unrealized appreciation | | | | | | | | 114,327 | |
LIBOR: London Interbank Offered Rate; 3-Month LIBOR rate at September 30, 2017 is 1.694%.
At December 31, 2017, open total return swap contracts were as follows:
| | | | | | | | | | | | | | | | | | | | |
| Bilateral Swaps — Long | | | | | | | | | | | | | | | |
Pay/Receive
Return of the
Reference Index | | Fixed Cash
Flows Paid | | Frequency | | Counterparty/
Expiration Date | | Notional
Amount ($) | | Value ($) | | | Upfront
Payments
Paid ($) | | | Unrealized
Appreciation ($) | |
| MSCI World Net Total Return USD Index | | 1.339% | | At Expiration | | Goldman Sachs & Co.
3/14/2018 | | 7,201,805 | | | 457,662 | | | | — | | | | 457,662 | |
| MSCI World Net Total Return USD Index | | 1.259% | | At Expiration | | Citigroup, Inc.
3/14/2018 | | 7,301,985 | | | 459,405 | | | | — | | | | 459,405 | |
| Total unrealized appreciation | | | | 917,067 | |
As of December 31, 2017, the Fund had the following open forward foreign currency contracts:
| | | | | | | | | | | | | | | | | | |
| Contracts to Deliver | | | In Exchange For | | | Settlement
Date | | Unrealized
Appreciation ($) | | | Counterparty |
| USD | | | 699,276 | | | EUR | | | 600,000 | | | 1/10/2018 | | | 20,934 | | | Credit Agricole |
| USD | | | 2,896,512 | | | EUR | | | 2,430,000 | | | 1/10/2018 | | | 20,337 | | | State Street Bank & Trust Co. |
| MXN | | | 12,800,000 | | | USD | | | 664,083 | | | 1/24/2018 | | | 15,579 | | | HSBC Holdings PLC |
| USD | | | 2,831,128 | | | CAD | | | 3,600,000 | | | 1/29/2018 | | | 34,042 | | | Canadian Imperial Bank of Commerce |
| USD | | | 4,614,618 | | | EUR | | | 3,860,000 | | | 2/28/2018 | | | 31,750 | | | Credit Agricole |
| Total unrealized appreciation | | | 122,642 | | | |
| | | | | | | | | | | | | | | | | | |
| Contracts to Deliver | | | In Exchange For | | | Settlement
Date | | Unrealized
Depreciation ($) | | | Counterparty |
| EUR | | | 600,000 | | | USD | | | 703,690 | | | 1/10/2018 | | | (16,520) | | | Credit Agricole |
| EUR | | | 2,430,000 | | | USD | | | 2,865,993 | | | 1/10/2018 | | | (50,856) | | | State Street Bank & Trust Co. |
| CAD | | | 3,600,000 | | | USD | | | 2,802,653 | | | 1/29/2018 | | | (62,516) | | | Citigroup, Inc. |
| AUD | | | 600,000 | | | USD | | | 462,750 | | | 2/6/2018 | | | (5,410) | | | National Australia Bank Ltd. |
The accompanying notes are an integral part of the financial statements.
| | | | | | |
| | 16 | | | | | | Deutsche Variable Series II — Deutsche Global Income Builder VIP |
| | | | | | | | | | | | | | | | | | |
| Contracts to Deliver | | | In Exchange For | | | Settlement
Date | | Unrealized
Depreciation ($) | | | Counterparty |
| GBP | | | 2,250,000 | | | USD | | | 2,987,269 | | | 2/28/2018 | | | (55,973) | | | JPMorgan Chase Securities, Inc. |
| EUR | | | 3,860,000 | | | USD | | | 4,565,828 | | | 2/28/2018 | | | (80,541) | | | Credit Agricole |
| AUD | | | 2,910,000 | | | USD | | | 2,202,058 | | | 3/1/2018 | | | (68,279) | | | Citigroup, Inc. |
| EUR | | | 2,750,000 | | | USD | | | 3,304,542 | | | 4/3/2018 | | | (13,359) | | | Barclays Bank PLC |
| Total unrealized depreciation | | | (353,454) | | | |
Currency Abbreviations
For information on the Fund’s policy and additional disclosures regarding futures contracts, credit default swap contracts, interest rate swap contracts, total return swap contracts and forward foreign currency contracts, please refer to the Derivatives section of Note B in the accompanying Notes to Financial Statements.
Fair Value Measurements
Various inputs are used in determining the value of the Fund’s investments. These inputs are summarized in three broad levels. Level 1 includes quoted prices in active markets for identical securities. Level 2 includes other significant observable inputs (including quoted prices for similar securities, interest rates, prepayment speeds and credit risk). Level 3 includes significant unobservable inputs (including the Fund’s own assumptions in determining the fair value of investments). The level assigned to the securities valuations may not be an indication of the risk or liquidity associated with investing in those securities.
The following is a summary of the inputs used as of December 31, 2017 in valuing the Fund’s investments. For information on the Fund’s policy regarding the valuation of investments, please refer to the Security Valuation section of Note A in the accompanying Notes to Financial Statements.
| | | | | | | | | | | | | | | | |
| Assets | | Level 1 | | | Level 2 | | | Level 3 | | | Total | |
| Common Stocks (k) | | | | | | | | | | | | | | | | |
Consumer Discretionary | | $ | 5,859,226 | | | $ | 4,920,271 | | | $ | — | | | $ | 10,779,497 | |
Consumer Staples | | | 4,659,885 | | | | 1,359,663 | | | | — | | | | 6,019,548 | |
Energy | | | 4,424,619 | | | | 2,615,708 | | | | — | | | | 7,040,327 | |
Financials | | | 5,107,628 | | | | 6,396,133 | | | | — | | | | 11,503,761 | |
Health Care | | | 3,751,510 | | | | 2,745,325 | | | | — | | | | 6,496,835 | |
Industrials | | | 5,864,643 | | | | 3,591,640 | | | | — | | | | 9,456,283 | |
Information Technology | | | 12,947,070 | | | | 1,642,651 | | | | — | | | | 14,589,721 | |
Materials | | | 1,822,994 | | | | 503,082 | | | | 6,524 | | | | 2,332,600 | |
Real Estate | | | 3,618,242 | | | | 557,825 | | | | — | | | | 4,176,067 | |
Telecommunication Services | | | 2,046,455 | | | | 3,429,826 | | | | — | | | | 5,476,281 | |
Utilities | | | 2,169,402 | | | | 619,705 | | | | — | | | | 2,789,107 | |
| Preferred Stocks (k) | | | 8,283,495 | | | | — | | | | — | | | | 8,283,495 | |
| Right | | | — | | | | — | | | | 7,611 | | | | 7,611 | |
| Warrant | | | — | | | | — | | | | 4,595 | | | | 4,595 | |
| Fixed Income Investments (k) | | | | | | | | | | | | | | | | |
Corporate Bonds | | | — | | | | 18,950,514 | | | | — | | | | 18,950,514 | |
Asset-Backed | | | — | | | | 941,477 | | | | — | | | | 941,477 | |
Mortgage-Backed Securities Pass-Throughs | | | — | | | | 1,566,934 | | | | — | | | | 1,566,934 | |
Commercial Mortgage-Backed Securities | | | — | | | | 1,365,759 | | | | — | | | | 1,365,759 | |
Collateralized Mortgage Obligations | | | — | | | | 2,142,852 | | | | — | | | | 2,142,852 | |
Government & Agency Obligations | | | — | | | | 8,412,847 | | | | — | | | | 8,412,847 | |
Municipal Bonds and Notes | | | — | | | | 65,043 | | | | — | | | | 65,043 | |
Convertible Bond | | | — | | | | — | | | | 314,566 | | | | 314,566 | |
Short-Term U.S. Treasury Obligations | | | — | | | | 6,321,033 | | | | — | | | | 6,321,033 | |
| Exchange-Traded Funds | | | 14,367,690 | | | | — | | | | — | | | | 14,367,690 | |
| Short-Term Investments (k) | | | 4,869,732 | | | | — | | | | — | | | | 4,869,732 | |
| Derivatives (l) | | | | | | | | | | | | | | | | |
Futures Contracts | | | 734,606 | | | | — | | | | — | | | | 734,606 | |
Credit Default Swap Contracts | | | — | | | | 144,850 | | | | — | | | | 144,850 | |
Interest Rate Swap Contracts | | | — | | | | 413,997 | | | | — | | | | 413,997 | |
Total Return Swap Contracts | | | — | | | | 917,067 | | | | — | | | | 917,067 | |
Forward Foreign Currency Contracts | | | — | | | | 122,642 | | | | — | | | | 122,642 | |
| Total | | $ | 80,527,197 | | | $ | 69,746,844 | | | $ | 333,296 | | | $ | 150,607,337 | |
The accompanying notes are an integral part of the financial statements.
| | | | |
Deutsche Variable Series II — Deutsche Global Income Builder VIP | | | | | 17 |
| | | | | | | | | | | | | | | | |
| Liabilities | | Level 1 | | | Level 2 | | | Level 3 | | | Total | |
| Derivatives (l) | | | | | | | | | | | | | | | | |
Futures Contracts | | $ | (80,294 | ) | | $ | — | | | $ | — | | | $ | (80,294 | ) |
Interest Rate Swap Contracts | | | — | | | | (299,670 | ) | | | — | | | | (299,670 | ) |
Forward Foreign Currency Contracts | | | — | | | | (353,454 | ) | | | — | | | | (353,454 | ) |
| Total | | $ | (80,294 | ) | | $ | (653,124 | ) | | $ | — | | | $ | (733,418 | ) |
There have been no transfers between fair value measurement levels during the year ended December 31, 2017.
| (k) | See Investment Portfolio for additional detailed categorizations. |
| (l) | Derivatives include unrealized appreciation (depreciation) on open futures contracts, credit default swap contracts, interest rate swap contracts, total return swap contracts and forward foreign currency exchange contracts. |
The accompanying notes are an integral part of the financial statements.
| | | | | | |
| | 18 | | | | | | Deutsche Variable Series II — Deutsche Global Income Builder VIP |
Statement of Assets and Liabilities
| | | | |
| as of December 31, 2017 | | | | |
| |
| Assets | | | | |
| Investments in non-affiliated securities, at value (cost $128,032,607) — including $3,154,529 of securities loaned | | $ | 143,404,443 | |
| Investment in Deutsche Government & Agency Securities Portfolio (cost $3,253,298)* | | | 3,253,298 | |
| Investments in Deutsche Central Cash Management Government Fund (cost $1,616,434) | | | 1,616,434 | |
| Cash | | | 146,198 | |
| Foreign currency, at value (cost $373,775) | | | 369,831 | |
| Cash held as collateral for bilateral swap contracts | | | 290,000 | |
| Receivable for Fund shares sold | | | 1,472 | |
| Dividends receivable | | | 232,231 | |
| Interest receivable | | | 453,873 | |
| Receivable for variation margin on futures contracts | | | 9,933 | |
| Unrealized appreciation on bilateral swap contracts | | | 917,067 | |
| Unrealized appreciation on forward foreign currency exchange contracts | | | 122,642 | |
| Foreign taxes recoverable | | | 94,383 | |
| Other assets | | | 3,305 | |
| Total assets | | | 150,915,110 | |
| |
| Liabilities | | | | |
| Payable upon return of securities loaned | | | 3,253,298 | |
| Payable for investments purchased — when-issued security | | | 160,000 | |
| Payable upon return of deposit for bilateral swap contracts | | | 290,000 | |
| Payable for Fund shares redeemed | | | 97,746 | |
| Payable for variation margin on centrally cleared swaps | | | 18,407 | |
| Unrealized depreciation on forward foreign currency exchange contracts | | | 353,454 | |
| Accrued management fee | | | 45,845 | |
| Accrued Trustees’ fees | | | 2,798 | |
| Other accrued expenses and payables | | | 174,319 | |
| Total liabilities | | | 4,395,867 | |
| Net assets, at value | | $ | 146,519,243 | |
| |
| Net Assets Consist of | | | | |
| Undistributed net investment income | | | 4,363,984 | |
| Net unrealized appreciation (depreciation) on: | | | | |
Investments | | | 15,371,836 | |
Swap contracts | | | 1,176,244 | |
Futures | | | 654,312 | |
Foreign currency | | | (1,130 | ) |
Forward foreign currency contracts | | | (230,812 | ) |
| Accumulated net realized gain (loss) | | | 11,838,154 | |
| Paid-in capital | | | 113,346,655 | |
| Net assets, at value | | $ | 146,519,243 | |
Class A | | | | |
| Net Asset Value, offering and redemption price per share ($146,519,243 ÷ 5,517,134 outstanding shares of beneficial interest, no par value, unlimited number of shares authorized) | | $ | 26.56 | |
| * | Represents collateral on securities loaned. |
Statement of Operations
| | | | |
| for the year ended December 31, 2017 | | | | |
| |
| Investment Income | | | | |
| Income: | | | | |
| Dividends (net of foreign taxes withheld of $181,510) | | $ | 4,250,725 | |
| Interest (net of foreign taxes withheld of $11,747) | | | 1,864,014 | |
| Income distributions — Deutsche Central Cash Management Government Fund | | | 35,123 | |
| Securities lending income, net of borrower rebates | | | 71,713 | |
| Total income | | | 6,221,575 | |
| Expenses: | | | | |
| Management fee | | | 662,352 | |
| Administration fee | | | 179,014 | |
| Services to shareholders | | | 823 | |
| Custodian fee | | | 55,014 | |
| Professional fees | | | 99,398 | |
| Reports to shareholders | | | 32,255 | |
| Trustees’ fees and expenses | | | 11,142 | |
| Pricing Service fee | | | 67,051 | |
| Other | | | 15,103 | |
| Total expenses | | | 1,122,152 | |
| Net investment income | | | 5,099,423 | |
| |
| Realized and Unrealized Gain (Loss) | | | | |
| Net realized gain (loss) from: | | | | |
| Investments | | | 15,344,722 | |
| Swap contracts | | | 1,303,473 | |
| Futures | | | 2,313,924 | |
| Written options | | | 89,550 | |
| Forward foreign currency contracts | | | (126,399 | ) |
| Foreign currency | | | 13,180 | |
| | | | 18,938,450 | |
| Change in net unrealized appreciation (depreciation) on: | | | | |
| Investments | | | 4,190,563 | |
| Swap contracts | | | (269,564 | ) |
| Futures | | | 869,583 | |
| Forward foreign currency contracts | | | (1,421,320 | ) |
| Foreign currency | | | 8,320 | |
| | | | 3,377,582 | |
| Net gain (loss) | | | 22,316,032 | |
| Net increase (decrease) in net assets resulting from operations | | $ | 27,415,455 | |
The accompanying notes are an integral part of the financial statements.
| | | | |
Deutsche Variable Series II — Deutsche Global Income Builder VIP | | | | | 19 |
Statements of Changes in Net Assets
| | | | | | | | |
| | | Years Ended December 31, | |
| Increase (Decrease) in Net Assets | | 2017 | | | 2016 | |
| Operations: | | | | | | | | |
| Net investment income | | $ | 5,099,423 | | | $ | 5,058,747 | |
| Net realized gain (loss) | | | 18,938,450 | | | | (200,045 | ) |
| Change in net unrealized appreciation (depreciation) | | | 3,377,582 | | | | 7,339,499 | |
| Net increase (decrease) in net assets resulting from operations | | | 27,415,455 | | | | 12,198,201 | |
| Distributions to shareholders from: | | | | | | | | |
| Net investment income: | | | | | | | | |
Class A | | | (5,628,068 | ) | | | (7,851,269 | ) |
| Fund share transactions: | | | | | | | | |
Class A | | | | | | | | |
| Proceeds from shares sold | | | 3,259,753 | | | | 3,626,943 | |
| Shares issued to shareholders in reinvestment of distributions | | | 5,628,068 | | | | 7,851,269 | |
| Payments for shares redeemed | | | (69,176,010 | ) | | | (32,401,979 | ) |
| Net increase (decrease) in net assets from Class A share transactions | | | (60,288,189 | ) | | | (20,923,767 | ) |
| Increase (decrease) in net assets | | | (38,500,802 | ) | | | (16,576,835 | ) |
| Net assets at beginning of period | | | 185,020,045 | | | | 201,596,880 | |
| Net assets at end of period (including undistributed net investment income of $4,363,984 and $4,038,796, respectively) | | $ | 146,519,243 | | | $ | 185,020,045 | |
| | |
| Other Information | | | | | | | | |
Class A | | | | | | | | |
| Shares outstanding at beginning of period | | | 7,873,905 | | | | 8,792,358 | |
| Shares sold | | | 130,993 | | | | 157,470 | |
| Shares issued to shareholders in reinvestment of distributions | | | 233,530 | | | | 348,017 | |
| Shares redeemed | | | (2,721,294 | ) | | | (1,423,940 | ) |
| Net increase (decrease) in Class A shares | | | (2,356,771 | ) | | | (918,453 | ) |
| Shares outstanding at end of period | | | 5,517,134 | | | | 7,873,905 | |
The accompanying notes are an integral part of the financial statements.
| | | | | | |
| | 20 | | | | | | Deutsche Variable Series II — Deutsche Global Income Builder VIP |
Financial Highlights
| | | | | | | | | | | | | | | | | | | | |
| | | Years Ended December 31, | |
| Class A | | 2017 | | | 2016 | | | 2015 | | | 2014 | | | 2013 | |
| | | | | |
| Selected Per Share Data | | | | | | | | | | | | | | | | | | | | |
| Net asset value, beginning of period | | $ | 23.50 | | | $ | 22.93 | | | $ | 24.62 | | | $ | 27.30 | | | $ | 23.90 | |
| Income (loss) from investment operations: | | | | | | | | | | | | | | | | | | | | |
Net investment incomea | | | .71 | | | | .61 | | | | .68 | | | | .72 | | | | .78 | |
Net realized and unrealized gain (loss) | | | 3.10 | | | | .91 | | | | (.97 | ) | | | .25 | | | | 3.14 | |
Total from investment operations | | | 3.81 | | | | 1.52 | | | | (.29 | ) | | | .97 | | | | 3.92 | |
| Less distributions from: | | | | | | | | | | | | | | | | | | | | |
Net investment income | | | (.75 | ) | | | (.95 | ) | | | (.76 | ) | | | (.85 | ) | | | (.52 | ) |
Net realized gains | | | — | | | | — | | | | (.64 | ) | | | (2.80 | ) | | | — | |
Total distributions | | | (.75 | ) | | | (.95 | ) | | | (1.40 | ) | | | (3.65 | ) | | | (.52 | ) |
| Net asset value, end of period | | $ | 26.56 | | | $ | 23.50 | | | $ | 22.93 | | | $ | 24.62 | | | $ | 27.30 | |
| Total Return (%) | | | 16.54 | | | | 6.81 | | | | (1.44 | )b | | | 3.83 | | | | 16.63 | |
| | | | | |
| Ratios to Average Net Assets and Supplemental Data | | | | | | | | | | | | | | | | | | | | |
| Net assets, end of period ($ millions) | | | 147 | | | | 185 | | | | 202 | | | | 247 | | | | 269 | |
| Ratio of expenses before expense reductions (%)c | | | .63 | | | | .62 | | | | .60 | | | | .62 | | | | .60 | |
| Ratio of expenses after expense reductions (%)c | | | .63 | | | | .62 | | | | .58 | | | | .62 | | | | .60 | |
| Ratio of net investment income (loss) (%) | | | 2.85 | | | | 2.66 | | | | 2.85 | | | | 2.83 | | | | 3.07 | |
| Portfolio turnover rate (%) | | | 122 | | | | 135 | | | | 92 | | | | 88 | | | | 182 | |
| a | Based on average shares outstanding during the period. |
| b | Total return would have been lower had certain expenses not been reduced. |
| c | Expense ratio does not reflect charges and fees associated with the separate account that invests in the Fund or any variable life insurance policy or variable annuity contract for which the Fund is an investment option. |
| | | | |
Deutsche Variable Series II — Deutsche Global Income Builder VIP | | | | | 21 |
| | |
| Notes to Financial Statements | | |
A. Organization and Significant Accounting Policies
Deutsche Global Income Builder VIP (the “Fund”) is a diversified series of Deutsche Variable Series II (the “Trust”), which is registered under the Investment Company Act of 1940, as amended (the “1940 Act”), as an open-end management investment company organized as a Massachusetts business trust.
The Fund’s financial statements are prepared in accordance with accounting principles generally accepted in the United States of America (“U.S. GAAP”) which require the use of management estimates. Actual results could differ from those estimates. The Fund qualifies as an investment company under Topic 946 of Accounting Standards Codification of U.S. GAAP. The policies described below are followed consistently by the Fund in the preparation of its financial statements.
Security Valuation. Investments are stated at value determined as of the close of regular trading on the New York Stock Exchange on each day the exchange is open for trading.
Various inputs are used in determining the value of the Fund’s investments. These inputs are summarized in three broad levels. Level 1 includes quoted prices in active markets for identical securities. Level 2 includes other significant observable inputs (including quoted prices for similar securities, interest rates, prepayment speeds and credit risk). Level 3 includes significant unobservable inputs (including the Fund’s own assumptions in determining the fair value of investments). The level assigned to the securities valuations may not be an indication of the risk or liquidity associated with investing in those securities.
Equity securities and Exchange-Traded Funds (“ETFs”) are valued at the most recent sale price or official closing price reported on the exchange (U.S. or foreign) or over-the-counter market on which they trade. Equity securities or ETFs for which no sales are reported are valued at the calculated mean between the most recent bid and asked quotations on the relevant market or, if a mean cannot be determined, at the most recent bid quotation. Equity securities and ETFs are generally categorized as Level 1. For certain international equity securities, in order to adjust for events which may occur between the close of the foreign exchanges and the close of the New York Stock Exchange, a fair valuation model may be used. This fair valuation model takes into account comparisons to the valuation of American Depository Receipts (ADRs), exchange-traded funds, futures contracts and certain indices and these securities are categorized as Level 2.
Debt securities are valued at prices supplied by independent pricing services approved by the Fund’s Board. Such services may use various pricing techniques which take into account appropriate factors such as yield, quality, coupon rate, maturity, type of issue, trading characteristics, prepayment speeds and other data, as well as broker quotes. If the pricing services are unable to provide valuations, debt securities are valued at the average of the most recent reliable bid quotations or evaluated prices, as applicable, obtained from broker-dealers. These securities are generally categorized as Level 2.
Investments in open-end investment companies are valued at their net asset value each business day and are categorized as Level 1.
Futures contracts are generally valued at the settlement prices established each day on the exchange on which they are traded and are categorized as Level 1.
Forward currency contracts are valued at the prevailing forward exchange rate of the underlying currencies and are categorized as Level 2.
Swap contracts are valued daily based upon prices supplied by a Board approved pricing vendor, if available, and otherwise are valued at the price provided by the broker-dealer. Swap contracts are generally categorized as Level 2.
Exchange-traded options are valued at the last sale price or, in the absence of a sale, the mean between the closing bid and asked prices or at the most recent asked price (bid for purchased options) if no bid or asked price are available. Exchange-traded options are categorized as Level 1. Over-the-counter written or purchased options are valued at prices supplied by a Board approved pricing vendor, if available, and otherwise are valued at the price provided by the broker-dealer with which the option was traded. Over-the-counter written or purchased options are generally categorized as Level 2.
Securities and other assets for which market quotations are not readily available or for which the above valuation procedures are deemed not to reflect fair value are valued in a manner that is intended to reflect their fair value as determined in accordance with procedures approved by the Board and are generally categorized as Level 3. In accordance with the Fund’s valuation procedures, factors considered in determining value may include, but are not limited to, the type of the security; the size of the holding; the initial cost of the security; the existence of any
| | | | | | |
| | 22 | | | | | | Deutsche Variable Series II — Deutsche Global Income Builder VIP |
contractual restrictions on the security’s disposition; the price and extent of public trading in similar securities of the issuer or of comparable companies; quotations or evaluated prices from broker-dealers and/or pricing services; information obtained from the issuer, analysts, and/or the appropriate stock exchange (for exchange-traded securities); an analysis of the company’s or issuer’s financial statements; an evaluation of the forces that influence the issuer and the market(s) in which the security is purchased and sold; and with respect to debt securities, the maturity, coupon, creditworthiness, currency denomination and the movement of the market in which the security is normally traded. The value determined under these procedures may differ from published values for the same securities.
Disclosure about the classification of fair value measurements is included in a table following the Fund’s Investment Portfolio.
Foreign Currency Translations. The books and records of the Fund are maintained in U.S. dollars. Investment securities and other assets and liabilities denominated in a foreign currency are translated into U.S. dollars at the prevailing exchange rates at period end. Purchases and sales of investment securities, income and expenses are translated into U.S. dollars at the prevailing exchange rates on the respective dates of the transactions.
Net realized and unrealized gains and losses on foreign currency transactions represent net gains and losses between trade and settlement dates on securities transactions, the acquisition and disposition of foreign currencies, and the difference between the amount of net investment income accrued and the U.S. dollar amount actually received. The portion of both realized and unrealized gains and losses on investments that results from fluctuations in foreign currency exchange rates is not separately disclosed but is included with net realized and unrealized gain/appreciation and loss/depreciation on investments.
Securities Lending. Deutsche Bank AG, as lending agent, lends securities of the Fund to certain financial institutions under the terms of its securities lending agreement. During the term of the loans, the Fund continues to receive interest and dividends generated by the securities and to participate in any changes in their market value. The Fund requires the borrowers of the securities to maintain collateral with the Fund consisting of either cash or liquid, unencumbered assets having a value at least equal to the value of the securities loaned. When the collateral falls below specified amounts, the lending agent will use its best effort to obtain additional collateral on the next business day to meet required amounts under the securities lending agreement. As of period end, any securities on loan were collateralized by cash. During the year ended December 31, 2017, the Fund invested the cash collateral into a joint trading account in affiliated money market funds managed by Deutsche Investment Management Americas Inc. As of December 31, 2017, the Fund invested the cash collateral in Deutsche Government & Agency Securities Portfolio. Deutsche Investment Management Americas Inc. receives a management/administration fee (0.13% annualized effective rate as of December 31, 2017) on the cash collateral invested in Deutsche Government & Agency Securities Portfolio. The Fund receives compensation for lending its securities either in the form of fees or by earning interest on invested cash collateral net of borrower rebates and fees paid to a lending agent. Either the Fund or the borrower may terminate the loan at any time, and the borrower, after notice, is required to return borrowed securities within a standard time period. There may be risks of delay and costs in recovery of securities or even loss of rights in the collateral should the borrower of the securities fail financially. If the Fund is not able to recover securities lent, the Fund may sell the collateral and purchase a replacement investment in the market, incurring the risk that the value of the replacement security is greater than the value of the collateral. The Fund is also subject to all investment risks associated with the reinvestment of any cash collateral received, including, but not limited to, interest rate, credit and liquidity risk associated with such investments.
As of December 31, 2017, the Fund had securities on loan, which were classified as common stocks, corporate bonds and exchange-traded funds in the Investment Portfolio. The value of the related collateral exceeded the value of the securities loaned at period end.
| | | | | | | | | | | | | | | | | | | | |
| Remaining Contractual Maturity of the Agreements as of December 31, 2017 | |
| | | Overnight
and
Continuous | | | <30 days | | | Between 30
& 90 days | | | >90 days | | | Total | |
Securities Lending Transactions | | | | | | | | | | | | | | | | | | | | |
| Common Stocks | | $ | 561,215 | | | $ | — | | | $ | — | | | $ | — | | | $ | 561,215 | |
| Corporate Bonds | | | 1,435,833 | | | | — | | | | — | | | | — | | | | 1,435,833 | |
| Exchange-Traded Fund | | | 1,256,250 | | | | — | | | | — | | | | — | | | | 1,256,250 | |
| Total Borrowings | | $ | 3,253,298 | | | $ | — | | | $ | — | | | $ | — | | | $ | 3,253,298 | |
| | | |
Gross amount of recognized liabilities for securities lending transactions: | | | | | | | | | | | $ | 3,253,298 | |
| | | | |
Deutsche Variable Series II — Deutsche Global Income Builder VIP | | | | | 23 |
When-Issued/Delayed Delivery Securities. The Fund may purchase or sell securities with delivery or payment to occur at a later date beyond the normal settlement period. At the time the Fund enters into a commitment to purchase or sell a security, the transaction is recorded and the value of the transaction is reflected in the net asset value. The price of such security and the date when the security will be delivered and paid for are fixed at the time the transaction is negotiated. The value of the security may vary with market fluctuations. At the time the Fund enters into a purchase transaction it is required to segregate cash or other liquid assets at least equal to the amount of the commitment. Additionally, the Fund may be required to post securities and/or cash collateral in accordance with the terms of the commitment.
Certain risks may arise upon entering into when-issued or delayed delivery transactions from the potential inability of counterparties to meet the terms of their contracts or if the issuer does not issue the securities due to political, economic or other factors. Additionally, losses may arise due to changes in the value of the underlying securities.
Taxes. The Fund’s policy is to comply with the requirements of the Internal Revenue Code, as amended, which are applicable to regulated investment companies and to distribute all of its taxable income to its shareholders.
Additionally, the Fund may be subject to taxes imposed by the governments of countries in which it invests and are generally based on income and/or capital gains earned or repatriated, a portion of which may be recoverable based upon the current interpretation of the tax rules and regulations. Estimated tax liabilities and recoveries on certain foreign securities are recorded on an accrual basis and are reflected as components of interest income or net change in unrealized gain/loss on investments. Tax liabilities realized as a result of security sales are reflected as a component of net realized gain/loss on investments.
The Fund has reviewed the tax positions for the open tax years as of December 31, 2017 and has determined that no provision for income tax and/or uncertain tax positions is required in the Fund’s financial statements. The Fund’s federal tax returns for the prior three fiscal years remain open subject to examination by the Internal Revenue Service.
Distribution of Income and Gains. Distributions from net investment income of the Fund, if any, are declared and distributed to shareholders annually. Net realized gains from investment transactions, in excess of available capital loss carryforwards, would be taxable to the Fund if not distributed and, therefore, will be distributed to shareholders at least annually. The Fund may also make additional distributions for tax purposes if necessary.
The timing and characterization of certain income and capital gain distributions are determined annually in accordance with federal tax regulations which may differ from accounting principles generally accepted in the United States of America. These differences primarily relate to investments in foreign denominated investments, forward currency contracts, futures contracts, swap contracts and certain securities sold at a loss. As a result, net investment income (loss) and net realized gain (loss) on investment transactions for a reporting period may differ significantly from distributions during such period. Accordingly, the Fund may periodically make reclassifications among certain of its capital accounts without impacting the net asset value of the Fund.
At December 31, 2017, the Fund’s components of distributable earnings on a tax basis were as follows:
| | | | |
| Undistributed ordinary income* | | $ | 9,638,614 | |
| Undistributed Long-Term Capital Gains | | $ | 8,282,808 | |
| Unrealized appreciation (depreciation) on investments | | $ | 15,203,530 | |
At December 31, 2017, the aggregate cost of investments for federal income tax purposes was $133,213,485. The net unrealized appreciation for all investments based on tax cost was $15,203,530. This consisted of aggregate gross unrealized appreciation for all investments in which there was an excess of value over tax cost of $17,066,142 and aggregate gross unrealized depreciation for all investments in which there was an excess of tax cost over value of $1,862,612.
In addition, the tax character of distributions paid by the Fund is summarized as follows:
| | | | | | | | |
| | | Years Ended December 31, | |
| | | 2017 | | | 2016 | |
| Distributions from ordinary income* | | $ | 5,628,068 | | | $ | 7,851,269 | |
| * | For tax purposes, short-term capital gain distributions are considered ordinary income distributions. |
Expenses. Expenses of the Trust arising in connection with a specific fund are allocated to that fund. Other Trust expenses which cannot be directly attributed to a fund are apportioned among the funds in the Trust based upon the relative net assets or other appropriate measures.
| | | | | | |
| | 24 | | | | | | Deutsche Variable Series II — Deutsche Global Income Builder VIP |
Contingencies. In the normal course of business, the Fund may enter into contracts with service providers that contain general indemnification clauses. The Fund’s maximum exposure under these arrangements is unknown, as this would involve future claims that may be made against the Fund that have not yet been made. However, based on experience, the Fund expects the risk of loss to be remote.
Other. Investment transactions are accounted for on a trade date plus one basis for daily net asset value calculations. However, for financial reporting purposes, investment transactions are reported on trade date. Interest income is recorded on the accrual basis. Dividend income is recorded on the ex-dividend date net of foreign withholding taxes. Certain dividends from foreign securities may be recorded subsequent to the ex-dividend date as soon as the Fund is informed of such dividends. Realized gains and losses from investment transactions are recorded on an identified cost basis. Proceeds from litigation payments, if any, are included in net realized gain (loss) from investments. All discounts and premiums are accreted/amortized for both tax and financial reporting purposes, with the exception of securities in default of principal.
B. Derivative Instruments
Swaps. A swap is a contract between two parties to exchange future cash flows at periodic intervals based on the notional amount of the swap. A bilateral swap is a transaction between the fund and a counterparty where cash flows are exchanged between the two parties. A centrally cleared swap is a transaction executed between the fund and a counterparty, then cleared by a clearing member through a central clearinghouse. The central clearinghouse serves as the counterparty, with whom the fund exchanges cash flows.
The value of a swap is adjusted daily, and the change in value, if any, is recorded as unrealized appreciation or depreciation in the Statement of Assets and Liabilities. Gains or losses are realized when the swap expires or is closed. Certain risks may arise when entering into swap transactions including counterparty default; liquidity; or unfavorable changes in interest rates or the value of the underlying reference security, commodity or index. In connection with bilateral swaps, securities and/or cash may be identified as collateral in accordance with the terms of the swap agreement to provide assets of value and recourse in the event of default. The maximum counterparty credit risk is the net present value of the cash flows to be received from or paid to the counterparty over the term of the swap, to the extent that this amount is beneficial to the Fund, in addition to any related collateral posted to the counterparty by the Fund. This risk may be partially reduced by a master netting arrangement between the Fund and the counterparty. Upon entering into a centrally cleared swap, the Fund is required to deposit with a financial intermediary cash or securities (“initial margin”) in an amount equal to a certain percentage of the notional amount of the swap. Subsequent payments (“variation margin”) are made or received by the Fund dependent upon the daily fluctuations in the value of the swap. In a cleared swap transaction, counterparty risk is minimized as the central clearinghouse acts as the counterparty.
An upfront payment, if any, made by the Fund is recorded as an asset in the Statement of Assets and Liabilities. An upfront payment, if any, received by the Fund is recorded as a liability in the Statement of Assets and Liabilities. Payments received or made at the end of the measurement period are recorded as realized gain or loss in the Statement of Operations.
Interest Rate Swaps. Interest rate swaps are agreements in which the Fund agrees to pay to the counterparty a fixed rate payment in exchange for the counterparty agreeing to pay to the Fund a variable rate payment, or the Fund agrees to receive from the counterparty a fixed rate payment in exchange for the counterparty agreeing to receive from the Fund a variable rate payment. The payment obligations are based on the notional amount of the swap. For the year ended December 31, 2017, the Fund entered into interest rate swap agreements to gain exposure to different parts of the yield curve while managing overall duration.
A summary of the open interest rate swap contracts as of December 31, 2017 is included in a table following the Fund’s Investment Portfolio. For the year ended December 31, 2017, the investment in interest rate swap contracts had a total notional amount generally indicative of a range from $27,000,000 to $31,640,000.
Credit Default Swaps. Credit default swaps are agreements between a buyer and a seller of protection against predefined credit events for the reference entity. The Fund may enter into credit default swaps to gain exposure to an underlying issuer’s credit quality characteristics without directly investing in that issuer or to hedge against the risk of a credit event on debt securities. As a seller of a credit default swap, the Fund is required to pay the par (or other agreed-upon) value of the referenced entity to the counterparty with the occurrence of a credit event by a third party, such as a U.S. or foreign corporate issuer, on the reference entity, which would likely result in a loss to the Fund. In return, the Fund receives from the counterparty a periodic stream of payments over the term of the swap provided that no credit event has occurred. If no
| | | | |
Deutsche Variable Series II — Deutsche Global Income Builder VIP | | | | | 25 |
credit event occurs, the Fund keeps the stream of payments with no payment obligations. The Fund may also buy credit default swaps, in which case the Fund functions as the counterparty referenced above. This involves the risk that the swap may expire worthless. It also involves counterparty risk that the seller may fail to satisfy its payment obligations to the Fund with the occurrence of a credit event. When the Fund sells a credit default swap, it will cover its commitment. This may be achieved by, among other methods, maintaining cash or liquid assets equal to the aggregate notional value of the reference entities for all outstanding credit default swaps sold by the Fund. For the year ended December 31, 2017, the Fund entered into credit default swap agreements to gain exposure to the underlying issuer’s credit quality characteristics and to hedge the risk of default or other specified credit events on portfolio assets.
Under the terms of a credit default swap, the Fund receives or makes periodic payments based on a specified interest rate on a fixed notional amount. These payments are recorded as a realized gain or loss in the Statement of Operations. Payments received or made as a result of a credit event or termination of the swap are recognized, net of a proportional amount of the upfront payment, as realized gains or losses in the Statement of Operations.
A summary of the open credit default swap contracts as of December 31, 2017 is included in a table following the Fund’s Investment Portfolio. For the year ended December 31, 2017, the investment on the credit default swap contracts sold had a total notional value of generally indicative of a range from approximately $376,000 to $7,700,000.
Total Return Swap Contracts. Total return swaps involve commitments to pay interest in exchange for a market-linked return based on a notional amount. One counterparty pays out the total return of the reference security or index underlying the total return swap, and in return receives a fixed or variable rate. As a receiver, the Fund would receive payments based on any positive total return and would owe payments in the event of a negative total return. As the payer, the Fund would owe payments on any net positive total return, and would receive payments in the event of a negative total return. For the year ended December 31, 2017, the Fund entered into total return swap transactions as a means of gaining exposure to a particular asset class without investing directly in such asset class.
A summary of the open total return swap contracts as of December 31, 2017 is included in a table following the Fund’s Investment Portfolio. For the year ended December 31, 2017, the investment in total return swap contracts had a total notional amount generally indicative of a range from $0 to approximately $18,005,000.
Futures Contracts. A futures contract is an agreement between a buyer or seller and an established futures exchange or its clearinghouse in which the buyer or seller agrees to take or make a delivery of a specific amount of a financial instrument at a specified price on a specific date (settlement date). For the year ended December 31, 2017, the Fund entered into interest rate futures to gain exposure to different parts of the yield curve while managing overall duration. The Fund also entered into interest rate futures contracts for non-hedging purposes to seek to enhance potential gains. In addition, the Fund entered into equity index futures as a means of gaining exposure to the equity asset class without investing directly into such asset class and to manage the risk of stock market volatility.
Upon entering into a futures contract, the Fund is required to deposit with a financial intermediary cash or securities (“initial margin”) in an amount equal to a certain percentage of the face value indicated in the futures contract. Subsequent payments (“variation margin”) are made or received by the Fund dependent upon the daily fluctuations in the value and are recorded for financial reporting purposes as unrealized gains or losses by the Fund. Gains or losses are realized when the contract expires or is closed. Since all futures contracts are exchange-traded, counterparty risk is minimized as the exchange’s clearinghouse acts as the counterparty, and guarantees the futures against default.
Certain risks may arise upon entering into futures contracts, including the risk that an illiquid market will limit the Fund’s ability to close out a futures contract prior to the settlement date and the risk that the futures contract is not well correlated with the security, index or currency to which it relates. Risk of loss may exceed amounts disclosed in the Statement of Assets and Liabilities.
A summary of the open futures contracts as of December 31, 2017 is included in a table following the Fund’s Investment Portfolio. For the year ended December 31, 2017, the investment in futures contracts purchased had a total notional value generally indicative of a range from approximately $28,712,000 to $57,111,000, and the investment in futures contracts sold had a total notional value generally indicative of a range from approximately $5,939,000 to $45,430,000.
Options. An option contract is a contract in which the writer (seller) of the option grants the buyer of the option, upon payment of a premium, the right to purchase from (call option), or sell to (put option), the writer a
| | | | | | |
| | 26 | | | | | | Deutsche Variable Series II — Deutsche Global Income Builder VIP |
designated instrument at a specified price within a specified period of time. The Fund may write or purchase interest rate swaption agreements which are options to enter into a pre-defined swap agreement. The interest rate swaption agreement will specify whether the buyer of the swaption will be a fixed-rate receiver or a fixed-rate payer upon exercise. Certain options, including options on indices and interest rate options, will require cash settlement by the Fund if exercised. For the year ended December 31, 2017, the Fund entered into options contracts in order to manage the risk of stock market volatility. In addition, the Fund entered into options on interest rate swaps in order to hedge against potential adverse interest rate movements of portfolio assets.
If the Fund writes a covered call option, the Fund foregoes, in exchange for the premium, the opportunity to profit during the option period from an increase in the market value of the underlying security above the exercise price. If the Fund writes a put option it accepts the risk of a decline in the value of the underlying security below the exercise price. Over-the-counter options have the risk of the potential inability of counterparties to meet the terms of their contracts. For exchange traded contracts, the counterparty risk is minimized as the exchange’s clearinghouse acts as the counterparty, and guarantees the futures against default. The Fund’s maximum exposure to purchased options is limited to the premium initially paid. In addition, certain risks may arise upon entering into option contracts including the risk that an illiquid secondary market will limit the Fund’s ability to close out an option contract prior to the expiration date and that a change in the value of the option contract may not correlate exactly with changes in the value of the securities or currencies hedged.
There were no open written or purchased option contracts as of December 31, 2017. For the year ended December 31, 2017, the investment in written option contracts had a total value generally indicative of a range from $0 to $346,000 and purchased option contracts with total values ranging from $0 to $206,000.
Forward Foreign Currency Contracts. A forward foreign currency contract (“forward currency contract”) is a commitment to purchase or sell a foreign currency at the settlement date at a negotiated rate. For the year ended December 31, 2017, the Fund entered into forward currency contracts in order to hedge its exposure to changes in foreign currency exchange rates on its foreign currency denominated portfolio holdings, to facilitate transactions in foreign currency denominated securities and for non-hedging purposes to seek to enhance potential gains.
Forward currency contracts are valued at the prevailing forward exchange rate of the underlying currencies and unrealized gain (loss) is recorded daily. On the settlement date of the forward currency contract, the Fund records a realized gain or loss equal to the difference between the value of the contract at the time it was opened and the value of the contract at the time it was closed. Certain risks may arise upon entering into forward currency contracts from the potential inability of counterparties to meet the terms of their contracts. The maximum counterparty credit risk to the Fund is measured by the unrealized gain on appreciated contracts. Additionally, when utilizing forward currency contracts to hedge, the Fund gives up the opportunity to profit from favorable exchange rate movements during the term of the contract.
A summary of the open forward currency contracts as of December 31, 2017 is included in a table following the Fund’s Investment Portfolio. For the year ended December 31, 2017, the investment in forward currency contracts short vs. U.S. dollars had a total contract value generally indicative of a range from approximately $20,559,000 to $74,338,000, and the investment in forward currency contracts long vs. U.S. dollars had a total contract value generally indicative of a range from approximately $11,042,000 to $60,988,000.
The following tables summarize the value of the Fund’s derivative instruments held as of December 31, 2017 and the related location in the accompanying Statement of Assets and Liabilities, presented by primary underlying risk exposure:
| | | | | | | | | | | | | | | | |
| Asset Derivatives | | Forward
Contracts | | | Swap
Contracts | | | Futures
Contracts | | | Total | |
| Equity Contracts (a)(b) | | $ | — | | | $ | 917,067 | | | $ | 646,420 | | | $ | 1,563,487 | |
| Interest Rate Contracts (a) | | | — | | | | 413,997 | | | | 88,186 | | | | 502,183 | |
| Credit Contracts (a) | | | — | | | | 144,850 | | | | — | | | | 144,850 | |
| Foreign Exchange Contracts (b) | | | 122,642 | | | | — | | | | — | | | | 122,642 | |
| | | $ | 122,642 | | | $ | 1,475,914 | | | $ | 734,606 | | | $ | 2,333,162 | |
Each of the above derivatives is located in the following Statement of Assets and Liabilities accounts:
| (a) | Includes cumulative appreciation of futures and centrally cleared swap contracts as disclosed in the Investment Portfolio. Unsettled variation margin is disclosed separately within the Statement of Assets and Liabilities. |
| (b) | Unrealized appreciation on forward foreign currency contracts and bilateral swap contracts |
| | | | |
Deutsche Variable Series II — Deutsche Global Income Builder VIP | | | | | 27 |
| | | | | | | | | | | | | | | | |
| Liability Derivatives | | Forward
Contracts | | | Swap
Contracts | | | Futures
Contracts | | | Total | |
| Interest Rate Contracts (c) | | $ | — | | | $ | (299,670 | ) | | $ | (80,294 | ) | | $ | (379,964 | ) |
| Foreign Exchange Contracts (d) | | | (353,454 | ) | | | — | | | | — | | | | (353,454 | ) |
| | | $ | (353,454 | ) | | $ | (299,670 | ) | | $ | (80,294 | ) | | $ | (733,418 | ) |
Each of the above derivatives is located in the following Statement of Assets and Liabilities accounts:
| (c) | Includes cumulative depreciation of futures and centrally cleared swap contracts as disclosed in the Investment Portfolio. Unsettled variation margin is disclosed separately within the Statement of Assets and Liabilities. |
| (d) | Unrealized depreciation on forward foreign currency contracts |
Additionally, the amount of unrealized and realized gains and losses on derivative instruments recognized in Fund earnings during the year ended December 31, 2017 and the related location in the accompanying Statement of Operations is summarized in the following tables by primary underlying risk exposure:
| | | | | | | | | | | | | | | | | | | | | | | | |
| Realized Gain (Loss) | | Purchased
Options | | | Written
Options | | | Forward
Contracts | | | Swap
Contracts | | | Futures
Contracts | | | Total | |
| Equity Contracts (e) | | $ | (98,354 | ) | | $ | (123,200 | ) | | $ | — | | | $ | — | | | $ | 2,170,721 | | | $ | 1,949,167 | |
| Interest Rate Contracts (e) | | | — | | | | 212,750 | | | | — | | | | 745,242 | | | | 143,203 | | | | 1,101,195 | |
| Credit Contracts (e) | | | — | | | | — | | | | — | | | | 558,231 | | | | — | | | | 558,231 | |
| Foreign Exchange Contracts (f) | | | — | | | | — | | | | (126,399 | ) | | | — | | | | — | | | | (126,399 | ) |
| | | $ | (98,354 | ) | | $ | 89,550 | | | $ | (126,399 | ) | | $ | 1,303,473 | | | $ | 2,313,924 | | | $ | 3,482,194 | |
Each of the above derivatives is located in the following Statement of Operations accounts:
| (e) | Net realized gain (loss) from investments (includes purchased options), written options, swap contracts and futures, respectively |
| (f) | Net realized gain (loss) from forward foreign currency contracts |
| | | | | | | | | | | | | | | | |
Change in Net Unrealized Appreciation (Depreciation) | | Forward
Contracts | | | Swap
Contracts | | | Futures
Contracts | | | Total | |
| Equity Contracts (g) | | $ | — | | | $ | 917,067 | | | $ | 701,962 | | | $ | 1,619,029 | |
| Interest Rate Contracts (g) | | | — | | | | (1,085,115 | ) | | | 167,621 | | | | (917,494 | ) |
| Credit Contracts (g) | | | — | | | | (101,516 | ) | | | — | | | | (101,516 | ) |
| Foreign Exchange Contracts (h) | | | (1,421,320 | ) | | | — | | | | — | | | | (1,421,320 | ) |
| | | $ | (1,421,320 | ) | | $ | (269,564 | ) | | $ | 869,583 | | | $ | (821,301 | ) |
Each of the above derivatives is located in the following Statement of Operations accounts:
| (g) | Change in net unrealized appreciation (depreciation) on swap contracts and futures, respectively |
| (h) | Change in net unrealized appreciation (depreciation) on forward foreign currency contracts |
As of December 31, 2017, the Fund has transactions subject to enforceable master netting agreements which govern the terms of certain transactions, and reduce the counterparty risk associated with such transactions. Master netting agreements allow a Fund to close out and net total exposure to a counterparty in the event of a deterioration in the credit quality or contractual default with respect to all of the transactions with a counterparty. As defined by the master netting agreement, the Fund may have collateral agreements with certain counterparties to mitigate risk. For financial reporting purposes the Statement of Assets and Liabilities generally shows derivatives assets and liabilities on a gross basis, which reflects the full risks and exposures prior to netting. A reconciliation of the gross amounts on the Statement of Assets and Liabilities to the net amounts by a counterparty, including any collateral exposure, is included in the following tables:
| | | | | | | | | | | | | | | | |
| Counterparty | | Gross Amounts
of Assets
Presented in the
Statement of
Assets and
Liabilities | | | Financial
Instruments
and
Derivatives
Available
for Offset | | | Cash Collateral
Received (i) | | | Net Amount of
Derivative
Assets | |
| Canadian Imperial Bank of Commerce | | $ | 34,042 | | | $ | — | | | $ | — | | | $ | 34,042 | |
| Citigroup, Inc. | | | 459,405 | | | | (130,795 | ) | | | — | | | | 328,610 | |
| Credit Agricole | | | 52,684 | | | | (52,684 | ) | | | — | | | | — | |
| Goldman Sachs & Co. | | | 457,662 | | | | — | | | | (290,000 | ) | | | 167,662 | |
| HSBC Holdings PLC | | | 15,579 | | | | — | | | | — | | | | 15,579 | |
| State Street Bank & Trust Co. | | | 20,337 | | | | (20,337 | ) | | | — | | | | — | |
| | | $ | 1,039,709 | | | $ | (203,816 | ) | | $ | (290,000 | ) | | $ | 545,893 | |
| | | | | | |
| | 28 | | | | | | Deutsche Variable Series II — Deutsche Global Income Builder VIP |
| | | | | | | | | | | | | | | | |
| Counterparty | | Gross Amounts
of Liabilities
Presented in the
Statement of
Assets and
Liabilities | | | Financial
Instruments
and
Derivatives
Available
for Offset | | | Non-Cash
Collateral
Pledged (i) | | | Net Amount of
Derivative
Liabilities | |
| Barclays Bank PLC | | $ | 13,359 | | | $ | — | | | $ | — | | | $ | 13,359 | |
| Citigroup, Inc. | | | 130,795 | | | | (130,795 | ) | | | — | | | | — | |
| Credit Agricole | | | 97,061 | | | | (52,684 | ) | | | — | | | | 44,377 | |
| JPMorgan Chase Securities, Inc. | | | 55,973 | | | | — | | | | (45,400 | ) | | | 10,573 | |
| National Australia Bank Ltd. | | | 5,410 | | | | — | | | | — | | | | 5,410 | |
| State Street Bank & Trust Co. | | | 50,856 | | | | (20,337 | ) | | | — | | | | 30,519 | |
| | | $ | 353,454 | | | $ | (203,816 | ) | | $ | (45,400 | ) | | $ | 104,238 | |
| (i) | The actual collateral received and/or pledged may be more than the amounts shown. |
C. Purchases and Sales of Securities
During the year ended December 31, 2017, purchases and sales of investment transactions (excluding short-term investments and U.S. Treasury obligations) aggregated $177,815,611 and $225,761,653, respectively. Purchases and sales of U.S. Treasury obligations aggregated $28,865,086 and $42,437,313, respectively.
D. Related Parties
Management Agreement. Under the Investment Management Agreement with Deutsche Investment Management Americas Inc. (“DIMA” or the “Advisor”), an indirect, wholly owned subsidiary of Deutsche Bank AG, the Advisor directs the investments of the Fund in accordance with its investment objectives, policies and restrictions. The Advisor determines the securities, instruments and other contracts relating to investments to be purchased, sold or entered into by the Fund or delegates such responsibility to the Fund’s subadvisor.
Effective March 1, 2017, Deutsche Alternative Asset Management (Global) Limited (DAAM Global), also an indirect, wholly owned subsidiary of Deutsche Bank AG, serves as subadvisor for the Fund and, as such, provides portfolio manager services to the Fund. Pursuant to a sub-advisory agreement between DIMA and DAAM Global, DIMA, not the Fund, compensates DAAM Global for the services it provides to the Fund.
Under the Investment Management Agreement, the Fund pays a monthly management fee based on the Fund’s average daily net assets, computed and accrued daily and payable monthly, at the following annual rates:
| | | | |
| First $250 million | | | .370 | % |
| Next $750 million | | | .345 | % |
| Over $1 billion | | | .310 | % |
Accordingly, for the year ended December 31, 2017, the fee pursuant to the Investment Management Agreement was equivalent to an annual rate (exclusive of any applicable waiver/reimbursements) of 0.37% of the Fund’s average daily net assets.
For the period from January 1, 2017 through September 30, 2017, the Advisor had contractually agreed to waive its fees and/or reimburse certain operating expenses to the extent necessary to maintain the total annual operating expenses (excluding certain expenses such as extraordinary expenses, taxes, brokerage and interest expense) of Class A shares at 0.73%.
Effective October 1, 2017 through September 30, 2018, the Advisor has contractually agreed to waive its fees and/or reimburse certain operating expenses to the extent necessary to maintain the total annual operating expenses (excluding certain expenses such as extraordinary expenses, taxes, brokerage and interest expense) of Class A shares at 0.69%.
Administration Fee. Pursuant to an Administrative Services Agreement, DIMA provides most administrative services to the Fund. For all services provided under the Administrative Services Agreement, the Fund pays DIMA an annual fee (“Administration Fee”) of 0.10% of the Fund’s average daily net assets, computed and accrued daily and payable monthly. For the year ended December 31, 2017, the Administration Fee was $179,014, of which $12,391 is unpaid.
| | | | |
Deutsche Variable Series II — Deutsche Global Income Builder VIP | | | | | 29 |
Service Provider Fees. Deutsche AM Service Company (“DSC”), an affiliate of the Advisor, is the transfer agent, dividend-paying agent and shareholder service agent for the Fund. Pursuant to a sub-transfer agency agreement between DSC and DST Systems, Inc. (“DST”), DSC has delegated certain transfer agent, dividend-paying agent and shareholder service agent functions to DST. DSC compensates DST out of the shareholder servicing fee it receives from the Fund. For the year ended December 31, 2017, the amounts charged to the Fund by DSC aggregated $428, of which $106 is unpaid.
Typesetting and Filing Service Fees. Under an agreement with DIMA, DIMA is compensated for providing certain pre-press and regulatory filing services to the Fund. For the year ended December 31, 2017, the amount charged to the Fund by DIMA included in the Statement of Operations under “Reports to shareholders” aggregated $12,948, of which $4,819 unpaid.
Trustees’ Fees and Expenses. The Fund paid retainer fees to each Trustee not affiliated with the Advisor, plus specified amounts to the Board Chairperson and Vice Chairperson and to each committee Chairperson.
Affiliated Cash Management Vehicles. The Fund may invest uninvested cash balances in Deutsche Central Cash Management Government Fund and Deutsche Variable NAV Money Fund, affiliated money market funds which are managed by the Advisor. Each affiliated money market fund is managed in accordance with Rule 2a-7 under the 1940 Act, which governs the quality, maturity, diversity and liquidity of instruments in which a money market fund may invest. Deutsche Central Cash Management Government Fund seeks to maintain a stable net asset value, and Deutsche Variable NAV Money Fund maintains a floating net asset value. The Fund indirectly bears its proportionate share of the expenses of each affiliated money market fund in which it invests. Deutsche Central Cash Management Government Fund does not pay the Advisor an investment management fee. To the extent that Deutsche Variable NAV Money Fund pays an investment management fee to the Advisor, the Advisor will waive an amount of the investment management fee payable to the Advisor by the Fund equal to the amount of the investment management fee payable on the Fund’s assets invested in Deutsche Variable NAV Money Fund.
Securities Lending Agent Fees. Deutsche Bank AG serves as securities lending agent for the Fund. For the year ended December 31, 2017, the Fund incurred securities lending agent fees to Deutsche Bank AG in the amount of $5,398.
E. Ownership of the Fund
At December 31, 2017, one participating insurance company was owner of record of 10% or more of the total outstanding shares of the Fund, owning 71%.
F. Line of Credit
The Fund and other affiliated funds (the “Participants”) share in a $400 million revolving credit facility provided by a syndication of banks. The Fund may borrow for temporary or emergency purposes, including the meeting of redemption requests that otherwise might require the untimely disposition of securities. The Participants are charged an annual commitment fee which is allocated based on net assets, among each of the Participants. Interest is calculated at a rate per annum equal to the sum of the Federal Funds Rate plus 1.25 percent plus if the one-month LIBOR exceeds the Federal Funds Rate, the amount of such excess. The Fund may borrow up to a maximum of 33 percent of its net assets under the agreement. The Fund had no outstanding loans at December 31, 2017.
| | | | | | |
| | 30 | | | | | | Deutsche Variable Series II — Deutsche Global Income Builder VIP |
Report of Independent Registered Public Accounting Firm
To the Board of Trustees of Deutsche Variable Series II and the Shareholders of Deutsche Global Income Builder VIP
Opinion on the Financial Statements
We have audited the accompanying statement of assets and liabilities of Deutsche Global Income Builder VIP (the “Fund”) (one of the funds constituting the Deutsche Variable Series II ) (the “Trust”), including the schedule of investments, as of December 31, 2017, and the related statement of operations for the year then ended, the statements of changes in net assets for each of the two years in the period then ended, the financial highlights for each of the five years in the period then ended and the related notes (collectively referred to as the “financial statements”). In our opinion, the financial statements present fairly, in all material respects, the financial position of the Fund (one of the funds constituting the Deutsche Variable Series II) at December 31, 2017, the results of its operations for the year then ended, the changes in its net assets for each of the two years in the period then ended and its financial highlights for each of the five years in the period then ended, in conformity with U.S. generally accepted accounting principles.
Basis for Opinion
These financial statements are the responsibility of the Trust’s management. Our responsibility is to express an opinion on the Fund’s financial statements based on our audits. We are a public accounting firm registered with the Public Company Accounting Oversight Board (United States) (“PCAOB”) and are required to be independent with respect to the Trust in accordance with the U.S. federal securities laws and the applicable rules and regulations of the Securities and Exchange Commission and the PCAOB.
We conducted our audits in accordance with the standards of the PCAOB. Those standards require that we plan and perform the audit to obtain reasonable assurance about whether the financial statements are free of material misstatement, whether due to error or fraud. The Trust is not required to have, nor were we engaged to perform, an audit of the Trust’s internal control over financial reporting. As part of our audits, we are required to obtain an understanding of internal control over financial reporting, but not for the purpose of expressing an opinion on the effectiveness of the Trust’s internal control over financial reporting. Accordingly, we express no such opinion.
Our audits included performing procedures to assess the risks of material misstatement of the financial statements, whether due to error or fraud, and performing procedures that respond to those risks. Such procedures included examining, on a test basis, evidence regarding the amounts and disclosures in the financial statements. Our procedures included confirmation of securities owned as of December 31, 2017, by correspondence with the custodian and brokers or by other appropriate auditing procedures where replies from brokers were not received.
Our audits also included evaluating the accounting principles used and significant estimates made by management, as well as evaluating the overall presentation of the financial statements. We believe that our audits provide a reasonable basis for our opinion.
| | |
| | 
|
We have served as the auditor of one or more investment companies in the Deutsche family of funds since at least 1979, but we are unable to determine the specific year. |
Boston, Massachusetts | | |
February 15, 2018 | | |
| | | | |
Deutsche Variable Series II — Deutsche Global Income Builder VIP | | | | | 31 |
| | |
| Information About Your Fund’s Expenses | | (Unaudited) |
As an investor of the Fund, you incur two types of costs: ongoing expenses and transaction costs. Ongoing expenses include management fees and other Fund expenses. Examples of transaction costs include contract charges, which are not shown in this section. The following tables are intended to help you understand your ongoing expenses (in dollars) of investing in the Fund and to help you compare these expenses with the ongoing expenses of investing in other mutual funds. The example in the table is based on an investment of $1,000 invested at the beginning of the six-month period and held for the entire period (July 1, 2017 to December 31, 2017).
The tables illustrate your Fund’s expenses in two ways:
| – | Actual Fund Return. This helps you estimate the actual dollar amount of ongoing expenses (but not transaction costs) paid on a $1,000 investment in the Fund using the Fund’s actual return during the period. To estimate the expenses you paid over the period, simply divide your account value by $1,000 (for example, an $8,600 account value divided by $1,000 = 8.6), then multiply the result by the number in the “Expenses Paid per $1,000” line under the share class you hold. |
| – | Hypothetical 5% Fund Return. This helps you to compare your Fund’s ongoing expenses (but not transaction costs) with those of other mutual funds using the Fund’s actual expense ratio and a hypothetical rate of return of 5% per year before expenses. Examples using a 5% hypothetical Fund return may be found in the shareholder reports of other mutual funds. The hypothetical account values and expenses may not be used to estimate the actual ending account balance or expenses you paid for the period. |
Please note that the expenses shown in these tables are meant to highlight your ongoing expenses only and do not reflect any transaction costs. The “Expenses Paid per $1,000” line of the tables is useful in comparing ongoing expenses only and will not help you determine the relative total expense of owning different funds. If these transaction costs had been included, your costs would have been higher.
| | | | |
| Expenses and Value of a $1,000 Investment for the six months ended December 31, 2017 | | | |
| |
| Actual Fund Return | | Class A | |
| Beginning Account Value 7/1/17 | | $ | 1,000.00 | |
| Ending Account Value 12/31/17 | | $ | 1,084.50 | |
| Expenses Paid per $1,000* | | $ | 3.31 | |
| |
| Hypothetical 5% Fund Return | | Class A | |
| Beginning Account Value 7/1/17 | | $ | 1,000.00 | |
| Ending Account Value 12/31/17 | | $ | 1,022.03 | |
| Expenses Paid per $1,000* | | $ | 3.21 | |
| * | Expenses are equal to the Fund’s annualized expense ratio, multiplied by the average account value over the period, multiplied by 184 (the number of days in the most recent six-month period), then divided by 365. |
| | | | |
| Annualized Expense Ratio | | Class A | |
| Deutsche Variable Series II — Deutsche Global Income Builder VIP | | | .63 | % |
For more information, please refer to the Fund’s prospectus.
These tables do not reflect charges and fees (“contract charges”) associated with the separate account that invests in the Fund or any variable life insurance policy or variable annuity contract for which the Fund is an investment option.
For an analysis of the fees associated with an investment in the fund or similar funds, please refer to the current and hypothetical expense calculators for Variable Insurance Products which can be found at deutschefunds.com/EN/resources/calculators.jsp.
| | | | | | |
| | 32 | | | | | | Deutsche Variable Series II — Deutsche Global Income Builder VIP |
| | |
| Tax Information | | (Unaudited) |
Pursuant to Section 852 of the Internal Revenue Code, the Fund designates $9,111,000 as capital gain dividends for its year ended December 31, 2017.
For corporate shareholders, 18% of the ordinary dividends (i.e., income dividends plus short-term capital gains) paid during the Fund’s fiscal year ended December 31, 2017 qualified for the dividends received deduction.
Please consult a tax advisor if you have questions about federal or state income tax laws, or on how to prepare your tax returns. If you have specific questions about your account, please contact your insurance provider.
Proxy Voting
The Trust’s policies and procedures for voting proxies for portfolio securities and information about how the Trust voted proxies related to its portfolio securities during the most recent 12-month period ended June 30 are available on our Web site — deutschefunds.com (click on “proxy voting” at the bottom of the page) — or on the SEC’s Web site — sec.gov. To obtain a written copy of the Trust’s policies and procedures without charge, upon request, call us toll free at (800) 728-3337.
| | | | |
Deutsche Variable Series II — Deutsche Global Income Builder VIP | | | | | 33 |
Advisory Agreement Board Considerations and Fee Evaluation
The Board of Trustees (hereinafter referred to as the “Board” or “Trustees”) approved the renewal of Deutsche Global Income Builder VIP’s (the “Fund”) investment management agreement (the “Agreement”) with Deutsche Investment Management Americas Inc. (“DIMA”) in September 2017. DIMA has also entered into a sub-advisory agreement with Deutsche Alternative Asset Management (Global) Limited (“DAAM Global”), an affiliate of DIMA, that has an initial term through September 30, 2018.
In terms of the process that the Board followed prior to approving the Agreement, shareholders should know that:
| – | | During the entire process, all of the Fund’s Trustees were independent of DIMA and its affiliates (the “Independent Trustees”). |
| – | | The Board met frequently during the past year to discuss fund matters and dedicated a substantial amount of time to contract review matters. Over the course of several months, the Board’s Contract Committee reviewed extensive materials received from DIMA, independent third parties and independent counsel. These materials included an analysis of the Fund’s performance, fees and expenses, and profitability from a fee consultant retained by the Fund’s Independent Trustees (the “Fee Consultant”). Based on its evaluation of the information provided, the Contract Committee presented its findings and recommendations to the Board. The Board then reviewed the Contract Committee’s findings and recommendations. |
| – | | The Board also received extensive information throughout the year regarding performance of the Fund. |
| – | | The Independent Trustees regularly met privately with counsel to discuss contract review and other matters. In addition, the Independent Trustees were advised by the Fee Consultant in the course of their review of the Fund’s contractual arrangements and considered a comprehensive report prepared by the Fee Consultant in connection with their deliberations. |
| – | | In connection with reviewing the Agreement, the Board also reviewed the terms of the Fund’s distribution agreement, administrative services agreement, transfer agency agreement and other material service agreements. |
In connection with the contract review process, the Contract Committee and the Board considered the factors discussed below, among others. The Board also considered that DIMA and its predecessors have managed the Fund since its inception, and the Board believes that a long-term relationship with a capable, conscientious advisor is in the best interests of the Fund. The Board considered, generally, that shareholders chose to invest or remain invested in the Fund knowing that DIMA managed the Fund, and that the Agreement was approved by the Fund’s shareholders. DIMA and DAAM Global are part of Deutsche Bank AG’s (“Deutsche Bank”) Asset Management (“Deutsche AM”) division. Deutsche AM is a global asset management business that offers a wide range of investing expertise and resources, including research capabilities in many countries throughout the world.
As part of the contract review process, the Board carefully considered the fees and expenses of each Deutsche fund overseen by the Board in light of the fund’s performance. In many cases, this led to the negotiation and implementation of expense caps. As part of these negotiations, the Board indicated that it would consider relaxing these caps in future years following sustained improvements in performance, among other considerations.
While shareholders may focus primarily on fund performance and fees, the Fund’s Board considers these and many other factors, including the quality and integrity of DIMA’s and DAAM Global’s personnel and administrative support services provided by DIMA, such as back-office operations, fund valuations, and compliance policies and procedures.
Nature, Quality and Extent of Services. The Board considered the terms of the Agreement, including the scope of advisory services provided under the Agreement. The Board noted that DIMA and DAAM Global provide portfolio management services to the Fund and that, pursuant to a separate administrative services agreement, DIMA provides administrative services to the Fund. The Board considered the experience and skills of senior management and investment personnel and the resources made available to such personnel. Throughout the course of the year, the Board also received information regarding DIMA’s oversight of fund sub-advisers, including DAAM Global. The Board reviewed the Fund’s performance over short-term and long-term periods and compared those returns to various agreed-upon performance measures, including market index(es) and a peer universe compiled using information supplied by Morningstar Direct (“Morningstar”), an
| | | | | | |
| | 34 | | | | | | Deutsche Variable Series II — Deutsche Global Income Builder VIP |
independent fund data service. The Board also noted that it has put into place a process of identifying “Funds in Review” (e.g., funds performing poorly relative to a peer universe), and receives additional reporting from DIMA regarding such funds and, where appropriate, DIMA’s plans to address underperformance. The Board believes this process is an effective manner of identifying and addressing underperforming funds. Based on the information provided, the Board noted that, for the one-, three- and five-year periods ended December 31, 2016, the Fund’s performance (Class A shares) was in the 2nd quartile, 2nd quartile and 1st quartile, respectively, of the applicable Morningstar universe (the 1st quartile being the best performers and the 4th quartile being the worst performers). The Board also observed that the Fund has outperformed its benchmark in the one-, three- and five-year periods ended December 31, 2016.
Fees and Expenses. The Board considered the Fund’s investment management fee schedule, operating expenses and total expense ratios, and comparative information provided by Broadridge Financial Solutions, Inc. (“Broadridge”) and the Fee Consultant regarding investment management fee rates paid to other investment advisors by similar funds (1st quartile being the most favorable and 4th quartile being the least favorable). With respect to management fees paid to other investment advisors by similar funds, the Board noted that the contractual fee rates paid by the Fund, which include a 0.10% fee paid to DIMA under the Fund’s administrative services agreement, were lower than the median (1st quartile) of the applicable Broadridge peer group (based on Broadridge data provided as of December 31, 2016). The Board noted that DIMA pays a sub-advisory fee to DAAM Global out of its fee. The Board noted that the Fund’s Class A shares total (net) operating expenses were expected to be lower than the median (2nd quartile) of the applicable Broadridge expense universe (based on Broadridge data provided as of December 31, 2016, and analyzing Broadridge expense universe Class A (net) expenses less any applicable 12b-1 fees) (“Broadridge Universe Expenses”). The Board noted that the expense limitation agreed to by DIMA was expected to help the Fund’s total (net) operating expenses remain competitive. The Board considered the Fund’s management fee rate as compared to fees charged by DIMA to a comparable Deutsche U.S. registered fund (“Deutsche Funds”) and considered differences between the Fund and the comparable Deutsche Fund. The information requested by the Board as part of its review of fees and expenses also included information about institutional accounts (including any sub-advised funds and accounts) and funds offered primarily to European investors (“Deutsche Europe funds”) managed by Deutsche AM. The Board noted that DIMA indicated that Deutsche AM does not manage any institutional accounts or Deutsche Europe funds comparable to the Fund.
On the basis of the information provided, the Board concluded that management fees were reasonable and appropriate in light of the nature, quality and extent of services provided by DIMA and DAAM Global.
Profitability. The Board reviewed detailed information regarding revenues received by DIMA under the Agreement. The Board considered the estimated costs to DIMA, and pre-tax profits realized by DIMA, from advising the Deutsche Funds, as well as estimates of the pre-tax profits attributable to managing the Fund in particular. The Board also received information regarding the estimated enterprise-wide profitability of DIMA and its affiliates with respect to all fund services in totality and by fund. The Board and the Fee Consultant reviewed DIMA’s methodology in allocating its costs to the management of the Fund. Based on the information provided, the Board concluded that the pre-tax profits realized by DIMA in connection with the management of the Fund were not unreasonable. The Board also reviewed certain publicly available information regarding the profitability of certain similar investment management firms. The Board noted that, while information regarding the profitability of such firms is limited (and in some cases is not necessarily prepared on a comparable basis), DIMA and its affiliates’ overall profitability with respect to the Deutsche Funds (after taking into account distribution and other services provided to the funds by DIMA and its affiliates) was lower than the overall profitability levels of most comparable firms for which such data was available.
Economies of Scale. The Board considered whether there are economies of scale with respect to the management of the Fund and whether the Fund benefits from any economies of scale. The Board noted that the Fund’s investment management fee schedule includes fee breakpoints. The Board concluded that the Fund’s fee schedule represents an appropriate sharing between the Fund and DIMA of such economies of scale as may exist in the management of the Fund at current asset levels.
Other Benefits to DIMA and Its Affiliates. The Board also considered the character and amount of other incidental benefits received by DIMA and its affiliates, including any fees received by DIMA for administrative services provided to the Fund and any fees received by an affiliate of DIMA for transfer agency services provided to the Fund. The Board also considered benefits to DIMA related to brokerage and soft-dollar
| | | | |
Deutsche Variable Series II — Deutsche Global Income Builder VIP | | | | | 35 |
allocations, including allocating brokerage to pay for research generated by parties other than the executing broker dealers, which pertain primarily to funds investing in equity securities. In addition, the Board considered the incidental public relations benefits to DIMA related to Deutsche Funds advertising and cross-selling opportunities among DIMA products and services. The Board considered these benefits in reaching its conclusion that the Fund’s management fees were reasonable.
Compliance. The Board considered the significant attention and resources dedicated by DIMA to documenting and enhancing its compliance processes in recent years. The Board noted in particular (i) the experience, seniority and time commitment of the individuals serving as DIMA’s and the Fund’s chief compliance officers; (ii) the large number of DIMA compliance personnel; and (iii) the substantial commitment of resources by DIMA and its affiliates to compliance matters.
Based on all of the information considered and the conclusions reached, the Board unanimously determined that the continuation of the Agreement is in the best interests of the Fund. In making this determination, the Board did not give particular weight to any single factor identified above. The Board considered these factors over the course of numerous meetings, certain of which were in executive session with only the Independent Trustees and counsel present. It is possible that individual Independent Trustees may have weighed these factors differently in reaching their individual decisions to approve the continuation of the Agreement.
| | | | | | |
| | 36 | | | | | | Deutsche Variable Series II — Deutsche Global Income Builder VIP |
Board Members and Officers
The following table presents certain information regarding the Board Members and Officers of the Fund. Each Board Member’s year of birth is set forth in parentheses after his or her name. Unless otherwise noted, (i) each Board Member has engaged in the principal occupation(s) noted in the table for at least the most recent five years, although not necessarily in the same capacity; and (ii) the address of each Independent Board Member is c/o Keith R. Fox, Deutsche Funds Board Chair, c/o Thomas R. Hiller, Ropes & Gray LLP, Prudential Tower, 800 Boylston Street, Boston, MA 02199-3600. Except as otherwise noted below, the term of office for each Board Member is until the election and qualification of a successor, or until such Board Member sooner dies, resigns, is removed or as otherwise provided in the governing documents of the Fund. Because the Fund does not hold an annual meeting of shareholders, each Board Member will hold office for an indeterminate period. The Board Members may also serve in similar capacities with other funds in the fund complex.
| | | | | | | | |
| Independent Board Members | | | | | | | |
Name, Year of Birth,
Position with the Fund and
Length of Time Served1 | | Business Experience and Directorships During the Past Five Years | | Number of
Funds in
Deutsche
Fund
Complex
Overseen | | | Other
Directorships
Held by Board
Member |
Keith R. Fox, CFA (1954) Chairperson since 2017, and Board Member since 1996 | | Managing General Partner, Exeter Capital Partners (a series of private investment funds) (since 1986). Directorships: Progressive International Corporation (kitchen goods importer and distributor); The Kennel Shop (retailer); former Chairman, National Association of Small Business Investment Companies; former Directorships: BoxTop Media Inc. (advertising); Sun Capital Advisers Trust (mutual funds) (2011–2012) | | | 89 | | | — |
Kenneth C. Froewiss (1945) Vice Chairperson since 2017, and Board Member since 2001 | | Retired Clinical Professor of Finance, NYU Stern School of Business (1997–2014); Member, Finance Committee, Association for Asian Studies (2002–present); Director, Mitsui Sumitomo Insurance Group (US) (2004–present); prior thereto, Managing Director, J.P. Morgan (investment banking firm) (until 1996) | | | 92 | | | — |
John W. Ballantine (1946) Board Member since 1999 | | Retired; formerly, Executive Vice President and Chief Risk Management Officer, First Chicago NBD Corporation/The First National Bank of Chicago (1996–1998); Executive Vice President and Head of International Banking (1995–1996); former Directorships: Director and former Chairman of the Board, Healthways, Inc.2 (population well-being and wellness services) (2003–2014); Stockwell Capital Investments PLC (private equity); Enron Corporation; FNB Corporation; Tokheim Corporation; First Oak Brook Bancshares, Inc. and Oak Brook Bank; Prisma Energy International. Not-for-Profit Director, Trustee: Palm Beach Civic Association; Public Radio International; Window to the World Communications (public media); Harris Theater for Music and Dance (Chicago) | | | 89 | | | Portland
General
Electric2
(utility
company)
(2003–
present) |
Henry P. Becton, Jr. (1943) Board Member since 1990 | | Vice Chair and former President, WGBH Educational Foundation. Directorships: Public Radio International; Public Radio Exchange (PRX); The Pew Charitable Trusts (charitable organization); former Directorships: Becton Dickinson and Company2 (medical technology company); Belo Corporation2 (media company); The PBS Foundation; Association of Public Television Stations; Boston Museum of Science; American Public Television; Concord Academy; New England Aquarium; Mass. Corporation for Educational Telecommunications; Committee for Economic Development; Public Broadcasting Service; Connecticut College; North Bennett Street School (Boston) | | | 89 | | | — |
Dawn-Marie Driscoll (1946) Board Member since 1987 | | Emeritus Executive Fellow, Center for Business Ethics, Bentley University; formerly: President, Driscoll Associates (consulting firm); Partner, Palmer & Dodge (law firm) (1988–1990); Vice President of Corporate Affairs and General Counsel, Filene’s (retail) (1978–1988). Directorships: Advisory Board, Center for Business Ethics, Bentley University; Trustee and former Chairman of the Board, Southwest Florida Community Foundation (charitable organization); former Directorships: ICI Mutual Insurance Company (2007–2015); Sun Capital Advisers Trust (mutual funds) (2007–2012), Investment Company Institute (audit, executive, nominating committees) and Independent Directors Council (governance, executive committees) | | | 89 | | | — |
| | | | |
Deutsche Variable Series II — Deutsche Global Income Builder VIP | | | | | 37 |
| | | | | | | | |
Name, Year of Birth,
Position with the Fund and
Length of Time Served1 | | Business Experience and Directorships During the Past Five Years | | Number of
Funds in
Deutsche
Fund
Complex
Overseen | | | Other
Directorships
Held by Board
Member |
Paul K. Freeman (1950) Board Member since 1993 | | Consultant, World Bank/Inter-American Development Bank; Independent Directors Council (former chair); Investment Company Institute (executive and nominating committees); formerly: Chairman of Education Committee of Independent Directors Council; Project Leader, International Institute for Applied Systems Analysis (1998–2001); Chief Executive Officer, The Eric Group, Inc. (environmental insurance) (1986–1998); Directorships: Denver Zoo Foundation (December 2012–present); Knoebel Institute for Healthy Aging, University of Denver (2017–present); former Directorships: Prisma Energy International | | | 89 | | | — |
Richard J. Herring (1946) Board Member since 1990 | | Jacob Safra Professor of International Banking and Professor, Finance Department, The Wharton School, University of Pennsylvania (since July 1972); Co-Director, Wharton Financial Institutions Center; formerly: Vice Dean and Director, Wharton Undergraduate Division (July 1995–June 2000); Director, Lauder Institute of International Management Studies (July 2000–June 2006) | | | 89 | | | Director,
Aberdeen
Singapore
and Japan
Funds (since
2007);
Independent
Director of
Barclays
Bank
Delaware
(since
September
2010) |
William McClayton (1944) Board Member since 2004 | | Private equity investor (since October 2009); previously, Managing Director, Diamond Management & Technology Consultants, Inc. (global consulting firm) (2001–2009); Directorship: Board of Managers, YMCA of Metropolitan Chicago; formerly: Senior Partner, Arthur Andersen LLP (accounting) (1966–2001); Trustee, Ravinia Festival | | | 89 | | | — |
Rebecca W. Rimel (1951) Board Member since 1995 | | President, Chief Executive Officer and Director, The Pew Charitable Trusts (charitable organization) (1994–present); formerly: Executive Vice President, The Glenmede Trust Company (investment trust and wealth management) (1983–2004); Board Member, Investor Education (charitable organization) (2004–2005); Trustee, Executive Committee, Philadelphia Chamber of Commerce (2001–2007); Director, Viasys Health Care2 (January 2007–June 2007); Trustee, Thomas Jefferson Foundation (charitable organization) (1994–2012) | | | 89 | | | Director,
Becton
Dickinson
and
Company2
(medical
technology
company)
(2012–
present);
Director,
BioTelemetry
Inc2 (health
care) (2009–
present) |
William N. Searcy, Jr. (1946) Board Member since 1993 | | Private investor since October 2003; formerly: Pension & Savings Trust Officer, Sprint Corporation2 (telecommunications) (November 1989–September 2003); Trustee, Sun Capital Advisers Trust (mutual funds) (1998–2012) | | | 89 | | | — |
Jean Gleason Stromberg (1943) Board Member since 1997 | | Retired. Formerly, Consultant (1997–2001); Director, Financial Markets U.S. Government Accountability Office (1996–1997); Partner, Norton Rose Fulbright, L.L.P. (law firm) (1978–1996); former Directorships: The William and Flora Hewlett Foundation (charitable organization) (2000–2015); Service Source, Inc. (nonprofit), Mutual Fund Directors Forum (2002–2004), American Bar Retirement Association (funding vehicle for retirement plans) (1987–1990 and 1994–1996) | | | 89 | | | — |
| | | | | | |
| | 38 | | | | | | Deutsche Variable Series II — Deutsche Global Income Builder VIP |
| | |
| Officers4 | | |
Name, Year of Birth,
Position with the Fund and
Length of Time Served5 | | Business Experience and Directorships During the Past Five Years |
Hepsen Uzcan6,9 (1974) President and Chief Executive Officer, 2017–present Assistant Secretary, 2013–present | | Director,3 Deutsche Asset Management; formerly: Vice President for the Deutsche funds (2016–2017) |
John Millette8 (1962) Vice President and Secretary, 1999–present | | Director,3 Deutsche Asset Management; Chief Legal Officer, Deutsche Investment Management Americas Inc. (2015–present); and Director and Vice President, Deutsche AM Trust Company (since 2016); formerly: Secretary, Deutsche Investment Management Americas Inc. (2015–2017) |
Paul H. Schubert6 (1963) Chief Financial Officer, 2004–present Treasurer, 2005–present | | Managing Director,3 Deutsche Asset Management, and Chairman, Director and President, Deutsche AM Trust Company (since 2013); Vice President, Deutsche AM Distributors, Inc. (since 2016); Director, Deutsche AM Service Company (since 2017); Director and President, DB Investment Managers, Inc. (since 2017); formerly: Director, Deutsche AM Trust Company (2004–2013) |
Caroline Pearson8 (1962) Chief Legal Officer, 2010–present | | Managing Director,3 Deutsche Asset Management; formerly: Secretary, Deutsche AM Distributors, Inc.; and Secretary, Deutsche AM Service Company |
Scott D. Hogan8 (1970) Chief Compliance Officer, 2016–present | | Director,3 Deutsche Asset Management |
Wayne Salit7 (1967) Anti-Money Laundering Compliance Officer, 2014–present | | Director,3 Deutsche Asset Management; formerly: Managing Director, AML Compliance Officer at BNY Mellon (2011–2014); and Director, AML Compliance Officer at Deutsche Bank (2004–2011) |
Sheila Cadogan8 (1966) Assistant Treasurer, since July 12, 2017 | | Director,3 Deutsche Asset Management |
Paul Antosca8 (1957) Assistant Treasurer, 2007–present | | Director,3 Deutsche Asset Management |
Diane Kenneally8 (1966) Assistant Treasurer, 2007–present | | Director,3 Deutsche Asset Management |
| 1 | The length of time served represents the year in which the Board Member joined the board of one or more Deutsche funds currently overseen by the Board. |
| 2 | A publicly held company with securities registered pursuant to Section 12 of the Securities Exchange Act of 1934. |
| 3 | Executive title, not a board directorship. |
| 4 | As a result of their respective positions held with the Advisor, these individuals are considered “interested persons” of the Advisor within the meaning of the 1940 Act. Interested persons receive no compensation from the Fund. |
| 5 | The length of time served represents the year in which the officer was first elected in such capacity for one or more Deutsche funds. |
| 6 | Address: 345 Park Avenue, New York, NY 10154. |
| 7 | Address: 60 Wall Street, New York, NY 10005. |
| 8 | Address: One International Place, Boston, MA 02110. |
| 9 | Appointed President and Chief Executive Officer effective December 1, 2017. |
The Fund’s Statement of Additional Information (“SAI”) includes additional information about the Board Members. The SAI is available, without charge, upon request. If you would like to request a copy of the SAI, you may do so by calling the following toll-free number: (800) 728-3337.
| | | | |
Deutsche Variable Series II — Deutsche Global Income Builder VIP | | | | | 39 |
| | |
 | | |
VS2GIB-2 (R-025825-7 2/18) | | |

December 31, 2017
Annual Report
Deutsche Variable Series II
Deutsche Government & Agency Securities VIP

Contents
This report must be preceded or accompanied by a prospectus. To obtain an additional prospectus or summary prospectus, if available, call (800) 728-3337 or your financial representative. We advise you to consider the Fund’s objectives, risks, charges and expenses carefully before investing. The summary prospectus and prospectus contain this and other important information about the Fund. Please read the prospectus carefully before you invest.
Investing in derivatives entails special risks relating to liquidity, leverage and credit that may reduce returns and/or increase volatility. Bond investments are subject to interest-rate, credit, liquidity and market risks to varying degrees. When interest rates rise, bond prices generally fall. Credit risk refers to the ability of an issuer to make timely payments of principal and interest. The “full faith and credit” guarantee of the US government applies to the timely repayment of interest, and does not eliminate market risk. Because of the rising US government debt burden, it is possible that the US government may not be able to meet its financial obligations or that securities issued by the US government may experience credit downgrades. The Fund may lend securities to approved institutions. See the prospectus for details.
Deutsche Asset Management represents the asset management activities conducted by Deutsche Bank AG or any of its subsidiaries.
Deutsche AM Distributors, Inc., 222 South Riverside Plaza, Chicago, IL 60606, (800) 621-1148
NOT FDIC/NCUA INSURED NO BANK GUARANTEE MAY LOSE VALUE NOT A DEPOSIT
NOT INSURED BY ANY FEDERAL GOVERNMENT AGENCY
| | | | | | |
| | 2 | | | | | | Deutsche Variable Series II — Deutsche Government & Agency Securities VIP |
| | |
| Performance Summary | | December 31, 2017 (Unaudited) |
Fund performance shown is historical, assumes reinvestment of all dividend and capital gain distributions and does not guarantee future results. Investment return and principal value fluctuate with changing market conditions so that, when redeemed, shares may be worth more or less than their original cost. Current performance may be lower or higher than the performance data quoted. Please contact your participating insurance company for the Fund’s most recent month-end performance. Performance doesn’t reflect charges and fees (“contract charges”) associated with the separate account that invests in the Fund or any variable life insurance policy or variable annuity contract for which the Fund is an investment option. These charges and fees will reduce returns. While all share classes have the same underlying portfolio, their performance will differ.
The gross expense ratios of the Fund, as stated in the fee table of the prospectus dated May 1, 2017 are 0.86% and 1.21% for Class A and Class B shares, respectively, and may differ from the expense ratios disclosed in the Financial Highlights tables in this report.
Generally accepted accounting principles require adjustments to be made to the net assets of the Fund at period end for financial reporting purposes only, and as such, the total return based on the unadjusted net asset value per share may differ from the total return reported in the financial highlights.
Growth of an Assumed $10,000 Investment in Deutsche Government & Agency Securities VIP
| | |
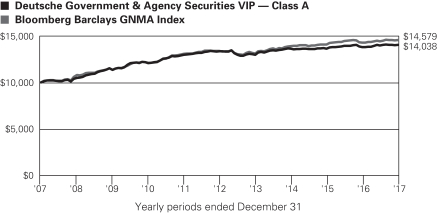 | | The Bloomberg Barclays GNMA Index is an unmanaged, market-value-weighted measure of all fixed-rate securities backed by mortgage pools of the Government National Mortgage Association. Index returns do not reflect any fees or expenses and it is not possible to invest directly into an index. |
| | | | | | | | | | |
| Comparative Results | | | | | | | | | | |
| | | | |
| Deutsche Government & Agency Securities VIP | | 1-Year | | 3-Year | | 5-Year | | 10-Year |
| Class A | | Growth of $10,000 | | $10,167 | | $10,282 | | $10,497 | | $14,038 |
| | | Average annual total return | | 1.67% | | 0.93% | | 0.97% | | 3.45% |
| Bloomberg Barclays GNMA Index | | Growth of $10,000 | | $10,186 | | $10,489 | | $10,879 | | $14,579 |
| | | Average annual total return | | 1.86% | | 1.60% | | 1.70% | | 3.84% |
| | | | |
| Deutsche Government & Agency Securities VIP | | 1-Year | | 3-Year | | 5-Year | | 10-Year |
| Class B | | Growth of $10,000 | | $10,131 | | $10,173 | | $10,330 | | $13,576 |
| | | Average annual total return | | 1.31% | | 0.57% | | 0.65% | | 3.10% |
| Bloomberg Barclays GNMA Index | | Growth of $10,000 | | $10,186 | | $10,489 | | $10,879 | | $14,579 |
| | Average annual total return | | 1.86% | | 1.60% | | 1.70% | | 3.84% |
The growth of $10,000 is cumulative.
| | | | |
Deutsche Variable Series II — Deutsche Government & Agency Securities VIP | | | | | 3 |
| | |
Management Summary | | December 31, 2017 (Unaudited) |
During the 12-month period ended December 31, 2017, the Fund provided a total return of 1.67% (Class A shares, unadjusted for contract charges) compared with the 1.86% return of its benchmark, the Bloomberg Barclays GNMA Index.
Entering 2017, investor sentiment was supported by optimism over the prospects for higher growth with Republicans holding the White House and both houses of Congress. Economically sensitive, credit-oriented segments of the bond market outperformed more interest rate-sensitive, higher-quality issues for much of the year. In October 2017, the U.S. Federal Reserve (the Fed) begin the gradual tapering of its mortgage-backed security and Treasury holdings. The plan to reduce the Fed’s balance sheet had been extensively foreshadowed, so the actual launch of tapering had a muted impact on longer-term bond yields. As 2017 drew to a close, against a backdrop of strengthened employment conditions and robust corporate profits, the passage of a tax reform bill that included a significant reduction in corporate tax rates led to stepped up expectations for Fed rate hikes. In December, the Fed implemented its third quarter-point rate hike of the year by increasing the upper band of its benchmark short-term lending rate from 1.25% to 1.50%.
For the 12 months ended December 31, 2017, the U.S. Treasury yield curve flattened as short term yields rose and longer-term rates declined. To illustrate, the two-year Treasury yield went from 1.20% to 1.91%, the five-year from 1.93% to 2.23%, the 10-year from 2.45% to 2.43%, the 20-year from 2.79% to 2.60% and the 30-year from 3.05% to 2.75%.
2017 was a difficult year for the GNMA sector, as faster prepayment and heavy supply undermined sentiment. We reduced GNMA exposure throughout the year in exchange for conventional mortgage-backed securities and other high-quality, out-of-benchmark sectors such as U.S. Treasuries, which proved beneficial to performance.
The Fund also maintained a position in collateralized mortgage obligations with favorable prepayment characteristics, which helped drive incremental yield for the Fund. The Fund tactically shifted its positioning along the yield curve throughout the period, while maintaining a strategic bias toward a flattening yield curve that favored longer maturities. High-coupon GNMAs lagged over the 12 months, and we reduced the Fund’s overweight to the sector while maintaining exposure to bonds that we believe could have upside potential if interest rate levels rise. Derivatives, which were used for tactical positioning with respect to non-U.S. dollar exposures, had a positive effect on performance when coupled with corresponding currency hedges. Derivatives were also used for hedging U.S. interest rate exposure with minimal impact on performance.
We expect a continued flattening of the yield curve given that the Fed is hinting at three or four hikes in the coming year. The positive sentiment is expected to carry forward into the new year, possibly suppressing demand for GNMA securities as investors seek higher yields in a steadily improving economy. However, with spreads having narrowed across asset classes, the relative value equation is pointing back in favor of the high-quality segments of the U.S. fixed income market. The backdrop is further complicated by the Fed’s tapering and ultimately vanishing reinvestment into the mortgage-backed securities market. We therefore believe maintaining off-index exposures to liquid instruments such as sovereign bonds, agency CMOs and ABS securities could help mitigate volatility in the coming year.
Gregory M. Staples, CFA, Managing Director
Scott Agi, CFA, Director
Portfolio Managers
The views expressed reflect those of the portfolio management team only through the end of the period of the report as stated on the cover. The management team’s views are subject to change at any time based on market and other conditions and should not be construed as a recommendation. Past performance is no guarantee of future results. Current and future portfolio holdings are subject to risk.
| | | | | | |
| | 4 | | | | | | Deutsche Variable Series II — Deutsche Government & Agency Securities VIP |
Terms to Know
The yield curve is a graphical representation of how yields on bonds of different maturities compare. Normally, yield curves slant up, as bonds with longer maturities typically offer higher yields than short-term bonds.
The Bloomberg Barclays GNMA Index is an unmanaged, market-value-weighted measure of all fixed rate securities backed by mortgage pools of the Government National Mortgage Association. Index returns do not reflect any fees or expenses and it is not possible to invest directly into an index.
Mortgage-backed securities (MBS) are bonds that are secured by mortgage debt. Collateralized mortgage obligations (CMOs) are mortgage-backed securities with separate pools for different classes of bondholders. Asset-backed securities (ABS) are bonds backed by receivables from consumer debt such as credit cards, home equity loans and auto loans.
Coupon is the interest rate, expressed as an annual percentage of face value, which a bond issuer promises to pay until maturity.
Overweight means the fund holds a higher weighting in a given sector or security than the benchmark. Underweight means the fund holds a lower weighting.
Derivatives are contracts whose values can be based on a variety of instruments including indices, currencies or securities. They can be utilized for a variety of reasons including for hedging purposes; for risk management; for non-hedging purposes to seek to enhance potential gains; or as a substitute for direct investment in a particular asset class or to keep cash on hand to meet shareholder redemptions. Investing in derivatives entails special risks relating to liquidity, leverage and credit that may reduce returns and/or increase volatility.
| | | | |
Deutsche Variable Series II — Deutsche Government & Agency Securities VIP | | | | | 5 |
| | |
| Portfolio Summary | | (Unaudited) |
| | | | | | | | |
| Asset Allocation (As a % of Net Assets) | | 12/31/17 | | | 12/31/16 | |
| Mortgage-Backed Securities Pass-Throughs | | | 80% | | | | 94% | |
| Collateralized Mortgage Obligations | | | 22% | | | | 16% | |
| Government & Agency Obligations | | | 16% | | | | 7% | |
| Asset-Backed | | | 5% | | | | — | |
| Commercial Mortgage-Backed Securities | | | 3% | | | | 1% | |
| Corporate Bonds | | | 1% | | | | 2% | |
| Cash Equivalents and Other Assets and Liabilities, net | | | –27% | | | | –20% | |
| | | 100% | | | 100% | |
| | |
| Coupons* | | 12/31/17 | | | 12/31/16 | |
| Less than 3.5% | | | 35% | | | | 27% | |
| 3.5%–4.49% | | | 42% | | | | 35% | |
| 4.5%–5.49% | | | 15% | | | | 20% | |
| 5.5%–6.49% | | | 5% | | | | 17% | |
| 6.5%–7.49% | | | 3% | | | | 1% | |
| 7.5% and Greater | | | 0% | | | | 0% | |
| | | 100% | | | 100% | |
| | |
| Interest Rate Sensitivity | | 12/31/17 | | | 12/31/16 | |
| Effective Maturity | | | 9.9 years | | | | 9.9 years | |
| Effective Duration | | | 4.0 years | | | | 4.2 years | |
| * | Excludes Cash Equivalents and U.S. Treasury Bills. |
Effective maturity is the weighted average of the maturity date of bonds held by the Fund taking into consideration any available maturity shortening features.
Effective duration is an approximate measure of the Fund’s sensitivity to interest rate changes taking into consideration any maturity shortening features.
Portfolio holdings and characteristics are subject to change.
For more complete details about the Fund’s investment portfolio, see page 6.
Following the Fund’s fiscal first and third quarter-end, a complete portfolio holdings listing is filed with the SEC on Form N-Q. The form will be available on the SEC’s Web site at sec.gov, and it also may be reviewed and copied at the SEC’s Public Reference Room in Washington, D.C. Information on the operation of the SEC’s Public Reference Room may be obtained by calling (800) SEC-0330. The Fund’s portfolio holdings are also posted on deutschefunds.com from time to time. Please see the Fund’s current prospectus for more information.
| | | | | | |
| | 6 | | | | | | Deutsche Variable Series II — Deutsche Government & Agency Securities VIP |
| | |
| Investment Portfolio | | December 31, 2017 |
| | | | | | | | |
| | | Principal
Amount ($)(a) | | | Value ($) | |
Mortgage-Backed Securities
Pass-Throughs 79.9% | |
Federal Home Loan Mortgage Corp.: | |
3.0%, with various maturities from 9/1/2047 until 1/1/2048 (b) | | | 3,175,532 | | | | 3,176,080 | |
3.5%, 1/1/2048 (b) | | | 1,500,000 | | | | 1,540,391 | |
Federal National Mortgage Association: | |
3.0%, 10/1/2047 | | | 989,643 | | | | 990,147 | |
3.5%, with various maturities from 3/1/2045 until 1/1/2048 (b) | | | 4,883,906 | | | | 5,023,618 | |
Government National Mortgage Association: | |
3.0%, 1/1/2048 (b) | | | 2,900,000 | | | | 2,926,281 | |
3.5%, with various maturities from 4/15/2042 until 1/1/2048 (b) | | | 8,952,364 | | | | 9,285,020 | |
4.0%, with various maturities from 9/20/2040 until 8/15/2047 (b) | | | 3,317,415 | | | | 3,500,974 | |
4.5%, with various maturities from 6/20/2033 until 6/20/2047 | | | 3,345,367 | | | | 3,562,313 | |
4.55%, 1/15/2041 | | | 154,256 | | | | 163,348 | |
4.625%, 5/15/2041 | | | 99,772 | | | | 105,623 | |
5.0%, with various maturities from 12/15/2032 until 8/15/2040 | | | 885,521 | | | | 961,290 | |
5.5%, with various maturities from 1/15/2034 until 6/15/2042 | | | 1,421,926 | | | | 1,580,577 | |
6.0%, with various maturities from 5/20/2034 until 12/20/2038 | | | 401,050 | | | | 451,867 | |
6.5%, with various maturities from 9/15/2036 until 2/15/2039 | | | 326,796 | | | | 369,347 | |
7.0%, with various maturities from 2/20/2027 until 11/15/2038 | | | 97,847 | | | | 100,187 | |
7.5%, 10/20/2031 | | | 3,416 | | | | 3,859 | |
Total Mortgage-Backed Securities Pass-Throughs (Cost $34,006,374) | | | | 33,740,922 | |
|
| Asset-Backed 4.9% | |
| Automobile Receivables 0.4% | |
AmeriCredit Automobile Receivables Trust, “A3”, Series 2017-1, 1.87%, 8/18/2021 | | | 170,000 | | | | 169,455 | |
|
| Credit Card Receivables 0.7% | |
Chase Issuance Trust, “A”, Series 2017-A2, 1-month USD-LIBOR + 0.400%, 1.877%*, 3/15/2024 | | | 300,000 | | | | 301,729 | |
| | | | | | | | |
| | | Principal
Amount ($)(a) | | | Value ($) | |
| Miscellaneous 3.8% | |
Atrium XIII, “A1”, Series 13A, 144A, 3-month USD-LIBOR + 1.180%, 2.621%*, 11/21/2030 | | | 310,000 | | | | 310,181 | |
Carbone CLO Ltd., “A1”, Series 2017-1A, 144A, 3-month USD-LIBOR + 1.140%, 2.809%*, 1/20/2031 | | | 380,000 | | | | 380,148 | |
Domino’s Pizza Master Issuer LLC, “A23”, Series 2017-1A, 144A, 4.118%, 7/25/2047 | | | 448,875 | | | | 458,606 | |
Goldentree Loan Management U.S. CLO Ltd., “A”, Series 2017-2A, 144A, 3-month USD-LIBOR + 1.150%, 2.724%*, 11/28/2030 | | | 450,000 | | | | 451,356 | |
| | | | | | | | |
| | | | | | | | 1,600,291 | |
Total Asset-Backed (Cost $2,058,869) | | | | 2,071,475 | |
|
| Collateralized Mortgage Obligations 22.1% | |
Federal Home Loan Mortgage Corp.: | |
“OA”, Series 3179, Principal Only, Zero Coupon, 7/15/2036 | | | 80,585 | | | | 71,416 | |
“22”, Series 243, Interest Only, 2.589%*, 6/15/2021 | | | 16,070 | | | | 198 | |
“YI”, Series 3936, Interest Only, 3.0%, 6/15/2025 | | | 18,087 | | | | 340 | |
“AI”, Series 4016, Interest Only, 3.0%, 9/15/2025 | | | 413,351 | | | | 17,262 | |
“WI”, Series 3939, Interest Only, 3.0%, 10/15/2025 | | | 124,962 | | | | 4,373 | |
“EI”, Series 3953, Interest Only, 3.0%, 11/15/2025 | | | 194,824 | | | | 6,575 | |
“IO”, Series 3974, Interest Only, 3.0%, 12/15/2025 | | | 78,663 | | | | 4,445 | |
“DI”, Series 4010, Interest Only, 3.0%, 2/15/2027 | | | 68,655 | | | | 5,211 | |
“IK”, Series 4048, Interest Only, 3.0%, 5/15/2027 | | | 766,414 | | | | 70,701 | |
“CZ”, Series 4113, 3.0%, 9/15/2042 | | | 314,642 | | | | 294,297 | |
“PL”, Series 4627, 3.0%, 10/15/2046 | | | 500,000 | | | | 486,898 | |
“IK”, Series 3754, Interest Only, 3.5%, 6/15/2025 | | | 321,530 | | | | 16,727 | |
“PI”, Series 3940, Interest Only, 4.0%, 2/15/2041 | | | 289,976 | | | | 42,897 | |
“C1”, Series 329, Interest Only, 4.0%, 12/15/2041 | | | 855,852 | | | | 161,532 | |
“UA”, Series 4298, 4.0%, 2/15/2054 | | | 76,882 | | | | 76,246 | |
“C32”, Series 303, Interest Only, 4.5%, 12/15/2042 | | | 876,617 | | | | 172,100 | |
“C28”, Series 303, Interest Only, 4.5%, 1/15/2043 | | | 1,044,120 | | | | 226,636 | |
“MI”, Series 3871, Interest Only, 6.0%, 4/15/2040 | | | 42,658 | | | | 3,356 | |
“IJ”, Series 4472, Interest Only, 6.0%, 11/15/2043 | | | 356,720 | | | | 81,864 | |
“A”, Series 172, Interest Only, 6.5%, 1/1/2024 | | | 7,619 | | | | 1,043 | |
The accompanying notes are an integral part of the financial statements.
| | | | |
Deutsche Variable Series II — Deutsche Government & Agency Securities VIP | | | | | 7 |
| | | | | | | | |
| | | Principal
Amount ($)(a) | | | Value ($) | |
“C22”, Series 324, Interest Only, 6.5%, 4/15/2039 | | | 492,382 | | | | 125,211 | |
Federal National Mortgage Association: | |
“DI”, Series 2011-136, Interest Only, 3.0%, 1/25/2026 | | | 67,676 | | | | 3,588 | |
“IB”, Series 2013-35, Interest Only, 3.0%, 4/25/2033 | | | 526,350 | | | | 74,144 | |
“Z”, Series 2013-44, 3.0%, 5/25/2043 | | | 96,441 | | | | 90,444 | |
“HI”, Series 2010-123, Interest Only, 3.5%, 3/25/2024 | | | 23,966 | | | | 188 | |
“KI”, Series 2011-72, Interest Only, 3.5%, 3/25/2025 | | | 55,450 | | | | 230 | |
“IO”, Series 2012-146, Interest Only, 3.5%, 1/25/2043 | | | 1,116,661 | | | | 212,914 | |
“4”, Series 406, Interest Only, 4.0%, 9/25/2040 | | | 215,791 | | | | 42,558 | |
“25”, Series 351, Interest Only, 4.5%, 5/25/2019 | | | 15,922 | | | | 282 | |
“21”, Series 334, Interest Only, 5.0%, 3/25/2018 | | | 10 | | | | 0 | |
“20”, Series 334, Interest Only, 5.0%, 3/25/2018 | | | 28 | | | | 0 | |
“23”, Series 339, Interest Only, 5.0%, 6/25/2018 | | | 1,027 | | | | 3 | |
“26”, Series 381, Interest Only, 5.0%, 12/25/2020 | | | 9,550 | | | | 394 | |
“IO”, Series 2016-26, Interest Only, 5.0%, 5/25/2046 | | | 951,380 | | | | 186,591 | |
“30”, Series 381, Interest Only, 5.5%, 11/25/2019 | | | 41,359 | | | | 1,470 | |
“PI”, Series 2009-14, Interest Only, 5.5%, 3/25/2024 | | | 1,291,661 | | | | 77,282 | |
“UI”, Series 2010-126, Interest Only, 5.5%, 10/25/2040 | | | 379,043 | | | | 75,407 | |
“IO”, Series 2014-70, Interest Only, 5.5%, 10/25/2044 | | | 502,789 | | | | 109,674 | |
“BI”, Series 2015-97, Interest Only, 5.5%, 1/25/2046 | | | 422,543 | | | | 92,878 | |
“WI”, Series 2011-59, Interest Only, 6.0%, 5/25/2040 | | | 67,171 | | | | 3,246 | |
“101”, Series 383, Interest Only, 6.5%, 9/25/2022 | | | 314,297 | | | | 29,701 | |
“YT”, Series 2013-35, 6.5%, 9/25/2032 | | | 543,786 | | | | 622,616 | |
Government National Mortgage Association: | |
“WF”, Series 2015-80, 1-month USD-LIBOR + 0.250%, 1.741%* , 1/16/2044 | | | 1,711,468 | | | | 1,713,585 | |
“PB”, Series 2012-90, 2.5%, 7/20/2042 | | | 515,988 | | | | 460,443 | |
“ZB”, Series 2016-161, 3.0%, 11/20/2046 | | | 842,107 | | | | 800,582 | |
“JI”, Series 2013-10, Interest Only, 3.5%, 1/20/2043 | | | 512,861 | | | | 102,935 | |
“ID”, Series 2013-70, Interest Only, 3.5%, 5/20/2043 | | | 244,486 | | | | 44,922 | |
“BI”, Series 2014-22, Interest Only, 4.0%, 2/20/2029 | | | 430,319 | | | | 40,847 | |
“IP”, Series 2015-50, Interest Only, 4.0%, 9/20/2040 | | | 916,440 | | | | 72,343 | |
“PI”, Series 2015-40, Interest Only, 4.0%, 4/20/2044 | | | 267,923 | | | | 30,957 | |
“LI”, Series 2009-104, Interest Only, 4.5%, 12/16/2018 | | | 13,339 | | | | 121 | |
| | | | | | | | |
| | | Principal
Amount ($)(a) | | | Value ($) | |
“NI”, Series 2010-44, Interest Only, 4.5%, 10/20/2037 | | | 10,295 | | | | 9 | |
“CI”, Series 2010-87, Interest Only, 4.5%, 11/20/2038 | | | 1,251,588 | | | | 65,659 | |
“PI”, Series 2014-108, Interest Only, 4.5%, 12/20/2039 | | | 217,067 | | | | 37,619 | |
“MI”, Series 2010-169, Interest Only, 4.5%, 8/20/2040 | | | 266,082 | | | | 31,356 | |
“IP”, Series 2014-115, Interest Only, 4.5%, 2/20/2044 | | | 148,002 | | | | 27,302 | |
“GZ”, Series 2005-24, 5.0%, 3/20/2035 | | | 632,896 | | | | 727,207 | |
“MZ”, Series 2009-98, 5.0%, 10/16/2039 | | | 1,277,578 | | | | 1,518,363 | |
“AI”, Series 2008-46, Interest Only, 5.5%, 5/16/2023 | | | 15,389 | | | | 331 | |
“GI”, Series 2003-19, Interest Only, 5.5%, 3/16/2033 | | | 337,891 | | | | 65,412 | |
“IB”, Series 2010-130, Interest Only, 5.5%, 2/20/2038 | | | 82,459 | | | | 14,722 | |
“IA”, Series 2012-64, Interest Only, 5.5%, 5/16/2042 | | | 202,447 | | | | 49,085 | |
“DI”, Series 2009-10, Interest Only, 6.0%, 4/16/2038 | | | 127,495 | | | | 19,509 | |
“IP”, Series 2009-118, Interest Only, 6.5%, 12/16/2039 | | | 34,557 | | | | 8,903 | |
“IC”, Series 1997-4, Interest Only, 7.5%, 3/16/2027 | | | 281,457 | | | | 2,085 | |
Total Collateralized Mortgage Obligations
(Cost $8,875,907) | | | | 9,327,235 | |
|
Commercial Mortgage-Backed
Securities 2.7% | |
CHT Mortgage Trust, “A”, Series 2017-CSMO,144A, 1-month USD-LIBOR + 0.880%, 2.31%*, 11/15/2036 | | | 400,000 | | | | 400,623 | |
Fannie Mae Grantor Trust, “A”, Series 2017-T1, 2.898%, 6/25/2027 | | | 499,893 | | | | 496,577 | |
FHLMC Multifamily Structured Pass-Through Securities, “X1”, Series K055, Interest Only, 1.368%*, 3/25/2026 | | | 2,483,267 | | | | 229,097 | |
Total Commercial Mortgage-Backed Securities (Cost $1,128,914) | | | | 1,126,297 | |
|
| Corporate Bond 1.2% | |
| Financials | | | | | | | | |
Bank of Montreal, 144A, 2.5%, 1/11/2022 (Cost $498,554) | | | 500,000 | | | | 499,305 | |
|
| Government & Agency Obligations 11.6% | |
| Sovereign Bonds 2.2% | | | | | | | | |
French Republic Government Bond OAT, 144A, REG S, 1.75%, 5/25/2066 | | | EUR 370,262 | | | | 420,571 | |
Kingdom of Sweden, Series 1053, 3.5%, 3/30/2039 | | | SEK 3,090,000 | | | | 516,874 | |
| | | | | | | | |
| | | | | | | 937,445 | |
The accompanying notes are an integral part of the financial statements.
| | | | | | |
| | 8 | | | | | | Deutsche Variable Series II — Deutsche Government & Agency Securities VIP |
| | | | | | | | |
| | | Principal
Amount ($)(a) | | | Value ($) | |
| U.S. Government Sponsored Agency 5.9% | |
Federal Home Loan Bank, 1.875%, 11/29/2021 | | | 2,500,000 | | | | 2,479,115 | |
|
| U.S. Treasury Obligations 3.5% | |
U.S. Treasury Inflation-Indexed Bond, 0.875%, 2/15/2047 | | | 370,012 | | | | 384,497 | |
U.S. Treasury Note, 2.25%, 11/15/2027 | | | 1,100,000 | | | | 1,084,488 | |
| | | | | | | | |
| | | | | | | | 1,468,985 | |
Total Government & Agency Obligations
(Cost $4,823,676) | | | | 4,885,545 | |
|
| Short-Term U.S. Treasury Obligations 4.4% | |
U.S. Treasury Bills: | | | | | | | | |
1.18% **, 8/16/2018 (c) | | | 880,000 | | | | 871,271 | |
1.378% **, 10/11/2018 (c) (d) | | | 1,000,000 | | | | 986,958 | |
Total Short-Term U.S. Treasury Obligations
(Cost $1,862,624) | | | | 1,858,229 | |
| | | | | | | | |
| | |
| | | Shares | | | Value ($) | |
| Cash Equivalents 0.0% | |
Deutsche Central Cash Management Government Fund, 1.30% (e) (Cost $10,252) | | | 10,252 | | | | 10,252 | |
| | |
| | | % of Net
Assets | | | Value ($) | |
Total Investment Portfolio (Cost $53,265,170) | | | 126.8 | | | | 53,519,260 | |
| Other Assets and Liabilities, Net | | | (26.8 | ) | | | (11,297,006 | ) |
| Net Assets | | | 100.0 | | | | 42,222,254 | |
| * | Variable or floating rate security. These securities are shown at their current rate as of December 31, 2017. For securities based on a published reference rate and spread, the reference rate and spread are indicated within the description above. Certain variable rate securities are not based on a published reference rate and spread but adjust periodically based on current market conditions, prepayment of underlying positions and/or other variables. |
| ** | Annualized yield at time of purchase; not a coupon rate. |
| (a) | Principal amount stated in U.S. dollars unless otherwise noted. |
| (b) | When-issued, delayed delivery or forward commitment securities included. |
| (c) | At December 31, 2017, this security has been pledged, in whole or in part, to cover initial margin requirements for open futures contracts. |
| (d) | At December 31, 2017, this security has been pledged, in whole or in part, to cover initial margin requirements for open centrally cleared swap contracts. |
| (e) | Affiliated fund managed by Deutsche Investment Management Americas Inc. The rate shown is the annualized seven-day yield at period end. |
144A: Security exempt from registration under Rule 144A of the Securities Act of 1933. These securities may be resold in transactions exempt from registration, normally to qualified institutional buyers.
CLO: Collateralized Loan Obligation
Interest Only: Interest Only (IO) bonds represent the “interest only” portion of payments on a pool of underlying mortgages or mortgage-backed securities. IO securities are subject to prepayment risk of the pool of underlying mortgages.
LIBOR: London Interbank Offered Rate
Principal Only: Principal Only (PO) bonds represent the “principal only” portion of payments on a pool of underlying mortgages or mortgage-backed securities.
REG S: Securities sold under Regulation S may not be offered, sold or delivered within the United States or to, or for the account or benefit of, U.S. persons, except pursuant to an exemption from, or in a transaction not subject to, the registration requirements of the Securities Act of 1933.
Included in the portfolio are investments in mortgage or asset-backed securities which are interests in separate pools of mortgages or assets. Effective maturities of these investments may be shorter than stated maturities due to prepayments. Some separate investments in the Federal Home Loan Mortgage Corp., Federal National Mortgage Association and Government National Mortgage Association issues which have similar coupon rates have been aggregated for presentation purposes in this investment portfolio.
At December 31, 2017, open futures contracts purchased were as follows:
| | | | | | | | | | | | | | | | | | | | | | | | |
| Futures | | Currency | | | Expiration
Date | | | Contracts | | | Notional
Amount ($) | | Notional Value ($) | | | Unrealized Appreciation
(Depreciation) ($) | |
| 10 Year U.S. Treasury Note | | | USD | | | | 3/20/2018 | | | | 3 | | | 374,507 | | | 372,141 | | | | (2,366 | ) |
| Ultra 10 Year U.S. Treasury Note | | | USD | | | | 3/20/2018 | | | | 16 | | | 2,133,472 | | | 2,137,000 | | | | 3,528 | |
| Total net unrealized appreciation | | | | 1,162 | |
The accompanying notes are an integral part of the financial statements.
| | | | |
Deutsche Variable Series II — Deutsche Government & Agency Securities VIP | | | | | 9 |
At December 31, 2017, open futures contracts sold were as follows:
| | | | | | | | | | | | | | | | | | | | | | | | |
| Futures | | | Currency | | |
| Expiration
Date |
| | | Contracts | | |
| Notional
Amount ($) |
| |
| Notional
Value ($) |
| |
| Unrealized
Appreciation ($) |
|
| Euro-OAT French Government Bond | | | EUR | | | | 3/8/2018 | | | | 9 | | | | 1,695,265 | | | | 1,675,734 | | | | 19,531 | |
| Federal Republic of Germany Euro-Bund | | | EUR | | | | 3/8/2018 | | | | 8 | | | | 1,563,919 | | | | 1,551,933 | | | | 11,986 | |
| U.S. Treasury Long Bond | | | USD | | | | 3/20/2018 | | | | 5 | | | | 766,357 | | | | 765,000 | | | | 1,357 | |
| Total unrealized appreciation | | | | | | | | | | | | | | | | 32,874 | |
At December 31, 2017, open interest rate swap contracts were as follows:
| | | | | | | | | | | | | | | | | | | | | | | | |
| Centrally Cleared Swaps | |
Cash Flows Paid by
the Fund/Frequency | | Cash Flows Received
by the Fund/Frequency | | Effective/ Expiration Date | | Notional Amount | | | Currency | | | Upfront
Payments Paid ($) | | | Value ($) | | | Unrealized
Appreciation/ (Depreciation) ($) | |
Fixed — 0.228%
Annually | | Floating — 3-Month STIBOR Quarterly | | 7/18/2017
7/18/2021 | | | 16,600,000 | | | | SEK | | | | — | | | | (7,002 | ) | | | (7,002 | ) |
Fixed — 2.239%
Semi-Annually | | Floating — 3-Month LIBOR Quarterly | | 3/21/2018
3/21/2023 | | | 1,700,000 | | | | USD | | | | — | | | | 3,065 | | | | 3,065 | |
Fixed — 2.589%
Semi-Annually | | Floating — 3-Month LIBOR Quarterly | | 3/21/2018
3/21/2038 | | | 400,000 | | | | USD | | | | — | | | | (3,142 | ) | | | (3,142 | ) |
Fixed — 1.698%
Semi-Annually | | Floating — 3-Month LIBOR Quarterly | | 12/20/2017
12/20/2019 | | | 5,700,000 | | | | USD | | | | — | | | | 40,066 | | | | 40,066 | |
Fixed — 2.34%
Semi-Annually | | Floating — 3-Month LIBOR Quarterly | | 12/20/2017
12/20/2027 | | | 1,300,000 | | | | USD | | | | 1,682 | | | | 5,920 | | | | 4,238 | |
Fixed — 2.45%
Semi-Annually | | Floating — 3-Month LIBOR Quarterly | | 12/20/2017
12/20/2032 | | | 1,100,000 | | | | USD | | | | — | | | | 4,658 | | | | 4,658 | |
Fixed — 2.522%
Semi-Annually | | Floating — 3-Month LIBOR Quarterly | | 12/20/2017
12/20/2037 | | | 700,000 | | | | USD | | | | — | | | | 420 | | | | 420 | |
| Total net unrealized appreciation | | | | | | | | | | | | | | | | | | | 42,303 | |
LIBOR: London Interbank Offered Rate; 3-Month LIBOR rate at December 31, 2017 is 1.694%. STIBOR: Stockholm Interbank Offered Rate 3-Month; STIBOR rate at December 31, 2017 is -0.47%.
At December 31, 2017, open total return swap contracts were as follows:
| | | | | | | | | | | | | | | | | | | | | | | | | | | | |
| Bilateral Swaps | | | | | | | | | | | | | | | | | | | | | |
Pay/Receive Return of the
Reference Index | | Fixed Cash
Flows
Received/
Frequency | | | Counterparty/
Expiration Date | | | Notional
Amount | | | Currency | | | Upfront
Payments
Paid ($) | | | Value ($) | | | Unrealized
Appreciation ($) | |
Long Positions | | | | | | | | | | | | | | | | | | | | | | | | | | | | |
| Markit IOS INDEX FN30.400.10 | | | 4.0%/Monthly | | |
| Goldman Sachs & Co.
1/12/2041 |
| | | 401,623 | | | | USD | | | | — | | | | 480 | | | | 480 | |
The accompanying notes are an integral part of the financial statements.
| | | | | | |
| | 10 | | | | | | Deutsche Variable Series II — Deutsche Government & Agency Securities VIP |
As of December 31, 2017, the Fund had the following open forward foreign currency contracts:
| | | | | | | | | | | | | | | | | | | | | | | | |
| Contracts to Deliver | | | In Exchange For | | | Settlement
Date | | | Unrealized
Appreciation ($) | | | Counterparty | |
| USD | | | 1,036,536 | | | | EUR | | | | 879,000 | | | | 1/4/2018 | | | | 18,383 | | | | Citigroup, Inc. | |
| SEK | | | 4,185,000 | | | | USD | | | | 518,452 | | | | 1/18/2018 | | | | 7,696 | | | | Danske Bank AS | |
| USD | | | 929,103 | | | | EUR | | | | 796,031 | | | | 1/24/2018 | | | | 27,459 | | | | JPMorgan Chase Securities, Inc. | |
| CAD | | | 526,422 | | | | NZD | | | | 600,000 | | | | 1/30/2018 | | | | 6,057 | | | | Canadian Imperial Bank of Commerce | |
| Total unrealized appreciation | | | | | | | | 59,595 | | | | | |
| | | | |
| Contracts to Deliver | | | In Exchange For | | | Settlement
Date | | | Unrealized
Depreciation ($) | | | Counterparty | |
| EUR | | | 879,000 | | | | USD | | | | 1,038,007 | | | | 1/4/2018 | | | | (16,912 | ) | | | Citigroup, Inc. | |
| EUR | | | 348,000 | | | | USD | | | | 412,509 | | | | 1/24/2018 | | | | (5,670 | ) | | | HSBC Holdings PLC | |
| EUR | | | 789,719 | | | | USD | | | | 935,688 | | | | 1/24/2018 | | | | (13,290 | ) | | | JPMorgan Chase Securities, Inc. | |
| Total unrealized depreciation | | | | | | | | (35,872 | ) | | | | |
Currency Abbreviations
For information on the Fund’s policy and additional disclosures regarding futures contracts, interest rate swap contracts, total return swap contracts and forward foreign currency contracts, please refer to the Derivatives section of Note A in the accompanying Notes to Financial Statements.
Fair Value Measurements
Various inputs are used in determining the value of the Fund’s investments. These inputs are summarized in three broad levels. Level 1 includes quoted prices in active markets for identical securities. Level 2 includes other significant observable inputs (including quoted prices for similar securities, interest rates, prepayment speeds and credit risk). Level 3 includes significant unobservable inputs (including the Fund’s own assumptions in determining the fair value of investments). The level assigned to the securities valuations may not be an indication of the risk or liquidity associated with investing in those securities.
The following is a summary of the inputs used as of December 31, 2017 in valuing the Fund’s investments. For information on the Fund’s policy regarding the valuation of investments, please refer to the Security Valuation section of Note A in the accompanying Notes to Financial Statements.
| | | | | | | | | | | | | | | | |
| Assets | | Level 1 | | | Level 2 | | | Level 3 | | | Total | |
| Fixed Income Investments (f) | | | | | | | | | | | | | | | | |
Mortgage-Backed Securities Pass-Throughs | | $ | — | | | $ | 33,740,922 | | | $ | — | | | $ | 33,740,922 | |
Asset-Backed | | | — | | | | 2,071,475 | | | | — | | | | 2,071,475 | |
Collateralized Mortgage Obligations | | | — | | | | 9,327,235 | | | | — | | | | 9,327,235 | |
Commercial Mortgage-Backed Securities | | | — | | | | 1,126,297 | | | | — | | | | 1,126,297 | |
Corporate Bond | | | — | | | | 499,305 | | | | — | | | | 499,305 | |
Government & Agency Obligations | | | — | | | | 4,885,545 | | | | — | | | | 4,885,545 | |
Short-Term U.S. Treasury Obligations | | | — | | | | 1,858,229 | | | | — | | | | 1,858,229 | |
| Short-Term Investments | | | 10,252 | | | | — | | | | — | | | | 10,252 | |
| Derivatives (g) | | | | | | | | | | | | | | | | |
Futures Contracts | | | 36,402 | | | | — | | | | — | | | | 36,402 | |
Interest Rate Swap Contracts | | | — | | | | 52,447 | | | | — | | | | 52,447 | |
Total Return Swap Contracts | | | — | | | | 480 | | | | — | | | | 480 | |
Forward Foreign Currency Contracts | | | — | | | | 59,595 | | | | — | | | | 59,595 | |
| Total | | $ | 46,654 | | | $ | 53,621,530 | | | $ | — | | | $ | 53,668,184 | |
| | | | |
| Liabilities | | Level 1 | | | Level 2 | | | Level 3 | | | Total | |
| Derivatives (g) | | | | | | | | | | | | | | | | |
Futures Contracts | | $ | (2,366 | ) | | $ | — | | | $ | — | | | $ | (2,366 | ) |
Interest Rate Swap Contracts | | | — | | | | (10,144 | ) | | | — | | | | (10,144 | ) |
Forward Foreign Currency Contracts | | | — | | | | (35,872 | ) | | | — | | | | (35,872 | ) |
| Total | | $ | (2,366 | ) | | $ | (46,016 | ) | | $ | — | | | $ | (48,382 | ) |
There have been no transfers between fair value measurement levels during the year ended December 31, 2017.
| (f) | See Investment Portfolio for additional detailed categorizations. |
| (g) | Derivatives include unrealized appreciation (depreciation) on open futures contracts, interest rate swap contracts, total return swap contracts and forward foreign currency contracts. |
The accompanying notes are an integral part of the financial statements.
| | | | |
Deutsche Variable Series II — Deutsche Government & Agency Securities VIP | | | | | 11 |
Statement of Assets and Liabilities
| | | | |
| as of December 31, 2017 | | | | |
| |
| Assets | | | | |
| Investments in non-affiliated securities, at value (cost $53,254,918) | | $ | 53,509,008 | |
| Investment in Deutsche Central Cash Management Government Fund (cost $10,252) | | | 10,252 | |
| Cash | | | 1,887,920 | |
| Foreign currency, at value (cost $23,582) | | | 23,641 | |
| Receivable for investments sold — forward commitments | | | 5,204,018 | |
| Receivable for Fund shares sold | | | 9,251 | |
| Interest receivable | | | 253,428 | |
| Receivable for variation margin on futures contracts | | | 20,008 | |
| Unrealized appreciation on bilateral swap contracts | | | 480 | |
| Unrealized appreciation on forward foreign currency exchange contracts | | | 59,595 | |
| Other assets | | | 1,106 | |
| Total assets | | | 60,978,707 | |
| |
| Liabilities | | | | |
| Payable for investments purchased — forward commitments | | | 17,516,123 | |
| Line of credit loan payable | | | 1,050,000 | |
| Payable for Fund shares redeemed | | | 6,478 | |
| Payable for variation margin on centrally cleared swaps | | | 24,267 | |
| Unrealized depreciation on forward foreign currency exchange contracts | | | 35,872 | |
| Accrued management fee | | | 7,196 | |
| Accrued Trustees’ fees | | | 1,569 | |
| Other accrued expenses and payables | | | 114,948 | |
| Total liabilities | | | 18,756,453 | |
| Net assets, at value | | $ | 42,222,254 | |
| |
| Net Assets Consist of | | | | |
| Undistributed net investment income | | | 1,051,322 | |
| Unrealized appreciation (depreciation) on: | | | | |
Investments | | | 254,090 | |
Swap contracts | | | 42,783 | |
Futures | | | 34,036 | |
Foreign currency | | | 231 | |
Forward foreign currency contracts | | | 23,723 | |
| Accumulated net realized gain (loss) | | | (65,240 | ) |
| Paid-in capital | | | 40,881,309 | |
| Net assets, at value | | $ | 42,222,254 | |
Class A | | | | |
| Net Asset Value, offering and redemption price per share ($40,373,381 ÷ 3,619,812 outstanding shares of beneficial interest, no par value, unlimited number of shares authorized) | | $ | 11.15 | |
Class B | | | | |
| Net Asset Value, offering and redemption price per share ($1,848,873 ÷ 165,975 outstanding shares of beneficial interest, no par value, unlimited number of shares authorized) | | $ | 11.14 | |
Statement of Operations
| | | | |
| for the year ended December 31, 2017 | | | | |
| |
| Investment Income | | | | |
| Income: | | | | |
| Interest | | $ | 1,256,209 | |
| Income distributions — Deutsche Central Cash Management Government Fund | | | 36,267 | |
| Securities lending income, net of borrower rebates | | | 78 | |
| Total income | | | 1,292,554 | |
| Expenses: | | | | |
| Management fee | | | 220,390 | |
| Administration fee | | | 48,976 | |
| Services to shareholders | | | 801 | |
| Record keeping fees (Class B) | | | 2,047 | |
| Distribution service fees (Class B) | | | 5,337 | |
| Custodian fee | | | 24,284 | |
| Professional fees | | | 83,328 | |
| Reports to shareholders | | | 20,469 | |
| Trustees’ fees and expenses | | | 4,712 | |
| Interest expense | | | 510 | |
| Other | | | 20,335 | |
| Total expenses before expense reductions | | | 431,189 | |
| Expense reductions | | | (126,723 | ) |
| Total expenses after expense reductions | | | 304,466 | |
| Net investment income | | | 988,088 | |
| |
| Realized and Unrealized Gain (Loss) | | | | |
| Net realized gain (loss) from: | | | | |
| Investments | | | 1,268,050 | |
| Swap contracts | | | (116,392 | ) |
| Futures | | | (316,318 | ) |
| Forward foreign currency contracts | | | 17,199 | |
| Foreign currency | | | (1,221 | ) |
| Payments by affiliates (see Note G) | | | 480 | |
| | | | 851,798 | |
| Change in net unrealized appreciation (depreciation) on: | | | | |
| Investments | | | (1,172,326 | ) |
| Swap contracts | | | 148,395 | |
| Futures | | | 25,841 | |
| Forward foreign currency contracts | | | 18,968 | |
| Foreign currency | | | 101 | |
| | | | (979,021 | ) |
| Net gain (loss) | | | (127,223 | ) |
| Net increase (decrease) in net assets resulting from operations | | $ | 860,865 | |
The accompanying notes are an integral part of the financial statements.
| | | | | | |
| | 12 | | | | | | Deutsche Variable Series II — Deutsche Government & Agency Securities VIP |
Statements of Changes in Net Assets
| | | | | | | | |
| | | Years Ended December 31, | |
| Increase (Decrease) in Net Assets | | 2017 | | | 2016 | |
| Operations: | | | | | | | | |
| Net investment income | | $ | 988,088 | | | $ | 1,359,001 | |
| Net realized gain (loss) | | | 851,798 | | | | (370,572 | ) |
| Change in net unrealized appreciation (depreciation) | | | (979,021 | ) | | | (170,481 | ) |
| Net increase (decrease) in net assets resulting from operations | | | 860,865 | | | | 817,948 | |
| Distributions to shareholders from: | | | | | | | | |
| Net investment income: | | | | | | | | |
Class A | | | (1,241,081 | ) | | | (1,846,498 | ) |
Class B | | | (46,826 | ) | | | (72,152 | ) |
| Total distributions | | | (1,287,907 | ) | | | (1,918,650 | ) |
| Fund share transactions: | | | | | | | | |
Class A | | | | | | | | |
| Proceeds from shares sold | | | 3,259,096 | | | | 2,898,041 | |
| Reinvestment of distributions | | | 1,241,081 | | | | 1,846,498 | |
| Payments for shares redeemed | | | (15,457,312 | ) | | | (18,364,955 | ) |
| Net increase (decrease) in net assets from Class A share transactions | | | (10,957,135 | ) | | | (13,620,416 | ) |
Class B | | | | | | | | |
| Proceeds from shares sold | | | 67,053 | | | | 226,087 | |
| Reinvestment of distributions | | | 46,826 | | | | 72,152 | |
| Payments for shares redeemed | | | (642,815 | ) | | | (503,123 | ) |
| Net increase (decrease) in net assets from Class B share transactions | | | (528,936 | ) | | | (204,884 | ) |
| Increase (decrease) in net assets | | | (11,913,113 | ) | | | (14,926,002 | ) |
| Net assets at beginning of period | | | 54,135,367 | | | | 69,061,369 | |
| Net assets at end of period (including undistributed net investment income of $1,051,322 and $1,284,868, respectively) | | $ | 42,222,254 | | | $ | 54,135,367 | |
| | |
| Other Information | | | | | | | | |
Class A | | | | | | | | |
| Shares outstanding at beginning of period | | | 4,598,638 | | | | 5,786,470 | |
| Shares sold | | | 291,446 | | | | 253,037 | |
| Shares issued to shareholders in reinvestment of distributions | | | 112,315 | | | | 163,697 | |
| Shares redeemed | | | (1,382,587 | ) | | | (1,604,566 | ) |
| Net increase (decrease) in Class A shares | | | (978,826 | ) | | | (1,187,832 | ) |
| Shares outstanding at end of period | | | 3,619,812 | | | | 4,598,638 | |
Class B | | | | | | | | |
| Shares outstanding at beginning of period | | | 213,112 | | | | 231,100 | |
| Shares sold | | | 6,013 | | | | 19,740 | |
| Shares issued to shareholders in reinvestment of distributions | | | 4,234 | | | | 6,391 | |
| Shares redeemed | | | (57,384 | ) | | | (44,119 | ) |
| Net increase (decrease) in Class B shares | | | (47,137 | ) | | | (17,988 | ) |
| Shares outstanding at end of period | | | 165,975 | | | | 213,112 | |
The accompanying notes are an integral part of the financial statements.
| | | | |
Deutsche Variable Series II — Deutsche Government & Agency Securities VIP | | | | | 13 |
Financial Highlights
| | | | | | | | | | | | | | | | | | | | |
| | | Years Ended December 31, | |
| Class A | | 2017 | | | 2016 | | | 2015 | | | 2014 | | | 2013 | |
| | | | | |
| Selected Per Share Data | | | | | | | | | | | | | | | | | | | | |
| Net asset value, beginning of period | | $ | 11.25 | | | $ | 11.48 | | | $ | 11.80 | | | $ | 11.47 | | | $ | 12.69 | |
| Income (loss) from investment operations: | | | | | | | | | | | | | | | | | | | | |
Net investment incomea | | | .23 | | | | .25 | | | | .27 | | | | .29 | | | | .24 | |
Net realized and unrealized gain (loss) | | | (.04 | ) | | | (.13 | ) | | | (.26 | ) | | | .31 | | | | (.59 | ) |
Total from investment operations | | | .19 | | | | .12 | | | | .01 | | | | .60 | | | | (.35 | ) |
| Less distributions from: | | | | | | | | | | | | | | | | | | | | |
Net investment income | | | (.29 | ) | | | (.35 | ) | | | (.33 | ) | | | (.27 | ) | | | (.37 | ) |
Net realized gains | | | — | | | | — | | | | — | | | | — | | | | (.50 | ) |
Total distributions | | | (.29 | ) | | | (.35 | ) | | | (.33 | ) | | | (.27 | ) | | | (.87 | ) |
| Net asset value, end of period | | $ | 11.15 | | | $ | 11.25 | | | $ | 11.48 | | | $ | 11.80 | | | $ | 11.47 | |
| Total Return (%)b | | | 1.67 | | | | 1.06 | | | | .06 | | | | 5.29 | | | | (3.04 | ) |
| | | | | |
| Ratios to Average Net Assets and Supplemental Data | | | | | | | | | | | | | | | | | | | | |
| Net assets, end of period ($ millions) | | | 40 | | | | 52 | | | | 66 | | | | 87 | | | | 96 | |
| Ratio of expenses before expense reductions (%)c | | | .87 | | | | .86 | | | | .74 | | | | .72 | | | | .71 | |
| Ratio of expenses after expense reductions (%)c | | | .61 | | | | .58 | | | | .68 | | | | .70 | | | | .67 | |
| Ratio of net investment income (%) | | | 2.03 | | | | 2.22 | | | | 2.33 | | | | 2.49 | | | | 2.05 | |
| Portfolio turnover rate (%) | | | 588 | | | | 521 | | | | 376 | | | | 393 | | | | 794 | |
| a | Based on average shares outstanding during the period. |
| b | Total return would have been lower had certain expenses not been reduced. |
| c | Expense ratio does not reflect charges and fees associated with the separate account that invests in the Fund or any variable life insurance policy or variable annuity contract for which the Fund is an investment option. |
| | | | | | | | | | | | | | | | | | | | |
| | | Years Ended December 31, | |
| Class B | | 2017 | | | 2016 | | | 2015 | | | 2014 | | | 2013 | |
| | | | | |
| Selected Per Share Data | | | | | | | | | | | | | | | | | | | | |
| Net asset value, beginning of period | | $ | 11.24 | | | $ | 11.46 | | | $ | 11.79 | | | $ | 11.46 | | | $ | 12.67 | |
| Income (loss) from investment operations: | | | | | | | | | | | | | | | | | | | | |
Net investment incomea | | | .19 | | | | .21 | | | | .23 | | | | .25 | | | | .20 | |
Net realized and unrealized gain (loss) | | | (.04 | ) | | | (.12 | ) | | | (.27 | ) | | | .31 | | | | (.59 | ) |
Total from investment operations | | | .15 | | | | .09 | | | | (.04 | ) | | | .56 | | | | (.39 | ) |
| Less distributions from: | | | | | | | | | | | | | | | | | | | | |
Net investment income | | | (.25 | ) | | | (.31 | ) | | | (.29 | ) | | | (.23 | ) | | | (.32 | ) |
Net realized gains | | | — | | | | — | | | | — | | | | — | | | | (.50 | ) |
Total distributions | | | (.25 | ) | | | (.31 | ) | | | (.29 | ) | | | (.23 | ) | | | (.82 | ) |
| Net asset value, end of period | | $ | 11.14 | | | $ | 11.24 | | | $ | 11.46 | | | $ | 11.79 | | | $ | 11.46 | |
| Total Return (%)b | | | 1.31 | | | | .79 | | | | (.36 | ) | | | 4.95 | | | | (3.25 | ) |
| | | | | |
| Ratios to Average Net Assets and Supplemental Data | | | | | | | | | | | | | | | | | | | | |
| Net assets, end of period ($ millions) | | | 2 | | | | 2 | | | | 3 | | | | 3 | | | | 4 | |
| Ratio of expenses before expense reductions (%)c | | | 1.21 | | | | 1.21 | | | | 1.09 | | | | 1.06 | | | | 1.06 | |
| Ratio of expenses after expense reductions (%)c | | | .95 | | | | .93 | | | | 1.03 | | | | 1.03 | | | | .99 | |
| Ratio of net investment income (%) | | | 1.69 | | | | 1.88 | | | | 1.99 | | | | 2.16 | | | | 1.71 | |
| Portfolio turnover rate (%) | | | 588 | | | | 521 | | | | 376 | | | | 393 | | | | 794 | |
| a | Based on average shares outstanding during the period. |
| b | Total return would have been lower had certain expenses not been reduced. |
| c | Expense ratio does not reflect charges and fees associated with the separate account that invests in the Fund or any variable life insurance policy or variable annuity contract for which the Fund is an investment option. |
The accompanying notes are an integral part of the financial statements.
| | | | | | |
| | 14 | | | | | | Deutsche Variable Series II — Deutsche Government & Agency Securities VIP |
Notes to Financial Statements
A. Organization and Significant Accounting Policies
Deutsche Government & Agency Securities VIP (the “Fund”) is a diversified series of Deutsche Variable Series II (the “Trust”), which is registered under the Investment Company Act of 1940, as amended (the “1940 Act”), as an open-end management investment company organized as a Massachusetts business trust.
Multiple Classes of Shares of Beneficial Interest. The Fund offers two classes of shares (Class A shares and Class B shares). Sales of Class B shares are subject to recordkeeping fees up to 0.15% and Rule 12b-1 fees under the 1940 Act equal to an annual rate of 0.25% of the average daily net assets of the Class B shares of the Fund. Class A shares are not subject to such fees.
Investment income, realized and unrealized gains and losses, and certain fund-level expenses and expense reductions, if any, are borne pro rata on the basis of relative net assets by the holders of all classes of shares except that each class bears certain expenses unique to that class (including the applicable Rule 12b-1 fee and recordkeeping fees). Differences in class-level expenses may result in payment of different per share dividends by class. All shares have equal rights with respect to voting subject to class-specific arrangements.
The Fund’s financial statements are prepared in accordance with accounting principles generally accepted in the United States of America (“U.S. GAAP”) which require the use of management estimates. Actual results could differ from those estimates. The Fund qualifies as an investment company under Topic 946 of Accounting Standards Codification of U.S. GAAP. The policies described below are followed consistently by the Fund in the preparation of its financial statements.
Security Valuation. Investments are stated at value determined as of the close of regular trading on the New York Stock Exchange on each day the exchange is open for trading.
Various inputs are used in determining the value of the Fund’s investments. These inputs are summarized in three broad levels. Level 1 includes quoted prices in active markets for identical securities. Level 2 includes other significant observable inputs (including quoted prices for similar securities, interest rates, prepayment speeds and credit risk). Level 3 includes significant unobservable inputs (including the Fund’s own assumptions in determining the fair value of investments). The level assigned to the securities valuations may not be an indication of the risk or liquidity associated with investing in those securities.
Debt securities are valued at prices supplied by independent pricing services approved by the Fund’s Board. Such services may use various pricing techniques which take into account appropriate factors such as yield, quality, coupon rate, maturity, type of issue, trading characteristics, prepayment speeds and other data, as well as broker quotes. If the pricing services are unable to provide valuations, debt securities are valued at the average of the most recent reliable bid quotations or evaluated prices, as applicable, obtained from broker-dealers. These securities are generally categorized as Level 2.
Investments in open-end investment companies are valued at their net asset value each business day and are categorized as Level 1.
Futures contracts are generally valued at the settlement prices established each day on the exchange on which they are traded and are categorized as Level 1.
Forward currency contracts are valued at the prevailing forward exchange rate of the underlying currencies and are categorized as Level 2.
Swap contracts are valued daily based upon prices supplied by a Board approved pricing vendor, if available, and otherwise are valued at the price provided by the broker-dealer. Swap contracts are generally categorized as Level 2.
Securities and other assets for which market quotations are not readily available or for which the above valuation procedures are deemed not to reflect fair value are valued in a manner that is intended to reflect their fair value as determined in accordance with procedures approved by the Board and are generally categorized as Level 3. In accordance with the Fund’s valuation procedures, factors considered in determining value may include, but are not limited to, the type of the security; the size of the holding; the initial cost of the security; the existence of any contractual restrictions on the security’s disposition; the price and extent of public trading in similar securities of the issuer or of comparable companies; quotations or evaluated prices from broker-dealers and/or pricing services; information obtained from the issuer, analysts, and/or the appropriate stock exchange (for exchange-traded securities); an analysis of the company’s or issuer’s financial statements; an evaluation of the forces that influence the issuer and the market(s) in which
| | | | |
Deutsche Variable Series II — Deutsche Government & Agency Securities VIP | | | | | 15 |
the security is purchased and sold; and with respect to debt securities, the maturity, coupon, creditworthiness, currency denomination and the movement of the market in which the security is normally traded. The value determined under these procedures may differ from published values for the same securities.
Disclosure about the classification of fair value measurements is included in a table following the Fund’s Investment Portfolio.
Foreign Currency Translations. The books and records of the Fund are maintained in U.S. dollars. Investment securities and other assets and liabilities denominated in a foreign currency are translated into U.S. dollars at the prevailing exchange rates at period end. Purchases and sales of investment securities, income and expenses are translated into U.S. dollars at the prevailing exchange rates on the respective dates of the transactions.
Net realized and unrealized gains and losses on foreign currency transactions represent net gains and losses between trade and settlement dates on securities transactions, the acquisition and disposition of foreign currencies, and the difference between the amount of net investment income accrued and the U.S. dollar amount actually received. The portion of both realized and unrealized gains and losses on investments that results from fluctuations in foreign currency exchange rates is not separately disclosed but is included with net realized and unrealized gain/appreciation and loss/depreciation on investments.
Securities Lending. Deutsche Bank AG, as lending agent, lends securities of the Fund to certain financial institutions under the terms of its securities lending agreement. During the term of the loans, the Fund continues to receive interest and dividends generated by the securities and to participate in any changes in their market value. The Fund requires the borrowers of the securities to maintain collateral with the Fund consisting of either cash or liquid, unencumbered assets having a value at least equal to the value of the securities loaned. When the collateral falls below specified amounts, the lending agent will use its best effort to obtain additional collateral on the next business day to meet required amounts under the securities lending agreement. During the year ended December 31, 2017, the Fund invested the cash collateral into a joint trading account in affiliated money market funds, including Deutsche Government & Agency Securities Portfolio, managed by Deutsche Investment Management Americas Inc. Deutsche Investment Management Americas Inc. receives a management/administration fee (0.13% annualized effective rate as of December 31, 2017) on the cash collateral invested in Deutsche Government & Agency Securities Portfolio. The Fund receives compensation for lending its securities either in the form of fees or by earning interest on invested cash collateral net of borrower rebates and fees paid to a lending agent. Either the Fund or the borrower may terminate the loan at any time, and the borrower, after notice, is required to return borrowed securities within a standard time period. There may be risks of delay and costs in recovery of securities or even loss of rights in the collateral should the borrower of the securities fail financially. If the Fund is not able to recover securities lent, the Fund may sell the collateral and purchase a replacement investment in the market, incurring the risk that the value of the replacement security is greater than the value of the collateral. The Fund is also subject to all investment risks associated with the reinvestment of any cash collateral received, including, but not limited to, interest rate, credit and liquidity risk associated with such investments.
As of December 31, 2017, the Fund had no securities on loan.
Forward Commitments. The Fund may purchase or sell securities on a when-issued, delayed delivery or forward commitment basis with delivery or payment to occur at a later date beyond the normal settlement period. At the time the Fund enters into a commitment to purchase or sell a security, the transaction is recorded and the value of the transaction is reflected in the net asset value. The price of such security and the date when the security will be delivered and paid for are fixed at the time the transaction is negotiated. The Fund may sell the forward commitment security before the settlement date or enter into a new commitment to extend the delivery date into the future. The value of the security may vary with market fluctuations. At the time the Fund enters into a purchase transaction it is required to segregate cash or other liquid assets at least equal to the amount of the commitment. Additionally, the Fund or the counterparty may be required to post securities and/or cash collateral in accordance with the terms of the commitment.
Certain risks may arise upon entering into when-issued, delayed delivery or forward commitment transactions from the potential inability of counterparties to meet the terms of their contracts or if the issuer does not issue the securities due to political, economic or other factors. Such transactions may also have the effect of leverage on the Fund and may cause the Fund to be more volatile. Additionally, losses may arise due to changes in the value of the underlying securities.
Federal Income Taxes. The Fund’s policy is to comply with the requirements of the Internal Revenue Code, as amended, which are applicable to regulated investment companies and to distribute all of its taxable income to its shareholders.
| | | | | | |
| | 16 | | | | | | Deutsche Variable Series II — Deutsche Government & Agency Securities VIP |
At December 31, 2017, the Fund had net tax basis capital loss carryforwards of approximately $29,000 of short-term losses, which may be applied against realized net taxable capital gains indefinitely.
The Fund has reviewed the tax positions for the open tax years as of December 31, 2017 and has determined that no provision for income tax and/or uncertain tax positions is required in the Fund’s financial statements. The Fund’s federal tax returns for the prior three fiscal years remain open subject to examination by the Internal Revenue Service.
Distribution of Income and Gains. Distributions from net investment income of the Fund, if any, are declared and distributed to shareholders annually. Net realized gains from investment transactions, in excess of available capital loss carryforwards, would be taxable to the Fund if not distributed and, therefore, will be distributed to shareholders at least annually. The Fund may also make additional distributions for tax purposes if necessary.
The timing and characterization of certain income and capital gain distributions are determined annually in accordance with federal tax regulations which may differ from accounting principles generally accepted in the United States of America. These differences primarily relate to investments in futures contracts, investments in swap contracts, forward currency contracts and certain securities sold at a loss. As a result, net investment income (loss) and net realized gain (loss) on investment transactions for a reporting period may differ significantly from distributions during such period. Accordingly, the Fund may periodically make reclassifications among certain of its capital accounts without impacting the net asset value of the Fund.
At December 31, 2017, the Fund’s components of distributable earnings on a tax basis were as follows:
| | | | |
| Undistributed ordinary income* | | $ | 1,070,799 | |
| Capital loss carryforward | | $ | (29,000 | ) |
| Unrealized appreciation (depreciation) on investments | | $ | 299,145 | |
At December 31, 2017, the aggregate cost of investments for federal income tax purposes was $53,267,143. The net unrealized appreciation for all investments based on tax cost was $299,145. This consisted of aggregate gross unrealized appreciation for all investments in which there was an excess of value over tax cost of $973,045 and aggregate gross unrealized depreciation for all investments in which there was an excess of tax cost over value of $673,900.
In addition, the tax character of distributions paid by the Fund is summarized as follows:
| | | | | | | | |
| | | Years Ended December 31, | |
| | | 2017 | | | 2016 | |
| Distributions from ordinary income* | | $ | 1,287,907 | | | $ | 1,918,650 | |
| * | For tax purposes, short-term capital gain distributions are considered ordinary income distributions. |
Expenses. Expenses of the Trust arising in connection with a specific fund are allocated to that fund. Other Trust expenses which cannot be directly attributed to a fund are apportioned among the funds in the Trust based upon the relative net assets or other appropriate measures.
Contingencies. In the normal course of business, the Fund may enter into contracts with service providers that contain general indemnification clauses. The Fund’s maximum exposure under these arrangements is unknown, as this would involve future claims that may be made against the Fund that have not yet been made. However, based on experience, the Fund expects the risk of loss to be remote.
Other. Investment transactions are accounted for on a trade date plus one basis for daily net asset value calculations. However, for financial reporting purposes, investment transactions are reported on trade date. Interest income is recorded on the accrual basis. Realized gains and losses from investment transactions are recorded on an identified cost basis. All discounts and premiums are accreted/amortized for both tax and financial reporting purposes for the Fund.
B. Derivative Instruments
Swaps. A swap is a contract between two parties to exchange future cash flows at periodic intervals based on the notional amount of the swap. A bilateral swap is a transaction between the Fund and a counterparty where cash flows are exchanged between the two parties. A centrally cleared swap is a transaction executed between the Fund and a counterparty, then cleared by a clearing member through a central clearinghouse. The central clearinghouse serves as the counterparty, with whom the Fund exchanges cash flows.
The value of a swap is adjusted daily, and the change in value, if any, is recorded as unrealized appreciation or depreciation in the Statement of Assets and Liabilities. Gains or losses are realized when the swap expires or is closed. Certain risks may arise when entering into swap transactions including counterparty default; liquidity; or unfavorable changes in interest rates or the value of the underlying reference security, commodity or index. In
| | | | |
Deutsche Variable Series II — Deutsche Government & Agency Securities VIP | | | | | 17 |
connection with bilateral swaps, securities and/or cash may be identified as collateral in accordance with the terms of the swap agreement to provide assets of value and recourse in the event of default. The maximum counterparty credit risk is the net present value of the cash flows to be received from or paid to the counterparty over the term of the swap, to the extent that this amount is beneficial to the Fund, in addition to any related collateral posted to the counterparty by the Fund. This risk may be partially reduced by a master netting arrangement between the Fund and the counterparty. Upon entering into a centrally cleared swap, the Fund is required to deposit with a financial intermediary cash or securities (“initial margin”) in an amount equal to a certain percentage of the notional amount of the swap. Subsequent payments (“variation margin”) are made or received by the Fund dependent upon the daily fluctuations in the value of the swap. In a cleared swap transaction, counterparty risk is minimized as the central clearinghouse acts as the counterparty.
An upfront payment, if any, made by the Fund is recorded as an asset in the Statement of Assets and Liabilities. An upfront payment, if any, received by the Fund is recorded as a liability in the Statement of Assets and Liabilities. Payments received or made at the end of the measurement period are recorded as realized gain or loss in the Statement of Operations.
Total Return Swap Contracts. Total return swaps involve commitments to pay interest in exchange for a market-linked return based on a notional amount. One counterparty pays out the total return of the reference security or index underlying the total return swap, and in return receives a fixed or variable rate. As a receiver, the Fund would receive payments based on any positive total return and would owe payments in the event of a negative total return. As the payer, the Fund would owe payments on any net positive total return, and would receive payments in the event of a negative total return. For the year ended December 31, 2017, the Fund entered into total return swap transactions as a means of gaining exposure to a particular asset class without investing directly in such asset class.
A summary of the open total return swap contracts as of December 31, 2017 is included in a table following the Fund’s Investment Portfolio. For the year ended December 31, 2017, the investment in total return swap contracts had a total notional amount generally indicative of a range from $402,000 to $963,000.
Interest Rate Swaps. Interest rate swaps are agreements in which the Fund agrees to pay to the counterparty a fixed rate payment in exchange for the counterparty agreeing to pay to the Fund a variable rate payment, or the Fund agrees to receive from the counterparty a fixed rate payment in exchange for the counterparty agreeing to receive from the Fund a variable rate payment. The payment obligations are based on the notional amount of the swap. For the year ended December 31, 2017, the Fund entered into interest rate swap agreements to gain exposure to different parts of the yield curve while managing overall duration and for non-hedging purposes to seek to enhance potential gains.
A summary of the open interest rate swap contracts as of December 31, 2017 is included in a table following the Fund’s Investment Portfolio. For the year ended December 31, 2017, the investment in interest rate swap contracts had a total USD equivalent notional amount generally indicative of a range from $2,396,000 to $13,364,000.
Futures Contracts. A futures contract is an agreement between a buyer or seller and an established futures exchange or its clearinghouse in which the buyer or seller agrees to take or make a delivery of a specific amount of a financial instrument at a specified price on a specific date (settlement date). For the year ended December 31, 2017, the Fund entered into interest rate futures to gain exposure to different parts of the yield curve while managing overall duration and for non-hedging purposes to seek to enhance potential gains.
Upon entering into a futures contract, the Fund is required to deposit with a financial intermediary cash or securities (“initial margin”) in an amount equal to a certain percentage of the face value indicated in the futures contract. Subsequent payments (“variation margin”) are made or received by the Fund dependent upon the daily fluctuations in the value and are recorded for financial reporting purposes as unrealized gains or losses by the Fund. Gains or losses are realized when the contract expires or is closed. Since all futures contracts are exchange-traded, counterparty risk is minimized as the exchange’s clearinghouse acts as the counterparty, and guarantees the futures against default.
Certain risks may arise upon entering into futures contracts, including the risk that an illiquid market will limit the Fund’s ability to close out a futures contract prior to the settlement date and the risk that the futures contract is not well correlated with the security, index or currency to which it relates. Risk of loss may exceed amounts disclosed in the Statement of Assets and Liabilities.
A summary of the open futures contracts as of December 31, 2017, is included in a table following the Fund’s Investment Portfolio. For the year ended December 31, 2017, the investment in futures contracts purchased had a total notional value generally indicative of a range from approximately $1,632,000 to
| | | | | | |
| | 18 | | | | | | Deutsche Variable Series II — Deutsche Government & Agency Securities VIP |
$7,595,000 and the investment in futures contracts sold had a total notional value generally indicative of a range from approximately $3,993,000 to $11,623,000.
Forward Foreign Currency Contracts. A forward foreign currency contract (“forward currency contract”) is a commitment to purchase or sell a foreign currency at the settlement date at a negotiated rate. For the year ended December 31, 2017, the Fund entered into forward currency contracts in order to hedge its exposure to changes in foreign currency exchange rates on its foreign currency denominated portfolio holdings and for non-hedging purposes to seek to enhance potential gains.
Forward currency contracts are valued at the prevailing forward exchange rate of the underlying currencies and unrealized gain (loss) is recorded daily. On the settlement date of the forward currency contract, the Fund records a realized gain or loss equal to the difference between the value of the contract at the time it was opened and the value of the contract at the time it was closed. Certain risks may arise upon entering into forward currency contracts from the potential inability of counterparties to meet the terms of their contracts. The maximum counterparty credit risk to the Fund is measured by the unrealized gain on appreciated contracts. Additionally,
when utilizing forward currency contracts to hedge, the Fund gives up the opportunity to profit from favorable exchange rate movements during the term of the contract.
A summary of the open forward currency contracts as of December 31, 2017 is included in a table following the Fund’s Investment Portfolio. For the year ended December 31, 2017, the investment in forward currency contracts short vs. U.S. dollars had a total contract value generally indicative of a range from approximately $1,646,000 to $6,789,000 and the investment in forward currency contracts long vs. U.S. dollars had a total contract value generally indicative of a range from approximately $962,000 to $2,884,000. The investment in forward currency contracts long vs. other foreign currencies sold had a total contract value generally indicative of a range from $0 to approximately $4,050,000.
The following tables summarize the value of the Fund’s derivative instruments held as of December 31, 2017 and the related location in the accompanying Statement of Assets and Liabilities, presented by primary underlying risk exposure:
| | | | | | | | | | | | | | | | |
| Asset Derivatives | | Forward
Contracts | | | Swap
Contracts | | | Futures
Contracts | | | Total | |
| Interest Rate Contracts (a) (b) | | $ | — | | | $ | 52,927 | | | $ | 36,402 | | | $ | 89,329 | |
| Foreign Exchange Contracts (c) | | | 59,595 | | | | — | | | | — | | | | 59,595 | |
| | | $ | 59,595 | | | $ | 52,927 | | | $ | 36,402 | | | $ | 148,924 | |
Each of the above derivatives is located in the following Statement of Assets and Liabilities accounts:
| (a) | Includes cumulative appreciation of swap contracts and futures as disclosed in the Investment Portfolio. Unsettled variation margin is disclosed separately within the Statement of Assets and Liabilities. |
| (b) | Unrealized appreciation on bilateral swap contracts |
| (c) | Unrealized appreciation on forward foreign currency contracts |
| | | | | | | | | | | | | | | | |
| Liability Derivatives | | Forward
Contracts | | | Swap
Contracts | | | Futures
Contracts | | | Total | |
| Interest Rate Contracts (d) | | $ | — | | | $ | (10,144 | ) | | $ | (2,366 | ) | | $ | (12,510 | ) |
| Foreign Exchange Contracts (e) | | | (35,872 | ) | | | — | | | | — | | | | (35,872 | ) |
| | | $ | (35,872 | ) | | $ | (10,144 | ) | | $ | (2,366 | ) | | $ | (48,382 | ) |
Each of the above derivatives is located in the following Statement of Assets and Liabilities accounts:
| (d) | Includes cumulative depreciation of swap contracts and futures as disclosed in the Investment Portfolio. Unsettled variation margin is disclosed separately within the Statement of Assets and Liabilities. |
| (e) | Unrealized depreciation on forward foreign currency contracts |
Additionally, the amount of unrealized and realized gains and losses on derivative instruments recognized in Fund earnings during the year ended December 31, 2017 and the related location in the accompanying Statement of Operations is summarized in the following tables by primary underlying risk exposure:
| | | | | | | | | | | | | | | | |
| Realized Gain (Loss) | | Forward
Contracts | | | Swap
Contracts | | | Futures
Contracts | | | Total | |
| Interest Rate Contracts (f) | | $ | — | | | $ | (116,392 | ) | | $ | (316,318 | ) | | $ | (432,710 | ) |
| Foreign Exchange Contracts (g) | | | 17,199 | | | | — | | | | — | | | | 17,199 | |
| | | $ | 17,199 | | | $ | (116,392 | ) | | $ | (316,318 | ) | | $ | (415,511 | ) |
Each of the above derivatives is located in the following Statement of Operations accounts:
| (f) | Net realized gain (loss) on swap contracts and futures, respectively |
| (g) | Net realized gain (loss) from forward foreign currency contracts |
| | | | |
Deutsche Variable Series II — Deutsche Government & Agency Securities VIP | | | | | 19 |
| | | | | | | | | | | | | | | | |
Change in Net Unrealized
Appreciation (Depreciation) | | Forward
Contracts | | | Swap
Contracts | | | Futures
Contracts | | | Total | |
| Interest Rate Contracts (h) | | $ | — | | | $ | 148,395 | | | $ | 25,841 | | | $ | 174,236 | |
| Foreign Exchange Contracts (i) | | | 18,968 | | | | — | | | | — | | | | 18,968 | |
| | | $ | 18,968 | | | $ | 148,395 | | | $ | 25,841 | | | $ | 193,204 | |
Each of the above derivatives is located in the following Statement of Operations accounts:
| (h) | Change in net unrealized appreciation (depreciation) from swap contracts and futures, respectively |
| (i) | Change in net unrealized appreciation (depreciation) on forward foreign currency contracts |
As of December 31, 2017, the Fund has transactions subject to enforceable master netting agreements which govern the terms of certain transactions, and reduce the counterparty risk associated with such transactions. Master netting agreements allow a Fund to close out and net total exposure to a counterparty in the event of a deterioration in the credit quality or contractual default with respect to all of the transactions with a counterparty. As defined by the master netting agreement, the Fund may have collateral agreements with certain counterparties to mitigate risk. For financial reporting purposes the Statement of Assets and Liabilities generally shows derivatives assets and liabilities on a gross basis, which reflects the full risks and exposures prior to netting. A reconciliation of the gross amounts on the Statement of Assets and Liabilities to the net amounts by a counterparty, including any collateral exposure, is included in the following tables:
| | | | | | | | | | | | | | | | |
| Counterparty | | Gross Amounts
of Assets
Presented in the
Statement of
Assets and
Liabilities | | | Financial
Instruments
and
Derivatives
Available
for Offset | | | Collateral Received | | | Net Amount of
Derivative
Assets | |
| Canadian Imperial Bank of Commerce | | $ | 6,057 | | | $ | — | | | $ | — | | | $ | 6,057 | |
| Citigroup, Inc. | | | 18,383 | | | | (16,912 | ) | | | — | | | | 1,471 | |
| Danske Bank AS | | | 7,696 | | | | — | | | | — | | | | 7,696 | |
| Goldman Sachs & Co. | | | 480 | | | | — | | | | — | | | | 480 | |
| JPMorgan Chase Securities, Inc. | | | 27,459 | | | | (13,290 | ) | | | — | | | | 14,169 | |
| | | $ | 60,075 | | | $ | (30,202 | ) | | $ | — | | | $ | 29,873 | |
| | | | | | | | | | | | | | | | |
| Counterparty | | Gross Amounts
of Liabilities
Presented in the
Statement of
Assets and
Liabilities | | | Financial
Instruments
and
Derivatives
Available
for Offset | | | Collateral Pledged | | | Net Amount of
Derivative
Liabilities | |
| Citigroup, Inc. | | $ | 16,912 | | | $ | (16,912 | ) | | $ | — | | | $ | — | |
| HSBC Holdings PLC | | | 5,670 | | | | — | | | | — | | | | 5,670 | |
| JPMorgan Chase Securities, Inc. | | | 13,290 | | | | (13,290 | ) | | | — | | | | — | |
| | | $ | 35,872 | | | $ | (30,202 | ) | | $ | — | | | $ | 5,670 | |
C. Purchases and Sales of Securities
During the year ended December 31, 2017, purchases and sales of investment securities (excluding short-term investments and U.S. Treasury securities) aggregated $354,519,795 and $361,479,195, respectively. Purchases and sales of U.S. Treasury securities aggregated $8,167,615 and $7,686,425, respectively.
D. Related Parties
Management Agreement. Under the Investment Management Agreement with Deutsche Investment Management Americas Inc. (“DIMA” or the “Advisor”), an indirect, wholly owned subsidiary of Deutsche Bank AG, the Advisor directs the investments of the Fund in accordance with its investment objectives, policies and restrictions. The Advisor determines the securities, instruments and other contracts relating to investments to be purchased, sold or entered into by the Fund.
| | | | | | |
| | 20 | | | | | | Deutsche Variable Series II — Deutsche Government & Agency Securities VIP |
Pursuant to the Investment Management Agreement with the Advisor, the Fund pays a monthly management fee based on the Fund’s average daily net assets, computed and accrued daily and payable monthly, at the following annual rates:
| | | | |
| First $250 million | | | .450 | % |
| Next $750 million | | | .430 | % |
| Next $1.5 billion | | | .410 | % |
| Next $2.5 billion | | | .400 | % |
| Next $2.5 billion | | | .380 | % |
| Next $2.5 billion | | | .360 | % |
| Next $2.5 billion | | | .340 | % |
| Over $12.5 billion | | | .320 | % |
Accordingly, for the year ended December 31, 2017, the fee pursuant to the Investment Management Agreement was equivalent to an annual rate (exclusive of any applicable waivers/reimbursements) of 0.45% of the Fund’s average daily net assets.
For the period from January 1, 2017 through April 30, 2017, the Advisor had contractually agreed to waive all or a portion of its fees and/or reimburse certain operating expenses of the Fund to the extent necessary to maintain the total annual operating expenses (excluding certain expenses such as extraordinary expenses, taxes, brokerage and interest) of each class as follows:
| | | | |
| Class A | | | .58 | % |
| Class B | | | .93 | % |
For the period from May 1, 2017 through September 30, 2017, the Advisor had contractually agreed to waive all or a portion of its fees and/or reimburse certain operating expenses of the Fund to the extent necessary to maintain the total annual operating expenses (excluding certain expenses such as extraordinary expenses, taxes, brokerage and interest) of each class as follows:
| | | | |
| Class A | | | .65 | % |
| Class B | | | 1.00 | % |
Effective October 1, 2017 through September 30, 2018, the Advisor has contractually agreed to waive all or a
portion of its fees and/or reimburse certain operating expenses of the Fund to the extent necessary to maintain the total annual operating expenses (excluding certain expenses such as extraordinary expenses, taxes, brokerage and interest) of each class as follows:
| | | | |
| Class A | | | .56 | % |
| Class B | | | .91 | % |
For the year ended December 31, 2017, fees waived and/or expenses reimbursed for each class are as follows:
| | | | |
| Class A | | $ | 121,210 | |
| Class B | | | 5,513 | |
| | | $ | 126,723 | |
Administration Fee. Pursuant to an Administrative Services Agreement, DIMA provides most administrative services to the Fund. For all services provided under the Administrative Services Agreement, the Fund pays DIMA an annual fee (“Administration Fee”) of 0.10% of the Fund’s average daily net assets, computed and accrued daily and payable monthly. For the year ended December 31, 2017, the Administration Fee was $48,976, of which $3,579 is unpaid.
Service Provider Fees. Deutsche AM Service Company (“DSC”), an affiliate of the Advisor, is the transfer agent, dividend-paying agent and shareholder service agent for the Fund. Pursuant to a sub-transfer agency agreement between DSC and DST Systems, Inc. (“DST”), DSC has delegated certain transfer agent, dividend-paying agent and shareholder service agent functions to DST. DSC compensates DST out of the shareholder servicing fee it receives from the Fund. For the year ended December 31, 2017, the amounts charged to the Fund by DSC were as follows:
| | | | |
Deutsche Variable Series II — Deutsche Government & Agency Securities VIP | | | | | 21 |
| | | | | | | | |
| | | Total
Aggregated | | | Unpaid at
December 31,
2017 | |
| Class A | | $ | 251 | | | $ | 63 | |
| Class B | | | 51 | | | | 13 | |
| | | $ | 302 | | | $ | 76 | |
Distribution Service Agreement. Under the Fund’s Class B 12b-1 plan, Deutsche AM Distributors, Inc. (“DDI”) received a fee (“Distribution Service Fee”) of 0.25% of average daily net assets of Class B shares. For the year ended December 31, 2017, the Distribution Service Fee aggregated $5,337, of which $392 is unpaid.
Typesetting and Filing Service Fees. Under an agreement with DIMA, DIMA is compensated for providing certain pre-press and regulatory filing services to the Fund. For the year ended December 31, 2017, the amount charged to the Fund by DIMA included in the Statement of Operations under “Reports to shareholders” aggregated $12,999, of which $5,907 is unpaid.
Trustees’ Fees and Expenses. The Fund paid retainer fees to each Trustee not affiliated with the Advisor, plus specified amounts to the Board Chairperson and Vice Chairperson and to each committee Chairperson.
Affiliated Cash Management Vehicles. The Fund may invest uninvested cash balances in Deutsche Central Cash Management Government Fund and Deutsche Variable NAV Money Fund, affiliated money market funds which are managed by the Advisor. Each affiliated money market fund is managed in accordance with Rule 2a-7 under the 1940 Act, which governs the quality, maturity, diversity and liquidity of instruments in which a money market fund may invest. Deutsche Central Cash Management Government Fund seeks to maintain a stable net asset value, and Deutsche Variable NAV Money Fund maintains a floating net asset value. The Fund indirectly bears its proportionate share of the expenses of each affiliated money market fund in which it invests. Deutsche Central Cash Management Government Fund does not pay the Advisor an investment management fee. To the extent that Deutsche Variable NAV Money Fund pays an investment management fee to the Advisor, the Advisor will waive an amount of the investment management fee payable to the Advisor by the Fund equal to the amount of the investment management fee payable on the Fund’s assets invested in Deutsche Variable NAV Money Fund.
Security Lending Fees. Deutsche Bank AG serves as securities lending agent for the Fund. For the year ended December 31, 2017, the Fund incurred securities lending agent fees to Deutsche Bank AG in the amount of $6.
E. Ownership of the Fund
At December 31, 2017, two participating insurance companies were owners of record of 10% or more of the total outstanding Class A shares of the Fund, each owning 48% and 37%. One participating insurance company was the owner of record of 10% or more of the total outstanding Class B shares of the Fund, owning 94%.
F. Line of Credit
The Fund and other affiliated funds (the “Participants”) share in a $400 million revolving credit facility provided by a syndication of banks. The Fund may borrow for temporary or emergency purposes, including the meeting of redemption requests that otherwise might require the untimely disposition of securities. The Participants are charged an annual commitment fee which is allocated based on net assets, among each of the Participants. Interest is calculated at a rate per annum equal to the sum of the Federal Funds Rate plus 1.25 percent plus if the one-month LIBOR exceeds the Federal Funds Rate, the amount of such excess. The Fund may borrow up to a maximum of 33 percent of its net assets under the agreement.
At December 31, 2017, the Fund had a $1,050,000 outstanding loan. Interest expense incurred on the borrowings was $510 for the period ended December 31, 2017. The average dollar amount of the borrowings was $503,846 the weighted average interest rate on these borrowings was 2.84%, and the Fund had a loan outstanding for thirteen days throughout the period. The borrowings were valued at cost, which approximates fair value.
G. Payments by Affiliates
During the year ended December 31, 2017, the Advisor agreed to reimburse the Fund $480 for losses incurred on trades executed incorrectly. The amount reimbursed was less than .01% of the Fund’s average net assets, thus having no impact on the Fund’s total return.
| | | | | | |
| | 22 | | | | | | Deutsche Variable Series II — Deutsche Government & Agency Securities VIP |
Report of Independent Registered Public Accounting Firm
To the Board of Trustees of Deutsche Variable Series II and Shareholders of Deutsche Government & Agency Securities VIP:
Opinion on the Financial Statements
We have audited the accompanying statement of assets and liabilities of Deutsche Government & Agency Securities VIP (the “Fund”) (one of the funds constituting the Deutsche Variable Series II ) (the “Trust”), including the schedule of investments, as of December 31, 2017, and the related statement of operations for the year then ended, the statements of changes in net assets for each of the two years in the period then ended, the financial highlights for each of the five years in the period then ended and the related notes (collectively referred to as the “financial statements”). In our opinion, the financial statements present fairly, in all material respects, the financial position of the Fund (one of the funds constituting the Deutsche Variable Series II) at December 31, 2017, the results of its operations for the year then ended, the changes in its net assets for each of the two years in the period then ended and its financial highlights for each of the five years in the period then ended, in conformity with U.S. generally accepted accounting principles.
Basis for Opinion
These financial statements are the responsibility of the Trust’s management. Our responsibility is to express an opinion on the Fund’s financial statements based on our audits. We are a public accounting firm registered with the Public Company Accounting Oversight Board (United States) (“PCAOB”) and are required to be independent with respect to the Trust in accordance with the U.S. federal securities laws and the applicable rules and regulations of the Securities and Exchange Commission and the PCAOB.
We conducted our audits in accordance with the standards of the PCAOB. Those standards require that we plan and perform the audit to obtain reasonable assurance about whether the financial statements are free of material misstatement, whether due to error or fraud. The Trust is not required to have, nor were we engaged to perform, an audit of the Trust’s internal control over financial reporting. As part of our audits, we are required to obtain an understanding of internal control over financial reporting, but not for the purpose of expressing an opinion on the effectiveness of the Trust’s internal control over financial reporting. Accordingly, we express no such opinion.
Our audits included performing procedures to assess the risks of material misstatement of the financial statements, whether due to error or fraud, and performing procedures that respond to those risks. Such procedures included examining, on a test basis, evidence regarding the amounts and disclosures in the financial statements. Our procedures included confirmation of securities owned as of December 31, 2017, by correspondence with the custodian and brokers or by other appropriate auditing procedures where replies from brokers were not received.
Our audits also included evaluating the accounting principles used and significant estimates made by management, as well as evaluating the overall presentation of the financial statements. We believe that our audits provide a reasonable basis for our opinion.

We have served as the auditor of one or more investment companies in the Deutsche family of funds since at least 1979, but we are unable to determine the specific year.
Boston, Massachusetts
February 15, 2018
| | | | |
Deutsche Variable Series II — Deutsche Government & Agency Securities VIP | | | | | 23 |
| | |
| Information About Your Fund’s Expenses | | (Unaudited) |
As an investor of the Fund, you incur two types of costs: ongoing expenses and transaction costs. Ongoing expenses include management fees, distribution and service (12b-1) fees and other Fund expenses. Examples of transaction costs include contract charges, which are not shown in this section. The following tables are intended to help you understand your ongoing expenses (in dollars) of investing in the Fund and to help you compare these expenses with the ongoing expenses of investing in other mutual funds. In the most recent six-month period, the Fund limited these expenses; had it not done so, expenses would have been higher. The example in the table is based on an investment of $1,000 invested at the beginning of the six-month period and held for the entire period (July 1, 2017 to December 31, 2017).
The tables illustrate your Fund’s expenses in two ways:
| – | Actual Fund Return. This helps you estimate the actual dollar amount of ongoing expenses (but not transaction costs) paid on a $1,000 investment in the Fund using the Fund’s actual return during the period. To estimate the expenses you paid over the period, simply divide your account value by $1,000 (for example, an $8,600 account value divided by $1,000 = 8.6), then multiply the result by the number in the “Expenses Paid per $1,000” line under the share class you hold. |
| – | Hypothetical 5% Fund Return. This helps you to compare your Fund’s ongoing expenses (but not transaction costs) with those of other mutual funds using the Fund’s actual expense ratio and a hypothetical rate of return of 5% per year before expenses. Examples using a 5% hypothetical Fund return may be found in the shareholder reports of other mutual funds. The hypothetical account values and expenses may not be used to estimate the actual ending account balance or expenses you paid for the period. |
Please note that the expenses shown in these tables are meant to highlight your ongoing expenses only and do not reflect any transaction costs. The “Expenses Paid per $1,000” line of the tables is useful in comparing ongoing expenses only and will not help you determine the relative total expense of owning different funds. If these transaction costs had been included, your costs would have been higher.
| | | | | | | | |
| Expenses and Value of a $1,000 Investment for the six months ended December 31, 2017 | | | | |
| | |
| Actual Fund Return | | | Class A | | | | Class B | |
| Beginning Account Value 7/1/17 | | $ | 1,000.00 | | | $ | 1,000.00 | |
| Ending Account Value 12/31/17 | | $ | 1,004.50 | | | $ | 1,002.70 | |
| Expenses Paid per $1,000* | | $ | 3.08 | | | $ | 4.85 | |
| | |
| Hypothetical 5% Fund Return | | | Class A | | | | Class B | |
| Beginning Account Value 7/1/17 | | $ | 1,000.00 | | | $ | 1,000.00 | |
| Ending Account Value 12/31/17 | | $ | 1,022.13 | | | $ | 1,020.37 | |
| Expenses Paid per $1,000* | | $ | 3.11 | | | $ | 4.89 | |
| * | Expenses are equal to the Fund’s annualized expense ratio for each share class, multiplied by the average account value over the period, multiplied by 184 (the number of days in the most recent six-month period), then divided by 365. |
| | | | | | | | |
| Annualized Expense Ratios | | Class A | | | Class B | |
| Deutsche Variable Series II — Deutsche Government & Agency Securities VIP | | | .61 | % | | | .96 | % |
For more information, please refer to the Fund’s prospectus.
These tables do not reflect charges and fees (“contract charges”) associated with the separate account that invests in the Fund or any variable life insurance policy or variable annuity contract for which the Fund is an investment option.
For an analysis of the fees associated with an investment in the fund or similar funds, please refer to the current and hypothetical expense calculators for Variable Insurance Products which can be found at deutschefunds.com/EN/resources/calculators.jsp.
| | | | | | |
| | 24 | | | | | | Deutsche Variable Series II — Deutsche Government & Agency Securities VIP |
| | |
| Tax Information | | (Unaudited) |
Please consult a tax advisor if you have questions about federal or state income tax laws, or on how to prepare your tax returns. If you have specific questions about your account, please contact your insurance provider.
Proxy Voting
The Trust’s policies and procedures for voting proxies for portfolio securities and information about how the Trust voted proxies related to its portfolio securities during the most recent 12-month period ended June 30 are available on our Web site — deutschefunds.com (click on “proxy voting” at the bottom of the page) — or on the SEC’s Web site — sec.gov. To obtain a written copy of the Trust’s policies and procedures without charge, upon request, call us toll free at (800) 728-3337.
| | | | |
Deutsche Variable Series II — Deutsche Government & Agency Securities VIP | | | | | 25 |
Advisory Agreement Board Considerations and Fee Evaluation
The Board of Trustees (hereinafter referred to as the “Board” or “Trustees”) approved the renewal of Deutsche Government & Agency Securities VIP’s (the “Fund”) investment management agreement (the “Agreement”) with Deutsche Investment Management Americas Inc. (“DIMA”) in September 2017.
In terms of the process that the Board followed prior to approving the Agreement, shareholders should know that:
| – | During the entire process, all of the Fund’s Trustees were independent of DIMA and its affiliates (the “Independent Trustees”). |
| – | The Board met frequently during the past year to discuss fund matters and dedicated a substantial amount of time to contract review matters. Over the course of several months, the Board’s Contract Committee reviewed extensive materials received from DIMA, independent third parties and independent counsel. These materials included an analysis of the Fund’s performance, fees and expenses, and profitability from a fee consultant retained by the Fund’s Independent Trustees (the “Fee Consultant”). Based on its evaluation of the information provided, the Contract Committee presented its findings and recommendations to the Board. The Board then reviewed the Contract Committee’s findings and recommendations. |
| – | The Board also received extensive information throughout the year regarding performance of the Fund. |
| – | The Independent Trustees regularly met privately with counsel to discuss contract review and other matters. In addition, the Independent Trustees were advised by the Fee Consultant in the course of their review of the Fund’s contractual arrangements and considered a comprehensive report prepared by the Fee Consultant in connection with their deliberations. |
| – | In connection with reviewing the Agreement, the Board also reviewed the terms of the Fund’s Rule 12b-1 plan, distribution agreement, administrative services agreement, transfer agency agreement and other material service agreements. |
In connection with the contract review process, the Contract Committee and the Board considered the factors discussed below, among others. The Board also considered that DIMA and its predecessors have managed the Fund since its inception, and the Board believes that a long-term relationship with a capable, conscientious advisor is in the best interests of the Fund. The Board considered, generally, that shareholders chose to invest or remain invested in the Fund knowing that DIMA managed the Fund, and that the Agreement was approved by the Fund’s shareholders. DIMA is part of Deutsche Bank AG’s (“Deutsche Bank”) Asset Management (“Deutsche AM”) division. Deutsche AM is a global asset management business that offers a wide range of investing expertise and resources, including research capabilities in many countries throughout the world.
As part of the contract review process, the Board carefully considered the fees and expenses of each Deutsche fund overseen by the Board in light of the fund’s performance. In many cases, this led to the negotiation and implementation of expense caps. As part of these negotiations, the Board indicated that it would consider relaxing these caps in future years following sustained improvements in performance, among other considerations.
While shareholders may focus primarily on fund performance and fees, the Fund’s Board considers these and many other factors, including the quality and integrity of DIMA’s personnel and administrative support services provided by DIMA, such as back-office operations, fund valuations, and compliance policies and procedures.
Nature, Quality and Extent of Services. The Board considered the terms of the Agreement, including the scope of advisory services provided under the Agreement. The Board noted that, under the Agreement, DIMA provides portfolio management services to the Fund and that, pursuant to a separate administrative services agreement, DIMA provides administrative services to the Fund. The Board considered the experience and skills of senior management and investment personnel and the resources made available to such personnel. The Board reviewed the Fund’s performance over short-term and long-term periods and compared those returns to various agreed-upon performance measures, including market index(es) and a peer universe compiled using information supplied by Morningstar Direct (“Morningstar”), an independent fund data service. The Board also noted that it has put into place a process of identifying “Funds in Review” (e.g., funds performing poorly relative to a peer universe), and receives additional reporting from DIMA regarding such funds and, where appropriate, DIMA’s plans to address underperformance. The Board
| | | | | | |
| | 26 | | | | | | Deutsche Variable Series II — Deutsche Government & Agency Securities VIP |
believes this process is an effective manner of identifying and addressing underperforming funds. Based on the information provided, the Board noted that, for the one-, three- and five-year periods ended December 31, 2016, the Fund’s performance (Class A shares) was in the 3rd quartile of the applicable Morningstar universe (the 1st quartile being the best performers and the 4th quartile being the worst performers). The Board also observed that the Fund has underperformed its benchmark in the one-, three- and five-year periods ended December 31, 2016.
Fees and Expenses. The Board considered the Fund’s investment management fee schedule, operating expenses and total expense ratios, and comparative information provided by Broadridge Financial Solutions, Inc. (“Broadridge”) and the Fee Consultant regarding investment management fee rates paid to other investment advisors by similar funds (1st quartile being the most favorable and 4th quartile being the least favorable). With respect to management fees paid to other investment advisors by similar funds, the Board noted that the contractual fee rates paid by the Fund, which include a 0.10% fee paid to DIMA under the Fund’s administrative services agreement, were higher than the median (4th quartile) of the applicable Broadridge peer group (based on Broadridge data provided as of December 31, 2016). The Board noted that the Fund’s Class A shares total (net) operating expenses were expected to be higher than the median (3rd quartile) of the applicable Broadridge expense universe (based on Broadridge data provided as of December 31, 2016, and analyzing Broadridge expense universe Class A (net) expenses less any applicable 12b-1 fees) (“Broadridge Universe Expenses”). The Board also reviewed data comparing each share class’s total (net) operating expenses to the applicable Broadridge Universe Expenses. The Board noted that the expense limitations agreed to by DIMA were expected to help the Fund’s total (net) operating expenses remain competitive. The Board considered the Fund’s management fee rate as compared to fees charged by DIMA to a comparable Deutsche U.S. registered fund (“Deutsche Funds”) and considered differences between the Fund and the comparable Deutsche Fund. The information requested by the Board as part of its review of fees and expenses also included information about institutional accounts (including any sub-advised funds and accounts) and funds offered primarily to European investors (“Deutsche Europe funds”) managed by Deutsche AM. The Board noted that DIMA indicated that Deutsche AM does not manage any institutional accounts or Deutsche Europe funds comparable to the Fund.
On the basis of the information provided, the Board concluded that management fees were reasonable and appropriate in light of the nature, quality and extent of services provided by DIMA.
Profitability. The Board reviewed detailed information regarding revenues received by DIMA under the Agreement. The Board considered the estimated costs to DIMA, and pre-tax profits realized by DIMA, from advising the Deutsche Funds, as well as estimates of the pre-tax profits attributable to managing the Fund in particular. The Board also received information regarding the estimated enterprise-wide profitability of DIMA and its affiliates with respect to all fund services in totality and by fund. The Board and the Fee Consultant reviewed DIMA’s methodology in allocating its costs to the management of the Fund. Based on the information provided, the Board concluded that the pre-tax profits realized by DIMA in connection with the management of the Fund were not unreasonable. The Board also reviewed certain publicly available information regarding the profitability of certain similar investment management firms. The Board noted that, while information regarding the profitability of such firms is limited (and in some cases is not necessarily prepared on a comparable basis), DIMA and its affiliates’ overall profitability with respect to the Deutsche Funds (after taking into account distribution and other services provided to the funds by DIMA and its affiliates) was lower than the overall profitability levels of most comparable firms for which such data was available.
Economies of Scale. The Board considered whether there are economies of scale with respect to the management of the Fund and whether the Fund benefits from any economies of scale. The Board noted that the Fund’s investment management fee schedule includes fee breakpoints. The Board concluded that the Fund’s fee schedule represents an appropriate sharing between the Fund and DIMA of such economies of scale as may exist in the management of the Fund at current asset levels.
Other Benefits to DIMA and Its Affiliates. The Board also considered the character and amount of other incidental benefits received by DIMA and its affiliates, including any fees received by DIMA for administrative services provided to the Fund, any fees received by an affiliate of DIMA for transfer agency services provided to the Fund and any fees received by an affiliate of DIMA for distribution services. The Board also considered benefits to DIMA related to brokerage and soft-dollar allocations, including allocating brokerage to pay for research generated by parties other than the executing broker dealers, which pertain primarily to funds investing in equity securities. In addition, the Board considered the incidental public relations benefits to DIMA related to Deutsche Funds advertising and cross-selling opportunities among DIMA products and
| | | | |
Deutsche Variable Series II — Deutsche Government & Agency Securities VIP | | | | | 27 |
services. The Board considered these benefits in reaching its conclusion that the Fund’s management fees were reasonable.
Compliance. The Board considered the significant attention and resources dedicated by DIMA to documenting and enhancing its compliance processes in recent years. The Board noted in particular (i) the experience, seniority and time commitment of the individuals serving as DIMA’s and the Fund’s chief compliance officers; (ii) the large number of DIMA compliance personnel; and (iii) the substantial commitment of resources by DIMA and its affiliates to compliance matters.
Based on all of the information considered and the conclusions reached, the Board unanimously determined that the continuation of the Agreement is in the best interests of the Fund. In making this determination, the Board did not give particular weight to any single factor identified above. The Board considered these factors over the course of numerous meetings, certain of which were in executive session with only the Independent Trustees and counsel present. It is possible that individual Independent Trustees may have weighed these factors differently in reaching their individual decisions to approve the continuation of the Agreement.
| | | | | | |
| | 28 | | | | | | Deutsche Variable Series II — Deutsche Government & Agency Securities VIP |
Board Members and Officers
The following table presents certain information regarding the Board Members and Officers of the Fund. Each Board Member’s year of birth is set forth in parentheses after his or her name. Unless otherwise noted, (i) each Board Member has engaged in the principal occupation(s) noted in the table for at least the most recent five years, although not necessarily in the same capacity; and (ii) the address of each Independent Board Member is c/o Keith R. Fox, Deutsche Funds Board Chair, c/o Thomas R. Hiller, Ropes & Gray LLP, Prudential Tower, 800 Boylston Street, Boston, MA 02199-3600. Except as otherwise noted below, the term of office for each Board Member is until the election and qualification of a successor, or until such Board Member sooner dies, resigns, is removed or as otherwise provided in the governing documents of the Fund. Because the Fund does not hold an annual meeting of shareholders, each Board Member will hold office for an indeterminate period. The Board Members may also serve in similar capacities with other funds in the fund complex.
| | | | | | | | |
| Independent Board Members | | | | | | | |
Name, Year of Birth,
Position with the Fund and
Length of Time Served1 | | Business Experience and Directorships During the Past Five Years | | Number of
Funds in
Deutsche
Fund
Complex
Overseen | | | Other
Directorships
Held by Board
Member |
Keith R. Fox, CFA (1954) Chairperson since 2017, and Board Member since 1996 | | Managing General Partner, Exeter Capital Partners (a series of private investment funds) (since 1986). Directorships: Progressive International Corporation (kitchen goods importer and distributor); The Kennel Shop (retailer); former Chairman, National Association of Small Business Investment Companies; former Directorships: BoxTop Media Inc. (advertising); Sun Capital Advisers Trust (mutual funds) (2011–2012) | | | 89 | | | — |
Kenneth C. Froewiss (1945) Vice Chairperson since 2017, and Board Member since 2001 | | Retired Clinical Professor of Finance, NYU Stern School of Business (1997–2014); Member, Finance Committee, Association for Asian Studies (2002–present); Director, Mitsui Sumitomo Insurance Group (US) (2004–present); prior thereto, Managing Director, J.P. Morgan (investment banking firm) (until 1996) | | | 92 | | | — |
John W. Ballantine (1946) Board Member since 1999 | | Retired; formerly, Executive Vice President and Chief Risk Management Officer, First Chicago NBD Corporation/The First National Bank of Chicago (1996–1998); Executive Vice President and Head of International Banking (1995–1996); former Directorships: Director and former Chairman of the Board, Healthways, Inc.2 (population well-being and wellness services) (2003–2014); Stockwell Capital Investments PLC (private equity); Enron Corporation; FNB Corporation; Tokheim Corporation; First Oak Brook Bancshares, Inc. and Oak Brook Bank; Prisma Energy International. Not-for-Profit Director, Trustee: Palm Beach Civic Association; Public Radio International; Window to the World Communications (public media); Harris Theater for Music and Dance (Chicago) | | | 89 | | | Portland
General
Electric2
(utility
company)
(2003–
present) |
Henry P. Becton, Jr. (1943) Board Member since 1990 | | Vice Chair and former President, WGBH Educational Foundation. Directorships: Public Radio International; Public Radio Exchange (PRX); The Pew Charitable Trusts (charitable organization); former Directorships: Becton Dickinson and Company2 (medical technology company); Belo Corporation2 (media company); The PBS Foundation; Association of Public Television Stations; Boston Museum of Science; American Public Television; Concord Academy; New England Aquarium; Mass. Corporation for Educational Telecommunications; Committee for Economic Development; Public Broadcasting Service; Connecticut College; North Bennett Street School (Boston) | | | 89 | | | — |
Dawn-Marie Driscoll (1946) Board Member since 1987 | | Emeritus Executive Fellow, Center for Business Ethics, Bentley University; formerly: President, Driscoll Associates (consulting firm); Partner, Palmer & Dodge (law firm) (1988–1990); Vice President of Corporate Affairs and General Counsel, Filene’s (retail) (1978–1988). Directorships: Advisory Board, Center for Business Ethics, Bentley University; Trustee and former Chairman of the Board, Southwest Florida Community Foundation (charitable organization); former Directorships: ICI Mutual Insurance Company (2007–2015); Sun Capital Advisers Trust (mutual funds) (2007–2012), Investment Company Institute (audit, executive, nominating committees) and Independent Directors Council (governance, executive committees) | | | 89 | | | — |
| | | | |
Deutsche Variable Series II — Deutsche Government & Agency Securities VIP | | | | | 29 |
| | | | | | | | |
Name, Year of Birth,
Position with the Fund and
Length of Time Served1 | | Business Experience and Directorships During the Past Five Years | | Number of
Funds in
Deutsche
Fund
Complex
Overseen | | | Other
Directorships
Held by Board
Member |
Paul K. Freeman (1950) Board Member since 1993 | | Consultant, World Bank/Inter-American Development Bank; Independent Directors Council (former chair); Investment Company Institute (executive and nominating committees); formerly: Chairman of Education Committee of Independent Directors Council; Project Leader, International Institute for Applied Systems Analysis (1998–2001); Chief Executive Officer, The Eric Group, Inc. (environmental insurance) (1986–1998); Directorships: Denver Zoo Foundation (December 2012–present); Knoebel Institute for Healthy Aging, University of Denver (2017–present); former Directorships: Prisma Energy International | | | 89 | | | — |
Richard J. Herring (1946) Board Member since 1990 | | Jacob Safra Professor of International Banking and Professor, Finance Department, The Wharton School, University of Pennsylvania (since July 1972); Co-Director, Wharton Financial Institutions Center; formerly: Vice Dean and Director, Wharton Undergraduate Division (July��1995–June 2000); Director, Lauder Institute of International Management Studies (July 2000–June 2006) | | | 89 | | | Director,
Aberdeen
Singapore
and Japan
Funds (since
2007);
Independent
Director of
Barclays
Bank
Delaware
(since
September
2010) |
William McClayton (1944) Board Member since 2004 | | Private equity investor (since October 2009); previously, Managing Director, Diamond Management & Technology Consultants, Inc. (global consulting firm) (2001–2009); Directorship: Board of Managers, YMCA of Metropolitan Chicago; formerly: Senior Partner, Arthur Andersen LLP (accounting) (1966–2001); Trustee, Ravinia Festival | | | 89 | | | — |
Rebecca W. Rimel (1951) Board Member since 1995 | | President, Chief Executive Officer and Director, The Pew Charitable Trusts (charitable organization) (1994–present); formerly: Executive Vice President, The Glenmede Trust Company (investment trust and wealth management) (1983–2004); Board Member, Investor Education (charitable organization) (2004–2005); Trustee, Executive Committee, Philadelphia Chamber of Commerce (2001–2007); Director, Viasys Health Care2 (January 2007–June 2007); Trustee, Thomas Jefferson Foundation (charitable organization) (1994–2012) | | | 89 | | | Director,
Becton
Dickinson
and
Company2
(medical
technology
company)
(2012–
present);
Director,
BioTelemetry
Inc2 (health
care) (2009–
present) |
William N. Searcy, Jr. (1946) Board Member since 1993 | | Private investor since October 2003; formerly: Pension & Savings Trust Officer, Sprint Corporation2 (telecommunications) (November 1989–September 2003); Trustee, Sun Capital Advisers Trust (mutual funds) (1998–2012) | | | 89 | | | — |
Jean Gleason Stromberg (1943) Board Member since 1997 | | Retired. Formerly, Consultant (1997–2001); Director, Financial Markets U.S. Government Accountability Office (1996–1997); Partner, Norton Rose Fulbright, L.L.P. (law firm) (1978–1996); former Directorships: The William and Flora Hewlett Foundation (charitable organization) (2000–2015); Service Source, Inc. (nonprofit), Mutual Fund Directors Forum (2002–2004), American Bar Retirement Association (funding vehicle for retirement plans) (1987–1990 and 1994–1996) | | | 89 | | | — |
| | | | | | |
| | 30 | | | | | | Deutsche Variable Series II — Deutsche Government & Agency Securities VIP |
| | |
| Officers4 | | |
Name, Year of Birth,
Position with the Fund and
Length of Time Served5 | | Business Experience and Directorships During the Past Five Years |
Hepsen Uzcan6,9 (1974) President and Chief Executive Officer, 2017–present Assistant Secretary, 2013–present | | Director,3 Deutsche Asset Management; formerly: Vice President for the Deutsche funds (2016–2017) |
John Millette8 (1962) Vice President and Secretary, 1999–present | | Director,3 Deutsche Asset Management; Chief Legal Officer, Deutsche Investment Management Americas Inc. (2015–present); and Director and Vice President, Deutsche AM Trust Company (since 2016); formerly: Secretary, Deutsche Investment Management Americas Inc. (2015–2017) |
Paul H. Schubert6 (1963) Chief Financial Officer, 2004–present Treasurer, 2005–present | | Managing Director,3 Deutsche Asset Management, and Chairman, Director and President, Deutsche AM Trust Company (since 2013); Vice President, Deutsche AM Distributors, Inc. (since 2016); Director, Deutsche AM Service Company (since 2017); Director and President, DB Investment Managers, Inc. (since 2017); formerly: Director, Deutsche AM Trust Company (2004–2013) |
Caroline Pearson8 (1962) Chief Legal Officer, 2010–present | | Managing Director,3 Deutsche Asset Management; formerly: Secretary, Deutsche AM Distributors, Inc.; and Secretary, Deutsche AM Service Company |
Scott D. Hogan8 (1970) Chief Compliance Officer, 2016–present | | Director,3 Deutsche Asset Management |
Wayne Salit7 (1967) Anti-Money Laundering Compliance Officer, 2014–present | | Director,3 Deutsche Asset Management; formerly: Managing Director, AML Compliance Officer at BNY Mellon (2011–2014); and Director, AML Compliance Officer at Deutsche Bank (2004–2011) |
Sheila Cadogan8 (1966) Assistant Treasurer, since July 12, 2017 | | Director,3 Deutsche Asset Management |
Paul Antosca8 (1957) Assistant Treasurer, 2007–present | | Director,3 Deutsche Asset Management |
Diane Kenneally8 (1966) Assistant Treasurer, 2007–present | | Director,3 Deutsche Asset Management |
| 1 | The length of time served represents the year in which the Board Member joined the board of one or more Deutsche funds currently overseen by the Board. |
| 2 | A publicly held company with securities registered pursuant to Section 12 of the Securities Exchange Act of 1934. |
| 3 | Executive title, not a board directorship. |
| 4 | As a result of their respective positions held with the Advisor, these individuals are considered “interested persons” of the Advisor within the meaning of the 1940 Act. Interested persons receive no compensation from the Fund. |
| 5 | The length of time served represents the year in which the officer was first elected in such capacity for one or more Deutsche funds. |
| 6 | Address: 345 Park Avenue, New York, NY 10154. |
| 7 | Address: 60 Wall Street, New York, NY 10005. |
| 8 | Address: One International Place, Boston, MA 02110. |
| 9 | Appointed President and Chief Executive Officer effective December 1, 2017. |
The Fund’s Statement of Additional Information (“SAI”) includes additional information about the Board Members. The SAI is available, without charge, upon request. If you would like to request a copy of the SAI, you may do so by calling the following toll-free number: (800) 728-3337.
| | | | |
Deutsche Variable Series II — Deutsche Government & Agency Securities VIP | | | | | 31 |
| | |
 | | |
VS2GAS-2 (R-025831-7 2/18) | | |

December 31, 2017
Annual Report
Deutsche Variable Series II
Deutsche Government Money Market VIP

Contents
This report must be preceded or accompanied by a prospectus. To obtain an additional prospectus or summary prospectus, if available, call (800) 728-3337 or your financial representative. We advise you to consider the Fund’s objectives, risks, charges and expenses carefully before investing. The summary prospectus and prospectus contain this and other important information about the Fund. Please read the prospectus carefully before you invest.
You could lose money by investing in the Fund. Although the Fund seeks to preserve the value of your investment at $1.00 per share, it cannot guarantee it will do so. An investment in the Fund is not insured or guaranteed by the Federal Deposit Insurance Corporation or any other government agency. The Fund’s sponsor has no legal obligation to provide financial support to the Fund, and you should not expect that the sponsor will provide financial support to the Fund at any time. You should not rely on or expect the Advisor to enter into support agreements or take other actions to maintain the Fund’s $1.00 share price. The credit quality of the Fund’s holdings can change rapidly in certain markets, and the default of a single holding could have an adverse impact on the Fund’s share price. The Fund’s share price can also be negatively affected during periods of high redemption pressures and/or illiquid markets. The actions of a few large investors in the Fund may have a significant adverse effect on the share price of the Fund. Please read the prospectus for specific details regarding the Fund’s risk profile.
Deutsche Asset Management represents the asset management activities conducted by Deutsche Bank AG or any of its subsidiaries.
Deutsche AM Distributors, Inc., 222 South Riverside Plaza, Chicago, IL 60606, (800) 621-1148
NOT FDIC/NCUA INSURED NO BANK GUARANTEE MAY LOSE VALUE NOT A DEPOSIT
NOT INSURED BY ANY FEDERAL GOVERNMENT AGENCY
| | | | | | |
| | 2 | | | | | | Deutsche Variable Series II — Deutsche Government Money Market VIP |
| | |
| Performance Summary | | December 31, 2017 (Unaudited) |
All performance shown is historical, assumes reinvestment of all dividend and capital gain distributions and does not guarantee future results. Investment return and principal value fluctuate with changing market conditions so that, when redeemed, shares may be worth more or less than their original cost. Current performance may be lower or higher than the performance data quoted. Please contact your participating insurance company for the Fund’s most recent month-end performance. Performance doesn’t reflect charges and fees (“contract charges”) associated with the separate account that invests in the Fund or any variable life insurance policy or variable annuity contract for which the Fund is an investment option. These charges and fees will reduce returns. The yield quotation more closely reflects the current earnings of the Fund than the total return quotation.
You could lose money by investing in the Fund. Although the Fund seeks to preserve the value of your investment at $1.00 per share, it cannot guarantee it will do so. An investment in the Fund is not insured or guaranteed by the Federal Deposit Insurance Corporation or any other government agency. The Fund’s sponsor has no legal obligation to provide financial support to the Fund, and you should not expect that the sponsor will provide financial support to the Fund at any time.
| | |
| |
| | | 7-Day Current Yield |
| December 31, 2017 | | .83% |
| December 31, 2016 | | .04%* |
| * | The investment advisor has agreed to waive fees/reimburse expenses. Without such fee waivers/expense reimbursements, the 7-day current yield would have been lower. |
Yields are historical, will fluctuate and do not guarantee future performance. The 7-day current yield refers to the income paid by the Fund over a 7-day period expressed as an annual percentage rate of the Fund’s shares outstanding.
| | | | |
Deutsche Variable Series II — Deutsche Government Money Market VIP | | | | | 3 |
| | |
| Management Summary | | December 31, 2017 (Unaudited) |
During the 12-month period ended December 31, 2017, the Fund provided a total return of 0.45% (Class A shares, unadjusted for contract charges). All performance is historical and does not guarantee future results. Yields fluctuate and are not guaranteed.
Over the past 12 months ended December 31, 2017, short-term rates moved up based on a growing U.S. economy and evolving U.S. Federal Reserve Board (the Fed) statements and actions. Following a tumultuous election season in 2016, the first quarter of 2017 saw continued market improvements in anticipation of economically friendly fiscal policy initiatives from the incoming administration. While these policy expectations were eventually tempered, equity markets continued to climb, and hawkish statements from the Fed had investors pricing in a more aggressive Fed rate policy in 2017. Though the Fed did raise short-term rates at its March meeting, the accompanying statement was more restrained in tone, and short-term rate expectations moderated. Despite softening inflation data in the second quarter, a strong U.S. labor market prompted the Fed to raise short-term rates again in June, keeping its forward rate forecast unchanged and stating that the central bank would soon begin to unwind its significant holdings in Treasury and mortgage securities. By the end of the summer, the money market yield curve had flattened in reaction to political uncertainty in Washington, D.C. and the lack of any sign of an uptick in U.S. inflation. As we moved into the fourth quarter, concerns were expressed regarding the expiration of the government’s debt ceiling, with accompanying volatility in rates in October, but Congress was able to keep the government operating with a short-term agreement with the administration. This cleared the way for the market to increase its projection for economic growth in 2018. The economy continued to perform well, with unemployment at 4.1%. Yields moved higher in reaction to the Fed’s December rate hike, its third such move in 2017.
We were able to maintain what we believe to be a competitive yield for the Fund during the annual period ended December 31, 2017. The Fund held a large percentage of portfolio assets in agency and Treasury floating-rate securities linked to LIBOR to take advantage of an incremental rise in those rates. At the same time, the Fund invested in overnight agency repurchase agreements for liquidity and looked for yield opportunities from three- to six-month agency and Treasury securities.
In 2018, a number of factors could combine to push short-term rates higher. First, under the new federal tax law approved late last year, we may see some repatriation of corporate assets back to the United States, which could cause a decline in demand for money market instruments and push rates higher in response. Second, a tightening U.S. labor market could cause inflation to reawaken to some degree, and thus exert additional upward pressure on rates. Our current forecast is for two to three short-term rate hikes by the Fed in 2018. However, some analysts believe that Jerome Powell’s assumption of the Fed Chairmanship in March may tilt the U.S. central bank into a more hawkish stance regarding the normalization of short-term rates.
A group of investment professionals is responsible for the day-to-day management of the Fund. These investment professionals have a broad range of experience managing money market funds.
The views expressed reflect those of the portfolio management team only through the end of the period of the report as stated on the cover. The management team’s views are subject to change at any time based on market and other conditions and should not be construed as a recommendation. Past performance is no guarantee of future results. Current and future portfolio holdings are subject to risk.
| | | | | | |
| | 4 | | | | | | Deutsche Variable Series II — Deutsche Government Money Market VIP |
Terms to Know
The yield curve is a graphical representation of how yields on bonds of different maturities compare. Normally, yield curves slant up, as bonds with longer maturities typically offer higher yields than short-term bonds.
Floating-rate securities are debt instruments with floating-rate coupons that generally reset every 30 to 90 days. While floating-rate securities are senior to equity and fixed-income securities, there is no guaranteed return of principal in case of default. Floating-rate issues often have less interest-rate risk than other fixed-income investments. Floating-rate securities are most often secured assets, generally senior to a company’s secured debt, and can be transferred to debt holders, resulting in potential downside risk.
LIBOR, or the London Interbank Offered Rate, is a widely used benchmark for short-term taxable interest rates.
A repurchase agreement, or “overnight repo,” is an agreement between a seller and a buyer, usually of government securities, where the seller agrees to repurchase the securities at a given price and usually at a stated time. Repos are widely used money market instruments that serve as an interest-bearing, short-term “parking place” for large sums of money.
| | | | |
Deutsche Variable Series II — Deutsche Government Money Market VIP | | | | | 5 |
| | |
| Portfolio Summary | | December 31, 2017 (Unaudited) |
| | | | | | | | |
| Asset Allocation (As a % of Investment Portfolio) | | 12/31/17 | | | 12/31/16 | |
| Government & Agency Obligations | | | 76% | | | | 58% | |
| Repurchase Agreements | | | 24% | | | | 42% | |
| | | | 100% | | | | 100% | |
| | |
| Weighted Average Maturity | | 12/31/17 | | | 12/31/16 | |
| Deutsche Variable Series II — Deutsche Government Money Market VIP | | | 26 days | | | | 29 days | |
| Government & Agency Retail Money Fund Average* | | | 30 days | | | | 36 days | |
| * | The Fund is compared to its respective iMoneyNet Category: Government & Agency Retail Money Fund Average — Category includes the most broadly based of the government retail funds. These funds may invest in U.S. Treasury securities, securities issued or guaranteed by the U.S. Government or its agencies or instrumentalities. |
Weighted average maturity, also known as effective maturity, is the weighted average of the maturity date of bonds held by the Fund taking into consideration any available maturity shortening features.
Portfolio holdings and characteristics are subject to change.
For more complete details about the Fund’s investment portfolio, see page 7.
Following the Fund’s fiscal first and third quarter-end, a complete portfolio holdings listing is filed with the SEC on Form N-Q. In addition, each month, information about the Fund and its portfolio holdings is filed with the SEC on Form N-MFP. The SEC delays the public availability of the information filed on Form N-MFP for 60 days after the end of the reporting period included in the filing. These forms will be available on the SEC’s Web site at sec.gov, and they may also be reviewed and copied at the SEC’s Public Reference Room in Washington, D.C. Information on the operation of the SEC’s Public Reference Room may be obtained by calling (800) SEC-0330. The Fund’s portfolio holdings are also posted on deutschefunds.com from time to time. Please see the Fund’s current prospectus for more information.
| | | | | | |
| | 6 | | | | | | Deutsche Variable Series II — Deutsche Government Money Market VIP |
| | |
| Investment Portfolio | | December 31, 2017 |
| | | | | | | | |
| | | Principal
Amount ($) | | | Value ($) | |
| Government & Agency Obligations 76.0% | |
| U.S. Government Sponsored Agencies 51.1% | |
Federal Farm Credit Bank: | | | | | | | | |
1-month LIBOR minus 0.180%, 1.192%*, 3/2/2018 | | | 1,000,000 | | | | 1,000,000 | |
1-month LIBOR minus 0.065%, 1.436%*, 7/20/2018 | | | 1,200,000 | | | | 1,200,000 | |
1-month LIBOR minus 0.115%, 1.437%*, 7/23/2018 | | | 1,500,000 | | | | 1,499,965 | |
1-month LIBOR minus 0.130%, 1.439%*, 4/29/2019 | | | 3,500,000 | | | | 3,500,000 | |
1-month LIBOR minus 0.095%, 1.44%*, 7/25/2019 | | | 1,000,000 | | | | 999,980 | |
1-month LIBOR plus 0.040%, 1.472%*, 1/10/2019 | | | 500,000 | | | | 500,362 | |
3-month Treasury Money
Market Yield plus 0.280%,
1.73%*, 11/13/2018 | | | 1,500,000 | | | | 1,500,000 | |
Federal Home Loan Bank: | | | | | | | | |
3-month LIBOR minus 0.380%, 1.023%*, 2/9/2018 | | | 2,000,000 | | | | 2,000,000 | |
1.156%**, 1/31/2018 | | | 1,000,000 | | | | 999,050 | |
1-month LIBOR minus 0.170%, 1.191%*, 2/1/2018 | | | 4,500,000 | | | | 4,500,000 | |
1-month LIBOR minus 0.180%, 1.192%*, 2/2/2018 | | | 1,500,000 | | | | 1,500,000 | |
1-month LIBOR minus 0.160%, 1.247%*, 2/8/2018 | | | 1,000,000 | | | | 999,994 | |
3-month LIBOR minus 0.150%, 1.269%*, 2/16/2018 | | | 1,750,000 | | | | 1,749,955 | |
1-month LIBOR minus 0.080%, 1.292%*, 2/4/2019 | | | 800,000 | | | | 800,000 | |
1-month LIBOR minus 0.190%, 1.301%*, 2/16/2018 | | | 2,750,000 | | | | 2,749,956 | |
3-month LIBOR minus 0.160%, 1.302%*, 2/26/2018 | | | 1,000,000 | | | | 1,000,064 | |
1.305%**, 2/2/2018 | | | 1,000,000 | | | | 998,856 | |
1-month LIBOR minus 0.160%, 1.317%*, 5/15/2018 | | | 600,000 | | | | 600,000 | |
1.318%**, 3/5/2018 | | | 500,000 | | | | 498,863 | |
3-month LIBOR minus 0.160%, 1.321%*, 5/30/2018 | | | 1,000,000 | | | | 1,000,000 | |
1-month LIBOR minus 0.110%, 1.322%*, 10/11/2018 | | | 3,500,000 | | | | 3,501,048 | |
1-month LIBOR minus 0.145%, 1.332%*, 8/15/2018 | | | 600,000 | | | | 600,000 | |
1-month LIBOR minus 0.160%, 1.335%*, 7/19/2018 | | | 1,500,000 | | | | 1,500,000 | |
1-month LIBOR minus 0.150%, 1.341%*, 7/16/2018 | | | 2,000,000 | | | | 2,000,000 | |
1-month LIBOR minus 0.135%, 1.356%*, 5/17/2018 | | | 2,500,000 | | | | 2,500,000 | |
1.375%, 3/9/2018 | | | 1,185,000 | | | | 1,185,382 | |
1-month LIBOR minus 0.125%, 1.376%*, 8/20/2018 | | | 2,000,000 | | | | 2,000,000 | |
1-month LIBOR minus 0.025%, 1.382%*, 3/8/2018 | | | 750,000 | | | | 750,000 | |
1-month LIBOR minus 0.165%, 1.387%*, 1/23/2018 | | | 1,000,000 | | | | 1,000,000 | |
1.489%**, 6/8/2018 | | | 500,000 | | | | 496,776 | |
Federal Home Loan Mortgage Corp.: | | | | | |
1.095%**, 2/6/2018 | | | 1,200,000 | | | | 1,198,704 | |
| | | | | | | | |
| | | Principal
Amount ($) | | | Value ($) | |
3-month LIBOR minus 0.250%,
1.1%*, 10/10/2018 | | | 1,000,000 | | | | 1,000,000 | |
1.125%**, 2/20/2018 | | | 1,500,000 | | | | 1,497,687 | |
3-month LIBOR minus 0.280%,
1.13%*, 8/10/2018 | | | 500,000 | | | | 500,000 | |
1.186%**, 3/14/2018 | | | 1,000,000 | | | | 997,660 | |
3-month LIBOR minus 0.200%,
1.246%*, 2/22/2018 | | | 1,000,000 | | | | 1,000,000 | |
1-month LIBOR minus 0.170%,
1.302%*, 6/14/2018 | | | 1,000,000 | | | | 1,000,000 | |
1-month LIBOR minus 0.080%,
1.392%*, 2/14/2019 | | | 2,000,000 | | | | 2,000,000 | |
Federal National Mortgage Association: | | | | | |
1.308%**, 3/22/2018 | | | 1,000,000 | | | | 997,133 | |
3-month LIBOR minus 0.030%,
1.326%*, 1/11/2018 | | | 1,500,000 | | | | 1,500,131 | |
| | | | | | | | |
| | | | | | | 56,821,566 | |
|
| U.S. Treasury Obligations 24.9% | |
U.S. Treasury Bills: | | | | | | | | |
Zero Coupon**, 4/5/2018 | | | 650,000 | | | | 647,657 | |
Zero Coupon**, 4/5/2018 | | | 650,000 | | | | 647,655 | |
1.118%**, 2/22/2018 | | | 2,000,000 | | | | 1,996,814 | |
1.151%**, 3/8/2018 | | | 2,500,000 | | | | 2,494,798 | |
1.156%**, 3/15/2018 | | | 1,000,000 | | | | 997,415 | |
1.291%**, 3/22/2018 | | | 750,000 | | | | 747,874 | |
1.293%**, 3/15/2018 | | | 1,000,000 | | | | 997,688 | |
1.293%**, 3/15/2018 | | | 1,000,000 | | | | 997,415 | |
1.294%**, 3/22/2018 | | | 2,250,000 | | | | 2,243,623 | |
1.305%**, 3/8/2018 | | | 2,000,000 | | | | 1,995,281 | |
3.022%**, 5/31/2018 | | | 1,200,000 | | | | 1,192,692 | |
U.S. Treasury Floating Rate Notes: | | | | | | | | |
3-month Treasury Money
Market Yield plus 0.070%,
1.52%*, 4/30/2019 | | | 1,000,000 | | | | 1,000,249 | |
3-month Treasury Money
Market Yield plus 0.170%,
1.62%*, 10/31/2018 | | | 2,050,000 | | | | 2,053,803 | |
3-month Treasury Money
Market Yield plus 0.190%,
1.64%*, 4/30/2018 | | | 3,225,000 | | | | 3,225,663 | |
3-month Treasury Money
Market Yield plus 0.272%,
1.722%*, 1/31/2018 | | | 6,500,000 | | | | 6,501,080 | |
| | | | | | | | |
| | | | | | | | 27,739,707 | |
Total Government & Agency Obligations
(Cost $84,561,273) | | | | 84,561,273 | |
|
| Repurchase Agreements 24.0% | |
Wells Fargo Bank, 1.41%, dated 12/29/2017, to be repurchased at $26,650,175 on 1/2/2018(a) (Cost $26,646,000) | | | 26,646,000 | | | | 26,646,000 | |
| | |
| | | % of Net
Assets | | | Value ($) | |
Total Investment Portfolio
(Cost $111,207,273) | | | 100.0 | | | | 111,207,273 | |
| Other Assets and Liabilities, Net | | | 0.0 | | | | 12,689 | |
| Net Assets | | | 100.0 | | | | 111,219,962 | |
The accompanying notes are an integral part of the financial statements.
| | | | |
Deutsche Variable Series II — Deutsche Government Money Market VIP | | | | | 7 |
| * | Floating rate security. These securities are shown at their current rate as of December 31, 2017. |
| ** | Annualized yield at time of purchase; not a coupon rate. |
| | | | | | | | | | | | | | |
Principal
Amount ($) | | Security | | Rate (%) | | | Maturity
Date | | | Collateral
Value ($) | |
| 21,021,823 | | Federal Home Loan Mortgage Corp. | | | 3.0-4.0 | | | | 12/1/2032-11/1/2047 | | | | 21,821,638 | |
| 5,211,755 | | Federal National Mortgage Association | | | 3.0-3.5 | | | | 12/1/2032-11/1/2047 | | | | 5,357,282 | |
Total Collateral Value
|
| | | | | | | 27,178,920 | |
LIBOR: London Interbank Offered Rate
Fair Value Measurements
Various inputs are used in determining the value of the Fund’s investments. These inputs are summarized in three broad levels. Level 1 includes quoted prices in active markets for identical securities. Level 2 includes other significant observable inputs (including quoted prices for similar securities, interest rates, prepayment speeds and credit risk). Level 3 includes significant unobservable inputs (including the Fund’s own assumptions in determining the fair value of investments). The level assigned to the securities valuations may not be an indication of the risk or liquidity associated with investing in those securities. Securities held by the Fund are reflected as Level 2 because the securities are valued at amortized cost (which approximates fair value) and, accordingly, the inputs used to determine value are not quoted prices in an active market.
The following is a summary of the inputs used as of December 31, 2017 in valuing the Fund’s investments. For information on the Fund’s policy regarding the valuation of investments, please refer to the Security Valuation section of Note A in the accompanying Notes to Financial Statements.
| | | | | | | | | | | | | | | | |
| Assets | | Level 1 | | | Level 2 | | | Level 3 | | | Total | |
| Investments in Securities (b) | | $ | — | | | $ | 84,561,273 | | | $ | — | | | $ | 84,561,273 | |
| Repurchase Agreement | | | — | | | | 26,646,000 | | | | — | | | | 26,646,000 | |
| Total | | $ | — | | | $ | 111,207,273 | | | $ | — | | | $ | 111,207,273 | |
There have been no transfers between fair value measurement levels during the year ended December 31, 2017.
| (b) | See Investment Portfolio for additional detailed categorizations. |
The accompanying notes are an integral part of the financial statements.
| | | | | | |
| | 8 | | | | | | Deutsche Variable Series II — Deutsche Government Money Market VIP |
Statement of Assets and Liabilities
| | | | |
| As of December 31, 2017 | |
|
| Assets | |
| Investments in securities, valued at amortized cost | | $ | 84,561,273 | |
| Repurchased agreement, valued at amortized cost | | | 26,646,000 | |
| Cash | | | 729 | |
| Receivable for investments sold | | | 1,292,303 | |
| Receivable for Fund shares sold | | | 167,590 | |
| Interest receivable | | | 85,375 | |
| Other assets | | | 2,229 | |
| Total assets | | | 112,755,499 | |
|
| Liabilities | |
| Payable for investments purchased | | | 1,295,312 | |
| Payable for Fund shares redeemed | | | 38,476 | |
| Distributions payable | | | 35,080 | |
| Accrued management fee | | | 22,112 | |
| Accrued Trustees’ fees | | | 2,709 | |
| Other accrued expenses and payables | | | 141,848 | |
| Total liabilities | | | 1,535,537 | |
| Net assets, at value | | $ | 111,219,962 | |
|
| Net Assets Consist of | |
| Undistributed net investment income | | | 14,912 | |
| Accumulated net realized gain (loss) | | | 53 | |
| Paid-in capital | | | 111,204,997 | |
| Net assets, at value | | $ | 111,219,962 | |
Class A Net Asset Value | |
| Net asset value, offering and redemption price per share ($111,219,962 ÷ 111,288,713 outstanding shares of beneficial interest, no par value, unlimited number of shares authorized) | | $ | 1.00 | |
Statement of Operations
| | | | |
| For the year ended December 31, 2017 | |
|
| Investment Income | |
| Income: | |
| Interest | | $ | 1,131,133 | |
| Expenses: | |
| Management fee | | | 284,839 | |
| Administration fee | | | 121,208 | |
| Services to shareholders | | | 2,878 | |
| Custodian fee | | | 9,259 | |
| Professional fees | | | 55,902 | |
| Reports to shareholders | | | 94,217 | |
| Trustees’ fees and expenses | | | 8,430 | |
| Other | | | 6,574 | |
| Total expenses | | | 583,307 | |
| Net investment income | | | 547,826 | |
| |
| Net realized gain (loss) from investments | | | 53 | |
| Net increase (decrease) in net assets resulting from operations | | $ | 547,879 | |
The accompanying notes are an integral part of the financial statements.
| | | | |
Deutsche Variable Series II — Deutsche Government Money Market VIP | | | | | 9 |
Statements of Changes in Net Assets
| | | | | | | | |
| | | Years Ended December 31, | |
| Increase (Decrease) in Net Assets | | 2017 | | | 2016 | |
| Operations: | | | | | | | | |
| Net investment income (loss) | | $ | 547,826 | | | $ | 63,700 | |
| Net realized gain (loss) | | | 53 | | | | 14,243 | |
| Net increase (decrease) in net assets resulting from operations | | | 547,879 | | | | 77,943 | |
| Distributions to shareholders from: | | | | | | | | |
| Net investment income | | | | | | | | |
Class A | | | (547,829 | ) | | | (63,706 | ) |
| Fund share transactions: | | | | | | | | |
Class��A | | | | | | | | |
| Proceeds from shares sold | | | 111,220,770 | | | | 122,352,015 | |
| Reinvestment of distributions | | | 514,778 | | | | 62,278 | |
| Cost of shares redeemed | | | (122,921,320 | ) | | | (134,243,063 | ) |
| Net increase (decrease) in net assets from Class A share transactions | | | (11,185,772 | ) | | | (11,828,770 | ) |
| Increase (decrease) in net assets | | | (11,185,722 | ) | | | (11,814,533 | ) |
| Net assets at beginning of period | | | 122,405,684 | | | | 134,220,217 | |
Net assets at end of year (including undistributed net investment income of $14,912 and
$ 14,915, respectively) | | $ | 111,219,962 | | | $ | 122,405,684 | |
| | |
| Other Information | | | | | | | | |
Class A | | | | | | | | |
| Shares outstanding at beginning of period | | | 122,474,485 | | | | 134,303,255 | |
| Shares sold | | | 111,220,770 | | | | 122,352,015 | |
| Shares issued to shareholders in reinvestment of distributions | | | 514,778 | | | | 62,278 | |
| Shares redeemed | | | (122,921,320 | ) | | | (134,243,063 | ) |
| Net increase (decrease) in Class A shares | | | (11,185,772 | ) | | | (11,828,770 | ) |
| Shares outstanding at end of period | | | 111,288,713 | | | | 122,474,485 | |
The accompanying notes are an integral part of the financial statements.
| | | | | | |
| | 10 | | | | | | Deutsche Variable Series II — Deutsche Government Money Market VIP |
Financial Highlights
| | | | | | | | | | | | | | | | | | | | |
| | | | | | Years Ended December 31, | |
| Class A | | 2017 | | | 2016 | | | 2015 | | | 2014 | | | 2013 | |
| | | | | |
Selected Per Share Data | | | | | | | | | | | | | | | | | | | | |
Net asset value, beginning of period | | $ | 1.00 | | | $ | 1.00 | | | $ | 1.00 | | | $ | 1.00 | | | $ | 1.00 | |
Income from investment operations: | | | | | | | | | | | | | | | | | | | | |
Net investment income | | | .005 | * | | | .001 | b | | | .000 | * | | | .000 | * | | | .000 | * |
Net realized gain (loss) | | | .000 | * | | | .000 | * | | | (.000 | )* | | | .000 | * | | | .000 | * |
Total from investment operations | | | .005 | * | | | .001 | | | | .000 | * | | | .000 | * | | | .000 | * |
Less distributions from: | | | | | | | | | | | | | | | | | | | | |
Net investment income | | | (.005 | )* | | | (.001 | ) | | | (.000 | )* | | | (.000 | )* | | | (.000 | )* |
Net asset value, end of period | | $ | 1.00 | | | $ | 1.00 | | | $ | 1.00 | | | $ | 1.00 | | | $ | 1.00 | |
Total Return (%) | | | .45 | | | | .05 | a,b | | | .01 | a | | | .01 | a | | | .01 | a |
| | | | | |
Ratios to Average Net Assets and Supplemental Data | | | | | | | | | | | | | | | | | | | | |
Net assets, end of period ($ millions) | | | 111 | | | | 122 | | | | 134 | | | | 177 | | | | 174 | |
Ratio of expenses before expense reductions (%)c | | | .48 | | | | .51 | | | | .49 | | | | .49 | | | | .49 | |
Ratio of expenses after expense reductions (%)c | | | .48 | | | | .44 | | | | .25 | | | | .18 | | | | .20 | |
Ratio of net investment income (%) | | | .45 | | | | .05 | b | | | .01 | | | | .01 | | | | .01 | |
| a | Total return would have been lower had certain expenses not been reduced. |
| b | Includes a non-recurring payment for overbilling of prior years’ custodian out-of-pocket fees. Excluding this payment, net investment income per share, total return, and ratio of net investment income to average net assets would have been reduced by $0.0004, 0.04%, and 0.04%, respectively. |
| c | Expense ratio does not reflect charges and fees associated with the separate account that invests in the Fund or any variable life insurance policy or variable annuity contract for which the Fund is an investment option. |
| * | Amount is less than $.0005. |
| | | | |
Deutsche Variable Series II — Deutsche Government Money Market VIP | | | | | 11 |
Notes to Financial Statements
A. Organization and Significant Accounting Policies
Deutsche Government Money Market VIP (the “Fund”) is a diversified series of Deutsche Variable Series II (the “Trust”), which is registered under the Investment Company Act of 1940, as amended (the “1940 Act”), as an open-end management investment company organized as a Massachusetts business trust.
The Fund’s financial statements are prepared in accordance with accounting principles generally accepted in the United States of America (“U.S. GAAP”) which require the use of management estimates. Actual results could differ from those estimates. The Fund qualifies as an investment company under Topic 946 of Accounting Standards Codification of U.S. GAAP. The policies described below are followed consistently by the Fund in the preparation of its financial statements.
Security Valuation. Various inputs are used in determining the value of the Fund’s investments. These inputs are summarized in three broad levels. Level 1 includes quoted prices in active markets for identical securities. Level 2 includes other significant observable inputs (including quoted prices for similar securities, interest rates, prepayment speeds and credit risk). Level 3 includes significant unobservable inputs (including the Fund’s own assumptions in determining the fair value of investments). The level assigned to the securities valuations may not be an indication of the risk or liquidity associated with investing in those securities.
The Fund values all securities utilizing the amortized cost method permitted in accordance with Rule 2a-7 under the 1940 Act and certain conditions therein. Under this method, which does not take into account unrealized capital gains or losses on securities, an instrument is initially valued at its cost and thereafter assumes a constant accretion/amortization rate to maturity of any discount or premium. Securities held by the Fund are reflected as Level 2 because the securities are valued at amortized cost (which approximates fair value) and, accordingly, the inputs used to determine value are not quoted prices in an active market.
Disclosure about the classification of fair value measurements is included in a table following the Fund’s Investment Portfolio.
Repurchase Agreements. The Fund may enter into repurchase agreements, under the terms of a Master Repurchase Agreement, with certain banks and broker/dealers whereby the Fund, through its custodian or a sub-custodian bank, receives delivery of the underlying securities, the amount of which at the time of purchase and each subsequent business day is required to be maintained at such a level that the value is equal to at least the principal amount of the repurchase price plus accrued interest. The custodian bank or another designated sub-custodian holds the collateral in a separate account until the agreement matures. If the value of the securities falls below the principal amount of the repurchase agreement plus accrued interest, the financial institution deposits additional collateral by the following business day. If the financial institution either fails to deposit the required additional collateral or fails to repurchase the securities as agreed, the Fund has the right to sell the securities and recover any resulting loss from the financial institution. If the financial institution enters into bankruptcy, the Fund’s claim on the collateral may be subject to legal proceedings.
As of December 31, 2017 the Fund held repurchase agreements with a gross value of $26,646,000. The value of the related collateral exceeded the value of the repurchase agreements at period end. The detail of the related collateral is included in the footnotes following the Fund’s Investment Portfolio.
Federal Income Taxes. The Fund’s policy is to comply with the requirements of the Internal Revenue Code, as amended, which are applicable to regulated investment companies and to distribute all of its taxable income to its shareholders.
From November 1, 2017 through December 31, 2017, the Fund elects to defer qualified late year losses of $53 of net short-term realized capital losses and treat them as arising in the fiscal year ending December 31, 2018.
The Fund has reviewed the tax positions for the open tax years as of December 31, 2017 and has determined that no positions for income tax and/or uncertain tax positions is required in the Fund’s financial statements. The Fund’s federal tax returns for the prior three fiscal years remain open subject to examination by the Internal Revenue Service.
Distribution of Income and Gains. Net investment income of the Fund is declared as a daily dividend and is distributed to shareholders monthly. The Fund may take into account capital gains and losses in its daily dividend declarations. The Fund may also make additional distributions for tax purposes if necessary.
| | | | | | |
| | 12 | | | | | | Deutsche Variable Series II — Deutsche Government Money Market VIP |
Permanent book and tax differences relating to shareholder distributions will result in reclassifications to paid-in capital. Temporary book and tax differences will reverse in a subsequent period. There were no significant book to tax differences for the Fund.
At December 31, 2017, the Fund’s components of distributable earnings on a tax basis were as follows:
| | | | | | |
| Undistributed ordinary income | | $ | 14,912 | |
At December 31, 2017, the aggregate cost of investments for federal income tax purposes was $111,207,273.
In addition, the tax character of distributions paid by the Fund is summarized as follows:
| | | | | | | | |
| | | Years Ended December 31, | |
| | | 2017 | | | 2016 | |
| Distributions from ordinary income | | $ | 547,829 | | | $ | 63,706 | |
Expenses. Expenses of the Trust arising in connection with a specific fund are allocated to that fund. Other Trust expenses which cannot be directly attributed to a fund are apportioned among the funds in the Trust based upon the relative net assets or other appropriate measures.
Contingencies. In the normal course of business, the Fund may enter into contracts with service providers that contain general indemnification clauses. The Fund’s maximum exposure under these arrangements is unknown, as this would involve future claims that may be made against the Fund that have not yet been made. However, based on experience, the Fund expects the risk of loss to be remote.
Other. Investment transactions are accounted for on a trade date. Interest income is recorded on the accrual basis. Realized gains and losses from investment transactions are recorded on an identified cost basis. All discounts and premiums are accreted/amortized for both tax and financial reporting purposes.
B. Related Parties
Management Agreement. Under the Investment Management Agreement with Deutsche Investment Management Americas Inc. (“DIMA” or the “Advisor”), an indirect, wholly owned subsidiary of Deutsche Bank AG, the Advisor directs the investments of the Fund in accordance with its investment objectives, policies and restrictions. The Advisor determines the securities, instruments and other contracts relating to investments to be purchased, sold or entered into by the Fund.
Pursuant to the Investment Management Agreement with the Advisor, the Fund pays the Advisor a monthly management fee based on its average daily net assets, computed and accrued daily and payable monthly, at the following annual rates:
| | | | |
| First $500 million | | | .235 | % |
| Next $500 million | | | .220 | % |
| Next $1.0 billion | | | .205 | % |
| Over $2.0 billion | | | .190 | % |
For the period from January 1, 2017 through September 30, 2018, the Advisor has contractually agreed to waive its fee and/or reimburse certain operating expenses to the extent necessary to maintain the total annual operating expenses (excluding certain expenses such as extraordinary expenses, taxes, brokerage and interest expense) at 0.51%.
Accordingly, for the year ended December 31, 2017 the fee pursuant to the Investment Management Agreement aggregated $284,839, of which $22,112 is unpaid, resulting in an annual effective rate of 0.235% of the Fund’s average daily net assets.
Administration Fee. Pursuant to an Administrative Services Agreement, DIMA provides most administrative services to the Fund. For all services provided under the Administrative Services Agreement, the Fund pays DIMA an annual fee (“Administration Fee”) of 0.10% of the Fund’s average daily net assets, computed and accrued daily and payable monthly. For the year ended December 31, 2017 the Administration Fee was $121,208, of which $9,409 is unpaid.
Service Provider Fees. Deutsche AM Service Company (“DSC”), an affiliate of the Advisor, is the transfer agent, dividend-paying agent and shareholder service agent for the Fund. Pursuant to a sub-transfer agency agreement between DSC and DST Systems, Inc. (“DST”), DSC has delegated certain transfer agent, dividend-paying agent and shareholder service agent functions to DST. DSC compensates DST out of the
| | | | |
Deutsche Variable Series II — Deutsche Government Money Market VIP | | | | | 13 |
shareholder servicing fee it receives from the Fund. For the year ended December 31, 2017 the amounts charged to the Fund by DSC aggregated $2,613, of which $609 is unpaid.
Typesetting and Filing Service Fees. Under an agreement with DIMA, DIMA is compensated for providing certain pre-press and regulatory filing services to the Fund. For the year ended December 31, 2017 the amount charged to the Fund by DIMA included in the Statement of Operations under “Reports to shareholders” aggregated $8,734, of which $4,009 is unpaid.
Trustees’ Fees and Expenses. The Fund paid retainer fees to each Trustee not affiliated with the Advisor, plus specified amounts to the Board Chairperson and Vice Chairperson and to each committee Chairperson.
C. Ownership of the Fund
At December 31, 2017 three participating insurance companies were owners of record of 10% or more of the total outstanding Class A shares of the Fund, each owning 47%, 20% and 16%.
D. Line of Credit
The Fund and other affiliated funds (the “Participants”) share in a $400 million revolving credit facility provided by a syndication of banks. The Fund may borrow for temporary or emergency purposes, including the meeting of redemption requests that otherwise might require the untimely disposition of securities. The Participants are charged an annual commitment fee which is allocated based on net assets, among each of the Participants. Interest is calculated at a rate per annum equal to the sum of the Federal Funds Rate, plus 1.25 percent plus if the one-month LIBOR exceeds the Federal Funds Rate, the amount of such excess. The Fund may borrow up to a maximum of 33 percent of its net assets under the agreement. The Fund had no outstanding loans at December 31, 2017.
| | | | | | |
| | 14 | | | | | | Deutsche Variable Series II — Deutsche Government Money Market VIP |
Report of Independent Registered Public Accounting Firm
To the Board of Trustees of Deutsche Variable Series II and the Shareholders of Deutsche Government Money Market VIP:
Opinion on the Financial Statements
We have audited the accompanying statement of assets and liabilities of Deutsche Government Money Market VIP (the “Fund”) (one of the funds constituting the Deutsche Variable Series II) (the “Trust”), including the schedule of investments, as of December 31, 2017, and the related statement of operations for the year then ended, the statements of changes in net assets for each of the two years in the period then ended, the financial highlights for each of the five years in the period then ended and the related notes (collectively referred to as the “financial statements”). In our opinion, the financial statements present fairly, in all material respects, the financial position of the Fund (one of the funds constituting the Deutsche Variable Series II) at December 31, 2017, the results of its operations for the year then ended, the changes in its net assets for each of the two years in the period then ended and its financial highlights for each of the five years in the period then ended, in conformity with U.S. generally accepted accounting principles.
Basis for Opinion
These financial statements are the responsibility of the Trust’s management. Our responsibility is to express an opinion on the Fund’s financial statements based on our audits. We are a public accounting firm registered with the Public Company Accounting Oversight Board (United States) (“PCAOB”) and are required to be independent with respect to the Trust in accordance with the U.S. federal securities laws and the applicable rules and regulations of the Securities and Exchange Commission and the PCAOB.
We conducted our audits in accordance with the standards of the PCAOB. Those standards require that we plan and perform the audit to obtain reasonable assurance about whether the financial statements are free of material misstatement, whether due to error or fraud. The Trust is not required to have, nor were we engaged to perform, an audit of the Trust’s internal control over financial reporting. As part of our audits, we are required to obtain an understanding of internal control over financial reporting, but not for the purpose of expressing an opinion on the effectiveness of the Trust’s internal control over financial reporting. Accordingly, we express no such opinion.
Our audits included performing procedures to assess the risks of material misstatement of the financial statements, whether due to error or fraud, and performing procedures that respond to those risks. Such procedures included examining, on a test basis, evidence regarding the amounts and disclosures in the financial statements. Our procedures included confirmation of securities owned as of December 31, 2017, by correspondence with the custodian and brokers or by other appropriate auditing procedures where replies from brokers were not received.
Our audits also included evaluating the accounting principles used and significant estimates made by management, as well as evaluating the overall presentation of the financial statements. We believe that our audits provide a reasonable basis for our opinion.
|

|
We have served as the auditor of one or more investment companies in the Deutsche family of funds since at least 1979, but we are unable to determine the specific year. Boston, Massachusetts February 15, 2018 |
| | | | |
Deutsche Variable Series II — Deutsche Government Money Market VIP | | | | | 15 |
| | |
| Information About Your Fund’s Expenses | | (Unaudited) |
As an investor of the Fund, you incur two types of costs: ongoing expenses and transaction costs. Ongoing expenses include management fees and other Fund expenses. Examples of transaction costs include contract charges, which are not shown in this section. The following tables are intended to help you understand your ongoing expenses (in dollars) of investing in the Fund and to help you compare these expenses with the ongoing expenses of investing in other mutual funds. The example in the table is based on an investment of $1,000 invested at the beginning of the six-month period and held for the entire period (July 1, 2017 to December 31, 2017).
The tables illustrate your Fund’s expenses in two ways:
| – | Actual Fund Return. This helps you estimate the actual dollar amount of ongoing expenses (but not transaction costs) paid on a $1,000 investment in the Fund using the Fund’s actual return during the period. To estimate the expenses you paid over the period, simply divide your account value by $1,000 (for example, an $8,600 account value divided by $1,000 = 8.6), then multiply the result by the number in the “Expenses Paid per $1,000” line under the share class you hold. |
| – | Hypothetical 5% Fund Return. This helps you to compare your Fund’s ongoing expenses (but not transaction costs) with those of other mutual funds using the Fund’s actual expense ratio and a hypothetical rate of return of 5% per year before expenses. Examples using a 5% hypothetical Fund return may be found in the shareholder reports of other mutual funds. The hypothetical account values and expenses may not be used to estimate the actual ending account balance or expenses you paid for the period. |
Please note that the expenses shown in these tables are meant to highlight your ongoing expenses only and do not reflect any transaction costs. The “Expenses Paid per $1,000” line of the tables is useful in comparing ongoing expenses only and will not help you determine the relative total expense of owning different funds. If these transaction costs had been included, your costs would have been higher.
| | | | |
| Expenses and Value of a $1,000 Investment for the six months December 31, 2017 | | | |
| |
| Actual Fund Return | | | Class A | |
| Beginning Account Value 7/1/17 | | $ | 1,000.00 | |
| Ending Account Value 12/31/17 | | $ | 1,003.20 | |
| Expenses Paid per $1,000* | | $ | 2.42 | |
| |
| Hypothetical 5% Fund Return | | | Class A | |
| Beginning Account Value 7/1/17 | | $ | 1,000.00 | |
| Ending Account Value 12/31/17 | | $ | 1,022.79 | |
| Expenses Paid per $1,000* | | $ | 2.45 | |
| * | Expenses are equal to the Fund’s annualized expense ratio, multiplied by the average account value over the period, multiplied by 184 (the number of days in the most recent six-month period), then divided by 365. |
| | | | |
| Annualized Expense Ratio | | Class A | |
| Deutsche Variable Series II — Deutsche Government Money Market VIP | | | .48 | % |
For more information, please refer to the Fund’s prospectus.
These tables do not reflect charges and fees (“contract charges”) associated with the separate account that invests in the Fund or any variable life insurance policy or variable annuity contract for which the Fund is an investment option.
For an analysis of the fees associated with an investment in the fund or similar funds, please refer to the current and hypothetical expense calculators for Variable Insurance Products which can be found at deutschefunds.com/EN/resources/calculators.jsp.
| | | | | | |
| | 16 | | | | | | Deutsche Variable Series II — Deutsche Government Money Market VIP |
| | |
| Tax Information | | (Unaudited) |
Please consult a tax advisor if you have questions about federal or state income tax laws, or on how to prepare your tax returns. If you have specific questions about your account, please contact your insurance provider.
The Trust’s policies and procedures for voting proxies for portfolio securities and information about how the Trust voted proxies related to its portfolio securities during the most recent 12-month period ended June 30 are available on our Web site — deutschefunds.com (click on “proxy voting” at the bottom of the page) — or on the SEC’s Web site — sec.gov. To obtain a written copy of the Trust’s policies and procedures without charge, upon request, call us toll free at (800) 728-3337.
| | | | |
Deutsche Variable Series II — Deutsche Government Money Market VIP | | | | | 17 |
Advisory Agreement Board Considerations and Fee Evaluation
The Board of Trustees (hereinafter referred to as the “Board” or “Trustees”) approved the renewal of Deutsche Government Money Market VIP’s (the “Fund”) investment management agreement (the “Agreement”) with Deutsche Investment Management Americas Inc. (“DIMA”) in September 2017.
In terms of the process that the Board followed prior to approving the Agreement, shareholders should know that:
| – | | During the entire process, all of the Fund’s Trustees were independent of DIMA and its affiliates (the “Independent Trustees”). |
| – | | The Board met frequently during the past year to discuss fund matters and dedicated a substantial amount of time to contract review matters. Over the course of several months, the Board’s Contract Committee reviewed extensive materials received from DIMA, independent third parties and independent counsel. These materials included an analysis of the Fund’s performance, fees and expenses, and profitability from a fee consultant retained by the Fund’s Independent Trustees (the “Fee Consultant”). Based on its evaluation of the information provided, the Contract Committee presented its findings and recommendations to the Board. The Board then reviewed the Contract Committee’s findings and recommendations. |
| – | | The Board also received extensive information throughout the year regarding performance of the Fund. |
| – | | The Independent Trustees regularly met privately with counsel to discuss contract review and other matters. In addition, the Independent Trustees were advised by the Fee Consultant in the course of their review of the Fund’s contractual arrangements and considered a comprehensive report prepared by the Fee Consultant in connection with their deliberations. |
| – | | In connection with reviewing the Agreement, the Board also reviewed the terms of the Fund’s distribution agreement, administrative services agreement, transfer agency agreement and other material service agreements. |
In connection with the contract review process, the Contract Committee and the Board considered the factors discussed below, among others. The Board also considered that DIMA and its predecessors have managed the Fund since its inception, and the Board believes that a long-term relationship with a capable, conscientious advisor is in the best interests of the Fund. The Board considered, generally, that shareholders chose to invest or remain invested in the Fund knowing that DIMA managed the Fund, and that the Agreement was approved by the Fund’s shareholders. DIMA is part of Deutsche Bank AG’s (“Deutsche Bank”) Asset Management (“Deutsche AM”) division. Deutsche AM is a global asset management business that offers a wide range of investing expertise and resources, including research capabilities in many countries throughout the world.
As part of the contract review process, the Board carefully considered the fees and expenses of each Deutsche fund overseen by the Board in light of the fund’s performance. In many cases, this led to the negotiation and implementation of expense caps. As part of these negotiations, the Board indicated that it would consider relaxing these caps in future years following sustained improvements in performance, among other considerations.
While shareholders may focus primarily on fund performance and fees, the Fund’s Board considers these and many other factors, including the quality and integrity of DIMA’s personnel and administrative support services provided by DIMA, such as back-office operations, fund valuations, and compliance policies and procedures.
Nature, Quality and Extent of Services. The Board considered the terms of the Agreement, including the scope of advisory services provided under the Agreement. The Board noted that, under the Agreement, DIMA provides portfolio management services to the Fund and that, pursuant to a separate administrative services agreement, DIMA provides administrative services to the Fund. The Board considered the experience and skills of senior management and investment personnel and the resources made available to such personnel. The Board reviewed the Fund’s performance over short-term and long-term periods and compared those returns to various agreed-upon performance measures, including a peer universe compiled using information supplied by iMoneyNet, an independent fund data service. The Board also noted that it has put into place a process of identifying “Funds in Review” (e.g., funds performing poorly relative to a peer universe), and receives additional reporting from DIMA regarding such funds and, where appropriate, DIMA’s plans to address underperformance. The Board believes this process is an effective manner of identifying and addressing underperforming funds. Based on the information provided, the Board noted that, for the one-
| | | | | | |
| | 18 | | | | | | Deutsche Variable Series II — Deutsche Government Money Market VIP |
and three-year periods ended December 31, 2016, the Fund’s gross performance (Class A shares) was in the 1st quartile of the applicable iMoneyNet universe (the 1st quartile being the best performers and the 4th quartile being the worst performers).
Fees and Expenses. The Board considered the Fund’s investment management fee schedule, operating expenses and total expense ratios, and comparative information provided by Broadridge Financial Solutions, Inc. (“Broadridge”) and the Fee Consultant regarding investment management fee rates paid to other investment advisors by similar funds (1st quartile being the most favorable and 4th quartile being the least favorable). With respect to management fees paid to other investment advisors by similar funds, the Board noted that the contractual fee rates paid by the Fund, which include a 0.10% fee paid to DIMA under the Fund’s administrative services agreement, were lower than the median (2nd quartile) of the applicable Broadridge peer group (based on Broadridge data provided as of December 31, 2016). The Board considered that the Fund’s management fee was reduced by 0.05% at all breakpoint levels in connection with the restructuring of the Fund into a government money market fund in 2016. The Board noted that the Fund’s Class A shares total (net) operating expenses were higher than the median (4th quartile) of the applicable Broadridge expense universe (based on Broadridge data provided as of December 31, 2016, and analyzing Broadridge expense universe Class A (net) expenses less any applicable 12b-1 fees) (“Broadridge Universe Expenses”). The Board noted the expense limitation agreed to by DIMA. The Board also noted the voluntary fee waivers implemented by DIMA to ensure the Fund maintained a positive yield. The Board considered the Fund’s management fee rate as compared to fees charged by DIMA to comparable Deutsche U.S. registered funds (“Deutsche Funds”) and considered differences between the Fund and the comparable Deutsche Funds. The information requested by the Board as part of its review of fees and expenses also included information about institutional accounts (including any sub-advised funds and accounts) and funds offered primarily to European investors (“Deutsche Europe funds”) managed by Deutsche AM. The Board noted that DIMA indicated that Deutsche AM does not manage any institutional accounts or Deutsche Europe funds comparable to the Fund.
On the basis of the information provided, the Board concluded that management fees were reasonable and appropriate in light of the nature, quality and extent of services provided by DIMA.
Profitability. The Board reviewed detailed information regarding revenues received by DIMA under the Agreement. The Board considered the estimated costs to DIMA, and pre-tax profits realized by DIMA, from advising the Deutsche Funds, as well as estimates of the pre-tax profits attributable to managing the Fund in particular. The Board also received information regarding the estimated enterprise-wide profitability of DIMA and its affiliates with respect to all fund services in totality and by fund. The Board and the Fee Consultant reviewed DIMA’s methodology in allocating its costs to the management of the Fund. Based on the information provided, the Board concluded that the pre-tax profits realized by DIMA in connection with the management of the Fund were not unreasonable. The Board also reviewed certain publicly available information regarding the profitability of certain similar investment management firms. The Board noted that, while information regarding the profitability of such firms is limited (and in some cases is not necessarily prepared on a comparable basis), DIMA and its affiliates’ overall profitability with respect to the Deutsche Funds (after taking into account distribution and other services provided to the funds by DIMA and its affiliates) was lower than the overall profitability levels of most comparable firms for which such data was available.
Economies of Scale. The Board considered whether there are economies of scale with respect to the management of the Fund and whether the Fund benefits from any economies of scale. The Board noted that the Fund’s investment management fee schedule includes fee breakpoints. The Board concluded that the Fund’s fee schedule represents an appropriate sharing between the Fund and DIMA of such economies of scale as may exist in the management of the Fund at current asset levels.
Other Benefits to DIMA and Its Affiliates. The Board also considered the character and amount of other incidental benefits received by DIMA and its affiliates, including any fees received by DIMA for administrative services provided to the Fund and any fees received by an affiliate of DIMA for transfer agency services provided to the Fund. The Board also considered benefits to DIMA related to brokerage and soft-dollar allocations, including allocating brokerage to pay for research generated by parties other than the executing broker dealers, which pertain primarily to funds investing in equity securities. In addition, the Board considered the incidental public relations benefits to DIMA related to Deutsche Funds advertising and cross-selling opportunities among DIMA products and services. The Board considered these benefits in reaching its conclusion that the Fund’s management fees were reasonable.
| | | | |
Deutsche Variable Series II — Deutsche Government Money Market VIP | | | | | 19 |
Compliance. The Board considered the significant attention and resources dedicated by DIMA to documenting and enhancing its compliance processes in recent years. The Board noted in particular (i) the experience, seniority and time commitment of the individuals serving as DIMA’s and the Fund’s chief compliance officers; (ii) the large number of DIMA compliance personnel; and (iii) the substantial commitment of resources by DIMA and its affiliates to compliance matters.
Based on all of the information considered and the conclusions reached, the Board unanimously determined that the continuation of the Agreement is in the best interests of the Fund. In making this determination, the Board did not give particular weight to any single factor identified above. The Board considered these factors over the course of numerous meetings, certain of which were in executive session with only the Independent Trustees and counsel present. It is possible that individual Independent Trustees may have weighed these factors differently in reaching their individual decisions to approve the continuation of the Agreement.
| | | | | | |
| | 20 | | | | | | Deutsche Variable Series II — Deutsche Government Money Market VIP |
Board Members and Officers
The following table presents certain information regarding the Board Members and Officers of the Fund. Each Board Member’s year of birth is set forth in parentheses after his or her name. Unless otherwise noted, (i) each Board Member has engaged in the principal occupation(s) noted in the table for at least the most recent five years, although not necessarily in the same capacity; and (ii) the address of each Independent Board Member is c/o Keith R. Fox, Deutsche Funds Board Chair, c/o Thomas R. Hiller, Ropes & Gray LLP, Prudential Tower, 800 Boylston Street, Boston, MA 02199-3600. Except as otherwise noted below, the term of office for each Board Member is until the election and qualification of a successor, or until such Board Member sooner dies, resigns, is removed or as otherwise provided in the governing documents of the Fund. Because the Fund does not hold an annual meeting of shareholders, each Board Member will hold office for an indeterminate period. The Board Members may also serve in similar capacities with other funds in the fund complex.
| | | | | | | | |
| Independent Board Members | | | | | | | |
Name, Year of Birth,
Position with the Fund and
Length of Time Served1 | | Business Experience and Directorships During the Past Five Years | | Number of
Funds in
Deutsche
Fund
Complex
Overseen | | | Other
Directorships
Held by Board
Member |
Keith R. Fox, CFA (1954) Chairperson since 2017, and Board Member since 1996 | | Managing General Partner, Exeter Capital Partners (a series of private investment funds) (since 1986). Directorships: Progressive International Corporation (kitchen goods importer and distributor); The Kennel Shop (retailer); former Chairman, National Association of Small Business Investment Companies; former Directorships: BoxTop Media Inc. (advertising); Sun Capital Advisers Trust (mutual funds) (2011–2012) | | | 89 | | | — |
Kenneth C. Froewiss (1945) Vice Chairperson since 2017, and Board Member since 2001 | | Retired Clinical Professor of Finance, NYU Stern School of Business (1997–2014); Member, Finance Committee, Association for Asian Studies (2002–present); Director, Mitsui Sumitomo Insurance Group (US) (2004–present); prior thereto, Managing Director, J.P. Morgan (investment banking firm) (until 1996) | | | 92 | | | — |
John W. Ballantine (1946) Board Member since 1999 | | Retired; formerly, Executive Vice President and Chief Risk Management Officer, First Chicago NBD Corporation/The First National Bank of Chicago (1996–1998); Executive Vice President and Head of International Banking (1995–1996); former Directorships: Director and former Chairman of the Board, Healthways, Inc.2 (population well-being and wellness services) (2003–2014); Stockwell Capital Investments PLC (private equity); Enron Corporation; FNB Corporation; Tokheim Corporation; First Oak Brook Bancshares, Inc. and Oak Brook Bank; Prisma Energy International. Not-for-Profit Director, Trustee: Palm Beach Civic Association; Public Radio International; Window to the World Communications (public media); Harris Theater for Music and Dance (Chicago) | | | 89 | | | Portland
General
Electric2
(utility
company)
(2003–
present) |
Henry P. Becton, Jr. (1943) Board Member since 1990 | | Vice Chair and former President, WGBH Educational Foundation. Directorships: Public Radio International; Public Radio Exchange (PRX); The Pew Charitable Trusts (charitable organization); former Directorships: Becton Dickinson and Company2 (medical technology company); Belo Corporation2 (media company); The PBS Foundation; Association of Public Television Stations; Boston Museum of Science; American Public Television; Concord Academy; New England Aquarium; Mass. Corporation for Educational Telecommunications; Committee for Economic Development; Public Broadcasting Service; Connecticut College; North Bennett Street School (Boston) | | | 89 | | | — |
Dawn-Marie Driscoll (1946) Board Member since 1987 | | Emeritus Executive Fellow, Center for Business Ethics, Bentley University; formerly: President, Driscoll Associates (consulting firm); Partner, Palmer & Dodge (law firm) (1988–1990); Vice President of Corporate Affairs and General Counsel, Filene’s (retail) (1978–1988). Directorships: Advisory Board, Center for Business Ethics, Bentley University; Trustee and former Chairman of the Board, Southwest Florida Community Foundation (charitable organization); former Directorships: ICI Mutual Insurance Company (2007–2015); Sun Capital Advisers Trust (mutual funds) (2007–2012), Investment Company Institute (audit, executive, nominating committees) and Independent Directors Council (governance, executive committees) | | | 89 | | | — |
| | | | |
Deutsche Variable Series II — Deutsche Government Money Market VIP | | | | | 21 |
| | | | | | | | |
Name, Year of Birth,
Position with the Fund and
Length of Time Served1 | | Business Experience and Directorships During the Past Five Years | | Number of
Funds in
Deutsche
Fund
Complex
Overseen | | | Other
Directorships
Held by Board
Member |
Paul K. Freeman (1950) Board Member since 1993 | | Consultant, World Bank/Inter-American Development Bank; Independent Directors Council (former chair); Investment Company Institute (executive and nominating committees); formerly: Chairman of Education Committee of Independent Directors Council; Project Leader, International Institute for Applied Systems Analysis (1998–2001); Chief Executive Officer, The Eric Group, Inc. (environmental insurance) (1986–1998); Directorships: Denver Zoo Foundation (December 2012–present); Knoebel Institute for Healthy Aging, University of Denver (2017–present); former Directorships: Prisma Energy International | | | 89 | | | — |
Richard J. Herring (1946) Board Member since 1990 | | Jacob Safra Professor of International Banking and Professor, Finance Department, The Wharton School, University of Pennsylvania (since July 1972); Co-Director, Wharton Financial Institutions Center; formerly: Vice Dean and Director, Wharton Undergraduate Division (July 1995–June 2000); Director, Lauder Institute of International Management Studies (July 2000–June 2006) | | | 89 | | | Director,
Aberdeen
Singapore
and Japan
Funds (since
2007);
Independent
Director of
Barclays
Bank
Delaware
(since
September
2010) |
William McClayton (1944) Board Member since 2004 | | Private equity investor (since October 2009); previously, Managing Director, Diamond Management & Technology Consultants, Inc. (global consulting firm) (2001–2009); Directorship: Board of Managers, YMCA of Metropolitan Chicago; formerly: Senior Partner, Arthur Andersen LLP (accounting) (1966–2001); Trustee, Ravinia Festival | | | 89 | | | — |
Rebecca W. Rimel (1951) Board Member since 1995 | | President, Chief Executive Officer and Director, The Pew Charitable Trusts (charitable organization) (1994–present); formerly: Executive Vice President, The Glenmede Trust Company (investment trust and wealth management) (1983–2004); Board Member, Investor Education (charitable organization) (2004–2005); Trustee, Executive Committee, Philadelphia Chamber of Commerce (2001–2007); Director, Viasys Health Care2 (January 2007–June 2007); Trustee, Thomas Jefferson Foundation (charitable organization) (1994–2012) | | | 89 | | | Director,
Becton
Dickinson
and
Company2
(medical
technology
company)
(2012–
present);
Director,
BioTelemetry
Inc2 (health
care) (2009–
present) |
William N. Searcy, Jr. (1946) Board Member since 1993 | | Private investor since October 2003; formerly: Pension & Savings Trust Officer, Sprint Corporation2 (telecommunications) (November 1989–September 2003); Trustee, Sun Capital Advisers Trust (mutual funds) (1998–2012) | | | 89 | | | — |
Jean Gleason Stromberg (1943) Board Member since 1997 | | Retired. Formerly, Consultant (1997–2001); Director, Financial Markets U.S. Government Accountability Office (1996–1997); Partner, Norton Rose Fulbright, L.L.P. (law firm) (1978–1996); former Directorships: The William and Flora Hewlett Foundation (charitable organization) (2000–2015); Service Source, Inc. (nonprofit), Mutual Fund Directors Forum (2002–2004), American Bar Retirement Association (funding vehicle for retirement plans) (1987–1990 and 1994–1996) | | | 89 | | | — |
| | | | | | |
| | 22 | | | | | | Deutsche Variable Series II — Deutsche Government Money Market VIP |
| | |
| Officers4 | | |
Name, Year of Birth,
Position with the Fund and
Length of Time Served5 | | Business Experience and Directorships During the Past Five Years |
Hepsen Uzcan6,9 (1974) President and Chief Executive Officer, 2017–present Assistant Secretary, 2013–present | | Director,3 Deutsche Asset Management; formerly: Vice President for the Deutsche funds (2016–2017) |
John Millette8 (1962) Vice President and Secretary, 1999–present | | Director,3 Deutsche Asset Management; Chief Legal Officer, Deutsche Investment Management Americas Inc. (2015–present); and Director and Vice President, Deutsche AM Trust Company (since 2016); formerly: Secretary, Deutsche Investment Management Americas Inc. (2015–2017) |
Paul H. Schubert6 (1963) Chief Financial Officer, 2004–present Treasurer, 2005–present | | Managing Director,3 Deutsche Asset Management, and Chairman, Director and President, Deutsche AM Trust Company (since 2013); Vice President, Deutsche AM Distributors, Inc. (since 2016); Director, Deutsche AM Service Company (since 2017); Director and President, DB Investment Managers, Inc. (since 2017); formerly: Director, Deutsche AM Trust Company (2004–2013) |
Caroline Pearson8 (1962) Chief Legal Officer, 2010–present | | Managing Director,3 Deutsche Asset Management; formerly: Secretary, Deutsche AM Distributors, Inc.; and Secretary, Deutsche AM Service Company |
Scott D. Hogan8 (1970) Chief Compliance Officer, 2016–present | | Director,3 Deutsche Asset Management |
Wayne Salit7 (1967) Anti-Money Laundering Compliance Officer, 2014–present | | Director,3 Deutsche Asset Management; formerly: Managing Director, AML Compliance Officer at BNY Mellon (2011–2014); and Director, AML Compliance Officer at Deutsche Bank (2004–2011) |
Sheila Cadogan8 (1966) Assistant Treasurer, since July 12, 2017 | | Director,3 Deutsche Asset Management |
Paul Antosca8 (1957) Assistant Treasurer, 2007–present | | Director,3 Deutsche Asset Management |
Diane Kenneally8 (1966) Assistant Treasurer, 2007–present | | Director,3 Deutsche Asset Management |
| 1 | The length of time served represents the year in which the Board Member joined the board of one or more Deutsche funds currently overseen by the Board. |
| 2 | A publicly held company with securities registered pursuant to Section 12 of the Securities Exchange Act of 1934. |
| 3 | Executive title, not a board directorship. |
| 4 | As a result of their respective positions held with the Advisor, these individuals are considered “interested persons” of the Advisor within the meaning of the 1940 Act. Interested persons receive no compensation from the Fund. |
| 5 | The length of time served represents the year in which the officer was first elected in such capacity for one or more Deutsche funds. |
| 6 | Address: 345 Park Avenue, New York, NY 10154. |
| 7 | Address: 60 Wall Street, New York, NY 10005. |
| 8 | Address: One International Place, Boston, MA 02110. |
| 9 | Appointed President and Chief Executive Officer effective December 1, 2017. |
The Fund’s Statement of Additional Information (“SAI”) includes additional information about the Board Members. The SAI is available, without charge, upon request. If you would like to request a copy of the SAI, you may do so by calling the following toll-free number: (800) 728-3337.
| | | | |
Deutsche Variable Series II — Deutsche Government Money Market VIP | | | | | 23 |
| | |
 | | |
VS2GMM-2 (R-025834-7 2/18) | | |

December 31, 2017
Annual Report
Deutsche Variable Series II
Deutsche High Income VIP

Contents
This report must be preceded or accompanied by a prospectus. To obtain an additional prospectus or summary prospectus, if available, call (800) 728-3337 or your financial representative. We advise you to consider the Fund’s objectives, risks, charges and expenses carefully before investing. The summary prospectus and prospectus contain this and other important information about the Fund. Please read the prospectus carefully before you invest.
Bond investments are subject to interest-rate, credit, liquidity and market risks to varying degrees. When interest rates rise, bond prices generally fall. Credit risk refers to the ability of an issuer to make timely payments of principal and interest. Investments in lower-quality (“junk bonds”) and non-rated securities present greater risk of loss than investments in higher-quality securities. Investing in derivatives entails special risks relating to liquidity, leverage and credit that may reduce returns and/or increase volatility. The Fund may lend securities to approved institutions. Please read the prospectus for details.
Deutsche Asset Management represents the asset management activities conducted by Deutsche Bank AG or any of its subsidiaries.
Deutsche AM Distributors, Inc., 222 South Riverside Plaza, Chicago, IL 60606, (800) 621-1148
NOT FDIC/NCUA INSURED NO BANK GUARANTEE MAY LOSE VALUE NOT A DEPOSIT NOT INSURED BY ANY FEDERAL GOVERNMENT AGENCY
| | | | | | |
| | 2 | | | | | | Deutsche Variable Series II — Deutsche High Income VIP |
| | |
| Performance Summary | | December 31, 2017 (Unaudited) |
Fund performance shown is historical, assumes reinvestment of all dividend and capital gain distributions and does not guarantee future results. Investment return and principal value fluctuate with changing market conditions so that, when redeemed, shares may be worth more or less than their original cost. Current performance may be lower or higher than the performance data quoted. Please contact your participating insurance company for the Fund’s most recent month-end performance. Performance doesn’t reflect charges and fees (“contract charges”) associated with the separate account that invests in the Fund or any variable life insurance policy or variable annuity contract for which the Fund is an investment option. These charges and fees will reduce returns. While all share classes have the same underlying portfolio, their performance will differ.
The gross expense ratios of the Fund, as stated in the fee table of the prospectus dated May 1, 2017 are 0.80% and 1.21% for Class A and Class B shares, respectively, and may differ from the expense ratios disclosed in the Financial Highlights tables in this report.
Generally accepted accounting principles require adjustments to be made to the net assets of the Fund at period end for financial reporting purposes only, and as such, the total return based on the unadjusted net asset value per share may differ from the total return reported in the financial highlights.
Growth of an Assumed $10,000 Investment in Deutsche High Income VIP
| | |
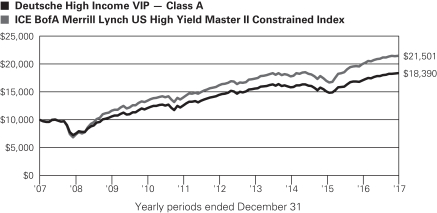 | | ICE BofA Merrill Lynch US High Yield Master II Constrained Index tracks the performance of US dollar denominated below investment grade corporate debt publicly issued in the US domestic market. Index returns do not reflect any fees or expenses and it is not possible to invest directly into an index. |
| | | | | | | | | | |
| Comparative Results | | | | | | | | | | |
| | | | | |
| Deutsche High Income VIP | | | | 1-Year | | 3-Year | | 5-Year | | 10-Year |
| Class A | | Growth of $10,000 | | $10,751 | | $11,595 | | $12,697 | | $18,390 |
| | | Average annual total return | | 7.51% | | 5.06% | | 4.89% | | 6.28% |
| ICE BofA Merrill Lynch US High Yield Master II Constrained Index | | Growth of $10,000 | | $10,748 | | $12,046 | | $13,263 | | $21,501 |
| | Average annual total return | | 7.48% | | 6.40% | | 5.81% | | 7.96% |
| | | | | |
| Deutsche High Income VIP | | | | 1-Year | | 3-Year | | 5-Year | | 10-Year |
| Class B | | Growth of $10,000 | | $10,721 | | $11,482 | | $12,487 | | $17,860 |
| | | Average annual total return | | 7.21% | | 4.72% | | 4.54% | | 5.97% |
| ICE BofA Merrill Lynch US High Yield Master II Constrained Index | | Growth of $10,000 | | $10,748 | | $12,046 | | $13,263 | | $21,501 |
| | Average annual total return | | 7.48% | | 6.40% | | 5.81% | | 7.96% |
The growth of $10,000 is cumulative.
| | | | |
Deutsche Variable Series II — Deutsche High Income VIP | | | | | 3 |
| | |
| Management Summary | | December 31, 2017 (Unaudited) |
High-yield bonds gained 7.48% in 2017 — based on the performance of the ICE BofA Merrill Lynch US High Yield Master II Constrained Index — as the combination of synchronized global economic expansion, a continuation of accommodative central bank policies, and a further recovery in commodity prices were all broadly supportive of the high-yield market. The Fund produced a strong absolute return of 7.51% (Class A shares, unadjusted for contract charges), and finished slightly ahead the benchmark.
We continued to look for security-specific opportunities where the yields provided favorable compensation for the underlying risks. Although our primary emphasis is on bottom-up credit research and individual issue selection, the Fund’s broader allocations can also have an impact on performance. During the past year, for instance, an overweight positions in the mining and chemicals industries contributed positively. However, underweights in the banking and oil field services industries detracted. From a ratings perspective, an underweight in lower-rated issues — including those rated CCC and below — detracted.
At the individual security level, the metals and mining company Teck Resources Ltd. was among the leading contributors to fund performance. The bonds were supported by a recovery in commodity prices, the company’s successful debt-reduction initiative, and an upgrade to its credit rating. NRG Energy, Inc., a power generation firm, was an additional outperformer as its management cut costs and used asset sales to reduce debt, improve efficiency and cut ties to underperforming businesses. The bonds of the pharmaceutical development and distribution company Valeant Pharmaceuticals International, Inc. made a strong contribution as well. Following a change in senior management, Valeant stabilized its business lines and used the proceeds from asset sales to repay debt and reduce leverage.
The Fund’s positioning in the bonds of satellite services provider Intelsat Jackson Holdings SA detracted from results. The company took a number of steps to improve its financial condition, including refinancing its near-term debt maturities. However, the prices the company’s secured bonds — where the Fund had the largest position — did not improve as strongly as the company’s unsecured notes, where the Fund was underweight. The wireline telecommunications services provider Frontier Communications Corp. was another notable detractor. The bonds traded weaker during the year as Frontier had higher-than-anticipated subscriber losses and diminished cash flows, which subsequently caused the rating agencies to downgrade its debt. An underweight position in Tenet Healthcare Corp., an owner and operator of hospitals and long-term care facilities, hurt performance. The debt traded stronger as the company improved its financial results and concerns about disruptive changes to the Affordable Care Act began to fade.
The Fund employed derivatives to hedge its modest euro exposure back into U.S. dollars, which detracted given the rally in the European currency. We also used credit default swaps (“CDS”) to gain exposure to an individual issuer. The CDS rose in value, slightly benefiting performance, and we have since closed the position. While we use derivatives periodically for specific purposes, they are not a core aspect of our strategy.
We retain a favorable view on the high-yield market. We consider forecasts for continuing global economic growth, combined with the consistent and measured shift away from an accommodative stance by the major central banks, as being supportive for the asset class. The use of new-issuance proceeds continues to be dominated by refinancing, which has reduced concerns about near-term maturities for high-yield issuers and contributed to decreasing default expectations. Recent economic data has been largely upbeat, which has been a further positive for the default outlook. Not least, we believe absolute yields could remain attractive enough to fuel continued investor demand. Potential disruptions to this outlook include the possibility of faster-than-expected U.S. Federal Reserve tightening and lingering geopolitical/macroeconomic issues. Additionally, we are concerned about the risk that increased issuance of lower-quality debt could lead to a meaningful market disruption once the cycle turns and credit conditions tighten. With this as the backdrop, we continued to use our bottom-up, research-based approach to identify securities that we believe offer the best risk-adjusted relative values.
Gary Russell, CFA, Managing Director
Thomas R. Bouchard, Director
Portfolio Managers
The views expressed reflect those of the portfolio management team only through the end of the period of the report as stated on the cover. The management team’s views are subject to change at any time based on market and other conditions and should not be construed as a recommendation. Past performance is no guarantee of future results. Current and future portfolio holdings are subject to risk.
| | | | | | |
| | 4 | | | | | | Deutsche Variable Series II — Deutsche High Income VIP |
Terms to Know
The ICE BofA Merrill Lynch US High Yield Master II Constrained Index tracks the performance of U.S. dollar-denominated below-investment-grade corporate debt publicly issued in the U.S. domestic market.
Credit quality measures a bond issuer’s ability to repay interest and principal in a timely manner. Rating agencies assign letter designations, such as AAA, AA and so forth. The lower the rating, the higher the probability of default. Credit quality does not remove market risk and is subject to change.
Overweight means a fund holds a higher weighting in a given sector or individual security compared with its benchmark index; underweight means a fund holds a lower weighting.
Contribution and detraction incorporate both an investment’s total return and its weighting in the fund.
Derivatives are contracts whose values can be based on a variety of instruments, including indices, currencies or securities. They can be utilized for a variety of reasons, including for hedging purposes, for risk management; for non-hedging purposes to seek to enhance potential gains, or as a substitute for direct investment in a particular asset class or to keep cash on hand to meet shareholder redemptions. Investing in derivatives entails special risks relating to liquidity, leverage and credit that may reduce returns and/or increase volatility.
A swap is an exchange of cash flows that are dependent on the price of an underlying commodity.
| | | | |
Deutsche Variable Series II — Deutsche High Income VIP | | | | | 5 |
| | |
| Portfolio Summary | | (Unaudited) |
| | | | | | | | |
| Asset Allocation (As a % of Investment Portfolio excluding Securities Lending Collateral) | | 12/31/17 | | | 12/31/16 | |
| Corporate Bonds | | | 93% | | | | 93% | |
| Cash Equivalents | | | 4% | | | | 5% | |
| Convertible Bond | | | 3% | | | | 1% | |
| Common Stocks | | | 0% | | | | 0% | |
| Warrant | | | 0% | | | | 0% | |
| Government & Agency Obligations | | | — | | | | 1% | |
| | | | 100% | | | | 100% | |
| | |
Sector Diversification (As a % of Investment Portfolio excluding Cash Equivalents and Securities
Lending Collateral) | | 12/31/17 | | | 12/31/16 | |
| Consumer Discretionary | | | 23% | | | | 27% | |
| Energy | | | 23% | | | | 18% | |
| Materials | | | 18% | | | | 16% | |
| Telecommunication Services | | | 10% | | | | 13% | |
| Health Care | | | 7% | | | | 6% | |
| Industrials | | | 7% | | | | 7% | |
| Utilities | | | 4% | | | | 4% | |
| Information Technology | | | 3% | | | | 3% | |
| Consumer Staples | | | 2% | | | | 2% | |
| Real Estate | | | 2% | | | | 2% | |
| Financials | | | 1% | | | | 2% | |
| | | | 100% | | | | 100% | |
| | |
| Quality (As a % of Investment Portfolio excluding Cash Equivalents and Securities Lending Collateral) | | 12/31/17 | | | 12/31/16 | |
| AAA | | | — | | | | 1% | |
| BBB | | | 5% | | | | 9% | |
| BB | | | 54% | | | | 57% | |
| B | | | 34% | | | | 30% | |
| CCC | | | 3% | | | | 3% | |
| Not Rated | | | 4% | | | | 0% | |
| | | | 100% | | | | 100% | |
The quality ratings represent the higher of Moody’s Investors Service, Inc. (“Moody’s”), Fitch Ratings, Inc. (“Fitch”) or Standard & Poor’s Corporation (“S&P”) credit ratings. The ratings of Moody’s, Fitch and S&P represent their opinions as to the quality of the securities they rate. Credit quality measures a bond issuer’s ability to repay interest and principal in a timely manner. Ratings are relative and subjective and are not absolute standards of quality. Credit quality does not remove market risk and is subject to change.
Portfolio holdings and characteristics are subject to change.
For more complete details about the Fund’s investment portfolio, see page 7.
Following the Fund’s fiscal first and third quarter-end, a complete portfolio holdings listing is filed with the SEC on Form N-Q. The form will be available on the SEC’s Web site at sec.gov, and it also may be reviewed and copied at the SEC’s Public Reference Room in Washington, D.C. Information on the operation of the SEC’s Public Reference Room may be obtained by calling (800) SEC-0330. The Fund’s portfolio holdings are also posted on deutschefunds.com from time to time. Please see the Fund’s current prospectus for more information.
| | | | | | |
| | 6 | | | | | | Deutsche Variable Series II — Deutsche High Income VIP |
| | |
| Investment Portfolio | | December 31, 2017 |
| | | | | | | | |
| | | Principal
Amount ($)(a) | | | Value ($) | |
| Corporate Bonds 91.7% | |
| Consumer Discretionary 21.7% | |
1011778 B.C. Unlimited Liability Co.: | | | | | | | | |
144A, 4.25%, 5/15/2024 | | | 135,000 | | | | 134,663 | |
144A, 5.0%, 10/15/2025 | | | 190,000 | | | | 191,425 | |
Adient Global Holdings Ltd.: | | | | | | | | |
REG S, 3.5%, 8/15/2024 | | EUR | 285,000 | | | | 364,889 | |
144A, 4.875%, 8/15/2026 | | | 340,000 | | | | 349,350 | |
Ally Financial, Inc., 5.75%, 11/20/2025 (b) | | | 110,000 | | | | 119,900 | |
Altice Financing SA, 144A, 7.5%, 5/15/2026 | | | 570,000 | | | | 607,050 | |
Altice U.S. Finance I Corp., 144A, 5.5%, 5/15/2026 | | | 175,000 | | | | 178,281 | |
American Axle & Manufacturing, Inc.: | | | | | | | | |
144A, 6.25%, 4/1/2025 (b) | | | 110,000 | | | | 115,775 | |
144A, 6.5%, 4/1/2027 (b) | | | 100,000 | | | | 105,875 | |
Asbury Automotive Group, Inc., 6.0%, 12/15/2024 | | | 320,000 | | | | 333,184 | |
Ashton Woods U.S.A. LLC, 144A, 6.75%, 8/1/2025 | | | 325,000 | | | | 324,594 | |
Boyd Gaming Corp., 6.875%, 5/15/2023 | | | 100,000 | | | | 106,000 | |
CalAtlantic Group, Inc., 5.0%, 6/15/2027 | | | 50,000 | | | | 51,875 | |
Carlson Travel, Inc., 144A, 9.5%, 12/15/2024 | | | 400,000 | | | | 322,000 | |
CCO Holdings LLC: | | | | | | | | |
144A, 5.0%, 2/1/2028 | | | 310,000 | | | | 301,475 | |
144A, 5.125%, 5/1/2027 | | | 250,000 | | | | 246,250 | |
144A, 5.5%, 5/1/2026 | | | 210,000 | | | | 215,250 | |
144A, 5.875%, 4/1/2024 | | | 170,000 | | | | 177,225 | |
144A, 5.875%, 5/1/2027 | | | 350,000 | | | | 360,500 | |
Cequel Communications Holdings I LLC, 144A, 5.125%, 12/15/2021 | | | 437,000 | | | | 438,092 | |
Clear Channel Worldwide Holdings, Inc.: | | | | | | | | |
Series A, 6.5%, 11/15/2022 | | | 180,000 | | | | 181,350 | |
Series B, 6.5%, 11/15/2022 | | | 265,000 | | | | 268,975 | |
Series A, 7.625%, 3/15/2020 | | | 80,000 | | | | 78,300 | |
CRC Escrow Issuer LLC, 144A, 5.25%, 10/15/2025 | | | 230,000 | | | | 231,725 | |
CSC Holdings LLC: | | | | | | | | |
144A, 5.5%, 4/15/2027 | | | 545,000 | | | | 555,900 | |
144A, 10.125%, 1/15/2023 | | | 200,000 | | | | 225,250 | |
144A, 10.875%, 10/15/2025 | | | 230,000 | | | | 273,700 | |
Cumberland Farms, Inc., 144A, 6.75%, 5/1/2025 | | | 48,000 | | | | 50,880 | |
Dana Financing Luxembourg Sarl: | | | | | | | | |
144A, 5.75%, 4/15/2025 | | | 315,000 | | | | 331,931 | |
144A, 6.5%, 6/1/2026 | | | 280,000 | | | | 303,450 | |
Dana, Inc., 5.5%, 12/15/2024 | | | 130,000 | | | | 137,313 | |
DISH DBS Corp.: | | | | | | | | |
5.875%, 7/15/2022 | | | 435,000 | | | | 437,175 | |
5.875%, 11/15/2024 | | | 75,000 | | | | 73,031 | |
6.75%, 6/1/2021 | | | 165,000 | | | | 173,250 | |
Eldorado Resorts, Inc., 6.0%, 4/1/2025 | | | 260,000 | | | | 271,700 | |
| | | | | | | | |
| | | Principal
Amount ($)(a) | | | Value ($) | |
Fiat Chrysler Automobiles NV, 5.25%, 4/15/2023 | | | 245,000 | | | | 256,490 | |
Group 1 Automotive, Inc., 5.0%, 6/1/2022 | | | 330,000 | | | | 339,900 | |
HD Supply, Inc., 144A, 5.75%, 4/15/2024 | | | 85,000 | | | | 90,313 | |
Mattel, Inc., 144A, 6.75%, 12/31/2025 | | | 105,000 | | | | 106,412 | |
Mediacom Broadband LLC, 6.375%, 4/1/2023 | | | 165,000 | | | | 169,537 | |
NCL Corp., Ltd., 144A, 4.75%, 12/15/2021 | | | 115,000 | | | | 119,025 | |
Penn National Gaming, Inc., 144A, 5.625%, 1/15/2027 | | | 80,000 | | | | 83,000 | |
Penske Automotive Group, Inc., 5.5%, 5/15/2026 | | | 165,000 | | | | 167,425 | |
PetSmart, Inc., 144A, 5.875%, 6/1/2025 | | | 65,000 | | | | 49,888 | |
Rivers Pittsburgh Borrower LP, 144A, 6.125%, 8/15/2021 | | | 50,000 | | | | 49,625 | |
Scientific Games International, Inc., 144A, 7.0%, 1/1/2022 | | | 510,000 | | | | 537,412 | |
Seminole Hard Rock Entertainment, Inc., 144A, 5.875%, 5/15/2021 | | | 90,000 | | | | 91,350 | |
SFR Group SA, 144A, 7.375%, 5/1/2026 | | | 610,000 | | | | 626,012 | |
Sonic Automotive, Inc., 6.125%, 3/15/2027 | | | 55,000 | | | | 54,588 | |
Staples, Inc., 144A, 8.5%, 9/15/2025 | | | 110,000 | | | | 101,750 | |
Suburban Propane Partners LP, 5.75%, 3/1/2025 | | | 105,000 | | | | 103,688 | |
Tesla, Inc., 144A, 5.3%, 8/15/2025 (b) | | | 75,000 | | | | 71,625 | |
Toll Brothers Finance Corp., 4.875%, 3/15/2027 | | | 325,000 | | | | 337,187 | |
TRI Pointe Group, Inc., 5.25%, 6/1/2027 | | | 135,000 | | | | 138,470 | |
UPCB Finance IV Ltd., 144A, 5.375%, 1/15/2025 | | | 355,000 | | | | 357,449 | |
Viking Cruises Ltd., 144A, 5.875%, 9/15/2027 | | | 155,000 | | | | 157,713 | |
Virgin Media Secured Finance PLC: | | | | | | | | |
144A, 5.25%, 1/15/2026 | | | 200,000 | | | | 202,000 | |
144A, 5.5%, 8/15/2026 | | | 215,000 | | | | 220,375 | |
WMG Acquisition Corp., 144A, 5.0%, 8/1/2023 | | | 75,000 | | | | 77,625 | |
| | | | | | | | |
| | | | | | | 13,146,442 | |
| | |
| Consumer Staples 2.1% | | | | | | | | |
Chobani LLC, 144A, 7.5%, 4/15/2025 | | | 35,000 | | | | 37,100 | |
FAGE International SA, 144A, 5.625%, 8/15/2026 | | | 220,000 | | | | 212,300 | |
JBS Investments GmbH, 144A, 7.25%, 4/3/2024 | | | 296,000 | | | | 290,820 | |
JBS U.S.A. LUX SA, 144A, 5.75%, 6/15/2025 | | | 210,000 | | | | 202,125 | |
Pilgrim’s Pride Corp.: | | | | | | | | |
144A, 5.75%, 3/15/2025 | | | 50,000 | | | | 51,688 | |
144A, 5.875%, 9/30/2027 | | | 150,000 | | | | 154,500 | |
The accompanying notes are an integral part of the financial statements.
| | | | |
Deutsche Variable Series II — Deutsche High Income VIP | | | | | 7 |
| | | | | | | | |
| | | Principal
Amount ($)(a) | | | Value ($) | |
Post Holdings, Inc.: | | | | | | | | |
144A, 5.625%, 1/15/2028 | | | 40,000 | | | | 40,212 | |
144A, 5.75%, 3/1/2027 | | | 215,000 | | | | 218,762 | |
Simmons Foods, Inc., 144A, 5.75%, 11/1/2024 | | | 100,000 | | | | 99,375 | |
| | | | | | | | |
| | | | | | | 1,306,882 | |
| | |
| Energy 21.6% | | | | | | | | |
Antero Midstream Partners LP, 5.375%, 9/15/2024 | | | 125,000 | | | | 128,750 | |
Antero Resources Corp.: | | | | | | | | |
5.375%, 11/1/2021 | | | 180,000 | | | | 184,500 | |
5.625%, 6/1/2023 | | | 45,000 | | | | 46,800 | |
Blue Racer Midstream LLC, 144A, 6.125%, 11/15/2022 | | | 295,000 | | | | 307,537 | |
Carrizo Oil & Gas, Inc.: | | | | | | | | |
6.25%, 4/15/2023 (b) | | | 85,000 | | | | 88,188 | |
8.25%, 7/15/2025 | | | 100,000 | | | | 109,875 | |
Cheniere Corpus Christi Holdings LLC: | | | | | | | | |
5.125%, 6/30/2027 | | | 230,000 | | | | 237,912 | |
5.875%, 3/31/2025 | | | 165,000 | | | | 178,819 | |
7.0%, 6/30/2024 | | | 470,000 | | | | 534,919 | |
Cheniere Energy Partners LP, 144A, 5.25%, 10/1/2025 | | | 150,000 | | | | 152,625 | |
Chesapeake Energy Corp.: | | | | | | | | |
144A, 8.0%, 12/15/2022 | | | 174,000 | | | | 187,703 | |
144A, 8.0%, 1/15/2025 | | | 165,000 | | | | 166,650 | |
144A, 8.0%, 6/15/2027 (b) | | | 315,000 | | | | 302,400 | |
Continental Resources, Inc.: | | | | | | | | |
3.8%, 6/1/2024 | | | 290,000 | | | | 286,737 | |
144A, 4.375%, 1/15/2028 | | | 75,000 | | | | 74,040 | |
4.5%, 4/15/2023 | | | 255,000 | | | | 260,100 | |
5.0%, 9/15/2022 | | | 413,000 | | | | 419,195 | |
Crestwood Midstream Partners LP: | | | | | | | | |
5.75%, 4/1/2025 | | | 125,000 | | | | 129,063 | |
6.25%, 4/1/2023 | | | 290,000 | | | | 301,368 | |
CrownRock LP, 144A, 5.625%, 10/15/2025 | | | 165,000 | | | | 165,825 | |
Diamondback Energy, Inc., 4.75%, 11/1/2024 | | | 125,000 | | | | 125,469 | |
Endeavor Energy Resources LP: | | | | | | | | |
144A, 5.5%, 1/30/2026 | | | 35,000 | | | | 35,613 | |
144A, 5.75%, 1/30/2028 | | | 35,000 | | | | 35,945 | |
Energy Transfer Equity LP, 5.5%, 6/1/2027 | | | 420,000 | | | | 428,400 | |
Extraction Oil & Gas, Inc., 144A, 7.375%, 5/15/2024 | | | 70,000 | | | | 74,725 | |
Genesis Energy LP: | | | | | | | | |
6.25%, 5/15/2026 | | | 215,000 | | | | 214,194 | |
6.5%, 10/1/2025 | | | 305,000 | | | | 309,575 | |
Gulfport Energy Corp.: | | | | | | | | |
6.0%, 10/15/2024 | | | 60,000 | | | | 60,000 | |
6.375%, 5/15/2025 | | | 100,000 | | | | 100,500 | |
144A, 6.375%, 1/15/2026 | | | 150,000 | | | | 150,375 | |
Hess Infrastructure Partners LP, 144A, 5.625%, 2/15/2026 | | | 130,000 | | | | 134,225 | |
Hilcorp Energy I LP: | | | | | | | | |
144A, 5.0%, 12/1/2024 | | | 105,000 | | | | 103,950 | |
144A, 5.75%, 10/1/2025 | | | 245,000 | | | | 250,512 | |
Holly Energy Partners LP, 144A, 6.0%, 8/1/2024 | | | 225,000 | | | | 234,562 | |
| | | | | | | | |
| | | Principal
Amount ($)(a) | | | Value ($) | |
Jonah Energy LLC, 144A, 7.25%, 10/15/2025 | | | 95,000 | | | | 95,713 | |
Laredo Petroleum, Inc.: | | | | | | | | |
5.625%, 1/15/2022 | | | 70,000 | | | | 70,700 | |
6.25%, 3/15/2023 | | | 215,000 | | | | 222,589 | |
MEG Energy Corp.: | | | | | | | | |
144A, 6.375%, 1/30/2023 | | | 215,000 | | | | 182,750 | |
144A, 6.5%, 1/15/2025 (b) | | | 234,000 | | | | 231,075 | |
Murphy Oil Corp., 5.75%, 8/15/2025 | | | 110,000 | | | | 112,475 | |
Murphy Oil U.S.A., Inc., 5.625%, 5/1/2027 | | | 65,000 | | | | 68,263 | |
Nabors Industries, Inc., 5.5%, 1/15/2023 (b) | | | 70,000 | | | | 67,900 | |
Newfield Exploration Co., 5.375%, 1/1/2026 | | | 245,000 | | | | 259,087 | |
NGPL PipeCo LLC, 144A, 4.875%, 8/15/2027 | | | 285,000 | | | | 295,687 | |
NuStar Logistics LP, 5.625%, 4/28/2027 | | | 236,000 | | | | 240,130 | |
Oasis Petroleum, Inc.: | | | | | | | | |
6.875%, 3/15/2022 | | | 145,000 | | | | 148,806 | |
6.875%, 1/15/2023 | | | 60,000 | | | | 61,350 | |
Parsley Energy LLC: | | | | | | | | |
144A, 5.25%, 8/15/2025 | | | 55,000 | | | | 55,138 | |
144A, 5.375%, 1/15/2025 | | | 85,000 | | | | 85,850 | |
144A, 5.625%, 10/15/2027 | | | 120,000 | | | | 122,700 | |
PDC Energy, Inc., 6.125%, 9/15/2024 | | | 150,000 | | | | 155,250 | |
Peabody Energy Corp.: | | | | | | | | |
144A, 6.0%, 3/31/2022 | | | 20,000 | | | | 20,750 | |
144A, 6.375%, 3/31/2025 | | | 175,000 | | | | 182,000 | |
Precision Drilling Corp., 144A, 7.125%, 1/15/2026 | | | 110,000 | | | | 112,200 | |
QEP Resources, Inc., 5.625%, 3/1/2026 | | | 130,000 | | | | 131,788 | |
Range Resources Corp.: | | | | | | | | |
4.875%, 5/15/2025 | | | 125,000 | | | | 120,625 | |
5.0%, 8/15/2022 | | | 255,000 | | | | 253,725 | |
5.875%, 7/1/2022 | | | 140,000 | | | | 142,800 | |
Seven Generations Energy Ltd., 144A, 5.375%, 9/30/2025 | | | 80,000 | | | | 80,800 | |
Southwestern Energy Co., 7.75%, 10/1/2027 | | | 215,000 | | | | 229,512 | |
Summit Midstream Holdings LLC, 5.75%, 4/15/2025 | | | 60,000 | | | | 60,503 | |
Sunoco LP, 6.375%, 4/1/2023 | | | 425,000 | | | | 447,844 | |
Targa Resources Partners LP: | | | | | | | | |
144A, 5.0%, 1/15/2028 | | | 235,000 | | | | 234,412 | |
5.375%, 2/1/2027 | | | 260,000 | | | | 266,825 | |
TerraForm Power Operating LLC, 144A, 5.0%, 1/31/2028 | | | 115,000 | | | | 113,850 | |
Trinidad Drilling Ltd., 144A, 6.625%, 2/15/2025 | | | 50,000 | | | | 47,500 | |
Weatherford International Ltd.: | | | | | | | | |
4.5%, 4/15/2022 (b) | | | 240,000 | | | | 217,200 | |
8.25%, 6/15/2023 | | | 70,000 | | | | 70,700 | |
Whiting Petroleum Corp.: | | | | | | | | |
5.0%, 3/15/2019 | | | 100,000 | | | | 102,550 | |
5.75%, 3/15/2021 (b) | | | 285,000 | | | | 292,481 | |
144A, 6.625%, 1/15/2026 | | | 220,000 | | | | 224,400 | |
The accompanying notes are an integral part of the financial statements.
| | | | | | |
| | 8 | | | | | | Deutsche Variable Series II — Deutsche High Income VIP |
| | | | | | | | |
| | | Principal
Amount ($)(a) | | | Value ($) | |
WildHorse Resource Development Corp., 6.875%, 2/1/2025 | | | 50,000 | | | | 51,125 | |
WPX Energy, Inc.: | | | | | | | | |
5.25%, 9/15/2024 | | | 145,000 | | | | 144,500 | |
6.0%, 1/15/2022 | | | 215,000 | | | | 224,675 | |
7.5%, 8/1/2020 | | | 71,000 | | | | 76,858 | |
8.25%, 8/1/2023 | | | 215,000 | | | | 244,025 | |
| | | | | | | | |
| | | | | | | 13,090,162 | |
| | |
| Financials 0.6% | | | | | | | | |
Lincoln Finance Ltd., 144A, 7.375%, 4/15/2021 | | | 105,000 | | | | 109,463 | |
Seminole Tribe of Florida, Inc., 144A, 7.804%, 10/1/2020 | | | 170,000 | | | | 171,700 | |
Tempo Acquisition LLC, 144A, 6.75%, 6/1/2025 | | | 75,000 | | | | 75,750 | |
| | | | | | | | |
| | | | | | | 356,913 | |
| | |
| Health Care 6.7% | | | | | | | | |
Avantor, Inc., 144A, 6.0%, 10/1/2024 | | | 70,000 | | | | 69,738 | |
DaVita, Inc.: | | | | | | | | |
5.0%, 5/1/2025 | | | 110,000 | | | | 109,967 | |
5.125%, 7/15/2024 | | | 110,000 | | | | 111,100 | |
Endo Dac, 144A, 6.0%, 7/15/2023 | | | 195,000 | | | | 153,075 | |
HCA, Inc.: | | | | | | | | |
4.5%, 2/15/2027 | | | 363,000 | | | | 364,815 | |
4.75%, 5/1/2023 | | | 360,000 | | | | 370,800 | |
5.25%, 6/15/2026 | | | 280,000 | | | | 296,800 | |
5.875%, 2/15/2026 | | | 190,000 | | | | 200,925 | |
Hologic, Inc., 144A, 5.25%, 7/15/2022 | | | 65,000 | | | | 67,275 | |
LifePoint Health, Inc., 5.5%, 12/1/2021 | | | 90,000 | | | | 91,800 | |
Mallinckrodt International Finance SA, 144A, 5.625%, 10/15/2023 | | | 100,000 | | | | 85,000 | |
Tenet Healthcare Corp., 144A, 5.125%, 5/1/2025 | | | 100,000 | | | | 97,500 | |
Valeant Pharmaceuticals International, Inc.: | | | | | | | | |
144A, 5.375%, 3/15/2020 | | | 259,000 | | | | 259,324 | |
144A, 5.5%, 11/1/2025 | | | 85,000 | | | | 86,487 | |
144A, 5.875%, 5/15/2023 | | | 170,000 | | | | 157,675 | |
144A, 6.125%, 4/15/2025 | | | 150,000 | | | | 137,250 | |
144A, 6.5%, 3/15/2022 | | | 105,000 | | | | 110,250 | |
144A, 7.0%, 3/15/2024 | | | 255,000 | | | | 272,850 | |
144A, 7.5%, 7/15/2021 | | | 545,000 | | | | 554,537 | |
144A, 9.0%, 12/15/2025 | | | 375,000 | | | | 390,825 | |
West Street Merger Sub, Inc., 144A, 6.375%, 9/1/2025 | | | 70,000 | | | | 70,175 | |
| | | | | | | | |
| | | | | | | 4,058,168 | |
| | |
| Industrials 6.6% | | | | | | | | |
Bombardier, Inc.: | | | | | | | | |
144A, 5.75%, 3/15/2022 | | | 230,000 | | | | 225,400 | |
144A, 6.0%, 10/15/2022 | | | 190,000 | | | | 186,675 | |
144A, 7.5%, 12/1/2024 | | | 85,000 | | | | 86,275 | |
Booz Allen Hamilton, Inc., 144A, 5.125%, 5/1/2025 | | | 25,000 | | | | 25,063 | |
Covanta Holding Corp.: | | | | | | | | |
5.875%, 3/1/2024 | | | 160,000 | | | | 162,400 | |
5.875%, 7/1/2025 | | | 85,000 | | | | 85,425 | |
| | | | | | | | |
| | | Principal
Amount ($)(a) | | | Value ($) | |
DAE Funding LLC: | | | | | | | | |
144A, 4.5%, 8/1/2022 | | | 8,000 | | | | 7,860 | |
144A, 5.0%, 8/1/2024 | | | 25,000 | | | | 24,688 | |
GFL Environmental, Inc., 144A, 5.625%, 5/1/2022 | | | 85,000 | | | | 88,188 | |
Itron, Inc., 144A, 5.0%, 1/15/2026 | | | 60,000 | | | | 60,225 | |
Jeld-Wen, Inc.: | | | | | | | | |
144A, 4.625%, 12/15/2025 | | | 70,000 | | | | 70,525 | |
144A, 4.875%, 12/15/2027 | | | 105,000 | | | | 106,050 | |
Masonite International Corp., 144A, 5.625%, 3/15/2023 | | | 195,000 | | | | 203,833 | |
Moog, Inc., 144A, 5.25%, 12/1/2022 | | | 120,000 | | | | 124,200 | |
Novelis Corp.: | | | | | | | | |
144A, 5.875%, 9/30/2026 | | | 230,000 | | | | 234,600 | |
144A, 6.25%, 8/15/2024 | | | 140,000 | | | | 146,650 | |
Oshkosh Corp., 5.375%, 3/1/2025 | | | 20,000 | | | | 21,225 | |
Park Aerospace Holdings Ltd.: | | | | | | | | |
144A, 4.5%, 3/15/2023 | | | 310,000 | | | | 296,050 | |
144A, 5.25%, 8/15/2022 | | | 180,000 | | | | 178,875 | |
144A, 5.5%, 2/15/2024 | | | 245,000 | | | | 243,162 | |
Ply Gem Industries, Inc., 6.5%, 2/1/2022 | | | 200,000 | | | | 206,500 | |
Prime Security Services Borrower LLC, 144A, 9.25%, 5/15/2023 | | | 20,000 | | | | 22,200 | |
RBS Global, Inc., 144A, 4.875%, 12/15/2025 | | | 70,000 | | | | 70,700 | |
Standard Industries, Inc., 144A, 4.75%, 1/15/2028 | | | 155,000 | | | | 155,358 | |
Summit Materials LLC: | | | | | | | | |
144A, 5.125%, 6/1/2025 | | | 30,000 | | | | 30,600 | |
6.125%, 7/15/2023 | | | 200,000 | | | | 208,000 | |
8.5%, 4/15/2022 | | | 70,000 | | | | 77,525 | |
Tennant Co., 144A, 5.625%, 5/1/2025 | | | 30,000 | | | | 31,500 | |
The Brink’s Co., 144A, 4.625%, 10/15/2027 | | | 125,000 | | | | 122,500 | |
United Rentals North America, Inc.: | | | | | | | | |
4.875%, 1/15/2028 | | | 310,000 | | | | 311,550 | |
5.5%, 5/15/2027 | | | 40,000 | | | | 42,100 | |
5.875%, 9/15/2026 | | | 8,000 | | | | 8,560 | |
WESCO Distribution, Inc., 5.375%, 6/15/2024 | | | 140,000 | | | | 143,850 | |
| | | | | | | | |
| | | | | | | 4,008,312 | |
|
| Information Technology 3.3% | |
Cardtronics, Inc., 144A, 5.5%, 5/1/2025 | | | 95,000 | | | | 85,738 | |
Change Healthcare Holdings LLC, 144A, 5.75%, 3/1/2025 | | | 210,000 | | | | 210,000 | |
Dell International LLC, 144A, 5.875%, 6/15/2021 | | | 110,000 | | | | 114,125 | |
First Data Corp., 144A, 7.0%, 12/1/2023 | | | 380,000 | | | | 401,850 | |
j2 Cloud Services LLC, 144A, 6.0%, 7/15/2025 | | | 125,000 | | | | 131,562 | |
Match Group, Inc., 144A, 5.0%, 12/15/2027 | | | 90,000 | | | | 91,350 | |
Netflix, Inc.: | | | | | | | | |
4.375%, 11/15/2026 | | | 180,000 | | | | 175,950 | |
5.875%, 2/15/2025 | | | 120,000 | | | | 127,500 | |
Riverbed Technology, Inc., 144A, 8.875%, 3/1/2023 | | | 110,000 | | | | 103,813 | |
The accompanying notes are an integral part of the financial statements.
| | | | |
Deutsche Variable Series II — Deutsche High Income VIP | | | | | 9 |
| | | | | | | | |
| | | Principal
Amount ($)(a) | | | Value ($) | |
TTM Technologies, Inc., 144A, 5.625%, 10/1/2025 | | | 155,000 | | | | 158,875 | |
Western Digital Corp.: | | | | | | | | |
144A, 7.375%, 4/1/2023 | | | 255,000 | | | | 275,081 | |
10.5%, 4/1/2024 | | | 123,000 | | | | 142,526 | |
| | | | | | | | |
| | | | | | | 2,018,370 | |
| | |
| Materials 13.8% | | | | | | | | |
AK Steel Corp.: | | | | | | | | |
6.375%, 10/15/2025 | | | 365,000 | | | | 361,350 | |
7.0%, 3/15/2027 | | | 625,000 | | | | 635,937 | |
7.5%, 7/15/2023 | | | 145,000 | | | | 156,963 | |
Ardagh Packaging Finance PLC: | | | | | | | | |
144A, 6.0%, 2/15/2025 | | | 440,000 | | | | 463,100 | |
144A, 7.25%, 5/15/2024 | | | 290,000 | | | | 315,737 | |
Berry Global, Inc., 5.5%, 5/15/2022 | | | 315,000 | | | | 324,450 | |
BWAY Holding Co., 144A, 5.5%, 4/15/2024 | | | 355,000 | | | | 369,200 | |
Cascades, Inc., 144A, 5.5%, 7/15/2022 | | | 26,000 | | | | 26,715 | |
Chemours Co.: | | | | | | | | |
5.375%, 5/15/2027 | | | 115,000 | | | | 119,025 | |
6.625%, 5/15/2023 | | | 190,000 | | | | 200,925 | |
7.0%, 5/15/2025 | | | 60,000 | | | | 65,100 | |
Clearwater Paper Corp., 144A, 5.375%, 2/1/2025 | | | 125,000 | | | | 125,625 | |
Constellium NV: | | | | | | | | |
144A, 4.625%, 5/15/2021 | | | EUR 150,000 | | | | 183,530 | |
144A, 5.75%, 5/15/2024 | | | 250,000 | | | | 255,000 | |
144A, 6.625%, 3/1/2025 | | | 250,000 | | | | 263,438 | |
Cornerstone Chemical Co., 144A, 6.75%, 8/15/2024 | | | 125,000 | | | | 124,844 | |
FMG Resources (August 2006) Pty Ltd., 144A, 5.125%, 5/15/2024 (b) | | | 100,000 | | | | 101,250 | |
Freeport-McMoRan, Inc.: | | | | | | | | |
3.55%, 3/1/2022 | | | 120,000 | | | | 118,650 | |
3.875%, 3/15/2023 | | | 115,000 | | | | 114,425 | |
4.0%, 11/14/2021 | | | 180,000 | | | | 180,000 | |
5.4%, 11/14/2034 | | | 160,000 | | | | 162,800 | |
5.45%, 3/15/2043 | | | 65,000 | | | | 64,919 | |
6.875%, 2/15/2023 | | | 145,000 | | | | 158,050 | |
Hexion, Inc.: | | | | | | | | |
6.625%, 4/15/2020 | | | 230,000 | | | | 206,425 | |
144A, 10.375%, 2/1/2022 | | | 40,000 | | | | 37,225 | |
Hudbay Minerals, Inc.: | | | | | | | | |
144A, 7.25%, 1/15/2023 | | | 175,000 | | | | 185,500 | |
144A, 7.625%, 1/15/2025 | | | 50,000 | | | | 54,750 | |
Kaiser Aluminum Corp., 5.875%, 5/15/2024 | | | 145,000 | | | | 154,063 | |
Mercer International, Inc., 6.5%, 2/1/2024 | | | 110,000 | | | | 116,875 | |
Multi-Color Corp., 144A, 4.875%, 11/1/2025 | | | 35,000 | | | | 35,131 | |
NOVA Chemicals Corp.: | | | | | | | | |
144A, 4.875%, 6/1/2024 | | | 365,000 | | | | 364,087 | |
144A, 5.25%, 6/1/2027 | | | 240,000 | | | | 239,400 | |
Plastipak Holdings, Inc., 144A, 6.25%, 10/15/2025 | | | 160,000 | | | | 163,600 | |
Platform Specialty Products Corp., 144A, 5.875%, 12/1/2025 | | | 301,000 | | | | 298,742 | |
| | | | | | | | |
| | | Principal
Amount ($)(a) | | | Value ($) | |
Reynolds Group Issuer, Inc.: | | | | | | | | |
144A, 5.125%, 7/15/2023 | | | 290,000 | | | | 300,150 | |
144A, 7.0%, 7/15/2024 | | | 35,000 | | | | 37,450 | |
Sealed Air Corp., 144A, 5.125%, 12/1/2024 | | | 40,000 | | | | 42,800 | |
Teck Resources Ltd.: | | | | | | | | |
6.125%, 10/1/2035 | | | 105,000 | | | | 117,600 | |
6.25%, 7/15/2041 | | | 165,000 | | | | 188,925 | |
Tronox Finance PLC, 144A, 5.75%, 10/1/2025 | | | 100,000 | | | | 102,750 | |
United States Steel Corp.: | | | | | | | | |
6.875%, 8/15/2025 | | | 295,000 | | | | 307,921 | |
144A, 8.375%, 7/1/2021 | | | 294,000 | | | | 319,137 | |
WR Grace & Co-Conn: | | | | | | | | |
144A, 5.125%, 10/1/2021 | | | 65,000 | | | | 68,331 | |
144A, 5.625%, 10/1/2024 | | | 125,000 | | | | 134,844 | |
| | | | | | | | |
| | | | | | | 8,366,739 | |
| | |
| Real Estate 2.1% | | | | | | | | |
CyrusOne LP: | | | | | | | | |
144A, (REIT), 5.0%, 3/15/2024 | | | 90,000 | | | | 93,375 | |
144A, (REIT), 5.375%, 3/15/2027 | | | 200,000 | | | | 210,000 | |
Howard Hughes Corp., 144A, 5.375%, 3/15/2025 | | | 365,000 | | | | 374,125 | |
Iron Mountain, Inc., 144A, (REIT), 5.25%, 3/15/2028 | | | 115,000 | | | | 114,425 | |
MGM Growth Properties Operating Partnership LP, 144A, (REIT), 4.5%, 1/15/2028 | | | 110,000 | | | | 107,800 | |
MPT Operating Partnership LP: | | | | | | | | |
(REIT), 5.0%, 10/15/2027 | | | 145,000 | | | | 147,719 | |
(REIT), 5.25%, 8/1/2026 | | | 35,000 | | | | 36,225 | |
(REIT), 6.375%, 3/1/2024 | | | 170,000 | | | | 179,775 | |
| | | | | | | | |
| | | | | | | 1,263,444 | |
|
| Telecommunication Services 9.6% | |
CenturyLink, Inc.: | | | | | | | | |
Series V, 5.625%, 4/1/2020 | | | 180,000 | | | | 181,350 | |
Series W, 6.75%, 12/1/2023 | | | 180,000 | | | | 176,400 | |
Series Y, 7.5%, 4/1/2024 (b) | | | 270,000 | | | | 269,325 | |
CommScope Technologies LLC, 144A, 5.0%, 3/15/2027 | | | 100,000 | | | | 100,000 | |
Frontier Communications Corp.: | | | | | | | | |
6.25%, 9/15/2021 | | | 465,000 | | | | 330,150 | |
7.125%, 1/15/2023 | | | 440,000 | | | | 292,600 | |
Hughes Satellite Systems Corp., 7.625%, 6/15/2021 | | | 165,000 | | | | 182,325 | |
Intelsat Jackson Holdings SA: | | | | | | | | |
7.25%, 10/15/2020 | | | 215,000 | | | | 202,100 | |
144A, 8.0%, 2/15/2024 | | | 327,000 | | | | 344,167 | |
144A, 9.75%, 7/15/2025 | | | 190,000 | | | | 182,875 | |
SoftBank Group Corp., REG S, 6.0%, 7/30/2025 | | | 230,000 | | | | 244,246 | |
Sprint Capital Corp.: | | | | | | | | |
6.875%, 11/15/2028 | | | 85,000 | | | | 85,531 | |
8.75%, 3/15/2032 | | | 235,000 | | | | 266,725 | |
Sprint Communications, Inc., 7.0%, 8/15/2020 | | | 125,000 | | | | 132,500 | |
Sprint Corp.: | | | | | | | | |
7.125%, 6/15/2024 | | | 885,000 | | | | 900,487 | |
7.625%, 2/15/2025 (b) | | | 270,000 | | | | 282,825 | |
The accompanying notes are an integral part of the financial statements.
| | | | | | |
| | 10 | | | | | | Deutsche Variable Series II — Deutsche High Income VIP |
| | | | | | | | |
| | | Principal
Amount ($)(a) | | | Value ($) | |
T-Mobile U.S.A., Inc.: | | | | | | | | |
6.0%, 4/15/2024 | | | 324,000 | | | | 343,440 | |
6.375%, 3/1/2025 | | | 362,000 | | | | 387,340 | |
6.5%, 1/15/2026 | | | 10,000 | | | | 10,913 | |
Telesat Canada, 144A, 8.875%, 11/15/2024 | | | 130,000 | | | | 145,600 | |
ViaSat, Inc., 144A, 5.625%, 9/15/2025 | | | 55,000 | | | | 55,413 | |
Zayo Group LLC: | | | | | | | | |
144A, 5.75%, 1/15/2027 | | | 240,000 | | | | 244,800 | |
6.0%, 4/1/2023 | | | 185,000 | | | | 192,687 | |
6.375%, 5/15/2025 | | | 281,000 | | | | 297,158 | |
| | | | | | | | |
| | | | | | | 5,850,957 | |
|
| Utilities 3.6% | |
AmeriGas Partners LP: | | | | | | | | |
5.5%, 5/20/2025 | | | 235,000 | | | | 237,350 | |
5.75%, 5/20/2027 | | | 220,000 | | | | 222,200 | |
Calpine Corp.: | | | | | | | | |
144A, 5.25%, 6/1/2026 | | | 90,000 | | | | 88,201 | |
5.75%, 1/15/2025 | | | 45,000 | | | | 42,525 | |
Dynegy, Inc.: | | | | | | | | |
7.375%, 11/1/2022 | | | 195,000 | | | | 205,725 | |
7.625%, 11/1/2024 | | | 75,000 | | | | 80,437 | |
144A, 8.125%, 1/30/2026 | | | 80,000 | | | | 87,400 | |
NextEra Energy Operating Partners LP, 144A, 4.5%, 9/15/2027 | | | 115,000 | | | | 114,425 | |
NGL Energy Partners LP, 5.125%, 7/15/2019 | | | 140,000 | | | | 142,450 | |
NRG Energy, Inc.: | | | | | | | | |
144A, 5.75%, 1/15/2028 | | | 200,000 | | | | 202,000 | |
6.25%, 7/15/2022 | | | 725,000 | | | | 754,000 | |
| | | | | | | | |
| | | | | | | | 2,176,713 | |
Total Corporate Bonds (Cost $54,824,443) | | | | 55,643,102 | |
|
| Convertible Bonds 3.3% | |
| Consumer Discretionary 0.1% | |
DISH Network Corp., 144A, 2.375%, 3/15/2024 | | | 35,000 | | | | 33,622 | |
| |
| Materials 3.2% | | | | | |
GEO Specialty Chemicals, Inc., 3-month USD-LIBOR + 14.0%, 15.709% PIK, 10/18/2025* (c) | | | 1,542,668 | | | | 1,950,703 | |
Total Convertible Bonds (Cost $1,569,260) | | | | 1,984,325 | |
| | | | | | | | |
| | |
| | |
Shares | | | Value ($) | |
| Common Stocks 0.1% | | | | | | | | |
| Industrials 0.0% | | | | | | | | |
Quad Graphics, Inc. | | | 249 | | | | 5,628 | |
| | |
| Materials 0.1% | | | | | | | | |
GEO Specialty Chemicals, Inc.** (c) | | | 144,027 | | | | 48,623 | |
GEO Specialty Chemicals, Inc. 144A** (c) | | | 2,206 | | | | 745 | |
| | | | | | | | |
| | | | | | | | 49,368 | |
Total Common Stocks (Cost $292,150) | | | | 54,996 | |
|
| Warrant 0.0% | |
| Materials | | | | | | | | |
Hercules Trust II, Expiration Date 3/31/2029** (c) (Cost $244,286) | | | 1,100 | | | | 29,732 | |
|
| Securities Lending Collateral 2.8% | |
Deutsche Government & Agency Securities Portfolio “Deutsche Government Cash Institutional Shares”, 1.21% (d) (e) (Cost $1,697,463) | | | 1,697,463 | | | | 1,697,463 | |
| | |
| Cash Equivalents 3.7% | | | | | | | | |
Deutsche Central Cash Management Government Fund, 1.30% (d) (Cost $2,240,926) | | | 2,240,926 | | | | 2,240,926 | |
| | |
| | | % of Net
Assets | | | Value ($) | |
Total Investment Portfolio
(Cost $60,868,528) | | | 101.6 | | | | 61,650,544 | |
| Other Assets and Liabilities, Net | | | (1.6 | ) | | | (952,415 | ) |
| Net Assets | | | 100.0 | | | | 60,698,129 | |
| * | Variable or floating rate security. These securities are shown at their current rate as of December 31, 2017. For securities based on a published reference rate and spread, the reference rate and spread are indicated within the description above. Certain variable rate securities are not based on a published reference rate and spread but adjust periodically based on current market conditions, |
| ** | Non-income producing security. |
| (a) | Principal amount stated in U.S. dollars unless otherwise noted. |
| (b) | All or a portion of these securities were on loan. In addition, “Other Assets and Liabilities, Net” may include pending sales that are also on loan. The value of securities loaned at December 31, 2017 amounted to $1,634,608, which is 2.7% of net assets. |
| (c) | Investment was valued using significant unobservable inputs. |
| (d) | Affiliated fund managed by Deutsche Investment Management Americas Inc. The rate shown is the annualized seven-day yield at period end. |
| (e) | Represents collateral held in connection with securities lending. Income earned by the Fund is net of borrower rebates. |
144A: Security exempt from registration under Rule 144A of the Securities Act of 1933. These securities may be resold in transactions exempt from registration, normally to qualified institutional buyers.
PIK: Denotes that all or a portion of the income is paid in-kind in the form of additional principal.
REG S: Securities sold under Regulation S may not be offered, sold or delivered within the United States or to, or for the account or benefit of, U.S. persons, except pursuant to an exemption from, or in a transaction not subject to, the registration requirements of the Securities Act of 1933.
REIT: Real Estate Investment Trust
The accompanying notes are an integral part of the financial statements.
| | | | |
Deutsche Variable Series II — Deutsche High Income VIP | | | | | 11 |
As of December 31, 2017, the Fund had the following open forward foreign currency contracts:
| | | | | | | | | | | | | | | | | | |
| Contracts to Deliver | | | In Exchange For | | | Settlement
Date | | Unrealized
Depreciation ($) | | | Counterparty |
| EUR | | | 468,564 | | | USD | | | 556,358 | | | 1/31/2018 | | | (6,916) | | | Bank of America |
Currency Abbreviations
For information on the Fund’s policy and additional disclosures regarding forward foreign currency contracts, please refer to the Derivatives section of Note A in the accompanying Notes to Financial Statements.
Fair Value Measurements
Various inputs are used in determining the value of the Fund’s investments. These inputs are summarized in three broad levels. Level 1 includes quoted prices in active markets for identical securities. Level 2 includes other significant observable inputs (including quoted prices for similar securities, interest rates, prepayment speeds and credit risk). Level 3 includes significant unobservable inputs (including the Fund’s own assumptions in determining the fair value of investments). The level assigned to the securities valuations may not be an indication of the risk or liquidity associated with investing in those securities.
The following is a summary of the inputs used as of December 31, 2017 in valuing the Fund’s investments. For information on the Fund’s policy regarding the valuation of investments, please refer to the Security Valuation section of Note A in the accompanying Notes to Financial Statements.
| | | | | | | | | | | | | | | | |
| Assets | | Level 1 | | | Level 2 | | | Level 3 | | | Total | |
| Fixed Income Investments (e) | | | | | | | | | | | | | | | | |
Corporate Bonds | | $ | — | | | $ | 55,643,102 | | | $ | — | | | $ | 55,643,102 | |
Convertible Bond | | | — | | | | 33,622 | | | | 1,950,703 | | | | 1,984,325 | |
| Common Stocks (e) | | | 5,628 | | | | — | | | | 49,368 | | | | 54,996 | |
| Warrant | | | — | | | | — | | | | 29,732 | | | | 29,732 | |
| Short-Term Investments (e) | | | 3,938,389 | | | | — | | | | — | | | | 3,938,389 | |
| Total | | $ | 3,944,017 | | | $ | 55,676,724 | | | $ | 2,029,803 | | | $ | 61,650,544 | |
| | | | |
| Liabilities | | Level 1 | | | Level 2 | | | Level 3 | | | Total | |
| Derivatives (f) | | | | | | | | | | | | | | | | |
Forward Foreign Currency Exchange Contracts | | $ | — | | | $ | (6,916 | ) | | $ | — | | | $ | (6,916 | ) |
| Total | | $ | — | | | $ | (6,916 | ) | | $ | — | | | $ | (6,916 | ) |
There have been no transfers between fair value measurement levels during the year ended December 31, 2017.
| (e) | See Investment Portfolio for additional detailed categorizations. |
| (f) | Derivatives include unrealized appreciation (depreciation) on forward foreign currency exchange contracts. |
Level 3 Reconciliation
The following is a reconciliation of the Fund’s Level 3 investments for which significant unobservable inputs were used in determining value:
| | | | | | | | | | | | | | | | |
| | | Convertible
Bonds | | | Common
Stocks | | | Warrant | | | Total | |
Balance as of December 31, 2016 | | $ | 1,459,104 | | | $ | 57,426 | | | $ | 4,994 | | | $ | 1,521,524 | |
| Realized gains (loss) | | | — | | | | — | | | | — | | | | — | |
| Change in unrealized appreciation (depreciation) | | | 367,752 | | | | (8,058 | ) | | | 24,738 | | | | 384,432 | |
| Amortization of premium/accretion of discount | | | 7,619 | | | | — | | | | — | | | | 7,619 | |
| Purchases | | | 1,614,966 | | | | — | | | | — | | | | 1,614,966 | |
| (Sales) | | | (1,498,738 | ) | | | — | | | | — | | | | (1,498,738 | ) |
| Transfer into Level 3 | | | — | | | | — | | | | — | | | | — | |
| Transfer (out) of Level 3 | | | — | | | | — | | | | — | | | | — | |
| Balance as of December 31, 2017 | | $ | 1,950,703 | | | $ | 49,368 | | | $ | 29,732 | | | $ | 2,029,803 | |
| Net change in unrealized appreciation (depreciation) from investments still held as of December 31, 2017 | | $ | 367,752 | | | $ | (8,058 | ) | | $ | 24,738 | | | $ | 384,432 | |
The accompanying notes are an integral part of the financial statements.
| | | | | | |
| | 12 | | | | | | Deutsche Variable Series II — Deutsche High Income VIP |
| | | | | | | | | | | | |
| Quantitative Disclosure About Significant Unobservable Inputs |
| Asset Class | | Fair Value at 12/31/17 | | | Valuation Technique(s) | | | Unobservable Input | | Range (Weighted Average) |
| Common Stocks | | | | | | | | | | | | |
| Materials | | | $49,368 | | | | Market Approach | | | EV/EBITDA Multiple | | 6.69% |
| | | | | | | | | | Discount to public comparables | | 20% |
| | | | | | | | | | | Discount for lack of marketability | | 20% |
| Warrant | | | | | | | | | | | | |
| Materials | | | $29,732 | | | | Black Scholes Option Pricing Model | | | Implied Volatility of Option | | 20.62% |
| | | | | | | | | | | Illiquidity Discount | | 20% |
| Convertible Bonds | | | | | | | | | | | | |
| Materials | | | $1,950,703 | | | | Market Approach | | | EV/EBITDA Multiple | | 6.69% |
| | | | | | | | | | Discount to public comparables | | 20% |
| | | | | | | | | | | Discount for lack of marketability | | 20% |
Qualitative Disclosure About Unobservable Inputs
Significant unobservable inputs developed by the Pricing Committee and used in the fair value measurement of the Fund’s equity and convertible bond investments include enterprise value (EV) to earnings before interest, taxes, depreciation and amortization (EBITDA) ratio with a discount for lack of marketability. A significant change in the EV to EBITDA ratio may result in a significant change in the fair value measurement, while a significant change in the discount for lack of marketability is unlikely to result in a materially higher or lower fair value measurement.
Significant unobservable inputs developed by the Pricing Committee and used in the fair value measurement of the Fund’s warrants include volatility and discount for lack of marketability. A change in the volatility of the underlying asset as an input to the Black-Scholes model may have a significant change in the fair value measurement. A significant change in the discount for lack of marketability is unlikely to have a material impact to the fair value measurement.
The accompanying notes are an integral part of the financial statements.
| | | | |
Deutsche Variable Series II — Deutsche High Income VIP | | | | | 13 |
Statement of Assets and Liabilities
| | | | |
| as of December 31, 2017 | | | | |
| |
| Assets | | | | |
| Investments in non-affiliated securities, at value (cost $56,930,139) — including $1,634,608 of securities loaned | | $ | 57,712,155 | |
| Investment in Deutsche Government & Agency Securities Portfolio (cost $1,697,463)* | | | 1,697,463 | |
Investment in Deutsche Central Cash Management Government Fund
(cost $2,240,926) | | | 2,240,926 | |
| Cash | | | 10,000 | |
| Foreign currency, at value (cost $10,181) | | | 10,161 | |
| Receivable for Fund shares sold | | | 3,616 | |
| Interest receivable | | | 921,122 | |
| Other assets | | | 1,901 | |
| Total assets | | | 62,597,344 | |
| |
| Liabilities | | | | |
| Payable upon return of securities loaned | | | 1,697,463 | |
| Payable for Fund shares redeemed | | | 44,038 | |
| Unrealized depreciation on forward foreign currency contracts | | | 6,916 | |
| Accrued management fee | | | 22,285 | |
| Accrued Trustees’ fees | | | 1,985 | |
| Other accrued expenses and payables | | | 126,528 | |
| Total liabilities | | | 1,899,215 | |
| Net assets, at value | | $ | 60,698,129 | |
| |
| Net Assets Consist of | | | | |
| Undistributed net investment income | | | 4,654,101 | |
| Net unrealized appreciation (depreciation) on: | | | | |
Investments | | | 782,016 | |
Foreign currency | | | 61 | |
Forward foreign currency contracts | | | (6,916 | ) |
| Accumulated net realized gain (loss) | | | (6,336,893 | ) |
| Paid-in capital | | | 61,605,760 | |
| Net assets, at value | | $ | 60,698,129 | |
| |
| Net Asset Value | | | | |
Class A | | | | |
Net Asset Value, offering and redemption price per share ($60,559,310 ÷ 9,527,083
outstanding shares of beneficial interest,
no par value, unlimited number of shares authorized) | | $ | 6.36 | |
Class B | | | | |
Net Asset Value, offering and redemption price per share ($138,819 ÷ 21,761
outstanding shares of beneficial interest,
no par value, unlimited number of shares authorized) | | $ | 6.38 | |
| * | Represents collateral on securities loaned. |
Statement of Operations
| | | | |
| for the year ended December 31, 2017 | | | | |
| |
| Investment Income | | | | |
| Income: | | | | |
| Interest | | $ | 5,224,571 | |
| Income distributions — Deutsche Central Cash Management Government Fund | | | 44,200 | |
| Securities lending income, net of borrower rebates | | | 53,436 | |
| Total income | | | 5,322,207 | |
| Expenses: | | | | |
| Management fee | | | 466,632 | |
| Administration fee | | | 93,326 | |
| Services to Shareholders | | | 930 | |
| Record keeping fee (Class B) | | | 750 | |
| Distribution service fees (Class B) | | | 1,690 | |
| Custodian fee | | | 5,067 | |
| Professional fees | | | 93,629 | |
| Reports to shareholders | | | 29,692 | |
| Trustees’ fees and expenses | | | 6,993 | |
| Other | | | 35,267 | |
| Total expenses before expense reductions | | | 733,976 | |
| Expense reductions | | | (61,676 | ) |
| Total expenses after expense reductions | | | 672,300 | |
| Net investment income | | | 4,649,907 | |
| |
| Realized and Unrealized Gain (Loss) | | | | |
| Net realized gain (loss) from: | | | | |
| Investments | | | 3,367,956 | |
| Swap contracts | | | 208,389 | |
| Forward foreign currency contracts | | | (86,685 | ) |
| Foreign currency | | | 5,356 | |
| | | | 3,495,016 | |
| Change in net unrealized appreciation (depreciation) on: | | | | |
| Investments | | | (936,036 | ) |
| Swap contracts | | | (36,516 | ) |
| Forward foreign currency contracts | | | (2,359 | ) |
| Foreign currency | | | (510 | ) |
| | | | (975,421 | ) |
| Net gain (loss) | | | 2,519,595 | |
| Net increase (decrease) in net assets resulting from operations | | $ | 7,169,502 | |
The accompanying notes are an integral part of the financial statements.
| | | | | | |
| | 14 | | | | | | Deutsche Variable Series II — Deutsche High Income VIP |
Statements of Changes in Net Assets
| | | | | | | | |
| | | Years Ended December 31, | |
| Increase (Decrease) in Net Assets | | 2017 | | | 2016 | |
Operations: | | | | | | | | |
Net investment income (loss) | | $ | 4,649,907 | | | $ | 5,440,363 | |
Net realized gain (loss) | | | 3,495,016 | | | | (3,163,765 | ) |
Change in net unrealized appreciation (depreciation) | | | (975,421 | ) | | | 9,890,493 | |
Net increase (decrease) in net assets resulting from operations | | | 7,169,502 | | | | 12,167,091 | |
Distributions to shareholders from: | | | | | | | | |
Net investment income: | | | | | | | | |
Class A | | | (5,780,980 | ) | | | (6,259,405 | ) |
Class B | | | (94,574 | ) | | | (122,558 | ) |
Total distributions | | | (5,875,554 | ) | | | (6,381,963 | ) |
Fund share transactions: | | | | | | | | |
Class A | | | | | | | | |
Proceeds from shares sold | | | 12,759,797 | | | | 15,011,086 | |
Reinvestment of distributions | | | 5,780,980 | | | | 6,259,405 | |
Cost of shares redeemed | | | (58,823,711 | ) | | | (28,525,830 | ) |
Net increase (decrease) in net assets from Class A share transactions | | | (40,282,934 | ) | | | (7,255,339 | ) |
Class B | | | | | | | | |
Proceeds from shares sold | | | 120,675 | | | | 5,848,785 | |
Reinvestment of distributions | | | 94,574 | | | | 122,558 | |
Cost of shares redeemed | | | (1,640,132 | ) | | | (7,539,910 | ) |
Net increase (decrease) in net assets from Class B share transactions | | | (1,424,883 | ) | | | (1,568,567 | ) |
Increase (decrease) in net assets | | | (40,413,869 | ) | | | (3,038,778 | ) |
Net assets at beginning of year | | | 101,111,998 | | | | 104,150,776 | |
Net assets at end of year (including undistributed net investment income of $4,654,101 and $5,781,669, respectively) | | $ | 60,698,129 | | | $ | 101,111,998 | |
| | |
Other Information | | | | | | |
Class A | | | | | | | | |
Shares outstanding at beginning of period | | | 15,845,238 | | | | 17,025,372 | |
Shares sold | | | 2,017,781 | | | | 2,525,843 | |
Shares issued to shareholders in reinvestment of distributions | | | 946,151 | | | | 1,081,072 | |
Shares redeemed | | | (9,282,087 | ) | | | (4,787,049 | ) |
Net increase (decrease) in Class A shares | | | (6,318,155 | ) | | | (1,180,134 | ) |
Shares outstanding at end of period | | | 9,527,083 | | | | 15,845,238 | |
Class B | | | | | | | | |
Shares outstanding at beginning of period | | | 254,095 | | | | 530,185 | |
Shares sold | | | 18,818 | | | | 990,197 | |
Shares issued to shareholders in reinvestment of distributions | | | 15,403 | | | | 21,094 | |
Shares redeemed | | | (266,555 | ) | | | (1,287,381 | ) |
Net increase (decrease) in Class B shares | | | (232,334 | ) | | | (276,090 | ) |
Shares outstanding at end of period | | | 21,761 | | | | 254,095 | |
The accompanying notes are an integral part of the financial statements.
| | | | |
Deutsche Variable Series II — Deutsche High Income VIP | | | | | 15 |
Financial Highlights
| | | | | | | | | | | | | | | | | | | | |
| | | Years Ended December 31, | |
| Class A | | 2017 | | | 2016 | | | 2015 | | | 2014 | | | 2013 | |
| | | | | |
| Selected Per Share Data | | | | | | | | | | | | | | | | | | | | |
| Net asset value, beginning of period | | $ | 6.28 | | | | $5.93 | | | | $6.60 | | | | $6.96 | | | | $6.93 | �� |
| Income (loss) from investment operations: | | | | | | | | | | | | | | | | | | | | |
Net investment incomea | | | .31 | | | | .32 | | | | .32 | | | | .36 | | | | .39 | |
Net realized and unrealized gain (loss) | | | .15 | | | | .41 | | | | (.58 | ) | | | (.25 | ) | | | .14 | |
Total from investment operations | | | .46 | | | | .73 | | | | (.26 | ) | | | .11 | | | | .53 | |
| Less distributions from: | | | | | | | | | | | | | | | | | | | | |
| Net investment income | | | (.38 | ) | | | (.38 | ) | | | (.41 | ) | | | (.47 | ) | | | (.50 | ) |
| Net asset value, end of period | | $ | 6.36 | | | | $6.28 | | | | $5.93 | | | | $6.60 | | | | $6.96 | |
| Total Return (%)b | | | 7.51 | | | | 12.87 | | | | (4.44 | ) | | | 1.47 | | | | 7.91 | |
| | | | | |
| Ratios to Average Net Assets and Supplemental Data | | | | | | | | | | | | | | | | | | | | |
| Net assets, end of period ($ millions) | | | 61 | | | | 100 | | | | 101 | | | | 135 | | | | 165 | |
| Ratio of expenses before expense reductions (%)c | | | .78 | | | | .80 | | | | .75 | | | | .75 | | | | .73 | |
| Ratio of expenses after expense reductions (%)c | | | .72 | | | | .72 | | | | .72 | | | | .73 | | | | .72 | |
| Ratio of net investment income (%) | | | 4.98 | | | | 5.38 | | | | 5.09 | | | | 5.21 | | | | 5.69 | |
| Portfolio turnover rate (%) | | | 71 | | | | 77 | | | | 47 | | | | 52 | | | | 58 | |
| a | Based on average shares outstanding during the period. |
| b | Total return would have been lower had certain expenses not been reduced. |
| c | Expense ratio does not reflect charges and fees associated with the separate account that invests in the Fund or any variable life insurance policy or variable annuity contract for which the Fund is an investment option. |
| | | | | | | | | | | | | | | | | | | | |
| | | Years Ended December 31, | |
| Class B | | 2017 | | | 2016 | | | 2015 | | | 2014 | | | 2013 | |
| | | | | |
| Selected Per Share Data | | | | | | | | | | | | | | | | | | | | |
| Net asset value, beginning of period | | $ | 6.30 | | | | $5.94 | | | | $6.63 | | | | $6.99 | | | | $6.97 | |
| Income (loss) from investment operations: | | | | | | | | | | | | | | | | | | | | |
Net investment incomea | | | .31 | | | | .31 | | | | .32 | | | | .35 | | | | .36 | |
Net realized and unrealized gain (loss) | | | .13 | | | | .41 | | | | (.61 | ) | | | (.26 | ) | | | .15 | |
Total from investment operations | | | .44 | | | | .72 | | | | (.29 | ) | | | .09 | | | | .51 | |
| Less distributions from: | | | | | | | | | | | | | | | | | | | | |
| Net investment income | | | (.36 | ) | | | (.36 | ) | | | (.40 | ) | | | (.45 | ) | | | (.49 | ) |
| Net asset value, end of period | | $ | 6.38 | | | | $6.30 | | | | $5.94 | | | | $6.63 | | | | $6.99 | |
| Total Return (%)b | | | 7.21 | | | | 12.67 | | | | (4.95 | ) | | | 1.22 | | | | 7.44 | |
| | | | | |
| Ratios to Average Net Assets and Supplemental Data | | | | | | | | | | | | | | | | | | | | |
| Net assets, end of period ($ millions) | | | .1 | | | | 2 | | | | 3 | | | | .03 | | | | .32 | |
| Ratio of expenses before expense reductions (%)c | | | 1.15 | | | | 1.21 | | | | 1.14 | | | | 1.13 | | | | 1.10 | |
| Ratio of expenses after expense reductions (%)c | | | .98 | | | | .98 | | | | 1.02 | | | | .97 | | | | .97 | |
| Ratio of net investment income (%) | | | 4.88 | | | | 5.15 | | | | 4.86 | | | | 5.09 | | | | 5.29 | |
| Portfolio turnover rate (%) | | | 71 | | | | 77 | | | | 47 | | | | 52 | | | | 58 | |
| a | Based on average shares outstanding during the period. |
| b | Total return would have been lower had certain expenses not been reduced. |
| c | Expense ratio does not reflect charges and fees associated with the separate account that invests in the Fund or any variable life insurance policy or variable annuity contract for which the Fund is an investment option. |
The accompanying notes are an integral part of the financial statements.
| | | | | | |
| | 16 | | | | | | Deutsche Variable Series II — Deutsche High Income VIP |
Notes to Financial Statements
A. Organization and Significant Accounting Policies
Deutsche High Income VIP (the “Fund”) is a diversified series of Deutsche Variable Series II (the “Trust”), which is registered under the Investment Company Act of 1940, as amended (the “1940 Act”), as an open-end management investment company organized as a Massachusetts business trust.
Multiple Classes of Shares of Beneficial Interest. The Fund offers two classes of shares (Class A shares and Class B shares). Sales of Class B shares are subject to recordkeeping fees up to 0.15% and Rule 12b-1 fees under the 1940 Act equal to an annual rate of 0.25% of the average daily net assets of the Class B shares of the Fund. Class A shares are not subject to such fees.
Investment income, realized and unrealized gains and losses, and certain fund-level expenses and expense reductions, if any, are borne pro rata on the basis of relative net assets by the holders of all classes of shares except that each class bears certain expenses unique to that class (including the applicable Rule 12b-1 fee and recordkeeping fees). Differences in class-level expenses may result in payment of different per share dividends by class. All shares have equal rights with respect to voting subject to class-specific arrangements.
The Fund’s financial statements are prepared in accordance with accounting principles generally accepted in the United States of America (“U.S. GAAP”) which require the use of management estimates. Actual results could differ from those estimates. The Fund qualifies as an investment company under Topic 946 of Accounting Standards Codification of U.S. GAAP. The policies described below are followed consistently by the Fund in the preparation of its financial statements.
Security Valuation. Investments are stated at value determined as of the close of regular trading on the New York Stock Exchange on each day the exchange is open for trading.
Various inputs are used in determining the value of the Fund’s investments. These inputs are summarized in three broad levels. Level 1 includes quoted prices in active markets for identical securities. Level 2 includes other significant observable inputs (including quoted prices for similar securities, interest rates, prepayment speeds and credit risk). Level 3 includes significant unobservable inputs (including the Fund’s own assumptions in determining the fair value of investments). The level assigned to the securities valuations may not be an indication of the risk or liquidity associated with investing in those securities.
Debt securities are valued at prices supplied by independent pricing services approved by the Fund’s Board. Such services may use various pricing techniques which take into account appropriate factors such as yield, quality, coupon rate, maturity, type of issue, trading characteristics, prepayment speeds and other data, as well as broker quotes. If the pricing services are unable to provide valuations, debt securities are valued at the average of the most recent reliable bid quotations or evaluated prices, as applicable, obtained from broker-dealers. These securities are generally categorized as Level 2.
Equity securities are valued at the most recent sale price or official closing price reported on the exchange (U.S. or foreign) or over-the-counter market on which they trade. Securities for which no sales are reported are valued at the calculated mean between the most recent bid and asked quotations on the relevant market or, if a mean cannot be determined, at the most recent bid quotation. Equity securities are generally categorized as Level 1 securities.
Investments in open-end investment companies are valued at their net asset value each business day and are categorized as Level 1.
Forward currency contracts are valued at the prevailing forward exchange rate of the underlying currencies and are categorized as Level 2.
Swap contracts are valued daily based upon prices supplied by a Board approved pricing vendor, if available, and otherwise are valued at the price provided by the broker-dealer. Swap contracts are generally categorized as Level 2.
Securities and other assets for which market quotations are not readily available or for which the above valuation procedures are deemed not to reflect fair value are valued in a manner that is intended to reflect their fair value as determined in accordance with procedures approved by the Board and are generally categorized as Level 3. In accordance with the Fund’s valuation procedures, factors considered in determining value may include, but are not limited to, the type of the security; the size of the holding; the initial cost of the security; the existence of any contractual restrictions on the security’s disposition; the price and extent of public trading in similar securities of the issuer or of comparable companies; quotations or evaluated prices from broker-dealers and/or pricing services; information obtained from the issuer, analysts and/or the appropriate stock exchange
| | | | |
Deutsche Variable Series II — Deutsche High Income VIP | | | | | 17 |
(for exchange-traded securities); an analysis of the company’s or issuer’s financial statements; an evaluation of the forces that influence the issuer and the market(s) in which the security is purchased and sold; and with respect to debt securities, the maturity, coupon, creditworthiness, currency denomination and the movement of the market in which the security is normally traded. The value determined under these procedures may differ from published values for the same securities.
Disclosure about the classification of fair value measurements is included in a table following the Fund’s Investment Portfolio.
Foreign Currency Translations. The books and records of the Fund are maintained in U.S. dollars. Investment securities and other assets and liabilities denominated in a foreign currency are translated into U.S. dollars at the prevailing exchange rates at period end. Purchases and sales of investment securities, income and expenses are translated into U.S. dollars at the prevailing exchange rates on the respective dates of the transactions.
Net realized and unrealized gains and losses on foreign currency transactions represent net gains and losses between trade and settlement dates on securities transactions, the acquisition and disposition of foreign currencies, and the difference between the amount of net investment income accrued and the U.S. dollar amount actually received. That portion of both realized and unrealized gains and losses on investments that results from fluctuations in foreign currency exchange rates is not separately disclosed but is included with net realized and unrealized gain/appreciation and loss/depreciation on investments.
Securities Lending. Deutsche Bank AG, as lending agent, lends securities of the Fund to certain financial institutions under the terms of its securities lending agreement. During the term of the loans, the Fund continues to receive interest and dividends generated by the securities and to participate in any changes in their market value. The Fund requires the borrowers of the securities to maintain collateral with the Fund consisting of either cash or liquid, unencumbered assets having a value at least equal to the value of the securities loaned. When the collateral falls below specified amounts, the lending agent will use its best effort to obtain additional collateral on the next business day to meet required amounts under the securities lending agreement. As of period end, any securities on loan were collateralized by cash. During the year ended December 31, 2017, the Fund invested the cash collateral into a joint trading account in affiliated money market funds managed by Deutsche Investment Management Americas Inc. As of December 31, 2017, the Fund invested the cash collateral in Deutsche Government & Agency Securities Portfolio. Deutsche Investment Management Americas Inc. receives a management/administration fee (0.13% annualized effective rate as of December 31, 2017) on the cash collateral invested in Deutsche Government & Agency Securities Portfolio. The Fund receives compensation for lending its securities either in the form of fees or by earning interest on invested cash collateral net of borrower rebates and fees paid to a lending agent. Either the Fund or the borrower may terminate the loan at any time, and the borrower, after notice, is required to return borrowed securities within a standard time period. There may be risks of delay and costs in recovery of securities or even loss of rights in the collateral should the borrower of the securities fail financially. If the Fund is not able to recover securities lent, the Fund may sell the collateral and purchase a replacement investment in the market, incurring the risk that the value of the replacement security is greater than the value of the collateral. The Fund is also subject to all investment risks associated with the reinvestment of any cash collateral received, including, but not limited to, interest rate, credit and liquidity risk associated with such investments.
As of December 31, 2017, the Fund had securities on loan, which were classified as corporate bonds in the Investment Portfolio. The value of the related collateral exceeded the value of the securities loaned at period end. As of period end, the remaining contractual maturity of the collateral agreements were overnight and continuous.
When-Issued/Delayed Delivery Securities. The Fund may purchase or sell securities with delivery or payment to occur at a later date beyond the normal settlement period. At the time the Fund enters into a commitment to purchase or sell a security, the transaction is recorded and the value of the transaction is reflected in the net asset value. The price of such security and the date when the security will be delivered and paid for are fixed at the time the transaction is negotiated. The value of the security may vary with market fluctuations. At the time the Fund enters into a purchase transaction it is required to segregate cash or other liquid assets at least equal to the amount of the commitment. Additionally, the Fund or the counterparty may be required to post securities and/or cash collateral in accordance with the terms of the commitment.
Certain risks may arise upon entering into when-issued or delayed delivery transaction from the potential inability of counterparties to meet the terms of their contracts or if the issuer does not issue the securities due to political, economic, or other factors. Additionally, losses may arise due to changes in the value of the underlying securities.
| | | | | | |
| | 18 | | | | | | Deutsche Variable Series II — Deutsche High Income VIP |
Taxes. The Fund’s policy is to comply with the requirements of the Internal Revenue Code, as amended, which are applicable to regulated investment companies and to distribute all of its taxable income to its shareholders.
At December 31, 2017, the Fund had a net tax basis capital loss carryforward of approximately $6,337,000, which may be applied against realized net taxable capital gains indefinitely, including short-term losses ($500,000) and long-term losses ($5,837,000).
The Fund has reviewed the tax positions for the open tax years as of December 31, 2017 and has determined that no provision for income tax and/or uncertain tax positions is required in the Fund’s financial statements. The Fund’s federal tax returns for the prior three fiscal years remain open subject to examination by the Internal Revenue Service.
Distribution of Income and Gains. Distributions from net investment income of the Fund, if any, are declared and distributed to shareholders annually. Net realized gains from investment transactions, in excess of available capital loss carryforwards, would be taxable to the Fund if not distributed and, therefore, will be distributed to shareholders at least annually. The Fund may also make additional distributions for tax purposes if necessary.
The timing and characterization of certain income and capital gain distributions are determined annually in accordance with federal tax regulations which may differ from accounting principles generally accepted in the United States of America. These differences primarily relate to investments in swap contracts, expiration of capital loss carryforward and certain securities sold at a loss. As a result, net investment income (loss) and net realized gain (loss) on investment transactions for a reporting period may differ significantly from distributions during such period. Accordingly, the Fund may periodically make reclassifications among certain of its capital accounts without impacting the net asset value of the Fund.
At December 31, 2017, the Fund’s components of distributable earnings on a tax basis were as follows:
| | | | |
| Undistributed ordinary income* | | $ | 4,647,185 | |
| Capital loss carryforwards | | $ | (6,337,000 | ) |
| Unrealized appreciation (depreciation) on investments | | $ | 782,016 | |
At December 31, 2017, the aggregate cost of investments for federal income tax purposes was $60,868,528. The net unrealized appreciation for all investments based on tax cost was $782,016. This consisted of aggregate gross unrealized appreciation for all investments in which there was an excess of value over tax cost of $2,074,675 and aggregate gross unrealized depreciation for all investments in which there was an excess of tax cost over value of $1,292,659.
In addition, the tax character of distributions paid by the Fund is summarized as follows:
| | | | | | | | |
| | | Years Ended December 31, | |
| | | 2017 | | | 2016 | |
| Distributions from ordinary income* | | $ | 5,875,554 | | | $ | 6,381,963 | |
| * | For tax purposes, short-term capital gain distributions are considered ordinary income distributions. |
Expenses. Expenses of the Trust arising in connection with a specific fund are allocated to that fund. Other Trust expenses which cannot be directly attributed to a fund are apportioned among the funds in the Trust based upon the relative net assets or other appropriate measures.
Contingencies. In the normal course of business, the Fund may enter into contracts with service providers that contain general indemnification clauses. The Fund’s maximum exposure under these arrangements is unknown, as this would involve future claims that may be made against the Fund that have not yet been made. However, based on experience, the Fund expects the risk of loss to be remote.
Other. Investment transactions are accounted for on a trade date plus one basis for daily net asset value calculations. However, for financial reporting purposes, investment transactions are reported on trade date. Interest income is recorded on the accrual basis. Dividend income is recorded on ex-dividend date. Realized gains and losses from investment transactions are recorded on an identified cost basis. Proceeds from litigation payments, if any, are included in net realized gain (loss) from investments. All discounts and premiums are accreted/amortized for both tax and financial reporting purposes for the Fund, with the exception of securities in default of principal.
| | | | |
Deutsche Variable Series II — Deutsche High Income VIP | | | | | 19 |
B. Derivative Instruments
Swaps. A swap is a contract between two parties to exchange future cash flows at periodic intervals based on the notional amount of the swap. A bilateral swap is a transaction between the fund and a counterparty where cash flows are exchanged between the two parties. A centrally cleared swap is a transaction executed between the fund and a counterparty, then cleared by a clearing member through a central clearinghouse. The central clearinghouse serves as the counterparty, with whom the fund exchanges cash flows.
The value of a swap is adjusted daily, and the change in value, if any, is recorded as unrealized appreciation or depreciation in the Statement of Assets and Liabilities. Gains or losses are realized when the swap expires or is closed. Certain risks may arise when entering into swap transactions including counterparty default; liquidity; or unfavorable changes in interest rates or the value of the underlying reference security, commodity or index. In connection with bilateral swaps, securities and/or cash may be identified as collateral in accordance with the terms of the swap agreement to provide assets of value and recourse in the event of default. The maximum counterparty credit risk is the net present value of the cash flows to be received from or paid to the counterparty over the term of the swap, to the extent that this amount is beneficial to the Fund, in addition to any related collateral posted to the counterparty by the Fund. This risk may be partially reduced by a master netting arrangement between the Fund and the counterparty. Upon entering into a centrally cleared swap, the Fund is required to deposit with a financial intermediary cash or securities (“initial margin”) in an amount equal to a certain percentage of the notional amount of the swap. Subsequent payments (“variation margin”) are made or received by the Fund dependent upon the daily fluctuations in the value of the swap. In a cleared swap transaction, counterparty risk is minimized as the central clearinghouse acts as the counterparty.
An upfront payment, if any, made by the Fund is recorded as an asset in the Statement of Assets and Liabilities. An upfront payment, if any, received by the Fund is recorded as a liability in the Statement of Assets and Liabilities. Payments received or made at the end of the measurement period are recorded as realized gain or loss in the Statement of Operations.
Credit default swaps are agreements between a buyer and a seller of protection against predefined credit events for the reference entity. The Fund may enter into credit default swaps to gain exposure to an underlying issuer’s credit quality characteristics without directly investing in that issuer or to hedge against the risk of a credit event on debt securities. As a seller of a credit default swap, the Fund is required to pay the par (or other agreed-upon) value of the referenced entity to the counterparty with the occurrence of a credit event by a third party, such as a U.S. or foreign corporate issuer, on the reference entity, which would likely result in a loss to the Fund. In return, the Fund receives from the counterparty a periodic stream of payments over the term of the swap provided that no credit event has occurred. If no credit event occurs, the Fund keeps the stream of payments with no payment obligations. The Fund may also buy credit default swaps, in which case the Fund functions as the counterparty referenced above. This involves the risk that the swap may expire worthless. It also involves counterparty risk that the seller may fail to satisfy its payment obligations to the Fund with the occurrence of a credit event. When the Fund sells a credit default swap, it will cover its commitment. This may be achieved by, among other methods, maintaining cash or liquid assets equal to the aggregate notional value of the reference entities for all outstanding credit default swaps sold by the Fund. For the year ended December 31, 2017, the Fund entered into credit default swap agreements to gain exposure to the underlying issuer’s credit quality characteristics.
Under the terms of a credit default swap, the Fund receives or makes periodic payments based on a specified interest rate on a fixed notional amount. These payments are recorded as a realized gain or loss in the Statement of Operations. Payments received or made as a result of a credit event or termination of the swap are recognized, net of a proportional amount of the upfront payment, as realized gains or losses in the Statement of Operations.
There were no open credit default swap contracts as of December 31, 2017. For the year ended December 31, 2017, the Fund’s investment in credit default swap contracts sold had a total notional value generally indicative of a range from $0 to approximately $6,450,000.
Forward Foreign Currency Exchange Contracts. A forward foreign currency exchange contract (“forward currency contract”) is a commitment to purchase or sell a foreign currency at the settlement date at a negotiated rate. For the year ended December 31, 2017, the Fund entered into forward currency contracts in order to hedge its exposure to changes in foreign currency exchange rates on its foreign currency denominated portfolio holdings and to facilitate transactions in foreign currency denominated securities. Forward currency contracts are valued at the prevailing forward exchange rate of the underlying currencies
| | | | | | |
| | 20 | | | | | | Deutsche Variable Series II — Deutsche High Income VIP |
and unrealized gain (loss) is recorded daily. On the settlement date of the forward currency contract, the Fund records a realized gain or loss equal to the difference between the value of the contract at the time it was opened and the value of the contract at the time it was closed. Certain risks may arise upon entering into forward currency contracts from the potential inability of counterparties to meet the terms of their contracts. The maximum counterparty credit risk to the Fund is measured by the unrealized gain on appreciated contracts. Additionally, when utilizing forward currency contracts to hedge, the Fund gives up the opportunity to profit from favorable exchange rate movements during the term of the contract.
A summary of the open forward currency contracts as of December 31, 2017 is included in a table following the Fund’s Investment Portfolio. For the year ended December 31, 2017, the investment in forward currency contracts short vs. U.S. dollars had a total contract value generally indicative of a range from approximately $498,000 to $885,000, and the investment in forward currency contracts long vs. U.S. dollars had a total contract value generally indicative of a range from $0 to approximately $217,000.
The following table summarizes the value of the Fund’s derivative instruments held as of December 31, 2017 and the related location in the accompanying Statement of Assets and Liabilities, presented by primary underlying risk exposure:
| | | | |
| Liability Derivative | | Forward
Contract | |
| Foreign Exchange Contracts (a) | | $ | (6,916 | ) |
The above derivative is located in the following Statement of Assets and Liabilities account:
| (a) | Unrealized depreciation on foreign forward currency exchange contracts |
Additionally, the amount of unrealized and realized gains and losses on derivative instruments recognized in Fund earnings during the year ended December 31, 2017 and the related location in the accompanying Statement of Operations is summarized in the following tables by primary underlying risk exposure:
| | | | | | | | | | | | |
| Realized Gain (Loss) | | Forward
Contracts | | | Swap
Contracts | | | Total | |
| Credit Contracts (b) | | $ | — | | | $ | 208,389 | | | $ | 208,389 | |
| Foreign Exchange Contracts (c) | |
| (86,685
| )
| | | — | | | | (86,685 | ) |
| | | $ | (86,685 | ) | | $ | 208,389 | | | $ | 121,704 | |
Each of the above derivatives is located in the following Statement of Operations accounts:
| (b) | Net realized gain (loss) from swap contracts |
| (c) | Net realized gain loss from forward foreign currency contracts |
| | | | | | | | | | | | |
Change in Net Unrealized Appreciation (Depreciation) | | Forward
Contracts | | | Swap
Contracts | | | Total | |
| Credit Contracts (d) | | $ | — | | | $ | (36,516 | ) | | $ | (36,516 | ) |
| Foreign Exchange Contracts (e) | | | (2,359 | ) | | | — | | | | (2,359 | ) |
| | | $ | (2,359 | ) | | $
| (36,516
| )
| | $ | (38,875 | ) |
Each of the above derivatives is located in the following Statement of Operations accounts:
| (d) | Change in net unrealized appreciation (depreciation) on swap contracts |
| (e) | Change in net unrealized appreciation (depreciation) on forward foreign currency contracts |
As of December 31, 2017, the Fund has transactions subject to enforceable master netting agreements which govern the terms of certain transactions, and reduce the counterparty risk associated with such transactions. Master netting agreements allow a Fund to close out and net total exposure to a counterparty in the event of a deterioration in the credit quality or contractual default with respect to all of the transactions with a counterparty. As defined by the master netting agreement, the Fund may have collateral agreements with certain counterparties to mitigate risk. For financial reporting purposes the Statement of Assets and Liabilities generally shows derivatives assets and liabilities on a gross basis, which reflects the full risks and exposures prior to netting. A reconciliation of the gross amounts on the Statement of Assets and Liabilities to the net amounts by a counterparty, including any collateral exposure, is included in the following table:
| | | | | | | | | | | | | | | | |
| Counterparty | | Gross Amounts
of Liabilities
Presented in the
Statement of
Assets and
Liabilities | | | Financial
Instruments
and
Derivatives
Available
for Offset | | | Collateral
Pledged | | | Net Amount of
Derivative
Liabilities | |
| Bank of America | | $ | 6,916 | | | $ | — | | | $ | — | | | $ | 6,916 | |
| | | | |
Deutsche Variable Series II — Deutsche High Income VIP | | | | | 21 |
C. Purchases and Sales of Securities
During the year ended December 31, 2017, purchases and sales of investment transactions (excluding short-term investments and U.S. Treasury securities) aggregated $61,238,762 and $100,943,488, respectively.
D. Related Parties
Management Agreement. Under the Investment Management Agreement with Deutsche Investment Management Americas Inc. (“DIMA” or the “Advisor”), an indirect, wholly owned subsidiary of Deutsche Bank AG, the Advisor directs the investments of the Fund in accordance with its investment objectives, policies and restrictions. The Advisor determines the securities, instruments and other contracts relating to investments to be purchased, sold or entered into by the Fund.
Pursuant to the Investment Management Agreement with the Advisor, the Fund pays a monthly management fee based on the Fund’s average daily net assets, computed and accrued daily and payable monthly, at the following annual rates:
| | | | |
| First $250 million | | | .500 | % |
| Next $750 million | | | .470 | % |
| Next $1.5 billion | | | .450 | % |
| Next $2.5 billion | | | .430 | % |
| Next $2.5 billion | | | .400 | % |
| Next $2.5 billion | | | .380 | % |
| Next $2.5 billion | | | .360 | % |
| Over $12.5 billion | | | .340 | % |
Accordingly, for the year ended December 31, 2017, the fee pursuant to the Investment Management Agreement was equivalent to an annual rate (exclusive of any applicable waivers/reimbursements) of 0.50% of the Fund’s average daily net assets.
For the period from January 1, 2017 through April 30, 2017, the Advisor had contractually agreed to waive all or a portion of its fees and/or reimburse certain operating expenses of the Fund to the extent necessary to maintain the total annual operating expenses (excluding certain expenses such as extraordinary expenses, taxes, brokerage and interest expense) of each class as follows:
| | | | |
| Class A | | | .72 | % |
| Class B | | | .98 | % |
For the period from May 1, 2017 through September 30, 2017, the Advisor had contractually agreed to waive all or a portion of its fees and/or reimburse certain operating expenses of the Fund to the extent necessary to maintain the total annual operating expenses (excluding certain expenses such as extraordinary expenses, taxes, brokerage and interest expense) of each class as follows:
| | | | |
| Class A | | | .73 | % |
| Class B | | | 1.06 | % |
For the period from October 1, 2017 through September 30, 2018, the Advisor has contractually agreed to waive all or a portion of its fees and/or reimburse certain operating expenses of the Fund to the extent necessary to maintain the total annual operating expenses (excluding certain expenses such as extraordinary expenses, taxes, brokerage and interest expense) of each class as follows:
| | | | |
| Class A | | | .69 | % |
| Class B | | | .97 | % |
For the year ended December 31, 2017, fees waived and/or expenses reimbursed for each class are as follows:
| | | | |
| Class A | | $ | 60,489 | |
| Class B | | | 1,187 | |
| | | $ | 61,676 | |
Administration Fee. Pursuant to an Administrative Services Agreement, DIMA provides most administrative services to the Fund. For all services provided under the Administrative Services Agreement, the Fund pays
| | | | | | |
| | 22 | | | | | | Deutsche Variable Series II — Deutsche High Income VIP |
DIMA an annual fee (“Administration Fee”) of 0.10% of the Fund’s average daily net assets, computed and accrued daily and payable monthly. For the year ended December 31, 2017, the Administration Fee was $93,326 of which $5,181 is unpaid.
Service Provider Fees. Deutsche AM Service Company (“DSC”), an affiliate of the Advisor, is the transfer agent, dividend-paying agent and shareholder service agent for the Fund. Pursuant to a sub-transfer agency agreement between DSC and DST Systems, Inc. (“DST”), DSC has delegated certain transfer agent, dividend-paying agent and shareholder service agent functions to DST. DSC compensates DST out of the shareholder servicing fee it receives from the Fund. For the year ended December 31, 2017, the amounts charged to the Fund by DSC were as follows:
| | | | | | | | |
| Services to Shareholders | | Total
Aggregated | | | Unpaid at
December 31,
2017 | |
| Class A | | $ | 282 | | | $ | 70 | |
| Class B | | | 49 | | | | 13 | |
| | | $ | 331 | | | $ | 83 | |
Distribution Service Agreement. Under the Fund’s Class B 12b-1 plan, Deutsche AM Distributors, Inc. (“DDI”) received a fee (“Distribution Service Fee”) of 0.25% of average daily net assets of Class B shares. For the year ended December 31, 2017, the Distribution Service Fee was $1,690, of which $33 is unpaid.
Typesetting and Filing Service Fees. Under an agreement with DIMA, DIMA is compensated for providing certain pre-press and regulatory filing services to the Fund. For the year ended December 31, 2017, the amount charged to the Fund by DIMA included in the Statement of Operations under “Reports to shareholders” aggregated $14,313, of which $6,967 is unpaid.
Trustees’ Fees and Expenses. The Fund paid retainer fees to each Trustee not affiliated with the Advisor, plus specified amounts to the Board Chairperson and Vice Chairperson and to each committee Chairperson.
Affiliated Cash Management Vehicles. The Fund may invest uninvested cash balances in Deutsche Central Cash Management Government Fund and Deutsche Variable NAV Money Fund, affiliated money market funds which are managed by the Advisor. Each affiliated money market fund is managed in accordance with Rule 2a-7 under the 1940 Act, which governs the quality, maturity, diversity and liquidity of instruments in which a money market fund may invest. Deutsche Central Cash Management Government Fund seeks to maintain a stable net asset value, and Deutsche Variable NAV Money Fund maintains a floating net asset value. The Fund indirectly bears its proportionate share of the expenses of each affiliated money market fund in which it invests. Deutsche Central Cash Management Government Fund does not pay the Advisor an investment management fee. To the extent that Deutsche Variable NAV Money Fund pays an investment management fee to the Advisor, the Advisor will waive an amount of the investment management fee payable to the Advisor by the Fund equal to the amount of the investment management fee payable on the Fund’s assets invested in Deutsche Variable NAV Money Fund.
Security Lending Fees. Deutsche Bank AG serves as lending agent for the Fund. For the year ended December 31, 2017, the Fund incurred lending agent fees to Deutsche Bank AG for the amount of $4,023.
E. Investing in High-Yield Debt Securities
High-yield debt securities or junk bonds are generally regarded as speculative with respect to the issuer’s continuing ability to meet principal and interest payments. The Fund’s performance could be hurt if an issuer of a debt security suffers an adverse change in financial condition that results in the issuer not making timely payments of interest or principal, a security downgrade or an inability to meet a financial obligation. High-yield debt securities’ total return and yield may generally be expected to fluctuate more than the total return and yield of investment-grade debt securities. A real or perceived economic downturn or an increase in market interest rates could cause a decline in the value of high-yield debt securities, result in increased redemptions and/or result in increased portfolio turnover, which could result in a decline in net asset value of the fund, reduce liquidity for certain investments and/or increase costs. High-yield debt securities are often thinly traded and can be more difficult to sell and value accurately than investment-grade debt securities as there may be no established secondary market. Investments in high yield debt securities could increase liquidity risk for the fund. In addition, the market for high-yield debt securities can experience sudden and sharp volatility which is generally associated more with investments in stocks.
| | | | |
Deutsche Variable Series II — Deutsche High Income VIP | | | | | 23 |
F. Ownership of the Fund
At December 31, 2017, two participating insurance companies were owners of record of 10% or more of the total outstanding Class A shares of the Fund, each owning 75% and 17%. Two participating insurance companies were owners of record of 10% or more of the total outstanding Class B shares of the Fund, each owning 87% and 11%.
G. Line of Credit
The Fund and other affiliated funds (the “Participants”) share in a $400 million revolving credit facility provided by a syndication of banks. The Fund may borrow for temporary or emergency purposes, including the meeting of redemption requests that otherwise might require the untimely disposition of securities. The Participants are charged an annual commitment fee which is allocated based on net assets, among each of the Participants. Interest is calculated at a rate per annum equal to the sum of the Federal Funds Rate plus 1.25 percent plus if the one-month LIBOR exceeds the Federal Funds Rate, the amount of such excess. The Fund may borrow up to a maximum of 33 percent of its net assets under the agreement. The Fund had no outstanding loans at December 31, 2017.
| | | | | | |
| | 24 | | | | | | Deutsche Variable Series II — Deutsche High Income VIP |
Report of Independent Registered Public Accounting Firm
To the Board of Trustees of Deutsche Variable Series II and the Shareholders of Deutsche High Income VIP
Opinion on the Financial Statements
We have audited the accompanying statement of assets and liabilities of Deutsche High Income VIP (the “Fund) (one of the portfolios constituting the Deutsche Variable Series II) (the “Trust”), including the schedule of investments, as of December 31, 2017, and the related statement of operations for the year then ended, the statements of changes in net assets for each of the two years in the period then ended, the financial highlights for each of the five years in the period then ended and the related notes (collectively referred to as the “financial statements”). In our opinion, the financial statements present fairly, in all material respects, the financial position of the Fund (one of the funds constituting the Deutsche Variable Series II) at December 31, 2017, the results of its operations for the year then ended, the changes in its net assets for each of the two years in the period then ended and its financial highlights for each of the five years in the period then ended, in conformity with U.S. generally accepted accounting principles.
Basis for Opinion
These financial statements are the responsibility of the Trust’s management. Our responsibility is to express an opinion on the Fund’s financial statements based on our audits. We are a public accounting firm registered with the Public Company Accounting Oversight Board (United States) (“PCAOB”) and are required to be independent with respect to the Trust in accordance with the U.S. federal securities laws and the applicable rules and regulations of the Securities and Exchange Commission and the PCAOB.
We conducted our audits in accordance with the standards of the PCAOB. Those standards require that we plan and perform the audit to obtain reasonable assurance about whether the financial statements are free of material misstatement, whether due to error or fraud. The Trust is not required to have, nor were we engaged to perform, an audit of the Trust’s internal control over financial reporting. As part of our audits, we are required to obtain an understanding of internal control over financial reporting, but not for the purpose of expressing an opinion on the effectiveness of the Trust’s internal control over financial reporting. Accordingly, we express no such opinion.
Our audits included performing procedures to assess the risks of material misstatement of the financial statements, whether due to error or fraud, and performing procedures that respond to those risks. Such procedures included examining, on a test basis, evidence regarding the amounts and disclosures in the financial statements. Our procedures included confirmation of securities owned as of December 31, 2017, by correspondence with the custodian and brokers or by other appropriate auditing procedures where replies from brokers were not received.
Our audits also included evaluating the accounting principles used and significant estimates made by management, as well as evaluating the overall presentation of the financial statements. We believe that our audits provide a reasonable basis for our opinion.
We have served as the auditor of one or more investment companies in the Deutsche family of funds since at least 1979, but we are unable to determine the specific year.
Boston, Massachusetts
February 15, 2018
| | | | |
Deutsche Variable Series II — Deutsche High Income VIP | | | | | 25 |
| | |
| Information About Your Fund’s Expenses | | (Unaudited) |
As an investor of the Fund, you incur two types of costs: ongoing expenses and transaction costs. Ongoing expenses include management fees, distribution and service (12b-1) fees and other Fund expenses. Examples of transaction costs include contract charges, which are not shown in this section. The following tables are intended to help you understand your ongoing expenses (in dollars) of investing in the Fund and to help you compare these expenses with the ongoing expenses of investing in other mutual funds. In the most recent six-month period, the Fund limited these expenses; had it not done so, expenses would have been higher. The example in the table is based on an investment of $1,000 invested at the beginning of the six-month period and held for the entire period (July 1, 2017 to December 31, 2017).
The tables illustrate your Fund’s expenses in two ways:
| – | Actual Fund Return. This helps you estimate the actual dollar amount of ongoing expenses (but not transaction costs) paid on a $1,000 investment in the Fund using the Fund’s actual return during the period. To estimate the expenses you paid over the period, simply divide your account value by $1,000 (for example, an $8,600 account value divided by $1,000 = 8.6), then multiply the result by the number in the “Expenses Paid per $1,000” line under the share class you hold. |
| – | Hypothetical 5% Fund Return. This helps you to compare your Fund’s ongoing expenses (but not transaction costs) with those of other mutual funds using the Fund’s actual expense ratio and a hypothetical rate of return of 5% per year before expenses. Examples using a 5% hypothetical Fund return may be found in the shareholder reports of other mutual funds. The hypothetical account values and expenses may not be used to estimate the actual ending account balance or expenses you paid for the period. |
Please note that the expenses shown in these tables are meant to highlight your ongoing expenses only and do not reflect any transaction costs. The “Expenses Paid per $1,000” line of the tables is useful in comparing ongoing expenses only and will not help you determine the relative total expense of owning different funds. If these transaction costs had been included, your costs would have been higher.
| | | | | | | | |
| Expenses and Value of a $1,000 Investment for the six months ended December 31, 2017 | |
| | |
| Actual Fund Return | | Class A | | | Class B | |
| Beginning Account Value 7/1/17 | | $ | 1,000.00 | | | $ | 1,000.00 | |
| Ending Account Value 12/31/17 | | $ | 1,029.10 | | | $ | 1,029.00 | |
| Expenses Paid per $1,000* | | $ | 3.63 | | | $ | 4.65 | |
| | |
| Hypothetical 5% Fund Return | | Class A | | | Class B | |
| Beginning Account Value 7/1/17 | | $ | 1,000.00 | | | $ | 1,000.00 | |
| Ending Account Value 12/31/17 | | $ | 1,021.63 | | | $ | 1,020.62 | |
| Expenses Paid per $1,000* | | $ | 3.62 | | | $ | 4.63 | |
| * | Expenses are equal to the Fund’s annualized expense ratio for each share class, multiplied by the average account value over the period, multiplied by 184 (the number of days in the most recent six-month period), then divided by 365. |
| | | | | | | | |
| Annualized Expense Ratios | | Class A | | | Class B | |
| Deutsche Variable Series II — Deutsche High Income VIP | | | .71 | % | | | .91 | % |
For more information, please refer to the Fund’s prospectus.
These tables do not reflect charges and fees (“contract charges”) associated with the separate account that invests in the Fund or any variable life insurance policy or variable annuity contract for which the Fund is an investment option.
For an analysis of the fees associated with an investment in the fund or similar funds, please refer to the current and hypothetical expense calculators for Variable Insurance Products which can be found at deutschefunds.com/EN/resources/calculators.jsp.
| | | | | | |
| | 26 | | | | | | Deutsche Variable Series II — Deutsche High Income VIP |
| | |
| Tax Information | | (Unaudited) |
Please consult a tax advisor if you have questions about federal or state income tax laws, or on how to prepare your tax returns. If you have specific questions about your account, please contact your insurance provider.
Proxy Voting
The Trust’s policies and procedures for voting proxies for portfolio securities and information about how the Trust voted proxies related to its portfolio securities during the most recent 12-month period ended June 30 are available on our Web site — deutschefunds.com (click on “proxy voting” at the bottom of the page) — or on the SEC’s Web site — sec.gov. To obtain a written copy of the Trust’s policies and procedures without charge, upon request, call us toll free at (800) 728-3337.
| | | | |
Deutsche Variable Series II — Deutsche High Income VIP | | | | | 27 |
Advisory Agreement Board Considerations and Fee Evaluation
The Board of Trustees (hereinafter referred to as the “Board” or “Trustees”) approved the renewal of Deutsche High Income VIP’s (the “Fund”) investment management agreement (the “Agreement”) with Deutsche Investment Management Americas Inc. (“DIMA”) in September 2017.
In terms of the process that the Board followed prior to approving the Agreement, shareholders should know that:
| – | During the entire process, all of the Fund’s Trustees were independent of DIMA and its affiliates (the “Independent Trustees”). |
| – | The Board met frequently during the past year to discuss fund matters and dedicated a substantial amount of time to contract review matters. Over the course of several months, the Board’s Contract Committee reviewed extensive materials received from DIMA, independent third parties and independent counsel. These materials included an analysis of the Fund’s performance, fees and expenses, and profitability from a fee consultant retained by the Fund’s Independent Trustees (the “Fee Consultant”). Based on its evaluation of the information provided, the Contract Committee presented its findings and recommendations to the Board. The Board then reviewed the Contract Committee’s findings and recommendations. |
| – | The Board also received extensive information throughout the year regarding performance of the Fund. |
| – | The Independent Trustees regularly met privately with counsel to discuss contract review and other matters. In addition, the Independent Trustees were advised by the Fee Consultant in the course of their review of the Fund’s contractual arrangements and considered a comprehensive report prepared by the Fee Consultant in connection with their deliberations. |
| – | In connection with reviewing the Agreement, the Board also reviewed the terms of the Fund’s Rule 12b-1 plan, distribution agreement, administrative services agreement, transfer agency agreement and other material service agreements. |
In connection with the contract review process, the Contract Committee and the Board considered the factors discussed below, among others. The Board also considered that DIMA and its predecessors have managed the Fund since its inception, and the Board believes that a long-term relationship with a capable, conscientious advisor is in the best interests of the Fund. The Board considered, generally, that shareholders chose to invest or remain invested in the Fund knowing that DIMA managed the Fund, and that the Agreement was approved by the Fund’s shareholders. DIMA is part of Deutsche Bank AG’s (“Deutsche Bank”) Asset Management (“Deutsche AM”) division. Deutsche AM is a global asset management business that offers a wide range of investing expertise and resources, including research capabilities in many countries throughout the world.
As part of the contract review process, the Board carefully considered the fees and expenses of each Deutsche fund overseen by the Board in light of the fund’s performance. In many cases, this led to the negotiation and implementation of expense caps. As part of these negotiations, the Board indicated that it would consider relaxing these caps in future years following sustained improvements in performance, among other considerations.
While shareholders may focus primarily on fund performance and fees, the Fund’s Board considers these and many other factors, including the quality and integrity of DIMA’s personnel and administrative support services provided by DIMA, such as back-office operations, fund valuations, and compliance policies and procedures.
Nature, Quality and Extent of Services. The Board considered the terms of the Agreement, including the scope of advisory services provided under the Agreement. The Board noted that, under the Agreement, DIMA provides portfolio management services to the Fund and that, pursuant to a separate administrative services agreement, DIMA provides administrative services to the Fund. The Board considered the experience and skills of senior management and investment personnel and the resources made available to such personnel. The Board reviewed the Fund’s performance over short-term and long-term periods and compared those returns to various agreed-upon performance measures, including market index(es) and a peer universe compiled using information supplied by Morningstar Direct (“Morningstar”), an independent fund data service. The Board also noted that it has put into place a process of identifying “Funds in Review” (e.g., funds performing poorly relative to a peer universe), and receives additional reporting from DIMA regarding such funds and, where appropriate, DIMA’s plans to address underperformance. The Board
| | | | | | |
| | 28 | | | | | | Deutsche Variable Series II — Deutsche High Income VIP |
believes this process is an effective manner of identifying and addressing underperforming funds. Based on the information provided, the Board noted that, for the one-, three- and five-year periods ended December 31, 2016, the Fund’s performance (Class A shares) was in the 3rd quartile, 4th quartile and 4th quartile, respectively, of the applicable Morningstar universe (the 1st quartile being the best performers and the 4th quartile being the worst performers). The Board also observed that the Fund has underperformed its benchmark in the one-, three- and five-year periods ended December 31, 2016. The Board noted the disappointing investment performance of the Fund in recent periods and continued to discuss with senior management of DIMA the factors contributing to such underperformance and actions being taken to improve performance. The Board observed that the Fund had experienced improved relative performance during the first eight months of 2017. The Board recognized the efforts by DIMA in recent years to enhance its investment platform and improve long-term performance across the Deutsche fund complex.
Fees and Expenses. The Board considered the Fund’s investment management fee schedule, operating expenses and total expense ratios, and comparative information provided by Broadridge Financial Solutions, Inc. (“Broadridge”) and the Fee Consultant regarding investment management fee rates paid to other investment advisors by similar funds (1st quartile being the most favorable and 4th quartile being the least favorable). With respect to management fees paid to other investment advisors by similar funds, the Board noted that the contractual fee rates paid by the Fund, which include a 0.10% fee paid to DIMA under the Fund’s administrative services agreement, were lower than the median (1st quartile) of the applicable Broadridge peer group (based on Broadridge data provided as of December 31, 2016). The Board noted that the Fund’s Class A shares total (net) operating expenses were expected to be lower than the median (2nd quartile) of the applicable Broadridge expense universe (based on Broadridge data provided as of December 31, 2016, and analyzing Broadridge expense universe Class A (net) expenses less any applicable 12b-1 fees) (“Broadridge Universe Expenses”). The Board also reviewed data comparing each share class’s total (net) operating expenses to the applicable Broadridge Universe Expenses. The Board noted that the expense limitations agreed to by DIMA were expected to help the Fund’s total (net) operating expenses remain competitive. The Board considered the Fund’s management fee rate as compared to fees charged by DIMA to comparable Deutsche U.S. registered funds (“Deutsche Funds”) and considered differences between the Fund and the comparable Deutsche Funds. The information requested by the Board as part of its review of fees and expenses also included information about institutional accounts (including any sub-advised funds and accounts) and funds offered primarily to European investors (“Deutsche Europe funds”) managed by Deutsche AM. The Board noted that DIMA indicated that Deutsche AM does not manage any institutional accounts or Deutsche Europe funds comparable to the Fund.
On the basis of the information provided, the Board concluded that management fees were reasonable and appropriate in light of the nature, quality and extent of services provided by DIMA.
Profitability. The Board reviewed detailed information regarding revenues received by DIMA under the Agreement. The Board considered the estimated costs to DIMA, and pre-tax profits realized by DIMA, from advising the Deutsche Funds, as well as estimates of the pre-tax profits attributable to managing the Fund in particular. The Board also received information regarding the estimated enterprise-wide profitability of DIMA and its affiliates with respect to all fund services in totality and by fund. The Board and the Fee Consultant reviewed DIMA’s methodology in allocating its costs to the management of the Fund. Based on the information provided, the Board concluded that the pre-tax profits realized by DIMA in connection with the management of the Fund were not unreasonable. The Board also reviewed certain publicly available information regarding the profitability of certain similar investment management firms. The Board noted that, while information regarding the profitability of such firms is limited (and in some cases is not necessarily prepared on a comparable basis), DIMA and its affiliates’ overall profitability with respect to the Deutsche Funds (after taking into account distribution and other services provided to the funds by DIMA and its affiliates) was lower than the overall profitability levels of most comparable firms for which such data was available.
Economies of Scale. The Board considered whether there are economies of scale with respect to the management of the Fund and whether the Fund benefits from any economies of scale. The Board noted that the Fund’s investment management fee schedule includes fee breakpoints. The Board concluded that the Fund’s fee schedule represents an appropriate sharing between the Fund and DIMA of such economies of scale as may exist in the management of the Fund at current asset levels.
Other Benefits to DIMA and Its Affiliates. The Board also considered the character and amount of other incidental benefits received by DIMA and its affiliates, including any fees received by DIMA for administrative services provided to the Fund, any fees received by an affiliate of DIMA for transfer agency services provided
| | | | |
Deutsche Variable Series II — Deutsche High Income VIP | | | | | 29 |
to the Fund and any fees received by an affiliate of DIMA for distribution services. The Board also considered benefits to DIMA related to brokerage and soft-dollar allocations, including allocating brokerage to pay for research generated by parties other than the executing broker dealers, which pertain primarily to funds investing in equity securities. In addition, the Board considered the incidental public relations benefits to DIMA related to Deutsche Funds advertising and cross-selling opportunities among DIMA products and services. The Board considered these benefits in reaching its conclusion that the Fund’s management fees were reasonable.
Compliance. The Board considered the significant attention and resources dedicated by DIMA to documenting and enhancing its compliance processes in recent years. The Board noted in particular (i) the experience, seniority and time commitment of the individuals serving as DIMA’s and the Fund’s chief compliance officers; (ii) the large number of DIMA compliance personnel; and (iii) the substantial commitment of resources by DIMA and its affiliates to compliance matters.
Based on all of the information considered and the conclusions reached, the Board unanimously determined that the continuation of the Agreement is in the best interests of the Fund. In making this determination, the Board did not give particular weight to any single factor identified above. The Board considered these factors over the course of numerous meetings, certain of which were in executive session with only the Independent Trustees and counsel present. It is possible that individual Independent Trustees may have weighed these factors differently in reaching their individual decisions to approve the continuation of the Agreement.
| | | | | | |
| | 30 | | | | | | Deutsche Variable Series II — Deutsche High Income VIP |
Board Members and Officers
The following table presents certain information regarding the Board Members and Officers of the fund. Each Board Member’s year of birth is set forth in parentheses after his or her name. Unless otherwise noted, (i) each Board Member has engaged in the principal occupation(s) noted in the table for at least the most recent five years, although not necessarily in the same capacity; and (ii) the address of each Independent Board Member is c/o Keith R. Fox, Deutsche Funds Board Chair, c/o Thomas R. Hiller, Ropes & Gray LLP, Prudential Tower, 800 Boylston Street, Boston, MA 02199-3600. Except as otherwise noted below, the term of office for each Board Member is until the election and qualification of a successor, or until such Board Member sooner dies, resigns, is removed or as otherwise provided in the governing documents of the fund. Because the fund does not hold an annual meeting of shareholders, each Board Member will hold office for an indeterminate period. The Board Members may also serve in similar capacities with other funds in the fund complex.
| | | | | | | | |
| Independent Board Members | | | | | | | |
Name, Year of Birth,
Position with the Fund and
Length of Time Served1 | | Business Experience and Directorships During the Past Five Years | | Number of
Funds in
Deutsche
Fund
Complex
Overseen | | | Other
Directorships
Held by Board
Member |
Keith R. Fox, CFA (1954) Chairperson since 2017, and Board Member since 1996 | | Managing General Partner, Exeter Capital Partners (a series of private investment funds) (since 1986). Directorships: Progressive International Corporation (kitchen goods importer and distributor); The Kennel Shop (retailer); former Chairman, National Association of Small Business Investment Companies; former Directorships: BoxTop Media Inc. (advertising); Sun Capital Advisers Trust (mutual funds) (2011–2012) | | | 89 | | | — |
Kenneth C. Froewiss (1945) Vice Chairperson since 2017, and Board Member since 2001 | | Retired Clinical Professor of Finance, NYU Stern School of Business (1997–2014); Member, Finance Committee, Association for Asian Studies (2002–present); Director, Mitsui Sumitomo Insurance Group (US) (2004–present); prior thereto, Managing Director, J.P. Morgan (investment banking firm) (until 1996) | | | 92 | | | — |
John W. Ballantine (1946) Board Member since 1999 | | Retired; formerly, Executive Vice President and Chief Risk Management Officer, First Chicago NBD Corporation/The First National Bank of Chicago (1996–1998); Executive Vice President and Head of International Banking (1995–1996); former Directorships: Director and former Chairman of the Board, Healthways, Inc.2 (population well-being and wellness services) (2003–2014); Stockwell Capital Investments PLC (private equity); Enron Corporation; FNB Corporation; Tokheim Corporation; First Oak Brook Bancshares, Inc. and Oak Brook Bank; Prisma Energy International. Not-for-Profit Director, Trustee: Palm Beach Civic Association; Public Radio International; Window to the World Communications (public media); Harris Theater for Music and Dance (Chicago) | | | 89 | | | Portland
General
Electric2
(utility
company)
(2003–
present) |
Henry P. Becton, Jr. (1943) Board Member since 1990 | | Vice Chair and former President, WGBH Educational Foundation. Directorships: Public Radio International; Public Radio Exchange (PRX); The Pew Charitable Trusts (charitable organization); former Directorships: Becton Dickinson and Company2 (medical technology company); Belo Corporation2 (media company); The PBS Foundation; Association of Public Television Stations; Boston Museum of Science; American Public Television; Concord Academy; New England Aquarium; Mass. Corporation for Educational Telecommunications; Committee for Economic Development; Public Broadcasting Service; Connecticut College; North Bennett Street School (Boston) | | | 89 | | | — |
Dawn-Marie Driscoll (1946) Board Member since 1987 | | Emeritus Executive Fellow, Center for Business Ethics, Bentley University; formerly: President, Driscoll Associates (consulting firm); Partner, Palmer & Dodge (law firm) (1988–1990); Vice President of Corporate Affairs and General Counsel, Filene’s (retail) (1978–1988). Directorships: Advisory Board, Center for Business Ethics, Bentley University; Trustee and former Chairman of the Board, Southwest Florida Community Foundation (charitable organization); former Directorships: ICI Mutual Insurance Company (2007–2015); Sun Capital Advisers Trust (mutual funds) (2007–2012), Investment Company Institute (audit, executive, nominating committees) and Independent Directors Council (governance, executive committees) | | | 89 | | | — |
| | | | |
Deutsche Variable Series II — Deutsche High Income VIP | | | | | 31 |
| | | | | | | | |
Name, Year of Birth,
Position with the Fund and
Length of Time Served1 | | Business Experience and Directorships During the Past Five Years | | Number of
Funds in
Deutsche
Fund
Complex
Overseen | | | Other
Directorships
Held by Board
Member |
Paul K. Freeman (1950) Board Member since 1993 | | Consultant, World Bank/Inter-American Development Bank; Independent Directors Council (former chair); Investment Company Institute (executive and nominating committees); formerly: Chairman of Education Committee of Independent Directors Council; Project Leader, International Institute for Applied Systems Analysis (1998–2001); Chief Executive Officer, The Eric Group, Inc. (environmental insurance) (1986–1998); Directorships: Denver Zoo Foundation (December 2012–present); Knoebel Institute for Healthy Aging, University of Denver (2017–present); former Directorships: Prisma Energy International | | | 89 | | | — |
Richard J. Herring (1946) Board Member since 1990 | | Jacob Safra Professor of International Banking and Professor, Finance Department, The Wharton School, University of Pennsylvania (since July 1972); Co-Director, Wharton Financial Institutions Center; formerly: Vice Dean and Director, Wharton Undergraduate Division (July 1995–June 2000); Director, Lauder Institute of International Management Studies (July 2000–June 2006) | | | 89 | | | Director,
Aberdeen
Singapore
and Japan
Funds (since
2007);
Independent
Director of
Barclays
Bank
Delaware
(since
September
2010) |
William McClayton (1944) Board Member since 2004 | | Private equity investor (since October 2009); previously, Managing Director, Diamond Management & Technology Consultants, Inc. (global consulting firm) (2001–2009); Directorship: Board of Managers, YMCA of Metropolitan Chicago; formerly: Senior Partner, Arthur Andersen LLP (accounting) (1966–2001); Trustee, Ravinia Festival | | | 89 | | | — |
Rebecca W. Rimel (1951) Board Member since 1995 | | President, Chief Executive Officer and Director, The Pew Charitable Trusts (charitable organization) (1994–present); formerly: Executive Vice President, The Glenmede Trust Company (investment trust and wealth management) (1983–2004); Board Member, Investor Education (charitable organization) (2004–2005); Trustee, Executive Committee, Philadelphia Chamber of Commerce (2001–2007); Director, Viasys Health Care2 (January 2007–June 2007); Trustee, Thomas Jefferson Foundation (charitable organization) (1994–2012) | | | 89 | | | Director,
Becton
Dickinson
and
Company2
(medical
technology
company)
(2012–
present);
Director,
BioTelemetry
Inc2 (health
care) (2009–
present) |
William N. Searcy, Jr. (1946) Board Member since 1993 | | Private investor since October 2003; formerly: Pension & Savings Trust Officer, Sprint Corporation2 (telecommunications) (November 1989–September 2003); Trustee, Sun Capital Advisers Trust (mutual funds) (1998–2012) | | | 89 | | | — |
Jean Gleason Stromberg (1943) Board Member since 1997 | | Retired. Formerly, Consultant (1997–2001); Director, Financial Markets U.S. Government Accountability Office (1996–1997); Partner, Norton Rose Fulbright, L.L.P. (law firm) (1978–1996); former Directorships: The William and Flora Hewlett Foundation (charitable organization) (2000–2015); Service Source, Inc. (nonprofit), Mutual Fund Directors Forum (2002–2004), American Bar Retirement Association (funding vehicle for retirement plans) (1987–1990 and 1994–1996) | | | 89 | | | — |
| | | | | | |
| | 32 | | | | | | Deutsche Variable Series II — Deutsche High Income VIP |
| | |
| Officers4 | | |
Name, Year of Birth,
Position with the Fund and
Length of Time Served5 | | Business Experience and Directorships During the Past Five Years |
Hepsen Uzcan6,9 (1974) President and Chief Executive Officer, 2017–present Assistant Secretary, 2013–present | | Director,3 Deutsche Asset Management; formerly: Vice President for the Deutsche funds (2016–2017) |
John Millette8 (1962) Vice President and Secretary, 1999–present | | Director,3 Deutsche Asset Management; Chief Legal Officer, Deutsche Investment Management Americas Inc. (2015–present); and Director and Vice President, Deutsche AM Trust Company (since 2016); formerly: Secretary, Deutsche Investment Management Americas Inc. (2015–2017) |
Paul H. Schubert6 (1963) Chief Financial Officer, 2004–present Treasurer, 2005–present | | Managing Director,3 Deutsche Asset Management, and Chairman, Director and President, Deutsche AM Trust Company (since 2013); Vice President, Deutsche AM Distributors, Inc. (since 2016); Director, Deutsche AM Service Company (since 2017); Director and President, DB Investment Managers, Inc. (since 2017); formerly: Director, Deutsche AM Trust Company (2004–2013) |
Caroline Pearson8 (1962) Chief Legal Officer, 2010–present | | Managing Director,3 Deutsche Asset Management; formerly: Secretary, Deutsche AM Distributors, Inc.; and Secretary, Deutsche AM Service Company |
Scott D. Hogan8 (1970) Chief Compliance Officer, 2016–present | | Director,3 Deutsche Asset Management |
Wayne Salit7 (1967) Anti-Money Laundering Compliance Officer, 2014–present | | Director,3 Deutsche Asset Management; formerly: Managing Director, AML Compliance Officer at BNY Mellon (2011–2014); and Director, AML Compliance Officer at Deutsche Bank (2004–2011) |
Sheila Cadogan8 (1966) Assistant Treasurer, since July 12, 2017 | | Director,3 Deutsche Asset Management |
Paul Antosca8 (1957) Assistant Treasurer, 2007–present | | Director,3 Deutsche Asset Management |
Diane Kenneally8 (1966) Assistant Treasurer, 2007–present | | Director,3 Deutsche Asset Management |
| 1 | The length of time served represents the year in which the Board Member joined the board of one or more Deutsche funds currently overseen by the Board. |
| 2 | A publicly held company with securities registered pursuant to Section 12 of the Securities Exchange Act of 1934. |
| 3 | Executive title, not a board directorship. |
| 4 | As a result of their respective positions held with the Advisor, these individuals are considered “interested persons” of the Advisor within the meaning of the 1940 Act. Interested persons receive no compensation from the fund. |
| 5 | The length of time served represents the year in which the officer was first elected in such capacity for one or more Deutsche funds. |
| 6 | Address: 345 Park Avenue, New York, NY 10154. |
| 7 | Address: 60 Wall Street, New York, NY 10005. |
| 8 | Address: One International Place, Boston, MA 02110. |
| 9 | Appointed President and Chief Executive Officer effective December 1, 2017. |
The fund’s Statement of Additional Information (“SAI”) includes additional information about the Board Members. The SAI is available, without charge, upon request. If you would like to request a copy of the SAI, you may do so by calling the following toll-free number: (800) 728-3337.
| | | | |
Deutsche Variable Series II — Deutsche High Income VIP | | | | | 33 |
|
 |
VS2HI-2 (R-025832-7 2/18) |

December 31, 2017
Annual Report
Deutsche Variable Series II
Deutsche International Growth VIP
(formerly Deutsche Global Growth VIP)

Contents
This report must be preceded or accompanied by a prospectus. To obtain an additional prospectus or summary prospectus, if available, call (800) 728-3337 or your financial representative. We advise you to consider the Fund’s objectives, risks, charges and expenses carefully before investing. The summary prospectus and prospectus contain this and other important information about the Fund. Please read the prospectus carefully before you invest.
Stocks may decline in value. Smaller company stocks tend to be more volatile than medium-sized or large company stocks. Investing in foreign securities, particularly those of emerging markets, presents certain risks, such as currency fluctuations, political and economic changes, and market risks. Emerging markets tend to be more volatile and less liquid than the markets of more mature economies, and generally have less diverse and less mature economic structures and less stable political systems than those of developed countries. Investing in derivatives entails special risks relating to liquidity, leverage and credit that may reduce returns and/or increase volatility. The Fund may lend securities to approved institutions. Please read prospectus for details.
Deutsche Asset Management represents the asset management activities conducted by Deutsche Bank AG or any of its subsidiaries.
Deutsche AM Distributors, Inc., 222 South Riverside Plaza, Chicago, IL 60606, (800) 621-1148
NOT FDIC/NCUA INSURED NO BANK GUARANTEE MAY LOSE VALUE NOT A DEPOSIT
NOT INSURED BY ANY FEDERAL GOVERNMENT AGENCY
| | | | | | |
| | 2 | | | | | | Deutsche Variable Series II — Deutsche International Growth VIP |
| | |
| Performance Summary | | December 31, 2017 (Unaudited) |
Fund performance shown is historical, assumes reinvestment of all dividend and capital gain distributions and does not guarantee future results. Investment return and principal value fluctuate with changing market conditions so that, when redeemed, shares may be worth more or less than their original cost. Current performance may be lower or higher than the performance data quoted. Please contact your participating insurance company for the Fund’s most recent month-end performance. Performance doesn’t reflect charges and fees (“contract charges”) associated with the separate account that invests in the Fund or any variable life insurance policy or variable annuity contract for which the Fund is an investment option. These charges and fees will reduce returns. While all share classes have the same underlying portfolio, their performance will differ.
The gross expense ratios of the Fund, as stated in the fee table of the prospectus dated October 1, 2017 are 1.36% and 1.68% for Class A and Class B shares, respectively, and may differ from the expense ratios disclosed in the Financial Highlights tables in this report.
On October 1, 2017, the comparative broad-based index changed from the MSCI World Index to the MSCI All Country World Index ex USA. The Advisor believes that the MSCI World Index ex USA is more suitable for performance comparison given the fund’s investment strategy change.
Generally accepted accounting principles require adjustments to be made to the net assets of the Fund at period end for financial reporting purposes only, and as such, the total return based on the unadjusted net asset value per share may differ from the total return reported in the financial highlights.
Growth of an Assumed $10,000 Investment in Deutsche Global Growth VIP
| | |
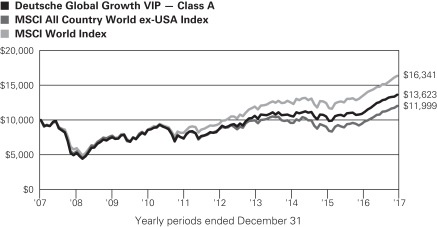 | | The MSCI All Country World ex-USA Index is designed to provide a broad measure of stock performance throughout the world, with the exception of U.S.-based companies. The MSCI All Country World ex-USA Index includes both developed and emerging markets. The MSCI World Index captures large and mid cap representation across 23 Developed Markets countries. Index returns do not reflect any fees or expenses and it is not possible to invest directly into an index. |
The growth of $10,000 is cumulative.
| | | | | | | | | | |
| Comparative Results | | | | | | | | | | |
| | | | | |
| Deutsche International Growth VIP | | | | 1-Year | | 3-Year | | 5-Year | | 10-Year |
| Class A | | Growth of $10,000 | | $12,547 | | $12,853 | | $15,709 | | $13,623 |
| | | Average annual total return | | 25.47% | | 8.73% | | 9.45% | | 3.14% |
| MSCI All Country World ex-USA Index | | Growth of $10,000 | | $12,719 | | $12,538 | | $13,896 | | $11,999 |
| | | Average annual total return | | 27.19% | | 7.83% | | 6.80% | | 1.84% |
| MSCI World Index | | Growth of $10,000 | | $12,240 | | $13,045 | | $17,340 | | $16,341 |
| | Average annual total return | | 22.40% | | 9.26% | | 11.64% | | 5.03% |
| | | | | |
| Deutsche International Growth VIP | | | | 1-Year | | 3-Year | | 5-Year | | 10-Year |
| Class B | | Growth of $10,000 | | $15,526 | | $12,748 | | $15,468 | | $13,186 |
| | | Average annual total return | | 25.26% | | 8.43% | | 9.11% | | 2.80% |
| MSCI All Country World ex-USA Index | | Growth of $10,000 | | $12,719 | | $12,538 | | $13,896 | | $11,999 |
| | Average annual total return | | 27.19% | | 7.83% | | 6.80% | | 1.84% |
| MSCI World Index | | Growth of $10,000 | | $12,240 | | $13,045 | | $17,340 | | $16,341 |
| | Average annual total return | | 22.40% | | 9.26% | | 11.64% | | 5.03% |
| | | | |
Deutsche Variable Series II — Deutsche International Growth VIP | | | | | 3 |
| | |
| Management Summary | | December 31, 2017 (Unaudited) |
The Fund’s Class A shares returned 25.47% during 2017 (unadjusted for contract charges), trailing the 27.19% return of the MSCI All-Country World ex-USA Index.
On October 1, 2017, Deutsche International Growth VIP adopted a foreign large-cap growth strategy. The Deutsche Fund Board approved a proposal to reposition the Fund from an emphasis on both U.S. and foreign growth stocks to focus on growth stocks mainly outside of the United States. The Fund’s name changed to Deutsche International Growth VIP, and its benchmark changed from the MSCI World Index to the MSCI All Country World ex-USA Index. The Fund’s 12-month performance therefore reflects the results of two strategies.
The Fund’s positioning in the financials made the largest contribution to performance in 2017. Many of our top performers in the sector were U.S. companies that we have since sold, including S&P Global, Inc.* and Progressive Corp.* We also generated strong returns from a position in Brookfield Asset Management, Inc., a Canadian company that we owned prior to the strategy change. The stock performed very well in the 12-month period thanks to rising earnings, continued gains in its assets under management and the growth of its emerging-markets business. Ping An Insurance (Group) of China, Ltd. and PT Bank Rakyat Indonesia Persero Tbk both added meaningful value due to their strong showing late in the year. We held these positions based on the belief that well-managed financials are in a prime position to benefit from the economic growth prospects and associated wealth effect in their home markets, where financial services remain underpenetrated.
Information technology was an additional area of strength for the Fund, due in large part to investments in the Chinese media and internet giants Tencent Holdings Ltd. and Alibaba Group Holding Ltd. The two companies have capitalized on the rapid development of e-commerce in China, helping them exceed analysts’ growth expectations. Positions in the U.S. stocks Activision Blizzard, Inc. and Broadcom Ltd.* also made sizable contributions prior to the strategy shift. Technology remains a key area of focus for the Fund, as the sector is home to a high representation of the types of fast-growing companies we seek.
On the negative side, we lost some ground from the underperformance of a handful of holdings in health care. Celgene Corp., which reduced its long-term earnings expectations following a failed trial results, was the largest detractor in the sector. Shares of the specialty pharmaceutical company Allergan PLC also slid due to heightened generic competition for one of its key medications. Positions in the U.S. retailers L Brands, Inc.* and TJX Corp.* further weighed on performance, as the timing of the Fund’s move to an international-focused strategy in the autumn prompted us to sell the stocks prior to their fourth-quarter recovery.
As a result of the Fund’s strategy change, the majority of our portfolio activity for the year involved selling positions in U.S. equities and redeploying the proceeds into opportunities overseas. Our overall approach to stock selection remained the same, with a continued emphasis on companies that we believe feature strong organic growth trends, solid competitive advantages and exposure to important secular themes.
With regard to the broader market backdrop, we see little reason for a near-term shift away from the environment gradual economic expansion and subdued inflation. At the same time, we do not expect that the world economy will accelerate significantly from its current pace — a trend that could continue to drive investor demand for growth stocks. On a longer-term basis, we view the international markets as being fertile ground in which to find reasonably valued companies with sustainable, above-average growth prospects.
Sebastian P. Werner, PhD, Director
Mark Schumann, CFA, Director
Portfolio Managers
The views expressed reflect those of the portfolio management team only through the end of the period of the report as stated on the cover. The management team’s views are subject to change at any time based on market and other conditions and should not be construed as a recommendation. Past performance is no guarantee of future results. Current and future portfolio holdings are subject to risk.
| | | | | | |
| | 4 | | | | | | Deutsche Variable Series II — Deutsche International Growth VIP |
Terms to Know
The MSCI World Index captures large and mid cap representation across 23 Developed Markets countries. With 1,652 constituents, the index covers approximately 85% of the free float-adjusted market capitalization in each country.
The MSCI All Country World ex-USA Index is designed to provide a broad measure of stock performance throughout the world, with the exception of U.S.-based companies. The MSCI All Country World Index Ex-U.S. includes both developed and emerging markets.
Contribution and detraction incorporate both a stock’s total return and its weighting in the fund.
| * | Held and sold prior to December 31, 2017. |
| | | | |
Deutsche Variable Series II — Deutsche International Growth VIP | | | | | 5 |
| | |
| Portfolio Summary | | (Unaudited) |
| | | | | | | | |
| Asset Allocation (As a % of Investment Portfolio excluding Securities Lending Collateral) | | 12/31/17 | | | 12/31/16 | |
Common Stocks | | | 96% | | | | 97% | |
Cash Equivalents | | | 4% | | | | 2% | |
Preferred Stocks | | | 0% | | | | 1% | |
Warrants | | | 0% | | | | 0% | |
| | | | 100% | | | | 100% | |
| | |
Sector Diversification (As a % of Investment Portfolio excluding Cash Equivalents and Securities Lending Collateral) | | 12/31/17 | | | 12/31/16 | |
Financials | | | 22% | | | | 18% | |
Industrials | | | 17% | | | | 10% | |
Information Technology | | | 17% | | | | 20% | |
Health Care | | | 14% | | | | 20% | |
Consumer Discretionary | | | 14% | | | | 13% | |
Materials | | | 6% | | | | 5% | |
Consumer Staples | | | 6% | | | | 9% | |
Energy | | | 3% | | | | 3% | |
Telecommunication Services | | | 1% | | | | 2% | |
| | | | 100% | | | | 100% | |
| | |
Geographical Diversification (As a % of Investment Portfolio excluding Cash Equivalents and Securities Lending Collateral) | | 12/31/17 | | | 12/31/16 | |
United States | | | 12% | | | | 56% | |
| France | | | 12% | | | | 1% | |
Canada | | | 12% | | | | 5% | |
Germany | | | 11% | | | | 6% | |
United Kingdom | | | 10% | | | | 5% | |
China | | | 7% | | | | 1% | |
Switzerland | | | 7% | | | | 5% | |
Japan | | | 6% | | | | 6% | |
Netherlands | | | 3% | | | | 1% | |
Sweden | | | 2% | | | | 3% | |
Singapore | | | 2% | | | | 2% | |
Finland | | | 2% | | | | 1% | |
Other | | | 14% | | | | 8% | |
| | | | 100% | | | | 100% | |
Portfolio holdings and characteristics are subject to change.
For more complete details about the Fund’s investment portfolio, see page 7.
Following the Fund’s fiscal first and third quarter-end, a complete portfolio holdings listing is filed with the SEC on Form N-Q. The form will be available on the SEC’s Web site at sec.gov, and it also may be reviewed and copied at the SEC’s Public Reference Room in Washington, D.C. Information on the operation of the SEC’s Public Reference Room may be obtained by calling (800) SEC-0330. The Fund’s portfolio holdings are also posted on deutschefunds.com from time to time. Please see the Fund’s current prospectus for more information.
| | | | | | |
| | 6 | | | | | | Deutsche Variable Series II — Deutsche International Growth VIP |
| | |
| Investment Portfolio | | December 31, 2017 |
| | | | | | | | |
| | | Shares | | | Value ($) | |
| Common Stocks 94.6% | | | | | | | | |
| Australia 1.2% | | | | | | | | |
Australia & New Zealand Banking Group Ltd. (Cost $224,846) | | | 10,079 | | | | 225,774 | |
| | |
| Canada 11.2% | | | | | | | | |
Agnico Eagle Mines Ltd. | | | 6,771 | | | | 312,640 | |
Alimentation Couche-Tard, Inc. “B” | | | 4,430 | | | | 231,157 | |
Bank of Nova Scotia | | | 3,715 | | | | 239,746 | |
Brookfield Asset Management, Inc. “A” | | | 9,600 | | | | 417,909 | |
Canada Goose Holdings, Inc.* | | | 4,791 | | | | 151,353 | |
Canadian National Railway Co. | | | 2,973 | | | | 245,148 | |
Enbridge, Inc. | | | 2,493 | | | | 97,499 | |
Gildan Activewear, Inc. | | | 4,987 | | | | 161,115 | |
Toronto-Dominion Bank | | | 4,184 | | | | 245,149 | |
| | | | | | | | |
(Cost $1,573,037) | | | | | | | 2,101,716 | |
| | |
| China 7.1% | | | | | | | | |
Alibaba Group Holding Ltd. (ADR)* | | | 1,556 | | | | 268,301 | |
China Life Insurance Co., Ltd. “H” | | | 58,000 | | | | 182,202 | |
China Literature Ltd. 144A* | | | 6 | | | | 64 | |
Minth Group Ltd. | | | 26,870 | | | | 162,221 | |
New Oriental Education & Technology Group, Inc. (ADR) | | | 1,467 | | | | 137,898 | |
Ping An Insurance (Group) Co. of China Ltd. “H” | | | 27,500 | | | | 286,557 | |
Sogou, Inc. (ADR)* (a) | | | 1,116 | | | | 12,912 | |
Tencent Holdings Ltd. | | | 5,600 | | | | 291,274 | |
| | | | | | | | |
(Cost $914,430) | | | | | | | 1,341,429 | |
| | |
| Denmark 0.6% | | | | | | | | |
Chr Hansen Holding AS (Cost $102,932) | | | 1,174 | | | | 110,148 | |
| | |
| Finland 1.6% | | | | | | | | |
Cramo Oyj | | | 2,641 | | | | 62,703 | |
Sampo Oyj “A” | | | 4,507 | | | | 247,926 | |
| | | | | | | | |
(Cost $274,409) | | | | | | | 310,629 | |
| | |
| France 11.7% | | | | | | | | |
Air Liquide SA | | | 2,152 | | | | 271,407 | |
AXA SA | | | 5,573 | | | | 165,567 | |
Capgemini SE | | | 2,054 | | | | 244,131 | |
LVMH Moet Hennessy Louis Vuitton SE | | | 900 | | | | 265,098 | |
Schneider Electric SE* | | | 3,257 | | | | 276,333 | |
SMCP SAS 144A* | | | 8,560 | | | | 197,711 | |
Teleperformance | | | 958 | | | | 137,406 | |
TOTAL SA | | | 3,373 | | | | 186,322 | |
VINCI SA | | | 2,689 | | | | 274,906 | |
Vivendi SA | | | 7,235 | | | | 194,335 | |
| | | | | | | | |
(Cost $2,139,138) | | | | | | | 2,213,216 | |
| | |
| Germany 10.6% | | | | | | | | |
Allianz SE (Registered) | | | 1,272 | | | | 292,796 | |
BASF SE | | | 1,662 | | | | 183,387 | |
Continental AG | | | 679 | | | | 183,832 | |
Deutsche Post AG (Registered) | | | 3,105 | | | | 148,424 | |
Deutsche Telekom AG (Registered) | | | 13,684 | | | | 243,606 | |
| | | | | | | | |
| | | Shares | | | Value ($) | |
Fresenius Medical Care AG & Co. KGaA | | | 2,911 | | | | 307,004 | |
Infineon Technologies AG | | | 4,351 | | | | 119,335 | |
OSRAM Licht AG | | | 1,643 | | | | 146,909 | |
SAP SE | | | 1,623 | | | | 182,505 | |
Siemens AG (Registered) | | | 1,370 | | | | 191,224 | |
| | | | | | | | |
(Cost $1,642,173) | | | | | | | 1,999,022 | |
| | |
| Hong Kong 0.8% | | | | | | | | |
Techtronic Industries Co., Ltd. (Cost $52,263) | | | 22,097 | | | | 144,597 | |
| | |
| Indonesia 1.3% | | | | | | | | |
PT Arwana Citramulia Tbk | | | 621,918 | | | | 15,637 | |
PT Bank Rakyat Indonesia Persero Tbk | | | 822,700 | | | | 220,971 | |
| | | | | | | | |
(Cost $206,264) | | | | | | | 236,608 | |
| | |
| Ireland 1.2% | | | | | | | | |
Kerry Group PLC “A” (Cost $134,923) | | | 1,998 | | | | 224,298 | |
| | |
| Italy 0.5% | | | | | | | | |
Luxottica Group SpA (Cost $88,069) | | | 1,502 | | | | 92,110 | |
| | |
| Japan 5.5% | | | | | | | | |
Bandai Namco Holdings, Inc. | | | 2,700 | | | | 88,351 | |
FANUC Corp. | | | 500 | | | | 120,209 | |
Hoya Corp. | | | 3,500 | | | | 174,780 | |
Keyence Corp. | | | 300 | | | | 167,845 | |
Komatsu Ltd. | | | 3,700 | | | | 134,189 | |
MISUMI Group, Inc. | | | 5,011 | | | | 146,142 | |
Murata Manufacturing Co., Ltd. | | | 700 | | | | 93,841 | |
Omron Corp. | | | 1,900 | | | | 113,416 | |
| | | | | | | | |
(Cost $850,894) | | | | | | | 1,038,773 | |
| | |
| Korea 1.2% | | | | | | | | |
Samsung Electronics Co., Ltd. (Cost $207,249) | | | 98 | | | | 233,996 | |
| | |
| Luxembourg 1.1% | | | | | | | | |
Eurofins Scientific (Cost $77,451) | | | 356 | | | | 216,873 | |
| | |
| Macau 0.6% | | | | | | | | |
Sands China Ltd. (Cost $113,186) | | | 22,000 | | | | 113,527 | |
| | |
| Malaysia 0.7% | | | | | | | | |
IHH Healthcare Bhd. (Cost $129,229) | | | 95,000 | | | | 137,490 | |
| | |
| Netherlands 2.7% | | | | | | | | |
ASML Holding NV | | | 1,272 | | | | 221,169 | |
Core Laboratories NV (a) (b) | | | 772 | | | | 84,573 | |
ING Groep NV | | | 10,569 | | | | 194,230 | |
| | | | | | | | |
(Cost $426,152) | | | | | | | 499,972 | |
| | |
| Norway 0.4% | | | | | | | | |
Marine Harvest ASA* (Cost $47,889) | | | 4,156 | | | | 70,320 | |
| | |
| Singapore 1.7% | | | | | | | | |
DBS Group Holdings Ltd. (Cost $264,978) | | | 17,000 | | | | 315,440 | |
The accompanying notes are an integral part of the financial statements.
| | | | |
Deutsche Variable Series II — Deutsche International Growth VIP | | | | | 7 |
| | | | | | | | |
| | | Shares | | | Value ($) | |
| | |
| South Africa 1.2% | | | | | | | | |
Naspers Ltd. “N” (Cost $182,437) | | | 802 | | | | 223,916 | |
| | |
| Spain 1.1% | | | | | | | | |
Banco Santander SA (Cost $212,797) | | | 32,354 | | | | 212,882 | |
| | |
| Sweden 2.1% | | | | | | | | |
Assa Abloy AB “B” | | | 10,810 | | | | 224,895 | |
Nobina AB 144A | | | 25,600 | | | | 168,738 | |
| | | | | | | | |
(Cost $304,722) | | | | | | | 393,633 | |
| | |
| Switzerland 6.5% | | | | | | | | |
Lonza Group AG (Registered)* | | | 1,443 | | | | 390,250 | |
Nestle SA (Registered) | | | 3,725 | | | | 320,491 | |
Novartis AG (Registered) | | | 3,130 | | | | 264,309 | |
Roche Holding AG (Genusschein) | | | 1,001 | | | | 253,373 | |
| | | | | | | | |
(Cost $933,354) | | | | | | | 1,228,423 | |
| | |
| Taiwan 0.9% | | | | | | | | |
Taiwan Semiconductor Manufacturing Co., Ltd. (Cost $139,216) | | | 23,000 | | | | 177,164 | |
| | |
| United Kingdom 9.4% | | | | | | | | |
Aon PLC (b) | | | 2,161 | | | | 289,574 | |
Clinigen Healthcare Ltd. | | | 5,959 | | | | 82,965 | |
Compass Group PLC | | | 13,264 | | | | 286,560 | |
ConvaTec Group PLC 144A | | | 28,738 | | | | 79,761 | |
Experian PLC | | | 8,505 | | | | 187,774 | |
Halma PLC | | | 6,268 | | | | 106,661 | |
Prudential PLC | | | 9,884 | | | | 254,454 | |
Reckitt Benckiser Group PLC | | | 1,564 | | | | 146,121 | |
RELX NV | | | 8,095 | | | | 186,343 | |
Smith & Nephew PLC | | | 8,163 | | | | 141,820 | |
| | | | | | | | |
(Cost $1,523,591) | | | | | | | 1,762,033 | |
| | |
| United States 11.7% | | | | | | | | |
A.O. Smith Corp. | | | 1,985 | | | | 121,641 | |
Activision Blizzard, Inc. | | | 2,738 | | | | 173,370 | |
Allergan PLC | | | 540 | | | | 88,333 | |
AMETEK, Inc. | | | 2,720 | | | | 197,118 | |
Amphenol Corp. “A” | | | 2,161 | | | | 189,736 | |
Celgene Corp.* | | | 1,861 | | | | 194,214 | |
Ecolab, Inc. | | | 1,504 | | | | 201,807 | |
EPAM Systems, Inc.* | | | 909 | | | | 97,654 | |
Marsh & McLennan Companies, Inc. | | | 2,176 | | | | 177,105 | |
Mastercard, Inc. “A” | | | 1,272 | | | | 192,530 | |
NVIDIA Corp. | | | 489 | | | | 94,621 | |
Schlumberger Ltd. | | | 1,736 | | | | 116,989 | |
| | | | | | | | |
| | | Shares | | | Value ($) | |
The Priceline Group, Inc.* | | | 101 | | | | 175,512 | |
Thermo Fisher Scientific, Inc. | | | 978 | | | | 185,702 | |
| | | | | | | | |
(Cost $1,568,547) | | | | | | | 2,206,332 | |
Total Common Stocks (Cost $14,334,176) | | | | 17,830,321 | |
| | |
| Warrants 0.0% | | | | | | | | |
| France | | | | | | | | |
Parrot SA Expiration Date (c) 12/15/2022* | | | 924 | | | | 217 | |
Parrot SA Expiration Date (c) 12/22/2022* | | | 924 | | | | 249 | |
Total Warrants (Cost $0) | | | | 466 | |
| | |
| Preferred Stocks 0.4% | | | | | | | | |
| Germany 0.3% | | | | | | | | |
Draegerwerk AG & Co. KGaA (Cost $45,679) | | | 630 | | | | 54,722 | |
| | |
| United States 0.1% | | | | | | | | |
Providence Service Corp. (c) (Cost $13,600) | | | 136 | | | | 20,236 | |
Total Preferred Stocks (Cost $59,279) | | | | 74,958 | |
|
| Securities Lending Collateral 0.5% | |
Deutsche Government & Agency Securities Portfolio “Deutsche Government Cash Institutional Shares”, 1.21% (d) (e) (Cost $88,780) | | | 88,780 | | | | 88,780 | |
| | |
| Cash Equivalents 3.6% | | | | | | | | |
Deutsche Central Cash Management Government Fund, 1.30% (d)
(Cost $687,282) | | | 687,282 | | | | 687,282 | |
| | |
| | | % of Net
Assets | | | Value ($) | |
Total Investment Portfolio (Cost $15,169,517) | | | 99.1 | | | | 18,681,807 | |
| Other Assets and Liabilities, Net | | | 0.9 | | | | 160,710 | |
| Net Assets | | | 100.0 | | | | 18,842,517 | |
| * | Non-income producing security. |
| (a) | All or a portion of these securities were on loan. In addition, “Other Assets and Liabilities, Net” may include pending sales that are also on loan. The value of securities loaned at December 31, 2017 amounted to $87,487, which is 0.5% of net assets. |
| (b) | Listed on the New York Stock Exchange. |
| (c) | Investment was valued using significant unobservable inputs. |
| (d) | Affiliated fund managed by Deutsche Investment Management Americas Inc. The rate shown is the annualized seven-day yield at period end. |
| (e) | Represents collateral held in connection with securities lending. Income earned by the Fund is net of borrower rebates. |
144A: Security exempt from registration under Rule 144A of the Securities Act of 1933. These securities may be resold in transactions exempt from registration, normally to qualified institutional buyers.
ADR: American Depositary Receipt
The accompanying notes are an integral part of the financial statements.
| | | | | | |
| | 8 | | | | | | Deutsche Variable Series II — Deutsche International Growth VIP |
Fair Value Measurements
Various inputs are used in determining the value of the Fund’s investments. These inputs are summarized in three broad levels. Level 1 includes quoted prices in active markets for identical securities. Level 2 includes other significant observable inputs (including quoted prices for similar securities, interest rates, prepayment speeds and credit risk). Level 3 includes significant unobservable inputs (including the Fund’s own assumptions in determining the fair value of investments). The level assigned to the securities valuations may not be an indication of the risk or liquidity associated with investing in those securities.
The following is a summary of the inputs used as of December 31, 2017 in valuing the Fund’s investments. For information on the Fund’s policy regarding the valuation of investments, please refer to the Security Valuation section of Note A in the accompanying Notes to Financial Statements.
| | | | | | | | | | | | | | | | |
| Assets | | Level 1 | | | Level 2 | | | Level 3 | | | Total | |
Common Stocks | | | | | | | | | | | | | | | | |
Australia | | $ | — | | | $ | 225,774 | | | $ | — | | | $ | 225,774 | |
Canada | | | 2,101,716 | | | | — | | | | — | | | | 2,101,716 | |
China | | | 419,175 | | | | 922,254 | | | | — | | | | 1,341,429 | |
Denmark | | | — | | | | 110,148 | | | | — | | | | 110,148 | |
Finland | | | — | | | | 310,629 | | | | — | | | | 310,629 | |
France | | | 197,711 | | | | 2,015,505 | | | | — | | | | 2,213,216 | |
Germany | | | — | | | | 1,999,022 | | | | — | | | | 1,999,022 | |
Hong Kong | | | — | | | | 144,597 | | | | — | | | | 144,597 | |
Indonesia | | | — | | | | 236,608 | | | | — | | | | 236,608 | |
Ireland | | | — | | | | 224,298 | | | | — | | | | 224,298 | |
Italy | | | — | | | | 92,110 | | | | — | | | | 92,110 | |
Japan | | | — | | | | 1,038,773 | | | | — | | | | 1,038,773 | |
Korea | | | — | | | | 233,996 | | | | — | | | | 233,996 | |
Luxembourg | | | — | | | | 216,873 | | | | — | | | | 216,873 | |
Macau | | | — | | | | 113,527 | | | | — | | | | 113,527 | |
Malaysia | | | — | | | | 137,490 | | | | — | | | | 137,490 | |
Netherlands | | | 84,573 | | | | 415,399 | | | | — | | | | 499,972 | |
Norway | | | — | | | | 70,320 | | | | — | | | | 70,320 | |
Singapore | | | — | | | | 315,440 | | | | — | | | | 315,440 | |
South Africa | | | — | | | | 223,916 | | | | — | | | | 223,916 | |
Spain | | | — | | | | 212,882 | | | | — | | | | 212,882 | |
Sweden | | | — | | | | 393,633 | | | | — | | | | 393,633 | |
Switzerland | | | — | | | | 1,228,423 | | | | — | | | | 1,228,423 | |
Taiwan | | | — | | | | 177,164 | | | | — | | | | 177,164 | |
United Kingdom | | | 289,574 | | | | 1,472,459 | | | | — | | | | 1,762,033 | |
United States | | | 2,206,332 | | | | — | | | | — | | | | 2,206,332 | |
| Warrants (f) | | | — | | | | — | | | | 466 | | | | 466 | |
| Preferred Stocks (f) | | | — | | | | 54,722 | | | | 20,236 | | | | 74,958 | |
| Short-Term Investments (f) | | | 776,062 | | | | — | | | | — | | | | 776,062 | |
| Total | | $ | 6,075,143 | | | $ | 12,585,962 | | | $ | 20,702 | | | $ | 18,681,807 | |
There have been no transfers between fair value measurement levels during the year ended December 31, 2017.
| (f) | See Investment Portfolio for additional detailed categorizations. |
The accompanying notes are an integral part of the financial statements.
| | | | |
Deutsche Variable Series II — Deutsche International Growth VIP | | | | | 9 |
Statement of Assets and Liabilities
| | | | |
| as of December 31, 2017 | | | | |
| |
| Assets | | | | |
| Investments in non-affiliated securities, at value (cost $14,393,455) — including $87,487 of securities loaned | | $ | 17,905,745 | |
| Investment in Deutsche Government & Agency Securities Portfolio (cost $88,780)* | | | 88,780 | |
| Investment in Deutsche Central Cash Management Government Fund (cost $687,282) | | | 687,282 | |
| Cash | | | 9,818 | |
| Foreign currency, at value (cost $246,064) | | | 248,327 | |
| Receivable for Fund shares sold | | | 36,238 | |
| Dividends receivable | | | 6,327 | |
| Interest receivable | | | 392 | |
| Foreign taxes recoverable | | | 14,718 | |
| Other assets | | | 1,032 | |
| Total assets | | | 18,998,659 | |
| |
| Liabilities | | | | |
| Payable upon return of securities loaned | | | 88,780 | |
| Payable for Fund shares redeemed | | | 2,553 | |
| Accrued Trustees’ fees | | | 853 | |
| Other accrued expenses and payables | | | 63,956 | |
| Total liabilities | | | 156,142 | |
| Net assets, at value | | $ | 18,842,517 | |
| |
| Net Assets Consist of | | | | |
| Undistributed net investment income | | | 166,256 | |
| Net unrealized appreciation (depreciation) on: | | | | |
Investments | | | 3,512,290 | |
Foreign currency | | | 2,509 | |
| Accumulated net realized gain (loss) | | | (31,943 | ) |
| Paid-in capital | | | 15,193,405 | |
| Net assets, at value | | $ | 18,842,517 | |
| |
| Net Asset Value | | | | |
Class A | | | | |
| Net Asset Value, offering and redemption price per share ($18,635,478 ÷ 1,340,522 outstanding shares of beneficial interest, no par value, unlimited number of shares authorized) | | $ | 13.90 | |
Class B | | | | |
| Net Asset Value, offering and redemption price per share ($207,039 ÷ 14,862 outstanding shares of beneficial interest, no par value, unlimited number of shares authorized) | | $ | 13.93 | |
| * | Represents collateral on securities loaned. |
Statement of Operations
| | | | |
| for the year ended December 31, 2017 | | | | |
| |
| Investment Income | | | | |
| Income: | | | | |
| Dividends (net of foreign taxes withheld of $33,602) | | $ | 408,307 | |
| Income distributions — Deutsche Central Cash Management Government Fund | | | 4,259 | |
| Securities lending income, net of borrower rebates | | | 1,447 | |
| Total income | | | 414,013 | |
| Expenses: | | | | |
| Management fee | | | 231,216 | |
| Administration fee | | | 27,084 | |
| Services to shareholders | | | 636 | |
| Record keeping fee (Class B) | | | 76 | |
| Distribution service fees (Class B) | | | 337 | |
| Custodian fee | | | 30,425 | |
| Professional fees | | | 83,039 | |
| Reports to shareholders | | | 26,913 | |
| Trustees’ fees and expenses | | | 3,029 | |
| Other | | | 21,229 | |
| Total expenses before expense reductions | | | 423,984 | |
| Expense reductions | | | (174,230 | ) |
| Total expenses after expense reductions | | | 249,754 | |
| Net investment income (loss) | | | 164,259 | |
| |
| Realized and Unrealized Gain (Loss) | | | | |
| Net realized gain (loss) from: | | | | |
| Investments | | | 4,628,855 | |
| Foreign currency | | | 14,964 | |
| Payments by affiliates (see Note G) | | | 7,312 | |
| | | | 4,651,131 | |
| Change in net unrealized appreciation (depreciation) on: | | | | |
| Investments | | | 1,406,765 | |
| Foreign currency | | | 7,934 | |
| | | | 1,414,699 | |
| Net gain (loss) | | | 6,065,830 | |
| Net increase (decrease) in net assets resulting from operations | | $ | 6,230,089 | |
The accompanying notes are an integral part of the financial statements.
| | | | | | |
| | 10 | | | | | | Deutsche Variable Series II — Deutsche International Growth VIP |
Statements of Changes in Net Assets
| | | | | | | | |
| | | Years Ended December 31, | |
| Increase (Decrease) in Net Assets | | 2017 | | | 2016 | |
Operations: | | | | | | | | |
Net investment income (loss) | | $ | 164,259 | | | $ | 146,983 | |
Net realized gain (loss) | | | 4,651,131 | | | | 1,336,318 | |
Change in net unrealized appreciation (depreciation) | | | 1,414,699 | | | | (701,827 | ) |
Net increase (decrease) in net assets resulting from operations | | | 6,230,089 | | | | 781,474 | |
Distributions to shareholders from: | | | | | | | | |
Net investment income: | | | | | | | | |
Class A | | | (106,825 | ) | | | (243,128 | ) |
Class B | | | (65 | ) | | | (285 | ) |
Total distributions | | | (106,890 | ) | | | (243,413 | ) |
Fund share transactions: | | | | | | | | |
Class A | | | | | | | | |
Proceeds from shares sold | | | 2,240,215 | | | | 1,028,197 | |
Reinvestment of distributions | | | 106,825 | | | | 243,128 | |
Cost of shares redeemed | | | (16,678,132 | ) | | | (8,614,441 | ) |
Net increase (decrease) in net assets from Class A share transactions | | | (14,331,092 | ) | | | (7,343,116 | ) |
Class B | | | | | | | | |
Proceeds from shares sold | | | 117,051 | | | | 14,771 | |
Reinvestment of distributions | | | 65 | | | | 285 | |
Cost of shares redeemed | | | (6,431 | ) | | | (11,122 | ) |
Net increase (decrease) in net assets from Class B share transactions | | | 110,685 | | | | 3,934 | |
Increase (decrease) in net assets | | | (8,097,208 | ) | | | (6,801,121 | ) |
Net assets at beginning of period | | | 26,939,725 | | | | 33,740,846 | |
Net assets at end of period (including undistributed net investment income of $166,256 and $93,056, respectively) | | $ | 18,842,517 | | | $ | 26,939,725 | |
| | |
Other Information | | | | | | | | |
Class A | | | | | | | | |
Shares outstanding at beginning of period | | | 2,417,159 | | | | 3,116,107 | |
Shares sold | | | 171,566 | | | | 95,060 | |
Shares issued to shareholders in reinvestment of distributions | | | 8,713 | | | | 22,163 | |
Shares redeemed | | | (1,256,916 | ) | | | (816,171 | ) |
Net increase (decrease) in Class A shares | | | (1,076,637 | ) | | | (698,948 | ) |
Shares outstanding at end of period | | | 1,340,522 | | | | 2,417,159 | |
Class B | | | | | | | | |
Shares outstanding at beginning of period | | | 6,272 | | | | 6,040 | |
Shares sold | | | 9,077 | | | | 1,328 | |
Shares issued to shareholders in reinvestment of distributions | | | 5 | | | | 26 | |
Shares redeemed | | | (492 | ) | | | (1,122 | ) |
Net increase (decrease) in Class B shares | | | 8,590 | | | | 232 | |
Shares outstanding at end of period | | | 14,862 | | | | 6,272 | |
The accompanying notes are an integral part of the financial statements.
| | | | |
Deutsche Variable Series II — Deutsche International Growth VIP | | | | | 11 |
Financial Highlights
| | | | | | | | | | | | | | | | | | | | |
| | | Years Ended December 31, | |
| Class A | | 2017 | | | 2016 | | | 2015 | | | 2014 | | | 2013 | |
| | | | | |
Selected Per Share Data | | | | | | | | | | | | | | | | | | | | |
Net asset value, beginning of period | | $ | 11.12 | | | $ | 10.81 | | | $ | 11.04 | | | $ | 11.13 | | | $ | 9.24 | |
Income (loss) from investment operations: | | | | | | | | | | | | | | | | | | | | |
Net investment incomea | | | .08 | | | | .06 | | | | .07 | | | | .08 | | | | .10 | |
Net realized and unrealized gain (loss) | | | 2.75 | | | | .34 | | | | (.21 | ) | | | (.06 | ) | | | 1.92 | |
Total from investment operations | | | 2.83 | | | | .40 | | | | (.14 | ) | | | .02 | | | | 2.02 | |
Less distributions from: | | | | | | | | | | | | | | | | | | | | |
Net investment income | | | (.05 | ) | | | (.09 | ) | | | (.09 | ) | | | (.11 | ) | | | (.13 | ) |
Net asset value, end of period | | $ | 13.90 | | | $ | 11.12 | | | $ | 10.81 | | | $ | 11.04 | | | $ | 11.13 | |
Total Return (%)b | | | 25.47 | | | | 3.72 | | | | (1.32 | ) | | | .21 | | | | 22.08 | |
| | | | |
Ratios to Average Net Assets and Supplemental Data | | | | | | | | | | | | | | | | | |
Net assets, end of period ($ millions) | | | 19 | | | | 27 | | | | 34 | | | | 47 | | | | 51 | |
Ratio of expenses before expense reductions (%)c | | | 1.56 | | | | 1.66 | | | | 1.44 | | | | 1.41 | | | | 1.45 | |
Ratio of expenses after expense reductions (%)c | | | .92 | | | | .95 | | | | .90 | | | | .82 | | | | .88 | |
Ratio of net investment income (%) | | | .61 | | | | .51 | | | | .65 | | | | .71 | | | | 1.00 | |
Portfolio turnover rate (%) | | | 62 | | | | 70 | | | | 64 | | | | 63 | | | | 171 | |
| a | Based on average shares outstanding during the period. |
| b | Total return would have been lower had certain expenses not been reduced. |
| c | Expense ratio does not reflect charges and fees associated with the separate account that invests in the Fund or any variable life insurance policy or variable annuity contract for which the Fund is an investment option. |
| | | | | | | | | | | | | | | | | | | | |
| | | Years Ended December 31, | |
| Class B | | 2017 | | | 2016 | | | 2015 | | | 2014 | | | 2013 | |
| | | | | |
Selected Per Share Data | | | | | | | | | | | | | | | | | | | | |
Net asset value, beginning of period | | $ | 11.13 | | | $ | 10.82 | | | $ | 11.05 | | | $ | 11.14 | | | $ | 9.25 | |
Income (loss) from investment operations: | | | | | | | | | | | | | | | | | | | | |
Net investment incomea | | | .02 | | | | .02 | | | | .05 | | | | .02 | | | | .07 | |
Net realized and unrealized gain (loss) | | | 2.79 | | | | .35 | | | | (.23 | ) | | | (.04 | ) | | | 1.92 | |
Total from investment operations | | | 2.81 | | | | .37 | | | | (.18 | ) | | | (.02 | ) | | | 1.99 | |
Less distributions from: | | | | | | | | | | | | | | | | | | | | |
Net investment income | | | (.01 | ) | | | (.06 | ) | | | (.05 | ) | | | (.07 | ) | | | (.10 | ) |
Net asset value, end of period | | $ | 13.93 | | | $ | 11.13 | | | $ | 10.82 | | | $ | 11.05 | | | $ | 11.14 | |
Total Return (%)b | | | 25.26 | | | | 3.38 | | | | (1.64 | ) | | | (.15 | ) | | | 21.62 | |
| | | | | |
Ratios to Average Net Assets and Supplemental Data | | | | | | | | | | | | | | | | | | | | |
Net assets, end of period ($ millions) | | | .2 | | | | .07 | | | | .1 | | | | .1 | | | | 3 | |
Ratio of expenses before expense reductions (%)c | | | 1.90 | | | | 1.98 | | | | 1.76 | | | | 1.76 | | | | 1.81 | |
Ratio of expenses after expense reductions (%)c | | | 1.15 | | | | 1.24 | | | | 1.22 | | | | 1.15 | | | | 1.23 | |
Ratio of net investment income (%) | | | .12 | | | | .17 | | | | .40 | | | | .14 | | | | .66 | |
Portfolio turnover rate (%) | | | 62 | | | | 70 | | | | 64 | | | | 63 | | | | 171 | |
| a | Based on average shares outstanding during the period. |
| b | Total return would have been lower had certain expenses not been reduced. |
| c | Expense ratio does not reflect charges and fees associated with the separate account that invests in the Fund or any variable life insurance policy or variable annuity contract for which the Fund is an investment option. |
The accompanying notes are an integral part of the financial statements.
| | | | | | |
| | 12 | | | | | | Deutsche Variable Series II — Deutsche International Growth VIP |
Notes to Financial Statements
A. Organization and Significant Accounting Policies
Deutsche International Growth VIP (formerly Deutsche Global Growth VIP) (the “Fund”) is a diversified series of Deutsche Variable Series II (the “Trust”), which is registered under the Investment Company Act of 1940, as amended (the “1940 Act”), as an open-end management investment company organized as a Massachusetts business trust.
Multiple Classes of Shares of Beneficial Interest. The Fund offers two classes of shares (Class A shares and Class B shares). Sales of Class B shares are subject to recordkeeping fees up to 0.15% and Rule 12b-1 fees under the 1940 Act equal to an annual rate of 0.25% of the average daily net assets for Class B shares of the Fund. Class A shares are not subject to such fees.
Investment income, realized and unrealized gains and losses, and certain fund-level expenses and expense reductions, if any, are borne pro rata on the basis of relative net assets by the holders of all classes of shares except that each class bears certain expenses unique to that class (including the applicable Rule 12b-1 fee and recordkeeping fees). Differences in class-level expenses may result in payment of different per share dividends by class. All shares have equal rights with respect to voting subject to class-specific arrangements.
The Fund’s financial statements are prepared in accordance with accounting principles generally accepted in the United States of America (“U.S. GAAP”) which require the use of management estimates. Actual results could differ from those estimates. The Fund qualifies as an investment company under Topic 946 of Accounting Standards Codification of U.S. GAAP. The policies described below are followed consistently by the Fund in the preparation of its financial statements.
Security Valuation. Investments are stated at value determined as of the close of regular trading on the New York Stock Exchange on each day the exchange is open for trading.
Various inputs are used in determining the value of the Fund’s investments. These inputs are summarized in three broad levels. Level 1 includes quoted prices in active markets for identical securities. Level 2 includes other significant observable inputs (including quoted prices for similar securities, interest rates, prepayment speeds and credit risk). Level 3 includes significant unobservable inputs (including the Fund’s own assumptions in determining the fair value of investments). The level assigned to the securities valuations may not be an indication of the risk or liquidity associated with investing in those securities.
Equity securities are valued at the most recent sale price or official closing price reported on the exchange (U.S. or foreign) or over-the-counter market on which they trade. Securities for which no sales are reported are valued at the calculated mean between the most recent bid and asked quotations on the relevant market or, if a mean cannot be determined, at the most recent bid quotation. Equity securities are generally categorized as Level 1. For certain international equity securities, in order to adjust for events which may occur between the close of the foreign exchanges and the close of the New York Stock Exchange, a fair valuation model may be used. This fair valuation model takes into account comparisons to the valuation of American Depository Receipts (ADRs), exchange-traded funds, futures contracts and certain indices and these securities are categorized as Level 2.
Investments in open-end investment companies are valued at their net asset value each business day and are categorized as Level 1.
Securities and other assets for which market quotations are not readily available or for which the above valuation procedures are deemed not to reflect fair value are valued in a manner that is intended to reflect their fair value as determined in accordance with procedures approved by the Board and are generally categorized as Level 3. In accordance with the Fund’s valuation procedures, factors considered in determining value may include, but are not limited to, the type of the security; the size of the holding; the initial cost of the security; the existence of any contractual restrictions on the security’s disposition; the price and extent of public trading in similar securities of the issuer or of comparable companies; quotations or evaluated prices from broker-dealers and/or pricing services; information obtained from the issuer, analysts, and/or the appropriate stock exchange (for exchange-traded securities); an analysis of the company’s or issuer’s financial statements; an evaluation of the forces that influence the issuer and the market(s) in which the security is purchased and sold; and with respect to debt securities, the maturity, coupon, creditworthiness, currency denomination and the movement of the market in which the security is normally traded. The value determined under these procedures may differ from published values for the same securities.
| | | | |
Deutsche Variable Series II — Deutsche International Growth VIP | | | | | 13 |
Disclosure about the classification of fair value measurements is included in a table following the Fund’s Investment Portfolio.
Foreign Currency Translations. The books and records of the Fund are maintained in U.S. dollars. Investment securities and other assets and liabilities denominated in a foreign currency are translated into U.S. dollars at the prevailing exchange rates at period end. Purchases and sales of investment securities, income and expenses are translated into U.S. dollars at the prevailing exchange rates on the respective dates of the transactions.
Net realized and unrealized gains and losses on foreign currency transactions represent net gains and losses between trade and settlement dates on securities transactions, the acquisition and disposition of foreign currencies, and the difference between the amount of net investment income accrued and the U.S. dollar amount actually received. The portion of both realized and unrealized gains and losses on investments that results from fluctuations in foreign currency exchange rates is not separately disclosed but is included with net realized and unrealized gain/appreciation and loss/depreciation on investments.
Securities Lending. Brown Brothers Harriman & Co., as lending agent, lends securities of the Fund to certain financial institutions under the terms of its securities lending agreement. During the term of the loans, the Fund continues to receive interest and dividends generated by the securities and to participate in any changes in their market value. The Fund requires the borrowers of the securities to maintain collateral with the Fund consisting of either cash or liquid, unencumbered assets having a value at least equal to the value of the securities loaned. When the collateral falls below specified amounts, the lending agent will use its best effort to obtain additional collateral on the next business day to meet required amounts under the securities lending agreement. As of period end, any securities on loan were collateralized by cash. During the year ended December 31, 2017, the Fund invested the cash collateral into a joint trading account in affiliated money market funds managed by Deutsche Investment Management Americas Inc. As of December 31, 2017, the Fund invested the cash collateral in Deutsche Government & Agency Securities Portfolio. Deutsche Investment Management Americas Inc. receives a management/administration fee (0.13% annualized effective rate as of December 31, 2017) on the cash collateral invested in Deutsche Government & Agency Securities Portfolio. The Fund receives compensation for lending its securities either in the form of fees or by earning interest on invested cash collateral net of borrower rebates and fees paid to a lending agent. Either the Fund or the borrower may terminate the loan at any time, and the borrower, after notice, is required to return borrowed securities within a standard time period. There may be risks of delay and costs in recovery of securities or even loss of rights in the collateral should the borrower of the securities fail financially. If the Fund is not able to recover securities lent, the Fund may sell the collateral and purchase a replacement investment in the market, incurring the risk that the value of the replacement security is greater than the value of the collateral. The Fund is also subject to all investment risks associated with the reinvestment of any cash collateral received, including, but not limited to, interest rate, credit and liquidity risk associated with such investments.
As of December 31, 2017, the Fund had securities on loan, which were classified as common stock in the Investment Portfolio. The value of the related collateral exceeded the value of the securities loaned at period end. As of period end, the remaining contractual maturity of the collateral agreements were overnight and continuous.
Taxes. The Fund’s policy is to comply with the requirements of the Internal Revenue Code, as amended, which are applicable to regulated investment companies and to distribute all of its taxable income to its shareholders.
Additionally, the Fund may be subject to taxes imposed by the governments of countries in which it invests and are generally based on income and/or capital gains earned or repatriated, a portion of which may be recoverable. Based upon the current interpretation of the tax rules and regulations, estimated tax liabilities and recoveries on certain foreign securities are recorded on an accrual basis and are reflected as components of interest income or net change in unrealized gain/loss on investments. Tax liabilities realized as a result of security sales are reflected as a component of net realized gain/loss on investments.
The Fund has reviewed the tax positions for the open tax years as of December 31, 2017 and has determined that no provision for income tax and/or uncertain tax positions is required in the Fund’s financial statements. The Fund’s federal tax returns for the prior three fiscal years remain open subject to examination by the Internal Revenue Service.
Distribution of Income and Gains. Distributions from net investment income of the Fund, if any, are declared and distributed to shareholders annually. Net realized gains from investment transactions, in excess
| | | | | | |
| | 14 | | | | | | Deutsche Variable Series II — Deutsche International Growth VIP |
of available capital loss carryforwards, would be taxable to the Fund if not distributed and, therefore, will be distributed to shareholders at least annually. The Fund may also make additional distributions for tax purposes if necessary.
The timing and characterization of certain income and capital gain distributions are determined annually in accordance with federal tax regulations which may differ from accounting principles generally accepted in the United States of America. These differences primarily relate to investments in foreign denominated investments, income received from passive foreign investment companies, expiration of capital loss carryforwards and certain securities sold at a loss. As a result, net investment income (loss) and net realized gain (loss) on investment transactions for a reporting period may differ significantly from distributions during such period. Accordingly, the Fund may periodically make reclassifications among certain of its capital accounts without impacting the net asset value of the Fund.
At December 31, 2017, the Fund’s components of distributable earnings on a tax basis were as follows:
| | | | |
| Undistributed ordinary income* | | $ | 166,256 | |
| Unrealized appreciation (depreciation) on investments | | $ | 3,480,347 | |
At December 31, 2017, the aggregate cost of investments for federal income tax purposes was $15,201,460. The net unrealized appreciation for all investments based on tax cost was $3,480,347. This consisted of aggregate gross unrealized appreciation for all investments in which there was an excess of value over tax cost of $3,677,854 aggregate gross unrealized depreciation for all investments in which was an excess of tax cost over value of $197,507.
In addition, the tax character of distributions paid by the Fund is summarized as follows:
| | | | | | | | |
| | | Years Ended December 31, | |
| | | 2017 | | | 2016 | |
| Distributions from ordinary income* | | $ | 106,890 | | | $ | 243,413 | |
| * | For tax purposes, short-term capital gain distributions are considered ordinary income distributions. |
Expenses. Expenses of the Trust arising in connection with a specific fund are allocated to that fund. Other Trust expenses which cannot be directly attributed to a fund are apportioned among the funds in the Trust based upon the relative net assets or other appropriate measures.
Contingencies. In the normal course of business, the Fund may enter into contracts with service providers that contain general indemnification clauses. The Fund’s maximum exposure under these arrangements is unknown, as this would involve future claims that may be made against the Fund that have not yet been made. However, based on experience, the Fund expects the risk of loss to be remote.
Other. Investment transactions are accounted for on a trade date plus one basis for daily net asset value calculations. However, for financial reporting purposes, investment transactions are reported on trade date. Interest income is recorded on the accrual basis. Dividend income is recorded on the ex-dividend date net of foreign withholding taxes. Realized gains and losses from investment transactions are recorded on an identified cost basis. Proceeds from litigation payments, if any, are included in net realized gain (loss) from investments.
B. Purchases and Sales of Securities
During the year ended December 31, 2017, purchases and sales of investment transactions (excluding short-term investments) aggregated $16,322,812 and $30,686,381, respectively.
C. Related Parties
Management Agreement. Under the Investment Management Agreement with Deutsche Investment Management Americas Inc. (“DIMA” or the “Advisor”), an indirect, wholly owned subsidiary of Deutsche Bank AG, the Advisor directs the investments of the Fund in accordance with its investment objectives, policies and restrictions. The Advisor determines the securities, instruments and other contracts relating to investments to be purchased, sold or entered into by the Fund.
| | | | |
Deutsche Variable Series II — Deutsche International Growth VIP | | | | | 15 |
For the period from January 1, 2017 through September 30, 2017, pursuant to the Investment Management Agreement with the Advisor, the Fund paid a monthly management fee based on the Fund’s average daily net assets, computed and accrued daily and payable monthly, at the following annual rates:
| | | | |
| First $250 million | | | .915 | % |
| Next $500 million | | | .865 | % |
| Next $750 million | | | .815 | % |
| Next $1.5 billion | | | .765 | % |
| Over $3 billion | | | .715 | % |
Effective October 1, 2017, the Fund pays the Advisor a monthly management fee computed and accrued daily and payable monthly, at the a rate of 0.62% of the Fund’s average daily net assets.
Accordingly, for the year ended December 31, 2017, the fee pursuant to the Investment Management Agreement was equivalent to an annual rate (exclusive of any applicable waivers/reimbursements) of 0.854% of the Fund’s average daily net assets.
For the period from January 1, 2017 through September 30, 2017, the Advisor had contractually agreed to waive all or a portion of its fee and/or reimburse certain operating expenses of the Fund to the extent necessary to maintain the total annual operating expenses (excluding certain expenses such as extraordinary expenses, taxes, brokerage and interest expense) of each class as follows:
| | | | |
| Class A | | | .95 | % |
| Class B | | | 1.20 | % |
For the period from October 1, 2017 through September 30, 2018, the Advisor has contractually agreed to waive its fees and/or reimburse certain operating expenses to the extent necessary to maintain the total annual operating expenses (excluding certain expenses such as extraordinary expenses, taxes, brokerage and interest expense) of each class as follows:
| | | | |
| Class A | | | .81 | % |
| Class B | | | 1.06 | % |
For the year ended December 31, 2017, fees waived and/or expenses reimbursed for each class are as follows:
| | | | |
| Class A | | $ | 173,216 | |
| Class B | | | 1,014 | |
| | | $ | 174,230 | |
Administration Fee. Pursuant to an Administrative Services Agreement, DIMA provides most administrative services to the Fund. For all services provided under the Administrative Services Agreement, the Fund pays DIMA an annual fee (“Administration Fee”) of 0.10% of the Fund’s average daily net assets, computed and accrued daily and payable monthly. For the year ended December 31, 2017, the Administration Fee was $27,084, of which $1,573 is unpaid.
Service Provider Fees. Deutsche AM Service Company (“DSC”), an affiliate of the Advisor, is the transfer agent, dividend-paying agent and shareholder service agent for the Fund. Pursuant to a sub-transfer agency agreement between DSC and DST Systems, Inc. (“DST”), DSC has delegated certain transfer agent, dividend-paying agent and shareholder service agent functions to DST. DSC compensates DST out of the shareholder servicing fee it receives from the Fund. For the year ended December 31, 2017, the amounts charged to the Fund by DSC were as follows:
| | | | | | | | |
| Services to Shareholders | | Total
Aggregated | | | Unpaid at
December 31,
2017 | |
| Class A | | $ | 241 | | | $ | 61 | |
| Class B | | | 47 | | | | 12 | |
| | | $ | 288 | | | $ | 73 | |
| | | | | | |
| | 16 | | | | | | Deutsche Variable Series II — Deutsche International Growth VIP |
Distribution Service Agreement. Under the Fund’s Class B 12b-1 plan, Deutsche AM Distributors, Inc. (“DDI”) received a fee (“Distribution Service Fee”) of 0.25% of average daily net assets of Class B shares. For the year ended December 31, 2017, the Distribution Service Fee aggregated $337, of which $43 is unpaid.
Typesetting and Filing Service Fees. Under an agreement with DIMA, DIMA is compensated for providing certain pre-press and regulatory filing services to the Fund. For the year ended December 31, 2017, the amount charged to the Fund by DIMA included in the Statement of Operations under “Reports to shareholders” aggregated $8,910, of which $2,907 is unpaid.
Trustees’ Fees and Expenses. The Fund paid retainer fees to each Trustee not affiliated with the Advisor, plus specified amounts to the Board Chairperson and Vice Chairperson and to each committee Chairperson.
Affiliated Cash Management Vehicles. The Fund may invest uninvested cash balances in Deutsche Central Cash Management Government Fund and Deutsche Variable NAV Money Fund, affiliated money market funds which are managed by the Advisor. Each affiliated money market fund is managed in accordance with Rule 2a-7 under the 1940 Act, which governs the quality, maturity, diversity and liquidity of instruments in which a money market fund may invest. Deutsche Central Cash Management Government Fund seeks to maintain a stable net asset value, and Deutsche Variable NAV Money Fund maintains a floating net asset value. The Fund indirectly bears its proportionate share of the expenses of each affiliated money market fund in which it invests. Deutsche Central Cash Management Government Fund does not pay the Advisor an investment management fee. To the extent that Deutsche Variable NAV Money Fund pays an investment management fee to the Advisor, the Advisor will waive an amount of the investment management fee payable to the Advisor by the Fund equal to the amount of the investment management fee payable on the Fund’s assets invested in Deutsche Variable NAV Money Fund.
D. Ownership of the Fund
At December 31, 2017, one participating insurance company was owner of record of 10% or more of the total outstanding Class A shares of the Fund, owning 85%. Three participating insurance companies were owners of record of 10% or more of the total outstanding Class B shares of the Fund, owning 52%, 31%, and 17%.
E. Line of Credit
The Fund and other affiliated funds (the “Participants”) share in a $400 million revolving credit facility provided by a syndication of banks. The Fund may borrow for temporary or emergency purposes, including the meeting of redemption requests that otherwise might require the untimely disposition of securities. The Participants are charged an annual commitment fee which is allocated based on net assets, among each of the Participants. Interest is calculated at a rate per annum equal to the sum of the Federal Funds Rate plus 1.25 percent plus if the one-month LIBOR exceeds the Federal Funds Rate, the amount of such excess. The Fund may borrow up to a maximum of 33 percent of its net assets under the agreement. The Fund had no outstanding loans at December 31, 2017.
F. Fund Name and Strategy Change
Effective October 1, 2017, Deutsche Global Growth VIP was renamed Deutsche International Growth VIP. At that time, the Fund’s principal investment strategy changed to reflect a foreign growth strategy and the Fund repositioned from a focus on U.S. and foreign growth stocks to focus on growth stocks mainly outside the U.S. The Fund will generally invest less than 20% of its assets in U.S. equities. To better reflect its new investment strategy, the Fund changed its principal benchmark index from the MSCI World Index to the MSCI All Country World ex-USA Index.
G. Payment by Affiliate
During the year ended December 31, 2017, the Advisor agreed to reimburse the Fund $7,312 for commission costs incurred in connection with purchases and sales of portfolio assets due to certain changes in the principal investment strategy of the Fund. The amount reimbursed was 0.03% of the Fund’s average net assets.
| | | | |
Deutsche Variable Series II — Deutsche International Growth VIP | | | | | 17 |
Report of Independent Registered Public Accounting Firm
To the Board of Trustees of Deutsche Variable Series II and Shareholders of Deutsche International Growth VIP:
Opinion on the Financial Statements
We have audited the accompanying statement of assets and liabilities of Deutsche International Growth VIP, formerly Deutsche Global Growth VIP (the “Fund”) (one of the funds constituting the Deutsche Variable Series II) (the “Trust”), including the schedule of investments, as of December 31, 2017, and the related statements of operations for the year then ended, the statements of changes in net assets for each of the two years in the period then ended, the financial highlights for each of the five years in the period then ended and the related notes (collectively referred to as the “financial statements”). In our opinion, the financial statements present fairly, in all material respects, the financial position of the Fund (one of the funds constituting the Deutsche Variable Series II) at December 31, 2017, the results of its operations for the year then ended, the changes in its net assets for each of the two years in the period then ended and its financial highlights for each of the five years in the period then ended, in conformity with U.S. generally accepted accounting principles.
Basis for Opinion
These financial statements are the responsibility of the Trust’s management. Our responsibility is to express an opinion on the Fund’s financial statements based on our audits. We are a public accounting firm registered with the Public Company Accounting Oversight Board (United States) (“PCAOB”) and are required to be independent with respect to the Trust in accordance with the U.S. federal securities laws and the applicable rules and regulations of the Securities and Exchange Commission and the PCAOB.
We conducted our audits in accordance with the standards of the PCAOB. Those standards require that we plan and perform the audit to obtain reasonable assurance about whether the financial statements are free of material misstatement, whether due to error or fraud. The Trust is not required to have, nor were we engaged to perform, an audit of the Trust’s internal control over financial reporting. As part of our audits, we are required to obtain an understanding of internal control over financial reporting, but not for the purpose of expressing an opinion on the effectiveness of the Trust’s internal control over financial reporting. Accordingly, we express no such opinion.
Our audits included performing procedures to assess the risks of material misstatement of the financial statements, whether due to error or fraud, and performing procedures that respond to those risks. Such procedures included examining, on a test basis, evidence regarding the amounts and disclosures in the financial statements. Our procedures included confirmation of securities owned as of December 31, 2017, by correspondence with the custodian and brokers or by other appropriate auditing procedures where replies from brokers were not received.
Our audits also included evaluating the accounting principles used and significant estimates made by management, as well as evaluating the overall presentation of the financial statements. We believe that our audits provide a reasonable basis for our opinion.

We have served as the auditor of one or more investment companies in the Deutsche family of funds since at least 1979, but we are unable to determine the specific year.
Boston, Massachusetts
February 15, 2018
| | | | | | |
| | 18 | | | | | | Deutsche Variable Series II — Deutsche International Growth VIP |
| | |
| Information About Your Fund’s Expenses | | (Unaudited) |
As an investor of the Fund, you incur two types of costs: ongoing expenses and transaction costs. Ongoing expenses include management fees, distribution and service (12b-1) fees and other Fund expenses. Examples of transaction costs include contract charges, which are not shown in this section. The following tables are intended to help you understand your ongoing expenses (in dollars) of investing in the Fund and to help you compare these expenses with the ongoing expenses of investing in other mutual funds. In the most recent six-month period, the Fund limited these expenses; had it not done so, expenses would have been higher. The example in the table is based on an investment of $1,000 invested at the beginning of the six-month period and held for the entire period (July 1, 2017 to December 31, 2017).
The tables illustrate your Fund’s expenses in two ways:
| – | Actual Fund Return. This helps you estimate the actual dollar amount of ongoing expenses (but not transaction costs) paid on a $1,000 investment in the Fund using the Fund’s actual return during the period. To estimate the expenses you paid over the period, simply divide your account value by $1,000 (for example, an $8,600 account value divided by $1,000 = 8.6), then multiply the result by the number in the “Expenses Paid per $1,000” line under the share class you hold. |
| – | Hypothetical 5% Fund Return. This helps you to compare your Fund’s ongoing expenses (but not transaction costs) with those of other mutual funds using the Fund’s actual expense ratio and a hypothetical rate of return of 5% per year before expenses. Examples using a 5% hypothetical Fund return may be found in the shareholder reports of other mutual funds. The hypothetical account values and expenses may not be used to estimate the actual ending account balance or expenses you paid for the period. |
Please note that the expenses shown in these tables are meant to highlight your ongoing expenses only and do not reflect any transaction costs. The “Expenses Paid per $1,000” line of the tables is useful in comparing ongoing expenses only and will not help you determine the relative total expense of owning different funds. If these transaction costs had been included, your costs would have been higher.
| | | | | | | | |
| Expenses and Value of a $1,000 Investment for the six months ended December 31, 2017 | | | | |
| | |
| Actual Fund Return | | | Class A | | | | Class B | |
| Beginning Account Value 7/1/17 | | $ | 1,000.00 | | | $ | 1,000.00 | |
| Ending Account Value 12/31/17 | | $ | 1,085.10 | | | $ | 1,083.20 | |
| Expenses Paid per $1,000* | | $ | 4.68 | | | $ | 5.88 | |
| | |
| Hypothetical 5% Fund Return | | | Class A | | | | Class B | |
| Beginning Account Value 7/1/17 | | $ | 1,000.00 | | | $ | 1,000.00 | |
| Ending Account Value 12/31/17 | | $ | 1,020.72 | | | $ | 1,019.56 | |
| Expenses Paid per $1,000* | | $ | 4.53 | | | $ | 5.70 | |
| * | Expenses are equal to the Fund’s annualized expense ratio for each share class, multiplied by the average account value over the period, multiplied by 184 (the number of days in the most recent six-month period), then divided by 365. |
| | | | | | | | |
| Annualized Expense Ratios | | Class A | | | Class B | |
| Deutsche Variable Series II — Deutsche International Growth VIP | | | .89 | % | | | 1.12 | % |
For more information, please refer to the Fund’s prospectus.
These tables do not reflect charges and fees (“contract charges”) associated with the separate account that invests in the Fund or any variable life insurance policy or variable annuity contract for which the Fund is an investment option.
For an analysis of the fees associated with an investment in the fund or similar funds, please refer to the current and hypothetical expense calculators for Variable Insurance Products which can be found at deutschefunds.com/EN/resources/calculators.jsp.
| | | | |
Deutsche Variable Series II — Deutsche International Growth VIP | | | | | 19 |
| | |
| Tax Information | | (Unaudited) |
For corporate shareholders, 100% of the ordinary dividends (i.e., income dividends plus short-term capital gains) paid during the Fund’s fiscal year ended December 31, 2017, qualified for the dividends received deduction.
The Fund paid foreign taxes of $30,873 and earned $121,405 of foreign source income during the year ended December 31, 2017. Pursuant to Section 853 of the Internal Revenue Code, the Fund designates $0.02 per share as foreign taxes paid and $0.09 per share as income earned from foreign sources for the year ended December 31, 2017.
Please consult a tax advisor if you have questions about federal or state income tax laws, or on how to prepare your tax returns. If you have specific questions about your account, please contact your insurance provider.
Proxy Voting
The Trust’s policies and procedures for voting proxies for portfolio securities and information about how the Trust voted proxies related to its portfolio securities during the most recent 12-month period ended June 30 are available on our Web site — deutschefunds.com (click on “proxy voting” at the bottom of the page) — or on the SEC’s Web site — sec.gov. To obtain a written copy of the Trust’s policies and procedures without charge, upon request, call us toll free at (800) 728-3337.
| | | | | | |
| | 20 | | | | | | Deutsche Variable Series II — Deutsche International Growth VIP |
Advisory Agreement Board Considerations and Fee Evaluation
The Board of Trustees (hereinafter referred to as the “Board” or “Trustees”) approved the renewal of Deutsche International Growth VIP’s (formerly Deutsche Global Growth VIP) (the “Fund”) investment management agreement (the “Agreement”) with Deutsche Investment Management Americas Inc. (“DIMA”) in September 2017.
In terms of the process that the Board followed prior to approving the Agreement, shareholders should know that:
| – | | During the entire process, all of the Fund’s Trustees were independent of DIMA and its affiliates (the “Independent Trustees”). |
| – | | The Board met frequently during the past year to discuss fund matters and dedicated a substantial amount of time to contract review matters. Over the course of several months, the Board’s Contract Committee reviewed extensive materials received from DIMA, independent third parties and independent counsel. These materials included an analysis of the Fund’s performance, fees and expenses, and profitability from a fee consultant retained by the Fund’s Independent Trustees (the “Fee Consultant”). Based on its evaluation of the information provided, the Contract Committee presented its findings and recommendations to the Board. The Board then reviewed the Contract Committee’s findings and recommendations. |
| – | | The Board also received extensive information throughout the year regarding performance of the Fund. |
| – | | The Independent Trustees regularly met privately with counsel to discuss contract review and other matters. In addition, the Independent Trustees were advised by the Fee Consultant in the course of their review of the Fund’s contractual arrangements and considered a comprehensive report prepared by the Fee Consultant in connection with their deliberations. |
| – | | In connection with reviewing the Agreement, the Board also reviewed the terms of the Fund’s Rule 12b-1 plan, distribution agreement, administrative services agreement, transfer agency agreement and other material service agreements. |
In connection with the contract review process, the Contract Committee and the Board considered the factors discussed below, among others. The Board also considered that DIMA and its predecessors have managed the Fund since its inception, and the Board believes that a long-term relationship with a capable, conscientious advisor is in the best interests of the Fund. The Board considered, generally, that shareholders chose to invest or remain invested in the Fund knowing that DIMA managed the Fund, and that the Agreement was approved by the Fund’s shareholders. DIMA is part of Deutsche Bank AG’s (“Deutsche Bank”) Asset Management (“Deutsche AM”) division. Deutsche AM is a global asset management business that offers a wide range of investing expertise and resources, including research capabilities in many countries throughout the world.
As part of the contract review process, the Board carefully considered the fees and expenses of each Deutsche fund overseen by the Board in light of the fund’s performance. In many cases, this led to the negotiation and implementation of expense caps. As part of these negotiations, the Board indicated that it would consider relaxing these caps in future years following sustained improvements in performance, among other considerations.
While shareholders may focus primarily on fund performance and fees, the Fund’s Board considers these and many other factors, including the quality and integrity of DIMA’s personnel and administrative support services provided by DIMA, such as back-office operations, fund valuations, and compliance policies and procedures.
Nature, Quality and Extent of Services. The Board considered the terms of the Agreement, including the scope of advisory services provided under the Agreement. The Board noted that, under the Agreement, DIMA provides portfolio management services to the Fund and that, pursuant to a separate administrative services agreement, DIMA provides administrative services to the Fund. The Board considered the experience and skills of senior management and investment personnel and the resources made available to such personnel. The Board reviewed the Fund’s performance over short-term and long-term periods and compared those returns to various agreed-upon performance measures, including market index(es) and a peer universe compiled using information supplied by Morningstar Direct (“Morningstar”), an independent fund data service. The Board also noted that it has put into place a process of identifying “Funds in Review” (e.g., funds performing poorly relative to a peer universe), and receives additional reporting from DIMA regarding such funds and, where appropriate, DIMA’s plans to address underperformance. The Board
| | | | |
Deutsche Variable Series II — Deutsche International Growth VIP | | | | | 21 |
believes this process is an effective manner of identifying and addressing underperforming funds. Based on the information provided, the Board noted that, for the one-, three- and five-year periods ended December 31, 2016, the Fund’s performance (Class A shares) was in the 3rd quartile, 4th quartile and 4th quartile, respectively, of the applicable Morningstar universe (the 1st quartile being the best performers and the 4th quartile being the worst performers). The Board also observed that the Fund has underperformed its benchmark in the one-, three- and five-year periods ended December 31, 2016. The Board noted the disappointing investment performance of the Fund in recent periods and continued to discuss with senior management of DIMA the factors contributing to such underperformance and actions being taken to improve performance. The Board considered that, effective October 3, 2016, the Fund’s investment strategy and certain members of the portfolio management team were changed, and that, effective October 1, 2017, the Fund would further change its investment strategy. The Board observed that the Fund had experienced improved relative performance during the first eight months of 2017. The Board recognized the efforts by DIMA in recent years to enhance its investment platform and improve long-term performance across the Deutsche fund complex.
Fees and Expenses. The Board considered the Fund’s investment management fee schedule, operating expenses and total expense ratios, and comparative information provided by Broadridge Financial Solutions, Inc. (“Broadridge”) and the Fee Consultant regarding investment management fee rates paid to other investment advisors by similar funds (1st quartile being the most favorable and 4th quartile being the least favorable). With respect to management fees paid to other investment advisors by similar funds, the Board noted that the contractual fee rates paid by the Fund, which include a 0.10% fee paid to DIMA under the Fund’s administrative services agreement, were higher than the median (4th quartile) of the applicable Broadridge peer group (based on Broadridge data provided as of December 31, 2016). The Board noted that, effective October 1, 2017, DIMA agreed to reduce the Fund’s contractual management fee rate to an annual rate of 0.62% in connection with changes to the Fund’s investment strategy. The Board noted that the Fund’s Class A shares total (net) operating expenses were expected to be lower than the median (2nd quartile) of the applicable Broadridge expense universe (based on Broadridge data provided as of December 31, 2016, and analyzing Broadridge expense universe Class A (net) expenses less any applicable 12b-1 fees) (“Broadridge Universe Expenses”). The Board also reviewed data comparing each share class’s total (net) operating expenses to the applicable Broadridge Universe Expenses. The Board noted that the expense limitations agreed to by DIMA were expected to help the Fund’s total (net) operating expenses remain competitive. The Board considered the Fund’s management fee rate as compared to fees charged by DIMA to comparable Deutsche U.S. registered funds (“Deutsche Funds”) and considered differences between the Fund and the comparable Deutsche Funds. The information requested by the Board as part of its review of fees and expenses also included information about institutional accounts (including any sub-advised funds and accounts) and funds offered primarily to European investors (“Deutsche Europe funds”) managed by Deutsche AM. The Board noted that DIMA indicated that Deutsche AM managed an institutional account comparable to the Fund’s investment strategy as of July 31, 2017, but that Deutsche AM does not manage any comparable Deutsche Europe funds. The Board took note of the differences in services provided to Deutsche Funds as compared to institutional accounts and that such differences made comparison difficult.
On the basis of the information provided, the Board concluded that management fees were reasonable and appropriate in light of the nature, quality and extent of services provided by DIMA.
Profitability. The Board reviewed detailed information regarding revenues received by DIMA under the Agreement. The Board considered the estimated costs to DIMA, and pre-tax profits realized by DIMA, from advising the Deutsche Funds, as well as estimates of the pre-tax profits attributable to managing the Fund in particular. The Board also received information regarding the estimated enterprise-wide profitability of DIMA and its affiliates with respect to all fund services in totality and by fund. The Board and the Fee Consultant reviewed DIMA’s methodology in allocating its costs to the management of the Fund. Based on the information provided, the Board concluded that the pre-tax profits realized by DIMA in connection with the management of the Fund were not unreasonable. The Board also reviewed certain publicly available information regarding the profitability of certain similar investment management firms. The Board noted that, while information regarding the profitability of such firms is limited (and in some cases is not necessarily prepared on a comparable basis), DIMA and its affiliates’ overall profitability with respect to the Deutsche Funds (after taking into account distribution and other services provided to the funds by DIMA and its affiliates) was lower than the overall profitability levels of most comparable firms for which such data was available.
| | | | | | |
| | 22 | | | | | | Deutsche Variable Series II — Deutsche International Growth VIP |
Economies of Scale. The Board considered whether there are economies of scale with respect to the management of the Fund and whether the Fund benefits from any economies of scale. In this regard, the Board observed that while the Fund’s reduced investment management fee schedule would not include breakpoints, the Fund’s fee schedule would represent an appropriate sharing between the Fund and DIMA of such economies of scale as may exist in the management of the Fund at current asset levels.
Other Benefits to DIMA and Its Affiliates. The Board also considered the character and amount of other incidental benefits received by DIMA and its affiliates, including any fees received by DIMA for administrative services provided to the Fund, any fees received by an affiliate of DIMA for transfer agency services provided to the Fund and any fees received by an affiliate of DIMA for distribution services. The Board also considered benefits to DIMA related to brokerage and soft-dollar allocations, including allocating brokerage to pay for research generated by parties other than the executing broker dealers, which pertain primarily to funds investing in equity securities. In addition, the Board considered the incidental public relations benefits to DIMA related to Deutsche Funds advertising and cross-selling opportunities among DIMA products and services. The Board considered these benefits in reaching its conclusion that the Fund’s management fees were reasonable.
Compliance. The Board considered the significant attention and resources dedicated by DIMA to documenting and enhancing its compliance processes in recent years. The Board noted in particular (i) the experience, seniority and time commitment of the individuals serving as DIMA’s and the Fund’s chief compliance officers; (ii) the large number of DIMA compliance personnel; and (iii) the substantial commitment of resources by DIMA and its affiliates to compliance matters.
Based on all of the information considered and the conclusions reached, the Board unanimously determined that the continuation of the Agreement is in the best interests of the Fund. In making this determination, the Board did not give particular weight to any single factor identified above. The Board considered these factors over the course of numerous meetings, certain of which were in executive session with only the Independent Trustees and counsel present. It is possible that individual Independent Trustees may have weighed these factors differently in reaching their individual decisions to approve the continuation of the Agreement.
Advisory Agreement Amendment
At a meeting held in July 2017, the Board of Trustees, all members of which are Independent Trustees, approved an amendment to the Fund’s Agreement to adopt a revised management fee schedule reducing DIMA’s management fee under the Agreement. The revised management fee schedule took effect on October 1, 2017.
In connection with its review of the amendment in July 2017, the Board noted that it most recently approved the renewal of the Agreement pursuant to a process that concluded in September 2016. The Board considered that the amendment was part of DIMA’s proposal to transition to a new international growth investment strategy for the Fund. The Board also received a report from a fee consultant retained by the Board regarding the revised management fee schedule. In addition, the Board also considered:
| – | | With the exception of the revised management fee schedule, the terms of the Agreement remained the same. |
| – | | DIMA’s statement that there would be no reduction in services to the Fund as a result of the revised management fee schedule. |
Based on all of the information considered, the Board concluded that the revised management fee schedule was reasonable and appropriate in light of the nature, quality and extent of services provided by DIMA. The Board unanimously determined that approval of the revised management fee schedule was in the best interests of the Fund.
| | | | |
Deutsche Variable Series II — Deutsche International Growth VIP | | | | | 23 |
Board Members and Officers
The following table presents certain information regarding the Board Members and Officers of the Fund. Each Board Member’s year of birth is set forth in parentheses after his or her name. Unless otherwise noted, (i) each Board Member has engaged in the principal occupation(s) noted in the table for at least the most recent five years, although not necessarily in the same capacity; and (ii) the address of each Independent Board Member is c/o Keith R. Fox, Deutsche Funds Board Chair, c/o Thomas R. Hiller, Ropes & Gray LLP, Prudential Tower, 800 Boylston Street, Boston, MA 02199-3600. Except as otherwise noted below, the term of office for each Board Member is until the election and qualification of a successor, or until such Board Member sooner dies, resigns, is removed or as otherwise provided in the governing documents of the Fund. Because the Fund does not hold an annual meeting of shareholders, each Board Member will hold office for an indeterminate period. The Board Members may also serve in similar capacities with other funds in the fund complex.
| | | | | | | | |
| Independent Board Members | | | | | | | |
Name, Year of Birth,
Position with the Fund and
Length of Time Served1 | | Business Experience and Directorships During the Past Five Years | | Number of
Funds in
Deutsche
Fund
Complex
Overseen | | | Other
Directorships
Held by Board
Member |
Keith R. Fox, CFA (1954) Chairperson since 2017, and Board Member since 1996 | | Managing General Partner, Exeter Capital Partners (a series of private investment funds) (since 1986). Directorships: Progressive International Corporation (kitchen goods importer and distributor); The Kennel Shop (retailer); former Chairman, National Association of Small Business Investment Companies; former Directorships: BoxTop Media Inc. (advertising); Sun Capital Advisers Trust (mutual funds) (2011–2012) | | | 89 | | | — |
Kenneth C. Froewiss (1945) Vice Chairperson since 2017, and Board Member since 2001 | | Retired Clinical Professor of Finance, NYU Stern School of Business (1997–2014); Member, Finance Committee, Association for Asian Studies (2002–present); Director, Mitsui Sumitomo Insurance Group (US) (2004–present); prior thereto, Managing Director, J.P. Morgan (investment banking firm) (until 1996) | | | 92 | | | — |
John W. Ballantine (1946) Board Member since 1999 | | Retired; formerly, Executive Vice President and Chief Risk Management Officer, First Chicago NBD Corporation/The First National Bank of Chicago (1996–1998); Executive Vice President and Head of International Banking (1995–1996); former Directorships: Director and former Chairman of the Board, Healthways, Inc.2 (population well-being and wellness services) (2003–2014); Stockwell Capital Investments PLC (private equity); Enron Corporation; FNB Corporation; Tokheim Corporation; First Oak Brook Bancshares, Inc. and Oak Brook Bank; Prisma Energy International. Not-for-Profit Director, Trustee: Palm Beach Civic Association; Public Radio International; Window to the World Communications (public media); Harris Theater for Music and Dance (Chicago) | | | 89 | | | Portland
General
Electric2
(utility
company)
(2003–
present) |
Henry P. Becton, Jr. (1943) Board Member since 1990 | | Vice Chair and former President, WGBH Educational Foundation. Directorships: Public Radio International; Public Radio Exchange (PRX); The Pew Charitable Trusts (charitable organization); former Directorships: Becton Dickinson and Company2 (medical technology company); Belo Corporation2 (media company); The PBS Foundation; Association of Public Television Stations; Boston Museum of Science; American Public Television; Concord Academy; New England Aquarium; Mass. Corporation for Educational Telecommunications; Committee for Economic Development; Public Broadcasting Service; Connecticut College; North Bennett Street School (Boston) | | | 89 | | | — |
Dawn-Marie Driscoll (1946) Board Member since 1987 | | Emeritus Executive Fellow, Center for Business Ethics, Bentley University; formerly: President, Driscoll Associates (consulting firm); Partner, Palmer & Dodge (law firm) (1988–1990); Vice President of Corporate Affairs and General Counsel, Filene’s (retail) (1978–1988). Directorships: Advisory Board, Center for Business Ethics, Bentley University; Trustee and former Chairman of the Board, Southwest Florida Community Foundation (charitable organization); former Directorships: ICI Mutual Insurance Company (2007–2015); Sun Capital Advisers Trust (mutual funds) (2007–2012), Investment Company Institute (audit, executive, nominating committees) and Independent Directors Council (governance, executive committees) | | | 89 | | | — |
| | | | | | |
| | 24 | | | | | | Deutsche Variable Series II — Deutsche International Growth VIP |
| | | | | | | | |
Name, Year of Birth,
Position with the Fund and
Length of Time Served1 | | Business Experience and Directorships During the Past Five Years | | Number of
Funds in
Deutsche
Fund
Complex
Overseen | | | Other
Directorships
Held by Board
Member |
Paul K. Freeman (1950) Board Member since 1993 | | Consultant, World Bank/Inter-American Development Bank; Independent Directors Council (former chair); Investment Company Institute (executive and nominating committees); formerly: Chairman of Education Committee of Independent Directors Council; Project Leader, International Institute for Applied Systems Analysis (1998–2001); Chief Executive Officer, The Eric Group, Inc. (environmental insurance) (1986–1998); Directorships: Denver Zoo Foundation (December 2012–present); Knoebel Institute for Healthy Aging, University of Denver (2017–present); former Directorships: Prisma Energy International | | | 89 | | | — |
Richard J. Herring (1946) Board Member since 1990 | | Jacob Safra Professor of International Banking and Professor, Finance Department, The Wharton School, University of Pennsylvania (since July 1972); Co-Director, Wharton Financial Institutions Center; formerly: Vice Dean and Director, Wharton Undergraduate Division (July 1995–June 2000); Director, Lauder Institute of International Management Studies (July 2000–June 2006) | | | 89 | | | Director,
Aberdeen
Singapore
and Japan
Funds (since
2007);
Independent
Director of
Barclays
Bank
Delaware
(since
September
2010) |
William McClayton (1944) Board Member since 2004 | | Private equity investor (since October 2009); previously, Managing Director, Diamond Management & Technology Consultants, Inc. (global consulting firm) (2001–2009); Directorship: Board of Managers, YMCA of Metropolitan Chicago; formerly: Senior Partner, Arthur Andersen LLP (accounting) (1966–2001); Trustee, Ravinia Festival | | | 89 | | | — |
Rebecca W. Rimel (1951) Board Member since 1995 | | President, Chief Executive Officer and Director, The Pew Charitable Trusts (charitable organization) (1994–present); formerly: Executive Vice President, The Glenmede Trust Company (investment trust and wealth management) (1983–2004); Board Member, Investor Education (charitable organization) (2004–2005); Trustee, Executive Committee, Philadelphia Chamber of Commerce (2001–2007); Director, Viasys Health Care2 (January 2007–June 2007); Trustee, Thomas Jefferson Foundation (charitable organization) (1994–2012) | | | 89 | | | Director,
Becton
Dickinson
and
Company2
(medical
technology
company)
(2012–
present);
Director,
BioTelemetry
Inc2 (health
care) (2009–
present) |
William N. Searcy, Jr. (1946) Board Member since 1993 | | Private investor since October 2003; formerly: Pension & Savings Trust Officer, Sprint Corporation2 (telecommunications) (November 1989–September 2003); Trustee, Sun Capital Advisers Trust (mutual funds) (1998–2012) | | | 89 | | | — |
Jean Gleason Stromberg (1943) Board Member since 1997 | | Retired. Formerly, Consultant (1997–2001); Director, Financial Markets U.S. Government Accountability Office (1996–1997); Partner, Norton Rose Fulbright, L.L.P. (law firm) (1978–1996); former Directorships: The William and Flora Hewlett Foundation (charitable organization) (2000–2015); Service Source, Inc. (nonprofit), Mutual Fund Directors Forum (2002–2004), American Bar Retirement Association (funding vehicle for retirement plans) (1987–1990 and 1994–1996) | | | 89 | | | — |
| | | | |
Deutsche Variable Series II — Deutsche International Growth VIP | | | | | 25 |
| | |
| Officers4 | | |
Name, Year of Birth,
Position with the Fund and
Length of Time Served5 | | Business Experience and Directorships During the Past Five Years |
Hepsen Uzcan6,9 (1974) President and Chief Executive Officer, 2017–present Assistant Secretary, 2013–present | | Director,3 Deutsche Asset Management; formerly: Vice President for the Deutsche funds (2016–2017) |
John Millette8 (1962) Vice President and Secretary, 1999–present | | Director,3 Deutsche Asset Management; Chief Legal Officer, Deutsche Investment Management Americas Inc. (2015–present); and Director and Vice President, Deutsche AM Trust Company (since 2016); formerly: Secretary, Deutsche Investment Management Americas Inc. (2015–2017) |
Paul H. Schubert6 (1963) Chief Financial Officer, 2004–present Treasurer, 2005–present | | Managing Director,3 Deutsche Asset Management, and Chairman, Director and President, Deutsche AM Trust Company (since 2013); Vice President, Deutsche AM Distributors, Inc. (since 2016); Director, Deutsche AM Service Company (since 2017); Director and President, DB Investment Managers, Inc. (since 2017); formerly: Director, Deutsche AM Trust Company (2004–2013) |
Caroline Pearson8 (1962) Chief Legal Officer, 2010–present | | Managing Director,3 Deutsche Asset Management; formerly: Secretary, Deutsche AM Distributors, Inc.; and Secretary, Deutsche AM Service Company |
Scott D. Hogan8 (1970) Chief Compliance Officer, 2016–present | | Director,3 Deutsche Asset Management |
Wayne Salit7 (1967) Anti-Money Laundering Compliance Officer, 2014–present | | Director,3 Deutsche Asset Management; formerly: Managing Director, AML Compliance Officer at BNY Mellon (2011–2014); and Director, AML Compliance Officer at Deutsche Bank (2004–2011) |
Sheila Cadogan8 (1966) Assistant Treasurer, since July 12, 2017 | | Director,3 Deutsche Asset Management |
Paul Antosca8 (1957) Assistant Treasurer, 2007–present | | Director,3 Deutsche Asset Management |
Diane Kenneally8 (1966) Assistant Treasurer, 2007–present | | Director,3 Deutsche Asset Management |
| 1 | The length of time served represents the year in which the Board Member joined the board of one or more Deutsche funds currently overseen by the Board. |
| 2 | A publicly held company with securities registered pursuant to Section 12 of the Securities Exchange Act of 1934. |
| 3 | Executive title, not a board directorship. |
| 4 | As a result of their respective positions held with the Advisor, these individuals are considered “interested persons” of the Advisor within the meaning of the 1940 Act. Interested persons receive no compensation from the Fund. |
| 5 | The length of time served represents the year in which the officer was first elected in such capacity for one or more Deutsche funds. |
| 6 | Address: 345 Park Avenue, New York, NY 10154. |
| 7 | Address: 60 Wall Street, New York, NY 10005. |
| 8 | Address: One International Place, Boston, MA 02110. |
| 9 | Appointed President and Chief Executive Officer effective December 1, 2017. |
The Fund’s Statement of Additional Information (“SAI”) includes additional information about the Board Members. The SAI is available, without charge, upon request. If you would like to request a copy of the SAI, you may do so by calling the following toll-free number: (800) 728-3337.
| | | | | | |
| | 26 | | | | | | Deutsche Variable Series II — Deutsche International Growth VIP |
| | |
 | | |
VS2IG-2 (R-025830-8 2/18) | | |

December 31, 2017
Annual Report
Deutsche Variable Series II
Deutsche Multisector Income VIP
(formerly Deutsche Unconstrained Income VIP)

Contents
This report must be preceded or accompanied by a prospectus. To obtain an additional prospectus or summary prospectus, if available, call (800) 728-3337 or your financial representative. We advise you to consider the Fund’s objectives, risks, charges and expenses carefully before investing. The summary prospectus and prospectus contain this and other important information about the Fund. Please read the prospectus carefully before you invest.
Bond investments are subject to interest-rate, credit, liquidity and market risks to varying degrees. When interest rates rise, bond prices generally fall. Credit risk refers to the ability of an issuer to make timely payments of principal and interest. Investments in lower-quality (“junk bonds”) and non-rated securities present greater risk of loss than investments in higher-quality securities. Investing in foreign securities, particularly those of emerging markets, presents certain risks, such as currency fluctuations, political and economic changes, and market risks. Emerging markets tend to be more volatile and less liquid than the markets of more mature economies, and generally have less diverse and less mature economic structures and less stable political systems than those of developed countries. Investing in derivatives entails special risks relating to liquidity, leverage and credit that may reduce returns and/or increase volatility. The Fund may lend securities to approved institutions. See the prospectus for details.
Deutsche Asset Management represents the asset management activities conducted by Deutsche Bank AG or any of its subsidiaries.
Deutsche AM Distributors, Inc., 222 South Riverside Plaza, Chicago, IL 60606, (800) 621-1148
NOT FDIC/NCUA INSURED NO BANK GUARANTEE MAY LOSE VALUE NOT A DEPOSIT NOT INSURED BY ANY FEDERAL GOVERNMENT AGENCY
| | | | | | |
| | 2 | | | | | | Deutsche Variable Series II — Deutsche Multisector Income VIP |
| | |
| Performance Summary | | December 31, 2017 (Unaudited) |
Fund performance shown is historical, assumes reinvestment of all dividend and capital gain distributions and does not guarantee future results. Investment return and principal value fluctuate with changing market conditions so that, when redeemed, shares may be worth more or less than their original cost. Current performance may be lower or higher than the performance data quoted. Please contact your participating insurance company for the Fund’s most recent month-end performance. Performance doesn’t reflect charges and fees (“contract charges”) associated with the separate account that invests in the Fund or any variable life insurance policy or variable annuity contract for which the Fund is an investment option. These charges and fees will reduce returns.
The gross expense ratio of the Fund, as stated in the fee table of the prospectus dated May 1, 2017 is 1.34% for Class A shares and may differ from the expense ratio disclosed in the Financial Highlights table in this report.
Generally accepted accounting principles require adjustments to be made to the net assets of the Fund at period end for financial reporting purposes only, and as such, the total return based on the unadjusted net asset value per share may differ from the total return reported in the financial highlights.
Growth of an Assumed $10,000 Investment in Deutsche Multisector Income VIP
| | |
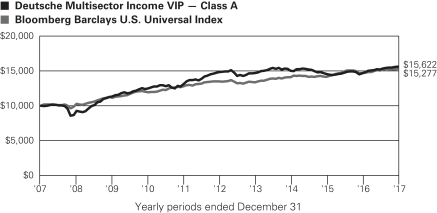
| | The unmanaged Bloomberg Barclays U.S. Universal Index represents the union of the U.S. Aggregate Index, the U.S. High-Yield Corporate Index, the 144A Index, the Eurodollar Index, the Emerging Markets Index and the non-ERISA portion of the CMBS Index. Index returns do not reflect any fees or expenses and it is not possible to invest directly into an index. |
| | | | | | | | | | |
| Comparative Results | | | | | | | | | | |
| | | | | |
| Deutsche Multisector Income VIP | | | | 1-Year | | 3-Year | | 5-Year | | 10-Year |
| Class A | | Growth of $10,000 | | $10,678 | | $10,408 | | $10,528 | | $15,622 |
| | | Average annual total return | | 6.78% | | 1.34% | | 1.04% | | 4.56% |
| Bloomberg Barclays U.S. Universal Index | | Growth of $10,000 | | $10,409 | | $10,863 | | $11,312 | | $15,277 |
| | Average annual total return | | 4.09% | | 2.80% | | 2.50% | | 4.33% |
The growth of $10,000 is cumulative.
| | | | |
Deutsche Variable Series II — Deutsche Multisector Income VIP | | | | | 3 |
| | |
| Management Summary | | December 31, 2017 (Unaudited) |
The Class A shares of the Fund returned 6.78% (unadjusted for contract charges) in 2017, outperforming the 4.09% return of the Bloomberg Barclays U.S. Universal Index.
The past year brought mixed results for the global bond market. Although U.S. Treasuries and agency mortgage-backed securities posted weak relative returns, categories with above-average sensitivity to economic growth registered healthy gains. In this environment, the Fund was helped by its focus on the credit-sensitive areas of the market and corresponding underweight in U.S. Treasuries and mortgage-backed securities.
The Fund’s overweight position in emerging-markets bonds, which are not represented in the index, made the largest positive contribution. We saw the asset class as having greater upside potential than other market segments due to its more reasonable valuations and above-average yields. The strongest returns came from our positions in higher-yielding countries, including Argentina and issuers in Sub-Saharan Africa. We also benefited from holding local-currency issues via an exchange-traded fund and positions in Indonesia and Mexico. Conversely, we lost some relative performance from certain positions in Turkey, as well as a zero weighting in Brazil.
Our large allocation to high-yield bonds, which reflected our belief that improving economic conditions, low defaults and a favorable balance of supply and demand in the market would fuel outperformance, made a healthy contribution as well. While we maintained a sizeable weighting in high yield at the close of the year, we also shifted our positioning within the category to reflect the compression in yield spreads. Rather than investing primarily in individual bonds, we rotated a large portion of the allocation into exchange-traded funds and derivative instruments. We think this move helps insulate the Fund from the risks associated with individual securities, and it also provides a higher degree of flexibility to shift the allocation efficiently if the risk/return equation changes.
In the Fund’s investment-grade portfolio, we added value by tilting toward the higher-yielding segments of the corporate bond market over the lower-risk, lower-yielding areas that generally underperformed. An allocation to Portugal was a further positive. However, our positions in U.S. Treasuries and agency mortgage-backed securities, to the extent that we invested in these categories, detracted from results. We held an underweight in the investment-grade space overall, as we found less attractive values in this area.
The Fund used derivatives during the year. In addition to owning credit default swaps to facilitate exposure to the high-yield market, we used derivatives to manage the foreign currency exposure of certain positions in foreign bonds. Both aspects of our strategy made modest contributions. We also used interest-rate futures and swaps to manage the Fund’s duration exposure (interest-rate sensitivity), which was a small detractor. Overall, our use of derivatives was a small net positive.
We maintained a focus on the higher-yielding, credit-oriented segments of the market throughout the year. We believed these categories offered the potential for a continued return advantage due to both the greater contribution from yield and their ability to benefit from strengthening economic growth. At the same time, we took a somewhat defensive approach as the year progressed since low yield spreads could translate to higher risk. Further, we sought to maintain a high degree of portfolio flexibility — highlighted by a larger-than-normal cash position and above-average liquidity — so we will be in a position to take advantage of downdrafts in either the broader market or in individual bonds. We believe this approach can add value if the investment backdrop remains constructive, while also giving us the latitude to capitalize on a re-emergence of volatility.
John D. Ryan, Managing Director
Kevin Bliss, Director
Portfolio Managers
Prior to August 1, 2017, the portfolio management team was as follows:
Gary Russell, CFA, Managing Director
John D. Ryan, Managing Director
Darwei Kung, Managing Director
Portfolio Managers
The views expressed reflect those of the portfolio management team only through the end of the period of the report as stated on the cover. The management team’s views are subject to change at any time based on market and other conditions and should not be construed as a recommendation. Past performance is no guarantee of future results. Current and future portfolio holdings are subject to risk.
| | | | | | |
| | 4 | | | | | | Deutsche Variable Series II — Deutsche Multisector Income VIP |
Terms to Know
The Barclays U.S. Universal Index represents the union of the U.S. Aggregate Index, the U.S. High-Yield Corporate Index, the 144A Index, the Eurodollar Index, the Emerging Markets Index and the non-ERISA portion of the CMBS Index. Index returns do not reflect fees or expenses and it is not possible to invest directly in an index.
Overweight means the fund holds a higher weighting in a given sector or security than the benchmark. Underweight means the fund holds a lower weighting.
Contribution and detraction incorporate both a stock’s total return and its weighting in the index.
Yield spread refers to differences between yields on differing debt instruments, calculated by deducting the yield of one instrument from another. The higher the yield spread, the greater the difference between the yields offered by each instrument.
Derivatives are contracts whose values can be based on a variety of instruments, including indices, currencies or securities. They can be utilized for a variety of reasons, including for hedging purposes, for risk management; for non-hedging purposes to seek to enhance potential gains, or as a substitute for direct investment in a particular asset class or to keep cash on hand to meet shareholder redemptions. Investing in derivatives entails special risks relating to liquidity, leverage and credit that may reduce returns and/or increase volatility.
A swap is an exchange of cash flows that are dependent on the price of an underlying commodity.
Futures contracts are contractual agreements to buy or sell a particular commodity or financial instrument at a predetermined price in the future.
Duration, which is expressed in years, measures the sensitivity of the price of a bond or bond fund to a change in interest rates.
| | | | |
Deutsche Variable Series II — Deutsche Multisector Income VIP | | | | | 5 |
| | | | |
| Portfolio Summary | | (Unaudited) | | |
| | | | | | | | |
| Asset Allocation (As a % of Investment Portfolio excluding Securities Lending Collateral) | | 12/31/17 | | | 12/31/16 | |
| Government & Agency Obligations | | | 29% | | | | 41% | |
| Corporate Bonds | | | 24% | | | | 20% | |
| Collateralized Mortgage Obligations | | | 13% | | | | 10% | |
| Short-Term U.S. Treasury Obligations | | | 12% | | | | 2% | |
| Loan Participations and Assignments | | | 7% | | | | 5% | |
| Cash Equivalents | | | 6% | | | | 5% | |
| Commercial Mortgage-Backed Securities | | | 5% | | | | 5% | |
| Asset-Backed | | | 2% | | | | 1% | |
| Convertible Bond | | | 2% | | | | 0% | |
| Common Stocks | | | 0% | | | | 0% | |
| Warrant | | | 0% | | | | 0% | |
| Exchange-Traded Funds | | | — | | | | 11% | |
| Put Options Purchased | | | — | | | | 0% | |
| | | | 100% | | | | 100% | |
| | |
| Quality (Excludes Cash Equivalents, Securities Lending Collateral and Exchange-Traded Funds) | | 12/31/17 | | | 12/31/16 | |
| AAA | | | 25% | | | | 41% | |
| AA | | | 1% | | | | 1% | |
| A | | | 8% | | | | 9% | |
| BBB | | | 24% | | | | 31% | |
| BB | | | 23% | | | | 9% | |
| B | | | 9% | | | | 3% | |
| CCC or Below | | | 3% | | | | 6% | |
| Non Rated | | | 7% | | | | — | |
| | | | 100% | | | | 100% | |
| | |
| Interest Rate Sensitivity | | 12/31/17 | | | 12/31/16 | |
| Effective Maturity | | | 5.4 years | | | | 7.2 years | |
| Effective Duration | | | 3.6 years | | | | 4.6 years | |
The quality ratings represent the higher of Moody’s Investors Service, Inc. (“Moody’s”), Fitch Ratings, Inc. (“Fitch”) or Standard & Poor’s Corporation (“S&P”) credit ratings. The ratings of Moody’s, Fitch and S&P represent their opinions as to the quality of the securities they rate. Credit quality measures a bond issuer’s ability to repay interest and principal in a timely manner. Ratings are relative and subjective and are not absolute standards of quality. Credit quality does not remove market risk and is subject to change.
Effective maturity is the weighted average of the maturity date of bonds held by the Fund taking into consideration any available maturity shortening features.
Effective duration is an approximate measure of the Fund’s sensitivity to interest rate changes taking into consideration any maturity shortening features.
Portfolio holdings and characteristics are subject to change.
For more complete details about the Fund’s investment portfolio, see page 7.
Following the Fund’s fiscal first and third quarter-end, a complete portfolio holdings listing is filed with the SEC on Form N-Q. The form will be available on the SEC’s Web site at sec.gov, and it also may be reviewed and copied at the SEC’s Public Reference Room in Washington, D.C. Information on the operation of the SEC’s Public Reference Room may be obtained by calling (800) SEC-0330. The Fund’s portfolio holdings are also posted on deutschefunds.com from time to time. Please see the Fund’s current prospectus for more information.
| | | | | | |
| | 6 | | | | | | Deutsche Variable Series II — Deutsche Multisector Income VIP |
| | |
| Investment Portfolio | | December 31, 2017 |
| | | | | | | | |
| | | Principal
Amount ($)(a) | | | Value ($) | |
| Corporate Bonds 22.6% | |
| Consumer Discretionary 2.7% | |
American Axle & Manufacturing, Inc., 144A, 6.25%, 4/1/2025 (b) | | | 60,000 | | | | 63,150 | |
Charter Communications Operating LLC, 3.75%, 2/15/2028 | | | 60,000 | | | | 57,492 | |
CVS Health Corp., 5.125%, 7/20/2045 | | | 30,000 | | | | 34,383 | |
Expedia, Inc., 3.8%, 2/15/2028 | | | 55,000 | | | | 53,147 | |
Nordstrom, Inc.: | | | | | | | | |
4.0%, 3/15/2027 | | | 20,000 | | | | 19,925 | |
5.0%, 1/15/2044 | | | 35,000 | | | | 33,742 | |
| | | | | | | | |
| | | | | | | 261,839 | |
|
| Consumer Staples 0.5% | |
BAT Capital Corp., 144A, 4.54%, 8/15/2047 | | | 30,000 | | | | 31,587 | |
Molson Coors Brewing Co., 4.2%, 7/15/2046 | | | 15,000 | | | | 15,286 | |
| | | | | | | | |
| | | | | | | 46,873 | |
| | |
| Energy 7.1% | | | | | | | | |
Canadian Natural Resources Ltd., 4.95%, 6/1/2047 | | | 20,000 | | | | 22,383 | |
Chesapeake Energy Corp., 144A, 8.0%, 1/15/2025 | | | 65,000 | | | | 65,650 | |
Energy Transfer LP: | | | | | | | | |
4.5%, 11/1/2023 | | | 20,000 | | | | 20,679 | |
5.95%, 10/1/2043 | | | 10,000 | | | | 10,632 | |
EnLink Midstream Partners LP, 5.45%, 6/1/2047 | | | 35,000 | | | | 36,984 | |
Halliburton Co., 4.85%, 11/15/2035 | | | 10,000 | | | | 11,218 | |
Hess Corp., 5.8%, 4/1/2047 | | | 25,000 | | | | 27,820 | |
KazMunayGas National Co. JSC, 144A, 4.75%, 4/19/2027 | | | 200,000 | | | | 210,580 | |
Kinder Morgan Energy Partners LP, 4.7%, 11/1/2042 | | | 40,000 | | | | 38,723 | |
Noble Energy, Inc., 3.85%, 1/15/2028 | | | 70,000 | | | | 70,214 | |
Noble Holding International Ltd., 5.75%, 3/16/2018 | | | 10,000 | | | | 10,025 | |
Oasis Petroleum, Inc., 6.875%, 3/15/2022 | | | 50,000 | | | | 51,313 | |
Sunoco Logistics Partners Operations LP, 5.3%, 4/1/2044 | | | 10,000 | | | | 9,869 | |
Weatherford International Ltd., 9.875%, 2/15/2024 | | | 100,000 | | | | 106,250 | |
| | | | | | | | |
| | | | | | | 692,340 | |
| | |
| Financials 3.7% | | | | | | | | |
Everest Reinsurance Holdings, Inc., 4.868%, 6/1/2044 | | | 30,000 | | | | 31,922 | |
FS Investment Corp., 4.75%, 5/15/2022 | | | 40,000 | | | | 41,180 | |
KKR Group Finance Co. III LLC, 144A, 5.125%, 6/1/2044 | | | 20,000 | | | | 22,170 | |
Legg Mason, Inc., 5.625%, 1/15/2044 | | | 20,000 | | | | 22,297 | |
| | | | | | | | |
| | | Principal
Amount ($)(a) | | | Value ($) | |
Nationwide Financial Services, Inc., 144A, 5.3%, 11/18/2044 | | | 20,000 | | | | 23,725 | |
TC Ziraat Bankasi AS, 144A, 5.125%, 5/3/2022 | | | 200,000 | | | | 198,290 | |
Voya Financial, Inc., 4.8%, 6/15/2046 | | | 15,000 | | | | 16,709 | |
| | | | | | | | |
| | | | | | | 356,293 | |
| | |
| Health Care 0.6% | | | | | | | | |
Allergan Funding SCS, 4.75%, 3/15/2045 | | | 4,000 | | | | 4,258 | |
Celgene Corp., 5.0%, 8/15/2045 | | | 10,000 | | | | 11,346 | |
Express Scripts Holding Co., 4.8%, 7/15/2046 | | | 20,000 | | | | 21,276 | |
Mylan NV, 5.25%, 6/15/2046 | | | 25,000 | | | | 27,393 | |
| | | | | | | | |
| | | | | | | 64,273 | |
|
| Industrials 0.6% | |
Park Aerospace Holdings Ltd., 144A, 5.25%, 8/15/2022 | | | 60,000 | | | | 59,625 | |
|
| Information Technology 1.4% | |
Dell International LLC, 144A, 8.1%, 7/15/2036 | | | 20,000 | | | | 25,256 | |
DXC Technology Co., 4.75%, 4/15/2027 | | | 60,000 | | | | 63,804 | |
Pitney Bowes, Inc., 3.625%, 9/15/2020 | | | 15,000 | | | | 14,850 | |
Seagate HDD Cayman, 144A, 4.25%, 3/1/2022 | | | 30,000 | | | | 30,366 | |
| | | | | | | | |
| | | | | | | 134,276 | |
| | |
| Materials 1.2% | | | | | | | | |
AK Steel Corp., 7.0%, 3/15/2027 (b) | | | 100,000 | | | | 101,750 | |
CF Industries, Inc., 144A, 4.5%, 12/1/2026 | | | 5,000 | | | | 5,212 | |
Glencore Funding LLC, 144A, 4.625%, 4/29/2024 | | | 10,000 | | | | 10,558 | |
| | | | | | | | |
| | | | | | | 117,520 | |
| | |
| Real Estate 2.9% | | | | | | | | |
CBL & Associates LP: | | | | | | | | |
(REIT), 5.25%, 12/1/2023 | | | 25,000 | | | | 23,609 | |
(REIT), 5.95%, 12/15/2026 (b) | | | 35,000 | | | | 32,560 | |
Crown Castle International Corp., (REIT), 5.25%, 1/15/2023 | | | 15,000 | | | | 16,424 | |
Government Properties Income Trust, (REIT), 4.0%, 7/15/2022 | | | 55,000 | | | | 55,332 | |
Omega Healthcare Investors, Inc.: | | | | | | | | |
(REIT), 4.75%, 1/15/2028 | | | 35,000 | | | | 34,694 | |
(REIT), 4.95%, 4/1/2024 | | | 30,000 | | | | 31,341 | |
Select Income REIT: | | | | | | | | |
(REIT), 4.15%, 2/1/2022 | | | 30,000 | | | | 30,337 | |
(REIT), 4.25%, 5/15/2024 | | | 10,000 | | | | 9,918 | |
VEREIT Operating Partnership LP, (REIT), 3.95%, 8/15/2027 | | | 45,000 | | | | 44,486 | |
| | | | | | | | |
| | | | | | | 278,701 | |
The accompanying notes are an integral part of the financial statements.
| | | | |
Deutsche Variable Series II — Deutsche Multisector Income VIP | | | | | 7 |
| | | | | | | | |
| | | Principal
Amount ($)(a) | | | Value ($) | |
| Telecommunication Services 1.8% | |
Frontier Communications Corp., 6.25%, 9/15/2021 | | | 100,000 | | | | 71,000 | |
Intelsat Jackson Holdings SA, 7.25%, 10/15/2020 | | | 100,000 | | | | 94,000 | |
Verizon Communications, Inc., 4.272%, 1/15/2036 | | | 10,000 | | | | 9,948 | |
| | | | | | | | |
| | | | | | | 174,948 | |
|
| Utilities 0.1% | |
Southern Power Co., Series F, 4.95%, 12/15/2046 | | | 7,000 | | | | 7,678 | |
Total Corporate Bonds (Cost $2,176,106) | | | | 2,194,366 | |
|
| Asset-Backed 2.3% | |
| Home Equity Loans 0.2% | |
CIT Group Home Equity Loan Trust, “AF6”, Series 2002-1, 6.2%, 2/25/2030 | | | 19,529 | | | | 19,896 | |
| | |
| Miscellaneous 2.1% | | | | | | | | |
Domino’s Pizza Master Issuer LLC, “A23”, Series 2017-1A, 144A, 4.118%, 7/25/2047 | | | 109,725 | | | | 112,104 | |
Hilton Grand Vacations Trust, “B”, Series 2014-AA, 144A, 2.07%, 11/25/2026 | | | 95,648 | | | | 94,077 | |
| | | | | | | | |
| | | | | | | | 206,181 | |
Total Asset-Backed (Cost $224,432) | | | | 226,077 | |
|
| Commercial Mortgage-Backed Security 4.7% | |
GMAC Commercial Mortgage Securities, Inc., “G”, Series 2004-C1, 144A, 5.455%, 3/10/2038 (Cost $493,496) | | | 490,430 | | | | 458,945 | |
|
| Collateralized Mortgage Obligations 12.7% | |
Banc of America Mortgage Securities, “2A2”, Series 2004-A, 3.594%**, 2/25/2034 | | | 38,103 | | | | 38,024 | |
Bear Stearns Adjustable Rate Mortgage Trust, “2A1”, Series 2005-11, 4.119%**, 12/25/2035 | | | 50,807 | | | | 51,674 | |
Countrywide Home Loans, “2A5”, Series 2004-13, 5.75%, 8/25/2034 | | | 35,838 | | | | 35,692 | |
Fannie Mae Connecticut Avenue Securities, “1M1”, Series 2016-C02, 1-month USD-LIBOR + 2.150%, 3.702%**, 9/25/2028 | | | 82,842 | | | | 83,658 | |
Federal Home Loan Mortgage Corp.: | | | | | | | | |
“AI”, Series 4016, Interest Only, 3.0%, 9/15/2025 | | | 413,351 | | | | 17,262 | |
“PI”, Series 3843, Interest Only, 4.5%, 5/15/2038 | | | 144,194 | | | | 10,486 | |
| | | | | | | | |
| | | Principal
Amount ($)(a) | | | Value ($) | |
“C31”, Series 303, Interest Only, 4.5%, 12/15/2042 | | | 466,984 | | | | 93,627 | |
“HI”, Series 2934, Interest Only, 5.0%, 2/15/2020 | | | 21,099 | | | | 808 | |
“WI”, Series 3010, Interest Only, 5.0%, 7/15/2020 | | | 32,798 | | | | 1,205 | |
Federal National Mortgage Association, “4”, Series 406, Interest Only, 4.0%, 9/25/2040 | | | 107,895 | | | | 21,279 | |
Government National Mortgage Association: | | | | | | | | |
“GI”, Series 2014-146, Interest Only, 3.5%, 9/20/2029 | | | 1,054,737 | | | | 124,240 | |
“PI”, Series 2015-40, Interest Only, 4.0%, 4/20/2044 | | | 133,962 | | | | 15,478 | |
“HI”, Series 2015-77, Interest Only, 4.0%, 5/20/2045 | | | 268,899 | | | | 46,228 | |
“IP”, Series 2014-115, Interest Only, 4.5%, 2/20/2044 | | | 42,286 | | | | 7,801 | |
“IV”, Series 2009-69, Interest Only, 5.5%, 8/20/2039 | | | 136,320 | | | | 23,077 | |
“IN”, Series 2009-69, Interest Only, 5.5%, 8/20/2039 | | | 139,551 | | | | 25,519 | |
“IJ”, Series 2009-75, Interest Only, 6.0%, 8/16/2039 | | | 123,459 | | | | 21,586 | |
JPMorgan Mortgage Trust, “2A1”, Series 2006-A2, 3.396%**, 4/25/2036 | | | 150,850 | | | | 148,924 | |
Merrill Lynch Mortgage Investors Trust, “2A”, Series 2003-A6, 3.78%**, 10/25/2033 | | | 32,471 | | | | 32,643 | |
RESIMAC, “A2”, Series 2017-2, Australian Bank Bill Short Term Rates 1 Month Mid + 1.200%, 2.89%**, 1/15/2049 | | | AUD 500,000 | | | | 390,927 | |
Wells Fargo Mortgage-Backed Securities Trust, “2A3”,Series 2004-EE, 3.425%**, 12/25/2034 | | | 42,120 | | | | 42,068 | |
Total Collateralized Mortgage Obligations (Cost $995,169) | | | | 1,232,206 | |
|
| Government & Agency Obligations 28.1% | |
| Other Government Related (c) 5.5% | |
Sberbank of Russia, 144A, 5.125%, 10/29/2022 | | | 200,000 | | | | 206,420 | |
Southern Gas Corridor CJSC, 144A, 6.875%, 3/24/2026 | | | 290,000 | | | | 329,513 | |
| | | | | | | | |
| | | | | | | 535,933 | |
|
| Sovereign Bonds 18.9% | |
Export Credit Bank of Turkey, 144A, 5.375%, 10/24/2023 | | | 200,000 | | | | 202,110 | |
Government of Indonesia, Series FR56, 8.375%, 9/15/2026 | | | IDR 1,340,000,000 | | | | 111,591 | |
Ivory Coast Government International Bond, 144A, 5.375%, 7/23/2024 | | | 200,000 | | | | 203,514 | |
Mexican Udibonos Inflation-Linked Bond, Series S, 2.0%, 6/9/2022 | | | MXN 2,864,014 | | | | 137,009 | |
The accompanying notes are an integral part of the financial statements.
| | | | | | |
| | 8 | | | | | | Deutsche Variable Series II — Deutsche Multisector Income VIP |
| | | | | | | | |
| | | Principal
Amount ($)(a) | | | Value ($) | |
Republic of Angola, 144A, 9.5%, 11/12/2025 | | | 200,000 | | | | 230,336 | |
Republic of Argentina-Inflation Linked Bond, 5.83%, 12/31/2033 | | | ARS 375 | | | | 159 | |
Republic of Hungary, Series 19/A, 6.5%, 6/24/2019 | | | HUF 11,600,000 | | | | 49,055 | |
Republic of Namibia, 144A, 5.25%, 10/29/2025 | | | 200,000 | | | | 203,780 | |
Republic of Senegal, 144A, 6.25%, 7/30/2024 | | | 200,000 | | | | 215,864 | |
Republic of Slovenia, 144A, 5.5%, 10/26/2022 | | | 100,000 | | | | 112,992 | |
Republic of Zambia, 144A, 5.375%, 9/20/2022 | | | 200,000 | | | | 195,112 | |
United Mexican States, Series M, 5.75%, 3/5/2026 | | | MXN 3,845,600 | | | | 172,885 | |
| | | | | | | | |
| | | | | | | 1,834,407 | |
|
| U.S. Treasury Obligations 3.7% | |
U.S. Treasury Bond, 3.0%, 5/15/2047 | | | 20,000 | | | | 21,027 | |
U.S. Treasury Notes: | | | | | | | | |
1.5%, 5/31/2019 | | | 232,600 | | | | 231,437 | |
1.625%, 12/31/2019 | | | 109,000 | | | | 108,430 | |
| | | | | | | | |
| | | | | | | | 360,894 | |
Total Government & Agency Obligations (Cost $2,660,096) | | | | 2,731,234 | |
|
| Short-Term U.S. Treasury Obligations 11.3% | |
U.S. Treasury Bills: | | | | | | | | |
1.18%***, 8/16/2018 (d) | | | 380,000 | | | | 376,231 | |
1.381%***, 10/11/2018 (d) | | | 730,000 | | | | 720,479 | |
Total Short-Term U.S. Treasury Obligations (Cost $1,099,250) | | | | 1,096,710 | |
|
| Loan Participations and Assignments 6.2% | |
| Senior Loans** | | | | | | | | |
American Rock Salt Co., LLC, First Lien Term Loan, 3-month USD LIBOR + 3.750%, 5.229%, 5/20/2021 | | | 101,222 | | | | 101,222 | |
DaVita HealthCare Partners, Inc., Term Loan B, 1-month USD LIBOR + 2.750%, 4.319%, 6/24/2021 | | | 67,550 | | | | 68,183 | |
Level 3 Financing, Inc., Term Loan B, 3-month USD LIBOR + 2.250%, 3.696%, 2/22/2024 | | | 60,000 | | | | 60,086 | |
MacDermid, Inc., Term Loan B6, 1-month USD LIBOR + 3.000%, 4.569%, 6/7/2023 | | | 57,187 | | | | 57,552 | |
MEG Energy Corp., Term Loan B, 3-month USD LIBOR + 3.500%, 5.2%, 12/31/2023 | | | 29,378 | | | | 29,454 | |
NRG Energy, Inc., Term Loan B, 3-month USD LIBOR + 2.250%, 3.943%, 6/30/2023 | | | 114,002 | | | | 114,205 | |
| | | | | | | | |
| | | Principal
Amount ($)(a) | | | Value ($) | |
Quebecor Media, Inc., Term Loan B1, 3-month USD LIBOR + 2.250%, 3.663%, 8/17/2020 | | | 86,175 | | | | 86,443 | |
Valeant Pharmaceuticals International, Inc., Term Loan B, 1-month USD LIBOR + 3.500%, 4.94%, 4/1/2022 | | | 80,188 | | | | 81,422 | |
Total Loan Participations and Assignments (Cost $595,484) | | | | 598,567 | |
|
| Convertible Bond 1.9% | |
| Materials | | | | | | | | |
GEO Specialty Chemicals, Inc., 3-month USD-LIBOR + 14.0%, 15.709% PIK, 10/18/2025 (e) (Cost $141,966) | | | 142,844 | | | | 180,626 | |
| | |
| | | Shares | | | Value ($) | |
| Common Stocks 0.0% | |
| Materials | |
GEO Specialty Chemicals, Inc.* (e)
(Cost $19,933) | | | 13,196 | | | | 4,455 | |
|
| Warrant 0.0% | |
| Materials | |
Hercules Trust II, Expiration Date 3/31/2029* (e)
(Cost $17,432) | | | 85 | | | | 2,298 | |
|
| Securities Lending Collateral 1.6% | |
Deutsche Government & Agency Securities Portfolio “Deutsche Government Cash Institutional Shares”, 1.21% (f) (g)
(Cost $154,990) | | | 154,990 | | | | 154,990 | |
|
| Cash Equivalents 5.5% | |
Deutsche Central Cash Management Government Fund, 1.30% (f) (Cost $539,169) | | | 539,169 | | | | 539,169 | |
| | |
| | | % of Net
Assets | | | Value ($) | |
Total Investment Portfolio (Cost $9,117,523) | | | 96.9 | | | | 9,419,643 | |
| Other Assets and Liabilities, Net | | | 3.1 | | | | 297,816 | |
| Net Assets | | | 100.0 | | | | 9,717,459 | |
The accompanying notes are an integral part of the financial statements.
| | | | |
Deutsche Variable Series II — Deutsche Multisector Income VIP | | | | | 9 |
| * | Non-income producing security. |
| ** | Variable or floating rate security. These securities are shown at their current rate as of December 31, 2017. For securities based on a published reference rate and spread, the reference rate and spread are indicated within the description above. Certain variable rate securities are not based on a published reference rate and spread but adjust periodically based on current market conditions, prepayment of underlying positions and/or other variables. |
| *** | Annualized yield at time of purchase; not a coupon rate. |
| (a) | Principal amount stated in U.S. dollars unless otherwise noted. |
| (b) | All or a portion of these securities were on loan. In addition, “Other Assets and Liabilities, Net” may include pending sales that are also on loan. The value of securities loaned at December 31, 2017 amounted to $149,742, which is 1.5% of net assets. |
| (c) | Government-backed debt issued by financial companies or government sponsored enterprises. |
| (d) | At December 31, 2017, this security has been pledged, in whole or in part, to cover initial margin requirements for open futures contracts. |
| (e) | Investment was valued using significant unobservable inputs. |
| (f) | Affiliated fund managed by Deutsche Investment Management Americas Inc. The rate shown is the annualized seven-day yield at period end. |
| (g) | Represents collateral held in connection with securities lending. Income earned by the Fund is net of borrower rebates. |
144A: Security exempt from registration under Rule 144A of the Securities Act of 1933. These securities may be resold in transactions exempt from registration, normally to qualified institutional buyers.
CJSC: Closed Joint Stock Company
Interest Only: Interest Only (IO) bonds represent the “interest only” portion of payments on a pool of underlying mortgages or mortgage-backed securities. IO securities are subject to prepayment risk of the pool of underlying mortgages.
JSC: Joint Stock Company
LIBOR: London Interbank Offered Rate
PIK: Denotes that all or a portion of the income is paid in-kind in the form of additional principal.
REIT: Real Estate Investment Trust
Included in the portfolio are investments in mortgage or asset-backed securities which are interests in separate pools of mortgages or assets. Effective maturities of these investments may be shorter than stated maturities due to prepayments. Some separate investments in the Federal National Mortgage Association issues which have similar coupon rates have been aggregated for presentation purposes in this investment portfolio.
At December 31, 2017, open futures contracts purchased were as follows:
| | | | | | | | | | | | | | | | | | | | | | | | |
| Futures | | Currency | | | Expiration
Date | | | Contracts | | | Notional
Amount ($) | | | Notional
Value ($) | | | Unrealized
(Depreciation) ($) | |
| Ultra 10 Year U.S. Treasury Note | | | USD | | | | 3/20/2018 | | | | 6 | | | | 804,938 | | | | 801,375 | | | | (3,563 | ) |
As of December 31, 2017, the Fund had the following open forward foreign currency contracts:
| | | | | | | | | | | | | | | | | | | | |
| Contracts to Deliver | | | In Exchange For | | | Settlement
Date | | | Unrealized
Appreciation ($) | | | Counterparty |
| USD | | | 233,092 | | | EUR | | | 200,000 | | | | 1/10/2018 | | | | 7,024 | | | Credit Agricole |
| MXN | | | 3,546,000 | | | USD | | | 183,972 | | | | 1/24/2018 | | | | 4,507 | | | HSBC Holdings PLC |
| Total unrealized appreciation | | | | | | | | 11,531 | | | |
| | | | |
| Contracts to Deliver | | | In Exchange For | | | Settlement
Date | | | Unrealized
Depreciation ($) | | | Counterparty |
| EUR | | | 200,000 | | | USD | | | 234,563 | | | | 1/10/2018 | | | | (5,553) | | | Credit Agricole |
| AUD | | | 500,000 | | | USD | | | 385,625 | | | | 2/6/2018 | | | | (4,509) | | | National Australia Bank Ltd. |
| Total unrealized depreciation | | | | | | | | (10,062) | | | |
Currency Abbreviations
For information on the Fund’s policy and additional disclosures regarding futures contracts and forward foreign currency contracts, please refer to the Derivatives section of Note B in the accompanying Notes to Financial Statements.
The accompanying notes are an integral part of the financial statements.
| | | | | | |
| | 10 | | | | | | Deutsche Variable Series II — Deutsche Multisector Income VIP |
Fair Value Measurements
Various inputs are used in determining the value of the Fund’s investments. These inputs are summarized in three broad levels. Level 1 includes quoted prices in active markets for identical securities. Level 2 includes other significant observable inputs (including quoted prices for similar securities, interest rates, prepayment speeds and credit risk). Level 3 includes significant unobservable inputs (including the Fund’s own assumptions in determining the fair value of investments). The level assigned to the securities valuations may not be an indication of the risk or liquidity associated with investing in those securities.
The following is a summary of the inputs used as of December 31, 2017 in valuing the Fund’s investments. For information on the Fund’s policy regarding the valuation of investments, please refer to the Security Valuation section of Note A in the accompanying Notes to Financial Statements.
| | | | | | | | | | | | | | | | |
| Assets | | Level 1 | | | Level 2 | | | Level 3 | | | Total | |
| Fixed Income Investments (h) | | | | | | | | | | | | | | | | |
Corporate Bonds | | $ | — | | | $ | 2,194,366 | | | $ | — | | | $ | 2,194,366 | |
Asset-Backed | | | — | | | | 226,077 | | | | — | | | | 226,077 | |
Commercial Mortgage-Backed Security | | | — | | | | 458,945 | | | | — | | | | 458,945 | |
Collateralized Mortgage Obligations | | | — | | | | 1,232,206 | | | | — | | | | 1,232,206 | |
Government & Agency Obligations | | | — | | | | 2,731,234 | | | | — | | | | 2,731,234 | |
Short-Term U.S. Treasury Obligations | | | — | | | | 1,096,710 | | | | — | | | | 1,096,710 | |
Loan Participations and Assignments | | | — | | | | 598,567 | | | | — | | | | 598,567 | |
Convertible Bond | | | — | | | | — | | | | 180,626 | | | | 180,626 | |
| Common Stocks | | | — | | | | — | | | | 4,455 | | | | 4,455 | |
| Warrant | | | — | | | | — | | | | 2,298 | | | | 2,298 | |
| Short-Term Investments (h) | | | 694,159 | | | | — | | | | — | | | | 694,159 | |
| Derivatives (i) | | | | | | | | | | | | | | | | |
Forward Foreign Currency Contracts | | | — | | | | 11,531 | | | | — | | | | 11,531 | |
| Total | | $ | 694,159 | | | $ | 8,549,636 | | | $ | 187,379 | | | $ | 9,431,174 | |
| | | | |
| Liabilities | | Level 1 | | | Level 2 | | | Level 3 | | | Total | |
| Derivatives (i) | | | | | | | | | | | | | | | | |
Futures Contracts | | $ | (3,563 | ) | | $ | — | | | $ | — | | | $ | (3,563 | ) |
Forward Foreign Currency Contracts | | | — | | | | (10,062 | ) | | | — | | | | (10,062 | ) |
| Total | | $ | (3,563 | ) | | $ | (10,062 | ) | | $ | — | | | $ | (13,625 | ) |
There have been no transfers between fair value measurement levels during the year ended December 31, 2017.
| (h) | See Investment Portfolio for additional detailed categorizations. |
| (i) | Derivatives include unrealized appreciation (depreciation) on open futures contracts and forward foreign currency contracts. |
Level 3 Reconciliation
The following is a reconciliation of the Fund’s Level 3 investments for which significant unobservable inputs were used in determining value:
| | | | | | | | | | | | | | | | |
| | | Convertible
Bonds | | | Common
Stock | | | Warrants | | | Total | |
Balance as of December 31, 2016 | | $ | 135,110 | | | $ | 5,182 | | | $ | 386 | | | $ | 140,678 | |
| Realized gains (loss) | | | 0 | | | | — | | | | — | | | | 0 | |
| Change in unrealized appreciation (depreciation) | | | 34,108 | | | | (727 | ) | | | 1,912 | | | | 35,293 | |
| Amortization premium/discount | | | 648 | | | | — | | | | — | | | | 648 | |
| Purchases | | | 149,617 | | | | — | | | | — | | | | 149,617 | |
| (Sales) | | | (138,857 | ) | | | — | | | | — | | | | (138,857 | ) |
| Transfers into Level 3 | | | — | | | | — | | | | — | | | | — | |
| Transfers (out) of Level 3 | | | — | | | | — | | | | — | | | | — | |
| Balance as of December 31, 2017 | | $ | 180,626 | | | $ | 4,455 | | | $ | 2,298 | | | $ | 187,379 | |
| Net change in unrealized appreciation (depreciation) from investments still held as of December 31, 2017 | | $ | 34,108 | | | $ | (727 | ) | | $ | 1,912 | | | $ | 35,293 | |
The accompanying notes are an integral part of the financial statements.
| | | | |
Deutsche Variable Series II — Deutsche Multisector Income VIP | | | | | 11 |
| | | | | | | | | | | | |
| Quantitative Disclosure About Significant Unobservable Inputs |
| Asset Class | | Fair Value at 12/31/17 | | | Valuation Technique(s) | | | Unobservable Input | | Range (Weighted Average) |
| Convertible Bonds | | | | | | | | | | | | |
| Materials | | | $180,626 | | | | Market Approach | | | EV/EBITDA Multiple | | 6.69% |
| | | | | | | | | | Discount to public comparables | | 20% |
| | | | | | | | | | | Discount for lack of marketability | | 20% |
| Common Stocks | | | | | | | | | | | | |
| Materials | | | $4,455 | | | | Market Approach | | | EV/EBITDA Multiple | | 6.69% |
| | | | | | | | | | Discount to public comparables | | 20% |
| | | | | | | | | | | Discount for lack of marketability | | 20% |
| Warrant | | | | | | | | | | | | |
| Materials | | | $2,298 | | | | Black Scholes Option Pricing Model | | | Implied Volatility of Option | | 20.62% |
| | | | | | | | | | | Illiquidity Discount | | 20% |
Qualitative Disclosure About Unobservable Inputs
Significant unobservable inputs developed by the Pricing Committee and used in the fair value measurement of the Fund’s equity and convertible bond investments include enterprise value (EV) to earnings before interest, taxes, depreciation and amortization (EBITDA) ratio with a discount for lack of marketability. A significant change in the EV to EBITDA ratio may result in a significant change in the fair value measurement, while a significant change in the discount for lack of marketability is unlikely to result in a materially higher or lower fair value measurement.
Significant unobservable inputs developed by the Pricing Committee and used in the fair value measurement of the Fund’s warrants include volatility and discount for lack of marketability. A change in the volatility of the underlying asset as an input to the Black-Scholes model may have a significant change in the fair value measurement. A significant change in the discount for lack of marketability is unlikely to have a material impact to the fair value measurement.
The accompanying notes are an integral part of the financial statements.
| | | | | | |
| | 12 | | | | | | Deutsche Variable Series II — Deutsche Multisector Income VIP |
Statement of Assets and Liabilities
| | | | |
| as of December 31, 2017 | | | | |
| |
| Assets | | | | |
| Investments in non-affiliated securities, at value (cost $8,423,364) — including $149,742 of securities loaned | | $ | 8,725,484 | |
| Investments in Deutsche Government & Agency Securities Portfolio (cost $154,990)* | | | 154,990 | |
| Investment in Deutsche Central Cash Management Government Fund (cost $539,169) | | | 539,169 | |
| Cash | | | 351 | |
| Foreign currency, at value (cost $466,339) | | | 459,761 | |
| Receivable for variation margin on futures contracts | | | 1,709 | |
| Receivable for Fund shares sold | | | 99 | |
| Interest receivable | | | 90,901 | |
| Unrealized appreciation on forward foreign currency contracts | | | 11,531 | |
| Foreign taxes recoverable | | | 672 | |
| Due from Advisor | | | 6,096 | |
| Other assets | | | 649 | |
| Total assets | | | 9,991,412 | |
| |
| Liabilities | | | | |
| Payable upon return of securities loaned | | | 154,990 | |
| Payable for Fund shares redeemed | | | 32 | |
| Unrealized depreciation on forward foreign currency contracts | | | 10,062 | |
| Accrued Trustees’ fees | | | 1,080 | |
| Other accrued expenses and payables | | | 107,789 | |
| Total liabilities | | | 273,953 | |
| Net assets, at value | | $ | 9,717,459 | |
| |
| Net Assets Consist of | | | | |
| Undistributed net investment income | | | 636,964 | |
| Net unrealized appreciation (depreciation) on: | | | | |
Investments | | | 302,120 | |
Futures | | | (3,563 | ) |
Foreign currency | | | (6,682 | ) |
Forward foreign currency contracts | | | 1,469 | |
| Accumulated net realized gain (loss) | | | (4,554,952 | ) |
| Paid-in capital | | | 13,342,103 | |
| Net assets, at value | | $ | 9,717,459 | |
Class A | | | | |
| |
| Net Asset Value | | | | |
| Net Asset Value, offering and redemption price per share ($9,717,459 ÷ 951,249 outstanding shares of beneficial interest, no par value, unlimited number of shares authorized) | | $ | 10.22 | |
| * | Represents collateral on securities loaned. |
Statement of Operations
| | | | |
| for the year ended December 31, 2017 | | | | |
| |
| Investment Income | | | | |
| Income: | | | | |
| Interest (net of foreign taxes withheld of $839) | | $ | 642,326 | |
| Dividends | | | 98,765 | |
| Income distributions — Deutsche Central Cash Management Government Fund | | | 6,756 | |
| Securities lending income, net of borrower rebates | | | 9,386 | |
| Total income | | | 757,233 | |
| Expenses: | | | | |
| Management fee | | | 119,671 | |
| Administration fee | | | 21,759 | |
| Services to Shareholders | | | 256 | |
| Custodian fee | | | 24,795 | |
| Professional fees | | | 88,667 | |
| Reports to shareholders | | | 18,417 | |
| Trustees’ fees and expenses | | | 3,185 | |
| Pricing service fee | | | 16,998 | |
| Other | | | 3,506 | |
| Total expenses before expense reductions | | | 297,254 | |
| Expense reductions | | | (152,082 | ) |
| Total expenses after expense reductions | | | 145,172 | |
| Net investment income | | | 612,061 | |
| |
| Realized and Unrealized Gain (Loss) | | | | |
| Net realized gain (loss) from: | | | | |
| Investments | | | 16,217 | |
| Swap contracts | | | 238,263 | |
| Futures | | | 191,262 | |
| Written options | | | 93,862 | |
| Forward foreign currency contracts | | | (83,399 | ) |
| Foreign currency | | | 42,233 | |
| Payments by affiliates (see Note I) | | | 187 | |
| | | | 498,625 | |
| Change in net unrealized appreciation (depreciation) on: | | | | |
| Investments | | | 716,852 | |
| Swap contracts | | | (380,270 | ) |
| Futures | | | 97,392 | |
| Written options | | | (86,505 | ) |
| Forward foreign currency contracts | | | 706 | |
| Foreign currency | | | 24,630 | |
| | | | 372,805 | |
| Net gain (loss) | | | 871,430 | |
| Net increase (decrease) in net assets resulting from operations | | $ | 1,483,491 | |
The accompanying notes are an integral part of the financial statements.
| | | | |
Deutsche Variable Series II — Deutsche Multisector Income VIP | | | | | 13 |
Statements of Changes in Net Assets
| | | | | | | | |
| | | Years Ended December 31, | |
| Increase (Decrease) in Net Assets | | 2017 | | | 2016 | |
| Operations: | | | | | | | | |
| Net investment income | | $ | 612,061 | | | $ | 620,959 | |
| Net realized gain (loss) | | | 498,625 | | | | (1,726,036 | ) |
| Change in net unrealized appreciation (depreciation) | | | 372,805 | | | | 1,292,328 | |
| Net increase (decrease) in net assets resulting from operations | | | 1,483,491 | | | | 187,251 | |
| Distributions to shareholders from: | | | | | | | | |
| Net investment income: | | | | | | | | |
Class A | | | (201,605 | ) | | | (2,341,380 | ) |
| Total distributions | | | (201,605 | ) | | | (2,341,380 | ) |
| Fund share transactions: | | | | | | | | |
Class A | | | | | | | | |
| Proceeds from shares sold | | | 710,821 | | | | 1,180,584 | |
| Reinvestment of distributions | | | 201,605 | | | | 2,341,380 | |
| Payments for shares redeemed | | | (17,200,328 | ) | | | (9,433,108 | ) |
| Net increase (decrease) in net assets from Class A share transactions | | | (16,287,902 | ) | | | (5,911,144 | ) |
| Increase (decrease) in net assets | | | (15,006,016 | ) | | | (8,065,273 | ) |
| Net assets at beginning of period | | | 24,723,475 | | | | 32,788,748 | |
| Net assets at end of period (including undistributed net investment income of $636,964 and $148,268, respectively) | | $ | 9,717,459 | | | $ | 24,723,475 | |
| | |
| Other Information | | | | | | | | |
Class A | | | | | | | | |
| Shares outstanding at beginning of period | | | 2,560,974 | | | | 3,142,272 | |
| Shares sold | | | 71,456 | | | | 115,644 | |
| Shares issued to shareholders in reinvestment of distributions | | | 20,405 | | | | 245,171 | |
| Shares redeemed | | | (1,701,586 | ) | | | (942,113 | ) |
| Net increase (decrease) in Class A shares | | | (1,609,725 | ) | | | (581,298 | ) |
| Shares outstanding at end of period | | | 951,249 | | | | 2,560,974 | |
The accompanying notes are an integral part of the financial statements.
| | | | | | |
| | 14 | | | | | | Deutsche Variable Series II — Deutsche Multisector Income VIP |
Financial Highlights
| | | | | | | | | | | | | | | | | | | | |
| | | Years Ended December 31, | |
| Class A | | 2017 | | | 2016 | | | 2015 | | | 2014 | | | 2013 | |
| | | | | |
| Selected Per Share Data | | | | | | | | | | | | | | | | | | | | |
| Net asset value, beginning of period | | $ | 9.65 | | | $ | 10.43 | | | $ | 11.20 | | | $ | 11.53 | | | | $12.60 | |
| Income (loss) from investment operations: | | | | | | | | | | | | | | | | | | | | |
Net investment incomea | | | .28 | | | | .22 | | | | .40 | | | | .49 | | | | .49 | |
Net realized and unrealized gain (loss) | | | .37 | | | | (.17 | ) | | | (.72 | ) | | | (.23 | ) | | | (.59 | ) |
Total from investment operations | | | .65 | | | | .05 | | | | (.32 | ) | | | .26 | | | | (.10 | ) |
| Less distributions from: | | | | | | | | | | | | | | | | | | | | |
Net investment income | | | (.08 | ) | | | (.83 | ) | | | (.45 | ) | | | (.59 | ) | | | (.62 | ) |
Net realized gains | | | — | | | | — | | | | — | | | | — | | | | (.35 | ) |
Total distributions | | | (.08 | ) | | | (.83 | ) | | | (.45 | ) | | | (.59 | ) | | | (.97 | ) |
| Net asset value, end of period | | $ | 10.22 | | | $ | 9.65 | | | $ | 10.43 | | | $ | 11.20 | | | | $11.53 | |
| Total Return (%)b | | | 6.78 | | | | .50 | | | | (3.02 | ) | | | 2.23 | | | | (1.04 | ) |
| | | | | |
| Ratios to Average Net Assets and Supplemental Data | | | | | | | | | | | | | | | | | | | | |
| Net assets, end of period ($ millions) | | | 10 | | | | 25 | | | | 33 | | | | 54 | | | | 61 | |
| Ratio of expenses before expense reductions (%)c | | | 1.37 | | | | 1.31 | | | | 1.15 | | | | 1.08 | | | | 1.02 | |
| Ratio of expenses after expense reductions (%)c | | | .67 | | | | .68 | | | | .70 | | | | .77 | | | | .74 | |
| Ratio of net investment income (%) | | | 2.81 | | | | 2.19 | | | | 3.67 | | | | 4.23 | | | | 4.16 | |
| Portfolio turnover rate (%) | | | 96 | | | | 159 | | | | 185 | | | | 185 | | | | 183 | |
| a | Based on average shares outstanding during the period. |
| b | Total return would have been lower had certain expenses not been reduced. |
| c | Expense ratio does not reflect charges and fees associated with the separate account that invests in the Fund or any variable life insurance policy or variable annuity contract for which the Fund is an investment option. |
The accompanying notes are an integral part of the financial statements.
| | | | |
Deutsche Variable Series II — Deutsche Multisector Income VIP | | | | | 15 |
Notes to Financial Statements
A. Organization and Significant Accounting Policies
Deutsche Multisector Income VIP (formerly Deutsche Unconstrained Income VIP) (the “Fund”) is a diversified series of Deutsche Variable Series II (the “Trust”), which is registered under the Investment Company Act of 1940, as amended (the “1940 Act”), as an open-end management investment company organized as a Massachusetts business trust.
The Fund’s financial statements are prepared in accordance with accounting principles generally accepted in the United States of America (“U.S. GAAP”) which require the use of management estimates. Actual results could differ from those estimates. The Fund qualifies as an investment company under Topic 946 of Accounting Standards Codification of U.S. GAAP. The policies described below are followed consistently by the Fund in the preparation of its financial statements.
Security Valuation. Investments are stated at value determined as of the close of regular trading on the New York Stock Exchange on each day the exchange is open for trading.
Various inputs are used in determining the value of the Fund’s investments. These inputs are summarized in three broad levels. Level 1 includes quoted prices in active markets for identical securities. Level 2 includes other significant observable inputs (including quoted prices for similar securities, interest rates, prepayment speeds and credit risk). Level 3 includes significant unobservable inputs (including the Fund’s own assumptions in determining the fair value of investments). The level assigned to the securities valuations may not be an indication of the risk or liquidity associated with investing in those securities.
Debt securities and loan participations and assignments are valued at prices supplied by independent pricing services approved by the Fund’s Board. Such services may use various pricing techniques which take into account appropriate factors such as yield, quality, coupon rate, maturity, type of issue, trading characteristics, prepayment speeds and other data, as well as broker quotes. If the pricing services are unable to provide valuations, debt securities are valued at the average of the most recent reliable bid quotations or evaluated prices, as applicable, obtained from broker-dealers and loan participations and assignments are valued at the mean of the most recent bid and ask quotations or evaluated prices, as applicable, obtained from one or more broker-dealers. Certain securities may be valued on the basis of a price provided by a single source or broker-dealer. No active trading market may exist for some senior loans and they may be subject to restrictions on resale. The inability to dispose of senior loans in a timely fashion could result in losses. These securities are generally categorized as Level 2.
Investments in open-end investment companies are valued at their net asset value each business day and are categorized as Level 1.
Futures contracts are generally valued at the settlement prices established each day on the exchange on which they are traded and are categorized as Level 1.
Forward currency contracts are valued at the prevailing forward exchange rate of the underlying currencies and are categorized as Level 2.
Swap contracts are valued daily based upon prices supplied by a Board approved pricing vendor, if available, and otherwise are valued at the price provided by the broker-dealer. Swap contracts are generally categorized as Level 2.
Exchange-traded options are valued at the last sale price or, in the absence of a sale, the mean between the closing bid and asked prices or at the most recent asked price (bid for purchased options) if no bid or asked price are available. Exchange-traded options are categorized as Level 1. Over-the-counter written or purchased options are valued at prices supplied by a Board approved pricing vendor, if available, and otherwise are valued at the price provided by the broker-dealer with which the option was traded. Over-the-counter written or purchased options are generally categorized as Level 2.
Securities and other assets for which market quotations are not readily available or for which the above valuation procedures are deemed not to reflect fair value are valued in a manner that is intended to reflect their fair value as determined in accordance with procedures approved by the Board and are generally categorized as Level 3. In accordance with the Fund’s valuation procedures, factors considered in determining value may include, but are not limited to, the type of the security; the size of the holding; the initial cost of the security; the existence of any contractual restrictions on the security’s disposition; the price and extent of public trading in similar securities of the issuer or of comparable companies; quotations or evaluated prices from broker-dealers and/or pricing services; information obtained from the issuer, analysts,
| | | | | | |
| | 16 | | | | | | Deutsche Variable Series II — Deutsche Multisector Income VIP |
and/or the appropriate stock exchange (for exchange-traded securities); an analysis of the company’s or issuer’s financial statements; an evaluation of the forces that influence the issuer and the market(s) in which the security is purchased and sold; and with respect to debt securities, the maturity, coupon, creditworthiness, currency denomination and the movement of the market in which the security is normally traded. The value determined under these procedures may differ from published values for the same securities.
Disclosure about the classification of fair value measurements is included in a table following the Fund’s Investment Portfolio.
Foreign Currency Translations. The books and records of the Fund are maintained in U.S. dollars. Investment securities and other assets and liabilities denominated in a foreign currency are translated into U.S. dollars at the prevailing exchange rates at period end. Purchases and sales of investment securities, income and expenses are translated into U.S. dollars at the prevailing exchange rates on the respective dates of the transactions.
Net realized and unrealized gains and losses on foreign currency transactions represent net gains and losses between trade and settlement dates on securities transactions, the acquisition and disposition of foreign currencies, and the difference between the amount of net investment income accrued and the U.S. dollar amount actually received. The portion of both realized and unrealized gains and losses on investments that results from fluctuations in foreign currency exchange rates is not separately disclosed but is included with net realized and unrealized gain/appreciation and loss/depreciation on investments.
Securities Lending. Deutsche Bank AG, as lending agent, lends securities of the Fund to certain financial institutions under the terms of its securities lending agreement. During the term of the loans, the Fund continues to receive interest and dividends generated by the securities and to participate in any changes in their market value. The Fund requires the borrowers of the securities to maintain collateral with the Fund consisting of either cash or liquid, unencumbered assets having a value at least equal to the value of the securities loaned. When the collateral falls below specified amounts, the lending agent will use its best effort to obtain additional collateral on the next business day to meet required amounts under the securities lending agreement. As of period end, any securities on loan were collateralized by cash. During the year ended December 31, 2017 the Fund invested the cash collateral into a joint trading account in affiliated money market funds managed by Deutsche Investment Management Americas Inc. As of December 31, 2017 the Fund invested the cash collateral in Deutsche Government & Agency Securities Portfolio. Deutsche Investment Management Americas Inc. receives a management/administration fee (0.13% annualized effective rate as of December 31, 2017) on the cash collateral invested in Deutsche Government & Agency Securities Portfolio. The Fund receives compensation for lending its securities either in the form of fees or by earning interest on invested cash collateral net of borrower rebates and fees paid to a lending agent. Either the Fund or the borrower may terminate the loan at any time, and the borrower, after notice, is required to return borrowed securities within a standard time period. There may be risks of delay and costs in recovery of securities or even loss of rights in the collateral should the borrower of the securities fail financially. If the Fund is not able to recover securities lent, the Fund may sell the collateral and purchase a replacement investment in the market, incurring the risk that the value of the replacement security is greater than the value of the collateral. The Fund is also subject to all investment risks associated with the reinvestment of any cash collateral received, including, but not limited to, interest rate, credit and liquidity risk associated with such investments.
As of December 31, 2017 the Fund had securities on loan, which were classified as corporate bonds in the Investment Portfolio. The value of the related collateral exceeded the value of the securities loaned at period end.
Loan Participations and Assignments. Loan Participations and Assignments are portions of loans originated by banks and sold in pieces to investors. These floating-rate loans (“Loans”) in which the Fund invests are arranged between the borrower and one or more financial institutions (“Lenders”). These Loans may take the form of Senior Loans, which are corporate obligations often issued in connection with recapitalizations, acquisitions, leveraged buy outs and refinancing. The Fund invests in such Loans in the form of participations in Loans (“Participations”) or assignments of all or a portion of Loans from third parties (“Assignments”). Participations typically result in the Fund having a contractual relationship with only the Lender, not with the borrower. The Fund has the right to receive payments of principal, interest and any fees to which it is entitled from the Lender selling the Participation and only upon receipt by the Lender of the payments from the borrower. In connection with purchasing Participations, the Fund generally has no right to enforce compliance by the borrower with the terms of the loan agreement relating to the Loan, or any rights
| | | | |
Deutsche Variable Series II — Deutsche Multisector Income VIP | | | | | 17 |
of set off against the borrower, and the Fund will not benefit directly from any collateral supporting the Loan in which it has purchased the Participation. As a result, the Fund assumes the credit risk of both the borrower and the Lender that is selling the Participation. Assignments typically result in the Fund having a direct contractual relationship with the borrower, and the Fund may enforce compliance by the borrower with the terms of the loan agreement. Loans held by the Fund are generally in the form of Assignments, but the Fund may also invest in Participations. If affiliates of the Advisor participate in the primary and secondary market for senior loans, legal limitations may restrict the Fund’s ability to participate in restructuring or acquiring some senior loans. All Loans involve interest rate risk, liquidity risk and credit risk, including the potential default or insolvency of the borrower.
When-Issued/Delayed Delivery Securities. The Fund may purchase or sell securities with delivery or payment to occur at a later date beyond the normal settlement period. At the time the Fund enters into a commitment to purchase or sell a security, the transaction is recorded and the value of the transaction is reflected in the net asset value. The price of such security and the date when the security will be delivered and paid for are fixed at the time the transaction is negotiated. The value of the security may vary with market fluctuations. At the time the Fund enters into this type of transaction, it is required to segregate cash or other liquid assets at least equal to the amount of the commitment. Additionally, the Fund may be required to post securities and/or cash collateral in accordance with the terms of the commitment.
Certain risks may arise upon entering into when-issued or delayed delivery transactions from the potential inability of counterparties to meet the terms of their contracts or if the issuer does not issue the securities due to political, economic, or other factors. Additionally, losses may arise due to changes in the value of the underlying securities.
Taxes. The Fund’s policy is to comply with the requirements of the Internal Revenue Code, as amended, which are applicable to regulated investment companies and to distribute all of its taxable income to its shareholders.
Additionally, the Fund may be subject to taxes imposed by the governments of countries in which it invests and are generally based on income and/or capital gains earned or repatriated, a portion of which may be recoverable. Based upon the current interpretation of the tax rules and regulations, estimated tax liabilities and recoveries on certain foreign securities are recorded on an accrual basis and are reflected as components of interest income or net change in unrealized gain/loss on investments. Tax liabilities realized as a result of security sales are reflected as a component of net realized gain/loss on investments.
At December 31, 2017, the Fund had net tax basis capital loss carryforwards of approximately $4,557,000, which may be applied against realized net taxable capital gains indefinitely, including short-term losses ($1,958,000) and long-term losses ($2,599,000).
The Fund has reviewed the tax positions for the open tax years as of December 31, 2017 and has determined that no provision for income tax and/or uncertain tax provisions is required in the Fund’s financial statements. The Fund’s federal tax returns for the prior three fiscal years remain open subject to examination by the Internal Revenue Service.
Distribution of Income and Gains. Distributions from net investment income of the Fund, if any, are declared and distributed to shareholders annually. Net realized gains from investment transactions, in excess of available capital loss carryforwards, would be taxable to the Fund if not distributed and, therefore, will be distributed to shareholders at least annually. The Fund may also make additional distributions for tax purposes if necessary.
The timing and characterization of certain income and capital gain distributions are determined annually in accordance with federal tax regulations which may differ from accounting principles generally accepted in the United States of America. These differences primarily relate to investments in foreign denominated investments, futures contracts, swap contracts and certain securities sold at a loss. As a result, net investment income (loss) and net realized gain (loss) on investment transactions for a reporting period may differ significantly from distributions during such period. Accordingly, the Fund may periodically make reclassifications among certain of its capital accounts without impacting the net asset value of the Fund.
At December 31, 2017, the Fund’s components of distributable earnings on a tax basis were as follows:
| | | | |
| Undistributed ordinary income* | | $ | 638,433 | |
| Capital loss carryforwards | | $ | (4,557,000 | ) |
| Unrealized appreciation (depreciation) on investments | | $ | 301,386 | |
| | | | | | |
| | 18 | | | | | | Deutsche Variable Series II — Deutsche Multisector Income VIP |
At December 31, 2017, the aggregate cost of investments for federal income tax purposes was $9,118,257. The net unrealized appreciation for all investments based on tax cost was $301,386. This consisted of aggregate gross unrealized appreciation for all investments in which there was an excess of value over tax cost of $431,028 and aggregate gross unrealized depreciation for all investments in which there was an excess of tax cost over value of $129,642.
In addition, the tax character of distributions paid by the Fund is summarized as follows:
| | | | | | | | |
| | | Years Ended December 31, | |
| | | 2017 | | | 2016 | |
| Distributions from ordinary income* | | $ | 201,605 | | | $ | 2,341,380 | |
| * | For tax purposes, short-term capital gain distributions are considered ordinary income distributions. |
Expenses. Expenses of the Trust arising in connection with a specific fund are allocated to that fund. Other Trust expenses which cannot be directly attributed to a fund are apportioned among the funds in the Trust based upon the relative net assets or other appropriate measures.
Contingencies. In the normal course of business, the Fund may enter into contracts with service providers that contain general indemnification clauses. The Fund’s maximum exposure under these arrangements is unknown, as this would involve future claims that may be made against the Fund that have not yet been made. However, based on experience, the Fund expects the risk of loss to be remote.
Other. Investment transactions are accounted for on a trade date plus one basis for daily net asset value calculations. However, for financial reporting purposes, investment transactions are reported on trade date. Interest income is recorded on the accrual basis. Dividend income is recorded on the ex-dividend date net of foreign withholding taxes. Realized gains and losses from investment transactions are recorded on an identified cost basis. Proceeds from litigation payments, if any, are included in net realized gain (loss) from investments. All discounts and premiums are accreted/amortized for both tax and financial reporting purposes for the Fund, with the exception of securities in default of principal.
B. Derivative Instruments
Swaps. A swap is a contract between two parties to exchange future cash flows at periodic intervals based on the notional amount of the swap. A bilateral swap is a transaction between the fund and a counterparty where cash flows are exchanged between the two parties. A centrally cleared swap is a transaction executed between the fund and a counterparty, then cleared by a clearing member through a central clearinghouse. The central clearinghouse serves as the counterparty, with whom the fund exchanges cash flows.
The value of a swap is adjusted daily, and the change in value, if any, is recorded as unrealized appreciation or depreciation in the Statement of Assets and Liabilities. Gains or losses are realized when the swap expires or is closed. Certain risks may arise when entering into swap transactions including counterparty default; liquidity; or unfavorable changes in interest rates or the value of the underlying reference security, commodity or index. In connection with bilateral swaps, securities and/or cash may be identified as collateral in accordance with the terms of the swap agreement to provide assets of value and recourse in the event of default. The maximum counterparty credit risk is the net present value of the cash flows to be received from or paid to the counterparty over the term of the swap, to the extent that this amount is beneficial to the Fund, in addition to any related collateral posted to the counterparty by the Fund. This risk may be partially reduced by a master netting arrangement between the Fund and the counterparty. Upon entering into a centrally cleared swap, the Fund is required to deposit with a financial intermediary cash or securities (“initial margin”) in an amount equal to a certain percentage of the notional amount of the swap. Subsequent payments (“variation margin”) are made or received by the Fund dependent upon the daily fluctuations in the value of the swap. In a cleared swap transaction, counterparty risk is minimized as the central clearinghouse acts as the counterparty.
An upfront payment, if any, made by the Fund is recorded as an asset in the Statement of Assets and Liabilities. An upfront payment, if any, received by the Fund is recorded as a liability in the Statement of Assets and Liabilities. Payments received or made at the end of the measurement period are recorded as realized gain or loss in the Statement of Operations.
Interest Rate Swaps. Interest rate swaps are agreements in which the Fund agrees to pay to the counterparty a fixed rate payment in exchange for the counterparty agreeing to pay to the Fund a variable rate payment, or the Fund agrees to receive from the counterparty a fixed rate payment in exchange for the counterparty agreeing to receive from the Fund a variable rate payment. The payment obligations are based
| | | | |
Deutsche Variable Series II — Deutsche Multisector Income VIP | | | | | 19 |
on the notional amount of the swap. For the year ended December 31, 2017 the Fund entered into interest rate swap agreements to gain exposure to different parts of the yield curve while managing overall duration.
There were no open interest rate swap contracts as of December 31, 2017. For the year ended December 31, 2017 the investment in interest rate swap contracts had a total notional amount generally indicative of a range from $0 to $17,200,000.
Credit Default Swaps. Credit default swaps are agreements between a buyer and a seller of protection against predefined credit events for the reference entity. The Fund may enter into credit default swaps to gain exposure to an underlying issuer’s credit quality characteristics without directly investing in that issuer or to hedge against the risk of a credit event on debt securities. As a seller of a credit default swap, the Fund is required to pay the par (or other agreed-upon) value of the referenced entity to the counterparty with the occurrence of a credit event by a third party, such as a U.S. or foreign corporate issuer, on the reference entity, which would likely result in a loss to the Fund. In return, the Fund receives from the counterparty a periodic stream of payments over the term of the swap provided that no credit event has occurred. If no credit event occurs, the Fund keeps the stream of payments with no payment obligations. The Fund may also buy credit default swaps, in which case the Fund functions as the counterparty referenced above. This involves the risk that the swap may expire worthless. It also involves counterparty risk that the seller may fail to satisfy its payment obligations to the Fund with the occurrence of a credit event. When the Fund sells a credit default swap, it will cover its commitment. This may be achieved by, among other methods, maintaining cash or liquid assets equal to the aggregate notional value of the reference entities for all outstanding credit default swaps sold by the Fund. For the year ended December 31, 2017 the Fund entered into credit default swap agreements to gain exposure to the underlying issuer’s credit quality characteristics and to hedge the risk of default on fund securities.
Under the terms of a credit default swap, the Fund receives or makes periodic payments based on a specified interest rate on a fixed notional amount. These payments are recorded as a realized gain or loss in the Statement of Operations. Payments received or made as a result of a credit event or termination of the swap are recognized, net of a proportional amount of the upfront payment, as realized gains or losses in the Statement of Operations.
There were no open credit default swap contracts as of December 31, 2017. For the year ended December 31, 2017 the investment in credit default swap contracts sold had a total notional value generally indicative of a range from $0 to $3,070,000.
Options. An option contract is a contract in which the writer (seller) of the option grants the buyer of the option, upon payment of a premium, the right to purchase from (call option), or sell to (put option), the writer a designated instrument at a specified price within a specified period of time. The Fund may write or purchase interest rate swaption agreements which are options to enter into a pre-defined swap agreement. The interest rate swaption agreement will specify whether the buyer of the swaption will be a fixed-rate receiver or a fixed-rate payer upon exercise. Certain options, including options on indices, will require cash settlement by the Fund if the option is exercised. For the year ended December 31, 2017 the Fund entered into options on interest rate swaps in order to hedge against potential adverse interest rate movements of portfolio assets.
If the Fund writes a covered call option, the Fund foregoes, in exchange for the premium, the opportunity to profit during the option period from an increase in the market value of the underlying security above the exercise price. If the Fund writes a put option it accepts the risk of a decline in the value of the underlying security below the exercise price. Over-the-counter options have the risk of the potential inability of counterparties to meet the terms of their contracts. The Fund’s maximum exposure to purchased options is limited to the premium initially paid. In addition, certain risks may arise upon entering into option contracts including the risk that an illiquid secondary market will limit the Fund’s ability to close out an option contract prior to the expiration date and that a change in the value of the option contract may not correlate exactly with changes in the value of the securities.
There were no open purchased or written option contracts as of December 31, 2017. For the year ended December 31, 2017 the investment in purchased option contracts had a total value generally indicative of a range from $0 to approximately $15,000, and written option contracts had a total value generally indicative of a range from $0 to approximately $116,000.
Futures Contracts. A futures contract is an agreement between a buyer or seller and an established futures exchange or its clearinghouse in which the buyer or seller agrees to take or make a delivery of a specific amount of a financial instrument at a specified price on a specific date (settlement date). For the year ended December 31, 2017 the Fund entered into interest rate futures to gain exposure to different parts of the yield curve while managing overall duration and for non-hedging purposes to seek to enhance potential gains.
| | | | | | |
| | 20 | | | | | | Deutsche Variable Series II — Deutsche Multisector Income VIP |
Upon entering into a futures contract, the Fund is required to deposit with a financial intermediary cash or securities (“initial margin”) in an amount equal to a certain percentage of the face value indicated in the futures contract. Subsequent payments (“variation margin”) are made or received by the Fund dependent upon the daily fluctuations in the value and are recorded for financial reporting purposes as unrealized gains or losses by the Fund. Gains or losses are realized when the contract expires or is closed. Since all futures contracts are exchange-traded, counterparty risk is minimized as the exchange’s clearinghouse acts as the counterparty, and guarantees the futures against default.
Certain risks may arise upon entering into futures contracts, including the risk that an illiquid market will limit the Fund’s ability to close out a futures contract prior to the settlement date and the risk that the futures contract is not well correlated with the security, index or currency to which it relates. Risk of loss may exceed amounts disclosed in the Statement of Assets and Liabilities.
A summary of the open futures contracts as of December 31, 2017 is included in a table following the Fund’s Investment Portfolio. For the year ended December 31, 2017 the investment in futures contracts purchased had a total notional value generally indicative of a range from approximately $801,000 to $8,144,000, and the investment in futures contracts sold had a total notional value generally indicative of a range from approximately $0 to approximately $5,938,000.
Forward Foreign Currency Contracts. A forward foreign currency contract (“forward currency contract”) is a commitment to purchase or sell a foreign currency at the settlement date at a negotiated rate. For the year ended December 31, 2017 the Fund entered into forward currency contracts in order to hedge against anticipated currency market changes and for non-hedging purposes to seek to enhance potential gains.
Forward currency contracts are valued at the prevailing forward exchange rate of the underlying currencies and unrealized gain (loss) is recorded daily. On the settlement date of the forward currency contract, the Fund records a realized gain or loss equal to the difference between the value of the contract at the time it was opened and the value of the contract at the time it was closed. Certain risks may arise upon entering into forward currency contracts from the potential inability of counterparties to meet the terms of their contracts. The maximum counterparty credit risk to the Fund is measured by the unrealized gain on appreciated contracts. Additionally, when utilizing forward currency contracts to hedge, the Fund gives up the opportunity to profit from favorable exchange rate movements during the term of the contract.
A summary of the open forward currency contracts as of December 31, 2017 is included in a table following the Fund’s Investment Portfolio. For the year ended December 31, 2017 the investment in forward currency contracts short vs. U.S. dollars had a total contract value generally indicative of a range from approximately $804,000 to $2,150,000, and the investment in forward currency contracts long vs. U.S. dollars had a total contract value generally indicative of a range from approximately $233,000 to $1,551,000.
The following tables summarize the value of the Fund’s derivative instruments held as of December 31, 2017 and the related location in the accompanying Statement of Assets and Liabilities, presented by primary underlying risk exposure:
| | | | |
| Asset Derivatives | | Forward
Contracts | |
| Foreign Exchange Contracts (a) | | $ | 11,531 | |
The above derivative is located in the following Statement of Assets and Liabilities accounts:
| (a) | Unrealized appreciation on forward foreign currency contracts |
| | | | | | | | | | | | |
| Liability Derivatives | | Forward
Contracts | | | Futures
Contracts | | | Total | |
| Interest Rate Contracts (b) | | $ | — | | | $ | (3,563 | ) | | $ | (3,563 | ) |
| Foreign Exchange Contracts (c) | | | (10,062 | ) | | | — | | | | (10,062 | ) |
| | | $ | (10,062 | ) | | $ | (3,563 | ) | | $ | (13,625 | ) |
Each of the above derivatives is located in the following Statement of Assets and Liabilities accounts:
| (b) | Includes cumulative depreciation of futures as disclosed in the Investment Portfolio. Unsettled variation margin is disclosed separately within the Statement of Assets and Liabilities. |
| (c) | Unrealized depreciation on forward foreign currency contracts |
| | | | |
Deutsche Variable Series II — Deutsche Multisector Income VIP | | | | | 21 |
Additionally, the amount of unrealized and realized gains and losses on derivative instruments recognized in Fund earnings during the year ended December 31, 2017 and the related location in the accompanying Statement of Operations is summarized in the following tables by primary underlying risk exposure:
| | | | | | | | | | | | | | | | | | | | | | | | |
| Realized Gain (Loss) | | Purchased
Options | | | Written
Options | | | Forward
Contracts | | | Swap
Contracts | | | Futures
Contracts | | | Total | |
| Interest Rate Contracts (d) | | $ | (225,738 | ) | | $ | 93,862 | | | $ | — | | | $ | 21,933 | | | $ | 191,262 | | | $ | 81,319 | |
| Credit Contracts (d) | | | — | | | | — | | | | — | | | | 216,330 | | | | — | | | | 216,330 | |
| Foreign Exchange Contracts (e) | | | — | | | | — | | | | (83,399 | ) | | | — | | | | — | | | | (83,399 | ) |
| | | $ | (225,738 | ) | | $ | 93,862 | | | $ | (83,399 | ) | | $ | 238,263 | | | $ | 191,262 | | | $ | 214,250 | |
Each of the above derivatives is located in the following Statement of Operations accounts:
| (d) | Net realized gain (loss) from investments (includes purchased options), written options, swap contracts and futures, respectively |
| (e) | Net realized gain (loss) from forward foreign currency contracts |
| | | | | | | | | | | | | | | | | | | | | | | | |
Change in Net Unrealized
Appreciation (Depreciation) | | Purchased
Options | | | Written
Options | | | Forward
Contracts | | | Swap
Contracts | | | Futures
Contracts | | | Total | |
| Interest Rate Contracts (f) | | $ | 210,480 | | | $ | (86,505 | ) | | $ | — | | | $ | (290,521 | ) | | $ | 97,392 | | | $ | (69,154 | ) |
| Credit Contracts (f) | | | — | | | | — | | | | — | | | | (89,749 | ) | | | — | | | | (89,749 | ) |
| Foreign Exchange Contracts (g) | | | — | | | | — | | | | 706 | | | | — | | | | — | | | | 706 | |
| | | $ | 210,480 | | | $ | (86,505 | ) | | $ | 706 | | | $ | (380,270 | ) | | $ | 97,392 | | | $ | (158,197 | ) |
Each of the above derivatives is located in the following Statement of Operations accounts:
| (f) | Change in net unrealized appreciation (depreciation) on investments (includes purchased options), written options, swap contracts and futures, respectively |
| (g) | Change in net unrealized appreciation (depreciation) on forward foreign currency contracts |
As of December 31, 2017 the Fund has transactions subject to enforceable master netting agreements which govern the terms of certain transactions, and reduce the counterparty risk associated with such transactions. Master netting agreements allow a Fund to close out and net total exposure to a counterparty in the event of a deterioration in the credit quality or contractual default with respect to all of the transactions with a counterparty. As defined by the master netting agreement, the Fund may have collateral agreements with certain counterparties to mitigate risk. For financial reporting purposes the Statement of Assets and Liabilities generally shows derivatives assets and liabilities on a gross basis, which reflects the full risks and exposures prior to netting. A reconciliation of the gross amounts on the Statement of Assets and Liabilities to the net amounts by a counterparty, including any collateral exposure, is included in the following tables:
| | | | | | | | | | | | | | | | |
| Counterparty | | Gross Amounts
of Assets
Presented in the
Statement of
Assets and
Liabilities | �� | | Financial
Instruments
and
Derivatives
Available
for Offset | | | Collateral
Received | | | Net Amount of
Derivative
Assets | |
Credit Agricole | | $ | 7,024 | | | $ | (5,553 | ) | | $ | — | | | $ | 1,471 | |
HSBC Holdings PLC | | | 4,507 | | | | — | | | | — | | | | 4,507 | |
| | | $ | 11,531 | | | $ | (5,553 | ) | | $ | — | | | $ | 5,978 | |
| | | | |
| Counterparty | | Gross Amounts
of Liabilities
Presented in the
Statement of
Assets and
Liabilities | | | Financial
Instruments
and
Derivatives
Available
for Offset | | | Collateral
Pledged | | | Net Amount of
Derivative
Liabilities | |
Credit Agricole | | $ | 5,553 | | | $ | (5,553 | ) | | $ | — | | | $ | — | |
National Australia Bank Ltd. | | | 4,509 | | | | — | | | | — | | | | 4,509 | |
| | | $ | 10,062 | | | $ | (5,553 | ) | | $ | — | | | $ | 4,509 | |
C. Purchases and Sales of Securities
During the year ended December 31, 2017 purchases and sales of investment transactions (excluding short-term investments and U.S. Treasury obligations) aggregated $17,412,428 and $27,105,969, respectively. Purchases and sales of U.S. Treasury obligations aggregated $1,356,035 and $7,123,237, respectively.
| | | | | | |
| | 22 | | | | | | Deutsche Variable Series II — Deutsche Multisector Income VIP |
D. Related Parties
Management Agreement. Under the Investment Management Agreement with Deutsche Investment Management Americas Inc. (“DIMA” or the “Advisor”), an indirect, wholly owned subsidiary of Deutsche Bank AG, the Advisor directs the investments of the Fund in accordance with its investment objectives, policies and restrictions. The Advisor determines the securities, instruments and other contracts relating to investments to be purchased, sold or entered into by the Fund or delegates such responsibility to the Fund’s subadvisor.
Effective March 1, 2017, Deutsche Alternative Asset Management (Global) Limited (DAAM Global), also an indirect, wholly owned subsidiary of Deutsche Bank AG, serves as subadvisor for the Fund and, as such, provides portfolio manager services to the Fund. Pursuant to a sub-advisory agreement between DIMA and DAAM Global, DIMA, not the Fund, compensates DAAM Global for the services it provides to the Fund.
Pursuant to the Investment Management Agreement with the Advisor, the Fund pays a monthly management fee based on the Fund’s average daily net assets, computed and accrued daily and payable monthly, at the following annual rates:
| | | | |
| First $250 million | | | .550 | % |
| Next $750 million | | | .520 | % |
| Next $1.5 billion | | | .500 | % |
| Next $2.5 billion | | | .480 | % |
| Next $2.5 billion | | | .450 | % |
| Next $2.5 billion | | | .430 | % |
| Next $2.5 billion | | | .410 | % |
| Over $12.5 billion | | | .390 | % |
Accordingly, for the year ended December 31, 2017 the fee pursuant to the Investment Management Agreement was equivalent to an annual rate (exclusive of any applicable waivers/reimbursements) of 0.55% of the Fund’s average daily net assets.
For the period from January 1, 2017 through September 30, 2017, the Advisor had contractually agreed to waive its fee and/or reimburse certain operating expenses to the extent necessary to maintain the total annual operating expenses (excluding certain expenses such as extraordinary expenses, taxes, brokerage and interest expense) at 0.67%.
Effective October 1, 2017 through September 30, 2018, the Advisor has contractually agreed to waive its fee and/or reimburse certain operating expenses to the extent necessary to maintain the total annual operating expenses (excluding certain expenses such as extraordinary expenses, taxes, brokerage and interest expense) at 0.65%.
For the year ended December 31, 2017 fees waived and/or expenses reimbursed amounted to $152,082.
Administration Fee. Pursuant to an Administrative Services Agreement, DIMA provides most administrative services to the Fund. For all services provided under the Administrative Services Agreement, the Fund pays DIMA an annual fee (“Administration Fee”) of 0.10% of the Fund’s average daily net assets, computed and accrued daily and payable monthly. For the year ended December 31, 2017 the Administration Fee was $21,759, of which $842 is unpaid.
Service Provider Fees. Deutsche AM Service Company (“DSC”), an affiliate of the Advisor, is the transfer agent, dividend-paying agent and shareholder service agent for the Fund. Pursuant to a sub-transfer agency agreement between DSC and DST Systems, Inc. (“DST”), DSC has delegated certain transfer agent, dividend-paying agent and shareholder service agent functions to DST. DSC compensates DST out of the shareholder servicing fee it receives from the Fund. For the year ended December 31, 2017 the amounts charged to the Fund by DSC aggregated $131, of which $33 is unpaid.
Typesetting and Filing Service Fees. Under an agreement with DIMA, DIMA is compensated for providing typesetting and certain regulatory filing services to the Fund. For the year ended December 31, 2017 the amount charged to the Fund by DIMA included in the Statement of Operations under “Reports to shareholders” aggregated $13,320, of which $6,398 is unpaid.
Trustees’ Fees and Expenses. The Fund paid retainer fees to each Trustee not affiliated with the Advisor, plus specified amounts to the Board Chairperson and Vice Chairperson and to each committee Chairperson.
Affiliated Cash Management Vehicles. The Fund may invest uninvested cash balances in Deutsche Central Cash Management Government Fund and Deutsche Variable NAV Money Fund, affiliated money market
| | | | |
Deutsche Variable Series II — Deutsche Multisector Income VIP | | | | | 23 |
funds which are managed by the Advisor. Each affiliated money market fund is managed in accordance with Rule 2a-7 under the 1940 Act, which governs the quality, maturity, diversity and liquidity of instruments in which a money market fund may invest. Deutsche Central Cash Management Government Fund seeks to maintain a stable net asset value, and Deutsche Variable NAV Money Fund maintains a floating net asset value. The Fund indirectly bears its proportionate share of the expenses of each affiliated money market fund in which it invests. Deutsche Central Cash Management Government Fund does not pay the Advisor an investment management fee. To the extent that Deutsche Variable NAV Money Fund pays an investment management fee to the Advisor, the Advisor will waive an amount of the investment management fee payable to the Advisor by the Fund equal to the amount of the investment management fee payable on the Fund’s assets invested in Deutsche Variable NAV Money Fund.
Security Lending Fees. Deutsche Bank AG serves as securities lending agent for the Fund. For the year ended December 31, 2017 the Fund incurred securities lending agent fees to Deutsche Bank AG in the amount of $706.
E. Line of Credit
The Fund and other affiliated funds (the “Participants”) share in a $400 million revolving credit facility provided by a syndication of banks. The Fund may borrow for temporary or emergency purposes, including the meeting of redemption requests that otherwise might require the untimely disposition of securities. The Participants are charged an annual commitment fee which is allocated based on net assets, among each of the Participants. Interest is calculated at a rate per annum equal to the sum of the Federal Funds Rate plus 1.25 percent plus if the one-month LIBOR exceeds the Federal Funds Rate, the amount of such excess. The Fund may borrow up to a maximum of 33 percent of its net assets under the agreement. The Fund had no outstanding loans at December 31, 2017.
F. Investing in High-Yield Securities
High-yield debt securities or junk bonds are generally regarded as speculative with respect to the issuer’s continuing ability to meet principal and interest payments. The Fund’s performance could be hurt if an issuer of a debt security suffers an adverse change in financial condition that results in the issuer not making timely payments of interest or principal, a security downgrade or an inability to meet a financial obligation. High-yield debt securities’ total return and yield may generally be expected to fluctuate more than the total return and yield of investment-grade debt securities. A real or perceived economic downturn or an increase in market interest rates could cause a decline in the value of high-yield debt securities, result in increased redemptions and/or result in increased portfolio turnover, which could result in a decline in net asset value of the Fund, reduce liquidity for certain investments and/or increase costs. High-yield debt securities are often thinly traded and can be more difficult to sell and value accurately than investment-grade debt securities as there may be no established secondary market. Investments in high yield debt securities could increase liquidity risk for the Fund. In addition, the market for high-yield debt securities can experience sudden and sharp volatility which is generally associated more with investments in stocks.
G. Investing in Emerging Markets
Investing in emerging markets may involve special risks and considerations not typically associated with investing in developed markets. These risks include revaluation of currencies, high rates of inflation or deflation, repatriation restrictions on income and capital, and future adverse political, social and economic developments. Moreover, securities issued in these markets may be less liquid, subject to government ownership controls or delayed settlements, and may have prices that are more volatile or less easily assessed than those of comparable securities of issuers in developed markets.
H. Ownership of the Fund
At December 31, 2017 one participating insurance company was owners of record of 10% or more of the total outstanding Class A shares of the Fund, owning 92%.
I. Payments by Affiliates
During the year ended December 31, 2017, the Advisor agreed to reimburse the Fund $187 for losses incurred on trades executed incorrectly. The amount reimbursed was less than .01% of the Fund’s average net assets, thus having no impact on the Fund’s total return.
| | | | | | |
| | 24 | | | | | | Deutsche Variable Series II — Deutsche Multisector Income VIP |
Report of Independent Registered Public Accounting Firm
To the Board of Trustees of Deutsche Variable Series II and the Shareholders of Deutsche Multisector Income VIP
Opinion on the Financial Statements
We have audited the accompanying statement of assets and liabilities of Deutsche Multisector Income VIP, formerly Deutsche Unconstrained Income VIP (the “Fund”) (one of the funds constituting the Deutsche Variable Series II) (the “Trust”), including the schedule of investments, as of December 31, 2017, and the related statement of operations for the year then ended, the statements of changes in net assets for each of the two years in the period then ended, the financial highlights for each of the five years in the period then ended and the related notes (collectively referred to as the “financial statements”). In our opinion, the financial statements present fairly, in all material respects, the financial position of the Fund (one of the funds constituting the Deutsche Variable Series II) at December 31, 2017, the results of its operations for the year then ended, the changes in its net assets for each of the two years in the period then ended and its financial highlights for each of the five years in the period then ended, in conformity with U.S. generally accepted accounting principles.
Basis for Opinion
These financial statements are the responsibility of the Trust’s management. Our responsibility is to express an opinion on the Fund’s financial statements based on our audits. We are a public accounting firm registered with the Public Company Accounting Oversight Board (United States) (“PCAOB”) and are required to be independent with respect to the Trust in accordance with the U.S. federal securities laws and the applicable rules and regulations of the Securities and Exchange Commission and the PCAOB.
We conducted our audits in accordance with the standards of the PCAOB. Those standards require that we plan and perform the audit to obtain reasonable assurance about whether the financial statements are free of material misstatement, whether due to error or fraud. The Trust is not required to have, nor were we engaged to perform, an audit of the Trust’s internal control over financial reporting. As part of our audits, we are required to obtain an understanding of internal control over financial reporting, but not for the purpose of expressing an opinion on the effectiveness of the Trust’s internal control over financial reporting. Accordingly, we express no such opinion.
Our audits included performing procedures to assess the risks of material misstatement of the financial statements, whether due to error or fraud, and performing procedures that respond to those risks. Such procedures included examining, on a test basis, evidence regarding the amounts and disclosures in the financial statements. Our procedures included confirmation of securities owned as of December 31, 2017, by correspondence with the custodian and brokers or by other appropriate auditing procedures where replies from brokers were not received.
Our audits also included evaluating the accounting principles used and significant estimates made by management, as well as evaluating the overall presentation of the financial statements. We believe that our audits provide a reasonable basis for our opinion.
We have served as the auditor of one or more investment companies in the Deutsche family of funds since at least 1979, but we are unable to determine the specific year.
Boston, Massachusetts
February 15, 2018
| | | | |
Deutsche Variable Series II — Deutsche Multisector Income VIP | | | | | 25 |
| | |
| Information About Your Fund’s Expenses | | (Unaudited) |
As an investor of the Fund, you incur two types of costs: ongoing expenses and transaction costs. Ongoing expenses include management fees and other Fund expenses. Examples of transaction costs include contract charges, which are not shown in this section. The following tables are intended to help you understand your ongoing expenses (in dollars) of investing in the Fund and to help you compare these expenses with the ongoing expenses of investing in other mutual funds. In the most recent six-month period, the Fund limited these expenses; had it not done so, expenses would have been higher. The example in the table is based on an investment of $1,000 invested at the beginning of the six-month period and held for the entire period (July 1, 2017 to December 31, 2017).
The tables illustrate your Fund’s expenses in two ways:
| — | Actual Fund Return. This helps you estimate the actual dollar amount of ongoing expenses (but not transaction costs) paid on a $1,000 investment in the Fund using the Fund’s actual return during the period. To estimate the expenses you paid over the period, simply divide your account value by $1,000 (for example, an $8,600 account value divided by $1,000 = 8.6), then multiply the result by the number in the “Expenses Paid per $1,000” line under the share class you hold. |
| — | Hypothetical 5% Fund Return. This helps you to compare your Fund’s ongoing expenses (but not transaction costs) with those of other mutual funds using the Fund’s actual expense ratio and a hypothetical rate of return of 5% per year before expenses. Examples using a 5% hypothetical Fund return may be found in the shareholder reports of other mutual funds. The hypothetical account values and expenses may not be used to estimate the actual ending account balance or expenses you paid for the period. |
Please note that the expenses shown in these tables are meant to highlight your ongoing expenses only and do not reflect any transaction costs. The “Expenses Paid per $1,000” line of the tables is useful in comparing ongoing expenses only and will not help you determine the relative total expense of owning different funds. If these transaction costs had been included, your costs would have been higher.
| | | | |
| Expenses and Value of a $1,000 Investment for the six months ended December 31, 2017 | | | |
| |
| Actual Fund Return | | | Class A | |
| Beginning Account Value 7/1/17 | | $ | 1,000.00 | |
| Ending Account Value 12/31/17 | | $ | 1,027.10 | |
| Expenses Paid per $1,000* | | $ | 3.37 | |
| |
| Hypothetical 5% Fund Return | | | Class A | |
| Beginning Account Value 7/1/17 | | $ | 1,000.00 | |
| Ending Account Value 12/31/17 | | $ | 1,021.88 | |
| Expenses Paid per $1,000* | | $ | 3.36 | |
| * | Expenses are equal to the Fund’s annualized expense ratio, multiplied by the average account value over the period, multiplied by 184 (the number of days in the most recent six-month period), then divided by 365. |
| | | | |
| Annualized Expense Ratio | | Class A | |
| Deutsche Variable Series II — Deutsche Multisector Income VIP | | | .66 | % |
For more information, please refer to the Fund’s prospectus.
These tables do not reflect charges and fees (“contract charges”) associated with the separate account that invests in the Fund or any variable life insurance policy or variable annuity contract for which the Fund is an investment option.
For an analysis of the fees associated with an investment in the fund or similar funds, please refer to the current and hypothetical expense calculators for Variable Insurance Products which can be found at deutschefunds.com/EN/resources/calculators.jsp.
| | | | | | |
| | 26 | | | | | | Deutsche Variable Series II — Deutsche Multisector Income VIP |
| | |
| Tax Information | | (Unaudited) |
Please consult a tax advisor if you have questions about federal or state income tax laws, or on how to prepare your tax returns. If you have specific questions about your account, please contact your insurance provider.
Proxy Voting
The Trust’s policies and procedures for voting proxies for portfolio securities and information about how the Trust voted proxies related to its portfolio securities during the most recent 12-month period ended June 30 are available on our Web site — deutschefunds.com (click on “proxy voting” at the bottom of the page) — or on the SEC’s Web site — sec.gov. To obtain a written copy of the Trust’s policies and procedures without charge, upon request, call us toll free at (800) 728-3337.
| | | | |
Deutsche Variable Series II — Deutsche Multisector Income VIP | | | | | 27 |
Advisory Agreement Board Considerations and Fee Evaluation
The Board of Trustees (hereinafter referred to as the “Board” or “Trustees”) approved the renewal of Deutsche Multisector Income VIP’s (formerly Deutsche Unconstrained Income VIP) (the “Fund”) investment management agreement (the “Agreement”) with Deutsche Investment Management Americas Inc. (“DIMA”) in September 2017. DIMA has also entered into a sub-advisory agreement with Deutsche Alternative Asset Management (Global) Limited (“DAAM Global”), an affiliate of DIMA, that has an initial term through September 30, 2018.
In terms of the process that the Board followed prior to approving the Agreement, shareholders should know that:
| – | | During the entire process, all of the Fund’s Trustees were independent of DIMA and its affiliates (the “Independent Trustees”). |
| – | | The Board met frequently during the past year to discuss fund matters and dedicated a substantial amount of time to contract review matters. Over the course of several months, the Board’s Contract Committee reviewed extensive materials received from DIMA, independent third parties and independent counsel. These materials included an analysis of the Fund’s performance, fees and expenses, and profitability from a fee consultant retained by the Fund’s Independent Trustees (the “Fee Consultant”). Based on its evaluation of the information provided, the Contract Committee presented its findings and recommendations to the Board. The Board then reviewed the Contract Committee’s findings and recommendations. |
| – | | The Board also received extensive information throughout the year regarding performance of the Fund. |
| – | | The Independent Trustees regularly met privately with counsel to discuss contract review and other matters. In addition, the Independent Trustees were advised by the Fee Consultant in the course of their review of the Fund’s contractual arrangements and considered a comprehensive report prepared by the Fee Consultant in connection with their deliberations. |
| – | | In connection with reviewing the Agreement, the Board also reviewed the terms of the Fund’s distribution agreement, administrative services agreement, transfer agency agreement and other material service agreements. |
In connection with the contract review process, the Contract Committee and the Board considered the factors discussed below, among others. The Board also considered that DIMA and its predecessors have managed the Fund since its inception, and the Board believes that a long-term relationship with a capable, conscientious advisor is in the best interests of the Fund. The Board considered, generally, that shareholders chose to invest or remain invested in the Fund knowing that DIMA managed the Fund, and that the Agreement was approved by the Fund’s shareholders. DIMA and DAAM Global are part of Deutsche Bank AG’s (“Deutsche Bank”) Asset Management (“Deutsche AM”) division. Deutsche AM is a global asset management business that offers a wide range of investing expertise and resources, including research capabilities in many countries throughout the world.
As part of the contract review process, the Board carefully considered the fees and expenses of each Deutsche fund overseen by the Board in light of the fund’s performance. In many cases, this led to the negotiation and implementation of expense caps. As part of these negotiations, the Board indicated that it would consider relaxing these caps in future years following sustained improvements in performance, among other considerations.
While shareholders may focus primarily on fund performance and fees, the Fund’s Board considers these and many other factors, including the quality and integrity of DIMA’s and DAAM Global’s personnel and administrative support services provided by DIMA, such as back-office operations, fund valuations, and compliance policies and procedures.
Nature, Quality and Extent of Services. The Board considered the terms of the Agreement, including the scope of advisory services provided under the Agreement. The Board noted that DIMA and DAAM Global provide portfolio management services to the Fund and that, pursuant to a separate administrative services agreement, DIMA provides administrative services to the Fund. The Board considered the experience and skills of senior management and investment personnel and the resources made available to such personnel. Throughout the course of the year, the Board also received information regarding DIMA’s oversight of fund sub-advisers, including DAAM Global. The Board reviewed the Fund’s performance over short-term and long-term periods and compared those returns to various agreed-upon performance measures, including market index(es) and a peer universe compiled using information supplied by Morningstar Direct (“Morningstar”), an
| | | | | | |
| | 28 | | | | | | Deutsche Variable Series II — Deutsche Multisector Income VIP |
independent fund data service. The Board also noted that it has put into place a process of identifying “Funds in Review” (e.g., funds performing poorly relative to a peer universe), and receives additional reporting from DIMA regarding such funds and, where appropriate, DIMA’s plans to address underperformance. The Board believes this process is an effective manner of identifying and addressing underperforming funds. Based on the information provided, the Board noted that, for the one-, three- and five-year periods ended December 31, 2016, the Fund’s performance (Class A shares) was in the 4th quartile of the applicable Morningstar universe (the 1st quartile being the best performers and the 4th quartile being the worst performers). The Board also observed that the Fund has underperformed its benchmark in the one-, three- and five-year periods ended December 31, 2016. The Board noted the disappointing investment performance of the Fund in recent periods and continued to discuss with senior management of DIMA and DAAM Global the factors contributing to such underperformance and actions being taken to improve performance. The Board noted certain changes in the Fund’s portfolio management team that were made effective August 1, 2017. The Board observed that the Fund had experienced improved relative performance during the first eight months of 2017. The Board recognized the efforts by DIMA in recent years to enhance its investment platform and improve long-term performance across the Deutsche fund complex.
Fees and Expenses. The Board considered the Fund’s investment management fee schedule, operating expenses and total expense ratios, and comparative information provided by Broadridge Financial Solutions, Inc. (“Broadridge”) and the Fee Consultant regarding investment management fee rates paid to other investment advisors by similar funds (1st quartile being the most favorable and 4th quartile being the least favorable). With respect to management fees paid to other investment advisors by similar funds, the Board noted that the contractual fee rates paid by the Fund, which include a 0.10% fee paid to DIMA under the Fund’s administrative services agreement, were higher than the median (3rd quartile) of the applicable Broadridge peer group (based on Broadridge data provided as of December 31, 2016). The Board noted that DIMA pays a sub-advisory fee to DAAM Global out of its fee. The Board noted that the Fund’s Class A shares total (net) operating expenses were expected to be lower than the median (2nd quartile) of the applicable Broadridge expense universe (based on Broadridge data provided as of December 31, 2016, and analyzing Broadridge expense universe Class A (net) expenses less any applicable 12b-1 fees) (“Broadridge Universe Expenses”). The Board noted that the expense limitation agreed to by DIMA was expected to help the Fund’s total (net) operating expenses remain competitive. The Board considered the Fund’s management fee rate as compared to fees charged by DIMA to comparable Deutsche U.S. registered funds (“Deutsche Funds”) and considered differences between the Fund and the comparable Deutsche Funds. The information requested by the Board as part of its review of fees and expenses also included information about institutional accounts (including any sub-advised funds and accounts) and funds offered primarily to European investors (“Deutsche Europe funds”) managed by Deutsche AM. The Board noted that DIMA indicated that Deutsche AM does not manage any institutional accounts or Deutsche Europe funds comparable to the Fund.
On the basis of the information provided, the Board concluded that management fees were reasonable and appropriate in light of the nature, quality and extent of services provided by DIMA and DAAM Global.
Profitability. The Board reviewed detailed information regarding revenues received by DIMA under the Agreement. The Board considered the estimated costs to DIMA, and pre-tax profits realized by DIMA, from advising the Deutsche Funds, as well as estimates of the pre-tax profits attributable to managing the Fund in particular. The Board also received information regarding the estimated enterprise-wide profitability of DIMA and its affiliates with respect to all fund services in totality and by fund. The Board and the Fee Consultant reviewed DIMA’s methodology in allocating its costs to the management of the Fund. Based on the information provided, the Board concluded that the pre-tax profits realized by DIMA in connection with the management of the Fund were not unreasonable. The Board also reviewed certain publicly available information regarding the profitability of certain similar investment management firms. The Board noted that, while information regarding the profitability of such firms is limited (and in some cases is not necessarily prepared on a comparable basis), DIMA and its affiliates’ overall profitability with respect to the Deutsche Funds (after taking into account distribution and other services provided to the funds by DIMA and its affiliates) was lower than the overall profitability levels of most comparable firms for which such data was available.
Economies of Scale. The Board considered whether there are economies of scale with respect to the management of the Fund and whether the Fund benefits from any economies of scale. The Board noted that the Fund’s investment management fee schedule includes fee breakpoints. The Board concluded that the Fund’s fee schedule represents an appropriate sharing between the Fund and DIMA of such economies of scale as may exist in the management of the Fund at current asset levels.
| | | | |
Deutsche Variable Series II — Deutsche Multisector Income VIP | | | | | 29 |
Other Benefits to DIMA and Its Affiliates. The Board also considered the character and amount of other incidental benefits received by DIMA and its affiliates, including any fees received by DIMA for administrative services provided to the Fund and any fees received by an affiliate of DIMA for transfer agency services provided to the Fund. The Board also considered benefits to DIMA related to brokerage and soft-dollar allocations, including allocating brokerage to pay for research generated by parties other than the executing broker dealers, which pertain primarily to funds investing in equity securities. In addition, the Board considered the incidental public relations benefits to DIMA related to Deutsche Funds advertising and cross-selling opportunities among DIMA products and services. The Board considered these benefits in reaching its conclusion that the Fund’s management fees were reasonable.
Compliance. The Board considered the significant attention and resources dedicated by DIMA to documenting and enhancing its compliance processes in recent years. The Board noted in particular (i) the experience, seniority and time commitment of the individuals serving as DIMA’s and the Fund’s chief compliance officers; (ii) the large number of DIMA compliance personnel; and (iii) the substantial commitment of resources by DIMA and its affiliates to compliance matters.
Based on all of the information considered and the conclusions reached, the Board unanimously determined that the continuation of the Agreement is in the best interests of the Fund. In making this determination, the Board did not give particular weight to any single factor identified above. The Board considered these factors over the course of numerous meetings, certain of which were in executive session with only the Independent Trustees and counsel present. It is possible that individual Independent Trustees may have weighed these factors differently in reaching their individual decisions to approve the continuation of the Agreement.
| | | | | | |
| | 30 | | | | | | Deutsche Variable Series II — Deutsche Multisector Income VIP |
Board Members and Officers
The following table presents certain information regarding the Board Members and Officers of the Fund. Each Board Member’s year of birth is set forth in parentheses after his or her name. Unless otherwise noted, (i) each Board Member has engaged in the principal occupation(s) noted in the table for at least the most recent five years, although not necessarily in the same capacity; and (ii) the address of each Independent Board Member is c/o Keith R. Fox, Deutsche Funds Board Chair, c/o Thomas R. Hiller, Ropes & Gray LLP, Prudential Tower, 800 Boylston Street, Boston, MA 02199-3600. Except as otherwise noted below, the term of office for each Board Member is until the election and qualification of a successor, or until such Board Member sooner dies, resigns, is removed or as otherwise provided in the governing documents of the Fund. Because the Fund does not hold an annual meeting of shareholders, each Board Member will hold office for an indeterminate period. The Board Members may also serve in similar capacities with other funds in the fund complex.
| | | | | | | | |
| Independent Board Members | | | | | | | |
Name, Year of Birth,
Position with the Fund and
Length of Time Served1 | | Business Experience and Directorships During the Past Five Years | | Number of
Funds in
Deutsche
Fund
Complex
Overseen | | | Other
Directorships
Held by Board
Member |
Keith R. Fox, CFA (1954) Chairperson since 2017, and Board Member since 1996 | | Managing General Partner, Exeter Capital Partners (a series of private investment funds) (since 1986). Directorships: Progressive International Corporation (kitchen goods importer and distributor); The Kennel Shop (retailer); former Chairman, National Association of Small Business Investment Companies; former Directorships: BoxTop Media Inc. (advertising); Sun Capital Advisers Trust (mutual funds) (2011–2012) | | | 89 | | | — |
Kenneth C. Froewiss (1945) Vice Chairperson since 2017, and Board Member since 2001 | | Retired Clinical Professor of Finance, NYU Stern School of Business (1997–2014); Member, Finance Committee, Association for Asian Studies (2002–present); Director, Mitsui Sumitomo Insurance Group (US) (2004–present); prior thereto, Managing Director, J.P. Morgan (investment banking firm) (until 1996) | | | 92 | | | — |
John W. Ballantine (1946) Board Member since 1999 | | Retired; formerly, Executive Vice President and Chief Risk Management Officer, First Chicago NBD Corporation/The First National Bank of Chicago (1996–1998); Executive Vice President and Head of International Banking (1995–1996); former Directorships: Director and former Chairman of the Board, Healthways, Inc.2 (population well-being and wellness services) (2003–2014); Stockwell Capital Investments PLC (private equity); Enron Corporation; FNB Corporation; Tokheim Corporation; First Oak Brook Bancshares, Inc. and Oak Brook Bank; Prisma Energy International. Not-for-Profit Director, Trustee: Palm Beach Civic Association; Public Radio International; Window to the World Communications (public media); Harris Theater for Music and Dance (Chicago) | | | 89 | | | Portland
General
Electric2
(utility
company)
(2003–
present) |
Henry P. Becton, Jr. (1943) Board Member since 1990 | | Vice Chair and former President, WGBH Educational Foundation. Directorships: Public Radio International; Public Radio Exchange (PRX); The Pew Charitable Trusts (charitable organization); former Directorships: Becton Dickinson and Company2 (medical technology company); Belo Corporation2 (media company); The PBS Foundation; Association of Public Television Stations; Boston Museum of Science; American Public Television; Concord Academy; New England Aquarium; Mass. Corporation for Educational Telecommunications; Committee for Economic Development; Public Broadcasting Service; Connecticut College; North Bennett Street School (Boston) | | | 89 | | | — |
Dawn-Marie Driscoll (1946) Board Member since 1987 | | Emeritus Executive Fellow, Center for Business Ethics, Bentley University; formerly: President, Driscoll Associates (consulting firm); Partner, Palmer & Dodge (law firm) (1988–1990); Vice President of Corporate Affairs and General Counsel, Filene’s (retail) (1978–1988). Directorships: Advisory Board, Center for Business Ethics, Bentley University; Trustee and former Chairman of the Board, Southwest Florida Community Foundation (charitable organization); former Directorships: ICI Mutual Insurance Company (2007–2015); Sun Capital Advisers Trust (mutual funds) (2007–2012), Investment Company Institute (audit, executive, nominating committees) and Independent Directors Council (governance, executive committees) | | | 89 | | | — |
| | | | |
Deutsche Variable Series II — Deutsche Multisector Income VIP | | | | | 31 |
| | | | | | | | |
Name, Year of Birth,
Position with the Fund and
Length of Time Served1 | | Business Experience and Directorships During the Past Five Years | | Number of
Funds in
Deutsche
Fund
Complex
Overseen | | | Other
Directorships
Held by Board
Member |
Paul K. Freeman (1950) Board Member since 1993 | | Consultant, World Bank/Inter-American Development Bank; Independent Directors Council (former chair); Investment Company Institute (executive and nominating committees); formerly: Chairman of Education Committee of Independent Directors Council; Project Leader, International Institute for Applied Systems Analysis (1998–2001); Chief Executive Officer, The Eric Group, Inc. (environmental insurance) (1986–1998); Directorships: Denver Zoo Foundation (December 2012–present); Knoebel Institute for Healthy Aging, University of Denver (2017–present); former Directorships: Prisma Energy International | | | 89 | | | — |
Richard J. Herring (1946) Board Member since 1990 | | Jacob Safra Professor of International Banking and Professor, Finance Department, The Wharton School, University of Pennsylvania (since July 1972); Co-Director, Wharton Financial Institutions Center; formerly: Vice Dean and Director, Wharton Undergraduate Division (July 1995–June 2000); Director, Lauder Institute of International Management Studies (July 2000–June 2006) | | | 89 | | | Director,
Aberdeen
Singapore
and Japan
Funds (since
2007);
Independent
Director of
Barclays
Bank
Delaware
(since
September
2010) |
William McClayton (1944) Board Member since 2004 | | Private equity investor (since October 2009); previously, Managing Director, Diamond Management & Technology Consultants, Inc. (global consulting firm) (2001–2009); Directorship: Board of Managers, YMCA of Metropolitan Chicago; formerly: Senior Partner, Arthur Andersen LLP (accounting) (1966–2001); Trustee, Ravinia Festival | | | 89 | | | — |
Rebecca W. Rimel (1951) Board Member since 1995 | | President, Chief Executive Officer and Director, The Pew Charitable Trusts (charitable organization) (1994–present); formerly: Executive Vice President, The Glenmede Trust Company (investment trust and wealth management) (1983–2004); Board Member, Investor Education (charitable organization) (2004–2005); Trustee, Executive Committee, Philadelphia Chamber of Commerce (2001–2007); Director, Viasys Health Care2 (January 2007–June 2007); Trustee, Thomas Jefferson Foundation (charitable organization) (1994–2012) | | | 89 | | | Director,
Becton
Dickinson
and
Company2
(medical
technology
company)
(2012–
present);
Director,
BioTelemetry
Inc2 (health
care) (2009–
present) |
William N. Searcy, Jr. (1946) Board Member since 1993 | | Private investor since October 2003; formerly: Pension & Savings Trust Officer, Sprint Corporation2 (telecommunications) (November 1989–September 2003); Trustee, Sun Capital Advisers Trust (mutual funds) (1998–2012) | | | 89 | | | — |
Jean Gleason Stromberg (1943) Board Member since 1997 | | Retired. Formerly, Consultant (1997–2001); Director, Financial Markets U.S. Government Accountability Office (1996–1997); Partner, Norton Rose Fulbright, L.L.P. (law firm) (1978–1996); former Directorships: The William and Flora Hewlett Foundation (charitable organization) (2000–2015); Service Source, Inc. (nonprofit), Mutual Fund Directors Forum (2002–2004), American Bar Retirement Association (funding vehicle for retirement plans) (1987–1990 and 1994–1996) | | | 89 | | | — |
| | | | | | |
| | 32 | | | | | | Deutsche Variable Series II — Deutsche Multisector Income VIP |
| | |
| Officers4 | | |
Name, Year of Birth,
Position with the Fund and
Length of Time Served5 | | Business Experience and Directorships During the Past Five Years |
Hepsen Uzcan6,9 (1974) President and Chief Executive Officer, 2017–present Assistant Secretary, 2013–present | | Director,3 Deutsche Asset Management; formerly: Vice President for the Deutsche funds (2016–2017) |
John Millette8 (1962) Vice President and Secretary, 1999–present | | Director,3 Deutsche Asset Management; Chief Legal Officer, Deutsche Investment Management Americas Inc. (2015–present); and Director and Vice President, Deutsche AM Trust Company (since 2016); formerly: Secretary, Deutsche Investment Management Americas Inc. (2015–2017) |
Paul H. Schubert6 (1963) Chief Financial Officer, 2004–present Treasurer, 2005–present | | Managing Director,3 Deutsche Asset Management, and Chairman, Director and President, Deutsche AM Trust Company (since 2013); Vice President, Deutsche AM Distributors, Inc. (since 2016); Director, Deutsche AM Service Company (since 2017); Director and President, DB Investment Managers, Inc. (since 2017); formerly: Director, Deutsche AM Trust Company (2004–2013) |
Caroline Pearson8 (1962) Chief Legal Officer, 2010–present | | Managing Director,3 Deutsche Asset Management; formerly: Secretary, Deutsche AM Distributors, Inc.; and Secretary, Deutsche AM Service Company |
Scott D. Hogan8 (1970) Chief Compliance Officer, 2016–present | | Director,3 Deutsche Asset Management |
Wayne Salit7 (1967) Anti-Money Laundering Compliance Officer, 2014–present | | Director,3 Deutsche Asset Management; formerly: Managing Director, AML Compliance Officer at BNY Mellon (2011–2014); and Director, AML Compliance Officer at Deutsche Bank (2004–2011) |
Sheila Cadogan8 (1966) Assistant Treasurer, since July 12, 2017 | | Director,3 Deutsche Asset Management |
Paul Antosca8 (1957) Assistant Treasurer, 2007–present | | Director,3 Deutsche Asset Management |
Diane Kenneally8 (1966) Assistant Treasurer, 2007–present | | Director,3 Deutsche Asset Management |
| 1 | The length of time served represents the year in which the Board Member joined the board of one or more Deutsche funds currently overseen by the Board. |
| 2 | A publicly held company with securities registered pursuant to Section 12 of the Securities Exchange Act of 1934. |
| 3 | Executive title, not a board directorship. |
| 4 | As a result of their respective positions held with the Advisor, these individuals are considered “interested persons” of the Advisor within the meaning of the 1940 Act. Interested persons receive no compensation from the Fund. |
| 5 | The length of time served represents the year in which the officer was first elected in such capacity for one or more Deutsche funds. |
| 6 | Address: 345 Park Avenue, New York, NY 10154. |
| 7 | Address: 60 Wall Street, New York, NY 10005. |
| 8 | Address: One International Place, Boston, MA 02110. |
| 9 | Appointed President and Chief Executive Officer effective December 1, 2017. |
The Fund’s Statement of Additional Information (“SAI”) includes additional information about the Board Members. The SAI is available, without charge, upon request. If you would like to request a copy of the SAI, you may do so by calling the following toll-free number: (800) 728-3337.
| | | | |
Deutsche Variable Series II — Deutsche Multisector Income VIP | | | | | 33 |
| | |
 | | |
VS2MSI-2 (R-025836-7 2/18) | | |

December 31, 2017
Annual Report
Deutsche Variable Series II
Deutsche Small Mid Cap Growth VIP

Contents
This report must be preceded or accompanied by a prospectus. To obtain an additional prospectus or summary prospectus, if available, call (800) 728-3337 or your financial representative. We advise you to consider the Fund’s objectives, risks, charges and expenses carefully before investing. The summary prospectus and prospectus contain this and other important information about the Fund. Please read the prospectus carefully before you invest.
Stocks may decline in value. Smaller and medium company stocks tend to be more volatile than large company stocks. Investing in derivatives entails special risks relating to liquidity, leverage and credit that may reduce returns and/or increase volatility. The Fund may lend securities to approved institutions. Please read the prospectus for details.
Deutsche Asset Management represents the asset management activities conducted by Deutsche Bank AG or any of its subsidiaries.
Deutsche AM Distributors, Inc., 222 South Riverside Plaza, Chicago, IL 60606, (800) 621-1148
NOT FDIC/NCUA INSURED NO BANK GUARANTEE MAY LOSE VALUE NOT A DEPOSIT
NOT INSURED BY ANY FEDERAL GOVERNMENT AGENCY
| | | | | | |
| | 2 | | | | | | Deutsche Variable Series II — Deutsche Small Mid Cap Growth VIP |
| | |
| Performance Summary | | December 31, 2017 (Unaudited) |
Fund performance shown is historical, assumes reinvestment of all dividend and capital gain distributions and does not guarantee future results. Investment return and principal value fluctuate with changing market conditions so that, when redeemed, shares may be worth more or less than their original cost. Current performance may be lower or higher than the performance data quoted. Please contact your participating insurance company for the Fund’s most recent month-end performance. Performance doesn’t reflect charges and fees (“contract charges”) associated with the separate account that invests in the Fund or any variable life insurance policy or variable annuity contract for which the Fund is an investment option. These charges and fees will reduce returns.
The gross expense ratio of the Fund, as stated in the fee table of the prospectus dated May 1, 2017 is 0.75% for Class A shares and may differ from the expense ratio disclosed in the Financial Highlights table in this report.
Generally accepted accounting principles require adjustments to be made to the net assets of the Fund at period end for financial reporting purposes only, and as such, the total return based on the unadjusted net asset value per share may differ from the total return reported in the financial highlights.
Growth of an Assumed $10,000 Investment in Deutsche Small Mid Cap Growth VIP
| | |
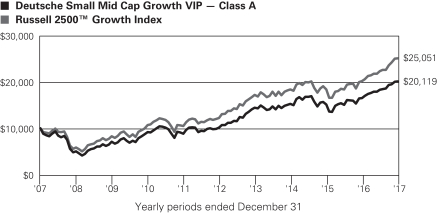 | | The Russell 2500TM Growth Index is an unmanaged index that measures the performance of the small- to mid-cap growth segment of the U.S. equity universe. It includes those Russell 2500 companies with higher price-to-book ratios and higher forecasted growth values. Index returns do not reflect any fees or expenses and it is not possible to invest directly into an index. |
| | | | | | | | | | |
| Comparative Results | | | | | | | | | | |
| | | | |
| Deutsche Small Mid Cap Growth VIP | | 1-Year | | 3-Year | | 5-Year | | 10-Year |
| Class A | | Growth of $10,000 | | $12,212 | | $13,201 | | $19,922 | | $20,119 |
| | | Average annual total return | | 22.12% | | 9.70% | | 14.78% | | 7.24% |
| Russell 2500 Growth Index | | Growth of $10,000 | | $12,446 | | $13,631 | | $20,524 | | $25,051 |
| | | Average annual total return | | 24.46% | | 10.88% | | 15.47% | | 9.62% |
The growth of $10,000 is cumulative.
| | | | |
Deutsche Variable Series II — Deutsche Small Mid Cap Growth VIP | | | | | 3 |
| | |
| Management Summary | | December 31, 2017 (Unaudited) |
For the 12-month period ended December 31, 2017, the Fund returned 22.12% (Class A shares, unadjusted for contract charges), compared with the 24.46% return of the Russell 2500™ Growth Index.
In 2017, financial markets performed well in the face of a number of difficult issues, including political volatility in Washington, Brexit negotiations and increased tensions with North Korea. Investors focused instead on steady economic growth, earnings increases and the eventual overhaul of the U.S. tax code. Oil prices slumped during the early summer on concerns regarding possible oversupply. However, the concerns were alleviated later in the year based in part on OPEC’s agreement for extended production cuts. Over the course of the period, stocks benefited from sustained growth and firming inflation. In addition, market sectors that had outperformed earlier in the year began to see weakness, and sectors that had lagged recovered as the momentum/growth trade turned to value and quality.
The portfolio’s underperformance was due primarily to unfavorable sector allocation, based on overweights in energy earlier in the year coupled with weak stock selection in financials and materials. This was offset by strong stock selection in energy, health care, real estate and information technology. Cognex Corp. and IPG Photonics Corp. were the top individual contributors for the year, while Cardtronics PLC* and Medicines Co.* were the largest individual detractors. Cognex, which manufactures machine vision systems, outperformed due to better than expected earnings results throughout the year. IPG Photonics, a manufacturer of laser systems for materials processing, was helped by consistent increases in its earnings forecasts. Cardtronics, a leading provider of non-bank ATMs, underperformed as the company faced the unexpected removal of interchange fees by major Australian banks. Medicines Co., a biopharmaceutical firm focused on cardiovascular and infectious diseases, underperformed as investors were disappointed at the results of a strategic review of the firm. The Fund sold Cardtronics and Medicines Co.
We continue to position the Fund for sustained economic recovery and remain focused on our bottom-up stock selection process. We maintain a long-term perspective, investing in quality small- and mid-cap growth stocks that trade at attractive valuations and are likely to benefit from a strong merger and acquisition cycle. Historically, in periods of accelerating GDP growth and increasing inflation, small-cap stocks have outperformed their larger-cap peers.
Joseph Axtell, CFA, Managing Director
Peter Barsa, Director
Michael A. Sesser, CFA, Vice President
Portfolio Managers
Prior to May 30, 2017, the portfolio management team was as follows:
Joseph Axtell, CFA, Managing Director
Rafaelina M. Lee, Managing Director
Portfolio Managers
The views expressed reflect those of the portfolio management team only through the end of the period of the report as stated on the cover. The management team’s views are subject to change at any time based on market and other conditions and should not be construed as a recommendation. Past performance is no guarantee of future results. Current and future portfolio holdings are subject to risk.
Terms to Know
The Russell 2500 Growth Index is an unmanaged, capitalization-weighted measure of the performance of the small- to mid-cap growth segment of the U.S. equity universe. It includes Russell 2500™ Index companies with higher price-to-book ratios and higher forecasted growth values. Index returns do not reflect fees or expenses and it is not possible to invest directly in an index.
“Overweight” means that the Fund holds a higher weighting in a given sector or security than the benchmark. “Underweight” means that the Fund holds a lower weighting.
| * | Not held in the portfolio as of December 31, 2017. |
| | | | | | |
| | 4 | | | | | | Deutsche Variable Series II — Deutsche Small Mid Cap Growth VIP |
| | |
| Portfolio Summary | | (Unaudited) |
| | | | | | | | |
| Asset Allocation (As a % of Investment Portfolio excluding Securities Lending Collateral) | | 12/31/17 | | | 12/31/16 | |
| Common Stocks | | | 97% | | | | 97% | |
| Cash Equivalents | | | 2% | | | | 3% | |
| Convertible Preferred Stock | | | 1% | | | | 0% | |
| | | | 100% | | | | 100% | |
Sector Diversification
(As a % of Investment Portfolio excluding Cash Equivalents and Securities Lending Collateral) | | 12/31/17 | | | 12/31/16 | |
| Information Technology | | | 23% | | | | 20% | |
| Health Care | | | 21% | | | | 18% | |
| Industrials | | | 19% | | | | 20% | |
| Consumer Discretionary | | | 15% | | | | 20% | |
| Materials | | | 7% | | | | 7% | |
| Financials | | | 6% | | | | 7% | |
| Consumer Staples | | | 4% | | | | 4% | |
| Real Estate | | | 3% | | | | 1% | |
| Energy | | | 2% | | | | 3% | |
| | | | 100% | | | | 100% | |
Portfolio holdings and characteristics are subject to change.
For more complete details about the Fund’s investment portfolio, see page 6.
Following the Fund’s fiscal first and third quarter-end, a complete portfolio holdings listing is filed with the SEC on Form N-Q. The form will be available on the SEC’s Web site at sec.gov, and it also may be reviewed and copied at the SEC’s Public Reference Room in Washington, D.C. Information on the operation of the SEC’s Public Reference Room may be obtained by calling (800) SEC-0330. The Fund’s portfolio holdings are also posted on deutschefunds.com from time to time. Please see the Fund’s current prospectus for more information.
| | | | |
Deutsche Variable Series II — Deutsche Small Mid Cap Growth VIP | | | | | 5 |
| | |
| Investment Portfolio | | as of December 31, 2017 |
| | | | | | | | |
| | | Shares | | | Value ($) | |
| Common Stocks 97.3% | |
| Consumer Discretionary 15.0% | |
Auto Components 2.1% | | | | | | | | |
Gentherm, Inc.* | | | 22,804 | | | | 724,027 | |
Tenneco, Inc. | | | 14,844 | | | | 868,968 | |
| | | | | | | | |
| | | | | | | 1,592,995 | |
|
Diversified Consumer Services 2.2% | |
Bright Horizons Family Solutions, Inc.* | | | 10,132 | | | | 952,408 | |
ServiceMaster Global Holdings, Inc.* | | | 13,978 | | | | 716,652 | |
| | | | | | | | |
| | | | | | | 1,669,060 | |
|
Hotels, Restaurants & Leisure 2.1% | |
Hilton Grand Vacations, Inc.* | | | 15,442 | | | | 647,792 | |
Jack in the Box, Inc. | | | 10,099 | | | | 990,813 | |
| | | | | | | | |
| | | | | | | 1,638,605 | |
| | |
Household Durables 2.3% | | | | | | | | |
Helen of Troy Ltd.* | | | 7,668 | | | | 738,812 | |
iRobot Corp.* (a) | | | 13,414 | | | | 1,028,854 | |
| | | | | | | | |
| | | | | | | 1,767,666 | |
| | |
Media 0.7% | | | | | | | | |
Cinemark Holdings, Inc. | | | 15,719 | | | | 547,335 | |
| | |
Specialty Retail 4.0% | | | | | | | | |
Burlington Stores, Inc.* | | | 11,449 | | | | 1,408,570 | |
The Children’s Place, Inc. | | | 8,248 | | | | 1,198,847 | |
Ulta Salon, Cosmetics & Fragrance, Inc.* | | | 2,361 | | | | 528,061 | |
| | | | | | | | |
| | | | | | | 3,135,478 | |
|
Textiles, Apparel & Luxury Goods 1.6% | |
Carter’s, Inc. | | | 6,302 | | | | 740,422 | |
Hanesbrands, Inc. (a) | | | 22,866 | | | | 478,128 | |
| | | | | | | | |
| | | | | | | 1,218,550 | |
|
| Consumer Staples 3.3% | |
Food & Staples Retailing 0.9% | | | | | | | | |
Casey’s General Stores, Inc. | | | 6,150 | | | | 688,431 | |
| | |
Food Products 1.3% | | | | | | | | |
Hain Celestial Group, Inc.* | | | 16,391 | | | | 694,815 | |
SunOpta, Inc.* | | | 44,516 | | | | 344,999 | |
| | | | | | | | |
| | | | | | | 1,039,814 | |
| | |
Household Products 1.1% | | | | | | | | |
Spectrum Brands Holdings, Inc. | | | 7,393 | | | | 830,973 | |
|
| Energy 2.3% | |
Energy Equipment & Services 1.9% | |
Dril-Quip, Inc.* | | | 16,509 | | | | 787,479 | |
Oil States International, Inc.* | | | 23,188 | | | | 656,221 | |
| | | | | | | | |
| | | | | | | 1,443,700 | |
|
Oil, Gas & Consumable Fuels 0.4% | |
Diamondback Energy, Inc.* | | | 2,809 | | | | 354,636 | |
| | |
| Financials 5.8% | | | | | | | | |
Banks 3.9% | | | | | | | | |
FCB Financial Holdings, Inc. “A”* | | | 15,144 | | | | 769,315 | |
Pinnacle Financial Partners, Inc. | | | 10,105 | | | | 669,962 | |
South State Corp. | | | 8,497 | | | | 740,514 | |
SVB Financial Group* | | | 3,490 | | | | 815,857 | |
| | | | | | | | |
| | | | | | | 2,995,648 | |
| | | | | | | | |
| | | Shares | | | Value ($) | |
Capital Markets 1.9% | | | | | | | | |
Lazard Ltd. “A” | | | 14,525 | | | | 762,562 | |
Moelis & Co. “A” | | | 15,610 | | | | 757,085 | |
| | | | | | | | |
| | | | | | | 1,519,647 | |
| | |
| Health Care 20.1% | | | | | | | | |
Biotechnology 9.7% | | | | | | | | |
Acceleron Pharma, Inc.* | | | 17,115 | | | | 726,361 | |
Alkermes PLC* | | | 12,591 | | | | 689,105 | |
Amicus Therapeutics, Inc.* | | | 19,754 | | | | 284,260 | |
Arena Pharmaceuticals, Inc.* | | | 6,443 | | | | 218,869 | |
Bluebird Bio, Inc.* | | | 3,054 | | | | 543,917 | |
Clovis Oncology, Inc.* | | | 3,126 | | | | 212,568 | |
Emergent Biosolutions, Inc.* | | | 14,518 | | | | 674,651 | |
Heron Therapeutics, Inc.* (a) | | | 44,567 | | | | 806,663 | |
Ligand Pharmaceuticals, Inc.* (a) | | | 9,659 | | | | 1,322,607 | |
Neurocrine Biosciences, Inc.* | | | 10,796 | | | | 837,662 | |
Retrophin, Inc.* | | | 51,813 | | | | 1,091,700 | |
TESARO, Inc.* | | | 1,300 | | | | 107,731 | |
| | | | | | | | |
| | | | | | | 7,516,094 | |
|
Health Care Equipment & Supplies 0.7% | |
Cardiovascular Systems, Inc.* | | | 22,867 | | | | 541,719 | |
|
Health Care Providers & Services 6.7% | |
BioScrip, Inc.* | | | 401,165 | | | | 1,167,390 | |
Centene Corp.* | | | 3,810 | | | | 384,353 | |
Molina Healthcare, Inc.* | | | 20,857 | | | | 1,599,315 | |
Providence Service Corp.* | | | 16,969 | | | | 1,006,940 | |
RadNet, Inc.* | | | 58,745 | | | | 593,324 | |
Tivity Health, Inc.* | | | 11,432 | | | | 417,840 | |
| | | | | | | | |
| | | | | | | 5,169,162 | |
| | |
Health Care Technology 1.0% | | | | | | | | |
athenahealth, Inc.* | | | 3,075 | | | | 409,098 | |
HMS Holdings Corp.* | | | 22,512 | | | | 381,579 | |
| | | | | | | | |
| | | | | | | 790,677 | |
| | |
Pharmaceuticals 2.0% | | | | | | | | |
Avadel Pharmaceuticals PLC (ADR)* | | | 58,167 | | | | 476,970 | |
Pacira Pharmaceuticals, Inc.* | | | 22,119 | | | | 1,009,732 | |
| | | | | | | | |
| | | | | | | 1,486,702 | |
| | |
| Industrials 18.5% | | | | | | | | |
Aerospace & Defense 1.2% | | | | | | | | |
HEICO Corp. | | | 9,954 | | | | 939,160 | |
| | |
Airlines 1.1% | | | | | | | | |
JetBlue Airways Corp.* | | | 37,786 | | | | 844,139 | |
| | |
Building Products 3.3% | | | | | | | | |
A.O. Smith Corp. | | | 16,215 | | | | 993,655 | |
Allegion PLC | | | 9,100 | | | | 723,996 | |
Fortune Brands Home & Security, Inc. | | | 12,443 | | | | 851,599 | |
| | | | | | | | |
| | | | | | | 2,569,250 | |
|
Commercial Services & Supplies 2.1% | |
Advanced Disposal Services, Inc.* | | | 39,685 | | | | 950,059 | |
UniFirst Corp. | | | 3,890 | | | | 641,461 | |
| | | | | | | | |
| | | | | | | 1,591,520 | |
The accompanying notes are an integral part of the financial statements.
| | | | | | |
| | 6 | | | | | | Deutsche Variable Series II — Deutsche Small Mid Cap Growth VIP |
| | | | | | | | |
| | | Shares | | | Value ($) | |
Construction & Engineering 0.5% | |
Primoris Services Corp. | | | 13,972 | | | | 379,899 | |
| | |
Electrical Equipment 1.3% | | | | | | | | |
Thermon Group Holdings, Inc.* | | | 41,624 | | | | 985,240 | |
| | |
Machinery 6.7% | | | | | | | | |
IDEX Corp. | | | 8,695 | | | | 1,147,479 | |
Kennametal, Inc. | | | 22,978 | | | | 1,112,365 | |
WABCO Holdings, Inc.* | | | 10,763 | | | | 1,544,490 | |
Welbilt, Inc.* | | | 59,629 | | | | 1,401,878 | |
| | | | | | | | |
| | | | | | | 5,206,212 | |
|
Trading Companies & Distributors 2.3% | |
Rush Enterprises, Inc. “A”* | | | 35,301 | | | | 1,793,644 | |
|
| Information Technology 22.8% | |
Electronic Equipment, Instruments & Components 5.2% | |
Belden, Inc. | | | 11,502 | | | | 887,609 | |
Cognex Corp. | | | 17,784 | | | | 1,087,669 | |
IPG Photonics Corp.* | | | 8,243 | | | | 1,765,074 | |
Knowles Corp.* | | | 19,535 | | | | 286,383 | |
| | | | | | | | |
| | | | | | | 4,026,735 | |
|
Internet Software & Services 2.6% | |
CoStar Group, Inc.* | | | 4,948 | | | | 1,469,309 | |
Five9, Inc.* | | | 20,949 | | | | 521,211 | |
| | | | | | | | |
| | | | | | | 1,990,520 | |
| | |
IT Services 4.9% | | | | | | | | |
Broadridge Financial Solutions, Inc. | | | 16,136 | | | | 1,461,599 | |
Euronet Worldwide, Inc.* | | | 3,300 | | | | 278,091 | |
MAXIMUS, Inc. | | | 9,060 | | | | 648,515 | |
WEX, Inc.* | | | 4,517 | | | | 637,936 | |
WNS Holdings Ltd. (ADR)* | | | 19,111 | | | | 766,924 | |
| | | | | | | | |
| | | | | | | 3,793,065 | |
|
Semiconductors & Semiconductor Equipment 3.4% | |
Advanced Energy Industries, Inc.* | | | 19,780 | | | | 1,334,755 | |
Advanced Micro Devices, Inc.* (a) | | | 22,933 | | | | 235,751 | |
Ambarella, Inc.* | | | 5,149 | | | | 302,504 | |
Cypress Semiconductor Corp. | | | 50,093 | | | | 763,417 | |
| | | | | | | | |
| | | | | | | 2,636,427 | |
| | |
Software 6.2% | | | | | | | | |
Aspen Technology, Inc.* | | | 19,088 | | | | 1,263,626 | |
Proofpoint, Inc.* | | | 8,009 | | | | 711,279 | |
QAD, Inc. “A” | | | 7,196 | | | | 279,565 | |
Take-Two Interactive Software, Inc.* | | | 2,302 | | | | 252,713 | |
Tyler Technologies, Inc.* | | | 7,927 | | | | 1,403,475 | |
Varonis Systems, Inc.* | | | 17,800 | | | | 864,190 | |
| | | | | | | | |
| | | | | | | 4,774,848 | |
|
Technology Hardware, Storage & Peripherals 0.5% | |
Super Micro Computer, Inc.* | | | 20,606 | | | | 431,181 | |
| | | | | | | | |
| | | Shares | | | Value ($) | |
| Materials 6.9% | | | | | | | | |
Chemicals 4.3% | | | | | | | | |
Huntsman Corp. | | | 12,575 | | | | 418,622 | |
KMG Chemicals, Inc. | | | 16,579 | | | | 1,095,540 | |
Minerals Technologies, Inc. | | | 13,266 | | | | 913,364 | |
Trinseo SA | | | 12,784 | | | | 928,119 | |
| | | | | | | | |
| | | | | | | 3,355,645 | |
| | |
Construction Materials 1.5% | | | | | | | | |
Eagle Materials, Inc. | | | 10,034 | | | | 1,136,852 | |
| | |
Containers & Packaging 1.1% | | | | | | | | |
Berry Global Group, Inc.* | | | 13,757 | | | | 807,123 | |
| | |
| Real Estate 2.6% | | | | | | | | |
Equity Real Estate Investment Trusts (REITs) | |
National Storage Affiliates Trust | | | 36,400 | | | | 992,264 | |
SBA Communications Corp. * | | | 2,141 | | | | 349,754 | |
Urban Edge Properties | | | 27,384 | | | | 698,018 | |
| | | | | | | | |
| | | | | | | | 2,040,036 | |
Total Common Stocks (Cost $47,515,365) | | | | | | | 75,248,388 | |
|
| Convertible Preferred Stock 0.6% | |
| Health Care | | | | | | | | |
Providence Service Corp., 5.5% (b) (Cost $283,300) | | | 2,833 | | | | 421,540 | |
|
| Securities Lending Collateral 5.1% | |
Deutsche Government & Agency Securities Portfolio “Deutsche Government Cash Institutional Shares”, 1.21% (c) (d) (Cost $3,961,099) | | | 3,961,099 | | | | 3,961,099 | |
| | |
| Cash Equivalents 2.3% | | | | | | | | |
Deutsche Central Cash Management Government Fund, 1.30% (c) (Cost $1,762,858) | | | 1,762,858 | | | | 1,762,858 | |
| | |
| | | % of Net
Assets | | | Value ($) | |
Total Investment Portfolio (Cost $53,522,622) | | | 105.2 | | | | 81,393,885 | |
| Other Assets and Liabilities, Net | | | (5.2 | ) | | | (4,050,359 | ) |
| Net Assets | | | 100.0 | | | | 77,343,526 | |
| * | Non-income producing security. |
| (a) | All or a portion of these securities were on loan. In addition, “Other Assets and Liabilities, Net” may include pending sales that are also on loan. The value of securities loaned at December 31, 2017 amounted to $3,796,401, which is 4.9% of net assets. |
| (b) | Investment was valued using significant unobservable inputs. |
| (c) | Affiliated fund managed by Deutsche Investment Management Americas Inc. The rate shown is the annualized seven-day yield at period end. |
| (d) | Represents collateral held in connection with securities lending. Income earned by the Fund is net of borrower rebates. |
ADR: American Depositary Receipt
The accompanying notes are an integral part of the financial statements.
| | | | |
Deutsche Variable Series II — Deutsche Small Mid Cap Growth VIP | | | | | 7 |
Fair Value Measurements
Various inputs are used in determining the value of the Fund’s investments. These inputs are summarized in three broad levels. Level 1 includes quoted prices in active markets for identical securities. Level 2 includes other significant observable inputs (including quoted prices for similar securities, interest rates, prepayment speeds and credit risk). Level 3 includes significant unobservable inputs (including the Fund’s own assumptions in determining the fair value of investments). The level assigned to the securities valuations may not be an indication of the risk or liquidity associated with investing in those securities.
The following is a summary of the inputs used as of December 31, 2017 in valuing the Fund’s investments. For information on the Fund’s policy regarding the valuation of investments, please refer to the Security Valuation section of Note A in the accompanying Notes to Financial Statements.
| | | | | | | | | | | | | | | | |
| Assets | | Level 1 | | | Level 2 | | | Level 3 | | | Total | |
| Common Stocks (e) | | $ | 75,248,388 | | | $ | — | | | $ | — | | | $ | 75,248,388 | |
| Convertible Preferred Stock | | | — | | | | — | | | | 421,540 | | | | 421,540 | |
| Short-Term Investments (e) | | | 5,723,957 | | | | — | | | | — | | | | 5,723,957 | |
| Total | | $ | 80,972,345 | | | $ | — | | | $ | 421,540 | | | $ | 81,393,885 | |
There have been no transfers between fair value measurement levels during the year ended December 31, 2017.
| (e) | See Investment Portfolio for additional detailed categorizations. |
The accompanying notes are an integral part of the financial statements.
| | | | | | |
| | 8 | | | | | | Deutsche Variable Series II — Deutsche Small Mid Cap Growth VIP |
Statement of Assets and Liabilities
| | | | |
| as of December 31, 2017 | | | | |
| |
| Assets | | | | |
| Investments in non-affiliated securities, at value (cost $47,798,665) — including $3,796,401 of securities loaned | | $ | 75,669,928 | |
| Investment in Deutsche Government & Agency Securities Portfolio (cost $3,961,099)* | | | 3,961,099 | |
| Investment in Deutsche Central Cash Management Government Fund (cost $1,762,858) | | | 1,762,858 | |
| Cash | | | 26,581 | |
| Receivable for Fund shares sold | | | 26,612 | |
| Dividends receivable | | | 17,997 | |
| Interest receivable | | | 2,614 | |
| Other assets | | | 2,119 | |
| Total assets | | | 81,469,808 | |
| |
| Liabilities | | | | |
| Payable upon return of securities loaned | | | 3,961,099 | |
| Payable for investments purchased | | | 27,500 | |
| Payable for Fund shares redeemed | | | 4,503 | |
| Accrued management fee | | | 35,913 | |
| Accrued Trustees’ fees | | | 1,997 | |
| Other accrued expenses and payables | | | 95,270 | |
| Total liabilities | | | 4,126,282 | |
| Net assets, at value | | $ | 77,343,526 | |
| |
| Net Assets Consist of | | | | |
| Net unrealized appreciation (depreciation) on investments | | | 27,871,263 | |
| Accumulated net realized gain (loss) | | | 24,783,124 | |
| Paid-in capital | | | 24,689,139 | |
| Net assets, at value | | $ | 77,343,526 | |
Net Asset Value | | | | |
| Net Asset Value, offering and redemption price per share ($77,343,526 ÷ 3,525,232 outstanding shares of beneficial interest, no par value, unlimited number of shares authorized) | | $ | 21.94 | |
| * | Represents collateral on securities loaned. |
Statement of Operations
| | | | |
| for the year ended December 31, 2017 | | | | |
| |
| Investment Income | | | | |
| Income: | | | | |
| Dividends (net of foreign taxes withheld of $3,276) | | $ | 698,660 | |
| Income distributions — Deutsche Central Cash Management Government Fund | | | 28,598 | |
| Securities lending income, net of borrower rebates | | | 48,600 | |
| Total income | | | 775,858 | |
| Expenses: | | | | |
| Management fee | | | 630,509 | |
| Administration fee | | | 114,638 | |
| Services to Shareholders | | | 1,109 | |
| Custodian fee | | | 2,703 | |
| Professional fees | | | 76,989 | |
| Reports to shareholders | | | 20,893 | |
| Trustees’ fees and expenses | | | 7,799 | |
| Other | | | 8,608 | |
| Total expenses | | | 863,248 | |
| Net investment income (loss) | | | (87,390 | ) |
| |
| Realized and Unrealized Gain (Loss) | | | | |
Net realized gain (loss) from:
Investments | | | 25,564,215 | |
| Payments by affiliates (see Note F) | | | 67 | |
| | | | 25,564,282 | |
| Change in net unrealized appreciation (depreciation) on investments | | | (2,783,953 | ) |
| Net gain (loss) | | | 22,780,329 | |
| Net increase (decrease) in net assets resulting from operations | | $ | 22,692,939 | |
The accompanying notes are an integral part of the financial statements.
| | | | |
Deutsche Variable Series II — Deutsche Small Mid Cap Growth VIP | | | | | 9 |
Statements of Changes in Net Assets
| | | | | | | | |
| | | Years Ended December 31, | |
| Increase (Decrease) in Net Assets | | 2017 | | | 2016 | |
| Operations: | | | | | | | | |
| Net investment income (loss) | | $ | (87,390 | ) | | $ | 124,275 | |
| Net realized gain (loss) | | | 25,564,282 | | | | 6,541,357 | |
| Change in net unrealized appreciation (depreciation) | | | (2,783,953 | ) | | | 1,718,283 | |
| Net increase (decrease) in net assets resulting from operations | | | 22,692,939 | | | | 8,383,915 | |
| Distributions to shareholders from: | | | | | | | | |
| Net investment income | | | | | | | | |
Class A | | | (124,128 | ) | | | — | |
| Net realized gains | | | | | | | | |
Class A | | | (6,452,819 | ) | | | (20,264,895 | ) |
| Total distributions | | | (6,576,947 | ) | | | (20,264,895 | ) |
| Fund share transactions: | | | | | | | | |
Class A | | | | | | | | |
| Proceeds from shares sold | | | 3,919,157 | | | | 2,382,262 | |
| Reinvestment of distributions | | | 6,576,947 | | | | 20,264,895 | |
| Payments for shares redeemed | | | (67,645,663 | ) | | | (27,583,809 | ) |
| Net increase (decrease) in net assets from Class A share transactions | | | (57,149,559 | ) | | | (4,936,652 | ) |
| Increase (decrease) in net assets | | | (41,033,567 | ) | | | (16,817,632 | ) |
| Net assets at beginning of period | | | 118,377,093 | | | | 135,194,725 | |
| Net assets at end of period (including distributions in excess of investment income and undistributed net investment income $0 and $115,705, respectively) | | $ | 77,343,526 | | | $ | 118,377,093 | |
| | |
| Other Information | | | | | | | | |
Class A | | | | | | | | |
| Shares outstanding at beginning of period | | | 6,244,931 | | | | 6,467,679 | |
| Shares sold | | | 194,850 | | | | 129,160 | |
| Shares issued to shareholders in reinvestment of distributions | | | 336,589 | | | | 1,137,838 | |
| Shares redeemed | | | (3,251,138 | ) | | | (1,489,746 | ) |
| Net increase (decrease) in Class A shares | | | (2,719,699 | ) | | | (222,748 | ) |
| Shares outstanding at end of period | | | 3,525,232 | | | | 6,244,931 | |
The accompanying notes are an integral part of the financial statements.
| | | | | | |
| | 10 | | | | | | Deutsche Variable Series II — Deutsche Small Mid Cap Growth VIP |
Financial Highlights
| | | | | | | | | | | | | | | | | | | | |
| | | Years Ended December 31, | |
| Class A | | 2017 | | | 2016 | | | 2015 | | | 2014 | | | 2013 | |
| | | | | |
| Selected Per Share Data | | | | | | | | | | | | | | | | | | | | |
| Net asset value, beginning of period | | $ | 18.96 | | | $ | 20.90 | | | $ | 22.83 | | | $ | 21.59 | | | $ | 15.14 | |
| Income (loss) from investment operations: | | | | | | | | | | | | | | | | | | | | |
Net investment income (loss)a | | | (.02 | ) | | | .02 | | | | (.04 | ) | | | (.02 | ) | | | (.04 | ) |
Net realized and unrealized gain (loss) | | | 4.08 | | | | 1.64 | | | | (.00 | ) | | | 1.26 | | | | 6.51 | |
Total from investment operations | | | 4.06 | | | | 1.66 | | | | (.04 | ) | | | 1.24 | | | | 6.47 | |
| Less distributions from: | | | | | | | | | | | | | | | | | | | | |
Net investment income | | | (.02 | ) | | | — | | | | — | | | | — | | | | (.02 | ) |
Net realized gains | | | (1.06 | ) | | | (3.60 | ) | | | (1.89 | ) | | | — | | | | — | |
Total distributions | | | (1.08 | ) | | | (3.60 | ) | | | (1.89 | ) | | | — | | | | (.02 | ) |
| Net asset value, end of period | | $ | 21.94 | | | $ | 18.96 | | | $ | 20.90 | | | $ | 22.83 | | | $ | 21.59 | |
| Total Return (%) | | | 22.12 | | | | 9.08 | | | | (.90 | ) | | | 5.74 | | | | 42.78 | |
| | | | | |
| Ratios to Average Net Assets and Supplemental Data | | | | | | | | | | | | | | | | | | | | |
| Net assets, end of period ($ millions) | | | 77 | | | | 118 | | | | 135 | | | | 172 | | | | 187 | |
| Ratio of expenses (%)b | | | .75 | | | | .75 | | | | .72 | | | | .73 | | | | .72 | |
| Ratio of net investment income (loss) (%) | | | (.08 | ) | | | .11 | | | | (.19 | ) | | | (.11 | ) | | | (.22 | ) |
| Portfolio turnover rate (%) | | | 32 | | | | 28 | | | | 42 | | | | 44 | | | | 56 | |
| a | Based on average shares outstanding during the period. |
| b | Expense ratio does not reflect charges and fees associated with the separate account that invests in the Fund or any variable life insurance policy or variable annuity contract for which the Fund is an investment option. |
The accompanying notes are an integral part of the financial statements.
| | | | |
Deutsche Variable Series II — Deutsche Small Mid Cap Growth VIP | | | | | 11 |
| | |
| Notes to Financial Statements | | |
A. Organization and Significant Accounting Policies
Deutsche Small Mid Cap Growth VIP (the “Fund”) is a diversified series of Deutsche Variable Series II (the “Trust”), which is registered under the Investment Company Act of 1940, as amended (the “1940 Act”), as an open-end management investment company organized as a Massachusetts business trust.
The Fund’s financial statements are prepared in accordance with accounting principles generally accepted in the United States of America (“U.S. GAAP”) which require the use of management estimates. Actual results could differ from those estimates. The Fund qualifies as an investment company under Topic 946 of Accounting Standards Codification of U.S. GAAP. The policies described below are followed consistently by the Fund in the preparation of its financial statements.
Security Valuation. Investments are stated at value determined as of the close of regular trading on the New York Stock Exchange on each day the exchange is open for trading.
Various inputs are used in determining the value of the Fund’s investments. These inputs are summarized in three broad levels. Level 1 includes quoted prices in active markets for identical securities. Level 2 includes other significant observable inputs (including quoted prices for similar securities, interest rates, prepayment speeds and credit risk). Level 3 includes significant unobservable inputs (including the Fund’s own assumptions in determining the fair value of investments). The level assigned to the securities valuations may not be an indication of the risk or liquidity associated with investing in those securities.
Equity securities and exchange-trade funds (“ETFs”) are valued at the most recent sale price or official closing price reported on the exchange (U.S. or foreign) or over-the-counter market on which they trade. Securities for which no sales are reported are valued at the calculated mean between the most recent bid and asked quotations on the relevant market or, if a mean cannot be determined, at the most recent bid quotation. Equity securities and ETFs are generally categorized as Level 1.
Investments in open-end investment companies are valued at their net asset value each business day and are categorized as Level 1.
Securities and other assets for which market quotations are not readily available or for which the above valuation procedures are deemed not to reflect fair value are valued in a manner that is intended to reflect their fair value as determined in accordance with procedures approved by the Board and are generally categorized as Level 3. In accordance with the Fund’s valuation procedures, factors considered in determining value may include, but are not limited to, the type of the security; the size of the holding; the initial cost of the security; the existence of any contractual restrictions on the security’s disposition; the price and extent of public trading in similar securities of the issuer or of comparable companies; quotations or evaluated prices from broker-dealers and/or pricing services; information obtained from the issuer, analysts, and/or the appropriate stock exchange (for exchange-traded securities); an analysis of the company’s or issuer’s financial statements; an evaluation of the forces that influence the issuer and the market(s) in which the security is purchased and sold; and with respect to debt securities, the maturity, coupon, creditworthiness, currency denomination and the movement of the market in which the security is normally traded. The value determined under these procedures may differ from published values for the same securities.
Disclosure about the classification of fair value measurements is included in a table following the Fund’s Investment Portfolio.
Securities Lending. Deutsche Bank AG, as lending agent, lends securities of the Fund to certain financial institutions under the terms of its securities lending agreement. During the term of the loans, the Fund continues to receive interest and dividends generated by the securities and to participate in any changes in their market value. The Fund requires the borrowers of the securities to maintain collateral with the Fund consisting of either cash or liquid, unencumbered assets having a value at least equal to the value of the securities loaned. When the collateral falls below specified amounts, the lending agent will use its best effort to obtain additional collateral on the next business day to meet required amounts under the securities lending agreement. As of period end, any securities on loan were collateralized by cash. During the year ended December 31, 2017 the Fund invested the cash collateral into a joint trading account in affiliated money market funds managed by Deutsche Investment Management Americas Inc. As of December 31, 2017 the Fund invested the cash collateral in Deutsche Government & Agency Securities Portfolio. Deutsche Investment Management Americas Inc. receives a management/administration fee (0.13% annualized effective rate as of December 31, 2017) on the cash collateral invested in Deutsche Government & Agency
| | | | | | |
| | 12 | | | | | | Deutsche Variable Series II — Deutsche Small Mid Cap Growth VIP |
Securities Portfolio. The Fund receives compensation for lending its securities either in the form of fees or by earning interest on invested cash collateral net of borrower rebates and fees paid to a lending agent. Either the Fund or the borrower may terminate the loan at any time, and the borrower, after notice, is required to return borrowed securities within a standard time period. There may be risks of delay and costs in recovery of securities or even loss of rights in the collateral should the borrower of the securities fail financially. If the Fund is not able to recover securities lent, the Fund may sell the collateral and purchase a replacement investment in the market, incurring the risk that the value of the replacement security is greater than the value of the collateral. The Fund is also subject to all investment risks associated with the reinvestment of any cash collateral received, including, but not limited to, interest rate, credit and liquidity risk associated with such investments.
As of December 31, 2017 the Fund had securities on loan, which were classified as common stock in the Investment Portfolio. The value of the related collateral exceeded the value of the securities loaned at period end. As of period end, the remaining contractual maturity of the collateral agreements were overnight and continuous.
Federal Income Taxes. The Fund’s policy is to comply with the requirements of the Internal Revenue Code, as amended, which are applicable to regulated investment companies, and to distribute all of its taxable income to its shareholders.
The Fund has reviewed the tax positions for the open tax years as of December 31, 2017 and has determined that no provision for income tax and/or uncertain tax positions is required in the Fund’s financial statements. The Fund’s federal tax returns for the prior three fiscal years remain open subject to examination by the Internal Revenue Service.
Distribution of Income and Gains. Distributions from net investment income of the Fund, if any, are declared and distributed to shareholders annually. Net realized gains from investment transactions, in excess of available capital loss carryforwards, would be taxable to the Fund if not distributed and, therefore, will be distributed to shareholders at least annually. The Fund may also make additional distributions for tax purposes if necessary.
The timing and characterization of certain income and capital gain distributions are determined annually in accordance with federal tax regulations which may differ from accounting principles generally accepted in the United States of America. These differences primarily relate to certain securities sold at a loss. As a result, net investment income (loss) and net realized gain (loss) on investment transactions for a reporting period may differ significantly from distributions during such period. Accordingly, the Fund may periodically make reclassifications among certain of its capital accounts without impacting the net asset value of the Fund.
At December 31, 2017, the Fund’s components of distributable earnings on a tax basis were as follows:
| | | | |
| Undistributed ordinary income* | | $ | 1,627,634 | |
| Undistributed long-term capital gains | | $ | 23,669,051 | |
| Net unrealized appreciation (depreciation) on investments | | $ | 27,357,702 | |
At December 31, 2017, the aggregate cost of investments for federal income tax purposes was $54,036,183. The net unrealized appreciation for all investments based on tax cost was $27,357,702. This consisted of aggregate gross unrealized appreciation for all investments in which there was an excess of value over tax cost of $29,109,327 aggregate gross unrealized depreciation for all investments in which was an excess of tax cost over value of $1,751,625.
In addition, the tax character of distributions paid by the Fund is summarized as follows:
| | | | | | | | |
| | | Years Ended December 31, | |
| | | 2017 | | | 2016 | |
| Distributions from ordinary income* | | $ | 124,128 | | | $ | 239,535 | |
| Distributions from long-term capital gains | | $ | 6,452,819 | | | $ | 20,025,360 | |
| * | For tax purposes, short-term capital gain distributions are considered ordinary income distributions. |
Expenses. Expenses of the Trust arising in connection with a specific fund are allocated to that fund. Other Trust expenses which cannot be directly attributed to a fund are apportioned among the funds in the Trust based upon the relative net assets or other appropriate measures.
Contingencies. In the normal course of business, the Fund may enter into contracts with service providers that contain general indemnification clauses. The Fund’s maximum exposure under these arrangements is unknown, as this would involve future claims that may be made against the Fund that have not yet been made. However, based on experience, the Fund expects the risk of loss to be remote.
| | | | |
Deutsche Variable Series II — Deutsche Small Mid Cap Growth VIP | | | | | 13 |
Other. Investment transactions are accounted for on a trade date plus one basis for daily net asset value calculations. However, for financial reporting purposes, investment transactions are reported on trade date. Interest income is recorded on the accrual basis. Dividend income is recorded on the ex-dividend date net of foreign withholding taxes. Realized gains and losses from investment transactions are recorded on an identified cost basis. Proceeds from litigation payments, if any, are included in net realized gain (loss) from investments.
B. Purchases and Sales of Securities
During the year ended December 31, 2017 purchases and sales of investment transactions (excluding short-term investments) aggregated $35,326,742 and $97,990,961, respectively.
C. Related Parties
Management Agreement. Under the Investment Management Agreement with Deutsche Investment Management Americas Inc. (“DIMA” or the “Advisor”), an indirect, wholly owned subsidiary of Deutsche Bank AG, the Advisor directs the investments of the Fund in accordance with its investment objectives, policies and restrictions. The Advisor determines the securities, instruments and other contracts relating to investments to be purchased, sold or entered into by the Fund.
Pursuant to the Investment Management Agreement with the Advisor, the Fund pays a monthly management fee based on the Fund’s average daily net assets, computed and accrued daily and payable monthly, at the following annual rates:
| | | | |
| First $250 million | | | .550 | % |
| Next $750 million | | | .525 | % |
| Over $1 billion | | | .500 | % |
Accordingly, for the year ended December 31, 2017 the fee pursuant to the Investment Management Agreement was equivalent to an annual rate (exclusive of any applicable waivers/reimbursements) of 0.55% of the Fund’s average daily net assets.
For the period from January 1, 2017 through September 30, 2017, the Advisor had contractually agreed to waive its fees and/or reimburse certain operating expenses to the extent necessary to maintain the total annual operating expenses (excluding certain expenses such as extraordinary expenses, taxes, brokerage and interest expense) of Class A at 0.88%.
For the period from October 1, 2017 through September 30, 2018, the Advisor has contractually agreed to waive its fees and/or reimburse certain operating expenses to the extent necessary to maintain the total annual operating expenses (excluding certain expenses such as extraordinary expenses, taxes, brokerage and interest expense) of Class A at 0.84%.
Administration Fee. Pursuant to an Administrative Services Agreement, DIMA provides most administrative services to the Fund. For all services provided under the Administrative Services Agreement, the Fund pays DIMA an annual fee (“Administration Fee”) of 0.10% of the Fund’s average daily net assets, computed and accrued daily and payable monthly. For the year ended December 31, 2017 the Administration Fee was $114,638, of which $6,530 is unpaid.
Service Provider Fees. Deutsche AM Service Company (“DSC”), an affiliate of the Advisor, is the transfer agent, dividend-paying agent and shareholder service agent for the Fund. Pursuant to a sub-transfer agency agreement between DSC and DST Systems, Inc. (“DST”), DSC has delegated certain transfer agent, dividend-paying agent and shareholder service agent functions to DST. DSC compensates DST out of the shareholder servicing fee it receives from the Fund. For the year ended December 31, 2017 the amounts charged to the Fund by DSC aggregated $372, of which $99 is unpaid.
Typesetting and Filing Service Fees. Under an agreement with DIMA, DIMA is compensated for providing certain pre-press and regulatory filing services to the Fund. For the year ended December 31, 2017 the amount charged to the Fund by DIMA included in the Statement of Operations under “Reports to shareholders” aggregated $9,369, of which $3,451 is unpaid.
Trustees’ Fees and Expenses. The Fund paid retainer fees to each Trustee not affiliated with the Advisor, plus specified amounts to the Board Chairperson and Vice Chairperson and to each committee Chairperson.
Affiliated Cash Management Vehicles. The Fund may invest uninvested cash balances in Deutsche Central Cash Management Government Fund and Deutsche Variable NAV Money Fund, affiliated money market
| | | | | | |
| | 14 | | | | | | Deutsche Variable Series II — Deutsche Small Mid Cap Growth VIP |
funds which are managed by the Advisor. Each affiliated money market fund is managed in accordance with Rule 2a-7 under the 1940 Act, which governs the quality, maturity, diversity and liquidity of instruments in which a money market fund may invest. Deutsche Central Cash Management Government Fund seeks to maintain a stable net asset value, and Deutsche Variable NAV Money Fund maintains a floating net asset value. The Fund indirectly bears its proportionate share of the expenses of each affiliated money market fund in which it invests. Deutsche Central Cash Management Government Fund does not pay the Advisor an investment management fee. To the extent that Deutsche Variable NAV Money Fund pays an investment management fee to the Advisor, the Advisor will waive an amount of the investment management fee payable to the Advisor by the Fund equal to the amount of the investment management fee payable on the Fund’s assets invested in Deutsche Variable NAV Money Fund.
Securities Lending Agent Fees. Deutsche Bank AG serves as securities lending agent for the Fund. For the year ended December 31, 2017 the Fund incurred securities lending agent fees to Deutsche Bank AG in the amount of $3,658.
D. Ownership of the Fund
At December 31, 2017 one participating insurance company was owner of record of 10% or more of the total outstanding Class A shares of the Fund, owning 92%.
E. Line of Credit
The Fund and other affiliated funds (the “Participants”) share in a $400 million revolving credit facility provided by a syndication of banks. The Fund may borrow for temporary or emergency purposes, including the meeting of redemption requests that otherwise might require the untimely disposition of securities. The Participants are charged an annual commitment fee which is allocated based on net assets, among each of the Participants. Interest is calculated at a rate per annum equal to the sum of the Federal Funds Rate plus 1.25 percent plus if the one-month LIBOR exceeds the Federal Funds Rate the amount of such excess. The Fund may borrow up to a maximum of 33 percent of its net assets under the agreement. The Fund had no outstanding loans at December 31, 2017.
F. Payments by Affiliates
During the year ended December 31, 2017, the Advisor agreed to reimburse the Fund $67 for losses incurred on trades executed incorrectly. The amount reimbursed was less than 0.01% of the Fund’s average net assets, thus having no impact on the Fund’s total return.
| | | | |
Deutsche Variable Series II — Deutsche Small Mid Cap Growth VIP | | | | | 15 |
Report of Independent Registered Public Accounting Firm
To the Board of Trustees of Deutsche Variable Series II and the Shareholders of Deutsche Small Mid Cap Growth VIP
Opinion on the Financial Statements
We have audited the accompanying statement of assets and liabilities of Small Mid Cap Growth VIP (the “Fund”) (one of the funds constituting the Deutsche Variable Series II) (the “Trust”), including the schedule of investments, as of December 31, 2017, and the related statement of operations for the year then ended, the statements of changes in net assets for each of the two years in the period then ended, the financial highlights for each of the five years in the period then ended and the related notes (collectively referred to as the “financial statements”). In our opinion, the financial statements present fairly, in all material respects, the financial position of the Fund (one of the funds constituting the Deutsche Variable Series II) at December 31, 2017, the results of its operations for the year then ended, the changes in its net assets for each of the two years in the period then ended and its financial highlights for each of the five years in the period then ended, in conformity with U.S. generally accepted accounting principles.
Basis for Opinion
These financial statements are the responsibility of the Trust’s management. Our responsibility is to express an opinion on the Fund’s financial statements based on our audits. We are a public accounting firm registered with the Public Company Accounting Oversight Board (United States) (“PCAOB”) and are required to be independent with respect to the Trust in accordance with the U.S. federal securities laws and the applicable rules and regulations of the Securities and Exchange Commission and the PCAOB.
We conducted our audits in accordance with the standards of the PCAOB. Those standards require that we plan and perform the audit to obtain reasonable assurance about whether the financial statements are free of material misstatement, whether due to error or fraud. The Trust is not required to have, nor were we engaged to perform, an audit of the Trust’s internal control over financial reporting. As part of our audits, we are required to obtain an understanding of internal control over financial reporting, but not for the purpose of expressing an opinion on the effectiveness of the Trust’s internal control over financial reporting. Accordingly, we express no such opinion.
Our audits included performing procedures to assess the risks of material misstatement of the financial statements, whether due to error or fraud, and performing procedures that respond to those risks. Such procedures included examining, on a test basis, evidence regarding the amounts and disclosures in the financial statements. Our procedures included confirmation of securities owned as of December 31, 2017, by correspondence with the custodian and brokers or by other appropriate auditing procedures where replies from brokers were not received.
Our audits also included evaluating the accounting principles used and significant estimates made by management, as well as evaluating the overall presentation of the financial statements. We believe that our audits provide a reasonable basis for our opinion.
| | |
| |  |
|
We have served as the auditor of one or more investment companies in the Deutsche family of funds since at least 1979, but we are unable to determine the specific year. |
Boston, Massachusetts | | |
| February 15, 2018 | | |
| | | | | | |
| | 16 | | | | | | Deutsche Variable Series II — Deutsche Small Mid Cap Growth VIP |
| | |
| Information About Your Fund’s Expenses | | (Unaudited) |
As an investor of the Fund, you incur two types of costs: ongoing expenses and transaction costs. Ongoing expenses include management fees and other Fund expenses. Examples of transaction costs include contract charges, which are not shown in this section. The following tables are intended to help you understand your ongoing expenses (in dollars) of investing in the Fund and to help you compare these expenses with the ongoing expenses of investing in other mutual funds. The example in the table is based on an investment of $1,000 invested at the beginning of the six-month period and held for the entire period (July 1, 2017 to December 31, 2017).
The tables illustrate your Fund’s expenses in two ways:
| – | Actual Fund Return. This helps you estimate the actual dollar amount of ongoing expenses (but not transaction costs) paid on a $1,000 investment in the Fund using the Fund’s actual return during the period. To estimate the expenses you paid over the period, simply divide your account value by $1,000 (for example, an $8,600 account value divided by $1,000 = 8.6), then multiply the result by the number in the “Expenses Paid per $1,000” line under the share class you hold. |
| – | Hypothetical 5% Fund Return. This helps you to compare your Fund’s ongoing expenses (but not transaction costs) with those of other mutual funds using the Fund’s actual expense ratio and a hypothetical rate of return of 5% per year before expenses. Examples using a 5% hypothetical Fund return may be found in the shareholder reports of other mutual funds. The hypothetical account values and expenses may not be used to estimate the actual ending account balance or expenses you paid for the period. |
Please note that the expenses shown in these tables are meant to highlight your ongoing expenses only and do not reflect any transaction costs. The “Expenses Paid per $1,000” line of the tables is useful in comparing ongoing expenses only and will not help you determine the relative total expense of owning different funds. If these transaction costs had been included, your costs would have been higher.
| | | | |
| Expenses and Value of a $1,000 Investment for the six months ended December 31, 2017 | | | |
| |
| Actual Fund Return | | Class A | |
| Beginning Account Value 7/1/17 | | $ | 1,000.00 | |
| Ending Account Value 12/31/17 | | $ | 1,098.60 | |
| Expenses Paid per $1,000* | | $ | 4.02 | |
| |
| Hypothetical 5% Fund Return | | Class A | |
| Beginning Account Value 7/1/17 | | $ | 1,000.00 | |
| Ending Account Value 12/31/17 | | $ | 1,021.37 | |
| Expenses Paid per $1,000* | | $ | 3.87 | |
| * | Expenses are equal to the Fund’s annualized expense ratio, multiplied by the average account value over the period, multiplied by 184 (the number of days in the most recent six-month period), then divided by 365. |
| | | | |
| Annualized Expense Ratio | | Class A | |
| Deutsche Variable Series II — Deutsche Small Mid Cap Growth VIP | | | .75 | % |
For more information, please refer to the Fund’s prospectus.
These tables do not reflect charges and fees (“contract charges”) associated with the separate account that invests in the Fund or any variable life insurance policy or variable annuity contract for which the Fund is an investment option.
For an analysis of the fees associated with an investment in the fund or similar funds, please refer to the current and hypothetical expense calculators for Variable Insurance Products which can be found at deutschefunds.com/EN/resources/calculators.jsp.
| | | | |
Deutsche Variable Series II — Deutsche Small Mid Cap Growth VIP | | | | | 17 |
| | |
| Tax Information | | (Unaudited) |
The Fund paid distributions of $1.06 per share from net long-term capital gains during its year ended December 31, 2017.
Pursuant to Section 852 of the Internal Revenue Code, the Fund designates $26,061,033 as capital gain dividends for its year ended December 31, 2017.
For corporate shareholders, 100% of the ordinary dividends (i.e., income dividends plus short-term capital gains) paid during the Fund’s fiscal year ended December 31, 2017, qualified for the dividends received deduction.
Please consult a tax advisor if you have questions about federal or state income tax laws, or on how to prepare your tax returns. If you have specific questions about your account, please contact your insurance provider.
Proxy Voting
The Trust’s policies and procedures for voting proxies for portfolio securities and information about how the Trust voted proxies related to its portfolio securities during the most recent 12-month period ended June 30 are available on our Web site — deutschefunds.com (click on “proxy voting” at the bottom of the page) — or on the SEC’s Web site — sec.gov. To obtain a written copy of the Trust’s policies and procedures without charge, upon request, call us toll free at (800) 728-3337.
| | | | | | |
| | 18 | | | | | | Deutsche Variable Series II — Deutsche Small Mid Cap Growth VIP |
Advisory Agreement Board Considerations and Fee Evaluation
The Board of Trustees (hereinafter referred to as the “Board” or “Trustees”) approved the renewal of Deutsche Small Mid Cap Growth VIP’s (the “Fund”) investment management agreement (the “Agreement”) with Deutsche Investment Management Americas Inc. (“DIMA”) in September 2017.
In terms of the process that the Board followed prior to approving the Agreement, shareholders should know that:
| – | During the entire process, all of the Fund’s Trustees were independent of DIMA and its affiliates (the “Independent Trustees”). |
| – | The Board met frequently during the past year to discuss fund matters and dedicated a substantial amount of time to contract review matters. Over the course of several months, the Board’s Contract Committee reviewed extensive materials received from DIMA, independent third parties and independent counsel. These materials included an analysis of the Fund’s performance, fees and expenses, and profitability from a fee consultant retained by the Fund’s Independent Trustees (the “Fee Consultant”). Based on its evaluation of the information provided, the Contract Committee presented its findings and recommendations to the Board. The Board then reviewed the Contract Committee’s findings and recommendations. |
| – | The Board also received extensive information throughout the year regarding performance of the Fund. |
| – | The Independent Trustees regularly met privately with counsel to discuss contract review and other matters. In addition, the Independent Trustees were advised by the Fee Consultant in the course of their review of the Fund’s contractual arrangements and considered a comprehensive report prepared by the Fee Consultant in connection with their deliberations. |
| – | In connection with reviewing the Agreement, the Board also reviewed the terms of the Fund’s distribution agreement, administrative services agreement, transfer agency agreement and other material service agreements. |
In connection with the contract review process, the Contract Committee and the Board considered the factors discussed below, among others. The Board also considered that DIMA and its predecessors have managed the Fund since its inception, and the Board believes that a long-term relationship with a capable, conscientious advisor is in the best interests of the Fund. The Board considered, generally, that shareholders chose to invest or remain invested in the Fund knowing that DIMA managed the Fund, and that the Agreement was approved by the Fund’s shareholders. DIMA is part of Deutsche Bank AG’s (“Deutsche Bank”) Asset Management (“Deutsche AM”) division. Deutsche AM is a global asset management business that offers a wide range of investing expertise and resources, including research capabilities in many countries throughout the world.
As part of the contract review process, the Board carefully considered the fees and expenses of each Deutsche fund overseen by the Board in light of the fund’s performance. In many cases, this led to the negotiation and implementation of expense caps. As part of these negotiations, the Board indicated that it would consider relaxing these caps in future years following sustained improvements in performance, among other considerations.
While shareholders may focus primarily on fund performance and fees, the Fund’s Board considers these and many other factors, including the quality and integrity of DIMA’s personnel and administrative support services provided by DIMA, such as back-office operations, fund valuations, and compliance policies and procedures.
Nature, Quality and Extent of Services. The Board considered the terms of the Agreement, including the scope of advisory services provided under the Agreement. The Board noted that, under the Agreement, DIMA provides portfolio management services to the Fund and that, pursuant to a separate administrative services agreement, DIMA provides administrative services to the Fund. The Board considered the experience and skills of senior management and investment personnel and the resources made available to such personnel. The Board reviewed the Fund’s performance over short-term and long-term periods and compared those returns to various agreed-upon performance measures, including market index(es) and a peer universe compiled using information supplied by Morningstar Direct (“Morningstar”), an independent fund data service. The Board also noted that it has put into place a process of identifying “Funds in Review” (e.g., funds performing poorly relative to a peer universe), and receives additional reporting from DIMA regarding such funds and, where appropriate, DIMA’s plans to address underperformance. The Board
| | | | |
Deutsche Variable Series II — Deutsche Small Mid Cap Growth VIP | | | | | 19 |
believes this process is an effective manner of identifying and addressing underperforming funds. Based on the information provided, the Board noted that, for the one-, three- and five-year periods ended December 31, 2016, the Fund’s performance (Class A shares) was in the 3rd quartile, 2nd quartile and 2nd quartile, respectively, of the applicable Morningstar universe (the 1st quartile being the best performers and the 4th quartile being the worst performers). The Board also observed that the Fund has underperformed its benchmark in the one-, three- and five-year periods ended December 31, 2016.
Fees and Expenses. The Board considered the Fund’s investment management fee schedule, operating expenses and total expense ratios, and comparative information provided by Broadridge Financial Solutions, Inc. (“Broadridge”) and the Fee Consultant regarding investment management fee rates paid to other investment advisors by similar funds (1st quartile being the most favorable and 4th quartile being the least favorable). With respect to management fees paid to other investment advisors by similar funds, the Board noted that the contractual fee rates paid by the Fund, which include a 0.10% fee paid to DIMA under the Fund’s administrative services agreement, were lower than the median (1st quartile) of the applicable Broadridge peer group (based on Broadridge data provided as of December 31, 2016). The Board noted that the Fund’s Class A shares total (net) operating expenses were expected to be lower than the median (2nd quartile) of the applicable Broadridge expense universe (based on Broadridge data provided as of December 31, 2016, and analyzing Broadridge expense universe Class A (net) expenses less any applicable 12b-1 fees) (“Broadridge Universe Expenses”). The Board noted that the expense limitation agreed to by DIMA was expected to help the Fund’s total (net) operating expenses remain competitive. The Board considered the Fund’s management fee rate as compared to fees charged by DIMA to a comparable Deutsche U.S. registered fund (“Deutsche Funds”) and considered differences between the Fund and the comparable Deutsche Fund. The information requested by the Board as part of its review of fees and expenses also included information about institutional accounts (including any sub-advised funds and accounts) and funds offered primarily to European investors (“Deutsche Europe funds”) managed by Deutsche AM. The Board noted that DIMA indicated that Deutsche AM does not manage any institutional accounts or Deutsche Europe funds comparable to the Fund.
On the basis of the information provided, the Board concluded that management fees were reasonable and appropriate in light of the nature, quality and extent of services provided by DIMA.
Profitability. The Board reviewed detailed information regarding revenues received by DIMA under the Agreement. The Board considered the estimated costs to DIMA, and pre-tax profits realized by DIMA, from advising the Deutsche Funds, as well as estimates of the pre-tax profits attributable to managing the Fund in particular. The Board also received information regarding the estimated enterprise-wide profitability of DIMA and its affiliates with respect to all fund services in totality and by fund. The Board and the Fee Consultant reviewed DIMA’s methodology in allocating its costs to the management of the Fund. Based on the information provided, the Board concluded that the pre-tax profits realized by DIMA in connection with the management of the Fund were not unreasonable. The Board also reviewed certain publicly available information regarding the profitability of certain similar investment management firms. The Board noted that, while information regarding the profitability of such firms is limited (and in some cases is not necessarily prepared on a comparable basis), DIMA and its affiliates’ overall profitability with respect to the Deutsche Funds (after taking into account distribution and other services provided to the funds by DIMA and its affiliates) was lower than the overall profitability levels of most comparable firms for which such data was available.
Economies of Scale. The Board considered whether there are economies of scale with respect to the management of the Fund and whether the Fund benefits from any economies of scale. The Board noted that the Fund’s investment management fee schedule includes fee breakpoints. The Board concluded that the Fund’s fee schedule represents an appropriate sharing between the Fund and DIMA of such economies of scale as may exist in the management of the Fund at current asset levels.
Other Benefits to DIMA and Its Affiliates. The Board also considered the character and amount of other incidental benefits received by DIMA and its affiliates, including any fees received by DIMA for administrative services provided to the Fund and any fees received by an affiliate of DIMA for transfer agency services provided to the Fund. The Board also considered benefits to DIMA related to brokerage and soft-dollar allocations, including allocating brokerage to pay for research generated by parties other than the executing broker dealers, which pertain primarily to funds investing in equity securities. In addition, the Board considered the incidental public relations benefits to DIMA related to Deutsche Funds advertising and cross-selling opportunities among DIMA products and services. The Board considered these benefits in reaching its conclusion that the Fund’s management fees were reasonable.
| | | | | | |
| | 20 | | | | | | Deutsche Variable Series II — Deutsche Small Mid Cap Growth VIP |
Compliance. The Board considered the significant attention and resources dedicated by DIMA to documenting and enhancing its compliance processes in recent years. The Board noted in particular (i) the experience, seniority and time commitment of the individuals serving as DIMA’s and the Fund’s chief compliance officers; (ii) the large number of DIMA compliance personnel; and (iii) the substantial commitment of resources by DIMA and its affiliates to compliance matters.
Based on all of the information considered and the conclusions reached, the Board unanimously determined that the continuation of the Agreement is in the best interests of the Fund. In making this determination, the Board did not give particular weight to any single factor identified above. The Board considered these factors over the course of numerous meetings, certain of which were in executive session with only the Independent Trustees and counsel present. It is possible that individual Independent Trustees may have weighed these factors differently in reaching their individual decisions to approve the continuation of the Agreement.
| | | | |
Deutsche Variable Series II — Deutsche Small Mid Cap Growth VIP | | | | | 21 |
Board Members and Officers
The following table presents certain information regarding the Board Members and Officers of the Fund. Each Board Member’s year of birth is set forth in parentheses after his or her name. Unless otherwise noted, (i) each Board Member has engaged in the principal occupation(s) noted in the table for at least the most recent five years, although not necessarily in the same capacity; and (ii) the address of each Independent Board Member is c/o Keith R. Fox, Deutsche Funds Board Chair, c/o Thomas R. Hiller, Ropes & Gray LLP, Prudential Tower, 800 Boylston Street, Boston, MA 02199-3600. Except as otherwise noted below, the term of office for each Board Member is until the election and qualification of a successor, or until such Board Member sooner dies, resigns, is removed or as otherwise provided in the governing documents of the Fund. Because the Fund does not hold an annual meeting of shareholders, each Board Member will hold office for an indeterminate period. The Board Members may also serve in similar capacities with other funds in the fund complex.
| | | | | | | | |
| Independent Board Members | | | | | | | |
Name, Year of Birth,
Position with the Fund and
Length of Time Served1 | | Business Experience and Directorships During the Past Five Years | | Number of
Funds in
Deutsche
Fund
Complex
Overseen | | | Other
Directorships
Held by Board
Member |
Keith R. Fox, CFA (1954) Chairperson since 2017, and Board Member since 1996 | | Managing General Partner, Exeter Capital Partners (a series of private investment funds) (since 1986). Directorships: Progressive International Corporation (kitchen goods importer and distributor); The Kennel Shop (retailer); former Chairman, National Association of Small Business Investment Companies; former Directorships: BoxTop Media Inc. (advertising); Sun Capital Advisers Trust (mutual funds) (2011–2012) | | | 89 | | | — |
Kenneth C. Froewiss (1945) Vice Chairperson since 2017, and Board Member since 2001 | | Retired Clinical Professor of Finance, NYU Stern School of Business (1997–2014); Member, Finance Committee, Association for Asian Studies (2002–present); Director, Mitsui Sumitomo Insurance Group (US) (2004–present); prior thereto, Managing Director, J.P. Morgan (investment banking firm) (until 1996) | | | 92 | | | — |
John W. Ballantine (1946) Board Member since 1999 | | Retired; formerly, Executive Vice President and Chief Risk Management Officer, First Chicago NBD Corporation/The First National Bank of Chicago (1996–1998); Executive Vice President and Head of International Banking (1995–1996); former Directorships: Director and former Chairman of the Board, Healthways, Inc.2 (population well-being and wellness services) (2003–2014); Stockwell Capital Investments PLC (private equity); Enron Corporation; FNB Corporation; Tokheim Corporation; First Oak Brook Bancshares, Inc. and Oak Brook Bank; Prisma Energy International. Not-for-Profit Director, Trustee: Palm Beach Civic Association; Public Radio International; Window to the World Communications (public media); Harris Theater for Music and Dance (Chicago) | | | 89 | | | Portland
General
Electric2
(utility
company)
(2003–
present) |
Henry P. Becton, Jr. (1943) Board Member since 1990 | | Vice Chair and former President, WGBH Educational Foundation. Directorships: Public Radio International; Public Radio Exchange (PRX); The Pew Charitable Trusts (charitable organization); former Directorships: Becton Dickinson and Company2 (medical technology company); Belo Corporation2 (media company); The PBS Foundation; Association of Public Television Stations; Boston Museum of Science; American Public Television; Concord Academy; New England Aquarium; Mass. Corporation for Educational Telecommunications; Committee for Economic Development; Public Broadcasting Service; Connecticut College; North Bennett Street School (Boston) | | | 89 | | | — |
Dawn-Marie Driscoll (1946) Board Member since 1987 | | Emeritus Executive Fellow, Center for Business Ethics, Bentley University; formerly: President, Driscoll Associates (consulting firm); Partner, Palmer & Dodge (law firm) (1988–1990); Vice President of Corporate Affairs and General Counsel, Filene’s (retail) (1978–1988). Directorships: Advisory Board, Center for Business Ethics, Bentley University; Trustee and former Chairman of the Board, Southwest Florida Community Foundation (charitable organization); former Directorships: ICI Mutual Insurance Company (2007–2015); Sun Capital Advisers Trust (mutual funds) (2007–2012), Investment Company Institute (audit, executive, nominating committees) and Independent Directors Council (governance, executive committees) | | | 89 | | | — |
| | | | | | |
| | 22 | | | | | | Deutsche Variable Series II — Deutsche Small Mid Cap Growth VIP |
| | | | | | | | |
Name, Year of Birth,
Position with the Fund and
Length of Time Served1 | | Business Experience and Directorships During the Past Five Years | | Number of
Funds in
Deutsche
Fund
Complex
Overseen | | | Other
Directorships
Held by Board
Member |
Paul K. Freeman (1950) Board Member since 1993 | | Consultant, World Bank/Inter-American Development Bank; Independent Directors Council (former chair); Investment Company Institute (executive and nominating committees); formerly: Chairman of Education Committee of Independent Directors Council; Project Leader, International Institute for Applied Systems Analysis (1998–2001); Chief Executive Officer, The Eric Group, Inc. (environmental insurance) (1986–1998); Directorships: Denver Zoo Foundation (December 2012–present); Knoebel Institute for Healthy Aging, University of Denver (2017–present); former Directorships: Prisma Energy International | | | 89 | | | — |
Richard J. Herring (1946) Board Member since 1990 | | Jacob Safra Professor of International Banking and Professor, Finance Department, The Wharton School, University of Pennsylvania (since July 1972); Co-Director, Wharton Financial Institutions Center; formerly: Vice Dean and Director, Wharton Undergraduate Division (July 1995–June 2000); Director, Lauder Institute of International Management Studies (July 2000–June 2006) | | | 89 | | | Director,
Aberdeen
Singapore
and Japan
Funds (since
2007);
Independent
Director of
Barclays
Bank
Delaware
(since
September
2010) |
William McClayton (1944) Board Member since 2004 | | Private equity investor (since October 2009); previously, Managing Director, Diamond Management & Technology Consultants, Inc. (global consulting firm) (2001–2009); Directorship: Board of Managers, YMCA of Metropolitan Chicago; formerly: Senior Partner, Arthur Andersen LLP (accounting) (1966–2001); Trustee, Ravinia Festival | | | 89 | | | — |
Rebecca W. Rimel (1951) Board Member since 1995 | | President, Chief Executive Officer and Director, The Pew Charitable Trusts (charitable organization) (1994–present); formerly: Executive Vice President, The Glenmede Trust Company (investment trust and wealth management) (1983–2004); Board Member, Investor Education (charitable organization) (2004–2005); Trustee, Executive Committee, Philadelphia Chamber of Commerce (2001–2007); Director, Viasys Health Care2 (January 2007–June 2007); Trustee, Thomas Jefferson Foundation (charitable organization) (1994–2012) | | | 89 | | | Director,
Becton
Dickinson
and
Company2
(medical
technology
company)
(2012–
present);
Director,
BioTelemetry
Inc2 (health
care) (2009–
present) |
William N. Searcy, Jr. (1946) Board Member since 1993 | | Private investor since October 2003; formerly: Pension & Savings Trust Officer, Sprint Corporation2 (telecommunications) (November 1989–September 2003); Trustee, Sun Capital Advisers Trust (mutual funds) (1998–2012) | | | 89 | | | — |
Jean Gleason Stromberg (1943) Board Member since 1997 | | Retired. Formerly, Consultant (1997–2001); Director, Financial Markets U.S. Government Accountability Office (1996–1997); Partner, Norton Rose Fulbright, L.L.P. (law firm) (1978–1996); former Directorships: The William and Flora Hewlett Foundation (charitable organization) (2000–2015); Service Source, Inc. (nonprofit), Mutual Fund Directors Forum (2002–2004), American Bar Retirement Association (funding vehicle for retirement plans) (1987–1990 and 1994–1996) | | | 89 | | | — |
| | | | |
Deutsche Variable Series II — Deutsche Small Mid Cap Growth VIP | | | | | 23 |
| | |
| Officers4 | | |
Name, Year of Birth,
Position with the Fund and
Length of Time Served5 | | Business Experience and Directorships During the Past Five Years |
Hepsen Uzcan6,9 (1974) President and Chief Executive Officer, 2017–present Assistant Secretary, 2013–present | | Director,3 Deutsche Asset Management; formerly: Vice President for the Deutsche funds (2016–2017) |
John Millette8 (1962) Vice President and Secretary, 1999–present | | Director,3 Deutsche Asset Management; Chief Legal Officer, Deutsche Investment Management Americas Inc. (2015–present); and Director and Vice President, Deutsche AM Trust Company (since 2016); formerly: Secretary, Deutsche Investment Management Americas Inc. (2015–2017) |
Paul H. Schubert6 (1963) Chief Financial Officer, 2004–present Treasurer, 2005–present | | Managing Director,3 Deutsche Asset Management, and Chairman, Director and President, Deutsche AM Trust Company (since 2013); Vice President, Deutsche AM Distributors, Inc. (since 2016); Director, Deutsche AM Service Company (since 2017); Director and President, DB Investment Managers, Inc. (since 2017); formerly: Director, Deutsche AM Trust Company (2004–2013) |
Caroline Pearson8 (1962) Chief Legal Officer, 2010–present | | Managing Director,3 Deutsche Asset Management; formerly: Secretary, Deutsche AM Distributors, Inc.; and Secretary, Deutsche AM Service Company |
Scott D. Hogan8 (1970) Chief Compliance Officer, 2016–present | | Director,3 Deutsche Asset Management |
Wayne Salit7 (1967) Anti-Money Laundering Compliance Officer, 2014–present | | Director,3 Deutsche Asset Management; formerly: Managing Director, AML Compliance Officer at BNY Mellon (2011–2014); and Director, AML Compliance Officer at Deutsche Bank (2004–2011) |
Sheila Cadogan8 (1966) Assistant Treasurer, since July 12, 2017 | | Director,3 Deutsche Asset Management |
Paul Antosca8 (1957) Assistant Treasurer, 2007–present | | Director,3 Deutsche Asset Management |
Diane Kenneally8 (1966) Assistant Treasurer, 2007–present | | Director,3 Deutsche Asset Management |
| 1 | The length of time served represents the year in which the Board Member joined the board of one or more Deutsche funds currently overseen by the Board. |
| 2 | A publicly held company with securities registered pursuant to Section 12 of the Securities Exchange Act of 1934. |
| 3 | Executive title, not a board directorship. |
| 4 | As a result of their respective positions held with the Advisor, these individuals are considered “interested persons” of the Advisor within the meaning of the 1940 Act. Interested persons receive no compensation from the Fund. |
| 5 | The length of time served represents the year in which the officer was first elected in such capacity for one or more Deutsche funds. |
| 6 | Address: 345 Park Avenue, New York, NY 10154. |
| 7 | Address: 60 Wall Street, New York, NY 10005. |
| 8 | Address: One International Place, Boston, MA 02110. |
| 9 | Appointed President and Chief Executive Officer effective December 1, 2017. |
The Fund’s Statement of Additional Information (“SAI”) includes additional information about the Board Members. The SAI is available, without charge, upon request. If you would like to request a copy of the SAI, you may do so by calling the following toll-free number: (800) 728-3337.
| | | | | | |
| | 24 | | | | | | Deutsche Variable Series II — Deutsche Small Mid Cap Growth VIP |
| | |
 | | |
VS2SMCG-2 (R-025835-7 2/18) | | |

December 31, 2017
Annual Report
Deutsche Variable Series II
Deutsche Small Mid Cap Value VIP

Contents
This report must be preceded or accompanied by a prospectus. To obtain an additional prospectus or summary prospectus, if available, call (800) 728-3337 or your financial representative. We advise you to consider the Fund’s objectives, risks, charges and expenses carefully before investing. The summary prospectus and prospectus contain this and other important information about the Fund. Please read the prospectus carefully before you invest.
Stocks may decline in value. Smaller and medium company stocks tend to be more volatile than large company stocks. Any fund that focuses in a particular segment of the market or region of the world will generally be more volatile than a fund that invests more broadly. The Fund may lend securities to approved institutions. Please read the prospectus for details.
Deutsche Asset Management represents the asset management activities conducted by Deutsche Bank AG or any of its subsidiaries.
Deutsche AM Distributors, Inc., 222 South Riverside Plaza, Chicago, IL 60606, (800) 621-1148
NOT FDIC/NCUA INSURED NO BANK GUARANTEE MAY LOSE VALUE NOT A DEPOSIT
NOT INSURED BY ANY FEDERAL GOVERNMENT AGENCY
| | | | | | |
| | 2 | | | | | | Deutsche Variable Series II — Deutsche Small Mid Cap Value VIP |
| | |
| Performance Summary | | December 31, 2017 (Unaudited) |
Fund performance shown is historical, assumes reinvestment of all dividend and capital gain distributions and does not guarantee future results. Investment return and principal value fluctuate with changing market conditions so that, when redeemed, shares may be worth more or less than their original cost. Current performance may be lower or higher than the performance data quoted. Please contact your participating insurance company for the Fund’s most recent month-end performance. Performance doesn’t reflect charges and fees (“contract charges”) associated with the separate account that invests in the Fund or any variable life insurance policy or variable annuity contract for which the Fund is an investment option. These charges and fees will reduce returns. While all share classes have the same underlying portfolio, their performance will differ.
The gross expense ratios of the Fund, as stated in the fee table of the prospectus dated May 1, 2017 are 0.83% and 1.19% for Class A and Class B shares, respectively, and may differ from the expense ratios disclosed in the Financial Highlights tables in this report.
Generally accepted accounting principles require adjustments to be made to the net assets of the Fund at period end for financial reporting purposes only, and as such, the total return based on the unadjusted net asset value per share may differ from the total return reported in the financial highlights.
Growth of an Assumed $10,000 Investment in Deutsche Small Mid Cap Value VIP
| | |
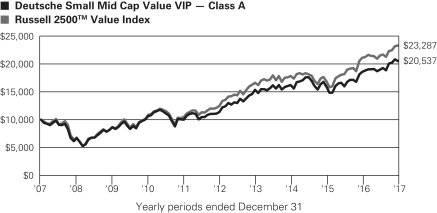 | | The Russell 2500TM Value Index is an unmanaged Index of those securities in the Russell 3000® Index with lower price-to-book ratios and lower forecasted growth values. Index returns do not reflect any fees or expenses and it is not possible to invest directly into an index. |
| | | | | | | | | | |
| Comparative Results | | | | | | | | | | |
| | | | |
| Deutsche Small Mid Cap Value VIP | | 1-Year | | 3-Year | | 5-Year | | 10-Year |
| Class A | | Growth of $10,000 | | $11,052 | | $12,672 | | $18,085 | | $20,537 |
| | | Average annual total return | | 10.52% | | 8.21% | | 12.58% | | 7.46% |
| Russell 2500 Value Index | | Growth of $10,000 | | $11,036 | | $13,059 | | $18,649 | | $23,287 |
| | | Average annual total return | | 10.36% | | 9.30% | | 13.27% | | 8.82% |
| | | | |
| Deutsche Small Mid Cap Value VIP | | 1-Year | | 3-Year | | 5-Year | | 10-Year |
| Class B | | Growth of $10,000 | | $11,013 | | $12,543 | | $17,756 | | $19,834 |
| | | Average annual total return | | 10.13% | | 7.85% | | 12.17% | | 7.09% |
| Russell 2500 Value Index | | Growth of $10,000 | | $11,036 | | $13,059 | | $18,649 | | $23,287 |
| | | Average annual total return | | 10.36% | | 9.30% | | 13.27% | | 8.82% |
The growth of $10,000 is cumulative.
| | | | |
Deutsche Variable Series II — Deutsche Small Mid Cap Value VIP | | | | | 3 |
| | |
| Management Summary | | December 31, 2017 (Unaudited) |
Class A shares of Deutsche Small Mid Cap VIP returned 10.52% in 2017 (unadjusted for contract charges), outperforming the 10.36% return of the Russell 2500 Value Index. We added the most value through individual stock selection in the real estate, information technology and financial sectors, while selection in consumer discretionary and health care detracted.
The Fund has long been underweight in real estate, but we added to the position in the past 18 months to limit the effect of sector allocations on relative performance. In doing so, we focused on real estate investment trusts (REITs) with exposure to positive industry trends and avoided areas, such as retail, with weaker fundamentals. This approach worked well and enabled us to add value through positions in Gaming and Leisure Properties, Inc.* and Pebblebrook Hotel Trust, among others. In technology, the specialty materials manufacturer Rogers Corp. — which was boosted by robust earnings and the announcement of acquisitions that were well-received by the markets — was the leading contributor to performance. Harris Corp.* also rallied thanks to better-than-expected cost synergies from an acquisitions, an expansion of its overseas business, and initiatives by the U.S. military to upgrade its communications systems. Walker and Dunlop, Inc. was a the top contributor in financials. The company benefited from several positive earnings developments and continued market-share gains in its mortgage-origination franchise. Outside of these three sectors, The Brink’s Co. was the top contributor. The security specialist hired a new chief executive officer, who successfully executed a plan to bring the company’s profit margins up to the level of its competitors.
Our decisions with regard to the Fund’s key detractors offers a closer look into our investment process. While we typically hold on to a poor-performing stock when the fundamentals remain intact, we are willing to cut our losses by selling positions if the investment case no longer holds. For example, we eliminated the Fund’s position in AMC Entertainment Holdings, Inc.* after a stretch of weakness since we saw no meaningful catalyst for a turnaround amid the broader downturn in box office receipts. We also eliminated the Fund’s position in the sporting-goods retailer Hibbett Sports, Inc.,* which declined due to the growing competitive threat from online retailers, as we believed the fundamental headwinds were too strong to warrant a continued investment. In contrast, we maintained our position in Puerto Rico-based OFG Bancorp. The stock slid in the aftermath of Hurricane Maria, but we believed the core business was healthy and the stock was undervalued. We see this disciplined approach — maintaining positions in companies that continue to execute while selling those where the fundamental story is falling short of expectations — as a critical aspect of successful risk management.
We were fairly active in managing the portfolio during the year, with 12 new purchases and 19 holdings that we chose to eliminate (four as a result of acquisitions). The high level of activity reflects the unusual nature of the market environment. Although the headline indices performed very well, there was also a large degree of “herd behavior” as investors rotated in and out of sectors and individual companies rapidly in response to headlines. This tendency created a growing number of value opportunities as otherwise good companies sold off indiscriminately, and we sought to capitalize on the trend by adding to stocks on our watch list. At the same time, we reduced or sold holdings that climbed to what we saw as full valuations. We believe this active and value-oriented approach has helped us take advantage of the constantly changing opportunity set in the small- and mid-cap space.
We believe our focus on companies with strong fundamentals and attractive valuations is evident in some of the portfolio’s underlying metrics. As of December 31, 2017, the Fund’s price-to-earnings (P/E) ratio (based on 12-month earnings estimates) was in line with the P/E of the Russell 2500 Value Index. However, the three- to five-year expected growth rate of the Fund’s holdings was 11.9%, which compared with 8.7% for the companies in the index. Additionally, the Fund’s aggregate return on equity of 12.0% exceeded the 6.7% ROE for the benchmark. We believe these portfolio characteristics, which reflect our preference for higher-quality companies trading at or below their historic valuation ranges, provide a healthy foundation for longer-term performance.
Richard Hanlon, CFA, Director
Mary Schafer Mahrer, Director
Portfolio Managers
| | | | | | |
| | 4 | | | | | | Deutsche Variable Series II — Deutsche Small Mid Cap Value VIP |
The views expressed reflect those of the portfolio management team only through the end of the period of the report as stated on the cover. The management team’s views are subject to change at any time based on market and other conditions and should not be construed as a recommendation. Past performance is no guarantee of future results. Current and future portfolio holdings are subject to risk.
Terms to Know
The Russell 2500 Value Index is an unmanaged index of those securities in the Russell 3000 Index with lower price-to-book ratios and lower forecasted growth values. Index returns do not reflect fees or expenses and it is not possible to invest directly into an index.
Consumer discretionary represents industries that produce goods and services that are not necessities in everyday life.
Overweight means the fund holds a higher weighting in a given sector or security than the benchmark. Underweight means the fund holds a lower weighting.
Contribution and detraction incorporate both a stock’s total return and its weighting in the fund.
Source: Factset. Price-to-earnings (P/E) ratio compares share price to per-share earnings.
Source: Factset. Return on equity is the amount of net income returned as a percentage of shareholders’ equity.
| * | Held and sold prior to December 31, 2017 |
| | | | |
Deutsche Variable Series II — Deutsche Small Mid Cap Value VIP | | | | | 5 |
| | |
| Portfolio Summary | | (Unaudited) |
| | | | | | | | |
| Asset Allocation (As a % of Investment Portfolio excluding Securities Lending Collateral) | | 12/31/17 | | | 12/31/16 | |
| Common Stocks | | | 96% | | | | 95% | |
| Cash Equivalents | | | 4% | | | | 5% | |
| | | | 100% | | | | 100% | |
| | |
Sector Diversification
(As a % of Investment Portfolio excluding Cash Equivalents and Securities Lending Collateral) | | 12/31/17 | | | 12/31/16 | |
Financials | | | 20% | | | | 24% | |
Industrials | | | 19% | | | | 15% | |
Real Estate | | | 13% | | | | 7% | |
Information Technology | | | 11% | | | | 15% | |
Consumer Discretionary | | | 9% | | | | 14% | |
Energy | | | 7% | | | | 7% | |
Consumer Staples | | | 7% | | | | 6% | |
Utilities | | | 5% | | | | 5% | |
Materials | | | 5% | | | | 3% | |
Health Care | | | 4% | | | | 4% | |
| | | | 100% | | | | 100% | |
Portfolio holdings and characteristics are subject to change.
For more complete details about the Fund’s investment portfolio, see page 7.
Following the Fund’s fiscal first and third quarter-end, a complete portfolio holdings listing is filed with the SEC on Form N-Q. The form will be available on the SEC’s Web site at sec.gov, and it also may be reviewed and copied at the SEC’s Public Reference Room in Washington, D.C. Information on the operation of the SEC’s Public Reference Room may be obtained by calling (800) SEC-0330. The Fund’s portfolio holdings are also posted on deutschefunds.com from time to time. Please see the Fund’s current prospectus for more information.
| | | | | | |
| | 6 | | | | | | Deutsche Variable Series II — Deutsche Small Mid Cap Value VIP |
| | |
| Investment Portfolio | | as of December 31, 2017 |
| | | | | | | | |
| | | Shares | | | Value ($) | |
| Common Stocks 96.2% | |
| Consumer Discretionary 8.3% | |
Auto Components 4.3% | |
Cooper Tire & Rubber Co. | | | 19,600 | | | | 692,860 | |
Standard Motor Products, Inc. | | | 50,604 | | | | 2,272,626 | |
Visteon Corp.* | | | 16,037 | | | | 2,006,870 | |
| | | | | | | | |
| | | | | | | 4,972,356 | |
|
Automobiles 0.8% | |
Winnebago Industries, Inc. | | | 16,400 | | | | 911,840 | |
|
Diversified Consumer Services 0.7% | |
Regis Corp.* | | | 52,100 | | | | 800,256 | |
|
Hotels, Restaurants & Leisure 0.9% | |
Denny’s Corp.* | | | 80,900 | | | | 1,071,116 | |
| | |
Media 1.2% | | | | | | | | |
TEGNA, Inc. | | | 95,267 | | | | 1,341,359 | |
|
Textiles, Apparel & Luxury Goods 0.4% | |
Carter’s, Inc. | | | 3,600 | | | | 422,964 | |
|
| Consumer Staples 6.3% | |
Food Products 3.2% | | | | | | | | |
Lamb Weston Holdings, Inc. | | | 39,076 | | | | 2,205,840 | |
Pinnacle Foods, Inc. | | | 23,500 | | | | 1,397,545 | |
| | | | | | | | |
| | | | | | | 3,603,385 | |
|
Household Products 3.1% | |
Central Garden & Pet Co.* | | | 46,200 | | | | 1,798,104 | |
Energizer Holdings, Inc. | | | 37,318 | | | | 1,790,518 | |
| | | | | | | | |
| | | | | | | 3,588,622 | |
|
| Energy 6.8% | |
Energy Equipment & Services 0.9% | |
U.S. Silica Holdings, Inc. | | | 31,839 | | | | 1,036,678 | |
|
Oil, Gas & Consumable Fuels 5.9% | |
Cimarex Energy Co. | | | 13,062 | | | | 1,593,695 | |
Golar LNG Ltd. | | | 37,178 | | | | 1,108,276 | |
Matador Resources Co.* | | | 69,315 | | | | 2,157,776 | |
Noble Energy, Inc. | | | 65,400 | | | | 1,905,756 | |
| | | | | | | | |
| | | | | | | 6,765,503 | |
|
| Financials 19.2% | |
Banks 10.6% | |
First Horizon National Corp. | | | 57,783 | | | | 1,155,082 | |
Great Western Bancorp., Inc. | | | 62,102 | | | | 2,471,660 | |
Hancock Holding Co. | | | 43,616 | | | | 2,158,992 | |
MB Financial, Inc. | | | 32,600 | | | | 1,451,352 | |
OFG Bancorp. | | | 135,982 | | | | 1,278,231 | |
Pacific Premier Bancorp., Inc.* | | | 31,500 | | | | 1,260,000 | |
Sterling Bancorp. | | | 95,454 | | | | 2,348,168 | |
| | | | | | | | |
| | | | | | | 12,123,485 | |
|
Insurance 6.5% | |
CNO Financial Group, Inc. | | | 123,078 | | | | 3,038,796 | |
ProAssurance Corp. | | | 19,800 | | | | 1,131,570 | |
Reinsurance Group of America, Inc. | | | 21,249 | | | | 3,313,356 | |
| | | | | | | | |
| | | | | | | 7,483,722 | |
|
Thrifts & Mortgage Finance 2.1% | |
Walker & Dunlop, Inc.* | | | 50,131 | | | | 2,381,223 | |
| | | | | | | | |
| | | Shares | | | Value ($) | |
|
| Health Care 3.5% | |
Health Care Providers & Services 2.4% | |
Encompass Health Corp. | | | 54,935 | | | | 2,714,339 | |
|
Life Sciences Tools & Services 1.1% | |
PerkinElmer, Inc. | | | 16,843 | | | | 1,231,560 | |
|
| Industrials 18.7% | |
Commercial Services & Supplies 4.5% | |
Interface, Inc. | | | 74,475 | | | | 1,873,046 | |
Pitney Bowes, Inc. | | | 81,763 | | | | 914,111 | |
The Brink’s Co. | | | 29,733 | | | | 2,339,987 | |
| | | | | | | | |
| | | | | | | 5,127,144 | |
|
Electrical Equipment 1.3% | |
EnerSys | | | 21,200 | | | | 1,476,156 | |
|
Industrial Conglomerates 1.3% | |
Carlisle Companies, Inc. | | | 13,310 | | | | 1,512,681 | |
|
Machinery 9.4% | |
Douglas Dynamics, Inc. | | | 42,200 | | | | 1,595,160 | |
Federal Signal Corp. | | | 78,600 | | | | 1,579,074 | |
Global Brass & Copper Holdings, Inc. | | | 49,100 | | | | 1,625,210 | |
Hillenbrand, Inc. | | | 79,967 | | | | 3,574,525 | |
Stanley Black & Decker, Inc. | | | 14,159 | | | | 2,402,641 | |
| | | | | | | | |
| | | | | | | 10,776,610 | |
|
Professional Services 0.3% | |
ManpowerGroup, Inc. | | | 3,200 | | | | 403,552 | |
|
Trading Companies & Distributors 1.9% | |
AerCap Holdings NV* | | | 41,633 | | | | 2,190,312 | |
|
| Information Technology 10.7% | |
Electronic Equipment, Instruments & Components 7.6% | |
Dolby Laboratories, Inc. “A” | | | 32,358 | | | | 2,006,196 | |
Insight Enterprises, Inc.* | | | 49,400 | | | | 1,891,526 | |
Keysight Technologies, Inc.* | | | 54,952 | | | | 2,286,003 | |
Rogers Corp.* | | | 12,035 | | | | 1,948,707 | |
Sanmina Corp.* | | | 19,100 | | | | 630,300 | |
| | | | | | | | |
| | | | | | | 8,762,732 | |
|
IT Services 1.2% | |
Convergys Corp. | | | 49,660 | | | | 1,167,010 | |
Travelport Worldwide Ltd. | | | 11,000 | | | | 143,770 | |
| | | | | | | | |
| | | | | | | 1,310,780 | |
|
Software 1.9% | |
Verint Systems, Inc.* | | | 52,794 | | | | 2,209,429 | |
|
| Materials 4.5% | |
Chemicals 2.5% | |
GCP Applied Technologies, Inc.* | | | 35,438 | | | | 1,130,472 | |
Minerals Technologies, Inc. | | | 25,800 | | | | 1,776,330 | |
| | | | | | | | |
| | | | | | | 2,906,802 | |
|
Containers & Packaging 1.6% | |
Owens-Illinois, Inc.* | | | 83,800 | | | | 1,857,846 | |
|
Metals & Mining 0.4% | |
Steel Dynamics, Inc. | | | 10,000 | | | | 431,300 | |
The accompanying notes are an integral part of the financial statements.
| | | | |
Deutsche Variable Series II — Deutsche Small Mid Cap Value VIP | | | | | 7 |
| | | | | | | | |
| | | Shares | | | Value ($) | |
| | |
| Real Estate 12.9% | | | | | | | | |
Equity Real Estate Investment Trusts (REITs) | |
Agree Realty Corp. | | | 52,502 | | | | 2,700,703 | |
Brixmor Property Group, Inc. | | | 71,400 | | | | 1,332,324 | |
Community Healthcare Trust, Inc. | | | 50,000 | | | | 1,405,000 | |
Easterly Government Properties, Inc. | | | 70,091 | | | | 1,495,742 | |
Highwoods Properties, Inc. | | | 28,800 | | | | 1,466,208 | |
Pebblebrook Hotel Trust | | | 69,839 | | | | 2,595,915 | |
Physicians Realty Trust | | | 96,608 | | | | 1,737,978 | |
STAG Industrial, Inc. | | | 76,900 | | | | 2,101,677 | |
| | | | | | | | |
| | | | | | | 14,835,547 | |
| | |
| Utilities 5.3% | | | | | | | | |
Electric Utilities 3.2% | | | | | | | | |
IDACORP, Inc. | | | 39,783 | | | | 3,634,575 | |
| | |
Gas Utilities 2.1% | | | | | | | | |
ONE Gas, Inc. | | | 33,200 | | | | 2,432,232 | |
| Total Common Stocks (Cost $88,431,856) | | | | 110,316,106 | |
| | | | | | | | |
| | | Shares | | | Value ($) | |
|
| Cash Equivalents 3.9% | |
Deutsche Central Cash Management Government Fund, 1.30% (a) (Cost $4,418,900) | | | 4,418,900 | | | | 4,418,900 | |
| | |
| | | % of Net
Assets | | | Value ($) | |
Total Investment Portfolio (Cost $92,850,756) | | | 100.1 | | | | 114,735,006 | |
| Other Assets and Liabilities, Net | | | (0.1 | ) | | | (76,136 | ) |
| Net Assets | | | 100.0 | | | | 114,658,870 | |
| * | Non-income producing security. |
| (a) | Affiliated fund managed by Deutsche Investment Management Americas Inc. The rate shown is the annualized seven-day yield at period end. |
Fair Value Measurements
Various inputs are used in determining the value of the Fund’s investments. These inputs are summarized in three broad levels. Level 1 includes quoted prices in active markets for identical securities. Level 2 includes other significant observable inputs (including quoted prices for similar securities, interest rates, prepayment speeds and credit risk). Level 3 includes significant unobservable inputs (including the Fund’s own assumptions in determining the fair value of investments). The level assigned to the securities valuations may not be an indication of the risk or liquidity associated with investing in those securities.
The following is a summary of the inputs used as of December 31, 2017 in valuing the Fund’s investments. For information on the Fund’s policy regarding the valuation of investments, please refer to the Security Valuation section of Note A in the accompanying Notes to Financial Statements.
| | | | | | | | | | | | | | | | |
| Assets | | Level 1 | | | Level 2 | | | Level 3 | | | Total | |
| Common Stocks (b) | | $ | 110,316,106 | | | $ | — | | | $ | — | | | $ | 110,316,106 | |
| Short-Term Investments | | | 4,418,900 | | | | — | | | | — | | | | 4,418,900 | |
| Total | | $ | 114,735,006 | | | $ | — | | | $ | — | | | $ | 114,735,006 | |
There have been no transfers between fair value measurement levels during the year ended December 31, 2017.
| (b) | See Investment Portfolio for additional detailed categorizations. |
The accompanying notes are an integral part of the financial statements.
| | | | | | |
| | 8 | | | | | | Deutsche Variable Series II — Deutsche Small Mid Cap Value VIP |
Statement of Assets and Liabilities
| | | | |
| as of December 31, 2017 | | | | |
| |
| Assets | | | | |
| Investments in non-affiliated securities, at value (cost $88,431,856) | | $ | 110,316,106 | |
| Investment in Deutsche Central Cash Management Government Fund (cost $4,418,900) | | | 4,418,900 | |
| Receivable for Fund shares sold | | | 20,712 | |
| Dividends receivable | | | 210,535 | |
| Interest receivable | | | 4,208 | |
| Other assets | | | 2,687 | |
| Total assets | | | 114,973,148 | |
| |
| Liabilities | | | | |
| Payable for Fund shares redeemed | | | 135,657 | |
| Accrued management fee | | | 71,427 | |
| Accrued Trustees’ fees | | | 2,562 | |
| Other accrued expenses and payables | | | 104,632 | |
| Total liabilities | | | 314,278 | |
| Net assets, at value | | $ | 114,658,870 | |
| |
| Net Assets Consist of | | | | |
| Undistributed net investment income | | | 1,432,026 | |
| Net unrealized appreciation (depreciation) on investments | | | 21,884,250 | |
| Accumulated net realized gain (loss) | | | 18,971,102 | |
| Paid-in capital | | | 72,371,492 | |
| Net assets, at value | | $ | 114,658,870 | |
| |
| Net Asset Value | | | | |
Class A | | | | |
| Net Asset Value, offering and redemption price per share ($96,135,249 ÷ 5,375,574 outstanding shares of beneficial interest, no par value, unlimited number of shares authorized) | | $ | 17.88 | |
Class B | | | | |
| Net Asset Value, offering and redemption price per share ($18,523,621 ÷ 1,037,183 outstanding shares of beneficial interest, no par value, unlimited number of shares authorized) | | $ | 17.86 | |
Statement of Operations
| | | | |
| for the year ended December 31, 2017 | | | | |
| |
| Investment Income | | | | |
| Income: | | | | |
| Dividends (net of foreign taxes withheld of $4,243) | | $ | 2,748,993 | |
| Income distributions — Deutsche Central Cash Management Government Fund | | | 42,309 | |
| Securities lending income, net of borrower rebates | | | 22,279 | |
| Total income | | | 2,813,581 | |
| Expenses: | | | | |
| Management fee | | | 1,010,270 | |
| Administration fee | | | 155,426 | |
| Services to Shareholders | | | 2,120 | |
| Record keeping fee (Class B) | | | 19,399 | |
| Distribution and service fees (Class B) | | | 42,268 | |
| Custodian fee | | | 5,250 | |
| Professional fees | | | 70,624 | |
| Reports to shareholders | | | 23,191 | |
| Trustees’ fees and expenses | | | 10,182 | |
| Other | | | 9,906 | |
| Total expenses before expense reductions | | | 1,348,636 | |
| Expense reductions | | | (2,161 | ) |
| Total expenses after expense reductions | | | 1,346,475 | |
| Net investment income | | | 1,467,106 | |
| |
| Realized and Unrealized Gain (Loss) | | | | |
| Net realized gain (loss) from investments | | | 18,971,820 | |
Change in net unrealized appreciation
(depreciation) on investments | | | (5,654,443 | ) |
| Net gain (loss) | | | 13,317,377 | |
| Net increase (decrease) in net assets resulting from operations | | $ | 14,784,483 | |
The accompanying notes are an integral part of the financial statements.
| | | | |
Deutsche Variable Series II — Deutsche Small Mid Cap Value VIP | | | | | 9 |
Statements of Changes in Net Assets
| | | | | | | | |
| | | Years Ended December 31, | |
Increase (Decrease) in Net Assets | | 2017 | | | 2016 | |
Operations: | | | | | | | | |
Net investment income (loss) | | $ | 1,467,106 | | | $ | 1,525,205 | |
Net realized gain (loss) | | | 18,971,820 | | | | 3,137,095 | |
Change in net unrealized appreciation (depreciation) | | | (5,654,443 | ) | | | 19,608,211 | |
Net increase (decrease) in net assets resulting from operations | | | 14,784,483 | | | | 24,270,511 | |
Distributions to shareholders from: | | | | | | | | |
Net investment income: | | | | | | | | |
Class A | | | (1,100,828 | ) | | | (888,084 | ) |
Class B | | | (59,126 | ) | | | (31,217 | ) |
Net realized gains: | | | | | | | | |
Class A | | | (3,269,636 | ) | | | (15,665,658 | ) |
Class B | | | (353,505 | ) | | | (1,422,898 | ) |
Total distributions | | | (4,783,095 | ) | | | (18,007,857 | ) |
Fund share transactions: | | | | | | | | |
Class A | | | | | | | | |
Proceeds from shares sold | | | 6,806,078 | | | | 8,157,267 | |
Reinvestment of distributions | | | 4,370,464 | | | | 16,553,742 | |
Payments for shares redeemed | | | (77,117,368 | ) | | | (37,741,593 | ) |
Net increase (decrease) in net assets from Class A share transactions | | | (65,940,826 | ) | | | (13,030,584 | ) |
Class B | | | | | | | | |
Proceeds from shares sold | | | 4,800,663 | | | | 2,712,137 | |
Reinvestment of distributions | | | 412,631 | | | | 1,454,115 | |
Payments for shares redeemed | | | (3,308,695 | ) | | | (3,082,291 | ) |
Net increase (decrease) in net assets from Class B share transactions | | | 1,904,599 | | | | 1,083,961 | |
Increase (decrease) in net assets | | | (54,034,839 | ) | | | (5,683,969 | ) |
Net assets at beginning of period | | | 168,693,709 | | | | 174,377,678 | |
Net assets at end of period (including undistributed net investment income of $1,432,026 and $1,465,989, respectively) | | $ | 114,658,870 | | | $ | 168,693,709 | |
| | |
Other Information | | | | | | |
Class A | | | | | | | | |
Shares outstanding at beginning of period | | | 9,208,579 | | | | 10,068,570 | |
Shares sold | | | 399,609 | | | | 525,679 | |
Shares issued to shareholders in reinvestment of distributions | | | 259,221 | | | | 1,110,244 | |
Shares redeemed | | | (4,491,835 | ) | | | (2,495,914 | ) |
Net increase (decrease) in Class A shares | | | (3,833,005 | ) | | | (859,991 | ) |
Shares outstanding at end of period | | | 5,375,574 | | | | 9,208,579 | |
Class B | | | | | | | | |
Shares outstanding at beginning of period | | | 923,852 | | | | 852,173 | |
Shares sold | | | 283,457 | | | | 176,025 | |
Shares issued to shareholders in reinvestment of distributions | | | 24,445 | | | | 97,461 | |
Shares redeemed | | | (194,571 | ) | | | (201,807 | ) |
Net increase (decrease) in Class B shares | | | 113,331 | | | | 71,679 | |
Shares outstanding at end of period | | | 1,037,183 | | | | 923,852 | |
The accompanying notes are an integral part of the financial statements.
| | | | | | |
| | 10 | | | | | | Deutsche Variable Series II — Deutsche Small Mid Cap Value VIP |
Financial Highlights
| | | | | | | | | | | | | | | | | | | | |
| | | Years Ended December 31, | |
| Class A | | 2017 | | | 2016 | | | 2015 | | | 2014 | | | 2013 | |
| | | | | |
Selected Per Share Data | | | | | | | | | | | | | | | | | | | | |
Net asset value, beginning of period | | $ | 16.65 | | | $ | 15.97 | | | $ | 17.79 | | | $ | 17.08 | | | $ | 12.78 | |
Income (loss) from investment operations: | | | | | | | | | | | | | | | | | | | | |
Net investment incomea | | | .17 | | | | .15 | | | | .09 | | | | .05 | | | | .12 | |
Net realized and unrealized gain (loss) | | | 1.55 | | | | 2.34 | | | | (.31 | ) | | | .88 | | | | 4.35 | |
Total from investment operations | | | 1.72 | | | | 2.49 | | | | (.22 | ) | | | .93 | | | | 4.47 | |
Less distributions from: | | | | | | | | | | | | | | | | | | | | |
Net investment income | | | (.12 | ) | | | (.10 | ) | | | (.05 | ) | | | (.14 | ) | | | (.17 | ) |
Net realized gains | | | (.37 | ) | | | (1.71 | ) | | | (1.55 | ) | | | (.08 | ) | | | — | |
Total distributions | | | (.49 | ) | | | (1.81 | ) | | | (1.60 | ) | | | (.22 | ) | | | (.17 | ) |
Net asset value, end of period | | $ | 17.88 | | | $ | 16.65 | | | $ | 15.97 | | | $ | 17.79 | | | $ | 17.08 | |
Total Return (%) | | | 10.52 | b | | | 16.89 | b | | | (1.91 | ) | | | 5.53 | | | | 35.24 | |
| | | | | |
Ratios to Average Net Assets and Supplemental Data | | | | | | | | | | | | | | | | | | | | |
Net assets, end of period ($ millions) | | | 96 | | | | 153 | | | | 161 | | | | 205 | | | | 240 | |
Ratio of expenses before expense reductions (%)c | | | .83 | | | | .83 | | | | .80 | | | | .82 | | | | .82 | |
Ratio of expenses after expense reductions (%)c | | | .83 | | | | .82 | | | | .80 | | | | .82 | | | | .82 | |
Ratio of net investment income (%) | | | .98 | | | | .99 | | | | .51 | | | | .32 | | | | .81 | |
Portfolio turnover rate (%) | | | 35 | | | | 53 | | | | 25 | | | | 34 | | | | 115 | |
| a | Based on average shares outstanding during the period. |
| b | Total return would have been lower had certain expenses not been reduced. |
| c | Expense ratio does not reflect charges and fees associated with the separate account that invests in the Fund or any variable life insurance policy or variable annuity contract for which the Fund is an investment option. |
| | | | | | | | | | | | | | | | | | | | |
| | | Years Ended December 31, | |
| Class B | | 2017 | | | 2016 | | | 2015 | | | 2014 | | | 2013 | |
| | | | | |
Selected Per Share Data | | | | | | | | | | | | | | | | | | | | |
Net asset value, beginning of period | | $ | 16.63 | | | $ | 15.95 | | | $ | 17.77 | | | $ | 17.07 | | | $ | 12.78 | |
Income (loss) from investment operations: | | | | | | | | | | | | | | | | | | | | |
Net investment incomea | | | .11 | | | | .09 | | | | .02 | | | | (.01 | ) | | | .07 | |
Net realized and unrealized gain (loss) | | | 1.55 | | | | 2.34 | | | | (.29 | ) | | | .87 | | | | 4.34 | |
Total from investment operations | | | 1.66 | | | | 2.43 | | | | (.27 | ) | | | .86 | | | | 4.41 | |
Less distributions from: | | | | | | | | | | | | | | | | | | | | |
Net investment income | | | (.06 | ) | | | (.04 | ) | | | — | | | | (.08 | ) | | | (.12 | ) |
Net realized gains | | | (.37 | ) | | | (1.71 | ) | | | (1.55 | ) | | | (.08 | ) | | | — | |
Total distributions | | | (.43 | ) | | | (1.75 | ) | | | (1.55 | ) | | | (.16 | ) | | | (.12 | ) |
Net asset value, end of period | | $ | 17.86 | | | $ | 16.63 | | | $ | 15.95 | | | $ | 17.77 | | | $ | 17.07 | |
Total Return (%) | | | 10.13 | b | | | 16.47 | b | | | (2.21 | ) | | | 5.09 | | | | 34.70 | |
| | | | | |
Ratios to Average Net Assets and Supplemental Data | | | | | | | | | | | | | | | | | | | | |
Net assets, end of period ($ millions) | | | 19 | | | | 15 | | | | 14 | | | | 17 | | | | 20 | |
Ratio of expenses before expense reductions (%)c | | | 1.19 | | | | 1.19 | | | | 1.16 | | | | 1.17 | | | | 1.17 | |
Ratio of expenses after expense reductions (%)c | | | 1.19 | | | | 1.18 | | | | 1.16 | | | | 1.17 | | | | 1.17 | |
Ratio of net investment income (loss) (%) | | | .65 | | | | .57 | | | | .14 | | | | (.04 | ) | | | .45 | |
Portfolio turnover rate (%) | | | 35 | | | | 53 | | | | 25 | | | | 34 | | | | 115 | |
| a | Based on average shares outstanding during the period. |
| b | Total return would have been lower had certain expenses not been reduced. |
| c | Expense ratio does not reflect charges and fees associated with the separate account that invests in the Fund or any variable life insurance policy or variable annuity contract for which the Fund is an investment option. |
The accompanying notes are an integral part of the financial statements.
| | | | |
Deutsche Variable Series II — Deutsche Small Mid Cap Value VIP | | | | | 11 |
Notes to Financial Statements
A. Organization and Significant Accounting Policies
Deutsche Small Mid Cap Value VIP (the “Fund”) is a diversified series of Deutsche Variable Series II (the “Trust”), which is registered under the Investment Company Act of 1940, as amended (the “1940 Act”), as an open-end management investment company organized as a Massachusetts business trust.
Multiple Classes of Shares of Beneficial Interest. The Fund offers two classes of shares (Class A shares and Class B shares). Sales of Class B shares are subject to recordkeeping fees up to 0.15% and Rule 12b-1 fees under the 1940 Act equal to an annual rate of 0.25% of the average daily net assets of the Class B shares of the Fund. Class A shares are not subject to such fees.
Investment income, realized and unrealized gains and losses, and certain fund-level expenses and expense reductions, if any, are borne pro rata on the basis of relative net assets by the holders of all classes of shares except that each class bears certain expenses unique to that class (including the applicable Rule 12b-1 fee and recordkeeping fees). Differences in class-level expenses may result in payment of different per share dividends by class. All shares have equal rights with respect to voting subject to class-specific arrangements.
The Fund’s financial statements are prepared in accordance with accounting principles generally accepted in the United States of America (“U.S. GAAP”) which require the use of management estimates. Actual results could differ from those estimates. The Fund qualifies as an investment company under Topic 946 of Accounting Standards Codification of U.S. GAAP. The policies described below are followed consistently by the Fund in the preparation of its financial statements.
Security Valuation. Investments are stated at value determined as of the close of regular trading on the New York Stock Exchange on each day the exchange is open for trading.
Various inputs are used in determining the value of the Fund’s investments. These inputs are summarized in three broad levels. Level 1 includes quoted prices in active markets for identical securities. Level 2 includes other significant observable inputs (including quoted prices for similar securities, interest rates, prepayment speeds and credit risk). Level 3 includes significant unobservable inputs (including the Fund’s own assumptions in determining the fair value of investments). The level assigned to the securities valuations may not be an indication of the risk or liquidity associated with investing in those securities.
Equity securities are valued at the most recent sale price or official closing price reported on the exchange (U.S. or foreign) or over-the-counter market on which they trade. Securities for which no sales are reported are valued at the calculated mean between the most recent bid and asked quotations on the relevant market or, if a mean cannot be determined, at the most recent bid quotation. Equity securities are generally categorized as Level 1.
Investments in open-end investment companies are valued at their net asset value each business day and are categorized as Level 1.
Securities and other assets for which market quotations are not readily available or for which the above valuation procedures are deemed not to reflect fair value are valued in a manner that is intended to reflect their fair value as determined in accordance with procedures approved by the Board and are generally categorized as Level 3. In accordance with the Fund’s valuation procedures, factors considered in determining value may include, but are not limited to, the type of the security; the size of the holding; the initial cost of the security; the existence of any contractual restrictions on the security’s disposition; the price and extent of public trading in similar securities of the issuer or of comparable companies; quotations or evaluated prices from broker-dealers and/or pricing services; information obtained from the issuer, analysts, and/or the appropriate stock exchange (for exchange-traded securities); an analysis of the company’s or issuer’s financial statements; an evaluation of the forces that influence the issuer and the market(s) in which the security is purchased and sold; and with respect to debt securities, the maturity, coupon, creditworthiness, currency denomination and the movement of the market in which the security is normally traded. The value determined under these procedures may differ from published values for the same securities.
Disclosure about the classification of fair value measurements is included in a table following the Fund’s Investment Portfolio.
Foreign Currency Translations. The books and records of the Fund are maintained in U.S. dollars. Investment securities and other assets and liabilities denominated in a foreign currency are translated into
| | | | | | |
| | 12 | | | | | | Deutsche Variable Series II — Deutsche Small Mid Cap Value VIP |
U.S. dollars at the prevailing exchange rates at period end. Purchases and sales of investment securities, income and expenses are translated into U.S. dollars at the prevailing exchange rates on the respective dates of the transactions.
Net realized and unrealized gains and losses on foreign currency transactions represent net gains and losses between trade and settlement dates on securities transactions, the acquisition and disposition of foreign currencies, and the difference between the amount of net investment income accrued and the U.S. dollar amount actually received. The portion of both realized and unrealized gains and losses on investments that results from fluctuations in foreign currency exchange rates is not separately disclosed but is included with net realized and unrealized gain/appreciation and loss/depreciation on investments.
Securities Lending. Brown Brothers Harriman & Co., as lending agent, lends securities of the Fund to certain financial institutions under the terms of its securities lending agreement. During the term of the loans, the Fund continues to receive interest and dividends generated by the securities and to participate in any changes in their market value. The Fund requires the borrowers of the securities to maintain collateral with the Fund consisting of either cash or liquid, unencumbered assets having a value at least equal to the value of the securities loaned. When the collateral falls below specified amounts, the lending agent will use its best effort to obtain additional collateral on the next business day to meet required amounts under the securities lending agreement. As of period end, any securities on loan were collateralized by cash. During the year ended December 31, 2017 the Fund invested the cash collateral into a joint trading account in affiliated money market funds managed by Deutsche Investment Management Americas Inc. As of December 31, 2017 the Fund invested the cash collateral in Deutsche Government & Agency Securities Portfolio. Deutsche Investment Management Americas Inc. receives a management/administration fee (0.13% annualized effective rate as of December 31, 2017) on the cash collateral invested in Deutsche Government & Agency Securities Portfolio. The Fund receives compensation for lending its securities either in the form of fees or by earning interest on invested cash collateral net of borrower rebates and fees paid to a lending agent. Either the Fund or the borrower may terminate the loan at any time, and the borrower, after notice, is required to return borrowed securities within a standard time period There may be risks of delay and costs in recovery of securities or even loss of rights in the collateral should the borrower of the securities fail financially. If the Fund is not able to recover securities lent, the Fund may sell the collateral and purchase a replacement investment in the market, incurring the risk that the value of the replacement security is greater than the value of the collateral. The Fund is also subject to all investment risks associated with the reinvestment of any cash collateral received, including, but not limited to, interest rate, credit and liquidity risk associated with such investments.
As of December 31, 2017, the Fund had no securities on loan.
Taxes. The Fund’s policy is to comply with the requirements of the Internal Revenue Code, as amended, which are applicable to regulated investment companies and to distribute all of its taxable income to its shareholders.
The Fund has reviewed the tax positions for the open tax years as of December 31, 2017 and has determined that no positions for income tax and/or uncertain tax positions is required in the Fund’s financial statements. The Fund’s federal tax returns for the prior three fiscal years remain open subject to examination by the Internal Revenue Service.
Distribution of Income and Gains. Distributions from net investment income of the Fund, if any, are declared and distributed to shareholders annually. Net realized gains from investment transactions, in excess of available capital loss carryforwards, would be taxable to the Fund if not distributed and, therefore, will be distributed to shareholders at least annually. The Fund may also make additional distributions for tax purposes if necessary.
The timing and characterization of certain income and capital gain distributions are determined annually in accordance with federal tax regulations which may differ from accounting principles generally accepted in the United States of America. These differences primarily relate to income received from Real Estate Investment Trusts and certain securities sold at a loss. As a result, net investment income (loss) and net realized gain (loss) on investment transactions for a reporting period may differ significantly from distributions during such period. Accordingly, the Fund may periodically make reclassifications among certain of its capital accounts without impacting the net asset value of the Fund.
| | | | |
Deutsche Variable Series II — Deutsche Small Mid Cap Value VIP | | | | | 13 |
At December 31, 2017, the Fund’s components of distributable earnings on a tax basis were as follows:
| | | | |
| Undistributed ordinary income* | | $ | 1,402,971 | |
| Undistributed long-term capital gains | | $ | 18,953,744 | |
| Unrealized appreciation (depreciation) on investments | | $ | 21,901,608 | |
At December 31, 2017, the aggregate cost of investments for federal income tax purposes was $92,833,398. The net unrealized appreciation for all investments based on tax cost was $21,901,608. This consisted of aggregate gross unrealized appreciation for all investments in which there was an excess of value over tax cost of $24,836,354 aggregate gross unrealized depreciation for all investments in which was an excess of tax cost over value of $2,934,746.
In addition, the tax character of distributions paid by the Fund is summarized as follows:
| | | | | | | | |
| | | Years Ended December 31, | |
| | | 2017 | | | 2016 | |
| Distributions from ordinary income* | | $ | 1,159,954 | | | $ | 1,718,093 | |
| Distributions from long-term capital gains | | $ | 3,623,141 | | | $ | 16,289,764 | |
| * | For tax purposes, short-term capital gain distributions are considered ordinary income distributions. |
Expenses. Expenses of the Trust arising in connection with a specific fund are allocated to that fund. Other Trust expenses which cannot be directly attributed to a fund are apportioned among the funds in the Trust based upon the relative net assets or other appropriate measures.
Contingencies. In the normal course of business, the Fund may enter into contracts with service providers that contain general indemnification clauses. The Fund’s maximum exposure under these arrangements is unknown, as this would involve future claims that may be made against the Fund that have not yet been made. However, based on experience, the Fund expects the risk of loss to be remote.
Real Estate Investment Trusts. The Fund at its fiscal year end recharacterizes distributions received from a Real Estate Investment Trust (“REIT”) investment based on information provided by the REIT into the following categories: ordinary income, long-term and short-term capital gains, and return of capital. If information is not available timely from a REIT, the recharacterization will be estimated for financial reporting purposes and a recharacterization will be made to the accounting records in the following year when such information becomes available. Distributions received from REITs in excess of income are recorded as either a reduction of cost of investments or realized gains.
Other. Investment transactions are accounted for on a trade date plus one basis for daily net asset value calculations. However, for financial reporting purposes, investment transactions are reported on trade date. Interest income is recorded on the accrual basis. Dividend income is recorded on the ex-dividend date net of foreign withholding taxes. Realized gains and losses from investment transactions are recorded on an identified cost basis. Proceeds from litigation payments, if any, are included in net realized gain (loss) from investments.
B. Purchases and Sales of Securities
During the year ended December 31, 2017 purchases and sales of investment transactions (excluding short-term investments) aggregated $52,632,032 and $114,767,583, respectively.
C. Related Parties
Management Agreement. Under the Investment Management Agreement with Deutsche Investment Management Americas Inc. (“DIMA” or the “Advisor”), an indirect, wholly owned subsidiary of Deutsche Bank AG, the Advisor directs the investments of the Fund in accordance with its investment objectives, policies and restrictions. The Advisor determines the securities, instruments and other contracts relating to investments to be purchased, sold or entered into by the Fund.
| | | | | | |
| | 14 | | | | | | Deutsche Variable Series II — Deutsche Small Mid Cap Value VIP |
Pursuant to the Investment Management Agreement with the Advisor, the Fund pays a monthly management fee based on the Fund’s average daily net assets, computed and accrued daily and payable monthly, at the following annual rates:
| | | | |
| First $250 million | | | .650 | % |
| Next $750 million | | | .620 | % |
| Next $1.5 billion | | | .600 | % |
| Next $2.5 billion | | | .580 | % |
| Next $2.5 billion | | | .550 | % |
| Next $2.5 billion | | | .540 | % |
| Next $2.5 billion | | | .530 | % |
| Over $12.5 billion | | | .520 | % |
Accordingly, for the year ended December 31, 2017 the fee pursuant to the Investment Management Agreement was equivalent to an annual rate (exclusive of any applicable waivers/reimbursements) of 0.65% of the Fund’s average daily net assets.
For the period from January 1, 2017 through September 30, 2017, the Advisor had contractually agreed to waive its fees and/or reimburse certain operating expenses to the extent necessary to maintain the total annual operating expenses (excluding certain expenses such as extraordinary expenses, taxes, brokerage and interest expense) of each class as follows:
| | | | |
| Class A | | | .84 | % |
| Class B | | | 1.20 | % |
Effective October 1, 2017 through September 30, 2018, the Advisor has contractually agreed to waive its fees and/or reimburse certain operating expenses to the extent necessary to maintain the total annual operating expenses (excluding certain expenses such as extraordinary expenses, taxes, brokerage and interest expense) of each class as follows:
| | | | |
| Class A | | | .81 | % |
| Class B | | | 1.16 | % |
For the year ended December 31, 2017, fees waived and/or expenses reimbursed for each class are as follows:
| | | | |
| Class A | | $ | 1,001 | |
| Class B | | | 1,160 | |
| | | $ | 2,161 | |
Administration Fee. Pursuant to an Administrative Services Agreement, DIMA provides most administrative services to the Fund. For all services provided under the Administrative Services Agreement, the Fund pays DIMA an annual fee (“Administration Fee”) of 0.10% of the Fund’s average daily net assets, computed and accrued daily and payable monthly. For the year ended December 31, 2017 the Administration Fee was $155,426, of which $9,810 is unpaid.
Service Provider Fees. Deutsche AM Service Company (“DSC”), an affiliate of the Advisor, is the transfer agent, dividend-paying agent and shareholder service agent for the Fund. Pursuant to a sub-transfer agency agreement between DSC and DST Systems, Inc. (“DST”), DSC has delegated certain transfer agent, dividend-paying agent and shareholder service agent functions to DST. DSC compensates DST out of the shareholder servicing fee it receives from the Fund. For the year ended December 31, 2017 the amounts charged to the Fund by DSC were as follows:
| | | | | | | | |
| Service to Shareholders | | Total
Aggregated | | | Unpaid at
December 31,
2017 | |
| Class A | | $ | 630 | | | $ | 157 | |
| Class B | | | 462 | | | | 116 | |
| | | $ | 1,092 | | | $ | 273 | |
Distribution Service Agreement. Under the Fund’s Class B 12b-1 plan, Deutsche AM Distributors, Inc. (“DDI”) received a fee (“Distribution Service Fee”) of 0.25% of average daily net assets of Class B shares.
| | | | |
Deutsche Variable Series II — Deutsche Small Mid Cap Value VIP | | | | | 15 |
For the year ended December 31, 2017 the Distribution Service Fee aggregated $42,268, of which $3,964 is unpaid.
Typesetting and Filing Service Fees. Under an agreement with DIMA, DIMA is compensated for providing certain pre-press and regulatory filing services to the Fund. For the year ended December 31, 2017 the amount charged to the Fund by DIMA included in the Statement of Operations under “Reports to shareholders” aggregated $10,154, of which $4,275 is unpaid.
Trustees’ Fees and Expenses. The Fund paid retainer fees to each Trustee not affiliated with the Advisor, plus specified amounts to the Board Chairperson and Vice Chairperson and to each committee Chairperson.
Affiliated Cash Management Vehicles. The Fund may invest uninvested cash balances in Deutsche Central Cash Management Government Fund and Deutsche Variable NAV Money Fund, affiliated money market funds which are managed by the Advisor. Each affiliated money market fund is managed in accordance with Rule 2a-7 under the 1940 Act, which governs the quality, maturity, diversity and liquidity of instruments in which a money market fund may invest. Deutsche Central Cash Management Government Fund seeks to maintain a stable net asset value, and Deutsche Variable NAV Money Fund maintains a floating net asset value. The Fund indirectly bears its proportionate share of the expenses of each affiliated money market fund in which it invests. Deutsche Central Cash Management Government Fund does not pay the Advisor an investment management fee. To the extent that Deutsche Variable NAV Money Fund pays an investment management fee to the Advisor, the Advisor will waive an amount of the investment management fee payable to the Advisor by the Fund equal to the amount of the investment management fee payable on the Fund’s assets invested in Deutsche Variable NAV Money Fund.
D. Ownership of the Fund
At December 31, 2017 one participating insurance company was owner of record of 10% or more of the total outstanding Class A shares of the Fund, owning 67%. Four participating insurance companies were owners of record of 10% or more of the total outstanding Class B shares of the Fund, each owning 28%, 22%, 18% and 13%.
E. Line of Credit
The Fund and other affiliated funds (the “Participants”) share in a $400 million revolving credit facility provided by a syndication of banks. The Fund may borrow for temporary or emergency purposes, including the meeting of redemption requests that otherwise might require the untimely disposition of securities. The Participants are charged an annual commitment fee which is allocated based on net assets, among each of the Participants. Interest is calculated at a rate per annum equal to the sum of the Federal Funds Rate plus 1.25 percent plus if the one-month LIBOR exceeds the Federal Funds Rate, the amount of such excess. The Fund may borrow up to a maximum of 33 percent of its net assets under the agreement. The Fund had no outstanding loans at December 31, 2017.
| | | | | | |
| | 16 | | | | | | Deutsche Variable Series II — Deutsche Small Mid Cap Value VIP |
Report of Independent Registered Public Accounting Firm
To the Board of Trustees of Deutsche Variable Series II and the Shareholders of Deutsche Small Mid Cap
Value VIP:
Opinion on the Financial Statements
We have audited the accompanying statement of assets and liabilities of Deutsche Small Mid Cap Value VIP (the “Fund”) (one of the funds constituting the Deutsche Variable Series II) (the “Trust”), including the schedule of investments, as of December 31, 2017, and the related statement of operations for the year then ended, the statements of changes in net assets for each of the two years in the period then ended, the financial highlights for each of the five years in the period then ended and the related notes (collectively referred to as the “financial statements”). In our opinion, the financial statements present fairly, in all material respects, the financial position of the Fund (one of the portfolios constituting the Deutsche Variable Series II) at December 31, 2017, the results of its operations for the year then ended, the changes in its net assets for each of the two years in the period then ended and its financial highlights for each of the five years in the period then ended, in conformity with U.S. generally accepted accounting principles.
Basis for Opinion
These financial statements are the responsibility of the Trust’s management. Our responsibility is to express an opinion on the Fund’s financial statements based on our audits. We are a public accounting firm registered with the Public Company Accounting Oversight Board (United States) (“PCAOB”) and are required to be independent with respect to the Trust in accordance with the U.S. federal securities laws and the applicable rules and regulations of the Securities and Exchange Commission and the PCAOB.
We conducted our audits in accordance with the standards of the PCAOB. Those standards require that we plan and perform the audit to obtain reasonable assurance about whether the financial statements are free of material misstatement, whether due to error or fraud. The Trust is not required to have, nor were we engaged to perform, an audit of the Trust’s internal control over financial reporting. As part of our audits, we are required to obtain an understanding of internal control over financial reporting, but not for the purpose of expressing an opinion on the effectiveness of the Trust’s internal control over financial reporting. Accordingly, we express no such opinion.
Our audits included performing procedures to assess the risks of material misstatement of the financial statements, whether due to error or fraud, and performing procedures that respond to those risks. Such procedures included examining, on a test basis, evidence regarding the amounts and disclosures in the financial statements. Our procedures included confirmation of securities owned as of December 31, 2017, by correspondence with the custodian and brokers or by other appropriate auditing procedures where replies from brokers were not received.
Our audits also included evaluating the accounting principles used and significant estimates made by management, as well as evaluating the overall presentation of the financial statements. We believe that our audits provide a reasonable basis for our opinion.

We have served as the auditor of one or more investment companies in the Deutsche family of funds since at least 1979, but we are unable to determine the specific year.
Boston, Massachusetts
February 15, 2018
| | | | |
Deutsche Variable Series II — Deutsche Small Mid Cap Value VIP | | | | | 17 |
| | |
| Information About Your Fund’s Expenses | | (Unaudited) |
As an investor of the Fund, you incur two types of costs: ongoing expenses and transaction costs. Ongoing expenses include management fees, distribution and service (12b-1) fees and other Fund expenses. Examples of transaction costs include contract charges, which are not shown in this section. The following tables are intended to help you understand your ongoing expenses (in dollars) of investing in the Fund and to help you compare these expenses with the ongoing expenses of investing in other mutual funds. In the most recent six-month period, the Fund limited these expenses; had it not done so, expenses would have been higher. The example in the table is based on an investment of $1,000 invested at the beginning of the six-month period and held for the entire period (July 1, 2017 to December 31, 2017).
The tables illustrate your Fund’s expenses in two ways:
| –Actual | Fund Return. This helps you estimate the actual dollar amount of ongoing expenses (but not transaction costs) paid on a $1,000 investment in the Fund using the Fund’s actual return during the period. To estimate the expenses you paid over the period, simply divide your account value by $1,000 (for example, an $8,600 account value divided by $1,000 = 8.6), then multiply the result by the number in the “Expenses Paid per $1,000” line under the share class you hold. |
| –Hypothetical | 5% Fund Return. This helps you to compare your Fund’s ongoing expenses (but not transaction costs) with those of other mutual funds using the Fund’s actual expense ratio and a hypothetical rate of return of 5% per year before expenses. Examples using a 5% hypothetical Fund return may be found in the shareholder reports of other mutual funds. The hypothetical account values and expenses may not be used to estimate the actual ending account balance or expenses you paid for the period. |
Please note that the expenses shown in these tables are meant to highlight your ongoing expenses only and do not reflect any transaction costs. The “Expenses Paid per $1,000” line of the tables is useful in comparing ongoing expenses only and will not help you determine the relative total expense of owning different funds. If these transaction costs had been included, your costs would have been higher.
| | | | | | | | |
| Expenses and Value of a $1,000 Investment for the six months ended December 31, 2017 | |
| | |
| Actual Fund Return | | | Class A | | | | Class B | |
| Beginning Account Value 7/1/17 | | $ | 1,000.00 | | | $ | 1,000.00 | |
| Ending Account Value 12/31/17 | | $ | 1,082.30 | | | $ | 1,080.50 | |
| Expenses Paid per $1,000* | | $ | 4.36 | | | $ | 6.19 | |
| | |
| Hypothetical 5% Fund Return | | | Class A | | | | Class B | |
| Beginning Account Value 7/1/17 | | $ | 1,000.00 | | | $ | 1,000.00 | |
| Ending Account Value 12/31/17 | | $ | 1,021.02 | | | $ | 1,019.26 | |
| Expenses Paid per $1,000* | | $ | 4.23 | | | $ | 6.01 | |
| * | Expenses are equal to the Fund’s annualized expense ratio for each share class, multiplied by the average account value over the period, multiplied by 184 (the number of days in the most recent six-month period), then divided by 365. |
| | | | | | | | |
| Annualized Expense Ratios | | Class A | | | Class B | |
| Deutsche Variable Series II — Deutsche Small Mid Cap Value VIP | | | .83 | % | | | 1.18 | % |
For more information, please refer to the Fund’s prospectus.
These tables do not reflect charges and fees (“contract charges”) associated with the separate account that invests in the Fund or any variable life insurance policy or variable annuity contract for which the Fund is an investment option.
For an analysis of the fees associated with an investment in the fund or similar funds, please refer to the current and hypothetical expense calculators for Variable Insurance Products which can be found at deutschefunds.com/EN/resources/calculators.jsp.
| | | | | | |
| | 18 | | | | | | Deutsche Variable Series II — Deutsche Small Mid Cap Value VIP |
| | |
| Tax Information | | (Unaudited) |
Please consult a tax advisor if you have questions about federal or state income tax laws, or on how to prepare your tax returns. If you have specific questions about your account, please contact your insurance provider.
The Fund paid distributions of $0.37 per share from net long-term capital gains during its year ended December 31, 2017.
Pursuant to Section 852 of the Internal Revenue Code, the Fund designates $20,892,000 as capital gain dividends for its year ended December 31, 2017.
For corporate shareholders, 100% of the ordinary dividends (i.e., income dividends plus short-term capital gains) paid during the Fund’s fiscal year ended December 31, 2017, qualified for the dividends received deduction.
Proxy Voting
The Trust’s policies and procedures for voting proxies for portfolio securities and information about how the Trust voted proxies related to its portfolio securities during the most recent 12-month period ended June 30 are available on our Web site — deutschefunds.com (click on “proxy voting” at the bottom of the page) — or on the SEC’s Web site — sec.gov. To obtain a written copy of the Trust’s policies and procedures without charge, upon request, call us toll free at (800) 728-3337.
| | | | |
Deutsche Variable Series II — Deutsche Small Mid Cap Value VIP | | | | | 19 |
Advisory Agreement Board Considerations and Fee Evaluation
The Board of Trustees (hereinafter referred to as the “Board” or “Trustees”) approved the renewal of Deutsche Small Mid Cap Value VIP’s (the “Fund”) investment management agreement (the “Agreement”) with Deutsche Investment Management Americas Inc. (“DIMA”) in September 2017.
In terms of the process that the Board followed prior to approving the Agreement, shareholders should know that:
| – | During the entire process, all of the Fund’s Trustees were independent of DIMA and its affiliates (the “Independent Trustees”). |
| – | The Board met frequently during the past year to discuss fund matters and dedicated a substantial amount of time to contract review matters. Over the course of several months, the Board’s Contract Committee reviewed extensive materials received from DIMA, independent third parties and independent counsel. These materials included an analysis of the Fund’s performance, fees and expenses, and profitability from a fee consultant retained by the Fund’s Independent Trustees (the “Fee Consultant”). Based on its evaluation of the information provided, the Contract Committee presented its findings and recommendations to the Board. The Board then reviewed the Contract Committee’s findings and recommendations. |
| – | The Board also received extensive information throughout the year regarding performance of the Fund. |
| – | The Independent Trustees regularly met privately with counsel to discuss contract review and other matters. In addition, the Independent Trustees were advised by the Fee Consultant in the course of their review of the Fund’s contractual arrangements and considered a comprehensive report prepared by the Fee Consultant in connection with their deliberations. |
| – | In connection with reviewing the Agreement, the Board also reviewed the terms of the Fund’s Rule 12b-1 plan, distribution agreement, administrative services agreement, transfer agency agreement and other material service agreements. |
In connection with the contract review process, the Contract Committee and the Board considered the factors discussed below, among others. The Board also considered that DIMA and its predecessors have managed the Fund since its inception, and the Board believes that a long-term relationship with a capable, conscientious advisor is in the best interests of the Fund. The Board considered, generally, that shareholders chose to invest or remain invested in the Fund knowing that DIMA managed the Fund, and that the Agreement was approved by the Fund’s shareholders. DIMA is part of Deutsche Bank AG’s (“Deutsche Bank”) Asset Management (“Deutsche AM”) division. Deutsche AM is a global asset management business that offers a wide range of investing expertise and resources, including research capabilities in many countries throughout the world.
As part of the contract review process, the Board carefully considered the fees and expenses of each Deutsche fund overseen by the Board in light of the fund’s performance. In many cases, this led to the negotiation and implementation of expense caps. As part of these negotiations, the Board indicated that it would consider relaxing these caps in future years following sustained improvements in performance, among other considerations.
While shareholders may focus primarily on fund performance and fees, the Fund’s Board considers these and many other factors, including the quality and integrity of DIMA’s personnel and administrative support services provided by DIMA, such as back-office operations, fund valuations, and compliance policies and procedures.
Nature, Quality and Extent of Services. The Board considered the terms of the Agreement, including the scope of advisory services provided under the Agreement. The Board noted that, under the Agreement, DIMA provides portfolio management services to the Fund and that, pursuant to a separate administrative services agreement, DIMA provides administrative services to the Fund. The Board considered the experience and skills of senior management and investment personnel and the resources made available to such personnel. The Board reviewed the Fund’s performance over short-term and long-term periods and compared those returns to various agreed-upon performance measures, including market index(es) and a peer universe compiled using information supplied by Morningstar Direct (“Morningstar”), an independent fund data service. The Board also noted that it has put into place a process of identifying “Funds in Review” (e.g., funds performing poorly relative to a peer universe), and receives additional reporting from DIMA regarding such funds and, where appropriate, DIMA’s plans to address underperformance. The Board
| | | | | | |
| | 20 | | | | | | Deutsche Variable Series II — Deutsche Small Mid Cap Value VIP |
believes this process is an effective manner of identifying and addressing underperforming funds. Based on the information provided, the Board noted that, for the one-, three- and five-year periods ended December 31, 2016, the Fund’s performance (Class A shares) was in the 3rd quartile, 4th quartile and 4th quartile, respectively, of the applicable Morningstar universe (the 1st quartile being the best performers and the 4th quartile being the worst performers). The Board also observed that the Fund has underperformed its benchmark in the one-, three- and five-year periods ended December 31, 2016. The Board noted the disappointing investment performance of the Fund in some past periods and continued to discuss with senior management of DIMA the factors contributing to such underperformance and actions being taken to improve performance. The Board recognized the efforts by DIMA in recent years to enhance its investment platform and improve long-term performance across the Deutsche fund complex.
Fees and Expenses. The Board considered the Fund’s investment management fee schedule, operating expenses and total expense ratios, and comparative information provided by Broadridge Financial Solutions, Inc. (“Broadridge”) and the Fee Consultant regarding investment management fee rates paid to other investment advisors by similar funds (1st quartile being the most favorable and 4th quartile being the least favorable). With respect to management fees paid to other investment advisors by similar funds, the Board noted that the contractual fee rates paid by the Fund, which include a 0.10% fee paid to DIMA under the Fund’s administrative services agreement, were equal to the median of the applicable Broadridge peer group (based on Broadridge data provided as of December 31, 2016). The Board noted that the Fund’s Class A shares total (net) operating expenses were expected to be lower than the median (2nd quartile) of the applicable Broadridge expense universe (based on Broadridge data provided as of December 31, 2016, and analyzing Broadridge expense universe Class A (net) expenses less any applicable 12b-1 fees) (“Broadridge Universe Expenses”). The Board also reviewed data comparing each share class’s total (net) operating expenses to the applicable Broadridge Universe Expenses. The Board noted that the expense limitations agreed to by DIMA were expected to help the Fund’s total (net) operating expenses remain competitive. The Board considered the Fund’s management fee rate as compared to fees charged by DIMA to a comparable Deutsche U.S. registered fund (“Deutsche Funds”) and considered differences between the Fund and the comparable Deutsche Fund. The information requested by the Board as part of its review of fees and expenses also included information about institutional accounts (including any sub-advised funds and accounts) and funds offered primarily to European investors (“Deutsche Europe funds”) managed by Deutsche AM. The Board noted that DIMA indicated that Deutsche AM does not manage any institutional accounts or Deutsche Europe funds comparable to the Fund.
On the basis of the information provided, the Board concluded that management fees were reasonable and appropriate in light of the nature, quality and extent of services provided by DIMA.
Profitability. The Board reviewed detailed information regarding revenues received by DIMA under the Agreement. The Board considered the estimated costs to DIMA, and pre-tax profits realized by DIMA, from advising the Deutsche Funds, as well as estimates of the pre-tax profits attributable to managing the Fund in particular. The Board also received information regarding the estimated enterprise-wide profitability of DIMA and its affiliates with respect to all fund services in totality and by fund. The Board and the Fee Consultant reviewed DIMA’s methodology in allocating its costs to the management of the Fund. Based on the information provided, the Board concluded that the pre-tax profits realized by DIMA in connection with the management of the Fund were not unreasonable. The Board also reviewed certain publicly available information regarding the profitability of certain similar investment management firms. The Board noted that, while information regarding the profitability of such firms is limited (and in some cases is not necessarily prepared on a comparable basis), DIMA and its affiliates’ overall profitability with respect to the Deutsche Funds (after taking into account distribution and other services provided to the funds by DIMA and its affiliates) was lower than the overall profitability levels of most comparable firms for which such data was available.
Economies of Scale. The Board considered whether there are economies of scale with respect to the management of the Fund and whether the Fund benefits from any economies of scale. The Board noted that the Fund’s investment management fee schedule includes fee breakpoints. The Board concluded that the Fund’s fee schedule represents an appropriate sharing between the Fund and DIMA of such economies of scale as may exist in the management of the Fund at current asset levels.
Other Benefits to DIMA and Its Affiliates. The Board also considered the character and amount of other incidental benefits received by DIMA and its affiliates, including any fees received by DIMA for administrative services provided to the Fund, any fees received by an affiliate of DIMA for transfer agency services provided to the Fund and any fees received by an affiliate of DIMA for distribution services. The Board also considered
| | | | |
Deutsche Variable Series II — Deutsche Small Mid Cap Value VIP | | | | | 21 |
benefits to DIMA related to brokerage and soft-dollar allocations, including allocating brokerage to pay for research generated by parties other than the executing broker dealers, which pertain primarily to funds investing in equity securities. In addition, the Board considered the incidental public relations benefits to DIMA related to Deutsche Funds advertising and cross-selling opportunities among DIMA products and services. The Board considered these benefits in reaching its conclusion that the Fund’s management fees were reasonable.
Compliance. The Board considered the significant attention and resources dedicated by DIMA to documenting and enhancing its compliance processes in recent years. The Board noted in particular (i) the experience, seniority and time commitment of the individuals serving as DIMA’s and the Fund’s chief compliance officers; (ii) the large number of DIMA compliance personnel; and (iii) the substantial commitment of resources by DIMA and its affiliates to compliance matters.
Based on all of the information considered and the conclusions reached, the Board unanimously determined that the continuation of the Agreement is in the best interests of the Fund. In making this determination, the Board did not give particular weight to any single factor identified above. The Board considered these factors over the course of numerous meetings, certain of which were in executive session with only the Independent Trustees and counsel present. It is possible that individual Independent Trustees may have weighed these factors differently in reaching their individual decisions to approve the continuation of the Agreement.
| | | | | | |
| | 22 | | | | | | Deutsche Variable Series II — Deutsche Small Mid Cap Value VIP |
Board Members and Officers
The following table presents certain information regarding the Board Members and Officers of the Fund. Each Board Member’s year of birth is set forth in parentheses after his or her name. Unless otherwise noted, (i) each Board Member has engaged in the principal occupation(s) noted in the table for at least the most recent five years, although not necessarily in the same capacity; and (ii) the address of each Independent Board Member is c/o Keith R. Fox, Deutsche Funds Board Chair, c/o Thomas R. Hiller, Ropes & Gray LLP, Prudential Tower, 800 Boylston Street, Boston, MA 02199-3600. Except as otherwise noted below, the term of office for each Board Member is until the election and qualification of a successor, or until such Board Member sooner dies, resigns, is removed or as otherwise provided in the governing documents of the Fund. Because the Fund does not hold an annual meeting of shareholders, each Board Member will hold office for an indeterminate period. The Board Members may also serve in similar capacities with other funds in the fund complex.
| | | | | | | | |
| Independent Board Members | | | | | | | |
Name, Year of Birth,
Position with the Fund and
Length of Time Served1 | | Business Experience and Directorships During the Past Five Years | | Number of
Funds in
Deutsche
Fund
Complex
Overseen | | | Other
Directorships
Held by Board
Member |
Keith R. Fox, CFA (1954) Chairperson since 2017, and Board Member since 1996 | | Managing General Partner, Exeter Capital Partners (a series of private investment funds) (since 1986). Directorships: Progressive International Corporation (kitchen goods importer and distributor); The Kennel Shop (retailer); former Chairman, National Association of Small Business Investment Companies; former Directorships: BoxTop Media Inc. (advertising); Sun Capital Advisers Trust (mutual funds) (2011–2012) | | | 89 | | | — |
Kenneth C. Froewiss (1945) Vice Chairperson since 2017, and Board Member since 2001 | | Retired Clinical Professor of Finance, NYU Stern School of Business (1997–2014); Member, Finance Committee, Association for Asian Studies (2002–present); Director, Mitsui Sumitomo Insurance Group (US) (2004–present); prior thereto, Managing Director, J.P. Morgan (investment banking firm) (until 1996) | | | 92 | | | — |
John W. Ballantine (1946) Board Member since 1999 | | Retired; formerly, Executive Vice President and Chief Risk Management Officer, First Chicago NBD Corporation/The First National Bank of Chicago (1996–1998); Executive Vice President and Head of International Banking (1995–1996); former Directorships: Director and former Chairman of the Board, Healthways, Inc.2 (population well-being and wellness services) (2003–2014); Stockwell Capital Investments PLC (private equity); Enron Corporation; FNB Corporation; Tokheim Corporation; First Oak Brook Bancshares, Inc. and Oak Brook Bank; Prisma Energy International. Not-for-Profit Director, Trustee: Palm Beach Civic Association; Public Radio International; Window to the World Communications (public media); Harris Theater for Music and Dance (Chicago) | | | 89 | | | Portland
General
Electric2
(utility
company)
(2003–
present) |
Henry P. Becton, Jr. (1943) Board Member since 1990 | | Vice Chair and former President, WGBH Educational Foundation. Directorships: Public Radio International; Public Radio Exchange (PRX); The Pew Charitable Trusts (charitable organization); former Directorships: Becton Dickinson and Company2 (medical technology company); Belo Corporation2 (media company); The PBS Foundation; Association of Public Television Stations; Boston Museum of Science; American Public Television; Concord Academy; New England Aquarium; Mass. Corporation for Educational Telecommunications; Committee for Economic Development; Public Broadcasting Service; Connecticut College; North Bennett Street School (Boston) | | | 89 | | | — |
Dawn-Marie Driscoll (1946) Board Member since 1987 | | Emeritus Executive Fellow, Center for Business Ethics, Bentley University; formerly: President, Driscoll Associates (consulting firm); Partner, Palmer & Dodge (law firm) (1988–1990); Vice President of Corporate Affairs and General Counsel, Filene’s (retail) (1978–1988). Directorships: Advisory Board, Center for Business Ethics, Bentley University; Trustee and former Chairman of the Board, Southwest Florida Community Foundation (charitable organization); former Directorships: ICI Mutual Insurance Company (2007–2015); Sun Capital Advisers Trust (mutual funds) (2007–2012), Investment Company Institute (audit, executive, nominating committees) and Independent Directors Council (governance, executive committees) | | | 89 | | | — |
| | | | |
Deutsche Variable Series II — Deutsche Small Mid Cap Value VIP | | | | | 23 |
| | | | | | | | |
Name, Year of Birth,
Position with the Fund and
Length of Time Served1 | | Business Experience and Directorships During the Past Five Years | | Number of
Funds in
Deutsche
Fund
Complex
Overseen | | | Other
Directorships
Held by Board
Member |
Paul K. Freeman (1950) Board Member since 1993 | | Consultant, World Bank/Inter-American Development Bank; Independent Directors Council (former chair); Investment Company Institute (executive and nominating committees); formerly: Chairman of Education Committee of Independent Directors Council; Project Leader, International Institute for Applied Systems Analysis (1998–2001); Chief Executive Officer, The Eric Group, Inc. (environmental insurance) (1986–1998); Directorships: Denver Zoo Foundation (December 2012–present); Knoebel Institute for Healthy Aging, University of Denver (2017–present); former Directorships: Prisma Energy International | | | 89 | | | — |
Richard J. Herring (1946) Board Member since 1990 | | Jacob Safra Professor of International Banking and Professor, Finance Department, The Wharton School, University of Pennsylvania (since July 1972); Co-Director, Wharton Financial Institutions Center; formerly: Vice Dean and Director, Wharton Undergraduate Division (July 1995–June 2000); Director, Lauder Institute of International Management Studies (July 2000–June 2006) | | | 89 | | | Director,
Aberdeen
Singapore
and Japan
Funds (since
2007);
Independent
Director of
Barclays
Bank
Delaware
(since
September
2010) |
William McClayton (1944) Board Member since 2004 | | Private equity investor (since October 2009); previously, Managing Director, Diamond Management & Technology Consultants, Inc. (global consulting firm) (2001–2009); Directorship: Board of Managers, YMCA of Metropolitan Chicago; formerly: Senior Partner, Arthur Andersen LLP (accounting) (1966–2001); Trustee, Ravinia Festival | | | 89 | | | — |
Rebecca W. Rimel (1951) Board Member since 1995 | | President, Chief Executive Officer and Director, The Pew Charitable Trusts (charitable organization) (1994–present); formerly: Executive Vice President, The Glenmede Trust Company (investment trust and wealth management) (1983–2004); Board Member, Investor Education (charitable organization) (2004–2005); Trustee, Executive Committee, Philadelphia Chamber of Commerce (2001–2007); Director, Viasys Health Care2 (January 2007–June 2007); Trustee, Thomas Jefferson Foundation (charitable organization) (1994–2012) | | | 89 | | | Director,
Becton
Dickinson
and
Company2
(medical
technology
company)
(2012–
present);
Director,
BioTelemetry
Inc2 (health
care) (2009–
present) |
William N. Searcy, Jr. (1946) Board Member since 1993 | | Private investor since October 2003; formerly: Pension & Savings Trust Officer, Sprint Corporation2 (telecommunications) (November 1989–September 2003); Trustee, Sun Capital Advisers Trust (mutual funds) (1998–2012) | | | 89 | | | — |
Jean Gleason Stromberg (1943) Board Member since 1997 | | Retired. Formerly, Consultant (1997–2001); Director, Financial Markets U.S. Government Accountability Office (1996–1997); Partner, Norton Rose Fulbright, L.L.P. (law firm) (1978–1996); former Directorships: The William and Flora Hewlett Foundation (charitable organization) (2000–2015); Service Source, Inc. (nonprofit), Mutual Fund Directors Forum (2002–2004), American Bar Retirement Association (funding vehicle for retirement plans) (1987–1990 and 1994–1996) | | | 89 | | | — |
| | | | | | |
| | 24 | | | | | | Deutsche Variable Series II — Deutsche Small Mid Cap Value VIP |
| | |
| Officers4 | | |
Name, Year of Birth,
Position with the Fund and
Length of Time Served5 | | Business Experience and Directorships During the Past Five Years |
Hepsen Uzcan6,9 (1974) President and Chief Executive Officer, 2017–present Assistant Secretary, 2013–present | | Director,3 Deutsche Asset Management; formerly: Vice President for the Deutsche funds (2016–2017) |
John Millette8 (1962) Vice President and Secretary, 1999–present | | Director,3 Deutsche Asset Management; Chief Legal Officer, Deutsche Investment Management Americas Inc. (2015–present); and Director and Vice President, Deutsche AM Trust Company (since 2016); formerly: Secretary, Deutsche Investment Management Americas Inc. (2015–2017) |
Paul H. Schubert6 (1963) Chief Financial Officer, 2004–present Treasurer, 2005–present | | Managing Director,3 Deutsche Asset Management, and Chairman, Director and President, Deutsche AM Trust Company (since 2013); Vice President, Deutsche AM Distributors, Inc. (since 2016); Director, Deutsche AM Service Company (since 2017); Director and President, DB Investment Managers, Inc. (since 2017); formerly: Director, Deutsche AM Trust Company (2004–2013) |
Caroline Pearson8 (1962) Chief Legal Officer, 2010–present | | Managing Director,3 Deutsche Asset Management; formerly: Secretary, Deutsche AM Distributors, Inc.; and Secretary, Deutsche AM Service Company |
Scott D. Hogan8 (1970) Chief Compliance Officer, 2016–present | | Director,3 Deutsche Asset Management |
Wayne Salit7 (1967) Anti-Money Laundering Compliance Officer, 2014–present | | Director,3 Deutsche Asset Management; formerly: Managing Director, AML Compliance Officer at BNY Mellon (2011–2014); and Director, AML Compliance Officer at Deutsche Bank (2004–2011) |
Sheila Cadogan8 (1966) Assistant Treasurer, since July 12, 2017 | | Director,3 Deutsche Asset Management |
Paul Antosca8 (1957) Assistant Treasurer, 2007–present | | Director,3 Deutsche Asset Management |
Diane Kenneally8 (1966) Assistant Treasurer, 2007–present | | Director,3 Deutsche Asset Management |
| 1 | The length of time served represents the year in which the Board Member joined the board of one or more Deutsche funds currently overseen by the Board. |
| 2 | A publicly held company with securities registered pursuant to Section 12 of the Securities Exchange Act of 1934. |
| 3 | Executive title, not a board directorship. |
| 4 | As a result of their respective positions held with the Advisor, these individuals are considered “interested persons” of the Advisor within the meaning of the 1940 Act. Interested persons receive no compensation from the Fund. |
| 5 | The length of time served represents the year in which the officer was first elected in such capacity for one or more Deutsche funds. |
| 6 | Address: 345 Park Avenue, New York, NY 10154. |
| 7 | Address: 60 Wall Street, New York, NY 10005. |
| 8 | Address: One International Place, Boston, MA 02110. |
| 9 | Appointed President and Chief Executive Officer effective December 1, 2017. |
The Fund’s Statement of Additional Information (“SAI”) includes additional information about the Board Members. The SAI is available, without charge, upon request. If you would like to request a copy of the SAI, you may do so by calling the following toll-free number: (800) 728-3337.
| | | | |
Deutsche Variable Series II — Deutsche Small Mid Cap Value VIP | | | | | 25 |
| | |
 | | |
VS2SMCV-2 (R-025829-7 2/18) | | |
| | |
| ITEM 2. | CODE OF ETHICS |
| | |
| | As of the end of the period covered by this report, the registrant has adopted a code of ethics, as defined in Item 2 of Form N-CSR that applies to its Principal Executive Officer and Principal Financial Officer. There have been no amendments to, or waivers from, a provision of the code of ethics during the period covered by this report that would require disclosure under Item 2. A copy of the code of ethics is filed as an exhibit to this Form N-CSR. |
| | |
| ITEM 3. | AUDIT COMMITTEE FINANCIAL EXPERT |
| | |
| | The fund’s audit committee is comprised solely of trustees who are "independent" (as such term has been defined by the Securities and Exchange Commission ("SEC") in regulations implementing Section 407 of the Sarbanes-Oxley Act (the "Regulations")). The fund’s Board of Trustees has determined that there are several "audit committee financial experts" (as such term has been defined by the Regulations) serving on the fund’s audit committee including Mr. Paul K. Freeman, the chair of the fund’s audit committee. An “audit committee financial expert” is not an “expert” for any purpose, including for purposes of Section 11 of the Securities Act of 1933 and the designation or identification of a person as an “audit committee financial expert” does not impose on such person any duties, obligations or liability that are greater than the duties, obligations and liability imposed on such person as a member of the audit committee and board of directors in the absence of such designation or identification. |
| | |
| ITEM 4. | PRINCIPAL ACCOUNTANT FEES AND SERVICES |
| | |
deutsche variable series II
form n-csr disclosure re: AUDIT FEES
The following table shows the amount of fees that Ernst & Young LLP (“EY”), the Fund’s Independent Registered Public Accounting Firm, billed to the Fund during the Fund’s last two fiscal years. The Audit Committee approved in advance all audit services and non-audit services that EY provided to the Fund.
Services that the Fund’s Independent Registered Public Accounting Firm Billed to the Fund
Fiscal Year
Ended
December 31, | Audit Fees Billed to Fund | Audit-Related
Fees Billed to Fund | Tax Fees Billed to Fund | All
Other Fees Billed to Fund |
| 2017 | $631,691 | $0 | $71,822 | $0 |
| 2016 | $644,583 | $0 | $73,288 | $0 |
The above “Tax Fees” were billed for professional services rendered for tax return preparation.
Services that the Fund’s Independent Registered Public Accounting Firm Billed to the Adviser and Affiliated Fund Service Providers
The following table shows the amount of fees billed by EY to Deutsche Investment Management Americas, Inc. (“DIMA” or the “Adviser”), and any entity controlling, controlled by or under common control with DIMA (“Control Affiliate”) that provides ongoing services to the Fund (“Affiliated Fund Service Provider”), for engagements directly related to the Fund’s operations and financial reporting, during the Fund’s last two fiscal years.
Fiscal Year
Ended
December 31, | Audit-Related
Fees Billed to Adviser and Affiliated Fund Service Providers | Tax Fees Billed to Adviser and Affiliated Fund Service Providers | All
Other Fees Billed to Adviser and Affiliated Fund Service Providers |
| 2017 | $0 | $502,238 | $0 |
| 2016 | $0 | $449,529 | $0 |
The above “Tax Fees” were billed in connection with tax compliance services and agreed upon procedures. All other engagement fees were billed for services in connection with agreed upon procedures for DIMA and other related entities.
Non-Audit Services
The following table shows the amount of fees that EY billed during the Fund’s last two fiscal years for non-audit services. The Audit Committee pre-approved all non-audit services that EY provided to the Adviser and any Affiliated Fund Service Provider that related directly to the Fund’s operations and financial reporting. The Audit Committee requested and received information from EY about any non-audit services that EY rendered during the Fund’s last fiscal year to the Adviser and any Affiliated Fund Service Provider. The Committee considered this information in evaluating EY’s independence.
Fiscal Year
Ended December 31, | Total
Non-Audit Fees Billed to Fund (A) | Total Non-Audit Fees billed to Adviser and Affiliated Fund Service Providers (engagements related directly to the operations and financial reporting of the Fund) (B) | Total Non-Audit Fees billed to Adviser and Affiliated Fund Service Providers (all other engagements) (C) | Total of (A), (B)
and (C) |
| 2017 | $71,822 | $502,238 | $606,585 | $1,180,645 |
| 2016 | $73,288 | $449,529 | $595,469 | $1,118,286 |
All other engagement fees were billed for services in connection with agreed upon procedures and tax compliance for DIMA and other related entities.
Audit Committee Pre-Approval Policies and Procedures. Generally, each Fund’s Audit Committee must pre approve (i) all services to be performed for a Fund by a Fund’s Independent Registered Public Accounting Firm and (ii) all non-audit services to be performed by a Fund’s Independent Registered Public Accounting Firm for the DIMA Entities with respect to operations and financial reporting of the Fund, except that the Chairperson or Vice Chairperson of each Fund’s Audit Committee may grant the pre-approval for non-audit services described in items (i) and (ii) above for non-prohibited services for engagements of less than $100,000. All such delegated pre approvals shall be presented to each Fund’s Audit Committee no later than the next Audit Committee meeting.
There were no amounts that were approved by the Audit Committee pursuant to the de minimis exception under Rule 2-01 of Regulation S-X.
According to the registrant’s principal Independent Registered Public Accounting Firm, substantially all of the principal Independent Registered Public Accounting Firm's hours spent on auditing the registrant's financial statements were attributed to work performed by full-time permanent employees of the principal Independent Registered Public Accounting Firm.
***
In connection with the audit of the 2016 financial statements, the Fund entered into an engagement letter with EY. The terms of the engagement letter required by EY, and agreed to by the Audit Committee, included provisions in which the parties consent to the sole jurisdiction of federal courts in New York, Boston or the Northern District of Illinois, as well as a waiver of right to a trial by jury.
In connection with the audit of the 2017 financial statements, the Fund entered into an engagement letter with EY. The terms of the engagement letter required by EY, and agreed to by the Audit Committee, include a provision mandating the use of mediation and arbitration to resolve any controversy or claim between the parties arising out of or relating to the engagement letter or services provided thereunder.
***
1.) In various communications beginning on April 20, 2016, EY advised the Fund’s Audit Committee that EY had identified the following matters that it determined to be inconsistent with the SEC’s auditor independence rules.
| · | EY advised the Fund’s Audit Committee of financial relationships held by covered persons within EY and its affiliates that were in violation of the Rule 2-01(c)(1) of Regulation S-X. EY advised the Audit Committee that after consideration of the facts and circumstances and the applicable independence rules, EY concluded that the independence breaches did not and do not impair EY’s ability to exercise objective and impartial judgment in connection with the audits of the financial statements of the Fund and that a reasonable investor would reach the same conclusion. In assessing this matter, EY indicated that upon detection the breaches were corrected promptly and that none of the breaches (i) related to financial relationships directly in the Fund, (ii) involved professionals who were part of the audit engagement team for the Fund or in a position to influence the audit engagement team, or (iii) were for services directly for the Fund. |
| · | EY advised the Fund’s Audit Committee that, in 2016, a pension plan for the Ernst & Young Global Limited (“EYG”) member firm in Germany (“EY Germany”), through one of its investment advisors, purchased an investment in an entity that may be deemed to be under common control with the Fund. EY informed the Audit Committee that this investment was inconsistent with Rule 2-01(c)(1)(i) of Regulation S-X. EY advised the Audit Committee that in assessing the impact of the independence breach, in fact and appearance, EY considered all relevant facts and circumstances to assess whether a reasonable investor would conclude that EY was and is capable of exercising objective and impartial judgment on all issues encompassed within the audit engagement. EY advised the Audit Committee that after consideration of the facts and circumstances and the applicable independence rules, EY concluded that the independence breach did not and does not impair EY’s ability to exercise objective and impartial judgment in connection with the audit of the financial statements of the Fund and that a reasonable investor would reach the same conclusion. In reaching this conclusion, EY noted a number of factors, including that the purchase was by EY Germany’s investment advisor without EY Germany’s permission, authorization or knowledge and EY Germany instructed its investment advisor to sell the shares of the entity that may be deemed to be under common control with the Fund immediately upon detection of the purchase and the breach did not involve any professionals who were part of the audit engagement team for the Fund or in a position to influence the audit engagement team. In addition, EY noted that the independence breach did not (i) create a mutual or conflicting interest with the Fund, (ii) place EY in the position of auditing its own work, (iii) result in EY acting as management or an employee of the Fund, or (iv) place EY in a position of being an advocate of the Fund. |
| · | EY advised the Fund’s Audit Committee that, in 2014, the EYG member firm in Spain (“EY Spain”) completed an acquisition of a small consulting firm that had a deposit account with an overdraft line of credit at the time of the acquisition with Deutsche Bank SA Espanola, which EY Spain acquired. EY informed the Audit Committee that having this line of credit with an entity that may be deemed to be under common control with the Fund was inconsistent with Rule 2-01(c)(1)(ii) of Regulation S-X. EY advised the Audit Committee that in assessing the impact of the independence breach, in fact and appearance, EY considered all relevant facts and circumstances to assess whether a reasonable investor would conclude that EY was and is capable of exercising objective and impartial judgment on all issues encompassed within the audit engagements. EY advised the Audit Committee that after consideration of the facts and circumstances and the applicable independence rules, EY concluded that the independence breach did not and does not impair EY’s ability to exercise objective and impartial judgment in connection with the audits of the financial statements of the Fund and that a reasonable investor would reach the same conclusion. In reaching this conclusion, EY noted a number of factors, including that that the credit line was terminated and the breach did not involve any professionals who were part of the audit engagement team for the Fund or in a position to influence the audit engagement team. In addition, EY noted that the independence breach did not (i) create a mutual or conflicting interest with the Fund, (ii) place EY in the position of auditing its own work, (iii) result in EY acting as management or an employee of the Fund, or (iv) place EY in a position of being an advocate of the Fund. |
EY advised the Audit Committee that the above described matters, individually and in the aggregate, do not and will not impair EY’s ability to exercise objective and impartial judgment in connection with the audits of the financial statements for the Fund and a reasonable investor with knowledge of all relevant facts and circumstances would conclude that EY has been and is capable of objective and impartial judgment on all issues encompassed within EY’s audit engagements, and that EY can continue to act as the Independent Registered Public Accounting Firm.
Management and the Audit Committee considered these matters and, based solely upon EY’s description of the facts and the representations made by EY, believe that (1) these matters did not impact EY’s application of objective and impartial judgment with respect to all issues encompassed within EY’s audit engagements; and (2) a reasonable investor with knowledge of all relevant facts and circumstances would reach the same conclusion.
2.) In various communications beginning on June 27, 2016, EY also informed the Audit Committee that EY had identified independence breaches where EY and covered persons maintain lending relationships with owners of greater than 10% of the shares of certain investment companies within the “investment company complex” as defined under Rule 2-01(f)(14) of Regulation S-X. EY informed the Audit Committee that these lending relationships are inconsistent with Rule 2-01(c)(l)(ii)(A) of Regulation S-X (referred to as the “Loan Rule”).
The Loan Rule specifically provides that an accounting firm would not be independent if it receives a loan from a lender that is a record or beneficial owner of more than ten percent of an audit client’s equity securities. For purposes of the Loan Rule, audit clients include the Fund as well as all registered investment companies advised by the Deutsche Investment Management Americas Inc. (the “Adviser”), the Fund’s investment adviser, and its affiliates, including other subsidiaries of the Adviser’s parent company, Deutsche Bank AG (collectively, the “Deutsche Funds Complex”). EY’s lending relationships affect EY’s independence under the Loan Rule with respect to all investment companies in the Deutsche Funds Complex.
EY informed the Audit Committee that, after evaluating the facts and circumstances and the applicable independence rules, EY has concluded that the lending relationships described above do not and will not impair EY’s ability to exercise objective and impartial judgment in connection with the audits of the financial statements for the Fund and a reasonable investor with knowledge of all relevant facts and circumstances would conclude that EY has been and is capable of objective and impartial judgment on all issues encompassed within EY’s audit engagements. EY informed the Audit Committee that its conclusion was based on a number of factors, including, among others, EY’s belief that the lenders are not able to impact the impartiality of EY or assert any influence over the investment companies in the Deutsche Funds Complex whose shares the lenders own or the applicable investment company’s investment adviser. In addition, the individuals at EY who arranged EY’s lending relationships have no oversight of, or ability to influence, the individuals at EY who conducted the audits of the Fund’s financial statements.
On June 20, 2016, the SEC Staff issued a “no-action” letter to another mutual fund complex (see Fidelity Management & Research Company et al., No-Action Letter) related to similar Loan Rule issues as those described above. In that letter, the SEC Staff confirmed that it would not recommend enforcement action against an investment company that relied on the audit services performed by an audit firm that was not in compliance with the Loan Rule in certain specified circumstances. The circumstances described in the no-action letter appear to be substantially similar to the circumstances that effected EY’s independence under the Loan Rule with respect to the Fund. EY confirmed to the Audit Committee that it meets the conditions of the no-action letter.
3.) In various communications beginning on January 25, 2017, EY advised the Fund’s Audit Committee that EY had identified the following matters that it determined to be inconsistent with the SEC’s auditor independence rules.
| · | EY advised the Fund’s Audit Committee of financial relationships held by covered persons within EY and its affiliates that were in violation of the Rule 2-01(c)(1) of Regulation S-X. EY advised the Audit Committee that after consideration of the facts and circumstances and the applicable independence rules, EY concluded that the independence breaches do not and will not impair EY’s ability to exercise objective and impartial judgment in connection with the audits of the financial statements of the Fund and that a reasonable investor would reach the same conclusion. In assessing this matter, EY indicated that upon detection the breaches were corrected promptly and that none of the breaches (i) related to financial relationships directly in the Fund, (ii) involved professionals who were part of the audit engagement team for the Fund or in a position to influence the audit engagement team, or (iii) were for services directly for the Fund. |
| · | EY advised the Fund’s Audit Committee that, in 2015, the Ernst & Young Global Limited (“EYG”) member firm in Spain (“EY Spain”) provided a loaned staff service to Deutsche Bank AG, where a manager from EY Spain analyzed investment opportunities in Spain under the supervision of Deutsche Bank AG personnel. EY informed the Audit Committee that this loaned staff service where the EY professional temporarily acted as an employee of Deutsche Bank AG was inconsistent with Rule 2-01(c)(4)(vi) of Regulation S-X. EY advised the Audit Committee that in assessing the impact of the independence breach, in fact and appearance, EY considered all relevant facts and circumstances to assess whether a reasonable investor would conclude that EY was and is capable of exercising objective and impartial judgment on all issues encompassed within the audit engagements. EY advised the Audit Committee that after consideration of the facts and circumstances and the applicable independence rules, EY concluded that the independence breach did not and will not impair EY’s ability to exercise objective and impartial judgment in connection with the audits of the financial statements of the Fund and that a reasonable investor would reach the same conclusion. In reaching this conclusion, EY noted a number of factors, including that the breach did not involve any professionals who were part of the audit engagement team for the Fund or in a position to influence the audit engagement team and did not involve services provided directly for the Fund. In addition, EY noted that the independence breach did not (i) create a mutual or conflicting interest with the Fund, (ii) place EY in the position of auditing its own work, (iii) result in EY acting as management or an employee of the Fund, or (iv) place EY in a position of being an advocate of the Fund. |
EY advised the Audit Committee that the above described matters, individually and in the aggregate, do not and will not impair EY’s ability to exercise objective and impartial judgment in connection with the audits of the financial statements for the Fund and a reasonable investor with knowledge of all relevant facts and circumstances would conclude that EY has been and is capable of objective and impartial judgment on all issues encompassed within EY’s audit engagements, and that EY can continue to act as the Independent Registered Public Accounting Firm.
4.) In various communications beginning on January 25, 2017, EY informed the Audit Committee that EY had identified an independence breach where a covered person maintains a lending relationship with an owner of greater than 10% of the shares of certain investment companies within the “investment company complex” as defined under Rule 2-01(f)(14) of Regulation S-X. EY informed the Audit Committee that this lending relationship is inconsistent with Rule 2-01(c)(l)(ii)(A) of Regulation S-X (referred to as the “Loan Rule”).
The Loan Rule specifically provides that an accounting firm would not be independent if it receives a loan from a lender that is a record or beneficial owner of more than ten percent of an audit client’s equity securities. For purposes of the Loan Rule, audit clients include the Fund as well as all registered investment companies advised by the Deutsche Investment Management Americas Inc. (the “Adviser”), the Fund’s investment adviser, and its affiliates, including other subsidiaries of the Adviser’s parent company, Deutsche Bank AG (collectively, the “Deutsche Funds Complex”). The covered person’s lending relationship affects EY’s independence under the Loan Rule with respect to all investment companies in the Deutsche Funds Complex.
EY informed the Audit Committee that, after evaluating the facts and circumstances and the applicable independence rules, EY has concluded that the lending relationship described above does not and will not impair EY’s ability to exercise objective and impartial judgment in connection with the audits of the financial statements for the Fund and a reasonable investor with knowledge of all relevant facts and circumstances would conclude that EY has been and is capable of objective and impartial judgment on all issues encompassed within EY’s audit engagements. EY informed the Audit Committee that its conclusion was based on a number of factors, including, among others, EY’s belief that the lender is not able to impact the impartiality of EY or assert any influence over the investment companies in the Deutsche Funds Complex whose shares the lenders own or the applicable investment company’s investment adviser.
On June 20, 2016, the SEC Staff issued a “no-action” letter to another mutual fund complex (see Fidelity Management & Research Company et al., No-Action Letter) related to similar Loan Rule issues as those described above. In that letter, the SEC Staff confirmed that it would not recommend enforcement action against an investment company that relied on the audit services performed by an audit firm that was not in compliance with the Loan Rule in certain specified circumstances. The circumstances described in the no-action letter appear to be substantially similar to the circumstances that effected EY’s independence under the Loan Rule with respect to the Fund. EY confirmed to the Audit Committee that it meets the conditions of the no-action letter.
5.) On July 11, 2017, EY advised the Fund’s Audit Committee that EY had identified the following matters that it determined to be inconsistent with the SEC’s auditor independence rules.
| · | EY advised the Fund’s Audit Committee of financial relationships held by covered persons within EY and its affiliates that were in violation of Rule 2-01(c)(1) of Regulation S-X. EY advised the Audit Committee that after consideration of the facts and circumstances and the applicable independence rules, EY concluded that the independence breaches do not and will not impair EY’s ability to exercise objective and impartial judgment in connection with the audits of the financial statements of the Fund and that a reasonable investor would reach the same conclusion. In assessing this matter, EY indicated that upon detection the breaches were corrected promptly and that none of the breaches (i) related to financial relationships directly in the Fund, (ii) involved professionals who were part of the audit engagement team for the Fund or in a position to influence the audit engagement team, or (iii) were for services directly for the Fund. |
EY advised the Audit Committee that the above described matters, individually and in the aggregate, do not and will not impair EY’s ability to exercise objective and impartial judgment in connection with the audits of the financial statements for the Fund and a reasonable investor with knowledge of all relevant facts and circumstances would conclude that EY has been and is capable of objective and impartial judgment on all issues encompassed within EY’s audit engagements, and that EY can continue to act as the Independent Registered Public Accounting Firm.
6.) On July 11, 2017, EY informed the Audit Committee that EY had identified an independence breach where EY maintains a lending relationship with an entity that owned for a period of time greater than 10% of the shares of an investment company within the “investment company complex” as defined under Rule 2-01(f)(14) of Regulation S-X. EY informed the Audit Committee that this lending relationship was inconsistent with Rule 2-01(c)(l)(ii)(A) of Regulation S-X (referred to as the “Loan Rule”).
The Loan Rule specifically provides that an accounting firm would not be independent if it receives a loan from a lender that is a record or beneficial owner of more than ten percent of an audit client’s equity securities. For purposes of the Loan Rule, audit clients include the Fund as well as all registered investment companies advised by the Deutsche Investment Management Americas Inc. (the “Adviser”), the Fund’s investment adviser, and its affiliates, including other subsidiaries of the Adviser’s parent company, Deutsche Bank AG (collectively, the “Deutsche Funds Complex”). EY’s lending relationship affects EY’s independence under the Loan Rule with respect to all investment companies in the Deutsche Funds Complex.
EY informed the Audit Committee that, after evaluating the facts and circumstances and the applicable independence rules, EY has concluded that the lending relationship described above did not and will not impair EY’s ability to exercise objective and impartial judgment in connection with the audits of the financial statements for the Fund and a reasonable investor with knowledge of all relevant facts and circumstances would conclude that EY has been and is capable of objective and impartial judgment on all issues encompassed within EY’s audit engagements. EY informed the Audit Committee that its conclusion was based on a number of factors, including, among others, EY’s belief that the lender is not able to impact the impartiality of EY and was not able to assert any influence over the investment company in the Deutsche Funds Complex whose shares the lender owned or the applicable investment company’s investment adviser.
On June 20, 2016, the SEC Staff issued a “no-action” letter to another mutual fund complex (see Fidelity Management & Research Company et al., No-Action Letter) related to similar Loan Rule issues as those described above. In that letter, the SEC Staff confirmed that it would not recommend enforcement action against an investment company that relied on the audit services performed by an audit firm that was not in compliance with the Loan Rule in certain specified circumstances. The circumstances described in the no-action letter appear to be substantially similar to the circumstances that effected EY’s independence under the Loan Rule with respect to the Fund. EY confirmed to the Audit Committee that it meets the conditions of the no-action letter.
7.) On October 24, 2017, EY advised the Fund’s Audit Committee that EY had identified the following matter that it determined to be inconsistent with the SEC’s auditor independence rules.
| · | EY advised the Fund’s Audit Committee of a financial relationship held by a covered person within EY and its affiliates that was in violation of Rule 2-01(c)(1) of Regulation S-X. EY advised the Audit Committee that after consideration of the facts and circumstances and the applicable independence rules, EY concluded that the independence breach did not and will not impair EY’s ability to exercise objective and impartial judgment in connection with the audits of the financial statements of the Fund and that a reasonable investor would reach the same conclusion. In assessing this matter, EY indicated that upon detection the breach was corrected promptly and that the breach (i) did not relate to financial relationships directly in the Fund, (ii) did not involve professionals who were part of the audit engagement team for the Fund or in a position to influence the audit engagement team, and (iii) were not for services directly for the Fund. |
EY advised the Audit Committee that the above described matter did not and will not impair EY’s ability to exercise objective and impartial judgment in connection with the audits of the financial statements for the Fund and a reasonable investor with knowledge of all relevant facts and circumstances would conclude that EY has been and is capable of objective and impartial judgment on all issues encompassed within EY’s audit engagements, and that EY can continue to act as the Independent Registered Public Accounting Firm.
8.) On October 24, 2017, EY informed the Audit Committee that EY had identified independence breaches where EY maintains lending relationships with entities that own greater than 10% of the shares of certain investment companies within the “investment company complex” as defined under Rule 2-01(f)(14) of Regulation S-X. EY informed the Audit Committee that these lending relationships were inconsistent with Rule 2-01(c)(l)(ii)(A) of Regulation S-X (referred to as the “Loan Rule”).
The Loan Rule specifically provides that an accounting firm would not be independent if it receives a loan from a lender that is a record or beneficial owner of more than ten percent of an audit client’s equity securities. For purposes of the Loan Rule, audit clients include the Fund as well as all registered investment companies advised by the Deutsche Investment Management Americas Inc. (the “Adviser”), the Fund’s investment adviser, and its affiliates, including other subsidiaries of the Adviser’s parent company, Deutsche Bank AG (collectively, the “Deutsche Funds Complex”). EY’s lending relationships affect EY’s independence under the Loan Rule with respect to all investment companies in the Deutsche Funds Complex.
EY informed the Audit Committee that, after evaluating the facts and circumstances and the applicable independence rules, EY has concluded that the lending relationships described above do not and will not impair EY’s ability to exercise objective and impartial judgment in connection with the audits of the financial statements for the Fund and a reasonable investor with knowledge of all relevant facts and circumstances would conclude that EY has been and is capable of objective and impartial judgment on all issues encompassed within EY’s audit engagements. EY informed the Audit Committee that its conclusion was based on a number of factors, including, among others, EY’s belief that the lenders are not able to impact the impartiality of EY or assert any influence over the investment company in the Deutsche Funds Complex whose shares the lender owned or the applicable investment company’s investment adviser.
On June 20, 2016, the SEC Staff issued a “no-action” letter to another mutual fund complex (see Fidelity Management & Research Company et al., No-Action Letter) related to similar Loan Rule issues as those described above. In that letter, the SEC Staff confirmed that it would not recommend enforcement action against an investment company that relied on the audit services performed by an audit firm that was not in compliance with the Loan Rule in certain specified circumstances. The circumstances described in the no-action letter appear to be substantially similar to the circumstances that effected EY’s independence under the Loan Rule with respect to the Fund. EY confirmed to the Audit Committee that it meets the conditions of the no-action letter.
| | |
| ITEM 5. | AUDIT COMMITTEE OF LISTED REGISTRANTS |
| | |
| | Not applicable |
| | |
| ITEM 6. | SCHEDULE OF INVESTMENTS |
| | |
| | Not applicable |
| | |
| ITEM 7. | DISCLOSURE OF PROXY VOTING POLICIES AND PROCEDURES FOR CLOSED-END MANAGEMENT INVESTMENT COMPANIES |
| | |
| | Not applicable |
| | |
| ITEM 8. | PORTFOLIO MANAGERS OF CLOSED-END MANAGEMENT INVESTMENT COMPANIES |
| | |
| | Not applicable |
| | |
| ITEM 9. | PURCHASES OF EQUITY SECURITIES BY CLOSED-END MANAGEMENT INVESTMENT COMPANY AND AFFILIATED PURCHASERS |
| | |
| | Not applicable |
| | |
| ITEM 10. | SUBMISSION OF MATTERS TO A VOTE OF SECURITY HOLDERS |
| | |
| | There were no material changes to the procedures by which shareholders may recommend nominees to the Fund’s Board. The primary function of the Nominating and Governance Committee is to identify and recommend individuals for membership on the Board and oversee the administration of the Board Governance Guidelines. Shareholders may recommend candidates for Board positions by forwarding their correspondence by U.S. mail or courier service to Keith R. Fox, Deutsche Funds Board Chair, c/o Thomas R. Hiller, Ropes & Gray LLP, Prudential Tower, 800 Boylston Street, Boston, MA 02199-3600. |
| | |
| ITEM 11. | CONTROLS AND PROCEDURES |
| | |
| | (a) | The Chief Executive and Financial Officers concluded that the Registrant’s Disclosure Controls and Procedures are effective based on the evaluation of the Disclosure Controls and Procedures as of a date within 90 days of the filing date of this report. |
| | |
| | (b) | There have been no changes in the registrant’s internal control over financial reporting that occurred during the second fiscal quarter of the period covered by this report that has materially affected, or is reasonably likely to materially affect, the registrant’s internal controls over financial reporting. |
| | |
| ITEM 12. | Disclosure of Securities Lending Activities for Closed-End Management Investment Companies |
| | |
| | Not applicable |
| | |
| ITEM 13. | EXHIBITS |
| | |
| | (a)(1) | Code of Ethics pursuant to Item 2 of Form N-CSR is filed and attached hereto as EX-99.CODE ETH. |
| | |
| | (a)(2) | Certification pursuant to Rule 30a-2(a) under the Investment Company Act of 1940 (17 CFR 270.30a-2(a)) is filed and attached hereto as Exhibit 99.CERT. |
| | |
| | (b) | Certification pursuant to Rule 30a-2(b) under the Investment Company Act of 1940 (17 CFR 270.30a-2(b)) is furnished and attached hereto as Exhibit 99.906CERT. |
SIGNATURES
Pursuant to the requirements of the Securities Exchange Act of 1934 and the Investment Company Act of 1940, the registrant has duly caused this report to be signed on its behalf by the undersigned, thereunto duly authorized.
| Registrant: | Deutsche Variable Series II |
| | |
| | |
| By: | /s/Hepsen Uzcan Hepsen Uzcan President |
| | |
| Date: | 2/15/2018 |
Pursuant to the requirements of the Securities Exchange Act of 1934 and the Investment Company Act of 1940, this report has been signed below by the following persons on behalf of the registrant and in the capacities and on the dates indicated.
| By: | /s/Hepsen Uzcan Hepsen Uzcan President |
| | |
| Date: | 2/15/2018 |
| | |
| | |
| | |
| By: | /s/Paul Schubert Paul Schubert Chief Financial Officer and Treasurer |
| | |
| Date: | 2/15/2018 |
| | |

