UNITED STATES
SECURITIES AND EXCHANGE COMMISSION
WASHINGTON, D. C. 20549
FORM N-CSR
Investment Company Act file number: 811-05002
Deutsche DWS Variable Series II
(Exact Name of Registrant as Specified in Charter)
875 Third Avenue
New York, NY 10022-6225
(Address of Principal Executive Offices) (Zip Code)
Registrant’s Telephone Number, including Area Code: (212) 454-4500
Diane Kenneally
100 Summer Street
Boston, MA 02110
(Name and Address of Agent for Service)
| Date of fiscal year end: | 12/31 |
| | |
| Date of reporting period: | 12/31/2020 |
| ITEM 1. | REPORT TO STOCKHOLDERS |
| | |
| | (a) |
December 31, 2020
Annual Report
Deutsche DWS Variable Series II
DWS Alternative Asset Allocation VIP

Contents
| | | | |
| | 3 | | | Performance Summary |
| | 5 | | | Management Summary |
| | 7 | | | Portfolio Summary |
| | 8 | | | Investment Portfolio |
| | 10 | | | Statement of Assets and Liabilities |
| | 10 | | | Statement of Operations |
| | 11 | | | Statements of Changes in Net Assets |
| | 12 | | | Financial Highlights |
| | 13 | | | Notes to Financial Statements |
| | 17 | | | Report of Independent Registered Public Accounting Firm |
| | 18 | | | Information About Your Fund’s Expenses |
| | 19 | | | Tax Information |
| | 19 | | | Proxy Voting |
| | 20 | | | Advisory Agreement Board Considerations and Fee Evaluation |
| | 23 | | | Board Members and Officers |
This report must be preceded or accompanied by a prospectus. To obtain an additional prospectus or summary prospectus, if available, call (800) 728-3337 or your financial representative. We advise you to consider the Fund’s objectives, risks, charges and expenses carefully before investing. The summary prospectus and prospectus contain this and other important information about the Fund. Please read the prospectus carefully before you invest.
Although allocation among different asset categories generally limits risk, portfolio management may favor an asset category that underperforms other assets or markets as a whole. The Fund expects to invest in underlying funds that emphasize alternatives or non-traditional asset categories or investment strategies, and as a result, it is subject to the risk factors of those underlying funds. Some of those risks include: stock market risk; the political, general economic, liquidity and currency risks of foreign investments, which may be particularly significant for emerging markets; credit and interest rate risk; floating rate loan risk; volatility, infrastructure and high-yield debt securities. Because Exchange Traded Funds (ETFs) trade on a securities exchange, their shares may trade at a premium or discount to their net asset value. ETFs also incur fees and expenses so they may not fully match the performance of the indexes they are designed to track. The Fund may use derivatives, including as part of its currency and interest-rate strategies. Investing in derivatives entails special risks relating to liquidity, leverage and credit that may reduce returns and/or increase volatility. The success of the Fund’s currency and interest-rate strategies are dependent, in part, on the effectiveness and implementation of portfolio management’s proprietary models. As part of these strategies, the Fund’s exposure to foreign currencies could cause lower returns or even losses because foreign currency rates may fluctuate significantly over short periods of time for a number of reasons. The risk of loss is heightened during periods of rapid rises in interest rates. In addition, the notional amount of the Fund’s aggregate currency and interest-rate exposure resulting from these strategies may significantly exceed the net assets of the Fund. Please read the prospectus for additional risks and specific details regarding the Fund’s risk profile.
War, terrorism, economic uncertainty, trade disputes, public health crises (including the recent pandemic spread of the novel coronavirus) and related geopolitical events could lead to increased market volatility, disruption to U.S. and world economies and markets and may have significant adverse effects on the Fund and its investments.
The brand DWS represents DWS Group GmbH & Co. KGaA and any of its subsidiaries such as DWS Distributors, Inc. which offers investment products or DWS Investment Management Americas, Inc. and RREEF America L.L.C. which offer advisory services.
DWS Distributors, Inc., 222 South Riverside Plaza, Chicago, IL 60606, (800) 621-1148
NOT FDIC/NCUA INSURED NO BANK GUARANTEE MAY LOSE VALUE NOT A DEPOSIT
NOT INSURED BY ANY FEDERAL GOVERNMENT AGENCY
| | | | | | |
| | 2 | | | | | | Deutsche DWS Variable Series II — DWS Alternative Asset Allocation VIP |
| | |
| Performance Summary | | December 31, 2020 (Unaudited) |
Fund performance shown is historical, assumes reinvestment of all dividend and capital gain distributions and does not guarantee future results. Investment return and principal value fluctuate with changing market conditions so that, when redeemed, shares may be worth more or less than their original cost. Current performance may be lower or higher than the performance data quoted. Please contact your participating insurance company for the Fund’s most recent month-end performance. Performance does not reflect charges and fees (“contract charges”) associated with the separate account that invests in the Fund or any variable life insurance policy or variable annuity contract for which the Fund is an investment option. These charges and fees will reduce returns. While all share classes have the same underlying portfolio, their performance will differ.
The gross expense ratios of the Fund, as stated in the fee table of the prospectus dated May 1, 2020 are 0.88% and 1.24% for Class A and Class B shares, respectively, and may differ from the expense ratios disclosed in the Financial Highlights tables in this report. These expense ratios include net expenses of the underlying funds in which the Fund invests.
Generally accepted accounting principles require adjustments to be made to the net assets of the Fund at period end for financial reporting purposes only, and as such, the total return based on the unadjusted net asset value per share may differ from the total return reported in the financial highlights.
Growth of an Assumed $10,000
| | |
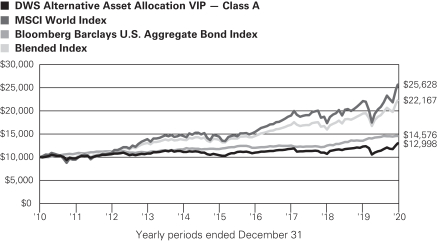
| | MSCI World Index is an unmanaged index representing large and mid-cap equity performance across 23 developed markets countries. It covers approximately 85% of the free float-adjusted market capitalization in each country. Bloomberg Barclays U.S. Aggregate Bond Index is an unmanaged index representing domestic taxable investment-grade bonds, with index components for government and corporate securities, mortgage pass-through securities, and asset-backed securities with average maturities of one year or more. The Blended Index consists of 70% MSCI World Index and 30% Bloomberg Barclays U.S. Aggregate Bond Index. Index returns do not reflect any fees or expenses and it is not possible to invest directly into an index. |
| | | | | | | | | | |
| Comparative Results | | | | | | | | |
| | | | |
| DWS Alternative Asset Allocation VIP | | 1-Year | | 3-Year | | 5-Year | | 10-Year |
| Class A | | Growth of $10,000 | | $10,571 | | $11,015 | | $12,459 | | $12,998 |
| | | Average annual total return | | 5.71% | | 3.28% | | 4.50% | | 2.66% |
| MSCI World Index | | Growth of $10,000 | | $11,590 | | $13,508 | | $17,776 | | $25,628 |
| | | Average annual total return | | 15.90% | | 10.54% | | 12.19% | | 9.87% |
| Bloomberg Barclays U.S. Aggregate Bond Index | | Growth of $10,000 | | $10,751 | | $11,689 | | $12,424 | | $14,576 |
| | Average annual total return | | 7.51% | | 5.34% | | 4.44% | | 3.84% |
| Blended Index | | Growth of $10,000 | | $11,402 | | $13,071 | | $16,162 | | $22,167 |
| | | Average annual total return | | 14.02% | | 9.34% | | 10.08% | | 8.29% |
| | | | |
Deutsche DWS Variable Series II — DWS Alternative Asset Allocation VIP | | | | | 3 |
| | | | | | | | | | |
| | | | |
| DWS Alternative Asset Allocation VIP | | 1-Year | | 3-Year | | 5-Year | | 10-Year |
| Class B | | Growth of $10,000 | | $10,532 | | $10,918 | | $12,266 | | $12,633 |
| | Average annual total return | | 5.32% | | 2.97% | | 4.17% | | 2.36% |
| MSCI World Index | | Growth of $10,000 | | $11,590 | | $13,508 | | $17,776 | | $25,628 |
| | Average annual total return | | 15.90% | | 10.54% | | 12.19% | | 9.87% |
| Bloomberg Barclays U.S. Aggregate Bond Index | | Growth of $10,000 | | $10,751 | | $11,689 | | $12,424 | | $14,576 |
| | Average annual total return | | 7.51% | | 5.34% | | 4.44% | | 3.84% |
| Blended Index | | Growth of $10,000 | | $11,402 | | $13,071 | | $16,162 | | $22,167 |
| | Average annual total return | | 14.02% | | 9.34% | | 10.08% | | 8.29% |
The growth of $10,000 is cumulative.
| | | | | | |
| | 4 | | | | | | Deutsche DWS Variable Series II — DWS Alternative Asset Allocation VIP |
| | |
| Management Summary | | December 31, 2020 (Unaudited) |
The Fund returned 5.71% (Class A shares, unadjusted for contract charges) during the 12-month period ended December 31, 2020, trailing the 14.02% return of the Blended Index. Since the index captures the returns of traditional asset and not alternative assets, it is primarily used for references purposes.
Alternative investments generated mixed results in 2020. All categories sold off to varying degrees in the first calendar quarter, when the spreads of COVID-19 pressured returns for all but the safest investments. The broader financial markets began to rebound in late March in the wake of unprecedented stimulus provided by governments and central banks, but the recovery was uneven. While some categories climbed back into positive territory and closed the year with gains, others were unable to recapture their previous highs.
Among the asset classes represented in the Fund, the largest rallies occurred in convertible bonds and preferred stocks. The Fund invests in these areas through SPDR Bloomberg Barclays Convertible Securities ETF and iShares U.S. Preferred Stock ETF, respectively. Both performed well in the final nine months of the year thanks to their above-average equity sensitivity and investors’ ongoing demand for income. Convertible bonds did particularly well and were the best performing segment of the Fund. Numerous issuers came to the market near the March lows in an effort to shore up their balance sheets, and the securities subsequently rebounded as risk appetites returned and investors began to look ahead to a reopening of the economy.
The Fund’s allocation to emerging-markets debt also benefited from the broader rally to finish the year with a solid, mid-single digit gain. Similarly, floating rate securities performed well from late March onward due to their above-average credit sensitivity. A position in DWS Global Macro Fund, which can seek opportunities anywhere in the financial markets in an effort to generate positive absolute returns, also delivered a narrow gain.
Conversely, a number of holdings failed to recapture their pre-COVID highs and closed the year in the red. Among these were allocations to real estate investment trusts, commodities, and infrastructure stocks. The Fund was also hurt to some extent by the underperformance of its underlying active managers versus their respective benchmarks. An above-average cash position was a further drag on absolute returns at a time of generally positive performance for most major asset classes.
Alternative assets underperformed traditional categories in 2020, but we believe they remain a vital source of longer-term portfolio diversification. The role of alternative assets may be especially important in the current environment. The major global equity indexes closed the year at or near all-time highs, and valuations were extended across broad segments of the market. Opportunities in core fixed income also appeared to be limited, with the ultra-low yields on government debt indicating lower upside potential.
We would also note that inflation expectations increased considerably in the final three months of 2020. While it has been quite some time since inflation has moved above 2%, the extremely accommodative policies of the world’s central banks suggest that the odds of rising inflation may be increasing. For example, the U.S. Federal Reserve (Fed) adopted a new policy regime under which a 2% inflation rate is no longer its ceiling, but rather its longer-term average target. This change indicates that the Fed may allow inflation to run higher than this level for an extended period before it tightens policy.
We believe these factors provide a positive foundation for alternative assets. In this environment, we see an advantage from our ability to capture numerous sources of return potential across the full spectrum of the alternative universe. Our mandate provides us with the flexibility to capitalize on value and avoid risk, an active approach whose merits may become more apparent if the returns of traditional assets begin to moderate.
Dokyoung Lee, CFA, Director
Darwei Kung, Managing Director
Sophia Noisten, Associate
Portfolio Managers
The views expressed reflect those of the portfolio management team only through the end of the period of the report as stated on the cover. The management team’s views are subject to change at any time based on market and other conditions and should not be construed as a recommendation. Past performance is no guarantee of future results. Current and future portfolio holdings are subject to risk.
| | | | |
Deutsche DWS Variable Series II — DWS Alternative Asset Allocation VIP | | | | | 5 |
Terms to Know
The Blended Index is calculated using the performance of two unmanaged indices, representative of stocks (the Morgan Stanley Capital International (MSCI) World Index, 70%) and bonds (the Bloomberg Barclays U.S. Aggregate Bond Index, 30%). These results are summed to produce the aggregate benchmark. MSCI World Index is an unmanaged index representing large and mid-cap equity performance across 23 developed markets countries. It covers approximately 85% of the free float adjusted market capitalization in each country. Bloomberg Barclays U.S. Aggregate Bond Index is an unmanaged index representing domestic taxable investment-grade bonds, with index components for government and corporate securities, mortgage pass through securities, and asset-backed securities with average maturities of one year or more. Index returns do not reflect fees or expenses and it is not possible to invest directly into an index.
Convertible bonds are bonds that are issued by corporations and that can be converted to shares of the issuing company’s stock at the bondholder’s discretion.
Preferred stocks are hybrid securities that offer some of the features of both stocks and bonds.
An exchange-traded fund (ETF) is a security that tracks an index, a commodity or a basket of assets like an index fund, but trades like a stock on an exchange.
| | | | | | |
| | 6 | | | | | | Deutsche DWS Variable Series II — DWS Alternative Asset Allocation VIP |
| | |
| Portfolio Summary | | (Unaudited) |
| | | | | | | | |
| Asset Allocation* (As a % of Investment Portfolio) | | 12/31/20 | | | 12/31/19 | |
Real Asset | | | 41% | | | | 39% | |
DWS Enhanced Commodity Strategy Fund | | | 12% | | | | 12% | |
DWS RREEF Global Infrastructure Fund | | | 11% | | | | 11% | |
DWS RREEF Real Estate Securities Fund | | | 10% | | | | 7% | |
iShares Global Infrastructure ETF | | | 5% | | | | 6% | |
SPDR S&P Global Natural Resources ETF | | | 2% | | | | — | |
DWS RREEF Global Real Estate Securities Fund | | | 1% | | | | 3% | |
| | |
Alternative Fixed Income | | | 19% | | | | 22% | |
DWS Floating Rate Fund | | | 9% | | | | 11% | |
DWS Emerging Markets Fixed Income Fund | | | 5% | | | | 5% | |
iShares JP Morgan USD Emerging Markets Bond ETF | | | 5% | | | | 6% | |
| | |
Alternative Equity | | | 30% | | | | 23% | |
SPDR Bloomberg Barclays Convertible Securities ETF | | | 21% | | | | 15% | |
iShares U.S. Preferred Stock ETF | | | 9% | | | | 8% | |
| | |
Absolute Return | | | 5% | | | | 3% | |
DWS Global Macro Fund | | | 5% | | | | 2% | |
Invesco DB U.S. Dollar Index Bullish Fund | | | — | | | | 1% | |
| | |
Cash Equivalents | | | 5% | | | | 13% | |
DWS Central Cash Management Government Fund | | | 5% | | | | 7% | |
DWS ESG Liquidity Fund | | | — | | | | 6% | |
| | | | 100% | | | | 100% | |
| * | During the periods indicated, asset categories and investment strategies represented in the Fund’s portfolio fell into the following categories: Real Assets, Alternative Fixed Income, Alternative Equity, and Absolute Return. Real Asset investments have a tangible or physical aspect such as real estate or commodities. Alternative Fixed Income investments seek to offer exposure to categories generally not included in investors’ allocations and to foreign investments, many of which are not denominated in US dollars. Alternative Equity investments are investments primarily in convertible and preferred instruments that offer equity exposure. Absolute Return investments seek positive returns in all market environments or seek to increase the diversification or liquidity of the Fund’s portfolio. |
Portfolio holdings and characteristics are subject to change.
For more complete details about the Fund’s investment portfolio, see page 8.
Following the Fund’s fiscal first and third quarter-end, a complete portfolio holdings listing is posted on dws.com, and is available free of charge by contacting your financial intermediary, or if you are a direct investor, by calling (800) 728-3337. In addition, the portfolio holdings listing is filed with the SEC on the Fund’s Form N-PORT and will be available on the SEC’s Web site at sec.gov. Additional portfolio holdings for the Fund are also posted on dws.com from time to time. Please see the Fund’s current prospectus for more information.
| | | | |
Deutsche DWS Variable Series II — DWS Alternative Asset Allocation VIP | | | | | 7 |
| | |
| Investment Portfolio | | as of December 31, 2020 |
| | | | | | | | |
| | | Shares | | | Value ($) | |
| Mutual Funds 52.7% | | | | | | | | |
| | |
DWS Emerging Markets Fixed Income Fund “Institutional” (a) | | | 2,641,114 | | | | 24,932,114 | |
| | |
DWS Enhanced Commodity Strategy Fund “Institutional” (a) | | | 5,841,969 | | | | 53,979,797 | |
| | |
DWS Floating Rate Fund “Institutional” (a) | | | 5,157,327 | | | | 40,691,313 | |
| | |
DWS Global Macro Fund “Institutional” (a) | | | 2,218,432 | | | | 22,250,874 | |
| | |
DWS RREEF Global Infrastructure Fund “Institutional” (a) | | | 3,357,839 | | | | 53,154,596 | |
| | |
DWS RREEF Global Real Estate Securities Fund “Institutional” (a) | | | 616,779 | | | | 4,792,369 | |
DWS RREEF Real Estate Securities Fund “Institutional” (a) | | | 2,161,192 | | | | 44,650,237 | |
Total Mutual Funds
(Cost $243,460,567) | | | | 244,451,300 | |
| |
| Exchange-Traded Funds 42.3% | | | | | |
| | |
iShares Global Infrastructure ETF | | | 490,135 | | | | 21,423,801 | |
| | | | | | | | |
| | | Shares | | | Value ($) | |
| | |
iShares JP Morgan USD Emerging Markets Bond ETF | | | 187,560 | | | | 21,740,080 | |
| | |
iShares U.S. Preferred Stock ETF | | | 1,104,703 | | | | 42,542,112 | |
| | |
SPDR Bloomberg Barclays Convertible Securities ETF | | | 1,198,544 | | | | 99,227,457 | |
SPDR S&P Global Natural Resources ETF | | | 258,982 | | | | 11,597,214 | |
Total Exchange-Traded Funds (Cost $159,969,198) | | | | 196,530,664 | |
| | |
| Cash Equivalents 5.1% | | | | | | | | |
DWS Central Cash Management Government Fund, 0.08% (a) (b) (Cost $23,563,848) | | | 23,563,848 | | | | 23,563,848 | |
| | |
| | | % of Net
Assets | | | Value ($) | |
Total Investment Portfolio
(Cost $426,993,613) | | | 100.1 | | | | 464,545,812 | |
| Other Assets and Liabilities, Net | | | (0.1 | ) | | | (495,321 | ) |
| Net Assets | | | 100.0 | | | | 464,050,491 | |
A summary of the Fund’s transactions with affiliated Underlying DWS Funds during the year ended December 31, 2020 are as follows:
| | | | | | | | | | | | | | | | | | | | | | | | | | | | | | | | |
Value ($) at
12/31/2019 | | Purchases
Cost ($) | | | Sales
Proceeds ($) | | | Net
Realized
Gain/
(Loss) ($) | | | Net Change in Unrealized
Appreciation
(Depreciation) ($) | | | Income ($) | | | Capital Gain
Distributions ($) | | | Number of Shares at
12/31/2020 | | | Value ($) at 12/31/2020 | |
Mutual Funds 52.7% | | | | | | | | | | | | | | | | | |
DWS Emerging Markets Fixed Income Fund “Institutional” (a) | |
| 19,550,537 | | | 5,049,336 | | | | — | | | | — | | | | 332,241 | | | | 1,024,036 | | | | — | | | | 2,641,114 | | | | 24,932,114 | |
DWS Enhanced Commodity Strategy Fund “Institutional” (a) | |
| 45,239,972 | | | 9,263,234 | | | | — | | | | — | | | | (523,409 | ) | | | 745,935 | | | | — | | | | 5,841,969 | | | | 53,979,797 | |
DWS Floating Rate Fund “Institutional” (a) | |
| 39,558,492 | | | 9,996,192 | | | | 6,650,000 | | | | (1,747,233 | ) | | | (466,138 | ) | | | 1,400,691 | | | | — | | | | 5,157,327 | | | | 40,691,313 | |
DWS Global Macro Fund “Institutional” (a) | |
| 8,887,591 | | | 12,962,710 | | | | — | | | | — | | | | 400,573 | | | | 178,561 | | | | — | | | | 2,218,432 | | | | 22,250,874 | |
DWS RREEF Global Infrastructure Fund “Institutional” (a) | |
| 43,335,324 | | | 10,886,266 | | | | — | | | | — | | | | (1,066,994 | ) | | | 809,266 | | | | 155,531 | | | | 3,357,839 | | | | 53,154,596 | |
DWS RREEF Global Real Estate Securities Fund “Institutional” (a) | |
| 11,176,441 | | | 4,595,000 | | | | 7,995,645 | | | | (3,069,600 | ) | | | 86,173 | | | | — | | | | — | | | | 616,779 | | | | 4,792,369 | |
DWS RREEF Real Estate Securities Fund “Institutional” (a) | |
| 26,423,025 | | | 29,377,292 | | | | 11,474,000 | | | | (389,114 | ) | | | 713,034 | | | | 1,149,651 | | | | 412,042 | | | | 2,161,192 | | | | 44,650,237 | |
Cash Equivalents 5.1% | | | | | | | | | | | | | | | | | |
DWS Central Cash Management Government Fund, 0.08% (a) (b) | |
| 27,144,085 | | | 146,117,255 | | | | 149,697,492 | | | | — | | | | — | | | | 171,301 | | | | — | | | | 23,563,848 | | | | 23,563,848 | |
DWS ESG Liquidity Fund, 0.18% (a) (b) | |
| 22,402,874 | | | 33,525,574 | | | | 55,961,490 | | | | 35,178 | | | | (2,136 | ) | | | 208,045 | | | | — | | | | — | | | | — | |
| 243,718,341 | | | 261,772,859 | | | | 231,778,627 | | | | (5,170,769 | ) | | | (526,656 | ) | | | 5,687,486 | | | | 567,573 | | | | 45,558,500 | | | | 268,015,148 | |
| (a) | Affiliated fund managed by DWS Investment Management Americas, Inc. |
| (b) | The rate shown is the annualized seven-day yield at period end. |
S&P: Standard & Poor’s
SPDR: Standard & Poor’s Depositary Receipt
The accompanying notes are an integral part of the financial statements.
| | | | | | |
| | 8 | | | | | | Deutsche DWS Variable Series II — DWS Alternative Asset Allocation VIP |
Fair Value Measurements
Various inputs are used in determining the value of the Fund’s investments. These inputs are summarized in three broad levels. Level 1 includes quoted prices in active markets for identical securities. Level 2 includes other significant observable inputs (including quoted prices for similar securities, interest rates, prepayment speeds and credit risk). Level 3 includes significant unobservable inputs (including the Fund’s own assumptions in determining the fair value of investments). The level assigned to the securities valuations may not be an indication of the risk or liquidity associated with investing in those securities.
The following is a summary of the inputs used as of December 31, 2020 in valuing the Fund’s investments. For information on the Fund’s policy regarding the valuation of investments, please refer to the Security Valuation section of Note A in the accompanying Notes to Financial Statements.
| | | | | | | | | | | | | | | | |
| Assets | | Level 1 | | | Level 2 | | | Level 3 | | | Total | |
| Mutual Funds | | $ | 244,451,300 | | | $ | — | | | $ | — | | | $ | 244,451,300 | |
| Exchange-Traded Funds | | | 196,530,664 | | | | — | | | | — | | | | 196,530,664 | |
| Short-Term Investments | | | 23,563,848 | | | | — | | | | — | | | | 23,563,848 | |
| Total | | $ | 464,545,812 | | | $ | — | | | $ | — | | | $ | 464,545,812 | |
The accompanying notes are an integral part of the financial statements.
| | | | |
Deutsche DWS Variable Series II — DWS Alternative Asset Allocation VIP | | | | | 9 |
Statement of Assets and Liabilities
| | | | |
| as of December 31, 2020 | | | | |
| |
| Assets | | | | |
| Investments in affiliated Underlying Funds, at value (cost $267,024,415) | | $ | 268,015,148 | |
| Investments in non-affiliated Underlying Funds, at value (cost $159,969,198) | | | 196,530,664 | |
| Receivable for Fund shares sold | | | 2,470 | |
| Interest receivable | | | 1,763 | |
| Other assets | | | 8,682 | |
| Total assets | | | 464,558,727 | |
| |
| Liabilities | | | | |
| Payable for Fund shares redeemed | | | 169,671 | |
| Accrued Management fee | | | 40,966 | |
| Accrued Trustees’ fees | | | 4,103 | |
| Other accrued expenses and payables | | | 293,496 | |
| Total liabilities | | | 508,236 | |
| Net assets, at value | | $ | 464,050,491 | |
| |
| Net Assets Consist of | | | | |
| Distributable earnings (loss) | | $ | 25,276,153 | |
| Paid-in capital | | | 438,774,338 | |
| Net assets, at value | | $ | 464,050,491 | |
Class A | | | | |
| |
| Net Asset Value, offering and redemption price per share ($36,993,774 ÷ 2,699,800 outstanding shares of beneficial interest, no par value, unlimited number of shares authorized) | | $ | 13.70 | |
Class B | | | | |
| |
| Net Asset Value, offering and redemption price per share ($427,056,717 ÷ 31,208,785 outstanding shares of beneficial interest, no par value, unlimited number of shares authorized) | | $ | 13.68 | |
Statement of Operations
| | | | |
| for the year ended December 31, 2020 | | | | |
| |
| Investment Income | | | | |
| Income: | | | | |
| Income distributions from affiliated Underlying Funds | | $ | 5,687,486 | |
| Dividends | | | 4,751,339 | |
| Total income | | | 10,438,825 | |
| Expenses: | | | | |
| Management fee | | | 412,424 | |
| Administration fee | | | 402,008 | |
| Recordkeeping fees (Class B) | | | 494,690 | |
| Services to shareholders | | | 1,108 | |
| Distribution and service fees (Class B) | | | 948,590 | |
| Custodian fee | | | 5,692 | |
| Professional fees | | | 72,746 | |
| Reports to shareholders | | | 46,992 | |
| Trustees’ fees and expenses | | | 16,014 | |
| Other | | | 9,429 | |
| Total expenses before expense reductions | | | 2,409,693 | |
| Expense reductions | | | (93,545 | ) |
| Total expenses after expense reductions | | | 2,316,148 | |
| Net investment income | | | 8,122,677 | |
| |
| Realized and Unrealized Gain (Loss) | | | | |
| Net realized gain (loss) from: | | | | |
| Sale of affiliated Underlying Funds | | | (5,170,769 | ) |
| Sale of non-affiliated Underlying Funds | | | (3,824,374 | ) |
| Capital gain distributions from affiliated Underlying Funds | | | 567,573 | |
| | | | (8,427,570 | ) |
| Change in net unrealized appreciation (depreciation) on: | | | | |
| Affiliated Underlying Funds | | | (526,656 | ) |
| Non-affiliated Underlying Funds | | | 28,742,578 | |
| | | | 28,215,922 | |
| Net gain (loss) | | | 19,788,352 | |
| Net increase (decrease) in net assets resulting from operations | | $ | 27,911,029 | |
The accompanying notes are an integral part of the financial statements.
| | | | | | |
| | 10 | | | | | | Deutsche DWS Variable Series II — DWS Alternative Asset Allocation VIP |
Statements of Changes in Net Assets
| | | | | | | | |
| | | Years Ended December 31, | |
| Increase (Decrease) in Net Assets | | 2020 | | | 2019 | |
| Operations: | | | | | | | | |
| Net investment income (loss) | | $ | 8,122,677 | | | $ | 9,024,230 | |
| Net realized gain (loss) | | | (8,427,570 | ) | | | 2,636,547 | |
| Change in net unrealized appreciation (depreciation) | | | 28,215,922 | | | | 26,981,654 | |
| Net increase (decrease) in net assets resulting from operations | | | 27,911,029 | | | | 38,642,431 | |
| Distributions to shareholders: | | | | | | | | |
Class A | | | (873,617 | ) | | | (1,142,148 | ) |
Class B | | | (8,977,130 | ) | | | (9,062,974 | ) |
| Total distributions | | | (9,850,747 | ) | | | (10,205,122 | ) |
| Fund share transactions: | | | | | | | | |
Class A | | | | | | | | |
| Proceeds from shares sold | | | 5,411,306 | | | | 5,519,916 | |
| Reinvestment of distributions | | | 873,617 | | | | 1,142,148 | |
| Payments for shares redeemed | | | (4,249,598 | ) | | | (2,018,312 | ) |
| Net increase (decrease) in net assets from Class A share transactions | | | 2,035,325 | | | | 4,643,752 | |
Class B | | | | | | | | |
| Proceeds from shares sold | | | 73,640,815 | | | | 118,564,810 | |
| Reinvestment of distributions | | | 8,977,130 | | | | 9,062,974 | |
| Payments for shares redeemed | | | (21,769,862 | ) | | | (11,692,494 | ) |
| Net increase (decrease) in net assets from Class B share transactions | | | 60,848,083 | | | | 115,935,290 | |
| Increase (decrease) in net assets | | | 80,943,690 | | | | 149,016,351 | |
| Net assets at beginning of period | | | 383,106,801 | | | | 234,090,450 | |
| | |
| Net assets at end of period | | $ | 464,050,491 | | | $ | 383,106,801 | |
| | |
| Other Information | | | | | | | | |
Class A | | | | | | | | |
| Shares outstanding at beginning of period | | | 2,541,554 | | | | 2,180,831 | |
| Shares sold | | | 433,052 | | | | 428,198 | |
| Shares issued to shareholders in reinvestment of distributions | | | 76,499 | | | | 90,217 | |
| Shares redeemed | | | (351,305 | ) | | | (157,692 | ) |
| Net increase (decrease) in Class A shares | | | 158,246 | | | | 360,723 | |
| | |
| Shares outstanding at end of period | | | 2,699,800 | | | | 2,541,554 | |
Class B | | | | | | | | |
| Shares outstanding at beginning of period | | | 26,180,029 | | | | 17,175,164 | |
| Shares sold | | | 5,958,291 | | | | 9,198,591 | |
| Shares issued to shareholders in reinvestment of distributions | | | 785,401 | | | | 715,310 | |
| Shares redeemed | | | (1,714,936 | ) | | | (909,036 | ) |
| Net increase (decrease) in Class B shares | | | 5,028,756 | | | | 9,004,865 | |
| | |
| Shares outstanding at end of period | | | 31,208,785 | | | | 26,180,029 | |
The accompanying notes are an integral part of the financial statements.
| | | | |
Deutsche DWS Variable Series II — DWS Alternative Asset Allocation VIP | | | | | 11 |
Financial Highlights
| | | | | | | | | | | | | | | | | | | | |
| DWS Alternative Asset Allocation VIP — Class A | | | | | | | | | | | | | | | | | | | | |
| |
| | | Years Ended December 31, | |
| | | 2020 | | | 2019 | | | 2018 | | | 2017 | | | 2016 | |
| | | | | |
| Selected Per Share Data | | | | | | | | | | | | | | | | | | | | |
| Net asset value, beginning of period | | $ | 13.35 | | | $ | 12.10 | | | $ | 13.61 | | | $ | 12.97 | | | $ | 12.60 | |
| Income (loss) from investment operations: | | | | | | | | | | | | | | | | | | | | |
Net investment incomea | | | .29 | | | | .40 | | | | .61 | | | | .33 | | | | .35 | |
Net realized and unrealized gain (loss) | | | .40 | | | | 1.35 | | | | (1.84 | ) | | | .62 | | | | .31 | |
Total from investment operations | | | .69 | | | | 1.75 | | | | (1.23 | ) | | | .95 | | | | .66 | |
| Less distributions from: | | | | | | | | | | | | | | | | | | | | |
Net investment income | | | (.34 | ) | | | (.50 | ) | | | (.28 | ) | | | (.31 | ) | | | (.29 | ) |
Net realized gains | | | — | | | | — | | | | — | | | | — | | | | — | |
Total distributions | | | (.34 | ) | | | (.50 | ) | | | (.28 | ) | | | (.31 | ) | | | (.29 | ) |
| Net asset value, end of period | | $ | 13.70 | | | $ | 13.35 | | | $ | 12.10 | | | $ | 13.61 | | | $ | 12.97 | |
| Total Return (%)c | | | 5.71 | | | | 14.68 | b | | | (9.14 | )b | | | 7.41 | b | | | 5.30 | b |
| | | | | |
| Ratios to Average Net Assets and Supplemental Data | | | | | | | | | | | | | | | | | | | | |
| Net assets, end of period ($ millions) | | | 37 | | | | 34 | | | | 26 | | | | 27 | | | | 24 | |
| Ratio of expenses before expense reductions (%)d,e | | | .23 | | | | .56 | | | | .73 | | | | .64 | | | | .56 | |
| Ratio of expenses after expense reductions (%)d,e | | | .23 | | | | .23 | | | | .16 | | | | .19 | | | | .27 | |
| Ratio of net investment income (%) | | | 2.29 | | | | 3.09 | | | | 4.78 | | | | 2.50 | | | | 2.70 | |
| Portfolio turnover rate (%) | | | 18 | | | | 10 | | | | 32 | | | | 55 | | | | 51 | |
| | | | | | | | | | | | | | | | | | | | |
| DWS Alternative Asset Allocation VIP — Class B | | | | | | | | | | | | | | | | | | | | |
| |
| | | Years Ended December 31, | |
| | | 2020 | | | 2019 | | | 2018 | | | 2017 | | | 2016 | |
| | | | | |
| Selected Per Share Data | | | | | | | | | | | | | | | | | | | | |
| Net asset value, beginning of period | | $ | 13.34 | | | $ | 12.09 | | | $ | 13.59 | | | $ | 12.96 | | | $ | 12.59 | |
| Income (loss) from investment operations: | | | | | | | | | | | | | | | | | | | | |
Net investment incomea | | | .24 | | | | .37 | | | | .62 | | | | .31 | | | | .31 | |
Net realized and unrealized gain (loss) | | | .41 | | | | 1.34 | | | | (1.88 | ) | | | .59 | | | | .31 | |
Total from investment operations | | | .65 | | | | 1.71 | | | | (1.26 | ) | | | .90 | | | | .62 | |
| Less distributions from: | | | | | | | | | | | | | | | | | | | | |
Net investment income | | | (.31 | ) | | | (.46 | ) | | | (.24 | ) | | | (.27 | ) | | | (.25 | ) |
Net realized gains | | | — | | | | — | | | | — | | | | — | | | | — | |
Total distributions | | | (.31 | ) | | | (.46 | ) | | | (.24 | ) | | | (.27 | ) | | | (.25 | ) |
| Net asset value, end of period | | $ | 13.68 | | | $ | 13.34 | | | $ | 12.09 | | | $ | 13.59 | | | $ | 12.96 | |
| Total Return (%)b,c | | | 5.32 | | | | 14.35 | | | | (9.35 | ) | | | 7.01 | | | | 4.99 | |
| | | | | |
| Ratios to Average Net Assets and Supplemental Data | | | | | | | | | | | | | | | | | | | | |
| Net assets, end of period ($ millions) | | | 427 | | | | 349 | | | | 208 | | | | 157 | | | | 107 | |
| Ratio of expenses before expense reductions (%)d,e | | | .61 | | | | .92 | | | | 1.08 | | | | .93 | | | | .85 | |
| Ratio of expenses after expense reductions (%)d,e | | | .59 | | | | .52 | | | | .45 | | | | .48 | | | | .57 | |
| Ratio of net investment income (%) | | | 1.94 | | | | 2.90 | | | | 4.85 | | | | 2.31 | | | | 2.45 | |
| Portfolio turnover rate (%) | | | 18 | | | | 10 | | | | 32 | | | | 55 | | | | 51 | |
| a | Based on average shares outstanding during the period. |
| b | Total return would have been lower had certain expenses not been reduced. |
| c | Total return would have been lower if the Advisor had not reduced some Underlying DWS Funds’ expenses. |
| d | The Fund invests in other Funds and indirectly bears its proportionate share of fees and expenses incurred by the Underlying Funds in which the Fund is invested. This ratio does not include these indirect fees and expenses. |
| e | Expense ratio does not reflect charges and fees associated with the separate account that invests in the Fund or any variable life insurance policy or variable annuity contract for which the Fund is an investment option. |
The accompanying notes are an integral part of the financial statements.
| | | | | | |
| | 12 | | | | | | Deutsche DWS Variable Series II — DWS Alternative Asset Allocation VIP |
| | | | |
| Notes to Financial Statements | | | | |
A. Organization and Significant Accounting Policies
DWS Alternative Asset Allocation VIP (the “Fund”) is a diversified series of Deutsche DWS Variable Series II (the “Trust”), which is registered under the Investment Company Act of 1940, as amended (the “1940 Act”), as an open-end management investment company organized as a Massachusetts business trust. The Fund mainly invests in other affiliated DWS funds (i.e., mutual funds, exchange-traded funds and other pooled investment vehicles managed by DWS Investment Management Americas, Inc. or one of its affiliates, together the “Underlying DWS Funds”), non-affiliated exchange-traded funds (“Non-affiliated ETFs”), non-affiliated exchange-traded notes (“Non-affiliated ETNs”) and derivative investments. Non-affiliated ETFs, Non-affiliated ETNs and Underlying DWS Funds are collectively referred to as “Underlying Funds.” During the year ended December 31, 2020, the Fund primarily invested in Underlying DWS Funds and non-affiliated ETFs. Each Underlying DWS Fund’s accounting policies and investment holdings are outlined in the Underlying DWS Funds’ financial statements and are available upon request.
Multiple Classes of Shares of Beneficial Interest. The Fund offers two classes of shares (Class A shares and Class B shares). Sales of Class B shares are subject to recordkeeping fees of up to 0.15% and Rule 12b-1 fees under the 1940 Act equal to an annual rate of up to 0.25% of the average daily net assets of the Class B shares of the Fund. Class A shares are not subject to such fees.
Investment income, realized and unrealized gains and losses, and certain fund-level expenses and expense reductions, if any, are borne pro rata on the basis of relative net assets by the holders of all classes of shares except that each class bears certain expenses unique to that class (including the applicable Rule 12b-1 fee). Differences in class-level expenses may result in payment of different per share dividends by class. All shares have equal rights with respect to voting subject to class-specific arrangements.
The Fund’s financial statements are prepared in accordance with accounting principles generally accepted in the United States of America (“U.S. GAAP”) which require the use of management estimates. Actual results could differ from those estimates. The Fund qualifies as an investment company under Topic 946 of Accounting Standards Codification of U.S. GAAP. The policies described below are followed consistently by the Fund in the preparation of its financial statements.
Security Valuation. Investments are stated at value determined as of the close of regular trading on the New York Stock Exchange on each day the exchange is open for trading.
Various inputs are used in determining the value of the Fund’s investments. These inputs are summarized in three broad levels. Level 1 includes quoted prices in active markets for identical securities. Level 2 includes other significant observable inputs (including quoted prices for similar securities, interest rates, prepayment speeds and credit risk). Level 3 includes significant unobservable inputs (including the Fund’s own assumptions in determining the fair value of investments). The level assigned to the securities valuations may not be an indication of the risk or liquidity associated with investing in those securities.
Investments in mutual funds are valued at the net asset value per share of each class of the Underlying DWS Funds and are categorized as Level 1.
ETFs and ETNs are valued at the most recent sale price or official closing price reported on the exchange (U.S. or foreign) or over-the-counter market on which they trade. ETFs and ETNs for which no sales are reported are valued at the calculated mean between the most recent bid and asked quotations on the relevant market or, if a mean cannot be determined, at the most recent bid quotation. ETFs and ETNs securities are generally categorized as Level 1.
Disclosure about the classification of fair value measurements is included in a table following the Fund’s Investment Portfolio.
Federal Income Taxes. The Fund’s policy is to comply with the requirements of the Internal Revenue Code, as amended, which are applicable to regulated investment companies and to distribute all of its taxable income to its shareholders.
At December 31, 2020, the Fund had a net tax basis capital loss carryforward of approximately $17,134,000, which may be applied against realized net taxable capital gains indefinitely, including short-term losses ($10,810,000) and long-term losses ($6,324,000).
The Fund has reviewed the tax positions for the open tax years as of December 31, 2020 and has determined that no provision for income tax and/or uncertain tax positions is required in the Fund’s financial statements. The Fund’s federal tax returns for the prior three fiscal years remain open subject to examination by the Internal Revenue Service.
| | | | |
Deutsche DWS Variable Series II — DWS Alternative Asset Allocation VIP | | | | | 13 |
Distribution of Income and Gains. Distributions from net investment income of the Fund, if any, are declared and distributed to shareholders annually. Net realized gains from investment transactions, in excess of available capital loss carryforwards, would be taxable to the Fund if not distributed and, therefore, will be distributed to shareholders at least annually. The Fund may also make additional distributions for tax purposes if necessary.
The timing and characterization of certain income and capital gain distributions are determined annually in accordance with federal tax regulations, which may differ from accounting principles generally accepted in the United States of America. These differences primarily relate to certain securities sold at a loss and capital gain distributions from Underlying Funds. As a result, net investment income (loss) and net realized gain (loss) on investment transactions for a reporting period may differ significantly from distributions during such period. Accordingly, the Fund may periodically make reclassifications among certain of its capital accounts without impacting the net asset value of the Fund.
At December 31, 2020, the Fund’s components of distributable earnings on a tax basis were as follows:
| | | | |
| Undistributed ordinary income* | | $ | 8,081,829 | |
| Capital loss carryforward | | $ | (17,134,000 | ) |
| Net unrealized appreciation (depreciation) on investments | | $ | 34,328,582 | |
At December 31, 2020, the aggregate cost of investments for federal income tax purposes was $430,217,230. The net unrealized appreciation for all investments based on tax cost was $34,328,582. This consisted of aggregate gross unrealized appreciation for all investments for which there was an excess of value over tax cost of $47,896,283 and aggregate gross unrealized depreciation for all investments for which there was an excess of tax cost over value of $13,567,701.
In addition, the tax character of distributions paid by the Fund is summarized as follows:
| | | | | | | | |
| | | Years Ended December 31, | |
| | | 2020 | | | 2019 | |
| Distributions from ordinary income* | | $ | 9,850,747 | | | $ | 10,205,122 | �� |
| * | For tax purposes, short-term capital gain distributions are considered ordinary income distributions. |
Expenses. Expenses of the Trust arising in connection with a specific fund are allocated to that fund. Other Trust expenses which cannot be directly attributed to a fund are apportioned among the funds in the Trust based upon the relative net assets or other appropriate measures.
Contingencies. In the normal course of business, the Fund may enter into contracts with service providers that contain general indemnification clauses. The Fund’s maximum exposure under these arrangements is unknown, as this would involve future claims that may be made against the Fund that have not yet been made. However, based on experience, the Fund expects the risk of loss to be remote.
Other. Investment transactions are accounted for on a trade date plus one basis for daily net asset value calculations. However, for financial reporting purposes, investment transactions are reported on trade date. Interest income is recorded on the accrual basis. Dividend Income is recorded on the ex-dividend date. Distributions of income and capital gains from the Underlying Funds are recorded on the ex-dividend date. Realized gains and losses from investment transactions are recorded on an identified cost basis.
B. Purchases and Sales of Securities
During the year ended December 31, 2020, purchases and sales of affiliated Underlying Funds (excluding short-term investments) aggregated $82,130,030 and $26,119,645, respectively. Purchases and sales of Non-affiliated ETFs aggregated $67,786,231 and $35,352,533, respectively.
C. Related Parties
Management Agreement. Under the Investment Management Agreement with DWS Investment Management Americas, Inc. (“DIMA” or the “Advisor”), an indirect, wholly owned subsidiary of DWS Group GmbH & Co. KGaA (“DWS Group”), the Advisor directs the investments of the Fund in accordance with its investment objectives, policies and restrictions. The Advisor determines the securities, instruments and other contracts relating to investments in Underlying Funds to be purchased, sold or entered into by the Fund or delegates such responsibility to the Fund’s subadvisors.
RREEF America L.L.C. (“RREEF”), an indirect, wholly owned subsidiary of DWS Group, acts as an investment subadvisor to the Fund. As an investment subadvisor to the Fund, RREEF provides investment management services to the portions of the Fund’s portfolio allocated to direct investments in global real estate and global infrastructure securities. RREEF is paid by the Advisor for the services RREEF provides to
| | | | | | |
| | 14 | | | | | | Deutsche DWS Variable Series II — DWS Alternative Asset Allocation VIP |
the Fund. As of the date of this report, the Fund obtained its exposure to global real estate and global infrastructure securities indirectly through investments in other Underlying Funds.
Under the Investment Management Agreement with the Advisor, the Fund pays a monthly management fee based on the Fund’s average daily net assets, computed and accrued daily and payable monthly, at the following annual rates:
| | | | |
| On assets invested in exchange-traded funds and mutual funds | | | .10 | % |
| On assets invested in all other assets not considered exchange-traded funds and mutual funds | | | 1.00 | % |
Accordingly, for the year ended December 31, 2020, the fee pursuant to the Investment Management Agreement was equivalent to an annual rate (exclusive of any applicable waivers/reimbursements) of 0.10% of the Fund’s average daily net assets.
In addition, the Advisor will receive management fees from managing the Underlying DWS Funds in which the Fund invests.
The Fund does not invest in the Underlying DWS Funds for the purpose of exercising management or control; however, investments within the set limits may represent 5% or more of an Underlying DWS Fund’s outstanding shares. At December 31, 2020, the Fund held approximately 31% of DWS Emerging Markets Fixed Income Fund, 25% of DWS Floating Rate Fund and 12% of DWS Global Macro Fund.
The Advisor has contractually agreed to waive its fees and/or reimburse Fund expenses for the period January 1, 2020 through April 30, 2021 to the extent necessary to maintain the total annual operating expenses (including indirect expenses of Underlying Funds and excluding certain expenses such as extraordinary expenses, taxes, brokerage and interest expenses) of each class as follows:
| | | | |
| Class A | | | .86 | % |
| Class B | | | 1.15 | % |
For the year ended December 31, 2020, fees waived and/or expenses reimbursed for Class B is $93,545.
The Fund indirectly bears its proportionate share of fees and expenses incurred by the Underlying Funds in which it is invested.
Administration Fee. Pursuant to an Administrative Services Agreement, DIMA provides most administrative services to the Fund. Prior to March 1, 2020, for all services provided under the Administrative Services Agreement, the Fund paid the Advisor an annual fee (“Administration Fee”) of 0.10% of the Fund’s average daily net assets, computed and accrued daily and payable monthly. Effective March 1, 2020, for all services provided under the Administrative Services Agreement, the Fund pays the Advisor an annual Administration Fee of 0.097% of the Fund’s average daily net assets, computed and accrued daily and payable monthly. For the year ended December 31, 2020, the Administration Fee was $402,008, of which $37,745 is unpaid.
Service Provider Fees. DWS Service Company (“DSC”), an affiliate of the Advisor, is the transfer agent, dividend-paying agent and shareholder service agent for the Fund. Pursuant to a sub-transfer agency agreement between DSC and DST Systems, Inc. (“DST”), DSC has delegated certain transfer agent, dividend-paying agent and shareholder service agent functions to DST. DSC compensates DST out of the shareholder servicing fee it receives from the Fund. For the year ended December 31, 2020, the amounts charged to the Fund by DSC were as follows:
| | | | | | | | |
| Services to Shareholders | | Total
Aggregated | | | Unpaid at
December 31, 2020 | |
| Class A | | $ | 170 | | | $ | 32 | |
| Class B | | | 284 | | | | 54 | |
| | | $ | 454 | | | $ | 86 | |
Distribution Service Agreement. Under the Fund’s Class B 12b-1 plan, DWS Distributors, Inc. (“DDI”) received a fee (“Distribution Service Fee”) of up to 0.25% of the average daily net assets of Class B shares. For the year ended December 31, 2020, the Distribution Service Fee aggregated $948,590, of which $89,582 is unpaid.
Other Service Fees. Under an agreement with the Fund, DIMA is compensated for providing certain pre-press and regulatory filing services to the Fund. For the year ended December 31, 2020, the amount charged to the Fund by DIMA included in the Statement of Operations under “Reports to shareholders” aggregated $9,372, of which $3,292 is unpaid.
| | | | |
Deutsche DWS Variable Series II — DWS Alternative Asset Allocation VIP | | | | | 15 |
Trustees’ Fees and Expenses. The Fund paid retainer fees to each Trustee not affiliated with the Advisor, plus specified amounts to the Board Chairperson and to each committee Chairperson.
Affiliated Cash Management Vehicles. The Fund may invest uninvested cash balances in DWS Central Cash Management Government Fund and DWS ESG Liquidity Fund, affiliated money market funds which are managed by the Advisor. Each affiliated money market fund is managed in accordance with Rule 2a-7 under the 1940 Act, which governs the quality, maturity, diversity and liquidity of instruments in which a money market fund may invest. DWS Central Cash Management Government Fund seeks to maintain a stable net asset value, and DWS ESG Liquidity Fund maintains a floating net asset value. The Fund indirectly bears its proportionate share of the expenses of each affiliated money market fund in which it invests. DWS Central Cash Management Government Fund does not pay the Advisor an investment management fee.
D. Ownership of the Fund
At December 31, 2020, two participating insurance companies were owners of record of 10% or more of the total outstanding Class A shares of the Fund, each owning 79% and 19%. Two participating insurance companies were owners of record of 10% or more of the total outstanding Class B shares of the Fund, each owning 84% and 11%, respectively.
E. Other — COVID-19 Pandemic
A novel coronavirus known as COVID-19, declared a pandemic by the World Health Organization, has caused significant uncertainty, market volatility, decreased economic and other activity and increased government activity. Specifically, COVID-19 has led to significant death and morbidity, and concerns about its further spread have resulted in the closing of schools and non-essential businesses, cancellations, shelter-in place orders, lower consumer spending in certain sectors, social distancing, bans on large social gatherings and travel, quarantines, government economic stimulus measures, reduced productivity, rapid increases in unemployment, increased demand for and strain on government and medical resources, border closings and global trade and supply chain interruptions, among others. The full effects, duration and costs of the COVID-19 pandemic are impossible to predict, and the circumstances surrounding the COVID-19 pandemic will continue to evolve. The pandemic may affect certain countries, industries, economic sectors, companies and investment products more than others, may exacerbate existing economic, political, or social tensions and may increase the probability of an economic recession or depression. The Fund and its investments may be adversely affected by the effects of the COVID-19 pandemic, and a prolonged pandemic may result in the Fund and its service providers experiencing operational difficulties in coordinating a remote workforce and implementing their business continuity plans, among others. Management will continue to monitor the impact COVID-19 has on the Fund and reflect the consequences as appropriate in the Fund’s accounting and financial reporting.
| | | | | | |
| | 16 | | | | | | Deutsche DWS Variable Series II — DWS Alternative Asset Allocation VIP |
Report of Independent Registered Public Accounting Firm
To the Board of Trustees of Deutsche DWS Variable Series II and Shareholders of DWS Alternative Asset Allocation VIP:
Opinion on the Financial Statements
We have audited the accompanying statement of assets and liabilities of DWS Alternative Asset Allocation VIP (the “Fund”) (one of the funds constituting Deutsche DWS Variable Series II) (the “Trust”), including the investment portfolio, as of December 31, 2020, and the related statement of operations for the year then ended, the statements of changes in net assets for each of the two years in the period then ended, the financial highlights for each of the five years in the period then ended and the related notes (collectively referred to as the “financial statements”). In our opinion, the financial statements present fairly, in all material respects, the financial position of the Fund (one of the funds constituting Deutsche DWS Variable Series II) at December 31, 2020, the results of its operations for the year then ended, the changes in its net assets for each of the two years in the period then ended and its financial highlights for each of the five years in the period then ended, in conformity with U.S. generally accepted accounting principles.
Basis for Opinion
These financial statements are the responsibility of the Trust’s management. Our responsibility is to express an opinion on the Fund’s financial statements based on our audits. We are a public accounting firm registered with the Public Company Accounting Oversight Board (United States) (“PCAOB”) and are required to be independent with respect to the Trust in accordance with the U.S. federal securities laws and the applicable rules and regulations of the Securities and Exchange Commission and the PCAOB.
We conducted our audits in accordance with the standards of the PCAOB. Those standards require that we plan and perform the audit to obtain reasonable assurance about whether the financial statements are free of material misstatement, whether due to error or fraud. The Trust is not required to have, nor were we engaged to perform, an audit of the Trust’s internal control over financial reporting. As part of our audits, we are required to obtain an understanding of internal control over financial reporting, but not for the purpose of expressing an opinion on the effectiveness of the Trust’s internal control over financial reporting. Accordingly, we express no such opinion.
Our audits included performing procedures to assess the risks of material misstatement of the financial statements, whether due to error or fraud, and performing procedures that respond to those risks. Such procedures included examining, on a test basis, evidence regarding the amounts and disclosures in the financial statements. Our procedures included confirmation of securities owned as of December 31, 2020, by correspondence with the custodian and others. Our audits also included evaluating the accounting principles used and significant estimates made by management, as well as evaluating the overall presentation of the financial statements. We believe that our audits provide a reasonable basis for our opinion.

We have served as the auditor of one or more investment companies in the DWS family of funds since at least 1979, but we are unable to determine the specific year.
Boston, Massachusetts
February 12, 2021
| | | | |
Deutsche DWS Variable Series II — DWS Alternative Asset Allocation VIP | | | | | 17 |
| | |
| Information About Your Fund’s Expenses | | (Unaudited) |
As an investor of the Fund, you incur two types of costs: ongoing expenses and transaction costs. Ongoing expenses include management fees, distribution and service (12b-1) fees and other Fund expenses. Examples of transaction costs include contract charges, which are not shown in this section. The following tables are intended to help you understand your ongoing expenses (in dollars) of investing in the Fund and to help you compare these expenses with the ongoing expenses of investing in other mutual funds. In addition to the ongoing expenses which the Fund bears directly, the Fund’s shareholders indirectly bear the expense of the Underlying Funds in which the Fund invests. These expenses are not included in the Fund’s annualized expense ratios used to calculate the expense estimate in the tables. In the most recent six-month period, Class B limited these expenses; had it not done so, expenses would have been higher. The examples in the table are based on an investment of $1,000 invested at the beginning of the six-month period and held for the entire period (July 1, 2020 to December 31, 2020).
The tables illustrate your Fund’s expenses in two ways:
| – | | Actual Fund Return. This helps you estimate the actual dollar amount of ongoing expenses (but not transaction costs) paid on a $1,000 investment in the Fund using the Fund’s actual return during the period. To estimate the expenses you paid over the period, simply divide your account value by $1,000 (for example, an $8,600 account value divided by $1,000 = 8.6), then multiply the result by the number in the “Expenses Paid per $1,000” line under the share class you hold. |
| – | | Hypothetical 5% Fund Return. This helps you to compare your Fund’s ongoing expenses (but not transaction costs) with those of other mutual funds using the Fund’s actual expense ratio and a hypothetical rate of return of 5% per year before expenses. Examples using a 5% hypothetical Fund return may be found in the shareholder reports of other mutual funds. The hypothetical account values and expenses may not be used to estimate the actual ending account balance or expenses you paid for the period. |
Please note that the expenses shown in these tables are meant to highlight your ongoing expenses only and do not reflect any transaction costs. The “Expenses Paid per $1,000” line of the tables is useful in comparing ongoing expenses only and will not help you determine the relative total expense of owning different funds. If these transaction costs had been included, your costs would have been higher.
| | | | | | | | |
| Expenses and Value of a $1,000 Investment for the six months ended December 31, 2020 | |
| | |
| Actual Fund Return | | Class A | | | Class B | |
| Beginning Account Value 7/1/20 | | $ | 1,000.00 | | | $ | 1,000.00 | |
| Ending Account Value 12/31/20 | | $ | 1,139.80 | | | $ | 1,137.20 | |
| Expenses Paid per $1,000* | | $ | 1.24 | | | $ | 3.17 | |
| | |
| Hypothetical 5% Fund Return | | | Class A | | | | Class B | |
| Beginning Account Value 7/1/20 | | $ | 1,000.00 | | | $ | 1,000.00 | |
| Ending Account Value 12/31/20 | | $ | 1,023.98 | | | $ | 1,022.17 | |
| Expenses Paid per $1,000* | | $ | 1.17 | | | $ | 3.00 | |
| * | Expenses are equal to the Fund’s annualized expense ratio for each share class, multiplied by the average account value over the period, multiplied by 184 (the number of days in the most recent six-month period), then divided by 366. |
| | | | | | | | |
| Annualized Expense Ratios** | | Class A | | | Class B | |
| Deutsche DWS Variable Series II — DWS Alternative Asset Allocation VIP | | | .23 | % | | | .59 | % |
| ** | The Fund invests in other funds and indirectly bears its proportionate share of fees and expenses incurred by the Underlying Funds in which the Fund is invested. These ratios do not include these indirect fees and expenses. |
For more information, please refer to the Fund’s prospectus.
These tables do not reflect charges and fees (“contract charges”) associated with the separate account that invests in the Fund or any variable life insurance policy or variable annuity contract for which the Fund is an investment option.
For an analysis of the fees associated with an investment in the Fund or similar funds, please refer to the current and hypothetical expense calculators for Variable Insurance Products which can be found at dws.com/calculators.
| | | | | | |
| | 18 | | | | | | Deutsche DWS Variable Series II — DWS Alternative Asset Allocation VIP |
| | | | |
| Tax Information | | (Unaudited) | | |
Please consult a tax advisor if you have questions about federal or state income tax laws, or on how to prepare your tax returns. If you have specific questions about your account, please contact your insurance provider.
Proxy Voting
The Trust’s policies and procedures for voting proxies for portfolio securities and information about how the Trust voted proxies related to its portfolio securities during the most recent 12-month period ended June 30 are available on our Web site — dws.com/en-us/resources/proxy-voting — or on the SEC’s Web site — sec.gov. To obtain a written copy of the Trust’s policies and procedures without charge, upon request, call us toll free at (800) 728-3337.
| | | | |
Deutsche DWS Variable Series II — DWS Alternative Asset Allocation VIP | | | | | 19 |
Advisory Agreement Board Considerations and Fee Evaluation
The Board of Trustees (hereinafter referred to as the “Board” or “Trustees”) approved the renewal of DWS Alternative Asset Allocation VIP’s (the “Fund”) investment management agreement (the “Agreement”) with DWS Investment Management Americas, Inc. (“DIMA”) and sub-advisory agreement (the “Sub-Advisory Agreement” and together with the Agreement, the “Agreements”) between DIMA and RREEF America L.L.C. (“RREEF”), an affiliate of DIMA, in September 2020.
In terms of the process that the Board followed prior to approving the Agreements, shareholders should know that:
| – | | DURING THE ENTIRE PROCESS, ALL OF THE FUND’S TRUSTEES WERE INDEPENDENT OF DIMA AND ITS AFFILIATES (THE “INDEPENDENT TRUSTEES”). |
| – | | The Board met frequently during the past year to discuss fund matters and dedicated a substantial amount of time to contract review matters. Over the course of several months, the Board reviewed extensive materials received from DIMA, independent third parties and independent counsel. These materials included an analysis of the Fund’s performance, fees and expenses, and profitability from a fee consultant retained by the Fund’s Independent Trustees (the “Fee Consultant”). |
| – | | The Board also received extensive information throughout the year regarding performance of the Fund. |
| – | | The Independent Trustees regularly met privately with counsel to discuss contract review and other matters. In addition, the Independent Trustees were advised by the Fee Consultant in the course of their review of the Fund’s contractual arrangements and considered a comprehensive report prepared by the Fee Consultant in connection with their deliberations. |
| – | | In connection with reviewing the Agreements, the Board also reviewed the terms of the Fund’s Rule 12b-1 plan, distribution agreement, administrative services agreement, transfer agency agreement and other material service agreements. |
In connection with the contract review process, the Board considered the factors discussed below, among others. The Board also considered that DIMA has managed the Fund since its inception, and the Board believes that a long-term relationship with a capable, conscientious advisor is in the best interests of the Fund. The Board considered, generally, that shareholders chose to invest or remain invested in the Fund knowing that DIMA managed the Fund. DIMA and RREEF are part of DWS Group GmbH & Co. KGaA (“DWS Group”). DWS Group is a global asset management business that offers a wide range of investing expertise and resources, including research capabilities in many countries throughout the world. In 2018, approximately 20% of DWS Group’s shares were sold in an initial public offering, with Deutsche Bank AG owning the remaining shares.
As part of the contract review process, the Board carefully considered the fees and expenses of each DWS fund overseen by the Board in light of the fund’s performance. In many cases, this led to the negotiation and implementation of expense caps.
While shareholders may focus primarily on fund performance and fees, the Fund’s Board considers these and many other factors, including the quality and integrity of DIMA’s and RREEF’s personnel and administrative support services provided by DIMA, such as back-office operations, fund valuations, and compliance policies and procedures.
Nature, Quality and Extent of Services. The Board considered the terms of the Agreements, including the scope of advisory services provided under the Agreements. The Board noted that, under the Agreements, DIMA and RREEF provide portfolio management services to the Fund and that, pursuant to a separate administrative services agreement, DIMA provides administrative services to the Fund. The Board considered the experience and skills of senior management and investment personnel and the resources made available to such personnel. The Board also considered the risks to DIMA in sponsoring or managing the Fund, including financial, operational and reputational risks, the potential economic impact to DIMA from such risks and DIMA’s approach to addressing such risks. Throughout the course of the year, the Board also received information regarding DIMA’s oversight of fund sub-advisors, including RREEF. The Board reviewed the Fund’s performance over short-term and long-term periods and compared those returns to various agreed-upon performance measures, including market index(es) and a peer universe compiled using information supplied by Morningstar Direct (“Morningstar”), an independent fund data service. The Board also noted that it has put into place a process of identifying “Funds in Review” (e.g., funds performing poorly
| | | | | | |
| | 20 | | | | | | Deutsche DWS Variable Series II — DWS Alternative Asset Allocation VIP |
relative to a peer universe), and receives additional reporting from DIMA regarding such funds and, where appropriate, DIMA’s plans to address underperformance. The Board believes this process is an effective manner of identifying and addressing underperforming funds. Based on the information provided, the Board noted that, for the one-, three- and five-year periods ended December 31, 2019, the Fund’s performance (Class A shares) was in the 2nd quartile, 2nd quartile and 1st quartile, respectively, of the applicable Morningstar universe (the 1st quartile being the best performers and the 4th quartile being the worst performers). The Board also observed that the Fund has underperformed its benchmark in the one-, three- and five-year periods ended December 31, 2019.
Fees and Expenses. The Board considered the Fund’s investment management fee schedule, sub-advisory fee schedule, operating expenses and total expense ratios, and comparative information provided by Broadridge Financial Solutions, Inc. (“Broadridge”) and the Fee Consultant regarding investment management fee rates paid to other investment advisors by similar funds (1st quartile being the most favorable and 4th quartile being the least favorable). With respect to management fees paid to other investment advisors by similar funds, the Board noted that the contractual fee rates paid by the Fund, which include a 0.10% fee paid to DIMA under the Fund’s administrative services agreement, were equal to the median of the applicable Broadridge peer group (based on Broadridge data provided as of December 31, 2019). The Board noted that, effective March 1, 2020, the fee paid to DIMA under the Fund’s administrative services agreement was reduced to 0.097%. The Board also noted that, from inception through October 1, 2019, DIMA waived voluntarily a portion (0.15%) of the Fund’s management fee, and noted further that, effective October 1, 2019, in connection with the 2019 contract renewal process, DIMA agreed to reduce the Fund’s contractual management fee by 0.10% on assets invested in other funds and by 0.20% on assets invested in direct investments. With respect to any sub-advisory fee paid to RREEF, the Board noted that the fee is paid by DIMA out of its fee and not directly by the Fund. The Board noted that the Fund’s Class A shares total (net) operating expenses were expected to be lower than the median (1st quartile) of the applicable Broadridge expense universe (based on Broadridge data provided as of December 31, 2019), and analyzing Broadridge expense universe Class A (net) expenses less any applicable 12b-1 fees, but inclusive of acquired fund fees and expenses) (“Broadridge Universe Expenses”). The Board also reviewed data comparing each other operational share class’s total (net) operating expenses to the applicable Broadridge Universe Expenses. The Board noted that the expense limitations agreed to by DIMA were expected to help the Fund’s total (net) operating expenses remain competitive. The Board considered the Fund’s management fee rate as compared to fees charged by DIMA to comparable DWS U.S. registered funds (“DWS Funds”) and considered differences between the Fund and the comparable DWS Funds. The information requested by the Board as part of its review of fees and expenses also included information about institutional accounts (including any sub-advised funds and accounts) and funds offered primarily to European investors (“DWS Europe Funds”) managed by DWS Group. The Board noted that DIMA indicated that DWS Group does not manage any institutional accounts or DWS Europe Funds comparable to the Fund.
On the basis of the information provided, the Board concluded that management fees were reasonable and appropriate in light of the nature, quality and extent of services provided by DIMA and RREEF.
Profitability. The Board reviewed detailed information regarding revenues received by DIMA from advising the DWS Funds along with the estimated costs to DIMA, and pre-tax profits realized by DIMA, from advising the DWS Funds. The Board also received information regarding the estimated enterprise-wide profitability of DIMA and its affiliates with respect to all fund services in totality. The Board did not receive profitability information with respect to the Fund, but did receive such information with respect to the DWS Funds in which the Fund invests. The Board also reviewed certain publicly available information regarding the profitability of certain similar investment management firms. The Board noted that, while information regarding the profitability of such firms is limited (and in some cases is not necessarily prepared on a comparable basis), DIMA and its affiliates’ overall profitability with respect to the DWS Funds (after taking into account distribution and other services provided to the funds by DIMA and its affiliates) was lower than the overall profitability levels of most comparable firms for which such data was available.
Economies of Scale. The Board considered whether there are economies of scale with respect to the management of the Fund and whether the Fund benefits from any economies of scale. In this regard, the Board observed that while the Fund’s current investment management fee schedule does not include breakpoints, the Fund’s fee schedule represents an appropriate sharing between the Fund and DIMA of such economies of scale as may exist in the management of the Fund at current asset levels.
Other Benefits to DIMA and Its Affiliates. The Board also considered the character and amount of other incidental or “fall-out” benefits received by DIMA and its affiliates, including any fees received by DIMA for
| | | | |
Deutsche DWS Variable Series II — DWS Alternative Asset Allocation VIP | | | | | 21 |
administrative services provided to the Fund, any fees received by an affiliate of DIMA for transfer agency services provided to the Fund and any fees received by an affiliate of DIMA for distribution services. The Board also considered benefits to DIMA related to brokerage and soft-dollar allocations, including allocating brokerage to pay for research generated by parties other than the executing broker dealers, which pertain primarily to funds investing in equity securities. In addition, the Board considered the incidental public relations benefits to DIMA related to DWS Funds advertising and cross-selling opportunities among DIMA products and services. The Board considered these benefits in reaching its conclusion that the Fund’s management fees were reasonable.
Compliance. The Board considered the significant attention and resources dedicated by DIMA to its compliance processes in recent years. The Board noted in particular (i) the experience, seniority and time commitment of the individuals serving as DIMA’s and the Fund’s chief compliance officers and (ii) the substantial commitment of resources by DIMA and its affiliates to compliance matters, including the retention of compliance personnel.
The Board also considered that on September 24, 2020, the SEC granted a temporary order permitting DIMA and its affiliates to continue providing investment advisory and underwriting services to the DWS Funds notwithstanding a consent order entered into by Deutsche Bank AG on June 17, 2020 (the “Consent Order”). The Board noted that the temporary order was granted effective as of the date of the Consent Order. The Board also noted various representations by DIMA to the Board relating to the Consent Order, including that the conduct giving rise to the Consent Order (unintentional conduct that resulted from a system outage that prevented Deutsche Bank AG from reporting data in accordance with applicable CFTC requirements for five days in April 2016) did not involve any DWS Fund or services DIMA and its affiliates provide to the DWS Funds, that DIMA and its personnel had no involvement in the alleged conduct giving rise to the Consent Order, and that the DWS Funds would not bear any financial impact or costs relating to the Consent Order.
Based on all of the information considered and the conclusions reached, the Board determined that the continuation of the Agreements is in the best interests of the Fund. In making this determination, the Board did not give particular weight to any single factor identified above. The Board considered these factors over the course of numerous meetings, certain of which were in executive session with only the Independent Trustees and counsel present. It is possible that individual Independent Trustees may have weighed these factors differently in reaching their individual decisions to approve the continuation of the Agreements.
| | | | | | |
| | 22 | | | | | | Deutsche DWS Variable Series II — DWS Alternative Asset Allocation VIP |
Board Members and Officers
The following table presents certain information regarding the Board Members and Officers of the Trust/Corporation. Each Board Member’s year of birth is set forth in parentheses after his or her name. Unless otherwise noted, (i) each Board Member has engaged in the principal occupation(s) noted in the table for at least the most recent five years, although not necessarily in the same capacity; and (ii) the address of each Independent Board Member is Keith R. Fox, DWS Funds Board Chair, c/o Thomas R. Hiller, Ropes & Gray LLP, Prudential Tower, 800 Boylston Street, Boston, MA 02199-3600. Except as otherwise noted below, the term of office for each Board Member is until the election and qualification of a successor, or until such Board Member sooner dies, resigns, is removed or as otherwise provided in the governing documents of the Trust/Corporation. Because the Fund does not hold an annual meeting of shareholders, each Board Member will hold office for an indeterminate period.
The Board Members may also serve in similar capacities with other funds in the fund complex. The number of funds in the DWS fund complex shown in the table below includes all registered open- and closed-end funds (including all of their portfolios) advised by the Advisor and any registered funds that have an investment advisor that is an affiliated person of the Advisor.
| | | | | | | | |
| Independent Board Members | | | |
Name, Year of Birth,
Position with the Trust/
Corporation and
Length of Time Served1 | | Business Experience and Directorships During the Past Five Years | | Number of
Funds in
DWS Fund
Complex
Overseen | | | Other
Directorships
Held by Board
Member
|
Keith R. Fox, CFA (1954) Chairperson since 2017, and Board Member since 1996 | | Managing General Partner, Exeter Capital Partners (a series of private investment funds) (since 1986). Directorships: Progressive International Corporation (kitchen goods importer and distributor); former Chairman, National Association of Small Business Investment Companies; former Directorships: ICI Mutual Insurance Company; BoxTop Media Inc. (advertising); Sun Capital Advisers Trust (mutual funds) (2011–2012) | | | 73 | | | — |
John W. Ballantine (1946) Board Member since 1999 | | Retired; formerly, Executive Vice President and Chief Risk Management Officer, First Chicago NBD Corporation/The First National Bank of Chicago (1996–1998); Executive Vice President and Head of International Banking (1995–1996); former Directorships: Director and Chairman of the Board, Healthways, Inc.2 (population well-being and wellness services) (2003–2014); Stockwell Capital Investments PLC (private equity); Enron Corporation; FNB Corporation; Tokheim Corporation; First Oak Brook Bancshares, Inc.; Oak Brook Bank; and Prisma Energy International. Not-for-Profit Director/Trustee: Palm Beach Civic Association; Window to the World Communications (public media); Life Director of Harris Theater for Music and Dance (Chicago); Life Director of Hubbard Street Dance Chicago; former Not-for-Profit Directorships: Public Radio International | | | 73 | | | Portland
General
Electric2
(utility
company)
(2003–
present) |
Dawn-Marie Driscoll (1946) Board Member since 1987 | | Emeritus Executive Fellow, Center for Business Ethics, Bentley University; formerly: Partner, Palmer & Dodge (law firm) (1988–1990); Vice President of Corporate Affairs and General Counsel, Filene’s (retail) (1978–1988). Directorships: Advisory Board, Center for Business Ethics, Bentley University; Trustee and former Chairman of the Board, Southwest Florida Community Foundation (charitable organization); former Directorships: ICI Mutual Insurance Company (2007–2015); Sun Capital Advisers Trust (mutual funds) (2007–2012), Investment Company Institute (audit, executive, nominating committees) and Independent Directors Council (governance, executive committees) | | | 73 | | | — |
Richard J. Herring (1946) Board Member since 1990 | | Jacob Safra Professor of International Banking and Professor of Finance, The Wharton School, University of Pennsylvania (since July 1972); Director, The Wharton Financial Institutions Center (since 1994); formerly: Vice Dean and Director, Wharton Undergraduate Division (1995–2000) and Director, The Lauder Institute of International Management Studies (2000–2006); Member FDIC Systemic Risk Advisory Committee since 2011, member Systemic Risk Council since 2012 and member of the Advisory Board at the Yale Program on Financial Stability since 2013; Formerly Co-Chair of the Shadow Financial Regulatory Committee (2003–2015), Executive Director of The Financial Economists Roundtable (2008–2015), Director of The Thai Capital Fund (2007–2013), Director of The Aberdeen Singapore Fund (2007–2018), and Nonexecutive Director of Barclays Bank DE (2010–2018) | | | 73 | | | Director,
Aberdeen
Japan Fund
(since 2007) |
William McClayton (1944) Board Member since 2004 | | Private equity investor (since October 2009); previously, Managing Director, Diamond Management & Technology Consultants, Inc. (global consulting firm) (2001–2009); Directorship: Board of Managers, YMCA of Metropolitan Chicago; formerly: Senior Partner, Arthur Andersen LLP (accounting) (1966–2001); Trustee, Ravinia Festival | | | 73 | | | — |
| | | | |
Deutsche DWS Variable Series II — DWS Alternative Asset Allocation VIP | | | | | 23 |
| | | | | | | | |
Name, Year of Birth,
Position with the Trust/
Corporation and
Length of Time Served1 | | Business Experience and Directorships During the Past Five Years | | Number of
Funds in
DWS Fund
Complex
Overseen | | | Other
Directorships
Held by Board
Member
|
Rebecca W. Rimel (1951) Board Member since 1995 | | Senior Advisor, The Pew Charitable Trusts (charitable organization) (since July 2020); formerly: Executive Vice President, The Glenmede Trust Company (investment trust and wealth management) (1983–2004); Board Member, Investor Education (charitable organization) (2004–2005); Trustee, Executive Committee, Philadelphia Chamber of Commerce (2001–2007); Director, Viasys Health Care2 (January 2007–June 2007); Trustee, Thomas Jefferson Foundation (charitable organization) (1994–2012); President, Chief Executive Officer and Director, The Pew Charitable Trusts (charitable organization) (1994–2020) | | | 73 | | | Director,
Becton
Dickinson
and
Company2
(medical
technology
company)
(2012–
present);
Director,
BioTelemetry
Inc.2 (health
care) (2009–
present) |
William N. Searcy, Jr. (1946) Board Member since 1993 | | Private investor since October 2003; formerly: Pension & Savings Trust Officer, Sprint Corporation2 (telecommunications) (November 1989–September 2003); Trustee, Sun Capital Advisers Trust (mutual funds) (1998–2012) | | | 73 | | | — |
| | |
| Officers4 | | |
Name, Year of Birth,
Position with the Trust/
Corporation and
Length of Time Served5 | | Business Experience and Directorships During the Past Five Years |
Hepsen Uzcan6 (1974) President and Chief Executive Officer, 2017–present | | Managing Director3, DWS; Secretary, DWS USA Corporation (2018–present); Assistant Secretary, DWS Distributors, Inc. (2018–present); Director and Vice President, DWS Service Company (2018–present); Assistant Secretary, DWS Investment Management Americas, Inc. (2018–present); Director and President, DB Investment Managers, Inc. (2018–present); President and Chief Executive Officer, The European Equity Fund, Inc., The New Germany Fund, Inc. and The Central and Eastern Europe Fund, Inc. (2017–present); formerly: Vice President for the Deutsche funds (2016–2017); Assistant Secretary for the DWS funds (2013–2019); Assistant Secretary, The European Equity Fund, Inc., The New Germany Fund, Inc. and The Central and Eastern Europe Fund, Inc. (2013–2020); Directorships: Interested Director, The European Equity Fund, Inc., The New Germany Fund, Inc. and The Central and Eastern Europe Fund, Inc. (since June 25, 2020); ICI Mutual Insurance Company (since October 16, 2020); and Episcopalian Charities of New York (2018–present) |
John Millette7 (1962) Vice President and Secretary, 1999–present | | Director,3 DWS; Chief Legal Officer, DWS Investment Management Americas, Inc. (2015–present); Director and Vice President, DWS Trust Company (2016–present); Secretary, DBX ETF Trust (2020–present); Secretary, The European Equity Fund, Inc., The New Germany Fund, Inc. and The Central and Eastern Europe Fund, Inc. (2011–present); formerly: Secretary, Deutsche Investment Management Americas Inc. (2015–2017); Assistant Secretary, DBX ETF Trust (2019–2020); Assistant Secretary (July 14, 2006–December 31, 2010) and Secretary (January 31, 2006–July 13, 2006), The European Equity Fund, Inc., The New Germany Fund, Inc. and The Central and Eastern Europe Fund, Inc. |
Ciara Crawford8 (1984) Assistant Secretary, (2019–present) | | Associate, DWS (since 2015); previously, Legal Assistant at Accelerated Tax Solutions. |
Diane Kenneally7 (1966) Chief Financial Officer and Treasurer, 2018–present | | Director,3 DWS; Treasurer, Chief Financial Officer and Controller, DBX ETF Trust (2019–present); Treasurer and Chief Financial Officer, The European Equity Fund, Inc., The New Germany Fund, Inc. and The Central and Eastern Europe Fund, Inc. (2018–present); formerly: Assistant Treasurer for the DWS funds (2007–2018) |
Paul Antosca7 (1957) Assistant Treasurer, 2007–present | | Director,3 DWS; and Assistant Treasurer, DBX ETF Trust (2019–present) |
Sheila Cadogan7 (1966) Assistant Treasurer, 2017–present | | Director,3 DWS; Director and Vice President, DWS Trust Company (2018–present); Assistant Treasurer, DBX ETF Trust (2019–present); Assistant Treasurer, The European Equity Fund, Inc., The New Germany Fund, Inc. and The Central and Eastern Europe Fund, Inc. (2018–present) |
Scott D. Hogan7 (1970) Chief Compliance Officer, 2016–present | | Director,3 DWS; Chief Compliance Officer, The European Equity Fund, Inc., The New Germany Fund, Inc. and The Central and Eastern Europe Fund, Inc. (2016–present) |
Caroline Pearson7 (1962) Chief Legal Officer, 2010–present | | Managing Director3, DWS; Assistant Secretary, DBX ETF Trust (2020–present); Chief Legal Officer, DBX Advisors LLC and DBX Strategic Advisors LLC (2020–present); Chief Legal Officer, The European Equity Fund, Inc., The New Germany Fund, Inc. and The Central and Eastern Europe Fund, Inc. (2012–present); formerly: Secretary, Deutsche AM Distributors, Inc. (2002–2017); and Secretary, Deutsche AM Service Company (2010–2017) |
| | | | | | |
| | 24 | | | | | | Deutsche DWS Variable Series II — DWS Alternative Asset Allocation VIP |
| | |
Name, Year of Birth,
Position with the Trust/
Corporation and
Length of Time Served5 | | Business Experience and Directorships During the Past Five Years |
Michelle Goveia-Pine6 (1970) Interim Anti-Money Laundering Compliance Officer, since July 10, 2020 | | Director,3 DWS; Interim AML Officer, DWS Trust Company (since July 28, 2020); Interim AML Officer, DBX ETF Trust (since July 9, 2020); Interim AML Officer, The European Equity Fund, Inc., The New Germany Fund, Inc. and The Central and Eastern Europe Fund, Inc. (since July 24, 2020) |
| 1 | The length of time served represents the year in which the Board Member joined the board of one or more DWS funds currently overseen by the Board. |
| 2 | A publicly held company with securities registered pursuant to Section 12 of the Securities Exchange Act of 1934. |
| 3 | Executive title, not a board directorship. |
| 4 | As a result of their respective positions held with the Advisor or its affiliates, these individuals are considered “interested persons” of the Advisor within the meaning of the 1940 Act. Interested persons receive no compensation from the Fund. |
| 5 | The length of time served represents the year in which the officer was first elected in such capacity for one or more DWS funds. |
| 6 | Address: 875 Third Avenue, New York, NY 10022. |
| 7 | Address: 100 Summer Street, Boston, MA 02110. |
| 8 | Address: 5022 Gate Parkway, Suite 400, Jacksonville, FL 32256. |
The Fund’s Statement of Additional Information (“SAI”) includes additional information about the Board Members. The SAI is available, without charge, upon request. If you would like to request a copy of the SAI, you may do so by calling the following toll-free number: (800) 728-3337.
| | | | |
Deutsche DWS Variable Series II — DWS Alternative Asset Allocation VIP | | | | | 25 |
Notes
Notes
| | |
| | |
VS2AAA-2 (R-025824-10 2/21) | | |
December 31, 2020
Annual Report
Deutsche DWS Variable Series II
DWS CROCI® U.S. VIP

Contents
| | | | |
| | 3 | | | Performance Summary |
| | 4 | | | Management Summary |
| | 6 | | | Portfolio Summary |
| | 7 | | | Investment Portfolio |
| | 9 | | | Statement of Assets and Liabilities |
| | 9 | | | Statement of Operations |
| | 10 | | | Statements of Changes in Net Assets |
| | 11 | | | Financial Highlights |
| | 12 | | | Notes to Financial Statements |
| | 17 | | | Report of Independent Registered Public Accounting Firm |
| | 18 | | | Information About Your Fund’s Expenses |
| | 19 | | | Tax Information |
| | 19 | | | Proxy Voting |
| | 20 | | | Advisory Agreement Board Considerations and Fee Evaluation |
| | 23 | | | Board Members and Officers |
This report must be preceded or accompanied by a prospectus. To obtain an additional prospectus or summary prospectus, if available, call (800) 728-3337 or your financial representative. We advise you to consider the Fund’s objectives, risks, charges and expenses carefully before investing. The summary prospectus and prospectus contain this and other important information about the Fund. Please read the prospectus carefully before you invest.
Stocks may decline in value. The Fund will be managed using the CROCI® Investment Process which is based on portfolio management’s belief that, over time, stocks which display more favorable financial metrics (for example, the CROCI® Economic P/E Ratio) as generated by this process may outperform stocks which display less favorable metrics. This premise may not prove to be correct and prospective investors should evaluate this assumption prior to investing in the Fund. The Fund may lend securities to approved institutions. Please read the prospectus for details.
War, terrorism, economic uncertainty, trade disputes, public health crises (including the recent pandemic spread of the novel coronavirus) and related geopolitical events could lead to increased market volatility, disruption to U.S. and world economies and markets and may have significant adverse effects on the Fund and its investments.
The brand DWS represents DWS Group GmbH & Co. KGaA and any of its subsidiaries such as DWS Distributors, Inc. which offers investment products or DWS Investment Management Americas, Inc. and RREEF America L.L.C. which offer advisory services.
DWS Distributors, Inc., 222 South Riverside Plaza, Chicago, IL 60606, (800) 621-1148
NOT FDIC/NCUA INSURED NO BANK GUARANTEE MAY LOSE VALUE NOT A DEPOSIT NOT INSURED BY ANY FEDERAL GOVERNMENT AGENCY
| | | | | | |
| | 2 | | | | | | Deutsche DWS Variable Series II — DWS CROCI® U.S. VIP |
| | |
| Performance Summary | | December 31, 2020 (Unaudited) |
Fund performance shown is historical, assumes reinvestment of all dividend and capital gain distributions and does not guarantee future results. Investment return and principal value fluctuate with changing market conditions so that, when redeemed, shares may be worth more or less than their original cost. Current performance may be lower or higher than the performance data quoted. Please contact your participating insurance company for the Fund’s most recent month-end performance. Performance does not reflect charges and fees (“contract charges”) associated with the separate account that invests in the Fund or any variable life insurance policy or variable annuity contract for which the Fund is an investment option. These charges and fees will reduce returns. While all share classes have the same underlying portfolio, their performance will differ.
The gross expense ratios of the Fund, as stated in the fee table of the prospectus dated May 1, 2020 are 0.84% and 1.16% for Class A and Class B shares, respectively, and may differ from the expense ratios disclosed in the Financial Highlights tables in this report.
Generally accepted accounting principles require adjustments to be made to the net assets of the Fund at period end for financial reporting purposes only, and as such, the total return based on the unadjusted net asset value per share may differ from the total return reported in the financial highlights.
Growth of an Assumed $10,000
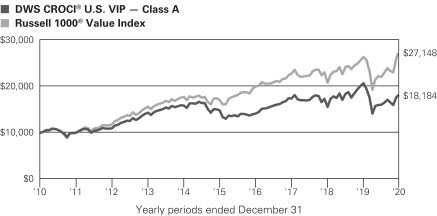
Russell 1000® Value Index is an unmanaged market capitalization-weighted index of value-oriented stocks of the largest U.S. domiciled companies that are included in the Russell 1000 Index. Value-oriented stocks tend to have lower price-to-book ratios and lower forecasted growth values. Russell 1000 Index is an unmanaged price-only index of the 1,000 largest capitalized companies that are domiciled in the U.S. and whose common stocks are traded.
Index returns do not reflect any fees or expenses and it is not possible to invest directly into an index.
Prior to May 1, 2017, the Fund operated with a different investment strategy. Prior to October 3, 2016, the Fund had a team that operated with a different investment strategy. Performance would have been different if the Fund’s current strategy had been in effect.
| | | | | | | | | | | | | | | | | | |
| Comparative Results | | | | | | | | | | | | |
| | | | | |
| DWS CROCI® U.S. VIP | | | | 1-Year | | | 3-Year | | | 5-Year | | | 10-Year | |
| Class A | | Growth of $10,000 | | | $8,784 | | | | $10,453 | | | | $12,281 | | | | $18,184 | |
| | | Average annual total return | | | –12.16% | | | | 1.49% | | | | 4.20% | | | | 6.16% | |
| Russell 1000® Value Index | | Growth of $10,000 | | | $10,280 | | | | $11,932 | | | | $15,915 | | | | $27,148 | |
| | Average annual total return | | | 2.80% | | | | 6.07% | | | | 9.74% | | | | 10.50% | |
| | | | | |
| DWS CROCI® U.S. VIP | | | | 1-Year | | | 3-Year | | | 5-Year | | | 10-Year | |
| Class B | | Growth of $10,000 | | | $8,759 | | | | $10,362 | | | | $12,102 | | | | $17,648 | |
| | | Average annual total return | | | –12.41% | | | | 1.19% | | | | 3.89% | | | | 5.84% | |
| Russell 1000® Value Index | | Growth of $10,000 | | | $10,280 | | | | $11,932 | | | | $15,915 | | | | $27,148 | |
| | Average annual total return | | | 2.80% | | | | 6.07% | | | | 9.74% | | | | 10.50% | |
The growth of $10,000 is cumulative.
| | | | |
Deutsche DWS Variable Series II — DWS CROCI® U.S. VIP | | | | | 3 |
| | |
| Management Summary | | December 31, 2020 (Unaudited) |
The Fund returned –12.16% (Class A shares, unadjusted for contract charges) in 2020 and underperformed the 2.80% return of its benchmark, the Russell 1000® Value Index. After initially selling off in February and March in response to COVID-19 and the associated containment measures, stocks recovered to post solid gains over the remainder of the year. The rally reflected the combination of aggressive monetary and fiscal stimulus, hopes for a renewed economic growth in 2021, and the approval of a coronavirus vaccine in early November.
Continuing a multi-year trend, the value style underperformed growth by a wide margin. While the Russell 1000 Value Index returned 2.80%, the Russell 1000® Growth Index surged 38.49% — a gap of more than 35 percentage points. At a time of heightened uncertainty surrounding the economic outlook, investors demonstrated an ongoing preference for a narrow group of mega-cap technology stocks seen as having the most reliable earnings. The value style strongly outperformed growth in November and December, however. Following the announcement that a vaccine for COVID-19 would soon be available, more economically sensitive market segments that had failed to keep pace over the previous seven months began to outperform.
Stock selection was the key factor in the Fund’s underperformance, with sector allocations playing a lesser role. Selection had the largest adverse effect in financials. Our shortfall in the sector was largely the result of positions in regional banks such as Comerica, Inc.*, Citizens Financial Group, Inc.*, and Huntington Bancshares, Inc.*, among others. Banking stocks, in general, lagged in the first ten months of the year due to the combination of slow economic growth and narrowing net interest margins (the difference between the rates at which banks borrow and lend). Discover Financial Services*, which was hurt by declining revenues and the potential for rising loan delinquencies, was also a notable laggard.
Communications services was another challenging area for the Fund. We held positions in ViacomCBS Inc.*, Discovery, Inc., and Fox Corp., all of which are heavily dependent on advertising revenues. When businesses cut back on ad spending in response to the pandemic, the stocks of ad-driven media companies were hit much harder than the market as a whole.
Similarly, the Fund’s performance in industrials was hurt by positions in United Airlines Holdings, Inc.* and Delta Airlines, Inc.* Both suffered steep declines once it became evident that the coronavirus would lead to a sharp reduction in air travel. We sold the stocks from the portfolio.
On the positive side, the Fund’s holdings in the energy and consumer discretionary sectors outperformed the corresponding benchmark components. At the individual stock level, key contributors included Cabot Oil & Gas Corp.*, Alexion Pharmaceuticals, Inc., and Cummins, Inc.*
With respect to sector allocations, overweight positions in financials and consumer staples had the largest adverse impact on performance. These detractors were offset, to some extent, by underweights in energy and real estate, together with an overweight in utilities.
We recognize that the Fund experienced meaningful underperformance over the past 12 months. In our view, the primary reason for the deficit was our emphasis on the deeper-value segment of the Russell 1000 Value Index. While stocks trading at valuation discounts have been a source of opportunity over time, investors have demonstrated little interest in this area of the market for several years. For our part, we remain focused on identifying undervalued stocks. We would note that the value style outperformed growth over multi-year stretches following the last two recessions and significant market downturns. This was the case both in the span from 2002 through 2006, when the market was recovering from the bursting of the technology “bubble” and the attacks of September 11, 2001, as well as in 2010-2014, in the wake of the global financial crisis. We believe our approach is well suited to capitalize on a similar recovery in value as the world economy bounces back from COVID-19 in the years ahead.
Di Kumble, CFA, Managing Director
John Moody, Vice President
Portfolio Managers
The views expressed reflect those of the portfolio management team only through the end of the period of the report as stated on the cover. The management team’s views are subject to change at any time based on market and other conditions and should not be construed as a recommendation. Past performance is no guarantee of future results. Current and future portfolio holdings are subject to risk.
| | | | | | |
| | 4 | | | | | | Deutsche DWS Variable Series II — DWS CROCI® U.S. VIP |
Terms to Know
Russell 1000 Value Index is an unmanaged market capitalization-weighted index of value-oriented stocks of the largest U.S. domiciled companies that are included in the Russell 1000 Index. Value-oriented stocks tend to have lower price-to-book ratios and lower forecasted growth values. Russell 1000 Index is an unmanaged price-only index of the 1,000 largest capitalized companies that are domiciled in the U.S. and whose common stocks are traded.
Russell 1000 Growth Index is an unmanaged index that consists of those stocks in the Russell 1000® Index that have higher price-to-book ratios and higher forecasted growth values. Russell 1000 Index is an unmanaged price-only index of the 1,000 largest capitalized companies that are domiciled in the U.S. and whose common stocks are traded.
Stock selection refers to the performance of the Fund’s holdings in a given sector relative to the sector as a whole.
Contribution and detraction incorporate both a stock’s total return and its weighting in the index.
Overweight means the Fund holds a higher weighting in a given sector or security than the benchmark. Underweight means the Fund holds a lower weighting.
| * | Not held at December 31, 2020. |
| | | | |
Deutsche DWS Variable Series II — DWS CROCI® U.S. VIP | | | | | 5 |
| | |
| Portfolio Summary | | (Unaudited) |
| | | | | | | | |
| Asset Allocation (As a % of Investment Portfolio excluding Securities Lending Collateral) | | 12/31/20 | | | 12/31/19 | |
| Common Stocks | | | 100% | | | | 99% | |
| Cash Equivalents | | | 0% | | | | 1% | |
| | | | 100% | | | | 100% | |
| | |
Sector Diversification (As a % of Investment Portfolio excluding Cash Equivalents and Securities Lending Collateral) | | 12/31/20 | | | 12/31/19 | |
| Health Care | | | 25% | | | | 16% | |
| Consumer Staples | | | 24% | | | | — | |
| Information Technology | | | 16% | | | | 2% | |
| Consumer Discretionary | | | 12% | | | | 2% | |
| Communication Services | | | 11% | | | | 10% | |
| Industrials | | | 7% | | | | 10% | |
| Financials | | | 5% | | | | 38% | |
| Utilities | | | — | | | | 17% | |
| Energy | | | — | | | | 3% | |
| Materials | | | — | | | | 2% | |
| | | | 100% | | | | 100% | |
Portfolio holdings and characteristics are subject to change.
For more complete details about the Fund’s investment portfolio, see page 7.
Following the Fund’s fiscal first and third quarter-end, a complete portfolio holdings listing is posted on dws.com, and is available free of charge by contacting your financial intermediary, or if you are a direct investor, by calling (800) 728-3337. In addition, the portfolio holdings listing is filed with the SEC on the Fund’s Form N-PORT and will be available on the SEC’s Web site at sec.gov. Additional portfolio holdings for the Fund are also posted on dws.com from time to time. Please see the Fund’s current prospectus for more information.
| | | | | | |
| | 6 | | | | | | Deutsche DWS Variable Series II — DWS CROCI® U.S. VIP |
| | |
| Investment Portfolio | | as of December 31, 2020 |
| | | | | | | | |
| | | Shares | | | Value ($) | |
| Common Stocks 99.2% | | | | | | | | |
| Communication Services 10.2% | |
Diversified Telecommunication Services 4.7% | |
| | |
AT&T, Inc. | | | 110,095 | | | | 3,166,332 | |
| | |
Verizon Communications, Inc. | | | 52,704 | | | | 3,096,360 | |
| | | | | | | | |
| | | | 6,262,692 | |
Media 5.5% | |
| | |
Discovery, Inc. “A”* (a) | | | 132,447 | | | | 3,985,331 | |
| | |
Fox Corp. “A” | | | 114,868 | | | | 3,344,956 | |
| | | | | | | | |
| | | | 7,330,287 | |
|
| Consumer Discretionary 12.2% | |
Household Durables 4.7% | |
| | |
D.R. Horton, Inc. | | | 42,942 | | | | 2,959,563 | |
| | |
Garmin Ltd. | | | 27,529 | | | | 3,294,120 | |
| | | | | | | | |
| | | | 6,253,683 | |
Internet & Direct Marketing Retail 2.5% | |
eBay, Inc. | | | 66,361 | | | | 3,334,640 | |
|
Multiline Retail 2.5% | |
Dollar General Corp. | | | 15,388 | | | | 3,236,096 | |
|
Specialty Retail 2.5% | |
AutoZone, Inc.* | | | 2,826 | | | | 3,350,054 | |
|
| Consumer Staples 23.9% | |
Beverages 2.4% | |
Molson Coors Beverage Co. “B” | | | 71,296 | | | | 3,221,866 | |
|
Food & Staples Retailing 2.4% | |
Kroger Co. | | | 100,126 | | | | 3,180,002 | |
|
Food Products 11.9% | |
| | |
Campbell Soup Co. (a) | | | 64,498 | | | | 3,118,479 | |
| | |
Conagra Brands, Inc. | | | 89,668 | | | | 3,251,362 | |
| | |
General Mills, Inc. | | | 52,549 | | | | 3,089,881 | |
| | |
J M Smucker Co. | | | 27,242 | | | | 3,149,175 | |
| | |
Tyson Foods, Inc. “A” | | | 49,721 | | | | 3,204,021 | |
| | | | | | | | |
| | | | 15,812,918 | |
Household Products 2.3% | |
Kimberly-Clark Corp. | | | 22,278 | | | | 3,003,743 | |
|
Tobacco 4.9% | |
| | |
Altria Group, Inc. | | | 77,706 | | | | 3,185,946 | |
| | |
Philip Morris International, Inc. | | | 40,621 | | | | 3,363,012 | |
| | | | | | | | |
| | | | 6,548,958 | |
|
| Financials 5.0% | |
Capital Markets | |
| | |
Bank of New York Mellon Corp. | | | 79,963 | | | | 3,393,630 | |
| | |
State Street Corp. | | | 45,194 | | | | 3,289,219 | |
| | | | | | | | |
| | | | 6,682,849 | |
|
| Health Care 24.9% | |
Biotechnology 12.5% | |
| | |
AbbVie, Inc. | | | 32,073 | | | | 3,436,622 | |
| | |
Alexion Pharmaceuticals, Inc.* | | | 25,426 | | | | 3,972,558 | |
| | |
Amgen, Inc. | | | 13,842 | | | | 3,182,553 | |
| | |
Gilead Sciences, Inc. | | | 52,130 | | | | 3,037,094 | |
| | |
Regeneron Pharmaceuticals, Inc.* | | | 6,046 | | | | 2,920,883 | |
| | | | | | | | |
| | | | 16,549,710 | |
| | | | | | | | |
| | | Shares | | | Value ($) | |
|
Pharmaceuticals 12.4% | |
| | |
Bristol-Myers Squibb Co. | | | 50,113 | | | | 3,108,510 | |
| | |
Johnson & Johnson | | | 21,519 | | | | 3,386,660 | |
| | |
Merck & Co., Inc. | | | 39,180 | | | | 3,204,924 | |
| | |
Pfizer, Inc. | | | 86,209 | | | | 3,173,353 | |
| | |
Viatris, Inc.* | | | 190,468 | | | | 3,569,370 | |
| | | | | | | | |
| | | | 16,442,817 | |
|
| Industrials 7.3% | |
Aerospace & Defense 2.3% | |
Lockheed Martin Corp. | | | 8,480 | | | | 3,010,230 | |
|
Air Freight & Logistics 5.0% | |
| | |
CH Robinson Worldwide, Inc. | | | 34,373 | | | | 3,226,593 | |
| | |
Expeditors International of Washington, Inc. | | | 35,714 | | | | 3,396,759 | |
| | | | | | | | |
| | | | 6,623,352 | |
|
| Information Technology 15.7% | |
Communications Equipment 5.0% | |
| | |
Cisco Systems, Inc. | | | 76,310 | | | | 3,414,873 | |
| | |
Juniper Networks, Inc. | | | 144,536 | | | | 3,253,505 | |
| | | | | | | | |
| | | | 6,668,378 | |
IT Services 5.3% | |
| | |
Amdocs Ltd. | | | 49,981 | | | | 3,545,152 | |
| | |
International Business Machines Corp. | | | 27,113 | | | | 3,412,985 | |
| | | | | | | | |
| | | | 6,958,137 | |
Semiconductors & Semiconductor Equipment 2.7% | |
Intel Corp. | | | 70,933 | | | | 3,533,882 | |
|
Software 2.7% | |
Oracle Corp. | | | 56,190 | | | | 3,634,931 | |
Total Common Stocks (Cost $124,263,969) | | | | 131,639,225 | |
|
| Securities Lending Collateral 3.2% | |
DWS Government & Agency Securities Portfolio “DWS Government Cash Institutional Shares”, 0.03% (b) (c) (Cost $4,309,705) | | | 4,309,705 | | | | 4,309,705 | |
| | |
| Cash Equivalents 0.5% | | | | | | | | |
DWS Central Cash Management Government Fund, 0.08% (b) (Cost $621,226) | | | 621,226 | | | | 621,226 | |
| | |
| | | % of Net
Assets | | | Value ($) | |
Total Investment Portfolio (Cost $129,194,900) | | | 102.9 | | | | 136,570,156 | |
| Other Assets and Liabilities, Net | | | (2.9 | ) | | | (3,880,008 | ) |
| Net Assets | | | 100.0 | | | | 132,690,148 | |
The accompanying notes are an integral part of the financial statements.
| | | | |
Deutsche DWS Variable Series II — DWS CROCI® U.S. VIP | | | | | 7 |
| | | | | | | | | | | | | | | | | | | | | | | | | | | | | | | | |
A summary of the Fund’s transactions with affiliated investments during the year ended December 31, 2020 are as follows: | |
Value ($) at
12/31/2019 | | Purchases
Cost ($) | | | Sales
Proceeds ($) | | | Net
Realized
Gain/
(Loss) ($) | | | Net Change in
Unrealized
Appreciation
(Depreciation) ($) | | | Income ($) | | | Capital Gain
Distributions ($) | | | Number
of Shares
at
12/31/2020 | | | Value ($)
at
12/31/2020 | |
Securities Lending Collateral 3.2% | |
DWS Government & Agency Securities Portfolio “DWS Government Cash Institutional Shares”, 0.03% (b) (c) | |
| 3,120,056 | | | 1,189,649 | (d) | | | — | | | | — | | | | — | | | | 5,430 | | | | — | | | | 4,309,705 | | | | 4,309,705 | |
Cash Equivalents 0.5% | |
DWS Central Cash Management Government Fund, 0.08% (b) | |
| 845,193 | | | 11,485,882 | | | | 11,709,849 | | | | — | | | | — | | | | 4,587 | | | | — | | | | 621,226 | | | | 621,226 | |
| 3,965,249 | | | 12,675,531 | | | | 11,709,849 | | | | — | | | | — | | | | 10,017 | | | | — | | | | 4,930,931 | | | | 4,930,931 | |
| * | Non-income producing security. |
| (a) | All or a portion of these securities were on loan. In addition, “Other Assets and Liabilities, Net” may include pending sales that are also on loan. The value of securities loaned at December 31, 2020 amounted to $4,251,821, which is 3.2% of net assets. |
| (b) | Affiliated fund managed by DWS Investment Management Americas, Inc. The rate shown is the annualized seven-day yield at period end. |
| (c) | Represents cash collateral held in connection with securities lending. Income earned by the Fund is net of borrower rebates. |
| (d) | Represents the net increase (purchase cost) or decrease (sales proceeds) in the amount invested in cash collateral for the year ended December 31, 2020. |
Fair Value Measurements
Various inputs are used in determining the value of the Fund’s investments. These inputs are summarized in three broad levels. Level 1 includes quoted prices in active markets for identical securities. Level 2 includes other significant observable inputs (including quoted prices for similar securities, interest rates, prepayment speeds and credit risk). Level 3 includes significant unobservable inputs (including the Fund’s own assumptions in determining the fair value of investments). The level assigned to the securities valuations may not be an indication of the risk or liquidity associated with investing in those securities.
The following is a summary of the inputs used as of December 31, 2020 in valuing the Fund’s investments. For information on the Fund’s policy regarding the valuation of investments, please refer to the Security Valuation section of Note A in the accompanying Notes to Financial Statements.
| | | | | | | | | | | | | | | | |
| Assets | | Level 1 | | | Level 2 | | | Level 3 | | | Total | |
| Common Stocks (e) | | $ | 131,639,225 | | | $ | — | | | $ | — | | | $ | 131,639,225 | |
| Short-Term Investment (e) | | | 4,930,931 | | | | — | | | | — | | | | 4,930,931 | |
| Total | | $ | 136,570,156 | | | $ | — | | | $ | — | | | $ | 136,570,156 | |
| (e) | See Investment Portfolio for additional detailed categorizations. |
The accompanying notes are an integral part of the financial statements.
| | | | | | |
| | 8 | | | | | | Deutsche DWS Variable Series II — DWS CROCI® U.S. VIP |
Statement of Assets and Liabilities
| | | | |
| |
| Assets | | | | |
| Investments in non-affiliated securities, at value (cost $124,263,969) — including $4,251,821 of securities loaned | | $ | 131,639,225 | |
| Investment in DWS Government & Agency Securities Portfolio (cost $4,309,705)* | | | 4,309,705 | |
| Investment in DWS Central Cash Management Government Fund (cost $621,226) | | | 621,226 | |
| Receivable for Fund shares sold | | | 334,068 | |
| Dividends receivable | | | 249,644 | |
| Interest receivable | | | 550 | |
| Other assets | | | 2,659 | |
| Total assets | | | 137,157,077 | |
| |
| Liabilities | | | | |
| Payable upon return of securities loaned | | | 4,309,705 | |
| Payable for Fund shares redeemed | | | 4,763 | |
| Accrued management fee | | | 60,138 | |
| Accrued Trustees’ fees | | | 2,872 | |
| Other accrued expenses and payables | | | 89,451 | |
| Total liabilities | | | 4,466,929 | |
| Net assets, at value | | $ | 132,690,148 | |
| |
| Net Assets Consist of | | | | |
| Distributable earnings (loss) | | | (6,497,749 | ) |
| Paid-in capital | | | 139,187,897 | |
| Net assets, at value | | $ | 132,690,148 | |
| |
| Net Asset Value | | | | |
Class A | | | | |
| |
| Net Asset Value, and redemption price per share ($129,565,247 ÷ 10,025,875 outstanding shares of beneficial interest, no par value, unlimited shares authorized) | | $ | 12.92 | |
Class B | | | | |
| |
| Net Asset Value, offering and redemption price per share ($3,124,901 ÷ 240,926 outstanding shares of beneficial interest, no par value, unlimited shares authorized) | | $ | 12.97 | |
| * | Represents collateral on securities loaned. |
Statement of Operations
| | |
| for the year ended December 31, 2020 |
| | | | |
| |
| Investment Income | | | | |
| Income: | | | | |
| Dividends | | $ | 3,714,961 | |
| Income distributions — DWS Central Cash Management Government Fund | | | 4,587 | |
| Securities lending income, net of borrower rebates | | | 5,430 | |
| Total income | | | 3,724,978 | |
| Expenses: | | | | |
| Management fee | | | 800,446 | |
| Administration fee | | | 122,573 | |
| Services to Shareholders | | | 5,680 | |
| Recordkeeping fee (Class B) | | | 1,990 | |
| Distribution service fee (Class B) | | | 7,656 | |
| Custodian fee | | | 3,986 | |
| Professional fees | | | 74,057 | |
| Reports to shareholders | | | 31,173 | |
| Trustees’ fees and expenses | | | 6,080 | |
| Other | | | 7,993 | |
| Total expenses before expense reductions | | | 1,061,634 | |
| Expense reductions | | | (185,516 | ) |
| Total expenses after expense reductions | | | 876,118 | |
| Net investment income | | | 2,848,860 | |
| |
| Realized and Unrealized gain (loss) | | | | |
| Net realized gain (loss) from investments | | | (16,282,685 | ) |
| Change in net unrealized appreciation (depreciation) on investments | | | (5,587,930 | ) |
| Net gain (loss) | | | (21,870,615 | ) |
| Net increase (decrease) in net assets resulting from operations | | $ | (19,021,755 | ) |
The accompanying notes are an integral part of the financial statements.
| | | | |
Deutsche DWS Variable Series II — DWS CROCI® U.S. VIP | | | | | 9 |
Statements of Changes in Net Assets
| | | | | | | | |
| | | Years Ended December 31, | |
| Increase (Decrease) in Net Assets | | 2020 | | | 2019 | |
| Operations: | | | | | | | | |
| Net investment income (loss) | | $ | 2,848,860 | | | $ | 3,092,197 | |
| Net realized gain (loss) | | | (16,282,685 | ) | | | 6,704,808 | |
| Change in net unrealized appreciation (depreciation) | | | (5,587,930 | ) | | | 31,036,303 | |
| Net increase (decrease) in net assets resulting from operations | | | (19,021,755 | ) | | | 40,833,308 | |
| Distributions to shareholders: | | | | | | | | |
Class A | | | (9,467,191 | ) | | | (14,271,121 | ) |
Class B | | | (221,204 | ) | | | (332,950 | ) |
| Total distributions | | | (9,688,395 | ) | | | (14,604,071 | ) |
Class A | | | | | | | | |
| Proceeds from shares sold | | | 6,978,119 | | | | 3,373,728 | |
| Reinvestment of distributions | | | 9,467,191 | | | | 14,271,121 | |
| Payments of shares redeemed | | | (11,817,632 | ) | | | (15,030,273 | ) |
| Net increase (decrease) in net assets from Class A share transactions | | | 4,627,678 | | | | 2,614,576 | |
Class B | | | | | | | | |
| Proceeds from shares sold | | | 784,815 | | | | 146,155 | |
| Reinvestment of distributions | | | 221,204 | | | | 332,950 | |
| Payments of shares redeemed | | | (873,871 | ) | | | (438,366 | ) |
| Net increase (decrease) in net assets from Class B share transactions | | | 132,148 | | | | 40,739 | |
| Increase (decrease) in net assets | | | (23,950,324 | ) | | | 28,884,552 | |
| Net assets at beginning of period | | | 156,640,472 | | | | 127,755,920 | |
| | |
| Net assets at end of period | | $ | 132,690,148 | | | $ | 156,640,472 | |
| | |
| Other Information | | | | | | | | |
Class A | | | | | | | | |
| Shares outstanding at beginning of period | | | 9,489,452 | | | | 9,266,278 | |
| Shares sold | | | 567,975 | | | | 231,369 | |
| Shares issued to shareholders in reinvestment of distributions | | | 895,666 | | | | 1,002,890 | |
| Shares redeemed | | | (927,218 | ) | | | (1,011,085 | ) |
| Net increase (decrease) in Class A shares | | | 536,423 | | | | 223,174 | |
| | |
| Shares outstanding at end of period | | | 10,025,875 | | | | 9,489,452 | |
Class B | | | | | | | | |
| Shares outstanding at beginning of period | | | 226,957 | | | | 223,302 | |
| Shares sold | | | 65,344 | | | | 9,627 | |
| Shares issued to shareholders in reinvestment of distributions | | | 20,809 | | | | 23,283 | |
| Shares redeemed | | | (72,184 | ) | | | (29,255 | ) |
| Net increase (decrease) in Class B shares | | | 13,969 | | | | 3,655 | |
| | |
| Shares outstanding at end of period | | | 240,926 | | | | 226,957 | |
The accompanying notes are an integral part of the financial statements.
| | | | | | |
| | 10 | | | | | | Deutsche DWS Variable Series II — DWS CROCI® U.S. VIP |
Financial Highlights
| | | | | | | | | | | | | | | | | | | | |
| DWS CROCI® U.S. VIP — Class A | | | | | | | | | | | | | | | | | | | | |
| | | Years Ended December 31, | |
| | | 2020 | | | 2019 | | | 2018 | | | 2017 | | | 2016 | |
| | | | | |
| Selected Per Share Data | | | | | | | | | | | | | | | | | | | | |
| Net asset value, beginning of period | | $ | 16.12 | | | $ | 13.46 | | | $ | 16.64 | | | $ | 13.75 | | | $ | 15.29 | |
| Income (loss) from investment operations: | | | | | | | | | | | | | | | | | | | | |
| | | | | |
Net investment income (loss)a | | | .28 | | | | .31 | | | | .29 | | | | .24 | | | | .23 | |
Net realized and unrealized gain (loss) | | | (2.47 | ) | | | 3.92 | | | | (1.89 | ) | | | 2.88 | | | | (.93 | ) |
Total from investment operations | | | (2.19 | ) | | | 4.23 | | | | (1.60 | ) | | | 3.12 | | | | (.70 | ) |
| Less distributions from: | | | | | | | | | | | | | | | | | | | | |
| | | | | |
Net investment income | | | (.31 | ) | | | (.30 | ) | | | (.41 | ) | | | (.23 | ) | | | (.14 | ) |
Net realized gains on investment transactions | | | (.70 | ) | | | (1.27 | ) | | | (1.17 | ) | | | — | | | | (.70 | ) |
Total distributions | | | (1.01 | ) | | | (1.57 | ) | | | (1.58 | ) | | | (.23 | ) | | | (.84 | ) |
| Net asset value, end of period | | $ | 12.92 | | | $ | 16.12 | | | $ | 13.46 | | | $ | 16.64 | | | $ | 13.75 | |
| Total Return (%)b | | | (12.16 | ) | | | 32.95 | | | | (10.50 | ) | | | 22.88 | c | | | (4.39 | ) |
| | | | | |
| Ratios to Average Net Assets and Supplemental Data | | | | | | | | | | | | | | | | | | | | |
| Net assets, end of period ($ millions) | | | 130 | | | | 153 | | | | 125 | | | | 153 | | | | 227 | |
| Ratio of expenses before expense reductions (%)d | | | .84 | | | | .84 | | | | .84 | | | | .82 | | | | .81 | |
| Ratio of expenses after expense reductions (%)d | | | .69 | | | | .70 | | | | .72 | | | | .72 | | | | .74 | |
| Ratio of net investment income (loss) (%) | | | 2.28 | | | | 2.13 | | | | 1.89 | | | | 1.59 | | | | 1.66 | |
| Portfolio turnover rate (%) | | | 122 | | | | 111 | | | | 100 | | | | 97 | | | | 293 | |
| a | Based on average shares outstanding during the period. |
| b | Total return would have been lower had certain expenses not been reduced. |
| c | The Fund’s total return includes a reimbursement by the Adviser for commission costs incurred in connection with purchases and sales of portfolio assets due to the change in investment strategy, which otherwise would have reduced total return by 0.03%. |
| d | Expense ratio does not reflect charges and fees associated with the separate account that invests in the Fund or any variable life insurance policy or variable annuity contract for which the Fund is an investment option. |
| | | | | | | | | | | | | | | | | | | | |
| DWS CROCI® U.S. VIP — Class B | | | | | | | | | | | | | | | | | | | | |
| | | Years Ended December 31, | |
| | | 2020 | | | 2019 | | | 2018 | | | 2017 | | | 2016 | |
| | | | | |
| Selected Per Share Data | | | | | | | | | | | | | | | | | | | | |
| Net asset value, beginning of period | | $ | 16.17 | | | $ | 13.50 | | | $ | 16.67 | | | $ | 13.78 | | | $ | 15.31 | |
| Income (loss) from investment operations: | | | | | | | | | | | | | | | | | | | | |
| | | | | |
Net investment income (loss)a | | | .24 | | | | .27 | | | | .24 | | | | .20 | | | | .19 | |
Net realized and unrealized gain (loss) | | | (2.47 | ) | | | 3.92 | | | | (1.88 | ) | | | 2.87 | | | | (.92 | ) |
Total from investment operations | | | (2.23 | ) | | | 4.19 | | | | (1.64 | ) | | | 3.07 | | | | (.73 | ) |
| Less distributions from: | | | | | | | | | | | | | | | | | | | | |
| | | | | |
Net investment income | | | (.27 | ) | | | (.25 | ) | | | (.36 | ) | | | (.18 | ) | | | (.10 | ) |
Net realized gains on investment transactions | | | (.70 | ) | | | (1.27 | ) | | | (1.17 | ) | | | — | | | | (.70 | ) |
Total distributions | | | (.97 | ) | | | (1.52 | ) | | | (1.53 | ) | | | (.18 | ) | | | (.80 | ) |
| Net asset value, end of period | | $ | 12.97 | | | $ | 16.17 | | | $ | 13.50 | | | $ | 16.67 | | | $ | 13.78 | |
| Total Return (%)b | | | (12.41 | ) | | | 32.49 | | | | (10.71 | ) | | | 22.45 | c | | | (4.62 | ) |
| | | | | |
| Ratios to Average Net Assets and Supplemental Data | | | | | | | | | | | | | | | | | | | | |
| Net assets, end of period ($ millions) | | | 3 | | | | 4 | | | | 3 | | | | 4 | | | | 4 | |
| Ratio of expenses before expense reductions (%)d | | | 1.16 | | | | 1.16 | | | | 1.16 | | | | 1.15 | | | | 1.13 | |
| Ratio of expenses after expense reductions (%)d | | | 1.00 | | | | 1.02 | | | | 1.04 | | | | 1.03 | | | | 1.05 | |
| Ratio of net investment income (loss) (%) | | | 1.96 | | | | 1.82 | | | | 1.55 | | | | 1.31 | | | | 1.37 | |
| Portfolio turnover rate (%) | | | 122 | | | | 111 | | | | 100 | | | | 97 | | | | 293 | |
| a | Based on average shares outstanding during the period. |
| b | Total return would have been lower had certain expenses not been reduced. |
| c | The Fund’s total return includes a reimbursement by the Adviser for commission costs incurred in connection with purchases and sales of portfolio assets due to the change in investment strategy, which otherwise would have reduced total return by 0.03%. |
| d | Expense ratio does not reflect charges and fees associated with the separate account that invests in the Fund or any variable life insurance policy or variable annuity contract for which the Fund is an investment option. |
The accompanying notes are an integral part of the financial statements.
| | | | |
Deutsche DWS Variable Series II — DWS CROCI® U.S. VIP | | | | | 11 |
| | |
| Notes to Financial Statements | | |
A. Organization and Significant Accounting Policies
DWS CROCI® U.S. VIP (the “Fund”) is a diversified series of Deutsche DWS Variable Series II (the “Trust”), which is registered under the Investment Company Act of 1940, as amended (the “1940 Act”), as an open-end management investment company organized as a Massachusetts business trust.
Multiple Classes of Shares of Beneficial Interest. The Fund offers two classes of shares (Class A shares and Class B shares). Sales of Class B shares are subject to recordkeeping fees of up to 0.15% and
Rule 12b-1 fees under the 1940 Act equal to an annual rate of up to 0.25% of the average daily net assets of the Class B shares of the Fund. Class A shares are not subject to such fees.
Investment income, realized and unrealized gains and losses, and certain fund-level expenses and expense reductions, if any, are borne pro rata on the basis of relative net assets by the holders of all classes of shares except that each class bears certain expenses unique to that class (including the applicable Rule 12b-1 fee and recordkeeping fees). Differences in class-level expenses may result in payment of different per share dividends by class. All shares have equal rights with respect to voting subject to class-specific arrangements.
The Fund’s financial statements are prepared in accordance with accounting principles generally accepted in the United States of America (“U.S. GAAP”) which require the use of management estimates. Actual results could differ from those estimates. The Fund qualifies as an investment company under Topic 946 of Accounting Standards Codification of U.S. GAAP. The policies described below are followed consistently by the Fund in the preparation of its financial statements.
Security Valuation. Investments are stated at value determined as of the close of regular trading on the New York Stock Exchange on each day the exchange is open for trading.
Various inputs are used in determining the value of the Fund’s investments. These inputs are summarized in three broad levels. Level 1 includes quoted prices in active markets for identical securities. Level 2 includes other significant observable inputs (including quoted prices for similar securities, interest rates, prepayment speeds and credit risk). Level 3 includes significant unobservable inputs (including the Fund’s own assumptions in determining the fair value of investments). The level assigned to the securities valuations may not be an indication of the risk or liquidity associated with investing in those securities.
Equity securities are valued at the most recent sale price or official closing price reported on the exchange (U.S. or foreign) or over-the-counter market on which they trade. Securities for which no sales are reported are valued at the calculated mean between the most recent bid and asked quotations on the relevant market or, if a mean cannot be determined, at the most recent bid quotation. Equity securities are generally categorized as Level 1.
Investments in open-end investment companies are valued at their net asset value each business day and are categorized as Level 1.
Securities and other assets for which market quotations are not readily available or for which the above valuation procedures are deemed not to reflect fair value are valued in a manner that is intended to reflect their fair value as determined in accordance with procedures approved by the Board and are generally categorized as Level 3. In accordance with the Fund’s valuation procedures, factors considered in determining value may include, but are not limited to, the type of the security; the size of the holding; the initial cost of the security; the existence of any contractual restrictions on the security’s disposition; the price and extent of public trading in similar securities of the issuer or of comparable companies; quotations or evaluated prices from broker-dealers and/or pricing services; information obtained from the issuer, analysts, and/or the appropriate stock exchange (for exchange-traded securities); an analysis of the company’s or issuer’s financial statements; an evaluation of the forces that influence the issuer and the market(s) in which the security is purchased and sold; and with respect to debt securities, the maturity, coupon, creditworthiness, currency denomination and the movement of the market in which the security is normally traded. The value determined under these procedures may differ from published values for the same securities.
Disclosure about the classification of fair value measurements is included in a table following the Fund’s Investment Portfolio.
Foreign Currency Translations. The books and records of the Fund are maintained in U.S. dollars. Investment securities and other assets and liabilities denominated in a foreign currency are translated into
| | | | | | |
| | 12 | | | | | | Deutsche DWS Variable Series II — DWS CROCI® U.S. VIP |
U.S. dollars at the prevailing exchange rates at period end. Purchases and sales of investment securities, income and expenses are translated into U.S. dollars at the prevailing exchange rates on the respective dates of the transactions.
Net realized and unrealized gains and losses on foreign currency transactions represent net gains and losses between trade and settlement dates on securities transactions, the acquisition and disposition of foreign currencies, and the difference between the amount of net investment income accrued and the U.S. dollar amount actually received. The portion of both realized and unrealized gains and losses on investments that results from fluctuations in foreign currency exchange rates is not separately disclosed but is included with net realized and unrealized gain/appreciation and loss/depreciation on investments.
Securities Lending. Deutsche Bank AG, as lending agent, lends securities of the Fund to certain financial institutions under the terms of its securities lending agreement. During the term of the loans, the Fund continues to receive interest and dividends generated by the securities and to participate in any changes in their market value. The Fund requires the borrowers of the securities to maintain collateral with the Fund consisting of either cash or liquid, unencumbered assets having a value at least equal to the value of the securities loaned. When the collateral falls below specified amounts, the lending agent will use its best effort to obtain additional collateral on the next business day to meet required amounts under the securities lending agreement. During the year ended December 31, 2020, the Fund invested the cash collateral into a joint trading account in DWS Government & Agency Securities Portfolio, an affiliated money market fund managed by DWS Investment Management Americas, Inc. DWS Investment Management Americas, Inc. receives a management/administration fee (0.06% annualized effective rate as of December 31, 2020) on the cash collateral invested in DWS Government & Agency Securities Portfolio. The Fund receives compensation for lending its securities either in the form of fees or by earning interest on invested cash collateral net of borrower rebates and fees paid to a lending agent. Either the Fund or the borrower may terminate the loan at any time, and the borrower, after notice, is required to return borrowed securities within a standard time period. There may be risks of delay and costs in recovery of securities or even loss of rights in the collateral should the borrower of the securities fail financially. If the Fund is not able to recover securities lent, the Fund may sell the collateral and purchase a replacement investment in the market, incurring the risk that the value of the replacement security is greater than the value of the collateral. The Fund is also subject to all investment risks associated with the reinvestment of any cash collateral received, including, but not limited to, interest rate, credit and liquidity risk associated with such investments.
As of December 31, 2020, the Fund had securities on loan, which were classified as common stocks in the Investment Portfolio. The value of the related collateral exceeded the value of the securities loaned at period end. As of period end, the remaining contractual maturity of the collateral agreements was overnight and continuous.
Federal Income Taxes. The Fund’s policy is to comply with the requirements of the Internal Revenue Code, as amended, which are applicable to regulated investment companies and to distribute all of its taxable income to its shareholders.
At December 31, 2020, the Fund had a net tax basis capital loss carryforward of approximately $16,383,000, which may be applied against realized net taxable capital gains indefinitely, including short-term losses ($7,570,000) and long-term losses ($8,813,000).
The Fund has reviewed the tax positions for the open tax years as of December 31, 2020 and has determined that no provision for income tax and/or uncertain tax positions is required in the Fund’s financial statements. The Fund’s federal tax returns for the prior three fiscal years remain open subject to examination by the Internal Revenue Service.
Distribution of Income and Gains. Distributions from net investment income of the Fund, if any, are declared and distributed to shareholders annually. Net realized gains from investment transactions, in excess of available capital loss carryforwards, would be taxable to the Fund if not distributed, and, therefore, will be distributed to shareholders at least annually. The Fund may also make additional distributions for tax purposes if necessary.
The timing and characterization of certain income and capital gain distributions are determined annually in accordance with federal tax regulations, which may differ from accounting principles generally accepted in the United States of America. These differences primarily relate to certain securities sold at a loss. As a result, net investment income (loss) and net realized gain (loss) on investment transactions for a reporting period may differ significantly from distributions during such period. Accordingly, the Fund may periodically make reclassifications among certain of its capital accounts without impacting the net asset value of the Fund.
| | | | |
Deutsche DWS Variable Series II — DWS CROCI® U.S. VIP | | | | | 13 |
At December 31, 2020, the Fund’s components of distributable earnings on a tax basis were as follows:
| | | | |
| Undistributed ordinary income* | | $ | 2,781,971 | |
| Capital loss carryforward | | $ | (16,383,000 | ) |
| Net unrealized appreciation (depreciation) on investments | | $ | 7,104,018 | |
At December 31, 2020, the aggregate cost of investments for federal income tax purposes was $129,466,138. The net unrealized appreciation for all investments based on tax cost was $7,104,018. This consisted of aggregate gross unrealized appreciation for all investments for which there was an excess of value over tax cost of $10,375,870 and aggregate gross unrealized depreciation for all investments for which there was an excess of tax cost over value of $3,271,852.
In addition, the tax character of distributions paid by the Fund is summarized as follows:
| | | | | | | | |
| | | Years Ended December 31, | |
| | | 2020 | | | 2019 | |
| Distributions from ordinary income* | | $ | 9,688,395 | | | $ | 4,413,315 | |
| Distributions from long-term capital gains | | $ | — | | | $ | 10,190,756 | |
| * | For tax purposes, short-term capital gain distributions are considered ordinary income distributions. |
Expenses. Expenses of the Trust arising in connection with a specific fund are allocated to that fund. Other Trust expenses which cannot be directly attributed to a fund are apportioned among the funds in the Trust based upon the relative net assets or other appropriate measures.
Contingencies. In the normal course of business, the Fund may enter into contracts with service providers that contain general indemnification clauses. The Fund’s maximum exposure under these arrangements is unknown, as this would involve future claims that may be made against the Fund that have not yet been made. However, based on experience, the Fund expects the risk of loss to be remote.
Other. Investment transactions are accounted for on a trade date plus one basis for daily net asset value calculations. However, for financial reporting purposes, investment transactions are reported on trade date. Interest income is recorded on the accrual basis. Dividend income is recorded on the ex-dividend date net of foreign withholding taxes. Realized gains and losses from investment transactions are recorded on an identified cost basis. Proceeds from litigation payments, if any, are included in net realized gain (loss) from investments.
B. Purchases and Sales of Securities
During the year ended December 31, 2020, purchases and sales of investment transactions (excluding short-term investments) aggregated $153,015,940 and $155,014,545, respectively.
C. Related Parties
Management Agreement. Under the Investment Management Agreement with DWS Investment Management Americas, Inc. (“DIMA” or the “Advisor”), an indirect, wholly owned subsidiary of DWS Group GmbH & Co. KGaA (“DWS Group”), the Advisor directs the investments of the Fund in accordance with its investment objectives, policies and restrictions. The Advisor determines the securities, instruments and other contracts relating to investments to be purchased, sold or entered into by the Fund.
Prior to October 1, 2020, under the Investment Management Agreement with the Advisor, the Fund paid a monthly management fee based on the Fund’s average daily net assets, computed and accrued daily and payable monthly, at the following annual rates:
| | | | |
| First $250 million | | | .650 | % |
| Next $750 million | | | .625 | % |
| Next $1.5 billion | | | .600 | % |
| Next $2.5 billion | | | .575 | % |
| Next $2.5 billion | | | .550 | % |
| Next $2.5 billion | | | .525 | % |
| Next $2.5 billion | | | .500 | % |
| Over $12.5 billion | | | .475 | % |
| | | | | | |
| | 14 | | | | | | Deutsche DWS Variable Series II — DWS CROCI® U.S. VIP |
Effective October 1, 2020, under the Investment Management Agreement with the Advisor, the Fund pays a monthly management fee based on the Fund’s average daily net assets, computed and accrued daily and payable monthly, at the following annual rates:
| | | | |
| First $250 million | | | .600 | % |
| Next $750 million | | | .575 | % |
| Next $1.5 billion | | | .550 | % |
| Next $2.5 billion | | | .525 | % |
| Next $2.5 billion | | | .500 | % |
| Next $2.5 billion | | | .475 | % |
| Next $2.5 billion | | | .450 | % |
| Over $12.5 billion | | | .425 | % |
Accordingly, for the year ended December 31, 2020, the fee pursuant to the Investment Management Agreement was equivalent to an annual rate (exclusive of any applicable waivers/reimbursements) of 0.637% of the Fund’s average daily net assets.
For the period from January 1, 2020 through April 30, 2021, the Advisor has contractually agreed to waive all or a portion of its fee and/or reimburse certain operating expenses of the Fund to the extent necessary to maintain the total annual operating expenses (excluding certain expenses such as extraordinary expenses, taxes, brokerage and interest expense) of each class as follows:
| | | | |
| Class A | | | .69 | % |
| Class B | | | 1.00 | % |
For the year ended December 31, 2020, fees waived and/or expenses reimbursed for each class are as follows:
| | | | |
| Class A | | $ | 180,597 | |
| Class B | | | 4,919 | |
| |
| | | $ | 185,516 | |
Administration Fee. Pursuant to an Administrative Services Agreement, DIMA provides most administrative services to the Fund. Prior to March 1, 2020, for all services provided under the Administrative Services Agreement, the Fund paid the Advisor an annual fee (“Administration Fee”) of 0.10% of the Fund’s average daily net assets, computed and accrued daily and payable monthly. Effective March 1, 2020, for all services provided under the Administrative Services Agreement, the Fund pays the Advisor an annual Administration Fee of 0.097% of the Fund’s average daily net assets, computed and accrued daily and payable monthly. For the year ended December 31, 2020, the Administration Fee was $122,573, of which $10,807 is unpaid.
Service Provider Fees. DWS Service Company (“DSC”), an affiliate of the Advisor, is the transfer agent, dividend-paying agent and shareholder service agent for the Fund. Pursuant to a sub-transfer agency agreement between DSC and DST Systems, Inc. (“DST”), DSC has delegated certain transfer agent, dividend-paying agent and shareholder service agent functions to DST. DSC compensates DST out of the shareholder servicing fee it receives from the Fund. For the year ended December 31, 2020, the amounts charged to the Fund by DSC were as follows:
| | | | | | | | |
| Services to Shareholders | | Total
Aggregated | | | Unpaid at
December 31, 2020 | |
| Class A | | $ | 432 | | | $ | 80 | |
| Class B | | | 262 | | | | 48 | |
| | |
| | | $ | 694 | | | $ | 128 | |
Distribution Service Agreement. Under the Fund’s Class B 12b-1 plan, DWS Distributors, Inc. (“DDI”) received a fee (“Distribution Service Fee”) of up to 0.25% of the average daily net assets of Class B shares. For the year ended December 31, 2020, the Distribution Service Fee aggregated $7,656, of which $662 is unpaid.
Other Service Fees. Under an agreement with the Fund, DIMA is compensated for providing certain pre-press and regulatory filing services to the Fund. For the year ended December 31, 2020, the amount charged to the Fund by DIMA included in the Statement of Operations under “Reports to shareholders” aggregated $9,979, of which $3,397 is unpaid.
| | | | |
Deutsche DWS Variable Series II — DWS CROCI® U.S. VIP | | | | | 15 |
Trustees’ Fees and Expenses. The Fund paid retainer fees to each Trustee not affiliated with the Advisor, plus specified amounts to the Board Chairperson and to each committee Chairperson.
Affiliated Cash Management Vehicles. The Fund may invest uninvested cash balances in DWS Central Cash Management Government Fund and DWS ESG Liquidity Fund, affiliated money market funds which are managed by the Advisor. Each affiliated money market fund is managed in accordance with Rule 2a-7 under the 1940 Act, which governs the quality, maturity, diversity and liquidity of instruments in which a money market fund may invest. DWS Central Cash Management Government Fund seeks to maintain a stable net asset value, and DWS ESG Liquidity Fund maintains a floating net asset value. The Fund indirectly bears its proportionate share of the expenses of each affiliated money market fund in which it invests. DWS Central Cash Management Government Fund does not pay the Advisor an investment management fee. To the extent that DWS ESG Liquidity Fund pays an investment management fee to the Advisor, the Advisor will waive an amount of the investment management fee payable to the Advisor by the Fund equal to the amount of the investment management fee payable on the Fund’s assets invested in DWS ESG Liquidity Fund.
Securities Lending Agent Fees. Deutsche Bank AG serves as securities lending agent for the Fund. For the year ended December 31, 2020, the Fund incurred securities lending agent fees to Deutsche Bank AG in the amount of $408.
D. Ownership of the Fund
At December 31, 2020, two participating insurance companies were owners of record of 10% or more of the total outstanding Class A shares of the Fund, each owning 59% and 35%. Three participating insurance companies were owners of record of 10% or more of the total outstanding Class B shares of the Fund, each owning 54%, 16% and 10%.
E. Line of Credit
The Fund and other affiliated funds (the “Participants”) share in a $350 million revolving credit facility provided by a syndication of banks. The Fund may borrow for temporary or emergency purposes, including the meeting of redemption requests that otherwise might require the untimely disposition of securities. The Participants are charged an annual commitment fee, which is allocated based on net assets, among each of the Participants. Interest is calculated at a rate per annum equal to the sum of the Federal Funds Rate plus 1.25 percent plus if the one-month LIBOR exceeds the Federal Funds Rate, the amount of such excess. The Fund may borrow up to a maximum of 33 percent of its net assets under the agreement. The Fund had no outstanding loans at December 31, 2020.
F. Other — COVID-19 Pandemic
A novel coronavirus known as COVID-19, declared a pandemic by the World Health Organization, has caused significant uncertainty, market volatility, decreased economic and other activity and increased government activity. Specifically, COVID-19 has led to significant death and morbidity, and concerns about its further spread have resulted in the closing of schools and non-essential businesses, cancellations, shelter-in place orders, lower consumer spending in certain sectors, social distancing, bans on large social gatherings and travel, quarantines, government economic stimulus measures, reduced productivity, rapid increases in unemployment, increased demand for and strain on government and medical resources, border closings and global trade and supply chain interruptions, among others. The full effects, duration and costs of the COVID-19 pandemic are impossible to predict, and the circumstances surrounding the COVID-19 pandemic will continue to evolve. The pandemic may affect certain countries, industries, economic sectors, companies and investment products more than others, may exacerbate existing economic, political, or social tensions and may increase the probability of an economic recession or depression. The Fund and its investments may be adversely affected by the effects of the COVID-19 pandemic, and a prolonged pandemic may result in the Fund and its service providers experiencing operational difficulties in coordinating a remote workforce and implementing their business continuity plans, among others. Management will continue to monitor the impact COVID-19 has on the Fund and reflect the consequences as appropriate in the Fund’s accounting and financial reporting.
| | | | | | |
| | 16 | | | | | | Deutsche DWS Variable Series II — DWS CROCI® U.S. VIP |
Report of Independent Registered Public Accounting Firm
To the Board of Trustees of Deutsche DWS Variable Series II and Shareholders of DWS CROCI® U.S. VIP:
Opinion on the Financial Statements
We have audited the accompanying statement of assets and liabilities of DWS CROCI® U.S. VIP (the “Fund”) (one of the funds constituting Deutsche DWS Variable Series II) (the “Trust”), including the investment portfolio, as of December 31, 2020, and the related statement of operations for the year then ended, the statements of changes in net assets for each of the two years in the period then ended, the financial highlights for each of the five years in the period then ended and the related notes (collectively referred to as the “financial statements”). In our opinion, the financial statements present fairly, in all material respects, the financial position of the Fund (one of the funds constituting Deutsche DWS Variable Series II) at December 31, 2020, the results of its operations for the year then ended, the changes in its net assets for each of the two years in the period then ended and its financial highlights for each of the five years in the period then ended, in conformity with U.S. generally accepted accounting principles.
Basis for Opinion
These financial statements are the responsibility of the Trust’s management. Our responsibility is to express an opinion on the Fund’s financial statements based on our audits. We are a public accounting firm registered with the Public Company Accounting Oversight Board (United States) (“PCAOB”) and are required to be independent with respect to the Trust in accordance with the U.S. federal securities laws and the applicable rules and regulations of the Securities and Exchange Commission and the PCAOB.
We conducted our audits in accordance with the standards of the PCAOB. Those standards require that we plan and perform the audit to obtain reasonable assurance about whether the financial statements are free of material misstatement, whether due to error or fraud. The Trust is not required to have, nor were we engaged to perform, an audit of the Trust’s internal control over financial reporting. As part of our audits, we are required to obtain an understanding of internal control over financial reporting, but not for the purpose of expressing an opinion on the effectiveness of the Trust’s internal control over financial reporting. Accordingly, we express no such opinion.
Our audits included performing procedures to assess the risks of material misstatement of the financial statements, whether due to error or fraud, and performing procedures that respond to those risks. Such procedures included examining, on a test basis, evidence regarding the amounts and disclosures in the financial statements. Our procedures included confirmation of securities owned as of December 31, 2020, by correspondence with the custodian and others. Our audits also included evaluating the accounting principles used and significant estimates made by management, as well as evaluating the overall presentation of the financial statements. We believe that our audits provide a reasonable basis for our opinion.

We have served as the auditor of one or more investment companies in the DWS family of funds since at least 1979, but we are unable to determine the specific year.
Boston, Massachusetts
February 12, 2021
| | | | |
Deutsche DWS Variable Series II — DWS CROCI® U.S. VIP | | | | | 17 |
| | |
| Information About Your Fund’s Expenses | | (Unaudited) |
As an investor of the Fund, you incur two types of costs: ongoing expenses and transaction costs. Ongoing expenses include management fees, distribution and service (12b-1) fees and other Fund expenses. Examples of transaction costs include contract charges, which are not shown in this section. The following tables are intended to help you understand your ongoing expenses (in dollars) of investing in the Fund and to help you compare these expenses with the ongoing expenses of investing in other mutual funds. In the most recent six-month period, the Fund limited these expenses; had it not done so, expenses would have been higher. The example in the table is based on an investment of $1,000 invested at the beginning of the six-month period and held for the entire period (July 1, 2020 to December 31, 2020).
The tables illustrate your Fund’s expenses in two ways:
| – | Actual Fund Return. This helps you estimate the actual dollar amount of ongoing expenses (but not transaction costs) paid on a $1,000 investment in the Fund using the Fund’s actual return during the period. To estimate the expenses you paid over the period, simply divide your account value by $1,000 (for example, an $8,600 account value divided by $1,000 = 8.6), then multiply the result by the number in the “Expenses Paid per $1,000” line under the share class you hold. |
| – | Hypothetical 5% Fund Return. This helps you to compare your Fund’s ongoing expenses (but not transaction costs) with those of other mutual funds using the Fund’s actual expense ratio and a hypothetical rate of return of 5% per year before expenses. Examples using a 5% hypothetical Fund return may be found in the shareholder reports of other mutual funds. The hypothetical account values and expenses may not be used to estimate the actual ending account balance or expenses you paid for the period. |
Please note that the expenses shown in these tables are meant to highlight your ongoing expenses only and do not reflect any transaction costs. The “Expenses Paid per $1,000” line of the tables is useful in comparing ongoing expenses only and will not help you determine the relative total expense of owning different funds. If these transaction costs had been included, your costs would have been higher.
| | | | | | | | |
| Expenses and Value of a $1,000 Investment for the six months ended December 31, 2020 | |
| | |
| Actual Fund Return | | | Class A | | | | Class B | |
| Beginning Account Value 7/1/20 | | $ | 1,000.00 | | | $ | 1,000.00 | |
| Ending Account Value 12/31/20 | | $ | 1,133.30 | | | $ | 1,131.80 | |
| Expenses Paid per $1,000* | | $ | 3.70 | | | $ | 5.36 | |
| | |
| Hypothetical 5% Fund Return | | | Class A | | | | Class B | |
| Beginning Account Value 7/1/20 | | $ | 1,000.00 | | | $ | 1,000.00 | |
| Ending Account Value 12/31/20 | | $ | 1,021.67 | | | $ | 1,020.11 | |
| Expenses Paid per $1,000* | | $ | 3.51 | | | $ | 5.08 | |
| * | Expenses are equal to the Fund’s annualized expense ratio for each share class, multiplied by the average account value over the period, multiplied by 184 (the number of days in the most recent six-month period), then divided by 366. |
| | | | | | | | |
| Annualized Expense Ratios | | Class A | | | Class B | |
| Deutsche DWS Variable Series II — DWS CROCI® U.S. VIP | | | .69 | % | | | 1.00 | % |
For more information, please refer to the Fund’s prospectus.
These tables do not reflect charges and fees (“contract charges”) associated with the separate account that invests in the Fund or any variable life insurance policy or variable annuity contract for which the Fund is an investment option.
For an analysis of the fees associated with an investment in the Fund or similar funds, please refer to the current and hypothetical expense calculators for Variable Insurance Products which can be found at dws.com/calculators.
| | | | | | |
| | 18 | | | | | | Deutsche DWS Variable Series II — DWS CROCI® U.S. VIP |
| | |
| Tax Information | | (Unaudited) |
For corporate shareholders, 35% of the ordinary dividends (i.e., income dividends plus short-term capital gains) paid during the Fund’s fiscal year ended December 31, 2020, qualified for the dividends received deduction.
Please consult a tax advisor if you have questions about federal or state income tax laws, or on how to prepare your tax returns. If you have specific questions about your account, please contact your insurance provider.
Proxy Voting
The Trust’s policies and procedures for voting proxies for portfolio securities and information about how the Trust voted proxies related to its portfolio securities during the most recent 12-month period ended June 30 are available on our Web site — dws.com/en-us/resources/proxy-voting — or on the SEC’s Web site — sec.gov. To obtain a written copy of the Trust’s policies and procedures without charge, upon request, call us toll free at (800) 728-3337.
| | | | |
Deutsche DWS Variable Series II — DWS CROCI® U.S. VIP | | | | | 19 |
Advisory Agreement Board Considerations and Fee Evaluation
The Board of Trustees (hereinafter referred to as the “Board” or “Trustees”) approved the renewal of DWS CROCI® U.S. VIP’s (the “Fund”) investment management agreement (the “Agreement”) with DWS Investment Management Americas, Inc. (“DIMA”) in September 2020.
In terms of the process that the Board followed prior to approving the Agreement, shareholders should know that:
| – | | During the entire process, all of the Fund’s Trustees were independent of DIMA and its affiliates (the “Independent Trustees”). |
| – | | The Board met frequently during the past year to discuss fund matters and dedicated a substantial amount of time to contract review matters. Over the course of several months, the Board reviewed extensive materials received from DIMA, independent third parties and independent counsel. These materials included an analysis of the Fund’s performance, fees and expenses, and profitability from a fee consultant retained by the Fund’s Independent Trustees (the “Fee Consultant”). |
| – | | The Board also received extensive information throughout the year regarding performance of the Fund. |
| – | | The Independent Trustees regularly met privately with counsel to discuss contract review and other matters. In addition, the Independent Trustees were advised by the Fee Consultant in the course of their review of the Fund’s contractual arrangements and considered a comprehensive report prepared by the Fee Consultant in connection with their deliberations. |
| – | | In connection with reviewing the Agreement, the Board also reviewed the terms of the Fund’s Rule 12b-1 plan, distribution agreement, administrative services agreement, transfer agency agreement and other material service agreements. |
In connection with the contract review process, the Board considered the factors discussed below, among others. The Board also considered that DIMA and its predecessors have managed the Fund since its inception, and the Board believes that a long-term relationship with a capable, conscientious advisor is in the best interests of the Fund. The Board considered, generally, that shareholders chose to invest or remain invested in the Fund knowing that DIMA managed the Fund. DIMA is part of DWS Group GmbH & Co. KGaA (“DWS Group”). DWS Group is a global asset management business that offers a wide range of investing expertise and resources, including research capabilities in many countries throughout the world. In 2018, approximately 20% of DWS Group’s shares were sold in an initial public offering, with Deutsche Bank AG owning the remaining shares.
As part of the contract review process, the Board carefully considered the fees and expenses of each DWS fund overseen by the Board in light of the fund’s performance. In many cases, this led to the negotiation and implementation of expense caps.
While shareholders may focus primarily on fund performance and fees, the Fund’s Board considers these and many other factors, including the quality and integrity of DIMA’s personnel and administrative support services provided by DIMA, such as back-office operations, fund valuations, and compliance policies and procedures.
Nature, Quality and Extent of Services. The Board considered the terms of the Agreement, including the scope of advisory services provided under the Agreement. The Board noted that, under the Agreement, DIMA provides portfolio management services to the Fund and that, pursuant to a separate administrative services agreement, DIMA provides administrative services to the Fund. The Board considered the experience and skills of senior management and investment personnel and the resources made available to such personnel. The Board also considered the risks to DIMA in sponsoring or managing the Fund, including financial, operational and reputational risks, the potential economic impact to DIMA from such risks and DIMA’s approach to addressing such risks. The Board reviewed the Fund’s performance over short-term and long-term periods and compared those returns to various agreed-upon performance measures, including market index(es) and a peer universe compiled using information supplied by Morningstar Direct (“Morningstar”), an independent fund data service. The Board also noted that it has put into place a process of identifying “Funds in Review” (e.g., funds performing poorly relative to a peer universe), and receives additional reporting from DIMA regarding such funds and, where appropriate, DIMA’s plans to address underperformance. The Board believes this process is an effective manner of identifying and addressing underperforming funds. Based on the information provided, the Board noted that, for the one-, three- and
| | | | | | |
| | 20 | | | | | | Deutsche DWS Variable Series II — DWS CROCI® U.S. VIP |
five-year periods ended December 31, 2019, the Fund’s performance (Class A shares) was in the 1st quartile, 1st quartile and 4th quartile, respectively, of the applicable Morningstar universe (the 1st quartile being the best performers and the 4th quartile being the worst performers). The Board also observed that the Fund has outperformed its benchmark in the one- and three-year periods and has underperformed its benchmark in the five-year period ended December 31, 2019.
Fees and Expenses. The Board considered the Fund’s investment management fee schedule, operating expenses and total expense ratios, and comparative information provided by Broadridge Financial Solutions, Inc. (“Broadridge”) and the Fee Consultant regarding investment management fee rates paid to other investment advisors by similar funds (1st quartile being the most favorable and 4th quartile being the least favorable). With respect to management fees paid to other investment advisors by similar funds, the Board noted that the contractual fee rates paid by the Fund, which include a 0.10% fee paid to DIMA under the Fund’s administrative services agreement, were higher than the median (3rd quartile) of the applicable Broadridge peer group (based on Broadridge data provided as of December 31, 2019). The Board noted that, effective March 1, 2020, the fee paid to DIMA under the Fund’s administrative services agreement was reduced to 0.097%. The Board also noted that, effective October 1, 2020, in connection with the 2020 contract renewal process, DIMA agreed to reduce the Fund’s contractual management fee at each breakpoint by 0.05%. The Board noted that the Fund’s Class A shares total (net) operating expenses were expected to be higher than the median (3rd quartile) of the applicable Broadridge expense universe (based on Broadridge data provided as of December 31, 2018, and analyzing Broadridge expense universe Class A (net) expenses less any applicable 12b-1 fees) (“Broadridge Universe Expenses”). The Board also reviewed data comparing each other operational share class’s total (net) operating expenses to the applicable Broadridge Universe Expenses. The Board noted that the expense limitations agreed to by DIMA were expected to help the Fund’s total (net) operating expenses remain competitive. The Board considered the Fund’s management fee rate as compared to fees charged by DIMA to comparable DWS U.S. registered funds (“DWS Funds”) and considered differences between the Fund and the comparable DWS Funds. The information requested by the Board as part of its review of fees and expenses also included information about institutional accounts (including any sub-advised funds and accounts) and funds offered primarily to European investors (“DWS Europe Funds”) managed by DWS Group. The Board noted that DIMA indicated that DWS Group does not manage any institutional accounts or DWS Europe Funds comparable to the Fund.
On the basis of the information provided, the Board concluded that management fees were reasonable and appropriate in light of the nature, quality and extent of services provided by DIMA.
Profitability. The Board reviewed detailed information regarding revenues received by DIMA under the Agreement. The Board considered the estimated costs to DIMA, and pre-tax profits realized by DIMA, from advising the DWS Funds, as well as estimates of the pre-tax profits attributable to managing the Fund in particular. The Board also received information regarding the estimated enterprise-wide profitability of DIMA and its affiliates with respect to all fund services in totality and by fund. The Board and the Fee Consultant reviewed DIMA’s methodology in allocating its costs to the management of the Fund. Based on the information provided, the Board concluded that the pre-tax profits realized by DIMA in connection with the management of the Fund were not unreasonable. The Board also reviewed certain publicly available information regarding the profitability of certain similar investment management firms. The Board noted that, while information regarding the profitability of such firms is limited (and in some cases is not necessarily prepared on a comparable basis), DIMA and its affiliates’ overall profitability with respect to the DWS Funds (after taking into account distribution and other services provided to the funds by DIMA and its affiliates) was lower than the overall profitability levels of most comparable firms for which such data was available.
Economies of Scale. The Board considered whether there are economies of scale with respect to the management of the Fund and whether the Fund benefits from any economies of scale. The Board noted that the Fund’s investment management fee schedule includes fee breakpoints. The Board concluded that the Fund’s fee schedule represents an appropriate sharing between the Fund and DIMA of such economies of scale as may exist in the management of the Fund at current asset levels.
Other Benefits to DIMA and Its Affiliates. The Board also considered the character and amount of other incidental or “fall-out” benefits received by DIMA and its affiliates, including any fees received by DIMA for administrative services provided to the Fund, any fees received by an affiliate of DIMA for transfer agency services provided to the Fund and any fees received by an affiliate of DIMA for distribution services. The Board noted that DIMA pays a licensing fee to an affiliate related to the Fund’s use of the CROCI® strategy. The Board also considered benefits to DIMA related to brokerage and soft-dollar allocations, including allocating brokerage to pay for research generated by parties other than the executing broker dealers, which
| | | | |
Deutsche DWS Variable Series II — DWS CROCI® U.S. VIP | | | | | 21 |
pertain primarily to funds investing in equity securities. In addition, the Board considered the incidental public relations benefits to DIMA related to DWS Funds advertising and cross-selling opportunities among DIMA products and services. The Board considered these benefits in reaching its conclusion that the Fund’s management fees were reasonable.
Compliance. The Board considered the significant attention and resources dedicated by DIMA to its compliance processes in recent years. The Board noted in particular (i) the experience, seniority and time commitment of the individuals serving as DIMA’s and the Fund’s chief compliance officers and (ii) the substantial commitment of resources by DIMA and its affiliates to compliance matters, including the retention of compliance personnel.
The Board also considered that on September 24, 2020, the SEC granted a temporary order permitting DIMA and its affiliates to continue providing investment advisory and underwriting services to the DWS Funds notwithstanding a consent order entered into by Deutsche Bank AG on June 17, 2020 (the “Consent Order”). The Board noted that the temporary order was granted effective as of the date of the Consent Order. The Board also noted various representations by DIMA to the Board relating to the Consent Order, including that the conduct giving rise to the Consent Order (unintentional conduct that resulted from a system outage that prevented Deutsche Bank AG from reporting data in accordance with applicable CFTC requirements for five days in April 2016) did not involve any DWS Fund or services DIMA and its affiliates provide to the DWS Funds, that DIMA and its personnel had no involvement in the alleged conduct giving rise to the Consent Order, and that the DWS Funds would not bear any financial impact or costs relating to the Consent Order.
Based on all of the information considered and the conclusions reached, the Board determined that the continuation of the Agreement is in the best interests of the Fund. In making this determination, the Board did not give particular weight to any single factor identified above. The Board considered these factors over the course of numerous meetings, certain of which were in executive session with only the Independent Trustees and counsel present. It is possible that individual Independent Trustees may have weighed these factors differently in reaching their individual decisions to approve the continuation of the Agreement.
| | | | | | |
| | 22 | | | | | | Deutsche DWS Variable Series II — DWS CROCI® U.S. VIP |
| | |
| Board Members and Officers | | |
The following table presents certain information regarding the Board Members and Officers of the Trust/Corporation. Each Board Member’s year of birth is set forth in parentheses after his or her name. Unless otherwise noted, (i) each Board Member has engaged in the principal occupation(s) noted in the table for at least the most recent five years, although not necessarily in the same capacity; and (ii) the address of each Independent Board Member is Keith R. Fox, DWS Funds Board Chair, c/o Thomas R. Hiller, Ropes & Gray LLP, Prudential Tower, 800 Boylston Street, Boston, MA 02199-3600. Except as otherwise noted below, the term of office for each Board Member is until the election and qualification of a successor, or until such Board Member sooner dies, resigns, is removed or as otherwise provided in the governing documents of the Trust/Corporation. Because the Fund does not hold an annual meeting of shareholders, each Board Member will hold office for an indeterminate period.
The Board Members may also serve in similar capacities with other funds in the fund complex. The number of funds in the DWS fund complex shown in the table below includes all registered open- and closed-end funds (including all of their portfolios) advised by the Advisor and any registered funds that have an investment advisor that is an affiliated person of the Advisor.
| | | | | | | | |
| Independent Board Members | | | |
Name, Year of Birth,
Position with the Trust/
Corporation and
Length of Time Served1 | | Business Experience and Directorships During the Past Five Years | | Number of
Funds in
DWS Fund
Complex
Overseen | | | Other
Directorships
Held by Board
Member
|
Keith R. Fox, CFA (1954) Chairperson since 2017, and Board Member since 1996 | | Managing General Partner, Exeter Capital Partners (a series of private investment funds) (since 1986). Directorships: Progressive International Corporation (kitchen goods importer and distributor); former Chairman, National Association of Small Business Investment Companies; former Directorships: ICI Mutual Insurance Company; BoxTop Media Inc. (advertising); Sun Capital Advisers Trust (mutual funds) (2011–2012) | | | 73 | | | — |
John W. Ballantine (1946) Board Member since 1999 | | Retired; formerly, Executive Vice President and Chief Risk Management Officer, First Chicago NBD Corporation/The First National Bank of Chicago (1996–1998); Executive Vice President and Head of International Banking (1995–1996); former Directorships: Director and Chairman of the Board, Healthways, Inc.2 (population well-being and wellness services) (2003–2014); Stockwell Capital Investments PLC (private equity); Enron Corporation; FNB Corporation; Tokheim Corporation; First Oak Brook Bancshares, Inc.; Oak Brook Bank; and Prisma Energy International. Not-for-Profit Director/Trustee: Palm Beach Civic Association; Window to the World Communications (public media); Life Director of Harris Theater for Music and Dance (Chicago); Life Director of Hubbard Street Dance Chicago; former Not-for-Profit Directorships: Public Radio International | | | 73 | | | Portland
General
Electric2
(utility
company)
(2003–
present) |
Dawn-Marie Driscoll (1946) Board Member since 1987 | | Emeritus Executive Fellow, Center for Business Ethics, Bentley University; formerly: Partner, Palmer & Dodge (law firm) (1988–1990); Vice President of Corporate Affairs and General Counsel, Filene’s (retail) (1978–1988). Directorships: Advisory Board, Center for Business Ethics, Bentley University; Trustee and former Chairman of the Board, Southwest Florida Community Foundation (charitable organization); former Directorships: ICI Mutual Insurance Company (2007–2015); Sun Capital Advisers Trust (mutual funds) (2007–2012), Investment Company Institute (audit, executive, nominating committees) and Independent Directors Council (governance, executive committees) | | | 73 | | | — |
Richard J. Herring (1946) Board Member since 1990 | | Jacob Safra Professor of International Banking and Professor of Finance, The Wharton School, University of Pennsylvania (since July 1972); Director, The Wharton Financial Institutions Center (since 1994); formerly: Vice Dean and Director, Wharton Undergraduate Division (1995–2000) and Director, The Lauder Institute of International Management Studies (2000–2006); Member FDIC Systemic Risk Advisory Committee since 2011, member Systemic Risk Council since 2012 and member of the Advisory Board at the Yale Program on Financial Stability since 2013; Formerly Co-Chair of the Shadow Financial Regulatory Committee (2003–2015), Executive Director of The Financial Economists Roundtable (2008–2015), Director of The Thai Capital Fund (2007–2013), Director of The Aberdeen Singapore Fund (2007–2018), and Nonexecutive Director of Barclays Bank DE (2010–2018) | | | 73 | | | Director,
Aberdeen
Japan Fund
(since 2007) |
William McClayton (1944) Board Member since 2004 | | Private equity investor (since October 2009); previously, Managing Director, Diamond Management & Technology Consultants, Inc. (global consulting firm) (2001–2009); Directorship: Board of Managers, YMCA of Metropolitan Chicago; formerly: Senior Partner, Arthur Andersen LLP (accounting) (1966–2001); Trustee, Ravinia Festival | | | 73 | | | — |
| | | | |
Deutsche DWS Variable Series II — DWS CROCI® U.S. VIP | | | | | 23 |
| | | | | | | | |
Name, Year of Birth,
Position with the Trust/
Corporation and
Length of Time Served1 | | Business Experience and Directorships During the Past Five Years | | Number of
Funds in
DWS Fund
Complex
Overseen | | | Other
Directorships
Held by Board
Member
|
Rebecca W. Rimel (1951) Board Member since 1995 | | Senior Advisor, The Pew Charitable Trusts (charitable organization) (since July 2020); formerly: Executive Vice President, The Glenmede Trust Company (investment trust and wealth management) (1983–2004); Board Member, Investor Education (charitable organization) (2004–2005); Trustee, Executive Committee, Philadelphia Chamber of Commerce (2001–2007); Director, Viasys Health Care2 (January 2007–June 2007); Trustee, Thomas Jefferson Foundation (charitable organization) (1994–2012); President, Chief Executive Officer and Director, The Pew Charitable Trusts (charitable organization) (1994–2020) | | | 73 | | | Director,
Becton
Dickinson
and
Company2
(medical
technology
company)
(2012–
present);
Director,
BioTelemetry
Inc.2 (health
care) (2009–
present) |
William N. Searcy, Jr. (1946) Board Member since 1993 | | Private investor since October 2003; formerly: Pension & Savings Trust Officer, Sprint Corporation2 (telecommunications) (November 1989–September 2003); Trustee, Sun Capital Advisers Trust (mutual funds) (1998–2012) | | | 73 | | | — |
| | |
| Officers4 | | |
Name, Year of Birth,
Position with the Trust/
Corporation and
Length of Time Served5 | | Business Experience and Directorships During the Past Five Years |
Hepsen Uzcan6 (1974) President and Chief Executive Officer, 2017–present | | Managing Director3, DWS; Secretary, DWS USA Corporation (2018–present); Assistant Secretary, DWS Distributors, Inc. (2018–present); Director and Vice President, DWS Service Company (2018–present); Assistant Secretary, DWS Investment Management Americas, Inc. (2018–present); Director and President, DB Investment Managers, Inc. (2018–present); President and Chief Executive Officer, The European Equity Fund, Inc., The New Germany Fund, Inc. and The Central and Eastern Europe Fund, Inc. (2017–present); formerly: Vice President for the Deutsche funds (2016–2017); Assistant Secretary for the DWS funds (2013–2019); Assistant Secretary, The European Equity Fund, Inc., The New Germany Fund, Inc. and The Central and Eastern Europe Fund, Inc. (2013–2020); Directorships: Interested Director, The European Equity Fund, Inc., The New Germany Fund, Inc. and The Central and Eastern Europe Fund, Inc. (since June 25, 2020); ICI Mutual Insurance Company (since October 16, 2020); and Episcopalian Charities of New York (2018–present) |
John Millette7 (1962) Vice President and Secretary, 1999–present | | Director,3 DWS; Chief Legal Officer, DWS Investment Management Americas, Inc. (2015–present); Director and Vice President, DWS Trust Company (2016–present); Secretary, DBX ETF Trust (2020–present); Secretary, The European Equity Fund, Inc., The New Germany Fund, Inc. and The Central and Eastern Europe Fund, Inc. (2011–present); formerly: Secretary, Deutsche Investment Management Americas Inc. (2015–2017); Assistant Secretary, DBX ETF Trust (2019–2020); Assistant Secretary (July 14, 2006–December 31, 2010) and Secretary (January 31, 2006–July 13, 2006), The European Equity Fund, Inc., The New Germany Fund, Inc. and The Central and Eastern Europe Fund, Inc. |
Ciara Crawford8 (1984) Assistant Secretary, (2019–present) | | Associate, DWS (since 2015); previously, Legal Assistant at Accelerated Tax Solutions. |
Diane Kenneally7 (1966) Chief Financial Officer and Treasurer, 2018–present | | Director,3 DWS; Treasurer, Chief Financial Officer and Controller, DBX ETF Trust (2019–present); Treasurer and Chief Financial Officer, The European Equity Fund, Inc., The New Germany Fund, Inc. and The Central and Eastern Europe Fund, Inc. (2018–present); formerly: Assistant Treasurer for the DWS funds (2007–2018) |
Paul Antosca7 (1957) Assistant Treasurer, 2007–present | | Director,3 DWS; and Assistant Treasurer, DBX ETF Trust (2019–present) |
Sheila Cadogan7 (1966) Assistant Treasurer, 2017–present | | Director,3 DWS; Director and Vice President, DWS Trust Company (2018–present); Assistant Treasurer, DBX ETF Trust (2019–present); Assistant Treasurer, The European Equity Fund, Inc., The New Germany Fund, Inc. and The Central and Eastern Europe Fund, Inc. (2018–present) |
Scott D. Hogan7 (1970) Chief Compliance Officer, 2016–present | | Director,3 DWS; Chief Compliance Officer, The European Equity Fund, Inc., The New Germany Fund, Inc. and The Central and Eastern Europe Fund, Inc. (2016–present) |
Caroline Pearson7 (1962) Chief Legal Officer, 2010–present | | Managing Director3, DWS; Assistant Secretary, DBX ETF Trust (2020–present); Chief Legal Officer, DBX Advisors LLC and DBX Strategic Advisors LLC (2020–present); Chief Legal Officer, The European Equity Fund, Inc., The New Germany Fund, Inc. and The Central and Eastern Europe Fund, Inc. (2012–present); formerly: Secretary, Deutsche AM Distributors, Inc. (2002–2017); and Secretary, Deutsche AM Service Company (2010–2017) |
| | | | | | |
| | 24 | | | | | | Deutsche DWS Variable Series II — DWS CROCI® U.S. VIP |
| | |
Name, Year of Birth,
Position with the Trust/
Corporation and
Length of Time Served5 | | Business Experience and Directorships During the Past Five Years |
Michelle Goveia-Pine6 (1970) Interim Anti-Money Laundering Compliance Officer, since July 10, 2020 | | Director,3 DWS; Interim AML Officer, DWS Trust Company (since July 28, 2020); Interim AML Officer, DBX ETF Trust (since July 9, 2020); Interim AML Officer, The European Equity Fund, Inc., The New Germany Fund, Inc. and The Central and Eastern Europe Fund, Inc. (since July 24, 2020) |
| 1 | The length of time served represents the year in which the Board Member joined the board of one or more DWS funds currently overseen by the Board. |
| 2 | A publicly held company with securities registered pursuant to Section 12 of the Securities Exchange Act of 1934. |
| 3 | Executive title, not a board directorship. |
| 4 | As a result of their respective positions held with the Advisor or its affiliates, these individuals are considered “interested persons” of the Advisor within the meaning of the 1940 Act. Interested persons receive no compensation from the Fund. |
| 5 | The length of time served represents the year in which the officer was first elected in such capacity for one or more DWS funds. |
| 6 | Address: 875 Third Avenue, New York, NY 10022. |
| 7 | Address: 100 Summer Street, Boston, MA 02110. |
| 8 | Address: 5022 Gate Parkway, Suite 400, Jacksonville, FL 32256. |
The Fund’s Statement of Additional Information (“SAI”) includes additional information about the Board Members. The SAI is available, without charge, upon request. If you would like to request a copy of the SAI, you may do so by calling the following toll-free number: (800) 728-3337.
| | | | |
Deutsche DWS Variable Series II — DWS CROCI® U.S. VIP | | | | | 25 |
Notes
Notes
| | |
| | |
VS2CUS-2 (R-025833-10 2/21) | | |
December 31, 2020
Annual Report
Deutsche DWS Variable Series II
DWS Global Equity VIP

Contents
| | | | |
| | 3 | | | Performance Summary |
| | 4 | | | Management Summary |
| | 6 | | | Portfolio Summary |
| | 7 | | | Investment Portfolio |
| | 10 | | | Statement of Assets and Liabilities |
| | 10 | | | Statement of Operations |
| | 11 | | | Statements of Changes in Net Assets |
| | 12 | | | Financial Highlights |
| | 13 | | | Notes to Financial Statements |
| | 18 | | | Report of Independent Registered Public Accounting Firm |
| | 19 | | | Information About Your Fund’s Expenses |
| | 20 | | | Tax Information |
| | 20 | | | Proxy Voting |
| | 21 | | | Advisory Agreement Board Considerations and Fee Evaluation |
| | 24 | | | Board Members and Officers |
This report must be preceded or accompanied by a prospectus. To obtain an additional prospectus or summary prospectus, if available, call (800) 728-3337 or your financial representative. We advise you to consider the Fund’s objectives, risks, charges and expenses carefully before investing. The summary prospectus and prospectus contain this and other important information about the Fund. Please read the prospectus carefully before you invest.
Stocks may decline in value. Investing in foreign securities, particularly those of emerging markets, presents certain risks, such as currency fluctuations, political and economic changes, and market risks. Emerging markets tend to be more volatile and less liquid than the markets of more mature economies, and generally have less diverse and less mature economic structures and less stable political systems than those of developed countries. The Fund may lend securities to approved institutions. Please read the prospectus for details.
War, terrorism, economic uncertainty, trade disputes, public health crises (including the recent pandemic spread of the novel coronavirus) and related geopolitical events could lead to increased market volatility, disruption to U.S. and world economies and markets and may have significant adverse effects on the Fund and its investments.
The brand DWS represents DWS Group GmbH & Co. KGaA and any of its subsidiaries such as DWS Distributors, Inc. which offers investment products or DWS Investment Management Americas, Inc. and RREEF America L.L.C. which offer advisory services.
DWS Distributors, Inc., 222 South Riverside Plaza, Chicago, IL 60606, (800) 621-1148
NOT FDIC/NCUA INSURED NO BANK GUARANTEE MAY LOSE VALUE NOT A DEPOSIT
NOT INSURED BY ANY FEDERAL GOVERNMENT AGENCY
| | | | | | |
| | 2 | | | | | | Deutsche DWS Variable Series II — DWS Global Equity VIP |
| | |
| Performance Summary | | December 31, 2020 (Unaudited) |
Fund performance shown is historical, assumes reinvestment of all dividend and capital gain distributions and does not guarantee future results. Investment return and principal value fluctuate with changing market conditions so that, when redeemed, shares may be worth more or less than their original cost. Current performance may be lower or higher than the performance data quoted. Please contact your participating insurance company for the Fund’s most recent month-end performance. Performance does not reflect charges and fees (“contract charges”) associated with the separate account that invests in the Fund or any variable life insurance policy or variable annuity contract for which the Fund is an investment option. These charges and fees will reduce returns.
The gross expense ratio of the Fund, as stated in the fee table of the prospectus dated May 1, 2020 is 1.22% for Class A shares and may differ from the expense ratio disclosed in the Financial Highlights table in this report.
Generally accepted accounting principles require adjustments to be made to the net assets of the Fund at period end for financial reporting purposes only, and as such, the total return based on the unadjusted net asset value per share may differ from the total return reported in the financial highlights.
Growth of an Assumed $10,000 Investment
| | |
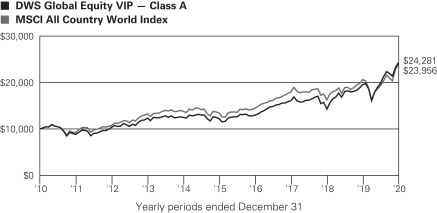
| | The MSCI All Country World Index is an unmanaged equity index which captures large and mid-capitalization representation across 23 developed markets and 26 emerging markets countries. It covers approximately 85% of the global investable equity opportunity set. Index returns do not reflect any fees or expenses and it is not possible to invest directly into an index. Prior to July 12, 2013, the Fund was named DWS Diversified International Equity VIP and had a subadvisor and a different investment management team that operated with a different investment strategy. Performance would have been different if the fund’s current investment strategy had been in effect. |
| | | | | | | | | | |
| Comparative Results | | | | |
| | | | |
| DWS Global Equity VIP | | 1-Year | | 3-Year | | 5-Year | | 10-Year |
| Class A | | Growth of $10,000 | | $12,452 | | $15,081 | | $19,850 | | $24,281 |
| | | Average annual total return | | 24.52% | | 14.68% | | 14.70% | | 9.28% |
| MSCI All Country World Index | | Growth of $10,000 | | $11,625 | | $13,332 | | $17,828 | | $23,956 |
| | Average annual total return | | 16.25% | | 10.06% | | 12.26% | | 9.13% |
The growth of $10,000 is cumulative.
| | | | |
Deutsche DWS Variable Series II — DWS Global Equity VIP | | | | | 3 |
| | |
| Management Summary | | December 31, 2020 (Unaudited) |
Class A shares of the Fund gained 24.52% (unadjusted for contract charges) in 2020 and strongly outperformed the 16.25% return of the MSCI All Country World Index. The Fund outpaced the index in the three-, five-, and 10-year periods that ended on December 31, 2020.
After a difficult start brought about by the emergence of COVID-19, global equities rebounded to close the year with a healthy gain. The recovery reflected optimism that the aggressive stimulus provided by world governments and central banks would sustain the economy until the virus had dissipated. The approval of multiple vaccines for COVID-19 also led to an improvement in the economic outlook, fueling an impressive rally in the major equity indexes in the final two months of the year.
Our emphasis on growth stocks was a key factor in the Fund’s outperformance in 2020. The growth style delivered a return that was well ahead of value, creating a tailwind for our strategy relative to the blended benchmark.
The Fund’s holdings outpaced the index by the widest margin in health care, led by positions in Lonza Group AG and Danaher Corp. Financials were an additional area of strength, with the largest contributions coming from Progressive Corp. and Brookfield Asset Management, Inc. We also added value through stock selection in communication services and information technology, where the top contributors were Spotify Technology SA and ServiceNow, Inc., respectively. The consumer discretionary sector was the only area where we underperformed to a meaningful extent, with the bulk of the shortfall resulting from a zero weighting in Tesla, Inc.
Amid the elevated uncertainty associated with COVID-19, we remained guided by our longstanding approach of investing in high-quality, innovative businesses that we believe can grow irrespective of the macroeconomic environment. As part of this process, we added new holdings in stocks we viewed as being especially well suited to navigate the cross-currents resulting from the pandemic. Some of these were immediate beneficiaries, such as Amazon.com, Inc. — which saw an accelerated adoption of ecommerce and cloud services — as well as Hologic, Inc. and Quidel Corp., which were quick to provide coronavirus tests in volume. We also established positions in RingCentral, Inc., which we believed would experience accelerating demand for its cloud-based, enterprise communication services, and Terminix Global Holdings, Inc., where the generally positive trends in the pest control market were augmented by corporate restructuring. Later in the year, as the likelihood of a vaccine increased, we looked for secular growth stocks that could benefit from a reopening. For instance, we added a position Match Group, Inc., an operator of several online dating sites and apps, and PPD, Inc., a contract research organization positioned to capitalize on a step-up in pharmaceutical- and biotechnology-related funding.
From a regional perspective, the Fund remained well diversified across Europe, China, and North America. Although we emphasize the developed markets, we look for growing businesses in the emerging markets (as well as companies with a large portion of their revenues from this segment) on the belief that the category features attractive long-term growth prospects. At the sector level, the Fund was overweight in technology, health care, and industrials, and its largest underweights were in energy and materials. This positioning is the result of our bottom-up stock selection process, rather than a top-down view.
We continue to see opportunities in companies that are positioned for long-term, sustainable growth as they capitalize on dynamic and widening addressable markets. We are finding this to be the case not only in growth sectors, but also in more traditional businesses (such as those in the financials, insurance, education, and health care industries) that are quickly embracing new solutions to adapt to the disrupting forces. Many companies in these areas also stand to benefit from the falling costs and increasing productivity that technology-enabled innovation provides.
With visibility remaining clouded due to renewed lockdowns and surging coronavirus cases around the world, we believe it’s essential to calibrate the portfolio’s risk-reward characteristics carefully and ensure the appropriate level of diversification across industries, regions, and stages of the corporate life cycle.
Sebastian P. Werner, PhD, Director
Portfolio Manager
The views expressed reflect those of the portfolio management team only through the end of the period of the report as stated on the cover. The management team’s views are subject to change at any time based on market and other conditions and should not be construed as a recommendation. Past performance is no guarantee of future results. Current and future portfolio holdings are subject to risk.
| | | | | | |
| | 4 | | | | | | Deutsche DWS Variable Series II — DWS Global Equity VIP |
Terms to Know
MSCI All Country World Index is an unmanaged equity index which captures large and mid-capitalization representation across 23 developed markets and 26 emerging markets countries. It covers approximately 85% of the global investable equity opportunity set.
Index returns do not reflect fees or expenses and it is not possible to invest directly into an index.
Stock selection refers to the performance of the fund’s holdings in a given sector relative to the sector as a whole.
Contribution incorporates both a stock’s total return and its weighting in the Fund.
Underweight means the Fund holds a lower weighting in a given sector or security than the benchmark. Overweight means it holds a higher weighting.
| | | | |
Deutsche DWS Variable Series II — DWS Global Equity VIP | | | | | 5 |
| | |
| Portfolio Summary | | (Unaudited) |
| | | | | | | | |
| Asset Allocation (As a % of Investment Portfolio excluding Securities Lending Collateral) | | 12/31/20 | | | 12/31/19 | |
| Common Stocks | | | 99% | | | | 99% | |
| Cash Equivalent | | | 1% | | | | 1% | |
| | | | 100% | | | | 100% | |
| | |
Sector Diversification (As a % of Investment Portfolio excluding Securities Lending Collateral and Cash
Equivalents) | | 12/31/20 | | | 12/31/19 | |
| Information Technology | | | 27% | | | | 21% | |
| Health Care | | | 17% | | | | 15% | |
| Financials | | | 15% | | | | 20% | |
| Consumer Discretionary | | | 11% | | | | 11% | |
| Communication Services | | | 11% | | | | 8% | |
| Industrials | | | 8% | | | | 10% | |
| Consumer Staples | | | 7% | | | | 7% | |
| Materials | | | 3% | | | | 4% | |
| Energy | | | 1% | | | | 3% | |
| Real Estate | | | — | | | | 1% | |
| | | | 100% | | | | 100% | |
| | |
Geographical Diversification (As a % of Investment Portfolio excluding Securities Lending Collateral
and Cash Equivalents) | | 12/31/20 | | | 12/31/19 | |
| United States | | | 57% | | | | 52% | |
| China | | | 7% | | | | 7% | |
| Germany | | | 6% | | | | 9% | |
| Canada | | | 5% | | | | 7% | |
| Switzerland | | | 5% | | | | 5% | |
| Japan | | | 4% | | | | 4% | |
| France | | | 3% | | | | 4% | |
| United Kingdom | | | 3% | | | | 3% | |
| Ireland | | | 3% | | | | 3% | |
| Sweden | | | 2% | | | | 1% | |
| Argentina | | | 2% | | | | 2% | |
| Other | | | 3% | | | | 3% | |
| | | | 100% | | | | 100% | |
Portfolio holdings and characteristics are subject to change.
For more complete details about the Fund’s investment portfolio, see page 7.
Following the Fund’s fiscal first and third quarter-end, a complete portfolio holdings listing is posted on dws.com, and is available free of charge by contacting your financial intermediary, or if you are a direct investor, by calling (800) 728-3337. In addition, the portfolio holdings listing is filed with the SEC on the Fund’s Form N-PORT and will be available on the SEC’s Web site at sec.gov. Additional portfolio holdings for the Fund are also posted on dws.com from time to time. Please see the Fund’s current prospectus for more information.
| | | | | | |
| | 6 | | | | | | Deutsche DWS Variable Series II — DWS Global Equity VIP |
| | |
| Investment Portfolio | | as of December 31, 2020 |
| | | | | | | | |
| | | Shares | | | Value ($) | |
| Common Stocks 98.9% | | | | | | | | |
| Argentina 1.9% | |
Globant SA*
(Cost $140,221) | | | 2,720 | | | | 591,899 | |
|
| Brazil 1.0% | |
Pagseguro Digital Ltd. “A”*
(Cost $222,301) | | | 5,800 | | | | 329,904 | |
|
| Canada 5.1% | |
| | |
Agnico Eagle Mines Ltd. | | | 4,650 | | | | 327,872 | |
| | |
Alimentation Couche-Tard, Inc. “B” | | | 10,340 | | | | 352,384 | |
| | |
Brookfield Asset Management, Inc. “A” | | | 22,840 | | | | 944,175 | |
| | | | | | | | |
(Cost $638,294) | | | | 1,624,431 | |
|
| China 6.8% | |
| | |
Alibaba Group Holding Ltd. (ADR)* | | | 2,400 | | | | 558,552 | |
| | |
New Oriental Education & Technology Group, Inc. (ADR)* | | | 1,490 | | | | 276,857 | |
| | |
Ping An Insurance (Group) Co. of China Ltd. “H” | | | 41,500 | | | | 509,754 | |
| | |
Tencent Holdings Ltd. | | | 11,200 | | | | 813,563 | |
| | | | | | | | |
(Cost $1,107,564) | | | | 2,158,726 | |
|
| France 3.4% | |
| | |
Cie de St-Gobain SA* | | | 5,400 | | | | 249,154 | |
| | |
LVMH Moet Hennessy Louis Vuitton SE | | | 275 | | | | 171,674 | |
| | |
Schneider Electric SE | | | 971 | | | | 140,956 | |
| | |
TOTAL SE | | | 4,000 | | | | 172,590 | |
| | |
VINCI SA | | | 3,450 | | | | 343,708 | |
| | | | | | | | |
(Cost $981,501) | | | | 1,078,082 | |
|
| Germany 6.0% | |
| | |
adidas AG* | | | 485 | | | | 177,118 | |
| | |
Allianz SE (Registered) | | | 2,055 | | | | 504,458 | |
| | |
Deutsche Boerse AG | | | 3,650 | | | | 621,988 | |
| | |
Evonik Industries AG | | | 5,530 | | | | 180,842 | |
| | |
Fresenius Medical Care AG & Co. KGaA | | | 5,055 | | | | 428,291 | |
| | | | | | | | |
(Cost $1,432,327) | | | | 1,912,697 | |
|
| Ireland 2.9% | |
| | |
Experian PLC | | | 11,041 | | | | 419,442 | |
| | |
Kerry Group PLC “A” (a) | | | 49 | | | | 7,101 | |
| | |
Kerry Group PLC “A” (a) | | | 3,451 | | | | 500,151 | |
| | | | | | | | |
(Cost $484,487) | | | | 926,694 | |
|
| Japan 3.6% | |
| | |
Kao Corp. | | | 2,800 | | | | 216,126 | |
| | |
Keyence Corp. | | | 1,200 | | | | 675,410 | |
| | |
SMC Corp. | | | 435 | | | | 265,729 | |
| | | | | | | | |
(Cost $691,434) | | | | 1,157,265 | |
|
| Luxembourg 0.9% | |
Eurofins Scientific SE*
(Cost $77,647) | | | 3,600 | | | | 302,750 | |
|
| Singapore 0.9% | |
DBS Group Holdings Ltd.
(Cost $279,300) | | | 15,200 | | | | 288,575 | |
| | | | | | | | |
| | | Shares | | | Value ($) | |
|
| Sweden 1.9% | |
| | |
Assa Abloy AB “B” | | | 6,700 | | | | 165,388 | |
| | |
Spotify Technology SA* (b) | | | 1,445 | | | | 454,684 | |
| | | | | | | | |
(Cost $343,592) | | | | 620,072 | |
|
| Switzerland 5.0% | |
| | |
Lonza Group AG (Registered) | | | 1,524 | | | | 982,594 | |
| | |
Nestle SA (Registered) | | | 5,185 | | | | 611,332 | |
| | | | | | | | |
(Cost $404,923) | | | | 1,593,926 | |
|
| United Kingdom 3.3% | |
| | |
Aon PLC “A” (b) | | | 1,500 | | | | 316,905 | |
| | |
Compass Group PLC | | | 8,360 | | | | 155,666 | |
| | |
Halma PLC | | | 8,200 | | | | 275,112 | |
| | |
Spirax-Sarco Engineering PLC | | | 1,950 | | | | 302,324 | |
| | | | | | | | |
(Cost $447,073) | | | | 1,050,007 | |
|
| United States 56.2% | |
| | |
Activision Blizzard, Inc. | | | 6,311 | | | | 585,976 | |
| | |
Alphabet, Inc. “A”* | | | 450 | | | | 788,688 | |
| | |
Amazon.com, Inc.* | | | 141 | | | | 459,227 | |
| | |
AMETEK, Inc. | | | 4,195 | | | | 507,343 | |
| | |
Amphenol Corp. “A” | | | 5,600 | | | | 732,312 | |
| | |
Apple, Inc. | | | 4,620 | | | | 613,028 | |
| | |
Applied Materials, Inc. | | | 5,750 | | | | 496,225 | |
| | |
AZEK Co., Inc.* | | | 4,300 | | | | 165,335 | |
| | |
Becton, Dickinson & Co. | | | 1,171 | | | | 293,008 | |
| | |
Certara, Inc.* | | | 1,408 | | | | 47,478 | |
| | |
ContextLogic, Inc. “A”* (c) | | | 4,860 | | | | 88,646 | |
| | |
Danaher Corp. | | | 4,980 | | | | 1,106,257 | |
| | |
DexCom, Inc.* | | | 760 | | | | 280,987 | |
| | |
Ecolab, Inc. | | | 2,280 | | | | 493,301 | |
| | |
EPAM Systems, Inc.* | | | 1,800 | | | | 645,030 | |
| | |
Exact Sciences Corp.* | | | 2,005 | | | | 265,642 | |
| | |
Fiserv, Inc.* | | | 4,400 | | | | 500,984 | |
| | |
Hologic, Inc.* | | | 3,500 | | | | 254,905 | |
| | |
Intuit, Inc. | | | 1,050 | | | | 398,843 | |
| | |
Johnson & Johnson | | | 1,700 | | | | 267,546 | |
| | |
JPMorgan Chase & Co. | | | 4,550 | | | | 578,168 | |
| | |
LivePerson, Inc.* | | | 1,600 | | | | 99,568 | |
| | |
MasterCard, Inc. “A” | | | 1,740 | | | | 621,076 | |
| | |
Match Group, Inc.* | | | 1,905 | | | | 288,017 | |
| | |
McDonald’s Corp. | | | 1,800 | | | | 386,244 | |
| | |
Microsoft Corp. | | | 4,640 | | | | 1,032,029 | |
| | |
Mondelez International, Inc. “A” | | | 8,435 | | | | 493,194 | |
| | |
NVIDIA Corp. | | | 1,130 | | | | 590,086 | |
| | |
PPD, Inc* | | | 9,800 | | | | 335,356 | |
| | |
Progressive Corp. | | | 9,700 | | | | 959,136 | |
| | |
Quidel Corp.* | | | 955 | | | | 171,566 | |
| | |
RingCentral, Inc. “A”* | | | 550 | | | | 208,434 | |
| | |
Schlumberger NV | | | 6,700 | | | | 146,261 | |
| | |
ServiceNow, Inc.* | | | 1,375 | | | | 756,841 | |
| | |
T-Mobile U.S., Inc.* | | | 3,000 | | | | 404,550 | |
| | |
Terminix Global Holdings, Inc.* | | | 8,100 | | | | 413,181 | |
| | |
TJX Companies, Inc. | | | 4,731 | | | | 323,080 | |
| | |
Vroom, Inc.* | | | 4,000 | | | | 163,880 | |
| | |
YETI Holdings, Inc.* | | | 6,800 | | | | 465,596 | |
| | |
Zoetis, Inc. | | | 3,260 | | | | 539,530 | |
| | | | | | | | |
| |
(Cost $8,390,740) | | | | 17,966,554 | |
Total Common Stocks (Cost $15,641,404) | | | | 31,601,582 | |
The accompanying notes are an integral part of the financial statements.
| | | | |
Deutsche DWS Variable Series II — DWS Global Equity VIP | | | | | 7 |
| | | | | | | | |
| | | Shares | | | Value ($) | |
|
Securities Lending Collateral 0.4% | |
DWS Government & Agency Securities Portfolio “DWS Government Cash Institutional Shares”, 0.03% (d) (e)
(Cost $117,216) | | | 117,216 | | | | 117,216 | |
| | |
| Cash Equivalents 0.9% | | | | | | | | |
DWS Central Cash Management Government Fund, 0.08% (d)
(Cost $302,262) | | | 302,262 | | | | 302,262 | |
| | |
| | | % of
Net Assets | | | Value ($) | |
Total Investment Portfolio
(Cost $16,060,882) | | | 100.2 | | | | 32,021,060 | |
| Other Assets and Liabilities, Net | | | (0.2 | ) | | | (76,607 | ) |
| Net Assets | | | 100.0 | | | | 31,944,453 | |
A summary of the Fund’s transactions with affiliated investments during the year ended December 31, 2020 are as follows:
| | | | | | | | | | | | | | | | | | | | | | | | | | | | | | | | |
Value ($) at
12/31/2019 | | Purchases
Cost ($) | | | Sales
Proceeds ($) | | | Net
Realized
Gain/
(Loss) ($) | | | Net Change in
Unrealized
Appreciation
(Depreciation) ($) | | | Income ($) | | | Capital Gain
Distributions ($) | | | Number
of Shares
at
12/31/2020 | | | Value ($)
at
12/31/2020 | |
Securities Lending Collateral 0.4% | | | | | | | | | | | | | | | | | |
DWS Government & Agency Securities Portfolio “DWS Government Cash Institutional Shares”, 0.03% (d) (e) | |
| 836,078 | | | — | | | | 718,862 | (f) | | | — | | | | — | | | | 6,859 | | | | — | | | | 117,216 | | | | 117,216 | |
Cash Equivalents 0.9% | |
DWS Central Cash Management Government Fund, 0.08% (d) | |
| 364,206 | | | 5,341,887 | | | | 5,403,831 | | | | — | | | | — | | | | 1,093 | | | | — | | | | 302,262 | | | | 302,262 | |
| 1,200,284 | | | 5,341,887 | | | | 6,122,693 | | | | — | | | | — | | | | 7,952 | | | | — | | | | 419,478 | | | | 419,478 | |
| * | Non-income producing security. |
| (a) | Securities with the same description are the same corporate entity but trade on different stock exchanges. |
| (b) | Listed on the New York Stock Exchange. |
| (c) | All or a portion of these securities were on loan. In addition, “Other Assets and Liabilities, Net” may include pending sales that are also on loan. The value of securities loaned at December 31, 2020 amounted to $118,778, which is 0.4% of net assets. |
| (d) | Affiliated fund managed by DWS Investment Management Americas, Inc. The rate shown is the annualized seven-day yield at period end. |
| (e) | Represents cash collateral held in connection with securities lending. Income earned by the Fund is net of borrower rebates. |
| (f) | Represents the net increase (purchase cost) or decrease (sales proceeds) in the amount invested in cash collateral for the year ended December 31, 2020. |
ADR: American Depositary Receipt
The accompanying notes are an integral part of the financial statements.
| | | | | | |
| | 8 | | | | | | Deutsche DWS Variable Series II — DWS Global Equity VIP |
Fair Value Measurements
Various inputs are used in determining the value of the Fund’s investments. These inputs are summarized in three broad levels. Level 1 includes quoted prices in active markets for identical securities. Level 2 includes other significant observable inputs (including quoted prices for similar securities, interest rates, prepayment speeds and credit risk). Level 3 includes significant unobservable inputs (including the Fund’s own assumptions in determining the fair value of investments). The level assigned to the securities valuations may not be an indication of the risk or liquidity associated with investing in those securities.
The following is a summary of the inputs used as of December 31, 2020 in valuing the Fund’s investments. For information on the Fund’s policy regarding the valuation of investments, please refer to the Security Valuation section of Note A in the accompanying Notes to Financial Statements.
| | | | | | | | | | | | | | | | |
| Assets | | Level 1 | | | Level 2 | | | Level 3 | | | Total | |
| Common Stocks | | | | | | | | | | | | | | | | |
Argentina | | $ | 591,899 | | | $ | — | | | $ | — | | | $ | 591,899 | |
Brazil | | | 329,904 | | | | — | | | | — | | | | 329,904 | |
Canada | | | 1,624,431 | | | | — | | | | — | | | | 1,624,431 | |
China | | | 835,409 | | | | 1,323,317 | | | | — | | | | 2,158,726 | |
France | | | — | | | | 1,078,082 | | | | — | | | | 1,078,082 | |
Germany | | | — | | | | 1,912,697 | | | | — | | | | 1,912,697 | |
Ireland | | | — | | | | 926,694 | | | | — | | | | 926,694 | |
Japan | | | — | | | | 1,157,265 | | | | — | | | | 1,157,265 | |
Luxembourg | | | — | | | | 302,750 | | | | — | | | | 302,750 | |
Singapore | | | — | | | | 288,575 | | | | — | | | | 288,575 | |
Sweden | | | 454,684 | | | | 165,388 | | | | — | | | | 620,072 | |
Switzerland | | | — | | | | 1,593,926 | | | | — | | | | 1,593,926 | |
United Kingdom | | | 316,905 | | | | 733,102 | | | | — | | | | 1,050,007 | |
United States | | | 17,966,554 | | | | — | | | | — | | | | 17,966,554 | |
| Short-Term Investments (g) | | | 419,478 | | | | — | | | | — | | | | 419,478 | |
| Total | | $ | 22,539,264 | | | $ | 9,481,796 | | | $ | — | | | $ | 32,021,060 | |
| (g) | See Investment Portfolio for additional detailed categorizations. |
The accompanying notes are an integral part of the financial statements.
| | | | |
Deutsche DWS Variable Series II — DWS Global Equity VIP | | | | | 9 |
| | | | |
Statement of
Assets and Liabilities | |
| as of December 31, 2020 | | | | |
| |
| Assets | | | | |
| Investments in non-affiliated securities, at value (cost $15,641,404) — including $118,778 of securities loaned | | $ | 31,601,582 | |
| Investment in DWS Government & Agency Securities Portfolio (cost $117,216)* | | | 117,216 | |
| Investment in DWS Central Cash Management Government Fund (cost $302,262) | | | 302,262 | |
| Foreign currency, at value (cost $114,598) | | | 116,524 | |
| Receivable for investments sold | | | 32,435 | |
| Receivable for Fund shares sold | | | 45 | |
| Dividends receivable | | | 9,487 | |
| Interest receivable | | | 327 | |
| Foreign taxes recoverable | | | 7,375 | |
| Other assets | | | 593 | |
| Total assets | | | 32,187,846 | |
| |
| Liabilities | | | | |
| Cash overdraft | | | 32,435 | |
| Payable upon return of securities loaned | | | 117,216 | |
| Payable for Fund shares redeemed | | | 3,011 | |
| Accrued management fee | | | 13,315 | |
| Accrued Trustees’ fees | | | 822 | |
| Other accrued expenses and payables | | | 76,594 | |
| Total liabilities | | | 243,393 | |
| Net assets, at value | | | 31,944,453 | |
| |
| Net Assets Consist of | | | | |
| Distributable earnings (loss) | | | 17,384,773 | |
| Paid-in capital | | | 14,559,680 | |
| Net assets, at value | | | 31,944,453 | |
| |
| Net Asset Value | | | | |
Class A | | | | |
| |
| Net asset value, offering and redemption price per share ($31,944,453 ÷ 2,081,012 outstanding shares of beneficial interest, no par value, unlimited number of shares authorized) | | $ | 15.35 | |
| * | Represents collateral on securities loaned. |
| | | | |
Statement of Operations | |
| for the year ended December 31, 2020 | |
| |
| Investment Income | | | | |
| Income: | | | | |
| Dividends (net of foreign taxes withheld of $18,732) | | $ | 341,401 | |
| Income distributions — DWS Central Cash Management Government Fund | | | 1,093 | |
| Securities lending income, net of borrower rebates | | | 6,859 | |
| Total income | | | 349,353 | |
| Expenses: | | | | |
| Management fee | | | 186,533 | |
| Administration fee | | | 27,987 | |
| Services to shareholders | | | 179 | |
| Custodian fee | | | 6,799 | |
| Professional fees | | | 72,955 | |
| Reports to shareholders | | | 28,283 | |
| Trustees’ fees and expenses | | | 2,956 | |
| Other | | | 6,886 | |
| Total expenses before expense reductions | | | 332,578 | |
| Expense reductions | | | (91,520 | ) |
| Total expenses after expense reductions | | | 241,058 | |
| Net investment income | | | 108,295 | |
| |
| Realized and Unrealized Gain (Loss) | | | | |
| Net realized gain (loss) from: | | | | |
| Investments | |
| 1,392,461
|
|
| Foreign currency | | | 2,207 | |
| | | | 1,394,668 | |
| Change in net unrealized appreciation (depreciation) on: | | | | |
| Investments | | | 4,804,272 | |
| Foreign currency | | | 3,440 | |
| | | | 4,807,712 | |
| Net gain (loss) | | | 6,202,380 | |
| Net increase (decrease) in net assets resulting from operations | | $ | 6,310,675 | |
The accompanying notes are an integral part of the financial statements.
| | | | | | |
| | 10 | | | | | | Deutsche DWS Variable Series II — DWS Global Equity VIP |
| | | | |
| Statements of Changes in Net Assets | | | | |
| | | | | | | | |
| | | Years Ended December 31, | |
| Increase (Decrease) in Net Assets | | 2020 | | | 2019 | |
| Operations: | | | | | | | | |
| Net investment income (loss) | | $ | 108,295 | | | $ | 197,722 | |
| Net realized gain (loss) | | | 1,394,668 | | | | 987,156 | |
| Change in net unrealized appreciation (depreciation) | | | 4,807,712 | | | | 7,411,902 | |
| Net increase (decrease) in net assets resulting from operations | | | 6,310,675 | | | | 8,596,780 | |
| Distributions to shareholders: | | | | | | | | |
| Class A | | | (1,173,276 | ) | | | (2,329,682 | ) |
| | | | (1,173,276 | ) | | | (2,329,682 | ) |
| Fund share transactions: | | | | | | | | |
Class A | | | | | | | | |
| Proceeds from shares sold | | | 850,800 | | | | 1,084,314 | |
| Reinvestment of distributions | | | 1,173,276 | | | | 2,329,682 | |
| Payments for shares redeemed | | | (5,118,359 | ) | | | (4,708,430 | ) |
| Net increase (decrease) in net assets from Class A share transactions | | | (3,094,283 | ) | | | (1,294,434 | ) |
| Increase (decrease) in net assets | | | 2,043,116 | | | | 4,972,664 | |
| Net assets at beginning of period | | | 29,901,337 | | | | 24,928,673 | |
| | |
| Net assets at end of period | | | 31,944,453 | | | | 29,901,337 | |
| | |
| Other Information | | | | | | | | |
Class A | | | | | | | | |
| Shares outstanding at beginning of period | | | 2,310,277 | | | | 2,415,204 | |
| Shares sold | | | 63,092 | | | | 87,985 | |
| Shares issued to shareholders in reinvestment of distributions | | | 107,739 | | | | 200,144 | |
| Shares redeemed | | | (400,096 | ) | | | (393,056 | ) |
| Net increase (decrease) in Class A shares | | | (229,265 | ) | | | (104,927 | ) |
| | |
| Shares outstanding at end of period | | | 2,081,012 | | | | 2,310,277 | |
The accompanying notes are an integral part of the financial statements.
| | | | |
Deutsche DWS Variable Series II — DWS Global Equity VIP | | | | | 11 |
Financial Highlights
| | | | | | | | | | | | | | | | | | | | |
| DWS Global Equity VIP — Class A | | | | | | | | | | | | | | | |
| | | Years Ended December 31, | |
| | | 2020 | | | 2019 | | | 2018 | | | 2017 | | | 2016 | |
| | | | | |
| Selected Per Share Data | | | | | | | | | | | | | | | | | | | | |
| Net asset value, beginning of period | | | $12.94 | | | $ | 10.32 | | | | $11.70 | | | | $9.48 | | | $ | 9.00 | |
| Income (loss) from investment operations: | | | | | | | | | | | | | | | | | | | | |
| | | | | |
Net investment incomea | | | .05 | | | | .08 | | | | .06 | | | | .05 | | | | .04 | |
Net realized and unrealized gain (loss) | | | 2.90 | �� | | | 3.55 | | | | (1.35 | ) | | | 2.22 | | | | .51 | |
Total from investment operations | | | 2.95 | | | | 3.63 | | | | (1.29 | ) | | | 2.27 | | | | .55 | |
| Less distributions from: | | | | | | | | | | | | | | | | | | | | |
| | | | | |
Net investment income | | | (.09 | ) | | | (.06 | ) | | | (.09 | ) | | | (.05 | ) | | | (.07 | ) |
Net realized gains | | | (.45 | ) | | | (.95 | ) | | | — | | | | — | | | | — | |
Total distributions | | | (.54 | ) | | | (1.01 | ) | | | (.09 | ) | | | (.05 | ) | | | (.07 | ) |
| Net asset value, end of period | | | $15.35 | | | $ | 12.94 | | | | $10.32 | | | $ | 11.70 | | | $ | 9.48 | |
| Total Return (%)b | | | 24.52 | | | | 36.26 | | | | (11.12 | ) | | | 24.04 | | | | 6.11 | c |
| | | | | |
| Ratios to Average Net Assets and Supplemental Data | | | | | | | | | | | | | | | | | | | | |
| Net assets, end of period ($ millions) | | | 32 | | | | 30 | | | | 25 | | | | 31 | | | | 43 | |
| Ratio of expenses before expense reductions (%)d | | | 1.16 | | | | 1.22 | | | | 1.22 | | | | 1.06 | | | | 1.03 | |
| Ratio of expenses after expense reductions (%)d | | | .84 | | | | .88 | | | | .92 | | | | .95 | | | | .95 | |
| Ratio of net investment income (%) | | | .38 | | | | .69 | | | | .51 | | | | .49 | | | | .49 | |
| Portfolio turnover rate (%) | | | 13 | | | | 12 | | | | 43 | | | | 19 | | | | 46 | |
| a | Based on average shares outstanding during the period. |
| b | Total return would have been lower had certain expenses not been reimbursed. |
| c | Includes a reimbursement by the Advisor for a realized loss on a trade executed incorrectly, which otherwise would have reduced total return by 0.31%. |
| d | Expense ratio does not reflect charges and fees associated with the separate account that invests in the Fund or any variable life insurance policy or variable annuity contract for which the Fund is an investment option. |
The accompanying notes are an integral part of the financial statements.
| | | | | | |
| | 12 | | | | | | Deutsche DWS Variable Series II — DWS Global Equity VIP |
| | |
| Notes to Financial Statements | | |
A. Organization and Significant Accounting Policies
DWS Global Equity VIP (the “Fund”) is a diversified series of Deutsche DWS Variable Series II (the “Trust”), which is registered under the Investment Company Act of 1940, as amended (the “1940 Act”), as an open-end management investment company organized as a Massachusetts business trust.
The Fund’s financial statements are prepared in accordance with accounting principles generally accepted in the United States of America (“U.S. GAAP”) which require the use of management estimates. Actual results could differ from those estimates. The Fund qualifies as an investment company under Topic 946 of Accounting Standards Codification of U.S. GAAP. The policies described below are followed consistently by the Fund in the preparation of its financial statements.
Security Valuation. Investments are stated at value determined as of the close of regular trading on the New York Stock Exchange on each day the exchange is open for trading.
Various inputs are used in determining the value of the Fund’s investments. These inputs are summarized in three broad levels. Level 1 includes quoted prices in active markets for identical securities. Level 2 includes other significant observable inputs (including quoted prices for similar securities, interest rates, prepayment speeds and credit risk). Level 3 includes significant unobservable inputs (including the Fund’s own assumptions in determining the fair value of investments). The level assigned to the securities valuations may not be an indication of the risk or liquidity associated with investing in those securities.
Equity securities are valued at the most recent sale price or official closing price reported on the exchange (U.S. or foreign) or over-the-counter market on which they trade. Securities for which no sales are reported are valued at the calculated mean between the most recent bid and asked quotations on the relevant market or, if a mean cannot be determined, at the most recent bid quotation. Equity securities are generally categorized as Level 1. For certain international equity securities, in order to adjust for events which may occur between the close of the foreign exchanges and the close of the New York Stock Exchange, a fair valuation model may be used. This fair valuation model takes into account comparisons to the valuation of American Depository Receipts (ADRs), futures contracts and certain indices and these securities are categorized as Level 2.
Investments in open-end investment companies are valued at their net asset value each business day and are categorized as Level 1.
Securities and other assets for which market quotations are not readily available or for which the above valuation procedures are deemed not to reflect fair value are valued in a manner that is intended to reflect their fair value as determined in accordance with procedures approved by the Board and are generally categorized as Level 3. In accordance with the Fund’s valuation procedures, factors considered in determining value may include, but are not limited to, the type of the security; the size of the holding; the initial cost of the security; the existence of any contractual restrictions on the security’s disposition; the price and extent of public trading in similar securities of the issuer or of comparable companies; quotations or evaluated prices from broker-dealers and/or pricing services; information obtained from the issuer, analysts, and/or the appropriate stock exchange (for exchange-traded securities); an analysis of the company’s or issuer’s financial statements; an evaluation of the forces that influence the issuer and the market(s) in which the security is purchased and sold; and with respect to debt securities, the maturity, coupon, creditworthiness, currency denomination and the movement of the market in which the security is normally traded. The value determined under these procedures may differ from published values for the same securities.
Disclosure about the classification of fair value measurements is included in a table following the Fund’s Investment Portfolio.
Securities Lending. Deutsche Bank AG, as lending agent, lends securities of the Fund to certain financial institutions under the terms of its securities lending agreement. During the term of the loans, the Fund continues to receive interest and dividends generated by the securities and to participate in any changes in their market value. The Fund requires the borrowers of the securities to maintain collateral with the Fund consisting of either cash or liquid, unencumbered assets having a value at least equal to the value of the securities loaned. When the collateral falls below specified amounts, the lending agent will use its best effort to obtain additional collateral on the next business day to meet required amounts under the securities lending agreement. As of period end, any securities on loan were collateralized by cash. During the year ended December 31, 2020, the Fund invested the cash collateral into a joint trading account in DWS Government &
| | | | |
Deutsche DWS Variable Series II — DWS Global Equity VIP | | | | | 13 |
Agency Securities Portfolio, an affiliated money market fund managed by DWS Investment Management Americas, Inc. DWS Investment Management Americas, Inc. receives a management/administration fee (0.06% annualized effective rate as of December 31, 2020) on the cash collateral invested in DWS Government & Agency Securities Portfolio. The Fund receives compensation for lending its securities either in the form of fees or by earning interest on invested cash collateral net of borrower rebates and fees paid to a lending agent. Either the Fund or the borrower may terminate the loan at any time, and the borrower, after notice, is required to return borrowed securities within a standard time period. There may be risks of delay and costs in recovery of securities or even loss of rights in the collateral should the borrower of the securities fail financially. If the Fund is not able to recover securities lent, the Fund may sell the collateral and purchase a replacement investment in the market, incurring the risk that the value of the replacement security is greater than the value of the collateral. The Fund is also subject to all investment risks associated with the reinvestment of any cash collateral received, including, but not limited to, interest rate, credit and liquidity risk associated with such investments.
As of December 31, 2020, the Fund had securities on loan, which were classified as common stocks in the Investment Portfolio. Due to the increased market values of securities on loan on December 31, 2020, the value of the related collateral was less than the value of securities on loan at period end. On the next business day, additional collateral was received, and the value of collateral exceeded the value of the securities on loan. As of period end, the remaining contractual maturity of the collateral agreements was overnight and continuous.
Foreign Currency Translations. The books and records of the Fund are maintained in U.S. dollars. Investment securities and other assets and liabilities denominated in a foreign currency are translated into U.S. dollars at the prevailing exchange rates at period end. Purchases and sales of investment securities, income and expenses are translated into U.S. dollars at the prevailing exchange rates on the respective dates of the transactions.
Net realized and unrealized gains and losses on foreign currency transactions represent net gains and losses between trade and settlement dates on securities transactions, the acquisition and disposition of foreign currencies, and the difference between the amount of net investment income accrued and the U.S. dollar amount actually received. The portion of both realized and unrealized gains and losses on investments that results from fluctuations in foreign currency exchange rates is not separately disclosed but is included with net realized and unrealized gain/appreciation and loss/depreciation on investments.
Taxes. The Fund’s policy is to comply with the requirements of the Internal Revenue Code, as amended, which are applicable to regulated investment companies, and to distribute all of its taxable income to its shareholders.
Additionally, the Fund may be subject to taxes imposed by the governments of countries in which it invests and are generally based on income and/or capital gains earned or repatriated, a portion of which may be recoverable. Based upon the current interpretation of the tax rules and regulations, estimated tax liabilities and recoveries on certain foreign securities are recorded on an accrual basis and are reflected as components of interest income or net change in unrealized gain/loss on investments. Tax liabilities realized as a result of security sales are reflected as a component of net realized gain/loss on investments.
The Fund has reviewed the tax positions for the open tax years as of December 31, 2020 and has determined that no provision for income tax and/or uncertain tax positions is required in the Fund’s financial statements. The Fund’s federal tax returns for the prior three fiscal years remain open subject to examination by the Internal Revenue Service.
Distribution of Income and Gains. Distributions from net investment income of the Fund, if any, are declared and distributed to shareholders annually. Net realized gains from investment transactions, in excess of available capital loss carryforwards, would be taxable to the Fund if not distributed and, therefore, will be distributed to shareholders at least annually. The Fund may also make additional distributions for tax purposes if necessary.
The timing and characterization of certain income and capital gain distributions are determined annually in accordance with federal tax regulations, which may differ from accounting principles generally accepted in the United States of America. These differences primarily relate to investments in foreign denominated investments and certain securities sold at a loss. As a result, net investment income (loss) and net realized gain (loss) on investment transactions for a reporting period may differ significantly from distributions during such period. Accordingly, the Fund may periodically make reclassifications among certain of its capital accounts without impacting the net asset value of the Fund.
| | | | | | |
| | 14 | | | | | | Deutsche DWS Variable Series II — DWS Global Equity VIP |
At December 31, 2020, the Fund’s components of distributable earnings on a tax basis were as follows:
| | | | |
| Undistributed ordinary income* | | $ | 112,997 | |
| Undistributed long-term capital gains | | $ | 1,365,388 | |
| Net unrealized appreciation (depreciation) on investments | | $ | 15,903,745 | |
At December 31, 2020, the aggregate cost of investments for federal income tax purposes was $16,117,315. The net unrealized appreciation for all investments based on tax cost was $15,903,745. This consisted of aggregate gross unrealized appreciation for all investments for which there was an excess of value over tax cost of $16,238,771 and aggregate gross unrealized depreciation for all investments for which there was an excess of tax cost over value of $335,026.
In addition, the tax character of distributions paid by the Fund is summarized as follows:
| | | | | | | | |
| | | Years Ended December 31, | |
| | | 2020 | | | 2019 | |
| Distributions from ordinary income* | | $ | 483,878 | | | $ | 144,985 | |
| Distributions from long-term capital gains | | $ | 689,398 | | | $ | 2,184,697 | |
| * | For tax purposes, short-term capital gain distributions are considered ordinary income distributions. |
Expenses. Expenses of the Trust arising in connection with a specific fund are allocated to that fund. Other Trust expenses which cannot be directly attributed to a fund are apportioned among the funds in the Trust based upon the relative net assets or other appropriate measures.
Contingencies. In the normal course of business, the Fund may enter into contracts with service providers that contain general indemnification clauses. The Fund’s maximum exposure under these arrangements is unknown, as this would involve future claims that may be made against the Fund that have not yet been made. However, based on experience, the Fund expects the risk of loss to be remote.
Other. Investment transactions are accounted for on a trade date plus one basis for daily net asset value calculations. However, for financial reporting purposes, investment transactions are reported on trade date. Interest income is recorded on the accrual basis. Dividend income is recorded on the ex-dividend date net of foreign withholding taxes. Certain dividends from foreign securities may be recorded subsequent to the ex-dividend date as soon as the Fund is informed of such dividends. Realized gains and losses from investment transactions are recorded on an identified cost basis. Proceeds from litigation payments, if any, are included in net realized gain (loss) from investments.
B. Purchases and Sales of Securities
During the year ended December 31, 2020, purchases and sales of investment transactions (excluding short-term investments) aggregated $3,602,234 and $7,808,353, respectively.
C. Related Parties
Management Agreement. Under the Investment Management Agreement with DWS Investment Management Americas, Inc. (“DIMA” or the “Advisor”), an indirect, wholly owned subsidiary of DWS Group GmbH & Co. KGaA (“DWS Group”), the Advisor directs the investments of the Fund in accordance with its investment objectives, policies and restrictions. The Advisor determines the securities, instruments and other contracts relating to investments to be purchased, sold or entered into by the Fund.
Pursuant to the Investment Management Agreement with the Advisor, the Fund pays a monthly management fee based on the Fund’s average daily net assets, computed and accrued daily and payable monthly, at the following annual rates:
| | | | |
| First $1.5 billion | | | .650 | % |
| Next $1.75 billion | | | .635 | % |
| Next $1.75 billion | | | .620 | % |
| Over $5 billion | | | .605 | % |
Accordingly, for the year ended December 31, 2020, the fee pursuant to the Investment Management Agreement was equivalent to an annual rate (exclusive of any applicable waivers/reimbursements) of 0.65% of the Fund’s average daily net assets.
| | | | |
Deutsche DWS Variable Series II — DWS Global Equity VIP | | | | | 15 |
For the period from January 1, 2020 through April 30, 2021, the Advisor has contractually agreed to waive its fee and/or reimburse certain operating expenses to the extent necessary to maintain the total annual operating expenses (excluding certain expenses such as extraordinary expenses, taxes, brokerage and interest expense) of Class A shares at 0.84%.
For the year ended December 31, 2020, fees waived and/or expenses reimbursed were $91,520.
Administration Fee. Pursuant to an Administrative Services Agreement, DIMA provides most administrative services to the Fund. Prior to March 1, 2020, for all services provided under the Administrative Services Agreement, the Fund paid DIMA an annual fee (“Administration Fee”) of 0.10% of the Fund’s average daily net assets, computed and accrued daily and payable monthly. Effective March 1, 2020, for all services provided under the Administrative Services Agreement, the Fund pays the Advisor an annual Administration Fee of 0.097% of the Fund’s average daily net assets, computed and accrued daily and payable monthly. For the year ended December 31, 2020, the Administration Fee was $27,987, of which $2,584 is unpaid.
Service Provider Fees. DWS Service Company (“DSC”), an affiliate of the Advisor, is the transfer agent, dividend-paying agent and shareholder service agent for the Fund. Pursuant to a sub-transfer agency agreement between DSC and DST Systems, Inc. (“DST”), DSC has delegated certain transfer agent, dividend-paying agent and shareholder service agent functions to DST. DSC compensates DST out of the shareholder servicing fee it receives from the Fund. For the year ended December 31, 2020, the amounts charged to the Fund by DSC aggregated $91, of which $16 is unpaid.
Other Service Fees. Under an agreement with the Fund, DIMA is compensated for providing certain pre-press and regulatory filing services to the Fund. For the year ended December 31, 2020, the amount charged to the Fund by DIMA included in the Statement of Operations under “Reports to shareholders” aggregated $8,945, of which $3,214 is unpaid.
Trustees’ Fees and Expenses. The Fund paid retainer fees to each Trustee not affiliated with the Advisor, plus specified amounts to the Board Chairperson and to each committee Chairperson.
Affiliated Cash Management Vehicles. The Fund may invest uninvested cash balances in DWS Central Cash Management Government Fund and DWS ESG Liquidity Fund, affiliated money market funds which are managed by the Advisor. Each affiliated money market fund is managed in accordance with Rule 2a-7 under the 1940 Act, which governs the quality, maturity, diversity and liquidity of instruments in which a money market fund may invest. DWS Central Cash Management Government Fund seeks to maintain a stable net asset value, and DWS ESG Liquidity Fund maintains a floating net asset value. The Fund indirectly bears its proportionate share of the expenses of each affiliated money market fund in which it invests. DWS Central Cash Management Government Fund does not pay the Advisor an investment management fee. To the extent that DWS ESG Liquidity Fund pays an investment management fee to the Advisor, the Advisor will waive an amount of the investment management fee payable to the Advisor by the Fund equal to the amount of the investment management fee payable on the Fund’s assets invested in DWS ESG Liquidity Fund.
Securities Lending Fees. Deutsche Bank AG serves as lending agent for the Fund. For the year ended December 31, 2020, the Fund incurred lending agent fees to Deutsche Bank AG in the amount of $517.
D. Ownership of the Fund
At December 31, 2020, one participating insurance company was owner of record of 10% or more of the total outstanding Class A shares of the Fund, owning 99%.
E. Line of Credit
The Fund and other affiliated funds (the “Participants”) share in a $350 million revolving credit facility provided by a syndication of banks. The Fund may borrow for temporary or emergency purposes, including the meeting of redemption requests that otherwise might require the untimely disposition of securities. The Participants are charged an annual commitment fee, which is allocated based on net assets, among each of the Participants. Interest is calculated at a rate per annum equal to the sum of the Federal Funds Rate plus 1.25 percent plus if the one-month LIBOR exceeds the Federal Funds Rate, the amount of such excess. The Fund may borrow up to a maximum of 33 percent of its net assets under the agreement. The Fund had no outstanding loans at December 31, 2020.
| | | | | | |
| | 16 | | | | | | Deutsche DWS Variable Series II — DWS Global Equity VIP |
F. Other — COVID-19 Pandemic
A novel coronavirus known as COVID-19, declared a pandemic by the World Health Organization, has caused significant uncertainty, market volatility, decreased economic and other activity and increased government activity. Specifically, COVID-19 has led to significant death and morbidity, and concerns about its further spread have resulted in the closing of schools and non-essential businesses, cancellations, shelter-in place orders, lower consumer spending in certain sectors, social distancing, bans on large social gatherings and travel, quarantines, government economic stimulus measures, reduced productivity, rapid increases in unemployment, increased demand for and strain on government and medical resources, border closings and global trade and supply chain interruptions, among others. The full effects, duration and costs of the COVID-19 pandemic are impossible to predict, and the circumstances surrounding the COVID-19 pandemic will continue to evolve. The pandemic may affect certain countries, industries, economic sectors, companies and investment products more than others, may exacerbate existing economic, political, or social tensions and may increase the probability of an economic recession or depression. The Fund and its investments may be adversely affected by the effects of the COVID-19 pandemic, and a prolonged pandemic may result in the Fund and its service providers experiencing operational difficulties in coordinating a remote workforce and implementing their business continuity plans, among others. Management will continue to monitor the impact COVID-19 has on the Fund and reflect the consequences as appropriate in the Fund’s accounting and financial reporting.
| | | | |
Deutsche DWS Variable Series II — DWS Global Equity VIP | | | | | 17 |
Report of Independent Registered Public Accounting Firm
To the Board of Trustees of Deutsche DWS Variable Series II and Shareholders of DWS Global Equity VIP:
Opinion on the Financial Statements
We have audited the accompanying statement of assets and liabilities of DWS Global Equity VIP (the “Fund”) (one of the funds constituting Deutsche DWS Variable Series II) (the “Trust”), including the investment portfolio, as of December 31, 2020, and the related statement of operations for the year then ended, the statements of changes in net assets for each of the two years in the period then ended, the financial highlights for each of the five years in the period then ended and the related notes (collectively referred to as the “financial statements”). In our opinion, the financial statements present fairly, in all material respects, the financial position of the Fund (one of the funds constituting Deutsche DWS Variable Series II) at December 31, 2020, the results of its operations for the year then ended, the changes in its net assets for each of the two years in the period then ended and its financial highlights for each of the five years in the period then ended, in conformity with U.S. generally accepted accounting principles.
Basis for Opinion
These financial statements are the responsibility of the Trust’s management. Our responsibility is to express an opinion on the Fund’s financial statements based on our audits. We are a public accounting firm registered with the Public Company Accounting Oversight Board (United States) (“PCAOB”) and are required to be independent with respect to the Trust in accordance with the U.S. federal securities laws and the applicable rules and regulations of the Securities and Exchange Commission and the PCAOB.
We conducted our audits in accordance with the standards of the PCAOB. Those standards require that we plan and perform the audit to obtain reasonable assurance about whether the financial statements are free of material misstatement, whether due to error or fraud. The Trust is not required to have, nor were we engaged to perform, an audit of the Trust’s internal control over financial reporting. As part of our audits, we are required to obtain an understanding of internal control over financial reporting, but not for the purpose of expressing an opinion on the effectiveness of the Trust’s internal control over financial reporting. Accordingly, we express no such opinion.
Our audits included performing procedures to assess the risks of material misstatement of the financial statements, whether due to error or fraud, and performing procedures that respond to those risks. Such procedures included examining, on a test basis, evidence regarding the amounts and disclosures in the financial statements. Our procedures included confirmation of securities owned as of December 31, 2020, by correspondence with the custodian and others. Our audits also included evaluating the accounting principles used and significant estimates made by management, as well as evaluating the overall presentation of the financial statements. We believe that our audits provide a reasonable basis for our opinion.

We have served as the auditor of one or more investment companies in the DWS family of funds since at least 1979, but we are unable to determine the specific year.
Boston, Massachusetts
February 12, 2021
| | | | | | |
| | 18 | | | | | | Deutsche DWS Variable Series II — DWS Global Equity VIP |
| | |
| Information About Your Fund’s Expenses | | (Unaudited) |
As an investor of the Fund, you incur two types of costs: ongoing expenses and transaction costs. Ongoing expenses include management fees and other Fund expenses. Examples of transaction costs include contract charges, which are not shown in this section. The following tables are intended to help you understand your ongoing expenses (in dollars) of investing in the Fund and to help you compare these expenses with the ongoing expenses of investing in other mutual funds. In the most recent six-month period, the Fund limited these expenses; had it not done so, expenses would have been higher. The example in the table is based on an investment of $1,000 invested at the beginning of the six-month period and held for the entire period (July 1, 2020 to December 31, 2020).
The tables illustrate your Fund’s expenses in two ways:
| – | | Actual Fund Return. This helps you estimate the actual dollar amount of ongoing expenses (but not transaction costs) paid on a $1,000 investment in the Fund using the Fund’s actual return during the period. To estimate the expenses you paid over the period, simply divide your account value by $1,000 (for example, an $8,600 account value divided by $1,000 = 8.6), then multiply the result by the number in the “Expenses Paid per $1,000” line under the share class you hold. |
| – | | Hypothetical 5% Fund Return. This helps you to compare your Fund’s ongoing expenses (but not transaction costs) with those of other mutual funds using the Fund’s actual expense ratio and a hypothetical rate of return of 5% per year before expenses. Examples using a 5% hypothetical Fund return may be found in the shareholder reports of other mutual funds. The hypothetical account values and expenses may not be used to estimate the actual ending account balance or expenses you paid for the period. |
Please note that the expenses shown in these tables are meant to highlight your ongoing expenses only and do not reflect any transaction costs. The “Expenses Paid per $1,000” line of the tables is useful in comparing ongoing expenses only and will not help you determine the relative total expense of owning different funds. If these transaction costs had been included, your costs would have been higher.
| | | | |
| Expenses and Value of a $1,000 Investment for the six months ended December 31, 2020 | | | |
| |
| Actual Fund Return | | | Class A | |
| Beginning Account Value 7/1/20 | | $ | 1,000.00 | |
| Ending Account Value 12/31/20 | | $ | 1,220.20 | |
| Expenses Paid per $1,000* | | $ | 4.69 | |
| |
| Hypothetical 5% Fund Return | | | Class A | |
| Beginning Account Value 7/1/20 | | $ | 1,000.00 | |
| Ending Account Value 12/31/20 | | $ | 1,020.91 | |
| Expenses Paid per $1,000* | | $ | 4.27 | |
| * | Expenses are equal to the Fund’s annualized expense ratio, multiplied by the average account value over the period, multiplied by 184 (the number of days in the most recent six-month period), then divided by 366. |
| | | | |
| Annualized Expense Ratio | | Class A | |
| Deutsche DWS Variable Series II — DWS Global Equity VIP | | | .84 | % |
For more information, please refer to the Fund’s prospectus.
These tables do not reflect charges and fees (“contract charges”) associated with the separate account that invests in the Fund or any variable life insurance policy or variable annuity contract for which the Fund is an investment option.
For an analysis of the fees associated with an investment in the Fund or similar funds, please refer to the current and hypothetical expense calculators for Variable Insurance Products which can be found at dws.com/calculators.
| | | | |
Deutsche DWS Variable Series II — DWS Global Equity VIP | | | | | 19 |
| | |
| Tax Information | | (Unaudited) |
The Fund paid distributions of $.32 per share from net long-term capital gains during its year ended December 31, 2020.
For corporate shareholders, 35% of the ordinary dividends (i.e., income dividends plus short-term capital gains) paid during the Fund’s fiscal year ended December 31, 2020 qualified for the dividends received deduction.
Pursuant to Section 852 of the Internal Revenue Code, the Fund designates $1,509,000 as capital gain dividends for its year ended December 31, 2020.
Please consult a tax advisor if you have questions about federal or state income tax laws, or on how to prepare your tax returns. If you have specific questions about your account, please contact your insurance provider.
Proxy Voting
The Trust’s policies and procedures for voting proxies for portfolio securities and information about how the Trust voted proxies related to its portfolio securities during the most recent 12-month period ended June 30 are available on our Web site — dws.com/en-us/resources/proxy-voting — or on the SEC’s Web site — sec.gov. To obtain a written copy of the Trust’s policies and procedures without charge, upon request, call us toll free at (800) 728-3337.
| | | | | | |
| | 20 | | | | | | Deutsche DWS Variable Series II — DWS Global Equity VIP |
Advisory Agreement Board Considerations and Fee Evaluation
The Board of Trustees (hereinafter referred to as the “Board” or “Trustees”) approved the renewal of DWS Global Equity VIP’s (the “Fund”) investment management agreement (the “Agreement”) with DWS Investment Management Americas, Inc. (“DIMA”) in September 2020.
In terms of the process that the Board followed prior to approving the Agreement, shareholders should know that:
| – | | During the entire process, all of the Fund’s Trustees were independent of DIMA and its affiliates (the “Independent Trustees”). |
| – | | The Board met frequently during the past year to discuss fund matters and dedicated a substantial amount of time to contract review matters. Over the course of several months, the Board reviewed extensive materials received from DIMA, independent third parties and independent counsel. These materials included an analysis of the Fund’s performance, fees and expenses, and profitability from a fee consultant retained by the Fund’s Independent Trustees (the “Fee Consultant”). |
| – | | The Board also received extensive information throughout the year regarding performance of the Fund. |
| – | | The Independent Trustees regularly met privately with counsel to discuss contract review and other matters. In addition, the Independent Trustees were advised by the Fee Consultant in the course of their review of the Fund’s contractual arrangements and considered a comprehensive report prepared by the Fee Consultant in connection with their deliberations. |
| – | | In connection with reviewing the Agreement, the Board also reviewed the terms of the Fund’s distribution agreement, administrative services agreement, transfer agency agreement and other material service agreements. |
In connection with the contract review process, the Board considered the factors discussed below, among others. The Board also considered that DIMA and its predecessors have managed the Fund since its inception, and the Board believes that a long-term relationship with a capable, conscientious advisor is in the best interests of the Fund. The Board considered, generally, that shareholders chose to invest or remain invested in the Fund knowing that DIMA managed the Fund. DIMA is part of DWS Group GmbH & Co. KGaA (“DWS Group”). DWS Group is a global asset management business that offers a wide range of investing expertise and resources, including research capabilities in many countries throughout the world. In 2018, approximately 20% of DWS Group’s shares were sold in an initial public offering, with Deutsche Bank AG owning the remaining shares.
As part of the contract review process, the Board carefully considered the fees and expenses of each DWS fund overseen by the Board in light of the fund’s performance. In many cases, this led to the negotiation and implementation of expense caps.
While shareholders may focus primarily on fund performance and fees, the Fund’s Board considers these and many other factors, including the quality and integrity of DIMA’s personnel and administrative support services provided by DIMA, such as back-office operations, fund valuations, and compliance policies and procedures.
Nature, Quality and Extent of Services. The Board considered the terms of the Agreement, including the scope of advisory services provided under the Agreement. The Board noted that, under the Agreement, DIMA provides portfolio management services to the Fund and that, pursuant to a separate administrative services agreement, DIMA provides administrative services to the Fund. The Board considered the experience and skills of senior management and investment personnel and the resources made available to such personnel. The Board also considered the risks to DIMA in sponsoring or managing the Fund, including financial, operational and reputational risks, the potential economic impact to DIMA from such risks and DIMA’s approach to addressing such risks. The Board reviewed the Fund’s performance over short-term and long-term periods and compared those returns to various agreed-upon performance measures, including market index(es) and a peer universe compiled using information supplied by Morningstar Direct (“Morningstar”), an independent fund data service. The Board also noted that it has put into place a process of identifying “Funds in Review” (e.g., funds performing poorly relative to a peer universe), and receives additional reporting from DIMA regarding such funds and, where appropriate, DIMA’s plans to address underperformance. The Board believes this process is an effective manner of identifying and addressing underperforming funds. Based on the information provided, the Board noted that, for the one-, three- and
| | | | |
Deutsche DWS Variable Series II — DWS Global Equity VIP | | | | | 21 |
five-year periods ended December 31, 2019, the Fund’s performance (Class A shares) was in the 1st quartile, 2nd quartile and 2nd quartile, respectively, of the applicable Morningstar universe (the 1st quartile being the best performers and the 4th quartile being the worst performers). The Board also observed that the Fund has outperformed its benchmark in the one-, three- and five-year periods ended December 31, 2019.
Fees and Expenses. The Board considered the Fund’s investment management fee schedule, operating expenses and total expense ratios, and comparative information provided by Broadridge Financial Solutions, Inc. (“Broadridge”) and the Fee Consultant regarding investment management fee rates paid to other investment advisors by similar funds (1st quartile being the most favorable and 4th quartile being the least favorable). With respect to management fees paid to other investment advisors by similar funds, the Board noted that the contractual fee rates paid by the Fund, which include a 0.10% fee paid to DIMA under the Fund’s administrative services agreement, were equal to the median of the applicable Broadridge peer group (based on Broadridge data provided as of December 31, 2019). The Board noted that, effective March 1, 2020, the fee paid to DIMA under the Fund’s administrative services agreement was reduced to 0.097%. The Board noted that the Fund’s Class A shares total (net) operating expenses were expected to be higher than the median (3rd quartile) of the applicable Broadridge expense universe (based on Broadridge data provided as of December 31, 2019, and analyzing Broadridge expense universe Class A (net) expenses less any applicable 12b-1 fees) (“Broadridge Universe Expenses”). The Board noted that the expense limitation agreed to by DIMA was expected to help the Fund’s total (net) operating expenses remain competitive. The Board considered the Fund’s management fee rate as compared to fees charged by DIMA to comparable DWS U.S. registered funds (“DWS Funds”) and considered differences between the Fund and the comparable DWS Funds. The information requested by the Board as part of its review of fees and expenses also included information about institutional accounts (including any sub-advised funds and accounts) and funds offered primarily to European investors (“DWS Europe Funds”) managed by DWS Group. The Board noted that DIMA indicated that DWS Group does not manage any institutional accounts or DWS Europe Funds comparable to the Fund.
On the basis of the information provided, the Board concluded that management fees were reasonable and appropriate in light of the nature, quality and extent of services provided by DIMA.
Profitability. The Board reviewed detailed information regarding revenues received by DIMA under the Agreement. The Board considered the estimated costs to DIMA, and pre-tax profits realized by DIMA, from advising the DWS Funds, as well as estimates of the pre-tax profits attributable to managing the Fund in particular. The Board also received information regarding the estimated enterprise-wide profitability of DIMA and its affiliates with respect to all fund services in totality and by fund. The Board and the Fee Consultant reviewed DIMA’s methodology in allocating its costs to the management of the Fund. Based on the information provided, the Board concluded that the pre-tax profits realized by DIMA in connection with the management of the Fund were not unreasonable. The Board also reviewed certain publicly available information regarding the profitability of certain similar investment management firms. The Board noted that, while information regarding the profitability of such firms is limited (and in some cases is not necessarily prepared on a comparable basis), DIMA and its affiliates’ overall profitability with respect to the DWS Funds (after taking into account distribution and other services provided to the funds by DIMA and its affiliates) was lower than the overall profitability levels of most comparable firms for which such data was available.
Economies of Scale. The Board considered whether there are economies of scale with respect to the management of the Fund and whether the Fund benefits from any economies of scale. The Board noted that the Fund’s investment management fee schedule includes fee breakpoints. The Board concluded that the Fund’s fee schedule represents an appropriate sharing between the Fund and DIMA of such economies of scale as may exist in the management of the Fund at current asset levels.
Other Benefits to DIMA and Its Affiliates. The Board also considered the character and amount of other incidental or “fall-out” benefits received by DIMA and its affiliates, including any fees received by DIMA for administrative services provided to the Fund and any fees received by an affiliate of DIMA for transfer agency services provided to the Fund. The Board also considered benefits to DIMA related to brokerage and soft-dollar allocations, including allocating brokerage to pay for research generated by parties other than the executing broker dealers, which pertain primarily to funds investing in equity securities. In addition, the Board considered the incidental public relations benefits to DIMA related to DWS Funds advertising and cross-selling opportunities among DIMA products and services. The Board considered these benefits in reaching its conclusion that the Fund’s management fees were reasonable.
| | | | | | |
| | 22 | | | | | | Deutsche DWS Variable Series II — DWS Global Equity VIP |
Compliance. The Board considered the significant attention and resources dedicated by DIMA to its compliance processes in recent years. The Board noted in particular (i) the experience, seniority and time commitment of the individuals serving as DIMA’s and the Fund’s chief compliance officers and (ii) the substantial commitment of resources by DIMA and its affiliates to compliance matters, including the retention of compliance personnel.
The Board also considered that on September 24, 2020, the SEC granted a temporary order permitting DIMA and its affiliates to continue providing investment advisory and underwriting services to the DWS Funds notwithstanding a consent order entered into by Deutsche Bank AG on June 17, 2020 (the “Consent Order”). The Board noted that the temporary order was granted effective as of the date of the Consent Order. The Board also noted various representations by DIMA to the Board relating to the Consent Order, including that the conduct giving rise to the Consent Order (unintentional conduct that resulted from a system outage that prevented Deutsche Bank AG from reporting data in accordance with applicable CFTC requirements for five days in April 2016) did not involve any DWS Fund or services DIMA and its affiliates provide to the DWS Funds, that DIMA and its personnel had no involvement in the alleged conduct giving rise to the Consent Order, and that the DWS Funds would not bear any financial impact or costs relating to the Consent Order.
Based on all of the information considered and the conclusions reached, the Board determined that the continuation of the Agreement is in the best interests of the Fund. In making this determination, the Board did not give particular weight to any single factor identified above. The Board considered these factors over the course of numerous meetings, certain of which were in executive session with only the Independent Trustees and counsel present. It is possible that individual Independent Trustees may have weighed these factors differently in reaching their individual decisions to approve the continuation of the Agreement.
| | | | |
Deutsche DWS Variable Series II — DWS Global Equity VIP | | | | | 23 |
Board Members and Officers
The following table presents certain information regarding the Board Members and Officers of the Trust/Corporation. Each Board Member’s year of birth is set forth in parentheses after his or her name. Unless otherwise noted, (i) each Board Member has engaged in the principal occupation(s) noted in the table for at least the most recent five years, although not necessarily in the same capacity; and (ii) the address of each Independent Board Member is Keith R. Fox, DWS Funds Board Chair, c/o Thomas R. Hiller, Ropes & Gray LLP, Prudential Tower, 800 Boylston Street, Boston, MA 02199-3600. Except as otherwise noted below, the term of office for each Board Member is until the election and qualification of a successor, or until such Board Member sooner dies, resigns, is removed or as otherwise provided in the governing documents of the Trust/Corporation. Because the Fund does not hold an annual meeting of shareholders, each Board Member will hold office for an indeterminate period.
The Board Members may also serve in similar capacities with other funds in the fund complex. The number of funds in the DWS fund complex shown in the table below includes all registered open- and closed-end funds (including all of their portfolios) advised by the Advisor and any registered funds that have an investment advisor that is an affiliated person of the Advisor.
| | | | | | | | |
| Independent Board Members | | | |
Name, Year of Birth,
Position with the Trust/
Corporation and
Length of Time Served1 | | Business Experience and Directorships During the Past Five Years | | Number of
Funds in
DWS Fund
Complex
Overseen | | | Other
Directorships
Held by Board
Member
|
Keith R. Fox, CFA (1954) Chairperson since 2017, and Board Member since 1996 | | Managing General Partner, Exeter Capital Partners (a series of private investment funds) (since 1986). Directorships: Progressive International Corporation (kitchen goods importer and distributor); former Chairman, National Association of Small Business Investment Companies; former Directorships: ICI Mutual Insurance Company; BoxTop Media Inc. (advertising); Sun Capital Advisers Trust (mutual funds) (2011–2012) | | | 73 | | | — |
John W. Ballantine (1946) Board Member since 1999 | | Retired; formerly, Executive Vice President and Chief Risk Management Officer, First Chicago NBD Corporation/The First National Bank of Chicago (1996–1998); Executive Vice President and Head of International Banking (1995–1996); former Directorships: Director and Chairman of the Board, Healthways, Inc.2 (population well-being and wellness services) (2003–2014); Stockwell Capital Investments PLC (private equity); Enron Corporation; FNB Corporation; Tokheim Corporation; First Oak Brook Bancshares, Inc.; Oak Brook Bank; and Prisma Energy International. Not-for-Profit Director/Trustee: Palm Beach Civic Association; Window to the World Communications (public media); Life Director of Harris Theater for Music and Dance (Chicago); Life Director of Hubbard Street Dance Chicago; former Not-for-Profit Directorships: Public Radio International | | | 73 | | | Portland
General
Electric2
(utility
company)
(2003–
present) |
Dawn-Marie Driscoll (1946) Board Member since 1987 | | Emeritus Executive Fellow, Center for Business Ethics, Bentley University; formerly: Partner, Palmer & Dodge (law firm) (1988–1990); Vice President of Corporate Affairs and General Counsel, Filene’s (retail) (1978–1988). Directorships: Advisory Board, Center for Business Ethics, Bentley University; Trustee and former Chairman of the Board, Southwest Florida Community Foundation (charitable organization); former Directorships: ICI Mutual Insurance Company (2007–2015); Sun Capital Advisers Trust (mutual funds) (2007–2012), Investment Company Institute (audit, executive, nominating committees) and Independent Directors Council (governance, executive committees) | | | 73 | | | — |
Richard J. Herring (1946) Board Member since 1990 | | Jacob Safra Professor of International Banking and Professor of Finance, The Wharton School, University of Pennsylvania (since July 1972); Director, The Wharton Financial Institutions Center (since 1994); formerly: Vice Dean and Director, Wharton Undergraduate Division (1995–2000) and Director, The Lauder Institute of International Management Studies (2000–2006); Member FDIC Systemic Risk Advisory Committee since 2011, member Systemic Risk Council since 2012 and member of the Advisory Board at the Yale Program on Financial Stability since 2013; Formerly Co-Chair of the Shadow Financial Regulatory Committee (2003–2015), Executive Director of The Financial Economists Roundtable (2008–2015), Director of The Thai Capital Fund (2007–2013), Director of The Aberdeen Singapore Fund (2007–2018), and Nonexecutive Director of Barclays Bank DE (2010–2018) | | | 73 | | | Director,
Aberdeen
Japan Fund
(since 2007) |
William McClayton (1944) Board Member since 2004 | | Private equity investor (since October 2009); previously, Managing Director, Diamond Management & Technology Consultants, Inc. (global consulting firm) (2001–2009); Directorship: Board of Managers, YMCA of Metropolitan Chicago; formerly: Senior Partner, Arthur Andersen LLP (accounting) (1966–2001); Trustee, Ravinia Festival | | | 73 | | | — |
| | | | | | |
| | 24 | | | | | | Deutsche DWS Variable Series II — DWS Global Equity VIP |
| | | | | | | | |
Name, Year of Birth,
Position with the Trust/
Corporation and
Length of Time Served1 | | Business Experience and Directorships During the Past Five Years | | Number of
Funds in
DWS Fund
Complex
Overseen | | | Other
Directorships
Held by Board
Member
|
Rebecca W. Rimel (1951) Board Member since 1995 | | Senior Advisor, The Pew Charitable Trusts (charitable organization) (since July 2020); formerly: Executive Vice President, The Glenmede Trust Company (investment trust and wealth management) (1983–2004); Board Member, Investor Education (charitable organization) (2004–2005); Trustee, Executive Committee, Philadelphia Chamber of Commerce (2001–2007); Director, Viasys Health Care2 (January 2007–June 2007); Trustee, Thomas Jefferson Foundation (charitable organization) (1994–2012); President, Chief Executive Officer and Director, The Pew Charitable Trusts (charitable organization) (1994–2020) | | | 73 | | | Director,
Becton
Dickinson
and
Company2
(medical
technology
company)
(2012–
present);
Director,
BioTelemetry
Inc.2 (health
care) (2009–
present) |
William N. Searcy, Jr. (1946) Board Member since 1993 | | Private investor since October 2003; formerly: Pension & Savings Trust Officer, Sprint Corporation2 (telecommunications) (November 1989–September 2003); Trustee, Sun Capital Advisers Trust (mutual funds) (1998–2012) | | | 73 | | | — |
| | |
| Officers4 | | |
Name, Year of Birth,
Position with the Trust/
Corporation and
Length of Time Served5 | | Business Experience and Directorships During the Past Five Years |
Hepsen Uzcan6 (1974) President and Chief Executive Officer, 2017–present | | Managing Director3, DWS; Secretary, DWS USA Corporation (2018–present); Assistant Secretary, DWS Distributors, Inc. (2018–present); Director and Vice President, DWS Service Company (2018–present); Assistant Secretary, DWS Investment Management Americas, Inc. (2018–present); Director and President, DB Investment Managers, Inc. (2018–present); President and Chief Executive Officer, The European Equity Fund, Inc., The New Germany Fund, Inc. and The Central and Eastern Europe Fund, Inc. (2017–present); formerly: Vice President for the Deutsche funds (2016–2017); Assistant Secretary for the DWS funds (2013–2019); Assistant Secretary, The European Equity Fund, Inc., The New Germany Fund, Inc. and The Central and Eastern Europe Fund, Inc. (2013–2020); Directorships: Interested Director, The European Equity Fund, Inc., The New Germany Fund, Inc. and The Central and Eastern Europe Fund, Inc. (since June 25, 2020); ICI Mutual Insurance Company (since October 16, 2020); and Episcopalian Charities of New York (2018–present) |
John Millette7 (1962) Vice President and Secretary, 1999–present | | Director,3 DWS; Chief Legal Officer, DWS Investment Management Americas, Inc. (2015–present); Director and Vice President, DWS Trust Company (2016–present); Secretary, DBX ETF Trust (2020–present); Secretary, The European Equity Fund, Inc., The New Germany Fund, Inc. and The Central and Eastern Europe Fund, Inc. (2011–present); formerly: Secretary, Deutsche Investment Management Americas Inc. (2015–2017); Assistant Secretary, DBX ETF Trust (2019–2020); Assistant Secretary (July 14, 2006–December 31, 2010) and Secretary (January 31, 2006–July 13, 2006), The European Equity Fund, Inc., The New Germany Fund, Inc. and The Central and Eastern Europe Fund, Inc. |
Ciara Crawford8 (1984) Assistant Secretary, (2019–present) | | Associate, DWS (since 2015); previously, Legal Assistant at Accelerated Tax Solutions. |
Diane Kenneally7 (1966) Chief Financial Officer and Treasurer, 2018–present | | Director,3 DWS; Treasurer, Chief Financial Officer and Controller, DBX ETF Trust (2019–present); Treasurer and Chief Financial Officer, The European Equity Fund, Inc., The New Germany Fund, Inc. and The Central and Eastern Europe Fund, Inc. (2018–present); formerly: Assistant Treasurer for the DWS funds (2007–2018) |
Paul Antosca7 (1957) Assistant Treasurer, 2007–present | | Director,3 DWS; and Assistant Treasurer, DBX ETF Trust (2019–present) |
Sheila Cadogan7 (1966) Assistant Treasurer, 2017–present | | Director,3 DWS; Director and Vice President, DWS Trust Company (2018–present); Assistant Treasurer, DBX ETF Trust (2019–present); Assistant Treasurer, The European Equity Fund, Inc., The New Germany Fund, Inc. and The Central and Eastern Europe Fund, Inc. (2018–present) |
Scott D. Hogan7 (1970) Chief Compliance Officer, 2016–present | | Director,3 DWS; Chief Compliance Officer, The European Equity Fund, Inc., The New Germany Fund, Inc. and The Central and Eastern Europe Fund, Inc. (2016–present) |
Caroline Pearson7 (1962) Chief Legal Officer, 2010–present | | Managing Director3, DWS; Assistant Secretary, DBX ETF Trust (2020–present); Chief Legal Officer, DBX Advisors LLC and DBX Strategic Advisors LLC (2020–present); Chief Legal Officer, The European Equity Fund, Inc., The New Germany Fund, Inc. and The Central and Eastern Europe Fund, Inc. (2012–present); formerly: Secretary, Deutsche AM Distributors, Inc. (2002–2017); and Secretary, Deutsche AM Service Company (2010–2017) |
| | | | |
Deutsche DWS Variable Series II — DWS Global Equity VIP | | | | | 25 |
| | |
Name, Year of Birth,
Position with the Trust/
Corporation and
Length of Time Served5 | | Business Experience and Directorships During the Past Five Years |
Michelle Goveia-Pine6 (1970) Interim Anti-Money Laundering Compliance Officer, since July 10, 2020 | | Director,3 DWS; Interim AML Officer, DWS Trust Company (since July 28, 2020); Interim AML Officer, DBX ETF Trust (since July 9, 2020); Interim AML Officer, The European Equity Fund, Inc., The New Germany Fund, Inc. and The Central and Eastern Europe Fund, Inc. (since July 24, 2020) |
| 1 | The length of time served represents the year in which the Board Member joined the board of one or more DWS funds currently overseen by the Board. |
| 2 | A publicly held company with securities registered pursuant to Section 12 of the Securities Exchange Act of 1934. |
| 3 | Executive title, not a board directorship. |
| 4 | As a result of their respective positions held with the Advisor or its affiliates, these individuals are considered “interested persons” of the Advisor within the meaning of the 1940 Act. Interested persons receive no compensation from the Fund. |
| 5 | The length of time served represents the year in which the officer was first elected in such capacity for one or more DWS funds. |
| 6 | Address: 875 Third Avenue, New York, NY 10022. |
| 7 | Address: 100 Summer Street, Boston, MA 02110. |
| 8 | Address: 5022 Gate Parkway, Suite 400, Jacksonville, FL 32256. |
The Fund’s Statement of Additional Information (“SAI”) includes additional information about the Board Members. The SAI is available, without charge, upon request. If you would like to request a copy of the SAI, you may do so by calling the following toll-free number: (800) 728-3337.
| | | | | | |
| | 26 | | | | | | Deutsche DWS Variable Series II — DWS Global Equity VIP |
Notes
| | |
| | |
VS2GE-2 (R-025828-10 2/21) | | |
December 31, 2020
Annual Report
Deutsche DWS Variable Series II
DWS Global Income Builder VIP

Contents
| | | | |
| | 3 | | | Performance Summary |
| | 5 | | | Management Summary |
| | 7 | | | Portfolio Summary |
| | 8 | | | Investment Portfolio |
| | 19 | | | Statement of Assets and Liabilities |
| | 20 | | | Statement of Operations |
| | 21 | | | Statements of Changes in Net Assets |
| | 22 | | | Financial Highlights |
| | 23 | | | Notes to Financial Statements |
| | 32 | | | Report of Independent Registered Public Accounting Firm |
| | 33 | | | Information About Your Fund’s Expenses |
| | 34 | | | Tax Information |
| | 34 | | | Proxy Voting |
| | 35 | | | Advisory Agreement Board Considerations and Fee Evaluation |
| | 38 | | | Board Members and Officers |
This report must be preceded or accompanied by a prospectus. To obtain an additional prospectus or summary prospectus, if available, call (800) 728-3337 or your financial representative. We advise you to consider the Fund’s objectives, risks, charges and expenses carefully before investing. The summary prospectus and prospectus contain this and other important information about the Fund. Please read the prospectus carefully before you invest.
Although allocation among different asset categories generally limits risk, fund management may favor an asset category that underperforms other assets or markets as a whole. Stocks may decline in value. Investing in foreign securities, particularly those of emerging markets, presents certain risks, such as currency fluctuations, political and economic changes, and market risks. Emerging markets tend to be more volatile and less liquid than the markets of more mature economies, and generally have less diverse and less mature economic structures and less stable political systems than those of developed countries. Investing in derivatives entails special risks relating to liquidity, leverage and credit that may reduce returns and/or increase volatility. Bond investments are subject to interest-rate, credit, liquidity and market risks to varying degrees. When interest rates rise, bond prices generally fall. Credit risk refers to the ability of an issuer to make timely payments of principal and interest. Please read the prospectus for details.
War, terrorism, economic uncertainty, trade disputes, public health crises (including the recent pandemic spread of the novel coronavirus) and related geopolitical events could lead to increased market volatility, disruption to U.S. and world economies and markets and may have significant adverse effects on the Fund and its investments.
The brand DWS represents DWS Group GmbH & Co. KGaA and any of its subsidiaries such as DWS Distributors, Inc. which offers investment products or DWS Investment Management Americas, Inc. and RREEF America L.L.C. which offer advisory services.
DWS Distributors, Inc., 222 South Riverside Plaza, Chicago, IL 60606, (800) 621-1148
NOT FDIC/NCUA INSURED NO BANK GUARANTEE MAY LOSE VALUE NOT A DEPOSIT
NOT INSURED BY ANY FEDERAL GOVERNMENT AGENCY
| | | | | | |
| | 2 | | | | | | Deutsche DWS Variable Series II — DWS Global Income Builder VIP |
| | |
| Performance Summary | | December 31, 2020 (Unaudited) |
Fund performance shown is historical, assumes reinvestment of all dividend and capital gain distributions and does not guarantee future results. Investment return and principal value fluctuate with changing market conditions so that, when redeemed, shares may be worth more or less than their original cost. Current performance may be lower or higher than the performance data quoted. Please contact your participating insurance company for the Fund’s most recent month-end performance. Performance does not reflect charges and fees (“contract charges”) associated with the separate account that invests in the Fund or any variable life insurance policy or variable annuity contract for which the Fund is an investment option. These charges and fees will reduce returns.
The gross expense ratios of the Fund, as stated in the fee table of the prospectus dated May 1, 2020 are 0.68% and 1.10% for Class A and Class B shares, respectively, and may differ from the expense ratios disclosed in the Financial Highlights tables in this report.
Generally accepted accounting principles require adjustments to be made to the net assets of the Fund at period end for financial reporting purposes only, and as such, the total return based on the unadjusted net asset value per share may differ from the total return reported in the financial highlights.
Growth of an Assumed $10,000 Investment
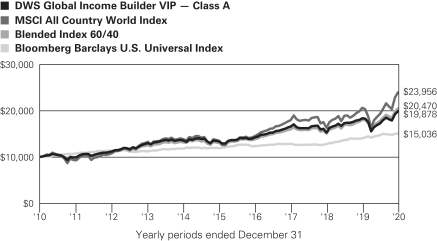
MSCI All Country World Index is an unmanaged equity index which captures large and mid-capitalization representation across 23 developed markets and 26 emerging markets countries. It covers approximately 85% of the global investable equity opportunity set.
The Blended Index 60/40 consists of an equally weighted blend of 60% MSCI All Country World Index and 40% Bloomberg Barclays U.S. Universal Index.
Bloomberg Barclays U.S. Universal Index measures the performance of U.S. dollar-denominated taxable bonds that are rated either investment grade or high yield. The index includes U.S. Treasury bonds, investment-grade and high yield U.S. corporate bonds, mortgage-backed securities, and Eurodollar bonds.
Index returns do not reflect any fees or expenses and it is not possible to invest directly into an index.
| | | | |
Deutsche DWS Variable Series II — DWS Global Income Builder VIP | | | | | 3 |
| | | | | | | | | | |
| Comparative Results | | | | | | | | | | |
| | | | |
| DWS Global Income Builder VIP | | 1-Year | | 3-Year | | 5-Year | | 10-Year |
| Class A | | Growth of $10,000 | | $10,828 | | $12,014 | | $14,955 | | $19,878 |
| | | Average annual total return | | 8.28% | | 6.31% | | 8.38% | | 7.11% |
| MSCI All Country World Index | | Growth of $10,000 | | $11,625 | | $13,332 | | $17,828 | | $23,956 |
| | | Average annual total return | | 16.25% | | 10.06% | | 12.26% | | 9.13% |
| Blended Index 60/40 | | Growth of $10,000 | | $11,378 | | $12,833 | | $15,808 | | $20,470 |
| | | Average annual total return | | 13.78% | | 8.67% | | 9.59% | | 7.43% |
| Bloomberg Barclays U.S. Universal Index | | Growth of $10,000 | | $10,758 | | $11,727 | | $12,684 | | $15,036 |
| | Average annual total return | | 7.58% | | 5.45% | | 4.87% | | 4.16% |
| | | | | | | | |
| | | |
| DWS Global Income Builder VIP | | | | 1-Year | | Life of Class* |
| Class B | | Growth of $10,000 | | | | $10,790 | | $12,178 |
| | | Average annual total return | | | | 7.90% | | 7.66% |
| MSCI All Country World Index | | Growth of $10,000 | | | | $11,625 | | $13,334 |
| | | Average annual total return | | | | 16.25% | | 11.39% |
| Blended Index 60/40 | | Growth of $10,000 | | | | $11,378 | | $12,932 |
| | | Average annual total return | | | | 13.78% | | 9.80% |
| Bloomberg Barclays U.S. Universal Index | | Growth of $10,000 | | | | $10,758 | | $11,974 |
| | Average annual total return | | | | 7.58% | | 6.99% |
The growth of $10,000 is cumulative.
| * | Class B commenced operations on May 1, 2018. |
| | | | | | |
| | 4 | | | | | | Deutsche DWS Variable Series II — DWS Global Income Builder VIP |
| | |
| Management Summary | | December 31, 2020 (Unaudited) |
The Fund returned 8.28% during the 12 months ended December 31, 2020 (Class A shares, unadjusted for contract charges) and underperformed the 13.78% return of its benchmark, the Blended Index 60/40. The index consists of a blend of 60% MSCI All Country World Index and 40% Bloomberg Barclays U.S. Universal Index. The two indexes returned 16.25% and 7.58%, respectively.
The financial markets produced robust, broad-based returns in 2020. Higher-risk assets, after experiencing pronounced weakness at the start of the year due to the spread of COVID-19, began to recover in late March once world central banks and governments responded with enormous monetary and fiscal stimulus. Investors, seeing the potential for these actions to help support the economy and markets until the virus was contained, bid up stock prices across the board. The bond market’s credit sectors, while also facing challenges in early 2020, rebounded to finish the year with healthy total returns.
The Fund’s underperformance was largely the result of our emphasis on dividend-paying, value-oriented stocks within the equity portfolio. The universe of higher-yielding stocks lagged the equity benchmark by a wide margin, reflecting the category’s lower weighting in mega-cap technology stocks and larger allocations to defensive sectors that underperformed. While this aspect of our strategy detracted in the past 12 months, we believe it is consistent with the Fund’s objective of delivering income over the long term.
Our decision to devote a portion of the Fund’s bond allocation to income-producing alternative investments — including convertible bonds and preferred stocks — was a key contributor to performance. All three categories performed very well from April onward, with convertibles leading the way, while the returns for bonds were relatively muted. We maintain this allocation on the belief that these areas continue to offer better longer-term total return potential than bonds.
The fixed-income portfolio outpaced the Bloomberg Barclays U.S. Universal Index and contributed to relative performance thanks to robust security selection in both investment-grade corporates and high yield. A position in emerging-market bonds was an additional positive. Conversely, the Fund lost some relative performance through underweight positions in U.S. Treasuries and investment-grade corporate bonds.
The Fund used derivatives during the past 12 months. On the equity side, we used futures on stock indexes to achieve our desired weightings in a more efficient manner than buying and selling individual securities. In the bond portfolio, we used credit default swaps, derivatives to currency exposure, and interest-rate futures and swaps to manage duration. The use of derivatives was a net contributor in the aggregate. Derivatives are used to achieve the fund’s risk and return objectives and should be evaluated within the context of the entire portfolio rather than as a standalone strategy.
We actively adjusted the Fund’s risk profile in response to the shifting environment. We established a defensive posture in late 2019 via an underweight in stocks, as we believed expectations for both economic growth and corporate earnings were too high. Although we didn’t anticipate the emergence of COVID-19, the defensive approach proved helpful once the markets turned lower in the first quarter of 2020. We continued to reduce risk during the downturn, and then we gradually increased it over the span from early April through the end of the year. We accomplished this both by adding to the equity weighting and increasing the risk profile of the bond portfolio. The Fund finished 2020 with an equity allocation that was close to the 60% level of the benchmark.
We believe the strength in the financial markets reflects some real, positive developments occurring in the global economy. Central banks are providing ample liquidity and government spending appears poised to rise significantly both in the United States and overseas, which should provide a tailwind for economic growth and corporate fundamentals in the year ahead. With that said, we remain on the lookout for potential risk factors given the magnitude of the rally in recent months. We believe our multifaceted strategy, which seeks to capitalize on opportunities while providing the flexibility to response to market volatility, can continue to add value in this environment.
Dokyoung Lee, CFA, Director
Di Kumble, CFA, Managing Director
Thomas M. Farina, CFA, Managing Director
Scott Agi, CFA, Director
Darwei Kung, Managing Director
Portfolio Managers
The views expressed reflect those of the portfolio management team only through the end of the period of the report as stated on the cover. The management team’s views are subject to change at any time based on market and other conditions and should not be construed as a recommendation. Past performance is no guarantee of future results. Current and future portfolio holdings are subject to risk.
| | | | |
Deutsche DWS Variable Series II — DWS Global Income Builder VIP | | | | | 5 |
Terms to Know
Blended Index 60/40 consists of an equally weighted blend of 60% MSCI All Country World Index and 40% Bloomberg Barclays U.S. Universal Index.
MSCI All Country World Index is an unmanaged equity index which captures large and mid-capitalization representation across 23 developed markets and 26 emerging markets countries. It covers approximately 85% of the global investable equity opportunity set.
Bloomberg Barclays U.S. Universal Index measures the performance of U.S. dollar-denominated taxable bonds that are rated either investment grade or high yield. The index includes U.S. Treasury bonds, investment-grade and high yield U.S. corporate bonds, mortgage-backed securities, and Eurodollar bonds.
Index returns do not reflect any fees or expenses and it is not possible to invest directly into an index.
Contribution and detraction incorporate both an investment’s total return and its weighting in the Fund.
Convertible securities are bonds that can be exchanged for equity at a pre-stated price. Convertibles generally offer higher income than is available from a common stock, but more appreciation potential than bonds.
Overweight means the Fund holds a higher weighting in a given sector or security than the benchmark. Underweight means the Fund holds a lower weighting.
Derivatives are contracts whose value is based on the performance of an underlying financial asset. Derivatives afford leverage, but when used by investors who are able to handle the inherent risks, can enhance returns or protect a portfolio. Derivatives experience significant losses if the underlying security moves contrary to the investor’s expectations.
Duration is a measure of bond price volatility. Duration can be defined as the approximate percentage change in price for a 100 basis point (one single percentage point) change in market interest rate levels. A duration of 5, for example, means that the price of a bond should rise by approximately 5% for a one percentage point drop in interest rates, and fall by 5% for a one percentage point rise in interest rates.
Futures contracts are contractual agreements to buy or sell a particular commodity or financial instrument at a pre-determined price in the future.
A swap is a derivative in which two counterparties exchange cash flows of one party’s financial instrument for those of the other party’s financial instrument for a set period of time. The prices of credit default swaps, which are designed to offset credit risk, typically move in the opposite direction of the index or security they track.
| | | | | | |
| | 6 | | | | | | Deutsche DWS Variable Series II — DWS Global Income Builder VIP |
| | |
| Portfolio Summary | | (Unaudited) |
| | | | | | | | |
| Asset Allocation (As a % of Investment Portfolio excluding Securities Lending Collateral) | | 12/31/20 | | | 12/31/19 | |
Equity | | | 61% | | | | 64% | |
Common Stocks | | | 57% | | | | 60% | |
Preferred Stocks | | | 4% | | | | 4% | |
| | |
Fixed Income | | | 37% | | | | 35% | |
Corporate Bonds | | | 15% | | | | 9% | |
Asset-Backed | | | 5% | | | | 6% | |
Commercial Mortgage-Backed Securities | | | 4% | | | | 5% | |
Mortgage-Backed Securities Pass-Throughs | | | 4% | | | | 1% | |
Collateralized Mortgage Obligations | | | 3% | | | | 8% | |
Exchange-Traded Funds | | | 3% | | | | 3% | |
Short-Term U.S. Treasury Obligations | | | 2% | | | | 2% | |
Government & Agency Obligations | | | 1% | | | | 1% | |
| | |
| Cash Equivalents | | | 2% | | | | 1% | |
| | | | 100% | | | | 100% | |
| | |
| Sector Diversification (As a % of Equities, Corporate Bonds and Preferred Securities) | | 12/31/20 | | | 12/31/19 | |
Information Technology | | | 20% | | | | 15% | |
Financials | | | 19% | | | | 19% | |
Communication Services | | | 10% | | | | 10% | |
Consumer Discretionary | | | 9% | | | | 9% | |
Health Care | | | 9% | | | | 9% | |
Industrials | | | 7% | | | | 7% | |
Utilities | | | 6% | | | | 8% | |
Consumer Staples | | | 6% | | | | 6% | |
| Energy | | | 5% | | | | 7% | |
| Materials | | | 5% | | | | 4% | |
| Real Estate | | | 4% | | | | 6% | |
| | | | 100% | | | | 100% | |
| | |
Geographical Diversification (As a % of Investment Portfolio excluding Cash Equivalents, Exchange-
Traded Funds and Securities Lending Collateral) | | 12/31/2020 | | | 12/31/2019 | |
| United States | | | 63% | | | | 68% | |
| Japan | | | 5% | | | | 4% | |
| Canada | | | 3% | | | | 2% | |
| United Kingdom | | | 3% | | | | 3% | |
| Switzerland | | | 3% | | | | 4% | |
| Australia | | | 2% | | | | 2% | |
| Germany | | | 2% | | | | 2% | |
| Hong Kong | | | 2% | | | | 1% | |
| Ireland | | | 2% | | | | 1% | |
| France | | | 1% | | | | 2% | |
| Other | | | 14% | | | | 11% | |
| | | | 100% | | | | 100% | |
Portfolio holdings and characteristics are subject to change.
For more complete details about the Fund’s investment portfolio, see page 8.
Following the Fund’s fiscal first and third quarter-end, a complete portfolio holdings listing is posted on dws.com, and is available free of charge by contacting your financial intermediary, or if you are a direct investor, by calling (800) 728-3337. In addition, the portfolio holdings listing is filed with the SEC on the Fund’s Form N-PORT and will be available on the SEC’s Web site at sec.gov. Additional portfolio holdings for the Fund are also posted on dws.com from time to time. Please see the Fund’s current prospectus for more information.
| | | | |
Deutsche DWS Variable Series II — DWS Global Income Builder VIP | | | | | 7 |
| | |
| Investment Portfolio | | as of December 31, 2020 |
| | | | | | | | |
| | | Shares | | | Value ($) | |
| Common Stocks 59.4% | | | | | | | | |
| Communication Services 5.2% | |
Diversified Telecommunication Services 2.4% | |
| | |
AT&T, Inc. | | | 14,200 | | | | 408,392 | |
| | |
BCE, Inc. | | | 7,850 | | | | 335,671 | |
| | |
Deutsche Telekom AG (Registered) | | | 13,448 | | | | 247,003 | |
| | |
Elisa Oyj | | | 3,058 | | | | 167,806 | |
| | |
Koninklijke KPN NV | | | 51,725 | | | | 157,450 | |
| | |
Nippon Telegraph & Telephone Corp. | | | 9,683 | | | | 247,421 | |
| | |
Orange SA | | | 13,001 | | | | 154,738 | |
| | |
Swisscom AG (Registered) | | | 292 | | | | 157,724 | |
| | |
Telenor ASA | | | 13,038 | | | | 222,782 | |
| | |
Telia Co. AB | | | 47,053 | | | | 194,650 | |
| | |
Telstra Corp., Ltd. | | | 69,261 | | | | 159,627 | |
| | |
TELUS Corp. | | | 9,921 | | | | 196,487 | |
| | |
Verizon Communications, Inc. | | | 6,371 | | | | 374,296 | |
| | | | | | | | |
| | | | 3,024,047 | |
|
Entertainment 0.6% | |
| | |
Activision Blizzard, Inc. | | | 1,150 | | | | 106,777 | |
| | |
NetEase, Inc. (ADR) | | | 2,191 | | | | 209,832 | |
| | |
Netflix, Inc.* | | | 427 | | | | 230,892 | |
| | |
Nintendo Co., Ltd. | | | 360 | | | | 229,713 | |
| | | | | | | | |
| | | | 777,214 | |
|
Interactive Media & Services 1.0% | |
| | |
Alphabet, Inc. “A”* | | | 69 | | | | 120,932 | |
| | |
Alphabet, Inc. “C”* | | | 79 | | | | 138,399 | |
| | |
Facebook, Inc. “A”* | | | 1,826 | | | | 498,790 | |
| | |
Pinterest, Inc. “A”* | | | 2,135 | | | | 140,697 | |
| | |
Tencent Holdings Ltd. (ADR) | | | 4,761 | | | | 342,268 | |
| | | | | | | | |
| | | | 1,241,086 | |
|
Media 0.5% | |
| | |
Charter Communications, Inc. “A”* | | | 308 | | | | 203,757 | |
| | |
Comcast Corp. “A” | | | 5,405 | | | | 283,222 | |
| | |
Interpublic Group of Companies, Inc. | | | 6,572 | | | | 154,574 | |
| | | | | | | | |
| | | | 641,553 | |
|
Wireless Telecommunication Services 0.7% | |
| | |
China Mobile Ltd. (ADR) (a) | | | 10,165 | | | | 290,109 | |
| | |
KDDI Corp. | | | 6,520 | | | | 193,819 | |
| | |
SoftBank Corp. | | | 18,300 | | | | 229,160 | |
| | |
Vodafone Group PLC | | | 86,146 | | | | 142,498 | |
| | | | | | | | |
| | | | 855,586 | |
|
| Consumer Discretionary 6.0% | |
Auto Components 0.1% | |
Denso Corp. | | | 3,163 | | | | 188,292 | |
|
Automobiles 1.4% | |
| | |
Bayerische Motoren Werke AG | | | 2,053 | | | | 183,845 | |
| | |
NIO, Inc. (ADR)* | | | 5,689 | | | | 277,282 | |
| | |
Porsche Automobil Holding SE (Preference) | | | 3,462 | | | | 243,742 | |
| | |
Tesla, Inc.* | | | 821 | | | | 579,355 | |
| | |
Toyota Motor Corp. | | | 3,279 | | | | 252,913 | |
| | |
Volkswagen AG (Preference) | | | 1,025 | | | | 191,991 | |
| | | | | | | | |
| | | | 1,729,128 | |
| | | | | | | | |
| | | Shares | | | Value ($) | |
|
Diversified Consumer Services 0.2% | |
| | |
GSX Techedu, Inc. (ADR)* | | | 996 | | | | 51,503 | |
| | |
TAL Education Group (ADR)* | | | 2,016 | | | | 144,164 | |
| | | | | | | | |
| | | | 195,667 | |
|
Hotels, Restaurants & Leisure 0.6% | |
| | |
Evolution Gaming Group AB 144A | | | 1,429 | | | | 145,734 | |
| | |
McDonald’s Corp. | | | 606 | | | | 130,035 | |
| | |
Restaurant Brands International, Inc. | | | 1,734 | | | | 106,023 | |
| | |
Starbucks Corp. | | | 2,324 | | | | 248,622 | |
| | |
Yum! Brands, Inc. | | | 1,064 | | | | 115,508 | |
| | | | | | | | |
| | | | 745,922 | |
|
Household Durables 0.6% | |
| | |
Electrolux AB “B” | | | 12,046 | | | | 280,325 | |
| | |
Garmin Ltd. | | | 1,460 | | | | 174,704 | |
| | |
Newell Brands, Inc. | | | 10,658 | | | | 226,269 | |
| | |
Sekisui House Ltd. | | | 6,606 | | | | 134,450 | |
| | | | | | | | |
| | | | 815,748 | |
|
Internet & Direct Marketing Retail 2.2% | |
| | |
Alibaba Group Holding Ltd. (ADR)* | | | 1,040 | | | | 242,039 | |
| | |
Amazon.com, Inc.* | | | 534 | | | | 1,739,201 | |
| | |
JD.com, Inc. (ADR)* | | | 3,874 | | | | 340,525 | |
| | |
MercadoLibre, Inc.* | | | 100 | | | | 167,522 | |
| | |
Pinduoduo, Inc. (ADR)* | | | 1,347 | | | | 239,321 | |
| | |
Wayfair, Inc. “A”* (a) | | | 378 | | | | 85,356 | |
| | | | | | | | |
| | | | 2,813,964 | |
|
Multiline Retail 0.4% | |
| | |
Target Corp. | | | 1,357 | | | | 239,551 | |
| | |
Wesfarmers Ltd. | | | 5,530 | | | | 215,428 | |
| | | | | | | | |
| | | | 454,979 | |
|
Specialty Retail 0.5% | |
| | |
Best Buy Co., Inc. | | | 1,497 | | | | 149,386 | |
| | |
Home Depot, Inc. | | | 1,227 | | | | 325,916 | |
| | |
Lowe’s Companies, Inc. | | | 1,344 | | | | 215,725 | |
| | | | | | | | |
| | | | 691,027 | |
|
| Consumer Staples 3.9% | |
Beverages 0.6% | |
| | |
Coca-Cola Co. | | | 6,663 | | | | 365,399 | |
| | |
PepsiCo, Inc. | | | 2,334 | | | | 346,132 | |
| | | | | | | | |
| | | | 711,531 | |
|
Food & Staples Retailing 0.7% | |
| | |
Koninklijke Ahold Delhaize NV | | | 5,854 | | | | 165,536 | |
| | |
Tesco PLC | | | 69,159 | | | | 219,200 | |
| | |
Walgreens Boots Alliance, Inc. | | | 4,223 | | | | 168,413 | |
| | |
Walmart, Inc. | | | 1,563 | | | | 225,307 | |
| | |
Woolworths Group Ltd. | | | 5,073 | | | | 153,795 | |
| | | | | | | | |
| | | | 932,251 | |
|
Food Products 1.0% | |
| | |
Bunge Ltd. | | | 2,214 | | | | 145,194 | |
| | |
General Mills, Inc. | | | 2,696 | | | | 158,525 | |
| | |
Kellogg Co. | | | 2,197 | | | | 136,720 | |
| | |
Kraft Heinz Co. | | | 5,955 | | | | 206,400 | |
| | |
Nestle SA (Registered) | | | 2,689 | | | | 317,044 | |
| | |
WH Group Ltd. 144A | | | 163,697 | | | | 137,552 | |
| | |
Wilmar International Ltd. | | | 61,200 | | | | 216,004 | |
| | | | | | | | |
| | | | 1,317,439 | |
The accompanying notes are an integral part of the financial statements.
| | | | | | |
| | 8 | | | | | | Deutsche DWS Variable Series II — DWS Global Income Builder VIP |
| | | | | | | | |
| | | Shares | | | Value ($) | |
|
Household Products 0.6% | |
| | |
Colgate-Palmolive Co. | | | 1,270 | | | | 108,598 | |
| | |
Kimberly-Clark Corp. | | | 1,068 | | | | 143,998 | |
| | |
Procter & Gamble Co. | | | 2,572 | | | | 357,868 | |
| | |
Reckitt Benckiser Group PLC | | | 1,954 | | | | 175,272 | |
| | | | | | | | |
| | | | 785,736 | |
|
Personal Products 0.3% | |
Unilever PLC | | | 5,335 | | | | 322,283 | |
|
Tobacco 0.7% | |
| | |
Japan Tobacco, Inc. | | | 16,200 | | | | 329,994 | |
| | |
Philip Morris International, Inc. | | | 6,561 | | | | 543,185 | |
| | | | | | | | |
| | | | 873,179 | |
|
| Energy 1.2% | |
Energy Equipment & Services 0.1% | |
Baker Hughes Co. | | | 6,231 | | | | 129,917 | |
|
Oil, Gas & Consumable Fuels 1.1% | |
| | |
Chevron Corp. | | | 1,600 | | | | 135,120 | |
| | |
ENEOS Holdings, Inc. | | | 48,000 | | | | 171,965 | |
| | |
Kinder Morgan, Inc. | | | 11,800 | | | | 161,306 | |
| | |
TC Energy Corp. | | | 5,753 | | | | 233,889 | |
| | |
TOTAL SE | | | 5,583 | | | | 240,892 | |
| | |
Valero Energy Corp. | | | 2,564 | | | | 145,046 | |
| | |
Williams Companies, Inc. | | | 17,100 | | | | 342,855 | |
| | | | | | | | |
| | | | 1,431,073 | |
|
| Financials 9.0% | |
Banks 4.6% | |
| | |
Bank of America Corp. | | | 5,218 | | | | 158,158 | |
| | |
Bank of Montreal | | | 3,034 | | | | 230,678 | |
| | |
Bank of Nova Scotia | | | 2,951 | | | | 159,501 | |
| | |
BOC Hong Kong Holdings Ltd. | | | 94,457 | | | | 286,734 | |
| | |
Canadian Imperial Bank of Commerce | | | 1,741 | | | | 148,701 | |
| | |
Citizens Financial Group, Inc. | | | 5,812 | | | | 207,837 | |
| | |
Commonwealth Bank of Australia | | | 4,518 | | | | 287,359 | |
| | |
DBS Group Holdings Ltd. | | | 18,836 | | | | 357,605 | |
| | |
Fifth Third Bancorp. | | | 4,961 | | | | 136,775 | |
| | |
Hang Seng Bank Ltd. | | | 11,607 | | | | 200,357 | |
| | |
Huntington Bancshares, Inc. | | | 10,606 | | | | 133,954 | |
| | |
JPMorgan Chase & Co. | | | 1,969 | | | | 250,201 | |
| | |
KeyCorp. | | | 10,832 | | | | 177,753 | |
| | |
Mitsubishi UFJ Financial Group, Inc. | | | 48,803 | | | | 215,726 | |
| | |
Mizuho Financial Group, Inc. | | | 24,488 | | | | 311,023 | |
| | |
National Australia Bank Ltd. | | | 10,112 | | | | 177,584 | |
| | |
Nordea Bank Abp* | | | 16,599 | | | | 136,406 | |
| | |
Oversea-Chinese Banking Corp., Ltd. | | | 28,981 | | | | 220,645 | |
| | |
PNC Financial Services Group, Inc. | | | 910 | | | | 135,590 | |
| | |
Regions Financial Corp. | | | 11,637 | | | | 187,588 | |
| | |
Royal Bank of Canada | | | 3,680 | | | | 302,373 | |
| | |
Sberbank of Russia PJSC (ADR) | | | 13,114 | | | | 190,153 | |
| | |
Sumitomo Mitsui Financial Group, Inc. | | | 9,398 | | | | 289,973 | |
| | |
Toronto-Dominion Bank | | | 5,779 | | | | 326,519 | |
| | |
Truist Financial Corp. | | | 2,919 | | | | 139,908 | |
| | |
U.S. Bancorp. | | | 4,238 | | | | 197,448 | |
| | |
United Overseas Bank Ltd. | | | 16,928 | | | | 289,491 | |
| | | | | | | | |
| | | | 5,856,040 | |
| | | | | | | | |
| | | Shares | | | Value ($) | |
|
Capital Markets 1.4% | |
| | |
3i Group PLC | | | 8,237 | | | | 131,008 | |
| | |
Apollo Global Management, Inc. | | | 5,323 | | | | 260,721 | |
| | |
BlackRock, Inc. | | | 236 | | | | 170,283 | |
| | |
Blackstone Group, Inc. “A” | | | 1,957 | | | | 126,833 | |
| | |
Franklin Resources., Inc. | | | 7,101 | | | | 177,454 | |
| | |
Hong Kong Exchanges & Clearing Ltd. | | | 2,026 | | | | 111,470 | |
| | |
Magellan Financial Group Ltd. | | | 4,652 | | | | 193,805 | |
| | |
Partners Group Holding AG | | | 203 | | | | 241,856 | |
| | |
Standard Life Aberdeen PLC | | | 48,288 | | | | 186,585 | |
| | |
T. Rowe Price Group, Inc. | | | 1,275 | | | | 193,022 | |
| | | | | | | | |
| | | | 1,793,037 | |
|
Diversified Financial Services 0.2% | |
ORIX Corp. | | | 11,400 | | | | 175,267 | |
|
Insurance 2.8% | |
| | |
Admiral Group PLC | | | 4,476 | | | | 177,837 | |
| | |
Allianz SE (Registered) | | | 1,232 | | | | 302,429 | |
| | |
Fidelity National Financial, Inc. | | | 3,007 | | | | 117,544 | |
| | |
Legal & General Group PLC | | | 47,095 | | | | 173,084 | |
| | |
Manulife Financial Corp. | | | 17,433 | | | | 310,203 | |
| | |
Medibank Private Ltd. | | | 65,592 | | | | 151,079 | |
| | |
MetLife, Inc. | | | 3,034 | | | | 142,446 | |
| | |
MS&AD Insurance Group Holdings, Inc. | | | 3,845 | | | | 117,145 | |
| | |
Muenchener Rueckversicherungs-Gesellschaft AG (Registered) | | | 503 | | | | 152,001 | |
| | |
NN Group NV | | | 4,040 | | | | 174,914 | |
| | |
Phoenix Group Holdings PLC | | | 24,498 | | | | 236,263 | |
| | |
Poste Italiane SpA 144A | | | 15,516 | | | | 158,193 | |
| | |
Prudential Financial, Inc. | | | 3,826 | | | | 298,696 | |
| | |
Sampo Oyj “A” | | | 5,877 | | | | 248,731 | |
| | |
Sompo Holdings, Inc. | | | 2,918 | | | | 118,015 | |
| | |
Swiss Re AG | | | 3,297 | | | | 312,529 | |
| | |
Zurich Insurance Group AG | | | 828 | | | | 351,046 | |
| | | | | | | | |
| | | | 3,542,155 | |
|
| Health Care 6.1% | |
Biotechnology 1.1% | |
| | |
AbbVie, Inc. | | | 5,609 | | | | 601,005 | |
| | |
Amgen, Inc. | | | 1,309 | | | | 300,965 | |
| | |
BeiGene Ltd. (ADR)* | | | 525 | | | | 135,655 | |
| | |
Gilead Sciences, Inc. | | | 4,685 | | | | 272,948 | |
| | | | | | | | |
| | | | 1,310,573 | |
|
Health Care Equipment & Supplies 0.6% | |
| | |
Abbott Laboratories | | | 2,588 | | | | 283,360 | |
| | |
Coloplast AS “B” | | | 607 | | | | 92,282 | |
| | |
DexCom, Inc.* | | | 223 | | | | 82,447 | |
| | |
Medtronic PLC | | | 2,419 | | | | 283,362 | |
| | | | | | | | |
| | | | 741,451 | |
|
Health Care Providers & Services 0.5% | |
| | |
Cardinal Health, Inc. | | | 2,960 | | | | 158,538 | |
| | |
CVS Health Corp. | | | 3,105 | | | | 212,071 | |
| | |
UnitedHealth Group, Inc. | | | 804 | | | | 281,947 | |
| | | | | | | | |
| | | | 652,556 | |
|
Health Care Technology 0.2% | |
| | |
M3, Inc. | | | 1,600 | | | | 151,312 | |
| | |
Veeva Systems, Inc. “A”* | | | 360 | | | | 98,010 | |
| | | | | | | | |
| | | | 249,322 | |
The accompanying notes are an integral part of the financial statements.
| | | | |
Deutsche DWS Variable Series II — DWS Global Income Builder VIP | | | | | 9 |
| | | | | | | | |
| | | Shares | | | Value ($) | |
|
Pharmaceuticals 3.7% | |
| | |
Astellas Pharma, Inc. | | | 8,615 | | | | 133,100 | |
| | |
AstraZeneca PLC | | | 2,347 | | | | 237,536 | |
| | |
Bayer AG (Registered) | | | 5,218 | | | | 308,403 | |
| | |
Bristol-Myers Squibb Co. | | | 4,798 | | | | 297,620 | |
| | |
Chugai Pharmaceutical Co., Ltd. | | | 5,059 | | | | 270,328 | |
| | |
Eli Lilly & Co. | | | 1,700 | | | | 287,028 | |
| | |
GlaxoSmithKline PLC | | | 13,595 | | | | 250,019 | |
| | |
Hikma Pharmaceuticals PLC | | | 4,677 | | | | 161,393 | |
| | |
Johnson & Johnson | | | 2,585 | | | | 406,827 | |
| | |
Merck & Co., Inc. | | | 4,636 | | | | 379,225 | |
| | |
Novartis AG (Registered) | | | 4,231 | | | | 400,229 | |
| | |
Novo Nordisk AS ‘‘B” | | | 2,939 | | | | 204,060 | |
| | |
Orion Oyj “B” | | | 3,045 | | | | 139,800 | |
| | |
Pfizer, Inc. | | | 11,203 | | | | 412,382 | |
| | |
Roche Holding AG (Genusschein) | | | 1,160 | | | | 406,010 | |
| | |
Sanofi | | | 2,477 | | | | 239,615 | |
| | |
Takeda Pharmaceutical Co., Ltd. | | | 5,339 | | | | 194,505 | |
| | | | | | | | |
| | | | 4,728,080 | |
|
| Industrials 4.3% | |
Aerospace & Defense 0.4% | |
| | |
BAE Systems PLC | | | 31,969 | | | | 213,413 | |
| | |
Lockheed Martin Corp. | | | 405 | | | | 143,767 | |
| | |
Raytheon Technologies Corp. | | | 2,592 | | | | 185,354 | |
| | | | | | | | |
| | | | 542,534 | |
|
Air Freight & Logistics 0.6% | |
| | |
Deutsche Post AG (Registered) | | | 4,566 | | | | 230,100 | |
| | |
FedEx Corp. | | | 739 | | | | 191,859 | |
| | |
United Parcel Service, Inc. “B” | | | 2,230 | | | | 375,532 | |
| | | | | | | | |
| | | | 797,491 | |
|
Building Products 0.1% | |
Johnson Controls International PLC | | | 3,410 | | | | 158,872 | |
|
Commercial Services & Supplies 0.1% | |
| | |
Quad Graphics, Inc. | | | 2 | | | | 8 | |
| | |
Waste Management, Inc. | | | 1,165 | | | | 137,388 | |
| | | | | | | | |
| | | | 137,396 | |
|
Construction & Engineering 0.3% | |
| | |
Bouygues SA | | | 3,870 | | | | 159,207 | |
| | |
HOCHTIEF AG | | | 1,536 | | | | 152,216 | |
| | | | | | | | |
| | | | 311,423 | |
|
Electrical Equipment 0.4% | |
| | |
ABB Ltd. (Registered) | | | 6,455 | | | | 183,064 | |
| | |
Eaton Corp. PLC | | | 1,737 | | | | 208,683 | |
| | |
Emerson Electric Co. | | | 1,748 | | | | 140,487 | |
| | | | | | | | |
| | | | 532,234 | |
|
Industrial Conglomerates 0.8% | |
| | |
3M Co. | | | 1,116 | | | | 195,066 | |
| | |
CK Hutchison Holdings Ltd. | | | 32,373 | | | | 225,810 | |
| | |
Honeywell International, Inc. | | | 910 | | | | 193,557 | |
| | |
Jardine Matheson Holdings Ltd. | | | 2,558 | | | | 143,167 | |
| | |
Siemens AG (Registered) | | | 1,364 | | | | 199,417 | |
| | | | | | | | |
| | | | 957,017 | |
|
Machinery 0.2% | |
| | |
Cummins, Inc. | | | 586 | | | | 133,081 | |
| | |
Kone Oyj “B” | | | 1,266 | | | | 102,830 | |
| | | | | | | | |
| | | | 235,911 | |
| | | | | | | | |
| | | Shares | | | Value ($) | |
|
Professional Services 0.2% | |
| | |
Adecco Group AG (Registered) | | | 2,528 | | | | 169,634 | |
| | |
Thomson Reuters Corp. | | | 1,390 | | | | 113,764 | |
| | | | | | | | |
| | | | 283,398 | |
|
Road & Rail 0.3% | |
| | |
Uber Technologies, Inc.* | | | 3,182 | | | | 162,282 | |
| | |
Union Pacific Corp. | | | 952 | | | | 198,225 | |
| | | | | | | | |
| | | | 360,507 | |
|
Trading Companies & Distributors 0.9% | |
| | |
Fastenal Co. | | | 2,043 | | | | 99,760 | |
| | |
ITOCHU Corp. | | | 8,271 | | | | 237,982 | |
| | |
Mitsubishi Corp. | | | 12,498 | | | | 308,302 | |
| | |
Mitsui & Co., Ltd. | | | 14,263 | | | | 261,570 | |
| | |
Sumitomo Corp. | | | 17,301 | | | | 229,716 | |
| | | | | | | | |
| | | | 1,137,330 | |
|
| Information Technology 15.4% | |
Communications Equipment 0.4% | |
| | |
Cisco Systems, Inc. | | | 8,635 | | | | 386,416 | |
| | |
Telefonaktiebolaget LM Ericsson “B” | | | 11,870 | | | | 141,303 | |
| | | | | | | | |
| | | | 527,719 | |
|
Electronic Equipment, Instruments & Components 0.9% | |
| | |
Amphenol Corp. “A” | | | 910 | | | | 119,001 | |
| | |
CDW Corp. | | | 824 | | | | 108,595 | |
| | |
Cognex Corp. | | | 1,528 | | | | 122,676 | |
| | |
Corning, Inc. | | | 4,865 | | | | 175,140 | |
| | |
Keyence Corp. | | | 257 | | | | 144,650 | |
| | |
Murata Manufacturing Co., Ltd. | | | 2,455 | | | | 221,831 | |
| | |
TE Connectivity Ltd. | | | 1,517 | | | | 183,663 | |
| | | | | | | | |
| | | | 1,075,556 | |
|
IT Services 3.1% | |
| | |
Accenture PLC “A” | | | 1,226 | | | | 320,244 | |
| | |
Afterpay Ltd.* | | | 2,005 | | | | 184,339 | |
| | |
Automatic Data Processing, Inc. | | | 1,155 | | | | 203,511 | |
| | |
Broadridge Financial Solutions, Inc. | | | 706 | | | | 108,159 | |
| | |
Fujitsu Ltd. | | | 1,355 | | | | 196,072 | |
| | |
GDS Holdings Ltd. (ADR)* | | | 1,202 | | | | 112,555 | |
| | |
Infosys Ltd. (ADR) | | | 16,239 | | | | 275,251 | |
| | |
International Business Machines Corp. | | | 3,341 | | | | 420,565 | |
| | |
MasterCard, Inc. “A” | | | 573 | | | | 204,527 | |
| | |
Okta, Inc.* | | | 601 | | | | 152,810 | |
| | |
Paychex, Inc. | | | 2,628 | | | | 244,877 | |
| | |
PayPal Holdings, Inc.* | | | 1,382 | | | | 323,664 | |
| | |
Shopify, Inc. “A”* | | | 356 | | | | 401,984 | |
| | |
Square, Inc. “A”* | | | 1,983 | | | | 431,580 | |
| | |
Twilio, Inc. “A”* (a) | | | 412 | | | | 139,462 | |
| | |
Visa, Inc. “A” | | | 505 | | | | 110,459 | |
| | |
Western Union Co. | | | 4,014 | | | | 88,067 | |
| | | | | | | | |
| | | | 3,918,126 | |
|
Semiconductors & Semiconductor Equipment 3.5% | |
| | |
Advanced Micro Devices, Inc.* | | | 2,163 | | | | 198,369 | |
| | |
Analog Devices, Inc. | | | 1,158 | | | | 171,071 | |
| | |
Applied Materials, Inc. | | | 1,528 | | | | 131,866 | |
| | |
Broadcom, Inc. | | | 1,163 | | | | 509,220 | |
| | |
Enphase Energy, Inc.* | | | 1,300 | | | | 228,111 | |
| | |
Intel Corp. | | | 4,527 | | | | 225,535 | |
| | |
KLA Corp. | | | 890 | | | | 230,430 | |
The accompanying notes are an integral part of the financial statements.
| | | | | | |
| | 10 | | | | | | Deutsche DWS Variable Series II — DWS Global Income Builder VIP |
| | | | | | | | |
| | | Shares | | | Value ($) | |
| | |
Lam Research Corp. | | | 462 | | | | 218,189 | |
| | |
Marvell Technology Group Ltd. | | | 2,609 | | | | 124,032 | |
| | |
NVIDIA Corp. | | | 721 | | | | 376,506 | |
| | |
QUALCOMM, Inc. | | | 3,006 | | | | 457,934 | |
| | |
Skyworks Solutions, Inc. | | | 721 | | | | 110,227 | |
| | |
SolarEdge Technologies, Inc.* | | | 600 | | | | 191,472 | |
| | |
Taiwan Semiconductor Manufacturing Co., Ltd. (ADR) | | | 5,383 | | | | 586,962 | |
| | |
Texas Instruments, Inc. | | | 2,255 | | | | 370,113 | |
| | |
Tokyo Electron Ltd. | | | 395 | | | | 147,521 | |
| | |
United Microelectronics Corp. (ADR) (a) | | | 20,100 | | | | 169,443 | |
| | | | | | | | |
| | | | 4,447,001 | |
|
Software 3.9% | |
| | |
Adobe, Inc.* | | | 695 | | | | 347,583 | |
| | |
Autodesk, Inc.* | | | 429 | | | | 130,991 | |
| | |
DocuSign, Inc.* | | | 755 | | | | 167,836 | |
| | |
Intuit, Inc. | | | 537 | | | | 203,979 | |
| | |
Microsoft Corp. | | | 9,314 | | | | 2,071,620 | |
| | |
Oracle Corp. | | | 4,489 | | | | 290,393 | |
| | |
Paycom Software, Inc.* | | | 392 | | | | 177,282 | |
| | |
salesforce.com, Inc.* | | | 940 | | | | 209,178 | |
| | |
SAP SE | | | 1,038 | | | | 137,653 | |
| | |
ServiceNow, Inc.* | | | 564 | | | | 310,443 | |
| | |
Splunk, Inc.* | | | 532 | | | | 90,381 | |
| | |
Trade Desk, Inc. “A”* | | | 323 | | | | 258,723 | |
| | |
Workday, Inc. “A”* | | | 532 | | | | 127,473 | |
| | |
Zoom Video Communications, Inc. “A”* | | | 599 | | | | 202,055 | |
| | |
Zscaler, Inc.* | | | 1,356 | | | | 270,807 | |
| | | | | | | | |
| | | | 4,996,397 | |
|
Technology Hardware, Storage & Peripherals 3.6% | |
| | |
Apple, Inc. | | | 22,039 | | | | 2,924,355 | |
| | |
Hewlett Packard Enterprise Co. | | | 11,595 | | | | 137,401 | |
| | |
HP, Inc. | | | 7,832 | | | | 192,589 | |
| | |
Logitech International SA (Registered) | | | 1,567 | | | | 153,825 | |
| | |
NetApp, Inc. | | | 3,746 | | | | 248,135 | |
| | |
Samsung Electronics Co., Ltd. (GDR) (Registered) | | | 191 | | | | 348,575 | |
| | |
Seagate Technology PLC | | | 5,761 | | | | 358,104 | |
| | |
Seiko Epson Corp. | | | 15,586 | | | | 231,382 | |
| | | | | | | | |
| | | | 4,594,366 | |
|
| Materials 3.2% | |
Chemicals 1.1% | |
| | |
Air Products & Chemicals, Inc. | | | 597 | | | | 163,112 | |
| | |
BASF SE | | | 1,981 | | | | 156,463 | |
| | |
Dow, Inc. | | | 6,085 | | | | 337,717 | |
| | |
Linde PLC | | | 411 | | | | 108,303 | |
| | |
LyondellBasell Industries NV “A” | | | 2,383 | | | | 218,426 | |
| | |
Nutrien Ltd. | | | 5,133 | | | | 246,952 | |
| | |
Sociedad Quimica y Minera de Chile SA (ADR) | | | 3,210 | | | | 157,579 | |
| | | | | | | | |
| | | | 1,388,552 | |
|
Construction Materials 0.2% | |
LafargeHolcim Ltd. (Registered) | | | 4,939 | | | | 273,727 | |
|
Containers & Packaging 0.3% | |
| | |
Amcor PLC | | | 15,179 | | | | 178,657 | |
| | |
International Paper Co. | | | 3,575 | | | | 177,749 | |
| | | | | | | | |
| | | | 356,406 | |
| | | | | | | | |
| | | Shares | | | Value ($) | |
|
Metals & Mining 1.5% | |
| | |
Anglo American PLC | | | 3,930 | | | | 130,893 | |
| | |
B2Gold Corp. | | | 25,136 | | | | 140,796 | |
| | |
BHP Group Ltd. | | | 11,105 | | | | 362,908 | |
| | |
BHP Group PLC | | | 9,788 | | | | 257,989 | |
| | |
Rio Tinto Ltd. | | | 3,603 | | | | 317,763 | |
| | |
Rio Tinto PLC | | | 6,321 | | | | 474,139 | |
| | |
Vale SA (ADR) | | | 13,248 | | | | 222,037 | |
| | | | | | | | |
| | | | 1,906,525 | |
|
Paper & Forest Products 0.1% | |
UPM-Kymmene Oyj | | | 3,838 | | | | 143,270 | |
|
| Real Estate 1.8% | |
Equity Real Estate Investment Trusts (REITs) 1.4% | |
| | |
Ascendas Real Estate Investment Trust | | | 39,043 | | | | 88,332 | |
| | |
CapitaLand Integrated Commercial Trust | | | 103,306 | | | | 169,259 | |
| | |
Crown Castle International Corp. | | | 883 | | | | 140,565 | |
| | |
Link REIT | | | 17,400 | | | | 158,387 | |
| | |
Medical Properties Trust, Inc. | | | 12,525 | | | | 272,920 | |
| | |
Omega Healthcare Investors, Inc. | | | 6,700 | | | | 243,344 | |
| | |
Prologis, Inc. | | | 929 | | | | 92,584 | |
| | |
Public Storage | | | 495 | | | | 114,310 | |
| | |
Realty Income Corp. | | | 1,642 | | | | 102,083 | |
| | |
VICI Properties, Inc. | | | 10,592 | | | | 270,096 | |
| | |
WP Carey, Inc. | | | 1,819 | | | | 128,385 | |
| | | | | | | | |
| | | | 1,780,265 | |
|
Real Estate Management & Development 0.4% | |
| | |
New World Development Co., Ltd. | | | 34,474 | | | | 160,657 | |
| | |
Sun Hung Kai Properties Ltd. | | | 11,235 | | | | 145,052 | |
| | |
Wharf Real Estate Investment Co., Ltd. | | | 32,000 | | | | 166,798 | |
| | | | | | | | |
| | | | 472,507 | |
|
| Utilities 3.3% | |
Electric Utilities 2.4% | |
| | |
American Electric Power Co., Inc. | | | 1,587 | | | | 132,149 | |
| | |
CLP Holdings Ltd. | | | 10,214 | | | | 94,471 | |
| | |
Duke Energy Corp. | | | 2,108 | | | | 193,008 | |
| | |
EDP — Energias de Portugal SA | | | 35,803 | | | | 225,635 | |
| | |
Endesa SA | | | 10,334 | | | | 282,902 | |
| | |
Enel SpA | | | 27,939 | | | | 283,293 | |
| | |
Entergy Corp. | | | 1,301 | | | | 129,892 | |
| | |
Exelon Corp. | | | 3,174 | | | | 134,006 | |
| | |
Fortum Oyj | | | 13,314 | | | | 321,874 | |
| | |
Iberdrola SA | | | 10,698 | | | | 152,876 | |
| | |
NextEra Energy, Inc. | | | 2,584 | | | | 199,356 | |
| | |
OGE Energy Corp. | | | 3,065 | | | | 97,651 | |
| | |
PPL Corp. | | | 7,426 | | | | 209,413 | |
| | |
Red Electrica Corp. SA | | | 8,578 | | | | 176,027 | |
| | |
Southern Co. | | | 3,513 | | | | 215,804 | |
| | |
SSE PLC | | | 11,570 | | | | 237,205 | |
| | | | | | | | |
| | | | 3,085,562 | |
|
Gas Utilities 0.2% | |
Snam SpA | | | 44,224 | | | | 249,621 | |
|
Multi-Utilities 0.7% | |
| | |
Consolidated Edison, Inc. | | | 1,633 | | | | 118,017 | |
| | |
Dominion Energy, Inc | | | 2,838 | | | | 213,418 | |
| | |
DTE Energy Co. | | | 1,161 | | | | 140,957 | |
| | |
National Grid PLC | | | 13,523 | | | | 160,427 | |
The accompanying notes are an integral part of the financial statements.
| | | | |
Deutsche DWS Variable Series II — DWS Global Income Builder VIP | | | | | 11 |
| | | | | | | | |
| | | Shares | | | Value ($) | |
| | |
Public Service Enterprise Group, Inc. | | | 2,398 | | | | 139,803 | |
| | |
Sempra Energy | | | 971 | | | | 123,715 | |
| | | | | | | | |
| | | | | 896,337 | |
Total Common Stocks (Cost $56,074,014) | | | | 75,292,153 | |
|
| Preferred Stocks 4.2% | |
| Financials 2.7% | |
| | |
AGNC Investment Corp. Series C, 7.0% | | | 14,427 | | | | 367,744 | |
| | |
Capital One Financial Corp. Series G, 5.2% | | | 10,000 | | | | 265,200 | |
| | |
Citigroup, Inc. Series S, 6.3% | | | 15,000 | | | | 383,400 | |
| | |
Fifth Third Bancorp. Series I, 6.625% | | | 10,000 | | | | 291,200 | |
| | |
JPMorgan Chase & Co. Series AA, 6.1% | | | 15,000 | | | | 386,250 | |
| | |
KeyCorp. Series E, 6.125% | | | 10,000 | | | | 292,700 | |
| | |
Morgan Stanley Series K, 5.85% | | | 10,000 | | | | 288,500 | |
| | |
The Goldman Sachs Group, Inc. Series J, 5.5% | | | 17,000 | | | | 464,610 | |
| | |
Truist Financial Corp. Series H, 5.625% | | | 10,000 | | | | 259,900 | |
| | |
Wells Fargo & Co. Series Y, 5.625% | | | 15,000 | | | | 401,100 | |
| | | | | | | | |
| | | | | | | 3,400,604 | |
|
| Real Estate 0.9% | |
| | |
Kimco Realty Corp. Series L, 5.125% | | | 15,000 | | | | 394,050 | |
| | |
Prologis, Inc. Series Q, 8.54% | | | 164 | | | | 11,316 | |
| | |
Simon Property Group, Inc. Series J, 8.375% | | | 8,000 | | | | 564,400 | |
| | |
VEREIT, Inc. Series F, 6.7% | | | 5,203 | | | | 130,856 | |
| | | | | | | | |
| | | | | | | 1,100,622 | |
|
| Utilities 0.6% | |
| | |
Dominion Energy, Inc. Series A, 5.25% | | | 30,000 | | | | 785,400 | |
Total Preferred Stocks (Cost $5,298,828) | | | | 5,286,626 | |
|
| Warrants 0.0% | |
| Materials | |
Hercules Trust II, Expiration Date 3/31/2029* (b) (Cost $30,283) | | | 170 | | | | 8,109 | |
| | |
| | | Principal
Amount ($)(c) | | | Value ($) | |
| Corporate Bonds 15.2% | |
| Communication Services 2.7% | |
| | |
Arches Buyer, Inc., 144A, 4.25%, 6/1/2028 | | | 30,000 | | | | 30,381 | |
|
AT&T, Inc.: | |
| | |
1.65%, 2/1/2028 | | | 50,000 | | | | 51,015 | |
| | |
2.25%, 2/1/2032 | | | 95,000 | | | | 96,370 | |
| | |
2.75%, 6/1/2031 | | | 135,000 | | | | 144,264 | |
| | |
3.65%, 6/1/2051 | | | 100,000 | | | | 104,709 | |
| | |
CCO Holdings LLC: | | | | | | | | |
| | |
144A, 4.75%, 3/1/2030 | | | 100,000 | | | | 107,900 | |
| | |
144A, 5.875%, 5/1/2027 | | | 250,000 | | | | 259,687 | |
| | | | | | | | |
| | | Principal
Amount ($)(c) | | | Value ($) | |
| | |
Charter Communications Operating LLC: | | | | | | | | |
| | |
3.7%, 4/1/2051 | | | 140,000 | | | | 145,384 | |
| | |
5.05%, 3/30/2029 | | | 100,000 | | | | 121,586 | |
| | |
CSC Holdings LLC: | | | | | | | | |
| | |
144A, 3.375%, 2/15/2031 | | | 200,000 | | | | 196,250 | |
| | |
144A, 4.125%, 12/1/2030 | | | 200,000 | | | | 209,120 | |
| | |
Discovery Communications LLC, 144A, 4.0%, 9/15/2055 | | | 50,000 | | | | 55,965 | |
| | |
Netflix, Inc.: | | | | | | | | |
| | |
4.375%, 11/15/2026 | | | 100,000 | | | | 110,875 | |
| | |
5.5%, 2/15/2022 | | | 175,000 | | | | 183,094 | |
| | |
5.875%, 11/15/2028 | | | 140,000 | | | | 167,825 | |
| | |
NortonLifeLock, Inc., 3.95%, 6/15/2022 | | | 275,000 | | | | 280,844 | |
| | |
T-Mobile U.S.A., Inc.: | | | | | | | | |
| | |
144A, 2.05%, 2/15/2028 | | | 30,000 | | | | 31,205 | |
| | |
144A, 2.25%, 11/15/2031 | | | 115,000 | | | | 118,029 | |
| | |
144A, 3.3%, 2/15/2051 | | | 50,000 | | | | 51,441 | |
| | |
144A, 3.6%, 11/15/2060 | | | 25,000 | | | | 26,536 | |
| | |
144A, 4.375%, 4/15/2040 | | | 60,000 | | | | 73,222 | |
| | |
144A, 4.5%, 4/15/2050 | | | 80,000 | | | | 98,671 | |
| | |
VeriSign, Inc.: | | | | | | | | |
| | |
4.625%, 5/1/2023 | | | 300,000 | | | | 302,625 | |
| | |
5.25%, 4/1/2025 | | | 300,000 | | | | 340,875 | |
| | |
Verizon Communications, Inc., 2.65%, 11/20/2040 | | | 40,000 | | | | 40,391 | |
| | |
ViacomCBS, Inc., 4.2%, 5/19/2032 | | | 55,000 | | | | 66,283 | |
| | | | | | | | |
| | | | | | | 3,414,547 | |
|
| Consumer Discretionary 1.4% | |
| | |
1011778 BC Unlimited Liability Co., 144A, 4.375%, 1/15/2028 | | | 225,000 | | | | 231,750 | |
| | |
Carnival Corp., 144A, 7.625%, 3/1/2026 | | | 97,000 | | | | 105,681 | |
| | |
Dollar General Corp., 4.125%, 4/3/2050 | | | 20,000 | | | | 25,311 | |
| | |
Ford Motor Credit Co. LLC: | | | | | | | | |
| | |
3.37%, 11/17/2023 | | | 350,000 | | | | 356,926 | |
| | |
3.375%, 11/13/2025 | | | 261,000 | | | | 268,141 | |
| | |
Hilton Domestic Operating Co., Inc., 144A, 4.0%, 5/1/2031 | | | 125,000 | | | | 131,889 | |
| | |
Nissan Motor Co., Ltd., 144A, 4.345%, 9/17/2027 | | | 395,000 | | | | 436,288 | |
| | |
QVC, Inc., 4.75%, 2/15/2027 | | | 185,000 | | | | 198,413 | |
| | | | | | | | |
| | | | | | | 1,754,399 | |
|
| Consumer Staples 0.4% | |
| | |
Albertsons Companies, Inc.: | | | | | | | | |
| | |
144A, 3.25%, 3/15/2026 | | | 100,000 | | | | 101,500 | |
| | |
144A, 3.5%, 3/15/2029 | | | 50,000 | | | | 50,593 | |
| | |
Altria Group, Inc.: | | | | | | | | |
| | |
3.875%, 9/16/2046 | | | 20,000 | | | | 21,126 | |
| | |
4.45%, 5/6/2050 | | | 40,000 | | | | 47,289 | |
| | |
Anheuser-Busch InBev Worldwide, Inc.: | | | | | | | | |
| | |
4.439%, 10/6/2048 | | | 50,000 | | | | 62,236 | |
| | |
5.55%, 1/23/2049 | | | 121,000 | | | | 172,047 | |
| | |
BAT Capital Corp., 2.726%, 3/25/2031 | | | 60,000 | | | | 62,144 | |
| | |
Keurig Dr Pepper, Inc., 3.8%, 5/1/2050 | | | 15,000 | | | | 17,966 | |
| | |
Smithfield Foods, Inc., 144A, 3.0%, 10/15/2030 | | | 40,000 | | | | 42,323 | |
| | | | | | | | |
| | | | | | | 577,224 | |
The accompanying notes are an integral part of the financial statements.
| | | | | | |
| | 12 | | | | | | Deutsche DWS Variable Series II — DWS Global Income Builder VIP |
| | | | | | | | |
| | | Principal
Amount ($)(c) | | | Value ($) | |
|
| Energy 2.4% | |
| | |
BP Capital Markets America, Inc., 2.939%, 6/4/2051 | | | 75,000 | | | | 76,615 | |
| | |
Cheniere Corpus Christi Holdings LLC, 5.875%, 3/31/2025 | | | 200,000 | | | | 232,755 | |
| | |
Devon Energy Corp., 5.0%, 6/15/2045 | | | 60,000 | | | | 70,672 | |
| | |
Energy Transfer Operating LP, 5.5%, 6/1/2027 | | | 100,000 | | | | 117,700 | |
| | |
Enterprise Products Operating LLC, 4.2%, 1/31/2050 | | | 172,000 | | | | 202,066 | |
| | |
Hess Corp., 5.8%, 4/1/2047 | | | 70,000 | | | | 89,066 | |
| | |
Marathon Petroleum Corp., 4.7%, 5/1/2025 | | | 110,000 | | | | 126,011 | |
| | |
MPLX LP, 2.65%, 8/15/2030 | | | 35,000 | | | | 36,680 | |
| | |
Occidental Petroleum Corp.: | | | | | | | | |
| | |
5.5%, 12/1/2025 | | | 10,000 | | | | 10,426 | |
| | |
6.125%, 1/1/2031 | | | 15,000 | | | | 16,053 | |
| | |
Petrobras Global Finance BV, 5.093%, 1/15/2030 | | | 625,000 | | | | 698,437 | |
| | |
Petroleos Mexicanos, 6.84%, 1/23/2030 | | | 625,000 | | | | 654,238 | |
| | |
Plains All American Pipeline LP, 3.8%, 9/15/2030 | | | 50,000 | | | | 53,753 | |
| | |
Saudi Arabian Oil Co., 144A, 2.25%, 11/24/2030 | | | 625,000 | | | | 636,465 | |
| | | | | | | | |
| | | | | | | 3,020,937 | |
|
| Financials 3.1% | |
| | |
AerCap Ireland Capital DAC: | | | | | | | | |
| | |
3.15%, 2/15/2024 | | | 300,000 | | | | 314,479 | |
| | |
4.625%, 10/15/2027 | | | 300,000 | | | | 339,720 | |
| | |
Air Lease Corp., 3.0%, 2/1/2030 | | | 125,000 | | | | 128,325 | |
| | |
Avolon Holdings Funding Ltd., 144A, 4.25%, 4/15/2026 | | | 40,000 | | | | 43,095 | |
| | |
Banco Nacional de Panama, 144A, 2.5%, 8/11/2030 | | | 200,000 | | | | 200,000 | |
| | |
Bank of America Corp.: | | | | | | | | |
| | |
2.676%, 6/19/2041 | | | 60,000 | | | | 62,514 | |
| | |
4.3%, Perpetual (d) | | | 102,000 | | | | 105,168 | |
| | |
Barclays PLC, 2.852%, 5/7/2026 | | | 200,000 | | | | 214,788 | |
| | |
Blackstone Secured Lending Fund, 144A, 3.625%, 1/15/2026 | | | 155,000 | | | | 159,429 | |
| | |
BPCE SA, 144A, 4.875%, 4/1/2026 | | | 300,000 | | | | 352,798 | |
| | |
Charles Schwab Corp., 4.0%, Perpetual (d) | | | 125,000 | | | | 131,562 | |
| | |
Citigroup, Inc.: | | | | | | | | |
| | |
2.572%, 6/3/2031 | | | 130,000 | | | | 138,562 | |
| | |
4.0%, Perpetual (d) | | | 300,000 | | | | 307,875 | |
| | |
HSBC Holdings PLC, 4.6%, Perpetual (d) | | | 250,000 | | | | 254,405 | |
| | |
JPMorgan Chase & Co., 2.956%, 5/13/2031 | | | 55,000 | | | | 60,313 | |
| | |
Morgan Stanley, 1.794%, 2/13/2032 | | | 45,000 | | | | 45,322 | |
| | |
OneMain Finance Corp., 4.0%, 9/15/2030 | | | 25,000 | | | | 25,940 | |
| | |
Park Aerospace Holdings Ltd., 144A, 5.25%, 8/15/2022 | | | 12,000 | | | | 12,594 | |
| | |
REC Ltd., 144A, 4.75%, 5/19/2023 | | | 200,000 | | | | 213,312 | |
| | |
Societe Generale SA, 144A, 5.375%, Perpetual (d) | | | 250,000 | | | | 265,092 | |
| | |
The Goldman Sachs Group, Inc., 4.4%, Perpetual (a) (d) | | | 31,000 | | | | 31,698 | |
| | | | | | | | |
| | | Principal
Amount ($)(c) | | | Value ($) | |
| | |
Truist Financial Corp., 4.8%, Perpetual (d) | | | 300,000 | | | | 316,868 | |
| | |
Westpac Banking Corp., 5.0%, Perpetual (d) | | | 200,000 | | | | 211,325 | |
| | | | | | | | |
| | | | | | | 3,935,184 | |
|
| Health Care 1.3% | |
| | |
AbbVie, Inc., 4.875%, 11/14/2048 | | | 75,000 | | | | 101,435 | |
| | |
Bausch Health Companies, Inc., 144A, 5.25%, 2/15/2031 | | | 50,000 | | | | 52,236 | |
| | |
Biogen, Inc., 3.15%, 5/1/2050 | | | 50,000 | | | | 51,846 | |
| | |
CVS Health Corp., 5.05%, 3/25/2048 | | | 175,000 | | | | 237,174 | |
| | |
Fresenius Medical Care U.S. Finance III, Inc., 144A, 2.375%, 2/16/2031 | | | 150,000 | | | | 152,453 | |
| | |
Gilead Sciences, Inc., 2.8%, 10/1/2050 | | | 50,000 | | | | 49,621 | |
| | |
HCA, Inc., 5.25%, 6/15/2026 | | | 300,000 | | | | 355,051 | |
| | |
Hologic, Inc., 144A, 3.25%, 2/15/2029 | | | 60,000 | | | | 61,050 | |
| | |
Teva Pharmaceutical Finance Netherlands III BV, 3.15%, 10/1/2026 | | | 625,000 | | | | 600,788 | |
| | | | | | | | |
| | | | | | | 1,661,654 | |
|
| Industrials 1.5% | |
| | |
Adani Ports & Special Economic Zone Ltd., 144A, 4.2%, 8/4/2027 | | | 200,000 | | | | 214,637 | |
| | |
Boeing Co.: | | | | | | | | |
| | |
1.95%, 2/1/2024 | | | 105,000 | | | | 108,137 | |
| | |
2.7%, 5/1/2022 | | | 135,000 | | | | 138,796 | |
| | |
2.75%, 2/1/2026 | | | 145,000 | | | | 152,475 | |
| | |
4.508%, 5/1/2023 | | | 140,000 | | | | 151,317 | |
| | |
4.875%, 5/1/2025 | | | 98,000 | | | | 111,711 | |
| | |
5.04%, 5/1/2027 | | | 60,000 | | | | 70,144 | |
| | |
Delta Air Lines, Inc., 144A, 4.5%, 10/20/2025 | | | 30,000 | | | | 32,066 | |
| | |
Gartner, Inc., 144A, 3.75%, 10/1/2030 | | | 60,000 | | | | 63,226 | |
| | |
General Electric Co.: | | | | | | | | |
| | |
3.45%, 5/1/2027 | | | 50,000 | | | | 56,552 | |
| | |
3.625%, 5/1/2030 | | | 40,000 | | | | 45,715 | |
| | |
GFL Environmental, Inc.: | | | | | | | | |
| | |
144A, 3.75%, 8/1/2025 | | | 100,000 | | | | 102,500 | |
| | |
144A, 4.0%, 8/1/2028 | | | 150,000 | | | | 151,125 | |
| | |
Nielsen Finance LLC, 144A, 5.625%, 10/1/2028 | | | 110,000 | | | | 119,521 | |
| | |
Prime Security Services Borrower LLC: | | | | | | | | |
| | |
144A, 5.25%, 4/15/2024 | | | 255,000 | | | | 272,212 | |
| | |
144A, 6.25%, 1/15/2028 | | | 70,000 | | | | 75,151 | |
| | | | | | | | |
| | | | | | | 1,865,285 | |
|
| Information Technology 0.4% | |
| | |
Booz Allen Hamilton, Inc., 144A, 3.875%, 9/1/2028 | | | 40,000 | | | | 41,200 | |
| | |
Broadcom, Inc., 5.0%, 4/15/2030 | | | 70,000 | | | | 85,093 | |
| | |
Dell International LLC, 144A, 8.35%, 7/15/2046 | | | 60,000 | | | | 90,769 | |
| | |
Open Text Corp., 144A, 3.875%, 2/15/2028 | | | 175,000 | | | | 182,000 | |
| | |
Oracle Corp., 3.6%, 4/1/2050 | | | 25,000 | | | | 29,127 | |
The accompanying notes are an integral part of the financial statements.
| | | | |
Deutsche DWS Variable Series II — DWS Global Income Builder VIP | | | | | 13 |
| | | | | | | | |
| | | Principal
Amount ($)(c) | | | Value ($) | |
| | |
Qorvo, Inc., 144A, 3.375%, 4/1/2031 | | | 50,000 | | | | 51,625 | |
| | |
Seagate HDD Cayman: | | | | | | | | |
| | |
144A, 3.125%, 7/15/2029 | | | 35,000 | | | | 35,004 | |
| | |
144A, 3.375%, 7/15/2031 | | | 25,000 | | | | 25,135 | |
| | | | | | | | |
| | | | | | | 539,953 | |
|
| Materials 0.4% | |
| | |
LYB International Finance III LLC, 3.625%, 4/1/2051 | | | 30,000 | | | | 32,782 | |
| | |
MEGlobal Canada ULC, 144A, 5.0%, 5/18/2025 | | | 256,000 | | | | 288,000 | |
| | |
Nutrition & Biosciences, Inc., 144A, 3.468%, 12/1/2050 | | | 57,000 | | | | 61,918 | |
| | |
Reynolds Group Issuer, Inc, 144A, 4.0%, 10/15/2027 | | | 40,000 | | | | 41,000 | |
| | |
Valvoline, Inc., 144A, 3.625%, 6/15/2031 (e) | | | 20,000 | | | | 20,525 | |
| | |
WRKCo., Inc., 3.0%, 6/15/2033 | | | 30,000 | | | | 32,960 | |
| | | | | | | | |
| | | | | | | 477,185 | |
|
| Real Estate 0.7% | |
| | |
American Tower Corp.: | | | | | | | | |
| | |
(REIT), 2.95%, 1/15/2051 | | | 35,000 | | | | 35,084 | |
| | |
(REIT), 3.8%, 8/15/2029 | | | 165,000 | | | | 191,835 | |
| | |
Equinix, Inc., (REIT), 2.15%, 7/15/2030 | | | 34,000 | | | | 34,583 | |
| | |
Iron Mountain, Inc.: | | | | | | | | |
| | |
144A, (REIT), 5.0%, 7/15/2028 | | | 55,000 | | | | 58,430 | |
| | |
144A, (REIT), 5.25%, 7/15/2030 | | | 105,000 | | | | 113,400 | |
| | |
MPT Operating Partnership LP, (REIT), 3.5%, 3/15/2031 | | | 195,000 | | | | 201,338 | |
| | |
Office Properties Income Trust, (REIT), 4.15%, 2/1/2022 | | | 60,000 | | | | 61,088 | |
| | |
Omega Healthcare Investors, Inc.: | | | | | | | | |
| | |
(REIT), 4.5%, 4/1/2027 | | | 50,000 | | | | 56,238 | |
| | |
(REIT), 4.75%, 1/15/2028 | | | 60,000 | | | | 68,357 | |
| | |
VEREIT Operating Partnership LP, (REIT), 2.85%, 12/15/2032 | | | 30,000 | | | | 31,369 | |
| | |
Welltower, Inc., (REIT), 2.75%, 1/15/2031 | | | 40,000 | | | | 42,325 | |
| | | | | | | | |
| | | | | | | 894,047 | |
|
| Utilities 0.9% | |
| | |
ENN Energy Holdings, Ltd., 144A, 2.625%, 9/17/2030 | | | 200,000 | | | | 201,112 | |
| | |
NextEra Energy Operating Partners LP: | | | | | | | | |
| | |
144A, 3.875%, 10/15/2026 | | | 190,000 | | | | 202,825 | |
| | |
144A, 4.25%, 7/15/2024 | | | 275,000 | | | | 294,250 | |
| | |
Pacific Gas and Electric Co.: | | | | | | | | |
| | |
2.5%, 2/1/2031 | | | 20,000 | | | | 20,073 | |
| | |
3.3%, 8/1/2040 | | | 70,000 | | | | 69,864 | |
| | |
3.5%, 8/1/2050 | | | 25,000 | | | | 24,848 | |
| | |
Perusahaan Listrik Negara PT, 144A, 2.875%, 10/25/2025 | | | EUR 260,000 | | | | 342,458 | |
| | | | | | | | |
| | | | | | | | 1,155,430 | |
Total Corporate Bonds (Cost $18,134,382) | | | | 19,295,845 | |
| | | | | | | | |
| | | Principal
Amount ($)(c) | | | Value ($) | |
|
| Asset-Backed 5.6% | |
| Automobile Receivables 3.0% | |
| | |
AmeriCredit Automobile Receivables Trust, “C”, Series 2019-2, 2.74%, 4/18/2025 | | | 720,000 | | | | 749,917 | |
| | |
Avis Budget Rental Car Funding AESOP LLC, “C”, Series 2019-1A, 144A, 4.53%, 3/20/2023 | | | 100,000 | | | | 101,686 | |
| | |
CPS Auto Receivables Trust, “E”, Series 2015-C, 144A, 6.54%, 8/16/2021 | | | 500,000 | | | | 501,014 | |
| | |
Flagship Credit Auto Trust, “C”, Series 2019-4, 144A, 2.77%, 12/15/2025 | | | 1,100,000 | | | | 1,144,751 | |
| | |
GMF Floorplan Owner Revolving Trust, “C”, Series 2019-1, 144A, 3.06%, 4/15/2024 | | | 260,000 | | | | 266,666 | |
| | |
Hertz Vehicle Financing II LP, “B”, Series 2017-2A, 144A, 4.2%, 10/25/2023 | | | 500,000 | | | | 501,363 | |
| | |
Hyundai Auto Receivables Trust, “C”, Series 2019-B, 2.4%, 6/15/2026 | | | 500,000 | | | | 522,243 | |
| | | | | |
| | | | | | | 3,787,640 | |
|
| Credit Card Receivables 0.6% | |
Fair Square Issuance Trust, “A”, Series 2020-AA, 144A, 2.9%, 9/20/2024 | | | 800,000 | | | | 808,927 | |
|
| Miscellaneous 2.0% | |
| | |
DB Master Finance LLC, “A2I”, Series 2019-1A, 144A, 3.787%, 5/20/2049 | | | 217,250 | | | | 222,625 | |
| | |
Domino’s Pizza Master Issuer LLC, “A23”, Series 2017-1A, 144A, 4.118%, 7/25/2047 | | | 329,800 | | | | 353,315 | |
| | |
MVW Owner Trust, “A”, Series 2019-1A, 144A, 2.89%, 11/20/2036 | | | 321,537 | | | | 333,653 | |
| | |
RR 8 Ltd., “A1B”, Series 2020-8A, 144A, 3-month USD-LIBOR + 1.450%, 1.687%**, 4/15/2033 | | | 490,000 | | | | 491,517 | |
| | |
Sierra Timeshare Receivables Funding LLC, “A”, Series 2020-2A, 144A, 1.33%, 7/20/2037 | | | 497,991 | | | | 500,316 | |
| | |
Taco Bell Funding LLC, “A2I”, Series 2018-1A, 144A, 4.318%, 11/25/2048 | | | 490,000 | | | | 497,002 | |
| | |
Wendy’s Funding LLC, “A2I”, Series 2018-1A, 144A, 3.573%, 3/15/2048 | | | 155,200 | | | | 159,986 | |
| | | | | | | | |
| | | | | | | | 2,558,414 | |
Total Asset-Backed (Cost $7,021,431) | | | | 7,154,981 | |
|
| Mortgage-Backed Securities Pass-Throughs 3.8% | |
| | |
Federal Home Loan Mortgage Corp., 6.0%, 3/1/2038 | | | 2,072 | | | | 2,433 | |
The accompanying notes are an integral part of the financial statements.
| | | | | | |
| | 14 | | | | | | Deutsche DWS Variable Series II — DWS Global Income Builder VIP |
| | | | | | | | |
| | | Principal
Amount ($)(c) | | | Value ($) | |
| | |
Federal National Mortgage Association: | | | | | | | | |
| | |
2.0%, 1/1/2051 (e) | | | 2,300,000 | | | | 2,388,826 | |
| | |
4.5%, 9/1/2035 | | | 3,147 | | | | 3,526 | |
| | |
6.0%, 1/1/2024 | | | 3,838 | | | | 4,030 | |
| | |
Government National Mortgage Association, 2.0%, 1/1/2051 (e) | | | 2,300,000 | | | | 2,404,029 | |
Total Mortgage-Backed Securities Pass-Throughs (Cost $4,778,652) | | | | 4,802,844 | |
|
| Commercial Mortgage-Backed Securities 3.9% | |
| | |
BX Commercial Mortgage Trust, “D”, Series 2018-IND, 144A, 1-month USD-LIBOR + 1.300%, 1.459%**, 11/15/2035 | | | 175,000 | | | | 174,561 | |
| | |
CFK Trust, “A”, Series 2020-MF2, 144A, 2.387%, 3/15/2039 | | | 750,000 | | | | 781,479 | |
| | |
Citigroup Commercial Mortgage Trust: | | | | | | | | |
| | |
“A”, Series 2020-555, 144A, 2.647%, 12/10/2041 | | | 700,000 | | | | 736,572 | |
| | |
“D”, Series 2019-PRM, 144A, 4.35%, 5/10/2036 | | | 500,000 | | | | 520,119 | |
| | |
Credit Suisse Commercial Mortgage Trust, “B”, Series 2020-TMIC, 144A, 1-month USD-LIBOR + 5.000%, 5.25%**, 12/15/2035 | | | 700,000 | | | | 701,357 | |
| | |
FHLMC Multifamily Structured Pass-Through Certificates: | | | | | | | | |
| | |
“X1”, Series K043, Interest Only, 0.528%**, 12/25/2024 | | | 4,797,953 | | | | 89,866 | |
| | |
“X1P”, Series KL05, Interest Only, 0.892%**, 6/25/2029 | | | 4,800,000 | | | | 320,019 | |
| | |
“X1”, Series K110, Interest Only, 1.698%**, 4/25/2030 | | | 3,497,690 | | | | 463,175 | |
| | |
GMAC Commercial Mortgage Securities, Inc., “G”, Series 2004-C1, 144A, 5.455%, 3/10/2038 | | | 394,448 | | | | 248,023 | |
| | |
MTRO Commercial Mortgage Trust, “C”, Series 2019-TECH, 144A, 1-month USD-LIBOR + 1.300%, 1.459%**, 12/15/2033 | | | 250,000 | | | | 242,780 | |
| | |
Multifamily Connecticut Avenue Securities Trust, “M7”, Series 2019-01, 144A, 1-month USD-LIBOR + 1.700%, 1.848%**, 10/15/2049 | | | 366,604 | | | | 356,358 | |
| | |
NYT Mortgage Trust, “B”, Series 2019-NYT, 144A, 1-month USD-LIBOR + 1.400%, 1.559%**, 12/15/2035 | | | 350,000 | | | | 348,051 | |
Total Commercial Mortgage-Backed Securities (Cost $5,081,623) | | | | 4,982,360 | |
|
| Collateralized Mortgage Obligations 3.1% | |
| | |
Connecticut Avenue Securities Trust: | | | | | | | | |
| | |
“1M2”, Series 2019-R03, 144A, 1-month USD-LIBOR + 2.150%, 2.298%**, 9/25/2031 | | | 97,755 | | | | 97,636 | |
| | | | | | | | |
| | | Principal
Amount ($)(c) | | | Value ($) | |
| | |
“1M2”, Series 2019-R02, 144A, 1-month USD-LIBOR + 2.300%, 2.448%**, 8/25/2031 | | | 137,774 | | | | 137,598 | |
| | |
Fannie Mae Connecticut Avenue Securities: | | | | | | | | |
| | |
“1M2”, Series 2018-C06, 1-month USD-LIBOR + 2.000%, 2.148%**, 3/25/2031 | | | 105,735 | | | | 105,054 | |
| | |
“1M2”, Series 2018-C01, 1-month USD-LIBOR + 2.250%, 2.398%**, 7/25/2030 | | | 125,384 | | | | 124,755 | |
| | |
“1M2”, Series 2018-C05, 1-month USD-LIBOR + 2.350%, 2.498%**, 1/25/2031 | | | 393,628 | | | | 394,128 | |
| | |
Federal Home Loan Mortgage Corp., “H”, Series 2278, 6.5%, 1/15/2031 | | | 98 | | | | 109 | |
| | |
Federal National Mortgage Association: | | | | | | | | |
| | |
“4”, Series 406, Interest Only, 4.0%, 9/25/2040 | | | 274,043 | | | | 37,521 | |
| | |
“I”, Series 2003-84, Interest Only, 6.0%, 9/25/2033 | | | 79,014 | | | | 15,649 | |
| | |
Freddie Mac Structured Agency Credit Risk Debt Notes: | | | | | | | | |
| | |
“M2”, Series 2020-DNA2, 144A, 1-month USD-LIBOR + 1.850%, 1.998%**, 2/25/2050 | | | 1,000,000 | | | | 993,863 | |
| | |
“M2”, Series 2019-DNA3, 144A, 1-month USD-LIBOR + 2.050%, 2.198%**, 7/25/2049 | | | 260,254 | | | | 258,800 | |
| | |
“M2”, Series 2019-DNA2, 144A, 1-month USD-LIBOR + 2.450%, 2.598%**, 3/25/2049 | | | 367,855 | | | | 366,920 | |
| | |
“M2”, Series 2019-DNA1, 144A, 1-month USD-LIBOR + 2.650%, 2.798%**, 1/25/2049 | | | 53,202 | | | | 53,067 | |
| | |
Government National Mortgage Association: | | | | | | | | |
| | |
“PI”, Series 2015-40, Interest Only, 4.0%, 4/20/2044 | | | 102,791 | | | | 5,130 | |
| | |
“IV”, Series 2009-69, Interest Only, 5.5%, 8/20/2039 | | | 103,013 | | | | 16,622 | |
| | |
“IN”, Series 2009-69, Interest Only, 5.5%, 8/20/2039 | | | 109,248 | | | | 17,869 | |
| | |
“IJ”, Series 2009-75, Interest Only, 6.0%, 8/16/2039 | | | 71,420 | | | | 11,918 | |
| | |
JPMorgan Mortgage Trust: | | | | | | | | |
| | |
“A11”, Series 2019-9, 144A, 1-month USD-LIBOR + 0.900%, 1.05%**, 5/25/2050 | | | 192,811 | | | | 193,041 | |
| | |
“AM”, Series 2016-3, 144A, 3.35%**, 10/25/2046 | | | 395,988 | | | | 401,169 | |
| | |
New Residential Mortgage Loan Trust: | | | | | | | | |
| | |
“A1”, Series 2019-NQM3, 144A, 2.802%**, 7/25/2049 | | | 297,879 | | | | 301,572 | |
| | |
“A1”, Series 2019-NQM2, 144A, 3.6%, 4/25/2049 | | | 105,752 | | | | 106,561 | |
The accompanying notes are an integral part of the financial statements.
| | | | |
Deutsche DWS Variable Series II — DWS Global Income Builder VIP | | | | | 15 |
| | | | | | | | |
| | | Principal
Amount ($)(c) | | | Value ($) | |
| | |
STACR Trust, “M2”, Series 2018-DNA3, 144A, 1-month USD-LIBOR + 2.100%, 2.248%**, 9/25/2048 | | | 324,324 | | | | 320,636 | |
Total Collateralized Mortgage Obligations (Cost $3,901,934) | | | | 3,959,618 | |
|
| Government & Agency Obligations 1.7% | |
| Sovereign Bonds | |
| | |
Federative Republic of Brazil, 3.875%, 6/12/2030 | | | 200,000 | | | | 211,000 | |
| | |
Perusahaan Penerbit SBSN Indonesia III, 144A, 2.8%, 6/23/2030 | | | 200,000 | | | | 212,126 | |
| | |
Republic of Indonesia, 2.85%, 2/14/2030 | | | 625,000 | | | | 674,306 | |
| | |
Republic of Kazakhstan, 144A, 1.55%, 11/9/2023 | | | EUR 270,000 | | | | 341,101 | |
| | |
Republic of Philippines, 2.457%, 5/5/2030 | | | 625,000 | | | | 673,688 | |
Total Government & Agency Obligations (Cost $2,068,536) | | | | 2,112,221 | |
|
| Short-Term U.S. Treasury Obligations 1.7% | |
| | |
U.S. Treasury Bills: | | | | | | | | |
| | |
0.101%***, 8/12/2021 (f) | | | 175,000 | | | | 174,907 | |
| | |
0.125%***, 8/12/2021 | | | 250,000 | | | | 249,868 | |
| | |
0.142%***, 6/17/2021 (g) | | | 1,700,000 | | | | 1,699,361 | |
Total Short-Term U.S. Treasury Obligations (Cost $2,123,578) | | | | 2,124,136 | |
| | | | | | | | |
| | | Shares | | | Value ($) | |
| Exchange-Traded Funds 3.0% | |
SPDR Bloomberg Barclays Convertible Securities ETF (Cost $2,468,571) | | | 46,280 | | | | 3,831,521 | |
|
| Securities Lending Collateral 0.6% | |
| | |
DWS Government & Agency Securities Portfolio “DWS Government Cash Institutional Shares”, 0.03% (h) (i) (Cost $693,562) | | | 693,562 | | | | 693,562 | |
|
| Cash Equivalents 1.9% | |
DWS Central Cash Management Government Fund, 0.08% (h) (Cost $2,394,743) | | | 2,394,743 | | | | 2,394,743 | |
| | |
| | | % of
Net Assets | | | Value ($) | |
Total Investment Portfolio (Cost $110,070,137) | | | 104.1 | | | | 131,938,719 | |
| Other Assets and Liabilities, Net | | | (4.1 | ) | | | (5,184,255 | ) |
| Net Assets | | | 100.0 | | | | 126,754,464 | |
A summary of the Fund’s transactions with affiliated investments during the year ended December 31, 2020 are as follows:
| | | | | | | | | | | | | | | | | | | | | | | | | | | | | | | | |
Value ($) at
12/31/2019 | | Purchases
Cost ($) | | | Sales
Proceeds ($) | | | Net
Realized
Gain/
(Loss) ($) | | | Net Change in
Unrealized
Appreciation
(Depreciation) ($) | | | Income ($) | | | Capital Gain
Distributions ($) | | | Number of
Shares at
12/31/2020 | | | Value ($)
at
12/31/2020 | |
Securities Lending Collateral 0.6% | |
DWS Government & Agency Securities Portfolio “DWS Government Cash Institutional Shares”, 0.03% (h) (i) | |
| 1,105,478 | | | — | | | | 411,916 | (j) | | | — | | | | — | | | | 12,173 | | | | — | | | | 693,562 | | | | 693,562 | |
Cash Equivalents 1.9% | |
DWS Central Cash Management Government Fund, 0.08% (h) | |
| 1,544,128 | | | 63,175,398 | | | | 62,324,783 | | | | — | | | | — | | | | 15,583 | | | | — | | | | 2,394,743 | | | | 2,394,743 | |
| 2,649,606 | | | 63,175,398 | | | | 62,736,699 | | | | — | | | | — | | | | 27,756 | | | | — | | | | 3,088,305 | | | | 3,088,305 | |
| * | Non-income producing security. |
| ** | Variable or floating rate security. These securities are shown at their current rate as of December 31, 2020. For securities based on a published reference rate and spread, the reference rate and spread are indicated within the description above. Certain variable rate securities are not based on a published reference rate and spread but adjust periodically based on current market conditions, prepayment of underlying positions and/or other variables. |
| *** | Annualized yield at time of purchase; not a coupon rate. |
| (a) | All or a portion of these securities were on loan. In addition, “Other Assets and Liabilities, Net” may include pending sales that are also on loan. The value of securities loaned at December 31, 2020 amounted to $666,666, which is 0.5% of net assets. |
| (b) | Investment was valued using significant unobservable inputs. |
| (c) | Principal amount stated in U.S. dollars unless otherwise noted. |
| (d) | Perpetual, callable security with no stated maturity date. |
| (e) | When-issued, delayed delivery or forward commitment securities included. |
| (f) | At December 31, 2020, this security has been pledged, in whole or in part, to cover initial margin requirements for open centrally cleared swap contracts. |
| (g) | At December 31, 2020, this security has been pledged, in whole or in part, to cover initial margin requirements for open futures contracts. |
The accompanying notes are an integral part of the financial statements.
| | | | | | |
| | 16 | | | | | | Deutsche DWS Variable Series II — DWS Global Income Builder VIP |
| (h) | Affiliated fund managed by DWS Investment Management Americas, Inc. The rate shown is the annualized seven-day yield at period end. |
| (i) | Represents cash collateral held in connection with securities lending. Income earned by the Fund is net of borrower rebates. |
| (j) | Represents the net increase (purchase cost) or decrease (sales proceeds) in the amount invested in cash collateral for the year ended December 31, 2020. |
144A: Security exempt from registration under Rule 144A of the Securities Act of 1933. These securities may be resold in transactions exempt from registration, normally to qualified institutional buyers.
ADR: American Depositary Receipt
ASX: Australian Securities Exchange
GDR: Global Depositary Receipt
Interest Only: Interest Only (IO) bonds represent the “interest only” portion of payments on a pool of underlying mortgages or mortgage-backed securities. IO securities are subject to prepayment risk of the pool of underlying mortgages.
LIBOR: London Interbank Offered Rate
MSCI: Morgan Stanley Capital International
PJSC: Public Joint Stock Company
REIT: Real Estate Investment Trust
SBSN: Surat Berharga Syariah Negara (Islamic Based Government Securities)
S&P: Standard & Poor’s
SPDR: Standard & Poor’s Depositary Receipt
Included in the portfolio are investments in mortgage or asset-backed securities which are interests in separate pools of mortgages or assets. Effective maturities of these investments may be shorter than stated maturities due to prepayments.
At December 31, 2020, open futures contracts purchased were as follows:
| | | | | | | | | | | | | | | | | | | | | | | | |
| Futures | | Currency | | | Expiration
Date | | | Contracts | | | Notional
Amount ($) | | | Notional
Value ($) | | | Unrealized
Appreciation
(Depreciation) ($) | |
| 3 Month Euro Euribor Interest Rate | | | EUR | | | | 12/13/2021 | | | | 2 | | | | 614,158 | | | | 614,216 | | | | 58 | |
| 3 Month Euro Swiss Franc (Euroswiss) Interest Rate | | | CHF | | | | 12/13/2021 | | | | 2 | | | | 569,131 | | | | 569,129 | | | | (2 | ) |
| 3 Month Euroyen | | | JPY | | | | 12/13/2021 | | | | 2 | | | | 484,463 | | | | 484,480 | | | | 17 | |
| 3 Month Sterling (Short Sterling) Interest Rate | | | GBP | | | | 12/15/2021 | | | | 3 | | | | 512,790 | | | | 513,146 | | | | 356 | |
| 90 Day Eurodollar Time Deposit | | | USD | | | | 12/13/2021 | | | | 2 | | | | 498,700 | | | | 498,950 | | | | 250 | |
| ASX 90 Day Bank Accepted Bills | | | AUD | | | | 12/9/2021 | | | | 3 | | | | 2,312,347 | | | | 2,312,508 | | | | 161 | |
| MSCI E-Mini Emerging Market Index | | | USD | | | | 3/19/2021 | | | | 81 | | | | 5,150,977 | | | | 5,217,210 | | | | 66,233 | |
| Ultra Long U.S. Treasury Bond | | | USD | | | | 3/22/2021 | | | | 10 | | | | 2,164,714 | | | | 2,135,625 | | | | (29,089 | ) |
| Total net unrealized appreciation | | | | 37,984 | |
At December 31, 2020, open futures contracts sold were as follows:
| | | | | | | | | | | | | | | | | | | | | | | | |
| Futures | | Currency | | | Expiration
Date | | | Contracts | | | Notional
Amount ($) | | | Notional
Value ($) | | | Unrealized
Depreciation ($) | |
| 5 Year U.S. Treasury Note | | | USD | | | | 3/31/2021 | | | | 19 | | | | 2,391,281 | | | | 2,397,117 | | | | (5,836 | ) |
| S&P 500 E-Mini Index | | | USD | | | | 3/19/2021 | | | | 12 | | | | 2,215,735 | | | | 2,249,280 | | | | (33,545 | ) |
| TOPIX Index | | | JPY | | | | 3/11/2021 | | | | 17 | | | | 2,890,185 | | | | 2,970,946 | | | | (80,761 | ) |
| Total unrealized depreciation | | | | (120,142 | ) |
At December 31, 2020, open interest rate swap contracts were as follows:
| | | | | | | | | | | | | | | | | | | | | | |
| Centrally Cleared Swaps | |
Cash Flows
Paid by
the Fund/
Frequency | | Cash Flows
Received by
the Fund/
Frequency | | | Effective/
Expiration
Date | | Notional
Amount ($) | | Currency | | Value ($) | | | Upfront
Payments
Paid/
(Received) ($) | | | Unrealized
Depreciation ($) | |
Fixed — 2.0%
Semi-Annually | |
| Floating — 3-Month
LIBOR Quarterly |
| | 1/21/2020
1/21/2030 | | 1,800,000 | | USD | | | (200,558) | | | | (40,434) | | | | (160,124) | |
LIBOR: London Interbank Offered Rate; 3-month LIBOR rate as of December 31, 2020 is 0.238%.
As of December 31, 2020, the Fund had the following open forward foreign currency contracts:
| | | | | | | | | | | | | | | | | | | | | | |
| Contracts to Deliver | | | In Exchange For | | | Settlement
Date | | | Unrealized
Depreciation ($) | | | Counterparty |
| EUR | | | 800,000 | | | | USD | | | | 939,411 | | | | 2/5/2021 | | | | (38,637 | ) | | Bank of America |
The accompanying notes are an integral part of the financial statements.
| | | | |
Deutsche DWS Variable Series II — DWS Global Income Builder VIP | | | | | 17 |
Currency Abbreviations
For information on the Fund’s policy and additional disclosures regarding futures contracts, interest rate swap contracts and forward foreign currency contracts, please refer to the Derivatives section of Note B in the accompanying Notes to Financial Statements.
Fair Value Measurements
Various inputs are used in determining the value of the Fund’s investments. These inputs are summarized in three broad levels. Level 1 includes quoted prices in active markets for identical securities. Level 2 includes other significant observable inputs (including quoted prices for similar securities, interest rates, prepayment speeds and credit risk). Level 3 includes significant unobservable inputs (including the Fund’s own assumptions in determining the fair value of investments). The level assigned to the securities valuations may not be an indication of the risk or liquidity associated with investing in those securities.
The following is a summary of the inputs used as of December 31, 2020 in valuing the Fund’s investments. For information on the Fund’s policy regarding the valuation of investments, please refer to the Security Valuation section of Note A in the accompanying Notes to Financial Statements.
| | | | | | | | | | | | | | | | |
| Assets | | Level 1 | | | Level 2 | | | Level 3 | | | Total | |
| Common Stocks | | | | | | | | | | | | | | | | |
Communication Services | | $ | 4,035,095 | | | $ | 2,504,391 | | | $ | — | | | $ | 6,539,486 | |
Consumer Discretionary | | | 5,798,007 | | | | 1,836,720 | | | | — | | | | 7,634,727 | |
Consumer Staples | | | 2,905,739 | | | | 2,036,680 | | | | — | | | | 4,942,419 | |
Energy | | | 1,148,133 | | | | 412,857 | | | | — | | | | 1,560,990 | |
Financials | | | 4,880,339 | | | | 6,486,160 | | | | — | | | | 11,366,499 | |
Health Care | | | 4,493,390 | | | | 3,188,592 | | | | — | | | | 7,681,982 | |
Industrials | | | 2,637,685 | | | | 2,816,428 | | | | — | | | | 5,454,113 | |
Information Technology | | | 18,000,589 | | | | 1,558,576 | | | | — | | | | 19,559,165 | |
Materials | | | 1,951,328 | | | | 2,117,152 | | | | — | | | | 4,068,480 | |
Real Estate | | | 1,364,287 | | | | 888,485 | | | | — | | | | 2,252,772 | |
Utilities | | | 2,047,189 | | | | 2,184,331 | | | | — | | | | 4,231,520 | |
| Preferred Stocks (k) | | | 5,286,626 | | | | — | | | | — | | | | 5,286,626 | |
| Warrants | | | — | | | | — | | | | 8,109 | | | | 8,109 | |
| Fixed Income Investments (k) | | | | | | | | | | | | | | | | |
Corporate Bonds | | | — | | | | 19,295,845 | | | | — | | | | 19,295,845 | |
Asset-Backed | | | — | | | | 7,154,981 | | | | — | | | | 7,154,981 | |
Mortgage-Backed Securities Pass-Throughs | | | — | | | | 4,802,844 | | | | — | | | | 4,802,844 | |
Commercial Mortgage-Backed Securities | | | — | | | | 4,982,360 | | | | — | | | | 4,982,360 | |
Collateralized Mortgage Obligations | | | — | | | | 3,959,618 | | | | — | | | | 3,959,618 | |
Government & Agency Obligations | | | — | | | | 2,112,221 | | | | — | | | | 2,112,221 | |
Short-Term U.S. Treasury Obligations | | | — | | | | 2,124,136 | | | | — | | | | 2,124,136 | |
| Exchange-Traded Funds | | | 3,831,521 | | | | — | | | | — | | | | 3,831,521 | |
| Short-Term Investments (k) | | | 3,088,305 | | | | — | | | | — | | | | 3,088,305 | |
| Derivatives (l) | | | | | | | | | | | | | | | | |
Futures Contracts | | | 67,075 | | | | — | | | | — | | | | 67,075 | |
| Total | | $ | 61,535,308 | | | $ | 70,462,377 | | | $ | 8,109 | | | $ | 132,005,794 | |
| | | | |
| Liabilities | | Level 1 | | | Level 2 | | | Level 3 | | | Total | |
| Derivatives (l) | | | | | | | | | | | | | | | | |
Futures Contracts | | $ | (149,233 | ) | | $ | — | | | $ | — | | | $ | (149,233 | ) |
Interest Rate Swap Contracts | | | — | | | | (160,124 | ) | | | — | | | | (160,124 | ) |
Forward Foreign Currency Contracts | | | — | | | | (38,637 | ) | | | — | | | | (38,637 | ) |
| Total | | $ | (149,233 | ) | | $ | (198,761 | ) | | $ | — | | | $ | (347,994 | ) |
| (k) | See Investment Portfolio for additional detailed categorizations. |
| (l) | Derivatives include unrealized appreciation (depreciation) on open futures contracts, interest rate swap contracts and forward foreign currency contracts. |
The accompanying notes are an integral part of the financial statements.
| | | | | | |
| | 18 | | | | | | Deutsche DWS Variable Series II — DWS Global Income Builder VIP |
Statement of Assets and Liabilities
| | | | |
| as of December 31, 2020 | | | | |
| |
| Assets | | | | |
| Investments in non-affiliated securities, at value (cost $106,981,832) — including $666,666 of securities loaned | | $ | 128,850,414 | |
| Investment in DWS Government & Agency Securities Portfolio (cost $693,562)* | | | 693,562 | |
| Investment in DWS Central Cash Management Government Fund (cost $2,394,743) | | | 2,394,743 | |
| Cash | | | 20,000 | |
| Foreign currency, at value (cost $101,917) | | | 86,829 | |
| Receivable for investments sold | | | 35,000 | |
| Receivable for Fund shares sold | | | 1,327 | |
| Dividends receivable | | | 124,218 | |
| Interest receivable | | | 233,394 | |
| Receivable for variation margin on centrally cleared swaps | | | 3,641 | |
| Foreign taxes recoverable | | | 77,381 | |
| Other assets | | | 2,607 | |
| Total assets | | | 132,523,116 | |
| |
| Liabilities | | | | |
| Payable upon return of securities loaned | | | 693,562 | |
| Payable for investments purchased — when-issued/delayed delivery securities | | | 4,793,802 | |
| Payable for Fund shares redeemed | | | 37,152 | |
| Payable for variation margin on futures contracts | | | 15,338 | |
| Unrealized depreciation on forward foreign currency contracts | | | 38,637 | |
| Accrued management fee | | | 39,367 | |
| Accrued Trustees’ fees | | | 2,683 | |
| Other accrued expenses and payables | | | 148,111 | |
| Total liabilities | | | 5,768,652 | |
| Net assets, at value | | $ | 126,754,464 | |
|
| Net Assets Consist of | |
| Distributable earnings (loss) | | | 25,919,499 | |
| Paid-in capital | | | 100,834,965 | |
| Net assets, at value | | $ | 126,754,464 | |
|
| Net Asset Value | |
Class A | |
| |
| Net Asset Value, offering and redemption price per share ($126,742,285 ÷ 5,056,269 outstanding shares of beneficial interest, no par value, unlimited number of shares authorized) | | $ | 25.07 | |
Class B | |
| |
| Net Asset Value, offering and redemption price per share ($12,179 ÷ 487 outstanding shares of beneficial interest, no par value, unlimited number of shares authorized) | | $ | 25.01 | |
| * | Represents collateral on securities loaned. |
The accompanying notes are an integral part of the financial statements.
| | | | |
Deutsche DWS Variable Series II — DWS Global Income Builder VIP | | | | | 19 |
Statement of Operations
| | | | |
| for the year ended December 31, 2020 | |
| |
| Investment Income | | | | |
| Income: | |
| Dividends (net of foreign taxes withheld of $107,329) | | $ | 2,462,134 | |
| Interest | | | 1,271,929 | |
| Income distributions — DWS Central Cash Management Government Fund | | | 15,583 | |
| Securities lending income, net of borrower rebates | | | 12,173 | |
| Total income | | | 3,761,819 | |
| Expenses: | | | | |
| Management fee | | | 442,071 | |
| Administration fee | | | 116,532 | |
| Services to Shareholders | | | 685 | |
| Distribution service fees (Class B) | | | 28 | |
| Custodian fee | | | 21,373 | |
| Professional fees | | | 97,135 | |
| Reports to shareholders | | | 54,184 | |
| Trustees’ fees and expenses | | | 5,726 | |
| Other | | | 28,733 | |
| Total expenses before expense reductions | | | 766,467 | |
| Expense reductions | | | (18 | ) |
| Total expenses after expense reductions | | | 766,449 | |
| Net investment income | | | 2,995,370 | |
| |
| Realized and Unrealized Gain (Loss) | | | | |
| Net realized gain (loss) from: | | | | |
| Investments | | | (253,441 | ) |
| Swap contracts | | | 477,028 | |
| Futures | | | 1,538,385 | |
| Forward foreign currency contracts | | | (42,436 | ) |
| Foreign currency | | | 69,705 | |
| | | | 1,789,241 | |
| Change in net unrealized appreciation (depreciation) on: | | | | |
| Investments | | | 4,642,313 | |
| Swap contracts | | | (137,505 | ) |
| Futures | | | (28,164 | ) |
| Forward foreign currency contracts | | | (32,854 | ) |
| Foreign currency | | | (12,136 | ) |
| | | | 4,431,654 | |
| Net gain (loss) | | | 6,220,895 | |
| Net increase (decrease) in net assets resulting from operations | | $ | 9,216,265 | |
The accompanying notes are an integral part of the financial statements.
| | | | | | |
| | 20 | | | | | | Deutsche DWS Variable Series II — DWS Global Income Builder VIP |
Statements of Changes in Net Assets
| | | | | | | | |
| | | Years Ended December 31, | |
| Increase (Decrease) in Net Assets | | 2020 | | | 2019 | |
| Operations: | | | | | | | | |
| Net investment income | | $ | 2,995,370 | | | $ | 3,775,658 | |
| Net realized gain (loss) | | | 1,789,241 | | | | 2,358,917 | |
| Change in net unrealized appreciation (depreciation) | | | 4,431,654 | | | | 17,107,421 | |
| Net increase (decrease) in net assets resulting from operations | | | 9,216,265 | | | | 23,241,996 | |
| Distributions to shareholders: | | | | | | | | |
Class A | | | (6,579,884 | ) | | | (5,055,619 | ) |
Class B | | | (575 | ) | | | (391 | ) |
| Total distributions | | | (6,580,459 | ) | | | (5,056,010 | ) |
| Fund share transactions: | | | | | | | | |
Class A | | | | | | | | |
| Proceeds from shares sold | | | 2,458,485 | | | | 3,126,739 | |
| Reinvestment of distributions | | | 6,579,884 | | | | 5,055,619 | |
| Payments for shares redeemed | | | (14,768,561 | ) | | | (16,140,970 | ) |
| Net increase (decrease) in net assets from Class A share transactions | | | (5,730,192 | ) | | | (7,958,612 | ) |
Class B | | | | | | | | |
| Reinvestment of distributions | | | 575 | | | | 391 | |
| Net increase (decrease) in net assets from Class B share transactions | | | 575 | | | | 391 | |
| Increase (decrease) in net assets | | | (3,093,811 | ) | | | 10,227,765 | |
| Net assets at beginning of period | | | 129,848,275 | | | | 119,620,510 | |
| | |
| Net assets at end of period | | $ | 126,754,464 | | | $ | 129,848,275 | |
|
| Other Information | |
Class A | |
| Shares outstanding at beginning of period | | | 5,271,275 | | | | 5,608,755 | |
| Shares sold | | | 106,312 | | | | 133,321 | |
| Shares issued to shareholders in reinvestment of distributions | | | 324,451 | | | | 220,866 | |
| Shares redeemed | | | (645,769 | ) | | | (691,667 | ) |
| Net increase (decrease) in Class A shares | | | (215,006 | ) | | | (337,480 | ) |
| | |
| Shares outstanding at end of period | | | 5,056,269 | | | | 5,271,275 | |
Class B | | | | | | | | |
| Shares outstanding at beginning of period | | | 458.6 | | | | 441.5 | |
| Shares issued to shareholders in reinvestment of distributions | | | 28.4 | | | | 17.1 | |
| Net increase (decrease) in Class B shares | | | 28.4 | | | | 17.1 | |
| | |
| Shares outstanding at end of period | | | 487 | | | | 458.6 | |
The accompanying notes are an integral part of the financial statements.
| | | | |
Deutsche DWS Variable Series II — DWS Global Income Builder VIP | | | | | 21 |
Financial Highlights
| | | | | | | | | | | | | | | | | | | | |
| DWS Global Income Builder VIP — Class A | | | | | | | | | | | | | | | | | | | | |
| |
| | | Years Ended December 31, | |
| | | 2020 | | | 2019 | | | 2018 | | | 2017 | | | 2016 | |
| | | | | |
| Selected Per Share Data | | | | | | | | | | | | | | | | | | | | |
| Net asset value, beginning of period | | $ | 24.63 | | | $ | 21.33 | | | $ | 26.56 | | | $ | 23.50 | | | $ | 22.93 | |
| Income (loss) from investment operations: | | | | | | | | | | | | | | | | | | | | |
| | | | | |
Net investment incomea | | | .57 | | | | .69 | | | | .80 | | | | .71 | | | | .61 | |
Net realized and unrealized gain (loss) | | | 1.16 | | | | 3.54 | | | | (2.67 | ) | | | 3.10 | | | | .91 | |
Total from investment operations | | | 1.73 | | | | 4.23 | | | | (1.87 | ) | | | 3.81 | | | | 1.52 | |
| Less distributions from: | | | | | | | | | | | | | | | | | | | | |
| | | | | |
Net investment income | | | (.74 | ) | | | (.90 | ) | | | (.98 | ) | | | (.75 | ) | | | (.95 | ) |
Net realized gains | | | (.55 | ) | | | (.03 | ) | | | (2.38 | ) | | | — | | | | — | |
Total distributions | | | (1.29 | ) | | | (.93 | ) | | | (3.36 | ) | | | (.75 | ) | | | (.95 | ) |
| Net asset value, end of period | | $ | 25.07 | | | $ | 24.63 | | | $ | 21.33 | | | $ | 26.56 | | | $ | 23.50 | |
| Total Return (%) | | | 8.28 | | | | 20.16 | | | | (7.66 | )b | | | 16.54 | | | | 6.81 | |
| | | | | |
| Ratios to Average Net Assets and Supplemental Data | | | | | | | | | | | | | | | | | | | | |
| Net assets, end of period ($ millions) | | | 127 | | | | 130 | | | | 120 | | | | 147 | | | | 185 | |
| Ratio of expenses before expense reductions (%)c | | | .64 | | | | .68 | | | | .69 | | | | .63 | | | | .62 | |
| Ratio of expenses after expense reductions (%)c | | | .64 | | | | .68 | | | | .68 | | | | .63 | | | | .62 | |
| Ratio of net investment income (loss) (%) | | | 2.51 | | | | 2.96 | | | | 3.34 | | | | 2.85 | | | | 2.66 | |
| Portfolio turnover rate (%) | | | 137 | | | | 182 | | | | 70 | | | | 122 | | | | 135 | |
| a | Based on average shares outstanding during the period. |
| b | Total return would have been lower had certain expenses not been reduced. |
| c | Expense ratio does not reflect charges and fees associated with the separate account that invests in the Fund or any variable life insurance policy or variable annuity contract for which the Fund is an investment option. |
| | | | | | | | | | | | |
| DWS Global Income Builder VIP — Class B | | | | | | | | | | | | |
| | |
| | | Years Ended December 31, | | | Period
Ended 12/31/18a | |
| | | 2020 | | | 2019 | |
| | | |
| Selected Per Share Data | | | | | | | | | | | | |
| Net asset value, beginning of period | | $ | 24.61 | | | $ | 21.30 | | | $ | 22.65 | |
| Income (loss) from investment operations: | | | | | | | | | | | | |
| | | |
Net investment incomeb | | | .50 | | | | .65 | | | | .50 | |
Net realized and unrealized gain (loss) | | | 1.15 | | | | 3.55 | | | | (1.85 | ) |
Total from investment operations | | | 1.65 | | | | 4.20 | | | | (1.35 | ) |
| Less distributions from: | | | | | | | | | | | | |
| | | |
Net investment income | | | (.70 | ) | | | (.86 | ) | | | — | |
Net realized gains | | | (.55 | ) | | | (.03 | ) | | | — | |
Total distributions | | | (1.25 | ) | | | (.89 | ) | | | — | |
| Net asset value, end of period | | $ | 25.01 | | | $ | 24.61 | | | $ | 21.30 | |
| Total Return (%)c | | | 7.90 | | | | 20.01 | | | | (5.96 | )** |
| | | |
| Ratios to Average Net Assets and Supplemental Data | | | | | | | | | | | | |
| Net assets, end of period ($ thousands) | | | 12 | | | | 11 | | | | 9 | |
| Ratio of expenses before expense reductions (%)d | | | 1.10 | | | | 1.10 | | | | 1.15 | * |
| Ratio of expenses after expense reductions (%)d | | | .93 | | | | .86 | | | | .86 | * |
| Ratio of net investment income (loss) (%) | | | 2.20 | | | | 2.77 | | | | 3.30 | * |
| Portfolio turnover rate (%) | | | 137 | | | | 182 | | | | 70 | e |
| a | For the period from May 1, 2018 (commencement of operations) to December 31, 2018. |
| b | Based on average shares outstanding during the period. |
| c | Total return would have been lower had certain expenses not been reduced. |
| d | Expense ratio does not reflect charges and fees associated with the separate account that invests in the Fund or any variable life insurance policy or variable annuity contract for which the Fund is an investment option. |
| e | Represents the Fund’s portfolio turnover rate for the year ended December 31, 2018. |
The accompanying notes are an integral part of the financial statements.
| | | | | | |
| | 22 | | | | | | Deutsche DWS Variable Series II — DWS Global Income Builder VIP |
| | | | |
| Notes to Financial Statements | | | | |
A. Organization and Significant Accounting Policies
DWS Global Income Builder VIP (the “Fund”) is a diversified series of Deutsche DWS Variable Series II (the “Trust”), which is registered under the Investment Company Act of 1940, as amended (the “1940 Act”), as an open-end management investment company organized as a Massachusetts business trust.
Multiple Classes of Shares of Beneficial Interest. The Fund offers two classes of shares (Class A shares and Class B shares). Sales of Class B shares are subject to recordkeeping fees of up to 0.15% and Rule 12b-1 fees under the 1940 Act equal to an annual rate of up to 0.25% of the average daily net assets of the Class B shares of the Fund. Class A shares are not subject to such fees.
Investment income, realized and unrealized gains and losses, and certain fund-level expenses and expense reductions, if any, are borne pro rata on the basis of relative net assets by the holders of all classes of shares, except that each class bears certain expenses unique to that class (including the applicable Rule 12b-1 distribution fees). Differences in class-level expenses may result in payment of different per share dividends by class. All shares have equal rights with respect to voting subject to class-specific arrangements.
The Fund’s financial statements are prepared in accordance with accounting principles generally accepted in the United States of America (“U.S. GAAP”) which require the use of management estimates. Actual results could differ from those estimates. The Fund qualifies as an investment company under Topic 946 of Accounting Standards Codification of U.S. GAAP. The policies described below are followed consistently by the Fund in the preparation of its financial statements.
Security Valuation. Investments are stated at value determined as of the close of regular trading on the New York Stock Exchange on each day the exchange is open for trading.
Various inputs are used in determining the value of the Fund’s investments. These inputs are summarized in three broad levels. Level 1 includes quoted prices in active markets for identical securities. Level 2 includes other significant observable inputs (including quoted prices for similar securities, interest rates, prepayment speeds and credit risk). Level 3 includes significant unobservable inputs (including the Fund’s own assumptions in determining the fair value of investments). The level assigned to the securities valuations may not be an indication of the risk or liquidity associated with investing in those securities.
Equity securities and Exchange-Traded Funds (“ETFs”) are valued at the most recent sale price or official closing price reported on the exchange (U.S. or foreign) or over-the-counter market on which they trade. Equity securities or ETFs for which no sales are reported are valued at the calculated mean between the most recent bid and asked quotations on the relevant market or, if a mean cannot be determined, at the most recent bid quotation. Equity securities and ETFs are generally categorized as Level 1. For certain international equity securities, in order to adjust for events which may occur between the close of the foreign exchanges and the close of the New York Stock Exchange, a fair valuation model may be used. This fair valuation model takes into account comparisons to the valuation of American Depository Receipts (ADRs), exchange-traded funds, futures contracts and certain indices and these securities are categorized as Level 2.
Debt securities are valued at prices supplied by independent pricing services approved by the Fund’s Board. Such services may use various pricing techniques which take into account appropriate factors such as yield, quality, coupon rate, maturity, type of issue, trading characteristics, prepayment speeds and other data, as well as broker quotes. If the pricing services are unable to provide valuations, debt securities are valued at the average of the most recent reliable bid quotations or evaluated prices, as applicable, obtained from broker-dealers. These securities are generally categorized as Level 2.
Investments in open-end investment companies are valued at their net asset value each business day and are categorized as Level 1.
Futures contracts are generally valued at the settlement prices established each day on the exchange on which they are traded and are categorized as Level 1.
Forward currency contracts are valued at the prevailing forward exchange rate of the underlying currencies and are categorized as Level 2.
Swap contracts are valued daily based upon prices supplied by a Board approved pricing vendor, if available, and otherwise are valued at the price provided by the broker-dealer. Swap contracts are generally categorized as Level 2.
| | | | |
Deutsche DWS Variable Series II — DWS Global Income Builder VIP | | | | | 23 |
Securities and other assets for which market quotations are not readily available or for which the above valuation procedures are deemed not to reflect fair value are valued in a manner that is intended to reflect their fair value as determined in accordance with procedures approved by the Board and are generally categorized as Level 3. In accordance with the Fund’s valuation procedures, factors considered in determining value may include, but are not limited to, the type of the security; the size of the holding; the initial cost of the security; the existence of any contractual restrictions on the security’s disposition; the price and extent of public trading in similar securities of the issuer or of comparable companies; quotations or evaluated prices from broker-dealers and/or pricing services; information obtained from the issuer, analysts, and/or the appropriate stock exchange (for exchange-traded securities); an analysis of the company’s or issuer’s financial statements; an evaluation of the forces that influence the issuer and the market(s) in which the security is purchased and sold; and with respect to debt securities, the maturity, coupon, creditworthiness, currency denomination and the movement of the market in which the security is normally traded. The value determined under these procedures may differ from published values for the same securities.
Disclosure about the classification of fair value measurements is included in a table following the Fund’s Investment Portfolio.
Foreign Currency Translations. The books and records of the Fund are maintained in U.S. dollars. Investment securities and other assets and liabilities denominated in a foreign currency are translated into U.S. dollars at the prevailing exchange rates at period end. Purchases and sales of investment securities, income and expenses are translated into U.S. dollars at the prevailing exchange rates on the respective dates of the transactions.
Net realized and unrealized gains and losses on foreign currency transactions represent net gains and losses between trade and settlement dates on securities transactions, the acquisition and disposition of foreign currencies, and the difference between the amount of net investment income accrued and the U.S. dollar amount actually received. The portion of both realized and unrealized gains and losses on investments that results from fluctuations in foreign currency exchange rates is not separately disclosed but is included with net realized and unrealized gain/appreciation and loss/depreciation on investments.
Securities Lending. Deutsche Bank AG, as lending agent, lends securities of the Fund to certain financial institutions under the terms of its securities lending agreement. During the term of the loans, the Fund continues to receive interest and dividends generated by the securities and to participate in any changes in their market value. The Fund requires the borrowers of the securities to maintain collateral with the Fund consisting of either cash or liquid, unencumbered assets having a value at least equal to the value of the securities loaned. When the collateral falls below specified amounts, the lending agent will use its best effort to obtain additional collateral on the next business day to meet required amounts under the securities lending agreement. As of period end, any securities on loan were collateralized by cash. During the year ended December 31, 2020, the Fund invested the cash collateral into a joint trading account in DWS Government & Agency Securities Portfolio, an affiliated money market fund managed by DWS Investment Management Americas, Inc. DWS Investment Management Americas, Inc. receives a management/administration fee (0.06% annualized effective rate as of December 31, 2020) on the cash collateral invested in DWS Government & Agency Securities Portfolio. The Fund receives compensation for lending its securities either in the form of fees or by earning interest on invested cash collateral net of borrower rebates and fees paid to a lending agent. Either the Fund or the borrower may terminate the loan at any time, and the borrower, after notice, is required to return borrowed securities within a standard time period. There may be risks of delay and costs in recovery of securities or even loss of rights in the collateral should the borrower of the securities fail financially. If the Fund is not able to recover securities lent, the Fund may sell the collateral and purchase a replacement investment in the market, incurring the risk that the value of the replacement security is greater than the value of the collateral. The Fund is also subject to all investment risks associated with the reinvestment of any cash collateral received, including, but not limited to, interest rate, credit and liquidity risk associated with such investments.
| | | | | | |
| | 24 | | | | | | Deutsche DWS Variable Series II — DWS Global Income Builder VIP |
As of December 31, 2020, the Fund had securities on loan. The value of the related collateral exceeded the value of the securities loaned at period end.
| | | | | | | | | | | | | | | | | | | | |
| Remaining Contractual Maturity of the Agreements as of December 31, 2020 | |
| | | Overnight
and
Continuous | | | <30 days | | | Between 30
& 90 days | | | >90 days | | | Total | |
Securities Lending Transactions | | | | | | | | | | | | | | | | | | | | |
| Common Stocks | | $ | 663,602 | | | $ | — | | | $ | — | | | $ | — | | | $ | 663,602 | |
| Corporate Bonds | | | 29,960 | | | | — | | | | — | | | | — | | | | 29,960 | |
| Total Borrowings | | $ | 693,562 | | | $ | — | | | $ | — | | | $ | — | | | $ | 693,562 | |
| | | |
Gross amount of recognized liabilities for securities lending transactions | | | | | | | | | | | $ | 693,562 | |
When-Issued/Delayed Delivery Securities. The Fund may purchase or sell securities with delivery or payment to occur at a later date beyond the normal settlement period. At the time the Fund enters into a commitment to purchase or sell a security, the transaction is recorded and the value of the transaction is reflected in the net asset value. The price of such security and the date when the security will be delivered and paid for are fixed at the time the transaction is negotiated. The value of the security may vary with market fluctuations. At the time the Fund enters into a purchase transaction it is required to segregate cash or other liquid assets at least equal to the amount of the commitment. Additionally, the Fund may be required to post securities and/or cash collateral in accordance with the terms of the commitment.
Certain risks may arise upon entering into when-issued or delayed delivery transactions from the potential inability of counterparties to meet the terms of their contracts or if the issuer does not issue the securities due to political, economic or other factors. Additionally, losses may arise due to changes in the value of the underlying securities.
Taxes. The Fund’s policy is to comply with the requirements of the Internal Revenue Code, as amended, which are applicable to regulated investment companies and to distribute all of its taxable income to its shareholders.
Additionally, the Fund may be subject to taxes imposed by the governments of countries in which it invests and are generally based on income and/or capital gains earned or repatriated, a portion of which may be recoverable based upon the current interpretation of the tax rules and regulations. Estimated tax liabilities and recoveries on certain foreign securities are recorded on an accrual basis and are reflected as components of interest income or net change in unrealized gain/loss on investments. Tax liabilities realized as a result of security sales are reflected as a component of net realized gain/loss on investments.
The Fund has reviewed the tax positions for the open tax years as of December 31, 2020 and has determined that no provision for income tax and/or uncertain tax positions is required in the Fund’s financial statements. The Fund’s federal tax returns for the prior three fiscal years remain open subject to examination by the Internal Revenue Service.
Distribution of Income and Gains. Distributions from net investment income of the Fund, if any, are declared and distributed to shareholders annually. Net realized gains from investment transactions, in excess of available capital loss carryforwards, would be taxable to the Fund if not distributed and, therefore, will be distributed to shareholders at least annually. The Fund may also make additional distributions for tax purposes if necessary.
The timing and characterization of certain income and capital gain distributions are determined annually in accordance with federal tax regulations, which may differ from accounting principles generally accepted in the United States of America. These differences primarily relate to investments in foreign denominated investments, forward currency contracts, futures contracts, swap contracts and certain securities sold at a loss. As a result, net investment income (loss) and net realized gain (loss) on investment transactions for a reporting period may differ significantly from distributions during such period. Accordingly, the Fund may periodically make reclassifications among certain of its capital accounts without impacting the net asset value of the Fund.
At December 31, 2020, the Fund’s components of distributable earnings on a tax basis were as follows:
| | | | |
| Undistributed ordinary income* | | $ | 3,031,181 | |
| Undistributed long-term capital gains | | $ | 1,789,328 | |
| Net unrealized appreciation (depreciation) on investments | | $ | 21,085,539 | |
| | | | |
Deutsche DWS Variable Series II — DWS Global Income Builder VIP | | | | | 25 |
At December 31, 2020, the aggregate cost of investments for federal income tax purposes was $110,627,722. The net unrealized appreciation for all investments based on tax cost was $21,085,539. This consisted of aggregate gross unrealized appreciation for all investments for which there was an excess of value over tax cost of $22,865,547 and aggregate gross unrealized depreciation for all investments for which there was an excess of tax cost over value of $1,780,008.
In addition, the tax character of distributions paid by the Fund is summarized as follows:
| | | | | | | | |
| | | Years Ended December 31, | |
| | | 2020 | | | 2019 | |
| Distributions from ordinary income* | | $ | 4,875,936 | | | $ | 4,909,285 | |
| Distributions from long-term capital gains | | $ | 1,704,523 | | | $ | 146,725 | |
| * | For tax purposes, short-term capital gain distributions are considered ordinary income distributions. |
Expenses. Expenses of the Trust arising in connection with a specific fund are allocated to that fund. Other Trust expenses which cannot be directly attributed to a fund are apportioned among the funds in the Trust based upon the relative net assets or other appropriate measures.
Contingencies. In the normal course of business, the Fund may enter into contracts with service providers that contain general indemnification clauses. The Fund’s maximum exposure under these arrangements is unknown, as this would involve future claims that may be made against the Fund that have not yet been made. However, based on experience, the Fund expects the risk of loss to be remote.
Other. Investment transactions are accounted for on a trade date plus one basis for daily net asset value calculations. However, for financial reporting purposes, investment transactions are reported on trade date. Interest income is recorded on the accrual basis. Dividend income is recorded on the ex-dividend date net of foreign withholding taxes. Certain dividends from foreign securities may be recorded subsequent to the ex-dividend date as soon as the Fund is informed of such dividends. Realized gains and losses from investment transactions are recorded on an identified cost basis. Proceeds from litigation payments, if any, are included in net realized gain (loss) from investments. All discounts and premiums are accreted/amortized for both tax and financial reporting purposes, with the exception of securities in default of principal.
B. Derivative Instruments
Swaps. A swap is a contract between two parties to exchange future cash flows at periodic intervals based on the notional amount of the swap. A bilateral swap is a transaction between the fund and a counterparty where cash flows are exchanged between the two parties. A centrally cleared swap is a transaction executed between the fund and a counterparty, then cleared by a clearing member through a central clearinghouse. The central clearinghouse serves as the counterparty, with whom the fund exchanges cash flows.
The value of a swap is adjusted daily, and the change in value, if any, is recorded as unrealized appreciation or depreciation in the Statement of Assets and Liabilities. Gains or losses are realized when the swap expires or is closed. Certain risks may arise when entering into swap transactions including counterparty default; liquidity; or unfavorable changes in interest rates or the value of the underlying reference security, commodity or index. In connection with bilateral swaps, securities and/or cash may be identified as collateral in accordance with the terms of the swap agreement to provide assets of value and recourse in the event of default. The maximum counterparty credit risk is the net present value of the cash flows to be received from or paid to the counterparty over the term of the swap, to the extent that this amount is beneficial to the Fund, in addition to any related collateral posted to the counterparty by the Fund. This risk may be partially reduced by a master netting arrangement between the Fund and the counterparty. Upon entering into a centrally cleared swap, the Fund is required to deposit with a financial intermediary cash or securities (“initial margin”) in an amount equal to a certain percentage of the notional amount of the swap. Subsequent payments (“variation margin”) are made or received by the Fund dependent upon the daily fluctuations in the value of the swap. In a cleared swap transaction, counterparty risk is minimized as the central clearinghouse acts as the counterparty.
An upfront payment, if any, made by the Fund is recorded as an asset in the Statement of Assets and Liabilities. An upfront payment, if any, received by the Fund is recorded as a liability in the Statement of Assets and Liabilities. Payments received or made at the end of the measurement period are recorded as realized gain or loss in the Statement of Operations.
| | | | | | |
| | 26 | | | | | | Deutsche DWS Variable Series II — DWS Global Income Builder VIP |
Interest Rate Swaps. Interest rate swaps are agreements in which the Fund agrees to pay to the counterparty a fixed rate payment in exchange for the counterparty agreeing to pay to the Fund a variable rate payment, or the Fund agrees to receive from the counterparty a fixed rate payment in exchange for the counterparty agreeing to receive from the Fund a variable rate payment. The payment obligations are based on the notional amount of the swap. For the year ended December 31, 2020, the Fund entered into interest rate swap agreements to gain exposure to different parts of the yield curve while managing overall duration.
A summary of the open interest rate swap contracts as of December 31, 2020 is included in a table following the Fund’s Investment Portfolio. For the year ended December 31, 2020, the investment in interest rate swap contracts had a total notional amount generally indicative of a range from $800,000 to $5,600,000.
Credit Default Swaps. Credit default swaps are agreements between a buyer and a seller of protection against predefined credit events for the reference entity. The Fund may enter into credit default swaps to gain exposure to an underlying issuer’s credit quality characteristics without directly investing in that issuer or to hedge against the risk of a credit event on debt securities. As a seller of a credit default swap, the Fund is required to pay the par (or other agreed-upon) value of the referenced entity to the counterparty with the occurrence of a credit event by a third party, such as a U.S. or foreign corporate issuer, on the reference entity, which would likely result in a loss to the Fund. In return, the Fund receives from the counterparty a periodic stream of payments over the term of the swap provided that no credit event has occurred. If no credit event occurs, the Fund keeps the stream of payments with no payment obligations. The Fund may also buy credit default swaps, in which case the Fund functions as the counterparty referenced above. This involves the risk that the swap may expire worthless. It also involves counterparty risk that the seller may fail to satisfy its payment obligations to the Fund with the occurrence of a credit event. When the Fund sells a credit default swap, it will cover its commitment. This may be achieved by, among other methods, maintaining cash or liquid assets equal to the aggregate notional value of the reference entities for all outstanding credit default swaps sold by the Fund. For the year ended December 31, 2020, the Fund entered into credit default swap agreements to gain exposure to the underlying issuer’s credit quality characteristics and to hedge the risk of default or other specified credit events on portfolio assets.
Under the terms of a credit default swap, the Fund receives or makes periodic payments based on a specified interest rate on a fixed notional amount. These payments are recorded as a realized gain or loss in the Statement of Operations. Payments received or made as a result of a credit event or termination of the swap are recognized, net of a proportional amount of the upfront payment, as realized gains or losses in the Statement of Operations.
There were no open credit default swap contracts as of December 31, 2020. For the year ended December 31, 2020, the investment in credit default swap contracts sold had a total notional value generally indicative of a range from $0 to $2,576,000.
Futures Contracts. A futures contract is an agreement between a buyer or seller and an established futures exchange or its clearinghouse in which the buyer or seller agrees to take or make a delivery of a specific amount of a financial instrument at a specified price on a specific date (settlement date). For the year ended December 31, 2020, the Fund entered into interest rate futures to gain exposure to different parts of the yield curve while managing overall duration. The Fund also entered into interest rate futures contracts for non-hedging purposes to seek to enhance potential gains. In addition, the Fund entered into equity index futures as a means of gaining exposure to the equity asset class without investing directly into such asset class and to manage the risk of stock market volatility.
Upon entering into a futures contract, the Fund is required to deposit with a financial intermediary cash or securities (“initial margin”) in an amount equal to a certain percentage of the face value indicated in the futures contract. Subsequent payments (“variation margin”) are made or received by the Fund dependent upon the daily fluctuations in the value and are recorded for financial reporting purposes as unrealized gains or losses by the Fund. Gains or losses are realized when the contract expires or is closed. Since all futures contracts are exchange-traded, counterparty risk is minimized as the exchange’s clearinghouse acts as the counterparty, and guarantees the futures against default.
Certain risks may arise upon entering into futures contracts, including the risk that an illiquid market will limit the Fund’s ability to close out a futures contract prior to the settlement date and the risk that the futures contract is not well correlated with the security, index or currency to which it relates. Risk of loss may exceed amounts disclosed in the Statement of Assets and Liabilities.
A summary of the open futures contracts as of December 31, 2020 is included in a table following the Fund’s Investment Portfolio. For the year ended December 31, 2020, the investment in futures contracts purchased had a total notional value generally indicative of a range from approximately $12,345,000 to $42,318,000, and
| | | | |
Deutsche DWS Variable Series II — DWS Global Income Builder VIP | | | | | 27 |
the investment in futures contracts sold had a total notional value generally indicative of a range from approximately $6,988,000 to $12,281,000.
Forward Foreign Currency Contracts. A forward foreign currency contract (“forward currency contract”) is a commitment to purchase or sell a foreign currency at the settlement date at a negotiated rate. For the year ended December 31, 2020, the Fund entered into forward currency contracts in order to hedge its exposure to changes in foreign currency exchange rates on its foreign currency denominated portfolio holdings, to facilitate transactions in foreign currency denominated securities and for non-hedging purposes to seek to enhance potential gains.
Forward currency contracts are valued at the prevailing forward exchange rate of the underlying currencies and unrealized gain (loss) is recorded daily. On the settlement date of the forward currency contract, the Fund records a realized gain or loss equal to the difference between the value of the contract at the time it was opened and the value of the contract at the time it was closed. Certain risks may arise upon entering into forward currency contracts from the potential inability of counterparties to meet the terms of their contracts. The maximum counterparty credit risk to the Fund is measured by the unrealized gain on appreciated contracts. Additionally, when utilizing forward currency contracts to hedge, the Fund gives up the opportunity to profit from favorable exchange rate movements during the term of the contract.
A summary of the open forward currency contracts as of December 31, 2020 is included in a table following the Fund’s Investment Portfolio. For the year ended December 31, 2020, the investment in forward currency contracts short vs. U.S. dollars had a total contract value generally indicative of a range from approximately $617,000 to $1,175,000, and the investment in forward currency contracts long vs. U.S. dollars had a total contract value generally indicative of a range from $0 to approximately $567,000.
The following tables summarize the value of the Fund’s derivative instruments held as of December 31, 2020 and the related location in the accompanying Statement of Assets and Liabilities, presented by primary underlying risk exposure:
| | | | |
| Asset Derivatives | | Futures Contracts | |
| Equity Contracts (a) | | $ | 66,233 | |
| Interest Rate Contracts (a) | | | 842 | |
| | | $ | 67,075 | |
The above derivative is located in the following Statement of Assets and Liabilities accounts:
| (a) | Includes cumulative appreciation of futures contracts as disclosed in the Investment Portfolio. Unsettled variation margin is disclosed separately within the Statement of Assets and Liabilities. |
| | | | | | | | | | | | | | | | |
| Liability Derivatives | | Forward
Contracts | | | Swap
Contracts | | | Futures
Contracts | | | Total | |
| Equity Contracts (b) | | $ | — | | | $ | — | | | $ | (114,306 | ) | | $ | (114,306 | ) |
| Interest Rate Contracts (b) | | | — | | | | (160,124 | ) | | | (34,927 | ) | | | (195,051 | ) |
| Foreign Exchange Contracts (c) | | | (38,637 | ) | | | — | | | | `— | | | | (38,637 | ) |
| | | $ | (38,637 | ) | | $ | (160,124 | ) | | $ | (149,233 | ) | | $ | (347,994 | ) |
Each of the above derivatives is located in the following Statement of Assets and Liabilities accounts:
| (b) | Includes cumulative depreciation of futures and centrally cleared swap contracts as disclosed in the Investment Portfolio. Unsettled variation margin is disclosed separately within the Statement of Assets and Liabilities. |
| (c) | Unrealized depreciation on forward foreign currency contracts |
Additionally, the amount of unrealized and realized gains and losses on derivative instruments recognized in Fund earnings during the year ended December 31, 2020, and the related location in the accompanying Statement of Operations is summarized in the following tables by primary underlying risk exposure:
| | | | | | | | | | | | | | | | |
| Realized Gain (Loss) | | Forward
Contracts | | | Swap
Contracts | | | Futures
Contracts | | | Total | |
| Equity Contracts (d) | | $ | — | | | $ | — | | | $ | 251,402 | | | $ | 251,402 | |
| Credit Contracts (d) | | | — | | | | 970,253 | | | | — | | | | 970,253 | |
| Interest Rate Contracts (d) | | | — | | | | (493,225 | ) | | | 1,286,983 | | | | 793,758 | |
| Foreign Exchange Contracts (d) | | | (42,436 | ) | | | — | | | | — | | | | (42,436 | ) |
| | | $ | (42,436 | ) | | $ | 477,028 | | | $ | 1,538,385 | | | $ | 1,972,977 | |
Each of the above derivatives is located in the following Statement of Operations accounts:
| (d) | Net realized gain (loss) from forward foreign currency contracts, swap contracts and futures, respectively |
| | | | | | |
| | 28 | | | | | | Deutsche DWS Variable Series II — DWS Global Income Builder VIP |
| | | | | | | | | | | | | | | | |
Change in Net Unrealized Appreciation (Depreciation) | | Forward
Contracts | | | Swap
Contracts | | | Futures
Contracts | | | Total | |
| Equity Contracts (e) | | $ | — | | | $ | — | | | $ | (100,076 | ) | | $ | (100,076 | ) |
| Credit Contracts (e) | | | — | | | | (13,370 | ) | | | — | | | | (13,370 | ) |
| Interest Rate Contracts (e) | | | — | | | | (124,135 | ) | | | 71,912 | | | | (52,223 | ) |
| Foreign Exchange Contracts (e) | | | (32,854 | ) | | | — | | | | — | | | | (32,854 | ) |
| | | $ | (32,854 | ) | | $ | (137,505 | ) | | $ | (28,164 | ) | | $ | (198,523 | ) |
Each of the above derivatives is located in the following Statement of Operations accounts:
| (e) | Change in net unrealized appreciation (depreciation) on forward foreign currency contracts, swap contracts and futures, respectively |
As of December 31, 2020, the Fund has transactions subject to enforceable master netting agreements which govern the terms of certain transactions, and reduce the counterparty risk associated with such transactions. Master netting agreements allow a Fund to close out and net total exposure to a counterparty in the event of a deterioration in the credit quality or contractual default with respect to all of the transactions with a counterparty. As defined by the master netting agreement, the Fund may have collateral agreements with certain counterparties to mitigate risk. For financial reporting purposes the Statement of Assets and Liabilities generally shows derivatives assets and liabilities on a gross basis, which reflects the full risks and exposures prior to netting. A reconciliation of the gross amounts on the Statement of Assets and Liabilities to the net amounts by a counterparty, including any collateral exposure, is included in the following tables:
| | | | | | | | | | | | | | | | |
| Counterparty | | Gross Amounts
of Liabilities
Presented in the
Statement of
Assets and
Liabilities | | | Financial
Instruments
and
Derivatives
Available
for Offset | | | Collateral Pledged | | | Net Amount of
Derivative
Liabilities | |
| Bank of America | | $ | 38,637 | | | $ | — | | | $ | — | | | $ | 38,637 | |
C. Purchases and Sales of Securities
During the year ended December 31, 2020, purchases and sales of investment transactions, excluding short-term investments, were as follows:
| | | | | | | | |
| | | Purchases | | | Sales | |
| Non-U.S. Treasury Obligations | | $ | 153,938,303 | | | $ | 155,711,395 | |
| U.S. Treasury Obligations | | $ | 5,785,426 | | | $ | 5,869,052 | |
D. Related Parties
Management Agreement. Under the Investment Management Agreement with DWS Investment Management Americas, Inc. (“DIMA” or the “Advisor”), an indirect, wholly owned subsidiary of DWS Group GmbH & Co. KGaA (“DWS Group”), the Advisor directs the investments of the Fund in accordance with its investment objectives, policies and restrictions. The Advisor determines the securities, instruments and other contracts relating to investments to be purchased, sold or entered into by the Fund or delegates such responsibility to the Fund’s subadvisor.
Under the Investment Management Agreement, the Fund pays a monthly management fee based on the Fund’s average daily net assets, computed and accrued daily and payable monthly, at the following annual rates:
| | | | |
| First $250 million | | | .370 | % |
| Next $750 million | | | .345 | % |
| Over $1 billion | | | .310 | % |
Accordingly, for the year ended December 31, 2020, the fee pursuant to the Investment Management Agreement was equivalent to an annual rate (exclusive of any applicable waiver/reimbursements) of 0.37% of the Fund’s average daily net assets.
For the period from January 1, 2020 through September 30, 2021 (and through April 30, 2020 for Class B shares), the Advisor has contractually agreed to waive its fees and/or reimburse certain operating expenses
| | | | |
Deutsche DWS Variable Series II — DWS Global Income Builder VIP | | | | | 29 |
to the extent necessary to maintain the total annual operating expenses (excluding certain expenses such as extraordinary expenses, taxes, brokerage and interest expense) of each class as follows:
| | | | |
| Class A | | | .71 | % |
| Class B | | | .86 | % |
Effective May 1, 2020 through September 30, 2021, the Advisor has contractually agreed to waive its fees and/or reimburse certain operating expenses to the extent necessary to maintain the total annual operating expenses (excluding certain expenses such as extraordinary expenses, taxes, brokerage and interest expense) of Class B shares at 0.96%.
For the year ended December 31, 2020, fees waived and/or expenses reimbursed for Class B are $18.
Administration Fee. Pursuant to an Administrative Services Agreement, DIMA provides most administrative services to the Fund. Prior to March 1, 2020, for all services provided under the Administrative Services Agreement, the Fund paid DIMA an annual fee (“Administration Fee”) of 0.10% of the Fund’s average daily net assets, computed and accrued daily and payable monthly. Effective March 1, 2020, for all services provided under the Administrative Services Agreement, the Fund pays the Advisor an annual Administration Fee of 0.097% of the Fund’s average daily net assets, computed and accrued daily and payable monthly. For the year ended December 31, 2020, the Administration Fee was $116,532, of which $10,321 is unpaid.
Distribution Service Agreement. DWS Distributors, Inc. (“DDI”), an affiliate of the Advisor, is the Fund’s distributor. In accordance with the Distribution Plan, DDI receives 12b-1 fees of up to 0.25% of average daily net assets of Class B shares. For the year ended December 31, 2020, the Distribution Service Fee was as follows:
| | | | | | | | |
| Distribution Fee | | Total
Aggregated | | | Unpaid at
December 31, 2020 | |
| Class B | | $ | 28 | | | $ | 2 | |
Service Provider Fees. DWS Service Company (“DSC”), an affiliate of the Advisor, is the transfer agent, dividend-paying agent and shareholder service agent for the Fund. Pursuant to a sub-transfer agency agreement between DSC and DST Systems, Inc. (“DST”), DSC has delegated certain transfer agent, dividend-paying agent and shareholder service agent functions to DST. DSC compensates DST out of the shareholder servicing fee it receives from the Fund. For the year ended December 31, 2020, the amounts charged to the Fund by DSC were as follows:
| | | | | | | | |
| Services to Shareholders | | Total
Aggregated | | | Unpaid at
December 31 , 2020 | |
| Class A | | $ | 480 | | | $ | 89 | |
| Class B | | | 22 | | | | 4 | |
| | | $ | 502 | | | $ | 93 | |
Other Service Fees. Under an agreement with the Fund, DIMA is compensated for providing certain pre-press and regulatory filing services to the Fund. For the year ended December 31, 2020, the amount charged to the Fund by DIMA included in the Statement of Operations under “Reports to shareholders” aggregated $13,086, of which $5,495 is unpaid.
Trustees’ Fees and Expenses. The Fund paid retainer fees to each Trustee not affiliated with the Advisor, plus specified amounts to the Board Chairperson and to each committee Chairperson.
Affiliated Cash Management Vehicles. The Fund may invest uninvested cash balances in DWS Central Cash Management Government Fund and DWS ESG Liquidity Fund, affiliated money market funds which are managed by the Advisor. Each affiliated money market fund is managed in accordance with Rule 2a-7 under the 1940 Act, which governs the quality, maturity, diversity and liquidity of instruments in which a money market fund may invest. DWS Central Cash Management Government Fund seeks to maintain a stable net asset value, and DWS ESG Liquidity Fund maintains a floating net asset value. The Fund indirectly bears its proportionate share of the expenses of each affiliated money market fund in which it invests. DWS Central Cash Management Government Fund does not pay the Advisor an investment management fee. To the extent that DWS ESG Liquidity Fund pays an investment management fee to the Advisor, the Advisor will waive an amount of the investment management fee payable to the Advisor by the Fund equal to the amount of the investment management fee payable on the Fund’s assets invested in DWS ESG Liquidity Fund.
| | | | | | |
| | 30 | | | | | | Deutsche DWS Variable Series II — DWS Global Income Builder VIP |
Securities Lending Agent Fees. Deutsche Bank AG serves as securities lending agent for the Fund. For the year ended December 31, 2020, the Fund incurred securities lending agent fees to Deutsche Bank AG in the amount of $1,099.
E. Ownership of the Fund
At December 31, 2020, one participating insurance company was owner of record of 10% or more of the total outstanding Class A shares of the Fund, owning 68%.
F. Line of Credit
The Fund and other affiliated funds (the “Participants”) share in a $350 million revolving credit facility provided by a syndication of banks. The Fund may borrow for temporary or emergency purposes, including the meeting of redemption requests that otherwise might require the untimely disposition of securities. The Participants are charged an annual commitment fee, which is allocated based on net assets, among each of the Participants. Interest is calculated at a rate per annum equal to the sum of the Federal Funds Rate plus 1.25 percent plus if the one-month LIBOR exceeds the Federal Funds Rate, the amount of such excess. The Fund may borrow up to a maximum of 33 percent of its net assets under the agreement. The Fund had no outstanding loans at December 31, 2020.
G. Other — COVID-19 Pandemic
A novel coronavirus known as COVID-19, declared a pandemic by the World Health Organization, has caused significant uncertainty, market volatility, decreased economic and other activity and increased government activity. Specifically, COVID-19 has led to significant death and morbidity, and concerns about its further spread have resulted in the closing of schools and non-essential businesses, cancellations, shelter-in place orders, lower consumer spending in certain sectors, social distancing, bans on large social gatherings and travel, quarantines, government economic stimulus measures, reduced productivity, rapid increases in unemployment, increased demand for and strain on government and medical resources, border closings and global trade and supply chain interruptions, among others. The full effects, duration and costs of the COVID-19 pandemic are impossible to predict, and the circumstances surrounding the COVID-19 pandemic will continue to evolve. The pandemic may affect certain countries, industries, economic sectors, companies and investment products more than others, may exacerbate existing economic, political, or social tensions and may increase the probability of an economic recession or depression. The Fund and its investments may be adversely affected by the effects of the COVID-19 pandemic, and a prolonged pandemic may result in the Fund and its service providers experiencing operational difficulties in coordinating a remote workforce and implementing their business continuity plans, among others. Management will continue to monitor the impact COVID-19 has on the Fund and reflect the consequences as appropriate in the Fund’s accounting and financial reporting.
| | | | |
Deutsche DWS Variable Series II — DWS Global Income Builder VIP | | | | | 31 |
Report of Independent Registered Public Accounting Firm
To the Board of Trustees of Deutsche DWS Variable Series II and Shareholders of DWS Global Income Builder VIP:
Opinion on the Financial Statements
We have audited the accompanying statement of assets and liabilities of DWS Global Income Builder VIP (the “Fund”) (one of the funds constituting Deutsche DWS Variable Series II) (the “Trust”), including the investment portfolio, as of December 31, 2020, and the related statement of operations for the year then ended, the statements of changes in net assets for each of the two years in the period then ended, the financial highlights for each of the five years in the period then ended and the related notes (collectively referred to as the “financial statements”). In our opinion, the financial statements present fairly, in all material respects, the financial position of the Fund (one of the funds constituting Deutsche DWS Variable Series II) at December 31, 2020, the results of its operations for the year then ended, the changes in its net assets for each of the two years in the period then ended and its financial highlights for each of the five years in the period then ended, in conformity with U.S. generally accepted accounting principles.
Basis for Opinion
These financial statements are the responsibility of the Trust’s management. Our responsibility is to express an opinion on the Fund’s financial statements based on our audits. We are a public accounting firm registered with the Public Company Accounting Oversight Board (United States) (“PCAOB”) and are required to be independent with respect to the Trust in accordance with the U.S. federal securities laws and the applicable rules and regulations of the Securities and Exchange Commission and the PCAOB.
We conducted our audits in accordance with the standards of the PCAOB. Those standards require that we plan and perform the audit to obtain reasonable assurance about whether the financial statements are free of material misstatement, whether due to error or fraud. The Trust is not required to have, nor were we engaged to perform, an audit of the Trust’s internal control over financial reporting. As part of our audits, we are required to obtain an understanding of internal control over financial reporting, but not for the purpose of expressing an opinion on the effectiveness of the Trust’s internal control over financial reporting. Accordingly, we express no such opinion.
Our audits included performing procedures to assess the risks of material misstatement of the financial statements, whether due to error or fraud, and performing procedures that respond to those risks. Such procedures included examining, on a test basis, evidence regarding the amounts and disclosures in the financial statements. Our procedures included confirmation of securities owned as of December 31, 2020, by correspondence with the custodian and others or by other appropriate auditing procedures where replies from others were not received. Our audits also included evaluating the accounting principles used and significant estimates made by management, as well as evaluating the overall presentation of the financial statements. We believe that our audits provide a reasonable basis for our opinion.

We have served as the auditor of one or more investment companies in the DWS family of funds since at least 1979, but we are unable to determine the specific year.
Boston, Massachusetts
February 12, 2021
| | | | | | |
| | 32 | | | | | | Deutsche DWS Variable Series II — DWS Global Income Builder VIP |
| | |
| Information About Your Fund’s Expenses | | (Unaudited) |
As an investor of the Fund, you incur two types of costs: ongoing expenses and transaction costs. Ongoing expenses include management fees and other Fund expenses. Examples of transaction costs include contract charges, which are not shown in this section. The following tables are intended to help you understand your ongoing expenses (in dollars) of investing in the Fund and to help you compare these expenses with the ongoing expenses of investing in other mutual funds. In the most recent six-month period, Class B limited these expenses; had it not done so, expenses would have been higher. The example in the table is based on an investment of $1,000 invested at the beginning of the six-month period and held for the entire period (July 1, 2020 to December 31, 2020).
The tables illustrate your Fund’s expenses in two ways:
| – | Actual Fund Return. This helps you estimate the actual dollar amount of ongoing expenses (but not transaction costs) paid on a $1,000 investment in the Fund using the Fund’s actual return during the period. To estimate the expenses you paid over the period, simply divide your account value by $1,000 (for example, an $8,600 account value divided by $1,000 = 8.6), then multiply the result by the number in the “Expenses Paid per $1,000” line under the share class you hold. |
| – | Hypothetical 5% Fund Return. This helps you to compare your Fund’s ongoing expenses (but not transaction costs) with those of other mutual funds using the Fund’s actual expense ratio and a hypothetical rate of return of 5% per year before expenses. Examples using a 5% hypothetical Fund return may be found in the shareholder reports of other mutual funds. The hypothetical account values and expenses may not be used to estimate the actual ending account balance or expenses you paid for the period. |
Please note that the expenses shown in these tables are meant to highlight your ongoing expenses only and do not reflect any transaction costs. The “Expenses Paid per $1,000” line of the tables is useful in comparing ongoing expenses only and will not help you determine the relative total expense of owning different funds. If these transaction costs had been included, your costs would have been higher.
| | | | | | | | |
| Expenses and Value of a $1,000 Investment for the six months ended December 31, 2020 | | | | |
| | |
| Actual Fund Return | | Class A | | | Class B | |
| Beginning Account Value 1/1/20 | | $ | 1,000.00 | | | $ | 1,000.00 | |
| Ending Account Value 6/30/20 | | $ | 1,151.10 | | | $ | 1,148.80 | |
| Expenses Paid per $1,000* | | $ | 3.35 | | | $ | 5.19 | |
| | |
| Hypothetical 5% Fund Return | | Class A | | | Class B | |
| Beginning Account Value 1/1/20 | | $ | 1,000.00 | | | $ | 1,000.00 | |
| Ending Account Value 6/30/20 | | $ | 1,022.02 | | | $ | 1,020.31 | |
| Expenses Paid per $1,000* | | $ | 3.15 | | | $ | 4.88 | |
| * | Expenses are equal to the Fund’s annualized expense ratio for each share class, multiplied by the average account value over the period, multiplied by 184 (the number of days in the most recent six-month period), then divided by 366. |
| | | | | | | | |
| Annualized Expense Ratio | | Class A | | | Class B | |
| Deutsche DWS Variable Series II — DWS Global Income Builder VIP | | | .62 | % | | | .96 | % |
For more information, please refer to the Fund’s prospectus.
These tables do not reflect charges and fees (“contract charges”) associated with the separate account that invests in the Fund or any variable life insurance policy or variable annuity contract for which the Fund is an investment option.
For an analysis of the fees associated with an investment in the Fund or similar funds, please refer to the current and hypothetical expense calculators for Variable Insurance Products which can be found at dws.com/calculators.
| | | | |
Deutsche DWS Variable Series II — DWS Global Income Builder VIP | | | | | 33 |
| | |
| Tax Information | | (Unaudited) |
The Fund paid distributions of $0.34 per share from net long-term capital gains during its year ended December 31, 2020.
Pursuant to Section 852 of the Internal Revenue Code, the Fund designates $1,987,000 as capital gain dividends for its year ended December 31, 2020.
For corporate shareholders, 26% of the ordinary dividends (i.e., income dividends plus short-term capital gains) paid during the Fund’s fiscal year ended December 31, 2020 qualified for the dividends received deduction.
Please consult a tax advisor if you have questions about federal or state income tax laws, or on how to prepare your tax returns. If you have specific questions about your account, please contact your insurance provider.
Proxy Voting
The Trust’s policies and procedures for voting proxies for portfolio securities and information about how the Trust voted proxies related to its portfolio securities during the most recent 12-month period ended June 30 are available on our Web site — dws.com/en-us/resources/proxy-voting — or on the SEC’s Web site — sec.gov. To obtain a written copy of the Trust’s policies and procedures without charge, upon request, call us toll free at (800) 728-3337.
| | | | | | |
| | 34 | | | | | | Deutsche DWS Variable Series II — DWS Global Income Builder VIP |
Advisory Agreement Board Considerations and Fee Evaluation
The Board of Trustees (hereinafter referred to as the “Board” or “Trustees”) approved the renewal of DWS Global Income Builder VIP’s (the “Fund”) investment management agreement (the “Agreement”) with DWS Investment Management Americas, Inc. (“DIMA”) in September 2020.
In terms of the process that the Board followed prior to approving the Agreement, shareholders should know that:
| – | | During the entire process, all of the Fund’s Trustees were independent of DIMA and its affiliates (the “Independent Trustees”). |
| – | | The Board met frequently during the past year to discuss fund matters and dedicated a substantial amount of time to contract review matters. Over the course of several months, the Board reviewed extensive materials received from DIMA, independent third parties and independent counsel. These materials included an analysis of the Fund’s performance, fees and expenses, and profitability from a fee consultant retained by the Fund’s Independent Trustees (the “Fee Consultant”). |
| – | | The Board also received extensive information throughout the year regarding performance of the Fund. |
| – | | The Independent Trustees regularly met privately with counsel to discuss contract review and other matters. In addition, the Independent Trustees were advised by the Fee Consultant in the course of their review of the Fund’s contractual arrangements and considered a comprehensive report prepared by the Fee Consultant in connection with their deliberations. |
| – | | In connection with reviewing the Agreement, the Board also reviewed the terms of the Fund’s Rule 12b-1 plan, distribution agreement, administrative services agreement, transfer agency agreement and other material service agreements. |
In connection with the contract review process, the Board considered the factors discussed below, among others. The Board also considered that DIMA and its predecessors have managed the Fund since its inception, and the Board believes that a long-term relationship with a capable, conscientious advisor is in the best interests of the Fund. The Board considered, generally, that shareholders chose to invest or remain invested in the Fund knowing that DIMA managed the Fund. DIMA is part of DWS Group GmbH & Co. KGaA (“DWS Group”). DWS Group is a global asset management business that offers a wide range of investing expertise and resources, including research capabilities in many countries throughout the world. In 2018, approximately 20% of DWS Group’s shares were sold in an initial public offering, with Deutsche Bank AG owning the remaining shares.
As part of the contract review process, the Board carefully considered the fees and expenses of each DWS fund overseen by the Board in light of the fund’s performance. In many cases, this led to the negotiation and implementation of expense caps.
While shareholders may focus primarily on fund performance and fees, the Fund’s Board considers these and many other factors, including the quality and integrity of DIMA’s personnel and administrative support services provided by DIMA, such as back-office operations, fund valuations, and compliance policies and procedures.
Nature, Quality and Extent of Services. The Board considered the terms of the Agreement, including the scope of advisory services provided under the Agreement. The Board noted that, under the Agreement, DIMA provides portfolio management services to the Fund and that, pursuant to a separate administrative services agreement, DIMA provides administrative services to the Fund. The Board considered the experience and skills of senior management and investment personnel and the resources made available to such personnel. The Board also considered the risks to DIMA in sponsoring or managing the Fund, including financial, operational and reputational risks, the potential economic impact to DIMA from such risks and DIMA’s approach to addressing such risks. The Board reviewed the Fund’s performance over short-term and long-term periods and compared those returns to various agreed-upon performance measures, including market index(es) and a peer universe compiled using information supplied by Morningstar Direct (“Morningstar”), an independent fund data service. The Board also noted that it has put into place a process of identifying “Funds in Review” (e.g., funds performing poorly relative to a peer universe), and receives additional reporting from DIMA regarding such funds and, where appropriate, DIMA’s plans to address underperformance. The Board believes this process is an effective manner of identifying and addressing underperforming funds. Based on the information provided, the Board noted that, for the one-, three- and five-year periods ended December 31, 2019, the Fund’s performance (Class A shares) was in the 2nd
| | | | |
Deutsche DWS Variable Series II — DWS Global Income Builder VIP | | | | | 35 |
quartile, 1st quartile and 1st quartile, respectively, of the applicable Morningstar universe (the 1st quartile being the best performers and the 4th quartile being the worst performers). The Board also observed that the Fund has underperformed its benchmark in the one-, three- and five-year periods ended December 31, 2019.
Fees and Expenses. The Board considered the Fund’s investment management fee schedule, operating expenses and total expense ratios, and comparative information provided by Broadridge Financial Solutions, Inc. (“Broadridge”) and the Fee Consultant regarding investment management fee rates paid to other investment advisors by similar funds (1st quartile being the most favorable and 4th quartile being the least favorable). With respect to management fees paid to other investment advisors by similar funds, the Board noted that the contractual fee rates paid by the Fund, which include a 0.10% fee paid to DIMA under the Fund’s administrative services agreement, were lower than the median (1st quartile) of the applicable Broadridge peer group (based on Broadridge data provided as of December 31, 2019). The Board noted that, effective March 1, 2020, the fee paid to DIMA under the Fund’s administrative services agreement was reduced to 0.097%. The Board noted that the Fund’s Class A shares total (net) operating expenses were expected to be equal to the median of the applicable Broadridge expense universe (based on Broadridge data provided as of December 31, 2019, and analyzing Broadridge expense universe Class A (net) expenses less any applicable 12b-1 fees) (“Broadridge Universe Expenses”). The Board also reviewed data comparing each other operational share class’s total (net) operating expenses to the applicable Broadridge Universe Expenses. The Board noted that the expense limitations agreed to by DIMA were expected to help the Fund’s total (net) operating expenses remain competitive. The Board considered the Fund’s management fee rate as compared to fees charged by DIMA to a comparable DWS U.S. registered fund (“DWS Funds”) and considered differences between the Fund and the comparable DWS Fund. The information requested by the Board as part of its review of fees and expenses also included information about institutional accounts (including any sub-advised funds and accounts) and funds offered primarily to European investors (“DWS Europe Funds”) managed by DWS Group. The Board noted that DIMA indicated that DWS Group does not manage any institutional accounts or DWS Europe Funds comparable to the Fund.
On the basis of the information provided, the Board concluded that management fees were reasonable and appropriate in light of the nature, quality and extent of services provided by DIMA.
Profitability. The Board reviewed detailed information regarding revenues received by DIMA under the Agreement. The Board considered the estimated costs to DIMA, and pre-tax profits realized by DIMA, from advising the DWS Funds, as well as estimates of the pre-tax profits attributable to managing the Fund in particular. The Board also received information regarding the estimated enterprise-wide profitability of DIMA and its affiliates with respect to all fund services in totality and by fund. The Board and the Fee Consultant reviewed DIMA’s methodology in allocating its costs to the management of the Fund. Based on the information provided, the Board concluded that the pre-tax profits realized by DIMA in connection with the management of the Fund were not unreasonable. The Board also reviewed certain publicly available information regarding the profitability of certain similar investment management firms. The Board noted that, while information regarding the profitability of such firms is limited (and in some cases is not necessarily prepared on a comparable basis), DIMA and its affiliates’ overall profitability with respect to the DWS Funds (after taking into account distribution and other services provided to the funds by DIMA and its affiliates) was lower than the overall profitability levels of most comparable firms for which such data was available.
Economies of Scale. The Board considered whether there are economies of scale with respect to the management of the Fund and whether the Fund benefits from any economies of scale. The Board noted that the Fund’s investment management fee schedule includes fee breakpoints. The Board concluded that the Fund’s fee schedule represents an appropriate sharing between the Fund and DIMA of such economies of scale as may exist in the management of the Fund at current asset levels.
Other Benefits to DIMA and Its Affiliates. The Board also considered the character and amount of other incidental or “fall-out” benefits received by DIMA and its affiliates, including any fees received by DIMA for administrative services provided to the Fund, any fees received by an affiliate of DIMA for transfer agency services provided to the Fund and any fees received by an affiliate of DIMA for distribution services. The Board also considered benefits to DIMA related to brokerage and soft-dollar allocations, including allocating brokerage to pay for research generated by parties other than the executing broker dealers, which pertain primarily to funds investing in equity securities. In addition, the Board considered the incidental public relations benefits to DIMA related to DWS Funds advertising and cross-selling opportunities among DIMA products and services. The Board considered these benefits in reaching its conclusion that the Fund’s management fees were reasonable.
| | | | | | |
| | 36 | | | | | | Deutsche DWS Variable Series II — DWS Global Income Builder VIP |
Compliance. The Board considered the significant attention and resources dedicated by DIMA to its compliance processes in recent years. The Board noted in particular (i) the experience, seniority and time commitment of the individuals serving as DIMA’s and the Fund’s chief compliance officers and (ii) the substantial commitment of resources by DIMA and its affiliates to compliance matters, including the retention of compliance personnel.
The Board also considered that on September 24, 2020, the SEC granted a temporary order permitting DIMA and its affiliates to continue providing investment advisory and underwriting services to the DWS Funds notwithstanding a consent order entered into by Deutsche Bank AG on June 17, 2020 (the “Consent Order”). The Board noted that the temporary order was granted effective as of the date of the Consent Order. The Board also noted various representations by DIMA to the Board relating to the Consent Order, including that the conduct giving rise to the Consent Order (unintentional conduct that resulted from a system outage that prevented Deutsche Bank AG from reporting data in accordance with applicable CFTC requirements for five days in April 2016) did not involve any DWS Fund or services DIMA and its affiliates provide to the DWS Funds, that DIMA and its personnel had no involvement in the alleged conduct giving rise to the Consent Order, and that the DWS Funds would not bear any financial impact or costs relating to the Consent Order.
Based on all of the information considered and the conclusions reached, the Board determined that the continuation of the Agreement is in the best interests of the Fund. In making this determination, the Board did not give particular weight to any single factor identified above. The Board considered these factors over the course of numerous meetings, certain of which were in executive session with only the Independent Trustees and counsel present. It is possible that individual Independent Trustees may have weighed these factors differently in reaching their individual decisions to approve the continuation of the Agreement.
| | | | |
Deutsche DWS Variable Series II — DWS Global Income Builder VIP | | | | | 37 |
Board Members and Officers
The following table presents certain information regarding the Board Members and Officers of the Trust/Corporation. Each Board Member’s year of birth is set forth in parentheses after his or her name. Unless otherwise noted, (i) each Board Member has engaged in the principal occupation(s) noted in the table for at least the most recent five years, although not necessarily in the same capacity; and (ii) the address of each Independent Board Member is Keith R. Fox, DWS Funds Board Chair, c/o Thomas R. Hiller, Ropes & Gray LLP, Prudential Tower, 800 Boylston Street, Boston, MA 02199-3600. Except as otherwise noted below, the term of office for each Board Member is until the election and qualification of a successor, or until such Board Member sooner dies, resigns, is removed or as otherwise provided in the governing documents of the Trust/Corporation. Because the Fund does not hold an annual meeting of shareholders, each Board Member will hold office for an indeterminate period.
The Board Members may also serve in similar capacities with other funds in the fund complex. The number of funds in the DWS fund complex shown in the table below includes all registered open- and closed-end funds (including all of their portfolios) advised by the Advisor and any registered funds that have an investment advisor that is an affiliated person of the Advisor.
| | | | | | | | |
| Independent Board Members | | | |
Name, Year of Birth,
Position with the Trust/
Corporation and
Length of Time Served1 | | Business Experience and Directorships During the Past Five Years | | Number of
Funds in
DWS Fund
Complex
Overseen | | | Other
Directorships
Held by Board
Member
|
Keith R. Fox, CFA (1954) Chairperson since 2017, and Board Member since 1996 | | Managing General Partner, Exeter Capital Partners (a series of private investment funds) (since 1986). Directorships: Progressive International Corporation (kitchen goods importer and distributor); former Chairman, National Association of Small Business Investment Companies; former Directorships: ICI Mutual Insurance Company; BoxTop Media Inc. (advertising); Sun Capital Advisers Trust (mutual funds) (2011–2012) | | | 73 | | | — |
John W. Ballantine (1946) Board Member since 1999 | | Retired; formerly, Executive Vice President and Chief Risk Management Officer, First Chicago NBD Corporation/The First National Bank of Chicago (1996–1998); Executive Vice President and Head of International Banking (1995–1996); former Directorships: Director and Chairman of the Board, Healthways, Inc.2 (population well-being and wellness services) (2003–2014); Stockwell Capital Investments PLC (private equity); Enron Corporation; FNB Corporation; Tokheim Corporation; First Oak Brook Bancshares, Inc.; Oak Brook Bank; and Prisma Energy International. Not-for-Profit Director/Trustee: Palm Beach Civic Association; Window to the World Communications (public media); Life Director of Harris Theater for Music and Dance (Chicago); Life Director of Hubbard Street Dance Chicago; former Not-for-Profit Directorships: Public Radio International | | | 73 | | | Portland
General
Electric2
(utility
company)
(2003–
present) |
Dawn-Marie Driscoll (1946) Board Member since 1987 | | Emeritus Executive Fellow, Center for Business Ethics, Bentley University; formerly: Partner, Palmer & Dodge (law firm) (1988–1990); Vice President of Corporate Affairs and General Counsel, Filene’s (retail) (1978–1988). Directorships: Advisory Board, Center for Business Ethics, Bentley University; Trustee and former Chairman of the Board, Southwest Florida Community Foundation (charitable organization); former Directorships: ICI Mutual Insurance Company (2007–2015); Sun Capital Advisers Trust (mutual funds) (2007–2012), Investment Company Institute (audit, executive, nominating committees) and Independent Directors Council (governance, executive committees) | | | 73 | | | — |
Richard J. Herring (1946) Board Member since 1990 | | Jacob Safra Professor of International Banking and Professor of Finance, The Wharton School, University of Pennsylvania (since July 1972); Director, The Wharton Financial Institutions Center (since 1994); formerly: Vice Dean and Director, Wharton Undergraduate Division (1995–2000) and Director, The Lauder Institute of International Management Studies (2000–2006); Member FDIC Systemic Risk Advisory Committee since 2011, member Systemic Risk Council since 2012 and member of the Advisory Board at the Yale Program on Financial Stability since 2013; Formerly Co-Chair of the Shadow Financial Regulatory Committee (2003–2015), Executive Director of The Financial Economists Roundtable (2008–2015), Director of The Thai Capital Fund (2007–2013), Director of The Aberdeen Singapore Fund (2007–2018), and Nonexecutive Director of Barclays Bank DE (2010–2018) | | | 73 | | | Director,
Aberdeen
Japan Fund
(since 2007) |
William McClayton (1944) Board Member since 2004 | | Private equity investor (since October 2009); previously, Managing Director, Diamond Management & Technology Consultants, Inc. (global consulting firm) (2001–2009); Directorship: Board of Managers, YMCA of Metropolitan Chicago; formerly: Senior Partner, Arthur Andersen LLP (accounting) (1966–2001); Trustee, Ravinia Festival | | | 73 | | | — |
| | | | | | |
| | 38 | | | | | | Deutsche DWS Variable Series II — DWS Global Income Builder VIP |
| | | | | | | | |
Name, Year of Birth,
Position with the Trust/
Corporation and
Length of Time Served1 | | Business Experience and Directorships During the Past Five Years | | Number of
Funds in
DWS Fund
Complex
Overseen | | | Other
Directorships
Held by Board
Member
|
Rebecca W. Rimel (1951) Board Member since 1995 | | Senior Advisor, The Pew Charitable Trusts (charitable organization) (since July 2020); formerly: Executive Vice President, The Glenmede Trust Company (investment trust and wealth management) (1983–2004); Board Member, Investor Education (charitable organization) (2004–2005); Trustee, Executive Committee, Philadelphia Chamber of Commerce (2001–2007); Director, Viasys Health Care2 (January 2007–June 2007); Trustee, Thomas Jefferson Foundation (charitable organization) (1994–2012); President, Chief Executive Officer and Director, The Pew Charitable Trusts (charitable organization) (1994–2020) | | | 73 | | | Director,
Becton
Dickinson
and
Company2
(medical
technology
company)
(2012–
present);
Director,
BioTelemetry
Inc.2 (health
care) (2009–
present) |
William N. Searcy, Jr. (1946) Board Member since 1993 | | Private investor since October 2003; formerly: Pension & Savings Trust Officer, Sprint Corporation2 (telecommunications) (November 1989–September 2003); Trustee, Sun Capital Advisers Trust (mutual funds) (1998–2012) | | | 73 | | | — |
| | |
| Officers4 | | |
Name, Year of Birth,
Position with the Trust/
Corporation and
Length of Time Served5 | | Business Experience and Directorships During the Past Five Years |
Hepsen Uzcan6 (1974) President and Chief Executive Officer, 2017–present | | Managing Director3, DWS; Secretary, DWS USA Corporation (2018–present); Assistant Secretary, DWS Distributors, Inc. (2018–present); Director and Vice President, DWS Service Company (2018–present); Assistant Secretary, DWS Investment Management Americas, Inc. (2018–present); Director and President, DB Investment Managers, Inc. (2018–present); President and Chief Executive Officer, The European Equity Fund, Inc., The New Germany Fund, Inc. and The Central and Eastern Europe Fund, Inc. (2017–present); formerly: Vice President for the Deutsche funds (2016–2017); Assistant Secretary for the DWS funds (2013–2019); Assistant Secretary, The European Equity Fund, Inc., The New Germany Fund, Inc. and The Central and Eastern Europe Fund, Inc. (2013–2020); Directorships: Interested Director, The European Equity Fund, Inc., The New Germany Fund, Inc. and The Central and Eastern Europe Fund, Inc. (since June 25, 2020); ICI Mutual Insurance Company (since October 16, 2020); and Episcopalian Charities of New York (2018–present) |
John Millette7 (1962) Vice President and Secretary, 1999–present | | Director,3 DWS; Chief Legal Officer, DWS Investment Management Americas, Inc. (2015–present); Director and Vice President, DWS Trust Company (2016–present); Secretary, DBX ETF Trust (2020–present); Secretary, The European Equity Fund, Inc., The New Germany Fund, Inc. and The Central and Eastern Europe Fund, Inc. (2011–present); formerly: Secretary, Deutsche Investment Management Americas Inc. (2015–2017); Assistant Secretary, DBX ETF Trust (2019–2020); Assistant Secretary (July 14, 2006–December 31, 2010) and Secretary (January 31, 2006–July 13, 2006), The European Equity Fund, Inc., The New Germany Fund, Inc. and The Central and Eastern Europe Fund, Inc. |
Ciara Crawford8 (1984) Assistant Secretary, (2019–present) | | Associate, DWS (since 2015); previously, Legal Assistant at Accelerated Tax Solutions. |
Diane Kenneally7 (1966) Chief Financial Officer and Treasurer, 2018–present | | Director,3 DWS; Treasurer, Chief Financial Officer and Controller, DBX ETF Trust (2019–present); Treasurer and Chief Financial Officer, The European Equity Fund, Inc., The New Germany Fund, Inc. and The Central and Eastern Europe Fund, Inc. (2018–present); formerly: Assistant Treasurer for the DWS funds (2007–2018) |
Paul Antosca7 (1957) Assistant Treasurer, 2007–present | | Director,3 DWS; and Assistant Treasurer, DBX ETF Trust (2019–present) |
Sheila Cadogan7 (1966) Assistant Treasurer, 2017–present | | Director,3 DWS; Director and Vice President, DWS Trust Company (2018–present); Assistant Treasurer, DBX ETF Trust (2019–present); Assistant Treasurer, The European Equity Fund, Inc., The New Germany Fund, Inc. and The Central and Eastern Europe Fund, Inc. (2018–present) |
Scott D. Hogan7 (1970) Chief Compliance Officer, 2016–present | | Director,3 DWS; Chief Compliance Officer, The European Equity Fund, Inc., The New Germany Fund, Inc. and The Central and Eastern Europe Fund, Inc. (2016–present) |
Caroline Pearson7 (1962) Chief Legal Officer, 2010–present | | Managing Director3, DWS; Assistant Secretary, DBX ETF Trust (2020–present); Chief Legal Officer, DBX Advisors LLC and DBX Strategic Advisors LLC (2020–present); Chief Legal Officer, The European Equity Fund, Inc., The New Germany Fund, Inc. and The Central and Eastern Europe Fund, Inc. (2012–present); formerly: Secretary, Deutsche AM Distributors, Inc. (2002–2017); and Secretary, Deutsche AM Service Company (2010–2017) |
| | | | |
Deutsche DWS Variable Series II — DWS Global Income Builder VIP | | | | | 39 |
| | |
Name, Year of Birth,
Position with the Trust/
Corporation and
Length of Time Served5 | | Business Experience and Directorships During the Past Five Years |
Michelle Goveia-Pine6 (1970) Interim Anti-Money Laundering Compliance Officer, since July 10, 2020 | | Director,3 DWS; Interim AML Officer, DWS Trust Company (since July 28, 2020); Interim AML Officer, DBX ETF Trust (since July 9, 2020); Interim AML Officer, The European Equity Fund, Inc., The New Germany Fund, Inc. and The Central and Eastern Europe Fund, Inc. (since July 24, 2020) |
| 1 | The length of time served represents the year in which the Board Member joined the board of one or more DWS funds currently overseen by the Board. |
| 2 | A publicly held company with securities registered pursuant to Section 12 of the Securities Exchange Act of 1934. |
| 3 | Executive title, not a board directorship. |
| 4 | As a result of their respective positions held with the Advisor or its affiliates, these individuals are considered “interested persons” of the Advisor within the meaning of the 1940 Act. Interested persons receive no compensation from the Fund. |
| 5 | The length of time served represents the year in which the officer was first elected in such capacity for one or more DWS funds. |
| 6 | Address: 875 Third Avenue, New York, NY 10022. |
| 7 | Address: 100 Summer Street, Boston, MA 02110. |
| 8 | Address: 5022 Gate Parkway, Suite 400, Jacksonville, FL 32256. |
The Fund’s Statement of Additional Information (“SAI”) includes additional information about the Board Members. The SAI is available, without charge, upon request. If you would like to request a copy of the SAI, you may do so by calling the following toll-free number: (800) 728-3337.
| | | | | | |
| | 40 | | | | | | Deutsche DWS Variable Series II — DWS Global Income Builder VIP |
Notes
Notes
Notes
| | |
| | |
VS2GIB-2 (R-025825-10 2/21) | | |
December 31, 2020
Annual Report
Deutsche DWS Variable Series II
DWS Government Money Market VIP

Contents
| | | | |
| | 3 | | | Management Summary |
| | 5 | | | Portfolio Summary |
| | 6 | | | Investment Portfolio |
| | 8 | | | Statement of Assets and Liabilities |
| | 8 | | | Statement of Operations |
| | 9 | | | Statements of Changes in Net Assets |
| | 10 | | | Financial Highlights |
| | 11 | | | Notes to Financial Statements |
| | 14 | | | Report of Independent Registered Public Accounting Firm |
| | 15 | | | Information About Your Fund’s Expenses |
| | 16 | | | Tax Information |
| | 16 | | | Proxy Voting |
| | 17 | | | Advisory Agreement Board Considerations and Fee Evaluation |
| | 20 | | | Board Members and Officers |
This report must be preceded or accompanied by a prospectus. To obtain an additional prospectus or summary prospectus, if available, call (800) 728-3337 or your financial representative. We advise you to consider the Fund’s objectives, risks, charges and expenses carefully before investing. The summary prospectus and prospectus contain this and other important information about the Fund. Please read the prospectus carefully before you invest.
You could lose money by investing in the Fund. Although the Fund seeks to preserve the value of your investment at $1.00 per share, it cannot guarantee it will do so. An investment in the Fund is not insured or guaranteed by the Federal Deposit Insurance Corporation or any other government agency. The Fund’s sponsor has no legal obligation to provide financial support to the Fund, and you should not expect that the sponsor will provide financial support to the Fund at any time. The credit quality of the Fund’s holdings can change rapidly in certain markets, and the default of a single holding could have an adverse impact on the Fund’s share price. The Fund’s share price can also be negatively affected during periods of high redemption pressures and/or illiquid markets. The actions of a few large investors in the Fund may have a significant adverse effect on the share price of the Fund. Please read the prospectus for specific details regarding the Fund’s risk profile.
War, terrorism, economic uncertainty, trade disputes, public health crises (including the recent pandemic spread of the novel coronavirus) and related geopolitical events could lead to increased market volatility, disruption to U.S. and world economies and markets and may have significant adverse effects on the Fund and its investments.
The brand DWS represents DWS Group GmbH & Co. KGaA and any of its subsidiaries such as DWS Distributors, Inc. which offers investment products or DWS Investment Management Americas, Inc. and RREEF America L.L.C. which offer advisory services.
DWS Distributors, Inc., 222 South Riverside Plaza, Chicago, IL 60606, (800) 621-1148
NOT FDIC/NCUA INSURED NO BANK GUARANTEE MAY LOSE VALUE NOT A DEPOSIT
NOT INSURED BY ANY FEDERAL GOVERNMENT AGENCY
| | | | | | |
| | 2 | | | | | | Deutsche DWS Variable Series II — DWS Government Money Market VIP |
| | |
| Management Summary | | December 31, 2020 (Unaudited) |
During the 12-month period ended December 31, 2020, the Fund provided a total return of 0.24% (Class A shares, unadjusted for contract charges). All performance is historical and does not guarantee future results. Yields fluctuate and are not guaranteed.
Over the past 12 months ended December 31, 2020, yields across the money market yield curve fluctuated based on the status of the U.S. economy, evolving U.S. Federal Reserve (Fed) statements and actions, federal, state and local responses to the coronavirus pandemic, and investor sentiment regarding U.S. political uncertainty and U.S./China trade tensions. In January, the first news of the coronavirus outbreak in China reached the rest of the world, and by February and March, the virus had already spread dramatically in some parts of Europe and the United States. As worries about the outbreak grew, the U.S. financial system endured severe shocks as state and local governments imposed ever-increasing restrictions on public gatherings while significant portions of the U.S. economy were shut down, and the country instantly saw massive job losses and depressed economic activity. In response, the Fed almost immediately enacted a series of measures to gradually restore liquidity to the money markets and boost confidence in financial markets overall. The Fed cut short-term rates by 1.5 percentage points, re-initiated quantitative easing through significant purchases of Treasury, agency, mortgage and high yield securities, restarted liquidity facilities that had been effective in boosting market liquidity during the 2008 financial crisis, and added new facilities. On the fiscal side, Congress and the Administration enacted a $2.3 trillion aid package that included direct payments to individuals, enhanced unemployment benefits and loans to small businesses. These actions helped to stabilize equity markets and boosted investor confidence. Liquidity within the money markets, which had all but disappeared in early March, was restored to a tremendous degree in April due to the above-mentioned monetary and fiscal measures. As a result, by the end of April money markets had largely normalized, in our view.
During the early fall through the end of 2020, investors largely looked past the Administration’s evident pullback from a full-scale national effort to combat the coronavirus. Market watchers then anxiously awaited the outcome of the U.S. election, witnessed significant political disruptions, and waited to see whether Congress and the Administration could agree on another financial relief package for citizens, states and cities, and small businesses. A relief package, though smaller than anticipated, finally was approved near the end of the year.
We were able to maintain what we believe to be a competitive yield for the Fund during the annual period ended December 31, 2020. During the period, the Fund held a large percentage of portfolio assets in agency and Treasury floating-rate securities to take advantage of incremental rises in SOFR (the Secured Overnight Financing Rate) and Treasury bill rates. At the same time, the Fund invested in overnight agency repurchase agreements for liquidity and looked for yield opportunities from three- to six-month agency and Treasury securities.
While significant U.S. political uncertainty has persisted through the end of 2020 and beyond, given the results of the election we believe that the prospects for additional fiscal stimulus in early 2021 have measurably increased. With that, we look for higher short-term Treasury issuance, which should relieve some downward pressure on money market yields and help yields to pick up marginally. Our strategy over the coming weeks will be to shorten duration now in preparation for continued steepening in the money market yield curve in 2021 that we believe may occur, and take advantage of higher yields when possible.
A group of investment professionals is responsible for the day-to-day management of the Fund. These investment professionals have a broad range of experience managing money market funds.
The views expressed reflect those of the portfolio management team only through the end of the period of the report as stated on the cover. The management team’s views are subject to change at any time based on market and other conditions and should not be construed as a recommendation. Past performance is no guarantee of future results. Current and future portfolio holdings are subject to risk.
| | | | |
Deutsche DWS Variable Series II — DWS Government Money Market VIP | | | | | 3 |
Fund Performance (as of December 31, 2020)
All performance shown is historical, assumes reinvestment of all dividend and capital gain distributions and does not guarantee future results. Investment return and principal value fluctuate with changing market conditions so that, when redeemed, shares may be worth more or less than their original cost. Current performance may be lower or higher than the performance data quoted. Please contact your participating insurance company for the Fund’s most recent month-end performance. Performance does not reflect charges and fees (“contract charges”) associated with the separate account that invests in the Fund or any variable life insurance policy or variable annuity contract for which the Fund is an investment option. These charges and fees will reduce returns. The yield quotation more closely reflects the current earnings of the Fund than the total return quotation.
You could lose money by investing in the Fund. Although the Fund seeks to preserve the value of your investment at $1.00 per share, it cannot guarantee it will do so. An investment in the Fund is not insured or guaranteed by the Federal Deposit Insurance Corporation or any other government agency. The Fund’s sponsor has no legal obligation to provide financial support to the Fund, and you should not expect that the sponsor will provide financial support to the Fund at any time.
| | |
| |
| | | 7-Day Current Yield |
| December 31, 2020 | | 0.01%* |
| * | The 7-Day Current Yield would have been -.35% had certain expenses not been reduced. |
Yields are historical, will fluctuate and do not guarantee future performance. The 7-day current yield refers to the income paid by the portfolio over a 7-day period expressed as an annual percentage rate of the fund’s shares outstanding. Please visit our Web site at liquidity.dws.com/US/index.jsp for the product’s most recent month-end performance.
Terms to Know
The yield curve is a graphical representation of how yields on bonds of different maturities compare. Normally, yield curves slant up, as bonds with longer maturities typically offer higher yields than short-term bonds.
A repurchase agreement, or “overnight repo,” is an agreement between a seller and a buyer, usually of government securities, where the seller agrees to repurchase the securities at a given price and usually at a stated time. Repos are widely used money market instruments that serve as an interest-bearing, short-term “parking place” for large sums of money.
Floating-rate securities are debt instruments with floating-rate coupons that generally reset every 30 to 90 days. While floating-rate securities are senior to equity and fixed- income securities, there is no guaranteed return of principal in case of default. Floating- rate issues often have less interest-rate risk than other fixed-income investments.
Floating-rate securities are most often secured assets, generally senior to a company’s secured debt, and can be transferred to debt holders, resulting in potential downside risk.
SOFR, or the Secured Overnight Financing Rate, is a benchmark interest rate for short-term U.S. dollar-denominated loans that has been recommended to replace the London Interbank Offered Rate (LIBOR). SOFR is based on transactions in the Treasury repurchase market where investors offer banks overnight loans backed by their bond assets.
Duration is a measure of price volatility for fixed-income instruments. Duration can be defined as the approximate percentage change in price for a 100 basis point (one single percentage point) change in market interest rate levels.
| | | | | | |
| | 4 | | | | | | Deutsche DWS Variable Series II — DWS Government Money Market VIP |
| | |
| Portfolio Summary | | (Unaudited) |
| | | | | | | | |
| Asset Allocation (As a % of Investment Portfolio) | | 12/31/20 | | | 12/31/19 | |
| Government & Agency Obligations | | | 77% | | | | 79% | |
| Repurchase Agreements | | | 23% | | | | 21% | |
| | | | 100% | | | | 100% | |
| | |
| Weighted Average Maturity | | 12/31/20 | | | 12/31/19 | |
| Deutsche DWS Variable Series II — DWS Government Money Market VIP | | | 26 days | | | | 29 days | |
| iMoneyNet Money Fund AverageTM — Gov’t & Agency Retail* | | | 37 days | | | | 29 days | |
| * | The Fund is compared to its respective iMoneyNet Money Fund Average category: Gov’t & Agency Retail — Category includes the most broadly based of the government retail funds. These funds may invest in U.S. Treasury securities, securities issued or guaranteed by the U.S. Government or its agencies or instrumentalities. |
Weighted average maturity, also known as effective maturity, is the weighted average of the maturity date of bonds held by the Fund taking into consideration any available maturity shortening features.
Portfolio holdings and characteristics are subject to change.
For more complete details about the Fund’s investment portfolio, see page 6.
Each month, information about the Fund and its portfolio holdings is filed with the SEC on Form N-MFP. The SEC delays the public availability of the information filed on Form N-MFP for 60 days after the end of the reporting period included in the filing. These forms will be available on the SEC’s Web site at sec.gov. The Fund’s portfolio holdings are also posted on dws.com as of each month-end. Please see the Fund’s current prospectus for more information.
| | | | |
Deutsche DWS Variable Series II — DWS Government Money Market VIP | | | | | 5 |
| | |
| Investment Portfolio | | as of December 31, 2020 |
| | | | | | | | |
| | | Principal
Amount ($) | | | Value ($) | |
| Government & Agency Obligations 77.1% | |
| U.S. Government Sponsored Agencies 32.6% | |
| | |
Federal Farm Credit Bank: | | | | | | | | |
| | |
1-month LIBOR minus 0.055%, 0.093%*, 2/3/2021 | | | 1,000,000 | | | | 999,991 | |
| | |
0.112%**, 4/16/2021 | | | 1,500,000 | | | | 1,499,519 | |
| | |
SOFR plus 0.070%, 0.16%*, 8/11/2022 | | | 500,000 | | | | 500,041 | |
| | |
0.35%, 5/7/2021 | | | 1,250,000 | | | | 1,249,764 | |
| | |
Federal Home Loan Bank: | | | | | | | | |
| | |
3-month LIBOR minus 0.155%, 0.061%*, 1/29/2021 | | | 1,000,000 | | | | 1,000,000 | |
| | |
0.09%**, 3/24/2021 | | | 1,500,000 | | | | 1,499,696 | |
| | |
1-month LIBOR minus 0.050%, 0.098%*, 1/27/2021 | | | 1,000,000 | | | | 1,000,000 | |
| | |
0.1%**, 1/29/2021 | | | 2,500,000 | | | | 2,499,809 | |
| | |
SOFR plus 0.010%, 0.1%*, 5/3/2021 | | | 4,000,000 | | | | 4,000,000 | |
| | |
0.11%, 4/26/2021 | | | 1,000,000 | | | | 999,980 | |
| | |
SOFR plus 0.030%, 0.12%*, 1/28/2021 | | | 1,500,000 | | | | 1,500,000 | |
| | |
SOFR plus 0.040%, 0.13%*, 2/9/2021 | | | 1,000,000 | | | | 1,000,000 | |
| | |
SOFR plus 0.040%, 0.13%*, 2/26/2021 | | | 2,750,000 | | | | 2,750,000 | |
| | |
1-month LIBOR minus 0.010%, 0.138%*, 5/3/2021 | | | 750,000 | | | | 749,974 | |
| | |
SOFR plus 0.050%, 0.14%*, 1/22/2021 | | | 300,000 | | | | 300,000 | |
| | |
SOFR plus 0.050%, 0.14%*, 1/28/2021 | | | 2,500,000 | | | | 2,500,000 | |
| | |
0.15%, 11/22/2021 | | | 1,000,000 | | | | 1,000,000 | |
| | |
SOFR plus 0.065%, 0.155%*, 2/26/2021 | | | 1,500,000 | | | | 1,500,000 | |
| | |
SOFR plus 0.120%, 0.21%*, 2/28/2022 | | | 1,000,000 | | | | 1,000,000 | |
| | |
0.458%**, 3/8/2021 | | | 2,500,000 | | | | 2,497,938 | |
| | |
0.529%**, 3/9/2021 | | | 1,000,000 | | | | 999,032 | |
| |
Federal Home Loan Mortgage Corp.: | | | | | |
| | |
SOFR plus 0.030%, 0.12%*, 1/22/2021 | | | 1,200,000 | | | | 1,200,000 | |
| | |
SOFR plus 0.030%, 0.12%*, 2/24/2021 | | | 1,500,000 | | | | 1,500,000 | |
| | |
SOFR plus 0.070%, 0.16%*, 2/25/2022 | | | 3,000,000 | | | | 3,000,000 | |
| | |
SOFR plus 0.950%, 0.185%*, 8/19/2022 | | | 1,500,000 | | | | 1,500,000 | |
| | |
SOFR plus 0.150%, 0.24%*, 3/4/2022 | | | 1,750,000 | | | | 1,747,189 | |
| |
Federal National Mortgage Association: | | | | | |
| | |
SOFR plus 0.040%, 0.13%*, 1/29/2021 | | | 1,500,000 | | | | 1,500,000 | |
| | |
SOFR plus 0.050%, 0.14%*, 3/4/2021 | | | 3,500,000 | | | | 3,500,000 | |
| | |
SOFR plus 0.075%, 0.165%*, 6/4/2021 | | | 2,000,000 | | | | 2,000,000 | |
| | |
SOFR plus 0.300%, 0.39%*, 1/7/2022 | | | 1,500,000 | | | | 1,500,000 | |
| | |
SOFR plus 0.310%, 0.4%*, 10/25/2021 | | | 1,500,000 | | | | 1,500,000 | |
| | | | | | | | |
| | | | | | | 49,992,933 | |
| | | | | | | | |
| | | Principal
Amount ($) | | | Value ($) | |
| U.S. Treasury Obligations 44.5% | |
| | |
U.S. Treasury Bills: | | | | | | | | |
| | |
0.082%**, 2/16/2021 | | | 5,000,000 | | | | 4,999,483 | |
| | |
0.086%**, 2/25/2021 | | | 8,250,000 | | | | 8,248,911 | |
| | |
0.092%**, 5/27/2021 | | | 5,000,000 | | | | 4,998,175 | |
| | |
0.097%**, 1/7/2021 | | | 5,000,000 | | | | 4,999,921 | |
| | |
0.102%**, 1/28/2021 | | | 5,000,000 | | | | 4,999,594 | |
| | |
0.102%**, 3/2/2021 | | | 1,000,000 | | | | 999,833 | |
| | |
0.105%**, 1/14/2021 | | | 2,500,000 | | | | 2,499,859 | |
| | |
0.107%**, 3/25/2021 | | | 5,000,000 | | | | 4,998,790 | |
| | |
0.12%**, 2/25/2021 | | | 1,750,000 | | | | 1,749,702 | |
| | |
0.122%**, 2/11/2021 | | | 2,000,000 | | | | 1,999,727 | |
| | |
0.125%**, 1/28/2021 | | | 3,000,000 | | | | 2,999,755 | |
| | |
0.147%**, 1/14/2021 | | | 4,000,000 | | | | 3,999,839 | |
| |
U.S. Treasury Floating Rate Notes: | | | | | |
| | |
3-month U.S. Treasury Bill Money Market Yield plus 0.055%, 0.15%*, 7/31/2022 | | | 1,000,000 | | | | 999,976 | |
| | |
3-month U.S. Treasury Bill Money Market Yield plus 0.114%, 0.209%*, 4/30/2022 | | | 3,500,000 | | | | 3,503,472 | |
| | |
3-month U.S. Treasury Bill Money Market Yield plus 0.115%, 0.21%*, 1/31/2021 | | | 9,000,000 | | | | 9,000,760 | |
| | |
3-month U.S. Treasury Bill Money Market Yield plus 0.139%, 0.234%*, 4/30/2021 | | | 5,700,000 | | | | 5,702,708 | |
| | |
3-month U.S. Treasury Bill Money Market Yield plus 0.220%, 0.315%*, 7/31/2021 | | | 500,000 | | | | 500,644 | |
| | |
3-month U.S. Treasury Bill Money Market Yield plus 0.300%, 0.395%*, 10/31/2021 | | | 1,000,000 | | | | 1,002,502 | |
| | | | | | | | |
| | | | | | | | 68,203,651 | |
Total Government & Agency Obligations
(Cost $118,196,584) | | | | 118,196,584 | |
| |
| Repurchase Agreements 22.8% | | | | | |
| | |
Citigroup Global Markets, Inc., 0.05%, dated 12/31/2020, to be repurchased at $19,608,109 on 1/4/2021 (a) | | | 19,608,000 | | | | 19,608,000 | |
| | |
Wells Fargo Bank, 0.08%, dated 12/31/2020, to be repurchased at $15,300,136 on 1/4/2021 (b) | | | 15,300,000 | | | | 15,300,000 | |
Total Repurchase Agreements
(Cost $34,908,000) | | | | | | | 34,908,000 | |
| | |
| | | % of Net
Assets | | | Value ($) | |
Total Investment Portfolio
(Cost $153,104,584) | | | 99.9 | | | | 153,104,584 | |
| Other Assets and Liabilities, Net | | | 0.1 | | | | 152,630 | |
| Net Assets | | | 100.0 | | | | 153,257,214 | |
The accompanying notes are an integral part of the financial statements.
| | | | | | |
| | 6 | | | | | | Deutsche DWS Variable Series II — DWS Government Money Market VIP |
| * | Floating rate security. These securities are shown at their current rate as of December 31, 2020. |
| ** | Annualized yield at time of purchase; not a coupon rate. |
| | | | | | | | | | |
| Principal Amount ($) | | Security | | Rate (%) | | Maturity
Date | | Collateral
Value ($) | |
| 311,300 | | U.S. Treasury Bond | | 2.25-2.875 | | 8/15/2045-8/15/2047 | | | 392,332 | |
| 17,065,700 | | U.S. Treasury Note | | 0.25 | | 7/15/2029 | | | 19,607,912 | |
| Total Collateral Value | | | | | | | | | 20,000,244 | |
| (b) | Collateralized by $14,534,886 Federal National Mortgage Association, with the various coupon rates from 1.865-6%, with various maturity dates of 4/1/2023-12/1/2050 with a value of $15,606,000. |
LIBOR: London Interbank Offered Rate
SOFR: Secured Overnight Financing Rate
Fair Value Measurements
Various inputs are used in determining the value of the Fund’s investments. These inputs are summarized in three broad levels. Level 1 includes quoted prices in active markets for identical securities. Level 2 includes other significant observable inputs (including quoted prices for similar securities, interest rates, prepayment speeds and credit risk). Level 3 includes significant unobservable inputs (including the Fund’s own assumptions in determining the fair value of investments). The level assigned to the securities valuations may not be an indication of the risk or liquidity associated with investing in those securities. Securities held by the Fund are reflected as Level 2 because the securities are valued at amortized cost (which approximates fair value) and, accordingly, the inputs used to determine value are not quoted prices in an active market.
The following is a summary of the inputs used as of December 31, 2020 in valuing the Fund’s investments. For information on the Fund’s policy regarding the valuation of investments, please refer to the Security Valuation section of Note A in the accompanying Notes to Financial Statements.
| | | | | | | | | | | | | | | | |
| Assets | | Level 1 | | | Level 2 | | | Level 3 | | | Total | |
| Government & Agency Obligations (c) | | $ | — | | | $ | 118,196,584 | | | $ | — | | | $ | 118,196,584 | |
| Repurchase Agreements | | | — | | | | 34,908,000 | | | | — | | | | 34,908,000 | |
| Total | | $ | — | | | $ | 153,104,584 | | | $ | — | | | $ | 153,104,584 | |
| (c) | See Investment Portfolio for additional detailed categorizations. |
The accompanying notes are an integral part of the financial statements.
| | | | |
Deutsche DWS Variable Series II — DWS Government Money Market VIP | | | | | 7 |
Statement of
Assets and Liabilities
| | | | |
| as of December 31, 2020 | |
|
| Assets | |
Investments in securities, valued at
amortized cost | | $ | 118,196,584 | |
Repurchase Agreements, valued at
amortized cost | | | 34,908,000 | |
| Cash | | | 50,208 | |
| Receivable for Fund shares sold | | | 195,940 | |
| Interest receivable | | | 16,314 | |
| Other assets | | | 3,532 | |
| Total assets | | | 153,370,578 | |
| |
| Liabilities | | | | |
| Payable for Fund shares redeemed | | | 9,344 | |
| Distributions payable | | | 684 | |
| Accrued Trustees’ fees | | | 2,505 | |
| Other accrued expenses and payables | | | 100,831 | |
| Total liabilities | | | 113,364 | |
| Net assets, at value | | $ | 153,257,214 | |
| |
| Net Assets Consist of | | | | |
| Distributable earnings (loss) | | | 15,013 | |
| Paid-in capital | | | 153,242,201 | |
| Net assets, at value | | $ | 153,257,214 | |
| |
| Net Asset Value | | | | |
Class A | | | | |
| |
Net asset value, offering and redemption price per share ($153,257,214 ÷ 153,325,917
outstanding shares of beneficial interest, no par value, unlimited number of shares authorized) | | $ | 1.00 | |
Statement of Operations
| | | | |
| for the year ended December 31, 2020 | |
| |
| Investment Income | | | | |
| Income: | | | | |
| Interest | | $ | 666,741 | |
| Expenses: | | | | |
| Management fee | | | 369,116 | |
| Administration fee | | | 152,957 | |
| Services to Shareholders | | | 2,759 | |
| Custodian fee | | | 4,789 | |
| Professional fees | | | 51,913 | |
| Reports to shareholders | | | 62,650 | |
| Trustees’ fees and expenses | | | 4,954 | |
| Other | | | 12,071 | |
| Total expenses before expense reductions | | | 661,209 | |
| Expense reductions | | | (303,046 | ) |
| Total expenses after expense reductions | | | 358,163 | |
| Net investment income | | | 308,578 | |
| Net realized gain (loss) from investments | | | 144 | |
| Net increase (decrease) in net assets resulting from operations | | $ | 308,722 | |
The accompanying notes are an integral part of the financial statements.
| | | | | | |
| | 8 | | | | | | Deutsche DWS Variable Series II — DWS Government Money Market VIP |
Statements of Changes in Net Assets
| | | | | | | | |
| | | Years Ended December 31, | |
| Increase (Decrease) in Net Assets | | 2020 | | | 2019 | |
| Operations: | | | | | | | | |
| Net investment income (loss) | | $ | 308,578 | | | $ | 1,929,658 | |
| Net realized gain (loss) | | | 144 | | | | 42 | |
| Net increase (decrease) in net assets resulting from operations | | | 308,722 | | | | 1,929,700 | |
| Distributions to shareholders : | | | | | | | | |
Class A | | | (308,575 | ) | | | (1,929,596 | ) |
| Fund share transactions: | | | | | | | | |
Class A | | | | | | | | |
| Proceeds from shares sold | | | 180,940,347 | | | | 121,681,165 | |
| Reinvestment of distributions | | | 366,986 | | | | 1,949,598 | |
| Payments for shares redeemed | | | (150,319,848 | ) | | | (108,541,061 | ) |
| Net increase (decrease) in net assets from Class A share transactions | | | 30,987,485 | | | | 15,089,702 | |
| Increase (decrease) in net assets | | | 30,987,632 | | | | 15,089,806 | |
| Net assets at beginning of period | | | 122,269,582 | | | | 107,179,776 | |
| | |
| Net assets at end of period | | $ | 153,257,214 | | | $ | 122,269,582 | |
| | |
| Other Information: | | | | | | | | |
Class A | | | | | | | | |
| Shares outstanding at beginning of period | | | 122,338,432 | | | | 107,248,730 | |
| Shares sold | | | 180,940,347 | | | | 121,681,165 | |
| Shares issued to shareholders in reinvestment of distributions | | | 366,986 | | | | 1,949,598 | |
| Shares redeemed | | | (150,319,848 | ) | | | (108,541,061 | ) |
| Net increase (decrease) in Fund shares | | | 30,987,485 | | | | 15,089,702 | |
| | |
| Shares outstanding at end of period | | | 153,325,917 | | | | 122,338,432 | |
The accompanying notes are an integral part of the financial statements.
| | | | |
Deutsche DWS Variable Series II — DWS Government Money Market VIP | | | | | 9 |
Financial Highlights
| | | | | | | | | | | | | | | | | | | | |
| DWS Government Money Market VIP — Class A | | | | | | | | | | | | | | | |
| | | Years Ended December 31, | |
| | | 2020 | | | 2019 | | | 2018 | | | 2017 | | | 2016 | |
| | | | | |
| Selected Per Share Data | | | | | | | | | | | | | | | | | | | | |
| Net asset value, beginning of period | | | $1.00 | | | | $1.00 | | | | $1.00 | | | | $1.00 | | | | $1.00 | |
| Income from investment operations: | | | | | | | | | | | | | | | | | | | | |
| | | | | |
Net investment income | | | .002 | | | | .018 | | | | .014 | | | | .005 | | | | .001 | b |
Net realized gain (loss) | | | .000 | * | | | .000 | * | | | (.000 | )* | | | .000 | * | | | .000 | * |
Total from investment operations | | | .002 | | | | .018 | | | | .014 | | | | .005 | | | | .001 | |
| Less distributions from: | | | | | | | | | | | | | | | | | | | | |
Net investment income | | | (.002 | ) | | | (.018 | ) | | | (.014 | ) | | | (.005 | ) | | | (.001 | ) |
| Net asset value, end of period | | | $1.00 | | | | $1.00 | | | | $1.00 | | | | $1.00 | | | | $1.00 | |
| Total Return (%) | | | .24 | a | | | 1.77 | a | | | 1.39 | a | | | .45 | | | | .05 | a,b |
| | | | | |
| Ratios to Average Net Assets and Supplemental Data | | | | | | | | | | | | | | | | | | | | |
| Net assets, end of period ($ millions) | | | 153 | | | | 122 | | | | 107 | | | | 111 | | | | 122 | |
| Ratio of expenses before expense reductions (%)c | | | .42 | | | | .47 | | | | .50 | | | | .48 | | | | .51 | |
| Ratio of expenses after expense reductions (%)c | | | .23 | | | | .47 | | | | .50 | | | | .48 | | | | .44 | |
| Ratio of net investment income (%) | | | .20 | | | | 1.74 | | | | 1.37 | | | | .45 | | | | .05 | b |
| a | Total return would have been lower had certain expenses not been reduced. |
| b | Includes a non-recurring payment for overbilling of prior years’ custodian out-of-pocket fees. Excluding this payment, net investment income per share, total return, and ratio of net investment income to average net assets would have been reduced by $0.0004, 0.04%, and 0.04%, respectively. |
| c | Expense ratio does not reflect charges and fees associated with the separate account that invests in the Fund or any variable life insurance policy or variable annuity contract for which the Fund is an investment option. |
| * | Amount is less than $.0005. |
The accompanying notes are an integral part of the financial statements.
| | | | | | |
| | 10 | | | | | | Deutsche DWS Variable Series II — DWS Government Money Market VIP |
| | |
| Notes to Financial Statements | | |
A. Organization and Significant Accounting Policies
DWS Government Money Market VIP (the “Fund”) is a diversified series of Deutsche DWS Variable Series II (the “Trust”), which is registered under the Investment Company Act of 1940, as amended (the “1940 Act”), as an open-end management investment company organized as a Massachusetts business trust.
The Fund’s financial statements are prepared in accordance with accounting principles generally accepted in the United States of America (“U.S. GAAP”) which require the use of management estimates. Actual results could differ from those estimates. The Fund qualifies as an investment company under Topic 946 of Accounting Standards Codification of U.S. GAAP. The policies described below are followed consistently by the Fund in the preparation of its financial statements.
Security Valuation. Various inputs are used in determining the value of the Fund’s investments. These inputs are summarized in three broad levels. Level 1 includes quoted prices in active markets for identical securities. Level 2 includes other significant observable inputs (including quoted prices for similar securities, interest rates, prepayment speeds and credit risk). Level 3 includes significant unobservable inputs (including the Fund’s own assumptions in determining the fair value of investments). The level assigned to the securities valuations may not be an indication of the risk or liquidity associated with investing in those securities.
The Fund values all securities utilizing the amortized cost method permitted in accordance with Rule 2a-7 under the 1940 Act and certain conditions therein. Under this method, which does not take into account unrealized capital gains or losses on securities, an instrument is initially valued at its cost and thereafter assumes a constant accretion/amortization rate to maturity of any discount or premium. Securities held by the Fund are reflected as Level 2 because the securities are valued at amortized cost (which approximates fair value) and, accordingly, the inputs used to determine value are not quoted prices in an active market.
Disclosure about the classification of fair value measurements is included in a table following the Fund’s Investment Portfolio.
Repurchase Agreements. The Fund may enter into repurchase agreements, under the terms of a Master Repurchase Agreement, with certain banks and broker/dealers whereby the Fund, through its custodian or a sub-custodian bank, receives delivery of the underlying securities, the amount of which at the time of purchase and each subsequent business day is required to be maintained at such a level that the value is equal to at least the principal amount of the repurchase price plus accrued interest. The custodian bank or another designated sub-custodian holds the collateral in a separate account until the agreement matures. If the value of the securities falls below the principal amount of the repurchase agreement plus accrued interest, the financial institution deposits additional collateral by the following business day. If the financial institution either fails to deposit the required additional collateral or fails to repurchase the securities as agreed, the Fund has the right to sell the securities and recover any resulting loss from the financial institution. If the financial institution enters into bankruptcy, the Fund’s claim on the collateral may be subject to legal proceedings.
As of December 31, 2020, the Fund held repurchase agreements with a gross value of $34,908,000. The value of the related collateral exceeded the value of the repurchase agreements at period end. The detail of the related collateral is included in the footnotes following the Fund’s Investment Portfolio.
Federal Income Taxes. The Fund’s policy is to comply with the requirements of the Internal Revenue Code, as amended, which are applicable to regulated investment companies and to distribute all of its taxable income to its shareholders.
The Fund has reviewed the tax positions for the open tax years as of December 31, 2020 and has determined that no provision for income tax and/or uncertain tax positions is required in the Fund’s financial statements. The Fund’s federal tax returns for the prior three fiscal years remain open subject to examination by the Internal Revenue Service.
Distribution of Income and Gains. Net investment income of the Fund is declared as a daily dividend and is distributed to shareholders monthly. The Fund may take into account capital gains and losses in its daily dividend declarations. The Fund may also make additional distributions for tax purposes if necessary.
Permanent book and tax differences relating to shareholder distributions will result in reclassifications to paid-in capital. Temporary book and tax differences will reverse in a subsequent period. There were no significant book to tax differences for the Fund.
| | | | |
Deutsche DWS Variable Series II — DWS Government Money Market VIP | | | | | 11 |
At December 31, 2020, the Fund’s components of distributable earnings on a tax basis were as follows:
| | | | |
| Undistributed ordinary income | | $ | 15,013 | |
At December 31, 2020, the aggregate cost of investments for federal income tax purposes was $153,104,584.
In addition, the tax character of distributions paid by the Fund is summarized as follows:
| | | | | | | | |
| | | Years Ended December 31, | |
| | | 2020 | | | 2019 | |
| Distributions from ordinary income | | $ | 308,575 | | | $ | 1,929,596 | |
Expenses. Expenses of the Trust arising in connection with a specific fund are allocated to that fund. Other Trust expenses which cannot be directly attributed to a fund are apportioned among the funds in the Trust based upon the relative net assets or other appropriate measures.
Contingencies. In the normal course of business, the Fund may enter into contracts with service providers that contain general indemnification clauses. The Fund’s maximum exposure under these arrangements is unknown, as this would involve future claims that may be made against the Fund that have not yet been made. However, based on experience, the Fund expects the risk of loss to be remote.
Other. Investment transactions are accounted for on a trade date. Interest income is recorded on the accrual basis. Realized gains and losses from investment transactions are recorded on an identified cost basis. All discounts and premiums are accreted/amortized for both tax and financial reporting purposes.
B. Related Parties
Management Agreement. Under the Investment Management Agreement with DWS Investment Management Americas, Inc. (“DIMA” or the “Advisor”), an indirect, wholly owned subsidiary of DWS Group GmbH & Co. KGaA (“DWS Group”), the Advisor directs the investments of the Fund in accordance with its investment objectives, policies and restrictions. The Advisor determines the securities, instruments and other contracts relating to investments to be purchased, sold or entered into by the Fund.
Under the Investment Management Agreement with the Advisor, the Fund pays the Advisor a monthly management fee based on its average daily net assets, computed and accrued daily and payable monthly, at the following annual rates:
| | | | |
| First $500 million | | | .235 | % |
| Next $500 million | | | .220 | % |
| Next $1.0 billion | | | .205 | % |
| Over $2.0 billion | | | .190 | % |
Accordingly, for the year ended December 31, 2020, the fee pursuant to the Investment Management Agreement was equivalent to an annual rate (exclusive of any applicable waivers/reimbursements) of 0.235% of the Fund’s average daily net assets.
For the period from January 1, 2020 through September 30, 2021, the Advisor has contractually agreed to waive its fee and/or reimburse certain operating expenses to the extent necessary to maintain the total annual operating expenses (excluding certain expenses such as extraordinary expenses, taxes, brokerage and interest expense) at 0.51%.
In addition, the Advisor has agreed to voluntarily waive additional expenses. This voluntary waiver may be changed or terminated at any time without notice. Under these arrangements, the Advisor waived certain expenses of the Fund.
For the year ended December 31, 2020, fees waived and/or expenses reimbursed amounted to $303,046.
Administration Fee. Pursuant to an Administrative Services Agreement, DIMA provides most administrative services to the Fund. Prior to March 1, 2020, for all services provided under the Administrative Services Agreement, the Fund paid the Advisor an annual fee (“Administration Fee”) of 0.10% of the Fund’s average daily net assets, computed and accrued daily and payable monthly. Effective March 1, 2020, for all services provided under the Administrative Services Agreement, the Fund pays the Advisor an annual Administration Fee of 0.097% of the Fund’s average daily net assets, computed and accrued daily and payable monthly. For the year ended December 31, 2020, the Administration Fee was $152,957, of which $12,835 is unpaid.
| | | | | | |
| | 12 | | | | | | Deutsche DWS Variable Series II — DWS Government Money Market VIP |
Service Provider Fees. DWS Service Company (“DSC”), an affiliate of the Advisor, is the transfer agent, dividend-paying agent and shareholder service agent for the Fund. Pursuant to a sub-transfer agency agreement between DSC and DST Systems, Inc. (“DST”), DSC has delegated certain transfer agent, dividend-paying agent and shareholder service agent functions to DST. DSC compensates DST out of the shareholder servicing fee it receives from the Fund. For the year ended December 31, 2020, the amounts charged to the Fund by DSC aggregated $2,325, of which $393 is unpaid.
Other Service Fees. Under an agreement with the Fund, DIMA is compensated for providing certain pre-press and regulatory filing services to the Fund. For the year ended December 31, 2020, the amount charged to the Fund by DIMA included in the Statement of Operations under “Reports to shareholders” aggregated $7,608, of which $2,910 is unpaid.
Trustees’ Fees and Expenses. The Fund paid retainer fees to each Trustee not affiliated with the Advisor, plus specified amounts to the Board Chairperson and to each committee Chairperson.
C. Ownership of the Fund
At December 31, 2020, three participating insurance companies were owners of record of 10% or more of the total outstanding Class A shares of the Fund, each owning 58%, 15% and 11%.
D. Line of Credit
The Fund and other affiliated funds (the “Participants”) share in a $350 million revolving credit facility provided by a syndication of banks. The Fund may borrow for temporary or emergency purposes, including the meeting of redemption requests that otherwise might require the untimely disposition of securities. The Participants are charged an annual commitment fee, which is allocated based on net assets, among each of the Participants. Interest is calculated at a rate per annum equal to the sum of the Federal Funds Rate, plus 1.25 percent plus if the one-month LIBOR exceeds the Federal Funds Rate, the amount of such excess. The Fund may borrow up to a maximum of 33 percent of its net assets under the agreement. The Fund had no outstanding loans at December 31, 2020.
E. Money Market Fund Investments and Yield
Rising interest rates could cause the value of the Fund’s investments — and therefore its share price as well — to decline. Conversely, any decline in interest rates is likely to cause the Fund’s yield to decline, and during periods of unusually low interest rates, the Fund’s yield may approach zero. A low interest rate environment may prevent the fund from providing a positive yield or paying fund expenses out of current income and, at times, could impair the fund’s ability to maintain a stable $1.00 share price. Over time, the total return of a money market fund may not keep pace with inflation, which could result in a net loss of purchasing power for long-term investors. Recent and potential future changes in monetary policy made by central banks or governments are likely to affect the level of interest rates. Money market funds try to minimize this risk by purchasing short-term securities.
If there is an insufficient supply of US government securities to meet investor demand, it could result in lower yields on such securities and increase interest rate risk for the fund.
F. Other — COVID-19 Pandemic
A novel coronavirus known as COVID-19, declared a pandemic by the World Health Organization, has caused significant uncertainty, market volatility, decreased economic and other activity and increased government activity. Specifically, COVID-19 has led to significant death and morbidity, and concerns about its further spread have resulted in the closing of schools and non-essential businesses, cancellations, shelter-in place orders, lower consumer spending in certain sectors, social distancing, bans on large social gatherings and travel, quarantines, government economic stimulus measures, reduced productivity, rapid increases in unemployment, increased demand for and strain on government and medical resources, border closings and global trade and supply chain interruptions, among others. The full effects, duration and costs of the COVID-19 pandemic are impossible to predict, and the circumstances surrounding the COVID-19 pandemic will continue to evolve. The pandemic may affect certain countries, industries, economic sectors, companies and investment products more than others, may exacerbate existing economic, political, or social tensions and may increase the probability of an economic recession or depression. The Fund and its investments may be adversely affected by the effects of the COVID-19 pandemic, and a prolonged pandemic may result in the Fund and its service providers experiencing operational difficulties in coordinating a remote workforce and implementing their business continuity plans, among others. Management will continue to monitor the impact COVID-19 has on the Fund and reflect the consequences as appropriate in the Fund’s accounting and financial reporting.
| | | | |
Deutsche DWS Variable Series II — DWS Government Money Market VIP | | | | | 13 |
Report of Independent Registered Public Accounting Firm
To the Board of Trustees of Deutsche DWS Variable Series II and Shareholders of DWS Government Money Market VIP:
Opinion on the Financial Statements
We have audited the accompanying statement of assets and liabilities of DWS Government Money Market VIP (the “Fund”) (one of the funds constituting Deutsche DWS Variable Series II) (the “Trust”), including the investment portfolio, as of December 31, 2020, and the related statement of operations for the year then ended, the statements of changes in net assets for each of the two years in the period then ended, the financial highlights for each of the five years in the period then ended and the related notes (collectively referred to as the “financial statements”). In our opinion, the financial statements present fairly, in all material respects, the financial position of the Fund (one of the funds constituting Deutsche DWS Variable Series II) at December 31, 2020, the results of its operations for the year then ended, the changes in its net assets for each of the two years in the period then ended and its financial highlights for each of the five years in the period then ended, in conformity with U.S. generally accepted accounting principles.
Basis for Opinion
These financial statements are the responsibility of the Trust’s management. Our responsibility is to express an opinion on the Fund’s financial statements based on our audits. We are a public accounting firm registered with the Public Company Accounting Oversight Board (United States) (“PCAOB”) and are required to be independent with respect to the Trust in accordance with the U.S. federal securities laws and the applicable rules and regulations of the Securities and Exchange Commission and the PCAOB.
We conducted our audits in accordance with the standards of the PCAOB. Those standards require that we plan and perform the audit to obtain reasonable assurance about whether the financial statements are free of material misstatement, whether due to error or fraud. The Trust is not required to have, nor were we engaged to perform, an audit of the Trust’s internal control over financial reporting. As part of our audits, we are required to obtain an understanding of internal control over financial reporting, but not for the purpose of expressing an opinion on the effectiveness of the Trust’s internal control over financial reporting. Accordingly, we express no such opinion.
Our audits included performing procedures to assess the risks of material misstatement of the financial statements, whether due to error or fraud, and performing procedures that respond to those risks. Such procedures included examining, on a test basis, evidence regarding the amounts and disclosures in the financial statements. Our procedures included confirmation of securities owned as of December 31, 2020, by correspondence with the custodian and brokers. Our audits also included evaluating the accounting principles used and significant estimates made by management, as well as evaluating the overall presentation of the financial statements. We believe that our audits provide a reasonable basis for our opinion.

We have served as the auditor of one or more investment companies in the DWS family of funds since at least 1979, but we are unable to determine the specific year.
Boston, Massachusetts
February 12, 2021
| | | | | | |
| | 14 | | | | | | Deutsche DWS Variable Series II — DWS Government Money Market VIP |
| | |
| Information About Your Fund’s Expenses | | (Unaudited) |
As an investor of the Fund, you incur two types of costs: ongoing expenses and transaction costs. Ongoing expenses include management fees and other Fund expenses. Examples of transaction costs include contract charges, which are not shown in this section. The following tables are intended to help you understand your ongoing expenses (in dollars) of investing in the Fund and to help you compare these expenses with the ongoing expenses of investing in other mutual funds. In the most recent six-month period the Fund limited these expenses; had it not done so, expenses would have been higher. The example in the table is based on an investment of $1,000 invested at the beginning of the six-month period and held for the entire period (July 1, 2020 to December 31, 2020).
The tables illustrate your Fund’s expenses in two ways:
| – | | Actual Fund Return. This helps you estimate the actual dollar amount of ongoing expenses (but not transaction costs) paid on a $1,000 investment in the Fund using the Fund’s actual return during the period. To estimate the expenses you paid over the period, simply divide your account value by $1,000 (for example, an $8,600 account value divided by $1,000 = 8.6), then multiply the result by the number in the “Expenses Paid per $1,000” line under the share class you hold. |
| – | | Hypothetical 5% Fund Return. This helps you to compare your Fund’s ongoing expenses (but not transaction costs) with those of other mutual funds using the Fund’s actual expense ratio and a hypothetical rate of return of 5% per year before expenses. Examples using a 5% hypothetical Fund return may be found in the shareholder reports of other mutual funds. The hypothetical account values and expenses may not be used to estimate the actual ending account balance or expenses you paid for the period. |
Please note that the expenses shown in these tables are meant to highlight your ongoing expenses only and do not reflect any transaction costs. The “Expenses Paid per $1,000” line of the tables is useful in comparing ongoing expenses only and will not help you determine the relative total expense of owning different funds. If these transaction costs had been included, your costs would have been higher.
| | | | |
| Expenses and Value of a $1,000 Investment for the six months ended December 31, 2020 | | | |
| |
| Actual Fund Return | | | Class A | |
| Beginning Account Value 7/1/20 | | $ | 1,000.00 | |
| Ending Account Value 12/31/20 | | $ | 1,000.10 | |
| Expenses Paid per $1,000* | | $ | .65 | |
| |
| Hypothetical 5% Fund Return | | | Class A | |
| Beginning Account Value 7/1/20 | | $ | 1,000.00 | |
| Ending Account Value 12/31/20 | | $ | 1,024.48 | |
| Expenses Paid per $1,000* | | $ | .66 | |
| * | Expenses are equal to the Fund’s annualized expense ratio, multiplied by the average account value over the period, multiplied by 184 (the number of days in the most recent six-month period), then divided by 366. |
| | | | |
| Annualized Expense Ratio | | Class A | |
| Deutsche DWS Variable Series II — DWS Government Money Market VIP | | | .13 | % |
For more information, please refer to the Fund’s prospectus.
These tables do not reflect charges and fees (“contract charges”) associated with the separate account that invests in the Fund or any variable life insurance policy or variable annuity contract for which the Fund is an investment option.
For an analysis of the fees associated with an investment in the Fund or similar funds, please refer to the current and hypothetical expense calculators for Variable Insurance Products which can be found at dws.com/calculators.
| | | | |
Deutsche DWS Variable Series II — DWS Government Money Market VIP | | | | | 15 |
| | |
| Tax Information | | (Unaudited) |
Please consult a tax advisor if you have questions about federal or state income tax laws, or on how to prepare your tax returns. If you have specific questions about your account, please contact your insurance provider.
Proxy Voting
The Trust’s policies and procedures for voting proxies for portfolio securities and information about how the Trust voted proxies related to its portfolio securities during the most recent 12-month period ended June 30 are available on our Web site — dws.com/en-us/resources/proxy-voting — or on the SEC’s Web site — sec.gov. To obtain a written copy of the Trust’s policies and procedures without charge, upon request, call us toll free at (800) 728-3337.
| | | | | | |
| | 16 | | | | | | Deutsche DWS Variable Series II — DWS Government Money Market VIP |
Advisory Agreement Board Considerations and Fee Evaluation
The Board of Trustees (hereinafter referred to as the “Board” or “Trustees”) approved the renewal of DWS Government Money Market VIP’s (the “Fund”) investment management agreement (the “Agreement”) with DWS Investment Management Americas, Inc. (“DIMA”) in September 2020.
In terms of the process that the Board followed prior to approving the Agreement, shareholders should know that:
| – | | During the entire process, all of the Fund’s Trustees were independent of DIMA and its affiliates (the “Independent Trustees”). |
| – | | The Board met frequently during the past year to discuss fund matters and dedicated a substantial amount of time to contract review matters. Over the course of several months, the Board reviewed extensive materials received from DIMA, independent third parties and independent counsel. These materials included an analysis of the Fund’s performance, fees and expenses, and profitability from a fee consultant retained by the Fund’s Independent Trustees (the “Fee Consultant”). |
| – | | The Board also received extensive information throughout the year regarding performance of the Fund. |
| – | | The Independent Trustees regularly met privately with counsel to discuss contract review and other matters. In addition, the Independent Trustees were advised by the Fee Consultant in the course of their review of the Fund’s contractual arrangements and considered a comprehensive report prepared by the Fee Consultant in connection with their deliberations. |
| – | | In connection with reviewing the Agreement, the Board also reviewed the terms of the Fund’s distribution agreement, administrative services agreement, transfer agency agreement and other material service agreements. |
In connection with the contract review process, the Board considered the factors discussed below, among others. The Board also considered that DIMA and its predecessors have managed the Fund since its inception, and the Board believes that a long-term relationship with a capable, conscientious advisor is in the best interests of the Fund. The Board considered, generally, that shareholders chose to invest or remain invested in the Fund knowing that DIMA managed the Fund. DIMA is part of DWS Group GmbH & Co. KGaA (“DWS Group”). DWS Group is a global asset management business that offers a wide range of investing expertise and resources, including research capabilities in many countries throughout the world. In 2018, approximately 20% of DWS Group’s shares were sold in an initial public offering, with Deutsche Bank AG owning the remaining shares.
As part of the contract review process, the Board carefully considered the fees and expenses of each DWS fund overseen by the Board in light of the fund’s performance. In many cases, this led to the negotiation and implementation of expense caps.
While shareholders may focus primarily on fund performance and fees, the Fund’s Board considers these and many other factors, including the quality and integrity of DIMA’s personnel and administrative support services provided by DIMA, such as back-office operations, fund valuations, and compliance policies and procedures.
Nature, Quality and Extent of Services. The Board considered the terms of the Agreement, including the scope of advisory services provided under the Agreement. The Board noted that, under the Agreement, DIMA provides portfolio management services to the Fund and that, pursuant to a separate administrative services agreement, DIMA provides administrative services to the Fund. The Board considered the experience and skills of senior management and investment personnel and the resources made available to such personnel. The Board also considered the risks to DIMA in sponsoring or managing the Fund, including financial, operational and reputational risks, the potential economic impact to DIMA from such risks and DIMA’s approach to addressing such risks. The Board reviewed the Fund’s performance over short-term and long-term periods and compared those returns to various agreed-upon performance measures, including a peer universe compiled using information supplied by iMoneyNet, an independent fund data service. The Board also noted that it has put into place a process of identifying “Funds in Review” (e.g., funds performing poorly relative to a peer universe), and receives additional reporting from DIMA regarding such funds and, where appropriate, DIMA’s plans to address underperformance. The Board believes this process is an
| | | | |
Deutsche DWS Variable Series II — DWS Government Money Market VIP | | | | | 17 |
effective manner of identifying and addressing underperforming funds. Based on the information provided, the Board noted that, for the one- and three-year periods ended December 31, 2019, the Fund’s performance (Class A shares) was in the 2nd quartile and 1st quartile, respectively, of the applicable iMoneyNet universe (the 1st quartile being the best performers and the 4th quartile being the worst performers).
Fees and Expenses. The Board considered the Fund’s investment management fee schedule, operating expenses and total expense ratios, and comparative information provided by Broadridge Financial Solutions, Inc. (“Broadridge”) and the Fee Consultant regarding investment management fee rates paid to other investment advisors by similar funds (1st quartile being the most favorable and 4th quartile being the least favorable). With respect to management fees paid to other investment advisors by similar funds, the Board noted that the contractual fee rates paid by the Fund, which include a 0.10% fee paid to DIMA under the Fund’s administrative services agreement, were lower than the median (1st quartile) of the applicable Broadridge peer group (based on Broadridge data provided as of December 31, 2019). The Board noted that, effective March 1, 2020, the fee paid to DIMA under the Fund’s administrative services agreement was reduced to 0.097%. Based on Broadridge data provided as of December 31, 2019, the Board noted that the Fund’s Class A shares total operating expenses were higher than the median (3rd quartile) of the applicable Broadridge expense universe (less any applicable 12b-1 fees). The Board noted the expense limitation agreed to by DIMA. The Board also noted the voluntary fee waivers implemented by DIMA from time to time in recent years to ensure the Fund maintained a positive yield. The Board considered the Fund’s management fee rate as compared to fees charged by DIMA to comparable DWS U.S. registered funds (“DWS Funds”) and considered differences between the Fund and the comparable DWS Funds. The information requested by the Board as part of its review of fees and expenses also included information about institutional accounts (including any sub-advised funds and accounts) and funds offered primarily to European investors (“DWS Europe Funds”) managed by DWS Group. The Board noted that DIMA indicated that DWS Group does not manage any institutional accounts or DWS Europe Funds comparable to the Fund.
On the basis of the information provided, the Board concluded that management fees were reasonable and appropriate in light of the nature, quality and extent of services provided by DIMA.
Profitability. The Board reviewed detailed information regarding revenues received by DIMA under the Agreement. The Board considered the estimated costs to DIMA, and pre-tax profits realized by DIMA, from advising the DWS Funds, as well as estimates of the pre-tax profits attributable to managing the Fund in particular. The Board also received information regarding the estimated enterprise-wide profitability of DIMA and its affiliates with respect to all fund services in totality and by fund. The Board and the Fee Consultant reviewed DIMA’s methodology in allocating its costs to the management of the Fund. Based on the information provided, the Board concluded that the pre-tax profits realized by DIMA in connection with the management of the Fund were not unreasonable. The Board also reviewed certain publicly available information regarding the profitability of certain similar investment management firms. The Board noted that, while information regarding the profitability of such firms is limited (and in some cases is not necessarily prepared on a comparable basis), DIMA and its affiliates’ overall profitability with respect to the DWS Funds (after taking into account distribution and other services provided to the funds by DIMA and its affiliates) was lower than the overall profitability levels of most comparable firms for which such data was available.
Economies of Scale. The Board considered whether there are economies of scale with respect to the management of the Fund and whether the Fund benefits from any economies of scale. The Board noted that the Fund’s investment management fee schedule includes fee breakpoints. The Board concluded that the Fund’s fee schedule represents an appropriate sharing between the Fund and DIMA of such economies of scale as may exist in the management of the Fund at current asset levels.
Other Benefits to DIMA and Its Affiliates. The Board also considered the character and amount of other incidental or “fall-out” benefits received by DIMA and its affiliates, including any fees received by DIMA for administrative services provided to the Fund and any fees received by an affiliate of DIMA for transfer agency services provided to the Fund. The Board also considered benefits to DIMA related to brokerage and soft-dollar allocations, including allocating brokerage to pay for research generated by parties other than the executing broker dealers, which pertain primarily to funds investing in equity securities. In addition, the Board
| | | | | | |
| | 18 | | | | | | Deutsche DWS Variable Series II — DWS Government Money Market VIP |
considered the incidental public relations benefits to DIMA related to DWS Funds advertising and cross-selling opportunities among DIMA products and services. The Board considered these benefits in reaching its conclusion that the Fund’s management fees were reasonable.
Compliance. The Board considered the significant attention and resources dedicated by DIMA to its compliance processes in recent years. The Board noted in particular (i) the experience, seniority and time commitment of the individuals serving as DIMA’s and the Fund’s chief compliance officers and (ii) the substantial commitment of resources by DIMA and its affiliates to compliance matters, including the retention of compliance personnel.
The Board also considered that on September 24, 2020, the SEC granted a temporary order permitting DIMA and its affiliates to continue providing investment advisory and underwriting services to the DWS Funds notwithstanding a consent order entered into by Deutsche Bank AG on June 17, 2020 (the “Consent Order”). The Board noted that the temporary order was granted effective as of the date of the Consent Order. The Board also noted various representations by DIMA to the Board relating to the Consent Order, including that the conduct giving rise to the Consent Order (unintentional conduct that resulted from a system outage that prevented Deutsche Bank AG from reporting data in accordance with applicable CFTC requirements for five days in April 2016) did not involve any DWS Fund or services DIMA and its affiliates provide to the DWS Funds, that DIMA and its personnel had no involvement in the alleged conduct giving rise to the Consent Order, and that the DWS Funds would not bear any financial impact or costs relating to the Consent Order.
Based on all of the information considered and the conclusions reached, the Board determined that the continuation of the Agreement is in the best interests of the Fund. In making this determination, the Board did not give particular weight to any single factor identified above. The Board considered these factors over the course of numerous meetings, certain of which were in executive session with only the Independent Trustees and counsel present. It is possible that individual Independent Trustees may have weighed these factors differently in reaching their individual decisions to approve the continuation of the Agreement.
| | | | |
Deutsche DWS Variable Series II — DWS Government Money Market VIP | | | | | 19 |
Board Members and Officers
The following table presents certain information regarding the Board Members and Officers of the Trust/Corporation. Each Board Member’s year of birth is set forth in parentheses after his or her name. Unless otherwise noted, (i) each Board Member has engaged in the principal occupation(s) noted in the table for at least the most recent five years, although not necessarily in the same capacity; and (ii) the address of each Independent Board Member is Keith R. Fox, DWS Funds Board Chair, c/o Thomas R. Hiller, Ropes & Gray LLP, Prudential Tower, 800 Boylston Street, Boston, MA 02199-3600. Except as otherwise noted below, the term of office for each Board Member is until the election and qualification of a successor, or until such Board Member sooner dies, resigns, is removed or as otherwise provided in the governing documents of the Trust/Corporation. Because the Fund does not hold an annual meeting of shareholders, each Board Member will hold office for an indeterminate period.
The Board Members may also serve in similar capacities with other funds in the fund complex. The number of funds in the DWS fund complex shown in the table below includes all registered open- and closed-end funds (including all of their portfolios) advised by the Advisor and any registered funds that have an investment advisor that is an affiliated person of the Advisor.
| | | | | | | | |
| Independent Board Members | | | |
Name, Year of Birth,
Position with the Trust/
Corporation and
Length of Time Served1 | | Business Experience and Directorships During the Past Five Years | | Number of
Funds in
DWS Fund
Complex
Overseen | | | Other
Directorships
Held by Board
Member
|
Keith R. Fox, CFA (1954) Chairperson since 2017, and Board Member since 1996 | | Managing General Partner, Exeter Capital Partners (a series of private investment funds) (since 1986). Directorships: Progressive International Corporation (kitchen goods importer and distributor); former Chairman, National Association of Small Business Investment Companies; former Directorships: ICI Mutual Insurance Company; BoxTop Media Inc. (advertising); Sun Capital Advisers Trust (mutual funds) (2011–2012) | | | 73 | | | — |
John W. Ballantine (1946) Board Member since 1999 | | Retired; formerly, Executive Vice President and Chief Risk Management Officer, First Chicago NBD Corporation/The First National Bank of Chicago (1996–1998); Executive Vice President and Head of International Banking (1995–1996); former Directorships: Director and Chairman of the Board, Healthways, Inc.2 (population well-being and wellness services) (2003–2014); Stockwell Capital Investments PLC (private equity); Enron Corporation; FNB Corporation; Tokheim Corporation; First Oak Brook Bancshares, Inc.; Oak Brook Bank; and Prisma Energy International. Not-for-Profit Director/Trustee: Palm Beach Civic Association; Window to the World Communications (public media); Life Director of Harris Theater for Music and Dance (Chicago); Life Director of Hubbard Street Dance Chicago; former Not-for-Profit Directorships: Public Radio International | | | 73 | | | Portland
General
Electric2
(utility
company)
(2003–
present) |
Dawn-Marie Driscoll (1946) Board Member since 1987 | | Emeritus Executive Fellow, Center for Business Ethics, Bentley University; formerly: Partner, Palmer & Dodge (law firm) (1988–1990); Vice President of Corporate Affairs and General Counsel, Filene’s (retail) (1978–1988). Directorships: Advisory Board, Center for Business Ethics, Bentley University; Trustee and former Chairman of the Board, Southwest Florida Community Foundation (charitable organization); former Directorships: ICI Mutual Insurance Company (2007–2015); Sun Capital Advisers Trust (mutual funds) (2007–2012), Investment Company Institute (audit, executive, nominating committees) and Independent Directors Council (governance, executive committees) | | | 73 | | | — |
Richard J. Herring (1946) Board Member since 1990 | | Jacob Safra Professor of International Banking and Professor of Finance, The Wharton School, University of Pennsylvania (since July 1972); Director, The Wharton Financial Institutions Center (since 1994); formerly: Vice Dean and Director, Wharton Undergraduate Division (1995–2000) and Director, The Lauder Institute of International Management Studies (2000–2006); Member FDIC Systemic Risk Advisory Committee since 2011, member Systemic Risk Council since 2012 and member of the Advisory Board at the Yale Program on Financial Stability since 2013; Formerly Co-Chair of the Shadow Financial Regulatory Committee (2003–2015), Executive Director of The Financial Economists Roundtable (2008–2015), Director of The Thai Capital Fund (2007–2013), Director of The Aberdeen Singapore Fund (2007–2018), and Nonexecutive Director of Barclays Bank DE (2010–2018) | | | 73 | | | Director,
Aberdeen
Japan Fund
(since 2007) |
William McClayton (1944) Board Member since 2004 | | Private equity investor (since October 2009); previously, Managing Director, Diamond Management & Technology Consultants, Inc. (global consulting firm) (2001–2009); Directorship: Board of Managers, YMCA of Metropolitan Chicago; formerly: Senior Partner, Arthur Andersen LLP (accounting) (1966–2001); Trustee, Ravinia Festival | | | 73 | | | — |
| | | | | | |
| | 20 | | | | | | Deutsche DWS Variable Series II — DWS Government Money Market VIP |
| | | | | | | | |
Name, Year of Birth,
Position with the Trust/
Corporation and
Length of Time Served1 | | Business Experience and Directorships During the Past Five Years | | Number of
Funds in
DWS Fund
Complex
Overseen | | | Other
Directorships
Held by Board
Member
|
Rebecca W. Rimel (1951) Board Member since 1995 | | Senior Advisor, The Pew Charitable Trusts (charitable organization) (since July 2020); formerly: Executive Vice President, The Glenmede Trust Company (investment trust and wealth management) (1983–2004); Board Member, Investor Education (charitable organization) (2004–2005); Trustee, Executive Committee, Philadelphia Chamber of Commerce (2001–2007); Director, Viasys Health Care2 (January 2007–June 2007); Trustee, Thomas Jefferson Foundation (charitable organization) (1994–2012); President, Chief Executive Officer and Director, The Pew Charitable Trusts (charitable organization) (1994–2020) | | | 73 | | | Director,
Becton
Dickinson
and
Company2
(medical
technology
company)
(2012–
present);
Director,
BioTelemetry
Inc.2 (health
care) (2009–
present) |
William N. Searcy, Jr. (1946) Board Member since 1993 | | Private investor since October 2003; formerly: Pension & Savings Trust Officer, Sprint Corporation2 (telecommunications) (November 1989–September 2003); Trustee, Sun Capital Advisers Trust (mutual funds) (1998–2012) | | | 73 | | | — |
| | |
| Officers4 | | |
Name, Year of Birth,
Position with the Trust/
Corporation and
Length of Time Served5 | | Business Experience and Directorships During the Past Five Years |
Hepsen Uzcan6 (1974) President and Chief Executive Officer, 2017–present | | Managing Director3, DWS; Secretary, DWS USA Corporation (2018–present); Assistant Secretary, DWS Distributors, Inc. (2018–present); Director and Vice President, DWS Service Company (2018–present); Assistant Secretary, DWS Investment Management Americas, Inc. (2018–present); Director and President, DB Investment Managers, Inc. (2018–present); President and Chief Executive Officer, The European Equity Fund, Inc., The New Germany Fund, Inc. and The Central and Eastern Europe Fund, Inc. (2017–present); formerly: Vice President for the Deutsche funds (2016–2017); Assistant Secretary for the DWS funds (2013–2019); Assistant Secretary, The European Equity Fund, Inc., The New Germany Fund, Inc. and The Central and Eastern Europe Fund, Inc. (2013–2020); Directorships: Interested Director, The European Equity Fund, Inc., The New Germany Fund, Inc. and The Central and Eastern Europe Fund, Inc. (since June 25, 2020); ICI Mutual Insurance Company (since October 16, 2020); and Episcopalian Charities of New York (2018–present) |
John Millette7 (1962) Vice President and Secretary, 1999–present | | Director,3 DWS; Chief Legal Officer, DWS Investment Management Americas, Inc. (2015–present); Director and Vice President, DWS Trust Company (2016–present); Secretary, DBX ETF Trust (2020–present); Secretary, The European Equity Fund, Inc., The New Germany Fund, Inc. and The Central and Eastern Europe Fund, Inc. (2011–present); formerly: Secretary, Deutsche Investment Management Americas Inc. (2015–2017); Assistant Secretary, DBX ETF Trust (2019–2020); Assistant Secretary (July 14, 2006–December 31, 2010) and Secretary (January 31, 2006–July 13, 2006), The European Equity Fund, Inc., The New Germany Fund, Inc. and The Central and Eastern Europe Fund, Inc. |
Ciara Crawford8 (1984) Assistant Secretary, (2019–present) | | Associate, DWS (since 2015); previously, Legal Assistant at Accelerated Tax Solutions. |
Diane Kenneally7 (1966) Chief Financial Officer and Treasurer, 2018–present | | Director,3 DWS; Treasurer, Chief Financial Officer and Controller, DBX ETF Trust (2019–present); Treasurer and Chief Financial Officer, The European Equity Fund, Inc., The New Germany Fund, Inc. and The Central and Eastern Europe Fund, Inc. (2018–present); formerly: Assistant Treasurer for the DWS funds (2007–2018) |
Paul Antosca7 (1957) Assistant Treasurer, 2007–present | | Director,3 DWS; and Assistant Treasurer, DBX ETF Trust (2019–present) |
Sheila Cadogan7 (1966) Assistant Treasurer, 2017–present | | Director,3 DWS; Director and Vice President, DWS Trust Company (2018–present); Assistant Treasurer, DBX ETF Trust (2019–present); Assistant Treasurer, The European Equity Fund, Inc., The New Germany Fund, Inc. and The Central and Eastern Europe Fund, Inc. (2018–present) |
Scott D. Hogan7 (1970) Chief Compliance Officer, 2016–present | | Director,3 DWS; Chief Compliance Officer, The European Equity Fund, Inc., The New Germany Fund, Inc. and The Central and Eastern Europe Fund, Inc. (2016–present) |
Caroline Pearson7 (1962) Chief Legal Officer, 2010–present | | Managing Director3, DWS; Assistant Secretary, DBX ETF Trust (2020–present); Chief Legal Officer, DBX Advisors LLC and DBX Strategic Advisors LLC (2020–present); Chief Legal Officer, The European Equity Fund, Inc., The New Germany Fund, Inc. and The Central and Eastern Europe Fund, Inc. (2012–present); formerly: Secretary, Deutsche AM Distributors, Inc. (2002–2017); and Secretary, Deutsche AM Service Company (2010–2017) |
| | | | |
Deutsche DWS Variable Series II — DWS Government Money Market VIP | | | | | 21 |
| | |
Name, Year of Birth,
Position with the Trust/
Corporation and
Length of Time Served5 | | Business Experience and Directorships During the Past Five Years |
Michelle Goveia-Pine6 (1970) Interim Anti-Money Laundering Compliance Officer, since July 10, 2020 | | Director,3 DWS; Interim AML Officer, DWS Trust Company (since July 28, 2020); Interim AML Officer, DBX ETF Trust (since July 9, 2020); Interim AML Officer, The European Equity Fund, Inc., The New Germany Fund, Inc. and The Central and Eastern Europe Fund, Inc. (since July 24, 2020) |
| 1 | The length of time served represents the year in which the Board Member joined the board of one or more DWS funds currently overseen by the Board. |
| 2 | A publicly held company with securities registered pursuant to Section 12 of the Securities Exchange Act of 1934. |
| 3 | Executive title, not a board directorship. |
| 4 | As a result of their respective positions held with the Advisor or its affiliates, these individuals are considered “interested persons” of the Advisor within the meaning of the 1940 Act. Interested persons receive no compensation from the Fund. |
| 5 | The length of time served represents the year in which the officer was first elected in such capacity for one or more DWS funds. |
| 6 | Address: 875 Third Avenue, New York, NY 10022. |
| 7 | Address: 100 Summer Street, Boston, MA 02110. |
| 8 | Address: 5022 Gate Parkway, Suite 400, Jacksonville, FL 32256. |
The Fund’s Statement of Additional Information (“SAI”) includes additional information about the Board Members. The SAI is available, without charge, upon request. If you would like to request a copy of the SAI, you may do so by calling the following toll-free number: (800) 728-3337.
| | | | | | |
| | 22 | | | | | | Deutsche DWS Variable Series II — DWS Government Money Market VIP |
Notes
| | |
| | |
VS2GMM-2 (R-025834-10 2/21) | | |
December 31, 2020
Annual Report
Deutsche DWS Variable Series II
DWS High Income VIP

Contents
| | | | |
| | 3 | | | Performance Summary |
| | 4 | | | Management Summary |
| | 6 | | | Portfolio Summary |
| | 7 | | | Investment Portfolio |
| | 15 | | | Statement of Assets and Liabilities |
| | 15 | | | Statement of Operations |
| | 16 | | | Statements of Changes in Net Assets |
| | 17 | | | Financial Highlights |
| | 18 | | | Notes to Financial Statements |
| | 25 | | | Report of Independent Registered Public Accounting Firm |
| | 26 | | | Information About Your Fund’s Expenses |
| | 27 | | | Tax Information |
| | 27 | | | Proxy Voting |
| | 28 | | | Advisory Agreement Board Considerations and Fee Evaluation |
| | 31 | | | Board Members and Officers |
This report must be preceded or accompanied by a prospectus. To obtain an additional prospectus or summary prospectus, if available, call (800) 728-3337 or your financial representative. We advise you to consider the Fund’s objectives, risks, charges and expenses carefully before investing. The summary prospectus and prospectus contain this and other important information about the Fund. Please read the prospectus carefully before you invest.
Bond investments are subject to interest-rate, credit, liquidity and market risks to varying degrees. When interest rates rise, bond prices generally fall. Credit risk refers to the ability of an issuer to make timely payments of principal and interest. Investments in lower-quality (“junk bonds”) and non-rated securities present greater risk of loss than investments in higher-quality securities. Investing in foreign securities presents certain risks, such as currency fluctuations, political and economic changes, and market risks. Investing in derivatives entails special risks relating to liquidity, leverage and credit that may reduce returns and/or increase volatility. The Fund may lend securities to approved institutions. Please read the prospectus for details.
War, terrorism, economic uncertainty, trade disputes, public health crises (including the recent pandemic spread of the novel coronavirus) and related geopolitical events could lead to increased market volatility, disruption to U.S. and world economies and markets and may have significant adverse effects on the Fund and its investments.
The brand DWS represents DWS Group GmbH & Co. KGaA and any of its subsidiaries such as DWS Distributors, Inc. which offers investment products or DWS Investment Management Americas, Inc. and RREEF America L.L.C. which offer advisory services.
DWS Distributors, Inc., 222 South Riverside Plaza, Chicago, IL 60606, (800) 621-1148
NOT FDIC/NCUA INSURED NO BANK GUARANTEE MAY LOSE VALUE NOT A DEPOSIT NOT INSURED BY ANY FEDERAL GOVERNMENT AGENCY
| | | | | | |
| | 2 | | | | | | Deutsche DWS Variable Series II — DWS High Income VIP |
| | |
| Performance Summary | | December 31, 2020 (Unaudited) |
Fund performance shown is historical, assumes reinvestment of all dividend and capital gain distributions and does not guarantee future results. Investment return and principal value fluctuate with changing market conditions so that, when redeemed, shares may be worth more or less than their original cost. Current performance may be lower or higher than the performance data quoted. Please contact your participating insurance company for the Fund’s most recent month-end performance. Performance does not reflect charges and fees (“contract charges”) associated with the separate account that invests in the Fund or any variable life insurance policy or variable annuity contract for which the Fund is an investment option. These charges and fees will reduce returns. While all share classes have the same underlying portfolio, their performance will differ.
The gross expense ratios of the Fund, as stated in the fee table of the prospectus dated May 1, 2020 are 0.96% and 1.40% for Class A and Class B shares, respectively, and may differ from the expense ratios disclosed in the Financial Highlights tables in this report.
Generally accepted accounting principles require adjustments to be made to the net assets of the Fund at period end for financial reporting purposes only, and as such, the total return based on the unadjusted net asset value per share may differ from the total return reported in the financial highlights.
Growth of an Assumed $10,000 Investment
| | |
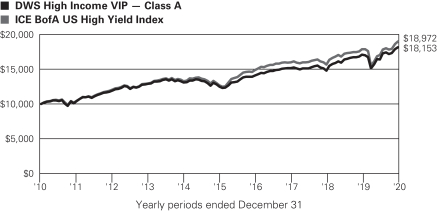
| | ICE BofA US High Yield Index tracks the performance of US dollar denominated below investment grade corporate debt publicly issued in the US domestic market. Index returns do not reflect any fees or expenses and it is not possible to invest directly into an index. |
| | | | | | | | | | |
| Comparative Results | | | | | | | | | | |
| | | | | |
| DWS High Income VIP | | | | 1-Year | | 3-Year | | 5-Year | | 10-Year |
| Class A | | Growth of $10,000 | | $10,624 | | $11,982 | | $14,538 | | $18,153 |
| | | Average annual total return | | 6.24% | | 6.21% | | 7.77% | | 6.14% |
| ICE BofA US High Yield Index | | Growth of $10,000 | | $10,607 | | $11,861 | | $14,978 | | $18,972 |
| | Average annual total return | | 6.07% | | 5.85% | | 8.42% | | 6.61% |
| | | | | |
| DWS High Income VIP | | | | 1-Year | | 3-Year | | 5-Year | | 10-Year |
| Class B | | Growth of $10,000 | | $10,577 | | $11,862 | | $14,329 | | $17,595 |
| | | Average annual total return | | 5.77% | | 5.86% | | 7.46% | | 5.81% |
| ICE BofA US High Yield Index | | Growth of $10,000 | | $10,607 | | $11,861 | | $14,978 | | $18,972 |
| | Average annual total return | | 6.07% | | 5.85% | | 8.42% | | 6.61% |
The growth of $10,000 is cumulative.
| | | | |
Deutsche DWS Variable Series II — DWS High Income VIP | | | | | 3 |
| | |
| Management Summary | | December 31, 2020 (Unaudited) |
The Fund returned 6.24% in 2020 (Class A shares, unadjusted for contract charges), outperforming the 6.07% return of its benchmark, the ICE BofA US High Yield Index.
The year began with elevated market volatility, as the emergence of COVID-19 led to a sharp sell-off in higher-risk assets. The index fell 13.13% in the first quarter of 2020, its worst showing in a calendar quarter since the last three months of 2008. The U.S. government responded to the pandemic by implementing unprecedented fiscal and monetary relief designed to avoid a prolonged recession. In addition, the U.S. Federal Reserve (Fed) announced it would intervene directly in the high-yield market by purchasing exchange-traded funds and individual securities. The ensuing rally lasted through year-end, reflecting growing investor confidence in the economic outlook for 2021.
Consistent with the high level of market volatility, yield spreads experienced a series of large moves throughout the period. The ICE BofA US High Yield Master II Option-Adjusted Spread — which measures the difference between yields on high-yield bonds and equivalent Treasuries — began 2020 at 402 basis points (4.02 percentage points) and fell to a low of 338 on January 20, 2020. Spreads surged in the subsequent sell-off, reaching a peak of 1087 basis points on March 23. As liquidity conditions improved and the markets regained confidence, the yield spread gradually declined to finish the year at 386. The spread movements occurred against a backdrop of sharply declining U.S. Treasury yields. The Fed’s decision to reduce short-term interest rates to near zero and restart of a number of quantitative easing measures caused yields to fall dramatically.
BB rated bonds were the strongest performers among three major credit tiers represented in the index, followed by B rated issues. The relative strength in BBs reflected investors’ preference for higher-rated bonds in the first-quarter downturn. On the other end of the spectrum, lower-rated CCC securities — while finishing 2020 in positive territory — lagged other ratings categories due to the extent of their sell-off in February and March.
Security selection, particularly in the cable and satellite industry, helped Fund performance. Industry allocation was an additional contributor, with an underweight in oil field services having the largest positive effect. In terms of credit quality positioning, an underweight in CCCs aided results. The Fund used derivatives to hedge its modest euro exposure back into U.S. dollars, which did not have a material effect on performance. While we use derivatives periodically for specific purposes, they are not a core aspect of our strategy.
We retain a constructive view on U.S. high yield, as we anticipate the U.S. economy will continue to recover from the impact of COVID-19 as the inoculation program accelerates and virus infection rates begin to trend lower. Nevertheless, there is still the potential for renewed market volatility. The recent emergence of new, more highly transmissible strain of the virus, as well as an uptick in infection rates in certain parts of the United States, has necessitated the imposition of expanded control measures. Ultimately, we believe that volatility could remain elevated until the vaccine successfully brings coronavirus transmission and infection rates under control.
We expect that the U.S. government and the Fed will continue to take steps to blunt the economic impact of the virus-containment measures. We anticipate the Fed will keep interest rates at historically low levels and pursue asset purchases to support market liquidity. In addition, the pandemic relief legislation passed in December 2020 is expected to pump approximately $900 million into the U.S. economy in the first part of 2021.
We are still finding ample opportunities to invest in securities with attractive total return potential relative to the underlying risks, even after the rally in the final nine months of the year. We continue to view fundamental credit analysis as critical, and we seek to identify companies with strong market positions, solid business fundamentals, and improving credit metrics.
Gary Russell, CFA, Managing Director
Thomas R. Bouchard, Director
Lonnie Fox, Director
Portfolio Managers
The views expressed reflect those of the portfolio management team only through the end of the period of the report as stated on the cover. The management team’s views are subject to change at any time based on market and other conditions and should not be construed as a recommendation. Past performance is no guarantee of future results. Current and future portfolio holdings are subject to risk.
| | | | | | |
| | 4 | | | | | | Deutsche DWS Variable Series II — DWS High Income VIP |
Terms to Know
ICE BofA US High Yield Index tracks the performance of U.S. dollar denominated below investment grade corporate debt publicly issued in the US domestic market.
Yield spread refers to differences between yields on differing debt instruments, calculated by deducting the yield of one instrument from another. The higher the yield spread, the greater the difference between the yields offered by each instrument.
The ICE BofA US High Yield Option—Adjusted Spread (OAS) calculates the spread between a computed OAS index of bonds that are below investment grade (those rated BB or below) and a spot Treasury curve.
Credit quality measures a bond issuer’s ability to repay interest and principal in a timely manner. Rating agencies assign letter designations, such as AAA, AA and so forth. The lower the rating, the higher the probability of default. Credit quality does not remove market risk and is subject to change.
Overweight means a fund holds a higher weighting in a given sector or individual security compared with its benchmark index; underweight means a fund holds a lower weighting.
Contribution and detraction incorporate both an investment’s total return and its weighting in the fund.
Derivatives are contracts whose values can be based on a variety of instruments, including indices, currencies or securities. They can be utilized for a variety of reasons, including for hedging purposes, for risk management, for non-hedging purposes to seek to enhance potential gains, as a substitute for direct investment in a particular asset class or to keep cash on hand to meet shareholder redemptions. Investing in derivatives entails special risks relating to liquidity, leverage and credit that may reduce returns and/or increase volatility.
| | | | |
Deutsche DWS Variable Series II — DWS High Income VIP | | | | | 5 |
| | |
| Portfolio Summary | | (Unaudited) |
| | | | | | | | |
| Asset Allocation (As a % of Investment Portfolio excluding Securities Lending Collateral) | | 12/31/20 | | | 12/31/19 | |
| Corporate Bonds | | | 98% | | | | 96% | |
| Loan Participations and Assignments | | | 1% | | | | 0% | |
| Cash Equivalents | | | 1% | | | | 4% | |
| Warrants | | | 0% | | | | 0% | |
| Common Stocks | | | 0% | | | | 0% | |
| Convertible Bonds | | | — | | | | 0% | |
| | | | 100% | | | | 100% | |
| | |
Sector Diversification (As a % of Investment Portfolio excluding Cash Equivalents and Securities
Lending Collateral) | | 12/31/20 | | | 12/31/19 | |
| Consumer Discretionary | | | 22% | | | | 14% | |
| Communication Services | | | 19% | | | | 24% | |
| Energy | | | 13% | | | | 13% | |
| Materials | | | 11% | | | | 12% | |
| Industrials | | | 10% | | | | 9% | |
| Health Care | | | 8% | | | | 9% | |
| Real Estate | | | 5% | | | | 3% | |
| Utilities | | | 4% | | | | 6% | |
| Consumer Staples | | | 4% | | | | 4% | |
| Information Technology | | | 2% | | | | 3% | |
| Financials | | | 2% | | | | 3% | |
| | | | 100% | | | | 100% | |
| | |
| Quality (As a % of Investment Portfolio excluding Cash Equivalent and Securities Lending Collateral) | | 12/31/20 | | | 12/31/19 | |
| BBB | | | 4% | | | | 5% | |
| BB | | | 61% | | | | 61% | |
| B | | | 30% | | | | 32% | |
| CCC | | | 5% | | | | 2% | |
| Not Rated | | | 0% | | | | 0% | |
| | | | 100% | | | | 100% | |
The quality ratings represent the higher of Moody’s Investors Service, Inc. (“Moody’s”), Fitch Ratings, Inc. (“Fitch”) or S&P Global Ratings (“S&P”) credit ratings. The ratings of Moody’s, Fitch and S&P represent their opinions as to the quality of the securities they rate. Credit quality measures a bond issuer’s ability to repay interest and principal in a timely manner. Ratings are relative and subjective and are not absolute standards of quality. Credit quality does not remove market risk and is subject to change.
Portfolio holdings and characteristics are subject to change.
For more complete details about the Fund’s investment portfolio, see page 7.
Following the Fund’s fiscal first and third quarter-end, a complete portfolio holdings listing is posted on dws.com, and is available free of charge by contacting your financial intermediary, or if you are a direct investor, by calling (800) 728-3337. In addition, the portfolio holdings listing is filed with the SEC on the Fund’s Form N-PORT and will be available on the SEC’s Web site at sec.gov. Additional portfolio holdings for the Fund are also posted on dws.com from time to time. Please see the Fund’s current prospectus for more information.
| | | | | | |
| | 6 | | | | | | Deutsche DWS Variable Series II — DWS High Income VIP |
| | |
| Investment Portfolio | | as of December 31, 2020 |
| | | | | | | | |
| | | Principal
Amount ($)(a) | | | Value ($) | |
| Corporate Bonds 96.9% | |
| Communication Services 18.3% | |
| | |
Altice France Holding SA: | | | | | | | | |
| | |
144A, 6.0%, 2/15/2028 | | | 200,000 | | | | 202,500 | |
| | |
144A, 10.5%, 5/15/2027 | | | 200,000 | | | | 224,500 | |
| | |
Altice France SA: | | | | | | | | |
| | |
144A, 5.5%, 1/15/2028 | | | 200,000 | | | | 209,102 | |
| | |
144A, 7.375%, 5/1/2026 | | | 710,000 | | | | 747,275 | |
| | |
144A, 8.125%, 2/1/2027 | | | 200,000 | | | | 220,502 | |
| | |
Arches Buyer, Inc.: | | | | | | | | |
| | |
144A, 4.25%, 6/1/2028 | | | 30,000 | | | | 30,381 | |
| | |
144A, 6.125%, 12/1/2028 | | | 15,000 | | | | 15,491 | |
| | |
Avaya, Inc., 144A, 6.125%, 9/15/2028 | | | 130,000 | | | | 138,874 | |
| | |
Cable One, Inc., 144A, 4.0%, 11/15/2030 | | | 28,000 | | | | 29,085 | |
| | |
CCO Holdings LLC: | | | | | | | | |
| | |
144A, 4.75%, 3/1/2030 | | | 140,000 | | | | 151,060 | |
| | |
144A, 5.0%, 2/1/2028 | | | 150,000 | | | | 158,625 | |
| | |
144A, 5.125%, 5/1/2027 | | | 125,000 | | | | 132,649 | |
| | |
CenturyLink, Inc.: | | | | | | | | |
| | |
5.625%, 4/1/2025 | | | 50,000 | | | | 53,938 | |
| | |
Series W, 6.75%, 12/1/2023 | | | 45,000 | | | | 50,119 | |
|
Clear Channel Worldwide Holdings, Inc.: | |
| | |
144A, 5.125%, 8/15/2027 | | | 320,000 | | | | 323,200 | |
| | |
9.25%, 2/15/2024 | | | 67,000 | | | | 67,838 | |
| | |
CommScope Technologies LLC, 144A, 6.0%, 6/15/2025 | | | 93,000 | | | | 95,092 | |
| | |
CommScope, Inc.: | | | | | | | | |
| | |
144A, 5.5%, 3/1/2024 | | | 130,000 | | | | 134,030 | |
| | |
144A, 7.125%, 7/1/2028 | | | 75,000 | | | | 79,875 | |
| | |
144A, 8.25%, 3/1/2027 | | | 130,000 | | | | 138,775 | |
| | |
Consolidated Communications, Inc., 144A, 6.5%, 10/1/2028 | | | 155,000 | | | | 165,850 | |
| | |
CSC Holdings LLC: | | | | | | | | |
| | |
144A, 4.125%, 12/1/2030 | | | 200,000 | | | | 209,120 | |
| | |
144A, 4.625%, 12/1/2030 | | | 300,000 | | | | 313,125 | |
| | |
144A, 5.5%, 4/15/2027 | | | 345,000 | | | | 365,700 | |
| | |
144A, 5.75%, 1/15/2030 | | | 200,000 | | | | 219,250 | |
| | |
144A, 6.5%, 2/1/2029 | | | 200,000 | | | | 225,810 | |
| | |
Diamond Sports Group LLC, 144A, 5.375%, 8/15/2026 | | | 45,000 | | | | 36,563 | |
| | |
DISH DBS Corp.: | | | | | | | | |
| | |
5.875%, 11/15/2024 | | | 96,000 | | | | 100,659 | |
| | |
7.375%, 7/1/2028 | | | 50,000 | | | | 53,250 | |
| | |
7.75%, 7/1/2026 (b) | | | 90,000 | | | | 100,801 | |
| | |
Frontier Communications Corp.: | | | | | | | | |
| | |
144A, 5.0%, 5/1/2028 | | | 165,000 | | | | 172,012 | |
| | |
144A, 5.875%, 10/15/2027 | | | 75,000 | | | | 81,094 | |
| | |
144A, 6.75%, 5/1/2029 | | | 90,000 | | | | 96,300 | |
| | |
Gray Television, Inc., 144A, 4.75%, 10/15/2030 | | | 55,000 | | | | 56,031 | |
| | |
Lamar Media Corp., 4.875%, 1/15/2029 | | | 80,000 | | | | 85,000 | |
| | |
LCPR Senior Secured Financing DAC, 144A, 6.75%, 10/15/2027 | | | 210,000 | | | | 226,012 | |
| | |
Netflix, Inc.: | | | | | | | | |
| | |
4.625%, 5/15/2029 | | | EUR 230,000 | | | | 339,493 | |
| | |
5.875%, 11/15/2028 | | | 71,000 | | | | 85,111 | |
| | |
Outfront Media Capital LLC, 144A, 5.0%, 8/15/2027 | | | 140,000 | | | | 142,450 | |
| | | | | | | | |
| | | Principal
Amount ($)(a) | | | Value ($) | |
| | |
QualityTech LP, 144A, 3.875%, 10/1/2028 | | | 140,000 | | | | 142,800 | |
| | |
Radiate Holdco LLC: | | | | | | | | |
| | |
144A, 4.5%, 9/15/2026 | | | 55,000 | | | | 56,719 | |
| | |
144A, 6.5%, 9/15/2028 | | | 210,000 | | | | 221,287 | |
| | |
Sable International Finance Ltd., 144A, 5.75%, 9/7/2027 | | | 200,000 | | | | 212,750 | |
| | |
Scripps Escrow II, Inc.: | | | | | | | | |
| | |
144A, 3.875%, 1/15/2029 | | | 25,000 | | | | 25,982 | |
| | |
144A, 5.375%, 1/15/2031 | | | 30,000 | | | | 31,275 | |
| | |
Sprint Capital Corp., 6.875%, 11/15/2028 | | | 395,000 | | | | 520,800 | |
| | |
Telecom Italia Capital SA, 6.375%, 11/15/2033 | | | 155,000 | | | | 190,650 | |
| | |
Uber Technologies, Inc.: | | | | | | | | |
| | |
144A, 6.25%, 1/15/2028 | | | 25,000 | | | | 27,188 | |
| | |
144A, 7.5%, 5/15/2025 | | | 120,000 | | | | 129,626 | |
| | |
144A, 7.5%, 9/15/2027 | | | 50,000 | | | | 55,000 | |
| | |
ViaSat, Inc.: | | | | | | | | |
| | |
144A, 5.625%, 9/15/2025 | | | 135,000 | | | | 138,078 | |
| | |
144A, 5.625%, 4/15/2027 | | | 120,000 | | | | 126,000 | |
| | |
144A, 6.5%, 7/15/2028 | | | 105,000 | | | | 113,632 | |
| |
Virgin Media Secured Finance PLC: | | | | | |
| | |
144A, 5.5%, 8/15/2026 | | | 215,000 | | | | 223,331 | |
| | |
144A, 5.5%, 5/15/2029 | | | 345,000 | | | | 373,894 | |
| | |
Vodafone Group PLC, 7.0%, 4/4/2079 | | | 185,000 | | | | 230,146 | |
| | |
Windstream Escrow LLC, 144A, 7.75%, 8/15/2028 | | | 50,000 | | | | 50,350 | |
| | |
Ziggo Bond Co. BV, 144A, 3.375%, 2/28/2030 | | | EUR 370,000 | | | | 454,158 | |
| | |
Ziggo BV, 144A, 4.875%, 1/15/2030 | | | 290,000 | | | | 304,862 | |
| | | | | | | | |
| | | | | | | 9,905,070 | |
| |
| Consumer Discretionary 21.3% | | | | | |
| | |
1011778 BC Unlimited Liability Co., 144A, 3.5%, 2/15/2029 | | | 55,000 | | | | 54,931 | |
| | |
Adient U.S. LLC, 144A, 9.0%, 4/15/2025 | | | 30,000 | | | | 33,450 | |
| | |
Allison Transmission, Inc., 144A, 3.75%, 1/30/2031 | | | 105,000 | | | | 107,428 | |
| | |
Asbury Automotive Group, Inc.: | | | | | | | | |
| | |
4.5%, 3/1/2028 | | | 25,000 | | | | 26,063 | |
| | |
4.75%, 3/1/2030 | | | 25,000 | | | | 26,813 | |
| | |
Beacon Roofing Supply, Inc., 144A, 4.875%, 11/1/2025 | | | 100,000 | | | | 102,375 | |
| | |
Beazer Homes U.S.A., Inc., 5.875%, 10/15/2027 | | | 35,000 | | | | 36,838 | |
| | |
Boyd Gaming Corp.: | | | | | | | | |
| | |
4.75%, 12/1/2027 | | | 130,000 | | | | 135,037 | |
| | |
6.375%, 4/1/2026 | | | 100,000 | | | | 103,881 | |
| | |
144A, 8.625%, 6/1/2025 | | | 120,000 | | | | 133,463 | |
| | |
Caesars Entertainment, Inc.: | | | | | | | | |
| | |
144A, 6.25%, 7/1/2025 | | | 270,000 | | | | 287,550 | |
| | |
144A, 8.125%, 7/1/2027 | | | 310,000 | | | | 343,177 | |
| | |
Caesars Resort Collection LLC, 144A, 5.75%, 7/1/2025 | | | 20,000 | | | | 21,192 | |
| | |
Carnival Corp.: | | | | | | | | |
| | |
144A, 7.625%, 3/1/2026 | | | 98,000 | | | | 106,770 | |
| | |
144A, 9.875%, 8/1/2027 | | | 130,000 | | | | 149,500 | |
| | |
144A, 10.5%, 2/1/2026 | | | 80,000 | | | | 93,200 | |
| | |
144A, 11.5%, 4/1/2023 | | | 145,000 | | | | 167,724 | |
The accompanying notes are an integral part of the financial statements.
| | | | |
Deutsche DWS Variable Series II — DWS High Income VIP | | | | | 7 |
| | | | | | | | |
| | | Principal
Amount ($)(a) | | | Value ($) | |
| | |
Carvana Co., 144A, 5.625%, 10/1/2025 | | | 150,000 | | | | 153,937 | |
| | |
Clarios Global LP: | | | | | | | | |
| | |
REG S, 4.375%, 5/15/2026 | | | EUR 200,000 | | | | 253,101 | |
| | |
144A, 4.375%, 5/15/2026 | | | EUR 100,000 | | | | 126,551 | |
| | |
144A, 6.25%, 5/15/2026 | | | 55,000 | | | | 58,988 | |
| | |
144A, 6.75%, 5/15/2025 | | | 80,000 | | | | 86,200 | |
| | |
144A, 8.5%, 5/15/2027 | | | 55,000 | | | | 59,753 | |
| | |
Dana Financing Luxembourg Sarl, 144A, 6.5%, 6/1/2026 | | | 110,000 | | | | 115,087 | |
| | |
Dana, Inc.: | | | | | | | | |
| | |
5.375%, 11/15/2027 | | | 55,000 | | | | 58,300 | |
| | |
5.625%, 6/15/2028 | | | 25,000 | | | | 26,918 | |
| | |
Empire Communities Corp., 144A, 7.0%, 12/15/2025 | | | 55,000 | | | | 57,962 | |
| | |
Ford Motor Co.: | | | | | | | | |
| | |
5.291%, 12/8/2046 | | | 60,000 | | | | 62,700 | |
| | |
7.45%, 7/16/2031 | | | 85,000 | | | | 109,012 | |
| | |
8.5%, 4/21/2023 | | | 90,000 | | | | 101,296 | |
| | |
9.0%, 4/22/2025 | | | 285,000 | | | | 349,413 | |
| | |
9.625%, 4/22/2030 | | | 170,000 | | | | 239,912 | |
| | |
Ford Motor Credit Co. LLC: | | | | | | | | |
| | |
3.219%, 1/9/2022 | | | 200,000 | | | | 201,855 | |
| | |
3.375%, 11/13/2025 | | | 209,000 | | | | 214,718 | |
| | |
4.0%, 11/13/2030 | | | 200,000 | | | | 210,000 | |
| | |
4.14%, 2/15/2023 | | | 200,000 | | | | 206,000 | |
| | |
5.113%, 5/3/2029 | | | 200,000 | | | | 222,740 | |
| | |
5.125%, 6/16/2025 | | | 230,000 | | | | 250,079 | |
| | |
Group 1 Automotive, Inc., 144A, 4.0%, 8/15/2028 | | | 100,000 | | | | 103,078 | |
| |
Hilton Domestic Operating Co., Inc.: | | | | | |
| | |
144A, 3.75%, 5/1/2029 | | | 240,000 | | | | 250,246 | |
| | |
144A, 4.0%, 5/1/2031 | | | 30,000 | | | | 31,653 | |
| | |
4.875%, 1/15/2030 | | | 139,000 | | | | 151,857 | |
| | |
144A, 5.375%, 5/1/2025 | | | 30,000 | | | | 31,875 | |
| | |
IAA, Inc., 144A, 5.5%, 6/15/2027 | | | 75,000 | | | | 79,500 | |
| | |
Jaguar Land Rover Automotive PLC, 144A, 5.875%, 1/15/2028 | | | 200,000 | | | | 201,520 | |
| | |
Kronos Acquisition Holdings, Inc.: | | | | | | | | |
| | |
144A, 5.0%, 12/31/2026 | | | 20,000 | | | | 20,864 | |
| | |
144A, 7.0%, 12/31/2027 | | | 45,000 | | | | 47,116 | |
| | |
L Brands, Inc.: | | | | | | | | |
| | |
144A, 6.625%, 10/1/2030 | | | 70,000 | | | | 77,875 | |
| | |
144A, 6.875%, 7/1/2025 | | | 110,000 | | | | 119,436 | |
| | |
6.875%, 11/1/2035 | | | 80,000 | | | | 89,800 | |
| | |
144A, 9.375%, 7/1/2025 | | | 60,000 | | | | 73,800 | |
| | |
Lithia Motors, Inc., 144A, 4.625%, 12/15/2027 | | | 140,000 | | | | 147,700 | |
| | |
M/I Homes, Inc., 4.95%, 2/1/2028 | | | 130,000 | | | | 137,611 | |
| | |
Marriott Ownership Resorts, Inc., 144A, 6.125%, 9/15/2025 | | | 150,000 | | | | 159,750 | |
| | |
Mattel, Inc., 144A, 6.75%, 12/31/2025 | | | 145,000 | | | | 153,043 | |
| | |
Meritor, Inc.: | | | | | | | | |
| | |
144A, 4.5%, 12/15/2028 | | | 15,000 | | | | 15,375 | |
| | |
6.25%, 2/15/2024 | | | 29,000 | | | | 29,595 | |
| | |
144A, 6.25%, 6/1/2025 | | | 40,000 | | | | 43,200 | |
| | |
NCL Corp Ltd., 144A, 5.875%, 3/15/2026 | | | 90,000 | | | | 94,664 | |
| | |
NCL Corp., Ltd., 144A, 3.625%, 12/15/2024 | | | 100,000 | | | | 95,000 | |
| | |
Newell Brands, Inc., 4.7%, 4/1/2026 | | | 440,000 | | | | 484,660 | |
| | |
Penske Automotive Group, Inc., 3.5%, 9/1/2025 | | | 80,000 | | | | 81,300 | |
| | | | | | | | |
| | | Principal
Amount ($)(a) | | | Value ($) | |
| | |
PetSmart, Inc., 144A, 7.125%, 3/15/2023 | | | 103,000 | | | | 103,000 | |
| | |
Picasso Finance Sub, Inc., 144A, 6.125%, 6/15/2025 | | | 120,000 | | | | 128,400 | |
| | |
Prestige Brands, Inc., 144A, 5.125%, 1/15/2028 | | | 60,000 | | | | 63,975 | |
| | |
Royal Caribbean Cruises Ltd.: | | | | | | | | |
| | |
144A, 9.125%, 6/15/2023 | | | 140,000 | | | | 151,900 | |
| | |
144A, 10.875%, 6/1/2023 | | | 110,000 | | | | 125,167 | |
| | |
144A, 11.5%, 6/1/2025 | | | 50,000 | | | | 58,453 | |
| |
Scientific Games International, Inc.: | | | | | |
| | |
144A, 7.0%, 5/15/2028 | | | 175,000 | | | | 188,162 | |
| | |
144A, 7.25%, 11/15/2029 | | | 125,000 | | | | 137,187 | |
| | |
SeaWorld Parks & Entertainment, Inc., 144A, 9.5%, 8/1/2025 | | | 100,000 | | | | 108,563 | |
| | |
Sonic Automotive, Inc., 6.125%, 3/15/2027 | | | 55,000 | | | | 57,956 | |
| | |
Spectrum Brands, Inc., 144A, 5.0%, 10/1/2029 | | | 30,000 | | | | 32,217 | |
| | |
Staples, Inc., 144A, 7.5%, 4/15/2026 | | | 210,000 | | | | 219,297 | |
| | |
Stars Group Holdings BV, 144A, 7.0%, 7/15/2026 | | | 105,000 | | | | 110,512 | |
| | |
Suburban Propane Partners LP, 5.75%, 3/1/2025 | | | 105,000 | | | | 107,100 | |
| |
Taylor Morrison Communities, Inc.: | | | | | |
| | |
144A, 5.125%, 8/1/2030 | | | 145,000 | | | | 162,400 | |
| | |
144A, 5.75%, 1/15/2028 | | | 170,000 | | | | 192,525 | |
| | |
Tenneco, Inc., 144A, 7.875%, 1/15/2029 | | | 13,000 | | | | 14,596 | |
| | |
TRI Pointe Group, Inc.: | | | | | | | | |
| | |
5.25%, 6/1/2027 | | | 55,000 | | | | 59,813 | |
| | |
5.7%, 6/15/2028 | | | 80,000 | | | | 90,320 | |
| | |
United Rentals North America, Inc., 5.25%, 1/15/2030 | | | 80,000 | | | | 88,800 | |
| | |
Univar Solutions U.S.A., Inc., 144A, 5.125%, 12/1/2027 | | | 160,000 | | | | 169,000 | |
| | |
Vail Resorts, Inc., 144A, 6.25%, 5/15/2025 | | | 100,000 | | | | 106,750 | |
| | |
Viking Cruises Ltd., 144A, 5.875%, 9/15/2027 | |
| 205,000
|
| | | 200,486 | |
| | |
White Cap Buyer LLC, 144A, 6.875%, 10/15/2028 | | | 60,000 | | | | 63,975 | |
| | |
Williams Scotsman International, Inc., 144A, 4.625%, 8/15/2028 | | | 60,000 | | | | 62,100 | |
| | |
Wolverine World Wide, Inc., 144A, 6.375%, 5/15/2025 | | | 150,000 | | | | 159,750 | |
| | |
Wyndham Destinations, Inc.: | | | | | | | | |
| | |
5.65%, 4/1/2024 | | | 105,000 | | | | 113,400 | |
| | |
6.6%, 10/1/2025 | | | 59,000 | | | | 66,670 | |
| | |
144A, 6.625%, 7/31/2026 | | | 20,000 | | | | 22,900 | |
| | |
Wyndham Hotels & Resorts, Inc., 144A, 4.375%, 8/15/2028 | | | 50,000 | | | | 51,953 | |
| | |
Wynn Macau Ltd.: | | | | | | | | |
| | |
144A, 5.5%, 1/15/2026 | | | 200,000 | | | | 208,000 | |
| | |
144A, 5.625%, 8/26/2028 | | | 200,000 | | | | 210,500 | |
| | |
Wynn Resorts Finance LLC, 144A, 5.125%, 10/1/2029 | | | 70,000 | | | | 73,325 | |
| | | | | | | | |
| | | | | | | 11,523,584 | |
| | |
| Consumer Staples 4.0% | | | | | | | | |
| | |
Albertsons Companies, Inc.: | | | | | | | | |
| | |
144A, 3.5%, 3/15/2029 | | | 35,000 | | | | 35,415 | |
| | |
144A, 4.625%, 1/15/2027 | | | 200,000 | | | | 212,750 | |
| | |
144A, 5.875%, 2/15/2028 | | | 60,000 | | | | 65,291 | |
The accompanying notes are an integral part of the financial statements.
| | | | | | |
| | 8 | | | | | | Deutsche DWS Variable Series II — DWS High Income VIP |
| | | | | | | | |
| | | Principal
Amount ($)(a) | | | Value ($) | |
| | |
Chobani LLC, 144A, 4.625%, 11/15/2028 | | | 30,000 | | | | 30,450 | |
| | |
Edgewell Personal Care Co., 144A, 5.5%, 6/1/2028 | | | 70,000 | | | | 75,229 | |
| | |
JBS U.S.A. LUX SA: | | | | | | | | |
| | |
144A, 5.5%, 1/15/2030 | | | 60,000 | | | | 68,926 | |
| | |
144A, 5.75%, 6/15/2025 | | | 210,000 | | | | 216,825 | |
| | |
144A, 6.5%, 4/15/2029 | | | 132,000 | | | | 153,661 | |
| | |
144A, 6.75%, 2/15/2028 | | | 235,000 | | | | 264,022 | |
| | |
Kraft Heinz Foods Co.: | | | | | | | | |
| | |
144A, 4.25%, 3/1/2031 | | | 260,000 | | | | 289,915 | |
| | |
4.625%, 1/30/2029 | | | 70,000 | | | | 80,097 | |
| | |
Pilgrim’s Pride Corp.: | | | | | | | | |
| | |
144A, 5.75%, 3/15/2025 | | | 50,000 | | | | 51,330 | |
| | |
144A, 5.875%, 9/30/2027 | | | 230,000 | | | | 249,460 | |
| | |
Post Holdings, Inc.: | | | | | | | | |
| | |
144A, 5.0%, 8/15/2026 | | | 165,000 | | | | 170,363 | |
| | |
144A, 5.5%, 12/15/2029 | | | 110,000 | | | | 120,038 | |
| | |
TreeHouse Foods, Inc., 4.0%, 9/1/2028 | | | 60,000 | | | | 62,063 | |
| | | | | | | | |
| | | | | | | 2,145,835 | |
| | |
| Energy 12.5% | | | | | | | | |
| | |
Antero Midstream Partners LP: | | | | | | | | |
| | |
5.375%, 9/15/2024 | | | 95,000 | | | | 92,625 | |
| | |
144A, 5.75%, 3/1/2027 | | | 80,000 | | | | 78,600 | |
| | |
144A, 5.75%, 1/15/2028 | | | 90,000 | | | | 86,418 | |
| | |
Antero Resources Corp., 144A, 8.375%, 7/15/2026 (c) | | | 65,000 | | | | 66,345 | |
| | |
Apache Corp.: | | | | | | | | |
| | |
4.625%, 11/15/2025 | | | 37,000 | | | | 39,110 | |
| | |
4.875%, 11/15/2027 | | | 55,000 | | | | 58,300 | |
| | |
5.1%, 9/1/2040 | | | 57,000 | | | | 60,776 | |
| | |
Archrock Partners LP: | | | | | | | | |
| | |
144A, 6.25%, 4/1/2028 | | | 220,000 | | | | 229,011 | |
| | |
144A, 6.875%, 4/1/2027 | | | 110,000 | | | | 118,387 | |
| | |
Ascent Resources Utica Holdings LLC, 144A, 8.25%, 12/31/2028 | | | 15,000 | | | | 14,963 | |
| | |
Blue Racer Midstream LLC, 144A, 7.625%, 12/15/2025 | | | 40,000 | | | | 42,600 | |
| | |
Buckeye Partners LP, 144A, 4.5%, 3/1/2028 | | | 80,000 | | | | 82,400 | |
| | |
Cheniere Energy Partners LP: | | | | | | | | |
| | |
4.5%, 10/1/2029 | | | 272,000 | | | | 287,716 | |
| | |
5.625%, 10/1/2026 | | | 80,000 | | | | 83,200 | |
| | |
Cheniere Energy, Inc., 144A, 4.625%, 10/15/2028 | | | 25,000 | | | | 26,250 | |
| | |
CNX Resources Corp.: | | | | | | | | |
| | |
144A, 6.0%, 1/15/2029 | | | 135,000 | | | | 138,305 | |
| | |
144A, 7.25%, 3/14/2027 | | | 100,000 | | | | 107,000 | |
| | |
Comstock Resources, Inc., 9.75%, 8/15/2026 | | | 119,000 | | | | 128,222 | |
| | |
Continental Resources, Inc., 144A, 5.75%, 1/15/2031 | | | 65,000 | | | | 72,149 | |
| | |
DCP Midstream Operating LP: | | | | | | | | |
| | |
5.125%, 5/15/2029 | | | 80,000 | | | | 88,730 | |
| | |
5.375%, 7/15/2025 | | | 367,000 | | | | 403,267 | |
| | |
5.625%, 7/15/2027 | | | 50,000 | | | | 55,500 | |
| | |
Endeavor Energy Resources LP: | | | | | | | | |
| | |
144A, 5.5%, 1/30/2026 | | | 155,000 | | | | 159,053 | |
| | |
144A, 5.75%, 1/30/2028 | | | 35,000 | | | | 37,755 | |
| | |
144A, 6.625%, 7/15/2025 | | | 35,000 | | | | 37,450 | |
| | |
EQM Midstream Partners LP: | | | | | | | | |
| | |
5.5%, 7/15/2028 | | | 55,000 | | | | 60,107 | |
| | |
144A, 6.0%, 7/1/2025 | | | 140,000 | | | | 153,300 | |
| | |
144A, 6.5%, 7/1/2027 | | | 80,000 | | | | 90,083 | |
| | | | | | | | |
| | | Principal
Amount ($)(a) | | | Value ($) | |
| | |
EQT Corp.: | | | | | | | | |
| | |
5.0%, 1/15/2029 | | | 85,000 | | | | 89,617 | |
| | |
7.875%, 2/1/2025 | | | 105,000 | | | | 119,569 | |
| | |
8.75%, 2/1/2030 | | | 135,000 | | | | 165,375 | |
| | |
Genesis Energy LP, 6.25%, 5/15/2026 | | | 55,000 | | | | 51,660 | |
| | |
Harvest Midstream I LP, 144A, 7.5%, 9/1/2028 | | | 130,000 | | | | 138,287 | |
| | |
Hilcorp Energy I LP: | | | | | | | | |
| | |
144A, 5.0%, 12/1/2024 | | | 155,000 | | | | 154,290 | |
| | |
144A, 5.75%, 10/1/2025 | | | 60,000 | | | | 60,675 | |
| | |
144A, 6.25%, 11/1/2028 | | | 35,000 | | | | 35,744 | |
| | |
Murphy Oil U.S.A., Inc.: | | | | | | | | |
| | |
4.75%, 9/15/2029 | | | 115,000 | | | | 122,331 | |
| | |
5.625%, 5/1/2027 | | | 65,000 | | | | 68,737 | |
| | |
NuStar Logistics LP: | | | | | | | | |
| | |
5.75%, 10/1/2025 | | | 80,000 | | | | 85,200 | |
| | |
6.375%, 10/1/2030 | | | 55,000 | | | | 62,304 | |
| | |
Occidental Petroleum Corp.: | | | | | | | | |
| | |
2.7%, 2/15/2023 | | | 126,000 | | | | 125,880 | |
| | |
5.5%, 12/1/2025 | | | 135,000 | | | | 140,752 | |
| | |
5.55%, 3/15/2026 | | | 105,000 | | | | 109,614 | |
| | |
6.125%, 1/1/2031 | | | 255,000 | | | | 272,901 | |
| | |
8.0%, 7/15/2025 (b) | | | 175,000 | | | | 199,325 | |
| | |
8.5%, 7/15/2027 | | | 100,000 | | | | 115,405 | |
| | |
Parkland Corp., 144A, 5.875%, 7/15/2027 | | | 80,000 | | | | 86,498 | |
| | |
Range Resources Corp., 9.25%, 2/1/2026 | | | 50,000 | | | | 52,250 | |
| | |
Rattler Midstream LP, 144A, 5.625%, 7/15/2025 | | | 75,000 | | | | 79,219 | |
| | |
Southwestern Energy Co.: | | | | | | | | |
| | |
6.45%, 1/23/2025 | | | 140,000 | | | | 145,600 | |
| | |
7.75%, 10/1/2027 | | | 100,000 | | | | 107,970 | |
| | |
8.375%, 9/15/2028 | | | 50,000 | | | | 54,250 | |
| | |
Sunoco LP: | | | | | | | | |
| | |
144A, 4.5%, 5/15/2029 | | | 56,000 | | | | 58,240 | |
| | |
5.875%, 3/15/2028 | | | 35,000 | | | | 37,800 | |
| | |
6.0%, 4/15/2027 | | | 52,000 | | | | 55,277 | |
| | |
Tallgrass Energy Partners LP: | | | | | | | | |
| | |
144A, 6.0%, 12/31/2030 | | | 30,000 | | | | 30,872 | |
| | |
144A, 7.5%, 10/1/2025 | | | 15,000 | | | | 16,194 | |
| | |
Targa Resources Partners LP: | | | | | | | | |
| | |
144A, 4.875%, 2/1/2031 | | | 30,000 | | | | 32,688 | |
| | |
5.0%, 1/15/2028 | | | 215,000 | | | | 226,945 | |
| | |
5.5%, 3/1/2030 | | | 90,000 | | | | 97,713 | |
| | |
TerraForm Power Operating LLC: | | | | | | | | |
| | |
144A, 4.75%, 1/15/2030 | | | 65,000 | | | | 69,550 | |
| | |
144A, 5.0%, 1/31/2028 | | | 100,000 | | | | 112,365 | |
| | |
USA Compression Partners LP: | | | | | | | | |
| | |
6.875%, 4/1/2026 | | | 142,000 | | | | 148,390 | |
| | |
6.875%, 9/1/2027 | | | 100,000 | | | | 106,758 | |
| | |
Western Midstream Operating LP: | | | | | | | | |
| | |
4.1%, 2/1/2025 | | | 80,000 | | | | 82,446 | |
| | |
5.05%, 2/1/2030 | | | 155,000 | | | | 173,571 | |
| | | | | | | | |
| | | | | | | 6,789,884 | |
| | |
| Financials 1.7% | | | | | | | | |
| | |
AG Issuer LLC, 144A, 6.25%, 3/1/2028 | | | 95,000 | | | | 96,069 | |
| | |
AmWINS Group, Inc., 144A, 7.75%, 7/1/2026 | | | 70,000 | | | | 75,173 | |
| | |
Cardtronics, Inc., 144A, 5.5%, 5/1/2025 (b) | | | 95,000 | | | | 98,206 | |
The accompanying notes are an integral part of the financial statements.
| | | | |
Deutsche DWS Variable Series II — DWS High Income VIP | | | | | 9 |
| | | | | | | | |
| | | Principal
Amount ($)(a) | | | Value ($) | |
| | |
Intesa Sanpaolo SpA, 144A, 5.71%, 1/15/2026 | | | 200,000 | | | | 228,918 | |
| | |
LD Holdings Group LLC, 144A, 6.5%, 11/1/2025 | | | 61,000 | | | | 64,202 | |
| | |
LPL Holdings, Inc., 144A, 4.625%, 11/15/2027 | | | 30,000 | | | | 31,050 | |
| | |
OneMain Finance Corp.: | | | | | | | | |
| | |
5.375%, 11/15/2029 | | | 80,000 | | | | 90,000 | |
| | |
8.875%, 6/1/2025 | | | 50,000 | | | | 56,563 | |
| | |
Quicken Loans LLC, 144A, 3.625%, 3/1/2029 | | | 120,000 | | | | 122,400 | |
| | |
Sabre GLBL, Inc., 144A, 7.375%, 9/1/2025 | | | 30,000 | | | | 32,550 | |
| | |
Shift4 Payments LLC, 144A, 4.625%, 11/1/2026 | | | 10,000 | | | | 10,400 | |
| | | | | | | | |
| | | | | | | 905,531 | |
| | |
| Health Care 7.8% | | | | | | | | |
| | |
Acadia Healthcare Co., Inc., 144A, 5.0%, 4/15/2029 | | | 50,000 | | | | 53,375 | |
| | |
AdaptHealth LLC: | | | | | | | | |
| | |
144A, 4.625%, 8/1/2029 (c) | | | 55,000 | | | | 56,513 | |
| | |
144A, 6.125%, 8/1/2028 | | | 80,000 | | | | 85,900 | |
| | |
Avantor Funding, Inc., 144A, 4.625%, 7/15/2028 | | | 25,000 | | | | 26,438 | |
| | |
Bausch Health Americas, Inc.: | | | | | | | | |
| | |
144A, 8.5%, 1/31/2027 | | | 195,000 | | | | 216,873 | |
| | |
144A, 9.25%, 4/1/2026 | | | 135,000 | | | | 150,525 | |
| | |
Bausch Health Companies, Inc.: | | | | | | | | |
| | |
144A, 5.25%, 2/15/2031 | | | 50,000 | | | | 52,236 | |
| | |
144A, 6.125%, 4/15/2025 | | | 150,000 | | | | 154,599 | |
| | |
Catalent Pharma Solutions, Inc., 144A, 5.0%, 7/15/2027 | | | 125,000 | | | | 132,017 | |
| | |
Centene Corp., 4.625%, 12/15/2029 | | | 475,000 | | | | 527,350 | |
| |
CHS/Community Health Systems, Inc.: | | | | | |
| | |
144A, 5.625%, 3/15/2027 | | | 60,000 | | | | 64,515 | |
| | |
144A, 6.0%, 1/15/2029 | | | 65,000 | | | | 70,217 | |
| | |
Community Health Systems, Inc., 144A, 8.125%, 6/30/2024 (b) | | | 180,000 | | | | 186,300 | |
| | |
Emergent BioSolutions, Inc., 144A, 3.875%, 8/15/2028 | | | 35,000 | | | | 36,243 | |
| | |
Encompass Health Corp.: | | | | | | | | |
| | |
4.5%, 2/1/2028 | | | 45,000 | | | | 47,025 | |
| | |
4.75%, 2/1/2030 | | | 37,000 | | | | 39,636 | |
| | |
HCA, Inc.: | | | | | | | | |
| | |
5.375%, 9/1/2026 | | | 140,000 | | | | 160,916 | |
| | |
5.625%, 9/1/2028 | | | 150,000 | | | | 177,000 | |
| | |
5.875%, 2/15/2026 | | | 90,000 | | | | 103,500 | |
| | |
5.875%, 2/1/2029 | | | 90,000 | | | | 108,313 | |
| | |
Hill-Rom Holdings, Inc., 144A, 4.375%, 9/15/2027 | | | 85,000 | | | | 89,798 | |
| | |
IQVIA, Inc., 144A, 5.0%, 5/15/2027 | | | 220,000 | | | | 233,865 | |
| | |
Legacy LifePoint Health LLC, 144A, 6.75%, 4/15/2025 | | | 135,000 | | | | 144,964 | |
| | |
LifePoint Health, Inc., 144A, 5.375%, 1/15/2029 | | | 150,000 | | | | 149,677 | |
| | |
Molina Healthcare, Inc., 144A, 4.375%, 6/15/2028 | | | 100,000 | | | | 105,250 | |
| | |
Prime Healthcare Services, Inc., 144A, 7.25%, 11/1/2025 | | | 50,000 | | | | 53,125 | |
| | |
RegionalCare Hospital Partners Holdings, Inc., 144A, 9.75%, 12/1/2026 | | | 60,000 | | | | 66,000 | |
| | | | | | | | |
| | | Principal
Amount ($)(a) | | | Value ($) | |
| | |
RP Escrow Issuer LLC, 144A, 5.25%, 12/15/2025 | | | 45,000 | | | | 47,028 | |
| | |
Select Medical Corp., 144A, 6.25%, 8/15/2026 | | | 125,000 | | | | 134,615 | |
| | |
Syneos Health, Inc., 144A, 3.625%, 1/15/2029 | | | 100,000 | | | | 100,277 | |
| | |
Tenet Healthcare Corp.: | | | | | | | | |
| | |
4.625%, 7/15/2024 | | | 50,000 | | | | 51,251 | |
| | |
144A, 4.875%, 1/1/2026 | | | 190,000 | | | | 198,761 | |
| | |
144A, 5.125%, 11/1/2027 | | | 150,000 | | | | 158,812 | |
| | |
144A, 6.125%, 10/1/2028 | | | 85,000 | | | | 88,568 | |
| | |
144A, 6.25%, 2/1/2027 | | | 75,000 | | | | 79,500 | |
| | |
144A, 7.5%, 4/1/2025 | | | 50,000 | | | | 54,625 | |
| | | | | | | | |
| | | | | | | 4,205,607 | |
| | |
| Industrials 9.7% | | | | | | | | |
| | |
ATS Automation Tooling Systems Inc, 144A, 4.125%, 12/15/2028 | | | 30,000 | | | | 30,525 | |
| | |
Bombardier, Inc.: | | | | | | | | |
| | |
144A, 5.75%, 3/15/2022 | | | 159,000 | | | | 162,223 | |
| | |
144A, 6.0%, 10/15/2022 | | | 73,000 | | | | 71,660 | |
| | |
144A, 7.5%, 3/15/2025 | | | 190,000 | | | | 176,225 | |
| | |
BWX Technologies, Inc., 144A, 5.375%, 7/15/2026 | | | 30,000 | | | | 31,163 | |
| | |
Cargo Aircraft Management, Inc., 144A, 4.75%, 2/1/2028 | | | 100,000 | | | | 103,125 | |
| | |
Cimpress PLC, 144A, 7.0%, 6/15/2026 | | | 150,000 | | | | 157,687 | |
| | |
Clark Equipment Co., 144A, 5.875%, 6/1/2025 | | | 55,000 | | | | 58,025 | |
| | |
Colfax Corp., 144A, 6.375%, 2/15/2026 | | | 95,000 | | | | 101,412 | |
| | |
Covanta Holding Corp., 5.0%, 9/1/2030 | | | 70,000 | | | | 74,896 | |
| | |
CP Atlas Buyer, Inc., 144A, 7.0%, 12/1/2028 | | | 13,000 | | | | 13,520 | |
| | |
Delta Air Lines, Inc.: | | | | | | | | |
| | |
144A, 4.5%, 10/20/2025 | | | 80,000 | | | | 85,509 | |
| | |
144A, 4.75%, 10/20/2028 | | | 180,000 | | | | 196,472 | |
| | |
144A, 7.0%, 5/1/2025 | | | 120,000 | | | | 138,546 | |
| | |
Energizer Holdings, Inc.: | | | | | | | | |
| | |
144A, 4.75%, 6/15/2028 | | | 60,000 | | | | 63,150 | |
| | |
144A, 7.75%, 1/15/2027 | | | 105,000 | | | | 116,707 | |
| | |
EnerSys, 144A, 4.375%, 12/15/2027 | | | 90,000 | | | | 95,175 | |
| | |
Forterra Finance LLC, 144A, 6.5%, 7/15/2025 | | | 30,000 | | | | 32,250 | |
| | |
Fortress Transportation and Infrastructure Investors LLC, 144A, 9.75%, 8/1/2027 | | | 30,000 | | | | 34,388 | |
| | |
GFL Environmental, Inc.: | | | | | | | | |
| | |
144A, 3.75%, 8/1/2025 | | | 80,000 | | | | 82,000 | |
| | |
144A, 4.25%, 6/1/2025 | | | 40,000 | | | | 41,500 | |
| | |
144A, 5.125%, 12/15/2026 | | | 50,000 | | | | 53,188 | |
| | |
Hillenbrand, Inc., 5.75%, 6/15/2025 | | | 160,000 | | | | 172,800 | |
| | |
Howmet Aerospace, Inc., 6.875%, 5/1/2025 | | | 140,000 | | | | 163,800 | |
| | |
Itron, Inc., 144A, 5.0%, 1/15/2026 | | | 140,000 | | | | 142,975 | |
| | |
Jaguar Holding Co. II: | | | | | | | | |
| | |
144A, 4.625%, 6/15/2025 | | | 55,000 | | | | 58,004 | |
| | |
144A, 5.0%, 6/15/2028 | | | 45,000 | | | | 48,038 | |
| | |
Masonite International Corp., 144A, 5.375%, 2/1/2028 | | | 74,000 | | | | 79,457 | |
| | |
MasTec, Inc., 144A, 4.5%, 8/15/2028 | | | 60,000 | | | | 63,000 | |
The accompanying notes are an integral part of the financial statements.
| | | | | | |
| | 10 | | | | | | Deutsche DWS Variable Series II — DWS High Income VIP |
| | | | | | | | |
| | | Principal
Amount ($)(a) | | | Value ($) | |
| | |
Mileage Plus Holdings LLC, 144A, 6.5%, 6/20/2027 | | | 130,000 | | | | 139,750 | |
| | |
Moog, Inc., 144A, 4.25%, 12/15/2027 | | | 160,000 | | | | 166,000 | |
| | |
Nielsen Finance LLC, 144A, 5.625%, 10/1/2028 | | | 165,000 | | | | 179,281 | |
| |
Prime Security Services Borrower LLC: | | | | | |
| | |
144A, 3.375%, 8/31/2027 | | | 70,000 | | | | 69,475 | |
| | |
144A, 5.75%, 4/15/2026 | | | 135,000 | | | | 147,825 | |
| | |
144A, 6.25%, 1/15/2028 | | | 275,000 | | | | 295,237 | |
| | |
Sensata Technologies, Inc., 144A, 3.75%, 2/15/2031 | | | 50,000 | | | | 51,829 | |
| | |
Signature Aviation U.S. Holdings, Inc., 144A, 4.0%, 3/1/2028 | | | 155,000 | | | | 156,031 | |
| | |
Spirit AeroSystems, Inc., 144A, 7.5%, 4/15/2025 | | | 50,000 | | | | 53,625 | |
| | |
Spirit Loyalty Cayman Ltd., 144A, 8.0%, 9/20/2025 | | | 190,000 | | | | 212,800 | |
| | |
Stericycle, Inc., 144A, 3.875%, 1/15/2029 | | | 16,000 | | | | 16,440 | |
| | |
Summit Materials LLC, 144A, 5.25%, 1/15/2029 | | | 30,000 | | | | 31,500 | |
| | |
Tennant Co., 5.625%, 5/1/2025 | | | 30,000 | | | | 31,238 | |
| | |
TransDigm, Inc.: | | | | | | | | |
| | |
5.5%, 11/15/2027 | | | 115,000 | | | | 120,899 | |
| | |
144A, 6.25%, 3/15/2026 | | | 335,000 | | | | 356,775 | |
| | |
144A, 8.0%, 12/15/2025 | | | 60,000 | | | | 66,318 | |
| | |
Triumph Group, Inc., 144A, 6.25%, 9/15/2024 | | | 42,000 | | | | 41,580 | |
| | |
U.S. Concrete, Inc., 144A, 5.125%, 3/1/2029 | | | 30,000 | | | | 30,900 | |
| | |
Vertical U.S. Newco, Inc., 144A, 5.25%, 7/15/2027 | | | 200,000 | | | | 212,000 | |
| | |
WESCO Distribution, Inc.: | | | | | | | | |
| | |
144A, 7.125%, 6/15/2025 | | | 40,000 | | | | 43,993 | |
| | |
144A, 7.25%, 6/15/2028 | | | 105,000 | | | | 119,415 | |
| | |
XPO Logistics, Inc., 144A, 6.25%, 5/1/2025 | | | 65,000 | | | | 69,949 | |
| | | | | | | | |
| | | | | | | 5,260,280 | |
| |
| Information Technology 2.2% | | | | | |
| | |
Austin BidCo, Inc., 144A, 7.125%, 12/15/2028 | | | 30,000 | | | | 31,313 | |
| | |
Banff Merger Sub, Inc., 144A, 9.75%, 9/1/2026 | | | 75,000 | | | | 81,011 | |
| | |
Boxer Parent Co., Inc., 144A, 7.125%, 10/2/2025 | | | 60,000 | | | | 65,127 | |
| | |
Camelot Finance SA, 144A, 4.5%, 11/1/2026 | | | 55,000 | | | | 57,406 | |
| | |
Change Healthcare Holdings LLC, 144A, 5.75%, 3/1/2025 | | | 210,000 | | | | 214,200 | |
| | |
Microchip Technology, Inc., 144A, 4.25%, 9/1/2025 | | | 140,000 | | | | 148,112 | |
| | |
MTS Systems Corp., 144A, 5.75%, 8/15/2027 | | | 32,000 | | | | 34,726 | |
| | |
Presidio Holdings, Inc.: | | | | | | | | |
| | |
144A, 4.875%, 2/1/2027 | | | 50,000 | | | | 53,039 | |
| | |
144A, 8.25%, 2/1/2028 | | | 30,000 | | | | 33,075 | |
| | |
Rackspace Technology Global, Inc., 144A, 5.375%, 12/1/2028 | | | 110,000 | | | | 115,247 | |
| | |
Science Applications International Corp., 144A, 4.875%, 4/1/2028 | | | 30,000 | | | | 31,800 | |
| | |
Seagate HDD Cayman: | | | | | | | | |
| | |
144A, 3.125%, 7/15/2029 | | | 35,000 | | | | 35,004 | |
| | |
144A, 3.375%, 7/15/2031 | | | 15,000 | | | | 15,081 | |
| | | | | | | | |
| | | Principal
Amount ($)(a) | | | Value ($) | |
| | |
SS&C Technologies, Inc., 144A, 5.5%, 9/30/2027 | | | 85,000 | | | | 90,782 | |
| | |
TTM Technologies, Inc., 144A, 5.625%, 10/1/2025 | | | 155,000 | | | | 158,681 | |
| | |
Unisys Corp., 144A, 6.875%, 11/1/2027 | | | 41,000 | | | | 44,793 | |
| | | | | | | | |
| | | | | | | 1,209,397 | |
| | |
| Materials 10.3% | | | | | | | | |
| | |
Arconic Corp., 144A, 6.125%, 2/15/2028 | | | 150,000 | | | | 161,719 | |
| | |
Berry Global, Inc., 144A, 5.625%, 7/15/2027 | | | 15,000 | | | | 16,130 | |
| | |
Cascades, Inc.: | | | | | | | | |
| | |
144A, 5.125%, 1/15/2026 | | | 10,000 | | | | 10,563 | |
| | |
144A, 5.375%, 1/15/2028 | | | 45,000 | | | | 47,827 | |
| | |
CF Industries, Inc., 5.15%, 3/15/2034 | | | 30,000 | | | | 36,864 | |
| | |
Chemours Co.: | | | | | | | | |
| | |
5.375%, 5/15/2027 (b) | | | 95,000 | | | | 101,175 | |
| | |
144A, 5.75%, 11/15/2028 | | | 290,000 | | | | 295,800 | |
| | |
Clearwater Paper Corp.: | | | | | | | | |
| | |
144A, 4.75%, 8/15/2028 | | | 80,000 | | | | 82,800 | |
| | |
144A, 5.375%, 2/1/2025 | | | 110,000 | | | | 119,212 | |
| | |
Cleveland-Cliffs, Inc., 144A, 6.75%, 3/15/2026 | | | 125,000 | | | | 135,000 | |
| | |
Constellium SE: | | | | | | | | |
| | |
144A, 5.75%, 5/15/2024 | | | 250,000 | | | | 255,105 | |
| | |
144A, 6.625%, 3/1/2025 | | | 250,000 | | | | 255,312 | |
| | |
Element Solutions, Inc., 144A, 3.875%, 9/1/2028 | | | 50,000 | | | | 51,438 | |
| | |
First Quantum Minerals Ltd.: | | | | | | | | |
| | |
144A, 6.875%, 3/1/2026 | | | 200,000 | | | | 208,500 | |
| | |
144A, 6.875%, 10/15/2027 | | | 300,000 | | | | 325,500 | |
| | |
Freeport-McMoRan, Inc.: | | | | | | | | |
| | |
4.125%, 3/1/2028 | | | 270,000 | | | | 283,162 | |
| | |
4.25%, 3/1/2030 | | | 150,000 | | | | 161,625 | |
| | |
4.375%, 8/1/2028 | | | 90,000 | | | | 95,625 | |
| | |
4.625%, 8/1/2030 | | | 90,000 | | | | 98,775 | |
| | |
5.0%, 9/1/2027 | | | 105,000 | | | | 111,300 | |
| | |
5.4%, 11/14/2034 | | | 70,000 | | | | 87,587 | |
| | |
HB Fuller Co., 4.25%, 10/15/2028 | | | 50,000 | | | | 51,250 | |
| | |
Hudbay Minerals, Inc.: | | | | | | | | |
| | |
144A, 6.125%, 4/1/2029 | | | 100,000 | | | | 107,750 | |
| | |
144A, 7.625%, 1/15/2025 | | | 220,000 | | | | 228,525 | |
| | |
Illuminate Buyer LLC, 144A, 9.0%, 7/1/2028 | | | 20,000 | | | | 22,000 | |
| | |
Ingevity Corp., 144A, 3.875%, 11/1/2028 | | | 70,000 | | | | 70,525 | |
| | |
Kaiser Aluminum Corp., 144A, 4.625%, 3/1/2028 | | | 70,000 | | | | 72,625 | |
| | |
Kraton Polymers LLC, 144A, 4.25%, 12/15/2025 | | | 65,000 | | | | 66,306 | |
| | |
LABL Escrow Issuer LLC, 144A, 6.75%, 7/15/2026 | | | 100,000 | | | | 108,297 | |
| | |
Mauser Packaging Solutions Holding Co., 144A, 7.25%, 4/15/2025 | | | 105,000 | | | | 106,050 | |
| | |
Mercer International, Inc., 7.375%, 1/15/2025 | | | 175,000 | | | | 182,112 | |
| | |
Methanex Corp.: | | | | | | | | |
| | |
5.125%, 10/15/2027 | | | 180,000 | | | | 195,638 | |
| | |
5.25%, 12/15/2029 | | | 50,000 | | | | 54,186 | |
| | |
Nouryon Holding BV, 144A, 8.0%, 10/1/2026 | | | 150,000 | | | | 159,375 | |
| | |
Novelis Corp.: | | | | | | | | |
| | |
144A, 4.75%, 1/30/2030 | | | 375,000 | | | | 404,012 | |
| | |
144A, 5.875%, 9/30/2026 | | | 230,000 | | | | 240,350 | |
The accompanying notes are an integral part of the financial statements.
| | | | |
Deutsche DWS Variable Series II — DWS High Income VIP | | | | | 11 |
| | | | | | | | |
| | | Principal
Amount ($)(a) | | | Value ($) | |
| | |
Rayonier AM Products, Inc., 144A, 7.625%, 1/15/2026 | | | 30,000 | | | | 31,283 | |
| | |
Tronox Finance PLC, 144A, 5.75%, 10/1/2025 | | | 266,000 | | | | 275,975 | |
| | |
Tronox, Inc.: | | | | | | | | |
| | |
144A, 6.5%, 5/1/2025 | | | 30,000 | | | | 32,100 | |
| | |
144A, 6.5%, 4/15/2026 | | | 192,000 | | | | 199,920 | |
| | | | | | | | |
| | | | | | | 5,549,298 | |
| | |
| Real Estate 4.7% | | | | | | | | |
| | |
Cushman & Wakefield U.S. Borrower LLC, 144A, 6.75%, 5/15/2028 | | | 120,000 | | | | 132,300 | |
| | |
Iron Mountain, Inc.: | | | | | | | | |
| | |
144A, (REIT), 4.875%, 9/15/2029 | | | 60,000 | | | | 63,300 | |
| | |
144A, (REIT), 5.0%, 7/15/2028 | | | 75,000 | | | | 79,678 | |
| | |
144A, (REIT), 5.25%, 7/15/2030 | | | 100,000 | | | | 108,000 | |
| | |
iStar, Inc.: | | | | | | | | |
| | |
(REIT), 4.25%, 8/1/2025 | | | 100,000 | | | | 98,750 | |
| | |
(REIT), 4.75%, 10/1/2024 | | | 170,000 | | | | 172,125 | |
| | |
MGM Growth Properties Operating Partnership LP: | | | | | | | | |
| | |
144A, (REIT), 3.875%, 2/15/2029 | | | 90,000 | | | | 92,025 | |
| | |
144A, (REIT), 4.625%, 6/15/2025 | | | 233,000 | | | | 249,543 | |
| | |
(REIT), 5.75%, 2/1/2027 | | | 310,000 | | | | 347,780 | |
| | |
MPT Operating Partnership LP: | | | | | | | | |
| | |
(REIT), 3.5%, 3/15/2031 | | | 105,000 | | | | 108,412 | |
| | |
(REIT), 4.625%, 8/1/2029 | | | 140,000 | | | | 149,625 | |
| | |
Realogy Group LLC, 144A, 7.625%, 6/15/2025 | | | 185,000 | | | | 200,858 | |
| | |
Service Properties Trust: | | | | | | | | |
| | |
(REIT), 5.5%, 12/15/2027 | | | 135,000 | | | | 147,603 | |
| | |
(REIT), 7.5%, 9/15/2025 | | | 160,000 | | | | 184,371 | |
| | |
Uniti Group LP: | | | | | | | | |
| | |
144A, (REIT), 6.0%, 4/15/2023 | | | 60,000 | | | | 61,200 | |
| | |
144A, (REIT), 7.875%, 2/15/2025 | | | 110,000 | | | | 118,163 | |
| | |
VICI Properties LP: | | | | | | | | |
| | |
144A, (REIT), 3.5%, 2/15/2025 | | | 10,000 | | | | 10,228 | |
| | |
144A, (REIT), 3.75%, 2/15/2027 | | | 30,000 | | | | 30,675 | |
| | |
144A, (REIT), 4.125%, 8/15/2030 | | | 155,000 | | | | 163,623 | |
| | |
144A, (REIT), 4.625%, 12/1/2029 | | | 16,000 | | | | 17,120 | |
| | | | | | | | |
| | | | | | | 2,535,379 | |
| | |
| Utilities 4.4% | | | | | | | | |
| | |
AmeriGas Partners LP: | | | | | | | | |
| | |
5.5%, 5/20/2025 | | | 205,000 | | | | 227,037 | |
| | |
5.75%, 5/20/2027 | | | 110,000 | | | | 125,146 | |
| | |
Calpine Corp.: | | | | | | | | |
| | |
144A, 4.5%, 2/15/2028 | | | 155,000 | | | | 161,200 | |
| | |
144A, 4.625%, 2/1/2029 | | | 30,000 | | | | 30,848 | |
| | |
144A, 5.0%, 2/1/2031 | | | 45,000 | | | | 47,025 | |
| | |
Clearway Energy Operating LLC, 144A, 4.75%, 3/15/2028 | | | 165,000 | | | | 176,963 | |
| | |
NextEra Energy Operating Partners LP, 144A, 4.25%, 7/15/2024 | | | 210,000 | | | | 224,700 | |
| | |
NRG Energy, Inc.: | | | | | | | | |
| | |
144A, 3.375%, 2/15/2029 | | | 30,000 | | | | 30,714 | |
| | |
144A, 3.625%, 2/15/2031 | | | 145,000 | | | | 149,176 | |
| | |
144A, 5.25%, 6/15/2029 | | | 157,000 | | | | 172,700 | |
| | |
5.75%, 1/15/2028 | | | 200,000 | | | | 218,500 | |
| | |
Pattern Energy Operations LP, 144A, 4.5%, 8/15/2028 | | | 90,000 | | | | 94,950 | |
| | | | | | | | |
| | | Principal
Amount ($)(a) | | | Value ($) | |
| | |
PG&E Corp., 5.0%, 7/1/2028 | | | 125,000 | | | | 133,125 | |
| | |
Pike Corp., 144A, 5.5%, 9/1/2028 | | | 30,000 | | | | 31,688 | |
| | |
Talen Energy Supply LLC: | | | | | | | | |
| | |
144A, 7.25%, 5/15/2027 | | | 190,000 | | | | 202,350 | |
| | |
144A, 7.625%, 6/1/2028 | | | 60,000 | | | | 64,650 | |
| | |
Vistra Operations Co. LLC: | | | | | | | | |
| | |
144A, 5.0%, 7/31/2027 | | | 220,000 | | | | 233,200 | |
| | |
144A, 5.625%, 2/15/2027 | | | 55,000 | | | | 58,500 | |
| | | | | | | | |
| | | | | | | | 2,382,472 | |
Total Corporate Bonds (Cost $49,187,240) | | | | 52,412,337 | |
|
| Loan Participations and Assignments 0.8% | |
| Senior Loans ** | | | | | | | | |
| | |
Brand Energy & Infrastructure Services, Inc., Term Loan, 3-month USD-LIBOR + 4.250%, 5.25%, 6/21/2024 | | | 169,561 | | | | 165,714 | |
| | |
Endo Luxembourg Finance Company I S.a r.l., Term Loan B, 3-month USD-LIBOR + 4.250%, 5.0%, 4/29/2024 | | | 177,698 | | | | 175,477 | |
| | |
Flex Acquisition Co., Inc., Frist Lien Term Loan, 3-month USD-LIBOR + 3.000%, 4.0%, 12/29/2023 | | | 80,931 | | | | 80,679 | |
Total Loan Participations and Assignments (Cost $414,717) | | | | 421,870 | |
| | |
| | | Shares | | | Value ($) | |
| Common Stocks 0.0% | |
| Industrials | |
Quad Graphics, Inc. (Cost $0) | | | 287 | | | | 1,096 | |
| | |
| Warrants 0.1% | | | | | | | | |
| Materials | | | | | | | | |
Hercules Trust II, Expiration Date 3/31/2029* (d) (Cost $244,286) | | | 1,100 | | | | 52,471 | |
| |
| Securities Lending Collateral 1.2% | | | | | |
DWS Government & Agency Securities Portfolio “DWS Government Cash Institutional Shares”, 0.03% (e) (f) (Cost $633,205) | | | 633,205 | | | | 633,205 | |
| | |
| Cash Equivalents 1.5% | | | | | | | | |
DWS Central Cash Management Government Fund, 0.080% (e) (Cost $843,071) | | | 843,071 | | | | 843,071 | |
| | |
| | | % of Net
Assets | | | Value ($) | |
Total Investment Portfolio (Cost $51,322,519) | | | 100.5 | | | | 54,364,050 | |
| Other Assets and Liabilities, Net | | | (0.5 | ) | | | (257,085 | ) |
| Net Assets | | | 100.0 | | | | 54,106,965 | |
The accompanying notes are an integral part of the financial statements.
| | | | | | |
| | 12 | | | | | | Deutsche DWS Variable Series II — DWS High Income VIP |
A summary of the Fund’s transactions with affiliated investments during the year ended December 31, 2020 are as follows:
| | | | | | | | | | | | | | | | | | | | | | | | | | | | | | | | |
Value ($) at
12/31/2019 | | Purchases
Cost ($) | | | Sales
Proceeds ($) | | | Net
Realized
Gain/
(Loss) ($) | | | Net Change in
Unrealized
Appreciation
(Depreciation) ($) | | | Income ($) | | | Capital Gain
Distributions ($) | | | Number
of Shares
at
12/31/2020 | | | Value ($)
at
12/31/2020 | |
Securities Lending Collateral 1.2% | | | | | | | | | | | | | | | | | |
DWS Government & Agency Securities Portfolio “DWS Government Cash Institutional Shares”, 0.03% (e) (f) | |
| 361,289 | | | 271,916 | (g) | | | — | | | | — | | | | — | | | | 1,821 | | | | — | | | | 633,205 | | | | 633,205 | |
Cash Equivalents 1.5% | | | | | | | | | | | | | | | | | |
DWS Central Cash Management Government Fund, 0.08% (e) | |
| 2,187,480 | | | 27,038,416 | | | | 28,382,825 | | | | — | | | | — | | | | 7,012 | | | | — | | | | 843,071 | | | | 843,071 | |
| 2,548,769 | | | 27,310,332 | | | | 28,382,825 | | | | — | | | | — | | | | 8,833 | | | | — | | | | 1,476,276 | | | | 1,476,276 | |
| ** | Variable or floating rate security. These securities are shown at their current rate as of December 31, 2020. For securities based on a published reference rate and spread, the reference rate and spread are indicated within the description above. Certain variable rate securities are not based on a published reference rate and spread but adjust periodically based on current market conditions, prepayment of underlying positions and/or other variables. |
| (a) | Principal amount stated in U.S. dollars unless otherwise noted. |
| (b) | All or a portion of these securities were on loan. In addition, “Other Assets and Liabilities, Net” may include pending sales that are also on loan. The value of securities loaned at December 31, 2020 amounted to $604,414, which is 1.1% of net assets. |
| (c) | When-issued, delayed delivery or forward commitment securities included. |
| (d) | Investment was valued using significant unobservable inputs. |
| (e) | Affiliated fund managed by DWS Investment Management Americas, Inc. The rate shown is the annualized seven-day yield at period end. |
| (f) | Represents cash collateral held in connection with securities lending. Income earned by the Fund is net of borrower rebates. |
| (g) | Represents the net increase (purchase cost) or decrease (sales proceeds) in the amount invested in cash collateral for the year ended December 31, 2020. |
144A: Security exempt from registration under Rule 144A of the Securities Act of 1933. These securities may be resold in transactions exempt from registration, normally to qualified institutional buyers.
LIBOR: London Interbank Offered Rate
REG S: Securities sold under Regulation S may not be offered, sold or delivered within the United States or to, or for the account or benefit of, U.S. persons, except pursuant to an exemption from, or in a transaction not subject to, the registration requirements of the Securities Act of 1933.
REIT: Real Estate Investment Trust
As of December 31, 2020, the Fund had the following open forward foreign currency contracts:
| | | | | | | | | | | | | | | | | | |
| Contracts to Deliver | | | In Exchange For | | | Settlement
Date | | Unrealized
Appreciation ($) | | | Counterparty |
| EUR | | | 978,534 | | | USD | | | 1,196,511 | | | 1/29/2021 | | | 223 | | | BNP Paribas SA |
Currency Abbreviations
For information on the Fund’s policy and additional disclosures regarding forward foreign currency contracts, please refer to the Derivatives section of Note B in the accompanying Notes to Financial Statements.
The accompanying notes are an integral part of the financial statements.
| | | | |
Deutsche DWS Variable Series II — DWS High Income VIP | | | | | 13 |
Fair Value Measurements
Various inputs are used in determining the value of the Fund’s investments. These inputs are summarized in three broad levels. Level 1 includes quoted prices in active markets for identical securities. Level 2 includes other significant observable inputs (including quoted prices for similar securities, interest rates, prepayment speeds and credit risk). Level 3 includes significant unobservable inputs (including the Fund’s own assumptions in determining the fair value of investments). The level assigned to the securities valuations may not be an indication of the risk or liquidity associated with investing in those securities.
The following is a summary of the inputs used as of December 31, 2020 in valuing the Fund’s investments. For information on the Fund’s policy regarding the valuation of investments, please refer to the Security Valuation section of Note A in the accompanying Notes to Financial Statements.
| | | | | | | | | | | | | | | | |
| Assets | | Level 1 | | | Level 2 | | | Level 3 | | | Total | |
| Fixed Income Investments | | | | | | | | | | | | | | | | |
Corporate Bonds (h) | | $ | — | | | $ | 52,412,337 | | | $ | — | | | $ | 52,412,337 | |
Loan Participations and Assignments | | | — | | | | 421,870 | | | | — | | | | 421,870 | |
| Common Stocks | | | 1,096 | | | | — | | | | — | | | | 1,096 | |
| Warrants | | | — | | | | — | | | | 52,471 | | | | 52,471 | |
| Short-Term Investments (h) | | | 1,476,276 | | | | — | | | | — | | | | 1,476,276 | |
| Derivatives (i) | | | | | | | | | | | | | | | | |
Forward Foreign Currency Contracts | | | — | | | | 223 | | | | — | | | | 223 | |
| Total | | $ | 1,477,372 | | | $ | 52,834,430 | | | $ | 52,471 | | | $ | 54,364,273 | |
| (h) | See Investment Portfolio for additional detailed categorizations. |
| (i) | Derivatives include unrealized appreciation (depreciation) on open forward foreign currency contracts. |
The accompanying notes are an integral part of the financial statements.
| | | | | | |
| | 14 | | | | | | Deutsche DWS Variable Series II — DWS High Income VIP |
Statement of Assets and Liabilities
| | | | |
| as of December 31, 2020 | | | | |
| |
| Assets | | | | |
| Investments in non-affiliated securities, at value (cost $49,846,243) — including $604,414 of securities loaned | | $ | 52,887,774 | |
| Investment in DWS Government & Agency Securities Portfolio (cost $633,205)* | | | 633,205 | |
| Investment in DWS Central Cash Management Government Fund (cost $843,071) | | | 843,071 | |
| Cash | | | 2,737 | |
| Foreign currency, at value (cost $10,298) | | | 10,287 | |
| Receivable for investments sold — when-issued/delayed delivery securities | | | 35,729 | |
| Receivable for Fund shares sold | | | 20,676 | |
| Interest receivable | | | 776,526 | |
| Unrealized appreciation on forward foreign currency contracts | | | 223 | |
| Other assets | | | 1,129 | |
| Total assets | | | 55,211,357 | |
| |
| Liabilities | | | | |
| Payable upon return of securities loaned | | | 633,205 | |
| Payable for investments purchased | | | 166,593 | |
| Payable for investments purchased — when-issued/delayed delivery securities | | | 155,000 | |
| Payable for Fund shares redeemed | | | 11,415 | |
| Accrued management fee | | | 29,234 | |
| Accrued Trustees’ fees | | | 1,628 | |
| Other accrued expenses and payables | | | 107,317 | |
| Total liabilities | | | 1,104,392 | |
| Net assets, at value | | $ | 54,106,965 | |
| |
| Net Assets Consist of | | | | |
| Distributable earnings (loss) | | | (2,082,822 | ) |
| Paid-in capital | | | 56,189,787 | |
| Net assets, at value | | $ | 54,106,965 | |
| |
| Net Asset Value | | | | |
Class A | | | | |
| |
| Net Asset Value, offering and redemption price per share ($53,959,166 ÷ 8,668,128 outstanding shares of beneficial interest, no par value, unlimited number of shares authorized) | | $ | 6.23 | |
Class B | | | | |
| |
| Net Asset Value, offering and redemption price per share ($147,799 ÷ 23,669 outstanding shares of beneficial interest, no par value, unlimited number of shares authorized) | | $ | 6.24 | |
| * | Represents collateral on securities loaned. |
Statement of Operations
| | | | |
| for the year ended December 31, 2020 | |
| |
| Investment Income | | | | |
| Income: | | | | |
| |
| Interest | | $ | 2,890,941 | |
| Income distributions — DWS Central Cash Management Government Fund | | | 7,012 | |
| Securities lending income, net of borrower rebates | | | 1,821 | |
| Total income | | | 2,899,774 | |
| Expenses: | | | | |
| |
| Management fee | | | 260,892 | |
| Administration fee | | | 50,888 | |
| Services to Shareholders | | | 895 | |
| Record keeping fee (Class B) | | | 214 | |
| Distribution service fees (Class B) | | | 371 | |
| Custodian fee | | | 7,841 | |
| Professional fees | | | 89,150 | |
| Reports to shareholders | | | 36,343 | |
| Trustees’ fees and expenses | | | 3,595 | |
| Other | | | 3,995 | |
| Total expenses before expense reductions | | | 454,184 | |
| Expense reductions | | | (88,318 | ) |
| Total expenses after expense reductions | | | 365,866 | |
| Net investment income | | | 2,533,908 | |
| |
| Realized and Unrealized Gain (Loss) | | | | |
| Net realized gain (loss) from: | | | | |
| Investments | | | (743,582 | ) |
| Forward foreign currency contracts | | | (216,701 | ) |
| Foreign currency | | | 68,229 | |
| | | | (892,054 | ) |
| Change in net unrealized appreciation (depreciation) on: | | | | |
| |
| Investments | | | 1,331,238 | |
| Forward foreign currency contracts | | | 9,850 | |
| Foreign currency | | | 177 | |
| | | | 1,341,265 | |
| Net gain (loss) | | | 449,211 | |
Net increase (decrease) in net assets
resulting from operations | | $ | 2,983,119 | |
The accompanying notes are an integral part of the financial statements.
| | | | |
Deutsche DWS Variable Series II — DWS High Income VIP | | | | | 15 |
Statements of Changes in Net Assets
| | | | | | | | |
| | | Years Ended December 31, | |
| Increase (Decrease) in Net Assets | | 2020 | | | 2019 | |
| Operations: | | | | | | | | |
| Net investment income (loss) | | $ | 2,533,908 | | | $ | 2,819,135 | |
| Net realized gain (loss) | | | (892,054 | ) | | | (118,561 | ) |
| Change in net unrealized appreciation (depreciation) | | | 1,341,265 | | | | 5,181,906 | |
| Net increase (decrease) in net assets resulting from operations | | | 2,983,119 | | | | 7,882,480 | |
| Distributions to shareholders: | | | | | | | | |
Class A | | | (2,873,076 | ) | | | (3,177,995 | ) |
Class B | | | (8,104 | ) | | | (7,539 | ) |
| Total distributions | | | (2,881,180 | ) | | | (3,185,534 | ) |
| Fund share transactions: | | | | | | | | |
Class A | | | | | | | | |
| Proceeds from shares sold | | | 6,977,525 | | | | 5,665,153 | |
| Reinvestment of distributions | | | 2,873,076 | | | | 3,177,995 | |
| Payments for shares redeemed | | | (11,869,783 | ) | | | (9,540,349 | ) |
| Net increase (decrease) in net assets from Class A share transactions | | | (2,019,182 | ) | | | (697,201 | ) |
Class B | | | | | | | | |
| Proceeds from shares sold | | | 9,694 | | | | 16,476 | |
| Reinvestment of distributions | | | 8,104 | | | | 7,539 | |
| Payments for shares redeemed | | | (29,136 | ) | | | (11,195 | ) |
| Net increase (decrease) in net assets from Class B share transactions | | | (11,338 | ) | | | 12,820 | |
| Increase (decrease) in net assets | | | (1,928,581 | ) | | | 4,012,565 | |
| Net assets at beginning of period | | | 56,035,546 | | | | 52,022,981 | |
| | |
| Net assets at end of period | | $ | 54,106,965 | | | $ | 56,035,546 | |
| | |
| Other Information | | | | | | |
Class A | | | | | | | | |
| Shares outstanding at beginning of period | | | 8,976,023 | | | | 9,081,584 | |
| Shares sold | | | 1,182,798 | | | | 944,540 | |
| Shares issued to shareholders in reinvestment of distributions | | | 536,022 | | | | 543,247 | |
| Shares redeemed | | | (2,026,715 | ) | | | (1,593,348 | ) |
| Net increase (decrease) in Class A shares | | | (307,895 | ) | | | (105,561 | ) |
| | |
| Shares outstanding at end of period | | | 8,668,128 | | | | 8,976,023 | |
Class B | | | | | | | | |
| Shares outstanding at beginning of period | | | 25,470 | | | | 23,418 | |
| Shares sold | | | 1,573 | | | | 2,669 | |
| Shares issued to shareholders in reinvestment of distributions | | | 1,501 | | | | 1,282 | |
| Shares redeemed | | | (4,875 | ) | | | (1,899 | ) |
| Net increase (decrease) in Class B shares | | | (1,801 | ) | | | 2,052 | |
| | |
| Shares outstanding at end of period | | | 23,669 | | | | 25,470 | |
The accompanying notes are an integral part of the financial statements.
| | | | | | |
| | 16 | | | | | | Deutsche DWS Variable Series II — DWS High Income VIP |
Financial Highlights
DWS High Income VIP — Class A
| | | | | | | | | | | | | | | | | | | | |
| | | Years Ended December 31, | |
| | | 2020 | | | 2019 | | | 2018 | | | 2017 | | | 2016 | |
| | | | | |
| Selected Per Share Data | | | | | | | | | | | | | | | | | | | | |
| Net asset value, beginning of period | | $ | 6.23 | | | | $5.71 | | | | $6.36 | | | | $6.28 | | | | $5.93 | |
| Income (loss) from investment operations: | | | | | | | | | | | | | | | | | | | | |
| | | | | |
Net investment incomea | | | .29 | | | | .31 | | | | .33 | | | | .31 | | | | .32 | |
Net realized and unrealized gain (loss) | | | .04 | | | | .56 | | | | (.48 | ) | | | .15 | | | | .41 | |
Total from investment operations | | | .33 | | | | .87 | | | | (.15 | ) | | | .46 | | | | .73 | |
| Less distributions from: | | | | | | | | | | | | | | | | | | | | |
Net investment income | | | (.33 | ) | | | (.35 | ) | | | (.50 | ) | | | (.38 | ) | | | (.38 | ) |
| Net asset value, end of period | | $ | 6.23 | | | | $6.23 | | | | $5.71 | | | | $6.36 | | | | $6.28 | |
| Total Return (%)b | | | 6.24 | | | | 15.69 | | | | (2.52 | ) | | | 7.51 | | | | 12.87 | |
| | | | | |
| Ratios to Average Net Assets and Supplemental Data | | | | | | | | | | | | | | | | | | | | |
| Net assets, end of period ($ millions) | | | 54 | | | | 56 | | | | 52 | | | | 61 | | | | 100 | |
| Ratio of expenses before expense reductions (%)c | | | .87 | | | | .96 | | | | .94 | | | | .78 | | | | .80 | |
| Ratio of expenses after expense reductions (%)c | | | .70 | | | | .68 | | | | .69 | | | | .72 | | | | .72 | |
| Ratio of net investment income (%) | | | 4.86 | | | | 5.09 | | | | 5.41 | | | | 4.98 | | | | 5.38 | |
| Portfolio turnover rate (%) | | | 94 | | | | 82 | | | | 62 | | | | 71 | | | | 77 | |
| a | Based on average shares outstanding during the period. |
| b | Total return would have been lower had certain expenses not been reduced. |
| c | Expense ratio does not reflect charges and fees associated with the separate account that invests in the Fund or any variable life insurance policy or variable annuity contract for which the Fund is an investment option. |
DWS High Income VIP — Class B
| | | | | | | | | | | | | | | | | | | | |
| | | Years Ended December 31, | |
| | | 2020 | | | 2019 | | | 2018 | | | 2017 | | | 2016 | |
| | | | | |
| Selected Per Share Data | | | | | | | | | | | | | | | | | | | | |
| Net asset value, beginning of period | | $ | 6.25 | | | | $5.73 | | | | $6.38 | | | | $6.30 | | | | $5.94 | |
| Income (loss) from investment operations: | | | | | | | | | | | | | | | | | | | | |
| | | | | |
Net investment incomea | | | .27 | | | | .29 | | | | .31 | | | | .31 | | | | .31 | |
Net realized and unrealized gain (loss) | | | .04 | | | | .57 | | | | (.48 | ) | | | .13 | | | | .41 | |
Total from investment operations | | | .31 | | | | .86 | | | | (.17 | ) | | | .44 | | | | .72 | |
| Less distributions from: | | | | | | | | | | | | | | | | | | | | |
Net investment income | | | (.32 | ) | | | (.34 | ) | | | (.48 | ) | | | (.36 | ) | | | (.36 | ) |
| Net asset value, end of period | | $ | 6.24 | | | | $6.25 | | | | $5.73 | | | | $6.38 | | | | $6.30 | |
| Total Return (%)b | | | 5.77 | | | | 15.33 | | | | (2.76 | ) | | | 7.21 | | | | 12.67 | |
| | | | | |
| Ratios to Average Net Assets and Supplemental Data | | | | | | | | | | | | | | | | | | | | |
| Net assets, end of period ($ millions) | | | .1 | | | | .2 | | | | .1 | | | | .1 | | | | 2 | |
| Ratio of expenses before expense reductions (%)c | | | 1.30 | | | | 1.40 | | | | 1.34 | | | | 1.15 | | | | 1.21 | |
| Ratio of expenses after expense reductions (%)c | | | 1.05 | | | | .94 | | | | .96 | | | | .98 | | | | .98 | |
| Ratio of net investment income (%) | | | 4.52 | | | | 4.82 | | | | 5.14 | | | | 4.88 | | | | 5.15 | |
| Portfolio turnover rate (%) | | | 94 | | | | 82 | | | | 62 | | | | 71 | | | | 77 | |
| a | Based on average shares outstanding during the period. |
| b | Total return would have been lower had certain expenses not been reduced. |
| c | Expense ratio does not reflect charges and fees associated with the separate account that invests in the Fund or any variable life insurance policy or variable annuity contract for which the Fund is an investment option. |
The accompanying notes are an integral part of the financial statements.
| | | | |
Deutsche DWS Variable Series II — DWS High Income VIP | | | | | 17 |
| | |
| Notes to Financial Statements | | |
A. Organization and Significant Accounting Policies
DWS High Income VIP (the “Fund”) is a diversified series of Deutsche DWS Variable Series II (the “Trust”), which is registered under the Investment Company Act of 1940, as amended (the “1940 Act”), as an open-end management investment company organized as a Massachusetts business trust.
Multiple Classes of Shares of Beneficial Interest. The Fund offers two classes of shares (Class A shares and Class B shares). Sales of Class B shares are subject to recordkeeping fees of up to 0.15% and
Rule 12b-1 fees under the 1940 Act equal to an annual rate of up to 0.25% of the average daily net assets of the Class B shares of the Fund. Class A shares are not subject to such fees.
Investment income, realized and unrealized gains and losses, and certain fund-level expenses and expense reductions, if any, are borne pro rata on the basis of relative net assets by the holders of all classes of shares except that each class bears certain expenses unique to that class (including the applicable Rule 12b-1 fee and recordkeeping fees). Differences in class-level expenses may result in payment of different per share dividends by class. All shares have equal rights with respect to voting subject to class-specific arrangements.
The Fund’s financial statements are prepared in accordance with accounting principles generally accepted in the United States of America (“U.S. GAAP”) which require the use of management estimates. Actual results could differ from those estimates. The Fund qualifies as an investment company under Topic 946 of Accounting Standards Codification of U.S. GAAP. The policies described below are followed consistently by the Fund in the preparation of its financial statements.
Security Valuation. Investments are stated at value determined as of the close of regular trading on the New York Stock Exchange on each day the exchange is open for trading.
Various inputs are used in determining the value of the Fund’s investments. These inputs are summarized in three broad levels. Level 1 includes quoted prices in active markets for identical securities. Level 2 includes other significant observable inputs (including quoted prices for similar securities, interest rates, prepayment speeds and credit risk). Level 3 includes significant unobservable inputs (including the Fund’s own assumptions in determining the fair value of investments). The level assigned to the securities valuations may not be an indication of the risk or liquidity associated with investing in those securities.
Debt securities and loan participations and assignments are valued at prices supplied by independent pricing services approved by the Fund’s Board. Such services may use various pricing techniques which take into account appropriate factors such as yield, quality, coupon rate, maturity, type of issue, trading characteristics, prepayment speeds and other data, as well as broker quotes. If the pricing services are unable to provide valuations, debt securities are valued at the average of the most recent reliable bid quotations or evaluated prices, as applicable, obtained from broker-dealers and loan participations and assignments are valued at the mean of the most recent bid and ask quotations or evaluated prices, as applicable, obtained from broker-dealers. Certain securities may be valued on the basis of a price provided by a single source or broker-dealer. No active trading market may exist for some senior loans and they may be subject to restrictions on resale. The inability to dispose of senior loans in a timely fashion could result in losses. These securities are generally categorized as Level 2.
Equity securities are valued at the most recent sale price or official closing price reported on the exchange (U.S. or foreign) or over-the-counter market on which they trade. Securities for which no sales are reported are valued at the calculated mean between the most recent bid and asked quotations on the relevant market or, if a mean cannot be determined, at the most recent bid quotation. Equity securities are generally categorized as Level 1 securities.
Investments in open-end investment companies are valued at their net asset value each business day and are categorized as Level 1.
Forward currency contracts are valued at the prevailing forward exchange rate of the underlying currencies and are categorized as Level 2.
Securities and other assets for which market quotations are not readily available or for which the above valuation procedures are deemed not to reflect fair value are valued in a manner that is intended to reflect their fair value as determined in accordance with procedures approved by the Board and are generally categorized as Level 3. In accordance with the Fund’s valuation procedures, factors considered in determining value may include, but are not limited to, the type of the security; the size of the holding; the initial cost of the security; the existence of any contractual restrictions on the security’s disposition; the price
| | | | | | |
| | 18 | | | | | | Deutsche DWS Variable Series II — DWS High Income VIP |
and extent of public trading in similar securities of the issuer or of comparable companies; quotations or evaluated prices from broker-dealers and/or pricing services; information obtained from the issuer, analysts and/or the appropriate stock exchange (for exchange-traded securities); an analysis of the company’s or issuer’s financial statements; an evaluation of the forces that influence the issuer and the market(s) in which the security is purchased and sold; and with respect to debt securities, the maturity, coupon, creditworthiness, currency denomination and the movement of the market in which the security is normally traded. The value determined under these procedures may differ from published values for the same securities.
Disclosure about the classification of fair value measurements is included in a table following the Fund’s Investment Portfolio.
Foreign Currency Translations. The books and records of the Fund are maintained in U.S. dollars. Investment securities and other assets and liabilities denominated in a foreign currency are translated into U.S. dollars at the prevailing exchange rates at period end. Purchases and sales of investment securities, income and expenses are translated into U.S. dollars at the prevailing exchange rates on the respective dates of the transactions.
Net realized and unrealized gains and losses on foreign currency transactions represent net gains and losses between trade and settlement dates on securities transactions, the acquisition and disposition of foreign currencies, and the difference between the amount of net investment income accrued and the U.S. dollar amount actually received. That portion of both realized and unrealized gains and losses on investments that results from fluctuations in foreign currency exchange rates is not separately disclosed but is included with net realized and unrealized gain/appreciation and loss/depreciation on investments.
Securities Lending. Deutsche Bank AG, as lending agent, lends securities of the Fund to certain financial institutions under the terms of its securities lending agreement. During the term of the loans, the Fund continues to receive interest and dividends generated by the securities and to participate in any changes in their market value. The Fund requires the borrowers of the securities to maintain collateral with the Fund consisting of either cash or liquid, unencumbered assets having a value at least equal to the value of the securities loaned. When the collateral falls below specified amounts, the lending agent will use its best effort to obtain additional collateral on the next business day to meet required amounts under the securities lending agreement. As of period end, any securities on loan were collateralized by cash. During the year ended December 31, 2020, the Fund invested the cash collateral into a joint trading account in DWS Government & Agency Securities Portfolio, an affiliated money market fund managed by DWS Investment Management Americas, Inc. DWS Investment Management Americas, Inc. receives a management/administration fee (0.06% annualized effective rate as of December 31, 2020) on the cash collateral invested in DWS Government & Agency Securities Portfolio. The Fund receives compensation for lending its securities either in the form of fees or by earning interest on invested cash collateral net of borrower rebates and fees paid to a lending agent. Either the Fund or the borrower may terminate the loan at any time, and the borrower, after notice, is required to return borrowed securities within a standard time period. There may be risks of delay and costs in recovery of securities or even loss of rights in the collateral should the borrower of the securities fail financially. If the Fund is not able to recover securities lent, the Fund may sell the collateral and purchase a replacement investment in the market, incurring the risk that the value of the replacement security is greater than the value of the collateral. The Fund is also subject to all investment risks associated with the reinvestment of any cash collateral received, including, but not limited to, interest rate, credit and liquidity risk associated with such investments.
As of December 31, 2020, the Fund had securities on loan, which were classified as corporate bonds in the Investment Portfolio. The value of the related collateral exceeded the value of the securities loaned at period end. As of period end, the remaining contractual maturity of the collateral agreements were overnight and continuous.
Taxes. The Fund’s policy is to comply with the requirements of the Internal Revenue Code, as amended, which are applicable to regulated investment companies and to distribute all of its taxable income to its shareholders.
At December 31, 2020, the Fund had a net tax basis capital loss carryforward of approximately $7,538,000, which may be applied against realized net taxable capital gains indefinitely, including short-term losses ($1,009,000) and long-term losses ($6,529,000).
The Fund has reviewed the tax positions for the open tax years as of December 31, 2020 and has determined that no provision for income tax and/or uncertain tax positions is required in the Fund’s financial statements. The Fund’s federal tax returns for the prior three fiscal years remain open subject to examination by the Internal Revenue Service.
| | | | |
Deutsche DWS Variable Series II — DWS High Income VIP | | | | | 19 |
Distribution of Income and Gains. Distributions from net investment income of the Fund, if any, are declared and distributed to shareholders annually. Net realized gains from investment transactions, in excess of available capital loss carryforwards, would be taxable to the Fund if not distributed and, therefore, will be distributed to shareholders at least annually. The Fund may also make additional distributions for tax purposes if necessary.
The timing and characterization of certain income and capital gain distributions are determined annually in accordance with federal tax regulations, which may differ from accounting principles generally accepted in the United States of America. These differences primarily relate to foreign denominated investments. As a result, net investment income (loss) and net realized gain (loss) on investment transactions for a reporting period may differ significantly from distributions during such period. Accordingly, the Fund may periodically make reclassifications among certain of its capital accounts without impacting the net asset value of the Fund.
At December 31, 2020, the Fund’s components of distributable earnings on a tax basis were as follows:
| | | | |
| Undistributed ordinary income* | | $ | 2,428,599 | |
| Capital loss carryforwards | | $ | (7,538,000 | ) |
| Net unrealized appreciation (depreciation) on investments | | $ | 3,026,544 | |
At December 31, 2020, the aggregate cost of investments for federal income tax purposes was $51,337,506. The net unrealized appreciation for all investments based on tax cost was $3,026,544. This consisted of aggregate gross unrealized appreciation for all investments for which there was an excess of value over tax cost of $3,262,983 and aggregate gross unrealized depreciation for all investments for which there was an excess of tax cost over value of $236,439.
In addition, the tax character of distributions paid by the Fund is summarized as follows:
| | | | | | | | |
| | | Years Ended December 31, | |
| | | 2020 | | | 2019 | |
| Distributions from ordinary income* | | $ | 2,881,180 | | | $ | 3,185,534 | |
| * | For tax purposes, short-term capital gain distributions are considered ordinary income distributions. |
Expenses. Expenses of the Trust arising in connection with a specific fund are allocated to that fund. Other Trust expenses which cannot be directly attributed to a fund are apportioned among the funds in the Trust based upon the relative net assets or other appropriate measures.
Contingencies. In the normal course of business, the Fund may enter into contracts with service providers that contain general indemnification clauses. The Fund’s maximum exposure under these arrangements is unknown, as this would involve future claims that may be made against the Fund that have not yet been made. However, based on experience, the Fund expects the risk of loss to be remote.
Other. Investment transactions are accounted for on a trade date plus one basis for daily net asset value calculations. However, for financial reporting purposes, investment transactions are reported on trade date. Interest income is recorded on the accrual basis. Dividend income is recorded on ex-dividend date. Realized gains and losses from investment transactions are recorded on an identified cost basis. Proceeds from litigation payments, if any, are included in net realized gain (loss) from investments. All discounts and premiums are accreted/amortized for both tax and financial reporting purposes for the Fund, with the exception of securities in default of principal.
B. Derivative Instruments
Forward Foreign Currency Exchange Contracts. A forward foreign currency exchange contract (“forward currency contract”) is a commitment to purchase or sell a foreign currency at the settlement date at a negotiated rate. For the year ended December 31, 2020, the Fund entered into forward currency contracts in order to hedge its exposure to changes in foreign currency exchange rates on its foreign currency denominated portfolio holdings and to facilitate transactions in foreign currency denominated securities.
Forward currency contracts are valued at the prevailing forward exchange rate of the underlying currencies and unrealized gain (loss) is recorded daily. On the settlement date of the forward currency contract, the Fund records a realized gain or loss equal to the difference between the value of the contract at the time it was opened and the value of the contract at the time it was closed. Certain risks may arise upon entering into forward currency contracts from the potential inability of counterparties to meet the terms of their
| | | | | | |
| | 20 | | | | | | Deutsche DWS Variable Series II — DWS High Income VIP |
contracts. The maximum counterparty credit risk to the Fund is measured by the unrealized gain on appreciated contracts. Additionally, when utilizing forward currency contracts to hedge, the Fund gives up the opportunity to profit from favorable exchange rate movements during the term of the contract.
A summary of the open forward currency contracts as of December 31, 2020 is included in a table following the Fund’s Investment Portfolio. For the year ended December 31, 2020, the investment in forward currency contracts short vs. U.S. dollars had a total contract value generally indicative of a range from approximately $880,000 to $1,866,000, and the investment in forward currency contracts long vs. U.S. dollars had a total contract value generally indicative of a range from $0 to approximately $142,000.
The following table summarizes the value of the Fund’s derivative instruments held as of December 31, 2020 and the related location in the accompanying Statement of Assets and Liabilities, presented by primary underlying risk exposure:
| | | | |
| Asset Derivative | | Forward
Contract | |
| Foreign Exchange contracts (a) | | $ | 223 | |
The above derivative is located in the following Statement of Assets and Liabilities account:
| (a) | Unrealized appreciation on forward foreign currency contracts. |
Additionally, the amount of unrealized and realized gains and losses on derivative instruments recognized in Fund earnings during the year ended December 31, 2020 and the related location in the accompanying Statement of Operations is summarized in the following tables by primary underlying risk exposure:
| | | | |
| Realized Gain (Loss) | | Forward
Contract | |
| Foreign Exchange Contracts (b) | | $ | (216,701 | ) |
The above derivative is located in the following Statement of Operations accounts:
| (b) | Net realized gain (loss) from forward foreign currency contracts |
| | | | |
| Change in Net Unrealized Appreciation (Depreciation) | | Forward
Contract | |
| Foreign Exchange contracts (c) | | $ | 9,850 | |
The above derivative is located in the following Statement of Operations accounts:
| (c) | Change in net unrealized appreciation (depreciation) on forward foreign currency contracts |
As of December 31, 2020, the Fund has transactions subject to enforceable master netting agreements which govern the terms of certain transactions, and reduce the counterparty risk associated with such transactions. Master netting agreements allow a Fund to close out and net total exposure to a counterparty in the event of a deterioration in the credit quality or contractual default with respect to all of the transactions with a counterparty. As defined by the master netting agreement, the Fund may have collateral agreements with certain counterparties to mitigate risk. For financial reporting purposes the Statement of Assets and Liabilities generally shows derivatives assets and liabilities on a gross basis, which reflects the full risks and exposures prior to netting. A reconciliation of the gross amounts on the Statement of Assets and Liabilities to the net amounts by a counterparty, including any collateral exposure, is included in the following table:
| | | | | | | | | | | | | | | | |
| Counterparty | | Gross Amounts
of Assets
Presented in the
Statement of
Assets and
Liabilities | | | Financial
Instruments
and
Derivatives
Available
for Offset | | | Collateral
Received | | | Net Amount of
Derivative
Assets | |
| BNP Paribas SA | | $ | 223 | | | $ | — | | | $ | — | | | $ | 223 | |
C. Purchases and Sales of Securities
During the year ended December 31, 2020, purchases and sales of investment transactions (excluding short-term investments and U.S. Treasury securities) aggregated $47,976,841 and $48,794,547, respectively.
D. Related Parties
Management Agreement. Under the Investment Management Agreement with DWS Investment Management Americas, Inc. (“DIMA” or the “Advisor”), an indirect, wholly owned subsidiary of DWS Group GmbH & Co. KGaA (“DWS Group”), the Advisor directs the investments of the Fund in accordance with its investment objectives, policies and restrictions. The Advisor determines the securities, instruments and other contracts relating to investments to be purchased, sold or entered into by the Fund.
| | | | |
Deutsche DWS Variable Series II — DWS High Income VIP | | | | | 21 |
Under the Investment Management Agreement with the Advisor, the Fund pays a monthly management fee based on the Fund’s average daily net assets, computed and accrued daily and payable monthly, at the following annual rates:
| | | | |
| First $250 million | | | .500 | % |
| Next $750 million | | | .470 | % |
| Next $1.5 billion | | | .450 | % |
| Next $2.5 billion | | | .430 | % |
| Next $2.5 billion | | | .400 | % |
| Next $2.5 billion | | | .380 | % |
| Next $2.5 billion | | | .360 | % |
| Over $12.5 billion | | | .340 | % |
Accordingly, for the year ended December 31, 2020, the fee pursuant to the Investment Management Agreement was equivalent to an annual rate (exclusive of any applicable waivers/reimbursements) of 0.50% of the Fund’s average daily net assets.
For the period from January 1, 2020 through April 30, 2020, the Advisor had contractually agreed to waive all or a portion of its fees and/or reimburse certain operating expenses of the Fund to the extent necessary to maintain the total annual operating expenses (excluding certain expenses such as extraordinary expenses, taxes, brokerage and interest expense) of each class as follows:
| | | | |
| Class A | | | .68 | % |
| Class B | | | .94 | % |
Effective May 1, 2020 through September 30, 2021 (through April 30, 2021 for Class B shares), the Advisor has contractually agreed to waive all or a portion of its fees and/or reimburse certain operating expenses of the Fund to the extent necessary to maintain the total annual operating expenses (excluding certain expenses such as extraordinary expenses, taxes, brokerage and interest expense) of each class as follows:
| | | | |
| Class A | | | .71 | % |
| Class B | | | 1.10 | % |
For the year ended December 31, 2020, fees waived and/or expenses reimbursed for each class were as follows:
| | | | |
| Class A | | $ | 87,938 | |
| Class B | | | 380 | |
| | | $ | 88,318 | |
Administration Fee. Pursuant to an Administrative Services Agreement, DIMA provides most administrative services to the Fund. Prior to March 1, 2020, for all services provided under the Administrative Services Agreement, the Fund paid the Advisor an annual fee (“Administration Fee”) of 0.10% of the Fund’s average daily net assets, computed and accrued daily and payable monthly. Effective March 1, 2020, for all services provided under the Administrative Services Agreement, the Fund pays the Advisor an annual Administration Fee of 0.097% of the Fund’s average daily net assets, computed and accrued daily and payable monthly. For the year ended December 31, 2020, the Administration Fee was $50,888, of which $4,426 is unpaid.
Service Provider Fees. DWS Service Company (“DSC”), an affiliate of the Advisor, is the transfer agent, dividend-paying agent and shareholder service agent for the Fund. Pursuant to a sub-transfer agency agreement between DSC and DST Systems, Inc. (“DST”), DSC has delegated certain transfer agent, dividend-paying agent and shareholder service agent functions to DST. DSC compensates DST out of the shareholder servicing fee it receives from the Fund. For the year ended December 31, 2020, the amounts charged to the Fund by DSC were as follows:
| | | | | | | | |
| Services to Shareholders | | Total
Aggregated | | | Unpaid at
December 31, 2020 | |
| Class A | | $ | 285 | | | $ | 53 | |
| Class B | | | 58 | | | | 11 | |
| | | $ | 343 | | | $ | 64 | |
| | | | | | |
| | 22 | | | | | | Deutsche DWS Variable Series II — DWS High Income VIP |
Distribution Service Agreement. Under the Fund’s Class B 12b-1 plan, DWS Distributors, Inc. (“DDI”) received a fee (“Distribution Service Fee”) of up to 0.25% of the average daily net assets of Class B shares. For the year ended December 31, 2020, the Distribution Service Fee was $371, of which $29 is unpaid.
Other Service Fees. Under an agreement with the Fund, DIMA is compensated for providing certain pre-press and regulatory filing services to the Fund. For the year ended December 31, 2020, the amount charged to the Fund by DIMA included in the Statement of Operations under “Reports to shareholders” aggregated $9,789, of which $4,164 is unpaid.
Trustees’ Fees and Expenses. The Fund paid retainer fees to each Trustee not affiliated with the Advisor, plus specified amounts to the Board Chairperson and to each committee Chairperson.
Affiliated Cash Management Vehicles. The Fund may invest uninvested cash balances in DWS Central Cash Management Government Fund and DWS ESG Liquidity Fund, affiliated money market funds which are managed by the Advisor. Each affiliated money market fund is managed in accordance with Rule 2a-7 under the 1940 Act, which governs the quality, maturity, diversity and liquidity of instruments in which a money market fund may invest. DWS Central Cash Management Government Fund seeks to maintain a stable net asset value, and DWS ESG Liquidity Fund maintains a floating net asset value. The Fund indirectly bears its proportionate share of the expenses of each affiliated money market fund in which it invests. DWS Central Cash Management Government Fund does not pay the Advisor an investment management fee. To the extent that DWS ESG Liquidity Fund pays an investment management fee to the Advisor, the Advisor will waive an amount of the investment management fee payable to the Advisor by the Fund equal to the amount of the investment management fee payable on the Fund’s assets invested in DWS ESG Liquidity Fund.
Security Lending Fees. Deutsche Bank AG serves as lending agent for the Fund. For the year ended December 31, 2020, the Fund incurred lending agent fees to Deutsche Bank AG for the amount of $137.
E. Investing in High-Yield Debt Securities
High-yield debt securities or junk bonds are generally regarded as speculative with respect to the issuer’s continuing ability to meet principal and interest payments. The Fund’s performance could be hurt if an issuer of a debt security suffers an adverse change in financial condition that results in the issuer not making timely payments of interest or principal, a security downgrade or an inability to meet a financial obligation. High-yield debt securities’ total return and yield may generally be expected to fluctuate more than the total return and yield of investment-grade debt securities. A real or perceived economic downturn or an increase in market interest rates could cause a decline in the value of high-yield debt securities, result in increased redemptions and/or result in increased portfolio turnover, which could result in a decline in net asset value of the fund, reduce liquidity for certain investments and/or increase costs. High-yield debt securities are often thinly traded and can be more difficult to sell and value accurately than investment-grade debt securities as there may be no established secondary market. Investments in high yield debt securities could increase liquidity risk for the fund. In addition, the market for high-yield debt securities can experience sudden and sharp volatility which is generally associated more with investments in stocks.
F. Ownership of the Fund
At December 31, 2020, two participating insurance companies were owners of record of 10% or more of the total outstanding Class A shares of the Fund, each owning 69% and 21%. One participating insurance company was owner of record of 10% or more of the total outstanding Class B shares of the Fund, owning 81%.
G. Line of Credit
The Fund and other affiliated funds (the “Participants”) share in a $350 million revolving credit facility provided by a syndication of banks. The Fund may borrow for temporary or emergency purposes, including the meeting of redemption requests that otherwise might require the untimely disposition of securities. The Participants are charged an annual commitment fee, which is allocated based on net assets, among each of the Participants. Interest is calculated at a rate per annum equal to the sum of the Federal Funds Rate plus 1.25 percent plus if the one-month LIBOR exceeds the Federal Funds Rate, the amount of such excess. The Fund may borrow up to a maximum of 33 percent of its net assets under the agreement. The Fund had no outstanding loans at December 31, 2020.
| | | | |
Deutsche DWS Variable Series II — DWS High Income VIP | | | | | 23 |
H. Other — COVID-19 Pandemic
A novel coronavirus known as COVID-19, declared a pandemic by the World Health Organization, has caused significant uncertainty, market volatility, decreased economic and other activity and increased government activity. Specifically, COVID-19 has led to significant death and morbidity, and concerns about its further spread have resulted in the closing of schools and non-essential businesses, cancellations, shelter-in place orders, lower consumer spending in certain sectors, social distancing, bans on large social gatherings and travel, quarantines, government economic stimulus measures, reduced productivity, rapid increases in unemployment, increased demand for and strain on government and medical resources, border closings and global trade and supply chain interruptions, among others. The full effects, duration and costs of the COVID-19 pandemic are impossible to predict, and the circumstances surrounding the COVID-19 pandemic will continue to evolve. The pandemic may affect certain countries, industries, economic sectors, companies and investment products more than others, may exacerbate existing economic, political, or social tensions and may increase the probability of an economic recession or depression. The Fund and its investments may be adversely affected by the effects of the COVID-19 pandemic, and a prolonged pandemic may result in the Fund and its service providers experiencing operational difficulties in coordinating a remote workforce and implementing their business continuity plans, among others. Management will continue to monitor the impact COVID-19 has on the Fund and reflect the consequences as appropriate in the Fund’s accounting and financial reporting.
| | | | | | |
| | 24 | | | | | | Deutsche DWS Variable Series II — DWS High Income VIP |
Report of Independent Registered Public Accounting Firm
To the Board of Trustees of Deutsche DWS Variable Series II and Shareholders of DWS High Income VIP:
Opinion on the Financial Statements
We have audited the accompanying statement of assets and liabilities of DWS High Income VIP (the “Fund”) (one of the funds constituting Deutsche DWS Variable Series II) (the “Trust”), including the investment portfolio, as of December 31, 2020, and the related statement of operations for the year then ended, the statements of changes in net assets for each of the two years in the period then ended, the financial highlights for each of the five years in the period then ended and the related notes (collectively referred to as the “financial statements”). In our opinion, the financial statements present fairly, in all material respects, the financial position of the Fund (one of the funds constituting Deutsche DWS Variable Series II) at December 31, 2020, the results of its operations for the year then ended, the changes in its net assets for each of the two years in the period then ended and its financial highlights for each of the five years in the period then ended, in conformity with U.S. generally accepted accounting principles.
Basis for Opinion
These financial statements are the responsibility of the Trust’s management. Our responsibility is to express an opinion on the Fund’s financial statements based on our audits. We are a public accounting firm registered with the Public Company Accounting Oversight Board (United States) (“PCAOB”) and are required to be independent with respect to the Trust in accordance with the U.S. federal securities laws and the applicable rules and regulations of the Securities and Exchange Commission and the PCAOB.
We conducted our audits in accordance with the standards of the PCAOB. Those standards require that we plan and perform the audit to obtain reasonable assurance about whether the financial statements are free of material misstatement, whether due to error or fraud. The Trust is not required to have, nor were we engaged to perform, an audit of the Trust’s internal control over financial reporting. As part of our audits, we are required to obtain an understanding of internal control over financial reporting, but not for the purpose of expressing an opinion on the effectiveness of the Trust’s internal control over financial reporting. Accordingly, we express no such opinion.
Our audits included performing procedures to assess the risks of material misstatement of the financial statements, whether due to error or fraud, and performing procedures that respond to those risks. Such procedures included examining, on a test basis, evidence regarding the amounts and disclosures in the financial statements. Our procedures included confirmation of securities owned as of December 31, 2020, by correspondence with the custodian and others or by other appropriate auditing procedures where replies from others were not received. Our audits also included evaluating the accounting principles used and significant estimates made by management, as well as evaluating the overall presentation of the financial statements. We believe that our audits provide a reasonable basis for our opinion.

We have served as the auditor of one or more investment companies in the DWS family of funds since at least 1979, but we are unable to determine the specific year.
Boston, Massachusetts
February 12, 2021
| | | | |
Deutsche DWS Variable Series II — DWS High Income VIP | | | | | 25 |
| | |
| Information About Your Fund’s Expenses | | (Unaudited) |
As an investor of the Fund, you incur two types of costs: ongoing expenses and transaction costs. Ongoing expenses include management fees, distribution and service (12b-1) fees and other Fund expenses. Examples of transaction costs include contract charges, which are not shown in this section. The following tables are intended to help you understand your ongoing expenses (in dollars) of investing in the Fund and to help you compare these expenses with the ongoing expenses of investing in other mutual funds. In the most recent six-month period, the Fund limited these expenses; had it not done so, expenses would have been higher. The example in the table is based on an investment of $1,000 invested at the beginning of the six-month period and held for the entire period (July 1, 2020 to December 31, 2020).
The tables illustrate your Fund’s expenses in two ways:
| – | Actual Fund Return. This helps you estimate the actual dollar amount of ongoing expenses (but not transaction costs) paid on a $1,000 investment in the Fund using the Fund’s actual return during the period. To estimate the expenses you paid over the period, simply divide your account value by $1,000 (for example, an $8,600 account value divided by $1,000 = 8.6), then multiply the result by the number in the “Expenses Paid per $1,000” line under the share class you hold. |
| – | Hypothetical 5% Fund Return. This helps you to compare your Fund’s ongoing expenses (but not transaction costs) with those of other mutual funds using the Fund’s actual expense ratio and a hypothetical rate of return of 5% per year before expenses. Examples using a 5% hypothetical Fund return may be found in the shareholder reports of other mutual funds. The hypothetical account values and expenses may not be used to estimate the actual ending account balance or expenses you paid for the period. |
Please note that the expenses shown in these tables are meant to highlight your ongoing expenses only and do not reflect any transaction costs. The “Expenses Paid per $1,000” line of the tables is useful in comparing ongoing expenses only and will not help you determine the relative total expense of owning different funds. If these transaction costs had been included, your costs would have been higher.
| | | | | | | | |
| Expenses and Value of a $1,000 Investment for the six months ended December 31, 2020 | |
| | |
| Actual Fund Return | | Class A | | | Class B | |
| Beginning Account Value 7/1/20 | | $ | 1,000.00 | | | $ | 1,000.00 | |
| Ending Account Value 12/31/20 | | $ | 1,106.60 | | | $ | 1,102.50 | |
| Expenses Paid per $1,000* | | $ | 3.76 | | | $ | 5.81 | |
| | |
| Hypothetical 5% Fund Return | | Class A | | | Class B | |
| Beginning Account Value 7/1/20 | | $ | 1,000.00 | | | $ | 1,000.00 | |
| Ending Account Value 12/31/20 | | $ | 1,021.57 | | | $ | 1,019.61 | |
| Expenses Paid per $1,000* | | $ | 3.61 | | | $ | 5.58 | |
| * | Expenses are equal to the Fund’s annualized expense ratio for each share class, multiplied by the average account value over the period, multiplied by 184 (the number of days in the most recent six-month period), then divided by 366. |
| | | | | | | | |
| Annualized Expense Ratios | | Class A | | | Class B | |
| Deutsche DWS Variable Series II — DWS High Income VIP | | | .71 | % | | | 1.10 | % |
For more information, please refer to the Fund’s prospectus.
These tables do not reflect charges and fees (“contract charges”) associated with the separate account that invests in the Fund or any variable life insurance policy or variable annuity contract for which the Fund is an investment option.
For an analysis of the fees associated with an investment in the Fund or similar funds, please refer to the current and hypothetical expense calculators for Variable Insurance Products which can be found at dws.com/calculators.
| | | | | | |
| | 26 | | | | | | Deutsche DWS Variable Series II — DWS High Income VIP |
| | |
| Tax Information | | (Unaudited) |
Please consult a tax advisor if you have questions about federal or state income tax laws, or on how to prepare your tax returns. If you have specific questions about your account, please contact your insurance provider.
The Trust’s policies and procedures for voting proxies for portfolio securities and information about how the Trust voted proxies related to its portfolio securities during the most recent 12-month period ended June 30 are available on our Web site — dws.com/en-us/resources/proxy-voting — or on the SEC’s Web site — sec.gov. To obtain a written copy of the Trust’s policies and procedures without charge, upon request, call us toll free at (800) 728-3337.
| | | | |
Deutsche DWS Variable Series II — DWS High Income VIP | | | | | 27 |
Advisory Agreement Board Considerations and Fee Evaluation
The Board of Trustees (hereinafter referred to as the “Board” or “Trustees”) approved the renewal of DWS High Income VIP’s (the “Fund”) investment management agreement (the “Agreement”) with DWS Investment Management Americas, Inc. (“DIMA”) in September 2020.
In terms of the process that the Board followed prior to approving the Agreement, shareholders should know that:
| – | | During the entire process, all of the Fund’s Trustees were independent of DIMA and its affiliates (the “Independent Trustees”). |
| – | | The Board met frequently during the past year to discuss fund matters and dedicated a substantial amount of time to contract review matters. Over the course of several months, the Board reviewed extensive materials received from DIMA, independent third parties and independent counsel. These materials included an analysis of the Fund’s performance, fees and expenses, and profitability from a fee consultant retained by the Fund’s Independent Trustees (the “Fee Consultant”). |
| – | | The Board also received extensive information throughout the year regarding performance of the Fund. |
| – | | The Independent Trustees regularly met privately with counsel to discuss contract review and other matters. In addition, the Independent Trustees were advised by the Fee Consultant in the course of their review of the Fund’s contractual arrangements and considered a comprehensive report prepared by the Fee Consultant in connection with their deliberations. |
| – | | In connection with reviewing the Agreement, the Board also reviewed the terms of the Fund’s Rule 12b-1 plan, distribution agreement, administrative services agreement, transfer agency agreement and other material service agreements. |
In connection with the contract review process, the Board considered the factors discussed below, among others. The Board also considered that DIMA and its predecessors have managed the Fund since its inception, and the Board believes that a long-term relationship with a capable, conscientious advisor is in the best interests of the Fund. The Board considered, generally, that shareholders chose to invest or remain invested in the Fund knowing that DIMA managed the Fund. DIMA is part of DWS Group GmbH & Co. KGaA (“DWS Group”). DWS Group is a global asset management business that offers a wide range of investing expertise and resources, including research capabilities in many countries throughout the world. In 2018, approximately 20% of DWS Group’s shares were sold in an initial public offering, with Deutsche Bank AG owning the remaining shares.
As part of the contract review process, the Board carefully considered the fees and expenses of each DWS fund overseen by the Board in light of the fund’s performance. In many cases, this led to the negotiation and implementation of expense caps.
While shareholders may focus primarily on fund performance and fees, the Fund’s Board considers these and many other factors, including the quality and integrity of DIMA’s personnel and administrative support services provided by DIMA, such as back-office operations, fund valuations, and compliance policies and procedures.
Nature, Quality and Extent of Services. The Board considered the terms of the Agreement, including the scope of advisory services provided under the Agreement. The Board noted that, under the Agreement, DIMA provides portfolio management services to the Fund and that, pursuant to a separate administrative services agreement, DIMA provides administrative services to the Fund. The Board considered the experience and skills of senior management and investment personnel and the resources made available to such personnel. The Board also considered the risks to DIMA in sponsoring or managing the Fund, including financial, operational and reputational risks, the potential impact to DIMA from such risks and DIMA’s approach to addressing such risks. The Board reviewed the Fund’s performance over short-term and long-term periods and compared those returns to various agreed-upon performance measures, including market index(es) and a peer universe compiled using information supplied by Morningstar Direct (“Morningstar”), an independent fund data service. The Board also noted that it has put into place a process of identifying “Funds in Review” (e.g., funds performing poorly relative to a peer universe), and receives additional reporting from DIMA regarding such funds and, where appropriate, DIMA’s plans to address underperformance. The Board believes this process is an effective manner of identifying and addressing underperforming funds. Based on the information provided, the Board noted that, for the one-, three- and five-year periods ended December 31, 2019, the Fund’s performance (Class A shares) was in the 1st quartile, 1st quartile and
| | | | | | |
| | 28 | | | | | | Deutsche DWS Variable Series II — DWS High Income VIP |
3rd quartile, respectively, of the applicable Morningstar universe (the 1st quartile being the best performers and the 4th quartile being the worst performers). The Board also observed that the Fund has outperformed its benchmark in the one- and three-year periods and has underperformed its benchmark in the five-year period ended December 31, 2019.
Fees and Expenses. The Board considered the Fund’s investment management fee schedule, operating expenses and total expense ratios, and comparative information provided by Broadridge Financial Solutions, Inc. (“Broadridge”) and the Fee Consultant regarding investment management fee rates paid to other investment advisors by similar funds (1st quartile being the most favorable and 4th quartile being the least favorable). With respect to management fees paid to other investment advisors by similar funds, the Board noted that the contractual fee rates paid by the Fund, which include a 0.10% fee paid to DIMA under the Fund’s administrative services agreement, were lower than the median (1st quartile) of the applicable Broadridge peer group (based on Broadridge data provided as of December 31, 2019). The Board noted that, effective March 1, 2020, the fee paid to DIMA under the Fund’s administrative services agreement was reduced to 0.097%. The Board noted that the Fund’s Class A shares total (net) operating expenses were expected to be higher than the median (3rd quartile) of the applicable Broadridge expense universe (based on Broadridge data provided as of December 31, 2019, and analyzing Broadridge expense universe Class A (net) expenses less any applicable 12b-1 fees) (“Broadridge Universe Expenses”). The Board also reviewed data comparing each other operational share class’s total (net) operating expenses to the applicable Broadridge Universe Expenses. The Board noted that the expense limitations agreed to by DIMA were expected to help the Fund’s total (net) operating expenses remain competitive. The Board considered the Fund’s management fee rate as compared to fees charged by DIMA to comparable DWS U.S. registered funds (“DWS Funds”) and considered differences between the Fund and the comparable DWS Funds. The information requested by the Board as part of its review of fees and expenses also included information about institutional accounts (including any sub-advised funds and accounts) and funds offered primarily to European investors (“DWS Europe Funds”) managed by DWS Group. The Board noted that DIMA indicated that DWS Group does not manage any institutional accounts or DWS Europe Funds comparable to the Fund.
On the basis of the information provided, the Board concluded that management fees were reasonable and appropriate in light of the nature, quality and extent of services provided by DIMA.
Profitability. The Board reviewed detailed information regarding revenues received by DIMA under the Agreement. The Board considered the estimated costs to DIMA, and pre-tax profits realized by DIMA, from advising the DWS Funds, as well as estimates of the pre-tax profits attributable to managing the Fund in particular. The Board also received information regarding the estimated enterprise-wide profitability of DIMA and its affiliates with respect to all fund services in totality and by fund. The Board and the Fee Consultant reviewed DIMA’s methodology in allocating its costs to the management of the Fund. Based on the information provided, the Board concluded that the pre-tax profits realized by DIMA in connection with the management of the Fund were not unreasonable. The Board also reviewed certain publicly available information regarding the profitability of certain similar investment management firms. The Board noted that, while information regarding the profitability of such firms is limited (and in some cases is not necessarily prepared on a comparable basis), DIMA and its affiliates’ overall profitability with respect to the DWS Funds (after taking into account distribution and other services provided to the funds by DIMA and its affiliates) was lower than the overall profitability levels of most comparable firms for which such data was available.
Economies of Scale. The Board considered whether there are economies of scale with respect to the management of the Fund and whether the Fund benefits from any economies of scale. The Board noted that the Fund’s investment management fee schedule includes fee breakpoints. The Board concluded that the Fund’s fee schedule represents an appropriate sharing between the Fund and DIMA of such economies of scale as may exist in the management of the Fund at current asset levels.
Other Benefits to DIMA and Its Affiliates. The Board also considered the character and amount of other incidental or “fall-out” benefits received by DIMA and its affiliates, including any fees received by DIMA for administrative services provided to the Fund, any fees received by an affiliate of DIMA for transfer agency services provided to the Fund and any fees received by an affiliate of DIMA for distribution services. The Board also considered benefits to DIMA related to brokerage and soft-dollar allocations, including allocating brokerage to pay for research generated by parties other than the executing broker dealers, which pertain primarily to funds investing in equity securities. In addition, the Board considered the incidental public relations benefits to DIMA related to DWS Funds advertising and cross-selling opportunities among DIMA products and services. The Board considered these benefits in reaching its conclusion that the Fund’s management fees were reasonable.
| | | | |
Deutsche DWS Variable Series II — DWS High Income VIP | | | | | 29 |
Compliance. The Board considered the significant attention and resources dedicated by DIMA to its compliance processes in recent years. The Board noted in particular (i) the experience, seniority and time commitment of the individuals serving as DIMA’s and the Fund’s chief compliance officers and (ii) the substantial commitment of resources by DIMA and its affiliates to compliance matters, including the retention of compliance personnel.
The Board also considered that on September 24, 2020, the SEC granted a temporary order permitting DIMA and its affiliates to continue providing investment advisory and underwriting services to the DWS Funds notwithstanding a consent order entered into by Deutsche Bank AG on June 17, 2020 (the “Consent Order”). The Board noted that the temporary order was granted effective as of the date of the Consent Order. The Board also noted various representations by DIMA to the Board relating to the Consent Order, including that the conduct giving rise to the Consent Order (unintentional conduct that resulted from a system outage that prevented Deutsche Bank AG from reporting data in accordance with applicable CFTC requirements for five days in April 2016) did not involve any DWS Fund or services DIMA and its affiliates provide to the DWS Funds, that DIMA and its personnel had no involvement in the alleged conduct giving rise to the Consent Order, and that the DWS Funds would not bear any financial impact or costs relating to the Consent Order.
Based on all of the information considered and the conclusions reached, the Board determined that the continuation of the Agreement is in the best interests of the Fund. In making this determination, the Board did not give particular weight to any single factor identified above. The Board considered these factors over the course of numerous meetings, certain of which were in executive session with only the Independent Trustees and counsel present. It is possible that individual Independent Trustees may have weighed these factors differently in reaching their individual decisions to approve the continuation of the Agreement.
| | | | | | |
| | 30 | | | | | | Deutsche DWS Variable Series II — DWS High Income VIP |
Board Members and Officers
The following table presents certain information regarding the Board Members and Officers of the Trust/Corporation. Each Board Member’s year of birth is set forth in parentheses after his or her name. Unless otherwise noted, (i) each Board Member has engaged in the principal occupation(s) noted in the table for at least the most recent five years, although not necessarily in the same capacity; and (ii) the address of each Independent Board Member is Keith R. Fox, DWS Funds Board Chair, c/o Thomas R. Hiller, Ropes & Gray LLP, Prudential Tower, 800 Boylston Street, Boston, MA 02199-3600. Except as otherwise noted below, the term of office for each Board Member is until the election and qualification of a successor, or until such Board Member sooner dies, resigns, is removed or as otherwise provided in the governing documents of the Trust/Corporation. Because the Fund does not hold an annual meeting of shareholders, each Board Member will hold office for an indeterminate period.
The Board Members may also serve in similar capacities with other funds in the fund complex. The number of funds in the DWS fund complex shown in the table below includes all registered open- and closed-end funds (including all of their portfolios) advised by the Advisor and any registered funds that have an investment advisor that is an affiliated person of the Advisor.
| | | | | | | | |
| Independent Board Members | | | |
Name, Year of Birth,
Position with the Trust/
Corporation and
Length of Time Served1 | | Business Experience and Directorships During the Past Five Years | | Number of
Funds in
DWS Fund
Complex
Overseen | | | Other
Directorships
Held by Board
Member
|
Keith R. Fox, CFA (1954) Chairperson since 2017, and Board Member since 1996 | | Managing General Partner, Exeter Capital Partners (a series of private investment funds) (since 1986). Directorships: Progressive International Corporation (kitchen goods importer and distributor); former Chairman, National Association of Small Business Investment Companies; former Directorships: ICI Mutual Insurance Company; BoxTop Media Inc. (advertising); Sun Capital Advisers Trust (mutual funds) (2011–2012) | | | 73 | | | — |
John W. Ballantine (1946) Board Member since 1999 | | Retired; formerly, Executive Vice President and Chief Risk Management Officer, First Chicago NBD Corporation/The First National Bank of Chicago (1996–1998); Executive Vice President and Head of International Banking (1995–1996); former Directorships: Director and Chairman of the Board, Healthways, Inc.2 (population well-being and wellness services) (2003–2014); Stockwell Capital Investments PLC (private equity); Enron Corporation; FNB Corporation; Tokheim Corporation; First Oak Brook Bancshares, Inc.; Oak Brook Bank; and Prisma Energy International. Not-for-Profit Director/Trustee: Palm Beach Civic Association; Window to the World Communications (public media); Life Director of Harris Theater for Music and Dance (Chicago); Life Director of Hubbard Street Dance Chicago; former Not-for-Profit Directorships: Public Radio International | | | 73 | | | Portland
General
Electric2
(utility
company)
(2003–
present) |
Dawn-Marie Driscoll (1946) Board Member since 1987 | | Emeritus Executive Fellow, Center for Business Ethics, Bentley University; formerly: Partner, Palmer & Dodge (law firm) (1988–1990); Vice President of Corporate Affairs and General Counsel, Filene’s (retail) (1978–1988). Directorships: Advisory Board, Center for Business Ethics, Bentley University; Trustee and former Chairman of the Board, Southwest Florida Community Foundation (charitable organization); former Directorships: ICI Mutual Insurance Company (2007–2015); Sun Capital Advisers Trust (mutual funds) (2007–2012), Investment Company Institute (audit, executive, nominating committees) and Independent Directors Council (governance, executive committees) | | | 73 | | | — |
Richard J. Herring (1946) Board Member since 1990 | | Jacob Safra Professor of International Banking and Professor of Finance, The Wharton School, University of Pennsylvania (since July 1972); Director, The Wharton Financial Institutions Center (since 1994); formerly: Vice Dean and Director, Wharton Undergraduate Division (1995–2000) and Director, The Lauder Institute of International Management Studies (2000–2006); Member FDIC Systemic Risk Advisory Committee since 2011, member Systemic Risk Council since 2012 and member of the Advisory Board at the Yale Program on Financial Stability since 2013; Formerly Co-Chair of the Shadow Financial Regulatory Committee (2003–2015), Executive Director of The Financial Economists Roundtable (2008–2015), Director of The Thai Capital Fund (2007–2013), Director of The Aberdeen Singapore Fund (2007–2018), and Nonexecutive Director of Barclays Bank DE (2010–2018) | | | 73 | | | Director,
Aberdeen
Japan Fund
(since 2007) |
William McClayton (1944) Board Member since 2004 | | Private equity investor (since October 2009); previously, Managing Director, Diamond Management & Technology Consultants, Inc. (global consulting firm) (2001–2009); Directorship: Board of Managers, YMCA of Metropolitan Chicago; formerly: Senior Partner, Arthur Andersen LLP (accounting) (1966–2001); Trustee, Ravinia Festival | | | 73 | | | — |
| | | | |
Deutsche DWS Variable Series II — DWS High Income VIP | | | | | 31 |
| | | | | | | | |
Name, Year of Birth,
Position with the Trust/
Corporation and
Length of Time Served1 | | Business Experience and Directorships During the Past Five Years | | Number of
Funds in
DWS Fund
Complex
Overseen | | | Other
Directorships
Held by Board
Member
|
Rebecca W. Rimel (1951) Board Member since 1995 | | Senior Advisor, The Pew Charitable Trusts (charitable organization) (since July 2020); formerly: Executive Vice President, The Glenmede Trust Company (investment trust and wealth management) (1983–2004); Board Member, Investor Education (charitable organization) (2004–2005); Trustee, Executive Committee, Philadelphia Chamber of Commerce (2001–2007); Director, Viasys Health Care2 (January 2007–June 2007); Trustee, Thomas Jefferson Foundation (charitable organization) (1994–2012); President, Chief Executive Officer and Director, The Pew Charitable Trusts (charitable organization) (1994–2020) | | | 73 | | | Director,
Becton
Dickinson
and
Company2
(medical
technology
company)
(2012–
present);
Director,
BioTelemetry
Inc.2 (health
care) (2009–
present) |
William N. Searcy, Jr. (1946) Board Member since 1993 | | Private investor since October 2003; formerly: Pension & Savings Trust Officer, Sprint Corporation2 (telecommunications) (November 1989–September 2003); Trustee, Sun Capital Advisers Trust (mutual funds) (1998–2012) | | | 73 | | | — |
| | |
| Officers4 | | |
Name, Year of Birth,
Position with the Trust/
Corporation and
Length of Time Served5 | | Business Experience and Directorships During the Past Five Years |
Hepsen Uzcan6 (1974) President and Chief Executive Officer, 2017–present | | Managing Director3, DWS; Secretary, DWS USA Corporation (2018–present); Assistant Secretary, DWS Distributors, Inc. (2018–present); Director and Vice President, DWS Service Company (2018–present); Assistant Secretary, DWS Investment Management Americas, Inc. (2018–present); Director and President, DB Investment Managers, Inc. (2018–present); President and Chief Executive Officer, The European Equity Fund, Inc., The New Germany Fund, Inc. and The Central and Eastern Europe Fund, Inc. (2017–present); formerly: Vice President for the Deutsche funds (2016–2017); Assistant Secretary for the DWS funds (2013–2019); Assistant Secretary, The European Equity Fund, Inc., The New Germany Fund, Inc. and The Central and Eastern Europe Fund, Inc. (2013–2020); Directorships: Interested Director, The European Equity Fund, Inc., The New Germany Fund, Inc. and The Central and Eastern Europe Fund, Inc. (since June 25, 2020); ICI Mutual Insurance Company (since October 16, 2020); and Episcopalian Charities of New York (2018–present) |
John Millette7 (1962) Vice President and Secretary, 1999–present | | Director,3 DWS; Chief Legal Officer, DWS Investment Management Americas, Inc. (2015–present); Director and Vice President, DWS Trust Company (2016–present); Secretary, DBX ETF Trust (2020–present); Secretary, The European Equity Fund, Inc., The New Germany Fund, Inc. and The Central and Eastern Europe Fund, Inc. (2011–present); formerly: Secretary, Deutsche Investment Management Americas Inc. (2015–2017); Assistant Secretary, DBX ETF Trust (2019–2020); Assistant Secretary (July 14, 2006–December 31, 2010) and Secretary (January 31, 2006–July 13, 2006), The European Equity Fund, Inc., The New Germany Fund, Inc. and The Central and Eastern Europe Fund, Inc. |
Ciara Crawford8 (1984) Assistant Secretary, (2019–present) | | Associate, DWS (since 2015); previously, Legal Assistant at Accelerated Tax Solutions. |
Diane Kenneally7 (1966) Chief Financial Officer and Treasurer, 2018–present | | Director,3 DWS; Treasurer, Chief Financial Officer and Controller, DBX ETF Trust (2019–present); Treasurer and Chief Financial Officer, The European Equity Fund, Inc., The New Germany Fund, Inc. and The Central and Eastern Europe Fund, Inc. (2018–present); formerly: Assistant Treasurer for the DWS funds (2007–2018) |
Paul Antosca7 (1957) Assistant Treasurer, 2007–present | | Director,3 DWS; and Assistant Treasurer, DBX ETF Trust (2019–present) |
Sheila Cadogan7 (1966) Assistant Treasurer, 2017–present | | Director,3 DWS; Director and Vice President, DWS Trust Company (2018–present); Assistant Treasurer, DBX ETF Trust (2019–present); Assistant Treasurer, The European Equity Fund, Inc., The New Germany Fund, Inc. and The Central and Eastern Europe Fund, Inc. (2018–present) |
Scott D. Hogan7 (1970) Chief Compliance Officer, 2016–present | | Director,3 DWS; Chief Compliance Officer, The European Equity Fund, Inc., The New Germany Fund, Inc. and The Central and Eastern Europe Fund, Inc. (2016–present) |
Caroline Pearson7 (1962) Chief Legal Officer, 2010–present | | Managing Director3, DWS; Assistant Secretary, DBX ETF Trust (2020–present); Chief Legal Officer, DBX Advisors LLC and DBX Strategic Advisors LLC (2020–present); Chief Legal Officer, The European Equity Fund, Inc., The New Germany Fund, Inc. and The Central and Eastern Europe Fund, Inc. (2012–present); formerly: Secretary, Deutsche AM Distributors, Inc. (2002–2017); and Secretary, Deutsche AM Service Company (2010–2017) |
| | | | | | |
| | 32 | | | | | | Deutsche DWS Variable Series II — DWS High Income VIP |
| | |
Name, Year of Birth,
Position with the Trust/
Corporation and
Length of Time Served5 | | Business Experience and Directorships During the Past Five Years |
Michelle Goveia-Pine6 (1970) Interim Anti-Money Laundering Compliance Officer, since July 10, 2020 | | Director,3 DWS; Interim AML Officer, DWS Trust Company (since July 28, 2020); Interim AML Officer, DBX ETF Trust (since July 9, 2020); Interim AML Officer, The European Equity Fund, Inc., The New Germany Fund, Inc. and The Central and Eastern Europe Fund, Inc. (since July 24, 2020) |
| 1 | The length of time served represents the year in which the Board Member joined the board of one or more DWS funds currently overseen by the Board. |
| 2 | A publicly held company with securities registered pursuant to Section 12 of the Securities Exchange Act of 1934. |
| 3 | Executive title, not a board directorship. |
| 4 | As a result of their respective positions held with the Advisor or its affiliates, these individuals are considered “interested persons” of the Advisor within the meaning of the 1940 Act. Interested persons receive no compensation from the Fund. |
| 5 | The length of time served represents the year in which the officer was first elected in such capacity for one or more DWS funds. |
| 6 | Address: 875 Third Avenue, New York, NY 10022. |
| 7 | Address: 100 Summer Street, Boston, MA 02110. |
| 8 | Address: 5022 Gate Parkway, Suite 400, Jacksonville, FL 32256. |
The Fund’s Statement of Additional Information (“SAI”) includes additional information about the Board Members. The SAI is available, without charge, upon request. If you would like to request a copy of the SAI, you may do so by calling the following toll-free number: (800) 728-3337.
| | | | |
Deutsche DWS Variable Series II — DWS High Income VIP | | | | | 33 |
Notes
Notes
|
|
VS2HI-2 (R-025832-10 2/21) |
December 31, 2020
Annual Report
Deutsche DWS Variable Series II
DWS International Growth VIP

Contents
| | | | |
| | 3 | | | Performance Summary |
| | 4 | | | Management Summary |
| | 6 | | | Portfolio Summary |
| | 7 | | | Investment Portfolio |
| | 10 | | | Statement of Assets and Liabilities |
| | 10 | | | Statement of Operations |
| | 11 | | | Statements of Changes in Net Assets |
| | 12 | | | Financial Highlights |
| | 13 | | | Notes to Financial Statements |
| | 18 | | | Report of Independent Registered Public Accounting Firm |
| | 19 | | | Information About Your Fund’s Expenses |
| | 20 | | | Tax Information |
| | 20 | | | Proxy Voting |
| | 21 | | | Advisory Agreement Board Considerations and Fee Evaluation |
| | 24 | | | Board Members and Officers |
This report must be preceded or accompanied by a prospectus. To obtain an additional prospectus or summary prospectus, if available, call (800) 728-3337 or your financial representative. We advise you to consider the Fund’s objectives, risks, charges and expenses carefully before investing. The summary prospectus and prospectus contain this and other important information about the Fund. Please read the prospectus carefully before you invest.
Investing in foreign securities, particularly those of emerging markets, presents certain risks, such as currency fluctuations, political and economic changes, and market risks. Emerging markets tend to be more volatile and less liquid than the markets of more mature economies, and generally have less diverse and less mature economic structures and less stable political systems than those of developed countries. Stocks may decline in value. Smaller company stocks tend to be more volatile than medium-sized or large company stocks. The Fund may lend securities to approved institutions. Please read the prospectus for details.
War, terrorism, economic uncertainty, trade disputes, public health crises (including the recent pandemic spread of the novel coronavirus) and related geopolitical events could lead to increased market volatility, disruption to U.S. and world economies and markets and may have significant adverse effects on the Fund and its investments.
The brand DWS represents DWS Group GmbH & Co. KGaA and any of its subsidiaries such as DWS Distributors, Inc. which offers investment products or DWS Investment Management Americas, Inc. and RREEF America L.L.C. which offer advisory services.
DWS Distributors, Inc., 222 South Riverside Plaza, Chicago, IL 60606, (800) 621-1148
NOT FDIC/NCUA INSURED NO BANK GUARANTEE MAY LOSE VALUE NOT A DEPOSIT
NOT INSURED BY ANY FEDERAL GOVERNMENT AGENCY
| | | | | | |
| | 2 | | | | | | Deutsche DWS Variable Series II — DWS International Growth VIP |
| | |
| Performance Summary | | December 31, 2020 (Unaudited) |
Fund performance shown is historical, assumes reinvestment of all dividend and capital gain distributions and does not guarantee future results. Investment return and principal value fluctuate with changing market conditions so that, when redeemed, shares may be worth more or less than their original cost. Current performance may be lower or higher than the performance data quoted. Please contact your participating insurance company for the Fund’s most recent month-end performance. Performance does not reflect charges and fees (“contract charges”) associated with the separate account that invests in the Fund or any variable life insurance policy or variable annuity contract for which the Fund is an investment option. These charges and fees will reduce returns. While all share classes have the same underlying portfolio, their performance will differ.
The gross expense ratios of the Fund, as stated in the fee table of the prospectus dated May 1, 2020 are 1.64% and 1.95% for Class A and Class B shares, respectively, and may differ from the expense ratios disclosed in the Financial Highlights tables in this report.
Generally accepted accounting principles require adjustments to be made to the net assets of the Fund at period end for financial reporting purposes only, and as such, the total return based on the unadjusted net asset value per share may differ from the total return reported in the financial highlights.
Growth of an Assumed $10,000 Investment
| | |
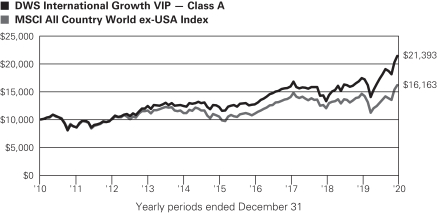
| | MSCI All Country World ex-USA Index is an unmanaged equity index which captures large and mid-capitalization representation across 22 of 23 developed markets countries excluding the U.S. and 26 emerging markets countries. It covers approximately 85% of the global equity opportunity set outside of the U.S. Index returns do not reflect any fees or expenses and it is not possible to invest directly into an index. Prior to October 1, 2017, the fund was named Deutsche Global Growth VIP and operated with a different investment strategy. Performance would have been different if the fund’s current investment strategy had been in effect. |
| | | | | | | | | | |
| Comparative Results | | | | | | | | |
| | | | | |
| DWS International Growth VIP | | | | 1-Year | | 3-Year | | 5-Year | | 10-Year |
| Class A | | Growth of $10,000 | | $12,269 | | $13,413 | | $17,454 | | $21,393 |
| | | Average annual total return | | 22.69% | | 10.28% | | 11.78% | | 7.90% |
MSCI All Country World
ex-USA Index | | Growth of $10,000 | | $11,065 | | $11,537 | | $15,334 | | $16,163 |
| | Average annual total return | | 10.65% | | 4.88% | | 8.93% | | 4.92% |
| | | | | |
| DWS International Growth VIP | | | | 1-Year | | 3-Year | | 5-Year | | 10-Year |
| Class B | | Growth of $10,000 | | $12,229 | | $13,293 | | $17,214 | | $20,731 |
| | | Average annual total return | | 22.29% | | 9.95% | | 11.47% | | 7.56% |
MSCI All Country World
ex-USA Index | | Growth of $10,000 | | $11,065 | | $11,537 | | $15,334 | | $16,163 |
| | Average annual total return | | 10.65% | | 4.88% | | 8.93% | | 4.92% |
The growth of $10,000 is cumulative.
| | | | |
Deutsche DWS Variable Series II — DWS International Growth VIP | | | | | 3 |
| | |
| Management Summary | | December 31, 2020 (Unaudited) |
The Fund’s Class A shares returned 22.69% in 2020 (unadjusted for contract charges), outperforming the 10.65% return of the MSCI All-Country World ex-USA Index by a comfortable margin. The Fund outpaced the index in the three-, five-, and 10-year periods that ended on December 31, 2020.
Our emphasis on growing, innovative companies was a key factor in the Fund’s strong showing in 2020. Growth stocks, in general, delivered returns that were well ahead of their value counterparts, creating a tailwind for our strategy relative to the blended benchmark. Our growth-oriented approach also led us to hold an underweight position in energy, the worst performer among the eleven major sectors, as well as an overweight in information technology, the top performer. Stock selection was also a sizable contributor, with the best results occurring in the health care, industrial, and financials sectors. The growth-oriented communication services and information technology sectors were additional areas of strength.
Lonza Group AG (Switzerland) was the leading contributor at the company level. The stock was boosted by robust demand in its core business and expectations that it will be a preferred manufacturer of COVID-19 vaccines and treatments. Farfetch Ltd. (United Kingdom), which operates a marketplace for luxury goods, was another top performer. The social media company Momo, Inc. (China) and the food-services provider Compass Group PLC (United Kingdom), both of which were adversely affected by the lockdowns, were the largest detractors.
Amid the elevated uncertainty associated with COVID-19, we remained guided by our longstanding approach of investing in high-quality, innovative businesses that we believe can grow irrespective of the macroeconomic environment. As part of this process, we added new holdings in stocks we viewed as being especially well suited to navigate the cross-currents resulting from the pandemic. For example, we established positions in the German health care companies Sartorius AG and Evotec SE. Both benefited from accelerating demand for their products and services, as well as increased funding for drug development related to the coronavirus and other conditions. We also added a position in Zur Rose Group AG (Switzerland), the operator of Germany’s leading online pharmacy. Later in the year, as the likelihood of a vaccine increased, we looked for secular growth stocks that stood to benefit from a reopening. Among these were Rentokil Initial PLC, a global business services company focused on hygiene, sanitation, and pest control, and the industrial semiconductor designer NXP Semiconductors NV (Netherlands). Conversely, we sold several holdings where the long-term outlook had deteriorated or where the positions had grown beyond their target portfolio weightings.
From a regional perspective, the Fund remained well diversified across Europe, China, Japan, Brazil, and North America. Although we emphasize the developed markets, we look for growth businesses in the emerging markets (as well as companies with a large portion of their revenues from this segment) on the belief that the category features attractive long-term growth prospects. At the sector level, the Fund was overweight in technology, health care, and industrials, and its largest underweights were in financials, utilities, energy, materials, and real estate. This positioning is the result of our bottom-up stock selection process, rather than a top-down view.
We continue to see opportunities in companies that are positioned for long-term, sustainable growth as they capitalize on dynamic and widening addressable markets. We are finding this to be the case not only in growth sectors, but also in more traditional businesses (such as those in the financials, insurance, education, and health care industries) that are quickly embracing new solutions to adapt to the disrupting forces. Many companies in these areas also stand to benefit from the falling costs and increasing productivity that technology-enabled innovation provides.
With visibility remaining clouded due to renewed lockdowns and surging coronavirus cases around the world, we believe it’s essential to calibrate the portfolio’s risk-reward characteristics carefully and ensure the appropriate level of diversification across industries, regions, and stages of the corporate life cycle.
| | | | | | |
| | 4 | | | | | | Deutsche DWS Variable Series II — DWS International Growth VIP |
Sebastian P. Werner, PhD, Director
Julia A. Merz, PhD, Assistant Vice President
Portfolio Managers
The views expressed reflect those of the portfolio management team only through the end of the period of the report as stated on the cover. The management team’s views are subject to change at any time based on market and other conditions and should not be construed as a recommendation. Past performance is no guarantee of future results. Current and future portfolio holdings are subject to risk.
Terms to Know
MSCI All Country World ex USA Index is an unmanaged equity index which captures large and mid-capitalization representation across 22 of 23 developed markets countries excluding the U.S. and 26 emerging markets countries. It covers approximately 85% of the global equity opportunity set outside of the U.S.
Overweight means the Fund holds a higher weighting in a given sector or security than the benchmark. Underweight means the Fund holds a lower weighting.
Stock selection refers to the performance of the fund’s holdings in a given sector relative to the sector as a whole.
Contributors and detractors incorporate both a stock’s return and its weight. If two stocks have the same return but one has a larger weighting in the Fund, it will have a larger contribution to return in the period.
| | | | |
Deutsche DWS Variable Series II — DWS International Growth VIP | | | | | 5 |
| | |
| Portfolio Summary | | (Unaudited) |
| | | | | | | | |
| Asset Allocation (As a % of Investment Portfolio excluding Securities Lending Collateral) | | 12/31/20 | | | 12/31/19 | |
Common Stocks | | | 96% | | | | 97% | |
Cash Equivalents | | | 2% | | | | 1% | |
Preferred Stocks | | | 1% | | | | 0% | |
Exchange-Traded Funds | | | 1% | | | | 2% | |
| | | | 100% | | | | 100% | |
| | |
Sector Diversification (As a % of Investment Portfolio excluding Exchange-Traded Funds, Securities Lending Collateral and
Cash Equivalents) | | 12/31/20 | | | 12/31/19 | |
| Information Technology | | | 24% | | | | 18% | |
| Health Care | | | 16% | | | | 15% | |
Industrials | | | 15% | | | | 15% | |
Financials | | | 13% | | | | 19% | |
| Consumer Discretionary | | | 13% | | | | 14% | |
| Consumer Staples | | | 7% | | | | 7% | |
| Communication Services | | | 6% | | | | 5% | |
| Materials | | | 5% | | | | 5% | |
| Energy | | | 1% | | | | 2% | |
| | | | 100% | | | | 100% | |
| | |
Geographical Diversification (As a % of Investment Portfolio excluding Securities Lending Collateral and Cash Equivalents) | | 12/31/20 | | | 12/31/19 | |
Germany | | | 15% | | | | 13% | |
France | | | 12% | | | | 13% | |
Japan | | | 10% | | | | 10% | |
Switzerland | | | 9% | | | | 9% | |
China | | | 8% | | | | 8% | |
United States | | | 8% | | | | 8% | |
Canada | | | 7% | | | | 9% | |
Netherlands | | | 6% | | | | 4% | |
United Kingdom | | | 4% | | | | 4% | |
Ireland | | | 4% | | | | 4% | |
Sweden | | | 3% | | | | 3% | |
Korea | | | 2% | | | | 2% | |
Argentina | | | 2% | | | | 2% | |
Taiwan | | | 2% | | | | 1% | |
Brazil | | | 2% | | | | 2% | |
Singapore | | | 2% | | | | 2% | |
| Other | | | 4% | | | | 6% | |
| | | | 100% | | | | 100% | |
Portfolio holdings and characteristics are subject to change.
For more complete details about the Fund’s investment portfolio, see page 7.
Following the Fund’s fiscal first and third quarter-end, a complete portfolio holdings listing is posted on dws.com, and is available free of charge by contacting your financial intermediary, or if you are a direct investor, by calling (800) 728-3337. In addition, the portfolio holdings listing is filed with the SEC on the Fund’s Form N-PORT and will be available on the SEC’s Web site at sec.gov. Additional portfolio holdings for the Fund are also posted on dws.com from time to time. Please see the Fund’s current prospectus for more information.
| | | | | | |
| | 6 | | | | | | Deutsche DWS Variable Series II — DWS International Growth VIP |
| | |
| Investment Portfolio | | as of December 31, 2020 |
| | | | | | | | |
| | | Shares | | | Value ($) | |
| Common Stocks 96.2% | | | | | | | | |
| Argentina 2.1% | |
Globant SA* (a)
(Cost $103,492) | | | 1,860 | | | | 404,755 | |
|
| Australia 0.3% | |
Appen Ltd.
(Cost $74,288) | | | 3,459 | | | | 66,143 | |
|
| Brazil 1.8% | |
| | |
Magazine Luiza SA | | | 22,116 | | | | 106,164 | |
| | |
Pagseguro Digital Ltd. “A”* (a) | | | 4,379 | | | | 249,078 | |
| | | | | | | | |
(Cost $176,084) | | | | 355,242 | |
|
| Canada 6.5% | |
| | |
Agnico Eagle Mines Ltd. | | | 3,500 | | | | 246,339 | |
| | |
Alimentation Couche-Tard, Inc. “B” | | | 5,515 | | | | 187,949 | |
| | |
Brookfield Asset Management, Inc. “A” | | | 14,194 | | | | 586,761 | |
| | |
Canadian National Railway Co. | | | 2,180 | | | | 239,665 | |
| | | | | | | | |
(Cost $582,363) | | | | 1,260,714 | |
|
| China 8.1% | |
| | |
Alibaba Group Holding Ltd. (ADR)* | | | 1,693 | | | | 394,012 | |
| | |
Dada Nexus Ltd. (ADR)* | | | 544 | | | | 19,856 | |
| | |
Minth Group Ltd. | | | 16,870 | | | | 89,322 | |
| | |
Momo, Inc. (ADR) | | | 3,293 | | | | 45,970 | |
| | |
New Oriental Education & Technology Group, Inc. (ADR)* | | | 939 | | | | 174,476 | |
| | |
Ping An Healthcare and Technology Co., Ltd. 144A* | | | 2,100 | | | | 25,663 | |
| | |
Ping An Insurance (Group) Co. of China Ltd. “H” | | | 31,000 | | | | 380,780 | |
| | |
Tencent Holdings Ltd. | | | 6,000 | | | | 435,837 | |
| | | | | | | | |
(Cost $881,540) | | | | 1,565,916 | |
|
| France 11.3% | |
| | |
Airbus SE* | | | 1,055 | | | | 115,927 | |
| | |
Capgemini SE | | | 1,239 | | | | 192,938 | |
| | |
Cie de Saint-Gobain* | | | 3,000 | | | | 138,419 | |
| | |
LVMH Moet Hennessy Louis Vuitton SE | | | 795 | | | | 496,295 | |
| | |
Orpea SA* | | | 1,070 | | | | 141,056 | |
| | |
Schneider Electric SE | | | 475 | | | | 68,954 | |
| | |
SMCP SA 144A* | | | 6,128 | | | | 37,549 | |
| | |
Teleperformance | | | 1,001 | | | | 334,319 | |
| | |
TOTAL SE | | | 5,614 | | | | 242,230 | |
| | |
VINCI SA | | | 2,670 | | | | 266,000 | |
| | |
Vivendi SA | | | 5,110 | | | | 164,890 | |
| | | | | | | | |
(Cost $1,719,453) | | | | 2,198,577 | |
|
| Germany 13.6% | |
| | |
adidas AG* | | | 327 | | | | 119,417 | |
| | |
Allianz SE (Registered) | | | 1,322 | | | | 324,522 | |
| | |
BASF SE | | | 1,978 | | | | 156,227 | |
| | |
Deutsche Boerse AG | | | 2,634 | | | | 448,854 | |
| | |
Evonik Industries AG | | | 6,335 | | | | 207,167 | |
| | |
Evotec SE* | | | 5,569 | | | | 206,573 | |
| | |
Fresenius Medical Care AG & Co. KGaA | | | 3,825 | | | | 324,078 | |
| | |
LANXESS AG | | | 2,210 | | | | 170,120 | |
| | |
SAP SE | | | 1,621 | | | | 214,967 | |
| | | | | | | | |
| | | Shares | | | Value ($) | |
| | |
TeamViewer AG 144A* | | | 6,482 | | | | 348,836 | |
| | |
Wacker Chemie AG | | | 750 | | | | 107,440 | |
| | | | | | | | |
(Cost $2,099,436) | | | | 2,628,201 | |
|
| Hong Kong 1.2% | |
Techtronic Industries Co., Ltd.
(Cost $38,072) | | | 16,097 | | | | 230,502 | |
|
| Ireland 3.5% | |
| | |
Experian PLC | | | 10,233 | | | | 388,746 | |
| | |
Kerry Group PLC “A” | | | 1,977 | | | | 286,525 | |
| | | | | | | | |
(Cost $364,469) | | | | 675,271 | |
|
| Japan 10.2% | |
| | |
Daikin Industries Ltd. | | | 1,700 | | | | 378,268 | |
| | |
Fast Retailing Co., Ltd. | | | 300 | | | | 269,381 | |
| | |
Hoya Corp. | | | 2,500 | | | | 346,190 | |
| | |
Kao Corp. | | | 1,100 | | | | 84,907 | |
| | |
Keyence Corp. | | | 800 | | | | 450,273 | |
| | |
MISUMI Group, Inc. | | | 3,911 | | | | 128,302 | |
| | |
Pigeon Corp. | | | 3,900 | | | | 160,912 | |
| | |
Shimadzu Corp. | | | 4,200 | | | | 163,416 | |
| | | | | | | | |
(Cost $1,071,371) | | | | 1,981,649 | |
|
| Korea 2.1% | |
Samsung Electronics Co., Ltd.
(Cost $229,761) | | | 5,423 | | | | 406,183 | |
|
| Luxembourg 1.0% | |
Eurofins Scientific SE*
(Cost $51,777) | | | 2,380 | | | | 200,151 | |
|
| Macau 0.5% | |
Sands China Ltd.
(Cost $116,661) | | | 22,800 | | | | 100,729 | |
|
| Netherlands 5.5% | |
| | |
Adyen NV 144A* | | | 59 | | | | 138,025 | |
| | |
ASML Holding NV | | | 513 | | | | 251,532 | |
| | |
ING Groep NV* | | | 16,200 | | | | 152,107 | |
| | |
Koninklijke Philips NV* | | | 4,819 | | | | 258,448 | |
| | |
NXP Semiconductors NV (a) | | | 965 | | | | 153,445 | |
| | |
Prosus NV | | | 1,035 | | | | 112,604 | |
| | | | | | | | |
(Cost $753,689) | | | | 1,066,161 | |
|
| Singapore 1.8% | |
DBS Group Holdings Ltd.
(Cost $289,679) | | | 18,300 | | | | 347,429 | |
|
| South Africa 1.1% | |
Naspers Ltd. “N”
(Cost $235,856) | | | 1,035 | | | | 213,756 | |
|
| Sweden 3.4% | |
| | |
Assa Abloy AB “B” | | | 3,900 | | | | 96,271 | |
| | |
Hexagon AB “B” | | | 1,068 | | | | 97,553 | |
| | |
Nobina AB 144A* | | | 22,904 | | | | 193,360 | |
| | |
Spotify Technology SA* (a) | | | 866 | | | | 272,496 | |
| | | | | | | | |
(Cost $391,626) | | | | 659,680 | |
|
| Switzerland 8.8% | |
| | |
Alcon, Inc.* | | | 632 | | | | 42,053 | |
| | |
Julius Baer Group Ltd. | | | 1,388 | | | | 79,805 | |
| | |
Lonza Group AG (Registered) | | | 823 | | | | 530,626 | |
The accompanying notes are an integral part of the financial statements.
| | | | |
Deutsche DWS Variable Series II — DWS International Growth VIP | | | | | 7 |
| | | | | | | | |
| | | Shares | | | Value ($) | |
| | |
Nestle SA (Registered) | | | 3,470 | | | | 409,127 | |
| | |
Novartis AG (Registered) | | | 2,550 | | | | 241,216 | |
| | |
Roche Holding AG (Genusschein) | | | 761 | | | | 266,357 | |
| | |
Zur Rose Group AG* | | | 405 | | | | 130,009 | |
| | | | | | | | |
(Cost $900,558) | | | | 1,699,193 | |
|
| Taiwan 2.1% | |
Taiwan Semiconductor Manufacturing Co., Ltd.
(Cost $137,146) | | | 21,000 | | | | 396,689 | |
|
| United Kingdom 4.1% | |
| | |
Clarivate PLC* (a) | | | 4,760 | | | | 141,420 | |
| | |
Clinigen Group PLC | | | 9,352 | | | | 86,427 | |
| | |
Compass Group PLC | | | 6,985 | | | | 130,063 | |
| | |
Farfetch Ltd. “A”* (a) | | | 2,310 | | | | 147,401 | |
| | |
Halma PLC | | | 4,667 | | | | 156,579 | |
| | |
Rentokil Initial PLC* | | | 19,720 | | | | 137,620 | |
| | | | | | | | |
(Cost $578,465) | | | | 799,510 | |
|
| United States 7.2% | |
| | |
Activision Blizzard, Inc. | | | 1,966 | | | | 182,543 | |
| | |
EPAM Systems, Inc.* | | | 1,080 | | | | 387,018 | |
| | |
Marsh & McLennan Companies, Inc. | | | 1,677 | | | | 196,209 | |
| | |
MasterCard, Inc. “A” | | | 594 | | | | 212,022 | |
| | |
NVIDIA Corp. | | | 329 | | | | 171,804 | |
| | |
Schlumberger NV | | | 2,572 | | | | 56,147 | |
| | |
Thermo Fisher Scientific, Inc. | | | 415 | | | | 193,299 | |
| | | | | | | | |
| |
(Cost $537,383) | | | | 1,399,042 | |
Total Common Stocks (Cost $11,333,169) | | | | 18,655,493 | |
| | | | | | | | |
| | | Shares | | | Value ($) | |
| | |
| Preferred Stocks 0.7% | | | | | | | | |
| Germany | |
Sartorius AG
(Cost $84,410) | | | 350 | | | | 147,633 | |
|
Exchange-Traded Funds 0.5% | |
| United States | |
iShares MSCI Japan ETF (Cost $84,057) | | | 1,408 | | | | 95,124 | |
| | |
| Cash Equivalents 2.4% | | | | | | | | |
DWS Central Cash Management Government Fund, 0.08% (b)
(Cost $458,187) | | | 458,187 | | | | 458,187 | |
| | |
| | | % of
Net Assets | | | Value ($) | |
Total Investment Portfolio
(Cost $11,959,823) | | | 99.8 | | | | 19,356,437 | |
| Other Assets and Liabilities, Net | | | 0.2 | | | | 42,498 | |
| Net Assets | | | 100.0 | | | | 19,398,935 | |
A summary of the Fund’s transactions with affiliated investments during the year ended December 31, 2020 are as follows:
| | | | | | | | | | | | | | | | | | | | | | | | | | | | | | | | |
Value ($) at
12/31/2019 | | Purchases
Cost ($) | | | Sales
Proceeds ($) | | | Net
Realized
Gain/
(Loss) ($) | | | Net Change in
Unrealized
Appreciation
(Depreciation) ($) | | | Income ($) | | | Capital Gain
Distributions ($) | | | Number
of Shares
at
12/31/2020 | | | Value ($)
at
12/31/2020 | |
Securities Lending Collateral —% | | | | | | | | | | | | | | | | | |
DWS Government & Agency Securities Portfolio “DWS Government Cash Institutional Shares”, 0.03% (b) (c) | |
| 290,624 | | | — | | | | 290,624 | (d) | | | — | | | | — | | | | 2,173 | | | | — | | | | — | | | | — | |
Cash Equivalents 2.4% | |
DWS Central Cash Management Government Fund, 0.08% (b) | |
| 241,211 | | | 4,047,899 | | | | 3,830,923 | | | | — | | | | — | | | | 1,241 | | | | — | | | | 458,187 | | | | 458,187 | |
| 531,835 | | | 4,047,899 | | | | 4,121,547 | | | | — | | | | — | | | | 3,414 | | | | — | | | | 458,187 | | | | 458,187 | |
| * | Non-income producing security. |
| (a) | Listed on the New York Stock Exchange. |
| (b) | Affiliated fund managed by DWS Investment Management Americas, Inc. The rate shown is the annualized seven-day yield at period end. |
| (c) | Represents cash collateral held in connection with securities lending. Income earned by the Fund is net of borrower rebates. |
| (d) | Represents the net increase (purchase cost) or decrease (sales proceeds) in the amount invested in cash collateral for the year ended December 31, 2020. |
144A: Security exempt from registration under Rule 144A of the Securities Act of 1933. These securities may be resold in transactions exempt from registration, normally to qualified institutional buyers.
ADR: American Depositary Receipt
MSCI: Morgan Stanley Capital International
The accompanying notes are an integral part of the financial statements.
| | | | | | |
| | 8 | | | | | | Deutsche DWS Variable Series II — DWS International Growth VIP |
Fair Value Measurements
Various inputs are used in determining the value of the Fund’s investments. These inputs are summarized in three broad levels. Level 1 includes quoted prices in active markets for identical securities. Level 2 includes other significant observable inputs (including quoted prices for similar securities, interest rates, prepayment speeds and credit risk). Level 3 includes significant unobservable inputs (including the Fund’s own assumptions in determining the fair value of investments). The level assigned to the securities valuations may not be an indication of the risk or liquidity associated with investing in those securities.
The following is a summary of the inputs used as of December 31, 2020 in valuing the Fund’s investments. For information on the Fund’s policy regarding the valuation of investments, please refer to the Security Valuation section of Note A in the accompanying Notes to Financial Statements.
| | | | | | | | | | | | | | | | |
| Assets | | Level 1 | | | Level 2 | | | Level 3 | | | Total | |
Common Stocks | | | | | | | | | | | | | | | | |
Argentina | | $ | 404,755 | | | $ | — | | | $ | — | | | $ | 404,755 | |
Australia | | | — | | | | 66,143 | | | | — | | | | 66,143 | |
Brazil | | | 249,078 | | | | 106,164 | | | | — | | | | 355,242 | |
Canada | | | 1,260,714 | | | | — | | | | — | | | | 1,260,714 | |
China | | | 634,314 | | | | 931,602 | | | | — | | | | 1,565,916 | |
France | | | — | | | | 2,198,577 | | | | — | | | | 2,198,577 | |
Germany | | | — | | | | 2,628,201 | | | | — | | | | 2,628,201 | |
Hong Kong | | | — | | | | 230,502 | | | | — | | | | 230,502 | |
Ireland | | | — | | | | 675,271 | | | | — | | | | 675,271 | |
Japan | | | — | | | | 1,981,649 | | | | — | | | | 1,981,649 | |
Korea | | | — | | | | 406,183 | | | | — | | | | 406,183 | |
Luxembourg | | | — | | | | 200,151 | | | | — | | | | 200,151 | |
Macau | | | — | | | | 100,729 | | | | — | | | | 100,729 | |
Netherlands | | | 153,445 | | | | 912,716 | | | | — | | | | 1,066,161 | |
Singapore | | | — | | | | 347,429 | | | | — | | | | 347,429 | |
South Africa | | | — | | | | 213,756 | | | | — | | | | 213,756 | |
Sweden | | | 272,496 | | | | 387,184 | | | | — | | | | 659,680 | |
Switzerland | | | — | | | | 1,699,193 | | | | — | | | | 1,699,193 | |
Taiwan | | | — | | | | 396,689 | | | | — | | | | 396,689 | |
United Kingdom | | | 288,821 | | | | 510,689 | | | | — | | | | 799,510 | |
United States | | | 1,399,042 | | | | — | | | | — | | | | 1,399,042 | |
| Preferred Stocks | | | — | | | | 147,633 | | | | — | | | | 147,633 | |
| Exchange-Traded Funds | | | 95,124 | | | | — | | | | — | | | | 95,124 | |
| Short-Term Investments | | | 458,187 | | | | — | | | | — | | | | 458,187 | |
| Total | | $ | 5,215,976 | | | $ | 14,140,461 | | | $ | — | | | $ | 19,356,437 | |
The accompanying notes are an integral part of the financial statements.
| | | | |
Deutsche DWS Variable Series II — DWS International Growth VIP | | | | | 9 |
Statement of Assets and Liabilities
| | | | |
| as of December 31, 2020 | | | | |
| |
| Assets | | | | |
| Investments in non-affiliated securities, at value (cost $11,501,636) | | $ | 18,898,250 | |
| Investment in DWS Central Cash Management Government Fund (cost $458,187) | | | 458,187 | |
| Foreign currency, at value (cost $143,723) | | | 146,071 | |
| Receivable for investments sold | | | 8,945 | |
| Receivable for Fund shares sold | | | 25 | |
| Dividends receivable | | | 4,513 | |
| Interest receivable | | | 270 | |
| Foreign taxes recoverable | | | 13,305 | |
| Other assets | | | 367 | |
| Total assets | | | 19,529,933 | |
| |
| Liabilities | | | | |
| Payable for investments purchased | | | 35,668 | |
| Payable for Fund shares redeemed | | | 13,517 | |
| Accrued Management fee | | | 910 | |
| Accrued Trustees’ fees | | | 1,074 | |
| Other accrued expenses and payables | | | 79,829 | |
| Total liabilities | | | 130,998 | |
| Net assets, at value | | $ | 19,398,935 | |
| |
| Net Assets Consist of | | | | |
| Distributable earnings (loss) | | | 7,664,379 | |
| Paid-in capital | | | 11,734,556 | |
| Net assets, at value | | $ | 19,398,935 | |
| |
| Net Asset Value | | | | |
Class A | | | | |
| |
Net Asset Value, offering and redemption price per share ($19,292,461 ÷ 1,093,246 outstanding
shares of beneficial interest, no par value, unlimited number of shares authorized) | | $ | 17.65 | |
Class B | | | | |
| |
Net Asset Value, offering and redemption price per share ($106,474 ÷ 6,025 outstanding
shares of beneficial interest, no par value, unlimited number of shares authorized) | | $ | 17.67 | |
Statement of Operations
| | | | |
| for the year ended December 31, 2020 | |
| |
| Investment Income | | | | |
| Income: | | | | |
Dividends (net of foreign taxes withheld
of $28,050) | | $ | 210,603 | |
| Income distributions — DWS Central Cash Management Government Fund | | | 1,241 | |
| Securities lending income, net of borrower rebates | | | 2,173 | |
| Total income | | | 214,017 | |
| Expenses: | | | | |
| Management fee | | | 103,177 | |
| Administration fee | | | 16,230 | |
| Services to Shareholders | | | 814 | |
| Distribution service fee (Class B) | | | 246 | |
| Custodian fee | | | 12,888 | |
| Professional fees | | | 78,486 | |
| Reports to shareholders | | | 26,317 | |
| Trustees’ fees and expenses | | | 2,527 | |
| Other | | | 9,832 | |
| Total expenses before expense reductions | | | 250,517 | |
| Expense reductions | | | (105,431 | ) |
| Total expenses after expense reductions | | | 145,086 | |
| Net investment income (loss) | | | 68,931 | |
| |
| Realized and Unrealized Gain (Loss) | | | | |
| Net realized gain (loss) from: | | | | |
| Investments | | | 266,348 | |
| Foreign currency | | | (61 | ) |
| | | | 266,287 | |
| Change in net unrealized appreciation (depreciation) on: | | | | |
| Investments | | | 3,132,926 | |
| Foreign currency | | | 3,965 | |
| | | | 3,136,891 | |
| Net gain (loss) | | | 3,403,178 | |
| Net increase (decrease) in net assets resulting from operations | | $ | 3,472,109 | |
The accompanying notes are an integral part of the financial statements.
| | | | | | |
| | 10 | | | | | | Deutsche DWS Variable Series II — DWS International Growth VIP |
Statements of Changes in Net Assets
| | | | | | | | |
| | | Years Ended December 31, | |
| Increase (Decrease) in Net Assets | | 2020 | | | 2019 | |
| Operations: | | | | | | | | |
| Net investment income (loss) | | $ | 68,931 | | | $ | 265,032 | |
| Net realized gain (loss) | | | 266,287 | | | | (38,995 | ) |
| Change in net unrealized appreciation (depreciation) | | | 3,136,891 | | | | 4,100,804 | |
| Net increase (decrease) in net assets resulting from operations | | | 3,472,109 | | | | 4,326,841 | |
| Distributions to shareholders: | | | | | | | | |
Class A | | | (248,933 | ) | | | (445,123 | ) |
Class B | | | (1,082 | ) | | | (3,307 | ) |
| Total distributions | | | (250,015 | ) | | | (448,430 | ) |
| Fund share transactions: | | | | | | | | |
Class A | | | | | | | | |
| Proceeds from shares sold | | | 1,646,537 | | | | 1,652,668 | |
| Reinvestment of distributions | | | 248,933 | | | | 445,123 | |
| Payments for shares redeemed | | | (3,319,251 | ) | | | (2,520,782 | ) |
| Net increase (decrease) in net assets from Class A share transactions | | | (1,423,781 | ) | | | (422,991 | ) |
Class B | | | | | | | | |
| Proceeds from shares sold | | | 1,708 | | | | 16,855 | |
| Reinvestment of distributions | | | 1,082 | | | | 3,307 | |
| Payments for shares redeemed | | | (73,265 | ) | | | (112,320 | ) |
| Net increase (decrease) in net assets from Class B share transactions | | | (70,475 | ) | | | (92,158 | ) |
| Increase (decrease) in net assets | | | 1,727,838 | | | | 3,363,262 | |
| Net assets at beginning of period | | | 17,671,097 | | | | 14,307,835 | |
| | |
| Net assets at end of period | | $ | 19,398,935 | | | $ | 17,671,097 | |
| | |
| Other Information | | | | | | | | |
Class A | | | | | | | | |
| Shares outstanding at beginning of period | | | 1,196,084 | | | | 1,228,635 | |
| Shares sold | | | 111,439 | | | | 122,990 | |
| Shares issued to shareholders in reinvestment of distributions | | | 20,388 | | | | 33,594 | |
| Shares redeemed | | | (234,665 | ) | | | (189,135 | ) |
| Net increase (decrease) in Class A shares | | | (102,838 | ) | | | (32,551 | ) |
| | |
| Shares outstanding at end of period | | | 1,093,246 | | | | 1,196,084 | |
Class B | | | | | | | | |
| Shares outstanding at beginning of period | | | 10,737 | | | | 19,045 | |
| Shares sold | | | 134 | | | | 1,204 | |
| Shares issued to shareholders in reinvestment of distributions | | | 88 | | | | 249 | |
| Shares redeemed | | | (4,934 | ) | | | (9,761 | ) |
| Net increase (decrease) in Class B shares | | | (4,712 | ) | | | (8,308 | ) |
| | |
| Shares outstanding at end of period | | | 6,025 | | | | 10,737 | |
The accompanying notes are an integral part of the financial statements.
| | | | |
Deutsche DWS Variable Series II — DWS International Growth VIP | | | | | 11 |
Financial Highlights
| | | | | | | | | | | | | | | | | | | | |
| DWS International Growth VIP — Class A | | | | | | | | | | | | | | | | | | | | |
| |
| | | Years Ended December 31, | |
| | | 2020 | | | 2019 | | | 2018 | | | 2017 | | | 2016 | |
| | | | | |
| Selected Per Share Data | | | | | | | | | | | | | | | | | | | | |
| Net asset value, beginning of period | | $ | 14.64 | | | $ | 11.47 | | | | $13.90 | | | $ | 11.12 | | | $ | 10.81 | |
| Income (loss) from investment operations: | | | | | | | | | | | | | | | | | | | | |
Net investment incomea | | | .06 | | | | .22 | | | | .16 | | | | .08 | | | | .06 | |
Net realized and unrealized gain (loss) | | | 3.17 | | | | 3.32 | | | | (2.46 | ) | | | 2.75 | | | | .34 | |
Total from investment operations | | | 3.23 | | | | 3.54 | | | | (2.30 | ) | | | 2.83 | | | | .40 | |
| Less distribution from: | | | | | | | | | | | | | | | | | | | | |
Net investment income | | | (.22 | ) | | | (.17 | ) | | | (.13 | ) | | | (.05 | ) | | | (.09 | ) |
Net realized gain | | | — | | | | (.20 | ) | | | — | | | | — | | | | — | |
Total distributions | | | (.22 | ) | | | (.37 | ) | | | (.13 | ) | | | (.05 | ) | | | (.09 | ) |
| Net asset value, end of period | | $ | 17.65 | | | $ | 14.64 | | | | $11.47 | | | $ | 13.90 | | | $ | 11.12 | |
| Total Return (%)b | | | 22.69 | | | | 31.22 | | | | (16.69 | ) | | | 25.47 | | | | 3.72 | |
| |
| Ratios to Average Net Assets and Supplemental Data | | | | | |
| Net assets, end of period ($ millions) | | | 19 | | | | 18 | | | | 14 | | | | 19 | | | | 27 | |
| Ratio of expenses before expense reductions (%)c | | | 1.50 | | | | 1.64 | | | | 1.72 | | | | 1.56 | | | | 1.66 | |
| Ratio of expenses after expense reductions (%)c | | | .87 | | | | .86 | | | | .81 | | | | .92 | | | | .95 | |
| Ratio of net investment income (%) | | | .42 | | | | 1.63 | | | | 1.21 | | | | .61 | | | | .51 | |
| Portfolio turnover rate (%) | | | 10 | | | | 16 | | | | 38 | | | | 62 | | | | 70 | |
| a | Based on average shares outstanding during the period. |
| b | Total return would have been lower had certain expenses not been reduced. |
| c | Expense ratio does not reflect charges and fees associated with the separate account that invests in the Fund or any variable life insurance policy or variable annuity contract for which the Fund is an investment option. |
| | | | | | | | | | | | | | | | | | | | |
| DWS International Growth VIP — Class B | | | | | | | | | | | | | | | | | | | | |
| |
| | | Years Ended December 31, | |
| | | 2020 | | | 2019 | | | 2018 | | | 2017 | | | 2016 | |
| | | | | |
| Selected Per Share Data | | | | | | | | | | | | | | | | | | | | |
| Net asset value, beginning of period | | $ | 14.66 | | | $ | 11.49 | | | | $13.93 | | | $ | 11.13 | | | $ | 10.82 | |
| Income (loss) from investment operations: | | | | | | | | | | | | | | | | | | | | |
Net investment incomea | | | .01 | | | | .18 | | | | .12 | | | | .02 | | | | .02 | |
Net realized and unrealized gain (loss) | | | 3.18 | | | | 3.33 | | | | (2.46 | ) | | | 2.79 | | | | .35 | |
Total from investment operations | | | 3.19 | | | | 3.51 | | | | (2.34 | ) | | | 2.81 | | | | .37 | |
| Less distribution from: | | | | | | | | | | | | | | | | | | | | |
Net investment income | | | (.18 | ) | | | (.14 | ) | | | (.10 | ) | | | (.01 | ) | | | (.06 | ) |
Net realized gain | | | — | | | | (.20 | ) | | | — | | | | — | | | | — | |
Total distributions | | | (.18 | ) | | | (.34 | ) | | | (.10 | ) | | | (.01 | ) | | | (.06 | ) |
| Net asset value, end of period | | $ | 17.67 | | | $ | 14.66 | | | | $11.49 | | | $ | 13.93 | | | $ | 11.13 | |
| Total Return (%)b | | | 22.29 | | | | 30.84 | | | | (16.92 | ) | | | 25.26 | | | | 3.38 | |
|
| Ratios to Average Net Assets and Supplemental Data | |
| Net assets, end of period ($ millions) | | | .1 | | | | .2 | | | | .2 | | | | .2 | | | | .07 | |
| Ratio of expenses before expense reductions (%)c | | | 1.81 | | | | 1.95 | | | | 2.07 | | | | 1.90 | | | | 1.98 | |
| Ratio of expenses after expense reductions (%)c | | | 1.18 | | | | 1.16 | | | | 1.06 | | | | 1.15 | | | | 1.24 | |
| Ratio of net investment income (%) | | | .07 | | | | 1.31 | | | | .92 | | | | .12 | | | | .17 | |
| Portfolio turnover rate (%) | | | 10 | | | | 16 | | | | 38 | | | | 62 | | | | 70 | |
| a | Based on average shares outstanding during the period. |
| b | Total return would have been lower had certain expenses not been reduced. |
| c | Expense ratio does not reflect charges and fees associated with the separate account that invests in the Fund or any variable life insurance policy or variable annuity contract for which the Fund is an investment option. |
The accompanying notes are an integral part of the financial statements.
| | | | | | |
| | 12 | | | | | | Deutsche DWS Variable Series II — DWS International Growth VIP |
| | |
| Notes to Financial Statements | | |
A. Organization and Significant Accounting Policies
DWS International Growth VIP (the “Fund”) is a diversified series of Deutsche DWS Variable Series II (the “Trust”), which is registered under the Investment Company Act of 1940, as amended (the “1940 Act”), as an open-end management investment company organized as a Massachusetts business trust.
Multiple Classes of Shares of Beneficial Interest. The Fund offers two classes of shares (Class A shares and Class B shares). Sales of Class B shares are subject to recordkeeping fees of up to 0.15% and Rule 12b-1 fees under the 1940 Act equal to an annual rate of up to 0.25% of the average daily net assets for Class B shares of the Fund. Class A shares are not subject to such fees.
Investment income, realized and unrealized gains and losses, and certain fund-level expenses and expense reductions, if any, are borne pro rata on the basis of relative net assets by the holders of all classes of shares except that each class bears certain expenses unique to that class (including the applicable Rule 12b-1 fee and recordkeeping fees). Differences in class-level expenses may result in payment of different per share dividends by class. All shares have equal rights with respect to voting subject to class-specific arrangements.
The Fund’s financial statements are prepared in accordance with accounting principles generally accepted in the United States of America (“U.S. GAAP”) which require the use of management estimates. Actual results could differ from those estimates. The Fund qualifies as an investment company under Topic 946 of Accounting Standards Codification of U.S. GAAP. The policies described below are followed consistently by the Fund in the preparation of its financial statements.
Security Valuation. Investments are stated at value determined as of the close of regular trading on the New York Stock Exchange on each day the exchange is open for trading.
Various inputs are used in determining the value of the Fund’s investments. These inputs are summarized in three broad levels. Level 1 includes quoted prices in active markets for identical securities. Level 2 includes other significant observable inputs (including quoted prices for similar securities, interest rates, prepayment speeds and credit risk). Level 3 includes significant unobservable inputs (including the Fund’s own assumptions in determining the fair value of investments). The level assigned to the securities valuations may not be an indication of the risk or liquidity associated with investing in those securities.
Equity securities and Exchange-Traded Funds (“ETFs”) are valued at the most recent sale price or official closing price reported on the exchange (U.S. or foreign) or over-the-counter market on which they trade. Equity securities or ETFs for which no sales are reported are valued at the calculated mean between the most recent bid and asked quotations on the relevant market or, if a mean cannot be determined, at the most recent bid quotation. Equity securities and ETFs are generally categorized as Level 1. For certain international equity securities, in order to adjust for events which may occur between the close of the foreign exchanges and the close of the New York Stock Exchange, a fair valuation model may be used. This fair valuation model takes into account comparisons to the valuation of American Depository Receipts (ADRs), exchange-traded funds, futures contracts and certain indices and these securities are categorized as Level 2.
Investments in open-end investment companies are valued at their net asset value each business day and are categorized as Level 1.
Securities and other assets for which market quotations are not readily available or for which the above valuation procedures are deemed not to reflect fair value are valued in a manner that is intended to reflect their fair value as determined in accordance with procedures approved by the Board and are generally categorized as Level 3. In accordance with the Fund’s valuation procedures, factors considered in determining value may include, but are not limited to, the type of the security; the size of the holding; the initial cost of the security; the existence of any contractual restrictions on the security’s disposition; the price and extent of public trading in similar securities of the issuer or of comparable companies; quotations or evaluated prices from broker-dealers and/or pricing services; information obtained from the issuer, analysts, and/or the appropriate stock exchange (for exchange-traded securities); an analysis of the company’s or issuer’s financial statements; an evaluation of the forces that influence the issuer and the market(s) in which the security is purchased and sold; and with respect to debt securities, the maturity, coupon, creditworthiness, currency denomination and the movement of the market in which the security is normally traded. The value determined under these procedures may differ from published values for the same securities.
Disclosure about the classification of fair value measurements is included in a table following the Fund’s Investment Portfolio.
| | | | |
Deutsche DWS Variable Series II — DWS International Growth VIP | | | | | 13 |
Foreign Currency Translations. The books and records of the Fund are maintained in U.S. dollars. Investment securities and other assets and liabilities denominated in a foreign currency are translated into U.S. dollars at the prevailing exchange rates at period end. Purchases and sales of investment securities, income and expenses are translated into U.S. dollars at the prevailing exchange rates on the respective dates of the transactions.
Net realized and unrealized gains and losses on foreign currency transactions represent net gains and losses between trade and settlement dates on securities transactions, the acquisition and disposition of foreign currencies, and the difference between the amount of net investment income accrued and the U.S. dollar amount actually received. The portion of both realized and unrealized gains and losses on investments that results from fluctuations in foreign currency exchange rates is not separately disclosed but is included with net realized and unrealized gain/appreciation and loss/depreciation on investments.
Securities Lending. Brown Brothers Harriman & Co., as lending agent, lends securities of the Fund to certain financial institutions under the terms of its securities lending agreement. During the term of the loans, the Fund continues to receive interest and dividends generated by the securities and to participate in any changes in their market value. The Fund requires the borrowers of the securities to maintain collateral with the Fund consisting of either cash and/or U.S. Treasury Securities having a value at least equal to the value of the securities loaned. When the collateral falls below specified amounts, the lending agent will use its best effort to obtain additional collateral on the next business day to meet required amounts under the securities lending agreement. During the year ended December 31, 2020, the Fund invested the cash collateral into a joint trading account in DWS Government & Agency Securities Portfolio, an affiliated money market fund managed by DWS Investment Management Americas, Inc. DWS Investment Management Americas, Inc. receives a management/administration fee (0.06% annualized effective rate as of December 31, 2020) on the cash collateral invested in DWS Government & Agency Securities Portfolio. The Fund receives compensation for lending its securities either in the form of fees or by earning interest on invested cash collateral net of borrower rebates and fees paid to a lending agent. Either the Fund or the borrower may terminate the loan at any time, and the borrower, after notice, is required to return borrowed securities within a standard time period. There may be risks of delay and costs in recovery of securities or even loss of rights in the collateral should the borrower of the securities fail financially. If the Fund is not able to recover securities lent, the Fund may sell the collateral and purchase a replacement investment in the market, incurring the risk that the value of the replacement security is greater than the value of the collateral. The Fund is also subject to all investment risks associated with the reinvestment of any cash collateral received, including, but not limited to, interest rate, credit and liquidity risk associated with such investments.
As of December 31, 2020, the Fund had no securities on loan.
Taxes. The Fund’s policy is to comply with the requirements of the Internal Revenue Code, as amended, which are applicable to regulated investment companies and to distribute all of its taxable income to its shareholders.
Additionally, the Fund may be subject to taxes imposed by the governments of countries in which it invests and are generally based on income and/or capital gains earned or repatriated, a portion of which may be recoverable. Based upon the current interpretation of the tax rules and regulations, estimated tax liabilities and recoveries on certain foreign securities are recorded on an accrual basis and are reflected as components of interest income or net change in unrealized gain/loss on investments. Tax liabilities realized as a result of security sales are reflected as a component of net realized gain/loss on investments.
The Fund has reviewed the tax positions for the open tax years as of December 31, 2020 and has determined that no provision for income tax and/or uncertain tax positions is required in the Fund’s financial statements. The Fund’s federal tax returns for the prior three fiscal years remain open subject to examination by the Internal Revenue Service.
Distribution of Income and Gains. Distributions from net investment income of the Fund, if any, are declared and distributed to shareholders annually. Net realized gains from investment transactions, in excess of available capital loss carryforwards, would be taxable to the Fund if not distributed and, therefore, will be distributed to shareholders at least annually. The Fund may also make additional distributions for tax purposes if necessary.
The timing and characterization of certain income and capital gain distributions are determined annually in accordance with federal tax regulations, which may differ from accounting principles generally accepted in the United States of America. These differences primarily relate to investments in foreign denominated investments and certain securities sold at a loss. As a result, net investment income (loss) and net realized
| | | | | | |
| | 14 | | | | | | Deutsche DWS Variable Series II — DWS International Growth VIP |
gain (loss) on investment transactions for a reporting period may differ significantly from distributions during such period. Accordingly, the Fund may periodically make reclassifications among certain of its capital accounts without impacting the net asset value of the Fund.
At December 31, 2020, the Fund’s components of distributable earnings on a tax basis were as follows:
| | | | |
| Undistributed ordinary income* | | $ | 66,127 | |
Undistributed long-term capital gains | | $ | 227,261 | |
| Net unrealized appreciation (depreciation) on investments | | $ | 7,367,492 | |
At December 31, 2020, the aggregate cost of investments for federal income tax purposes was $11,988,945. The net unrealized appreciation for all investments based on tax cost was $7,367,492. This consisted of aggregate gross unrealized appreciation for all investments for which there was an excess of value over tax cost of $7,940,739 and aggregate gross unrealized depreciation for all investments for which there was an excess of tax cost over value of $573,247.
In addition, the tax character of distributions paid by the Fund is summarized as follows:
| | | | | | | | |
| | | Years Ended December 31, | |
| | | 2020 | | | 2019 | |
| Distributions from ordinary income* | | $ | 250,015 | | | $ | 213,752 | |
| Distributions from long-term capital gains | | $ | — | | | $ | 234,678 | |
| * | For tax purposes, short-term capital gain distributions are considered ordinary income distributions. |
Expenses. Expenses of the Trust arising in connection with a specific fund are allocated to that fund. Other Trust expenses which cannot be directly attributed to a fund are apportioned among the funds in the Trust based upon the relative net assets or other appropriate measures.
Contingencies. In the normal course of business, the Fund may enter into contracts with service providers that contain general indemnification clauses. The Fund’s maximum exposure under these arrangements is unknown, as this would involve future claims that may be made against the Fund that have not yet been made. However, based on experience, the Fund expects the risk of loss to be remote.
Other. Investment transactions are accounted for on a trade date plus one basis for daily net asset value calculations. However, for financial reporting purposes, investment transactions are reported on trade date. Interest income is recorded on the accrual basis. Dividend income is recorded on the ex-dividend date net of foreign withholding taxes. Realized gains and losses from investment transactions are recorded on an identified cost basis. Proceeds from litigation payments, if any, are included in net realized gain (loss) from investments.
B. Purchases and Sales of Securities
During the year ended December 31, 2020, purchases and sales of investment transactions (excluding short-term investments) aggregated $1,609,431 and $3,472,105, respectively.
C. Related Parties
Management Agreement. Under the Investment Management Agreement with DWS Investment Management Americas, Inc. (“DIMA” or the “Advisor”), an indirect, wholly owned subsidiary of DWS Group GmbH & Co. KGaA (“DWS Group”), the Advisor directs the investments of the Fund in accordance with its investment objectives, policies and restrictions. The Advisor determines the securities, instruments and other contracts relating to investments to be purchased, sold or entered into by the Fund.
Under to the Investment Management Agreement with the Advisor, the Fund pays the Advisor an annual fee based on its average daily net assets, computed and accrued daily and payable monthly at the annual rate (exclusive of any applicable waivers/reimbursements) of 0.62%.
For the period from January 1, 2020 through April 30, 2021(through September 30, 2020 for Class B shares), the Advisor has contractually agreed to waive its fees and/or reimburse certain operating expenses to the extent necessary to maintain the total annual operating expenses (excluding certain expenses such as extraordinary expenses, taxes, brokerage and interest expense) of each class as follows:
| | | | |
| Class A | | | .87 | % |
| Class B | | | 1.19 | % |
| | | | |
Deutsche DWS Variable Series II — DWS International Growth VIP | | | | | 15 |
Effective October 1, 2020 through September 30, 2021, the Advisor has contractually agreed to waive its
fees and/or reimburse certain operating expenses to the extent necessary to maintain the total annual
operating expenses (excluding certain expenses such as extraordinary expenses, taxes, brokerage and
interest expense) of Class B as 1.17%
For the year ended December 31, 2020, fees waived and/or expenses reimbursed for each class are as follows:
| | | | |
| Class A | | $ | 104,808 | |
| Class B | | | 623 | |
| | | $ | 105,431 | |
Administration Fee. Pursuant to an Administrative Services Agreement, DIMA provides most administrative services to the Fund. Prior to March 1, 2020, for all services provided under the Administrative Services Agreement, the Fund paid the Advisor an annual fee (“Administration Fee”) of 0.10% of the Fund’s average daily net assets, computed and accrued daily and payable monthly. Effective March 1, 2020, for all services provided under the Administrative Services Agreement, the Fund pays the Advisor an annual Administration Fee of 0.097% of the Fund’s average daily net assets, computed and accrued daily and payable monthly. For the year ended December 31, 2020, the Administration Fee was $16,230, of which $1,559 is unpaid.
Service Provider Fees. DWS Service Company (“DSC”), an affiliate of the Advisor, is the transfer agent, dividend-paying agent and shareholder service agent for the Fund. Pursuant to a sub-transfer agency agreement between DSC and DST Systems, Inc. (“DST”), DSC has delegated certain transfer agent, dividend-paying agent and shareholder service agent functions to DST. DSC compensates DST out of the shareholder servicing fee it receives from the Fund. For the year ended December 31, 2020, the amounts charged to the Fund by DSC were as follows:
| | | | | | | | |
| Services to Shareholders | | Total
Aggregated | | | Unpaid at
December 31, 2020 | |
| Class A | | $ | 246 | | | $ | 46 | |
| Class B | | | 58 | | | | 11 | |
| | | $ | 304 | | | $ | 57 | |
Distribution Service Agreement. Under the Fund’s Class B 12b-1 plan, DWS Distributors, Inc. (“DDI”) received a fee (“Distribution Service Fee”) of up to 0.25% of the average daily net assets of Class B shares. For the year ended December 31, 2020, the Distribution Service Fee aggregated $246, of which $22 is unpaid.
Other Service Fees. Under an agreement with the Fund, DIMA is compensated for providing certain pre-press and regulatory filing services to the Fund. For the year ended December 31, 2020, the amount charged to the Fund by DIMA included in the Statement of Operations under “Reports to shareholders” aggregated $9,487, of which $3,568 is unpaid.
Trustees’ Fees and Expenses. The Fund paid retainer fees to each Trustee not affiliated with the Advisor, plus specified amounts to the Board Chairperson and to each committee Chairperson.
Affiliated Cash Management Vehicles. The Fund may invest uninvested cash balances in DWS Central Cash Management Government Fund and DWS ESG Liquidity Fund, affiliated money market funds which are managed by the Advisor. Each affiliated money market fund is managed in accordance with Rule 2a-7 under the 1940 Act, which governs the quality, maturity, diversity and liquidity of instruments in which a money market fund may invest. DWS Central Cash Management Government Fund seeks to maintain a stable net asset value, and DWS ESG Liquidity Fund maintains a floating net asset value. The Fund indirectly bears its proportionate share of the expenses of each affiliated money market fund in which it invests. DWS Central Cash Management Government Fund does not pay the Advisor an investment management fee. To the extent that DWS ESG Liquidity Fund pays an investment management fee to the Advisor, the Advisor will waive an amount of the investment management fee payable to the Advisor by the Fund equal to the amount of the investment management fee payable on the Fund’s assets invested in DWS ESG Liquidity Fund.
D. Ownership of the Fund
At December 31, 2020, one participating insurance company was owner of record of 10% or more of the total outstanding Class A shares of the Fund, owning 85%. Two participating insurance companies were owners of record of 10% or more of the total outstanding Class B shares of the Fund, owning 85% and 15%.
| | | | | | |
| | 16 | | | | | | Deutsche DWS Variable Series II — DWS International Growth VIP |
E. Line of Credit
The Fund and other affiliated funds (the “Participants”) share in a $350 million revolving credit facility provided by a syndication of banks. The Fund may borrow for temporary or emergency purposes, including the meeting of redemption requests that otherwise might require the untimely disposition of securities. The Participants are charged an annual commitment fee, which is allocated based on net assets, among each of the Participants. Interest is calculated at a rate per annum equal to the sum of the Federal Funds Rate plus 1.25 percent plus if the one-month LIBOR exceeds the Federal Funds Rate, the amount of such excess. The Fund may borrow up to a maximum of 33 percent of its net assets under the agreement. The Fund had no outstanding loans at December 31, 2020.
F. Other — COVID-19 Pandemic
A novel coronavirus known as COVID-19, declared a pandemic by the World Health Organization, has caused significant uncertainty, market volatility, decreased economic and other activity and increased government activity. Specifically, COVID-19 has led to significant death and morbidity, and concerns about its further spread have resulted in the closing of schools and non-essential businesses, cancellations, shelter-in place orders, lower consumer spending in certain sectors, social distancing, bans on large social gatherings and travel, quarantines, government economic stimulus measures, reduced productivity, rapid increases in unemployment, increased demand for and strain on government and medical resources, border closings and global trade and supply chain interruptions, among others. The full effects, duration and costs of the COVID-19 pandemic are impossible to predict, and the circumstances surrounding the COVID-19 pandemic will continue to evolve. The pandemic may affect certain countries, industries, economic sectors, companies and investment products more than others, may exacerbate existing economic, political, or social tensions and may increase the probability of an economic recession or depression. The Fund and its investments may be adversely affected by the effects of the COVID-19 pandemic, and a prolonged pandemic may result in the Fund and its service providers experiencing operational difficulties in coordinating a remote workforce and implementing their business continuity plans, among others. Management will continue to monitor the impact COVID-19 has on the Fund and reflect the consequences as appropriate in the Fund’s accounting and financial reporting.
| | | | |
Deutsche DWS Variable Series II — DWS International Growth VIP | | | | | 17 |
| | |
| Report of Independent Registered Public Accounting Firm | | |
To the Board of Trustees of Deutsche DWS Variable Series II and Shareholders of DWS International Growth VIP:
Opinion on the Financial Statements
We have audited the accompanying statement of assets and liabilities of DWS International Growth VIP (the “Fund”) (one of the funds constituting Deutsche DWS Variable Series II) (the “Trust”), including the investment portfolio, as of December 31, 2020, and the related statement of operations for the year then ended, the statements of changes in net assets for each of the two years in the period then ended, the financial highlights for each of the five years in the period then ended and the related notes (collectively referred to as the “financial statements”). In our opinion, the financial statements present fairly, in all material respects, the financial position of the Fund (one of the funds constituting Deutsche DWS Variable Series II) at December 31, 2020, the results of its operations for the year then ended, the changes in its net assets for each of the two years in the period then ended and its financial highlights for each of the five years in the period then ended, in conformity with U.S. generally accepted accounting principles.
Basis for Opinion
These financial statements are the responsibility of the Trust’s management. Our responsibility is to express an opinion on the Fund’s financial statements based on our audits. We are a public accounting firm registered with the Public Company Accounting Oversight Board (United States) (“PCAOB”) and are required to be independent with respect to the Trust in accordance with the U.S. federal securities laws and the applicable rules and regulations of the Securities and Exchange Commission and the PCAOB.
We conducted our audits in accordance with the standards of the PCAOB. Those standards require that we plan and perform the audit to obtain reasonable assurance about whether the financial statements are free of material misstatement, whether due to error or fraud. The Trust is not required to have, nor were we engaged to perform, an audit of the Trust’s internal control over financial reporting. As part of our audits, we are required to obtain an understanding of internal control over financial reporting, but not for the purpose of expressing an opinion on the effectiveness of the Trust’s internal control over financial reporting. Accordingly, we express no such opinion.
Our audits included performing procedures to assess the risks of material misstatement of the financial statements, whether due to error or fraud, and performing procedures that respond to those risks. Such procedures included examining, on a test basis, evidence regarding the amounts and disclosures in the financial statements. Our procedures included confirmation of securities owned as of December 31, 2020, by correspondence with the custodian and others or by other appropriate auditing procedures where replies from others were not received. Our audits also included evaluating the accounting principles used and significant estimates made by management, as well as evaluating the overall presentation of the financial statements. We believe that our audits provide a reasonable basis for our opinion.

We have served as the auditor of one or more investment companies in the DWS family of funds since at least 1979, but we are unable to determine the specific year.
Boston, Massachusetts
February 12, 2021
| | | | | | |
| | 18 | | | | | | Deutsche DWS Variable Series II — DWS International Growth VIP |
| | |
| Information About Your Fund’s Expenses | | (Unaudited) |
As an investor of the Fund, you incur two types of costs: ongoing expenses and transaction costs. Ongoing expenses include management fees, distribution and service (12b-1) fees and other Fund expenses. Examples of transaction costs include contract charges, which are not shown in this section. The following tables are intended to help you understand your ongoing expenses (in dollars) of investing in the Fund and to help you compare these expenses with the ongoing expenses of investing in other mutual funds. In the most recent six-month period, the Fund limited these expenses; had it not done so, expenses would have been higher. The example in the table is based on an investment of $1,000 invested at the beginning of the six-month period and held for the entire period (July 1, 2020 to December 31, 2020).
The tables illustrate your Fund’s expenses in two ways:
| – | | Actual Fund Return. This helps you estimate the actual dollar amount of ongoing expenses (but not transaction costs) paid on a $1,000 investment in the Fund using the Fund’s actual return during the period. To estimate the expenses you paid over the period, simply divide your account value by $1,000 (for example, an $8,600 account value divided by $1,000 = 8.6), then multiply the result by the number in the “Expenses Paid per $1,000” line under the share class you hold. |
| – | | Hypothetical 5% Fund Return. This helps you to compare your Fund’s ongoing expenses (but not transaction costs) with those of other mutual funds using the Fund’s actual expense ratio and a hypothetical rate of return of 5% per year before expenses. Examples using a 5% hypothetical Fund return may be found in the shareholder reports of other mutual funds. The hypothetical account values and expenses may not be used to estimate the actual ending account balance or expenses you paid for the period. |
Please note that the expenses shown in these tables are meant to highlight your ongoing expenses only and do not reflect any transaction costs. The “Expenses Paid per $1,000” line of the tables is useful in comparing ongoing expenses only and will not help you determine the relative total expense of owning different funds. If these transaction costs had been included, your costs would have been higher.
| | | | | | | | |
| Expenses and Value of a $1,000 Investment for the six months ended December 31, 2020 | | | | |
| | |
| Actual Fund Return | | | Class A | | | | Class B | |
| Beginning Account Value 7/1/20 | | $ | 1,000.00 | | | $ | 1,000.00 | |
| Ending Account Value 12/31/20 | | $ | 1,236.90 | | | $ | 1,233.90 | |
| Expenses Paid per $1,000* | | $ | 4.89 | | | $ | 6.68 | |
| | |
| Hypothetical 5% Fund Return | | | | | | | | |
| Beginning Account Value 7/1/20 | | $ | 1,000.00 | | | $ | 1,000.00 | |
| Ending Account Value 12/31/20 | | $ | 1,020.76 | | | $ | 1,019.15 | |
| Expenses Paid per $1,000* | | $ | 4.42 | | | $ | 6.04 | |
| * | Expenses are equal to the Fund’s annualized expense ratio for each share class, multiplied by the average account value over the period, multiplied by 184 (the number of days in the most recent six-month period), then divided by 366. |
| | | | | | | | |
| Annualized Expense Ratios | | Class A | | | Class B | |
| Deutsche DWS Variable Series II — DWS International Growth VIP | | | .87 | % | | | 1.19 | % |
For more information, please refer to the Fund’s prospectus.
These tables do not reflect charges and fees (“contract charges”) associated with the separate account that invests in the Fund or any variable life insurance policy or variable annuity contract for which the Fund is an investment option.
For an analysis of the fees associated with an investment in the Fund or similar funds, please refer to the current and hypothetical expense calculators for Variable Insurance Products which can be found at dws.com/calculators.
| | | | |
Deutsche DWS Variable Series II — DWS International Growth VIP | | | | | 19 |
| | |
| Tax Information | | (Unaudited) |
Pursuant to Section 852 of the Internal Revenue Code, the Fund designates $250,000 as capital gain
dividends for its year ended December 31, 2020.
For corporate shareholders, 3% of the ordinary dividends (i.e., income dividends plus short-term capital gains) paid during the Fund’s fiscal year ended December 31, 2020, qualified for the dividends received deduction.
The Fund paid foreign taxes of $22,737 and earned $80,616 of foreign source income during the year ended December 31, 2020. Pursuant to Section 853 of the Internal Revenue Code, the Fund designates $0.02 per share as foreign taxes paid and $0.07 per share as income earned from foreign sources for the year ended December 31, 2020.
Please consult a tax advisor if you have questions about federal or state income tax laws, or on how toprepare your tax returns. If you have specific questions about your account, please contact your insurance provider.
Proxy Voting
The Trust’s policies and procedures for voting proxies for portfolio securities and information about how the Trust voted proxies related to its portfolio securities during the most recent 12-month period ended June 30 are available on our Web site — dws.com/en-us/resources/proxy-voting — or on the SEC’s Web site — sec.gov. To obtain a written copy of the Trust’s policies and procedures without charge, upon request, call us toll free at (800) 728-3337.
| | | | | | |
| | 20 | | | | | | Deutsche DWS Variable Series II — DWS International Growth VIP |
Advisory Agreement Board Considerations and Fee Evaluation
The Board of Trustees (hereinafter referred to as the “Board” or “Trustees”) approved the renewal of DWS International Growth VIP’s (the “Fund”) investment management agreement (the “Agreement”) with DWS Investment Management Americas, Inc. (“DIMA”) in September 2020.
In terms of the process that the Board followed prior to approving the Agreement, shareholders should know that:
| – | | During the entire process, all of the Fund’s Trustees were independent of DIMA and its affiliates (the “Independent Trustees”). |
| – | | The Board met frequently during the past year to discuss fund matters and dedicated a substantial amount of time to contract review matters. Over the course of several months, the Board reviewed extensive materials received from DIMA, independent third parties and independent counsel. These materials included an analysis of the Fund’s performance, fees and expenses, and profitability from a fee consultant retained by the Fund’s Independent Trustees (the “Fee Consultant”). |
| – | | The Board also received extensive information throughout the year regarding performance of the Fund. |
| – | | The Independent Trustees regularly met privately with counsel to discuss contract review and other matters. In addition, the Independent Trustees were advised by the Fee Consultant in the course of their review of the Fund’s contractual arrangements and considered a comprehensive report prepared by the Fee Consultant in connection with their deliberations. |
| – | | In connection with reviewing the Agreement, the Board also reviewed the terms of the Fund’s Rule 12b-1 plan, distribution agreement, administrative services agreement, transfer agency agreement and other material service agreements. |
In connection with the contract review process, the Board considered the factors discussed below, among others. The Board also considered that DIMA and its predecessors have managed the Fund since its inception, and the Board believes that a long-term relationship with a capable, conscientious advisor is in the best interests of the Fund. The Board considered, generally, that shareholders chose to invest or remain invested in the Fund knowing that DIMA managed the Fund. DIMA is part of DWS Group GmbH & Co. KGaA (“DWS Group”). DWS Group is a global asset management business that offers a wide range of investing expertise and resources, including research capabilities in many countries throughout the world. In 2018, approximately 20% of DWS Group’s shares were sold in an initial public offering, with Deutsche Bank AG owning the remaining shares.
As part of the contract review process, the Board carefully considered the fees and expenses of each DWS fund overseen by the Board in light of the fund’s performance. In many cases, this led to the negotiation and implementation of expense caps.
While shareholders may focus primarily on fund performance and fees, the Fund’s Board considers these and many other factors, including the quality and integrity of DIMA’s personnel and administrative support services provided by DIMA, such as back-office operations, fund valuations, and compliance policies and procedures.
Nature, Quality and Extent of Services. The Board considered the terms of the Agreement, including the scope of advisory services provided under the Agreement. The Board noted that, under the Agreement, DIMA provides portfolio management services to the Fund and that, pursuant to a separate administrative services agreement, DIMA provides administrative services to the Fund. The Board considered the experience and skills of senior management and investment personnel and the resources made available to such personnel. The Board also considered the risks to DIMA in sponsoring or managing the Fund, including financial, operational and reputational risks, the potential economic impact to DIMA from such risks and DIMA’s approach to addressing such risks. The Board reviewed the Fund’s performance over short-term and long-term periods and compared those returns to various agreed-upon performance measures, including market index(es) and a peer universe compiled using information supplied by Morningstar Direct (“Morningstar”), an independent fund data service. The Board also noted that it has put into place a process of identifying “Funds in Review” (e.g., funds performing poorly relative to a peer universe), and receives additional reporting from DIMA regarding such funds and, where appropriate, DIMA’s plans to address underperformance. The Board believes this process is an effective manner of identifying and addressing underperforming funds. Based on the information provided, the Board noted that, for the one-, three- and five-year periods ended December 31, 2019, the Fund’s performance (Class A shares) was in the 1st quartile, 4th quartile and 3rd quartile, respectively, of the applicable Morningstar universe (the 1st quartile being the
| | | | |
Deutsche DWS Variable Series II — DWS International Growth VIP | | | | | 21 |
best performers and the 4th quartile being the worst performers). The Board also observed that the Fund has outperformed its benchmark in the one-, three- and five-year periods ended December 31, 2019.
Fees and Expenses. The Board considered the Fund’s investment management fee schedule, operating expenses and total expense ratios, and comparative information provided by Broadridge Financial Solutions, Inc. (“Broadridge”) and the Fee Consultant regarding investment management fee rates paid to other investment advisors by similar funds (1st quartile being the most favorable and 4th quartile being the least favorable). With respect to management fees paid to other investment advisors by similar funds, the Board noted that the contractual fee rates paid by the Fund, which include a 0.10% fee paid to DIMA under the Fund’s administrative services agreement, were lower than the median (1st quartile) of the applicable Broadridge peer group (based on Broadridge data provided as of December 31, 2019). The Board noted that, effective March 1, 2020, the fee paid to DIMA under the Fund’s administrative services agreement was reduced to 0.097%. The Board noted that the Fund’s Class A shares total (net) operating expenses were expected to be higher than the median (3rd quartile) of the applicable Broadridge expense universe (based on Broadridge data provided as of December 31, 2019, and analyzing Broadridge expense universe Class A (net) expenses less any applicable 12b-1 fees) (“Broadridge Universe Expenses”). The Board also reviewed data comparing each other operational share class’s total (net) operating expenses to the applicable Broadridge Universe Expenses. The Board noted that the expense limitations agreed to by DIMA were expected to help the Fund’s total (net) operating expenses remain competitive. The Board considered the Fund’s management fee rate as compared to fees charged by DIMA to a comparable DWS U.S. registered fund (“DWS Funds”) and considered differences between the Fund and the comparable DWS Fund. The information requested by the Board as part of its review of fees and expenses also included information about institutional accounts (including any sub-advised funds and accounts) and funds offered primarily to European investors (“DWS Europe Funds”) managed by DWS Group. The Board noted that DIMA indicated that DWS Group does not manage any institutional accounts or DWS Europe Funds comparable to the Fund.
On the basis of the information provided, the Board concluded that management fees were reasonable and appropriate in light of the nature, quality and extent of services provided by DIMA.
Profitability. The Board reviewed detailed information regarding revenues received by DIMA under the Agreement. The Board considered the estimated costs to DIMA, and pre-tax profits realized by DIMA, from advising the DWS Funds, as well as estimates of the pre-tax profits attributable to managing the Fund in particular. The Board also received information regarding the estimated enterprise-wide profitability of DIMA and its affiliates with respect to all fund services in totality and by fund. The Board and the Fee Consultant reviewed DIMA’s methodology in allocating its costs to the management of the Fund. Based on the information provided, the Board concluded that the pre-tax profits realized by DIMA in connection with the management of the Fund were not unreasonable. The Board also reviewed certain publicly available information regarding the profitability of certain similar investment management firms. The Board noted that, while information regarding the profitability of such firms is limited (and in some cases is not necessarily prepared on a comparable basis), DIMA and its affiliates’ overall profitability with respect to the DWS Funds (after taking into account distribution and other services provided to the funds by DIMA and its affiliates) was lower than the overall profitability levels of most comparable firms for which such data was available.
Economies of Scale. The Board considered whether there are economies of scale with respect to the management of the Fund and whether the Fund benefits from any economies of scale. In this regard, the Board observed that while the Fund’s current investment management fee schedule does not include breakpoints, the Fund’s fee schedule represents an appropriate sharing between the Fund and DIMA of such economies of scale as may exist in the management of the Fund at current asset levels.
Other Benefits to DIMA and Its Affiliates. The Board also considered the character and amount of other incidental or “fall-out” benefits received by DIMA and its affiliates, including any fees received by DIMA for administrative services provided to the Fund, any fees received by an affiliate of DIMA for transfer agency services provided to the Fund and any fees received by an affiliate of DIMA for distribution services. The Board also considered benefits to DIMA related to brokerage and soft-dollar allocations, including allocating brokerage to pay for research generated by parties other than the executing broker dealers, which pertain primarily to funds investing in equity securities. In addition, the Board considered the incidental public relations benefits to DIMA related to DWS Funds advertising and cross-selling opportunities among DIMA products and services. The Board considered these benefits in reaching its conclusion that the Fund’s management fees were reasonable.
Compliance. The Board considered the significant attention and resources dedicated by DIMA to its compliance processes in recent years. The Board noted in particular (i) the experience, seniority and time
| | | | | | |
| | 22 | | | | | | Deutsche DWS Variable Series II — DWS International Growth VIP |
commitment of the individuals serving as DIMA’s and the Fund’s chief compliance officers and (ii) the substantial commitment of resources by DIMA and its affiliates to compliance matters, including the retention of compliance personnel.
The Board also considered that on September 24, 2020, the SEC granted a temporary order permitting DIMA and its affiliates to continue providing investment advisory and underwriting services to the DWS Funds notwithstanding a consent order entered into by Deutsche Bank AG on June 17, 2020 (the “Consent Order”). The Board noted that the temporary order was granted effective as of the date of the Consent Order. The Board also noted various representations by DIMA to the Board relating to the Consent Order, including that the conduct giving rise to the Consent Order (unintentional conduct that resulted from a system outage that prevented Deutsche Bank AG from reporting data in accordance with applicable CFTC requirements for five days in April 2016) did not involve any DWS Fund or services DIMA and its affiliates provide to the DWS Funds, that DIMA and its personnel had no involvement in the alleged conduct giving rise to the Consent Order, and that the DWS Funds would not bear any financial impact or costs relating to the Consent Order.
Based on all of the information considered and the conclusions reached, the Board determined that the continuation of the Agreement is in the best interests of the Fund. In making this determination, the Board did not give particular weight to any single factor identified above. The Board considered these factors over the course of numerous meetings, certain of which were in executive session with only the Independent Trustees and counsel present. It is possible that individual Independent Trustees may have weighed these factors differently in reaching their individual decisions to approve the continuation of the Agreement.
| | | | |
Deutsche DWS Variable Series II — DWS International Growth VIP | | | | | 23 |
Board Members and Officers
The following table presents certain information regarding the Board Members and Officers of the Trust/Corporation. Each Board Member’s year of birth is set forth in parentheses after his or her name. Unless otherwise noted, (i) each Board Member has engaged in the principal occupation(s) noted in the table for at least the most recent five years, although not necessarily in the same capacity; and (ii) the address of each Independent Board Member is Keith R. Fox, DWS Funds Board Chair, c/o Thomas R. Hiller, Ropes & Gray LLP, Prudential Tower, 800 Boylston Street, Boston, MA 02199-3600. Except as otherwise noted below, the term of office for each Board Member is until the election and qualification of a successor, or until such Board Member sooner dies, resigns, is removed or as otherwise provided in the governing documents of the Trust/Corporation. Because the Fund does not hold an annual meeting of shareholders, each Board Member will hold office for an indeterminate period.
The Board Members may also serve in similar capacities with other funds in the fund complex. The number of funds in the DWS fund complex shown in the table below includes all registered open- and closed-end funds (including all of their portfolios) advised by the Advisor and any registered funds that have an investment advisor that is an affiliated person of the Advisor.
| | | | | | | | |
| Independent Board Members | | | |
Name, Year of Birth,
Position with the Trust/
Corporation and
Length of Time Served1 | | Business Experience and Directorships During the Past Five Years | | Number of
Funds in
DWS Fund
Complex
Overseen | | | Other
Directorships
Held by Board
Member
|
Keith R. Fox, CFA (1954) Chairperson since 2017, and Board Member since 1996 | | Managing General Partner, Exeter Capital Partners (a series of private investment funds) (since 1986). Directorships: Progressive International Corporation (kitchen goods importer and distributor); former Chairman, National Association of Small Business Investment Companies; former Directorships: ICI Mutual Insurance Company; BoxTop Media Inc. (advertising); Sun Capital Advisers Trust (mutual funds) (2011–2012) | | | 73 | | | — |
John W. Ballantine (1946) Board Member since 1999 | | Retired; formerly, Executive Vice President and Chief Risk Management Officer, First Chicago NBD Corporation/The First National Bank of Chicago (1996–1998); Executive Vice President and Head of International Banking (1995–1996); former Directorships: Director and Chairman of the Board, Healthways, Inc.2 (population well-being and wellness services) (2003–2014); Stockwell Capital Investments PLC (private equity); Enron Corporation; FNB Corporation; Tokheim Corporation; First Oak Brook Bancshares, Inc.; Oak Brook Bank; and Prisma Energy International. Not-for-Profit Director/Trustee: Palm Beach Civic Association; Window to the World Communications (public media); Life Director of Harris Theater for Music and Dance (Chicago); Life Director of Hubbard Street Dance Chicago; former Not-for-Profit Directorships: Public Radio International | | | 73 | | | Portland
General
Electric2
(utility
company)
(2003–
present) |
Dawn-Marie Driscoll (1946) Board Member since 1987 | | Emeritus Executive Fellow, Center for Business Ethics, Bentley University; formerly: Partner, Palmer & Dodge (law firm) (1988–1990); Vice President of Corporate Affairs and General Counsel, Filene’s (retail) (1978–1988). Directorships: Advisory Board, Center for Business Ethics, Bentley University; Trustee and former Chairman of the Board, Southwest Florida Community Foundation (charitable organization); former Directorships: ICI Mutual Insurance Company (2007–2015); Sun Capital Advisers Trust (mutual funds) (2007–2012), Investment Company Institute (audit, executive, nominating committees) and Independent Directors Council (governance, executive committees) | | | 73 | | | — |
Richard J. Herring (1946) Board Member since 1990 | | Jacob Safra Professor of International Banking and Professor of Finance, The Wharton School, University of Pennsylvania (since July 1972); Director, The Wharton Financial Institutions Center (since 1994); formerly: Vice Dean and Director, Wharton Undergraduate Division (1995–2000) and Director, The Lauder Institute of International Management Studies (2000–2006); Member FDIC Systemic Risk Advisory Committee since 2011, member Systemic Risk Council since 2012 and member of the Advisory Board at the Yale Program on Financial Stability since 2013; Formerly Co-Chair of the Shadow Financial Regulatory Committee (2003–2015), Executive Director of The Financial Economists Roundtable (2008–2015), Director of The Thai Capital Fund (2007–2013), Director of The Aberdeen Singapore Fund (2007–2018), and Nonexecutive Director of Barclays Bank DE (2010–2018) | | | 73 | | | Director,
Aberdeen
Japan Fund
(since 2007) |
William McClayton (1944) Board Member since 2004 | | Private equity investor (since October 2009); previously, Managing Director, Diamond Management & Technology Consultants, Inc. (global consulting firm) (2001–2009); Directorship: Board of Managers, YMCA of Metropolitan Chicago; formerly: Senior Partner, Arthur Andersen LLP (accounting) (1966–2001); Trustee, Ravinia Festival | | | 73 | | | — |
| | | | | | |
| | 24 | | | | | | Deutsche DWS Variable Series II — DWS International Growth VIP |
| | | | | | | | |
Name, Year of Birth,
Position with the Trust/
Corporation and
Length of Time Served1 | | Business Experience and Directorships During the Past Five Years | | Number of
Funds in
DWS Fund
Complex
Overseen | | | Other
Directorships
Held by Board
Member
|
Rebecca W. Rimel (1951) Board Member since 1995 | | Senior Advisor, The Pew Charitable Trusts (charitable organization) (since July 2020); formerly: Executive Vice President, The Glenmede Trust Company (investment trust and wealth management) (1983–2004); Board Member, Investor Education (charitable organization) (2004–2005); Trustee, Executive Committee, Philadelphia Chamber of Commerce (2001–2007); Director, Viasys Health Care2 (January 2007–June 2007); Trustee, Thomas Jefferson Foundation (charitable organization) (1994–2012); President, Chief Executive Officer and Director, The Pew Charitable Trusts (charitable organization) (1994–2020) | | | 73 | | | Director,
Becton
Dickinson
and
Company2
(medical
technology
company)
(2012–
present);
Director,
BioTelemetry
Inc.2 (health
care) (2009–
present) |
William N. Searcy, Jr. (1946) Board Member since 1993 | | Private investor since October 2003; formerly: Pension & Savings Trust Officer, Sprint Corporation2 (telecommunications) (November 1989–September 2003); Trustee, Sun Capital Advisers Trust (mutual funds) (1998–2012) | | | 73 | | | — |
| | |
| Officers4 | | |
Name, Year of Birth,
Position with the Trust/
Corporation and
Length of Time Served5 | | Business Experience and Directorships During the Past Five Years |
Hepsen Uzcan6 (1974) President and Chief Executive Officer, 2017–present | | Managing Director3, DWS; Secretary, DWS USA Corporation (2018–present); Assistant Secretary, DWS Distributors, Inc. (2018–present); Director and Vice President, DWS Service Company (2018–present); Assistant Secretary, DWS Investment Management Americas, Inc. (2018–present); Director and President, DB Investment Managers, Inc. (2018–present); President and Chief Executive Officer, The European Equity Fund, Inc., The New Germany Fund, Inc. and The Central and Eastern Europe Fund, Inc. (2017–present); formerly: Vice President for the Deutsche funds (2016–2017); Assistant Secretary for the DWS funds (2013–2019); Assistant Secretary, The European Equity Fund, Inc., The New Germany Fund, Inc. and The Central and Eastern Europe Fund, Inc. (2013–2020); Directorships: Interested Director, The European Equity Fund, Inc., The New Germany Fund, Inc. and The Central and Eastern Europe Fund, Inc. (since June 25, 2020); ICI Mutual Insurance Company (since October 16, 2020); and Episcopalian Charities of New York (2018–present) |
John Millette7 (1962) Vice President and Secretary, 1999–present | | Director,3 DWS; Chief Legal Officer, DWS Investment Management Americas, Inc. (2015–present); Director and Vice President, DWS Trust Company (2016–present); Secretary, DBX ETF Trust (2020–present); Secretary, The European Equity Fund, Inc., The New Germany Fund, Inc. and The Central and Eastern Europe Fund, Inc. (2011–present); formerly: Secretary, Deutsche Investment Management Americas Inc. (2015–2017); Assistant Secretary, DBX ETF Trust (2019–2020); Assistant Secretary (July 14, 2006–December 31, 2010) and Secretary (January 31, 2006–July 13, 2006), The European Equity Fund, Inc., The New Germany Fund, Inc. and The Central and Eastern Europe Fund, Inc. |
Ciara Crawford8 (1984) Assistant Secretary, (2019–present) | | Associate, DWS (since 2015); previously, Legal Assistant at Accelerated Tax Solutions. |
Diane Kenneally7 (1966) Chief Financial Officer and Treasurer, 2018–present | | Director,3 DWS; Treasurer, Chief Financial Officer and Controller, DBX ETF Trust (2019–present); Treasurer and Chief Financial Officer, The European Equity Fund, Inc., The New Germany Fund, Inc. and The Central and Eastern Europe Fund, Inc. (2018–present); formerly: Assistant Treasurer for the DWS funds (2007–2018) |
Paul Antosca7 (1957) Assistant Treasurer, 2007–present | | Director,3 DWS; and Assistant Treasurer, DBX ETF Trust (2019–present) |
Sheila Cadogan7 (1966) Assistant Treasurer, 2017–present | | Director,3 DWS; Director and Vice President, DWS Trust Company (2018–present); Assistant Treasurer, DBX ETF Trust (2019–present); Assistant Treasurer, The European Equity Fund, Inc., The New Germany Fund, Inc. and The Central and Eastern Europe Fund, Inc. (2018–present) |
Scott D. Hogan7 (1970) Chief Compliance Officer, 2016–present | | Director,3 DWS; Chief Compliance Officer, The European Equity Fund, Inc., The New Germany Fund, Inc. and The Central and Eastern Europe Fund, Inc. (2016–present) |
Caroline Pearson7 (1962) Chief Legal Officer, 2010–present | | Managing Director3, DWS; Assistant Secretary, DBX ETF Trust (2020–present); Chief Legal Officer, DBX Advisors LLC and DBX Strategic Advisors LLC (2020–present); Chief Legal Officer, The European Equity Fund, Inc., The New Germany Fund, Inc. and The Central and Eastern Europe Fund, Inc. (2012–present); formerly: Secretary, Deutsche AM Distributors, Inc. (2002–2017); and Secretary, Deutsche AM Service Company (2010–2017) |
| | | | |
Deutsche DWS Variable Series II — DWS International Growth VIP | | | | | 25 |
| | |
Name, Year of Birth,
Position with the Trust/
Corporation and
Length of Time Served5 | | Business Experience and Directorships During the Past Five Years |
Michelle Goveia-Pine6 (1970) Interim Anti-Money Laundering Compliance Officer, since July 10, 2020 | | Director,3 DWS; Interim AML Officer, DWS Trust Company (since July 28, 2020); Interim AML Officer, DBX ETF Trust (since July 9, 2020); Interim AML Officer, The European Equity Fund, Inc., The New Germany Fund, Inc. and The Central and Eastern Europe Fund, Inc. (since July 24, 2020) |
| 1 | The length of time served represents the year in which the Board Member joined the board of one or more DWS funds currently overseen by the Board. |
| 2 | A publicly held company with securities registered pursuant to Section 12 of the Securities Exchange Act of 1934. |
| 3 | Executive title, not a board directorship. |
| 4 | As a result of their respective positions held with the Advisor or its affiliates, these individuals are considered “interested persons” of the Advisor within the meaning of the 1940 Act. Interested persons receive no compensation from the Fund. |
| 5 | The length of time served represents the year in which the officer was first elected in such capacity for one or more DWS funds. |
| 6 | Address: 875 Third Avenue, New York, NY 10022. |
| 7 | Address: 100 Summer Street, Boston, MA 02110. |
| 8 | Address: 5022 Gate Parkway, Suite 400, Jacksonville, FL 32256. |
The Fund’s Statement of Additional Information (“SAI”) includes additional information about the Board Members. The SAI is available, without charge, upon request. If you would like to request a copy of the SAI, you may do so by calling the following toll-free number: (800) 728-3337.
| | | | | | |
| | 26 | | | | | | Deutsche DWS Variable Series II — DWS International Growth VIP |
Notes
| | |
| | |
VS2IG-2 (R-025830-11 2/21) | | |
December 31, 2020
Annual Report
Deutsche DWS Variable Series II
DWS Small Mid Cap Growth VIP

Contents
| | | | |
| | 3 | | | Performance Summary |
| | 4 | | | Management Summary |
| | 6 | | | Portfolio Summary |
| | 7 | | | Investment Portfolio |
| | 10 | | | Statement of Assets and Liabilities |
| | 10 | | | Statement of Operations |
| | 11 | | | Statements of Changes in Net Assets |
| | 12 | | | Financial Highlights |
| | 13 | | | Notes to Financial Statements |
| | 18 | | | Report of Independent Registered Public Accounting Firm |
| | 19 | | | Information About Your Fund’s Expenses |
| | 20 | | | Tax Information |
| | 20 | | | Proxy Voting |
| | 21 | | | Advisory Agreement Board Considerations and Fee Evaluation |
| | 24 | | | Board Members and Officers |
This report must be preceded or accompanied by a prospectus. To obtain an additional prospectus or summary prospectus, if available, call (800) 728-3337 or your financial representative. We advise you to consider the Fund’s objectives, risks, charges and expenses carefully before investing. The summary prospectus and prospectus contain this and other important information about the Fund. Please read the prospectus carefully before you invest.
Stocks may decline in value. Smaller and medium company stocks tend to be more volatile than large company stocks. Any fund that focuses in a particular segment of the market or region of the world will generally be more volatile than a fund that invests more broadly. Investing in foreign securities presents certain risks, such as currency fluctuations, political and economic changes, and market risks. The Fund may lend securities to approved institutions. Please read the prospectus for details.
War, terrorism, economic uncertainty, trade disputes, public health crises (including the recent pandemic spread of the novel coronavirus) and related geopolitical events could lead to increased market volatility, disruption to U.S. and world economies and markets and may have significant adverse effects on the Fund and its investments.
The brand DWS represents DWS Group GmbH & Co. KGaA and any of its subsidiaries such as DWS Distributors, Inc. which offers investment products or DWS Investment Management Americas, Inc. and RREEF America L.L.C. which offer advisory services.
DWS Distributors, Inc., 222 South Riverside Plaza, Chicago, IL 60606, (800) 621-1148
NOT FDIC/NCUA INSURED NO BANK GUARANTEE MAY LOSE VALUE NOT A DEPOSIT
NOT INSURED BY ANY FEDERAL GOVERNMENT AGENCY
| | | | | | |
| | 2 | | | | | | Deutsche DWS Variable Series II — DWS Small Mid Cap Growth VIP |
| | |
| Performance Summary | | December 31, 2020 (Unaudited) |
Fund performance shown is historical, assumes reinvestment of all dividend and capital gain distributions and does not guarantee future results. Investment return and principal value fluctuate with changing market conditions so that, when redeemed, shares may be worth more or less than their original cost. Current performance may be lower or higher than the performance data quoted. Please contact your participating insurance company for the Fund’s most recent month-end performance. Performance does not reflect charges and fees (“contract charges”) associated with the separate account that invests in the Fund or any variable life insurance policy or variable annuity contract for which the Fund is an investment option. These charges and fees will reduce returns.
The gross expense ratio of the Fund, as stated in the fee table of the prospectus dated May 1, 2020 is 0.82% for Class A shares and may differ from the expense ratio disclosed in the Financial Highlights table in this report.
Generally accepted accounting principles require adjustments to be made to the net assets of the Fund at period end for financial reporting purposes only, and as such, the total return based on the unadjusted net asset value per share may differ from the total return reported in the financial highlights.
Growth of an Assumed $10,000 Investment
| | |
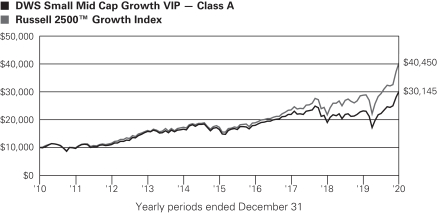
| | The Russell 2500TM Growth Index is an unmanaged index that measures the performance of the small to mid-cap growth segment of the U.S. equity universe. It includes those Russell 2500 companies with higher price-to-book ratios and higher forecasted growth values. Index returns do not reflect any fees or expenses and it is not possible to invest directly into an index. |
| | | | | | | | | | |
| Comparative Results | | | | | | | | | | |
| | | | |
| DWS Small Mid Cap Growth VIP | | 1-Year | | 3-Year | | 5-Year | | 10-Year |
| Class A | | Growth of $10,000 | | $13,018 | | $13,770 | | $18,342 | | $30,145 |
| | | Average annual total return | | 30.18% | | 11.25% | | 12.90% | | 11.67% |
| Russell 2500 Growth Index | | Growth of $10,000 | | $14,047 | | $17,242 | | $23,547 | | $40,450 |
| | | Average annual total return | | 40.47% | | 19.91% | | 18.68% | | 15.00% |
The growth of $10,000 is cumulative.
| | | | |
Deutsche DWS Variable Series II — DWS Small Mid Cap Growth VIP | | | | | 3 |
| | |
| Management Summary | | December 31, 2020 (Unaudited) |
For the 12-month period ended December 31, 2020, the Fund returned 30.18% (Class A shares, unadjusted for contract charges), compared with the 40.47% return of the Russell 2500™ Growth Index.
Following a benign start to 2020, equities moved sharply lower in mid-February amid mounting concerns regarding the potential impact of the COVID-19 outbreak on the global economy. The market downturn proved relatively short in duration, however, as central banks slashed interest rates and announced a number of measures to promote growth and liquidity. Governments worldwide augmented the monetary stimulus with fiscal spending packages. Taken together, these actions helped to foster investor confidence that government support would help to keep the economy afloat until the pandemic dissipates, sparking a market rally that lasted from late March until the end of August. Although the market’s advance paused in the fall due to a second wave of coronavirus cases and uncertainty surrounding the U.S. election, the rally resumed in late 2020 following the approval of two vaccines. Small- and mid-cap stocks performed particularly well during this time, as investors began to look for opportunities outside the U.S. mega-cap technology segment.
The portfolio’s underperformance during the 12-month period was primarily concentrated within the information technology and health care sectors. Within information technology, the portfolio’s positioning in the software and IT services industries did not keep pace with the benchmark, as companies positioned to benefit from work-from-home spending saw their shares soar during this period. In terms of individual securities, the portfolio’s holdings in the cloud contact software firm Five9, Inc., recreational vehicle (RV) company Camping World Holdings, Inc. and health care services firm ModivCare Inc.* (formerly Providence Service Corp.) contributed to performance during the period. Five9, which enables businesses to better utilize, analyze and adapt their workforce in the cloud, enjoyed favorable financial results. Camping World experienced a significant increase in sales over the period, as RVs were viewed by many as the safest means for travel/vacation during the pandemic. ModivCare, the largest provider of non-emergency medical transportation services in the United States, has been able to deliver consistent revenue in line with strong Medicaid enrollment growth. Conversely, holdings in industrial process heating solutions company Thermon Group Holdings, Inc., private security firm The Brink’s Co. and health care staffing company AMN Healthcare Services, Inc. detracted from performance. In the case of Thermon Group, the company was negatively impacted by reduced energy demand, trimmed-down capital spending plans and delayed project completions. Shares of Brink’s suffered as the company announced the poorly timed acquisition of British security firm G4S plc* in late February, taking on additional leverage just as many of Brink’s “non-essential business” retail clients were shutting down due to quarantine orders. Lastly, AMN Healthcare saw strong demand for nurses but also was temporarily pressured by elevated costs during the period.
Going forward, we believe that the investment backdrop remains favorable for small- and mid-cap stocks, as growth appears set to improve in 2021, which would create supportive conditions for these companies. Inflationary pressures also appear to be mounting, which could represent a tailwind given that rising inflation has been correlated with outperformance for small caps over time. In this environment, we believe that the investment universe provides highly fertile territory for bottom-up investors to identify growing, undervalued and undiscovered companies.
Peter Barsa, Director
Michael A. Sesser, CFA, Director
Portfolio Managers
The views expressed reflect those of the portfolio management team only through the end of the period of the report as stated on the cover. The management team’s views are subject to change at any time based on market and other conditions and should not be construed as a recommendation. Past performance is no guarantee of future results. Current and future portfolio holdings are subject to risk.
| | | | | | |
| | 4 | | | | | | Deutsche DWS Variable Series II — DWS Small Mid Cap Growth VIP |
Terms to Know
The Russell 2500TM Growth Index is an unmanaged index that measures the performance of the small- to midcap growth segment of the U.S. equity universe. It includes those Russell 2500 companies with higher price-to-book ratios and higher forecasted growth values. Index returns do not reflect any fees or expenses and it is not possible to invest directly into an index.
Contribution and detraction incorporate both a stock’s total return and its weighting in the Fund.
| * | Not held at December 31, 2020. |
| | | | |
Deutsche DWS Variable Series II — DWS Small Mid Cap Growth VIP | | | | | 5 |
| | |
| Portfolio Summary | | (Unaudited) |
| | | | | | | | |
| Asset Allocation (As a % of Investment Portfolio excluding Securities Lending Collateral) | | 12/31/20 | | | 12/31/19 | |
| Common Stocks | | | 97% | | | | 98% | |
| Cash Equivalents | | | 2% | | | | 1% | |
| Exchange-Traded Funds | | | 1% | | | | — | |
| Convertible Preferred Stock | | | — | | | | 1% | |
| | | | 100% | | | | 100% | |
| | |
Sector Diversification
(As a % of Investment Portfolio excluding Cash Equivalents, Exchange-Traded Funds and Securities Lending
Collateral) | | 12/31/20 | | | 12/31/19 | |
Information Technology | | | 29% | | | | 24% | |
Health Care | | | 29% | | | | 24% | |
Industrials | | | 14% | | | | 20% | |
Consumer Discretionary | | | 13% | | | | 15% | |
Financials | | | 5% | | | | 6% | |
Materials | | | 4% | | | | 3% | |
Real Estate | | | 3% | | | | 4% | |
Consumer Staples | | | 2% | | | | 2% | |
Communication Services | | | 1% | | | | 1% | |
Energy | | | 0% | | | | 1% | |
| | | | 100% | | | | 100% | |
Portfolio holdings and characteristics are subject to change.
For more complete details about the Fund’s investment portfolio, see page 7.
Following the Fund’s fiscal first and third quarter-end, a complete portfolio holdings listing is posted on dws.com, and is available free of charge by contacting your financial intermediary, or if you are a direct investor, by calling (800) 728-3337. In addition, the portfolio holdings listing is filed with the SEC on the Fund’s Form N-PORT and will be available on the SEC’s Web site at sec.gov. Additional portfolio holdings for the Fund are also posted on dws.com from time to time. Please see the Fund’s current prospectus for more information.
| | | | | | |
| | 6 | | | | | | Deutsche DWS Variable Series II — DWS Small Mid Cap Growth VIP |
| | |
| Investment Portfolio | | as of December 31, 2020 |
| | | | | | | | |
| | | Shares | | | Value ($) | |
| Common Stocks 97.4% | |
| Communication Services 0.9% | |
Diversified Telecommunication Services 0.3% | |
| | |
Bandwidth, Inc. “A”* | | | 1,484 | | | | 228,046 | |
|
Entertainment 0.6% | |
| | |
Take-Two Interactive Software, Inc.* | | | 2,174 | | | | 451,736 | |
|
| Consumer Discretionary 13.1% | |
Auto Components 0.9% | |
| | |
Gentherm, Inc.* | | | 7,364 | | | | 480,280 | |
| | |
Tenneco, Inc. “A”* | | | 18,953 | | | | 200,902 | |
| | | | | | | | |
| | | | 681,182 | |
|
Diversified Consumer Services 1.8% | |
| | |
Bright Horizons Family Solutions, Inc.* | | | 5,598 | | | | 968,398 | |
| | |
Terminix Global Holdings, Inc.* | | | 6,718 | | | | 342,685 | |
| | | | | | | | |
| | | | 1,311,083 | |
|
Hotels, Restaurants & Leisure 1.8% | |
| | |
Hilton Grand Vacations, Inc.* | | | 12,491 | | | | 391,593 | |
| | |
Jack in the Box, Inc. | | | 7,892 | | | | 732,377 | |
| | |
Penn National Gaming, Inc.* | | | 2,400 | | | | 207,288 | |
| | | | | | | | |
| | | | 1,331,258 | |
|
Household Durables 4.0% | |
| | |
Helen of Troy Ltd.* | | | 3,647 | | | | 810,327 | |
| | |
iRobot Corp.* (a) | | | 6,773 | | | | 543,804 | |
| | |
LGI Homes, Inc.* | | | 2,689 | | | | 284,631 | |
| | |
TopBuild Corp.* | | | 6,707 | | | | 1,234,624 | |
| | | | | | | | |
| | | | 2,873,386 | |
|
Internet & Direct Marketing Retail 0.4% | |
| | |
Grubhub, Inc.* | | | 3,663 | | | | 272,051 | |
|
Leisure Products 1.5% | |
| | |
YETI Holdings, Inc.* | | | 16,312 | | | | 1,116,883 | |
|
Specialty Retail 2.7% | |
| | |
Burlington Stores, Inc.* | | | 3,382 | | | | 884,562 | |
| | |
Camping World Holdings, Inc. “A” (a) | | | 24,907 | | | | 648,828 | |
| | |
Leslie’s, Inc.* | | | 2,799 | | | | 77,672 | |
| | |
The Children’s Place, Inc. | | | 6,488 | | | | 325,049 | |
| | |
Vroom, Inc.* | | | 999 | | | | 40,929 | |
| | | | | | | | |
| | | | 1,977,040 | |
|
| Consumer Staples 1.8% | |
Food & Staples Retailing 1.1% | |
Casey’s General Stores, Inc. | | | 4,371 | | | | 780,748 | |
|
Household Products 0.7% | |
Spectrum Brands Holdings, Inc. | | | 6,982 | | | | 551,438 | |
|
| Energy 0.1% | |
Oil, Gas & Consumable Fuels | |
Contango Oil & Gas Co.* (a) | | | 39,242 | | | | 89,864 | |
|
| Financials 4.6% | |
Banks 2.4% | |
| | |
Pinnacle Financial Partners, Inc. | | | 7,304 | | | | 470,378 | |
| | |
South State Corp. | | | 4,704 | | | | 340,099 | |
| | |
SVB Financial Group* | | | 1,234 | | | | 478,582 | |
| | |
Synovus Financial Corp. | | | 13,385 | | | | 433,273 | |
| | | | | | | | |
| | | | 1,722,332 | |
| | | | | | | | |
| | | Shares | | | Value ($) | |
|
Capital Markets 1.4% | |
| | |
Lazard Ltd. “A” | | | 13,717 | | | | 580,229 | |
| | |
Moelis & Co. “A” | | | 9,136 | | | | 427,199 | |
| | | | | | | | |
| | | | 1,007,428 | |
|
Consumer Finance 0.5% | |
Green Dot Corp. “A”* | | | 6,162 | | | | 343,840 | |
|
Diversified Financial Services 0.3% | |
Social Capital Hedosophia Holdings Corp. III “A”* (a) | | | 15,307 | | | | 256,698 | |
|
| Health Care 28.5% | |
Biotechnology 13.5% | |
| | |
Acceleron Pharma, Inc.* | | | 3,899 | | | | 498,838 | |
| | |
Amicus Therapeutics, Inc.* | | | 17,294 | | | | 399,318 | |
| | |
Apellis Pharmaceuticals, Inc.* | | | 9,281 | | | | 530,873 | |
| | |
Arena Pharmaceuticals, Inc.* | | | 7,158 | | | | 549,949 | |
| | |
Biohaven Pharmaceutical Holding Co., Ltd.* | | | 7,887 | | | | 675,995 | |
| | |
Blueprint Medicines Corp.* | | | 4,684 | | | | 525,311 | |
| | |
ChemoCentryx, Inc.* | | | 5,580 | | | | 345,514 | |
| | |
Deciphera Pharmaceuticals, Inc.* | | | 4,133 | | | | 235,870 | |
| | |
Emergent BioSolutions, Inc.* | | | 10,674 | | | | 956,390 | |
| | |
Global Blood Therapeutics, Inc.* | | | 4,524 | | | | 195,934 | |
| | |
Heron Therapeutics, Inc.* | | | 22,719 | | | | 480,848 | |
| | |
Insmed, Inc.* | | | 4,677 | | | | 155,697 | |
| | |
Invitae Corp.* | | | 5,038 | | | | 210,639 | |
| | |
Iovance Biotherapeutics, Inc.* | | | 5,250 | | | | 243,600 | |
| | |
Ligand Pharmaceuticals, Inc.* (a) | | | 3,112 | | | | 309,488 | |
| | |
Mirati Therapeutics, Inc.* | | | 2,178 | | | | 478,376 | |
| | |
Natera, Inc.* | | | 4,935 | | | | 491,131 | |
| | |
Neurocrine Biosciences, Inc.* | | | 10,195 | | | | 977,191 | |
| | |
TG Therapeutics, Inc.* | | | 1,400 | | | | 72,828 | |
| | |
Translate Bio, Inc.* | | | 7,829 | | | | 144,289 | |
| | |
Travere Therapeutics, Inc.* | | | 23,478 | | | | 639,893 | |
| | |
Turning Point Therapeutics, Inc.* | | | 2,679 | | | | 326,436 | |
| | |
Ultragenyx Pharmaceutical, Inc.* | | | 3,057 | | | | 423,181 | |
| | | | | | | | |
| | | | 9,867,589 | |
|
Health Care Equipment & Supplies 5.3% | |
| | |
Cardiovascular Systems, Inc.* | | | 6,014 | | | | 263,173 | |
| | |
Globus Medical, Inc. “A”* | | | 4,024 | | | | 262,445 | |
| | |
Haemonetics Corp.* | | | 1,353 | | | | 160,669 | |
| | |
iRhythm Technologies, Inc.* | | | 3,258 | | | | 772,830 | |
| | |
Masimo Corp.* | | | 4,040 | | | | 1,084,255 | |
| | |
Natus Medical, Inc.* | | | 9,520 | | | | 190,781 | |
| | |
Nevro Corp.* | | | 2,328 | | | | 402,977 | |
| | |
Outset Medical, Inc.* | | | 736 | | | | 41,834 | |
| | |
Quidel Corp.* | | | 1,635 | | | | 293,728 | |
| | |
Tandem Diabetes Care, Inc.* | | | 4,219 | | | | 403,674 | |
| | | | | | | | |
| | | | 3,876,366 | |
|
Health Care Providers & Services 7.4% | |
| | |
AMN Healthcare Services, Inc.* | | | 15,169 | | | | 1,035,284 | |
| | |
HealthEquity, Inc.* | | | 1,929 | | | | 134,471 | |
| | |
Molina Healthcare, Inc.* | | | 4,458 | | | | 948,127 | |
| | |
Option Care Health, Inc.* | | | 27,764 | | | | 434,229 | |
| | |
Providence Service Corp.* | | | 12,193 | | | | 1,690,315 | |
| | |
RadNet, Inc.* | | | 55,477 | | | | 1,085,685 | |
| | |
Tivity Health, Inc.* | | | 4,464 | | | | 87,450 | |
| | | | | | | | |
| | | | 5,415,561 | |
The accompanying notes are an integral part of the financial statements.
| | | | |
Deutsche DWS Variable Series II — DWS Small Mid Cap Growth VIP | | | | | 7 |
| | | | | | | | |
| | | Shares | | | Value ($) | |
|
Health Care Technology 0.6% | |
HMS Holdings Corp.* | | | 10,589 | | | | 389,146 | |
|
Life Sciences Tools & Services 0.2% | |
Avantor, Inc.* | | | 4,849 | | | | 136,499 | |
|
Pharmaceuticals 1.5% | |
| | |
ANI Pharmaceuticals, Inc.* | | | 8,521 | | | | 247,450 | |
| | |
Avadel Pharmaceuticals PLC (ADR)* (a) | | | 18,916 | | | | 126,359 | |
| | |
Pacira BioSciences, Inc.* (a) | | | 11,807 | | | | 706,531 | |
| | | | | | | | |
| | | | 1,080,340 | |
|
| Industrials 13.2% | |
Aerospace & Defense 0.9% | |
HEICO Corp. | | | 5,006 | | | | 662,795 | |
|
Building Products 3.7% | |
| | |
Advanced Drainage Systems, Inc. | | | 3,825 | | | | 319,693 | |
| | |
Allegion PLC | | | 7,499 | | | | 872,734 | |
| | |
AZEK Co., Inc.* | | | 2,261 | | | | 86,935 | |
| | |
Builders FirstSource, Inc.* (a) | | | 18,923 | | | | 772,248 | |
| | |
Masonite International Corp.* | | | 6,705 | | | | 659,370 | |
| | | | | | | | |
| | | | 2,710,980 | |
|
Commercial Services & Supplies 1.9% | |
| | |
MSA Safety, Inc. | | | 3,375 | | | | 504,191 | |
| | |
The Brink’s Co. | | | 12,428 | | | | 894,816 | |
| | | | | | | | |
| | | | 1,399,007 | |
|
Construction & Engineering 0.6% | |
MasTec, Inc.* (a) | | | 6,416 | | | | 437,443 | |
|
Electrical Equipment 1.5% | |
| | |
Generac Holdings, Inc.* | | | 1,478 | | | | 336,112 | |
| | |
Plug Power, Inc.* | | | 11,183 | | | | 379,216 | |
| | |
Thermon Group Holdings, Inc.* | | | 26,199 | | | | 409,490 | |
| | | | | | | | |
| | | | 1,124,818 | |
|
Machinery 0.7% | |
IDEX Corp. | | | 2,502 | | | | 498,398 | |
|
Professional Services 1.2% | |
Kforce, Inc. | | | 21,425 | | | | 901,778 | |
|
Trading Companies & Distributors 2.7% | |
| | |
H&E Equipment Services, Inc. | | | 16,406 | | | | 489,063 | |
| | |
Rush Enterprises, Inc. “A” | | | 25,190 | | | | 1,043,370 | |
| | |
Titan Machinery, Inc.* | | | 20,663 | | | | 403,961 | |
| | | | | | | | |
| | | | 1,936,394 | |
| Information Technology 28.6% | |
Communications Equipment 1.4% | |
| | |
Calix, Inc.* | | | 8,844 | | | | 263,197 | |
| | |
Lumentum Holdings, Inc.* | | | 8,417 | | | | 797,932 | |
| | | | | | | | |
| | | | 1,061,129 | |
|
Electronic Equipment, Instruments & Components 1.4% | |
| | |
Cognex Corp. | | | 7,873 | | | | 632,084 | |
| | |
IPG Photonics Corp.* | | | 1,883 | | | | 421,396 | |
| | | | | | | | |
| | | | 1,053,480 | |
|
IT Services 3.7% | |
| | |
Broadridge Financial Solutions, Inc. | | | 6,371 | | | | 976,037 | |
| | |
MAXIMUS, Inc. | | | 8,556 | | | | 626,214 | |
| | |
WEX, Inc.* | | | 2,932 | | | | 596,750 | |
| | |
WNS Holdings Ltd. (ADR)* | | | 6,641 | | | | 478,484 | |
| | | | | | | | |
| | | | 2,677,485 | |
| | | | | | | | |
| | | Shares | | | Value ($) | |
|
Semiconductors & Semiconductor Equipment 5.2% | |
| | |
Advanced Energy Industries, Inc.* | | | 12,629 | | | | 1,224,634 | |
| | |
Advanced Micro Devices, Inc.* | | | 10,476 | | | | 960,754 | |
| | |
CMC Materials, Inc. | | | 3,131 | | | | 473,720 | |
| | |
Entegris, Inc. | | | 8,229 | | | | 790,807 | |
| | |
Semtech Corp.* | | | 4,743 | | | | 341,923 | |
| | | | | | | | |
| | | | 3,791,838 | |
|
Software 16.9% | |
| | |
Aspen Technology, Inc.* | | | 9,339 | | | | 1,216,405 | |
| | |
Cornerstone OnDemand, Inc.* | | | 11,656 | | | | 513,330 | |
| | |
DocuSign, Inc.* | | | 2,091 | | | | 464,829 | |
| | |
Envestnet, Inc.* | | | 9,852 | | | | 810,721 | |
| | |
Five9, Inc.* | | | 15,581 | | | | 2,717,326 | |
| | |
LivePerson, Inc.* | | | 7,263 | | | | 451,977 | |
| | |
Proofpoint, Inc.* | | | 7,005 | | | | 955,552 | |
| | |
QAD, Inc. “A” | | | 14,773 | | | | 933,358 | |
| | |
Tyler Technologies, Inc.* | | | 4,558 | | | | 1,989,658 | |
| | |
Varonis Systems, Inc.* | | | 13,732 | | | | 2,246,693 | |
| | | | | | | | |
| | | | 12,299,849 | |
|
| Materials 3.7% | |
Construction Materials 1.3% | |
Eagle Materials, Inc. | | | 9,476 | | | | 960,393 | |
|
Containers & Packaging 0.6% | |
Berry Global Group, Inc.* | | | 7,728 | | | | 434,236 | |
|
Metals & Mining 1.8% | |
| | |
Cleveland-Cliffs, Inc. (a) | | | 67,277 | | | | 979,553 | |
| | |
First Quantum Minerals Ltd. | | | 17,207 | | | | 308,885 | |
| | | | | | | | |
| | | | 1,288,438 | |
|
| Real Estate 2.9% | |
Real Estate Investment Trusts (REITs) | |
| | |
Americold Realty Trust | | | 10,299 | | | | 384,462 | |
| | |
EastGroup Properties, Inc. | | | 2,708 | | | | 373,866 | |
| | |
Essential Properties Realty Trust, Inc. | | | 21,678 | | | | 459,574 | |
| | |
Four Corners Property Trust, Inc. | | | 13,954 | | | | 415,411 | |
| | |
QTS Realty Trust, Inc. “A” (a) | | | 7,598 | | | | 470,164 | |
| | | | | | | | |
| | | | | | | | 2,103,477 | |
| Total Common Stocks (Cost $37,590,615) | | | | 71,102,452 | |
|
| Exchange-Traded Funds 0.5% | |
SPDR S&P Biotech ETF (a)
(Cost $247,240) | | | 2,719 | | | | 382,782 | |
|
| Securities Lending Collateral 7.5% | |
DWS Government & Agency Securities Portfolio “DWS Government Cash Institutional Shares”, 0.03% (b) (c)
(Cost $5,457,727) | | | 5,457,727 | | | | 5,457,727 | |
| | |
| Cash Equivalents 2.4% | | | | | | | | |
DWS Central Cash Management Government Fund, 0.08% (b) (Cost $1,738,142) | | | 1,738,142 | | | | 1,738,142 | |
The accompanying notes are an integral part of the financial statements.
| | | | | | |
| | 8 | | | | | | Deutsche DWS Variable Series II — DWS Small Mid Cap Growth VIP |
| | | | | | | | |
| | | % of Net
Assets | | | Value ($) | |
Total Investment Portfolio
(Cost $45,033,724) | | | 107.8 | | | | 78,681,103 | |
| Other Assets and Liabilities, Net | | | (7.8 | ) | | | (5,711,938 | ) |
| Net Assets | | | 100.0 | | | | 72,969,165 | |
A summary of the Fund’s transactions with affiliated investments during the year ended December 31, 2020 are as follows:
| | | | | | | | | | | | | | | | | | | | | | | | | | | | | | | | |
Value ($) at
12/31/2019 | | Purchases
Cost ($) | | | Sales
Proceeds ($) | | | Net
Realized
Gain/
(Loss) ($) | | | Net Change in
Unrealized
Appreciation
(Depreciation) ($) | | | Income ($) | | | Capital Gain
Distributions ($) | | | Number
of Shares
at
12/31/2020 | | | Value ($)
at
12/31/2020 | |
Securities Lending Collateral 7.5% | | | | | | | | | | | | | | | | | |
DWS Government & Agency Securities Portfolio “DWS Government Cash Institutional Shares”, 0.03% (b) (c) | |
| 2,086,238 | | | 3,371,489 | (d) | | | — | | | | — | | | | — | | | | 27,589 | | | | — | | | | 5,457,727 | | | | 5,457,727 | |
Cash Equivalents 2.4% | | | | | | | | | | | | | | | | | |
DWS Central Cash Management Government Fund, 0.08% (b) | |
| 955,515 | | | 8,932,767 | | | | 8,150,140 | | | | — | | | | — | | | | 4,936 | | | | — | | | | 1,738,142 | | | | 1,738,142 | |
| 3,041,753 | | | 12,304,256 | | | | 8,150,140 | | | | — | | | | — | | | | 32,525 | | | | — | | | | 7,195,869 | | | | 7,195,869 | |
| * | Non-income producing security. |
| (a) | All or a portion of these securities were on loan. In addition, “Other Assets and Liabilities, Net” may include pending sales that are also on loan. The value of securities loaned at December 31, 2020 amounted to $5,243,423, which is 7.2% of net assets. |
| (b) | Affiliated fund managed by DWS Investment Management Americas, Inc. The rate shown is the annualized seven-day yield at period end. |
| (c) | Represents cash collateral held in connection with securities lending. Income earned by the Fund is net of borrower rebates. |
| (d) | Represents the net increase (purchase cost) or decrease (sales proceeds) in the amount invested in cash collateral for the year ended December 31, 2020. |
ADR: American Depositary Receipt
S&P: Standard & Poor’s
SPDR: Standard & Poor’s Depositary Receipt
Fair Value Measurements
Various inputs are used in determining the value of the Fund’s investments. These inputs are summarized in three broad levels. Level 1 includes quoted prices in active markets for identical securities. Level 2 includes other significant observable inputs (including quoted prices for similar securities, interest rates, prepayment speeds and credit risk). Level 3 includes significant unobservable inputs (including the Fund’s own assumptions in determining the fair value of investments). The level assigned to the securities valuations may not be an indication of the risk or liquidity associated with investing in those securities.
The following is a summary of the inputs used as of December 31, 2020 in valuing the Fund’s investments. For information on the Fund’s policy regarding the valuation of investments, please refer to the Security Valuation section of Note A in the accompanying Notes to Financial Statements.
| | | | | | | | | | | | | | | | |
| Assets | | Level 1 | | | Level 2 | | | Level 3 | | | Total | |
| Common Stocks (e) | | $ | 71,102,452 | | | $ | — | | | $ | — | | | $ | 71,102,452 | |
| Exchange-Traded Funds | | | 382,782 | | | | — | | | | — | | | | 382,782 | |
| Short-Term Investments (e) | | | 7,195,869 | | | | — | | | | — | | | | 7,195,869 | |
| Total | | $ | 78,681,103 | | | $ | — | | | $ | — | | | $ | 78,681,103 | |
| (e) | See Investment Portfolio for additional detailed categorizations. |
The accompanying notes are an integral part of the financial statements.
| | | | |
Deutsche DWS Variable Series II — DWS Small Mid Cap Growth VIP | | | | | 9 |
Statement of Assets and Liabilities
| | | | |
| as of December 31, 2020 | | | | |
| |
| Assets | | | | |
| Investments in non-affiliated securities, at value (cost $37,837,855) — including $5,243,423 of securities loaned | | $ | 71,485,234 | |
| Investment in DWS Government & Agency Securities Portfolio (cost $5,457,727)* | | | 5,457,727 | |
| Investment in DWS Central Cash Management Government Fund (cost $1,738,142) | | | 1,738,142 | |
| Foreign currency, at value (cost $107) | | | 115 | |
| Dividends receivable | | | 28,028 | |
| Interest receivable | | | 1,599 | |
| Other assets | | | 1,208 | |
| Total assets | | | 78,712,053 | |
| |
| Liabilities | | | | |
| Payable upon return of securities loaned | | | 5,457,727 | |
| Payable for investments purchased | | | 72,971 | |
| Payable for Fund shares redeemed | | | 105,670 | |
| Accrued management fee | | | 35,858 | |
| Accrued Trustees’ fees | | | 1,018 | |
| Other accrued expenses and payables | | | 69,644 | |
| Total liabilities | | | 5,742,888 | |
| Net assets, at value | | $ | 72,969,165 | |
| |
| Net Assets Consist of | | | | |
| Distributable earnings (loss) | | | 37,257,815 | |
| Paid-in capital | | | 35,711,350 | |
| Net assets, at value | | $ | 72,969,165 | |
| |
| Net Asset Value | | | | |
| |
| Net Asset Value, offering and redemption price per share ($72,969,165 ÷ 4,186,167 outstanding shares of beneficial interest, no par value, unlimited number of shares authorized) | | $ | 17.43 | |
| * | Represents collateral on securities loaned. |
Statement of Operations
| | | | |
| for the year ended December 31, 2020 | |
| |
| Investment Income | | | | |
| Income: | | | | |
| Dividends (net of foreign taxes withheld of $656) | | $ | 420,832 | |
| Income distributions — DWS Central Cash Management Government Fund | | | 4,936 | |
| Securities lending income, net of borrower rebates | | | 27,589 | |
| Total income | | | 453,357 | |
| Expenses: | | | | |
| Management fee | | | 327,098 | |
| Administration fee | | | 58,007 | |
| Services to Shareholders | | | 818 | |
| Custodian fee | | | 2,008 | |
| Professional fees | | | 58,742 | |
| Reports to shareholders | | | 35,556 | |
| Trustees’ fees and expenses | | | 3,598 | |
| Other | | | 3,985 | |
| Total expenses before expense reductions | | | 489,812 | |
| Expense reductions | | | (8,086 | ) |
| Total expenses after expense reductions | | | 481,726 | |
| Net investment income (loss) | | | (28,369 | ) |
| |
| Realized and Unrealized Gain (Loss) | | | | |
| Net realized gain (loss) from: | | | | |
| Investments | | | 3,757,625 | |
| Foreign Currency | | | (1 | ) |
| | | | 3,757,624 | |
| Change in net unrealized appreciation (depreciation) on: | | | | |
| Investments | | | 12,517,956 | |
| Foreign currency | | | 8 | |
| | | | 12,517,964 | |
| Net gain (loss) | | | 16,275,588 | |
| Net increase (decrease) in net assets resulting from operations | | $ | 16,247,219 | |
The accompanying notes are an integral part of the financial statements.
| | | | | | |
| | 10 | | | | | | Deutsche DWS Variable Series II — DWS Small Mid Cap Growth VIP |
Statements of Changes in Net Assets
| | | | | | | | |
| | | Years Ended December 31, | |
| Increase (Decrease) in Net Assets | | 2020 | | | 2019 | |
| Operations: | | | | | | | | |
| Net investment income (loss) | | $ | (28,369 | ) | | $ | 71,165 | |
| Net realized gain (loss) | | | 3,757,624 | | | | 1,092,162 | |
| Change in net unrealized appreciation (depreciation) | | | 12,517,964 | | | | 12,312,200 | |
| Net increase (decrease) in net assets resulting from operations | | | 16,247,219 | | | | 13,475,527 | |
| Distributions to shareholders: | | | | | | | | |
Class A | | | (959,731 | ) | | | (8,788,523 | ) |
| Fund share transactions: | | | | | | | | |
Class A | | | | | | | | |
| Proceeds from shares sold | | | 3,372,258 | | | | 2,374,360 | |
| Reinvestment of distributions | | | 959,731 | | | | 8,788,523 | |
| Payments for shares redeemed | | | (10,851,170 | ) | | | (16,023,146 | ) |
| Net increase (decrease) in net assets from Class A share transactions | | | (6,519,181 | ) | | | (4,860,263 | ) |
| Increase (decrease) in net assets | | | 8,768,307 | | | | (173,259 | ) |
| Net assets at beginning of period | | | 64,200,858 | | | | 64,374,117 | |
| | |
| Net assets at end of period | | $ | 72,969,165 | | | $ | 64,200,858 | |
| | |
| Other Information | | | | | | | | |
Class A | | | | | | | | |
| Shares outstanding at beginning of period | | | 4,698,629 | | | | 5,077,014 | |
| Shares sold | | | 244,143 | | | | 179,399 | |
| Shares issued to shareholders in reinvestment of distributions | | | 90,115 | | | | 680,753 | |
| Shares redeemed | | | (846,720 | ) | | | (1,238,537 | ) |
| Net increase (decrease) in Class A shares | | | (512,462 | ) | | | (378,385 | ) |
| | |
| Shares outstanding at end of period | | | 4,186,167 | | | | 4,698,629 | |
The accompanying notes are an integral part of the financial statements.
| | | | |
Deutsche DWS Variable Series II — DWS Small Mid Cap Growth VIP | | | | | 11 |
Financial Highlights
| | | | | | | | | | | | | | | | | | | | |
| DWS Small Mid Cap Growth VIP — Class A | | | | | | | | | | | | | | | |
| | | Years Ended December 31, | |
| | | 2020 | | | 2019 | | | 2018 | | | 2017 | | | 2016 | |
| | | | | |
| Selected Per Share Data | | | | | | | | | | | | | | | | | | | | |
| Net asset value, beginning of period | | | $13.66 | | | | $12.68 | | | | $21.94 | | | | $18.96 | | | | $20.90 | |
| Income (loss) from investment operations: | | | | | | | | | | | | | | | | | | | | |
| | | | | |
Net investment income (loss)a | | | (.01 | ) | | | .01 | | | | (.01 | ) | | | (.02 | ) | | | .02 | |
Net realized and unrealized gain (loss) | | | 4.00 | | | | 2.73 | | | | (1.92 | ) | | | 4.08 | | | | 1.64 | |
Total from investment operations | | | 3.99 | | | | 2.74 | | | | (1.93 | ) | | | 4.06 | | | | 1.66 | |
| Less distributions from: | | | | | | | | | | | | | | | | | | | | |
| | | | | |
Net investment income | | | (.01 | ) | | | — | | | | — | | | | (.02 | ) | | | — | |
Net realized gains | | | (.21 | ) | | | (1.76 | ) | | | (7.33 | ) | | | (1.06 | ) | | | (3.60 | ) |
Total distributions | | | (.22 | ) | | | (1.76 | ) | | | (7.33 | ) | | | (1.08 | ) | | | (3.60 | ) |
| Net asset value, end of period | | | $17.43 | | | | $13.66 | | | | $12.68 | | | | $21.94 | | | | $18.96 | |
| Total Return (%) | | | 30.18 | b | | | 22.41 | b | | | (13.59 | )b | | | 22.12 | | | | 9.08 | |
| | | | | |
| Ratios to Average Net Assets and Supplemental Data | | | | | | | | | | | | | | | | | | | | |
| Net assets, end of period ($ millions) | | | 73 | | | | 64 | | | | 64 | | | | 77 | | | | 118 | |
| Ratio of expenses before expense reductions (%)c | | | .82 | | | | .82 | | | | .81 | | | | .75 | | | | .75 | |
| Ratio of expenses after expense reductions (%)c | | | .81 | | | | .81 | | | | .80 | | | | .75 | | | | .75 | |
| Ratio of net investment income (loss) (%) | | | (.05 | ) | | | .11 | | | | (.06 | ) | | | (.08 | ) | | | .11 | |
| Portfolio turnover rate (%) | | | 12 | | | | 10 | | | | 32 | | | | 32 | | | | 28 | |
| a | Based on average shares outstanding during the period. |
| b | Total return would have been lower had certain expenses not been reduced. |
| c | Expense ratio does not reflect charges and fees associated with the separate account that invests in the Fund or any variable life insurance policy or variable annuity contract for which the Fund is an investment option. |
The accompanying notes are an integral part of the financial statements.
| | | | | | |
| | 12 | | | | | | Deutsche DWS Variable Series II — DWS Small Mid Cap Growth VIP |
| | |
| Notes to Financial Statements | | |
A. Organization and Significant Accounting Policies
DWS Small Mid Cap Growth VIP (the “Fund”) is a diversified series of Deutsche DWS Variable Series II (the “Trust”), which is registered under the Investment Company Act of 1940, as amended (the “1940 Act”), as an open-end management investment company organized as a Massachusetts business trust.
The Fund’s financial statements are prepared in accordance with accounting principles generally accepted in the United States of America (“U.S. GAAP”) which require the use of management estimates. Actual results could differ from those estimates. The Fund qualifies as an investment company under Topic 946 of Accounting Standards Codification of U.S. GAAP. The policies described below are followed consistently by the Fund in the preparation of its financial statements.
Security Valuation. Investments are stated at value determined as of the close of regular trading on the New York Stock Exchange on each day the exchange is open for trading.
Various inputs are used in determining the value of the Fund’s investments. These inputs are summarized in three broad levels. Level 1 includes quoted prices in active markets for identical securities. Level 2 includes other significant observable inputs (including quoted prices for similar securities, interest rates, prepayment speeds and credit risk). Level 3 includes significant unobservable inputs (including the Fund’s own assumptions in determining the fair value of investments). The level assigned to the securities valuations may not be an indication of the risk or liquidity associated with investing in those securities.
Equity securities and exchange-traded funds (“ETFs”) are valued at the most recent sale price or official closing price reported on the exchange (U.S. or foreign) or over-the-counter market on which they trade. Equity securities or ETFs for which no sales are reported are valued at the calculated mean between the most recent bid and asked quotations on the relevant market or, if a mean cannot be determined, at the most recent bid quotation. Equity securities or ETFs are generally categorized as Level 1.
Investments in open-end investment companies are valued at their net asset value each business day and are categorized as Level 1.
Securities and other assets for which market quotations are not readily available or for which the above valuation procedures are deemed not to reflect fair value are valued in a manner that is intended to reflect their fair value as determined in accordance with procedures approved by the Board and are generally categorized as Level 3. In accordance with the Fund’s valuation procedures, factors considered in determining value may include, but are not limited to, the type of the security; the size of the holding; the initial cost of the security; the existence of any contractual restrictions on the security’s disposition; the price and extent of public trading in similar securities of the issuer or of comparable companies; quotations or evaluated prices from broker-dealers and/or pricing services; information obtained from the issuer, analysts, and/or the appropriate stock exchange (for exchange-traded securities); an analysis of the company’s or issuer’s financial statements; an evaluation of the forces that influence the issuer and the market(s) in which the security is purchased and sold; and with respect to debt securities, the maturity, coupon, creditworthiness, currency denomination and the movement of the market in which the security is normally traded. The value determined under these procedures may differ from published values for the same securities.
Disclosure about the classification of fair value measurements is included in a table following the Fund’s Investment Portfolio.
Foreign Currency Translations. The books and records of the Fund are maintained in U.S. dollars. Investment securities and other assets and liabilities denominated in a foreign currency are translated into U.S. dollars at the prevailing exchange rates at period end. Purchases and sales of investment securities, income and expenses are translated into U.S. dollars at the prevailing exchange rates on the respective dates of the transactions.
Net realized and unrealized gains and losses on foreign currency transactions represent net gains and losses between trade and settlement dates on securities transactions, the acquisition and disposition of foreign currencies, and the difference between the amount of net investment income accrued and the U.S. dollar amount actually received. The portion of both realized and unrealized gains and losses on investments that results from fluctuations in foreign currency exchange rates is not separately disclosed but is included with net realized and unrealized gain/appreciation and loss/depreciation on investments.
Securities Lending. Deutsche Bank AG, as lending agent, lends securities of the Fund to certain financial institutions under the terms of its securities lending agreement. During the term of the loans, the Fund
| | | | |
Deutsche DWS Variable Series II — DWS Small Mid Cap Growth VIP | | | | | 13 |
continues to receive interest and dividends generated by the securities and to participate in any changes in their market value. The Fund requires the borrowers of the securities to maintain collateral with the Fund consisting of either cash or liquid, unencumbered assets having a value at least equal to the value of the securities loaned. When the collateral falls below specified amounts, the lending agent will use its best effort to obtain additional collateral on the next business day to meet required amounts under the securities lending agreement. As of period end, any securities on loan were collateralized by cash. During the year ended December 31, 2020, the Fund invested the cash collateral into a joint trading account in DWS Government & Agency Securities Portfolio, an affiliated money market fund managed by DWS Investment Management Americas, Inc. DWS Investment Management Americas, Inc. receives a management/administration fee (0.06% annualized effective rate as of December 31, 2020) on the cash collateral invested in DWS Government & Agency Securities Portfolio. The Fund receives compensation for lending its securities either in the form of fees or by earning interest on invested cash collateral net of borrower rebates and fees paid to a lending agent. Either the Fund or the borrower may terminate the loan at any time, and the borrower, after notice, is required to return borrowed securities within a standard time period. There may be risks of delay and costs in recovery of securities or even loss of rights in the collateral should the borrower of the securities fail financially. If the Fund is not able to recover securities lent, the Fund may sell the collateral and purchase a replacement investment in the market, incurring the risk that the value of the replacement security is greater than the value of the collateral. The Fund is also subject to all investment risks associated with the reinvestment of any cash collateral received, including, but not limited to, interest rate, credit and liquidity risk associated with such investments.
As of December 31, 2020, the Fund had securities on loan. The value of the related collateral exceeded the value of the securities loaned at period end.
| | | | | | | | | | | | | | | | | | | | |
| Remaining Contractual Maturity of the Agreements as of December 31, 2020 | |
| | | Overnight
and Continuous | | | <30 Days | | | Between 30
& 90 Days | | | >90 Days | | | Total | |
Securities Lending Transactions | | | | | | | | | | | | | | | | | | | | |
| Common Stocks | | $ | 5,060,827 | | | $ | — | | | $ | — | | | $ | — | | | $ | 5,060,827 | |
| Exchange-Traded Funds | | | 396,900 | | | | — | | | | — | | | | — | | | | 396,900 | |
| Total Borrowings | | $ | 5,457,727 | | | $ | — | | | $ | — | | | $ | — | | | $ | 5,457,727 | |
| | |
Gross amount of recognized liabilities for securities lending transactions: | | | | | | | $ | 5,457,727 | |
Federal Income Taxes. The Fund’s policy is to comply with the requirements of the Internal Revenue Code, as amended, which are applicable to regulated investment companies, and to distribute all of its taxable income to its shareholders.
The Fund has reviewed the tax positions for the open tax years as of December 31, 2020 and has determined that no provision for income tax and/or uncertain tax positions is required in the Fund’s financial statements. The Fund’s federal tax returns for the prior three fiscal years remain open subject to examination by the Internal Revenue Service.
Distribution of Income and Gains. Distributions from net investment income of the Fund, if any, are declared and distributed to shareholders annually. Net realized gains from investment transactions, in excess of available capital loss carryforwards, would be taxable to the Fund if not distributed and, therefore, will be distributed to shareholders at least annually. The Fund may also make additional distributions for tax purposes if necessary.
The timing and characterization of certain income and capital gain distributions are determined annually in accordance with federal tax regulations, which may differ from accounting principles generally accepted in the United States of America. These differences primarily relate to investments in foreign denominated Investments and certain securities sold at a loss. As a result, net investment income (loss) and net realized gain (loss) on investment transactions for a reporting period may differ significantly from distributions during such period. Accordingly, the Fund may periodically make reclassifications among certain of its capital accounts without impacting the net asset value of the Fund.
At December 31, 2020, the Fund’s components of distributable earnings on a tax basis were as follows:
| | | | |
| Undistributed ordinary income* | | $ | 786,931 | |
| Undistributed long-term capital gains | | $ | 3,015,494 | |
| Net unrealized appreciation (depreciation) on investments | | $ | 33,444,144 | |
| | | | | | |
| | 14 | | | | | | Deutsche DWS Variable Series II — DWS Small Mid Cap Growth VIP |
At December 31, 2020, the aggregate cost of investments for federal income tax purposes was $45,236,959. The net unrealized appreciation for all investments based on tax cost was $33,444,144. This consisted of aggregate gross unrealized appreciation for all investments for which there was an excess of value over tax cost of $36,810,605 and aggregate gross unrealized depreciation for all investments for which there was an excess of tax cost over value of $3,366,461.
In addition, the tax character of distributions paid by the Fund is summarized as follows:
| | | | | | | | |
| | | Years Ended December 31, | |
| | | 2020 | | | 2019 | |
| Distributions from ordinary income* | | $ | 27,637 | | | $ | — | |
| Distributions from long-term capital gains | | $ | 932,094 | | | $ | 8,788,523 | |
| * | For tax purposes, short-term capital gain distributions are considered ordinary income distributions. |
Expenses. Expenses of the Trust arising in connection with a specific fund are allocated to that fund. Other Trust expenses which cannot be directly attributed to a fund are apportioned among the funds in the Trust based upon the relative net assets or other appropriate measures.
Contingencies. In the normal course of business, the Fund may enter into contracts with service providers that contain general indemnification clauses. The Fund’s maximum exposure under these arrangements is unknown, as this would involve future claims that may be made against the Fund that have not yet been made. However, based on experience, the Fund expects the risk of loss to be remote.
Other. Investment transactions are accounted for on a trade date plus one basis for daily net asset value calculations. However, for financial reporting purposes, investment transactions are reported on trade date. Interest income is recorded on the accrual basis. Dividend income is recorded on the ex-dividend date net of foreign withholding taxes. Realized gains and losses from investment transactions are recorded on an identified cost basis. Proceeds from litigation payments, if any, are included in net realized gain (loss) from investments.
B. Purchases and Sales of Securities
During the year ended December 31, 2020, purchases and sales of investment transactions (excluding short-term investments) aggregated $7,334,911 and $15,372,087, respectively.
C. Related Parties
Management Agreement. Under the Investment Management Agreement with DWS Investment Management Americas, Inc. (“DIMA” or the “Advisor”), an indirect, wholly owned subsidiary of DWS Group GmbH & Co. KGaA (“DWS Group”), the Advisor directs the investments of the Fund in accordance with its investment objectives, policies and restrictions. The Advisor determines the securities, instruments and other contracts relating to investments to be purchased, sold or entered into by the Fund.
Under the Investment Management Agreement with the Advisor, the Fund pays a monthly management fee based on the Fund’s average daily net assets, computed and accrued daily and payable monthly, at the following annual rates:
| | | | |
| First $250 million | | | .550 | % |
| Next $750 million | | | .525 | % |
| Over $1 billion | | | .500 | % |
Accordingly, for the year ended December 31, 2020, the fee pursuant to the Investment Management Agreement was equivalent to an annual rate (exclusive of any applicable waivers/reimbursements) of 0.55% of the Fund’s average daily net assets.
For the period from January 1, 2020 through September 30, 2021, the Advisor has contractually agreed to waive its fees and/or reimburse certain operating expenses to the extent necessary to maintain the total annual operating expenses (excluding certain expenses such as extraordinary expenses, taxes, brokerage and interest expense) of Class A at 0.81%.
For the year ended December 31, 2020, fees waived and/or expenses reimbursed were $8,086.
Administration Fee. Pursuant to an Administrative Services Agreement, DIMA provides most administrative services to the Fund. Prior to March 1, 2020, for all services provided under the Administrative Services Agreement, the Fund paid the Advisor an annual fee (“Administration Fee”) of 0.10% of the Fund’s average
| | | | |
Deutsche DWS Variable Series II — DWS Small Mid Cap Growth VIP | | | | | 15 |
daily net assets, computed and accrued daily and payable monthly. Effective March 1, 2020, for all services provided under the Administrative Services Agreement, the Fund pays the Advisor an annual Administration Fee of 0.097% of the Fund’s average daily net assets, computed and accrued daily and payable monthly. For the year ended December 31, 2020, the Administration Fee was $58,007, of which $5,868 is unpaid.
Service Provider Fees. DWS Service Company (“DSC”), an affiliate of the Advisor, is the transfer agent, dividend-paying agent and shareholder service agent for the Fund. Pursuant to a sub-transfer agency agreement between DSC and DST Systems, Inc. (“DST”), DSC has delegated certain transfer agent, dividend-paying agent and shareholder service agent functions to DST. DSC compensates DST out of the shareholder servicing fee it receives from the Fund. For the year ended December 31, 2020, the amounts charged to the Fund by DSC aggregated $424, of which $78 is unpaid.
Other Service Fees. Under an agreement with the Fund, DIMA is compensated for providing certain pre-press and regulatory filing services to the Fund. For the year ended December 31, 2020, the amount charged to the Fund by DIMA included in the Statement of Operations under “Reports to shareholders” aggregated $8,422, of which $3,025 is unpaid.
Trustees’ Fees and Expenses. The Fund paid retainer fees to each Trustee not affiliated with the Advisor, plus specified amounts to the Board Chairperson and to each committee Chairperson.
Affiliated Cash Management Vehicles. The Fund may invest uninvested cash balances in DWS Central Cash Management Government Fund and DWS ESG Liquidity Fund, affiliated money market funds which are managed by the Advisor. Each affiliated money market fund is managed in accordance with Rule 2a-7 under the 1940 Act, which governs the quality, maturity, diversity and liquidity of instruments in which a money market fund may invest. DWS Central Cash Management Government Fund seeks to maintain a stable net asset value, and DWS ESG Liquidity Fund maintains a floating net asset value. The Fund indirectly bears its proportionate share of the expenses of each affiliated money market fund in which it invests. DWS Central Cash Management Government Fund does not pay the Advisor an investment management fee. To the extent that DWS ESG Liquidity Fund pays an investment management fee to the Advisor, the Advisor will waive an amount of the investment management fee payable to the Advisor by the Fund equal to the amount of the investment management fee payable on the Fund’s assets invested in DWS ESG Liquidity Fund.
Securities Lending Agent Fees. Deutsche Bank AG serves as securities lending agent for the Fund. For the year ended December 31, 2020, the Fund incurred securities lending agent fees to Deutsche Bank AG in the amount of $2,077.
D. Ownership of the Fund
At December 31, 2020, one participating insurance company was owner of record of 10% or more of the total outstanding Class A shares of the Fund, owning 92%.
E. Line of Credit
The Fund and other affiliated funds (the “Participants”) share in a $350 million revolving credit facility provided by a syndication of banks. The Fund may borrow for temporary or emergency purposes, including the meeting of redemption requests that otherwise might require the untimely disposition of securities. The Participants are charged an annual commitment fee, which is allocated based on net assets, among each of the Participants. Interest is calculated at a rate per annum equal to the sum of the Federal Funds Rate plus 1.25 percent plus if the one-month LIBOR exceeds the Federal Funds Rate the amount of such excess. The Fund may borrow up to a maximum of 33 percent of its net assets under the agreement. The Fund had no outstanding loans at December 31, 2020.
F. Other — COVID-19 Pandemic
A novel coronavirus known as COVID-19, declared a pandemic by the World Health Organization, has caused significant uncertainty, market volatility, decreased economic and other activity and increased government activity. Specifically, COVID-19 has led to significant death and morbidity, and concerns about its further spread have resulted in the closing of schools and non-essential businesses, cancellations, shelter-in place orders, lower consumer spending in certain sectors, social distancing, bans on large social gatherings and travel, quarantines, government economic stimulus measures, reduced productivity, rapid increases in unemployment, increased demand for and strain on government and medical resources, border closings and global trade and supply chain interruptions, among others. The full effects, duration and costs of the
| | | | | | |
| | 16 | | | | | | Deutsche DWS Variable Series II — DWS Small Mid Cap Growth VIP |
COVID-19 pandemic are impossible to predict, and the circumstances surrounding the COVID-19 pandemic will continue to evolve. The pandemic may affect certain countries, industries, economic sectors, companies and investment products more than others, may exacerbate existing economic, political, or social tensions and may increase the probability of an economic recession or depression. The Fund and its investments may be adversely affected by the effects of the COVID-19 pandemic, and a prolonged pandemic may result in the Fund and its service providers experiencing operational difficulties in coordinating a remote workforce and implementing their business continuity plans, among others. Management will continue to monitor the impact COVID-19 has on the Fund and reflect the consequences as appropriate in the Fund’s accounting and financial reporting.
| | | | |
Deutsche DWS Variable Series II — DWS Small Mid Cap Growth VIP | | | | | 17 |
Report of Independent Registered Public Accounting Firm
To the Board of Trustees of Deutsche DWS Variable Series II and Shareholders of DWS Small Mid Cap Growth VIP:
Opinion on the Financial Statements
We have audited the accompanying statement of assets and liabilities of DWS Small Mid Cap Growth VIP (the “Fund”) (one of the funds constituting Deutsche DWS Variable Series II) (the “Trust”), including the investment portfolio, as of December 31, 2020, and the related statement of operations for the year then ended, the statements of changes in net assets for each of the two years in the period then ended, the financial highlights for each of the five years in the period then ended and the related notes (collectively referred to as the “financial statements”). In our opinion, the financial statements present fairly, in all material respects, the financial position of the Fund (one of the funds constituting Deutsche DWS Variable Series II) at December 31, 2020, the results of its operations for the year then ended, the changes in its net assets for each of the two years in the period then ended and its financial highlights for each of the five years in the period then ended, in conformity with U.S. generally accepted accounting principles.
Basis for Opinion
These financial statements are the responsibility of the Trust’s management. Our responsibility is to express an opinion on the Fund’s financial statements based on our audits. We are a public accounting firm registered with the Public Company Accounting Oversight Board (United States) (“PCAOB”) and are required to be independent with respect to the Trust in accordance with the U.S. federal securities laws and the applicable rules and regulations of the Securities and Exchange Commission and the PCAOB.
We conducted our audits in accordance with the standards of the PCAOB. Those standards require that we plan and perform the audit to obtain reasonable assurance about whether the financial statements are free of material misstatement, whether due to error or fraud. The Trust is not required to have, nor were we engaged to perform, an audit of the Trust’s internal control over financial reporting. As part of our audits, we are required to obtain an understanding of internal control over financial reporting, but not for the purpose of expressing an opinion on the effectiveness of the Trust’s internal control over financial reporting. Accordingly, we express no such opinion.
Our audits included performing procedures to assess the risks of material misstatement of the financial statements, whether due to error or fraud, and performing procedures that respond to those risks. Such procedures included examining, on a test basis, evidence regarding the amounts and disclosures in the financial statements. Our procedures included confirmation of securities owned as of December 31, 2020, by correspondence with the custodian and others or by other appropriate auditing procedures where replies from others were not received. Our audits also included evaluating the accounting principles used and significant estimates made by management, as well as evaluating the overall presentation of the financial statements. We believe that our audits provide a reasonable basis for our opinion.

We have served as the auditor of one or more investment companies in the DWS family of funds since at least 1979, but we are unable to determine the specific year.
Boston, Massachusetts
February 12, 2021
| | | | | | |
| | 18 | | | | | | Deutsche DWS Variable Series II — DWS Small Mid Cap Growth VIP |
| | |
| Information About Your Fund’s Expenses | | (Unaudited) |
As an investor of the Fund, you incur two types of costs: ongoing expenses and transaction costs. Ongoing expenses include management fees and other Fund expenses. Examples of transaction costs include contract charges, which are not shown in this section. The following tables are intended to help you understand your ongoing expenses (in dollars) of investing in the Fund and to help you compare these expenses with the ongoing expenses of investing in other mutual funds. The example in the table is based on an investment of $1,000 invested at the beginning of the six-month period and held for the entire period (July 1, 2020 to December 31, 2020).
The tables illustrate your Fund’s expenses in two ways:
| – | Actual Fund Return. This helps you estimate the actual dollar amount of ongoing expenses (but not transaction costs) paid on a $1,000 investment in the Fund using the Fund’s actual return during the period. To estimate the expenses you paid over the period, simply divide your account value by $1,000 (for example, an $8,600 account value divided by $1,000 = 8.6), then multiply the result by the number in the “Expenses Paid per $1,000” line under the share class you hold. |
| – | Hypothetical 5% Fund Return. This helps you to compare your Fund’s ongoing expenses (but not transaction costs) with those of other mutual funds using the Fund’s actual expense ratio and a hypothetical rate of return of 5% per year before expenses. Examples using a 5% hypothetical Fund return may be found in the shareholder reports of other mutual funds. The hypothetical account values and expenses may not be used to estimate the actual ending account balance or expenses you paid for the period. |
Please note that the expenses shown in these tables are meant to highlight your ongoing expenses only and do not reflect any transaction costs. The “Expenses Paid per $1,000” line of the tables is useful in comparing ongoing expenses only and will not help you determine the relative total expense of owning different funds. If these transaction costs had been included, your costs would have been higher.
| | | | |
| Expenses and Value of a $1,000 Investment for the six months ended December 31, 2020 | | | |
| |
| Actual Fund Return | | Class A | |
| Beginning Account Value 7/1/20 | | $ | 1,000.00 | |
| Ending Account Value 12/31/20 | | $ | 1,359.60 | |
| Expenses Paid per $1,000* | | $ | 4.80 | |
| |
| Hypothetical 5% Fund Return | | Class A | |
| Beginning Account Value 7/1/20 | | $ | 1,000.00 | |
| Ending Account Value 12/31/20 | | $ | 1,021.06 | |
| Expenses Paid per $1,000* | | $ | 4.12 | |
| * | Expenses are equal to the Fund’s annualized expense ratio, multiplied by the average account value over the period, multiplied by 184 (the number of days in the most recent six-month period), then divided by 366. |
| | | | |
| Annualized Expense Ratio | | Class A | |
| Deutsche DWS Variable Series II — DWS Small Mid Cap Growth VIP | | | .81 | % |
For more information, please refer to the Fund’s prospectus.
These tables do not reflect charges and fees (“contract charges”) associated with the separate account that invests in the Fund or any variable life insurance policy or variable annuity contract for which the Fund is an investment option.
For an analysis of the fees associated with an investment in the Fund or similar funds, please refer to the current and hypothetical expense calculators for Variable Insurance Products which can be found at dws.com/calculators.
| | | | |
Deutsche DWS Variable Series II — DWS Small Mid Cap Growth VIP | | | | | 19 |
| | |
| Tax Information | | (Unaudited) |
The Fund paid distributions of $0.21 per share from net long-term capital gains during its year ended December 31, 2020.
Pursuant to Section 852 of the Internal Revenue Code, the Fund designates $3,333,000 as capital gain dividends for its year ended December 31, 2020.
For corporate shareholders, 100% of the ordinary dividends (i.e., income dividends plus short-term capital gains) paid during the Fund’s fiscal year ended December 31, 2020, qualified for the dividends received deduction.
Please consult a tax advisor if you have questions about federal or state income tax laws, or on how to prepare your tax returns. If you have specific questions about your account, please contact your insurance provider.
The Trust��s policies and procedures for voting proxies for portfolio securities and information about how the Trust voted proxies related to its portfolio securities during the most recent 12-month period ended June 30 are available on our Web site — dws.com/en-us/resources/proxy-voting — or on the SEC’s Web site — sec.gov. To obtain a written copy of the Trust’s policies and procedures without charge, upon request, call us toll free at (800) 728-3337.
| | | | | | |
| | 20 | | | | | | Deutsche DWS Variable Series II — DWS Small Mid Cap Growth VIP |
Advisory Agreement Board Considerations and Fee Evaluation
The Board of Trustees (hereinafter referred to as the “Board” or “Trustees”) approved the renewal of DWS Small Mid Cap Growth VIP’s (the “Fund”) investment management agreement (the “Agreement”) with DWS Investment Management Americas, Inc. (“DIMA”) in September 2020.
In terms of the process that the Board followed prior to approving the Agreement, shareholders should know that:
| – | | During the entire process, all of the Fund’s Trustees were independent of DIMA and its affiliates (the “Independent Trustees”). |
| – | | The Board met frequently during the past year to discuss fund matters and dedicated a substantial amount of time to contract review matters. Over the course of several months, the Board reviewed extensive materials received from DIMA, independent third parties and independent counsel. These materials included an analysis of the Fund’s performance, fees and expenses, and profitability from a fee consultant retained by the Fund’s Independent Trustees (the “Fee Consultant”). |
| – | | The Board also received extensive information throughout the year regarding performance of the Fund. |
| – | | The Independent Trustees regularly met privately with counsel to discuss contract review and other matters. In addition, the Independent Trustees were advised by the Fee Consultant in the course of their review of the Fund’s contractual arrangements and considered a comprehensive report prepared by the Fee Consultant in connection with their deliberations. |
| – | | In connection with reviewing the Agreement, the Board also reviewed the terms of the Fund’s distribution agreement, administrative services agreement, transfer agency agreement and other material service agreements. |
In connection with the contract review process, the Board considered the factors discussed below, among others. The Board also considered that DIMA and its predecessors have managed the Fund since its inception, and the Board believes that a long-term relationship with a capable, conscientious advisor is in the best interests of the Fund. The Board considered, generally, that shareholders chose to invest or remain invested in the Fund knowing that DIMA managed the Fund. DIMA is part of DWS Group GmbH & Co. KGaA (“DWS Group”). DWS Group is a global asset management business that offers a wide range of investing expertise and resources, including research capabilities in many countries throughout the world. In 2018, approximately 20% of DWS Group’s shares were sold in an initial public offering, with Deutsche Bank AG owning the remaining shares.
As part of the contract review process, the Board carefully considered the fees and expenses of each DWS fund overseen by the Board in light of the fund’s performance. In many cases, this led to the negotiation and implementation of expense caps.
While shareholders may focus primarily on fund performance and fees, the Fund’s Board considers these and many other factors, including the quality and integrity of DIMA’s personnel and administrative support services provided by DIMA, such as back-office operations, fund valuations, and compliance policies and procedures.
Nature, Quality and Extent of Services. The Board considered the terms of the Agreement, including the scope of advisory services provided under the Agreement. The Board noted that, under the Agreement, DIMA provides portfolio management services to the Fund and that, pursuant to a separate administrative services agreement, DIMA provides administrative services to the Fund. The Board considered the experience and skills of senior management and investment personnel and the resources made available to such personnel. The Board also considered the risks to DIMA in sponsoring or managing the Fund, including financial, operational and reputational risks, the potential economic impact to DIMA from such risks and DIMA’s approach to addressing such risks. The Board reviewed the Fund’s performance over short-term and long-term periods and compared those returns to various agreed-upon performance measures, including market index(es) and a peer universe compiled using information supplied by Morningstar Direct (“Morningstar”), an independent fund data service. The Board also noted that it has put into place a process of identifying “Funds in Review” (e.g., funds performing poorly relative to a peer universe), and receives additional reporting from DIMA regarding such funds and, where appropriate, DIMA’s plans to address underperformance. The Board believes this process is an effective manner of identifying and addressing underperforming funds. Based on the information provided, the Board noted that, for the one-, three- and five-year periods ended December 31, 2019, the Fund’s performance (Class A shares) was in the 4th quartile of the applicable Morningstar universe (the 1st quartile being the best performers and the 4th quartile being
| | | | |
Deutsche DWS Variable Series II — DWS Small Mid Cap Growth VIP | | | | | 21 |
the worst performers). The Board also observed that the Fund has underperformed its benchmark in the one-, three- and five-year periods ended December 31, 2019. The Board noted the disappointing investment performance of the Fund in recent periods and continued to discuss with senior management of DIMA the factors contributing to such underperformance and actions being taken to improve performance. The Board noted changes in the portfolio management team, effective April 19, 2018. The Board recognized the efforts by DIMA in recent years to enhance its investment platform and improve long-term performance across the DWS fund complex.
Fees and Expenses. The Board considered the Fund’s investment management fee schedule, operating expenses and total expense ratios, and comparative information provided by Broadridge Financial Solutions, Inc. (“Broadridge”) and the Fee Consultant regarding investment management fee rates paid to other investment advisors by similar funds (1st quartile being the most favorable and 4th quartile being the least favorable). With respect to management fees paid to other investment advisors by similar funds, the Board noted that the contractual fee rates paid by the Fund, which include a 0.10% fee paid to DIMA under the Fund’s administrative services agreement, were lower than the median (1st quartile) of the applicable Broadridge peer group (based on Broadridge data provided as of December 31, 2019). The Board noted that, effective March 1, 2020, the fee paid to DIMA under the Fund’s administrative services agreement was reduced to 0.097%. The Board noted that the Fund’s Class A shares total (net) operating expenses were expected to be lower than the median (2nd quartile) of the applicable Broadridge expense universe (based on Broadridge data provided as of December 31, 2019, and analyzing Broadridge expense universe Class A (net) expenses less any applicable 12b-1 fees) (“Broadridge Universe Expenses”). The Board noted that the expense limitation agreed to by DIMA was expected to help the Fund’s total (net) operating expenses remain competitive. The Board considered the Fund’s management fee rate as compared to fees charged by DIMA to comparable DWS U.S. registered funds (“DWS Funds”), noting that DIMA indicated that it does not provide services to any other comparable DWS Funds. The information requested by the Board as part of its review of fees and expenses also included information about institutional accounts (including any sub-advised funds and accounts) and funds offered primarily to European investors (“DWS Europe Funds”) managed by DWS Group. The Board noted that DIMA indicated that DWS Group does not manage any institutional accounts or DWS Europe Funds comparable to the Fund.
On the basis of the information provided, the Board concluded that management fees were reasonable and appropriate in light of the nature, quality and extent of services provided by DIMA.
Profitability. The Board reviewed detailed information regarding revenues received by DIMA under the Agreement. The Board considered the estimated costs to DIMA, and pre-tax profits realized by DIMA, from advising the DWS Funds, as well as estimates of the pre-tax profits attributable to managing the Fund in particular. The Board also received information regarding the estimated enterprise-wide profitability of DIMA and its affiliates with respect to all fund services in totality and by fund. The Board and the Fee Consultant reviewed DIMA’s methodology in allocating its costs to the management of the Fund. Based on the information provided, the Board concluded that the pre-tax profits realized by DIMA in connection with the management of the Fund were not unreasonable. The Board also reviewed certain publicly available information regarding the profitability of certain similar investment management firms. The Board noted that, while information regarding the profitability of such firms is limited (and in some cases is not necessarily prepared on a comparable basis), DIMA and its affiliates’ overall profitability with respect to the DWS Funds (after taking into account distribution and other services provided to the funds by DIMA and its affiliates) was lower than the overall profitability levels of most comparable firms for which such data was available.
Economies of Scale. The Board considered whether there are economies of scale with respect to the management of the Fund and whether the Fund benefits from any economies of scale. The Board noted that the Fund’s investment management fee schedule includes fee breakpoints. The Board concluded that the Fund’s fee schedule represents an appropriate sharing between the Fund and DIMA of such economies of scale as may exist in the management of the Fund at current asset levels.
Other Benefits to DIMA and Its Affiliates. The Board also considered the character and amount of other incidental or “fall-out” benefits received by DIMA and its affiliates, including any fees received by DIMA for administrative services provided to the Fund and any fees received by an affiliate of DIMA for transfer agency services provided to the Fund. The Board also considered benefits to DIMA related to brokerage and soft-dollar allocations, including allocating brokerage to pay for research generated by parties other than the executing broker dealers, which pertain primarily to funds investing in equity securities. In addition, the Board considered the incidental public relations benefits to DIMA related to DWS Funds advertising and cross-
| | | | | | |
| | 22 | | | | | | Deutsche DWS Variable Series II — DWS Small Mid Cap Growth VIP |
selling opportunities among DIMA products and services. The Board considered these benefits in reaching its conclusion that the Fund’s management fees were reasonable.
Compliance. The Board considered the significant attention and resources dedicated by DIMA to its compliance processes in recent years. The Board noted in particular (i) the experience, seniority and time commitment of the individuals serving as DIMA’s and the Fund’s chief compliance officers and (ii) the substantial commitment of resources by DIMA and its affiliates to compliance matters, including the retention of compliance personnel.
The Board also considered that on September 24, 2020, the SEC granted a temporary order permitting DIMA and its affiliates to continue providing investment advisory and underwriting services to the DWS Funds notwithstanding a consent order entered into by Deutsche Bank AG on June 17, 2020 (the “Consent Order”). The Board noted that the temporary order was granted effective as of the date of the Consent Order. The Board also noted various representations by DIMA to the Board relating to the Consent Order, including that the conduct giving rise to the Consent Order (unintentional conduct that resulted from a system outage that prevented Deutsche Bank AG from reporting data in accordance with applicable CFTC requirements for five days in April 2016) did not involve any DWS Fund or services DIMA and its affiliates provide to the DWS Funds, that DIMA and its personnel had no involvement in the alleged conduct giving rise to the Consent Order, and that the DWS Funds would not bear any financial impact or costs relating to the Consent Order.
Based on all of the information considered and the conclusions reached, the Board determined that the continuation of the Agreement is in the best interests of the Fund. In making this determination, the Board did not give particular weight to any single factor identified above. The Board considered these factors over the course of numerous meetings, certain of which were in executive session with only the Independent Trustees and counsel present. It is possible that individual Independent Trustees may have weighed these factors differently in reaching their individual decisions to approve the continuation of the Agreement.
| | | | |
Deutsche DWS Variable Series II — DWS Small Mid Cap Growth VIP | | | | | 23 |
Board Members and Officers
The following table presents certain information regarding the Board Members and Officers of the Trust/Corporation. Each Board Member’s year of birth is set forth in parentheses after his or her name. Unless otherwise noted, (i) each Board Member has engaged in the principal occupation(s) noted in the table for at least the most recent five years, although not necessarily in the same capacity; and (ii) the address of each Independent Board Member is Keith R. Fox, DWS Funds Board Chair, c/o Thomas R. Hiller, Ropes & Gray LLP, Prudential Tower, 800 Boylston Street, Boston, MA 02199-3600. Except as otherwise noted below, the term of office for each Board Member is until the election and qualification of a successor, or until such Board Member sooner dies, resigns, is removed or as otherwise provided in the governing documents of the Trust/Corporation. Because the Fund does not hold an annual meeting of shareholders, each Board Member will hold office for an indeterminate period.
The Board Members may also serve in similar capacities with other funds in the fund complex. The number of funds in the DWS fund complex shown in the table below includes all registered open- and closed-end funds (including all of their portfolios) advised by the Advisor and any registered funds that have an investment advisor that is an affiliated person of the Advisor.
| | | | | | | | |
| Independent Board Members | | | |
Name, Year of Birth,
Position with the Trust/
Corporation and
Length of Time Served1 | | Business Experience and Directorships During the Past Five Years | | Number of
Funds in
DWS Fund
Complex
Overseen | | | Other
Directorships
Held by Board
Member
|
Keith R. Fox, CFA (1954) Chairperson since 2017, and Board Member since 1996 | | Managing General Partner, Exeter Capital Partners (a series of private investment funds) (since 1986). Directorships: Progressive International Corporation (kitchen goods importer and distributor); former Chairman, National Association of Small Business Investment Companies; former Directorships: ICI Mutual Insurance Company; BoxTop Media Inc. (advertising); Sun Capital Advisers Trust (mutual funds) (2011–2012) | | | 73 | | | — |
John W. Ballantine (1946) Board Member since 1999 | | Retired; formerly, Executive Vice President and Chief Risk Management Officer, First Chicago NBD Corporation/The First National Bank of Chicago (1996–1998); Executive Vice President and Head of International Banking (1995–1996); former Directorships: Director and Chairman of the Board, Healthways, Inc.2 (population well-being and wellness services) (2003–2014); Stockwell Capital Investments PLC (private equity); Enron Corporation; FNB Corporation; Tokheim Corporation; First Oak Brook Bancshares, Inc.; Oak Brook Bank; and Prisma Energy International. Not-for-Profit Director/Trustee: Palm Beach Civic Association; Window to the World Communications (public media); Life Director of Harris Theater for Music and Dance (Chicago); Life Director of Hubbard Street Dance Chicago; former Not-for-Profit Directorships: Public Radio International | | | 73 | | | Portland
General
Electric2
(utility
company)
(2003–
present) |
Dawn-Marie Driscoll (1946) Board Member since 1987 | | Emeritus Executive Fellow, Center for Business Ethics, Bentley University; formerly: Partner, Palmer & Dodge (law firm) (1988–1990); Vice President of Corporate Affairs and General Counsel, Filene’s (retail) (1978–1988). Directorships: Advisory Board, Center for Business Ethics, Bentley University; Trustee and former Chairman of the Board, Southwest Florida Community Foundation (charitable organization); former Directorships: ICI Mutual Insurance Company (2007–2015); Sun Capital Advisers Trust (mutual funds) (2007–2012), Investment Company Institute (audit, executive, nominating committees) and Independent Directors Council (governance, executive committees) | | | 73 | | | — |
Richard J. Herring (1946) Board Member since 1990 | | Jacob Safra Professor of International Banking and Professor of Finance, The Wharton School, University of Pennsylvania (since July 1972); Director, The Wharton Financial Institutions Center (since 1994); formerly: Vice Dean and Director, Wharton Undergraduate Division (1995–2000) and Director, The Lauder Institute of International Management Studies (2000–2006); Member FDIC Systemic Risk Advisory Committee since 2011, member Systemic Risk Council since 2012 and member of the Advisory Board at the Yale Program on Financial Stability since 2013; Formerly Co-Chair of the Shadow Financial Regulatory Committee (2003–2015), Executive Director of The Financial Economists Roundtable (2008–2015), Director of The Thai Capital Fund (2007–2013), Director of The Aberdeen Singapore Fund (2007–2018), and Nonexecutive Director of Barclays Bank DE (2010–2018) | | | 73 | | | Director,
Aberdeen
Japan Fund
(since 2007) |
William McClayton (1944) Board Member since 2004 | | Private equity investor (since October 2009); previously, Managing Director, Diamond Management & Technology Consultants, Inc. (global consulting firm) (2001–2009); Directorship: Board of Managers, YMCA of Metropolitan Chicago; formerly: Senior Partner, Arthur Andersen LLP (accounting) (1966–2001); Trustee, Ravinia Festival | | | 73 | | | — |
| | | | | | |
| | 24 | | | | | | Deutsche DWS Variable Series II — DWS Small Mid Cap Growth VIP |
| | | | | | | | |
Name, Year of Birth,
Position with the Trust/
Corporation and
Length of Time Served1 | | Business Experience and Directorships During the Past Five Years | | Number of
Funds in
DWS Fund
Complex
Overseen | | | Other
Directorships
Held by Board
Member
|
Rebecca W. Rimel (1951) Board Member since 1995 | | Senior Advisor, The Pew Charitable Trusts (charitable organization) (since July 2020); formerly: Executive Vice President, The Glenmede Trust Company (investment trust and wealth management) (1983–2004); Board Member, Investor Education (charitable organization) (2004–2005); Trustee, Executive Committee, Philadelphia Chamber of Commerce (2001–2007); Director, Viasys Health Care2 (January 2007–June 2007); Trustee, Thomas Jefferson Foundation (charitable organization) (1994–2012); President, Chief Executive Officer and Director, The Pew Charitable Trusts (charitable organization) (1994–2020) | | | 73 | | | Director,
Becton
Dickinson
and
Company2
(medical
technology
company)
(2012–
present);
Director,
BioTelemetry
Inc.2 (health
care) (2009–
present) |
William N. Searcy, Jr. (1946) Board Member since 1993 | | Private investor since October 2003; formerly: Pension & Savings Trust Officer, Sprint Corporation2 (telecommunications) (November 1989–September 2003); Trustee, Sun Capital Advisers Trust (mutual funds) (1998–2012) | | | 73 | | | — |
| | |
| Officers4 | | |
Name, Year of Birth,
Position with the Trust/
Corporation and
Length of Time Served5 | | Business Experience and Directorships During the Past Five Years |
Hepsen Uzcan6 (1974) President and Chief Executive Officer, 2017–present | | Managing Director3, DWS; Secretary, DWS USA Corporation (2018–present); Assistant Secretary, DWS Distributors, Inc. (2018–present); Director and Vice President, DWS Service Company (2018–present); Assistant Secretary, DWS Investment Management Americas, Inc. (2018–present); Director and President, DB Investment Managers, Inc. (2018–present); President and Chief Executive Officer, The European Equity Fund, Inc., The New Germany Fund, Inc. and The Central and Eastern Europe Fund, Inc. (2017–present); formerly: Vice President for the Deutsche funds (2016–2017); Assistant Secretary for the DWS funds (2013–2019); Assistant Secretary, The European Equity Fund, Inc., The New Germany Fund, Inc. and The Central and Eastern Europe Fund, Inc. (2013–2020); Directorships: Interested Director, The European Equity Fund, Inc., The New Germany Fund, Inc. and The Central and Eastern Europe Fund, Inc. (since June 25, 2020); ICI Mutual Insurance Company (since October 16, 2020); and Episcopalian Charities of New York (2018–present) |
John Millette7 (1962) Vice President and Secretary, 1999–present | | Director,3 DWS; Chief Legal Officer, DWS Investment Management Americas, Inc. (2015–present); Director and Vice President, DWS Trust Company (2016–present); Secretary, DBX ETF Trust (2020–present); Secretary, The European Equity Fund, Inc., The New Germany Fund, Inc. and The Central and Eastern Europe Fund, Inc. (2011–present); formerly: Secretary, Deutsche Investment Management Americas Inc. (2015–2017); Assistant Secretary, DBX ETF Trust (2019–2020); Assistant Secretary (July 14, 2006–December 31, 2010) and Secretary (January 31, 2006–July 13, 2006), The European Equity Fund, Inc., The New Germany Fund, Inc. and The Central and Eastern Europe Fund, Inc. |
Ciara Crawford8 (1984) Assistant Secretary, (2019–present) | | Associate, DWS (since 2015); previously, Legal Assistant at Accelerated Tax Solutions. |
Diane Kenneally7 (1966) Chief Financial Officer and Treasurer, 2018–present | | Director,3 DWS; Treasurer, Chief Financial Officer and Controller, DBX ETF Trust (2019–present); Treasurer and Chief Financial Officer, The European Equity Fund, Inc., The New Germany Fund, Inc. and The Central and Eastern Europe Fund, Inc. (2018–present); formerly: Assistant Treasurer for the DWS funds (2007–2018) |
Paul Antosca7 (1957) Assistant Treasurer, 2007–present | | Director,3 DWS; and Assistant Treasurer, DBX ETF Trust (2019–present) |
Sheila Cadogan7 (1966) Assistant Treasurer, 2017–present | | Director,3 DWS; Director and Vice President, DWS Trust Company (2018–present); Assistant Treasurer, DBX ETF Trust (2019–present); Assistant Treasurer, The European Equity Fund, Inc., The New Germany Fund, Inc. and The Central and Eastern Europe Fund, Inc. (2018–present) |
Scott D. Hogan7 (1970) Chief Compliance Officer, 2016–present | | Director,3 DWS; Chief Compliance Officer, The European Equity Fund, Inc., The New Germany Fund, Inc. and The Central and Eastern Europe Fund, Inc. (2016–present) |
Caroline Pearson7 (1962) Chief Legal Officer, 2010–present | | Managing Director3, DWS; Assistant Secretary, DBX ETF Trust (2020–present); Chief Legal Officer, DBX Advisors LLC and DBX Strategic Advisors LLC (2020–present); Chief Legal Officer, The European Equity Fund, Inc., The New Germany Fund, Inc. and The Central and Eastern Europe Fund, Inc. (2012–present); formerly: Secretary, Deutsche AM Distributors, Inc. (2002–2017); and Secretary, Deutsche AM Service Company (2010–2017) |
| | | | |
Deutsche DWS Variable Series II — DWS Small Mid Cap Growth VIP | | | | | 25 |
| | |
Name, Year of Birth,
Position with the Trust/
Corporation and
Length of Time Served5 | | Business Experience and Directorships During the Past Five Years |
Michelle Goveia-Pine6 (1970) Interim Anti-Money Laundering Compliance Officer, since July 10, 2020 | | Director,3 DWS; Interim AML Officer, DWS Trust Company (since July 28, 2020); Interim AML Officer, DBX ETF Trust (since July 9, 2020); Interim AML Officer, The European Equity Fund, Inc., The New Germany Fund, Inc. and The Central and Eastern Europe Fund, Inc. (since July 24, 2020) |
| 1 | The length of time served represents the year in which the Board Member joined the board of one or more DWS funds currently overseen by the Board. |
| 2 | A publicly held company with securities registered pursuant to Section 12 of the Securities Exchange Act of 1934. |
| 3 | Executive title, not a board directorship. |
| 4 | As a result of their respective positions held with the Advisor or its affiliates, these individuals are considered “interested persons” of the Advisor within the meaning of the 1940 Act. Interested persons receive no compensation from the Fund. |
| 5 | The length of time served represents the year in which the officer was first elected in such capacity for one or more DWS funds. |
| 6 | Address: 875 Third Avenue, New York, NY 10022. |
| 7 | Address: 100 Summer Street, Boston, MA 02110. |
| 8 | Address: 5022 Gate Parkway, Suite 400, Jacksonville, FL 32256. |
The Fund’s Statement of Additional Information (“SAI”) includes additional information about the Board Members. The SAI is available, without charge, upon request. If you would like to request a copy of the SAI, you may do so by calling the following toll-free number: (800) 728-3337.
| | | | | | |
| | 26 | | | | | | Deutsche DWS Variable Series II — DWS Small Mid Cap Growth VIP |
Notes
| | |
| | |
VS2SMCG-2 (R-025835-10 2/21) | | |
December 31, 2020
Annual Report
Deutsche DWS Variable Series II
DWS Small Mid Cap Value VIP

Contents
| | | | |
| | 3 | | | Performance Summary |
| | 4 | | | Management Summary |
| | 6 | | | Portfolio Summary |
| | 7 | | | Investment Portfolio |
| | 10 | | | Statement of Assets and Liabilities |
| | 10 | | | Statement of Operations |
| | 11 | | | Statements of Changes in Net Assets |
| | 12 | | | Financial Highlights |
| | 13 | | | Notes to Financial Statements |
| | 18 | | | Report of Independent Registered Public Accounting Firm |
| | 19 | | | Information About Your Fund’s Expenses |
| | 20 | | | Tax Information |
| | 20 | | | Proxy Voting |
| | 21 | | | Advisory Agreement Board Considerations and Fee Evaluation |
| | 24 | | | Board Members and Officers |
This report must be preceded or accompanied by a prospectus. To obtain an additional prospectus or summary prospectus, if available, call (800) 728-3337 or your financial representative. We advise you to consider the Fund’s objectives, risks, charges and expenses carefully before investing. The summary prospectus and prospectus contain this and other important information about the Fund. Please read the prospectus carefully before you invest.
Stocks may decline in value. Smaller and medium company stocks tend to be more volatile than large company stocks. Any fund that focuses in a particular segment of the market or region of the world will generally be more volatile than a fund that invests more broadly. Investing in foreign securities presents certain risks, such as currency fluctuations, political and economic changes, and market risks. The impact of the use of quantitative models and the analysis of specific metrics on a stock’s performance can be difficult to predict, and stocks that previously possessed certain desirable quantitative characteristics may not continue to demonstrate those same characteristics in the future. Quantitative models also entail the risk that the models themselves may be limited or incorrect. Investing in foreign securities presents certain risks, such as currency fluctuations, political and economic changes, and market risks. The Fund may lend securities to approved institutions. Please read the prospectus for details.
War, terrorism, economic uncertainty, trade disputes, public health crises (including the recent pandemic spread of the novel coronavirus) and related geopolitical events could lead to increased market volatility, disruption to U.S. and world economies and markets and may have significant adverse effects on the Fund and its investments.
The brand DWS represents DWS Group GmbH & Co. KGaA and any of its subsidiaries such as DWS Distributors, Inc. which offers investment products or DWS Investment Management Americas, Inc. and RREEF America L.L.C. which offer advisory services.
DWS Distributors, Inc., 222 South Riverside Plaza, Chicago, IL 60606, (800) 621-1148
NOT FDIC/NCUA INSURED NO BANK GUARANTEE MAY LOSE VALUE NOT A DEPOSIT
NOT INSURED BY ANY FEDERAL GOVERNMENT AGENCY
| | | | | | |
| | 2 | | | | | | Deutsche DWS Variable Series II — DWS Small Mid Cap Value VIP |
| | |
| Performance Summary | | December 31, 2020 (Unaudited) |
Fund performance shown is historical, assumes reinvestment of all dividend and capital gain distributions and does not guarantee future results. Investment return and principal value fluctuate with changing market conditions so that, when redeemed, shares may be worth more or less than their original cost. Current performance may be lower or higher than the performance data quoted. Please contact your participating insurance company for the Fund’s most recent month-end performance. Performance does not reflect charges and fees (“contract charges”) associated with the separate account that invests in the Fund or any variable life insurance policy or variable annuity contract for which the Fund is an investment option. These charges and fees will reduce returns. While all share classes have the same underlying portfolio, their performance will differ.
The gross expense ratios of the Fund, as stated in the fee table of the prospectus dated May 1, 2020 are 0.88% and 1.25% for Class A and Class B shares, respectively, and may differ from the expense ratios disclosed in the Financial Highlights tables in this report.
Generally accepted accounting principles require adjustments to be made to the net assets of the Fund at period end for financial reporting purposes only, and as such, the total return based on the unadjusted net asset value per share may differ from the total return reported in the financial highlights.
Growth of an Assumed $10,000 Investment
| | |
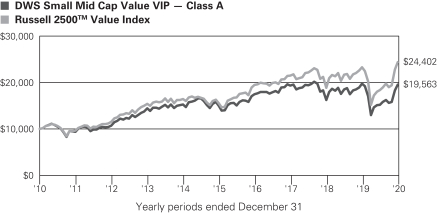
| | Russell 2500™ Value Index is an unmanaged index measuring the small- to mid-cap U.S. equity value market. Index returns do not reflect any fees or expenses and it is not possible to invest directly into an index. |
| | | | | | | | | | |
| Comparative Results | | | | | | | | |
| | | | |
| DWS Small Mid Cap Value VIP | | 1-Year | | 3-Year | | 5-Year | | 10-Year |
| Class A | | Growth of $10,000 | | $9,920 | | $10,124 | | $13,079 | | $19,563 |
| | | Average annual total return | | –0.80% | | 0.41% | | 5.51% | | 6.94% |
| Russell 2500 Value Index | | Growth of $10,000 | | $10,488 | | $11,358 | | $15,693 | | $24,402 |
| | | Average annual total return | | 4.88% | | 4.34% | | 9.43% | | 9.33% |
| | | | |
| DWS Small Mid Cap Value VIP | | 1-Year | | 3-Year | | 5-Year | | 10-Year |
| Class B | | Growth of $10,000 | | $9,889 | | $10,012 | | $12,842 | | $18,880 |
| | | Average annual total return | | –1.11% | | 0.04% | | 5.13% | | 6.56% |
| Russell 2500 Value Index | | Growth of $10,000 | | $10,488 | | $11,358 | | $15,693 | | $24,402 |
| | | Average annual total return | | 4.88% | | 4.34% | | 9.43% | | 9.33% |
The growth of $10,000 is cumulative.
| | | | |
Deutsche DWS Variable Series II — DWS Small Mid Cap Value VIP | | | | | 3 |
| | |
| Management Summary | | December 31, 2020 (Unaudited) |
Class A shares of DWS Small Mid Cap Value VIP returned –0.80% in 2020 (unadjusted for contract charges) and underperformed the 4.88% gain of the Russell 2500™ Value Index.
Small-cap value stocks struggled for most of the 2020, but a late rally enabled the category to finish the year with a positive total return. After a strong start, stocks collapsed in mid-February once it became evident that COVID-19 would have a significant impact on economic growth and corporate earnings. The markets stabilized in late March after world governments and central banks stepped in with an unprecedented level of fiscal and monetary stimulus. Investors concluded that these measures would help bridge the gap until the virus was contained, sparking a rally that continued until year-end. However, the gains were primarily focused on mega-cap growth stocks for the majority of 2020. Only in November, when a vaccine for COVID-19 was finally approved, did investors feel comfortable moving into more economically sensitive areas such as smaller companies and the value style. This trend helped Russell 2500 Value Index climb back into positive territory on a year-to-date basis in early December, and it held on to the gain through the end of the year.
The Fund uses proprietary quantitative models that seek to identify the most attractive stocks in the index based on fundamental factors that have been effective sources of return over time, such as valuation, momentum, profitability, earnings, and sales growth. The models are dynamic and use specific factor weights for separate industry groups. The goal of this strategy is to maximize return potential while maintaining a risk profile similar to that of the index. Our process did not work as well as intended in 2020, largely due to modest deviations in factor exposures relative to the benchmark. In an effort to counter this issue, we tightened our factor constraints to minimize, if not eliminate, any biases. As always, we continue to revise and update our industry models to adapt to changes in the market.
The Fund lagged its benchmark by the widest margin in the consumer discretionary sector. Regis Corp.*, which operates a wide range of hair-salon chains, was the largest detractor due to extended closures stemming from COVID-19. Positions in Columbia Sportswear Co. and Michaels Companies, Inc.* further weighed on results. Health care also proved to be a challenging area for the Fund, as a handful of holdings — including Mallinckrodt PLC*, Bruker Corp., and Invacare Corp. — failed to keep pace with the broader sector. Outside of these two areas, Hertz Global Holdings, Inc.* and Peabody Energy Corp. were among the most notable detractors.
On the positive side, our strategy generated strong outperformance in the real estate sector. Easterly Government Properties, Inc.*, which proved largely immune to coronavirus-induced slowdown given that it primarily leases its properties to government agencies, was the top contributor. Consumer staples and financials were additional areas of strength, thanks to positions in Central Garden & Pet Co. and the commercial real estate financing company Walker & Dunlop, Inc. Qurate Retail Inc., a media company that owns a variety of home shopping networks, also performed well as investors were compelled to change their shopping patterns due to COVID-related lockdowns.
Stocks performed remarkably well in the time since the March lows, which was quite impressive given how dire the investment outlook appeared in the early days of COVID-19. Although it remains to be seen whether the rollout of the vaccine will indeed lead to improving growth, investors have clearly “looked past the valley” in anticipation of stronger economic conditions in 2021. Broader-market valuations increased considerably in the second half of the year as a result. While valuations don’t necessarily correlate with near-term performance, stocks could become more volatile in the year ahead if the economic recovery isn’t as smooth as the November-December rally would indicate. With this as the backdrop, we believe our steady, rules-based strategy — which strives to evaluate companies in a disciplined and dispassionate manner — is well suited for a time characterized by both continued opportunity and potentially increased risk.
Pankaj Bhatnagar, PhD, Managing Director
Arno V. Puskar, Director
Portfolio Managers
The views expressed reflect those of the portfolio management team only through the end of the period of the report as stated on the cover. The management team’s views are subject to change at any time based on market and other conditions and should not be construed as a recommendation. Past performance is no guarantee of future results. Current and future portfolio holdings are subject to risk.
| | | | | | |
| | 4 | | | | | | Deutsche DWS Variable Series II — DWS Small Mid Cap Value VIP |
Terms to Know
Russell 2500 Value Index is an unmanaged index measuring the small- to mid-cap U.S. equity value market.
Contribution and detraction incorporate both a stock’s total return and its weighting in the fund.
| * | Not held at December 31, 2020. |
| | | | |
Deutsche DWS Variable Series II — DWS Small Mid Cap Value VIP | | | | | 5 |
| | |
| Portfolio Summary | | (Unaudited) |
| | | | | | | | |
| Asset Allocation (As a % of Investment Portfolio excluding Securities Lending Collateral) | | 12/31/20 | | | 12/31/19 | |
| Common Stocks | | | 100% | | | | 99% | |
| Cash Equivalents | | | 0% | | | | 1% | |
| | | | 100% | | | | 100% | |
| | |
Sector Diversification
(As a % of Investment Portfolio excluding Cash Equivalents and Securities Lending Collateral) | | 12/31/20 | | | 12/31/19 | |
Financials | | | 20% | | | | 23% | |
Industrials | | | 17% | | | | 14% | |
Consumer Discretionary | | | 14% | | | | 10% | |
Real Estate | | | 12% | | | | 14% | |
Information Technology | | | 9% | | | | 9% | |
Health Care | | | 7% | | | | 6% | |
Materials | | | 7% | | | | 7% | |
Utilities | | | 4% | | | | 6% | |
Energy | | | 4% | | | | 5% | |
Communication Services | | | 3% | | | | 3% | |
Consumer Staples | | | 3% | | | | 3% | |
| | | | 100% | | | | 100% | |
Portfolio holdings and characteristics are subject to change.
For more complete details about the Fund’s investment portfolio, see page 7.
Following the Fund’s fiscal first and third quarter-end, a complete portfolio holdings listing is posted on dws.com, and is available free of charge by contacting your financial intermediary, or if you are a direct investor, by calling (800) 728-3337. In addition, the portfolio holdings listing is filed with the SEC on the Fund’s Form N-PORT and will be available on the SEC’s Web site at sec.gov. Additional portfolio holdings for the Fund are also posted on dws.com from time to time. Please see the Fund’s current prospectus for more information.
| | | | | | |
| | 6 | | | | | | Deutsche DWS Variable Series II — DWS Small Mid Cap Value VIP |
| | |
| Investment Portfolio | | as of December 31, 2020 |
| | | | | | | | |
| | | Shares | | | Value ($) | |
| Common Stocks 99.7% | |
| Communication Services 3.4% | |
|
Entertainment 0.9% | |
Lions Gate Entertainment Corp. “A”* (a) | | | 66,768 | | | | 759,152 | |
|
Media 2.1% | |
Interpublic Group of Companies, Inc. | | | 77,473 | | | | 1,822,165 | |
|
Wireless Telecommunication Services 0.4% | |
Telephone & Data Systems, Inc. | | | 21,403 | | | | 397,454 | |
|
| Consumer Discretionary 13.6% | |
Auto Components 0.3% | |
Goodyear Tire & Rubber Co. | | | 27,451 | | | | 299,490 | |
|
Automobiles 1.4% | |
Winnebago Industries, Inc. | | | 20,175 | | | | 1,209,290 | |
|
Distributors 0.3% | |
Core-Mark Holding Co., Inc. | | | 8,219 | | | | 241,392 | |
|
Hotels, Restaurants & Leisure 4.0% | |
| | |
Aramark | | | 50,036 | | | | 1,925,385 | |
| | |
Boyd Gaming Corp. | | | 11,289 | | | | 484,524 | |
| | |
Choice Hotels International, Inc. | | | 2,637 | | | | 281,447 | |
| | |
International Game Technology PLC | | | 21,168 | | | | 358,586 | |
| | |
Red Rock Resorts, Inc. “A” | | | 17,585 | | | | 440,329 | |
| | | | | | | | |
| | | | | | | 3,490,271 | |
|
Household Durables 1.5% | |
PulteGroup, Inc. | | | 30,685 | | | | 1,323,137 | |
|
Internet & Direct Marketing Retail 1.7% | |
| | |
Overstock.com, Inc.* (a) | | | 9,912 | | | | 475,478 | |
| | |
Qurate Retail, Inc. “A” | | | 90,577 | | | | 993,630 | |
| | | | | | | | |
| | | | | | | 1,469,108 | |
|
Leisure Products 1.7% | |
| | |
Brunswick Corp. | | | 17,166 | | | | 1,308,736 | |
| | |
Nautilus, Inc.* (a) | | | 9,884 | | | | 179,296 | |
| | | | | | | | |
| | | | | | | 1,488,032 | |
|
Specialty Retail 0.4% | |
Boot Barn Holdings, Inc.* | | | 7,546 | | | | 327,195 | |
|
Textiles, Apparel & Luxury Goods 2.3% | |
| | |
Columbia Sportswear Co. | | | 16,082 | | | | 1,405,245 | |
| | |
Under Armour, Inc. “A”* | | | 36,419 | | | | 625,314 | |
| | | | | | | | |
| | | | | | | 2,030,559 | |
|
| Consumer Staples 3.2% | |
Food & Staples Retailing 0.5% | |
The Andersons, Inc. | | | 18,649 | | | | 457,087 | |
|
Food Products 0.7% | |
Darling Ingredients, Inc.* | | | 11,188 | | | | 645,324 | |
|
Household Products 2.0% | |
| | |
Central Garden & Pet Co.* | | | 20,865 | | | | 805,598 | |
| | |
Spectrum Brands Holdings, Inc. | | | 11,587 | | | | 915,141 | |
| | | | | | | | |
| | | | | | | 1,720,739 | |
| | | | | | | | |
| | | Shares | | | Value ($) | |
|
| Energy 3.8% | |
Oil, Gas & Consumable Fuels | |
| | |
Devon Energy Corp. | | | 40,830 | | | | 645,522 | |
| | |
Equitrans Midstream Corp. | | | 111,906 | | | | 899,724 | |
| | |
Peabody Energy Corp.* | | | 148,020 | | | | 356,728 | |
| | |
Renewable Energy Group, Inc.* | | | 3,491 | | | | 247,233 | |
| | |
Targa Resources Corp. | | | 43,415 | | | | 1,145,288 | |
| | | | | | | | |
| | | | | | | 3,294,495 | |
| Financials 20.3% | |
Banks 8.4% | |
| | |
BankUnited, Inc. | | | 42,766 | | | | 1,487,402 | |
| | |
Commerce Bancshares, Inc. | | | 3,421 | | | | 224,760 | |
| | |
ConnectOne Bancorp., Inc. | | | 11,504 | | | | 227,664 | |
| | |
Eagle Bancorp., Inc. | | | 29,648 | | | | 1,224,462 | |
| | |
Flushing Financial Corp. | | | 14,310 | | | | 238,118 | |
| | |
Hancock Whitney Corp. | | | 21,427 | | | | 728,947 | |
| | |
Hilltop Holdings, Inc. | | | 18,538 | | | | 509,980 | |
| | |
Simmons First National Corp. “A” | | | 32,240 | | | | 696,062 | |
| | |
UMB Financial Corp. | | | 18,298 | | | | 1,262,379 | |
| | |
Valley National Bancorp. | | | 77,972 | | | | 760,227 | |
| | | | | | | | |
| | | | 7,360,001 | |
|
Capital Markets 0.9% | |
Donnelley Financial Solutions, Inc.* | | | 43,730 | | | | 742,098 | |
|
Consumer Finance 0.8% | |
Credit Acceptance Corp.* (a) | | | 2,012 | | | | 696,434 | |
|
Diversified Financial Services 0.7% | |
Voya Financial, Inc. | | | 10,464 | | | | 615,388 | |
|
Insurance 5.8% | |
| | |
American Equity Investment Life Holding Co. | | | 15,400 | | | | 425,964 | |
| | |
Assurant, Inc. | | | 11,157 | | | | 1,519,807 | |
| | |
Athene Holding Ltd. “A”* | | | 5,162 | | | | 222,689 | |
| | |
Brown & Brown, Inc. | | | 38,186 | | | | 1,810,398 | |
| | |
Everest Re Group Ltd. | | | 3,480 | | | | 814,633 | |
| | |
Globe Life, Inc. | | | 2,820 | | | | 267,787 | |
| | | | | | | | |
| | | | 5,061,278 | |
|
Mortgage Real Estate Investment Trusts (REITs) 2.0% | |
| | |
Blackstone Mortgage Trust, Inc., “A” | | | 30,794 | | | | 847,759 | |
| | |
Ellington Financial, Inc. | | | 25,308 | | | | 375,570 | |
| | |
PennyMac Mortgage Investment Trust | | | 18,527 | | | | 325,890 | |
| | |
Redwood Trust, Inc. | | | 27,145 | | | | 238,333 | |
| | | | | | | | |
| | | | 1,787,552 | |
|
Thrifts & Mortgage Finance 1.7% | |
Walker & Dunlop, Inc. | | | 16,128 | | | | 1,484,098 | |
|
| Health Care 7.1% | |
Biotechnology 2.2% | |
| | |
Agios Pharmaceuticals, Inc.* | | | 7,532 | | | | 326,361 | |
| | |
Bluebird Bio, Inc.* | | | 7,969 | | | | 344,819 | |
| | |
Myriad Genetics, Inc.* | | | 35,679 | | | | 705,552 | |
| | |
Novavax, Inc.* (a) | | | 2,643 | | | | 294,721 | |
| | |
Sage Therapeutics, Inc.* | | | 2,615 | | | | 226,224 | |
| | | | | | | | |
| | | | 1,897,677 | |
The accompanying notes are an integral part of the financial statements.
| | | | |
Deutsche DWS Variable Series II — DWS Small Mid Cap Value VIP | | | | | 7 |
| | | | | | | | |
| | | Shares | | | Value ($) | |
|
Health Care Equipment & Supplies 0.9% | |
| | |
ICU Medical, Inc.* | | | 1,594 | | | | 341,897 | |
| | |
Invacare Corp. | | | 50,340 | | | | 450,543 | |
| | | | | | | | |
| | | | 792,440 | |
|
Health Care Providers & Services 0.3% | |
Molina Healthcare, Inc.* | | | 1,203 | | | | 255,854 | |
|
Life Sciences Tools & Services 3.2% | |
| | |
Bruker Corp. | | | 20,724 | | | | 1,121,790 | |
| | |
PerkinElmer, Inc. | | | 9,197 | | | | 1,319,770 | |
| | |
Syneos Health, Inc.* | | | 5,591 | | | | 380,915 | |
| | | | | | | | |
| | | | 2,822,475 | |
|
Pharmaceuticals 0.5% | |
Endo International PLC* (a) | | | 57,178 | | | | 410,538 | |
|
| Industrials 17.0% | |
Aerospace & Defense 1.9% | |
Teledyne Technologies, Inc.* | | | 4,200 | | | | 1,646,316 | |
|
Air Freight & Logistics 0.7% | |
Atlas Air Worldwide Holdings, Inc.* | | | 11,482 | | | | 626,228 | |
|
Building Products 1.5% | |
| | |
Resideo Technologies, Inc.* | | | 14,020 | | | | 298,065 | |
| | |
Simpson Manufacturing Co., Inc. | | | 10,683 | | | | 998,327 | |
| | | | | | | | |
| | | | 1,296,392 | |
|
Commercial Services & Supplies 2.3% | |
| | |
IAA, Inc.* | | | 20,112 | | | | 1,306,878 | |
| | |
Interface, Inc. | | | 65,057 | | | | 683,098 | |
| | | | | | | | |
| | | | 1,989,976 | |
|
Construction & Engineering 1.6% | |
Jacobs Engineering Group, Inc. | | | 12,823 | | | | 1,397,194 | |
|
Electrical Equipment 1.9% | |
EnerSys | | | 20,450 | | | | 1,698,577 | |
|
Industrial Conglomerates 1.1% | |
Carlisle Companies, Inc. | | | 6,002 | | | | 937,392 | |
|
Machinery 4.8% | |
| | |
Federal Signal Corp. | | | 37,993 | | | | 1,260,228 | |
| | |
Hillenbrand, Inc. | | | 40,909 | | | | 1,628,178 | |
| | |
The Manitowoc Co., Inc.* | | | 68,765 | | | | 915,262 | |
| | |
Pentair PLC | | | 7,157 | | | | 379,965 | |
| | | | | | | | |
| | | | 4,183,633 | |
|
Road & Rail 0.2% | |
Knight-Swift Transportation Holdings, Inc. | | | 5,170 | | | | 216,210 | |
|
Trading Companies & Distributors 1.0% | |
NOW, Inc.* | | | 115,938 | | | | 832,435 | |
|
| Information Technology 8.8% | |
Communications Equipment 1.4% | |
| | |
Ciena Corp.* | | | 8,379 | | | | 442,830 | |
| | |
CommScope Holding Co., Inc.* | | | 57,699 | | | | 773,167 | |
| | | | | | | | |
| | | | 1,215,997 | |
|
Electronic Equipment, Instruments & Components 2.0% | |
| | |
Avnet, Inc. | | | 24,965 | | | | 876,521 | |
| | |
Insight Enterprises, Inc.* | | | 7,720 | | | | 587,415 | |
| | |
SYNNEX Corp. | | | 4,038 | | | | 328,854 | |
| | | | | | | | |
| | | | 1,792,790 | |
| | | | | | | | |
| | | Shares | | | Value ($) | |
|
IT Services 2.0% | |
| | |
Alliance Data Systems Corp. | | | 9,391 | | | | 695,873 | |
| | |
Concentrix Corp.* | | | 3,625 | | | | 357,788 | |
| | |
Leidos Holdings, Inc. | | | 6,243 | | | | 656,264 | |
| | | | | | | | |
| | | | 1,709,925 | |
|
Semiconductors & Semiconductor Equipment 1.3% | |
| | |
Cirrus Logic, Inc.* | | | 9,449 | | | | 776,708 | |
| | |
ON Semiconductor Corp.* | | | 10,558 | | | | 345,563 | |
| | | | | | | | |
| | | | 1,122,271 | |
|
Software 2.1% | |
| | |
Cloudera, Inc.* | | | 24,944 | | | | 346,971 | |
| | |
Verint Systems, Inc.* | | | 21,689 | | | | 1,457,067 | |
| | | | | | | | |
| | | | 1,804,038 | |
|
| Materials 6.7% | |
Chemicals 3.3% | |
| | |
Albemarle Corp. | | | 2,026 | | | | 298,876 | |
| | |
Avient Corp. | | | 11,497 | | | | 463,099 | |
| | |
H.B. Fuller Co. | | | 6,522 | | | | 338,361 | |
| | |
Kraton Corp.* | | | 55,450 | | | | 1,540,955 | |
| | |
The Mosaic Co. | | | 9,850 | | | | 226,649 | |
| | | | | | | | |
| | | | 2,867,940 | |
|
Containers & Packaging 0.5% | |
Graphic Packaging Holding Co. | | | 25,865 | | | | 438,153 | |
|
Metals & Mining 2.9% | |
| | |
Coeur Mining, Inc.* | | | 118,553 | | | | 1,227,023 | |
| | |
Steel Dynamics, Inc. | | | 36,117 | | | | 1,331,634 | |
| | | | | | | | |
| | | | 2,558,657 | |
|
| Real Estate 11.9% | |
Equity Real Estate Investment Trusts (REITs) | |
| | |
Agree Realty Corp. | | | 21,068 | | | | 1,402,708 | |
| | |
Alexander & Baldwin, Inc. (a) | | | 19,091 | | | | 327,984 | |
| | |
Duke Realty Corp. | | | 26,566 | | | | 1,061,843 | |
| | |
Gaming and Leisure Properties, Inc. | | | 33,868 | | | | 1,436,003 | |
| | |
Highwoods Properties, Inc. | | | 28,630 | | | | 1,134,607 | |
| | |
Iron Mountain, Inc. (a) | | | 8,465 | | | | 249,548 | |
| | |
Lexington Realty Trust | | | 86,944 | | | | 923,345 | |
| | |
SITE Centers Corp. | | | 70,528 | | | | 713,743 | |
| | |
STAG Industrial, Inc. | | | 43,062 | | | | 1,348,702 | |
| | |
Urban Edge Properties | | | 49,462 | | | | 640,038 | |
| | |
WP Carey, Inc. | | | 15,714 | | | | 1,109,094 | |
| | | | | | | | |
| | | | 10,347,615 | |
|
| Utilities 3.9% | |
Electric Utilities 2.6% | |
| | |
IDACORP, Inc. | | | 12,283 | | | | 1,179,536 | |
| | |
PG&E Corp.* | | | 20,106 | | | | 250,521 | |
| | |
Pinnacle West Capital Corp. | | | 11,000 | | | | 879,450 | |
| | | | | | | | |
| | | | 2,309,507 | |
|
Gas Utilities 1.3% | |
| | |
ONE Gas, Inc. | | | 7,459 | | | | 572,628 | |
| | |
UGI Corp. | | | 14,947 | | | | 522,547 | |
| | | | | | | | |
| | | | | | | | 1,095,175 | |
| Total Common Stocks (Cost $72,335,884) | | | | 86,987,144 | |
The accompanying notes are an integral part of the financial statements.
| | | | | | |
| | 8 | | | | | | Deutsche DWS Variable Series II — DWS Small Mid Cap Value VIP |
| | | | | | | | |
| | | Shares | | | Value ($) | |
|
| Securities Lending Collateral 2.8% | |
DWS Government & Agency Securities Portfolio “DWS Government Cash Institutional Shares”, 0.03% (b) (c) (Cost $2,438,401) | | | 2,438,401 | | | | 2,438,401 | |
| | |
| Cash Equivalents 0.3% | | | | | | | | |
DWS Central Cash Management Government Fund, 0.08% (b) (Cost $259,282) | | | 259,282 | | | | 259,282 | |
| | | | | | | | |
| | | % of Net
Assets | | | Value ($) | |
Total Investment Portfolio (Cost $75,033,567) | | | 102.8 | | | | 89,684,827 | |
| Other Assets and Liabilities, Net | | | (2.8 | ) | | | (2,405,911 | ) |
| Net Assets | | | 100.0 | | | | 87,278,916 | |
A summary of the Fund’s transactions with affiliated investments during the year ended December 31, 2020 are as follows:
| | | | | | | | | | | | | | | | | | | | | | | | | | | | | | | | |
Value ($) at
12/31/2019 | | Purchases
Cost ($) | | | Sales
Proceeds ($) | | | Net
Realized
Gain/
(Loss) ($) | | | Net Change in
Unrealized
Appreciation
(Depreciation) ($) | | | Income ($) | | | Capital Gain
Distributions ($) | | | Number of
Shares at
12/31/2020 | | | Value ($) at
12/31/2020 | |
Securities Lending Collateral 2.8% | | | | | | | | | | | | | | | | | |
DWS Government & Agency Securities Portfolio “DWS Government Cash Institutional Shares”, 0.03% (b) (c) | |
| 1,984,280 | | | 454,121 | (d) | | | — | | | | — | | | | — | | | | 93,629 | | | | — | | | | 2,438,401 | | | | 2,438,401 | |
Cash Equivalents 0.3% | | | | | | | | | | | | | | | | | |
DWS Central Cash Management Government Fund, 0.08% (b) | |
| 487,000 | | | 9,898,169 | | | | 10,125,887 | | | | — | | | | — | | | | 4,566 | | | | — | | | | 259,282 | | | | 259,282 | |
| 2,471,280 | | | 10,352,290 | | | | 10,125,887 | | | | — | | | | — | | | | 98,195 | | | | — | | | | 2,697,683 | | | | 2,697,683 | |
| * | Non-income producing security. |
| (a) | All or a portion of these securities were on loan. In addition, “Other Assets and Liabilities, Net” may include pending sales that are also on loan. The value of securities loaned at December 31, 2020 amounted to $2,435,784, which is 2.8% of net assets. |
| (b) | Affiliated fund managed by DWS Investment Management Americas, Inc. The rate shown is the annualized seven-day yield at period end. |
| (c) | Represents cash collateral held in connection with securities lending. Income earned by the Fund is net of borrower rebates. In addition, the Fund held non-cash U.S. Treasury securities collateral having a value of $81,945. |
| (d) | Represents the net increase (purchase cost) or decrease (sales proceeds) in the amount invested in cash collateral for the year ended December 31, 2020. |
Fair Value Measurements
Various inputs are used in determining the value of the Fund’s investments. These inputs are summarized in three broad levels. Level 1 includes quoted prices in active markets for identical securities. Level 2 includes other significant observable inputs (including quoted prices for similar securities, interest rates, prepayment speeds and credit risk). Level 3 includes significant unobservable inputs (including the Fund’s own assumptions in determining the fair value of investments). The level assigned to the securities valuations may not be an indication of the risk or liquidity associated with investing in those securities.
The following is a summary of the inputs used as of December 31, 2020 in valuing the Fund’s investments. For information on the Fund’s policy regarding the valuation of investments, please refer to the Security Valuation section of Note A in the accompanying Notes to Financial Statements.
| | | | | | | | | | | | | | | | |
| Assets | | Level 1 | | | Level 2 | | | Level 3 | | | Total | |
| Common Stocks (e) | | $ | 86,987,144 | | | $ | — | | | $ | — | | | $ | 86,987,144 | |
| Short-Term Investments (e) | | | 2,697,683 | | | | — | | | | — | | | | 2,697,683 | |
| Total | | $ | 89,684,827 | | | $ | — | | | $ | — | | | $ | 89,684,827 | |
| (e) | See Investment Portfolio for additional detailed categorizations. |
The accompanying notes are an integral part of the financial statements.
| | | | |
Deutsche DWS Variable Series II — DWS Small Mid Cap Value VIP | | | | | 9 |
Statement of
Assets and Liabilities
| | | | |
| as of December 31, 2020 | | | | |
| |
| Assets | | | | |
| Investments in non-affiliated securities, at value (cost $72,335,884) — including $2,435,784 of securities loaned | | $ | 86,987,144 | |
| Investment in DWS Government & Agency Securities Portfolio (cost $2,438,401)* | | | 2,438,401 | |
| Investment in DWS Central Cash Management Government Fund (cost $259,282) | | | 259,282 | |
| Receivable for Fund shares sold | | | 8,446 | |
| Dividends receivable | | | 155,364 | |
| Interest receivable | | | 278 | |
| Other assets | | | 1,568 | |
| Total assets | | | 89,850,483 | |
| |
| Liabilities | | | | |
| Payable upon return of securities loaned | | | 2,438,401 | |
| Payable for Fund shares redeemed | | | 11,285 | |
| Accrued management fee | | | 45,579 | |
| Accrued Trustees’ fees | | | 2,082 | |
| Other accrued expenses and payables | | | 74,220 | |
| Total liabilities | | | 2,571,567 | |
| Net assets, at value | | $ | 87,278,916 | |
| |
| Net Assets Consist of | | | | |
| Distributable earnings (loss) | | | 7,029,341 | |
| Paid-in capital | | | 80,249,575 | |
| Net assets, at value | | $ | 87,278,916 | |
| |
| Net Asset Value | | | | |
Class A | | | | |
| |
| Net Asset Value, offering and redemption price per share ($70,264,803 ÷ 5,853,631 outstanding shares of beneficial interest, no par value, unlimited number of shares authorized) | | $ | 12.00 | |
Class B | | | | |
| |
| Net Asset Value, offering and redemption price per share ($17,014,113 ÷ 1,418,467 outstanding shares of beneficial interest, no par value, unlimited number of shares authorized) | | $ | 11.99 | |
| * | Represents collateral on securities loaned. In addition, the Fund held non-cash collateral having a value of $81,945. |
Statement of Operations
| | | | |
| for the year ended December 31, 2020 | |
| |
| Investment Income | | | | |
| Income: | | | | |
| Dividends | | $ | 1,737,184 | |
| Income distributions — DWS Cash Management Government Fund | | | 4,566 | |
| Securities lending income, net of borrower rebates | | | 93,629 | |
| Total income | | $ | 1,835,379 | |
| Expenses: | | | | |
| Management fee | | | 498,541 | |
| Administration fee | | | 74,858 | |
| Services to Shareholders | | | 2,109 | |
| Record keeping fee (Class B) | | | 17,901 | |
| Distribution service fees (Class B) | | | 37,021 | |
| Custodian fee | | | 3,153 | |
| Professional fees | | | 51,408 | |
| Reports to shareholders | | | 36,640 | |
| Trustees’ fees and expenses | | | 4,352 | |
| Other | | | 5,298 | |
| Total expenses before expense reductions | | | 731,281 | |
| Expense reductions | | | (47,561 | ) |
| Total expenses after expense reductions | | | 683,720 | |
| Net investment income | | | 1,151,659 | |
| |
| Realized and Unrealized gain (loss) | | | | |
| Net realized gain (loss) from investments | | | (8,657,454 | ) |
| Change in net unrealized appreciation (depreciation) on investments | | | 5,071,194 | |
| Net gain (loss) | | | (3,586,260 | ) |
| Net increase (decrease) in net assets resulting from operations | | $ | (2,434,601 | ) |
The accompanying notes are an integral part of the financial statements.
| | | | | | |
| | 10 | | | | | | Deutsche DWS Variable Series II — DWS Small Mid Cap Value VIP |
Statements of Changes in Net Assets
| | | | | | | | |
| | | Years Ended December 31, | |
| Increase (Decrease) in Net Assets | | 2020 | | | 2019 | |
| Operations: | | | | | | | | |
| Net investment income (loss) | | $ | 1,151,659 | | | $ | 1,188,003 | |
| Net realized gain (loss) | | | (8,657,454 | ) | | | 6,244,068 | |
| Change in net unrealized appreciation (depreciation) | | | 5,071,194 | | | | 11,215,454 | |
| Net increase (decrease) in net assets resulting from operations | | | (2,434,601 | ) | | | 18,647,525 | |
| Distributions to shareholders: | | | | | | | | |
Class A | | | (6,015,690 | ) | | | (6,073,443 | ) |
Class B | | | (1,399,898 | ) | | | (1,252,920 | ) |
| Total distributions | | | (7,415,588 | ) | | | (7,326,363 | ) |
| Fund share transactions: | | | | | | | | |
Class A | | | | | | | | |
| Proceeds from shares sold | | | 5,262,531 | | | | 3,385,798 | |
| Reinvestment of distributions | | | 6,015,690 | | | | 6,073,443 | |
| Payments for shares redeemed | | | (11,188,291 | ) | | | (10,531,345 | ) |
| Net increase (decrease) in net assets from Class A share transactions | | | 89,930 | | | | (1,072,104 | ) |
Class B | | | | | | | | |
| Proceeds from shares sold | | | 3,507,387 | | | | 1,581,613 | |
| Reinvestment of distributions | | | 1,399,898 | | | | 1,252,920 | |
| Payments for shares redeemed | | | (3,035,924 | ) | | | (3,209,519 | ) |
| Net increase (decrease) in net assets from Class B share transactions | | | 1,871,361 | | | | (374,986 | ) |
| Increase (decrease) in net assets | | | (7,888,898 | ) | | | 9,874,072 | |
| Net assets at beginning of period | | | 95,167,814 | | | | 85,293,742 | |
| | |
| Net assets at end of period | | $ | 87,278,916 | | | $ | 95,167,814 | |
| | |
| Other Information | | | | | | |
Class A | | | | | | | | |
| Shares outstanding at beginning of period | | | 5,666,170 | | | | 5,742,711 | |
| Shares sold | | | 527,815 | | | | 261,390 | |
| Shares issued to shareholders in reinvestment of distributions | | | 725,656 | | | | 468,268 | |
| Shares redeemed | | | (1,066,010 | ) | | | (806,199 | ) |
| Net increase (decrease) in Class A shares | | | 187,461 | | | | (76,541 | ) |
| | |
| Shares outstanding at end of period | | | 5,853,631 | | | | 5,666,170 | |
Class B | | | | | | | | |
| Shares outstanding at beginning of period | | | 1,216,620 | | | | 1,243,269 | |
| Shares sold | | | 321,995 | | | | 121,577 | |
| Shares issued to shareholders in reinvestment of distributions | | | 168,662 | | | | 96,453 | |
| Shares redeemed | | | (288,810 | ) | | | (244,679 | ) |
| Net increase (decrease) in Class B shares | | | 201,847 | | | | (26,649 | ) |
| | |
| Shares outstanding at end of period | | | 1,418,467 | | | | 1,216,620 | |
The accompanying notes are an integral part of the financial statements.
| | | | |
Deutsche DWS Variable Series II — DWS Small Mid Cap Value VIP | | | | | 11 |
Financial Highlights
| | | | | | | | | | | | | | | | | | | | |
| DWS Small Mid Cap Value VIP — Class A | | | | | | | | | | | | | | | | | | | | |
| | | Years Ended December 31, | |
| | | 2020 | | | 2019 | | | 2018 | | | 2017 | | | 2016 | |
| | | | | |
| Selected Per Share Data | | | | | | | | | | | | | | | | | | | | |
| Net asset value, beginning of period | | | $13.83 | | | | $12.21 | | | | $17.88 | | | | $16.65 | | | | $15.97 | |
| Income (loss) from investment operations: | | | | | | | | | | | | | | | | | | | | |
| | | | | |
Net investment incomea | | | .16 | | | | .18 | | | | .10 | | | | .17 | | | | .15 | |
Net realized and unrealized gain (loss) | | | (.90 | ) | | | 2.53 | d | | | (2.47 | ) | | | 1.55 | | | | 2.34 | |
Total from investment operations | | | (.74 | ) | | | 2.71 | | | | (2.37 | ) | | | 1.72 | | | | 2.49 | |
| Less distributions from: | | | | | | | | | | | | | | | | | | | | |
| | | | | |
Net investment income | | | (.16 | ) | | | (.10 | ) | | | (.24 | ) | | | (.12 | ) | | | (.10 | ) |
Net realized gains | | | (.93 | ) | | | (.99 | ) | | | (3.06 | ) | | | (.37 | ) | | | (1.71 | ) |
Total distributions | | | (1.09 | ) | | | (1.09 | ) | | | (3.30 | ) | | | (.49 | ) | | | (1.81 | ) |
| Net asset value, end of period | | | $12.00 | | | | $13.83 | | | | $12.21 | | | | $17.88 | | | | $16.65 | |
| Total Return (%)b | | | (1.80 | ) | | | 22.76 | d | | | (16.01 | ) | | | 10.52 | | | | 16.89 | |
| | | | | |
| Ratios to Average Net Assets and Supplemental Data | | | | | | | | | | | | | | | | | | | | |
| Net assets, end of period ($ millions) | | | 70 | | | | 78 | | | | 70 | | | | 96 | | | | 153 | |
| Ratio of expenses before expense reductions (%)c | | | .88 | | | | .88 | | | | .87 | | | | .83 | | | | .83 | |
| Ratio of expenses after expense reductions (%)c | | | .82 | | | | .83 | | | | .81 | | | | .83 | | | | .82 | |
| Ratio of net investment income (%) | | | 1.57 | | | | 1.35 | | | | .65 | | | | .98 | | | | .99 | |
| Portfolio turnover rate (%) | | | 43 | | | | 55 | | | | 64 | | | | 35 | | | | 53 | |
| a | Based on average shares outstanding during the period. |
| b | Total return would have been lower had certain expenses not been reduced. |
| c | Expense ratio does not reflect charges and fees associated with the separate account that invests in the Fund or any variable life insurance policy or variable annuity contract for which the Fund is an investment option. |
| d | Includes proceeds from a non-recurring litigation payment amounting to $0.14 per share and 1.07% of average daily net assets, for the year ended December 31, 2019. |
| | | | | | | | | | | | | | | | | | | | |
| DWS Small Mid Cap Value VIP — Class B | | | | | | | | | | | | | | | | | | | | |
| | | Years Ended December 31, | |
| | | 2020 | | | 2019 | | | 2018 | | | 2017 | | | 2016 | |
| | | | | |
| Selected Per Share Data | | | | | | | | | | | | | | | | | | | | |
| Net asset value, beginning of period | | | $13.82 | | | | $12.20 | | | | $17.86 | | | | $16.63 | | | | $15.95 | |
| Income (loss) from investment operations: | | | | | | | | | | | | | | | | | | | | |
| | | | | |
Net investment incomea | | | .13 | | | | .13 | | | | .05 | | | | .11 | | | | .09 | |
Net realized and unrealized gain (loss) | | | (.90 | ) | | | 2.53 | d | | | (2.48 | ) | | | 1.55 | | | | 2.34 | |
Total from investment operations | | | (.77 | ) | | | 2.66 | | | | (2.43 | ) | | | 1.66 | | | | 2.43 | |
| Less distributions from: | | | | | | | | | | | | | | | | | | | | |
| | | | | |
Net investment income | | | (.13 | ) | | | (.05 | ) | | | (.17 | ) | | | (.06 | ) | | | (.04 | ) |
Net realized gains | | | (.93 | ) | | | (.99 | ) | | | (3.06 | ) | | | (.37 | ) | | | (1.71 | ) |
Total distributions | | | (1.06 | ) | | | (1.04 | ) | | | (3.23 | ) | | | (.43 | ) | | | (1.75 | ) |
| Net asset value, end of period | | | $11.99 | | | | $13.82 | | | | $12.20 | | | | $17.86 | | | | $16.63 | |
| Total Return (%)b | | | (2.18 | ) | | | 22.32 | d | | | (16.32 | ) | | | 10.13 | | | | 16.47 | |
| | | | | |
| Ratios to Average Net Assets and Supplemental Data | | | | | | | | | | | | | | | | | | | | |
| Net assets, end of period ($ millions) | | | 17 | | | | 17 | | | | 15 | | | | 19 | | | | 15 | |
| Ratio of expenses before expense reductions (%)c | | | 1.25 | | | | 1.25 | | | | 1.24 | | | | 1.19 | | | | 1.19 | |
| Ratio of expenses after expense reductions (%)c | | | 1.19 | | | | 1.19 | | | | 1.16 | | | | 1.19 | | | | 1.18 | |
| Ratio of net investment income (loss) (%) | | | 1.21 | | | | .99 | | | | .30 | | | | .65 | | | | .57 | |
| Portfolio turnover rate (%) | | | 43 | | | | 55 | | | | 64 | | | | 35 | | | | 53 | |
| a | Based on average shares outstanding during the period. |
| b | Total return would have been lower had certain expenses not been reduced. |
| c | Expense ratio does not reflect charges and fees associated with the separate account that invests in the Fund or any variable life insurance policy or variable annuity contract for which the Fund is an investment option. |
| d | Includes proceeds from a non-recurring litigation payment amounting to $0.14 per share and 1.07% of average daily net assets, for the year ended December 31, 2019. |
The accompanying notes are an integral part of the financial statements.
| | | | | | |
| | 12 | | | | | | Deutsche DWS Variable Series II — DWS Small Mid Cap Value VIP |
| | |
| Notes to Financial Statements | | |
A. Organization and Significant Accounting Policies
DWS Small Mid Cap Value VIP (the “Fund”) is a diversified series of Deutsche DWS Variable Series II (the “Trust”), which is registered under the Investment Company Act of 1940, as amended (the “1940 Act”), as an open-end management investment company organized as a Massachusetts business trust.
Multiple Classes of Shares of Beneficial Interest. The Fund offers two classes of shares (Class A shares and Class B shares). Sales of Class B shares are subject to recordkeeping fees of up to 0.15% and Rule 12b-1 fees under the 1940 Act equal to an annual rate of up to 0.25% of the average daily net assets of the Class B shares of the Fund. Class A shares are not subject to such fees.
Investment income, realized and unrealized gains and losses, and certain fund-level expenses and expense reductions, if any, are borne pro rata on the basis of relative net assets by the holders of all classes of shares except that each class bears certain expenses unique to that class (including the applicable Rule 12b-1 fee and recordkeeping fees). Differences in class-level expenses may result in payment of different per share dividends by class. All shares have equal rights with respect to voting subject to class-specific arrangements.
The Fund’s financial statements are prepared in accordance with accounting principles generally accepted in the United States of America (“U.S. GAAP”) which require the use of management estimates. Actual results could differ from those estimates. The Fund qualifies as an investment company under Topic 946 of Accounting Standards Codification of U.S. GAAP. The policies described below are followed consistently by the Fund in the preparation of its financial statements.
Security Valuation. Investments are stated at value determined as of the close of regular trading on the New York Stock Exchange on each day the exchange is open for trading.
Various inputs are used in determining the value of the Fund’s investments. These inputs are summarized in three broad levels. Level 1 includes quoted prices in active markets for identical securities. Level 2 includes other significant observable inputs (including quoted prices for similar securities, interest rates, prepayment speeds and credit risk). Level 3 includes significant unobservable inputs (including the Fund’s own assumptions in determining the fair value of investments). The level assigned to the securities valuations may not be an indication of the risk or liquidity associated with investing in those securities.
Equity securities are valued at the most recent sale price or official closing price reported on the exchange (U.S. or foreign) or over-the-counter market on which they trade. Securities for which no sales are reported are valued at the calculated mean between the most recent bid and asked quotations on the relevant market or, if a mean cannot be determined, at the most recent bid quotation. Equity securities are generally categorized as Level 1.
Investments in open-end investment companies are valued at their net asset value each business day and are categorized as Level 1.
Securities and other assets for which market quotations are not readily available or for which the above valuation procedures are deemed not to reflect fair value are valued in a manner that is intended to reflect their fair value as determined in accordance with procedures approved by the Board and are generally categorized as Level 3. In accordance with the Fund’s valuation procedures, factors considered in determining value may include, but are not limited to, the type of the security; the size of the holding; the initial cost of the security; the existence of any contractual restrictions on the security’s disposition; the price and extent of public trading in similar securities of the issuer or of comparable companies; quotations or evaluated prices from broker-dealers and/or pricing services; information obtained from the issuer, analysts, and/or the appropriate stock exchange (for exchange-traded securities); an analysis of the company’s or issuer’s financial statements; an evaluation of the forces that influence the issuer and the market(s) in which the security is purchased and sold; and with respect to debt securities, the maturity, coupon, creditworthiness, currency denomination and the movement of the market in which the security is normally traded. The value determined under these procedures may differ from published values for the same securities.
Disclosure about the classification of fair value measurements is included in a table following the Fund’s Investment Portfolio.
Foreign Currency Translations. The books and records of the Fund are maintained in U.S. dollars. Investment securities and other assets and liabilities denominated in a foreign currency are translated into U.S. dollars at the prevailing exchange rates at period end. Purchases and sales of investment securities, income and expenses are translated into U.S. dollars at the prevailing exchange rates on the respective dates of the transactions.
| | | | |
Deutsche DWS Variable Series II — DWS Small Mid Cap Value VIP | | | | | 13 |
Net realized and unrealized gains and losses on foreign currency transactions represent net gains and losses between trade and settlement dates on securities transactions, the acquisition and disposition of foreign currencies, and the difference between the amount of net investment income accrued and the U.S. dollar amount actually received. The portion of both realized and unrealized gains and losses on investments that results from fluctuations in foreign currency exchange rates is not separately disclosed but is included with net realized and unrealized gain/appreciation and loss/depreciation on investments.
Securities Lending. Brown Brothers Harriman & Co., as lending agent, lends securities of the Fund to certain financial institutions under the terms of its securities lending agreement. During the term of the loans, the Fund continues to receive interest and dividends generated by the securities and to participate in any changes in their market value. The Fund requires the borrowers of the securities to maintain collateral with the Fund consisting of either cash and/or U.S. Treasury Securities having a value at least equal to the value of the securities loaned. When the collateral falls below specified amounts, the lending agent will use its best effort to obtain additional collateral on the next business day to meet required amounts under the securities lending agreement. During the year ended December 31, 2020, the Fund invested the cash collateral into a joint trading account in DWS Government & Agency Securities Portfolio, an affiliated money market fund managed by DWS Investment Management Americas, Inc. DWS Investment Management Americas Inc. receives a management/administration fee (0.06% annualized effective rate as of December 31, 2020) on the cash collateral invested in DWS Government & Agency Securities Portfolio. The Fund receives compensation for lending its securities either in the form of fees or by earning interest on invested cash collateral net of borrower rebates and fees paid to a lending agent. Either the Fund or the borrower may terminate the loan at any time, and the borrower, after notice, is required to return borrowed securities within a standard time period There may be risks of delay and costs in recovery of securities or even loss of rights in the collateral should the borrower of the securities fail financially. If the Fund is not able to recover securities lent, the Fund may sell the collateral and purchase a replacement investment in the market, incurring the risk that the value of the replacement security is greater than the value of the collateral. The Fund is also subject to all investment risks associated with the reinvestment of any cash collateral received, including, but not limited to, interest rate, credit and liquidity risk associated with such investments.
As of December 31, 2020, the Fund had securities on loan. The value of the related collateral exceeded the value of the securities loaned at period end.
| | | | | | | | | | | | | | | | | | | | |
| Remaining Contractual Maturity of the Agreements as of December 31, 2020 | |
| | | Overnight
and
Continuous | | | <30 Days | | | Between 30
& 90 Days | | | >90 Days | | | Total | |
Securities Lending Transactions | | | | | | | | | | | | | | | | | | | | |
| Common Stocks | | $ | 2,438,401 | | | $ | — | | | $ | — | | | $ | 81,945 | | | $ | 2,520,346 | |
| |
Gross amount of recognized liabilities and non-cash collateral for securities lending transactions: | | | $ | 2,520,346 | |
Taxes. The Fund’s policy is to comply with the requirements of the Internal Revenue Code, as amended, which are applicable to regulated investment companies and to distribute all of its taxable income to its shareholders.
At December 31, 2020, the Fund had a net tax basis capital loss carryforward of approximately $8,694,000, which may be applied against realized net taxable capital gains indefinitely, including short-term losses ($2,621,000) and long-term losses ($6,073,000).
The Fund has reviewed the tax positions for the open tax years as of December 31, 2020 and has determined that no provision for income tax and/or uncertain tax positions is required in the Fund’s financial statements. The Fund’s federal tax returns for the prior three fiscal years remain open subject to examination by the Internal Revenue Service.
Distribution of Income and Gains. Distributions from net investment income of the Fund, if any, are declared and distributed to shareholders annually. Net realized gains from investment transactions, in excess of available capital loss carryforwards, would be taxable to the Fund if not distributed and, therefore, will be distributed to shareholders at least annually. The Fund may also make additional distributions for tax purposes if necessary.
The timing and characterization of certain income and capital gain distributions are determined annually in accordance with federal tax regulations, which may differ from accounting principles generally accepted in the United States of America. These differences primarily relate to certain securities sold at a loss. As a
| | | | | | |
| | 14 | | | | | | Deutsche DWS Variable Series II — DWS Small Mid Cap Value VIP |
result, net investment income (loss) and net realized gain (loss) on investment transactions for a reporting period may differ significantly from distributions during such period. Accordingly, the Fund may periodically make reclassifications among certain of its capital accounts without impacting the net asset value of the Fund.
At December 31, 2020, the Fund’s components of distributable earnings on a tax basis were as follows:
| | | | |
| Undistributed ordinary income* | | $ | 1,114,910 | |
| Capital loss carryforwards | | $ | (8,694,000 | ) |
| Unrealized appreciation (depreciation) on investments | | $ | 14,554,540 | |
At December 31, 2020, the aggregate cost of investments for federal income tax purposes was $75,130,287. The net unrealized appreciation for all investments based on tax cost was $14,554,540. This consisted of aggregate gross unrealized appreciation for all investments for which there was an excess of value over tax cost of $18,320,630 and aggregate gross unrealized depreciation for all investments for which there was an excess of tax cost over value of $3,766,090.
In addition, the tax character of distributions paid by the Fund is summarized as follows:
| | | | | | | | |
| | | Years Ended December 31, | |
| | | 2020 | | | 2019 | |
| Distributions from ordinary income* | | $ | 1,300,909 | | | $ | 615,525 | |
| Distributions from long-term capital gains | | $ | 6,114,679 | | | $ | 6,710,838 | |
| * | For tax purposes, short-term capital gain distributions are considered ordinary income distributions. |
Expenses. Expenses of the Trust arising in connection with a specific fund are allocated to that fund. Other Trust expenses which cannot be directly attributed to a fund are apportioned among the funds in the Trust based upon the relative net assets or other appropriate measures.
Contingencies. In the normal course of business, the Fund may enter into contracts with service providers that contain general indemnification clauses. The Fund’s maximum exposure under these arrangements is unknown, as this would involve future claims that may be made against the Fund that have not yet been made. However, based on experience, the Fund expects the risk of loss to be remote.
Real Estate Investment Trusts. The Fund at its fiscal year end recharacterizes distributions received from a Real Estate Investment Trust (“REIT”) investment based on information provided by the REIT into the following categories: ordinary income, long-term and short-term capital gains, and return of capital. If information is not available timely from a REIT, the recharacterization will be estimated for financial reporting purposes and a recharacterization will be made to the accounting records in the following year when such information becomes available. Distributions received from REITs in excess of income are recorded as either a reduction of cost of investments or realized gains.
Other. Investment transactions are accounted for on a trade date plus one basis for daily net asset value calculations. However, for financial reporting purposes, investment transactions are reported on trade date. Interest income is recorded on the accrual basis. Dividend income is recorded on the ex-dividend date net of foreign withholding taxes. Realized gains and losses from investment transactions are recorded on an identified cost basis. Proceeds from litigation payments, if any, are included in net realized gain (loss) from investments.
B. Purchases and Sales of Securities
During the year ended December 31, 2020, purchases and sales of investment transactions (excluding short-term investments) aggregated $33,047,853 and $35,940,867, respectively.
C. Related Parties
Management Agreement. Under the Investment Management Agreement with DWS Investment Management Americas, Inc. (“DIMA” or the “Advisor”), an indirect, wholly owned subsidiary of DWS Group GmbH & Co. KGaA (“DWS Group”), the Advisor directs the investments of the Fund in accordance with its investment objectives, policies and restrictions. The Advisor determines the securities, instruments and other contracts relating to investments to be purchased, sold or entered into by the Fund.
| | | | |
Deutsche DWS Variable Series II — DWS Small Mid Cap Value VIP | | | | | 15 |
Pursuant to the Investment Management Agreement with the Advisor, the Fund pays a monthly management fee based on the Fund’s average daily net assets, computed and accrued daily and payable monthly, at the following annual rates:
| | | | |
| First $250 million | | | .650 | % |
| Next $750 million | | | .620 | % |
| Next $1.5 billion | | | .600 | % |
| Next $2.5 billion | | | .580 | % |
| Next $2.5 billion | | | .550 | % |
| Next $2.5 billion | | | .540 | % |
| Next $2.5 billion | | | .530 | % |
| Over $12.5 billion | | | .520 | % |
Accordingly, for the year ended December 31, 2020, the fee pursuant to the Investment Management Agreement was equivalent to an annual rate (exclusive of any applicable waivers/reimbursements) of 0.65% of the Fund’s average daily net assets.
For the period from January 1, 2020 through April 30, 2021, the Advisor has contractually agreed to waive all or a portion of its fees and/or reimburse certain operating expenses of the Fund to the extent necessary to maintain the total annual operating expenses (excluding certain expenses such as extraordinary expenses, taxes, brokerage and interest) of each class as follows:
| | | | |
| Class A | | | .82 | % |
| Class B | | | 1.19 | % |
For the year ended December 31, 2020, fees waived and/or expenses reimbursed for each class were as follows:
| | | | |
| Class A | | $ | 37,989 | |
| Class B | | | 9,572 | |
| | | $ | 47,561 | |
Administration Fee. Pursuant to an Administrative Services Agreement, DIMA provides most administrative services to the Fund. Prior to March 1, 2020, for all services provided under the Administrative Services Agreement, the Fund paid the Advisor an annual fee (“Administration Fee”) of 0.10% of the Fund’s average daily net assets, computed and accrued daily and payable monthly. Effective March 1, 2020, for all services provided under the Administrative Services Agreement, the Fund pays the Advisor an annual Administration Fee of 0.097% of the Fund’s average daily net assets, computed and accrued daily and payable monthly. For the year ended December 31, 2020, the Administration Fee was $74,858, of which $7,079 is unpaid.
Service Provider Fees. DWS Service Company (“DSC”), an affiliate of the Advisor, is the transfer agent, dividend-paying agent and shareholder service agent for the Fund. Pursuant to a sub-transfer agency agreement between DSC and DST Systems, Inc. (“DST”), DSC has delegated certain transfer agent, dividend-paying agent and shareholder service agent functions to DST. DSC compensates DST out of the shareholder servicing fee it receives from the Fund. For the year ended December 31, 2020, the amounts charged to the Fund by DSC were as follows:
| | | | | | | | |
| Service to Shareholders | | Total
Aggregated | | | Unpaid at
December 31, 2020 | |
| Class A | | $ | 742 | | | $ | 138 | |
| Class B | | | 545 | | | | 106 | |
| | | $ | 1,287 | | | $ | 244 | |
Distribution Service Agreement. Under the Fund’s Class B 12b-1 plan, DWS Distributors, Inc. (“DDI”) received a fee (“Distribution Service Fee”) of up to 0.25% of the average daily net assets of Class B shares. For the year ended December 31, 2020, the Distribution Service Fee aggregated $37,021, of which $3,560 is unpaid.
Other Service Fees. Under an agreement with the Fund, DIMA is compensated for providing certain pre-press and regulatory filing services to the Fund. For the year ended December 31, 2020, the amount charged to the Fund by DIMA included in the Statement of Operations under “Reports to shareholders” aggregated $9,175, of which $3,527 is unpaid.
| | | | | | |
| | 16 | | | | | | Deutsche DWS Variable Series II — DWS Small Mid Cap Value VIP |
Trustees’ Fees and Expenses. The Fund paid retainer fees to each Trustee not affiliated with the Advisor, plus specified amounts to the Board Chairperson and to each committee Chairperson.
Affiliated Cash Management Vehicles. The Fund may invest uninvested cash balances in DWS Central Cash Management Government Fund and DWS ESG Liquidity Fund, affiliated money market funds which are managed by the Advisor. Each affiliated money market fund is managed in accordance with Rule 2a-7 under the 1940 Act, which governs the quality, maturity, diversity and liquidity of instruments in which a money market fund may invest. DWS Central Cash Management Government Fund seeks to maintain a stable net asset value, and DWS ESG Liquidity Fund maintains a floating net asset value. The Fund indirectly bears its proportionate share of the expenses of each affiliated money market fund in which it invests. DWS Central Cash Management Government Fund does not pay the Advisor an investment management fee. To the extent that DWS ESG Liquidity Fund pays an investment management fee to the Advisor, the Advisor will waive an amount of the investment management fee payable to the Advisor by the Fund equal to the amount of the investment management fee payable on the Fund’s assets invested in DWS ESG Liquidity Fund.
D. Ownership of the Fund
At December 31, 2020, one participating insurance company was owner of record of 10% or more of the total outstanding Class A shares of the Fund, owning 69%. Four participating insurance companies were owners of record of 10% or more of the total outstanding Class B shares of the Fund, each owning 29%, 19%, 18% and 12%.
E. Line of Credit
The Fund and other affiliated funds (the “Participants”) share in a $350 million revolving credit facility provided by a syndication of banks. The Fund may borrow for temporary or emergency purposes, including the meeting of redemption requests that otherwise might require the untimely disposition of securities. The Participants are charged an annual commitment fee, which is allocated based on net assets, among each of the Participants. Interest is calculated at a rate per annum equal to the sum of the Federal Funds Rate plus 1.25 percent plus if the one-month LIBOR exceeds the Federal Funds Rate, the amount of such excess. The Fund may borrow up to a maximum of 33 percent of its net assets under the agreement. The Fund had no outstanding loans at December 31, 2020.
F. Other — COVID-19 Pandemic
A novel coronavirus known as COVID-19, declared a pandemic by the World Health Organization, has caused significant uncertainty, market volatility, decreased economic and other activity and increased government activity. Specifically, COVID-19 has led to significant death and morbidity, and concerns about its further spread have resulted in the closing of schools and non-essential businesses, cancellations, shelter-in place orders, lower consumer spending in certain sectors, social distancing, bans on large social gatherings and travel, quarantines, government economic stimulus measures, reduced productivity, rapid increases in unemployment, increased demand for and strain on government and medical resources, border closings and global trade and supply chain interruptions, among others. The full effects, duration and costs of the COVID-19 pandemic are impossible to predict, and the circumstances surrounding the COVID-19 pandemic will continue to evolve. The pandemic may affect certain countries, industries, economic sectors, companies and investment products more than others, may exacerbate existing economic, political, or social tensions and may increase the probability of an economic recession or depression. The Fund and its investments may be adversely affected by the effects of the COVID-19 pandemic, and a prolonged pandemic may result in the Fund and its service providers experiencing operational difficulties in coordinating a remote workforce and implementing their business continuity plans, among others. Management will continue to monitor the impact COVID-19 has on the Fund and reflect the consequences as appropriate in the Fund’s accounting and financial reporting.
| | | | |
Deutsche DWS Variable Series II — DWS Small Mid Cap Value VIP | | | | | 17 |
| | |
| Report of Independent Registered Public Accounting Firm | | |
To the Board of Trustees of Deutsche DWS Variable Series II and Shareholders of DWS Small Mid Cap Value VIP:
Opinion on the Financial Statements
We have audited the accompanying statement of assets and liabilities of DWS Small Mid Cap Value VIP (the “Fund”) (one of the funds constituting Deutsche DWS Variable Series II) (the “Trust”), including the investment portfolio, as of December 31, 2020, and the related statement of operations for the year then ended, the statements of changes in net assets for each of the two years in the period then ended, the financial highlights for each of the five years in the period then ended and the related notes (collectively referred to as the “financial statements”). In our opinion, the financial statements present fairly, in all material respects, the financial position of the Fund (one of the funds constituting Deutsche DWS Variable Series II) at December 31, 2020, the results of its operations for the year then ended, the changes in its net assets for each of the two years in the period then ended and its financial highlights for each of the five years in the period then ended, in conformity with U.S. generally accepted accounting principles.
Basis for Opinion
These financial statements are the responsibility of the Trust’s management. Our responsibility is to express an opinion on the Fund’s financial statements based on our audits. We are a public accounting firm registered with the Public Company Accounting Oversight Board (United States) (“PCAOB”) and are required to be independent with respect to the Trust in accordance with the U.S. federal securities laws and the applicable rules and regulations of the Securities and Exchange Commission and the PCAOB.
We conducted our audits in accordance with the standards of the PCAOB. Those standards require that we plan and perform the audit to obtain reasonable assurance about whether the financial statements are free of material misstatement, whether due to error or fraud. The Trust is not required to have, nor were we engaged to perform, an audit of the Trust’s internal control over financial reporting. As part of our audits, we are required to obtain an understanding of internal control over financial reporting, but not for the purpose of expressing an opinion on the effectiveness of the Trust’s internal control over financial reporting. Accordingly, we express no such opinion.
Our audits included performing procedures to assess the risks of material misstatement of the financial statements, whether due to error or fraud, and performing procedures that respond to those risks. Such procedures included examining, on a test basis, evidence regarding the amounts and disclosures in the financial statements. Our procedures included confirmation of securities owned as of December 31, 2020, by correspondence with the custodian and others. Our audits also included evaluating the accounting principles used and significant estimates made by management, as well as evaluating the overall presentation of the financial statements. We believe that our audits provide a reasonable basis for our opinion.

We have served as the auditor of one or more investment companies in the DWS family of funds since at least 1979, but we are unable to determine the specific year.
Boston, Massachusetts
February 12, 2021
| | | | | | |
| | 18 | | | | | | Deutsche DWS Variable Series II — DWS Small Mid Cap Value VIP |
| | |
| Information About Your Fund’s Expenses | | (Unaudited) |
As an investor of the Fund, you incur two types of costs: ongoing expenses and transaction costs. Ongoing expenses include management fees, distribution and service (12b-1) fees and other Fund expenses. Examples of transaction costs include contract charges, which are not shown in this section. The following tables are intended to help you understand your ongoing expenses (in dollars) of investing in the Fund and to help you compare these expenses with the ongoing expenses of investing in other mutual funds. In the most recent six-month period, the Fund limited these expenses; had it not done so, expenses would have been higher. The example in the table is based on an investment of $1,000 invested at the beginning of the six-month period and held for the entire period (July 1, 2020 to December 31, 2020).
The tables illustrate your Fund’s expenses in two ways:
| – | | Actual Fund Return. This helps you estimate the actual dollar amount of ongoing expenses (but not transaction costs) paid on a $1,000 investment in the Fund using the Fund’s actual return during the period. To estimate the expenses you paid over the period, simply divide your account value by $1,000 (for example, an $8,600 account value divided by $1,000 = 8.6), then multiply the result by the number in the “Expenses Paid per $1,000” line under the share class you hold. |
| – | | Hypothetical 5% Fund Return. This helps you to compare your Fund’s ongoing expenses (but not transaction costs) with those of other mutual funds using the Fund’s actual expense ratio and a hypothetical rate of return of 5% per year before expenses. Examples using a 5% hypothetical Fund return may be found in the shareholder reports of other mutual funds. The hypothetical account values and expenses may not be used to estimate the actual ending account balance or expenses you paid for the period. |
Please note that the expenses shown in these tables are meant to highlight your ongoing expenses only and do not reflect any transaction costs. The “Expenses Paid per $1,000” line of the tables is useful in comparing ongoing expenses only and will not help you determine the relative total expense of owning different funds. If these transaction costs had been included, your costs would have been higher.
| | | | | | | | |
| Expenses and Value of a $1,000 Investment for the six months ended December 31, 2020 | |
| | |
| Actual Fund Return | | | Class A | | | | Class B | |
| Beginning Account Value 7/1/20 | | $ | 1,000.00 | | | $ | 1,000.00 | |
| Ending Account Value 12/31/20 | | $ | 1,286.20 | | | $ | 1,282.40 | |
| Expenses Paid per $1,000* | | $ | 4.71 | | | $ | 6.83 | |
| | |
| Hypothetical 5% Fund Return | | | Class A | | | | Class B | |
| Beginning Account Value 7/1/20 | | $ | 1,000.00 | | | $ | 1,000.00 | |
| Ending Account Value 12/31/20 | | $ | 1,021.01 | | | $ | 1,019.15 | |
| Expenses Paid per $1,000* | | $ | 4.17 | | | $ | 6.04 | |
| * | Expenses are equal to the Fund’s annualized expense ratio for each share class, multiplied by the average account value over the period, multiplied by 184 (the number of days in the most recent six-month period), then divided by 366. |
| | | | | | | | |
| Annualized Expense Ratios | | Class A | | | Class B | |
| Deutsche DWS Variable Series II — DWS Small Mid Cap Value VIP | | | .82 | % | | | 1.19 | % |
For more information, please refer to the Fund’s prospectus.
These tables do not reflect charges and fees (“contract charges”) associated with the separate account that invests in the Fund or any variable life insurance policy or variable annuity contract for which the Fund is an investment option.
For an analysis of the fees associated with an investment in the Fund or similar funds, please refer to the current and hypothetical expense calculators for Variable Insurance Products which can be found at dws.com/calculators.
| | | | |
Deutsche DWS Variable Series II — DWS Small Mid Cap Value VIP | | | | | 19 |
| | |
| Tax Information | | (Unaudited) |
The Fund paid distributions of $0.90 per share from net long-term capital gains during its year ended December 31, 2020.
For corporate shareholders, 96% of the ordinary dividends (i.e., income dividends plus short-term capital gains) paid during the Fund’s fiscal year ended December 31, 2020, qualified for the dividends received deduction.
Please consult a tax advisor if you have questions about federal or state income tax laws, or on how to prepare your tax returns. If you have specific questions about your account, please contact your insurance provider.
The Trust’s policies and procedures for voting proxies for portfolio securities and information about how the Trust voted proxies related to its portfolio securities during the most recent 12-month period ended June 30 are available on our Web site — dws.com/en-us/resources/proxy-voting — or on the SEC’s Web site — sec.gov. To obtain a written copy of the Trust’s policies and procedures without charge, upon request, call us toll free at (800) 728-3337.
| | | | | | |
| | 20 | | | | | | Deutsche DWS Variable Series II — DWS Small Mid Cap Value VIP |
Advisory Agreement Board Considerations and Fee Evaluation
The Board of Trustees (hereinafter referred to as the “Board” or “Trustees”) approved the renewal of DWS Small Mid Cap Value VIP’s (the “Fund”) investment management agreement (the “Agreement”) with DWS Investment Management Americas, Inc. (“DIMA”) in September 2020.
In terms of the process that the Board followed prior to approving the Agreement, shareholders should know that:
| – | | During the entire process, all of the Fund’s Trustees were independent of DIMA and its affiliates (the “Independent Trustees”). |
| – | | The Board met frequently during the past year to discuss fund matters and dedicated a substantial amount of time to contract review matters. Over the course of several months, the Board reviewed extensive materials received from DIMA, independent third parties and independent counsel. These materials included an analysis of the Fund’s performance, fees and expenses, and profitability from a fee consultant retained by the Fund’s Independent Trustees (the “Fee Consultant”). |
| – | | The Board also received extensive information throughout the year regarding performance of the Fund. |
| – | | The Independent Trustees regularly met privately with counsel to discuss contract review and other matters. In addition, the Independent Trustees were advised by the Fee Consultant in the course of their review of the Fund’s contractual arrangements and considered a comprehensive report prepared by the Fee Consultant in connection with their deliberations. |
| – | | In connection with reviewing the Agreement, the Board also reviewed the terms of the Fund’s Rule 12b-1 plan, distribution agreement, administrative services agreement, transfer agency agreement and other material service agreements. |
In connection with the contract review process, the Board considered the factors discussed below, among others. The Board also considered that DIMA and its predecessors have managed the Fund since its inception, and the Board believes that a long-term relationship with a capable, conscientious advisor is in the best interests of the Fund. The Board considered, generally, that shareholders chose to invest or remain invested in the Fund knowing that DIMA managed the Fund. DIMA is part of DWS Group GmbH & Co. KGaA (“DWS Group”). DWS Group is a global asset management business that offers a wide range of investing expertise and resources, including research capabilities in many countries throughout the world. In 2018, approximately 20% of DWS Group’s shares were sold in an initial public offering, with Deutsche Bank AG owning the remaining shares.
As part of the contract review process, the Board carefully considered the fees and expenses of each DWS fund overseen by the Board in light of the fund’s performance. In many cases, this led to the negotiation and implementation of expense caps.
While shareholders may focus primarily on fund performance and fees, the Fund’s Board considers these and many other factors, including the quality and integrity of DIMA’s personnel and administrative support services provided by DIMA, such as back-office operations, fund valuations, and compliance policies and procedures.
Nature, Quality and Extent of Services. The Board considered the terms of the Agreement, including the scope of advisory services provided under the Agreement. The Board noted that, under the Agreement, DIMA provides portfolio management services to the Fund and that, pursuant to a separate administrative services agreement, DIMA provides administrative services to the Fund. The Board considered the experience and skills of senior management and investment personnel and the resources made available to such personnel. The Board also considered the risks to DIMA in sponsoring or managing the Fund, including financial, operational and reputational risks, the potential economic impact to DIMA from such risks and DIMA’s approach to addressing such risks. The Board reviewed the Fund’s performance over short-term and long-term periods and compared those returns to various agreed-upon performance measures, including market index(es) and a peer universe compiled using information supplied by Morningstar Direct (“Morningstar”), an independent fund data service. The Board also noted that it has put into place a process of identifying “Funds in Review” (e.g., funds performing poorly relative to a peer universe), and receives additional reporting from DIMA regarding such funds and, where appropriate, DIMA’s plans to address underperformance. The Board believes this process is an effective manner of identifying and addressing underperforming funds. Based on the information provided, the Board noted that, for the one-, three- and five-year periods ended December 31, 2019, the Fund’s performance (Class A shares) was in the 4th quartile
| | | | |
Deutsche DWS Variable Series II — DWS Small Mid Cap Value VIP | | | | | 21 |
of the applicable Morningstar universe (the 1st quartile being the best performers and the 4th quartile being the worst performers). The Board also observed that the Fund has underperformed its benchmark in the one-, three- and five-year periods ended December 31, 2019. The Board noted the disappointing investment performance of the Fund in recent periods and continued to discuss with senior management of DIMA the factors contributing to such underperformance and actions being taken to improve performance. The Board noted certain changes in the Fund’s portfolio management team that were made effective February 14, 2019. The Board recognized the efforts by DIMA in recent years to enhance its investment platform and improve long-term performance across the DWS fund complex.
Fees and Expenses. The Board considered the Fund’s investment management fee schedule, operating expenses and total expense ratios, and comparative information provided by Broadridge Financial Solutions, Inc. (“Broadridge”) and the Fee Consultant regarding investment management fee rates paid to other investment advisors by similar funds (1st quartile being the most favorable and 4th quartile being the least favorable). With respect to management fees paid to other investment advisors by similar funds, the Board noted that the contractual fee rates paid by the Fund, which include a 0.10% fee paid to DIMA under the Fund’s administrative services agreement, were lower than the median (2nd quartile) of the applicable Broadridge peer group (based on Broadridge data provided as of December 31, 2019). The Board noted that, effective March 1, 2020, the fee paid to DIMA under the Fund’s administrative services agreement was reduced to 0.097%. The Board noted that the Fund’s Class A shares total (net) operating expenses were expected to be lower than the median (2nd quartile) of the applicable Broadridge expense universe (based on Broadridge data provided as of December 31, 2019, and analyzing Broadridge expense universe Class A (net) expenses less any applicable 12b-1 fees) (“Broadridge Universe Expenses”). The Board also reviewed data comparing each other operational share class’s total (net) operating expenses to the applicable Broadridge Universe Expenses. The Board noted that the expense limitations agreed to by DIMA were expected to help the Fund’s total (net) operating expenses remain competitive. The Board considered the Fund’s management fee rate as compared to fees charged by DIMA to a comparable DWS U.S. registered fund (“DWS Funds”) and considered differences between the Fund and the comparable DWS Fund. The information requested by the Board as part of its review of fees and expenses also included information about institutional accounts (including any sub-advised funds and accounts) and funds offered primarily to European investors (“DWS Europe Funds”) managed by DWS Group. The Board noted that DIMA indicated that DWS Group does not manage any institutional accounts or DWS Europe Funds comparable to the Fund.
On the basis of the information provided, the Board concluded that management fees were reasonable and appropriate in light of the nature, quality and extent of services provided by DIMA.
Profitability. The Board reviewed detailed information regarding revenues received by DIMA under the Agreement. The Board considered the estimated costs to DIMA, and pre-tax profits realized by DIMA, from advising the DWS Funds, as well as estimates of the pre-tax profits attributable to managing the Fund in particular. The Board also received information regarding the estimated enterprise-wide profitability of DIMA and its affiliates with respect to all fund services in totality and by fund. The Board and the Fee Consultant reviewed DIMA’s methodology in allocating its costs to the management of the Fund. Based on the information provided, the Board concluded that the pre-tax profits realized by DIMA in connection with the management of the Fund were not unreasonable. The Board also reviewed certain publicly available information regarding the profitability of certain similar investment management firms. The Board noted that, while information regarding the profitability of such firms is limited (and in some cases is not necessarily prepared on a comparable basis), DIMA and its affiliates’ overall profitability with respect to the DWS Funds (after taking into account distribution and other services provided to the funds by DIMA and its affiliates) was lower than the overall profitability levels of most comparable firms for which such data was available.
Economies of Scale. The Board considered whether there are economies of scale with respect to the management of the Fund and whether the Fund benefits from any economies of scale. The Board noted that the Fund’s investment management fee schedule includes fee breakpoints. The Board concluded that the Fund’s fee schedule represents an appropriate sharing between the Fund and DIMA of such economies of scale as may exist in the management of the Fund at current asset levels.
Other Benefits to DIMA and Its Affiliates. The Board also considered the character and amount of other incidental or “fall-out” benefits received by DIMA and its affiliates, including any fees received by DIMA for administrative services provided to the Fund, any fees received by an affiliate of DIMA for transfer agency services provided to the Fund and any fees received by an affiliate of DIMA for distribution services. The Board also considered benefits to DIMA related to brokerage and soft-dollar allocations, including allocating brokerage to pay for research generated by parties other than the executing broker dealers, which pertain
| | | | | | |
| | 22 | | | | | | Deutsche DWS Variable Series II — DWS Small Mid Cap Value VIP |
primarily to funds investing in equity securities. In addition, the Board considered the incidental public relations benefits to DIMA related to DWS Funds advertising and cross-selling opportunities among DIMA products and services. The Board considered these benefits in reaching its conclusion that the Fund’s management fees were reasonable.
Compliance. The Board considered the significant attention and resources dedicated by DIMA to its compliance processes in recent years. The Board noted in particular (i) the experience, seniority and time commitment of the individuals serving as DIMA’s and the Fund’s chief compliance officers and (ii) the substantial commitment of resources by DIMA and its affiliates to compliance matters, including the retention of compliance personnel.
The Board also considered that on September 24, 2020, the SEC granted a temporary order permitting DIMA and its affiliates to continue providing investment advisory and underwriting services to the DWS Funds notwithstanding a consent order entered into by Deutsche Bank AG on June 17, 2020 (the “Consent Order”). The Board noted that the temporary order was granted effective as of the date of the Consent Order. The Board also noted various representations by DIMA to the Board relating to the Consent Order, including that the conduct giving rise to the Consent Order (unintentional conduct that resulted from a system outage that prevented Deutsche Bank AG from reporting data in accordance with applicable CFTC requirements for five days in April 2016) did not involve any DWS Fund or services DIMA and its affiliates provide to the DWS Funds, that DIMA and its personnel had no involvement in the alleged conduct giving rise to the Consent Order, and that the DWS Funds would not bear any financial impact or costs relating to the Consent Order.
Based on all of the information considered and the conclusions reached, the Board determined that the continuation of the Agreement is in the best interests of the Fund. In making this determination, the Board did not give particular weight to any single factor identified above. The Board considered these factors over the course of numerous meetings, certain of which were in executive session with only the Independent Trustees and counsel present. It is possible that individual Independent Trustees may have weighed these factors differently in reaching their individual decisions to approve the continuation of the Agreement.
| | | | |
Deutsche DWS Variable Series II — DWS Small Mid Cap Value VIP | | | | | 23 |
Board Members and Officers
The following table presents certain information regarding the Board Members and Officers of the Trust/Corporation. Each Board Member’s year of birth is set forth in parentheses after his or her name. Unless otherwise noted, (i) each Board Member has engaged in the principal occupation(s) noted in the table for at least the most recent five years, although not necessarily in the same capacity; and (ii) the address of each Independent Board Member is Keith R. Fox, DWS Funds Board Chair, c/o Thomas R. Hiller, Ropes & Gray LLP, Prudential Tower, 800 Boylston Street, Boston, MA 02199-3600. Except as otherwise noted below, the term of office for each Board Member is until the election and qualification of a successor, or until such Board Member sooner dies, resigns, is removed or as otherwise provided in the governing documents of the Trust/Corporation. Because the Fund does not hold an annual meeting of shareholders, each Board Member will hold office for an indeterminate period.
The Board Members may also serve in similar capacities with other funds in the fund complex. The number of funds in the DWS fund complex shown in the table below includes all registered open- and closed-end funds (including all of their portfolios) advised by the Advisor and any registered funds that have an investment advisor that is an affiliated person of the Advisor.
| | | | | | | | |
| Independent Board Members | | | |
Name, Year of Birth,
Position with the Trust/
Corporation and
Length of Time Served1 | | Business Experience and Directorships During the Past Five Years | | Number of
Funds in
DWS Fund
Complex
Overseen | | | Other
Directorships
Held by Board
Member
|
Keith R. Fox, CFA (1954) Chairperson since 2017, and Board Member since 1996 | | Managing General Partner, Exeter Capital Partners (a series of private investment funds) (since 1986). Directorships: Progressive International Corporation (kitchen goods importer and distributor); former Chairman, National Association of Small Business Investment Companies; former Directorships: ICI Mutual Insurance Company; BoxTop Media Inc. (advertising); Sun Capital Advisers Trust (mutual funds) (2011–2012) | | | 73 | | | — |
John W. Ballantine (1946) Board Member since 1999 | | Retired; formerly, Executive Vice President and Chief Risk Management Officer, First Chicago NBD Corporation/The First National Bank of Chicago (1996–1998); Executive Vice President and Head of International Banking (1995–1996); former Directorships: Director and Chairman of the Board, Healthways, Inc.2 (population well-being and wellness services) (2003–2014); Stockwell Capital Investments PLC (private equity); Enron Corporation; FNB Corporation; Tokheim Corporation; First Oak Brook Bancshares, Inc.; Oak Brook Bank; and Prisma Energy International. Not-for-Profit Director/Trustee: Palm Beach Civic Association; Window to the World Communications (public media); Life Director of Harris Theater for Music and Dance (Chicago); Life Director of Hubbard Street Dance Chicago; former Not-for-Profit Directorships: Public Radio International | | | 73 | | | Portland
General
Electric2
(utility
company)
(2003–
present) |
Dawn-Marie Driscoll (1946) Board Member since 1987 | | Emeritus Executive Fellow, Center for Business Ethics, Bentley University; formerly: Partner, Palmer & Dodge (law firm) (1988–1990); Vice President of Corporate Affairs and General Counsel, Filene’s (retail) (1978–1988). Directorships: Advisory Board, Center for Business Ethics, Bentley University; Trustee and former Chairman of the Board, Southwest Florida Community Foundation (charitable organization); former Directorships: ICI Mutual Insurance Company (2007–2015); Sun Capital Advisers Trust (mutual funds) (2007–2012), Investment Company Institute (audit, executive, nominating committees) and Independent Directors Council (governance, executive committees) | | | 73 | | | — |
Richard J. Herring (1946) Board Member since 1990 | | Jacob Safra Professor of International Banking and Professor of Finance, The Wharton School, University of Pennsylvania (since July 1972); Director, The Wharton Financial Institutions Center (since 1994); formerly: Vice Dean and Director, Wharton Undergraduate Division (1995–2000) and Director, The Lauder Institute of International Management Studies (2000–2006); Member FDIC Systemic Risk Advisory Committee since 2011, member Systemic Risk Council since 2012 and member of the Advisory Board at the Yale Program on Financial Stability since 2013; Formerly Co-Chair of the Shadow Financial Regulatory Committee (2003–2015), Executive Director of The Financial Economists Roundtable (2008–2015), Director of The Thai Capital Fund (2007–2013), Director of The Aberdeen Singapore Fund (2007–2018), and Nonexecutive Director of Barclays Bank DE (2010–2018) | | | 73 | | | Director,
Aberdeen
Japan Fund
(since 2007) |
William McClayton (1944) Board Member since 2004 | | Private equity investor (since October 2009); previously, Managing Director, Diamond Management & Technology Consultants, Inc. (global consulting firm) (2001–2009); Directorship: Board of Managers, YMCA of Metropolitan Chicago; formerly: Senior Partner, Arthur Andersen LLP (accounting) (1966–2001); Trustee, Ravinia Festival | | | 73 | | | — |
| | | | | | |
| | 24 | | | | | | Deutsche DWS Variable Series II — DWS Small Mid Cap Value VIP |
| | | | | | | | |
Name, Year of Birth,
Position with the Trust/
Corporation and
Length of Time Served1 | | Business Experience and Directorships During the Past Five Years | | Number of
Funds in
DWS Fund
Complex
Overseen | | | Other
Directorships
Held by Board
Member
|
Rebecca W. Rimel (1951) Board Member since 1995 | | Senior Advisor, The Pew Charitable Trusts (charitable organization) (since July 2020); formerly: Executive Vice President, The Glenmede Trust Company (investment trust and wealth management) (1983–2004); Board Member, Investor Education (charitable organization) (2004–2005); Trustee, Executive Committee, Philadelphia Chamber of Commerce (2001–2007); Director, Viasys Health Care2 (January 2007–June 2007); Trustee, Thomas Jefferson Foundation (charitable organization) (1994–2012); President, Chief Executive Officer and Director, The Pew Charitable Trusts (charitable organization) (1994–2020) | | | 73 | | | Director,
Becton
Dickinson
and
Company2
(medical
technology
company)
(2012–
present);
Director,
BioTelemetry
Inc.2 (health
care) (2009–
present) |
William N. Searcy, Jr. (1946) Board Member since 1993 | | Private investor since October 2003; formerly: Pension & Savings Trust Officer, Sprint Corporation2 (telecommunications) (November 1989–September 2003); Trustee, Sun Capital Advisers Trust (mutual funds) (1998–2012) | | | 73 | | | — |
| | |
| Officers4 | | |
Name, Year of Birth,
Position with the Trust/
Corporation and
Length of Time Served5 | | Business Experience and Directorships During the Past Five Years |
Hepsen Uzcan6 (1974) President and Chief Executive Officer, 2017–present | | Managing Director3, DWS; Secretary, DWS USA Corporation (2018–present); Assistant Secretary, DWS Distributors, Inc. (2018–present); Director and Vice President, DWS Service Company (2018–present); Assistant Secretary, DWS Investment Management Americas, Inc. (2018–present); Director and President, DB Investment Managers, Inc. (2018–present); President and Chief Executive Officer, The European Equity Fund, Inc., The New Germany Fund, Inc. and The Central and Eastern Europe Fund, Inc. (2017–present); formerly: Vice President for the Deutsche funds (2016–2017); Assistant Secretary for the DWS funds (2013–2019); Assistant Secretary, The European Equity Fund, Inc., The New Germany Fund, Inc. and The Central and Eastern Europe Fund, Inc. (2013–2020); Directorships: Interested Director, The European Equity Fund, Inc., The New Germany Fund, Inc. and The Central and Eastern Europe Fund, Inc. (since June 25, 2020); ICI Mutual Insurance Company (since October 16, 2020); and Episcopalian Charities of New York (2018–present) |
John Millette7 (1962) Vice President and Secretary, 1999–present | | Director,3 DWS; Chief Legal Officer, DWS Investment Management Americas, Inc. (2015–present); Director and Vice President, DWS Trust Company (2016–present); Secretary, DBX ETF Trust (2020–present); Secretary, The European Equity Fund, Inc., The New Germany Fund, Inc. and The Central and Eastern Europe Fund, Inc. (2011–present); formerly: Secretary, Deutsche Investment Management Americas Inc. (2015–2017); Assistant Secretary, DBX ETF Trust (2019–2020); Assistant Secretary (July 14, 2006–December 31, 2010) and Secretary (January 31, 2006–July 13, 2006), The European Equity Fund, Inc., The New Germany Fund, Inc. and The Central and Eastern Europe Fund, Inc. |
Ciara Crawford8 (1984) Assistant Secretary, (2019–present) | | Associate, DWS (since 2015); previously, Legal Assistant at Accelerated Tax Solutions. |
Diane Kenneally7 (1966) Chief Financial Officer and Treasurer, 2018–present | | Director,3 DWS; Treasurer, Chief Financial Officer and Controller, DBX ETF Trust (2019–present); Treasurer and Chief Financial Officer, The European Equity Fund, Inc., The New Germany Fund, Inc. and The Central and Eastern Europe Fund, Inc. (2018–present); formerly: Assistant Treasurer for the DWS funds (2007–2018) |
Paul Antosca7 (1957) Assistant Treasurer, 2007–present | | Director,3 DWS; and Assistant Treasurer, DBX ETF Trust (2019–present) |
Sheila Cadogan7 (1966) Assistant Treasurer, 2017–present | | Director,3 DWS; Director and Vice President, DWS Trust Company (2018–present); Assistant Treasurer, DBX ETF Trust (2019–present); Assistant Treasurer, The European Equity Fund, Inc., The New Germany Fund, Inc. and The Central and Eastern Europe Fund, Inc. (2018–present) |
Scott D. Hogan7 (1970) Chief Compliance Officer, 2016–present | | Director,3 DWS; Chief Compliance Officer, The European Equity Fund, Inc., The New Germany Fund, Inc. and The Central and Eastern Europe Fund, Inc. (2016–present) |
Caroline Pearson7 (1962) Chief Legal Officer, 2010–present | | Managing Director3, DWS; Assistant Secretary, DBX ETF Trust (2020–present); Chief Legal Officer, DBX Advisors LLC and DBX Strategic Advisors LLC (2020–present); Chief Legal Officer, The European Equity Fund, Inc., The New Germany Fund, Inc. and The Central and Eastern Europe Fund, Inc. (2012–present); formerly: Secretary, Deutsche AM Distributors, Inc. (2002–2017); and Secretary, Deutsche AM Service Company (2010–2017) |
| | | | |
Deutsche DWS Variable Series II — DWS Small Mid Cap Value VIP | | | | | 25 |
| | |
Name, Year of Birth,
Position with the Trust/
Corporation and
Length of Time Served5 | | Business Experience and Directorships During the Past Five Years |
Michelle Goveia-Pine6 (1970) Interim Anti-Money Laundering Compliance Officer, since July 10, 2020 | | Director,3 DWS; Interim AML Officer, DWS Trust Company (since July 28, 2020); Interim AML Officer, DBX ETF Trust (since July 9, 2020); Interim AML Officer, The European Equity Fund, Inc., The New Germany Fund, Inc. and The Central and Eastern Europe Fund, Inc. (since July 24, 2020) |
| 1 | The length of time served represents the year in which the Board Member joined the board of one or more DWS funds currently overseen by the Board. |
| 2 | A publicly held company with securities registered pursuant to Section 12 of the Securities Exchange Act of 1934. |
| 3 | Executive title, not a board directorship. |
| 4 | As a result of their respective positions held with the Advisor or its affiliates, these individuals are considered “interested persons” of the Advisor within the meaning of the 1940 Act. Interested persons receive no compensation from the Fund. |
| 5 | The length of time served represents the year in which the officer was first elected in such capacity for one or more DWS funds. |
| 6 | Address: 875 Third Avenue, New York, NY 10022. |
| 7 | Address: 100 Summer Street, Boston, MA 02110. |
| 8 | Address: 5022 Gate Parkway, Suite 400, Jacksonville, FL 32256. |
The Fund’s Statement of Additional Information (“SAI”) includes additional information about the Board Members. The SAI is available, without charge, upon request. If you would like to request a copy of the SAI, you may do so by calling the following toll-free number: (800) 728-3337.
| | | | | | |
| | 26 | | | | | | Deutsche DWS Variable Series II — DWS Small Mid Cap Value VIP |
Notes
| | |
| | |
VS2SMCV-2 (R-025829-10 2/21) | | |
| | |
| | (b) Not applicable |
| | |
| ITEM 2. | CODE OF ETHICS |
| | |
| | As of the end of the period covered by this report, the registrant has adopted a code of ethics, as defined in Item 2 of Form N-CSR that applies to its Principal Executive Officer and Principal Financial Officer. There have been no amendments to, or waivers from, a provision of the code of ethics during the period covered by this report that would require disclosure under Item 2. A copy of the code of ethics is filed as an exhibit to this Form N-CSR. |
| | |
| ITEM 3. | AUDIT COMMITTEE FINANCIAL EXPERT |
| | |
| | The fund’s audit committee is comprised solely of trustees who are "independent" (as such term has been defined by the Securities and Exchange Commission ("SEC") in regulations implementing Section 407 of the Sarbanes-Oxley Act (the "Regulations")). The fund’s Board of Trustees has determined that there are several "audit committee financial experts" (as such term has been defined by the Regulations) serving on the fund’s audit committee including Mr. William McClayton, the chair of the fund’s audit committee. An “audit committee financial expert” is not an “expert” for any purpose, including for purposes of Section 11 of the Securities Act of 1933 and the designation or identification of a person as an “audit committee financial expert” does not impose on such person any duties, obligations or liability that are greater than the duties, obligations and liability imposed on such person as a member of the audit committee and board of directors in the absence of such designation or identification. |
| | |
| ITEM 4. | PRINCIPAL ACCOUNTANT FEES AND SERVICES |
| | |
Deutsche DWS Variable Series II
form n-csr disclosure re: AUDIT FEES
The following table shows the amount of fees that Ernst & Young LLP (“EY”), the Fund’s Independent Registered Public Accounting Firm, billed to the Fund during the Fund’s last two fiscal years. The Audit Committee approved in advance all audit services and non-audit services that EY provided to the Fund.
Services that the Fund’s Independent Registered Public Accounting Firm Billed to the Fund
Fiscal Year
Ended
December 31, | Audit Fees Billed to Fund | Audit-Related
Fees Billed to Fund | Tax Fees Billed to Fund | All
Other Fees Billed to Fund |
| 2020 | $462,792 | $0 | $68,453 | $0 |
| 2019 | $554,948 | $0 | $92,483 | $0 |
The above “Tax Fees” were billed for professional services rendered for tax preparation.
Services that the Fund’s Independent Registered Public Accounting Firm Billed to the Adviser and Affiliated Fund Service Providers
The following table shows the amount of fees billed by EY to DWS Investment Management Americas, Inc. (“DIMA” or the “Adviser”), and any entity controlling, controlled by or under common control with DIMA (“Control Affiliate”) that provides ongoing services to the Fund (“Affiliated Fund Service Provider”), for engagements directly related to the Fund’s operations and financial reporting, during the Fund’s last two fiscal years.
Fiscal Year
Ended
December 31, | Audit-Related
Fees Billed to Adviser and Affiliated Fund Service Providers | Tax Fees Billed to Adviser and Affiliated Fund Service Providers | All
Other Fees Billed to Adviser and Affiliated Fund Service Providers |
| 2020 | $0 | $650,763 | $0 |
| 2019 | $0 | $740,482 | $0 |
The above “Tax Fees” were billed in connection with tax compliance services and agreed upon procedures.
Non-Audit Services
The following table shows the amount of fees that EY billed during the Fund’s last two fiscal years for non-audit services. The Audit Committee pre-approved all non-audit services that EY provided to the Adviser and any Affiliated Fund Service Provider that related directly to the Fund’s operations and financial reporting. The Audit Committee requested and received information from EY about any non-audit services that EY rendered during the Fund’s last fiscal year to the Adviser and any Affiliated Fund Service Provider. The Committee considered this information in evaluating EY’s independence.
Fiscal Year
Ended
December 31, | Total
Non-Audit Fees Billed to Fund
(A) | Total Non-Audit Fees billed to Adviser and Affiliated Fund Service Providers (engagements related directly to the operations and financial reporting of the Fund)
(B) | Total Non-Audit Fees billed to Adviser and Affiliated Fund Service Providers (all other engagements)
(C) | Total of
(A), (B) and (C) |
| 2020 | $68,453 | $650,763 | $0 | $719,216 |
| 2019 | $92,483 | $740,482 | $0 | $832,965 |
All other engagement fees were billed for services in connection with agreed upon procedures and tax compliance for DIMA and other related entities.
Audit Committee Pre-Approval Policies and Procedures. Generally, each Fund’s Audit Committee must pre approve (i) all services to be performed for a Fund by a Fund’s Independent Registered Public Accounting Firm and (ii) all non-audit services to be performed by a Fund’s Independent Registered Public Accounting Firm for the DIMA Entities with respect to operations and financial reporting of the Fund, except that the Chairperson or Vice Chairperson of each Fund’s Audit Committee may grant the pre-approval for non-audit services described in items (i) and (ii) above for non-prohibited services for engagements of less than $100,000. All such delegated pre approvals shall be presented to each Fund’s Audit Committee no later than the next Audit Committee meeting.
There were no amounts that were approved by the Audit Committee pursuant to the de minimis exception under Rule 2-01 of Regulation S-X.
According to the registrant’s principal Independent Registered Public Accounting Firm, substantially all of the principal Independent Registered Public Accounting Firm's hours spent on auditing the registrant's financial statements were attributed to work performed by full-time permanent employees of the principal Independent Registered Public Accounting Firm.
***
In connection with the audit of the 2019 and 2020 financial statements, the Fund entered into an engagement letter with EY. The terms of the engagement letter required by EY, and agreed to by the Audit Committee, include a provision mandating the use of mediation and arbitration to resolve any controversy or claim between the parties arising out of or relating to the engagement letter or services provided thereunder.
***
Pursuant to PCAOB Rule 3526, EY is required to describe in writing to the Fund’s Audit Committee, on at least an annual basis, all relationships between EY, or any of its affiliates, and the DWS Funds, including the Fund, or persons in financial reporting oversight roles at the DWS Funds that, as of the date of the communication, may reasonably be thought to bear on EY’s independence. Pursuant to PCAOB Rule 3526, EY has reported the matters set forth below that may reasonably be thought to bear on EY’s independence. With respect to each reported matter, individually and in the aggregate, EY advised the Audit Committee that, after careful consideration of the facts and circumstances and the applicable independence rules, it concluded that the matters do not and will not impair EY’s ability to exercise objective and impartial judgement in connection with the audits of the financial statements for the Fund and a reasonable investor with knowledge of all relevant facts and circumstances would conclude that EY has been and is capable of exercising objective and impartial judgment on all issues encompassed within EY’s audit engagements. EY also confirmed to the Audit Committee that it can continue act as the Independent Registered Public Accounting Firm for the Fund.
| · | EY advised the Fund’s Audit Committee that various covered persons within EY’s affiliates held investments in, or had other financial relationships with, entities within the DWS Funds “investment company complex” (as defined in Regulation S-X) (the “DWS Funds Complex”). EY informed the Audit Committee that these investments and financial relationships were inconsistent with Rule 2-01(c)(1) of Regulation S-X. EY reported that all breaches have been resolved and that none of the breaches involved any investments in the Fund or any professionals who were part of the audit engagement team for the Fund. In addition, EY noted that the independence breaches did not (i) create a mutual or conflicting interest with the Fund, (ii) place EY in the position of auditing its own work, (iii) result in EY acting as management or an employee of the Fund, or (iv) place EY in a position of being an advocate of the Fund. |
| | |
| ITEM 5. | AUDIT COMMITTEE OF LISTED REGISTRANTS |
| | |
| | Not applicable |
| | |
| ITEM 6. | SCHEDULE OF INVESTMENTS |
| | |
| | Not applicable |
| | |
| ITEM 7. | DISCLOSURE OF PROXY VOTING POLICIES AND PROCEDURES FOR CLOSED-END MANAGEMENT INVESTMENT COMPANIES |
| | |
| | Not applicable |
| | |
| ITEM 8. | PORTFOLIO MANAGERS OF CLOSED-END MANAGEMENT INVESTMENT COMPANIES |
| | |
| | Not applicable |
| | |
| ITEM 9. | PURCHASES OF EQUITY SECURITIES BY CLOSED-END MANAGEMENT INVESTMENT COMPANY AND AFFILIATED PURCHASERS |
| | |
| | Not applicable |
| | |
| ITEM 10. | SUBMISSION OF MATTERS TO A VOTE OF SECURITY HOLDERS |
| | |
| | There were no material changes to the procedures by which shareholders may recommend nominees to the Fund’s Board. The primary function of the Nominating and Governance Committee is to identify and recommend individuals for membership on the Board and oversee the administration of the Board Governance Guidelines. Shareholders may recommend candidates for Board positions by forwarding their correspondence by U.S. mail or courier service to Keith R. Fox, DWS Funds Board Chair, c/o Thomas R. Hiller, Ropes & Gray LLP, Prudential Tower, 800 Boylston Street, Boston, MA 02199-3600. |
| | |
| ITEM 11. | CONTROLS AND PROCEDURES |
| | |
| | (a) | The Chief Executive and Financial Officers concluded that the Registrant’s Disclosure Controls and Procedures are effective based on the evaluation of the Disclosure Controls and Procedures as of a date within 90 days of the filing date of this report. |
| | |
| | (b) | There have been no changes in the registrant’s internal control over financial reporting that occurred during the period covered by this report that has materially affected, or is reasonably likely to materially affect, the registrant’s internal controls over financial reporting. |
| | |
| ITEM 12. | Disclosure of Securities Lending Activities for Closed-End Management Investment Companies |
| | |
| | Not applicable |
| | |
| ITEM 13. | EXHIBITS |
| | |
| | (a)(1) | Code of Ethics pursuant to Item 2 of Form N-CSR is filed and attached hereto as EX-99.CODE ETH. |
| | |
| | (a)(2) | Certification pursuant to Rule 30a-2(a) under the Investment Company Act of 1940 (17 CFR 270.30a-2(a)) is filed and attached hereto as Exhibit 99.CERT. |
| | |
| | (b) | Certification pursuant to Rule 30a-2(b) under the Investment Company Act of 1940 (17 CFR 270.30a-2(b)) is furnished and attached hereto as Exhibit 99.906CERT. |
SIGNATURES
Pursuant to the requirements of the Securities Exchange Act of 1934 and the Investment Company Act of 1940, the registrant has duly caused this report to be signed on its behalf by the undersigned, thereunto duly authorized.
| Registrant: | Deutsche DWS Variable Series II |
| | |
| | |
| By: | /s/Hepsen Uzcan Hepsen Uzcan President |
| | |
| Date: | 2/12/2021 |
Pursuant to the requirements of the Securities Exchange Act of 1934 and the Investment Company Act of 1940, this report has been signed below by the following persons on behalf of the registrant and in the capacities and on the dates indicated.
| By: | /s/Hepsen Uzcan Hepsen Uzcan President |
| | |
| Date: | 2/12/2021 |
| | |
| | |
| | |
| By: | /s/Diane Kenneally Diane Kenneally Chief Financial Officer and Treasurer |
| | |
| Date: | 2/12/2021 |
| | |