UNITED STATES
SECURITIES AND EXCHANGE COMMISSION
WASHINGTON, D. C. 20549
FORM N-CSR
Investment Company Act file number: 811-05002
Deutsche DWS Variable Series II
(Exact Name of Registrant as Specified in Charter)
345 Park Avenue
New York, NY 10154-0004
(Address of Principal Executive Offices) (Zip Code)
Registrant’s Telephone Number, including Area Code:(212) 250-2500
Diane Kenneally
One International Place
Boston, MA 02110
(Name and Address of Agent for Service)
| Date of fiscal year end: | 12/31 |
| | |
| Date of reporting period: | 12/31/2018 |
| ITEM 1. | REPORT TO STOCKHOLDERS |
December 31, 2018
Annual Report
Deutsche DWS Variable Series II
(formerly Deutsche Variable Series II)
DWS Alternative Asset Allocation VIP
(formerly Deutsche Alternative Asset Allocation VIP)
Beginning on January 1, 2021, as permitted by regulations adopted by the Securities and Exchange Commission, you may not be receiving paper copies of the Fund’s shareholder reports from the insurance company that offers your contract unless you specifically request paper copies from your insurance company or from your financial intermediary. Instead, the shareholder reports will be made available on a Web site, and your insurance company will notify you by mail each time a report is posted and provide you with a Web site link to access the report. Instructions for requesting paper copies will be provided by your insurance company.
If you already elected to receive shareholder reports electronically, you will not be affected by this change and you need not take any action. You may elect to receive shareholder reports and other communications from your insurance company electronically by following the instructions provided by your insurance company.
You may elect to receive all future reports in paper free of charge from your insurance company. If your insurance company informs you that future reports will be delivered via Web access, you can inform your insurance company that you wish to continue receiving paper copies of your shareholder reports by following the instructions provided by your insurance company.

Contents
This report must be preceded or accompanied by a prospectus. To obtain an additional prospectus or summary prospectus, if available, call (800) 728-3337 or your financial representative. We advise you to consider the Fund’s objectives, risks, charges and expenses carefully before investing. The summary prospectus and prospectus contain this and other important information about the Fund. Please read the prospectus carefully before you invest.
Although allocation among different asset categories generally limits risk, portfolio management may favor an asset category that underperforms other assets or markets as a whole. The Fund expects to invest in underlying funds that emphasize alternatives or non-traditional asset categories or investment strategies, and as a result, it is subject to the risk factors of those underlying funds. Some of those risks include: stock market risk; the political, general economic, liquidity and currency risks of foreign investments, which may be particularly significant for emerging markets; credit and interest rate risk; floating rate loan risk; volatility in commodity prices, infrastructure and high-yield debt securities; market direction risk (market advances when short, market declines when long); and short sales risk. Because Exchange Traded Funds (ETFs) trade on a securities exchange, their shares may trade at a premium or discount to their net asset value. ETFs also incur fees and expenses so they may not fully match the performance of the indexes they are designed to track. Because Exchange Traded Notes (ETNs) are senior, unsecured, unsubordinated debt securities of an issuer (typically a bank or bank holding company), ETNs are subject to the credit risk of the issuer and may lose value due to a downgrade in the issuer’s credit rating. The returns of an ETN are linked to the performance of an underlying instrument (typically an index), minus applicable fees. ETNs typically do not make periodic interest payments and principal typically is not protected. The value of an ETN may fluctuate based on factors such as time to maturity, level of supply and demand for the ETN, volatility and lack of liquidity in the underlying assets, changes in the applicable interest rates, and economic, legal, political or geographic events that affect the underlying assets. The Fund bears its proportionate share of any fees and expenses borne by the ETN. Because ETNs trade on a securities exchange, their shares may trade at a premium or discount to their net asset value. The Fund may use derivatives, including as part of its currency and interest-rate strategies. Investing in derivatives entails special risks relating to liquidity, leverage and credit that may reduce returns and/or increase volatility. The success of the Fund’s currency and interest-rate strategies are dependent, in part, on the effectiveness and implementation of portfolio management’s proprietary models. As part of these strategies, the Fund’s exposure to foreign currencies could cause lower returns or even losses because foreign currency rates may fluctuate significantly over short periods of time for a number of reasons. The risk of loss is heightened during periods of rapid rises in interest rates. In addition, the notional amount of the Fund’s aggregate currency and interest-rate exposure resulting from these strategies may significantly exceed the net assets of the Fund. Please read prospectus for additional risks and specific details regarding the Fund’s risk profile.
The brand DWS represents DWS Group GmbH & Co. KGaA and any of its subsidiaries such as DWS Distributors, Inc. which offers investment products or DWS Investment Management Americas, Inc. and RREEF America L.L.C. which offer advisory services.
DWS Distributors, Inc., 222 South Riverside Plaza, Chicago, IL 60606, (800) 621-1148
NOT FDIC/NCUA INSURED NO BANK GUARANTEE MAY LOSE VALUE NOT A DEPOSIT
NOT INSURED BY ANY FEDERAL GOVERNMENT AGENCY
| | | | | | |
| | 2 | | | | | | Deutsche DWS Variable Series II — DWS Alternative Asset Allocation VIP |
| | |
| Performance Summary | | December 31, 2018 (Unaudited) |
Fund performance shown is historical, assumes reinvestment of all dividend and capital gain distributions and does not guarantee future results. Investment return and principal value fluctuate with changing market conditions so that, when redeemed, shares may be worth more or less than their original cost. Current performance may be lower or higher than the performance data quoted. Please contact your participating insurance company for the Fund’s most recent month-end performance. Performance does not reflect charges and fees (“contract charges”) associated with the separate account that invests in the Fund or any variable life insurance policy or variable annuity contract for which the Fund is an investment option. These charges and fees will reduce returns. While all share classes have the same underlying portfolio, their performance will differ.
The gross expense ratios of the Fund, as stated in the fee table of the prospectus dated May 1, 2018 are 1.36% and 1.65% for Class A and Class B shares, respectively, and may differ from the expense ratios disclosed in the Financial Highlights tables in this report. These expense ratios include net expenses of the underlying funds in which the Fund invests.
Generally accepted accounting principles require adjustments to be made to the net assets of the Fund at period end for financial reporting purposes only, and as such, the total return based on the unadjusted net asset value per share may differ from the total return reported in the financial highlights.
Growth of an Assumed $10,000 Investment in DWS Alternative Asset Allocation VIP from 2/2/09 to 12/31/18
| | |
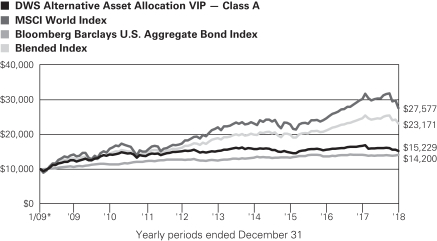 | | The Morgan Stanley Capital International (MSCI) World Index captures large and mid cap representation across 23 Developed Market countries. The Bloomberg Barclays U.S. Aggregate Bond Index is an unmanaged index representing domestic taxable investment-grade bonds, with index components for government and corporate securities, mortgage pass-through securities, and asset-backed securities with an average maturity of one year or more. The Blended Index is calculated using the performance of two unmanaged indices, representative of stocks (the MSCI World Index (70%)) and bonds (the Bloomberg Barclays U.S. Aggregate Bond Index (30%)). These results are summed to produce the aggregate benchmark. Index returns do not reflect any fees or expenses and it is not possible to invest directly into an index. |
| | | | | | | | | | |
| Comparative Results | | | | | | | | | | |
| | | | | |
DWS Alternative Asset
Allocation VIP | | | | 1-Year | | 3-Year | | 5-Year | | Life of Fund* |
| Class A | | Growth of $10,000 | | $9,086 | | $10,277 | | $9,967 | | $15,229 |
| | | Average annual total return | | –9.14% | | 0.91% | | –0.07% | | 4.33% |
| MSCI World Index | | Growth of $10,000 | | $9,129 | | $12,013 | | $12,496 | | $27,577 |
| | | Average annual total return | | –8.71% | | 6.30% | | 4.56% | | 10.78% |
| Bloomberg Barclays U.S. Aggregate Bond Index | | Growth of $10,000 | | $10,001 | | $10,630 | | $11,326 | | $14,200 |
| | Average annual total return | | 0.01% | | 2.06% | | 2.52% | | 3.60% |
| Blended Index | | Growth of $10,000 | | $9,404 | | $11,627 | | $12,215 | | $23,171 |
| | | Average annual total return | | –5.96% | | 5.15% | | 4.08% | | 8.84% |
The growth of $10,000 is cumulative.
| * | The Fund commenced offering Class A shares on February 2, 2009. The performance shown for each index is for the time period of January 31, 2009 through December 31, 2018, which is based on the performance period of the life of the Fund. |
| | | | |
Deutsche DWS Variable Series II — DWS Alternative Asset Allocation VIP | | | | | 3 |
| | | | | | | | | | |
| | | | | |
DWS Alternative Asset
Allocation VIP | | | | 1-Year | | 3-Year | | 5-Year | | Life of Class** |
| Class B | | Growth of $10,000 | | $9,065 | | $10,185 | | $9,827 | | $13,647 |
| | | Average annual total return | | –9.35% | | 0.61% | | –0.35% | | 3.28% |
| MSCI World Index | | Growth of $10,000 | | $9,129 | | $12,013 | | $12,496 | | $24,846 |
| | | Average annual total return | | –8.71% | | 6.30% | | 4.56% | | 9.92% |
| Bloomberg Barclays U.S. Aggregate Bond Index | | Growth of $10,000 | | $10,001 | | $10,630 | | $11,326 | | $13,873 |
| | Average annual total return | | 0.01% | | 2.06% | | 2.52% | | 3.46% |
| Blended Index | | Growth of $10,000 | | $9,404 | | $11,627 | | $12,215 | | $20,542 |
| | | Average annual total return | | –5.96% | | 5.15% | | 4.08% | | 7.80% |
The growth of $10,000 is cumulative.
| ** | The Fund commenced offering Class B shares on May 18, 2009. The performance shown for each index is for the time period of May 31, 2009 through December 31, 2018, which is based on the performance period of the life of Class B. |
| | | | | | |
| | 4 | | | | | | Deutsche DWS Variable Series II — DWS Alternative Asset Allocation VIP |
| | |
| Management Summary | | December 31, 2018 (Unaudited) |
The Fund returned –9.14% (Class A shares, unadjusted for contract charges) during the12-month period ended December 31, 2018, trailing the –5.96% return of its blended benchmark. The past year proved very challenging for the Fund, since virtually all asset categories experienced negative returns. Broader indexes linked to equities, commodities, and bonds all lost ground due to the combination of rising interest rates and emerging concerns about the trajectory of global growth. Perhaps more notably, financial assets demonstrated unusually high correlations in the fourth quarter once investor sentiment soured and the markets sold off. As a result, our diversified and long-term approach failed to add value in 2018.
The Fund’s positions in investments with sensitivity to the global equity markets — including infrastructure stocks, preferred stocks, and convertible bonds — all experienced double-digit losses and were generally the largest detractors. We invested in these areas as a way to gain exposure to risk-sensitive assets with higher income and a lower degree of expected volatility than the broad equity indexes. This aspect of our approach worked well through the first nine months of the period, when stocks were rising. However, these categories did not provide meaningful downside protection in the fourth-quarter downturn, when indiscriminate selling pressured returns across the equity market. We maintained the positions based on their long-term income potential and, in the case of infrastructure stocks, the expanding need for infrastructure to serve the world’s growing population.
The Fund’s allocation to real estate investment trusts (REITs), while also affected by broader-market weakness, nonetheless outperformed our other equity-sensitive investments. The asset class was helped by its strong underlying fundamentals and, later in the period, reduced worries about rising interest rates and investors’ preference for the more defensive areas of the market.
A position in commodities was an additional drag on Fund returns. The asset class experienced poor performance in the fourth calendar quarter, when the prospect of slowing economic growth sparked fears of slowing end demand in 2019.
Our allocation to fixed income did not provide the expected ballast to the portfolio, since the majority of the position was held in emerging-markets bonds. The category slumped due to questions about the growth outlook for the emerging world, as well as economic turmoil in Argentina and Turkey in the late summer. However, our allocation to floating-rate securities finished with only a narrow loss. At a time in which the U.S. Federal Reserve was tightening its monetary policy, bonds with floating-rate features benefited from elevated investor demand.
The Fund’s performance was also affected by its positions in exchange-traded funds (ETFs) with an inverse relationship to the CBOE Volatility Index (VIX). We held these funds in the early part of the year in anticipation that thelow-volatility environment for stocks would continue. They declined sharply once volatility spiked in February, however, and we elected to close the position. On the positive side, we held ETFs linked to the performance of the U.S. dollar. The dollar rallied in 2018 due to the United States’ stronger relative growth and tighter central bank policy versus other major developed nations.
The Fund finished December with allocations that were broadly in line with what it held throughout the year. While the markets were very volatile in the fourth quarter due to concerns about the growth outlook, we retained our core positioning on the belief that the world economy was on track for a continued expansion. With that said, we closed the year with a higher-than-normal allocation to cash, reflecting our desire to maintain the flexibility to capitalize on the potential for further volatility in the first half of 2019.
Pankaj Bhatnagar, PhD, Managing Director
Darwei Kung, Managing Director
Dokyoung Lee, CFA, Director
Portfolio Managers
The views expressed reflect those of the portfolio management team only through the end of the period of the report as stated on the cover. The management team’s views are subject to change at any time based on market and other conditions and should not be construed as a recommendation. Past performance is no guarantee of future results. Current and future portfolio holdings are subject to risk.
| | | | |
Deutsche DWS Variable Series II — DWS Alternative Asset Allocation VIP | | | | | 5 |
Terms to Know
TheBlended Index is calculated using the performance of two unmanaged indices, representative of stocks (the Morgan Stanley Capital International (MSCI) World Index, 70%) and bonds (the Bloomberg Barclays U.S. Aggregate Bond Index, 30%). These results are summed to produce the aggregate benchmark. Index returns do not reflect fees or expenses and it is not possible to invest directly into an index.
Convertible bonds are bonds that are issued by corporations and that can be converted to shares of the issuing company’s stock at the bondholder’s discretion.
Preferred stocks are hybrid securities that offer some of the features of both stocks and bonds.
Anexchange-traded fund (ETF) is a security that tracks an index, a commodity or a basket of assets like an index fund, but trades like a stock on an exchange.
The CBOE Volatility Index (VIX Index) is a measure of market expectations ofnear-term volatility conveyed by S&P 500 stock index option prices.
| | | | | | |
| | 6 | | | | | | Deutsche DWS Variable Series II — DWS Alternative Asset Allocation VIP |
| | |
| Portfolio Summary | | (Unaudited) |
| | | | | | | | |
| Asset Allocation* (As a % of Investment Portfolio) | | 12/31/18 | | | 12/31/17 | |
Real Asset | | | 40% | | | | 45% | |
DWS Enhanced Commodity Strategy Fund | | | 15% | | | | 13% | |
DWS RREEF Real Estate Securities Fund | | | 8% | | | | 4% | |
DWS RREEF Global Real Estate Securities Fund | | | 6% | | | | 8% | |
iShares Global Infrastructure ETF | | | 6% | | | | 9% | |
DWS RREEF Global Infrastructure Fund | | | 5% | | | | 11% | |
| | |
Alternative Fixed Income | | | 21% | | | | 23% | |
DWS Floating Rate Fund | | | 12% | | | | 7% | |
DWS Emerging Markets Fixed Income Fund | | | 7% | | | | 9% | |
iShares JP Morgan USD Emerging Markets Bond ETF | | | 2% | | | | 4% | |
VanEck Vectors JPMorgan EM Local Currency Bond ETF | | | — | | | | 3% | |
| | |
Alternative Equity | | | 19% | | | | 19% | |
SPDR Bloomberg Barclays Convertible Securities ETF | | | 14% | | | | 14% | |
iShares U.S. Preferred Stock ETF | | | 5% | | | | 5% | |
| | |
Absolute Return | | | 4% | | | | 6% | |
DWS Global Macro Fund | | | 3% | | | | 0% | |
Invesco DB U.S. Dollar Index Bullish Fund | | | 1% | | | | 0% | |
VelocityShares Daily Inverse VIX Short Term ETN | | | — | | | | 3% | |
PowersShares DB U.S. Dollar Index Bullish Fund | | | — | | | | 2% | |
ProShares Short VIX Short-Term Futures ETF | | | — | | | | 1% | |
| | |
Cash Equivalents | | | 16% | | | | 7% | |
DWS ESG Liquidity Fund | | | 8% | | | | — | |
DWS Central Cash Management Government Fund | | | 8% | | | | 7% | |
| | | | 100% | | | | 100% | |
| * | During the periods indicated, asset categories and investment strategies represented in the Fund’s portfolio fell into the following categories: Real Assets, Alternative Fixed Income, Alternative Equity, and Absolute Return. Real Asset investments have a tangible or physical aspect such as real estate or commodities. Alternative Fixed Income investments seek to offer exposure to categories generally not included in investors’ allocations and to foreign investments, many of which are not denominated in US dollars. Alternative Equity investments are investments primarily in convertible and preferred instruments that offer equity exposure. Absolute Return investments seek positive returns in all market environments or seek to increase the diversification or liquidity of the Fund’s portfolio. |
Portfolio holdings and characteristics are subject to change.
For more complete details about the Fund’s investment portfolio, see page 8.
Following the Fund’s fiscal first and third quarter-end, a complete portfolio holdings listing is filed with the SEC on Form N-Q or Form N-PORT (available for filings after March 31, 2019). The Fund’s Form N-Q or Form N-PORT will be available on the SEC’s Web site at sec.gov. The Fund’s portfolio holdings are also posted on dws.com from time to time. Please see the Fund’s current prospectus for more information.
| | | | |
Deutsche DWS Variable Series II — DWS Alternative Asset Allocation VIP | | | | | 7 |
| | |
| Investment Portfolio | | December 31, 2018 |
| | | | | | | | |
| | | Shares | | | Value ($) | |
| Mutual Funds 56.2% | | | | | | | | |
| | |
DWS Emerging Markets Fixed Income Fund “Institutional” (a) | | | 1,978,800 | | | | 17,037,469 | |
| | |
DWS Enhanced Commodity Strategy Fund “Institutional” (a) | | | 3,640,095 | | | | 34,471,696 | |
| | |
DWS Floating Rate Fund “Institutional” (a) | | | 3,762,828 | | | | 29,538,196 | |
| | |
DWS Global Infrastructure Fund “Institutional” (a) | | | 980,486 | | | | 12,746,320 | |
| | |
DWS Global Macro Fund “Institutional” (a) | | | 694,835 | | | | 6,302,154 | |
| | |
DWS Global Real Estate Securities Fund “Institutional” (a) | | | 1,629,076 | | | | 13,651,660 | |
| | |
DWS Real Estate Securities Fund “Institutional” (a) | | | 945,289 | | | | 17,837,606 | |
Total Mutual Funds (Cost $144,220,009) | | | | 131,585,101 | |
|
| Exchange-Traded Funds 28.2% | |
| | |
Invesco DB U.S. Dollar Index Bullish Fund | | | 97,613 | | | | 2,484,251 | |
| | |
iShares Global Infrastructure ETF | | | 369,135 | | | | 14,536,536 | |
| | |
iShares JP Morgan USD Emerging Markets Bond ETF | | | 51,200 | | | | 5,320,192 | |
| | | | | | | | |
| | | Shares | | | Value ($) | |
| | |
iShares U.S. Preferred Stock ETF | | | 317,840 | | | | 10,879,663 | |
| | |
SPDR Bloomberg Barclays Convertible Securities ETF | | | 701,340 | | | | 32,815,699 | |
Total Exchange-Traded Funds (Cost $71,044,980) | | | | 66,036,341 | |
|
| Cash Equivalents 15.4% | |
| | |
DWS Central Cash Management Government Fund, 2.41% (a) (b) | | | 17,736,862 | | | | 17,736,862 | |
| | |
DWS ESG Liquidity Fund “Institutional” (a) | | | 18,323,518 | | | | 18,321,686 | |
Total Cash Equivalents
(Cost $36,060,378) | | | | 36,058,548 | |
| | |
| | | % of Net
Assets | | | Value ($) | |
Total Investment Portfolio (Cost $251,325,367) | | | 99.8 | | | | 233,679,990 | |
| Other Assets and Liabilities, Net | | | 0.2 | | | | 410,460 | |
| Net Assets | | | 100.0 | | | | 234,090,450 | |
The Fund mainly invests in Underlying DWS Funds and Non-affiliated ETFs. The Underlying DWS Funds in which the Fund invests are considered to be affiliated investments.
|
| A summary of the Fund’s transactions with affiliated investments during the year ended December 31, 2018 are as follows: |
| | | | | | | | | | | | | | | | | | | | | | | | | | | | | | | | |
Value ($) at
12/31/2017 | | Purchases
Cost ($) | | | Sales
Proceeds ($) | | | Net
Realized
Gain/
(Loss) ($) | | | Net Change in
Unrealized
Appreciation
(Depreciation) ($) | | | Income ($) | | | Capital Gain
Distributions ($) | | | Number
of Shares
at
12/31/2018 | | | Value ($)
at
12/31/2018 | |
Mutual Funds 56.2% | | | | | | | | | | | | | |
DWS Emerging Markets Fixed Income Fund “Institutional” (a) | |
| 16,551,326 | | | 2,244,341 | | | | — | | | | — | | | | (1,758,198 | ) | | | 675,341 | | | | — | | | | 1,978,800 | | | | 17,037,469 | |
DWS Enhanced Commodity Strategy Fund “Institutional” (a) | |
| 25,128,692 | | | 17,512,515 | | | | — | | | | — | | | | (8,169,511 | ) | | | 3,751,715 | | | | — | | | | 3,640,095 | | | | 34,471,696 | |
DWS Floating Rate Fund “Institutional” (a) | |
| 13,334,203 | | | 17,640,183 | | | | — | | | | — | | | | (1,436,190 | ) | | | 1,007,083 | | | | — | | | | 3,762,828 | | | | 29,538,196 | |
DWS Global Infrastructure Fund “Institutional” (a) | |
| 20,825,265 | | | 1,044,820 | | | | 6,879,000 | | | | (79,375 | ) | | | (2,165,390 | ) | | | 331,420 | | | | — | | | | 980,486 | | | | 12,746,320 | |
DWS Global Macro Fund “Institutional” (a) | |
| — | | | 6,943,003 | | | | — | | | | — | | | | (640,849 | ) | | | 402,303 | | | | 119,430 | | | | 694,835 | | | | 6,302,154 | |
DWS Global Real Estate Securities Fund “Institutional” (a) | |
| 14,968,792 | | | 3,131,573 | | | | 3,088,000 | | | | (206,519 | ) | | | (1,154,186 | ) | | | 722,872 | | | | 48,627 | | | | 1,629,076 | | | | 13,651,660 | |
DWS Real Estate Securities Fund “Institutional” (a) | |
| 7,376,866 | | | 17,392,842 | | | | 5,701,100 | | | | (544,027 | ) | | | (686,975 | ) | | | 688,741 | | | | 323,079 | | | | 945,289 | | | | 17,837,606 | |
Cash Equivalents 15.4% | | | | | | | | | | | | | | | | | | | | | |
DWS Central Cash Management Government Fund 2.41% (a) (b) | |
| 12,941,460 | | | 101,616,053 | | | | 96,820,651 | | | | — | | | | — | | | | 219,363 | | | | — | | | | 17,736,862 | | | | 17,736,862 | |
DWS ESG Liquidity Fund “Institutional” (a) | | | | | |
| — | | | 18,323,516 | | | | — | | | | — | | | | (1,830 | ) | | | 62,093 | | | | — | | | | 18,323,518 | | | | 18,321,686 | |
| 111,126,604 | | | 185,848,846 | | | | 112,488,751 | | | | (829,921 | ) | | | (16,013,129 | ) | | | 7,860,931 | | | | 491,136 | | | | 49,691,789 | | | | 167,643,649 | |
| (a) | Affiliated fund managed by DWS Investment Management Americas Inc. |
| (b) | The rate shown is the annualized seven-day yield at period end. |
SPDR: Standard & Poor’s Depositary Receipt
The accompanying notes are an integral part of the financial statements.
| | | | | | |
| | 8 | | | | | | Deutsche DWS Variable Series II — DWS Alternative Asset Allocation VIP |
Fair Value Measurements
Various inputs are used in determining the value of the Fund’s investments. These inputs are summarized in three broad levels. Level 1 includes quoted prices in active markets for identical securities. Level 2 includes other significant observable inputs (including quoted prices for similar securities, interest rates, prepayment speeds and credit risk). Level 3 includes significant unobservable inputs (including the Fund’s own assumptions in determining the fair value of investments). The level assigned to the securities valuations may not be an indication of the risk or liquidity associated with investing in those securities.
The following is a summary of the inputs used as of December 31, 2018 in valuing the Fund’s investments. For information on the Fund’s policy regarding the valuation of investments, please refer to the Security Valuation section of Note A in the accompanying Notes to Financial Statements.
| | | | | | | | | | | | | | | | |
| Assets | | Level 1 | | | Level 2 | | | Level 3 | | | Total | |
| Mutual Funds | | $ | 131,585,101 | | | $ | — | | | $ | — | | | $ | 131,585,101 | |
| Exchange-Traded Funds | | | 66,036,341 | | | | — | | | | — | | | | 66,036,341 | |
| Short-Term Investments | | | 36,058,548 | | | | — | | | | — | | | | 36,058,548 | |
| Total | | $ | 233,679,990 | | | $ | — | | | $ | — | | | $ | 233,679,990 | |
The accompanying notes are an integral part of the financial statements.
| | | | |
Deutsche DWS Variable Series II — DWS Alternative Asset Allocation VIP | | | | | 9 |
Statement of Assets and Liabilities
| | | | |
| as of December 31, 2018 | | | | |
| |
| Assets | | | | |
| Investments in affiliated Underlying Funds, at value (cost $180,280,387) | | $ | 167,643,649 | |
| Investments innon-affiliated securities, at value (cost $71,044,980) | | | 66,036,341 | |
| Cash | | | 10,000 | |
| Receivable for Fund shares sold | | | 593,427 | |
| Dividends receivable | | | 34,977 | |
| Interest receivable | | | 26,391 | |
| Other assets | | | 4,768 | |
| Total assets | | | 234,349,553 | |
| |
| Liabilities | | | | |
| Payable for Fund shares redeemed | | | 76,422 | |
| Accrued Trustees’ fees | | | 5,249 | |
| Other accrued expenses and payables | | | 177,432 | |
| Total liabilities | | | 259,103 | |
| Net assets, at value | | $ | 234,090,450 | |
| |
| Net Assets Consist of | | | | |
| Distributable earnings (loss) | | | (21,221,438 | ) |
| Paid-in capital | | | 255,311,888 | |
| Net assets, at value | | $ | 234,090,450 | |
Class A | | | | |
| |
| Net Asset Value, offering and redemption price per share ($26,396,275 ÷ 2,180,831 outstanding shares of beneficial interest, no par value, unlimited number of shares authorized) | | $ | 12.10 | |
Class B | | | | |
| |
| Net Asset Value, offering and redemption price per share ($207,694,175 ÷ 17,175,164 outstanding shares of beneficial interest, no par value, unlimited number of shares authorized) | | $ | 12.09 | |
Statement of Operations
| | | | |
| for the year ended December 31, 2018 | | | | |
| |
| Investment Income | | | | |
| Income: | | | | |
| Income distributions from affiliated Underlying Funds | | $ | 7,860,931 | |
| Dividends | | | 2,931,443 | |
| Total income | | | 10,792,374 | |
| Expenses: | | | | |
| Management fee | | | 1,140,088 | |
| Administration fee | | | 205,334 | |
| Recordkeeping fees (Class B) | | | 165,837 | |
| Services to shareholders | | | 3,433 | |
| Distribution and service fees (Class B) | | | 445,558 | |
| Custodian fee | | | 7,299 | |
| Professional fees | | | 73,743 | |
| Reports to shareholders | | | 54,116 | |
| Registration fees | | | 20 | |
| Trustees’ fees and expenses | | | 14,184 | |
| Other | | | 6,574 | |
| Total expenses before expense reductions | | | 2,116,186 | |
| Expense reductions | | | (1,270,804 | ) |
| Total expenses after expense reductions | | | 845,382 | |
| Net investment income | | | 9,946,992 | |
| |
| Realized and Unrealized Gain (Loss) | | | | |
| Net realized gain (loss) from: | | | | |
| Sale of affiliated Underlying Funds | | | (829,921 | ) |
| Sale of non-affiliated Underlying Funds | | | (6,691,257 | ) |
| Capital gain distributions from affiliated Underlying Funds | | | 491,136 | |
| | | | (7,030,042 | ) |
| Change in net unrealized appreciation (depreciation) on: | | | | |
| Affiliated Underlying Funds | | | (16,013,129 | ) |
| Non-affiliated Underlying Funds | | | (7,305,480 | ) |
| | | | (23,318,609 | ) |
| Net gain (loss) | | | (30,348,651 | ) |
| Net increase (decrease) in net assets resulting from operations | | $ | (20,401,659 | ) |
The accompanying notes are an integral part of the financial statements.
| | | | | | |
| | 10 | | | | | | Deutsche DWS Variable Series II — DWS Alternative Asset Allocation VIP |
Statements of Changes in Net Assets
| | | | | | | | |
| | | Years Ended December 31, | |
| Increase (Decrease) in Net Assets | | 2018 | | | 2017 | |
| Operations: | | | | | | | | |
| Net investment income (loss) | | $ | 9,946,992 | | | $ | 3,728,776 | |
| Net realized gain (loss) | | | (7,030,042 | ) | | | (2,891,098 | ) |
| Change in net unrealized appreciation (depreciation) | | | (23,318,609 | ) | | | 10,090,153 | |
| Net increase (decrease) in net assets resulting from operations | | | (20,401,659 | ) | | | 10,927,831 | |
| Distributions to shareholders: | | | | | | | | |
Class A | | | (576,122 | ) | | | (586,944 | ) |
Class B | | | (3,035,192 | ) | | | (2,539,240 | ) |
| Total distributions | | | (3,611,314 | ) | | | (3,126,184 | )* |
| Fund share transactions: | | | | | | | | |
Class A | | | | | | | | |
| Proceeds from shares sold | | | 4,125,802 | | | | 4,259,606 | |
| Reinvestment of distributions | | | 576,122 | | | | 586,944 | |
| Payments for shares redeemed | | | (2,134,243 | ) | | | (3,329,766 | ) |
| Net increase (decrease) in net assets from Class A share transactions | | | 2,567,681 | | | | 1,516,784 | |
Class B | | | | | | | | |
| Proceeds from shares sold | | | 83,793,280 | | | | 53,356,061 | |
| Reinvestment of distributions | | | 3,035,192 | | | | 2,539,240 | |
| Payments for shares redeemed | | | (15,136,874 | ) | | | (12,561,333 | ) |
| Net increase (decrease) in net assets from Class B share transactions | | | 71,691,598 | | | | 43,333,968 | |
| Increase (decrease) in net assets | | | 50,246,306 | | | | 52,652,399 | |
| Net assets at beginning of period | | | 183,844,144 | | | | 131,191,745 | |
| | |
| Net assets at end of period | | $ | 234,090,450 | | | | 183,844,144 | ** |
| | |
| Other Information | | | | | | | | |
Class A | | | | | | | | |
| Shares outstanding at beginning of period | | | 1,982,448 | | | | 1,866,984 | |
| Shares sold | | | 319,659 | | | | 321,873 | |
| Shares issued to shareholders in reinvestment of distributions | | | 45,508 | | | | 45,046 | |
| Shares redeemed | | | (166,784 | ) | | | (251,455 | ) |
| Net increase (decrease) in Class A shares | | | 198,383 | | | | 115,464 | |
| | |
| Shares outstanding at end of period | | | 2,180,831 | | | | 1,982,448 | |
Class B | | | | | | | | |
| Shares outstanding at beginning of period | | | 11,540,895 | | | | 8,257,413 | |
| Shares sold | | | 6,569,707 | | | | 4,038,118 | |
| Shares issued to shareholders in reinvestment of distributions | | | 239,557 | | | | 194,727 | |
| Shares redeemed | | | (1,174,995 | ) | | | (949,363 | ) |
| Net increase (decrease) in Class B shares | | | 5,634,269 | | | | 3,283,482 | |
| | |
| Shares outstanding at end of period | | | 17,175,164 | | | | 11,540,895 | |
| * | Includes distributions from net investment income. |
| ** | Includes undistributed net investment income of $3,670,578. |
The accompanying notes are an integral part of the financial statements.
| | | | |
Deutsche DWS Variable Series II — DWS Alternative Asset Allocation VIP | | | | | 11 |
Financial Highlights
| | | | | | | | | | | | | | | | | | | | |
| | | Years Ended December 31, | |
| Class A | | 2018 | | | 2017 | | | 2016 | | | 2015 | | | 2014 | |
| | | | | |
| Selected Per Share Data | | | | | | | | | | | | | | | | | | | | |
| Net asset value, beginning of period | | $ | 13.61 | | | $ | 12.97 | | | $ | 12.60 | | | $ | 13.88 | | | $ | 13.75 | |
| Income (loss) from investment operations: | | | | | | | | | | | | | | | | | | | | |
Net investment incomea | | | .61 | | | | .33 | | | | .35 | | | | .29 | | | | .36 | |
Net realized and unrealized gain (loss) | | | (1.84 | ) | | | .62 | | | | .31 | | | | (1.13 | ) | | | .13 | |
Total from investment operations | | | (1.23 | ) | | | .95 | | | | .66 | | | | (.84 | ) | | | .49 | |
| Less distributions from: | | | | | | | | | | | | | | | | | | | | |
Net investment income | | | (.28 | ) | | | (.31 | ) | | | (.29 | ) | | | (.41 | ) | | | (.27 | ) |
Net realized gains | | | — | | | | — | | | | — | | | | (.03 | ) | | | (.09 | ) |
Total distributions | | | (.28 | ) | | | (.31 | ) | | | (.29 | ) | | | (.44 | ) | | | (.36 | ) |
| Net asset value, end of period | | $ | 12.10 | | | $ | 13.61 | | | $ | 12.97 | | | $ | 12.60 | | | $ | 13.88 | |
| Total Return (%)b,c | | | (9.14 | ) | | | 7.41 | | | | 5.30 | | | | (6.29 | ) | | | 3.50 | |
| | | | | |
| Ratios to Average Net Assets and Supplemental Data | | | | | | | | | | | | | | | | | | | | |
| Net assets, end of period ($ millions) | | | 26 | | | | 27 | | | | 24 | | | | 21 | | | | 20 | |
| Ratio of expenses before expense reductions (%)d,e | | | .73 | | | | .64 | | | | .56 | | | | .53 | | | | .56 | |
| Ratio of expenses after expense reductions (%)d,e | | | .16 | | | | .19 | | | | .27 | | | | .33 | | | | .32 | |
| Ratio of net investment income (%) | | | 4.78 | | | | 2.50 | | | | 2.70 | | | | 2.19 | | | | 2.54 | |
| Portfolio turnover rate (%) | | | 32 | | | | 55 | | | | 51 | | | | 21 | | | | 28 | |
| | | | | | | | | | | | | | | | | | | | |
| | | Years Ended December 31, | |
| Class B | | 2018 | | | 2017 | | | 2016 | | | 2015 | | | 2014 | |
| | | | | |
| Selected Per Share Data | | | | | | | | | | | | | | | | | | | | |
| Net asset value, beginning of period | | $ | 13.59 | | | $ | 12.96 | | | $ | 12.59 | | | $ | 13.87 | | | $ | 13.74 | |
| Income (loss) from investment operations: | | | | | | | | | | | | | | | | | | | | |
Net investment incomea | | | .62 | | | | .31 | | | | .31 | | | | .25 | | | | .31 | |
Net realized and unrealized gain (loss) | | | (1.88 | ) | | | .59 | | | | .31 | | | | (1.12 | ) | | | .14 | |
Total from investment operations | | | (1.26 | ) | | | .90 | | | | .62 | | | | (.87 | ) | | | .45 | |
| Less distributions from: | | | | | | | | | | | | | | | | | | | | |
Net investment income | | | (.24 | ) | | | (.27 | ) | | | (.25 | ) | | | (.38 | ) | | | (.23 | ) |
Net realized gains | | | — | | | | — | | | | — | | | | (.03 | ) | | | (.09 | ) |
Total distributions | | | (.24 | ) | | | (.27 | ) | | | (.25 | ) | | | (.41 | ) | | | (.32 | ) |
| Net asset value, end of period | | $ | 12.09 | | | $ | 13.59 | | | $ | 12.96 | | | $ | 12.59 | | | $ | 13.87 | |
| Total Return (%)b,c | | | (9.35 | ) | | | 7.01 | | | | 4.99 | | | | (6.54 | ) | | | 3.24 | |
| | | | | |
| Ratios to Average Net Assets and Supplemental Data | | | | | | | | | | | | | | | | | | | | |
| Net assets, end of period ($ millions) | | | 208 | | | | 157 | | | | 107 | | | | 88 | | | | 94 | |
| Ratio of expenses before expense reductions (%)d,e | | | 1.08 | | | | .93 | | | | .85 | | | | .83 | | | | .86 | |
| Ratio of expenses after expense reductions (%)d,e | | | .45 | | | | .48 | | | | .57 | | | | .62 | | | | .57 | |
| Ratio of net investment income (%) | | | 4.85 | | | | 2.31 | | | | 2.45 | | | | 1.84 | | | | 2.22 | |
| Portfolio turnover rate (%) | | | 32 | | | | 55 | | | | 51 | | | | 21 | | | | 28 | |
| a | Based on average shares outstanding during the period. |
| b | Total return would have been lower had certain expenses not been reduced. |
| c | Total return would have been lower if the Advisor had not reduced some Underlying DWS Funds’ expenses. |
| d | The Fund invests in other Funds and indirectly bears its proportionate share of fees and expenses incurred by the Underlying Funds in which the Fund is invested. This ratio does not include these indirect fees and expenses. |
| e | Expense ratio does not reflect charges and fees associated with the separate account that invests in the Fund or any variable life insurance policy or variable annuity contract for which the Fund is an investment option. |
The accompanying notes are an integral part of the financial statements.
| | | | | | |
| | 12 | | | | | | Deutsche DWS Variable Series II — DWS Alternative Asset Allocation VIP |
| | |
| Notes to Financial Statements | | |
A. Organization and Significant Accounting Policies
DWS Alternative Asset Allocation VIP (formerly Deutsche Alternative Asset Allocation VIP) (the “Fund”) is a diversified series of Deutsche DWS Variable Series II (formerly Deutsche Variable Series II) (the “Trust”), which is registered under the Investment Company Act of 1940, as amended (the “1940 Act”), as an open-end management investment company organized as a Massachusetts business trust. The Fund mainly invests in other affiliated DWS funds (i.e., mutual funds, exchange-traded funds and other pooled investment vehicles managed by DWS Investment Management Americas, Inc. or one of its affiliates, together the “Underlying DWS Funds”), non-affiliated exchange-traded funds (“Non-affiliated ETFs”), non-affiliated exchange-traded notes (“Non-affiliated ETNs”) and derivative investments. Non-affiliated ETFs, Non-affiliated ETNs and Underlying DWS Funds are collectively referred to as “Underlying Funds.” During the six months ended June 30, 2018, the Fund primarily invested in Underlying DWS Funds and non-affiliated ETFs. Each Underlying DWS Fund’s accounting policies and investment holdings are outlined in the Underlying DWS Funds’ financial statements and are available upon request.
Multiple Classes of Shares of Beneficial Interest. The Fund offers two classes of shares (Class A shares and Class B shares). Sales of Class B shares are subject to recordkeeping fees up to 0.15% and Rule 12b-1 fees under the 1940 Act equal to an annual rate of 0.25% of the average daily net assets of the Class B shares of the Fund. Class A shares are not subject to such fees.
Investment income, realized and unrealized gains and losses, and certain fund-level expenses and expense reductions, if any, are borne pro rata on the basis of relative net assets by the holders of all classes of shares except that each class bears certain expenses unique to that class (including the applicable Rule 12b-1 fee). Differences in class-level expenses may result in payment of different per share dividends by class. All shares have equal rights with respect to voting subject to class-specific arrangements.
The Fund’s financial statements are prepared in accordance with accounting principles generally accepted in the United States of America (“U.S. GAAP”) which require the use of management estimates. Actual results could differ from those estimates. The Fund qualifies as an investment company under Topic 946 of Accounting Standards Codification of U.S. GAAP. The policies described below are followed consistently by the Fund in the preparation of its financial statements.
In October 2018, the Securities and Exchange Commission adopted amendments to certain disclosure requirements in Securities Act Release No. 33-10532, Disclosure Update and Simplification, which is intended to facilitate the disclosure of information to investors and simplify compliance without significantly altering the total mix of information provided to investors. Effective with the current reporting period, the Fund adopted the amendments with the impacts being that the Fund is no longer required to present components of distributable earnings on the Statement of Assets and Liabilities or the sources of distributable earnings and the amount of undistributed net investment income on the Statements of Changes in Net Assets.
Security Valuation. Investments are stated at value determined as of the close of regular trading on the New York Stock Exchange on each day the exchange is open for trading.
Various inputs are used in determining the value of the Fund’s investments. These inputs are summarized in three broad levels. Level 1 includes quoted prices in active markets for identical securities. Level 2 includes other significant observable inputs (including quoted prices for similar securities, interest rates, prepayment speeds and credit risk). Level 3 includes significant unobservable inputs (including the Fund’s own assumptions in determining the fair value of investments). The level assigned to the securities valuations may not be an indication of the risk or liquidity associated with investing in those securities.
Investments in mutual funds are valued at the net asset value per share of each class of the Underlying DWS Funds and are categorized as Level 1.
ETFs and ETNs are valued at the most recent sale price or official closing price reported on the exchange (U.S. or foreign) or over-the-counter market on which they trade. ETFs and ETNs for which no sales are reported are valued at the calculated mean between the most recent bid and asked quotations on the relevant market or, if a mean cannot be determined, at the most recent bid quotation. ETFs and ETNs securities are generally categorized as Level 1.
Disclosure about the classification of fair value measurements is included in a table following the Fund’s Investment Portfolio.
| | | | |
Deutsche DWS Variable Series II — DWS Alternative Asset Allocation VIP | | | | | 13 |
Federal Income Taxes. The Fund’s policy is to comply with the requirements of the Internal Revenue Code, as amended, which are applicable to regulated investment companies and to distribute all of its taxable income to its shareholders.
At December 31, 2018, the Fund had approximately $10,101,000 of tax basis capital loss carryforwards, which may be applied against realized net taxable capital gains indefinitely, including short-term losses ($6,827,000) and long-term losses ($3,274,000).
The Fund has reviewed the tax positions for the open tax years as of December 31, 2018 and has determined that no provision for income tax and/or uncertain tax positions is required in the Fund’s financial statements. The Fund’s federal tax returns for the prior three fiscal years remain open subject to examination by the Internal Revenue Service.
Distribution of Income and Gains. Distributions from net investment income of the Fund, if any, are declared and distributed to shareholders annually. Net realized gains from investment transactions, in excess of available capital loss carryforwards, would be taxable to the Fund if not distributed and, therefore, will be distributed to shareholders at least annually. The Fund may also make additional distributions for tax purposes if necessary.
The timing and characterization of certain income and capital gain distributions are determined annually in accordance with federal tax regulations which may differ from accounting principles generally accepted in the United States of America. These differences primarily relate to certain securities sold at a loss and capital gain distributions from Underlying Funds. As a result, net investment income (loss) and net realized gain (loss) on investment transactions for a reporting period may differ significantly from distributions during such period. Accordingly, the Fund may periodically make reclassifications among certain of its capital accounts without impacting the net asset value of the Fund.
At December 31, 2018, the Fund’s components of distributable earnings on a tax basis were as follows:
| | | | |
| Undistributed ordinary income* | | $ | 10,093,696 | |
| Capital loss carryforward | | $ | (10,101,000 | ) |
| Unrealized appreciation (depreciation) on investments | | $ | (21,213,771 | ) |
At December 31, 2018, the aggregate cost of investments for federal income tax purposes was $254,893,761. The net unrealized depreciation for all investments based on tax cost was $21,213,771. This consisted of aggregate gross unrealized appreciation for all investments in which there was an excess of value over tax cost of $2,148,131 and aggregate gross unrealized depreciation for all investments in which there was an excess of tax cost over value of $23,361,902.
In addition, the tax character of distributions paid by the Fund is summarized as follows:
| | | | | | | | |
| | | Years Ended December 31, | |
| | | 2018 | | | 2017 | |
| Distributions from ordinary income* | | $ | 3,611,314 | | | $ | 3,126,184 | |
| * | For tax purposes, short-term capital gain distributions are considered ordinary income distributions. |
Expenses. Expenses of the Trust arising in connection with a specific fund are allocated to that fund. Other Trust expenses which cannot be directly attributed to a fund are apportioned among the funds in the Trust based upon the relative net assets or other appropriate measures.
Contingencies.In the normal course of business, the Fund may enter into contracts with service providers that contain general indemnification clauses. The Fund’s maximum exposure under these arrangements is unknown, as this would involve future claims that may be made against the Fund that have not yet been made. However, based on experience, the Fund expects the risk of loss to be remote.
Other.Investment transactions are accounted for on a trade date plus one basis for daily net asset value calculations. However, for financial reporting purposes, investment transactions are reported on trade date. Interest income is recorded on the accrual basis. Dividend Income is recorded on the ex-dividend date. Distributions of income and capital gains from the Underlying Funds are recorded on the ex-dividend date. Realized gains and losses from investment transactions are recorded on an identified cost basis.
B. Purchases and Sales of Securities
During the year ended December 31, 2018, purchases and sales of affiliated Underlying Funds (excluding short-term investments) aggregated $65,909,277 and $15,668,100, respectively. Purchases and sales of Non-affiliated ETFs aggregated $47,449,126 and $46,047,042, respectively.
| | | | | | |
| | 14 | | | | | | Deutsche DWS Variable Series II — DWS Alternative Asset Allocation VIP |
C. Related Parties
Management Agreement.Under the Investment Management Agreement with DWS Investment Management Americas, Inc. (formerly Deutsche Investment Management Americas Inc.) (“DIMA” or the “Advisor”), an indirect, wholly owned subsidiary of DWS Group GmbH & Co. KGaA (“DWS Group”), the Advisor directs the investments of the Fund in accordance with its investment objectives, policies and restrictions. The Advisor determines the securities, instruments and other contracts relating to investments in Underlying Funds to be purchased, sold or entered into by the Fund or delegates such responsibility to the Fund’s subadvisors.
RREEF America L.L.C. (“RREEF”), an indirect, wholly owned subsidiary of DWS Group, acts as an investment subadvisor to the Fund. As an investment subadvisor to the Fund, RREEF provides investment management services to the portions of the Fund’s portfolio allocated to direct investments in global real estate and global infrastructure securities. RREEF is paid by the Advisor for the services RREEF provides to the Fund. As of the date of this report, the Fund obtained its exposure to global real estate and global infrastructure securities indirectly through investments in other Underlying DWS Funds.
The Fund does not invest in the Underlying DWS Funds for the purpose of exercising management or control; however, investments within the set limits may represent 5% or more of an Underlying DWS Fund’s outstanding shares. At December 31, 2018, the Fund held approximately 25% of DWS Global Macro Fund, 23% of DWS Emerging Markets Fixed Income Fund and 11% of DWS Floating Rate Fund. Pursuant to the Investment Management Agreement with the Advisor, the Fund pays a monthly management fee based on the Fund’s average daily net assets, computed and accrued daily and payable monthly, at the following annual rates:
| | | | |
| On assets invested in other DWS Funds | | | .20 | % |
| On assets invested in all other assets not considered DWS Funds | | | 1.20 | % |
Accordingly, for the year ended December 31, 2018, the fee pursuant to the Investment Management Agreement was equivalent to an annual rate (exclusive of any applicable waivers/reimbursements) of 0.56% of the Fund’s average daily net assets.
In addition, the Advisor will receive management fees from managing the Underlying DWS Funds in which the Fund invests.
For the period from January 1, 2018 through April 30, 2019, the Advisor has contractually agreed to waive its fees and/or reimburse certain operating expenses to the extent necessary to maintain the total annual operating expenses (excluding certain expenses such as extraordinary expenses, taxes, brokerage, interest expense and Underlying Funds) of each class as follows:
| | | | |
| Class A | | | .23 | % |
| Class B | | | .53 | % |
In addition, the Advisor has contractually agreed to waive its fees and/or reimburse fund expenses for the period January 1, 2018 through September 30, 2019 to the extent necessary to maintain the fund’s total annual operating expenses (including indirect expenses of Underlying Funds and excluding certain expenses such as extraordinary expenses, taxes, brokerage and interest expenses) of each class as follows:
| | | | |
| Class A | | | .86 | % |
| Class B | | | 1.15 | % |
For the year ended December 31, 2018, the Advisor has voluntarily agreed to waive 0.15% of its management fee.
For the year ended December 31, 2018, fees waived and/or expenses reimbursed for each class are as follows:
| | | | |
| Class A | | $ | 154,900 | |
| Class B | | | 1,115,904 | |
| | | $ | 1,270,804 | |
The Fund indirectly bears its proportionate share of fees and expenses incurred by the Underlying Funds in which it is invested.
Administration Fee. Pursuant to an Administrative Services Agreement, DIMA provides most administrative services to the Fund. For all services provided under the Administrative Services Agreement, the Fund pays
| | | | |
Deutsche DWS Variable Series II — DWS Alternative Asset Allocation VIP | | | | | 15 |
DIMA an annual fee (“Administration Fee”) of 0.10% of the Fund’s average daily net assets, computed and accrued daily and payable monthly. For the year ended December 31, 2018, the Administration Fee was $205,334, of which $19,869 is unpaid.
Service Provider Fees. DWS Service Company (“DSC”), an affiliate of the Advisor, is the transfer agent, dividend-paying agent and shareholder service agent for the Fund. Pursuant to a sub-transfer agency agreement between DSC and DST Systems, Inc. (“DST”), DSC has delegated certain transfer agent, dividend-paying agent and shareholder service agent functions to DST. DSC compensates DST out of the shareholder servicing fee it receives from the Fund. For the year ended December 31, 2018, the amounts charged to the Fund by DSC were as follows:
| | | | | | | | |
| Services to Shareholders | | Total
Aggregated | | | Unpaid at
December 31, 2018 | |
| Class A | | $ | 128 | | | $ | 23 | |
| Class B | | | 250 | | | | 42 | |
| | | $ | 378 | | | $ | 65 | |
Distribution Service Agreement. Under the Fund’s Class B 12b-1 plan, DWS Distributors, Inc. (“DDI”) received a fee (“Distribution Service Fee”) of 0.25% of average daily net assets of Class B shares. For the year ended December 31, 2018, the Distribution Service Fee aggregated $445,558, of which $43,990 is unpaid.
Typesetting and Filing Service Fees. Under an agreement with the Fund, DIMA is compensated for providing certain pre-press and regulatory filing services to the Fund. For the year ended December 31, 2018, the amount charged to the Fund by DIMA included in the Statement of Operations under “Reports to shareholders” aggregated $14,716, of which $10,799 is unpaid.
Trustees’ Fees and Expenses. The Fund paid retainer fees to each Trustee not affiliated with the Advisor, plus specified amounts to the Board Chairperson and to each committee Chairperson.
Affiliated Cash Management Vehicles. The Fund may invest uninvested cash balances in DWS Central Cash Management Government Fund and DWS ESG Liquidity Fund, affiliated money market funds which are managed by the Advisor. Each affiliated money market fund is managed in accordance with Rule 2a-7 under the 1940 Act, which governs the quality, maturity, diversity and liquidity of instruments in which a money market fund may invest. DWS Central Cash Management Government Fund seeks to maintain a stable net asset value, and DWS ESG Liquidity Fund maintains a floating net asset value. The Fund indirectly bears its proportionate share of the expenses of each affiliated money market fund in which it invests. DWS Central Cash Management Government Fund does not pay the Advisor an investment management fee.
D. Ownership of the Fund
At December 31, 2018, two participating insurance company was the owner of record of 10% or more of the total outstanding Class A shares of the Fund, each owning 87% and 11%. Two participating insurance companies were the owner of record of 10% or more of the total outstanding Class B shares of the Fund, each owning 66% and 23%, respectively.
| | | | | | |
| | 16 | | | | | | Deutsche DWS Variable Series II — DWS Alternative Asset Allocation VIP |
Report of Independent Registered Public Accounting Firm
To the Board of Trustees of Deutsche DWS Variable Series II and Shareholders of DWS Alternative Asset Allocation VIP:
Opinion on the Financial Statements
We have audited the accompanying statement of assets and liabilities of DWS Alternative Asset Allocation VIP (formerly Deutsche Alternative Asset Allocation VIP) (the “Fund”) (one of the funds constituting Deutsche DWS Variable Series II (formerly Deutsche Variable Series II)) (the “Trust”), including the investment portfolio, as of December 31, 2018, and the related statement of operations for the year then ended, the statements of changes in net assets for each of the two years in the period then ended, the financial highlights for each of the five years in the period then ended and the related notes (collectively referred to as the “financial statements”). In our opinion, the financial statements present fairly, in all material respects, the financial position of the Fund (one of the funds constituting Deutsche DWS Variable Series II) at December 31, 2018, the results of its operations for the year then ended, the changes in its net assets for each of the two years in the period then ended and its financial highlights for each of the five years in the period then ended, in conformity with U.S. generally accepted accounting principles.
Basis for Opinion
These financial statements are the responsibility of the Trust’s management. Our responsibility is to express an opinion on the Fund’s financial statements based on our audits. We are a public accounting firm registered with the Public Company Accounting Oversight Board (United States) (“PCAOB”) and are required to be independent with respect to the Trust in accordance with the U.S. federal securities laws and the applicable rules and regulations of the Securities and Exchange Commission and the PCAOB.
We conducted our audits in accordance with the standards of the PCAOB. Those standards require that we plan and perform the audit to obtain reasonable assurance about whether the financial statements are free of material misstatement, whether due to error or fraud. The Trust is not required to have, nor were we engaged to perform, an audit of the Trust’s internal control over financial reporting. As part of our audits, we are required to obtain an understanding of internal control over financial reporting, but not for the purpose of expressing an opinion on the effectiveness of the Trust’s internal control over financial reporting. Accordingly, we express no such opinion.
Our audits included performing procedures to assess the risks of material misstatement of the financial statements, whether due to error or fraud, and performing procedures that respond to those risks. Such procedures included examining, on a test basis, evidence regarding the amounts and disclosures in the financial statements. Our procedures included confirmation of securities owned as of December 31, 2018, by correspondence with the custodian and brokers. Our audits also included evaluating the accounting principles used and significant estimates made by management, as well as evaluating the overall presentation of the financial statements. We believe that our audits provide a reasonable basis for our opinion.

We have served as the auditor of one or more investment companies in the DWS family of funds since at least 1979, but we are unable to determine the specific year.
Boston, Massachusetts
February 14, 2019
| | | | |
Deutsche DWS Variable Series II — DWS Alternative Asset Allocation VIP | | | | | 17 |
| | |
| Information About Your Fund’s Expenses | | (Unaudited) |
As an investor of the Fund, you incur two types of costs: ongoing expenses and transaction costs. Ongoing expenses include management fees, distribution and service (12b-1) fees and other Fund expenses. Examples of transaction costs include contract charges, which are not shown in this section. The following tables are intended to help you understand your ongoing expenses (in dollars) of investing in the Fund and to help you compare these expenses with the ongoing expenses of investing in other mutual funds. In addition to the ongoing expenses which the Fund bears directly, the Fund’s shareholders indirectly bear the expense of the Underlying Funds in which the Fund invests. These expenses are not included in the Fund’s annualized expense ratios used to calculate the expense estimate in the tables. In the most recent six-month period, the Fund limited the ongoing expenses the Fund bears directly; had it not done so, expenses would have been higher. The examples in the table are based on an investment of $1,000 invested at the beginning of the six-month period and held for the entire period (July 1, 2018 to December 31, 2018).
The tables illustrate your Fund’s expenses in two ways:
| – | | Actual Fund Return. This helps you estimate the actual dollar amount of ongoing expenses (but not transaction costs) paid on a $1,000 investment in the Fund using the Fund’s actual return during the period. To estimate the expenses you paid over the period, simply divide your account value by $1,000 (for example, an $8,600 account value divided by $1,000 = 8.6), then multiply the result by the number in the “Expenses Paid per $1,000” line under the share class you hold. |
| – | | Hypothetical 5% Fund Return. This helps you to compare your Fund’s ongoing expenses (but not transaction costs) with those of other mutual funds using the Fund’s actual expense ratio and a hypothetical rate of return of 5% per year before expenses. Examples using a 5% hypothetical Fund return may be found in the shareholder reports of other mutual funds. The hypothetical account values and expenses may not be used to estimate the actual ending account balance or expenses you paid for the period. |
Please note that the expenses shown in these tables are meant to highlight your ongoing expenses only and do not reflect any transaction costs. The “Expenses Paid per $1,000” line of the tables is useful in comparing ongoing expenses only and will not help you determine the relative total expense of owning different funds. If these transaction costs had been included, your costs would have been higher.
| | | | | | | | |
| Expenses and Value of a $1,000 Investment for the six months ended December 31, 2018 | |
| | |
| Actual Fund Return | | Class A | | | Class B | |
| Beginning Account Value 7/1/18 | | $ | 1,000.00 | | | $ | 1,000.00 | |
| Ending Account Value 12/31/18 | | $ | 945.30 | | | $ | 943.80 | |
| Expenses Paid per $1,000* | | $ | .83 | | | $ | 2.25 | |
| | |
| Hypothetical 5% Fund Return | | | Class A | | | | Class B | |
| Beginning Account Value 7/1/18 | | $ | 1,000.00 | | | $ | 1,000.00 | |
| Ending Account Value 12/31/18 | | $ | 1,024.35 | | | $ | 1,022.89 | |
| Expenses Paid per $1,000* | | $ | .87 | | | $ | 2.35 | |
| * | Expenses are equal to the Fund’s annualized expense ratio for each share class, multiplied by the average account value over the period, multiplied by 184 (the number of days in the most recent six-month period), then divided by 365. |
| | | | | | | | |
| Annualized Expense Ratios** | | Class A | | | Class B | |
| Deutsche DWS Variable Series II — DWS Alternative Asset Allocation VIP | | | .17 | % | | | .46 | % |
| ** | The Fund invests in other funds and indirectly bears its proportionate share of fees and expenses incurred by the Underlying Funds in which the Fund is invested. These ratios do not include these indirect fees and expenses. |
For more information, please refer to the Fund’s prospectus.
These tables do not reflect charges and fees (“contract charges”) associated with the separate account that invests in the Fund or any variable life insurance policy or variable annuity contract for which the Fund is an investment option.
For an analysis of the fees associated with an investment in the Fund or similar funds, please refer to the current and hypothetical expense calculators for Variable Insurance Products which can be found at dws.com/calculators.
| | | | | | |
| | 18 | | | | | | Deutsche DWS Variable Series II — DWS Alternative Asset Allocation VIP |
| | |
| Tax Information | | (Unaudited) |
Please consult a tax advisor if you have questions about federal or state income tax laws, or on how to prepare your tax returns. If you have specific questions about your account, please contact your insurance provider.
Proxy Voting
The Trust’s policies and procedures for voting proxies for portfolio securities and information about how the Trust voted proxies related to its portfolio securities during the most recent 12-month period ended June 30 are available on our Web site — dws.com/en-us/resources/proxy-voting — or on the SEC’s Web site — sec.gov. To obtain a written copy of the Trust’s policies and procedures without charge, upon request, call us toll free at (800) 728-3337.
| | | | |
Deutsche DWS Variable Series II — DWS Alternative Asset Allocation VIP | | | | | 19 |
Advisory Agreement Board Considerations and Fee Evaluation
The Board of Trustees (hereinafter referred to as the “Board” or “Trustees”) approved the renewal of DWS Alternative Asset Allocation VIP’s (the “Fund”) investment management agreement (the “Agreement”) with DWS Investment Management Americas, Inc. (“DIMA”) andsub-advisory agreement (the“Sub-Advisory Agreement” and together with the Agreement, the “Agreements”) between DIMA and RREEF America L.L.C. (“RREEF”), an affiliate of DIMA, in September 2018.
In terms of the process that the Board followed prior to approving the Agreements, shareholders should know that:
| – | | During the entire process, all of the Fund’s Trustees were independent of DIMA and its affiliates (the “Independent Trustees”). |
| – | | The Board met frequently during the past year to discuss fund matters and dedicated a substantial amount of time to contract review matters. Over the course of several months, the Board’s Contract Committee reviewed extensive materials received from DIMA, independent third parties and independent counsel. These materials included an analysis of the Fund’s performance, fees and expenses, and profitability from a fee consultant retained by the Fund’s Independent Trustees (the “Fee Consultant”). Based on its evaluation of the information provided, the Contract Committee presented its findings and recommendations to the Board. The Board then reviewed the Contract Committee’s findings and recommendations. |
| – | | The Board also received extensive information throughout the year regarding performance of the Fund. |
| – | | The Independent Trustees regularly met privately with counsel to discuss contract review and other matters. In addition, the Independent Trustees were advised by the Fee Consultant in the course of their review of the Fund’s contractual arrangements and considered a comprehensive report prepared by the Fee Consultant in connection with their deliberations. |
| – | | In connection with reviewing the Agreements, the Board also reviewed the terms of the Fund’sRule 12b-1 plan, distribution agreement, administrative services agreement, transfer agency agreement and other material service agreements. |
In connection with the contract review process, the Contract Committee and the Board considered the factors discussed below, among others. The Board also considered that DIMA has managed the Fund since its inception, and the Board believes that a long-term relationship with a capable, conscientious advisor is in the best interests of the Fund. The Board considered, generally, that shareholders chose to invest or remain invested in the Fund knowing that DIMA managed the Fund. DIMA and RREEF are part of DWS Group GmbH & Co. KGaA (“DWS Group”). DWS Group is a global asset management business that offers a wide range of investing expertise and resources, including research capabilities in many countries throughout the world. In 2018, approximately 20% of DWS Group’s shares were sold in an initial public offering, with Deutsche Bank AG owning the remaining shares.
As part of the contract review process, the Board carefully considered the fees and expenses of each DWS fund overseen by the Board in light of the fund’s performance. In many cases, this led to the negotiation and implementation of expense caps. As part of these negotiations, the Board indicated that it would consider relaxing these caps in future years following sustained improvements in performance, among other considerations.
While shareholders may focus primarily on fund performance and fees, the Fund’s Board considers these and many other factors, including the quality and integrity of DIMA’s and RREEF’s personnel and administrative support services provided by DIMA, such as back-office operations, fund valuations, and compliance policies and procedures.
Nature, Quality and Extent of Services.The Board considered the terms of the Agreements, including the scope of advisory services provided under the Agreements. The Board noted that, under the Agreements, DIMA and RREEF provide portfolio management services to the Fund and that, pursuant to a separate administrative services agreement, DIMA provides administrative services to the Fund. The Board considered the experience and skills of senior management and investment personnel and the resources made available to such personnel. Throughout the course of the year, the Board also received information regarding DIMA’s oversight of fundsub-advisers, including RREEF. The Board reviewed the Fund’s performance over short-term and long-term periods and compared those returns to various agreed-upon performance measures, including market index(es) and a peer universe compiled using information supplied by Morningstar Direct (“Morningstar”), an independent fund data service. The Board also noted that it has
| | | | | | |
| | 20 | | | | | | Deutsche DWS Variable Series II — DWS Alternative Asset Allocation VIP |
put into place a process of identifying “Funds in Review” (e.g., funds performing poorly relative to a peer universe), and receives additional reporting from DIMA regarding such funds and, where appropriate, DIMA’s plans to address underperformance. The Board believes this process is an effective manner of identifying and addressing underperforming funds. Based on the information provided, the Board noted that, for theone-, three- and five-year periods ended December 31, 2017, the Fund’s performance (Class A shares) was in the 1st quartile, 1st quartile and 2nd quartile, respectively, of the applicable Morningstar universe (the 1st quartile being the best performers and the 4th quartile being the worst performers). The Board also observed that the Fund has underperformed its benchmark in theone-, three- and five-year periods ended December 31, 2017.
Fees and Expenses. The Board considered the Fund’s investment management fee schedule,sub-advisory fee schedule, operating expenses and total expense ratios, and comparative information provided by Broadridge Financial Solutions, Inc. (“Broadridge”) and the Fee Consultant regarding investment management fee rates paid to other investment advisors by similar funds (1st quartile being the most favorable and 4th quartile being the least favorable). With respect to management fees paid to other investment advisors by similar funds, the Board noted that the contractual fee rates paid by the Fund, which include a 0.10% fee paid to DIMA under the Fund’s administrative services agreement, were higher than the median (3rd quartile) of the applicable Broadridge peer group (based on Broadridge data provided as of December 31, 2017). The Board noted that, since inception, DIMA has waived voluntarily a portion (0.15%) of the Fund’s management fee. With respect to anysub-advisory fee paid to RREEF, the Board noted that the fee is paid by DIMA out of its fee and not directly by the Fund. The Board noted the Fund’s total (net) operating expenses and noted that the expense limitations agreed to by DIMA were expected to help the Fund’s total (net) operating expenses remain competitive. The Board considered the Fund’s management fee rate as compared to fees charged by DIMA to comparable DWS U.S. registered funds (“DWS Funds”) and considered differences between the Fund and the comparable DWS Funds. The information requested by the Board as part of its review of fees and expenses also included information about institutional accounts (including anysub-advised funds and accounts) and funds offered primarily to European investors (“DWS Europe Funds”) managed by DWS Group. The Board noted that DIMA indicated that DWS Group does not manage any institutional accounts or DWS Europe Funds comparable to the Fund.
On the basis of the information provided, the Board concluded that management fees were reasonable and appropriate in light of the nature, quality and extent of services provided by DIMA and RREEF.
Profitability. The Board reviewed detailed information regarding revenues received by DIMA from advising the DWS Funds along with the estimated costs to DIMA, andpre-tax profits realized by DIMA, from advising the DWS Funds. The Board also received information regarding the estimated enterprise-wide profitability of DIMA and its affiliates with respect to all fund services in totality. The Board did not receive profitability information with respect to the Fund, but did receive such information with respect to the funds in which the Fund invests. The Board also reviewed certain publicly available information regarding the profitability of certain similar investment management firms. The Board noted that, while information regarding the profitability of such firms is limited (and in some cases is not necessarily prepared on a comparable basis), DIMA and its affiliates’ overall profitability with respect to the DWS Funds (after taking into account distribution and other services provided to the funds by DIMA and its affiliates) was lower than the overall profitability levels of most comparable firms for which such data was available.
Economies of Scale. The Board considered whether there are economies of scale with respect to the management of the Fund and whether the Fund benefits from any economies of scale. In this regard, the Board observed that while the Fund’s current investment management fee schedule does not include breakpoints, the Fund’s fee schedule represents an appropriate sharing between the Fund and DIMA of such economies of scale as may exist in the management of the Fund at current asset levels.
Other Benefits to DIMA and Its Affiliates. The Board also considered the character and amount of other incidental or“fall-out” benefits received by DIMA and its affiliates, including any fees received by DIMA for administrative services provided to the Fund, any fees received by an affiliate of DIMA for transfer agency services provided to the Fund and any fees received by an affiliate of DIMA for distribution services. The Board also considered benefits to DIMA related to brokerage and soft-dollar allocations, including allocating brokerage to pay for research generated by parties other than the executing broker dealers, which pertain primarily to funds investing in equity securities. In addition, the Board considered the incidental public relations benefits to DIMA related to DWS Funds advertising and cross-selling opportunities among DIMA products and services. The Board considered these benefits in reaching its conclusion that the Fund’s management fees were reasonable.
| | | | |
Deutsche DWS Variable Series II — DWS Alternative Asset Allocation VIP | | | | | 21 |
Compliance. The Board considered the significant attention and resources dedicated by DIMA to its compliance processes in recent years. The Board noted in particular (i) the experience, seniority and time commitment of the individuals serving as DIMA’s and the Fund’s chief compliance officers and (ii) the substantial commitment of resources by DIMA and its affiliates to compliance matters, including the retention of compliance personnel.
Based on all of the information considered and the conclusions reached, the Board unanimously determined that the continuation of the Agreements is in the best interests of the Fund. In making this determination, the Board did not give particular weight to any single factor identified above. The Board considered these factors over the course of numerous meetings, certain of which were in executive session with only the Independent Trustees and counsel present. It is possible that individual Independent Trustees may have weighed these factors differently in reaching their individual decisions to approve the continuation of the Agreements.
| | | | | | |
| | 22 | | | | | | Deutsche DWS Variable Series II — DWS Alternative Asset Allocation VIP |
Board Members and Officers
The following table presents certain information regarding the Board Members and Officers of the Fund. Each Board Member’s year of birth is set forth in parentheses after his or her name. Unless otherwise noted, (i) each Board Member has engaged in the principal occupation(s) noted in the table for at least the most recent five years, although not necessarily in the same capacity; and (ii) the address of each Independent Board Member is c/o Keith R. Fox, DWS Funds Board Chair, c/o Thomas R. Hiller, Ropes & Gray LLP, Prudential Tower, 800 Boylston Street, Boston, MA02199-3600. Except as otherwise noted below, the term of office for each Board Member is until the election and qualification of a successor, or until such Board Member sooner dies, resigns, is removed or as otherwise provided in the governing documents of the Fund. Because the Fund does not hold an annual meeting of shareholders, each Board Member will hold office for an indeterminate period. The Board Members may also serve in similar capacities with other funds in the fund complex.
| | | | | | | | |
| Independent Board Members | | | | | | |
Name, Year of Birth,
Position with the Fund and
Length of Time Served1 | | Business Experience and Directorships During the Past Five Years | | Number of
Funds in
DWS Fund
Complex
Overseen | | | Other
Directorships
Held by Board
Member
|
Keith R. Fox, CFA (1954) Chairperson since 2017, and Board Member since 1996 | | Managing General Partner, Exeter Capital Partners (a series of private investment funds) (since 1986). Directorships: Progressive International Corporation (kitchen goods importer and distributor); The Kennel Shop (retailer); former Chairman, National Association of Small Business Investment Companies; former Directorships: BoxTop Media Inc. (advertising); Sun Capital Advisers Trust (mutual funds) (2011–2012) | | | 82 | | | — |
John W. Ballantine (1946) Board Member since 1999 | | Retired; formerly, Executive Vice President and Chief Risk Management Officer, First Chicago NBD Corporation/The First National Bank of Chicago (1996–1998); Executive Vice President and Head of International Banking (1995–1996); former Directorships: Director and former Chairman of the Board, Healthways, Inc.2 (population well-being and wellness services) (2003–2014); Stockwell Capital Investments PLC (private equity); Enron Corporation; FNB Corporation; Tokheim Corporation; First Oak Brook Bancshares, Inc. and Oak Brook Bank; Prisma Energy International; Public Radio International. Not-for-Profit Director, Trustee: Palm Beach Civic Association; Window to the World Communications (public media); Harris Theater for Music and Dance (Chicago); Life Director of Hubbard Street Dance Chicago | | | 82 | | | Portland
General
Electric2
(utility
company)
(2003–
present) |
Henry P. Becton, Jr. (1943) Board Member since 1990 | | Vice Chair and former President, WGBH Educational Foundation. Directorships: Public Radio International; Public Radio Exchange (PRX); The Pew Charitable Trusts (charitable organization); Massachusetts Humane Society; Overseer of the New England Conservatory; former Directorships: Becton Dickinson and Company2 (medical technology company); Belo Corporation2 (media company); The PBS Foundation; Association of Public Television Stations; Boston Museum of Science; American Public Television; Concord Academy; New England Aquarium; Mass. Corporation for Educational Telecommunications; Committee for Economic Development; Public Broadcasting Service; Connecticut College; North Bennett Street School (Boston); American Documentary, Inc. (public media) | | | 82 | | | — |
Dawn-Marie Driscoll (1946) Board Member since 1987 | | Emeritus Executive Fellow, Center for Business Ethics, Bentley University; formerly: President, Driscoll Associates (consulting firm); Partner, Palmer & Dodge (law firm) (1988–1990); Vice President of Corporate Affairs and General Counsel, Filene’s (retail) (1978–1988). Directorships: Advisory Board, Center for Business Ethics, Bentley University; Trustee and former Chairman of the Board, Southwest Florida Community Foundation (charitable organization); former Directorships: ICI Mutual Insurance Company (2007–2015); Sun Capital Advisers Trust (mutual funds) (2007–2012), Investment Company Institute (audit, executive, nominating committees) and Independent Directors Council (governance, executive committees) | | | 82 | | | — |
Paul K. Freeman* (1950) Board Member since 1993 | | Consultant, WorldBank/Inter-American Development Bank; Independent Directors Council (former chair); Investment Company Institute (executive committee); Adjunct Professor, University of Denver Law School (2017–present); formerly: Chairman of Education Committee of Independent Directors Council; Project Leader, International Institute for Applied Systems Analysis (1998–2001); Chief Executive Officer, The Eric Group, Inc. (environmental insurance) (1986–1998); Directorships: Knoebel Institute for Healthy Aging, University of Denver (2017–present); former Directorships: Prisma Energy International; Denver Zoo Foundation (2012–2018) | | | 82 | | | — |
| | | | |
Deutsche DWS Variable Series II — DWS Alternative Asset Allocation VIP | | | | | 23 |
| | | | | | | | |
Name, Year of Birth,
Position with the Fund and
Length of Time Served1 | | Business Experience and Directorships During the Past Five Years | | Number of
Funds in
DWS Fund
Complex
Overseen | | | Other
Directorships
Held by Board
Member
|
Richard J. Herring (1946) Board Member since 1990 | | Jacob Safra Professor of International Banking and Professor of Finance, The Wharton School, University of Pennsylvania (since July 1972); Director, The Wharton Financial Institutions Center (since 1994); formerly: Vice Dean and Director, Wharton Undergraduate Division (1995–2000) and Director, The Lauder Institute of International Management Studies (2000–2006); Member FDIC Systemic Risk Advisory Committee since 2011, member Systemic Risk Council since 2012 and member of the Advisory Board at the Yale Program on Financial Stability since 2013; Formerly Co-Chair of the Shadow Financial Regulatory Committee (2003–2015), Executive Director of The Financial Economists Roundtable (2008–2015), Director of The Thai Capital Fund (2007–2013), Director of The Aberdeen Singapore Fund (2007–2018), and Nonexecutive Director of Barclays Bank DE (2010–2018) | | | 82 | | | Director,
Aberdeen
Japan Fund
(since 2007) |
William McClayton (1944) Board Member since 2004 | | Private equity investor (since October 2009); previously, Managing Director, Diamond Management & Technology Consultants, Inc. (global consulting firm) (2001–2009); Directorship: Board of Managers, YMCA of Metropolitan Chicago; formerly: Senior Partner, Arthur Andersen LLP (accounting) (1966–2001); Trustee, Ravinia Festival | | | 82 | | | — |
Rebecca W. Rimel (1951) Board Member since 1995 | | President, Chief Executive Officer and Director, The Pew Charitable Trusts (charitable organization) (1994–present); formerly: Executive Vice President, The Glenmede Trust Company (investment trust and wealth management) (1983–2004); Board Member, Investor Education (charitable organization) (2004–2005); Trustee, Executive Committee, Philadelphia Chamber of Commerce (2001–2007); Director, Viasys Health Care2 (January 2007–June 2007); Trustee, Thomas Jefferson Foundation (charitable organization) (1994–2012) | | | 82 | | | Director,
Becton
Dickinson
and
Company2
(medical
technology
company)
(2012–
present);
Director,
BioTelemetry
Inc.2(health
care) (2009–
present) |
William N. Searcy, Jr. (1946) Board Member since 1993 | | Private investor since October 2003; formerly: Pension & Savings Trust Officer, Sprint Corporation2(telecommunications) (November 1989–September 2003); Trustee, Sun Capital Advisers Trust (mutual funds) (1998–2012) | | | 82 | | | — |
Jean Gleason Stromberg (1943) Board Member since 1997 | | Retired. Formerly, Consultant (1997–2001); Director, Financial Markets U.S. Government Accountability Office (1996–1997); Partner, Norton Rose Fulbright, L.L.P. (law firm) (1978–1996); former Directorships: The William and Flora Hewlett Foundation (charitable organization) (2000–2015); Service Source, Inc. (nonprofit), Mutual Fund Directors Forum (2002–2004), American Bar Retirement Association (funding vehicle for retirement plans) (1987–1990 and 1994–1996) | | | 82 | | | — |
| | |
| Officers4 | | |
Name, Year of Birth, Position with the Fund and Length of Time Served5 | | Business Experience and Directorships During the Past Five Years |
Hepsen Uzcan6 (1974) President and Chief Executive Officer, 2017–present Assistant Secretary, 2013–present | | Managing Director,3 DWS; Secretary, DWS USA Corporation (since March 2018); Assistant Secretary, DWS Distributors, Inc. (since June 25, 2018); Director and Vice President, DWS Service Company (since June 25, 2018); Assistant Secretary, DWS Investment Management Americas, Inc. (since June 25, 2018); and Director and President, DB Investment Managers, Inc. (since June 25, 2018); formerly: Vice President for the Deutsche funds (2016–2017) |
John Millette8(1962) Vice President and Secretary, 1999–present | | Director,3DWS; Chief Legal Officer, DWS Investment Management Americas, Inc. (2015–present); and Director and Vice President, DWS Trust Company (2016–present); formerly: Secretary, Deutsche Investment Management Americas Inc. (2015–2017) |
Diane Kenneally8,9 (1966) Treasurer and Chief Financial Officer since 2018 | | Director,3 DWS; formerly: Assistant Treasurer for the DWS funds (2007–2018) |
Caroline Pearson8(1962) Chief Legal Officer, 2010–present | | Managing Director,3DWS; formerly: Secretary, Deutsche AM Distributors, Inc. (2002–2017); and Secretary, Deutsche AM Service Company (2010–2017) |
| | | | | | |
| | 24 | | | | | | Deutsche DWS Variable Series II — DWS Alternative Asset Allocation VIP |
| | |
Name, Year of Birth, Position with the Fund and Length of Time Served5 | | Business Experience and Directorships During the Past Five Years |
Scott D. Hogan8(1970) Chief Compliance Officer, 2016–present | | Director,3DWS |
Wayne Salit7(1967) Anti-Money Laundering Compliance Officer, 2014–present | | Director,3 Deutsche Bank; and AML Officer, DWS Trust Company; formerly: Managing Director, AML Compliance Officer at BNY Mellon (2011–2014); and Director, AML Compliance Officer at Deutsche Bank (2004–2011) |
Sheila Cadogan8(1966) Assistant Treasurer, 2017–present | | Director,3DWS; Director and Vice President, DWS Trust Company (since 2018) |
Paul Antosca8(1957) Assistant Treasurer, 2007–present | | Director,3DWS |
| 1 | The length of time served represents the year in which the Board Member joined the board of one or more DWS funds currently overseen by the Board. |
| 2 | A publicly held company with securities registered pursuant to Section 12 of the Securities Exchange Act of 1934. |
| 3 | Executive title, not a board directorship. |
| 4 | As a result of their respective positions held with the Advisor or its affiliates, these individuals are considered “interested persons” of the Advisor within the meaning of the 1940 Act. Interested persons receive no compensation from the Fund. |
| 5 | The length of time served represents the year in which the officer was first elected in such capacity for one or more DWS funds. |
| 6 | Address: 345 Park Avenue, New York, NY 10154. |
| 7 | Address: 60 Wall Street, New York, NY 10005. |
| 8 | Address: One International Place, Boston, MA 02110. |
| 9 | Appointed Treasurer and Chief Financial Officer effective July 2, 2018. |
| * | Paul K. Freeman retired from the Board effective December 31, 2018. |
The Fund’s Statement of Additional Information (“SAI”) includes additional information about the Board Members. The SAI is available, without charge, upon request. If you would like to request a copy of the SAI, you may do so by calling the followingtoll-free number:(800) 728-3337.
| | | | |
Deutsche DWS Variable Series II — DWS Alternative Asset Allocation VIP | | | | | 25 |
Notes
Notes
| | |
| | |
VS2AAA-2 (R-025824-8 2/19) | | |
December 31, 2018
Annual Report
Deutsche DWS Variable Series II
(formerly Deutsche Variable Series II)
DWS CROCI® U.S. VIP
(formerly Deutsche CROCI® U.S. VIP)
Beginning on January 1, 2021, as permitted by regulations adopted by the Securities and Exchange Commission, you may not be receiving paper copies of the Fund’s shareholder reports from the insurance company that offers your contract unless you specifically request paper copies from your insurance company or from your financial intermediary. Instead, the shareholder reports will be made available on a Web site, and your insurance company will notify you by mail each time a report is posted and provide you with a Web site link to access the report. Instructions for requesting paper copies will be provided by your insurance company.
If you already elected to receive shareholder reports electronically, you will not be affected by this change and you need not take any action. You may elect to receive shareholder reports and other communications from your insurance company electronically by following the instructions provided by your insurance company.
You may elect to receive all future reports in paper free of charge from your insurance company. If your insurance company informs you that future reports will be delivered via Web access, you can inform your insurance company that you wish to continue receiving paper copies of your shareholder reports by following the instructions provided by your insurance company.

Contents
This report must be preceded or accompanied by a prospectus. To obtain an additional prospectus or summary prospectus, if available, call (800)728-3337 or your financial representative. We advise you to consider the Fund’s objectives, risks, charges and expenses carefully before investing. The summary prospectus and prospectus contain this and other important information about the Fund. Please read the prospectus carefully before you invest.
The Fund will be managed using the CROCI® Investment Process which is based on portfolio management’s belief that, over time, stocks which display more favorable financial metrics (for example, the CROCI® Economic P/E Ratio) as generated by this process may outperform stocks which display less favorable metrics. This premise may not prove to be correct and prospective investors should evaluate this assumption prior to investing in the Fund. Stocks may decline in value. The Fund may lend securities to approved institutions. Please read the prospectus for details.
The brand DWS represents DWS Group GmbH & Co. KGaA and any of its subsidiaries such as DWS Distributors, Inc. which offers investment products or DWS Investment Management Americas, Inc. and RREEF America L.L.C. which offer advisory services.
DWS Distributors, Inc., 222 South Riverside Plaza, Chicago, IL 60606, (800)621-1148
NOT FDIC/NCUA INSURED NO BANK GUARANTEE MAY LOSE VALUE NOT A DEPOSIT NOT INSURED BY ANY FEDERAL GOVERNMENT AGENCY
| | | | | | |
| | 2 | | | | | | Deutsche DWS Variable Series II — DWS CROCI® U.S. VIP |
| | |
| Performance Summary | | December 31, 2018 (Unaudited) |
Fund performance shown is historical, assumes reinvestment of all dividend and capital gain distributions and does not guarantee future results. Investment return and principal value fluctuate with changing market conditions so that, when redeemed, shares may be worth more or less than their original cost. Current performance may be lower or higher than the performance data quoted. Please contact your participating insurance company for the Fund’s most recentmonth-end performance. Performance does not reflect charges and fees (“contract charges”) associated with the separate account that invests in the Fund or any variable life insurance policy or variable annuity contract for which the Fund is an investment option. These charges and fees will reduce returns. While all share classes have the same underlying portfolio, their performance will differ.
The gross expense ratios of the Fund, as stated in the fee table of the prospectus dated May 1, 2018 are 0.82% and 1.15% for Class A and Class B shares, respectively, and may differ from the expense ratios disclosed in the Financial Highlights tables in this report.
Generally accepted accounting principles require adjustments to be made to the net assets of the Fund at period end for financial reporting purposes only, and as such, the total return based on the unadjusted net asset value per share may differ from the total return reported in the financial highlights.
Growth of an Assumed $10,000 Investment in DWS CROCI® U.S. VIP
| | |
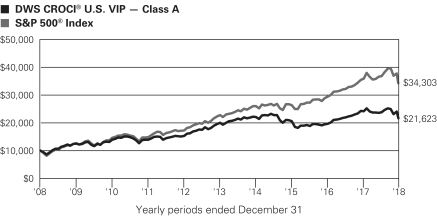 | | The Standard & Poor’s 500 (S&P 500) Index is an unmanaged,capitalization-weighted index of 500 stocks. The index is designed to measure performance of the broad domestic economy through changes in the aggregate market value of 500 stocks representing all major industries. Index returns do not reflect any fees or expenses and it is not possible to invest directly into an index. Prior to October 3, 2016, the Fund had a team that operated with a different investment strategy. Performance would have been different if the Fund’s current strategy had been in effect. |
| | | | | | | | | | |
| Comparative Results | | | | | | | | | | |
| | | | | |
| DWS CROCI® U.S. VIP | | | | 1-Year | | 3-Year | | 5-Year | | 10-Year |
| Class A | | Growth of $10,000 | | $8,950 | | $10,516 | | $10,843 | | $21,623 |
| | | Average annual total return | | –10.50% | | 1.69% | | 1.63% | | 8.02% |
| S&P 500® Index | | Growth of $10,000 | | $9,562 | | $13,042 | | $15,033 | | $34,303 |
| | Average annual total return | | –4.38% | | 9.26% | | 8.49% | | 13.12% |
| | | | | |
| DWS CROCI® U.S. VIP | | | | 1-Year | | 3-Year | | 5-Year | | 10-Year |
| Class B | | Growth of $10,000 | | $8,929 | | $10,429 | | $10,684 | | $20,988 |
| | | Average annual total return | | –10.71% | | 1.41% | | 1.33% | | 7.70% |
| S&P 500® Index | | Growth of $10,000 | | $9,562 | | $13,042 | | $15,033 | | $34,303 |
| | Average annual total return | | –4.38% | | 9.26% | | 8.49% | | 13.12% |
The growth of $10,000 is cumulative.
| | | | |
Deutsche DWS Variable Series II — DWS CROCI® U.S. VIP | | | | | 3 |
| | |
| Management Summary | | December 31, 2018 (Unaudited) |
The Fund returned –10.50% (Class A shares, unadjusted for contract charges) in 2018 and underperformed the –4.38% return for its benchmark, the S&P 500 Index.All of the downturn in the broader U.S. equity market occurred in the fourth calendar quarter. Prior to this time, stocks were buoyed by the combination of robust economic conditions and rising corporate earnings in the United States. Late in the year, however, investors’ appetite for risk evaporated amid questions about the outlook for global growth, interest rates, and U.S. trade policy. The index declined 13.52% in the fourth quarter, leading to a negative return for the full year.
The majority of the Fund’s underperformance occurred prior to the end of September. During this time, investors maintained a strong preference for faster-growing companies — particularlymega-cap technology stocks — while showing less interest in those with lower valuations and higher dividends. This trend resulted in a wide gap in the returns of the growth and value categories. In this environment, our value approach put the Fund out of step with broader market trends and was the primary factor causing underperformance. Our emphasis on lower-volatility stocks also detracted at a time in which higher-beta, momentum-driven equities generally outperformed. Once the market backdrop grew less favorable in the fourth quarter, the outperformance of growth stocks and the momentum style started to wane and value-oriented, lower-beta stocks began to experience better relative performance. While this shift worked to the Fund’s advantage, it did not help it to overcome the earlier shortfall.
The Fund’s performance was aided by our stock selection in the industrials sector, but the benefit was offset by weaker results in consumer discretionary, information technology, and financials. In the consumer discretionary sector, American Axle & Manufacturing Holdings, Inc.* — which declined due to broader weakness among auto-related companies — was a key detractor. The construction-supply company Mohawk Industries, Inc.,* which came under pressure from worries that rising interest rates would stem demand among homebuyers, was another key detractor. The Fund’s underperformance in technology largely stemmed from positions in Micron Technology, Inc. and Cognizant Technology Solutions Corp. Micron slid due to the prospect of a slowdown in the semiconductor industry as a whole, while Cognizant lagged due to disappointing revenues and concerns regarding its growth outlook. Financials proved to be a challenging area for the Fund, as well. Our holdings posted a negative return in the aggregate, with the largest effects coming from Synchrony Financial, Citigroup Inc. and Capital One Financial Corp.
On the positive side, our favorable showing in industrials was the result of a zero weighting in General Electric Co. — a large sector component whose shares plunged during the period — as well as investments in several stocks that outperformed and that we sold prior to the market downturn. Among these were Southwest Airlines Co.,* Raytheon Co.,* and Lockheed Martin Corp.* Outside of industrials, the pharmaceutical giant Merck & Co., Inc. was the largest contributor. The stock finished the year with a gain and strongly outpaced its sector peers due to its success with its cancer drug Keytruda, as well as its increased dividend and potential for expanding operating margins.
We are disappointed in the Fund’s results, but we are also remaining true to our value discipline. Value stocks underperformed growth by a wide margin in the time since April 2015, when the Fund began to use the CROCI® strategy, through September of this year. Although growth remained persistently in favor, it’s important to remember that the two styles tend to alternate leadership over time — as evidenced by the relative strength in value during the final three months of the year. We believe our CROCI® investment process, through its disciplined approach and emphasis on higher-quality stocks with attractive valuations, is well positioned to benefit if the relative performance of the value style continues to improve.
Di Kumble, CFA, Managing Director
John Moody, Vice President
Portfolio Managers
The views expressed reflect those of the portfolio management team only through the end of the period of the report as stated on the cover. The management team’s views are subject to change at any time based on market and other conditions and should not be construed as a recommendation. Past performance is no guarantee of future results. Current and future portfolio holdings are subject to risk.
| | | | | | |
| | 4 | | | | | | Deutsche DWS Variable Series II — DWS CROCI® U.S. VIP |
Terms to Know
TheStandard & Poor’s 500 (S&P 500) Index is an unmanaged, capitalization-weighted index of 500 stocks. The index is designed to measure performance of the broad domestic economy through changes in the aggregate market value of 500 stocks representing all major industries. Index returns do not reflect fees or expenses and it is not possible to invest directly into an index.
Contribution anddetraction incorporate both a stock’s total return and its weighting in the index.
Overweight means the Fund holds a higher weighting in a given sector or security than the benchmark.Underweight means the Fund holds a lower weighting.
| * | Not held in the portfolio as of December 31, 2018. |
| | | | |
Deutsche DWS Variable Series II — DWS CROCI® U.S. VIP | | | | | 5 |
| | |
| Portfolio Summary | | (Unaudited) |
| | | | | | | | |
| Asset Allocation (As a % of Investment Portfolio) | | 12/31/18 | | | 12/31/17 | |
| Common Stocks | | | 97% | | | | 99% | |
| Cash Equivalent | | | 3% | | | | 1% | |
| | | | 100% | | | | 100% | |
| | |
Sector Diversification (As a % of Investment Portfolio excluding Cash Equivalents) | | 12/31/18 | | | 12/31/17 | |
| Financials | | | 27% | | | | 18% | |
Information Technology | | | 21% | | | | 8% | |
| Health Care | | | 16% | | | | 15% | |
| Industrials | | | 11% | | | | 15% | |
Materials | | | 10% | | | | 5% | |
| Consumer Discretionary | | | 8% | | | | 7% | |
| Consumer Staples | | | 5% | | | | 10% | |
Utilities | | | 2% | | | | 14% | |
| Communication Services | | | — | | | | 8% | |
| | | | 100% | | | | 100% | |
Portfolio holdings and characteristics are subject to change.
For more complete details about the Fund’s investment portfolio, see page 7.
Following the Fund’s fiscal first and thirdquarter-end, a complete portfolio holdings listing is filed with the SEC on FormN-Q or Form N-PORT (available for filings after March 31, 2019). The Fund’s Form N-Q or Form N-PORT will be available on the SEC’s Web site at sec.gov. The Fund’s portfolio holdings are also posted on dws.com from time to time. Please see the Fund’s current prospectus for more information.
| | | | | | |
| | 6 | | | | | | Deutsche DWS Variable Series II — DWS CROCI® U.S. VIP |
| | |
| Investment Portfolio | | December 31, 2018 |
| | | | | | | | |
| | | Shares | | | Value ($) | |
| Common Stocks 97.2% | | | | | | | | |
| Consumer Discretionary 7.7% | |
Auto Components 2.4% | | | | | | | | |
BorgWarner, Inc. | | | 87,697 | | | | 3,046,593 | |
| | |
Household Durables 5.3% | | | | | | | | |
| | |
D.R. Horton, Inc. | | | 98,439 | | | | 3,411,896 | |
| | |
Garmin Ltd. | | | 53,669 | | | | 3,398,321 | |
| | | | | | | | |
| | | | | | | 6,810,217 | |
| | |
| Consumer Staples 4.9% | | | | | | | | |
Beverages 2.5% | | | | | | | | |
Coca-Cola Co. | | | 68,688 | | | | 3,252,377 | |
| | |
Food Products 2.4% | | | | | | | | |
Tyson Foods, Inc. “A” | | | 57,317 | | | | 3,060,728 | |
| | |
| Financials 26.1% | | | | | | | | |
Banks 11.5% | | | | | | | | |
| | |
Bank of America Corp. | | | 126,310 | | | | 3,112,278 | |
| | |
Citigroup, Inc. | | | 54,923 | | | | 2,859,291 | |
| | |
JPMorgan Chase & Co. | | | 31,671 | | | | 3,091,723 | |
| | |
SunTrust Banks, Inc. | �� | | 55,500 | | | | 2,799,420 | |
| | |
U.S. Bancorp. | | | 63,081 | | | | 2,882,802 | |
| | | | | | | | |
| | | | | | | 14,745,514 | |
| | |
Capital Markets 5.0% | | | | | | | | |
| | |
Bank of New York Mellon Corp. | | | 69,861 | | | | 3,288,357 | |
| | |
State Street Corp. | | | 49,191 | | | | 3,102,477 | |
| | | | | | | | |
| | | | | | | 6,390,834 | |
| | |
Consumer Finance 9.6% | | | | | | | | |
| | |
American Express Co. | | | 32,352 | | | | 3,083,793 | |
| | |
Capital One Financial Corp. | | | 39,837 | | | | 3,011,279 | |
| | |
Discover Financial Services | | | 50,147 | | | | 2,957,670 | |
| | |
Synchrony Financial | | | 135,155 | | | | 3,170,736 | |
| | | | | | | | |
| | | | | | | 12,223,478 | |
| | |
| Health Care 15.4% | | | | | | | | |
Biotechnology 7.7% | | | | | | | | |
| | |
Amgen, Inc. | | | 17,623 | | | | 3,430,669 | |
| | |
Celgene Corp.* | | | 50,616 | | | | 3,243,980 | |
| | |
Gilead Sciences, Inc. | | | 50,546 | | | | 3,161,652 | |
| | | | | | | | |
| | | | | | | 9,836,301 | |
| | |
Pharmaceuticals 7.7% | | | | | | | | |
| | |
Bristol-Myers Squibb Co. | | | 64,540 | | | | 3,354,789 | |
| | |
Johnson & Johnson | | | 23,252 | | | | 3,000,671 | |
| | |
Merck & Co., Inc. | | | 45,135 | | | | 3,448,765 | |
| | | | | | | | |
| | | | | | | 9,804,225 | |
Industrials 10.7% | | | | | | | | |
Aerospace & Defense 0.8% | | | | | | | | |
United Technologies Corp. | | | 9,963 | | | | 1,060,860 | |
| | |
Electrical Equipment 2.5% | | | | | | | | |
Eaton Corp. PLC | | | 46,995 | | | | 3,226,677 | |
| | |
Machinery 5.1% | | | | | | | | |
| | |
Cummins, Inc. | | | 23,861 | | | | 3,188,784 | |
| | |
PACCAR, Inc. | | | 57,375 | | | | 3,278,408 | |
| | | | | | | | |
| | | | | | | 6,467,192 | |
| | | | | | | | |
| | | Shares | | | Value ($) | |
| | |
Professional Services 2.3% | | | | | | | | |
ManpowerGroup, Inc. | | | 44,074 | | | | 2,855,995 | |
| Information Technology 20.3% | |
Electronic Equipment, Instruments & Components 2.7% | |
TE Connectivity Ltd. | | | 46,391 | | | | 3,508,551 | |
| | |
IT Services 7.5% | | | | | | | | |
| | |
Amdocs Ltd. | | | 52,721 | | | | 3,088,396 | |
| | |
Cognizant Technology Solutions Corp. “A” | | | 50,302 | | | | 3,193,171 | |
| | |
International Business Machines Corp. | | | 29,059 | | | | 3,303,137 | |
| | | | | | | | |
| | | | | | | 9,584,704 | |
|
Semiconductors & Semiconductor Equipment 10.1% | |
| | |
Applied Materials, Inc. | | | 98,326 | | | | 3,219,193 | |
| | |
Lam Research Corp. | | | 24,046 | | | | 3,274,344 | |
| | |
Micron Technology, Inc.* | | | 95,747 | | | | 3,038,052 | |
| | |
Skyworks Solutions, Inc. | | | 49,518 | | | | 3,318,697 | |
| | | | | | | | |
| | | | | | | 12,850,286 | |
| | |
| Materials 9.4% | | | | | | | | |
Chemicals 4.9% | | | | | | | | |
| | |
Eastman Chemical Co. | | | 43,024 | | | | 3,145,485 | |
| | |
LyondellBasell Industries NV “A” | | | 37,377 | | | | 3,108,271 | |
| | | | | | | | |
| | | | | | | 6,253,756 | |
| | |
Containers & Packaging 2.2% | | | | | | | | |
WestRock Co. | | | 74,746 | | | | 2,822,409 | |
| | |
Metals & Mining 2.3% | | | | | | | | |
Nucor Corp. | | | 56,636 | | | | 2,934,311 | |
| | |
| Utilities 2.7% | | | | | | | | |
Electric Utilities | | | | | | | | |
Exelon Corp. | | | 75,304 | | | | 3,396,210 | |
Total Common Stocks(Cost $142,204,335) | | | | 124,131,218 | |
| | |
| Cash Equivalent 2.8% | | | | | | | | |
DWS Central Cash Management Government Fund, 2.41% (a)
(Cost $3,576,006) | | | 3,576,006 | | | | 3,576,006 | |
| | |
| | | % of Net
Assets | | | Value ($) | |
Total Investment Portfolio (Cost $145,780,341) | | | 100.0 | | | | 127,707,224 | |
| Other Assets and Liabilities, Net | | | 0.0 | | | | 48,696 | |
| Net Assets | | | 100.0 | | | | 127,755,920 | |
The accompanying notes are an integral part of the financial statements.
| | | | |
Deutsche DWS Variable Series II — DWS CROCI® U.S. VIP | | | | | 7 |
A summary of the Fund’s transactions with affiliated investments during the year ended December 31, 2018 are as follows:
| | | | | | | | | | | | | | | | | | | | | | | | | | | | | | | | |
Value ($) at
12/31/2017 | | Purchases
Cost ($) | | | Sales
Proceeds ($) | | | Net
Realized
Gain/
(Loss) ($) | | | Net Change in
Unrealized
Appreciation
(Depreciation) ($) | | | Income ($) | | | Capital Gain
Distributions ($) | | | Number
of Shares
at
12/31/2018 | | | Value ($)
at
12/31/2018 | |
Securities Lending Collateral 0.0% | |
DWS Government & Agency Securities Portfolio “DWS Government Cash Institutional Shares”, 2.29% (a) (b) | |
| 4,968,641 | | | — | | | | 4,968,641 | (c) | | | — | | | | — | | | | 1,980 | | | | — | | | | — | | | | — | |
Cash Equivalent 2.8% | | | | | | | | | | | | | | | | | | | | | | | | | | | | | |
DWS Central Cash Management Government Fund, 2.41% (a) | |
| 1,372,351 | | | 22,264,157 | | | | 20,060,502 | | | | — | | | | — | | | | 30,452 | | | | — | | | | 3,576,006 | | | | 3,576,006 | |
| 6,340,992 | | | 22,264,157 | | | | 25,029,143 | | | | — | | | | — | | | | 32,432 | | | | — | | | | 3,576,006 | | | | 3,576,006 | |
| * | Non-income producing security. |
| (a) | Affiliated fund managed by DWS Investment Management Americas, Inc. The rate shown is the annualizedseven-day yield at period end. |
| (b) | Represents collateral held in connection with securities lending. Income earned by the Fund is net of borrower rebates. |
| (c) | Represents the net increase (purchase cost) or decrease (sales proceeds) in the amount invested for the year ended December 31, 2018. |
Fair Value Measurements
Various inputs are used in determining the value of the Fund’s investments. These inputs are summarized in three broad levels. Level 1 includes quoted prices in active markets for identical securities. Level 2 includes other significant observable inputs (including quoted prices for similar securities, interest rates, prepayment speeds and credit risk). Level 3 includes significant unobservable inputs (including the Fund’s own assumptions in determining the fair value of investments). The level assigned to the securities valuations may not be an indication of the risk or liquidity associated with investing in those securities.
The following is a summary of the inputs used as of December 31, 2018 in valuing the Fund’s investments. For information on the Fund’s policy regarding the valuation of investments, please refer to the Security Valuation section of Note A in the accompanying Notes to Financial Statements.
| | | | | | | | | | | | | | | | |
| Assets | | Level 1 | | | Level 2 | | | Level 3 | | | Total | |
| Common Stocks (d) | | $ | 124,131,218 | | | $ | — | | | $ | — | | | $ | 124,131,218 | |
| Short-Term Investment | | | 3,576,006 | | | | — | | | | — | | | | 3,576,006 | |
| Total | | $ | 127,707,224 | | | $ | — | | | $ | — | | | $ | 127,707,224 | |
| (d) | See Investment Portfolio for additional detailed categorizations. |
The accompanying notes are an integral part of the financial statements.
| | | | | | |
| | 8 | | | | | | Deutsche DWS Variable Series II — DWS CROCI® U.S. VIP |
Statement of Assets and Liabilities
| | | | |
| |
| Assets | | | | |
| Investments innon-affiliated securities, at value (cost $142,204,335) | | $ | 124,131,218 | |
| Investment in DWS Central Cash Management Government Fund (cost $3,576,006) | | | 3,576,006 | |
| Receivable for Fund shares sold | | | 7,006 | |
| Dividends receivable | | | 248,544 | |
| Interest receivable | | | 6,239 | |
| Other assets | | | 3,206 | |
| Total assets | | | 127,972,219 | |
| |
| Liabilities | | | | |
| Payable for Fund shares redeemed | | | 57,322 | |
| Accrued management fee | | | 54,633 | |
| Accrued Trustees’ fees | | | 2,602 | |
| Other accrued expenses and payables | | | 101,742 | |
| Total liabilities | | | 216,299 | |
| Net assets, at value | | $ | 127,755,920 | |
| |
| Net Assets Consist of | | | | |
| Distributable earnings (loss) | | | (4,016,836 | ) |
| Paid-in capital | | | 131,772,756 | |
| Net assets, at value | | $ | 127,755,920 | |
| |
| Net Asset Value | | | | |
Class A | | | | |
| |
| Net Asset Value, and redemption price per share ($124,742,009 ÷ 9,266,278 outstanding shares of beneficial interest, no par value, unlimited shares authorized) | | $ | 13.46 | |
Class B | | | | |
| |
| Net Asset Value, offering and redemption price per share ($3,013,911 ÷ 223,302 outstanding shares of beneficial interest, no par value, unlimited shares authorized) | | $ | 13.50 | |
Statement of Operations
| | |
| for the year ended December 31, 2018 |
| | | | |
| |
| Investment Income | | | | |
| Income: | | | | |
| Dividends | | $ | 3,847,720 | |
| Income distributions — DWS Central Cash Management Government Fund | | | 30,452 | |
| Securities lending income, net of borrower rebates | | | 1,980 | |
| Total income | | | 3,880,152 | |
| Expenses: | | | | |
| Management fee | | | 967,002 | |
| Administration fee | | | 148,769 | |
| Services to Shareholders | | | 2,999 | |
| Record keeping fee (Class B) | | | 2,327 | |
| Distribution service fee (Class B) | | | 9,256 | |
| Custodian fee | | | 6,818 | |
| Professional fees | | | 75,764 | |
| Reports to shareholders | | | 26,154 | |
| Trustees’ fees and expenses | | | 8,423 | |
| Other | | | 11,417 | |
| Total expenses before expense reductions | | | 1,258,929 | |
| Expense reductions | | | (176,612 | ) |
| Total expenses after expense reductions | | | 1,082,317 | |
| Net investment income | | | 2,797,835 | |
| |
| Realized and Unrealized gain (loss) | | | | |
| Net realized gain (loss) from investments | | | 12,382,135 | |
| Change in net unrealized appreciation (depreciation) on investments | | | (30,136,434 | ) |
| Net gain (loss) | | | (17,754,299 | ) |
| Net increase (decrease) in net assets resulting from operations | | $ | (14,956,464 | ) |
The accompanying notes are an integral part of the financial statements.
| | | | |
Deutsche DWS Variable Series II — DWS CROCI® U.S. VIP | | | | | 9 |
Statements of Changes in Net Assets
| | | | | | | | |
| | | Years Ended December 31, | |
| Increase (Decrease) in Net Assets | | 2018 | | | 2017 | |
| Operations: | | | | | | | | |
| Net investment income (loss) | | $ | 2,797,835 | | | $ | 3,581,174 | |
| Net realized gain (loss) | | | 12,382,135 | | | | 32,463,285 | |
| Change in net unrealized appreciation (depreciation) | | | (30,136,434 | ) | | | 10,347,153 | |
| Net increase (decrease) in net assets resulting from operations | | | (14,956,464 | ) | | | 46,391,612 | |
| Distributions to shareholders: | | | | | | | | |
Class A | | | (14,077,923 | ) | | | (3,625,439 | ) |
Class B | | | (318,032 | ) | | | (42,548 | ) |
| Total distributions | | | (14,395,955 | ) | | | (3,667,987 | )* |
Class A | | | | | | | | |
| Proceeds from shares sold | | | 2,162,910 | | | | 3,856,097 | |
| Reinvestment of distributions | | | 14,077,923 | | | | 3,625,439 | |
| Payments of shares redeemed | | | (15,569,405 | ) | | | (124,081,648 | ) |
| Net increase (decrease) in net assets from Class A share transactions | | | 671,428 | | | | (116,600,112 | ) |
Class B | | | | | | | | |
| Proceeds from shares sold | | | 1,589,334 | | | | 97,651 | |
| Reinvestment of distributions | | | 318,032 | | | | 42,548 | |
| Payments of shares redeemed | | | (1,755,739 | ) | | | (815,252 | ) |
| Net increase (decrease) in net assets from Class B share transactions | | | 151,627 | | | | (675,053 | ) |
| Increase (decrease) in net assets | | | (28,529,364 | ) | | | (74,551,540 | ) |
| Net assets at beginning of year | | | 156,285,284 | | | | 230,836,824 | |
| Net assets at end of year | | | 127,755,920 | | | | 156,285,284 | ** |
| | |
| Other Information | | | | | | | | |
Class A | | | | | | | | |
| Shares outstanding at beginning of period | | | 9,181,648 | | | | 16,529,732 | |
| Shares sold | | | 140,074 | | | | 255,906 | |
| Shares issued to shareholders in reinvestment of distributions | | | 953,143 | | | | 245,460 | |
| Shares redeemed | | | (1,008,587 | ) | | | (7,849,450 | ) |
| Net increase (decrease) in Class A shares | | | 84,630 | | | | (7,348,084 | ) |
| Shares outstanding at end of period | | | 9,266,278 | | | | 9,181,648 | |
Class B | | | | | | | | |
| Shares outstanding at beginning of period | | | 210,410 | | | | 254,820 | |
| Shares sold | | | 104,157 | | | | 6,516 | |
| Shares issued to shareholders in reinvestment of distributions | | | 21,431 | | | | 2,869 | |
| Shares redeemed | | | (112,696 | ) | | | (53,795 | ) |
| Net increase (decrease) in Class B shares | | | 12,892 | | | | (44,410 | ) |
| Shares outstanding at end of period | | | 223,302 | | | | 210,410 | |
| * | Includes distributions from net investment income. |
| ** | Includes undistributed net investment income of $3,682,681. |
The accompanying notes are an integral part of the financial statements.
| | | | | | |
| | 10 | | | | | | Deutsche DWS Variable Series II — DWS CROCI® U.S. VIP |
Financial Highlights
| | | | | | | | | | | | | | | | | | | | |
| | | Years Ended December 31, | |
| Class A | | 2018 | | | 2017 | | | 2016 | | | 2015 | | | 2014 | |
| | | | | |
| Selected Per Share Data | | | | | | | | | | | | | | | | | | | | |
| Net asset value, beginning of period | | $ | 16.64 | | | $ | 13.75 | | | $ | 15.29 | | | $ | 17.38 | | | $ | 15.97 | |
| Income (loss) from investment operations: | | | | | | | | | | | | | | | | | | | | |
Net investment income (loss)a | | | .29 | | | | .24 | | | | .23 | | | | .11 | | | | .24 | |
Net realized and unrealized gain (loss) | | | (1.89 | ) | | | 2.88 | | | | (.93 | ) | | | (1.20 | ) | | | 1.45 | |
Total from investment operations | | | (1.60 | ) | | | 3.12 | | | | (.70 | ) | | | (1.09 | ) | | | 1.69 | |
| Less distributions from: | | | | | | | | | | | | | | | | | | | | |
Net investment income | | | (.41 | ) | | | (.23 | ) | | | (.14 | ) | | | (.25 | ) | | | (.28 | ) |
Net realized gains on investment transactions | | | (1.17 | ) | | | — | | | | (.70 | ) | | | (.75 | ) | | | — | |
Total distributions | | | (1.58 | ) | | | (.23 | ) | | | (.84 | ) | | | (1.00 | ) | | | (.28 | ) |
| Net asset value, end of period | | $ | 13.46 | | | $ | 16.64 | | | $ | 13.75 | | | $ | 15.29 | | | $ | 17.38 | |
| Total Return (%)b | | | (10.50 | ) | | | 22.88 | c | | | (4.39 | ) | | | (6.87 | ) | | | 10.72 | |
| | | | | |
| Ratios to Average Net Assets and Supplemental Data | | | | | | | | | | | | | | | | | | | | |
| Net assets, end of period ($ millions) | | | 125 | | | | 153 | | | | 227 | | | | 293 | | | | 430 | |
| Ratio of expenses before expense reductions (%)d | | | .84 | | | | .82 | | | | .81 | | | | .78 | | | | .78 | |
| Ratio of expenses after expense reductions (%)d | | | .72 | | | | .72 | | | | .74 | | | | .73 | | | | .73 | |
| Ratio of net investment income (loss) (%) | | | 1.89 | | | | 1.59 | | | | 1.66 | | | | .65 | | | | 1.43 | |
| Portfolio turnover rate (%) | | | 100 | | | | 97 | | | | 293 | | | | 121 | | | | 133 | |
| a | Based on average shares outstanding during the period. |
| b | Total return would have been lower had certain expenses not been reduced. |
| c | The Fund’s total return includes a reimbursement by the Adviser for commission costs incurred in connection with purchases and sales of portfolio assets due to the change in investment strategy, which otherwise would have reduced total return by 0.03%. |
| d | Expense ratio does not reflect charges and fees associated with the separate account that invests in the Fund or any variable life insurance policy or variable annuity contract for which the Fund is an investment option. |
| | | | | | | | | | | | | | | | | | | | |
| | | Years Ended December 31, | |
| Class B | | 2018 | | | 2017 | | | 2016 | | | 2015 | | | 2014 | |
| | | | | |
| Selected Per Share Data | | | | | | | | | | | | | | | | | | | | |
| Net asset value, beginning of period | | $ | 16.67 | | | $ | 13.78 | | | $ | 15.31 | | | $ | 17.40 | | | $ | 15.99 | |
| Income (loss) from investment operations: | | | | | | | | | | | | | | | | | | | | |
Net investment income (loss)a | | | .24 | | | | .20 | | | | .19 | | | | .06 | | | | .18 | |
Net realized and unrealized gain (loss) | | | (1.88 | ) | | | 2.87 | | | | (.92 | ) | | | (1.21 | ) | | | 1.46 | |
Total from investment operations | | | (1.64 | ) | | | 3.07 | | | | (.73 | ) | | | (1.15 | ) | | | 1.64 | |
| Less distributions from: | | | | | | | | | | | | | | | | | | | | |
Net investment income | | | (.36 | ) | | | (.18 | ) | | | (.10 | ) | | | (.19 | ) | | | (.23 | ) |
Net realized gains on investment transactions | | | (1.17 | ) | | | — | | | | (.70 | ) | | | (.75 | ) | | | — | |
Total distributions | | | (1.53 | ) | | | (.18 | ) | | | (.80 | ) | | | (.94 | ) | | | (.23 | ) |
| Net asset value, end of period | | $ | 13.50 | | | $ | 16.67 | | | $ | 13.78 | | | $ | 15.31 | | | $ | 17.40 | |
| Total Return (%)b | | | (10.71 | ) | | | 22.45 | c | | | (4.62 | ) | | | (7.16 | ) | | | 10.36 | |
| | | | | |
| Ratios to Average Net Assets and Supplemental Data | | | | | | | | | | | | | | | | | | | | |
| Net assets, end of period ($ millions) | | | 3 | | | | 4 | | | | 4 | | | | 4 | | | | 5 | |
| Ratio of expenses before expense reductions (%)d | | | 1.16 | | | | 1.15 | | | | 1.13 | | | | 1.10 | | | | 1.09 | |
| Ratio of expenses after expense reductions (%)d | | | 1.04 | | | | 1.03 | | | | 1.05 | | | | 1.04 | | | | 1.04 | |
| Ratio of net investment income (loss) (%) | | | 1.55 | | | | 1.31 | | | | 1.37 | | | | .35 | | | | 1.10 | |
| Portfolio turnover rate (%) | | | 100 | | | | 97 | | | | 293 | | | | 121 | | | | 133 | |
| a | Based on average shares outstanding during the period. |
| b | Total return would have been lower had certain expenses not been reduced. |
| c | The Fund’s total return includes a reimbursement by the Adviser for commission costs incurred in connection with purchases and sales of portfolio assets due to the change in investment strategy, which otherwise would have reduced total return by 0.03%. |
| d | Expense ratio does not reflect charges and fees associated with the separate account that invests in the Fund or any variable life insurance policy or variable annuity contract for which the Fund is an investment option. |
The accompanying notes are an integral part of the financial statements.
| | | | |
Deutsche DWS Variable Series II — DWS CROCI® U.S. VIP | | | | | 11 |
| | |
| Notes to Financial Statements | | |
A. Organization and Significant Accounting Policies
DWS CROCI® U.S. VIP (formerly Deutsche CROCI® U.S. VIP) (the “Fund”) is a diversified series of Deutsche DWS Variable Series II (formerly Deutsche Variable Series II) (the “Trust”), which is registered under the Investment Company Act of 1940, as amended (the “1940 Act”), as anopen-end management investment company organized as a Massachusetts business trust.
Multiple Classes of Shares of Beneficial Interest. The Fund offers two classes of shares (Class A shares and Class B shares). Sales of Class B shares are subject to recordkeeping fees up to 0.15% and Rule12b-1 fees under the 1940 Act equal to an annual rate of 0.25% of the average daily net assets of the Class B shares of the Fund. Class A shares are not subject to such fees.
Investment income, realized and unrealized gains and losses, and certainfund-level expenses and expense reductions, if any, are borne pro rata on the basis of relative net assets by the holders of all classes of shares except that each class bears certain expenses unique to that class (including the applicable Rule12b-1 fee and recordkeeping fees). Differences inclass-level expenses may result in payment of different per share dividends by class. All shares have equal rights with respect to voting subject toclass-specific arrangements.
The Fund’s financial statements are prepared in accordance with accounting principles generally accepted in the United States of America (“U.S. GAAP”) which require the use of management estimates. Actual results could differ from those estimates. The Fund qualifies as an investment company under Topic 946 of Accounting Standards Codification of U.S. GAAP. The policies described below are followed consistently by the Fund in the preparation of its financial statements.
In October 2018, the Securities and Exchange Commission adopted amendments to certain disclosure requirements in Securities Act Release No. 33-10532, Disclosure Update and Simplification, which is intended to facilitate the disclosure of information to investors and simplify compliance without significantly altering the total mix of information provided to investors. Effective with the current reporting period, the Fund adopted the amendments with the impacts being that the Fund is no longer required to present components of distributable earnings on the Statement of Assets and Liabilities or the sources of distributable earnings and the amount of undistributed net investment income on the Statements of Changes in Net Assets.
Security Valuation. Investments are stated at value determined as of the close of regular trading on the New York Stock Exchange on each day the exchange is open for trading.
Various inputs are used in determining the value of the Fund’s investments. These inputs are summarized in three broad levels. Level 1 includes quoted prices in active markets for identical securities. Level 2 includes other significant observable inputs (including quoted prices for similar securities, interest rates, prepayment speeds and credit risk). Level 3 includes significant unobservable inputs (including the Fund’s own assumptions in determining the fair value of investments). The level assigned to the securities valuations may not be an indication of the risk or liquidity associated with investing in those securities.
Equity securities are valued at the most recent sale price or official closing price reported on the exchange (U.S. or foreign) orover-the-counter market on which they trade. Securities for which no sales are reported are valued at the calculated mean between the most recent bid and asked quotations on the relevant market or, if a mean cannot be determined, at the most recent bid quotation. Equity securities are generally categorized as Level 1.
Investments inopen-end investment companies are valued at their net asset value each business day and are categorized as Level 1.
Securities and other assets for which market quotations are not readily available or for which the above valuation procedures are deemed not to reflect fair value are valued in a manner that is intended to reflect their fair value as determined in accordance with procedures approved by the Board and are generally categorized as Level 3. In accordance with the Fund’s valuation procedures, factors considered in determining value may include, but are not limited to, the type of the security; the size of the holding; the initial cost of the security; the existence of any contractual restrictions on the security’s disposition; the price and extent of public trading in similar securities of the issuer or of comparable companies; quotations or evaluated prices frombroker-dealers and/or pricing services; information obtained from the issuer, analysts, and/or the appropriate stock exchange (forexchange-traded securities); an analysis of the company’s or issuer’s financial statements; an evaluation of the forces that influence the issuer and the market(s) in which
| | | | | | |
| | 12 | | | | | | Deutsche DWS Variable Series II — DWS CROCI® U.S. VIP |
the security is purchased and sold; and with respect to debt securities, the maturity, coupon, creditworthiness, currency denomination and the movement of the market in which the security is normally traded. The value determined under these procedures may differ from published values for the same securities.
Disclosure about the classification of fair value measurements is included in a table following the Fund’s Investment Portfolio.
Foreign Currency Translations. The books and records of the Fund are maintained in U.S. dollars. Investment securities and other assets and liabilities denominated in a foreign currency are translated into U.S. dollars at the prevailing exchange rates at period end. Purchases and sales of investment securities, income and expenses are translated into U.S. dollars at the prevailing exchange rates on the respective dates of the transactions.
Net realized and unrealized gains and losses on foreign currency transactions represent net gains and losses between trade and settlement dates on securities transactions, the acquisition and disposition of foreign
currencies, and the difference between the amount of net investment income accrued and the U.S. dollar amount actually received. The portion of both realized and unrealized gains and losses on investments that results from fluctuations in foreign currency exchange rates is not separately disclosed but is included with net realized and unrealized gain/appreciation and loss/depreciation on investments.
Securities Lending. Deutsche Bank AG, as lending agent, lends securities of the Fund to certain financial institutions under the terms of its securities lending agreement. During the term of the loans, the Fund continues to receive interest and dividends generated by the securities and to participate in any changes in their market value. The Fund requires the borrowers of the securities to maintain collateral with the Fund consisting of either cash or liquid, unencumbered assets having a value at least equal to the value of the securities loaned. When the collateral falls below specified amounts, the lending agent will use its best effort to obtain additional collateral on the next business day to meet required amounts under the securities lending agreement. During the year ended December 31, 2018, the Fund invested the cash collateral into a joint trading account in affiliated money market funds including DWS Government and Agency Securities Portfolio, managed by DWS Investment Management Americas, Inc. DWS Investment Management Americas, Inc. receives a management/administration fee (0.12% annualized effective rate as of December 31, 2018) on the cash collateral invested in DWS Government & Agency Securities Portfolio. The Fund receives compensation for lending its securities either in the form of fees or by earning interest on invested cash collateral net of borrower rebates and fees paid to a lending agent. Either the Fund or the borrower may terminate the loan at any time, and the borrower, after notice, is required to return borrowed securities within a standard time period. There may be risks of delay and costs in recovery of securities or even loss of rights in the collateral should the borrower of the securities fail financially. If the Fund is not able to recover securities lent, the Fund may sell the collateral and purchase a replacement investment in the market, incurring the risk that the value of the replacement security is greater than the value of the collateral. The Fund is also subject to all investment risks associated with the reinvestment of any cash collateral received, including, but not limited to, interest rate, credit and liquidity risk associated with such investments.
As of December 31, 2018, the Fund had no securities on loan.
Federal Income Taxes. The Fund’s policy is to comply with the requirements of the Internal Revenue Code, as amended, which are applicable to regulated investment companies and to distribute all of its taxable income to its shareholders.
The Fund has reviewed the tax positions for the open tax years as of December 31, 2018 and has determined that no provision for income tax and/or uncertain tax positions is required in the Fund’s financial statements. The Fund’s federal tax returns for the prior three fiscal years remain open subject to examination by the Internal Revenue Service.
Distribution of Income and Gains. Distributions from net investment income of the Fund, if any, is declared and distributed to shareholders annually. Net realized gains from investment transactions, in excess of available capital loss carryforwards, would be taxable to the Fund if not distributed and, therefore, will be distributed to shareholders at least annually. The Fund may also make additional distributions for tax purposes if necessary.
The timing and characterization of certain income and capital gain distributions are determined annually in accordance with federal tax regulations which may differ from accounting principles generally accepted in the United States of America. These differences primarily relate to certain securities sold at a loss. As a result, net investment income (loss) and net realized gain (loss) on investment transactions for a reporting period
| | | | |
Deutsche DWS Variable Series II — DWS CROCI® U.S. VIP | | | | | 13 |
may differ significantly from distributions during such period. Accordingly, the Fund may periodically make reclassifications among certain of its capital accounts without impacting the net asset value of the Fund.
At December 31, 2018, the Fund’s components of distributable earnings on a tax basis were as follows:
| | | | |
| Undistributed ordinary income* | | $ | 4,270,000 | |
| Undistributed long-term capital gains | | $ | 10,190,756 | |
| Unrealized appreciation (depreciation) on investments | | $ | (18,477,592 | ) |
At December 31, 2018, the aggregate cost of investments for federal income tax purposes was $146,184,816. The net unrealized depreciation for all investments based on tax cost was $18,477,592. This consisted of aggregate gross unrealized appreciation for all investments in which there was an excess of value over tax cost of $3,129,309 aggregate gross unrealized depreciation for all investments in which was an excess of tax cost over value of $21,606,901.
In addition, the tax character of distributions paid by the Fund is summarized as follows:
| | | | | | | | |
| | | Years Ended December 31, | |
| | | 2018 | | | 2017 | |
| Distributions from ordinary income* | | $ | 7,103,422 | | | $ | 3,667,987 | |
| Distributions from long-term capital gains | | $ | 7,292,533 | | | $ | — | |
| * | For tax purposes, short-term capital gain distributions are considered ordinary income distributions. |
Expenses. Expenses of the Trust arising in connection with a specific fund are allocated to that fund. Other Trust expenses which cannot be directly attributed to a fund are apportioned among the funds in the Trust based upon the relative net assets or other appropriate measures.
Contingencies. In the normal course of business, the Fund may enter into contracts with service providers that contain general indemnification clauses. The Fund’s maximum exposure under these arrangements is unknown, as this would involve future claims that may be made against the Fund that have not yet been made. However, based on experience, the Fund expects the risk of loss to be remote.
Other. Investment transactions are accounted for on a trade date plus one basis for daily net asset value calculations. However, for financial reporting purposes, investment transactions are reported on trade date. Interest income is recorded on the accrual basis. Dividend income is recorded on theex-dividend date net of foreign withholding taxes. Realized gains and losses from investment transactions are recorded on an identified cost basis. Proceeds from litigation payments, if any, are included in net realized gain (loss) from investments.
B. Purchases and Sales of Securities
During the year ended December 31, 2018, purchases and sales of investment transactions (excludingshort-term investments) aggregated $147,474,011 and $154,980,034, respectively.
C. Related Parties
Management Agreement. Under the Investment Management Agreement with DWS Investment Management Americas, Inc. (formerly Deutsche Investment Management Americas Inc.) (“DIMA” or the “Advisor”), an indirect, wholly owned subsidiary of DWS Group GmbH & Co. KGaA (“DWS Group”), the Advisor directs the investments of the Fund in accordance with its investment objectives, policies and restrictions. The Advisor determines the securities, instruments and other contracts relating to investments to be purchased, sold or entered into by the Fund.
Under the Investment Management Agreement with the Advisor, the Fund pays a monthly management fee based on the Fund’s average daily net assets, computed and accrued daily and payable monthly, at the following annual rates:
| | | | |
| First $250 million | | | .650 | % |
| Next $750 million | | | .625 | % |
| Next $1.5 billion | | | .600 | % |
| Next $2.5 billion | | | .575 | % |
| Next $2.5 billion | | | .550 | % |
| Next $2.5 billion | | | .525 | % |
| Next $2.5 billion | | | .500 | % |
| Over $12.5 billion | | | .475 | % |
| | | | | | |
| | 14 | | | | | | Deutsche DWS Variable Series II — DWS CROCI® U.S. VIP |
Accordingly, for the year ended December 31, 2018, the fee pursuant to the Investment Management Agreement was equivalent to an annual rate (exclusive of any applicable waivers/reimbursements) of 0.65% of the Fund’s average daily net assets.
For the period from January 1, 2018 through April 30, 2018, the Advisor had contractually agreed to waive all or a portion of its fee and/or reimburse certain operating expenses of the Fund to the extent necessary to maintain the total annual operating expenses (excluding certain expenses such as extraordinary expenses, taxes, brokerage and interest expense) of each class as follows:
| | | | |
| Class A | | | .72 | % |
| Class B | | | 1.03 | % |
For the period from May 1, 2018 through September 30, 2018, the Advisor had contractually agreed to waive all or a portion of its fee and/or reimburse certain operating expenses of the Fund to the extent necessary to maintain the total annual operating expenses (excluding certain expenses such as extraordinary expenses, taxes, brokerage and interest expense) of each class as follows:
| | | | |
| Class A | | | .73 | % |
| Class B | | | 1.06 | % |
Effective October 1, 2018 through September 30, 2019, the Advisor has contractually agreed to waive all or a portion of its fee and/or reimburse certain operating expenses of the Fund to the extent necessary to maintain the total annual operating expenses (excluding certain expenses such as extraordinary expenses, taxes, brokerage and interest expense) of each class as follows:
| | | | |
| Class A | | | .70 | % |
| Class B | | | 1.02 | % |
For the year ended December 31, 2018, fees waived and/or expenses reimbursed for each class are as follows:
| | | | |
| Class A | | $ | 172,204 | |
| Class B | | | 4,408 | |
| |
| | | $ | 176,612 | |
Administration Fee. Pursuant to an Administrative Services Agreement, DIMA provides most administrative services to the Fund. For all services provided under the Administrative Services Agreement, the Fund pays DIMA an annual fee (“Administration Fee”) of 0.10% of the Fund’s average daily net assets, computed and accrued daily and payable monthly. For the year ended December 31, 2018, the Administration Fee was $148,769, of which $11,215 is unpaid.
Service Provider Fees. DWS Service Company (“DSC”), an affiliate of the Advisor, is the transfer agent,dividend-paying agent and shareholder service agent for the Fund. Pursuant to asub-transfer agency agreement between DSC and DST Systems, Inc. (“DST”), DSC has delegated certain transfer agent,dividend-paying agent and shareholder service agent functions to DST. DSC compensates DST out of the shareholder servicing fee it receives from the Fund. For the year ended December 31, 2018, the amounts charged to the Fund by DSC were as follows:
| | | | | | | | |
| Services to Shareholders | | Total
Aggregated | | | Unpaid at
December 31, 2018 | |
| Class A | | $ | 384 | | | $ | 65 | |
| Class B | | | 223 | | | | 37 | |
| | |
| | | $ | 607 | | | $ | 102 | |
Distribution Service Agreement. Under the Fund’s Class B12b-1 plan, DWS Distributors, Inc. (“DDI”) received a fee (“Distribution Service Fee”) of 0.25% of average daily net assets of Class B shares. For the year ended December 31, 2018, the Distribution Service Fee aggregated $9,256, of which $660 is unpaid.
Typesetting and Filing Service Fees. Under an agreement with the Fund, DIMA is compensated for providing certainpre-press and regulatory filing services to the Fund. For the year ended December 31, 2018, the amount charged to the Fund by DIMA included in the Statement of Operations under “Reports to shareholders” aggregated $10,011, of which $6,895 is unpaid.
| | | | |
Deutsche DWS Variable Series II — DWS CROCI® U.S. VIP | | | | | 15 |
Trustees’ Fees and Expenses. The Fund paid retainer fees to each Trustee not affiliated with the Advisor, plus specified amounts to the Board Chairperson and to each committee Chairperson.
Affiliated Cash Management Vehicles. The Fund may invest uninvested cash balances in DWS Central Cash Management Government Fund and DWS ESG Liquidity Fund, affiliated money market funds which are managed by the Advisor. Each affiliated money market fund is managed in accordance withRule 2a-7 under the 1940 Act, which governs the quality, maturity, diversity and liquidity of instruments in which a money market fund may invest. DWS Central Cash Management Government Fund seeks to maintain a stable net asset value, and DWS ESG Liquidity Fund maintains a floating net asset value. The Fund indirectly bears its proportionate share of the expenses of each affiliated money market fund in which it invests. DWS Central Cash Management Government Fund does not pay the Advisor an investment management fee. To the extent that DWS ESG Liquidity Fund pays an investment management fee to the Advisor, the Advisor will waive an amount of the investment management fee payable to the Advisor by the Fund equal to the amount of the investment management fee payable on the Fund’s assets invested in DWS ESG Liquidity Fund.
Securities Lending Agent Fees. Deutsche Bank AG serves as securities lending agent for the Fund. For the year ended December 31, 2018, the Fund incurred securities lending agent fees to Deutsche Bank AG in the amount of $149.
D. Ownership of the Fund
At December 31, 2018, two participating insurance companies were owners of record of 10% or more of the total outstanding Class A shares of the Fund, each owning 62% and 29%. Two participating insurance companies was the owner of record of 10% or more of the total outstanding Class B shares of the Fund, each owning 61% and 16%.
E. Line of Credit
The Fund and other affiliated funds (the “Participants”) share in a $400 million revolving credit facility provided by a syndication of banks. The Fund may borrow for temporary or emergency purposes, including the meeting of redemption requests that otherwise might require the untimely disposition of securities. The Participants are charged an annual commitment fee which is allocated based on net assets, among each of the Participants. Interest is calculated at a rate per annum equal to the sum of the Federal Funds Rate plus 1.25 percent plus if theone-month LIBOR exceeds the Federal Funds Rate, the amount of such excess. The Fund may borrow up to a maximum of 33 percent of its net assets under the agreement. The Fund had no outstanding loans at December 31, 2018.
| | | | | | |
| | 16 | | | | | | Deutsche DWS Variable Series II — DWS CROCI® U.S. VIP |
Report of Independent Registered Public Accounting Firm
To the Board of Trustees of Deutsche DWS Variable Series II and Shareholders of DWS CROCI U.S. VIP:
Opinion on the Financial Statements
We have audited the accompanying statement of assets and liabilities of DWS CROCI U.S. VIP (formerly Deutsche CROCI U.S. VIP) (the “Fund”) (one of the funds constituting Deutsche DWS Variable Series II (formerly Deutsche Variable Series II)) (the “Trust”), including the investment portfolio, as of December 31, 2018, and the related statement of operations for the year then ended, the statements of changes in net assets for each of the two years in the period then ended, the financial highlights for each of the five years in the period then ended and the related notes (collectively referred to as the “financial statements”). In our opinion, the financial statements present fairly, in all material respects, the financial position of the Fund (one of the funds constituting Deutsche DWS Variable Series II) at December 31, 2018, the results of its operations for the year then ended, the changes in its net assets for each of the two years in the period then ended and its financial highlights for each of the five years in the period then ended, in conformity with U.S. generally accepted accounting principles.
Basis for Opinion
These financial statements are the responsibility of the Trust’s management. Our responsibility is to express an opinion on the Fund’s financial statements based on our audits. We are a public accounting firm registered with the Public Company Accounting Oversight Board (United States) (“PCAOB”) and are required to be independent with respect to the Trust in accordance with the U.S. federal securities laws and the applicable rules and regulations of the Securities and Exchange Commission and the PCAOB.
We conducted our audits in accordance with the standards of the PCAOB. Those standards require that we plan and perform the audit to obtain reasonable assurance about whether the financial statements are free of material misstatement, whether due to error or fraud. The Trust is not required to have, nor were we engaged to perform, an audit of the Trust’s internal control over financial reporting. As part of our audits, we are required to obtain an understanding of internal control over financial reporting, but not for the purpose of expressing an opinion on the effectiveness of the Trust’s internal control over financial reporting. Accordingly, we express no such opinion.
Our audits included performing procedures to assess the risks of material misstatement of the financial statements, whether due to error or fraud, and performing procedures that respond to those risks. Such procedures included examining, on a test basis, evidence regarding the amounts and disclosures in the financial statements. Our procedures included confirmation of securities owned as of December 31, 2018, by correspondence with the custodian and brokers. Our audits also included evaluating the accounting principles used and significant estimates made by management, as well as evaluating the overall presentation of the financial statements. We believe that our audits provide a reasonable basis for our opinion.

We have served as the auditor of one or more investment companies in the DWS family of funds since at least 1979, but we are unable to determine the specific year.
Boston, Massachusetts
February 14, 2019
| | | | |
Deutsche DWS Variable Series II — DWS CROCI® U.S. VIP | | | | | 17 |
| | |
| Information About Your Fund’s Expenses | | (Unaudited) |
As an investor of the Fund, you incur two types of costs: ongoing expenses and transaction costs. Ongoing expenses include management fees, distribution and service(12b-1) fees and other Fund expenses. Examples of transaction costs include contract charges, which are not shown in this section. The following tables are intended to help you understand your ongoing expenses (in dollars) of investing in the Fund and to help you compare these expenses with the ongoing expenses of investing in other mutual funds. In the most recentsix-month period, the Fund limited these expenses; had it not done so, expenses would have been higher. The example in the table is based on an investment of $1,000 invested at the beginning of thesix-month period and held for the entire period (July 1, 2018 to December 31, 2018).
The tables illustrate your Fund’s expenses in two ways:
| – | Actual Fund Return. This helps you estimate the actual dollar amount of ongoing expenses (but not transaction costs) paid on a $1,000 investment in the Fund using the Fund’s actual return during the period. To estimate the expenses you paid over the period, simply divide your account value by $1,000 (for example, an $8,600 account value divided by $1,000 = 8.6), then multiply the result by the number in the “Expenses Paid per $1,000” line under the share class you hold. |
| – | Hypothetical 5% Fund Return. This helps you to compare your Fund’s ongoing expenses (but not transaction costs) with those of other mutual funds using the Fund’s actual expense ratio and a hypothetical rate of return of 5% per year before expenses. Examples using a 5% hypothetical Fund return may be found in the shareholder reports of other mutual funds. The hypothetical account values and expenses may not be used to estimate the actual ending account balance or expenses you paid for the period. |
Please note that the expenses shown in these tables are meant to highlight your ongoing expenses only and do not reflect any transaction costs. The “Expenses Paid per $1,000” line of the tables is useful in comparing ongoing expenses only and will not help you determine the relative total expense of owning different funds. If these transaction costs had been included, your costs would have been higher.
| | | | | | | | |
| Expenses and Value of a $1,000 Investment for the six months ended December 31, 2018 | |
| | |
| Actual Fund Return | | | Class A | | | | Class B | |
| Beginning Account Value 7/1/18 | | $ | 1,000.00 | | | $ | 1,000.00 | |
| Ending Account Value 12/31/18 | | $ | 908.20 | | | $ | 907.30 | |
| Expenses Paid per $1,000* | | $ | 3.46 | | | $ | 5.00 | |
| | |
| Hypothetical 5% Fund Return | | | Class A | | | | Class B | |
| Beginning Account Value 7/1/18 | | $ | 1,000.00 | | | $ | 1,000.00 | |
| Ending Account Value 12/31/18 | | $ | 1,021.58 | | | $ | 1,019.96 | |
| Expenses Paid per $1,000* | | $ | 3.67 | | | $ | 5.30 | |
| * | Expenses are equal to the Fund’s annualized expense ratio for each share class, multiplied by the average account value over the period, multiplied by 184 (the number of days in the most recentsix-month period), then divided by 365. |
| | | | | | | | |
| Annualized Expense Ratios | | Class A | | | Class B | |
| Deutsche DWS Variable Series II — DWS CROCI®U.S. VIP | | | .72 | % | | | 1.04 | % |
For more information, please refer to the Fund’s prospectus.
These tables do not reflect charges and fees (“contract charges”) associated with the separate account that invests in the Fund or any variable life insurance policy or variable annuity contract for which the Fund is an investment option.
For an analysis of the fees associated with an investment in the Fund or similar funds, please refer to the current and hypothetical expense calculators for Variable Insurance Products which can be found at dws.com/calculators.
| | | | | | |
| | 18 | | | | | | Deutsche DWS Variable Series II — DWS CROCI® U.S. VIP |
| | |
| Tax Information | | (Unaudited) |
The Fund paid distributions of $0.80 per share from net long-term capital gains during its year ended
December 31, 2018.
Pursuant to Section 852 of the Internal Revenue Code, the Fund designates $11,290,000 as capital gain dividends for its year ended December 31, 2018.
For corporate shareholders, 69% of the ordinary dividends (i.e., income dividends plus short-term capital gains) paid during the Fund’s fiscal year ended December 31, 2018, qualified for the dividends received deduction.
Please consult a tax advisor if you have questions about federal or state income tax laws, or on how to prepare your tax returns. If you have specific questions about your account, please contact your insurance provider.
Proxy Voting
The Trust’s policies and procedures for voting proxies for portfolio securities and information about how the Trust voted proxies related to its portfolio securities during the most recent12-month period ended June 30 are available on our Web site — dws.com/en-us/resources/proxy-voting — or on the SEC’s Web site — sec.gov. To obtain a written copy of the Trust’s policies and procedures without charge, upon request, call us toll free at (800)728-3337.
| | | | |
Deutsche DWS Variable Series II — DWS CROCI® U.S. VIP | | | | | 19 |
Advisory Agreement Board Considerations and Fee Evaluation
The Board of Trustees (hereinafter referred to as the “Board” or “Trustees”) approved the renewal of DWS CROCI® U.S. VIP’s (the “Fund”) investment management agreement (the “Agreement”) with DWS Investment Management Americas, Inc. (“DIMA”) in September 2018.
In terms of the process that the Board followed prior to approving the Agreement, shareholders should know that:
| – | | During the entire process, all of the Fund’s Trustees were independent of DIMA and its affiliates (the “Independent Trustees”). |
| – | | The Board met frequently during the past year to discuss fund matters and dedicated a substantial amount of time to contract review matters. Over the course of several months, the Board’s Contract Committee reviewed extensive materials received from DIMA, independent third parties and independent counsel. These materials included an analysis of the Fund’s performance, fees and expenses, and profitability from a fee consultant retained by the Fund’s Independent Trustees (the “Fee Consultant”). Based on its evaluation of the information provided, the Contract Committee presented its findings and recommendations to the Board. The Board then reviewed the Contract Committee’s findings and recommendations. |
| – | | The Board also received extensive information throughout the year regarding performance of the Fund. |
| – | | The Independent Trustees regularly met privately with counsel to discuss contract review and other matters. In addition, the Independent Trustees were advised by the Fee Consultant in the course of their review of the Fund’s contractual arrangements and considered a comprehensive report prepared by the Fee Consultant in connection with their deliberations. |
| – | | In connection with reviewing the Agreement, the Board also reviewed the terms of the Fund’s Rule12b-1 plan, distribution agreement, administrative services agreement, transfer agency agreement and other material service agreements. |
In connection with the contract review process, the Contract Committee and the Board considered the factors discussed below, among others. The Board also considered that DIMA and its predecessors have managed the Fund since its inception, and the Board believes that a long-term relationship with a capable, conscientious advisor is in the best interests of the Fund. The Board considered, generally, that shareholders chose to invest or remain invested in the Fund knowing that DIMA managed the Fund. DIMA is part of DWS Group GmbH & Co. KGaA (“DWS Group”). DWS Group is a global asset management business that offers a wide range of investing expertise and resources, including research capabilities in many countries throughout the world. In 2018, approximately 20% of DWS Group’s shares were sold in an initial public offering, with Deutsche Bank AG owning the remaining shares.
As part of the contract review process, the Board carefully considered the fees and expenses of each DWS fund overseen by the Board in light of the fund’s performance. In many cases, this led to the negotiation and implementation of expense caps. As part of these negotiations, the Board indicated that it would consider relaxing these caps in future years following sustained improvements in performance, among other considerations.
While shareholders may focus primarily on fund performance and fees, the Fund’s Board considers these and many other factors, including the quality and integrity of DIMA’s personnel and administrative support services provided by DIMA, such as back-office operations, fund valuations, and compliance policies and procedures.
Nature, Quality and Extent of Services.The Board considered the terms of the Agreement, including the scope of advisory services provided under the Agreement. The Board noted that, under the Agreement, DIMA provides portfolio management services to the Fund and that, pursuant to a separate administrative services agreement, DIMA provides administrative services to the Fund. The Board considered the experience and skills of senior management and investment personnel and the resources made available to such personnel. The Board reviewed the Fund’s performance over short-term and long-term periods and compared those returns to various agreed-upon performance measures, including market index(es) and a peer universe compiled using information supplied by Morningstar Direct (“Morningstar”), an independent fund data service. The Board also noted that it has put into place a process of identifying “Funds in Review” (e.g., funds performing poorly relative to a peer universe), and receives additional reporting from DIMA regarding such funds and, where appropriate, DIMA’s plans to address underperformance. The Board
| | | | | | |
| | 20 | | | | | | Deutsche DWS Variable Series II — DWS CROCI® U.S. VIP |
believes this process is an effective manner of identifying and addressing underperforming funds. Based on the information provided, the Board noted that, for theone-, three- and five-year periods ended December 31, 2017, the Fund’s performance (Class A shares) was in the 1st quartile, 4th quartile and 4th quartile, respectively, of the applicable Morningstar universe (the 1st quartile being the best performers and the 4th quartile being the worst performers). The Board also observed that the Fund has outperformed its benchmark in theone-year period and has underperformed its benchmark in the three- and five-year periods ended December 31, 2017. The Board noted the disappointing investment performance of the Fund in some past periods and continued to discuss with senior management of DIMA the factors contributing to such underperformance and actions being taken to improve performance. The Board considered that, effective October 3, 2016, the Fund changed its investment strategy and portfolio managers and noted that the Fund further changed its investment strategy, effective May 1, 2017. The Board observed that the Fund had experienced improved relative performance in 2017. The Board recognized the efforts by DIMA in recent years to enhance its investment platform and improve long-term performance across the DWS fund complex.
Fees and Expenses. The Board considered the Fund’s investment management fee schedule, operating expenses and total expense ratios, and comparative information provided by Broadridge Financial Solutions, Inc. (“Broadridge”) and the Fee Consultant regarding investment management fee rates paid to other investment advisors by similar funds (1st quartile being the most favorable and 4th quartile being the least favorable). With respect to management fees paid to other investment advisors by similar funds, the Board noted that the contractual fee rates paid by the Fund, which include a 0.10% fee paid to DIMA under the Fund’s administrative services agreement, were equal to the median of the applicable Broadridge peer group (based on Broadridge data provided as of December 31, 2017). The Board noted that the Fund’s Class A shares total (net) operating expenses were expected to be lower than the median (2nd quartile) of the applicable Broadridge expense universe (based on Broadridge data provided as of December 31, 2017, and analyzing Broadridge expense universe Class A (net) expenses less any applicable12b-1 fees) (“Broadridge Universe Expenses”). The Board also reviewed data comparing each share class’s total (net) operating expenses to the applicable Broadridge Universe Expenses. The Board noted that the expense limitations agreed to by DIMA were expected to help the Fund’s total (net) operating expenses remain competitive. The Board considered the Fund’s management fee rate as compared to fees charged by DIMA to comparable DWS U.S. registered funds (“DWS Funds”) and considered differences between the Fund and the comparable DWS Funds. The information requested by the Board as part of its review of fees and expenses also included information about institutional accounts (including anysub-advised funds and accounts) and funds offered primarily to European investors (“DWS Europe Funds”) managed by DWS Group. The Board noted that DIMA indicated that DWS Group does not manage any institutional accounts or DWS Europe Funds comparable to the Fund.
On the basis of the information provided, the Board concluded that management fees were reasonable and appropriate in light of the nature, quality and extent of services provided by DIMA.
Profitability. The Board reviewed detailed information regarding revenues received by DIMA under the Agreement. The Board considered the estimated costs to DIMA, andpre-tax profits realized by DIMA, from advising the DWS Funds, as well as estimates of thepre-tax profits attributable to managing the Fund in particular. The Board also received information regarding the estimated enterprise-wide profitability of DIMA and its affiliates with respect to all fund services in totality and by fund. The Board and the Fee Consultant reviewed DIMA’s methodology in allocating its costs to the management of the Fund. Based on the information provided, the Board concluded that thepre-tax profits realized by DIMA in connection with the management of the Fund were not unreasonable. The Board also reviewed certain publicly available information regarding the profitability of certain similar investment management firms. The Board noted that, while information regarding the profitability of such firms is limited (and in some cases is not necessarily prepared on a comparable basis), DIMA and its affiliates’ overall profitability with respect to the DWS Funds (after taking into account distribution and other services provided to the funds by DIMA and its affiliates) was lower than the overall profitability levels of most comparable firms for which such data was available.
Economies of Scale. The Board considered whether there are economies of scale with respect to the management of the Fund and whether the Fund benefits from any economies of scale. The Board noted that the Fund’s investment management fee schedule includes fee breakpoints. The Board concluded that the Fund’s fee schedule represents an appropriate sharing between the Fund and DIMA of such economies of scale as may exist in the management of the Fund at current asset levels.
| | | | |
Deutsche DWS Variable Series II — DWS CROCI® U.S. VIP | | | | | 21 |
Other Benefits to DIMA and Its Affiliates. The Board also considered the character and amount of other incidental or“fall-out” benefits received by DIMA and its affiliates, including any fees received by DIMA for administrative services provided to the Fund, any fees received by an affiliate of DIMA for transfer agency services provided to the Fund and any fees received by an affiliate of DIMA for distribution services. The Board noted that DIMA pays a licensing fee to an affiliate related to the Fund’s use of the CROCI® strategy. The Board also considered benefits to DIMA related to brokerage and soft-dollar allocations, including allocating brokerage to pay for research generated by parties other than the executing broker dealers, which pertain primarily to funds investing in equity securities. In addition, the Board considered the incidental public relations benefits to DIMA related to DWS Funds advertising and cross-selling opportunities among DIMA products and services. The Board considered these benefits in reaching its conclusion that the Fund’s management fees were reasonable.
Compliance. The Board considered the significant attention and resources dedicated by DIMA to its compliance processes in recent years. The Board noted in particular (i) the experience, seniority and time commitment of the individuals serving as DIMA’s and the Fund’s chief compliance officers and (ii) the substantial commitment of resources by DIMA and its affiliates to compliance matters, including the retention of compliance personnel.
Based on all of the information considered and the conclusions reached, the Board unanimously determined that the continuation of the Agreement is in the best interests of the Fund. In making this determination, the Board did not give particular weight to any single factor identified above. The Board considered these factors over the course of numerous meetings, certain of which were in executive session with only the Independent Trustees and counsel present. It is possible that individual Independent Trustees may have weighed these factors differently in reaching their individual decisions to approve the continuation of the Agreement.
| | | | | | |
| | 22 | | | | | | Deutsche DWS Variable Series II — DWS CROCI® U.S. VIP |
Board Members and Officers
The following table presents certain information regarding the Board Members and Officers of the Fund. Each Board Member’s year of birth is set forth in parentheses after his or her name. Unless otherwise noted, (i) each Board Member has engaged in the principal occupation(s) noted in the table for at least the most recent five years, although not necessarily in the same capacity; and (ii) the address of each Independent Board Member is c/o Keith R. Fox, DWS Funds Board Chair, c/o Thomas R. Hiller, Ropes & Gray LLP, Prudential Tower, 800 Boylston Street, Boston, MA02199-3600. Except as otherwise noted below, the term of office for each Board Member is until the election and qualification of a successor, or until such Board Member sooner dies, resigns, is removed or as otherwise provided in the governing documents of the Fund. Because the Fund does not hold an annual meeting of shareholders, each Board Member will hold office for an indeterminate period. The Board Members may also serve in similar capacities with other funds in the fund complex.
| | | | | | | | |
| Independent Board Members | | | | | | |
Name, Year of Birth,
Position with the Fund and
Length of Time Served1 | | Business Experience and Directorships During the Past Five Years | | Number of
Funds in
DWS Fund
Complex
Overseen | | | Other
Directorships
Held by Board
Member
|
Keith R. Fox, CFA (1954) Chairperson since 2017, and Board Member since 1996 | | Managing General Partner, Exeter Capital Partners (a series of private investment funds) (since 1986). Directorships: Progressive International Corporation (kitchen goods importer and distributor); The Kennel Shop (retailer); former Chairman, National Association of Small Business Investment Companies; former Directorships: BoxTop Media Inc. (advertising); Sun Capital Advisers Trust (mutual funds) (2011–2012) | | | 82 | | | — |
John W. Ballantine (1946) Board Member since 1999 | | Retired; formerly, Executive Vice President and Chief Risk Management Officer, First Chicago NBD Corporation/The First National Bank of Chicago (1996–1998); Executive Vice President and Head of International Banking (1995–1996); former Directorships: Director and former Chairman of the Board, Healthways, Inc.2 (populationwell-being and wellness services) (2003–2014); Stockwell Capital Investments PLC (private equity); Enron Corporation; FNB Corporation; Tokheim Corporation; First Oak Brook Bancshares, Inc. and Oak Brook Bank; Prisma Energy International.Not-for-Profit Director, Trustee: Palm Beach Civic Association; Public Radio International; Window to the World Communications (public media); Harris Theater for Music and Dance (Chicago) | | | 82 | | | Portland
General
Electric2
(utility
company)
(2003–
present) |
Henry P. Becton, Jr. (1943) Board Member since 1990 | | Vice Chair and former President, WGBH Educational Foundation. Directorships: Public Radio International; Public Radio Exchange (PRX); The Pew Charitable Trusts (charitable organization); Massachusetts Humane Society; American Documentary, Inc. (public media); Overseer of the New England Conservatory; former Directorships: Becton Dickinson and Company2(medical technology company); Belo Corporation2(media company); The PBS Foundation; Association of Public Television Stations; Boston Museum of Science; American Public Television; Concord Academy; New England Aquarium; Mass. Corporation for Educational Telecommunications; Committee for Economic Development; Public Broadcasting Service; Connecticut College; North Bennett Street School (Boston) | | | 82 | | | — |
Dawn-Marie Driscoll (1946) Board Member since 1987 | | Emeritus Executive Fellow, Center for Business Ethics, Bentley University; formerly: President, Driscoll Associates (consulting firm); Partner, Palmer & Dodge (law firm) (1988–1990); Vice President of Corporate Affairs and General Counsel, Filene’s (retail) (1978–1988). Directorships: Advisory Board, Center for Business Ethics, Bentley University; Trustee and former Chairman of the Board, Southwest Florida Community Foundation (charitable organization); former Directorships: ICI Mutual Insurance Company (2007–2015); Sun Capital Advisers Trust (mutual funds) (2007–2012), Investment Company Institute (audit, executive, nominating committees) and Independent Directors Council (governance, executive committees) | | | 82 | | | — |
Paul K. Freeman* (1950) Board Member since 1993 | | Consultant, WorldBank/Inter-American Development Bank; Independent Directors Council (former chair); Investment Company Institute (executive committee); Adjunct Professor, University of Denver Law School (2017–present); formerly: Chairman of Education Committee of Independent Directors Council; Project Leader, International Institute for Applied Systems Analysis (1998–2001); Chief Executive Officer, The Eric Group, Inc. (environmental insurance) (1986–1998); Directorships: Knoebel Institute for Healthy Aging, University of Denver (2017–present); former Directorships: Prisma Energy International; Denver Zoo Foundation (2012–2018) | | | 82 | | | — |
| | | | |
Deutsche DWS Variable Series II — DWS CROCI® U.S. VIP | | | | | 23 |
| | | | | | | | |
Name, Year of Birth,
Position with the Fund and
Length of Time Served1 | | Business Experience and Directorships During the Past Five Years | | Number of
Funds in
DWS Fund
Complex
Overseen | | | Other
Directorships
Held by Board
Member
|
Richard J. Herring (1946) Board Member since 1990 | | Jacob Safra Professor of International Banking and Professor of Finance, The Wharton School, University of Pennsylvania (since July 1972); Director, The Wharton Financial Institutions Center (since 1994); formerly: Vice Dean and Director, Wharton Undergraduate Division (1995–2000) and Director, The Lauder Institute of International Management Studies (2000–2006); Member FDIC Systemic Risk Advisory Committee since 2011, member Systemic Risk Council since 2012 and member of the Advisory Board at the Yale Program on Financial Stability since 2013; Formerly Co-Chair of the Shadow Financial Regulatory Committee (2003–2015), Executive Director of The Financial Economists Roundtable (2008–2015), Director of The Thai Capital Fund (2007–2013), Director of The Aberdeen Singapore Fund (2007–2018), and Nonexecutive Director of Barclays Bank DE (2010–2018) | | | 82 | | | Director,
Aberdeen
Japan Fund
(since 2007) |
William McClayton (1944) Board Member since 2004 | | Private equity investor (since October 2009); previously, Managing Director, Diamond Management & Technology Consultants, Inc. (global consulting firm) (2001–2009); Directorship: Board of Managers, YMCA of Metropolitan Chicago; formerly: Senior Partner, Arthur Andersen LLP (accounting) (1966–2001); Trustee, Ravinia Festival | | | 82 | | | — |
Rebecca W. Rimel (1951) Board Member since 1995 | | President, Chief Executive Officer and Director, The Pew Charitable Trusts (charitable organization) (1994–present); formerly: Executive Vice President, The Glenmede Trust Company (investment trust and wealth management) (1983–2004); Board Member, Investor Education (charitable organization) (2004–2005); Trustee, Executive Committee, Philadelphia Chamber of Commerce (2001–2007); Director, Viasys Health Care2 (January 2007–June 2007); Trustee, Thomas Jefferson Foundation (charitable organization) (1994–2012) | | | 82 | | | Director,
Becton
Dickinson
and
Company2
(medical
technology
company)
(2012–
present);
Director,
BioTelemetry
Inc.2(health
care) (2009–
present) |
William N. Searcy, Jr. (1946) Board Member since 1993 | | Private investor since October 2003; formerly: Pension & Savings Trust Officer, Sprint Corporation2(telecommunications) (November 1989–September 2003); Trustee, Sun Capital Advisers Trust (mutual funds) (1998–2012) | | | 82 | | | — |
Jean Gleason Stromberg (1943) Board Member since 1997 | | Retired. Formerly, Consultant (1997–2001); Director, Financial Markets U.S. Government Accountability Office (1996–1997); Partner, Norton Rose Fulbright, L.L.P. (law firm) (1978–1996); former Directorships: The William and Flora Hewlett Foundation (charitable organization) (2000–2015); Service Source, Inc. (nonprofit), Mutual Fund Directors Forum (2002–2004), American Bar Retirement Association (funding vehicle for retirement plans) (1987–1990 and 1994–1996) | | | 82 | | | — |
| | |
| Officers4 | | |
Name, Year of Birth, Position with the Fund and Length of Time Served5 | | Business Experience and Directorships During the Past Five Years |
Hepsen Uzcan6 (1974) President and Chief Executive Officer, 2017–present Assistant Secretary, 2013–present | | Managing Director,3 DWS; Secretary, DWS USA Corporation (since March 2018); Assistant Secretary, DWS Distributors, Inc. (since June 25, 2018); Director and Vice President, DWS Service Company (since June 25, 2018); Assistant Secretary, DWS Investment Management Americas, Inc. (since June 25, 2018); and Director and President, DB Investment Managers, Inc. (since June 25, 2018); formerly: Vice President for the Deutsche funds (2016–2017) |
John Millette8(1962) Vice President and Secretary, 1999–present | | Director,3DWS; Chief Legal Officer, DWS Investment Management Americas, Inc. (2015–present); and Director and Vice President, DWS Trust Company (2016–present); formerly: Secretary, Deutsche Investment Management Americas Inc. (2015–2017) |
Diane Kenneally8,9 (1966) Treasurer and Chief Financial Officer since 2018 | | Director,3 DWS; formerly: Assistant Treasurer for the DWS funds (2007–2018) |
Caroline Pearson8(1962) Chief Legal Officer, 2010–present | | Managing Director,3DWS; formerly: Secretary, Deutsche AM Distributors, Inc. (2002–2017); and Secretary, Deutsche AM Service Company (2010–2017) |
| | | | | | |
| | 24 | | | | | | Deutsche DWS Variable Series II — DWS CROCI® U.S. VIP |
| | |
Name, Year of Birth, Position with the Fund and Length of Time Served5 | | Business Experience and Directorships During the Past Five Years |
Scott D. Hogan8(1970) Chief Compliance Officer, 2016–present | | Director,3DWS |
Wayne Salit7(1967) Anti-Money Laundering Compliance Officer, 2014–present | | Director,3 Deutsche Bank; and AML Officer, DWS Trust Company; formerly: Managing Director, AML Compliance Officer at BNY Mellon (2011–2014); and Director, AML Compliance Officer at Deutsche Bank (2004–2011) |
Sheila Cadogan8(1966) Assistant Treasurer, 2017–present | | Director,3DWS; Director and Vice President, DWS Trust Company (since 2018) |
Paul Antosca8(1957) Assistant Treasurer, 2007–present | | Director,3DWS |
| 1 | The length of time served represents the year in which the Board Member joined the board of one or more DWS funds currently overseen by the Board. |
| 2 | A publicly held company with securities registered pursuant to Section 12 of the Securities Exchange Act of 1934. |
| 3 | Executive title, not a board directorship. |
| 4 | As a result of their respective positions held with the Advisor or its affiliates, these individuals are considered “interested persons” of the Advisor within the meaning of the 1940 Act. Interested persons receive no compensation from the Fund. |
| 5 | The length of time served represents the year in which the officer was first elected in such capacity for one or more DWS funds. |
| 6 | Address: 345 Park Avenue, New York, NY 10154. |
| 7 | Address: 60 Wall Street, New York, NY 10005. |
| 8 | Address: One International Place, Boston, MA 02110. |
| 9 | Appointed Treasurer and Chief Financial Officer effective July 2, 2018. |
| * | Paul K. Freeman retired from the Board effective December 31, 2018. |
The Fund’s Statement of Additional Information (“SAI”) includes additional information about the Board Members. The SAI is available, without charge, upon request. If you would like to request a copy of the SAI, you may do so by calling the followingtoll-free number:(800) 728-3337.
| | | | |
Deutsche DWS Variable Series II — DWS CROCI® U.S. VIP | | | | | 25 |
Notes
Notes
| | |
| | |
VS2CUS-2 (R-025833-8 2/19) | | |
December 31, 2018
Annual Report
Deutsche DWS Variable Series II
(formerly Deutsche Variable Series II)
DWS Global Equity VIP
(formerly Deutsche Global Equity VIP)
Beginning on January 1, 2021, as permitted by regulations adopted by the Securities and Exchange Commission, you may not be receiving paper copies of the Fund’s shareholder reports from the insurance company that offers your contract unless you specifically request paper copies from your insurance company or from your financial intermediary. Instead, the shareholder reports will be made available on a Web site, and your insurance company will notify you by mail each time a report is posted and provide you with a Web site link to access the report. Instructions for requesting paper copies will be provided by your insurance company.
If you already elected to receive shareholder reports electronically, you will not be affected by this change and you need not take any action. You may elect to receive shareholder reports and other communications from your insurance company electronically by following the instructions provided by your insurance company.
You may elect to receive all future reports in paper free of charge from your insurance company. If your insurance company informs you that future reports will be delivered via Web access, you can inform your insurance company that you wish to continue receiving paper copies of your shareholder reports by following the instructions provided by your insurance company.

Contents
This report must be preceded or accompanied by a prospectus. To obtain an additional prospectus or summary prospectus, if available, call (800)728-3337 or your financial representative. We advise you to consider the Fund’s objectives, risks, charges and expenses carefully before investing. The summary prospectus and prospectus contain this and other important information about the Fund. Please read the prospectus carefully before you invest.
Stocks may decline in value. Investing in foreign securities, particularly those of emerging markets, presents certain risks, such as currency fluctuations, political and economic changes, and market risks. Emerging markets tend to be more volatile and less liquid than the markets of more mature economies, and generally have less diverse and less mature economic structures and less stable political systems than those of developed countries. Investing in derivatives entails special risks relating to liquidity, leverage and credit that may reduce returns and/or increase volatility. The Fund may lend securities to approved institutions. Please read the prospectus for details.
The brand DWS represents DWS Group GmbH & Co. KGaA and any of its subsidiaries such as DWS Distributors, Inc. which offers investment products or DWS Investment Management Americas, Inc. and RREEF America L.L.C. which offer advisory services.
DWS Distributors, Inc., 222 South Riverside Plaza, Chicago, IL 60606, (800)621-1148
NOT FDIC/NCUA INSURED NO BANK GUARANTEE MAY LOSE VALUE NOT A DEPOSIT
NOT INSURED BY ANY FEDERAL GOVERNMENT AGENCY
| | | | | | |
| | 2 | | | | | | Deutsche DWS Variable Series II — DWS Global Equity VIP |
| | |
| Performance Summary | | December 31, 2018 (Unaudited) |
Fund performance shown is historical, assumes reinvestment of all dividend and capital gain distributions and does not guarantee future results. Investment return and principal value fluctuate with changing market conditions so that, when redeemed, shares may be worth more or less than their original cost. Current performance may be lower or higher than the performance data quoted. Please contact your participating insurance company for the Fund’s most recentmonth-end performance. Performance does not reflect charges and fees (“contract charges”) associated with the separate account that invests in the Fund or any variable life insurance policy or variable annuity contract for which the Fund is an investment option. These charges and fees will reduce returns.
The gross expense ratio of the Fund, as stated in the fee table of the prospectus dated May 1, 2018 is 1.06% for Class A shares and may differ from the expense ratio disclosed in the Financial Highlights table in this report.
Generally accepted accounting principles require adjustments to be made to the net assets of the Fund at period end for financial reporting purposes only, and as such, the total return based on the unadjusted net asset value per share may differ from the total return reported in the financial highlights.
Growth of an Assumed $10,000 Investment in DWS Global Equity VIP
| | |
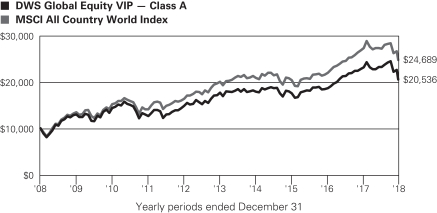 | | The MSCI All Country World Index captures large and mid cap representation across 23 Developed Markets and 23 Emerging Markets countries. Index returns do not reflect any fees or expenses and it is not possible to invest directly into an index. |
| | | | | | | | | | |
| Comparative Results | | | | | | | | | | |
| | | | |
| DWS Global Equity VIP | | 1-Year | | 3-Year | | 5-Year | | 10-Year |
| Class A | | Growth of $10,000 | | $8,888 | | $11,699 | | $11,625 | | $20,536 |
| | | Average annual total return | | –11.12% | | 5.37% | | 3.06% | | 7.46% |
| MSCI All Country World Index | | Growth of $10,000 | | $9,058 | | $12,113 | | $12,319 | | $24,689 |
| | Average annual total return | | –9.42% | | 6.60% | | 4.26% | | 9.46% |
The growth of $10,000 is cumulative.
| | | | |
Deutsche DWS Variable Series II — DWS Global Equity VIP | | | | | 3 |
| | |
| Management Summary | | December 31, 2018 (Unaudited) |
Global equities experienced meaningful headwinds in the latter part of 2018, leading to a return of –9.42% for the Fund’s benchmark, the MSCI All Country (AC) World Index. Class A shares of the Fund returned –11.12% (unadjusted for contract charges).
Although the index closed in negative territory, the investment backdrop was in fact quite favorable until the end of September. For the majority of 2018, stocks were well supported by the combination of positive global growth and rising corporate earnings. The positive environment changed in the fourth quarter, however, when stocks fell sharply in response to weaker economic data and uncertainty surrounding U.S. trade policy. The index slid 12.75% in the final three months of the year, erasing all of the earlier gain and causing it to finish in the red.
Asset allocation was a modest contributor to the Fund’s relative performance, while stock selection detracted. With regard to the former, the largest benefit came from overweight positions in the health care and information technology sectors. In terms of stock selection, our positive showing in financials and consumer staples was outweighed by weaker results in health care and communications services. Style factors also played a role in performance. We managed the Fund with a growth orientation, which helped versus the blended benchmark during the first nine months of the year but was a key detractor in the fourth quarter.
Among individual stocks, the leading contributors included Mastercard, Inc., Progressive Corp., Zoetis, Inc., and Canada Goose Holdings, Inc. Mastercard delivered strong, market-beating returns thanks to its stable growth trajectory and rising profit margins. The largest detractors were the health care stocks Fresenius Medical Care AG & Co. KGaA and Eurofins Scientific SE, as well as the semiconductor producer NVIDIA Corp. Fresenius posted weaker-than-expected profits due to underwhelming results in its U.S. operations and lower profit margins for its German business, causing it to lag its sector peers.
We believe volatility could remain a factor in market performance in the coming year amid ongoing questions about economic growth, corporate earnings, U.S. trade policy, and the direction of global interest rates. These issues led to a sizable decrease in valuations in the fourth quarter, however, indicating that they were largely factored into prices. Believing these circumstances provided the chance to buy high-quality growth companies at attractive valuations, we remained on the lookout for opportunities to use temporary price dislocations to our advantage.
The Fund closed the year with overweight positions in the information technology, health care, and consumer discretionary sectors, as well as in certain industrial and financial stocks. We were active in all of these areas during 2018, as large market movements provided the opportunity to adjust the Fund’s positioning. In health care, for instance, we sold positions in Roche Holding AG,* Biogen, Inc.,* and Bristol-Myers Squibb Co.,* among others, while adding to Lonza Group AG and Zoetis, Inc., and building a new position in Becton, Dickinson & Co.
From a regional perspective, we continued to favor the United States and the emerging markets. In both segments, attractive growth companies were trading at discounts relative to their European counterparts despite strongertop- and bottom-line results. We also identified innovative Japanese companies with conservative balance sheets, shareholder-focused management teams, and the ability to capitalize on opportunities outside of Japan. At the sector level, we found the most compelling ideas in companies that are embracing change to generate long-term shareholder value independent of the economic cycle. Overall, we think companies that can deliver bothtop- andbottom-line growth in excess of the broader market can attract steady investor demand at a time of sluggish global economic conditions.
The views expressed reflect those of the portfolio management team only through the end of the period of the report as stated on the cover. The management team’s views are subject to change at any time based on market and other conditions and should not be construed as a recommendation. Past performance is no guarantee of future results. Current and future portfolio holdings are subject to risk.
Sebastian P. Werner, PhD, Director
Mark Schumann, CFA, Director
Portfolio Managers
The views expressed reflect those of the portfolio management team only through the end of the period of the report as stated on the cover. The management team’s views are subject to change at any time based on market and other conditions and should not be construed as a recommendation. Past performance is no guarantee of future results. Current and future portfolio holdings are subject to risk.
| | | | | | |
| | 4 | | | | | | Deutsche DWS Variable Series II — DWS Global Equity VIP |
Terms to Know
TheMSCI All Country (AC) World Indexis a freefloat-adjusted market capitalization weighted index that is designed to measure the equity market performance of developed and emerging markets. The index consists of 46 country indices comprising 23 developed and 23 emerging market country indices. Index returns do not reflect fees or expenses and it is not possible to invest directly into an index.
Underweight means the Fund holds a lower weighting in a given sector or security than the benchmark.Overweightmeans it holds a higher weighting.
Contribution anddetraction incorporate both a stock’s total return and its weighting in the Fund.
| * | Held and sold prior to December 31, 2018. |
| | | | |
Deutsche DWS Variable Series II — DWS Global Equity VIP | | | | | 5 |
| | |
| Portfolio Summary | | (Unaudited) |
| | | | | | | | |
| Asset Allocation (As a % of Investment Portfolio excluding Securities Lending Collateral) | | 12/31/18 | | | 12/31/17 | |
| Common Stocks | | | 99% | | | | 98% | |
| Cash Equivalent | | | 1% | | | | 2% | |
| Preferred Stock | | | — | | | | 0% | |
| | | | 100% | | | | 100% | |
| | |
Sector Diversification (As a % of Investment Portfolio excluding Cash Equivalent and Securities
Lending Collateral) | | 12/31/18 | | | 12/31/17 | |
| Financials | | | 20% | | | | 19% | |
| Information Technology | | | 18% | | | | 26% | |
| Health Care | | | 15% | | | | 19% | |
| Industrials | | | 11% | | | | 11% | |
| Consumer Discretionary | | | 11% | | | | 7% | |
| Communication Services | | | 9% | | | | 2% | |
| Consumer Staples | | | 8% | | | | 6% | |
| Materials | | | 4% | | | | 6% | |
| Energy | | | 3% | | | | 3% | |
| Real Estate | | | 1% | | | | 1% | |
| | | | 100% | | | | 100% | |
| | |
Geographical Diversification (As a % of Investment Portfolio excluding Cash Equivalent and
Securities Lending Collateral) | | 12/31/18 | | | 12/31/17 | |
| United States | | | 51% | | | | 51% | |
| Germany | | | 10% | | | | 7% | |
| Canada | | | 7% | | | | 9% | |
| China | | | 7% | | | | 6% | |
| United Kingdom | | | 5% | | | | 7% | |
| Japan | | | 5% | | | | 1% | |
Switzerland | | | 4% | | | | 7% | |
| France | | | 3% | | | | 3% | |
| Ireland | | | 2% | | | | 2% | |
| Sweden | | | 2% | | | | 1% | |
| Argentina | | | 2% | | | | — | |
| Luxembourg | | | 1% | | | | 1% | |
| Others | | | 1% | | | | 5% | |
| | | | 100% | | | | 100% | |
Portfolio holdings and characteristics are subject to change.
For more complete details about the Fund’s investment portfolio, see page 7.
Following the Fund’s fiscal first and thirdquarter-end, a complete portfolio holdings listing is filed with the SEC on FormN-Q or Form N-PORT (available for filings after March 31, 2019). The Fund’s FormN-Q or Form N-PORT will be available on the SEC’s Web site at sec.gov. The Fund’s portfolio holdings are also posted on dws.com from time to time. Please see the Fund’s current prospectus for more information.
| | | | | | |
| | 6 | | | | | | Deutsche DWS Variable Series II — DWS Global Equity VIP |
| | |
| Investment Portfolio | | December 31, 2018 |
| | | | | | | | |
| | | Shares | | | Value ($) | |
| Common Stocks 98.7% | | | | | | | | |
| Argentina 1.5% | | | | | | | | |
Globant SA* (Cost $336,781) | | | 6,500 | | | | 366,080 | |
| | |
| Canada 7.1% | | | | | | | | |
| | |
Agnico Eagle Mines Ltd. | | | 4,650 | | | | 187,860 | |
| | |
Alimentation Couche-Tard, Inc. “B” | | | 6,300 | | | | 313,385 | |
| | |
Brookfield Asset Management, Inc. “A” | | | 18,200 | | | | 697,497 | |
| | |
Canada Goose Holdings, Inc.* | | | 4,400 | | | | 192,347 | |
| | |
Toronto-Dominion Bank | | | 7,400 | | | | 367,832 | |
| | | | | | | | |
(Cost $1,209,333) | | | | | | | 1,758,921 | |
| | |
| China 6.9% | | | | | | | | |
| | |
Alibaba Group Holding Ltd. (ADR)* | | | 2,650 | | | | 363,236 | |
| | |
China Life Insurance Co., Ltd. “H” | | | 123,000 | | | | 261,190 | |
| | |
China Literature Ltd. 144A* | | | 14 | | | | 65 | |
| | |
Momo, Inc. (ADR)* | | | 5,500 | | | | 130,625 | |
| | |
New Oriental Education & Technology Group, Inc. (ADR)* | | | 2,455 | | | | 134,559 | |
| | |
Ping An Insurance (Group) Co. of China Ltd. “H” | | | 41,500 | | | | 366,775 | |
| | |
Tencent Holdings Ltd. | | | 11,600 | | | | 464,303 | |
| | | | | | | | |
(Cost $1,859,493) | | | | | | | 1,720,753 | |
| | |
| France 2.7% | | | | | | | | |
| | |
TOTAL SA | | | 6,060 | | | | 320,682 | |
| | |
VINCI SA | | | 4,400 | | | | 363,362 | |
| | | | | | | | |
(Cost $798,801) | | | | | | | 684,044 | |
| | |
| Germany 9.5% | | | | | | | | |
| | |
adidas AG | | | 985 | | | | 206,643 | |
| | |
Allianz SE (Registered) | | | 2,300 | | | | 463,357 | |
| | |
BASF SE | | | 3,800 | | | | 266,718 | |
| | |
Deutsche Boerse AG | | | 3,650 | | | | 440,300 | |
| | |
Evonik Industries AG | | | 13,200 | | | | 330,978 | |
| | |
Fresenius Medical Care AG & Co. KGaA | | | 6,107 | | | | 397,052 | |
| | |
Siemens AG (Registered) | | | 2,400 | | | | 268,589 | |
| | | | | | | | |
(Cost $2,541,480) | | | | | | | 2,373,637 | |
| | |
| Ireland 1.6% | | | | | | | | |
| | |
Kerry Group PLC “A” (a) | | | 3,721 | | | | 369,336 | |
| | |
Kerry Group PLC “A” (a) | | | 379 | | | | 37,262 | |
| | | | | | | | |
(Cost $278,106) | | | | | | | 406,598 | |
| | |
| Japan 4.9% | | | | | | | | |
| | |
Kao Corp. | | | 3,700 | | | | 274,639 | |
| | |
Keyence Corp. | | | 600 | | | | 303,634 | |
| | |
Komatsu Ltd. | | | 7,400 | | | | 158,251 | |
| | |
Mitsubishi UFJ Financial Group, Inc. | | | 44,200 | | | | 216,554 | |
| | |
SMC Corp. | | | 900 | | | | 271,636 | |
| | | | | | | | |
(Cost $1,536,839) | | | | | | | 1,224,714 | |
| | |
| Luxembourg 1.1% | | | | | | | | |
Eurofins Scientific SE (Cost $150,981) | | | 700 | | | | 261,762 | |
| | |
| Malaysia 0.7% | | | | | | | | |
IHH Healthcare Bhd. (Cost $177,866) | | | 136,600 | | | | 178,041 | |
| | | | | | | | |
| | | Shares | | | Value ($) | |
| | |
| Norway 0.6% | | | | | | | | |
Marine Harvest ASA (Cost $82,231) | | | 7,200 | | | | 151,819 | |
| | |
| Sweden 1.6% | | | | | | | | |
| | |
Assa Abloy AB “B” | | | 7,600 | | | | 136,297 | |
| | |
Spotify Technology SA* (b) | | | 2,300 | | | | 261,050 | |
| | | | | | | | |
(Cost $511,723) | | | | | | | 397,347 | |
| | |
| Switzerland 4.4% | | | | | | | | |
| | |
Lonza Group AG (Registered)* (b) | | | 2,500 | | | | 652,474 | |
| | |
Nestle SA (Registered) | | | 5,509 | | | | 448,026 | |
| | | | | | | | |
(Cost $580,757) | | | | | | | 1,100,500 | |
| | |
| United Kingdom 5.3% | | | | | | | | |
| | |
Aon PLC (b) | | | 1,750 | | | | 254,380 | |
| | |
Compass Group PLC | | | 9,600 | | | | 202,076 | |
| | |
Experian PLC | | | 15,300 | | | | 371,728 | |
| | |
Halma PLC | | | 16,700 | | | | 290,820 | |
| | |
Spirax-Sarco Engineering PLC | | | 2,500 | | | | 199,132 | |
| | | | | | | | |
(Cost $949,413) | | | | | | | 1,318,136 | |
| | |
| United States 50.8% | | | | | | | | |
| | |
A.O. Smith Corp. | | | 4,500 | | | | 192,150 | |
| | |
Activision Blizzard, Inc. | | | 7,600 | | | | 353,932 | |
| | |
Alphabet, Inc. “A”* | | | 580 | | | | 606,077 | |
| | |
American Express Co. | | | 2,640 | | | | 251,645 | |
| | |
AMETEK, Inc. | | | 5,520 | | | | 373,704 | |
| | |
Amphenol Corp. “A” | | | 6,000 | | | | 486,120 | |
| | |
Apple, Inc. | | | 1,155 | | | | 182,190 | |
| | |
Applied Materials, Inc. | | | 6,300 | | | | 206,262 | |
| | |
Becton, Dickinson & Co. | | | 2,705 | | | | 609,491 | |
| | |
Boeing Co. | | | 940 | | | | 303,150 | |
| | |
CBRE Group, Inc. “A”* | | | 4,700 | | | | 188,188 | |
| | |
Danaher Corp. | | | 6,300 | | | | 649,656 | |
| | |
Ecolab, Inc. | | | 2,210 | | | | 325,643 | |
| | |
EOG Resources., Inc. | | | 3,800 | | | | 331,398 | |
| | |
EPAM Systems, Inc.* | | | 2,550 | | | | 295,825 | |
| | |
Equifax, Inc. | | | 1,225 | | | | 114,084 | |
| | |
Evolent Health, Inc. “A”* | | | 13,400 | | | | 267,330 | |
| | |
Fidelity National Information Services, Inc. | | | 3,000 | | | | 307,650 | |
| | |
Intuit, Inc. | | | 1,600 | | | | 314,960 | |
| | |
JPMorgan Chase & Co. | | | 6,664 | | | | 650,540 | |
| | |
Las Vegas Sands Corp. | | | 2,850 | | | | 148,342 | |
| | |
MasterCard, Inc. “A” | | | 3,340 | | | | 630,091 | |
| | |
McDonald’s Corp. | | | 2,900 | | | | 514,953 | |
| | |
Microsoft Corp. | | | 4,000 | | | | 406,280 | |
| | |
Mondelez International, Inc. “A” | | | 7,100 | | | | 284,213 | |
| | |
NVIDIA Corp. | | | 1,710 | | | | 228,285 | |
| | |
Progressive Corp. | | | 15,200 | | | | 917,016 | |
| | |
Schlumberger Ltd. | | | 4,500 | | | | 162,360 | |
| | |
ServiceMaster Global Holdings, Inc.* | | | 6,850 | | | | 251,669 | |
| | |
ServiceNow, Inc.* | | | 1,570 | | | | 279,538 | |
| | |
T-Mobile U.S., Inc.* | | | 6,500 | | | | 413,465 | |
| | |
TJX Companies, Inc. | | | 6,520 | | | | 291,705 | |
| | |
YETI Holdings, Inc.* (c) | | | 29,988 | | | | 445,022 | |
| | |
Zoetis, Inc. | | | 7,800 | | | | 667,212 | |
| | | | | | | | |
(Cost $9,829,523) | | | | | | | 12,650,146 | |
Total Common Stocks (Cost $20,843,327) | | | | 24,592,498 | |
The accompanying notes are an integral part of the financial statements.
| | | | |
Deutsche DWS Variable Series II — DWS Global Equity VIP | | | | | 7 |
| | | | | | | | |
| | | Shares | | | Value ($) | |
| Securities Lending Collateral 0.4% | |
DWS Government & Agency Securities Portfolio “DWS Government Cash Institutional Shares”, 2.29% (d) (e) (Cost $111,625) | | | 111,625 | | | | 111,625 | |
| | |
| Cash Equivalent 1.0% | | | | | | | | |
DWS Central Cash Management Government Fund, 2.41% (d) (Cost $238,530) | | | 238,530 | | | | 238,530 | |
| | |
| | | % of Net
Assets | | | Value ($) | |
Total Investment Portfolio (Cost $21,193,482) | | | 100.1 | | | | 24,942,653 | |
| Other Assets and Liabilities, Net | | | (0.1 | ) | | | (13,980 | ) |
| Net Assets | | | 100.0 | | | | 24,928,673 | |
A summary of the Fund’s transactions with affiliated investments during the year ended December 31, 2018 are as follows:
| | | | | | | | | | | | | | | | | | | | | | | | | | | | | | | | |
Value ($) at
12/31/2017 | | Purchases
Cost ($) | | | Sales
Proceeds ($) | | | Net
Realized
Gain/
(Loss) ($) | | | Net Change in
Unrealized
Appreciation
(Depreciation) ($) | | | Income ($) | | | Capital Gain
Distributions ($) | | | Number of
Shares at
12/31/2018 | | | Value ($) at
12/31/2018 | |
Securities Lending Collateral 0.4% | |
DWS Government & Agency Securities Portfolio “DWS Government Cash Institutional Shares”, 2.29% (d) (e) | |
| 395,119 | | | — | | | | 283,494 | (f) | | | — | | | | — | | | | 3,657 | | | | — | | | | 111,625 | | | | 111,625 | |
Cash Equivalent 1.0% | |
DWS Central Cash Management Government Fund, 2.41% (d) | |
| 480,743 | | | 8,034,940 | | | | 8,277,153 | | | | — | | | | — | | | | 5,295 | | | | — | | | | 238,530 | | | | 238,530 | |
| 875,862 | | | 8,034,940 | | | | 8,560,647 | | | | — | | | | — | | | | 8,952 | | | | — | | | | 350,155 | | | | 350,155 | |
| * | Non-income producing security. |
| (a) | Securities with the same description are the same corporate entity but trade on different stock exchanges. |
| (b) | Listed on the New York Stock Exchange. |
| (c) | All or a portion of these securities were on loan. In addition, “Other Assets and Liabilities, Net” may include pending sales that are also on loan. The value of securities loaned at December 31, 2018 amounted to $108,332, which is 0.4% of net assets. |
| (d) | Affiliated fund managed by DWS Investment Management Americas, Inc. The rate shown is the annualizedseven-day yield at period end. |
| (e) | Represents collateral held in connection with securities lending. Income earned by the Fund is net of borrower rebates. |
| (f) | Represents the net increase (purchase cost) or decrease (sales proceeds) in the amount invested for the year ended December 31, 2018. |
144A: Security exempt from registration under Rule 144A of the Securities Act of 1933. These securities may be resold in transactions exempt from registration, normally to qualified institutional buyers.
ADR: American Depositary Receipt
The accompanying notes are an integral part of the financial statements.
| | | | | | |
| | 8 | | | | | | Deutsche DWS Variable Series II — DWS Global Equity VIP |
Fair Value Measurements
Various inputs are used in determining the value of the Fund’s investments. These inputs are summarized in three broad levels. Level 1 includes quoted prices in active markets for identical securities. Level 2 includes other significant observable inputs (including quoted prices for similar securities, interest rates, prepayment speeds and credit risk). Level 3 includes significant unobservable inputs (including the Fund’s own assumptions in determining the fair value of investments). The level assigned to the securities valuations may not be an indication of the risk or liquidity associated with investing in those securities.
The following is a summary of the inputs used as of December 31, 2018 in valuing the Fund’s investments. For information on the Fund’s policy regarding the valuation of investments, please refer to the Security Valuation section of Note A in the accompanying Notes to Financial Statements.
| | | | | | | | | | | | | | | | |
| Assets | | Level 1 | | | Level 2 | | | Level 3 | | | Total | |
| Common Stocks | | | | | | | | | | | | | | | | |
Argentina | | $ | 366,080 | | | $ | — | | | $ | — | | | $ | 366,080 | |
Canada | | | 1,758,921 | | | | — | | | | — | | | | 1,758,921 | |
China | | | 628,420 | | | | 1,092,333 | | | | — | | | | 1,720,753 | |
France | | | — | | | | 684,044 | | | | — | | | | 684,044 | |
Germany | | | — | | | | 2,373,637 | | | | — | | | | 2,373,637 | |
Ireland | | | — | | | | 406,598 | | | | — | | | | 406,598 | |
Japan | | | — | | | | 1,224,714 | | | | — | | | | 1,224,714 | |
Luxembourg | | | — | | | | 261,762 | | | | — | | | | 261,762 | |
Malaysia | | | — | | | | 178,041 | | | | — | | | | 178,041 | |
Norway | | | — | | | | 151,819 | | | | — | | | | 151,819 | |
Sweden | | | 261,050 | | | | 136,297 | | | | — | | | | 397,347 | |
Switzerland | | | — | | | | 1,100,500 | | | | — | | | | 1,100,500 | |
United Kingdom | | | 254,380 | | | | 1,063,756 | | | | — | | | | 1,318,136 | |
United States | | | 12,650,146 | | | | — | | | | — | | | | 12,650,146 | |
| Short-Term Investments (g) | | | 350,155 | | | | — | | | | — | | | | 350,155 | |
| Total | | $ | 16,269,152 | | | $ | 8,673,501 | | | $ | — | | | $ | 24,942,653 | |
| (g) | See Investment Portfolio for additional detailed categorizations. |
The accompanying notes are an integral part of the financial statements.
| | | | |
Deutsche DWS Variable Series II — DWS Global Equity VIP | | | | | 9 |
| | | | |
Statement of
Assets and Liabilities | |
| As of December 31, 2018 | | | | |
| |
| Assets | | | | |
| Investments innon-affiliated securities, at value (cost $20,843,327) — including $108,332 of securities loaned | | $ | 24,592,498 | |
| Investment in DWS Government & Agency Securities Portfolio (cost $111,625)* | | | 111,625 | |
| Investment in DWS Central Cash Management Government Fund (cost $238,530) | | | 238,530 | |
| Foreign currency, at value (cost $172,844) | | | 168,056 | |
| Dividends receivable | | | 13,717 | |
| Interest receivable | | | 1,291 | |
| Foreign taxes recoverable | | | 32,361 | |
| Other assets | | | 811 | |
| Total assets | | | 25,158,889 | |
| |
| Liabilities | | | | |
| Payable upon return of securities loaned | | | 111,625 | |
| Payable for Fund shares redeemed | | | 14,757 | |
| Accrued management fee | | | 11,988 | |
| Accrued Trustees’ fees | | | 855 | |
| Other accrued expenses and payables | | | 90,991 | |
| Total liabilities | | | 230,216 | |
| Net assets, at value | | $ | 24,928,673 | |
| |
| Net Assets Consist of | | | | |
| Distributable earnings (loss) | | | 5,980,276 | |
| Paid-in capital | | | 18,948,397 | |
| Net assets, at value | | $ | 24,928,673 | |
| |
| Net Asset Value | | | | |
Class A | | | | |
| Net asset value, offering and redemption price per share ($24,928,673 ÷ 2,415,204 outstanding shares of beneficial interest, no par value, unlimited number of shares authorized) | | $ | 10.32 | |
| * | Represents collateral on securities loaned. |
| | | | |
Statement of Operations | |
| For the year ended December 31, 2018 | |
| |
| Investment Income | | | | |
| Income: | | | | |
| Dividends (net of foreign taxes withheld of $37,062) | | $ | 408,457 | |
| Income distributions — DWS Central Cash Management Government Fund | | | 5,295 | |
| Securities lending income, net of borrower rebates | | | 3,657 | |
| Other income | | | 1,300 | |
| Total income | | | 418,709 | |
| Expenses: | | | | |
| Management fee | | | 189,891 | |
| Administration fee | | | 29,214 | |
| Services to Shareholders | | | 261 | |
| Custodian fee | | | 25,250 | |
| Professional fees | | | 75,058 | |
| Reports to shareholders | | | 20,523 | |
| Trustees’ fees and expenses | | | 3,189 | |
| Other | | | 13,151 | |
| Total expenses before expense reductions | | | 356,537 | |
| Expense reductions | | | (87,556 | ) |
| Total expenses after expense reductions | | | 268,981 | |
| Net investment income | | | 149,728 | |
| |
| Realized and Unrealized Gain (Loss) | | | | |
| Net realized gain (loss) from: | | | | |
| Investments | | | 2,193,058 | |
| Foreign currency | | | (3,970 | ) |
| | | | 2,189,088 | |
| Change in net unrealized appreciation (depreciation) on: | | | | |
| Investments | | | (5,424,485 | ) |
| Foreign currency | | | (6,714 | ) |
| | | | (5,431,199) | |
| Net gain (loss) | | | (3,242,111 | ) |
| Net increase (decrease) in net assets resulting from operations | | $ | (3,092,383 | ) |
The accompanying notes are an integral part of the financial statements.
| | | | | | |
| | 10 | | | | | | Deutsche DWS Variable Series II — DWS Global Equity VIP |
| | | | |
| Statements of Changes in Net Assets | | | | |
| | | | | | | | |
| | | Years Ended December 31, | |
| Increase (Decrease) in Net Assets | | 2018 | | | 2017 | |
| Operations: | | | | | | | | |
| Net investment income (loss) | | $ | 149,728 | | | $ | 215,910 | |
| Net realized gain (loss) | | | 2,189,088 | | | | 5,321,643 | |
| Change in net unrealized appreciation (depreciation) | | | (5,431,199 | ) | | | 3,917,327 | |
| Net increase (decrease) in net assets resulting from operations | | | (3,092,383 | ) | | | 9,454,880 | |
| Distributions to shareholders: | | | | | | | | |
Class A | | | (219,217 | ) | | | (233,988 | )* |
| Fund share transactions: | | | | | | | | |
Class A | | | | | | | | |
| Proceeds from shares sold | | | 730,055 | | | | 1,174,131 | |
| Reinvestment of distributions | | | 219,217 | | | | 233,988 | |
| Payments for shares redeemed | | | (3,317,394 | ) | | | (23,512,478 | ) |
| Net increase (decrease) in net assets from Class A share transactions | | | (2,368,122 | ) | | | (22,104,359 | ) |
| Increase (decrease) in net assets | | | (5,679,722 | ) | | | (12,883,467 | ) |
| Net assets at beginning of year | | | 30,608,395 | | | | 43,491,862 | |
| | |
| Net assets at end of year | | | 24,928,673 | | | | 30,608,395 | ** |
| | |
| Other Information | | | | | | | | |
Class A | | | | | | | | |
| Shares outstanding at beginning of period | | | 2,616,821 | | | | 4,587,493 | |
| Shares sold | | | 62,443 | | | | 110,161 | |
| Shares issued to shareholders in reinvestment of distributions | | | 19,281 | | | | 22,499 | |
| Shares redeemed | | | (283,341 | ) | | | (2,103,332 | ) |
| Net increase (decrease) in Class A shares | | | (201,617 | ) | | | (1,970,672 | ) |
| | |
| Shares outstanding at end of period | | | 2,415,204 | | | | 2,616,821 | |
| * | Includes distributions from net investment income. |
| ** | Includes undistributed net investment income of $209,108. |
The accompanying notes are an integral part of the financial statements.
| | | | |
Deutsche DWS Variable Series II — DWS Global Equity VIP | | | | | 11 |
| | | | | | | | | | | | | | | | | | | | |
| | | Years Ended December 31, | |
| Class A | | 2018 | | | 2017 | | | 2016 | | | 2015 | | | 2014 | |
| | | | | |
| Selected Per Share Data | | | | | | | | | | | | | | | | | | | | |
| Net asset value, beginning of period | | $ | 11.70 | | | $ | 9.48 | | | $ | 9.00 | | | $ | 9.21 | | | $ | 9.27 | |
| Income (loss) from investment operations: | | | | | | | | | | | | | | | | | | | | |
| | | | | |
Net investment incomea | | | .06 | | | | .05 | | | | .04 | | | | .05 | | | | .06 | |
Net realized and unrealized gain (loss) | | | (1.35 | ) | | | 2.22 | | | | .51 | | | | (.21 | ) | | | .04 | |
Total from investment operations | | | (1.29 | ) | | | 2.27 | | | | .55 | | | | (.16 | ) | | | .10 | |
| Less distributions from: | | | | | | | | | | | | | | | | | | | | |
Net investment income | | | (.09 | ) | | | (.05 | ) | | | (.07 | ) | | | (.05 | ) | | | (.16 | ) |
| Net asset value, end of period | | $ | 10.32 | | | $ | 11.70 | | | $ | 9.48 | | | $ | 9.00 | | | $ | 9.21 | |
| Total Return (%) | | | (11.12 | )b | | | 24.04 | b | | | 6.11 | b,c | | | (1.75 | )b | | | 1.14 | |
| | | | | |
| Ratios to Average Net Assets and Supplemental Data | | | | | | | | | | | | | | | | | | | | |
| Net assets, end of period ($ millions) | | | 25 | | | | 31 | | | | 43 | | | | 49 | | | | 68 | |
| Ratio of expenses before expense reductions (%)d | | | 1.22 | | | | 1.06 | | | | 1.03 | | | | 1.00 | | | | .95 | |
| Ratio of expenses after expense reductions (%)d | | | .92 | | | | .95 | | | | .95 | | | | .91 | | | | .95 | |
| Ratio of net investment income (%) | | | .51 | | | | .49 | | | | .49 | | | | .58 | | | | .59 | |
| Portfolio turnover rate (%) | | | 43 | | | | 19 | | | | 46 | | | | 79 | | | | 78 | |
| a | Based on average shares outstanding during the period. |
| b | Total return would have been lower had certain expenses not been reimbursed. |
| c | Includes a reimbursement by the Advisor for a realized loss on a trade executed incorrectly, which otherwise would have reduced total return by 0.31%. |
| d | Expense ratio does not reflect charges and fees associated with the separate account that invests in the Fund or any variable life insurance policy or variable annuity contract for which the Fund is an investment option. |
The accompanying notes are an integral part of the financial statements.
| | | | | | |
| | 12 | | | | | | Deutsche DWS Variable Series II — DWS Global Equity VIP |
| | |
| Notes to Financial Statements | | |
A. Organization and Significant Accounting Policies
DWS Global Equity VIP (formerly Deutsche Global Equity VIP) (the “Fund”) is a diversified series of Deutsche DWS Variable Series II (formerly Deutsche Variable Series II) (the “Trust”), which is registered under the Investment Company Act of 1940, as amended (the “1940 Act”), as anopen-end management investment company organized as a Massachusetts business trust.
The Fund’s financial statements are prepared in accordance with accounting principles generally accepted in the United States of America (“U.S. GAAP”) which require the use of management estimates. Actual results could differ from those estimates. The Fund qualifies as an investment company under Topic 946 of Accounting Standards Codification of U.S. GAAP. The policies described below are followed consistently by the Fund in the preparation of its financial statements.
In October 2018, the Securities and Exchange Commission adopted amendments to certain disclosure requirements in Securities Act Release No. 33-10532, Disclosure Update and Simplification, which is intended to facilitate the disclosure of information to investors and simplify compliance without significantly altering the total mix of information provided to investors. Effective with the current reporting period, the Fund adopted the amendments with the impacts being that the Fund is no longer required to present components of distributable earnings on the Statement of Assets and Liabilities or the sources of distributable earnings and the amount of undistributed net investment income on the Statements of Changes in Net Assets.
Security Valuation. Investments are stated at value determined as of the close of regular trading on the New York Stock Exchange on each day the exchange is open for trading.
Various inputs are used in determining the value of the Fund’s investments. These inputs are summarized in three broad levels. Level 1 includes quoted prices in active markets for identical securities. Level 2 includes other significant observable inputs (including quoted prices for similar securities, interest rates, prepayment speeds and credit risk). Level 3 includes significant unobservable inputs (including the Fund’s own assumptions in determining the fair value of investments). The level assigned to the securities valuations may not be an indication of the risk or liquidity associated with investing in those securities.
Equity securities are valued at the most recent sale price or official closing price reported on the exchange (U.S. or foreign) orover-the-counter market on which they trade. Securities for which no sales are reported are valued at the calculated mean between the most recent bid and asked quotations on the relevant market or, if a mean cannot be determined, at the most recent bid quotation. Equity securities are generally categorized as Level 1. For certain international equity securities, in order to adjust for events which may occur between the close of the foreign exchanges and the close of the New York Stock Exchange, a fair valuation model may be used. This fair valuation model takes into account comparisons to the valuation of American Depository Receipts (ADRs), futures contracts and certain indices and these securities are categorized as Level 2.
Investments inopen-end investment companies are valued at their net asset value each business day and are categorized as Level 1.
Securities and other assets for which market quotations are not readily available or for which the above valuation procedures are deemed not to reflect fair value are valued in a manner that is intended to reflect their fair value as determined in accordance with procedures approved by the Board and are generally categorized as Level 3. In accordance with the Fund’s valuation procedures, factors considered in determining value may include, but are not limited to, the type of the security; the size of the holding; the initial cost of the security; the existence of any contractual restrictions on the security’s disposition; the price and extent of public trading in similar securities of the issuer or of comparable companies; quotations or evaluated prices frombroker-dealers and/or pricing services; information obtained from the issuer, analysts, and/or the appropriate stock exchange (forexchange-traded securities); an analysis of the company’s or issuer’s financial statements; an evaluation of the forces that influence the issuer and the market(s) in which the security is purchased and sold; and with respect to debt securities, the maturity, coupon, creditworthiness, currency denomination and the movement of the market in which the security is normally traded. The value determined under these procedures may differ from published values for the same securities.
Disclosure about the classification of fair value measurements is included in a table following the Fund’s Investment Portfolio.
| | | | |
Deutsche DWS Variable Series II — DWS Global Equity VIP | | | | | 13 |
Securities Lending. Deutsche Bank AG, as lending agent, lends securities of the Fund to certain financial institutions under the terms of its securities lending agreement. During the term of the loans, the Fund continues to receive interest and dividends generated by the securities and to participate in any changes in their market value. The Fund requires the borrowers of the securities to maintain collateral with the Fund consisting of either cash or liquid, unencumbered assets having a value at least equal to the value of the securities loaned. When the collateral falls below specified amounts, the lending agent will use its best effort to obtain additional collateral on the next business day to meet required amounts under the securities lending agreement. As of period end, any securities on loan were collateralized by cash. During the year ended December 31, 2018, the Fund invested the cash collateral into a joint trading account in affiliated money market funds managed by DWS Investment Management Americas, Inc. As of December 31, 2018, the Fund invested the cash collateral in DWS Government & Agency Securities Portfolio. DWS Investment Management Americas, Inc. receives a management/administration fee (0.12% annualized effective rate as of December 31, 2018) on the cash collateral invested in DWS Government & Agency Securities Portfolio. The Fund receives compensation for lending its securities either in the form of fees or by earning interest on invested cash collateral net of borrower rebates and fees paid to a lending agent. Either the Fund or the borrower may terminate the loan at any time, and the borrower, after notice, is required to return borrowed securities within a standard time period. There may be risks of delay and costs in recovery of securities or even loss of rights in the collateral should the borrower of the securities fail financially. If the Fund is not able to recover securities lent, the Fund may sell the collateral and purchase a replacement investment in the market, incurring the risk that the value of the replacement security is greater than the value of the collateral. The Fund is also subject to all investment risks associated with the reinvestment of any cash collateral received, including, but not limited to, interest rate, credit and liquidity risk associated with such investments.
As of December 31, 2018, the Fund had securities on loan, which were classified as common stocks in the Investment Portfolio. The value of the related collateral exceeded the value of the securities loaned at period end. As of period end, the remaining contractual maturity of the collateral agreements were overnight and continuous.
Foreign Currency Translations. The books and records of the Fund are maintained in U.S. dollars. Investment securities and other assets and liabilities denominated in a foreign currency are translated into U.S. dollars at the prevailing exchange rates at period end. Purchases and sales of investment securities, income and expenses are translated into U.S. dollars at the prevailing exchange rates on the respective dates of the transactions.
Net realized and unrealized gains and losses on foreign currency transactions represent net gains and losses between trade and settlement dates on securities transactions, the acquisition and disposition of foreign currencies, and the difference between the amount of net investment income accrued and the U.S. dollar amount actually received. The portion of both realized and unrealized gains and losses on investments that results from fluctuations in foreign currency exchange rates is not separately disclosed but is included with net realized and unrealized gain/appreciation and loss/depreciation on investments.
Taxes. The Fund’s policy is to comply with the requirements of the Internal Revenue Code, as amended, which are applicable to regulated investment companies, and to distribute all of its taxable income to its shareholders.
Additionally, the Fund may be subject to taxes imposed by the governments of countries in which it invests and are generally based on income and/or capital gains earned or repatriated, a portion of which may be recoverable. Based upon the current interpretation of the tax rules and regulations, estimated tax liabilities and recoveries on certain foreign securities are recorded on an accrual basis and are reflected as components of interest income or net change in unrealized gain/loss on investments. Tax liabilities realized as a result of security sales are reflected as a component of net realized gain/loss on investments.
The Fund has reviewed the tax positions for the open tax years as of December 31, 2018 and has determined that no provision for income tax and/or uncertain tax positions is required in the Fund’s financial statements. The Fund’s federal tax returns for the prior three fiscal years remain open subject to examination by the Internal Revenue Service.
Distribution of Income and Gains. Distributions from net investment income of the Fund, if any, are declared and distributed to shareholders annually. Net realized gains from investment transactions, in excess of available capital loss carryforwards, would be taxable to the Fund if not distributed and, therefore, will be distributed to shareholders at least annually. The Fund may also make additional distributions for tax purposes if necessary.
The timing and characterization of certain income and capital gain distributions are determined annually in accordance with federal tax regulations which may differ from accounting principles generally accepted in the
| | | | | | |
| | 14 | | | | | | Deutsche DWS Variable Series II — DWS Global Equity VIP |
United States of America. These differences primarily relate to investments in foreign denominated investments and certain securities sold at a loss. As a result, net investment income (loss) and net realized gain (loss) on investment transactions for a reporting period may differ significantly from distributions during such period. Accordingly, the Fund may periodically make reclassifications among certain of its capital accounts without impacting the net asset value of the Fund.
At December 31, 2018, the Fund’s components of distributable earnings on a tax basis were as follows:
| | | | |
| Undistributed ordinary income* | | $ | 135,649 | |
| Undistributed long-term capital gains | | $ | 2,166,350 | |
| Unrealized appreciation (depreciation) on investments | | $ | 3,684,241 | |
At December 31, 2018, the aggregate cost of investments for federal income tax purposes was $21,258,412. The net unrealized appreciation for all investments based on tax cost was $3,684,241. This consisted of aggregate gross unrealized appreciation for all investments in which there was an excess of value over tax cost of $5,635,343 and aggregate gross unrealized depreciation for all investments in which there was an excess of tax cost over value of $1,951,102.
In addition, the tax character of distributions paid by the Fund is summarized as follows:
| | | | | | | | |
| | | Years Ended December 31, | |
| | | 2018 | | | 2017 | |
| Distributions from ordinary income* | | $ | 219,217 | | | $ | 233,988 | |
| * | For tax purposes, short-term capital gain distributions are considered ordinary income distributions. |
Expenses. Expenses of the Trust arising in connection with a specific fund are allocated to that fund. Other Trust expenses which cannot be directly attributed to a fund are apportioned among the funds in the Trust based upon the relative net assets or other appropriate measures.
Contingencies. In the normal course of business, the Fund may enter into contracts with service providers that contain general indemnification clauses. The Fund’s maximum exposure under these arrangements is unknown, as this would involve future claims that may be made against the Fund that have not yet been made. However, based on experience, the Fund expects the risk of loss to be remote.
Other. Investment transactions are accounted for on a trade date plus one basis for daily net asset value calculations. However, for financial reporting purposes, investment transactions are reported on trade date. Interest income is recorded on the accrual basis. Dividend income is recorded on theex-dividend date net of foreign withholding taxes. Certain dividends from foreign securities may be recorded subsequent to theex-dividend date as soon as the Fund is informed of such dividends. Realized gains and losses from investment transactions are recorded on an identified cost basis. Proceeds from litigation payments, if any, are included in net realized gain (loss) from investments.
B. Purchases and Sales of Securities
During the year ended December 31, 2018, purchases and sales of investment transactions (excludingshort-term investments) aggregated $12,243,780 and $14,548,496, respectively.
C. Related Parties
Management Agreement. Under the Investment Management Agreement with DWS Investment Management Americas, Inc. (formerly Deutsche Investment Management Americas Inc.) (“DIMA” or the “Advisor”), an indirect, wholly owned subsidiary of DWS Group GmbH & Co. KGaA (“DWS Group”), the Advisor directs the investments of the Fund in accordance with its investment objectives, policies and restrictions. The Advisor determines the securities, instruments and other contracts relating to investments to be purchased, sold or entered into by the Fund.
Pursuant to the Investment Management Agreement with the Advisor, the Fund pays a monthly management fee based on the Fund’s average daily net assets, computed and accrued daily and payable monthly, at the following annual rates:
| | | | |
| First $1.5 billion | | | .650 | % |
| Next $1.75 billion | | | .635 | % |
| Next $1.75 billion | | | .620 | % |
| Over $5 billion | | | .605 | % |
| | | | |
Deutsche DWS Variable Series II — DWS Global Equity VIP | | | | | 15 |
Accordingly, for the year ended December 31, 2018, the fee pursuant to the Investment Management Agreement was equivalent to an annual rate (exclusive of any applicable waivers/reimbursements) of 0.65% of the Fund’s average daily net assets.
For the period from January 1, 2018 through September 30, 2018, the Advisor had contractually agreed to waive its fee and/or reimburse certain operating expenses to the extent necessary to maintain the total annual operating expenses (excluding certain expenses such as extraordinary expenses, taxes, brokerage and interest expense) of Class A shares at 0.93%.
Effective October 1, 2018 through September 30, 2019, the Advisor has contractually agreed to waive its fee and/or reimburse certain operating expenses to the extent necessary to maintain the total annual operating expenses (excluding certain expenses such as extraordinary expenses, taxes, brokerage and interest expense) of Class A shares at 0.89%.
For the year ended December 31, 2018, fees waived and/or expenses reimbursed were $87,556.
Administration Fee. Pursuant to an Administrative Services Agreement, DIMA provides most administrative services to the Fund. For all services provided under the Administrative Services Agreement, the Fund pays DIMA an annual fee (“Administration Fee”) of 0.10% of the Fund’s average daily net assets, computed and accrued daily and payable monthly. For the year ended December 31, 2018, the Administration Fee was $29,214, of which $2,191 is unpaid.
Service Provider Fees. DWS Service Company (“DSC”), an affiliate of the Advisor, is the transfer agent,dividend-paying agent and shareholder service agent for the Fund. Pursuant to asub-transfer agency agreement between DSC and DST Systems, Inc. (“DST”), DSC has delegated certain transfer agent,dividend-paying agent and shareholder service agent functions to DST. DSC compensates DST out of the shareholder servicing fee it receives from the Fund. For the year ended December 31, 2018, the amounts charged to the Fund by DSC aggregated $81, of which $13 is unpaid.
Typesetting and Filing Service Fees. Under an agreement with the Fund, DIMA is compensated for providing certainpre-press and regulatory filing services to the Fund. For the year ended December 31, 2018, the amount charged to the Fund by DIMA included in the Statement of Operations under “Reports to shareholders” aggregated $7,931, of which $5,498 is unpaid.
Trustees’ Fees and Expenses. The Fund paid retainer fees to each Trustee not affiliated with the Advisor, plus specified amounts to the Board Chairperson and to each committee Chairperson.
Affiliated Cash Management Vehicles. The Fund may invest uninvested cash balances in DWS Central Cash Management Government Fund and DWS ESG Liquidity Fund, affiliated money market funds which are managed by the Advisor. Each affiliated money market fund is managed in accordance withRule 2a-7 under the 1940 Act, which governs the quality, maturity, diversity and liquidity of instruments in which a money market fund may invest. DWS Central Cash Management Government Fund seeks to maintain a stable net asset value, and DWS ESG Liquidity Fund maintains a floating net asset value. The Fund indirectly bears its proportionate share of the expenses of each affiliated money market fund in which it invests. DWS Central Cash Management Government Fund does not pay the Advisor an investment management fee. To the extent that DWS ESG Liquidity Fund pays an investment management fee to the Advisor, the Advisor will waive an amount of the investment management fee payable to the Advisor by the Fund equal to the amount of the investment management fee payable on the Fund’s assets invested in DWS ESG Liquidity Fund.
Securities Lending Fees. Deutsche Bank AG serves as lending agent for the Fund. For the year ended December 31, 2018, the Fund incurred lending agent fees to Deutsche Bank AG in the amount of $263.
D. Ownership of the Fund
At December 31, 2018, one participating insurance company was owner of record of 10% or more of the total outstanding Class A shares of the Fund, owning 99%.
E. Line of Credit
The Fund and other affiliated funds (the “Participants”) share in a $400 million revolving credit facility provided by a syndication of banks. The Fund may borrow for temporary or emergency purposes, including the meeting of redemption requests that otherwise might require the untimely disposition of securities. The Participants are charged an annual commitment fee which is allocated based on net assets, among each of the Participants. Interest is calculated at a rate per annum equal to the sum of the Federal Funds Rate plus 1.25 percent plus if theone-month LIBOR exceeds the Federal Funds Rate, the amount of such excess. The Fund may borrow up to a maximum of 33 percent of its net assets under the agreement. The Fund had no outstanding loans at December 31, 2018.
| | | | | | |
| | 16 | | | | | | Deutsche DWS Variable Series II — DWS Global Equity VIP |
Report of Independent Registered Public Accounting Firm
To the Board of Trustees of Deutsche DWS Variable Series II and Shareholders of DWS Global Equity VIP:
Opinion on the Financial Statements
We have audited the accompanying statement of assets and liabilities of DWS Global Equity VIP (formerly Deutsche Global Equity VIP) (the “Fund”) (one of the funds constituting Deutsche DWS Variable Series II (formerly Deutsche Variable Series II)) (the “Trust”), including the investment portfolio, as of December 31, 2018, and the related statement of operations for the year then ended, the statements of changes in net assets for each of the two years in the period then ended, the financial highlights for each of the five years in the period then ended and the related notes (collectively referred to as the “financial statements”). In our opinion, the financial statements present fairly, in all material respects, the financial position of the Fund (one of the funds constituting Deutsche DWS Variable Series II) at December 31, 2018, the results of its operations for the year then ended, the changes in its net assets for each of the two years in the period then ended and its financial highlights for each of the five years in the period then ended, in conformity with U.S. generally accepted accounting principles.
Basis for Opinion
These financial statements are the responsibility of the Trust’s management. Our responsibility is to express an opinion on the Fund’s financial statements based on our audits. We are a public accounting firm registered with the Public Company Accounting Oversight Board (United States) (“PCAOB”) and are required to be independent with respect to the Trust in accordance with the U.S. federal securities laws and the applicable rules and regulations of the Securities and Exchange Commission and the PCAOB.
We conducted our audits in accordance with the standards of the PCAOB. Those standards require that we plan and perform the audit to obtain reasonable assurance about whether the financial statements are free of material misstatement, whether due to error or fraud. The Trust is not required to have, nor were we engaged to perform, an audit of the Trust’s internal control over financial reporting. As part of our audits, we are required to obtain an understanding of internal control over financial reporting, but not for the purpose of expressing an opinion on the effectiveness of the Trust’s internal control over financial reporting. Accordingly, we express no such opinion.
Our audits included performing procedures to assess the risks of material misstatement of the financial statements, whether due to error or fraud, and performing procedures that respond to those risks. Such procedures included examining, on a test basis, evidence regarding the amounts and disclosures in the financial statements. Our procedures included confirmation of securities owned as of December 31, 2018, by correspondence with the custodian and brokers. Our audits also included evaluating the accounting principles used and significant estimates made by management, as well as evaluating the overall presentation of the financial statements. We believe that our audits provide a reasonable basis for our opinion.

We have served as the auditor of one or more investment companies in the DWS family of funds since at least 1979, but we are unable to determine the specific year.
Boston, Massachusetts
February 14, 2019
| | | | |
Deutsche DWS Variable Series II — DWS Global Equity VIP | | | | | 17 |
| | |
| Information About Your Fund’s Expenses | | (Unaudited) |
As an investor of the Fund, you incur two types of costs: ongoing expenses and transaction costs. Ongoing expenses include management fees and other Fund expenses. Examples of transaction costs include contract charges, which are not shown in this section. The following tables are intended to help you understand your ongoing expenses (in dollars) of investing in the Fund and to help you compare these expenses with the ongoing expenses of investing in other mutual funds. In the most recentsix-month period, the Fund limited these expenses; had it not done so, expenses would have been higher. The example in the table is based on an investment of $1,000 invested at the beginning of thesix-month period and held for the entire period (July 1, 2018 to December 31, 2018).
The tables illustrate your Fund’s expenses in two ways:
| – | | Actual Fund Return. This helps you estimate the actual dollar amount of ongoing expenses (but not transaction costs) paid on a $1,000 investment in the Fund using the Fund’s actual return during the period. To estimate the expenses you paid over the period, simply divide your account value by $1,000 (for example, an $8,600 account value divided by $1,000 = 8.6), then multiply the result by the number in the “Expenses Paid per $1,000” line under the share class you hold. |
| – | | Hypothetical 5% Fund Return. This helps you to compare your Fund’s ongoing expenses (but not transaction costs) with those of other mutual funds using the Fund’s actual expense ratio and a hypothetical rate of return of 5% per year before expenses. Examples using a 5% hypothetical Fund return may be found in the shareholder reports of other mutual funds. The hypothetical account values and expenses may not be used to estimate the actual ending account balance or expenses you paid for the period. |
Please note that the expenses shown in these tables are meant to highlight your ongoing expenses only and do not reflect any transaction costs. The “Expenses Paid per $1,000” line of the tables is useful in comparing ongoing expenses only and will not help you determine the relative total expense of owning different funds. If these transaction costs had been included, your costs would have been higher.
| | | | |
| Expenses and Value of a $1,000 Investment for the six months ended December 31, 2018 | | | |
| |
| Actual Fund Return | | | Class A | |
| Beginning Account Value 7/1/18 | | $ | 1,000.00 | |
| Ending Account Value 12/31/18 | | $ | 884.30 | |
| Expenses Paid per $1,000* | | $ | 4.32 | |
| |
| Hypothetical 5% Fund Return | | | Class A | |
| Beginning Account Value 7/1/18 | | $ | 1,000.00 | |
| Ending Account Value 12/31/18 | | $ | 1,020.62 | |
| Expenses Paid per $1,000* | | $ | 4.63 | |
| * | Expenses are equal to the Fund’s annualized expense ratio, multiplied by the average account value over the period, multiplied by 184 (the number of days in the most recentsix-month period), then divided by 365. |
| | | | |
| Annualized Expense Ratio | | Class A | |
| Deutsche DWS Variable Series II — DWS Global Equity VIP | | | .91 | % |
For more information, please refer to the Fund’s prospectus.
These tables do not reflect charges and fees (“contract charges”) associated with the separate account that invests in the Fund or any variable life insurance policy or variable annuity contract for which the Fund is an investment option.
For an analysis of the fees associated with an investment in the Fund or similar funds, please refer to the current and hypothetical expense calculators for Variable Insurance Products which can be found at dws.com/calculators.
| | | | | | |
| | 18 | | | | | | Deutsche DWS Variable Series II — DWS Global Equity VIP |
| | |
| Tax Information | | (Unaudited) |
For corporate shareholders, 100% of the ordinary dividends (i.e., income dividends plus short-term capital gains) paid during the Fund’s fiscal year ended December 31, 2018, qualified for the dividends received deduction.
Pursuant to Section 852 of the Internal Revenue Code, the Fund designates $2,383,000 as capital gain dividends for its year ended December 30, 2018.
Please consult a tax advisor if you have questions about federal or state income tax laws, or on how to prepare your tax returns. If you have specific questions about your account, please contact your insurance provider.
Proxy Voting
The Trust’s policies and procedures for voting proxies for portfolio securities and information about how the Trust voted proxies related to its portfolio securities during the most recent12-month period ended June 30 are available on our Web site — dws.com/en-us/resources/proxy-voting — or on the SEC’s Web site — sec.gov. To obtain a written copy of the Trust’s policies and procedures without charge, upon request, call us toll free at(800) 728-3337.
| | | | |
Deutsche DWS Variable Series II — DWS Global Equity VIP | | | | | 19 |
Advisory Agreement Board Considerations and Fee Evaluation
The Board of Trustees (hereinafter referred to as the “Board” or “Trustees”) approved the renewal of DWS Global Equity VIP’s (the “Fund”) investment management agreement (the “Agreement”) with DWS Investment Management Americas, Inc. (“DIMA”) in September 2018.
In terms of the process that the Board followed prior to approving the Agreement, shareholders should know that:
| – | | During the entire process, all of the Fund’s Trustees were independent of DIMA and its affiliates (the “Independent Trustees”). |
| – | | The Board met frequently during the past year to discuss fund matters and dedicated a substantial amount of time to contract review matters. Over the course of several months, the Board’s Contract Committee reviewed extensive materials received from DIMA, independent third parties and independent counsel. These materials included an analysis of the Fund’s performance, fees and expenses, and profitability from a fee consultant retained by the Fund’s Independent Trustees (the “Fee Consultant”). Based on its evaluation of the information provided, the Contract Committee presented its findings and recommendations to the Board. The Board then reviewed the Contract Committee’s findings and recommendations. |
| – | | The Board also received extensive information throughout the year regarding performance of the Fund. |
| – | | The Independent Trustees regularly met privately with counsel to discuss contract review and other matters. In addition, the Independent Trustees were advised by the Fee Consultant in the course of their review of the Fund’s contractual arrangements and considered a comprehensive report prepared by the Fee Consultant in connection with their deliberations. |
| – | | In connection with reviewing the Agreement, the Board also reviewed the terms of the Fund’s distribution agreement, administrative services agreement, transfer agency agreement and other material service agreements. |
In connection with the contract review process, the Contract Committee and the Board considered the factors discussed below, among others. The Board also considered that DIMA and its predecessors have managed the Fund since its inception, and the Board believes that a long-term relationship with a capable, conscientious advisor is in the best interests of the Fund. The Board considered, generally, that shareholders chose to invest or remain invested in the Fund knowing that DIMA managed the Fund. DIMA is part of DWS Group GmbH & Co. KGaA (“DWS Group”). DWS Group is a global asset management business that offers a wide range of investing expertise and resources, including research capabilities in many countries throughout the world. In 2018, approximately 20% of DWS Group’s shares were sold in an initial public offering, with Deutsche Bank AG owning the remaining shares.
As part of the contract review process, the Board carefully considered the fees and expenses of each DWS fund overseen by the Board in light of the fund’s performance. In many cases, this led to the negotiation and implementation of expense caps. As part of these negotiations, the Board indicated that it would consider relaxing these caps in future years following sustained improvements in performance, among other considerations.
While shareholders may focus primarily on fund performance and fees, the Fund’s Board considers these and many other factors, including the quality and integrity of DIMA’s personnel and administrative support services provided by DIMA, such as back-office operations, fund valuations, and compliance policies and procedures.
Nature, Quality and Extent of Services.The Board considered the terms of the Agreement, including the scope of advisory services provided under the Agreement. The Board noted that, under the Agreement, DIMA provides portfolio management services to the Fund and that, pursuant to a separate administrative services agreement, DIMA provides administrative services to the Fund. The Board considered the experience and skills of senior management and investment personnel and the resources made available to such personnel. The Board reviewed the Fund’s performance over short-term and long-term periods and compared those returns to various agreed-upon performance measures, including market index(es) and a peer universe compiled using information supplied by Morningstar Direct (“Morningstar”), an independent fund data service. The Board also noted that it has put into place a process of identifying “Funds in Review” (e.g., funds performing poorly relative to a peer universe), and receives additional reporting from DIMA regarding such funds and, where appropriate, DIMA’s plans to address underperformance. The Board
| | | | | | |
| | 20 | | | | | | Deutsche DWS Variable Series II — DWS Global Equity VIP |
believes this process is an effective manner of identifying and addressing underperforming funds. Based on the information provided, the Board noted that, for the one-, three- and five-year periods ended December 31, 2017, the Fund’s performance (Class A shares) was in the 3rd quartile, 3rd quartile and 4th quartile, respectively, of the applicable Morningstar universe (the 1st quartile being the best performers and the 4th quartile being the worst performers). The Board also observed that the Fund has outperformed its benchmark in the one-year period and has underperformed its benchmark in the three- and five-year periods ended December 31, 2017.
Fees and Expenses. The Board considered the Fund’s investment management fee schedule, operating expenses and total expense ratios, and comparative information provided by Broadridge Financial Solutions, Inc. (“Broadridge”) and the Fee Consultant regarding investment management fee rates paid to other investment advisors by similar funds (1st quartile being the most favorable and 4th quartile being the least favorable). With respect to management fees paid to other investment advisors by similar funds, the Board noted that the contractual fee rates paid by the Fund, which include a 0.10% fee paid to DIMA under the Fund’s administrative services agreement, were equal to the median of the applicable Broadridge peer group (based on Broadridge data provided as of December 31, 2017). The Board noted that the Fund’s Class A shares total (net) operating expenses were expected to be higher than the median (3rd quartile) of the applicable Broadridge expense universe (based on Broadridge data provided as of December 31, 2017, and analyzing Broadridge expense universe Class A (net) expenses less any applicable 12b-1 fees) (“Broadridge Universe Expenses”). The Board noted that the expense limitation agreed to by DIMA was expected to help the Fund’s total (net) operating expenses remain competitive. The Board considered the Fund’s management fee rate as compared to fees charged by DIMA to comparable DWS U.S. registered funds (“DWS Funds”) and considered differences between the Fund and the comparable DWS Funds. The information requested by the Board as part of its review of fees and expenses also included information about institutional accounts (including any sub-advised funds and accounts) and funds offered primarily to European investors (“DWS Europe Funds”) managed by DWS Group. The Board noted that DIMA indicated that DWS Group does not manage any institutional accounts or DWS Europe Funds comparable to the Fund.
On the basis of the information provided, the Board concluded that management fees were reasonable and appropriate in light of the nature, quality and extent of services provided by DIMA.
Profitability. The Board reviewed detailed information regarding revenues received by DIMA under the Agreement. The Board considered the estimated costs to DIMA, and pre-tax profits realized by DIMA, from advising the DWS Funds, as well as estimates of the pre-tax profits attributable to managing the Fund in particular. The Board also received information regarding the estimated enterprise-wide profitability of DIMA and its affiliates with respect to all fund services in totality and by fund. The Board and the Fee Consultant reviewed DIMA’s methodology in allocating its costs to the management of the Fund. Based on the information provided, the Board concluded that the pre-tax profits realized by DIMA in connection with the management of the Fund were not unreasonable. The Board also reviewed certain publicly available information regarding the profitability of certain similar investment management firms. The Board noted that, while information regarding the profitability of such firms is limited (and in some cases is not necessarily prepared on a comparable basis), DIMA and its affiliates’ overall profitability with respect to the DWS Funds (after taking into account distribution and other services provided to the funds by DIMA and its affiliates) was lower than the overall profitability levels of most comparable firms for which such data was available.
Economies of Scale. The Board considered whether there are economies of scale with respect to the management of the Fund and whether the Fund benefits from any economies of scale. The Board noted that the Fund’s investment management fee schedule includes fee breakpoints. The Board concluded that the Fund’s fee schedule represents an appropriate sharing between the Fund and DIMA of such economies of scale as may exist in the management of the Fund at current asset levels.
Other Benefits to DIMA and Its Affiliates. The Board also considered the character and amount of other incidental or “fall-out” benefits received by DIMA and its affiliates, including any fees received by DIMA for administrative services provided to the Fund and any fees received by an affiliate of DIMA for transfer agency services provided to the Fund. The Board also considered benefits to DIMA related to brokerage and soft-dollar allocations, including allocating brokerage to pay for research generated by parties other than the executing broker dealers, which pertain primarily to funds investing in equity securities. In addition, the Board considered the incidental public relations benefits to DIMA related to DWS Funds advertising and cross-selling opportunities among DIMA products and services. The Board considered these benefits in reaching its conclusion that the Fund’s management fees were reasonable.
| | | | |
Deutsche DWS Variable Series II — DWS Global Equity VIP | | | | | 21 |
Compliance. The Board considered the significant attention and resources dedicated by DIMA to its compliance processes in recent years. The Board noted in particular (i) the experience, seniority and time commitment of the individuals serving as DIMA’s and the Fund’s chief compliance officers and (ii) the substantial commitment of resources by DIMA and its affiliates to compliance matters, including the retention of compliance personnel.
Based on all of the information considered and the conclusions reached, the Board unanimously determined that the continuation of the Agreement is in the best interests of the Fund. In making this determination, the Board did not give particular weight to any single factor identified above. The Board considered these factors over the course of numerous meetings, certain of which were in executive session with only the Independent Trustees and counsel present. It is possible that individual Independent Trustees may have weighed these factors differently in reaching their individual decisions to approve the continuation of the Agreement.
| | | | | | |
| | 22 | | | | | | Deutsche DWS Variable Series II — DWS Global Equity VIP |
Board Members and Officers
The following table presents certain information regarding the Board Members and Officers of the Fund. Each Board Member’s year of birth is set forth in parentheses after his or her name. Unless otherwise noted, (i) each Board Member has engaged in the principal occupation(s) noted in the table for at least the most recent five years, although not necessarily in the same capacity; and (ii) the address of each Independent Board Member is c/o Keith R. Fox, DWS Funds Board Chair, c/o Thomas R. Hiller, Ropes & Gray LLP, Prudential Tower, 800 Boylston Street, Boston, MA02199-3600. Except as otherwise noted below, the term of office for each Board Member is until the election and qualification of a successor, or until such Board Member sooner dies, resigns, is removed or as otherwise provided in the governing documents of the Fund. Because the Fund does not hold an annual meeting of shareholders, each Board Member will hold office for an indeterminate period. The Board Members may also serve in similar capacities with other funds in the fund complex.
| | | | | | | | |
| Independent Board Members | | | | | | |
Name, Year of Birth,
Position with the Fund and
Length of Time Served1 | | Business Experience and Directorships During the Past Five Years | | Number of
Funds in
DWS Fund
Complex
Overseen | | | Other
Directorships
Held by Board
Member
|
Keith R. Fox, CFA (1954) Chairperson since 2017, and Board Member since 1996 | | Managing General Partner, Exeter Capital Partners (a series of private investment funds) (since 1986). Directorships: Progressive International Corporation (kitchen goods importer and distributor); The Kennel Shop (retailer); former Chairman, National Association of Small Business Investment Companies; former Directorships: BoxTop Media Inc. (advertising); Sun Capital Advisers Trust (mutual funds) (2011–2012) | | | 82 | | | — |
John W. Ballantine (1946) Board Member since 1999 | | Retired; formerly, Executive Vice President and Chief Risk Management Officer, First Chicago NBD Corporation/The First National Bank of Chicago (1996–1998); Executive Vice President and Head of International Banking (1995–1996); former Directorships: Director and former Chairman of the Board, Healthways, Inc.2 (population well-being and wellness services) (2003–2014); Stockwell Capital Investments PLC (private equity); Enron Corporation; FNB Corporation; Tokheim Corporation; First Oak Brook Bancshares, Inc. and Oak Brook Bank; Prisma Energy International; Public Radio International. Not-for-Profit Director, Trustee: Palm Beach Civic Association; Window to the World Communications (public media); Harris Theater for Music and Dance (Chicago); Life Director of Hubbard Street Dance Chicago | | | 82 | | | Portland
General
Electric2
(utility
company)
(2003–
present) |
Henry P. Becton, Jr. (1943) Board Member since 1990 | | Vice Chair and former President, WGBH Educational Foundation. Directorships: Public Radio International; Public Radio Exchange (PRX); The Pew Charitable Trusts (charitable organization); Massachusetts Humane Society; Overseer of the New England Conservatory; former Directorships: Becton Dickinson and Company2 (medical technology company); Belo Corporation2 (media company); The PBS Foundation; Association of Public Television Stations; Boston Museum of Science; American Public Television; Concord Academy; New England Aquarium; Mass. Corporation for Educational Telecommunications; Committee for Economic Development; Public Broadcasting Service; Connecticut College; North Bennett Street School (Boston); American Documentary, Inc. (public media) | | | 82 | | | — |
Dawn-Marie Driscoll (1946) Board Member since 1987 | | Emeritus Executive Fellow, Center for Business Ethics, Bentley University; formerly: President, Driscoll Associates (consulting firm); Partner, Palmer & Dodge (law firm) (1988–1990); Vice President of Corporate Affairs and General Counsel, Filene’s (retail) (1978–1988). Directorships: Advisory Board, Center for Business Ethics, Bentley University; Trustee and former Chairman of the Board, Southwest Florida Community Foundation (charitable organization); former Directorships: ICI Mutual Insurance Company (2007–2015); Sun Capital Advisers Trust (mutual funds) (2007–2012), Investment Company Institute (audit, executive, nominating committees) and Independent Directors Council (governance, executive committees) | | | 82 | | | — |
Paul K. Freeman* (1950) Board Member since 1993 | | Consultant, WorldBank/Inter-American Development Bank; Independent Directors Council (former chair); Investment Company Institute (executive committee); Adjunct Professor, University of Denver Law School (2017–present); formerly: Chairman of Education Committee of Independent Directors Council; Project Leader, International Institute for Applied Systems Analysis (1998–2001); Chief Executive Officer, The Eric Group, Inc. (environmental insurance) (1986–1998); Directorships: Knoebel Institute for Healthy Aging, University of Denver (2017–present); former Directorships: Prisma Energy International; Denver Zoo Foundation (2012–2018) | | | 82 | | | — |
| | | | |
Deutsche DWS Variable Series II — DWS Global Equity VIP | | | | | 23 |
| | | | | | | | |
Name, Year of Birth,
Position with the Fund and
Length of Time Served1 | | Business Experience and Directorships During the Past Five Years | | Number of
Funds in
DWS Fund
Complex
Overseen | | | Other
Directorships
Held by Board
Member
|
Richard J. Herring (1946) Board Member since 1990 | | Jacob Safra Professor of International Banking and Professor of Finance, The Wharton School, University of Pennsylvania (since July 1972); Director, The Wharton Financial Institutions Center (since 1994); formerly: Vice Dean and Director, Wharton Undergraduate Division (1995–2000) and Director, The Lauder Institute of International Management Studies (2000–2006); Member FDIC Systemic Risk Advisory Committee since 2011, member Systemic Risk Council since 2012 and member of the Advisory Board at the Yale Program on Financial Stability since 2013; Formerly Co-Chair of the Shadow Financial Regulatory Committee (2003–2015), Executive Director of The Financial Economists Roundtable (2008–2015), Director of The Thai Capital Fund (2007–2013), Director of The Aberdeen Singapore Fund (2007–2018), and Nonexecutive Director of Barclays Bank DE (2010–2018) | | | 82 | | | Director,
Aberdeen
Japan Fund
(since 2007) |
William McClayton (1944) Board Member since 2004 | | Private equity investor (since October 2009); previously, Managing Director, Diamond Management & Technology Consultants, Inc. (global consulting firm) (2001–2009); Directorship: Board of Managers, YMCA of Metropolitan Chicago; formerly: Senior Partner, Arthur Andersen LLP (accounting) (1966–2001); Trustee, Ravinia Festival | | | 82 | | | — |
Rebecca W. Rimel (1951) Board Member since 1995 | | President, Chief Executive Officer and Director, The Pew Charitable Trusts (charitable organization) (1994–present); formerly: Executive Vice President, The Glenmede Trust Company (investment trust and wealth management) (1983–2004); Board Member, Investor Education (charitable organization) (2004–2005); Trustee, Executive Committee, Philadelphia Chamber of Commerce (2001–2007); Director, Viasys Health Care2 (January 2007–June 2007); Trustee, Thomas Jefferson Foundation (charitable organization) (1994–2012) | | | 82 | | | Director,
Becton
Dickinson
and
Company2
(medical
technology
company)
(2012–
present);
Director,
BioTelemetry
Inc.2(health
care) (2009–
present) |
William N. Searcy, Jr. (1946) Board Member since 1993 | | Private investor since October 2003; formerly: Pension & Savings Trust Officer, Sprint Corporation2(telecommunications) (November 1989–September 2003); Trustee, Sun Capital Advisers Trust (mutual funds) (1998–2012) | | | 82 | | | — |
Jean Gleason Stromberg (1943) Board Member since 1997 | | Retired. Formerly, Consultant (1997–2001); Director, Financial Markets U.S. Government Accountability Office (1996–1997); Partner, Norton Rose Fulbright, L.L.P. (law firm) (1978–1996); former Directorships: The William and Flora Hewlett Foundation (charitable organization) (2000–2015); Service Source, Inc. (nonprofit), Mutual Fund Directors Forum (2002–2004), American Bar Retirement Association (funding vehicle for retirement plans) (1987–1990 and 1994–1996) | | | 82 | | | — |
| | |
| Officers4 | | |
Name, Year of Birth, Position with the Fund and Length of Time Served5 | | Business Experience and Directorships During the Past Five Years |
Hepsen Uzcan6 (1974) President and Chief Executive Officer, 2017–present Assistant Secretary, 2013–present | | Managing Director,3 DWS; Secretary, DWS USA Corporation (since March 2018); Assistant Secretary, DWS Distributors, Inc. (since June 25, 2018); Director and Vice President, DWS Service Company (since June 25, 2018); Assistant Secretary, DWS Investment Management Americas, Inc. (since June 25, 2018); and Director and President, DB Investment Managers, Inc. (since June 25, 2018); formerly: Vice President for the Deutsche funds (2016–2017) |
John Millette8(1962) Vice President and Secretary, 1999–present | | Director,3DWS; Chief Legal Officer, DWS Investment Management Americas, Inc. (2015–present); and Director and Vice President, DWS Trust Company (2016–present); formerly: Secretary, Deutsche Investment Management Americas Inc. (2015–2017) |
Diane Kenneally8,9 (1966) Treasurer and Chief Financial Officer since 2018 | | Director,3 DWS; formerly: Assistant Treasurer for the DWS funds (2007–2018) |
Caroline Pearson8(1962) Chief Legal Officer, 2010–present | | Managing Director,3DWS; formerly: Secretary, Deutsche AM Distributors, Inc. (2002–2017); and Secretary, Deutsche AM Service Company (2010–2017) |
Scott D. Hogan8(1970) Chief Compliance Officer, 2016–present | | Director,3DWS |
| | | | | | |
| | 24 | | | | | | Deutsche DWS Variable Series II — DWS Global Equity VIP |
| | |
Name, Year of Birth, Position with the Fund and Length of Time Served5 | | Business Experience and Directorships During the Past Five Years |
Wayne Salit7(1967) Anti-Money Laundering Compliance Officer, 2014–present | | Director,3 Deutsche Bank; and AML Officer, DWS Trust Company; formerly: Managing Director, AML Compliance Officer at BNY Mellon (2011–2014); and Director, AML Compliance Officer at Deutsche Bank (2004–2011) |
Sheila Cadogan8(1966) Assistant Treasurer, 2017–present | | Director,3DWS; Director and Vice President, DWS Trust Company (since 2018) |
Paul Antosca8(1957) Assistant Treasurer, 2007–present | | Director,3DWS |
| 1 | The length of time served represents the year in which the Board Member joined the board of one or more DWS funds currently overseen by the Board. |
| 2 | A publicly held company with securities registered pursuant to Section 12 of the Securities Exchange Act of 1934. |
| 3 | Executive title, not a board directorship. |
| 4 | As a result of their respective positions held with the Advisor or its affiliates, these individuals are considered “interested persons” of the Advisor within the meaning of the 1940 Act. Interested persons receive no compensation from the Fund. |
| 5 | The length of time served represents the year in which the officer was first elected in such capacity for one or more DWS funds. |
| 6 | Address: 345 Park Avenue, New York, NY 10154. |
| 7 | Address: 60 Wall Street, New York, NY 10005. |
| 8 | Address: One International Place, Boston, MA 02110. |
| 9 | Appointed Treasurer and Chief Financial Officer effective July 2, 2018. |
| * | Paul K. Freeman retired from the Board effective December 31, 2018. |
The Fund’s Statement of Additional Information (“SAI”) includes additional information about the Board Members. The SAI is available, without charge, upon request. If you would like to request a copy of the SAI, you may do so by calling the followingtoll-free number:(800) 728-3337.
| | | | |
Deutsche DWS Variable Series II — DWS Global Equity VIP | | | | | 25 |
Notes
Notes
| | |
| | |
VS2GE-2 (R-025828-8 2/19) | | |
December 31, 2018
Annual Report
Deutsche DWS Variable Series II
(formerly Deutsche Variable Series II)
DWS Global Income Builder VIP
(formerly Deutsche Global Income Builder VIP)
Beginning on January 1, 2021, as permitted by regulations adopted by the Securities and Exchange Commission, you may not be receiving paper copies of the Fund’s shareholder reports from the insurance company that offers your contract unless you specifically request paper copies from your insurance company or from your financial intermediary. Instead, the shareholder reports will be made available on a Web site, and your insurance company will notify you by mail each time a report is posted and provide you with a Web site link to access the report. Instructions for requesting paper copies will be provided by your insurance company.
If you already elected to receive shareholder reports electronically, you will not be affected by this change and you need not take any action. You may elect to receive shareholder reports and other communications from your insurance company electronically by following the instructions provided by your insurance company.
You may elect to receive all future reports in paper free of charge from your insurance company. If your insurance company informs you that future reports will be delivered via Web access, you can inform your insurance company that you wish to continue receiving paper copies of your shareholder reports by following the instructions provided by your insurance company.

Contents
This report must be preceded or accompanied by a prospectus. To obtain an additional prospectus or summary prospectus, if available, call (800) 728-3337 or your financial representative. We advise you to consider the Fund’s objectives, risks, charges and expenses carefully before investing. The summary prospectus and prospectus contain this and other important information about the Fund. Please read the prospectus carefully before you invest.
Although allocation among different asset categories generally limits risk, fund management may favor an asset category that underperforms other assets or markets as a whole. Stocks may decline in value. Smaller company stocks tend to be more volatile than medium-sized or large company stocks. Dividends are not guaranteed. If the dividend-paying stocks held by the Fund reduce or stop paying dividends, the Fund’s ability to generate income may be adversely affected. Preferred stocks, a type of dividend-paying stock, present certain additional risks. Investing in foreign securities, particularly those of emerging markets, presents certain risks, such as currency fluctuations, political and economic changes, and market risks. Emerging markets tend to be more volatile and less liquid than the markets of more mature economies, and generally have less diverse and less mature economic structures and less stable political systems than those of developed countries. Investing in derivatives entails special risks relating to liquidity, leverage and credit that may reduce returns and/or increase volatility. Bond investments are subject to interest-rate, credit, liquidity and market risks to varying degrees. When interest rates rise, bond prices generally fall. Credit risk refers to the ability of an issuer to make timely payments of principal and interest. Because Exchange Traded Funds (ETFs) trade on a securities exchange, their shares may trade at a premium or discount to their net asset value. ETFs also incur fees and expenses so they may not fully match the performance of the indexes they are designed to track. The Fund may lend securities to approved institutions. Any fund that focuses in a particular segment of the market or region of the world will generally be more volatile than a fund that invests more broadly. See the prospectus for details.
The brand DWS represents DWS Group GmbH & Co. KGaA and any of its subsidiaries such as DWS Distributors, Inc. which offers investment products or DWS Investment Management Americas, Inc. and RREEF America L.L.C. which offer advisory services.
DWS Distributors, Inc., 222 South Riverside Plaza, Chicago, IL 60606, (800) 621-1148
NOT FDIC/NCUA INSURED NO BANK GUARANTEE MAY LOSE VALUE NOT A DEPOSIT
NOT INSURED BY ANY FEDERAL GOVERNMENT AGENCY
| | | | | | |
| | 2 | | | | | | Deutsche DWS Variable Series II — DWS Global Income Builder VIP |
| | |
| Performance Summary | | December 31, 2018 (Unaudited) |
Fund performance shown is historical, assumes reinvestment of all dividend and capital gain distributions and does not guarantee future results. Investment return and principal value fluctuate with changing market conditions so that, when redeemed, shares may be worth more or less than their original cost. Current performance may be lower or higher than the performance data quoted. Please contact your participating insurance company for the Fund’s most recent month-end performance. Performance does not reflect charges and fees (“contract charges”) associated with the separate account that invests in the Fund or any variable life insurance policy or variable annuity contract for which the Fund is an investment option. These charges and fees will reduce returns.
The gross expense ratios of the Fund, as stated in the fee table of the prospectus dated May 1, 2018 are 0.67% and 1.07% for Class A and Class B shares, respectively, and may differ from the expense ratios disclosed in the Financial Highlights tables in this report.
Generally accepted accounting principles require adjustments to be made to the net assets of the Fund at period end for financial reporting purposes only, and as such, the total return based on the unadjusted net asset value per share may differ from the total return reported in the financial highlights.
Growth of an Assumed $10,000 Investment in DWS Global Income Builder VIP
| | |
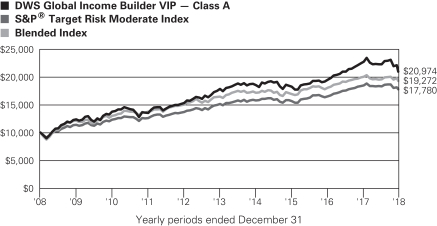 | | The S&P® Target Risk Moderate Index offers significant exposure to fixed income, while also increasing opportunities for higher returns through equities. The Blended Index consists of an equally weighted blend (50%/50%) of the MSCI World High Dividend Yield Index and Bloomberg Barclays U.S. Universal Index. MSCI World High Dividend Yield Index includes securities that offer a meaningfully higher-than-average dividend yield relative to the MSCI World Index and pass dividend sustainability and persistence screens. The index offers broad market coverage, and is free-float market capitalization-weighted to ensure that its performance can be replicated in institutional and retail portfolios. The index is calculated using closing local market prices and translates into US dollars using the London close foreign exchange rates. Bloomberg Barclays U.S. Universal Index represents the union of the U.S. Aggregate Index, the U.S. High-Yield Corporate Index, the 144A Index, the Eurodollar Index, the Emerging Markets Index and the non-ERISA portion of the CMBS Index. Index returns do not reflect any fees or expenses and it is not possible to invest directly into an index. |
| | | | | | | | | | |
| Comparative Results | | | | | | | | | | |
| | | | |
| DWS Global Income Builder VIP | | 1-Year | | 3-Year | | 5-Year | | 10-Year |
| Class A | | Growth of $10,000 | | $9,234 | | $11,494 | | $11,762 | | $20,974 |
| | | Average annual total return | | –7.66% | | 4.75% | | 3.30% | | 7.69% |
| S&P®Target Risk Moderate Index | | Growth of $10,000 | | $9,628 | | $11,383 | | $11,768 | | $17,780 |
| | | Average annual total return | | –3.72% | | 4.41% | | 3.31% | | 5.92% |
| Blended Index | | Growth of $10,000 | | $9,621 | | $11,383 | | $11,707 | | $19,272 |
| | | Average annual total return | | –3.79% | | 4.41% | | 3.20% | | 6.78% |
The growth of $10,000 is cumulative.
| | | | | | | | | | |
| | | | |
| DWS Global Income Builder VIP | | | | | | | | Life of Class* |
| Class B | | Growth of $10,000 | | | | | | | | $9,404 |
| | | Average annual total return | | | | | | | | –5.96% |
| S&P®Target Risk Moderate Index | | Growth of $10,000 | | | | | | | | $9,848 |
| | | Average annual total return | | | | | | | | –1.52% |
| Blended Index | | Growth of $10,000 | | | | | | | | $9,836 |
| | | Average annual total return | | | | | | | | –1.64% |
The growth of $10,000 is cumulative.
| * | Class B commenced operations on May 1, 2018. |
| | | | |
Deutsche DWS Variable Series II — DWS Global Income Builder VIP | | | | | 3 |
| | |
| Management Summary | | December 31, 2018 (Unaudited) |
The Fund returned –7.66% during the 12 months ended December 31, 2018 (Class A shares, unadjusted for contract charges), underperforming the –3.72% return of S&P® Target Risk Moderate Index. Its other benchmark — the Blended Index — returned –3.79%. The Blended Index is an equally-weighted blend (50%/50%) of the MSCI World High Dividend Yield Index and the Bloomberg Barclays U.S. Universal Index. The two indexes returned –7.56% and –0.25%, respectively.
The Fund’s broader allocation strategy detracted from its12-month returns. Although we made tactical adjustments to the Fund’s positioning based on market conditions, we maintained a consistent overweight in equities over fixed income. The portfolio averaged 68% of assets in stocks and 32% to bonds during the year, and it finished December with weightings of 61% and 37%. While this overweight was a meaningful contributor to performance through the end of September, when stocks were rallying, it ultimately proved to be a detractor due to the large, broad-based selloff of the fourth quarter. The Fund therefore experienced a larger impact from the downturn in stock prices over the full year than the 50/50 benchmark.
The equity portfolio produced a negative absolute return and lagged its benchmark. While stock selection in the industrials, real estate, and energy contributed to performance, these positive factors were offset by the negative effect of sector allocations. Most notably, the Fund was hurt by its underweights in health care and utilities, as well as its overweight in communication services. An overweight position in the emerging markets was an additional detractor.
With regard to positioning, we actively adjusted the equity portfolio throughout the year to capture opportunities as they arose. With that said, our core strategy continued to feature an overweight in U.S. large-caps and an underweight in the developed international markets. While we see domestic equities benefiting from the stronger growth of the U.S. economy, we think the sluggish growth in Europe is likely to act as a drag on the region’s markets. We also maintained an overweight in the emerging markets, which we believe are positioned to outperform given their attractive valuations and the potential for a mean reversion following their weak relative performance earlier in 2018. In addition, we believe investors’ depressed expectations create the latitude for a positive surprise in the emerging markets’ economic growth.
The major segments of the global fixed-income markets experienced a wide range of returns in the past 12 months. While U.S. Treasuries outpaced the index due to their strong fourth quarter rally, categories with a higher degree of credit risk were hurt by the prospect of slower growth. Our continued focus on high-yield bonds and emerging-markets debt therefore led to underperformance in the Fund’s bond portfolio. Still, we believe an emphasis on the credit sectors remains appropriate even after the fourth-quartersell-off in the financial markets. We see the elevated volatility as largely the result of investors’ overreaction to adverse headlines rather than a sign of a broader, systemic problem. In our view, the continued strength of the U.S. economy and positive growth in the world as a whole can provide a firm foundation for risk assets once news flow calms and investors return their focus to fundamentals.
The Fund used derivatives during the course of the period. On the equity side, we used futures and swaps on equity indices to achieve our desired weightings in a more efficient manner than buying and selling individual securities. In the bond portfolio, we used credit default swaps to facilitate exposure to the high-yield market, along with forward currency contracts to manage the currency exposure of certain positions in foreign bonds. We also used interest-rate futures and swaps to manage the Fund’s duration and achieve exposure to the European markets. In the aggregate, our use of derivatives was a small net contributor. Derivatives are used to achieve the Fund’s risk and return objectives and should therefore be evaluated within the context of the entire portfolio rather than as a standalone strategy.
John D. Ryan, Managing Director
Darwei Kung, Managing Director
Di Kumble, CFA, Managing Director
Kevin Bliss, Director
Dokyoung Lee, CFA, Director
Portfolio Managers
The views expressed reflect those of the portfolio management team only through the end of the period of the report as stated on the cover. The management team’s views are subject to change at any time based on market and other conditions and should not be construed as a recommendation. Past performance is no guarantee of future results. Current and future portfolio holdings are subject to risk.
| | | | | | |
| | 4 | | | | | | Deutsche DWS Variable Series II — DWS Global Income Builder VIP |
Terms to Know
TheS&P Target Risk Moderate Index offers significant exposure to fixed income, while also increasing opportunities for higher returns through equities.
TheBlended Index consists of an equally weighted blend (50%/50%) of the MSCI World High Dividend Yield Index and Bloomberg Barclays U.S. Universal Index.
TheMSCI World High Dividend Yield Index includes securities that offer a meaningfully higher-than-average dividend yield relative to the MSCI World Index and pass dividend sustainability and persistence screens. The index offers broad market coverage, and is free-float market capitalization-weighted to ensure that its performance can be replicated in institutional and retail portfolios. The index is calculated using closing local market prices and translates into U.S. dollars using the London close foreign exchange rates.
TheBloomberg Barclays U.S. Universal Indexrepresents the union of the U.S. Aggregate Index, U.S. Corporate High-Yield Index, Investment Grade 144A Index, Eurodollar Index, U.S. Emerging Markets Index, and thenon-ERISA eligible portion of the CMBS Index.
Index returns do not reflect any fees or expenses and it is not possible to invest directly into an index.
Overweight means the Fund holds a higher weighting in a given sector or security than the benchmark.Underweightmeans the Fund holds a lower weighting.
Contribution anddetraction incorporate both an investment’s total return and its weighting in the Fund.
Mean reversionis a theory that prices and returns eventually move back toward the mean, or average.
Derivativesare contracts whose value is based on the performance of an underlying financial asset. Derivatives afford leverage, but when used by investors who are able to handle the inherent risks, can enhance returns or protect a portfolio. Derivatives can experience significant losses if the underlying security moves contrary to the investor’s expectations.
A forward currency contractis a contract in the foreign exchange market that locks in the exchange rate for the purchase or sale of a currency on a future date as a means to hedge a fund’s currency risk.
Aswap is a derivative in which two counterparties exchange cash flows of one party’s financial instrument for those of the other party’s financial instrument for a set period of time.
Futures contractsare contractual agreements to buy or sell a particular commodity or financial instrument at apre-determined price in the future.
| | | | |
Deutsche DWS Variable Series II — DWS Global Income Builder VIP | | | | | 5 |
| | |
| Portfolio Summary | | (Unaudited) |
| | | | | | | | |
| Asset Allocation (As a % of Investment Portfolio excluding Securities Lending Collateral) | | 12/31/18 | | | 12/31/17 | |
Equity | | | 61% | | | | 65% | |
Common Stocks | | | 55% | | | | 56% | |
Preferred Stocks | | | 6% | | | | 6% | |
Exchange-Traded Funds | | | — | | | | 3% | |
| | |
Fixed Income | | | 37% | | | | 34% | |
Corporate Bonds | | | 13% | | | | 13% | |
Government & Agency Obligations | | | 9% | | | | 6% | |
Asset-Backed | | | 6% | | | | 1% | |
Exchange-Traded Funds | | | 3% | | | | 7% | |
Short-Term U.S. Treasury Obligations | | | 3% | | | | 4% | |
Collateralized Mortgage Obligations | | | 2% | | | | 1% | |
Commercial Mortgage-Backed Securities | | | 1% | | | | 1% | |
Convertible Bonds | | | 0% | | | | 0% | |
Mortgage-Backed Securities Pass-Throughs | | | 0% | | | | 1% | |
Municipal Bonds and Notes | | | — | | | | 0% | |
| | |
| Cash Equivalents | | | 2% | | | | 1% | |
| | | | 100% | | | | 100% | |
| | |
Sector Diversification (As a % of Equities, Corporate Bonds, Preferred Securities and
Convertible Bonds) | | 12/31/18 | | | 12/31/17 | |
Financials | | | 17% | | | | 17% | |
Energy | | | 13% | | | | 11% | |
Information Technology | | | 12% | | | | 11% | |
Communication Services | | | 12% | | | | 14% | |
Consumer Discretionary | | | 9% | | | | 10% | |
Health Care | | | 9% | | | | 7% | |
Industrials | | | 8% | | | | 10% | |
Consumer Staples | | | 6% | | | | 6% | |
Real Estate | | | 6% | | | | 6% | |
Utilities | | | 5% | | | | 4% | |
Materials | | | 3% | | | | 4% | |
| | | | 100% | | | | 100% | |
Portfolio holdings and characteristics are subject to change.
For more complete details about the Fund’s investment portfolio, see page 7.
Following the Fund’s fiscal first and third quarter-end, a complete portfolio holdings listing is filed with the SEC on Form N-Q or Form N-PORT (available for filings after March 31, 2019). The Fund’s Form N-Q or Form N-PORT will be available on the SEC’s Web site at sec.gov. The Fund’s portfolio holdings are also posted on dws.com from time to time. Please see the Fund’s current prospectus for more information.
| | | | | | |
| | 6 | | | | | | Deutsche DWS Variable Series II — DWS Global Income Builder VIP |
| | |
| Investment Portfolio | | December 31, 2018 |
| | | | | | | | |
| | | Shares | | | Value ($) | |
| Common Stocks 54.9% | |
| Communication Services 5.8% | |
Diversified Telecommunication Services 2.7% | |
| | |
AT&T, Inc. | | | 19,609 | | | | 559,641 | |
| | |
BCE, Inc. | | | 3,773 | | | | 149,046 | |
| | |
BT Group PLC | | | 61,658 | | | | 187,730 | |
| | |
Deutsche Telekom AG (Registered) | | | 10,946 | | | | 186,611 | |
| | |
Elisa Oyj | | | 3,526 | | | | 145,902 | |
| | |
Nippon Telegraph & Telephone Corp. | | | 3,800 | | | | 154,818 | |
| | |
Orange SA | | | 9,297 | | | | 151,173 | |
| | |
Proximus SA | | | 5,537 | | | | 150,096 | |
| | |
Singapore Telecommunications Ltd. | | | 63,245 | | | | 136,983 | |
| | |
Swisscom AG (Registered) | | | 439 | | | | 211,154 | |
| | |
Telefonica SA | | | 17,063 | | | | 143,806 | |
| | |
Telenor ASA | | | 7,167 | | | | 139,408 | |
| | |
Telia Co. AB | | | 30,834 | | | | 146,418 | |
| | |
TELUS Corp. | | | 6,329 | | | | 209,777 | |
| | |
Verizon Communications, Inc. | | | 9,866 | | | | 554,667 | |
| | | | | | | | |
| | | | | | | 3,227,230 | |
| | |
Entertainment 0.4% | | | | | | | | |
| | |
NetEase, Inc. (ADR) | | | 1,066 | | | | 250,904 | |
| | |
Walt Disney Co. | | | 2,415 | | | | 264,805 | |
| | | | | | | | |
| | | | | | | 515,709 | |
|
Interactive Media & Services 1.6% | |
| | |
Alphabet, Inc. “A”* | | | 473 | | | | 494,266 | |
| | |
Alphabet, Inc. “C”* | | | 505 | | | | 522,983 | |
| | |
Baidu, Inc. (ADR)* | | | 1,085 | | | | 172,081 | |
| | |
Facebook, Inc. “A”* | | | 3,544 | | | | 464,583 | |
| | |
Tencent Holdings Ltd. (ADR) | | | 7,068 | | | | 278,974 | |
| | | | | | | | |
| | | | | | | 1,932,887 | |
| | |
Media 0.8% | | | | | | | | |
| | |
Comcast Corp. “A” | | | 7,066 | | | | 240,597 | |
| | |
Interpublic Group of Companies, Inc. | | | 6,005 | | | | 123,883 | |
| | |
ITV PLC | | | 81,731 | | | | 130,155 | |
| | |
Omnicom Group, Inc. | | | 1,830 | | | | 134,029 | |
| | |
Shaw Communications, Inc. “B” | | | 7,223 | | | | 130,736 | |
| | |
WPP PLC | | | 13,334 | | | | 144,301 | |
| | | | | | | | |
| | | | | | | 903,701 | |
|
Wireless Telecommunication Services 0.3% | |
| | |
KDDI Corp. | | | 6,700 | | | | 160,123 | |
| | |
NTT DoCoMo, Inc. | | | 9,669 | | | | 217,700 | |
| | | | | | | | |
| | | | | | | 377,823 | |
|
| Consumer Discretionary 5.6% | |
Auto Components 0.2% | | | | | | | | |
| | |
Bridgestone Corp. | | | 3,505 | | | | 134,933 | |
| | |
Nokian Renkaat Oyj | | | 4,589 | | | | 141,375 | |
| | | | | | | | |
| | | | | | | 276,308 | |
| | |
Automobiles 1.3% | | | | | | | | |
| | |
Bayerische Motoren Werke AG | | | 1,677 | | | | 136,415 | |
| | |
Daimler AG (Registered) | | | 4,605 | | | | 242,996 | |
| | |
General Motors Co. | | | 5,173 | | | | 173,037 | |
| | |
Honda Motor Co., Ltd. | | | 5,750 | | | | 151,023 | |
| | | | | | | | |
| | | Shares | | | Value ($) | |
| | |
Nissan Motor Co., Ltd. | | | 25,585 | | | | 204,823 | |
| | |
Renault SA | | | 2,089 | | | | 130,826 | |
| | |
Subaru Corp. | | | 6,100 | | | | 131,173 | |
| | |
Toyota Motor Corp. | | | 5,700 | | | | 330,894 | |
| | | | | | | | |
| | | | | | | 1,501,187 | |
|
Diversified Consumer Services 0.1% | |
Tal Education Group (ADR)* | | | 6,000 | | | | 160,080 | |
|
Hotels, Restaurants & Leisure 1.0% | |
| | |
Carnival Corp. | | | 2,499 | | | | 123,201 | |
| | |
Darden Restaurants, Inc. | | | 1,343 | | | | 134,112 | |
| | |
Las Vegas Sands Corp. | | | 3,209 | | | | 167,028 | |
| | |
McDonald’s Corp. | | | 1,800 | | | | 319,626 | |
| | |
Starbucks Corp. | | | 3,197 | | | | 205,887 | |
| | |
TUI AG | | | 9,641 | | | | 138,495 | |
| | |
Yum! Brands, Inc. | | | 1,500 | | | | 137,880 | |
| | | | | | | | |
| | | | | | | 1,226,229 | |
| | |
Household Durables 0.5% | | | | | | | | |
| | |
Berkeley Group Holdings PLC | | | 3,249 | | | | 144,061 | |
| | |
Garmin Ltd. | | | 2,110 | | | | 133,605 | |
| | |
Leggett & Platt, Inc. | | | 3,518 | | | | 126,085 | |
| | |
Sekisui House Ltd. | | | 11,254 | | | | 167,478 | |
| | | | | | | | |
| | | | | | | 571,229 | |
|
Internet & Direct Marketing Retail 1.1% | |
| | |
Alibaba Group Holding Ltd. (ADR)* | | | 1,454 | | | | 199,300 | |
| | |
Amazon.com, Inc.* | | | 652 | | | | 979,284 | |
| | |
Ctrip.com International Ltd. (ADR)* | | | 6,667 | | | | 180,409 | |
| | | | | | | | |
| | | | | | | 1,358,993 | |
| | |
Leisure Products 0.1% | | | | | | | | |
Hasbro, Inc. | | | 1,676 | | | | 136,175 | |
| | |
Multiline Retail 0.4% | | | | | | | | |
| | |
Marks & Spencer Group PLC | | | 46,142 | | | | 145,452 | |
| | |
Target Corp. | | | 1,985 | | | | 131,189 | |
| | |
Wesfarmers Ltd. | | | 5,940 | | | | 134,663 | |
| | | | | | | | |
| | | | | | | 411,304 | |
| | |
Specialty Retail 0.4% | | | | | | | | |
| | |
Home Depot, Inc. | | | 1,634 | | | | 280,754 | |
| | |
L Brands, Inc. | | | 4,300 | | | | 110,381 | |
| | |
TJX Companies, Inc. | | | 3,000 | | | | 134,220 | |
| | | | | | | | |
| | | | | | | 525,355 | |
|
Textiles, Apparel & Luxury Goods 0.5% | |
| | |
Cie Financiere Richemont SA (Registered) | | | 2,123 | | | | 137,352 | |
| | |
NIKE, Inc. “B” | | | 2,142 | | | | 158,808 | |
| | |
Tapestry, Inc. | | | 3,843 | | | | 129,701 | |
| | |
VF Corp. | | | 1,851 | | | | 132,050 | |
| | | | | | | | |
| | | | | | | 557,911 | |
| | |
| Consumer Staples 4.3% | | | | | | | | |
Beverages 1.0% | | | | | | | | |
| | |
Ambev SA (ADR) | | | 35,231 | | | | 138,105 | |
| | |
Anheuser-Busch InBev SA | | | 1,935 | | | | 128,326 | |
| | |
Coca-Cola Co. | | | 8,825 | | | | 417,864 | |
| | |
Diageo PLC | | | 3,855 | | | | 137,432 | |
| | |
PepsiCo, Inc. | | | 3,021 | | | | 333,760 | |
| | | | | | | | |
| | | | | | | 1,155,487 | |
The accompanying notes are an integral part of the financial statements.
| | | | |
Deutsche DWS Variable Series II — DWS Global Income Builder VIP | | | | | 7 |
| | | | | | | | |
| | | Shares | | | Value ($) | |
Food & Staples Retailing 0.6% | | | | | | | | |
Costco Wholesale Corp. | | | 600 | | | | 122,226 | |
Lawson, Inc. | | | 2,100 | | | | 133,046 | |
Sysco Corp. | | | 2,139 | | | | 134,030 | |
Walgreens Boots Alliance, Inc. | | | 1,700 | | | | 116,161 | |
Walmart, Inc. | | | 2,516 | | | | 234,365 | |
| | | | | | | | |
| | | | | | | 739,828 | |
| | |
Food Products 1.4% | | | | | | | | |
Archer-Daniels-Midland Co. | | | 3,046 | | | | 124,795 | |
Bunge Ltd. | | | 2,300 | | | | 122,912 | |
General Mills, Inc. | | | 3,543 | | | | 137,964 | |
Kellogg Co. | | | 2,586 | | | | 147,428 | |
Kraft Heinz Co. | | | 2,962 | | | | 127,485 | |
Marine Harvest ASA | | | 6,166 | | | | 130,016 | |
Mondelez International, Inc. “A” | | | 4,000 | | | | 160,120 | |
Nestle SA (Registered) | | | 5,421 | | | | 440,870 | |
The Hershey Co. | | | 1,329 | | | | 142,442 | |
The JM Smucker Co. | | | 1,400 | | | | 130,886 | |
| | | | | | | | |
| | | | | | | 1,664,918 | |
| | |
Household Products 0.6% | | | | | | | | |
Colgate-Palmolive Co. | | | 2,270 | | | | 135,111 | |
Kimberly-Clark Corp. | | | 1,277 | | | | 145,501 | |
Procter & Gamble Co. | | | 5,159 | | | | 474,215 | |
| | | | | | | | |
| | | | | | | 754,827 | |
| | |
Tobacco 0.7% | | | | | | | | |
Altria Group, Inc. | | | 5,192 | | | | 256,433 | |
British American Tobacco PLC | | | 2,691 | | | | 86,054 | |
British American Tobacco PLC (ADR) | | | 1,736 | | | | 55,309 | |
Japan Tobacco, Inc. | | | 6,177 | | | | 147,026 | |
Philip Morris International, Inc. | | | 4,036 | | | | 269,443 | |
| | | | | | | | |
| | | | | | | 814,265 | |
| | |
| Energy 4.5% | | | | | | | | |
Oil, Gas & Consumable Fuels | | | | | | | | |
BP PLC | | | 53,165 | | | | 336,626 | |
Chevron Corp. | | | 3,969 | | | | 431,788 | |
Enagas SA | | | 5,091 | | | | 137,866 | |
Enbridge, Inc. | | | 4,359 | | | | 135,418 | |
Eni SpA | | | 8,701 | | | | 137,433 | |
Exxon Mobil Corp. | | | 8,799 | | | | 600,004 | |
Gazprom PJSC (ADR) | | | 88,363 | | | | 390,564 | |
JXTG Holdings, Inc. | | | 24,100 | | | | 126,044 | |
Kinder Morgan, Inc. | | | 10,158 | | | | 156,230 | |
LUKOIL PJSC (ADR) | | | 6,484 | | | | 462,569 | |
Occidental Petroleum Corp. | | | 2,669 | | | | 163,823 | |
ONEOK, Inc. | | | 2,236 | | | | 120,632 | |
Pembina Pipeline Corp. | | | 4,435 | | | | 131,601 | |
Phillips 66 | | | 1,560 | | | | 134,394 | |
Plains GP Holdings LP “A”* | | | 6,612 | | | | 132,901 | |
Repsol SA | | | 9,619 | | | | 155,751 | |
Royal Dutch Shell PLC “A” | | | 12,635 | | | | 372,147 | |
Royal Dutch Shell PLC “B” | | | 10,663 | | | | 318,451 | |
Snam SpA | | | 30,741 | | | | 134,937 | |
Tatneft PJSC (ADR) | | | 2,028 | | | | 128,778 | |
TOTAL SA | | | 5,207 | | | | 275,543 | |
TransCanada Corp. (a) | | | 3,548 | | | | 126,696 | |
Valero Energy Corp. | | | 1,771 | | | | 132,772 | |
Williams Companies, Inc. | | | 6,192 | | | | 136,534 | |
| | | | | | | | |
| | | | | | | 5,379,502 | |
| | | | | | | | |
| | | Shares | | | Value ($) | |
| | |
| Financials 7.9% | | | | | | | | |
Banks 4.9% | | | | | | | | |
Aozora Bank Ltd. | | | 4,300 | | | | 128,261 | |
Australia & New Zealand Banking Group Ltd. | | | 8,678 | | | | 149,494 | |
Banco Bradesco SA (ADR) (Preferred) | | | 14,488 | | | | 143,286 | |
Bank of America Corp. | | | 14,925 | | | | 367,752 | |
Bank of Montreal | | | 2,011 | | | | 131,381 | |
Bank of Nova Scotia | | | 3,393 | | | | 169,128 | |
BB&T Corp. | | | 3,010 | | | | 130,393 | |
BNP Paribas SA | | | 2,891 | | | | 130,988 | |
Canadian Imperial Bank of Commerce | | | 1,826 | | | | 136,000 | |
Citigroup, Inc. | | | 4,687 | | | | 244,005 | |
Commonwealth Bank of Australia | | | 4,177 | | | | 212,711 | |
HSBC Holdings PLC | | | 46,627 | | | | 385,507 | |
ICICI Bank Ltd. (ADR) | | | 15,400 | | | | 158,466 | |
Itau Unibanco Holding SA (ADR) (Preferred) | | | 15,500 | | | | 141,670 | |
Japan Post Bank Co., Ltd. | | | 12,500 | | | | 137,712 | |
JPMorgan Chase & Co. | | | 6,029 | | | | 588,551 | |
Lloyds Banking Group PLC | | | 218,842 | | | | 144,499 | |
Mitsubishi UFJ Financial Group, Inc. | | | 25,600 | | | | 125,425 | |
Mizuho Financial Group, Inc. | | | 93,873 | | | | 145,617 | |
People’s United Financial, Inc. | | | 8,492 | | | | 122,540 | |
Royal Bank of Canada | | | 3,105 | | | | 212,519 | |
Sberbank of Russia PJSC (ADR) | | | 34,594 | | | | 379,150 | |
Skandinaviska Enskilda Banken AB “A” | | | 14,159 | | | | 137,964 | |
Societe Generale SA | | | 3,948 | | | | 126,384 | |
Sumitomo Mitsui Financial Group, Inc. | | | 4,000 | | | | 132,689 | |
Swedbank AB “A” | | | 6,212 | | | | 139,084 | |
Toronto-Dominion Bank | | | 3,105 | | | | 154,340 | |
U.S. Bancorp. | | | 2,862 | | | | 130,793 | |
Wells Fargo & Co. | | | 7,269 | | | | 334,956 | |
Westpac Banking Corp. | | | 11,487 | | | | 202,519 | |
| | | | | | | | |
| | | | | | | 5,843,784 | |
| | |
Capital Markets 0.2% | | | | | | | | |
CME Group, Inc. | | | 820 | | | | 154,258 | |
UBS Group AG (Registered)* | | | 10,817 | | | | 134,992 | |
| | | | | | | | |
| | | | | | | 289,250 | |
|
Diversified Financial Services 0.3% | |
Berkshire Hathaway, Inc. “B”* | | | 1,718 | | | | 350,782 | |
| | |
Insurance 2.5% | | | | | | | | |
Ageas | | | 3,119 | | | | 140,462 | |
Allianz SE (Registered) | | | 732 | | | | 147,468 | |
American Financial Group, Inc. | | | 1,397 | | | | 126,470 | |
Assicurazioni Generali SpA | | | 8,624 | | | | 144,673 | |
Aviva PLC | | | 28,133 | | | | 134,902 | |
AXA SA | | | 6,933 | | | | 150,099 | |
Baloise Holding AG (Registered) | | | 977 | | | | 134,970 | |
Chubb Ltd. | | | 1,118 | | | | 144,423 | |
Japan Post Holdings Co., Ltd. | | | 11,700 | | | | 134,843 | |
Legal & General Group PLC | | | 54,098 | | | | 159,703 | |
MetLife, Inc. | | | 3,423 | | | | 140,548 | |
Muenchener Rueckversicherungs-Gesellschaft AG (Registered) | | | 658 | | | | 144,003 | |
Poste Italiane SpA 144A | | | 19,064 | | | | 153,099 | |
Power Corp. of Canada | | | 7,300 | | | | 131,167 | |
The accompanying notes are an integral part of the financial statements.
| | | | | | |
| | 8 | | | | | | Deutsche DWS Variable Series II — DWS Global Income Builder VIP |
| | | | | | | | |
| | | Shares | | | Value ($) | |
Power Financial Corp. (a) | | | 6,800 | | | | 128,658 | |
Sampo Oyj “A” | | | 4,982 | | | | 220,490 | |
Swiss Life Holding AG (Registered)* | | | 355 | | | | 137,317 | |
Swiss Re AG | | | 2,662 | | | | 244,961 | |
Zurich Insurance Group AG | | | 864 | | | | 258,495 | |
| | | | | | | | |
| | | | | | | 2,976,751 | |
| | |
| Health Care 5.8% | | | | | | | | |
Biotechnology 0.8% | | | | | | | | |
AbbVie, Inc. | | | 3,577 | | | | 329,764 | |
Amgen, Inc. | | | 1,597 | | | | 310,888 | |
Biogen., Inc.* | | | 400 | | | | 120,368 | |
Gilead Sciences, Inc. | | | 3,642 | | | | 227,807 | |
| | | | | | | | |
| | | | | | | 988,827 | |
|
Health Care Equipment & Supplies 0.3% | |
Abbott Laboratories | | | 2,421 | | | | 175,111 | |
Medtronic PLC | | | 2,239 | | | | 203,659 | |
| | | | | | | | |
| | | | | | | 378,770 | |
|
Health Care Providers & Services 0.6% | |
Anthem, Inc. | | | 600 | | | | 157,578 | |
CVS Health Corp. | | | 2,882 | | | | 188,829 | |
UnitedHealth Group, Inc. | | | 1,583 | | | | 394,357 | |
| | | | | | | | |
| | | | | | | 740,764 | |
|
Life Sciences Tools & Services 0.2% | |
Thermo Fisher Scientific, Inc. | | | 700 | | | | 156,653 | |
| | |
Pharmaceuticals 3.9% | | | | | | | | |
Allergan PLC | | | 1,000 | | | | 133,660 | |
Astellas Pharma, Inc. | | | 11,000 | | | | 140,887 | |
AstraZeneca PLC | | | 2,648 | | | | 198,628 | |
Bayer AG (Registered) | | | 1,951 | | | | 136,592 | |
Bristol-Myers Squibb Co. | | | 3,841 | | | | 199,655 | |
Daiichi Sankyo Co., Ltd. | | | 3,800 | | | | 121,354 | |
Eli Lilly & Co. | | | 2,365 | | | | 273,678 | |
GlaxoSmithKline PLC | | | 11,751 | | | | 223,750 | |
Johnson & Johnson | | | 5,592 | | | | 721,648 | |
Merck & Co., Inc. | | | 6,336 | | | | 484,134 | |
Novartis AG (Registered) | | | 4,774 | | | | 409,638 | |
Novo Nordisk AS ‘‘B” | | | 3,727 | | | | 171,216 | |
Pfizer, Inc. | | | 13,362 | | | | 583,251 | |
Roche Holding AG (Genusschein) | | | 1,828 | | | | 454,830 | |
Sanofi | | | 2,795 | | | | 242,424 | |
Takeda Pharmaceutical Co., Ltd. | | | 4,000 | | | | 135,624 | |
| | | | | | | | |
| | | | | | | 4,630,969 | |
| | |
| Industrials 5.3% | | | | | | | | |
Aerospace & Defense 1.0% | | | | | | | | |
BAE Systems PLC | | | 23,878 | | | | 140,038 | |
Boeing Co. | | | 939 | | | | 302,828 | |
General Dynamics Corp. | | | 800 | | | | 125,768 | |
Lockheed Martin Corp. | | | 597 | | | | 156,319 | |
Northrop Grumman Corp. | | | 566 | | | | 138,613 | |
Raytheon Co. | | | 781 | | | | 119,766 | |
United Technologies Corp. | | | 1,717 | | | | 182,826 | |
| | | | | | | | |
| | | | | | | 1,166,158 | |
| | |
Air Freight & Logistics 0.1% | | | | | | | | |
United Parcel Service, Inc. “B” | | | 1,380 | | | | 134,591 | |
| | |
Airlines 0.4% | | | | | | | | |
Deutsche Lufthansa AG (Registered) | | | 6,282 | | | | 142,729 | |
| | | | | | | | |
| | | Shares | | | Value ($) | |
International Consolidated Airlines Group SA | | | 17,761 | | | | 140,985 | |
Japan Airlines Co., Ltd. | | | 3,800 | | | | 134,672 | |
| | | | | | | | |
| | | | | | | 418,386 | |
| | |
Building Products 0.1% | | | | | | | | |
Johnson Controls International PLC | | | 4,215 | | | | 124,975 | |
|
Commercial Services & Supplies 0.3% | |
Quad Graphics, Inc. | | | 2 | | | | 25 | |
Republic Services, Inc. | | | 1,823 | | | | 131,420 | |
Secom Co., Ltd. | | | 1,600 | | | | 132,482 | |
Waste Management, Inc. | | | 1,524 | | | | 135,621 | |
| | | | | | | | |
| | | | | | | 399,548 | |
|
Construction & Engineering 0.3% | |
Kajima Corp. | | | 10,200 | | | | 136,602 | |
Obayashi Corp. | | | 14,200 | | | | 128,334 | |
Skanska AB “B” | | | 9,055 | | | | 144,597 | |
| | | | | | | | |
| | | | | | | 409,533 | |
| | |
Electrical Equipment 0.4% | | | | | | | | |
ABB Ltd. (Registered) | | | 7,510 | | | | 143,532 | |
Eaton Corp. PLC | | | 2,059 | | | | 141,371 | |
Emerson Electric Co. | | | 2,185 | | | | 130,554 | |
| | | | | | | | |
| | | | | | | 415,457 | |
| | |
Industrial Conglomerates 0.6% | | | | | | | | |
3M Co. | | | 1,117 | | | | 212,833 | |
General Electric Co. | | | 19,552 | | | | 148,008 | |
Honeywell International, Inc. | | | 1,574 | | | | 207,957 | |
Siemens AG (Registered) | | | 1,289 | | | | 144,255 | |
| | | | | | | | |
| | | | | | | 713,053 | |
| | |
Machinery 0.7% | | | | | | | | |
Caterpillar, Inc. | | | 1,158 | | | | 147,147 | |
Cummins, Inc. | | | 1,015 | | | | 135,645 | |
Illinois Tool Works, Inc. | | | 1,078 | | | | 136,572 | |
Ingersoll-Rand PLC | | | 1,348 | | | | 122,978 | |
Kone Oyj “B” | | | 2,909 | | | | 139,089 | |
Mitsubishi Heavy Industries Ltd. | | | 3,600 | | | | 129,297 | |
| | | | | | | | |
| | | | | | | 810,728 | |
| | |
Marine 0.1% | | | | | | | | |
Kuehne + Nagel International AG (Registered) | | | 1,028 | | | | 132,279 | |
| | |
Professional Services 0.4% | | | | | | | | |
Adecco Group AG (Registered) | | | 3,068 | | | | 144,178 | |
Nielsen Holdings PLC | | | 5,139 | | | | 119,893 | |
RELX PLC | | | 6,670 | | | | 137,582 | |
SGS SA (Registered) | | | 58 | | | | 130,965 | |
| | | | | | | | |
| | | | | | | 532,618 | |
| | |
Road & Rail 0.2% | | | | | | | | |
Aurizon Holdings Ltd. | | | 43,644 | | | | 131,481 | |
Union Pacific Corp. | | | 1,051 | | | | 145,280 | |
| | | | | | | | |
| | | | | | | 276,761 | |
|
Trading Companies & Distributors 0.7% | |
ITOCHU Corp. | | | 9,639 | | | | 163,707 | |
Marubeni Corp. | | | 18,749 | | | | 131,369 | |
Mitsubishi Corp. | | | 6,800 | | | | 186,771 | |
Mitsui & Co., Ltd. | | | 11,551 | | | | 177,556 | |
| | | | | | | | |
Sumitomo Corp. | | | 10,866 | | | | 154,132 | |
| | | | | | | | |
| | | | | | | 813,535 | |
The accompanying notes are an integral part of the financial statements.
| | | | |
Deutsche DWS Variable Series II — DWS Global Income Builder VIP | | | | | 9 |
| | | | | | | | |
| | | Shares | | | Value ($) | |
|
| Information Technology 9.0% | |
Communications Equipment 0.8% | |
Cisco Systems, Inc. | | | 10,699 | | | | 463,588 | |
Juniper Networks, Inc. | | | 5,500 | | | | 148,005 | |
Motorola Solutions, Inc. | | | 1,028 | | | | 118,261 | |
Nokia Oyj | | | 29,943 | | | | 173,192 | |
| | | | | | | | |
| | | | | | | 903,046 | |
|
Electronic Equipment, Instruments & Components 0.2% | |
Corning, Inc. | | | 4,393 | | | | 132,713 | |
TE Connectivity Ltd. | | | 1,967 | | | | 148,764 | |
| | | | | | | | |
| | | | | | | 281,477 | |
| | |
IT Services 2.6% | | | | | | | | |
Accenture PLC “A” | | | 1,602 | | | | 225,898 | |
Automatic Data Processing, Inc. | | | 1,581 | | | | 207,301 | |
Broadridge Financial Solutions, Inc. | | | 1,351 | | | | 130,034 | |
Cognizant Technology Solutions Corp. “A” | | | 2,042 | | | | 129,626 | |
DXC Technology Co. | | | 2,400 | | | | 127,608 | |
Fidelity National Information Services, Inc. | | | 1,421 | | | | 145,724 | |
Fujitsu Ltd. | | | 2,300 | | | | 143,222 | |
Infosys Ltd. (ADR) | | | 16,462 | | | | 156,718 | |
International Business Machines Corp. | | | 2,997 | | | | 340,669 | |
Leidos Holdings, Inc. | | | 2,315 | | �� | | 122,047 | |
MasterCard, Inc. “A” | | | 1,797 | | | | 339,004 | |
Otsuka Corp. | | | 4,300 | | | | 117,814 | |
Paychex, Inc. | | | 2,747 | | | | 178,967 | |
PayPal Holdings, Inc.* | | | 1,600 | | | | 134,544 | |
Visa, Inc. “A” | | | 3,164 | | | | 417,458 | |
Western Union Co. | | | 10,970 | | | | 187,148 | |
| | | | | | | | |
| | | | | | | 3,103,782 | |
|
Semiconductors & Semiconductor Equipment 1.8% | |
Analog Devices, Inc. | | | 1,599 | | | | 137,242 | |
Broadcom, Inc. | | | 931 | | | | 236,735 | |
Intel Corp. | | | 8,886 | | | | 417,020 | |
KLA-Tencor Corp. | | | 1,490 | | | | 133,340 | |
Maxim Integrated Products, Inc. | | | 2,734 | | | | 139,024 | |
QUALCOMM., Inc. | | | 4,005 | | | | 227,924 | |
Taiwan Semiconductor Manufacturing Co., Ltd. (ADR) | | | 14,142 | | | | 521,981 | |
Texas Instruments, Inc. | | | 2,238 | | | | 211,491 | |
Tokyo Electron Ltd. | | | 1,100 | | | | 125,053 | |
| | | | | | | | |
| | | | | | | 2,149,810 | |
| | |
Software 1.9% | | | | | | | | |
Adobe, Inc.* | | | 652 | | | | 147,508 | |
Intuit, Inc. | | | 723 | | | | 142,323 | |
Micro Focus International PLC | | | 7,326 | | | | 129,523 | |
Microsoft Corp. | | | 13,338 | | | | 1,354,741 | |
Oracle Corp. | | | 5,708 | | | | 257,716 | |
salesforce.com, Inc.* | | | 1,100 | | | | 150,667 | |
SAP SE | | | 1,421 | | | | 142,268 | |
| | | | | | | | |
| | | | | | | 2,324,746 | |
|
Technology Hardware, Storage & Peripherals 1.7% | |
Apple, Inc. | | | 8,631 | | | | 1,361,454 | |
Canon, Inc. | | | 6,874 | | | | 187,702 | |
HP, Inc. | | | 6,190 | | | | 126,647 | |
Samsung Electronics Co., Ltd. (GDR) | | | 166 | | | | 143,922 | |
| | | | | | | | |
| | | Shares | | | Value ($) | |
Seagate Technology PLC | | | 3,408 | | | | 131,515 | |
Xerox Corp. | | | 5,644 | | | | 111,525 | |
| | | | | | | | |
| | | | | | | 2,062,765 | |
| | |
| Materials 0.6% | | | | | | | | |
Chemicals 0.4% | | | | | | | | |
Air Products & Chemicals, Inc. | | | 879 | | | | 140,684 | |
DowDuPont, Inc. | | | 3,432 | | | | 183,544 | |
GEO Specialty Chemicals,
Inc.* (b) | | | 145,628 | | | | 18,218 | |
LyondellBasell Industries NV “A” | | | 1,752 | | | | 145,696 | |
| | | | | | | | |
| | | | | | | 488,142 | |
| | |
Metals & Mining 0.1% | | | | | | | | |
JFE Holdings, Inc. | | | 8,000 | | | | 126,588 | |
| | |
Paper & Forest Products 0.1% | | | | | | | | |
UPM-Kymmene Oyj | | | 5,346 | | | | 136,347 | |
| | |
| Real Estate 3.1% | | | | | | | | |
Equity Real Estate Investment Trusts (REITs) | |
AvalonBay Communities, Inc. | | | 748 | | | | 130,189 | |
Brookfield Property REIT, Inc. “A” | | | 8,800 | | | | 141,680 | |
Camden Property Trust | | | 1,483 | | | | 130,578 | |
Crown Castle International Corp. | | | 1,396 | | | | 151,647 | |
H&R Real Estate Investment Trust | | | 10,100 | | | | 152,772 | |
HCP, Inc. | | | 4,970 | | | | 138,812 | |
Iron Mountain, Inc. | | | 4,000 | | | | 129,640 | |
Japan Retail Fund Investment Corp. | | | 69 | | | | 137,957 | |
Kimco Realty Corp. | | | 11,953 | | | | 175,111 | |
Land Securities Group PLC | | | 13,054 | | | | 133,986 | |
Liberty Property Trust | | | 2,967 | | | | 124,258 | |
Mid-America Apartment Communities, Inc. | | | 1,390 | | | | 133,023 | |
National Retail Properties, Inc. | | | 2,772 | | | | 134,470 | |
Prologis, Inc. | | | 2,049 | | | | 120,317 | |
Public Storage | | | 727 | | | | 147,152 | |
Realty Income Corp. | | | 2,420 | | | | 152,557 | |
RioCan Real Estate Investment Trust | | | 8,642 | | | | 150,659 | |
Simon Property Group, Inc. | | | 1,211 | | | | 203,436 | |
Stockland (a) | | | 53,235 | | | | 131,819 | |
The Macerich Co. | | | 2,853 | | | | 123,478 | |
Unibail-Rodamco-Westfield* | | | 831 | | | | 128,917 | |
Ventas, Inc. | | | 2,802 | | | | 164,169 | |
VEREIT, Inc. | | | 17,700 | | | | 126,555 | |
Vicinity Centres (a) | | | 73,155 | | | | 133,844 | |
Welltower, Inc. | | | 2,441 | | | | 169,430 | |
WP Carey, Inc. | | | 2,000 | | | | 130,680 | |
| | | | | | | | |
| | | | | | | 3,697,136 | |
| | |
| Utilities 3.0% | | | | | | | | |
Electric Utilities 1.8% | | | | | | | | |
American Electric Power Co., Inc. | | | 2,127 | | | | 158,972 | |
Duke Energy Corp. | | | 2,441 | | | | 210,658 | |
Entergy Corp. | | | 1,802 | | | | 155,098 | |
Evergy, Inc. | | | 2,300 | | | | 130,571 | |
Exelon Corp. | | | 3,659 | | | | 165,021 | |
FirstEnergy Corp. | | | 3,500 | | | | 131,425 | |
Fortum Oyj | | | 6,761 | | | | 147,985 | |
NextEra Energy, Inc. | | | 918 | | | | 159,567 | |
OGE Energy Corp. | | | 3,400 | | | | 133,246 | |
Pinnacle West Capital Corp. | | | 1,500 | | | | 127,800 | |
Power Assets Holdings Ltd. | | | 20,000 | | | | 139,016 | |
The accompanying notes are an integral part of the financial statements.
| | | | | | |
| | 10 | | | | | | Deutsche DWS Variable Series II — DWS Global Income Builder VIP |
| | | | | | | | |
| | | Shares | | | Value ($) | |
| | |
PPL Corp. | | | 5,577 | | | | 157,996 | |
| | |
Southern Co. | | | 5,084 | | | | 223,289 | |
| | |
Xcel Energy, Inc. | | | 2,600 | | | | 128,102 | |
| | | | | | | | |
| | | | | | | 2,168,746 | |
| | |
Multi-Utilities 1.2% | | | | | | | | |
| | |
Ameren Corp. | | | 1,900 | | | | 123,937 | |
| | |
CenterPoint Energy, Inc. | | | 5,172 | | | | 146,005 | |
| | |
Consolidated Edison, Inc. | | | 1,923 | | | | 147,033 | |
| | |
Dominion Energy, Inc | | | 2,427 | | | | 173,433 | |
| | |
DTE Energy Co. | | | 1,100 | | | | 121,330 | |
| | |
Engie SA | | | 9,917 | | | | 142,449 | |
| | |
National Grid PLC | | | 13,058 | | | | 127,165 | |
| | |
Public Service Enterprise Group, Inc. | | | 2,500 | | | | 130,125 | |
| | |
Sempra Energy | | | 1,200 | | | | 129,828 | |
| | |
WEC Energy Group, Inc. | | | 1,834 | | | | 127,023 | |
| | | | | | | | |
| | | | | | | | 1,368,328 | |
Total Common Stocks (Cost $62,413,339) | | | | 65,706,033 | |
| | |
| Preferred Stocks 5.8% | | | | | | | | |
| Communication Services 0.6% | |
Verizon Communications,
Inc. 5.9% | | | 30,000 | | | | 759,000 | |
| | |
| Financials 3.3% | | | | | | | | |
| | |
AGNC Investment Corp.
Series C, 7.0% | | | 14,427 | | | | 364,715 | |
| | |
AGNC Investment Corp.
Series B, 7.75% | | | 18,000 | | | | 456,480 | |
| | |
Bank of America Corp.
Series Y, 6.5% | | | 15,000 | | | | 380,700 | |
| | |
BB&T Corp. 5.625% | | | 10,000 | | | | 235,100 | |
| | |
Capital One Financial Corp.
Series G, 5.2% | | | 10,000 | | | | 216,200 | |
| | |
Citigroup, Inc. Series S, 6.3% | | | 15,000 | | | | 382,500 | |
| | |
Fifth Third Bancorp.
Series I, 6.625% | | | 10,000 | | | | 258,700 | |
| | |
JPMorgan Chase & Co.
Series AA, 6.1% | | | 15,000 | | | | 383,100 | |
| | |
KeyCorp Series E, 6.125% | | | 10,000 | | | | 258,200 | |
| | |
Morgan Stanley Series K, 5.85% | | | 10,000 | | | | 242,800 | |
| | |
The Goldman Sachs Group, Inc. Series J, 5.5% | | | 17,000 | | | | 411,400 | |
| | |
Wells Fargo & Co.
Series Y, 5.625% | | | 15,000 | | | | 352,500 | |
| | | | | | | | |
| | | | | | | 3,942,395 | |
| | |
| Real Estate 1.0% | | | | | | | | |
| | |
Kimco Realty Corp.
Series L, 5.125% (REIT) | | | 15,000 | | | | 295,650 | |
| | |
Prologis, Inc. Series Q,
8.54% (REIT) | | | 164 | | | | 10,267 | |
| | |
Simon Property Group, Inc.
Series J, 8.375% (REIT) | | | 8,000 | | | | 549,600 | |
| | |
VEREIT, Inc. Series F, 6.7% (REIT) | | | 15,000 | | | | 354,900 | |
| | | | | | | | |
| | | | | | | 1,210,417 | |
Utilities 0.9% | | | | | | | | |
| | |
Dominion Energy, Inc.
Series A, 5.25% | | | 30,000 | | | | 692,400 | |
| | |
Southern Co. 5.25% | | | 15,000 | | | | 327,450 | |
| | | | | | | | |
| | | | | | | | 1,019,850 | |
Total Preferred Stocks (Cost $7,613,224) | | | | 6,931,662 | |
| | | | | | | | |
| | | Shares | | | Value ($) | |
| | |
| Warrant 0.0% | | | | | | | | |
| Materials | | | | | | | | |
Hercules Trust II, Expiration Date 3/31/2029* (b) (Cost $30,283) | | | 170 | | | | 4,191 | |
| | |
| | | Principal
Amount ($)(c) | | | Value ($) | |
| Corporate Bonds 13.0% | | | | | | | | |
| Communication Services 2.6% | |
| | |
Altice Financing SA, 144A,
7.5%, 5/15/2026 | | | 400,000 | | | | 365,000 | |
| | |
Altice France SA, 144A,
7.375%, 5/1/2026 | | | 300,000 | | | | 275,250 | |
| | |
Cablevision Systems Corp., 5.875%, 9/15/2022 | | | 300,000 | | | | 294,750 | |
| | |
CCO Holdings LLC, 144A, 5.875%, 5/1/2027 | | | 500,000 | | | | 485,000 | |
| | |
CenturyLink, Inc., Series Y,
7.5%, 4/1/2024 (a) | | | 300,000 | | | | 289,500 | |
| | |
CSC Holdings LLC: | | | | | | | | |
| | |
144A, 5.5%, 4/15/2027 | | | 400,000 | | | | 372,000 | |
| | |
144A, 10.125%, 1/15/2023 | | | 200,000 | | | | 215,250 | |
| | |
Expedia Group, Inc.,
3.8%, 2/15/2028 | | | 180,000 | | | | 163,230 | |
| | |
Netflix, Inc., 4.375%,
11/15/2026 (a) | | | 100,000 | | | | 90,750 | |
| | |
Sprint Corp., 7.625%, 2/15/2025 | | | 300,000 | | | | 300,000 | |
| | |
Virgin Media Secured Finance PLC, 144A, 5.25%, 1/15/2026 | | | 350,000 | | | | 320,688 | |
| | | | | | | | |
| | | | | | | 3,171,418 | |
|
| Consumer Discretionary 0.7% | |
| | |
1011778 B.C. Unlimited Liability Co., 144A, 5.0%, 10/15/2025 | | | 200,000 | | | | 184,000 | |
| | |
American Axle & Manufacturing, Inc., 6.25%, 4/1/2025 (a) | | | 350,000 | | | | 318,500 | |
| | |
Asbury Automotive Group, Inc., 6.0%, 12/15/2024 | | | 300,000 | | | | 287,250 | |
| | | | | | | | |
| | | | | | | 789,750 | |
| | |
| Consumer Staples 0.1% | | | | | | | | |
B&G Foods, Inc.,
5.25%, 4/1/2025 (a) | | | 100,000 | | | | 93,000 | |
| | |
| Energy 5.3% | | | | | | | | |
| | |
Boardwalk Pipelines LP,
4.95%, 12/15/2024 | | | 250,000 | | | | 253,517 | |
| | |
Buckeye Partners LP,
3.95%, 12/1/2026 | | | 500,000 | | | | 439,253 | |
| | |
Cheniere Corpus Christi Holdings LLC, 5.875%, 3/31/2025 | | | 200,000 | | | | 199,000 | |
| | |
Chesapeake Energy Corp.,
8.0%, 1/15/2025 (a) | | | 65,000 | | | | 57,362 | |
| | |
Crestwood Midstream Partners LP, 6.25%, 4/1/2023 | | | 700,000 | | | | 673,750 | |
| | |
CrownRock LP, 144A,
5.625%, 10/15/2025 | | | 100,000 | | | | 90,000 | |
| | |
Enbridge, Inc., 5.5%, 7/15/2077 | | | 200,000 | | | | 169,341 | |
| | |
Energy Transfer LP,
5.5%, 6/1/2027 | | | 100,000 | | | | 97,500 | |
| | |
EnLink Midstream Partners LP, 4.85%, 7/15/2026 | | | 400,000 | | | | 360,707 | |
| | |
Hilcorp Energy I LP, 144A,
5.75%, 10/1/2025 | | | 200,000 | | | | 178,000 | |
| | |
KazMunayGas National Co. JSC, 144A, 4.75%, 4/19/2027 | | | 1,000,000 | | | | 972,462 | |
The accompanying notes are an integral part of the financial statements.
| | | | |
Deutsche DWS Variable Series II — DWS Global Income Builder VIP | | | | | 11 |
| | | | | | | | |
| | |
| | | Principal
Amount ($)(c) | | | Value ($) | |
| | |
Laredo Petroleum, Inc.,
6.25%, 3/15/2023 (a) | | | 200,000 | | | | 179,500 | |
| | |
Marathon Petroleum Corp., 144A, 5.125%, 12/15/2026 | | | 500,000 | | | | 512,156 | |
| | |
MEG Energy Corp., 144A,
6.5%, 1/15/2025 | | | 200,000 | | | | 203,000 | |
| | |
Oasis Petroleum, Inc.,
6.875%, 3/15/2022 (a) | | | 96,000 | | | | 90,480 | |
| | |
Petrobras Global Finance BV, 5.299%, 1/27/2025 | | | 500,000 | | | | 477,500 | |
| | |
Plains All American Pipeline LP, 2.85%, 1/31/2023 | | | 55,000 | | | | 51,844 | |
| | |
Range Resources Corp.,
5.0%, 8/15/2022 | | | 200,000 | | | | 179,000 | |
| | |
Resolute Energy Corp.,
8.5%, 5/1/2020 | | | 100,000 | | | | 98,500 | |
| | |
Southwestern Energy Co.,
7.75%, 10/1/2027 | | | 100,000 | | | | 95,000 | |
| | |
Targa Resources Partners LP, 5.375%, 2/1/2027 | | | 200,000 | | | | 187,500 | |
| | |
Weatherford International Ltd., 9.875%, 2/15/2024 (a) | | | 200,000 | | | | 122,000 | |
| | |
WildHorse Resource Development Corp.,
6.875%, 2/1/2025 | | | 500,000 | | | | 472,500 | |
| | |
WPX Energy, Inc.,
5.25%, 9/15/2024 | | | 200,000 | | | | 181,000 | |
| | | | | | | | |
| | | | | | | 6,340,872 | |
| | |
| Financials 1.5% | | | | | | | | |
| | |
BPCE SA, 144A,
4.875%, 4/1/2026 | | | 700,000 | | | | 689,583 | |
| | |
FS KKR Capital Corp.,
4.75%, 5/15/2022 | | | 70,000 | | | | 69,306 | |
| | |
Royal Bank of Scotland Group PLC, 7.5%, 12/29/2049 | | | 800,000 | | | | 792,000 | |
| | |
Westpac Banking Corp.,
5.0%, 3/21/2067 | | | 300,000 | | | | 248,771 | |
| | | | | | | | |
| | | | | | | 1,799,660 | |
| | |
| Health Care 0.4% | | | | | | | | |
HCA, Inc., 5.25%, 6/15/2026 | | | 500,000 | | | | 496,250 | |
| | |
| Industrials 0.4% | | | | | | | | |
| | |
Bombardier, Inc., 144A,
6.0%, 10/15/2022 | | | 300,000 | | | | 281,250 | |
| | |
Park Aerospace Holdings Ltd., 144A, 5.25%, 8/15/2022 | | | 175,000 | | | | 169,312 | |
| | | | | | | | |
| | | | | | | 450,562 | |
| | |
| Materials 1.6% | | | | | | | | |
| | |
AK Steel Corp.,
7.0%, 3/15/2027 (a) | | | 200,000 | | | | 156,000 | |
| | |
Ardagh Packaging Finance PLC, 144A, 7.25%, 5/15/2024 | | | 200,000 | | | | 199,500 | |
| | |
Constellium NV, 144A,
6.625%, 3/1/2025 | | | 250,000 | | | | 231,875 | |
| | |
Evraz Group SA, 144A, 5.375%, 3/20/2023 | | | 300,000 | | | | 296,385 | |
| | |
Metinvest BV, 144A, 7.75%, 4/23/2023 | | | 500,000 | | | | 454,954 | |
| | |
United States Steel Corp., 6.875%, 8/15/2025 | | | 200,000 | | | | 183,000 | |
| | |
Vedanta Resources PLC, 144A, 7.125%, 5/31/2023 | | | 400,000 | | | | 359,200 | |
| | | | | | | | |
| | | | | | | 1,880,914 | |
| | | | | | | | |
| | |
| | | Principal
Amount ($)(c) | | | Value ($) | |
| | |
| Real Estate 0.3% | | | | | | | | |
| | |
Hospitality Properties Trust, (REIT), 3.95%, 1/15/2028 | | | 100,000 | | | | 90,124 | |
| | |
Omega Healthcare Investors, Inc., (REIT), 4.75%, 1/15/2028 (a) | | | 110,000 | | | | 107,767 | |
| | |
Select Income REIT: | | | | | | | | |
| | |
(REIT), 4.15%, 2/1/2022 | | | 60,000 | | | | 59,350 | |
| | |
(REIT), 4.25%, 5/15/2024 | | | 45,000 | | | | 43,363 | |
| | | | | | | | |
| | | | | | | 300,604 | |
| | |
| Utilities 0.1% | | | | | | | | |
AmeriGas Partners LP, 5.75%, 5/20/2027 | | | 200,000 | | | | 177,000 | |
Total Corporate Bonds (Cost $16,780,231) | | | | 15,500,030 | |
| | |
| Asset-Backed 5.8% | | | | | | | | |
| Miscellaneous | | | | | | | | |
| | |
Apidos CLO XXIX, “A2”, Series2018-29A, 144A,3-monthUSD-LIBOR + 1.550%,
3.942%**, 7/25/2030 | | | 1,500,000 | | | | 1,459,890 | |
| | |
Dell Equipment Finance Trust, “D”, Series2017-1, 144A, 3.44%, 4/24/2023 | | | 280,000 | | | | 279,137 | |
| | |
Domino’s Pizza Master Issuer LLC, “A23”, Series2017-1A, 144A, 4.118%, 7/25/2047 | | | 335,750 | | | | 328,958 | |
| | |
Dryden 55 CLO Ltd., “B”, Series2018-55A, 144A,3-monthUSD-LIBOR + 1.550%,
3.986%**, 4/15/2031 | | | 1,500,000 | | | | 1,460,643 | |
| | |
GoldenTree Loan Management Eur Clo 2 Dac, “C1A”, Series X2, REG S,3-month EURIBOR,+2.450% floor, 2.45%**, 1/20/2032 | | | EUR 480,000 | | | | 549,522 | |
| | |
Hilton Grand Vacations Trust, “B”, Series2014-AA, 144A, 2.07%, 11/25/2026 | | | 104,911 | | | | 103,335 | |
| | |
Jubilee CLO BV, “C1”, Series2018-21A, 144A, 3-month EURIBOR + 2.500% floor, 2.5%**, 1/15/2032 | | | EUR 500,000 | | | | 563,714 | |
| | |
Madison Park Funding XIV Ltd., “DRR”, Series2014-14A, 144A,3-monthUSD-LIBOR + 2.950%, 5.419%**, 10/22/2030 | | | 500,000 | | | | 466,242 | |
| | |
Neuberger Berman Loan Advisers CLO Ltd., “B”, Series2018-28A, 144A,3-monthUSD-LIBOR + 1.600%,
4.069%**, 4/20/2030 | | | 750,000 | | | | 730,568 | |
| | |
Taco Bell Funding LLC, “A2I”, Series2018-1A, 144A,
4.318%, 11/25/2048 | | | 500,000 | | | | 506,170 | |
| | |
Voya CLO Ltd., “CR”, Series2016-3A, 144A,3-monthUSD-LIBOR + 3.250%,
5.721%**, 10/18/2031 | | | 350,000 | | | | 326,406 | |
| | |
Wendy’s Funding LLC, “A2I”, Series2018-1A, 144A,
3.573%, 3/15/2048 | | | 158,400 | | | | 151,801 | |
Total Asset-Backed (Cost $7,097,410) | | | | 6,926,386 | |
The accompanying notes are an integral part of the financial statements.
| | | | | | |
| | 12 | | | | | | Deutsche DWS Variable Series II — DWS Global Income Builder VIP |
| | | | | | | | |
| | |
| | | Principal
Amount ($)(c) | | | Value ($) | |
| |
Mortgage-Backed Securities
Pass-Throughs 0.0% | | | | | |
| | |
Federal Home Loan Mortgage Corp., 6.0%, 3/1/2038 | | | 3,957 | | | | 4,318 | |
| | |
Federal National Mortgage Association: | | | | | | | | |
| | |
4.5%, 9/1/2035 | | | 5,972 | | | | 6,183 | |
| | |
6.0%, 1/1/2024 | | | 9,257 | | | | 9,933 | |
Total Mortgage-Backed Securities
Pass-Throughs (Cost $19,207) | | | | 20,434 | |
|
Commercial Mortgage-Backed
Securities 1.3% | |
| | |
BX Commercial Mortgage Trust, “D”, Series2018-IND, 144A,1-monthUSD-LIBOR + 1.300%, 3.755%**, 11/15/2035 | | | 249,628 | | | | 246,819 | |
| | |
DBWF Mortgage Trust, 144A,1-monthUSD-LIBOR + 1.750%, 4.13%**, 11/19/2035 | | | 250,000 | | | | 247,253 | |
| | |
FHLMC Multifamily Structured Pass-Through Certificates, “X1”, Series K043, Interest Only, 0.542%**, 12/25/2024 | | | 4,922,343 | | | | 137,482 | |
| | |
GMAC Commercial Mortgage Securities, Inc., “G”, Series2004-C1, 144A, 5.455%, 3/10/2038 | | | 423,843 | | | | 394,070 | |
| | |
GS Mortgage Securities Corp., “C”, Series 2018-FBLU, 144A,1-monthUSD-LIBOR + 1.600%, 4.055%**, 11/15/2035 | | | 500,000 | | | | 496,352 | |
Total Commercial Mortgage-Backed Securities (Cost $1,559,859) | | | | 1,521,976 | |
|
| Collateralized Mortgage Obligations 1.8% | |
| | |
Fannie Mae Connecticut Avenue Securities: | | | | | | | | |
| | |
“1M2”, Series2018-C06,1-monthUSD-LIBOR + 2.000%, 4.506%**, 3/25/2031 | | | 187,500 | | | | 180,136 | |
| | |
“1M2”, Series2018-C05,1-monthUSD-LIBOR + 2.350%, 4.856%**, 1/25/2031 | | | 500,000 | | | | 487,344 | |
| | |
Federal Home Loan Mortgage Corp.: | | | | | | | | |
| | |
“PI”, Series 3843, Interest Only, 4.5%, 5/15/2038 | | | 148,500 | | | | 8,467 | |
| | |
“C31”, Series 303, Interest Only, 4.5%, 12/15/2042 | | | 1,041,829 | | | | 228,793 | |
| | |
“H”, Series 2278,
6.5%, 1/15/2031 | | | 113 | | | | 115 | |
| | |
Federal National Mortgage Association: | | | | | | | | |
| | |
“WO”, Series2013-27, Principal Only, Zero Coupon, 12/25/2042 | | | 220,000 | | | | 137,837 | |
| | |
“4”, Series 406, Interest Only, 4.0%, 9/25/2040 | | | 93,099 | | | | 19,352 | |
| | |
“I”, Series2003-84, Interest Only, 6.0%, 9/25/2033 | | | 105,637 | | | | 16,435 | |
| | | | | | | | |
| | |
| | | Principal
Amount ($)(c) | | | Value ($) | |
| | |
Freddie Mac Structured Agency Credit Risk Debt Notes, “M2”, Series 2017-DNA2,1-monthUSD-LIBOR + 3.450%,
5.956%**, 10/25/2029 | | | 250,000 | | | | 264,548 | |
| | |
Government National Mortgage Association: | | | | | | | | |
| | |
“PI”, Series2015-40, Interest Only, 4.0%, 4/20/2044 | | | 208,577 | | | | 28,742 | |
| | |
“PI”, Series2014-108, Interest Only, 4.5%, 12/20/2039 | | | 56,616 | | | | 9,942 | |
| | |
“IP”, Series2014-11, Interest Only, 4.5%, 1/20/2043 | | | 145,115 | | | | 20,107 | |
| | |
“IN”, Series2009-69, Interest Only, 5.5%, 8/20/2039 | | | 172,093 | | | | 32,296 | |
| | |
“IV”, Series2009-69, Interest Only, 5.5%, 8/20/2039 | | | 167,074 | | | | 31,313 | |
| | |
“IJ”, Series2009-75, Interest Only, 6.0%, 8/16/2039 | | | 115,458 | | | | 19,863 | |
| | |
RESIMAC, “A2”, Series 2017-2, Australian Bank Bill Short Term Rates 1-Month Mid + 1.200%, 3.143%**, 1/15/2049 | | | AUD 486,002 | | | | 341,451 | |
| | |
STACR Trust, “M2”, Series 2018-DNA3, 144A,1-monthUSD-LIBOR + 2.100%,
4.606%**, 9/25/2048 | | | 324,324 | | | | 311,443 | |
Total Collateralized Mortgage Obligations (Cost $2,004,405) | | | | | | | 2,138,184 | |
|
| Government & Agency Obligations 8.4% | |
| Other Government Related (d) 1.4% | |
| | |
Banque Centrale de Tunisie International Bond, 144A, 5.75%, 1/30/2025 | | | 400,000 | | | | 335,536 | |
| | |
Gazprom OAO, 144A, 4.95%, 7/19/2022 | | | 400,000 | | | | 403,197 | |
| | |
Sberbank of Russia, 144A, 5.125%, 10/29/2022 | | | 200,000 | | | | 195,349 | |
| | |
Southern Gas Corridor CJSC, 144A, 6.875%, 3/24/2026 | | | 700,000 | | | | 756,028 | |
| | | | | | | 1,690,110 | |
| | |
| Sovereign Bonds 4.9% | | | | | | | | |
| | |
Export Credit Bank of Turkey, 144A, 5.375%, 10/24/2023 | | | 350,000 | | | | 318,128 | |
| | |
Indonesia Government International Bond,
4.45%, 2/11/2024 | | | 225,000 | | | | 226,167 | |
| | |
Islamic Republic of Pakistan, 144A, 6.875%, 12/5/2027 | | | 200,000 | | | | 181,150 | |
| | |
Ivory Coast Government International Bond, 144A, 5.375%, 7/23/2024 | | | 200,000 | | | | 183,408 | |
| | |
Kingdom of Bahrain, 144A, 6.125%, 8/1/2023 | | | 400,000 | | | | 407,494 | |
| | |
Mexican Udibonos Inflation-Linked Bond, Series
S, 2.0%, 6/9/2022 | | | MXN 9,363,607 | | | | 441,809 | |
| | |
Oman Government International Bond, 144A, 4.75%, 6/15/2026 | | | 600,000 | | | | 518,724 | |
| | |
Republic of Angola, 144A,
9.5%, 11/12/2025 | | | 300,000 | | | | 314,982 | |
The accompanying notes are an integral part of the financial statements.
| | | | |
Deutsche DWS Variable Series II — DWS Global Income Builder VIP | | | | | 13 |
| | | | | | | | |
| | |
| | | Principal
Amount ($)(c) | | | Value ($) | |
| | |
Republic of Argentina, Series NY,Step-up Coupon, 2.5% to 3/31/2019, 3.75% to 3/31/2029, 5.25% to 12/31/2038 | | | 400,000 | | | | 219,204 | |
| | |
Republic of Ecuador, 144A, 8.75%, 6/2/2023 | | | 200,000 | | | | 186,500 | |
| | |
Republic of Hungary,
Series 19/A,
6.5%, 6/24/2019 | | | HUF 16,900,000 | | | | 62,132 | |
| | |
Republic of Kenya, 144A,
6.875%, 6/24/2024 | | | 400,000 | | | | 375,500 | |
| | |
Republic of Namibia, 144A, 5.25%, 10/29/2025 | | | 350,000 | | | | 313,824 | |
| | |
Republic of Nigeria, 144A,
6.5%, 11/28/2027 | | | 200,000 | | | | 176,548 | |
| | |
Republic of Senegal, 144A, 6.25%, 7/30/2024 | | | 400,000 | | | | 388,128 | |
| | |
Republic of Sri Lanka, 144A, 5.75%, 1/18/2022 | | | 200,000 | | | | 188,034 | |
| | |
Republic of Zambia, 144A, 5.375%, 9/20/2022 | | | 500,000 | | | | 357,480 | |
| | |
State of Qatar, 144A,
3.25%, 6/2/2026 | | | 400,000 | | | | 386,282 | |
| | |
United Mexican States,
Series M, 5.75%, 3/5/2026 | | | MXN 13,525,200 | | | | 581,367 | |
| | | | | | | | |
| | | | | | | 5,826,861 | |
|
| U.S. Treasury Obligations 2.1% | |
| | |
U.S. Treasury Bonds,
3.0%, 2/15/2048 | | | 20,000 | | | | 19,893 | |
| | |
U.S. Treasury Inflation Indexed Note, 0.625%, 4/15/2023 | | | 2,570,526 | | | | 2,527,817 | |
| | | | | | | | |
| | | | | | | | 2,547,710 | |
Total Government & Agency Obligations
(Cost $10,510,129) | | | | 10,064,681 | |
| | |
| Convertible Bond 0.2% | | | | | | | | |
| Materials | | | | | | | | |
GEO Specialty Chemicals, Inc.,3-monthUSD-LIBOR + 14.0%, 16.707%**PIK, 10/18/2025 (b) (Cost $254,327) | | | 255,666 | | | | 275,864 | |
| | | | | | | | |
| | |
| | | Principal
Amount ($)(c) | | | Value ($) | |
|
| Short-Term U.S. Treasury Obligations 2.8% | |
| | |
U.S. Treasury Bills: | | | | | | | | |
| | |
2.362%***, 8/15/2019 (e) | | | 1,750,000 | | | | 1,722,479 | |
| | |
2.573%***, 10/10/2019 (f) | | | 1,160,000 | | | | 1,137,194 | |
| | |
2.573%***, 10/10/2019 (f) | | | 500,000 | | | | 490,170 | |
Total Short-Term U.S. Treasury Obligations (Cost $3,350,593) | | | | 3,349,843 | |
| | |
| | | Shares | | | Value ($) | |
| Exchange-Traded Fund 3.3% | | | | | |
| | |
iShares JP Morgan USD Emerging Markets Bond ETF | | | 8,884 | | | | 923,136 | |
| | |
SPDR Bloomberg Barclays Convertible Securities ETF | | | 64,000 | | | | 2,994,560 | |
Total Exchange-Traded Funds(Cost $4,337,185) | | | | | | | 3,917,696 | |
|
| Securities Lending Collateral 1.7% | |
DWS Government & Agency Securities Portfolio “DWS Government Cash Institutional Shares”, 2.29% (g) (h)
(Cost $2,070,696) | | | 2,070,696 | | | | 2,070,696 | |
|
| Cash Equivalents 1.9% | |
DWS Central Cash Management Government Fund, 2.41% (g) (Cost $2,297,660) | | | 2,297,660 | | | | 2,297,660 | |
| | |
| | | % of Net
Assets | | | Value ($) | |
Total Investment Portfolio
(Cost $120,338,548) | | | 100.9 | | | | 120,725,336 | |
| Other Assets and Liabilities, Net | | | (0.9 | ) | | | (1,104,826 | ) |
| Net Assets | | | 100.0 | | | | 119,620,510 | |
The accompanying notes are an integral part of the financial statements.
| | | | | | |
| | 14 | | | | | | Deutsche Variable Series II — DWS Global Income Builder VIP |
A summary of the Fund’s transactions with affiliated investments during the year ended December 31, 2018 are as follows:
| | | | | | | | | | | | | | | | | | | | | | | | | | | | | | | | |
Value ($) at
12/31/2017 | | Purchases
Cost ($) | | | Sales
Proceeds ($) | | | Net
Realized
Gain/
(Loss) ($) | | | Net Change in
Unrealized
Appreciation
(Depreciation) ($) | | | Income ($) | | | Capital Gain
Distributions ($) | | | Number of
Shares
at
12/31/2018 | | | Value ($)
at
12/31/2018 | |
Securities Lending Collateral 1.7% | |
DWS Government & Agency Securities Portfolio “DWS Government Cash Institutional Shares”, 2.29% (g) (h) | |
| 3,253,298 | | | — | | | | 1,182,602 | (i) | | | — | | | | — | | | | 55,330 | | | | — | | | | 2,070,696 | | | | 2,070,696 | |
Cash Equivalents 1.9% | |
DWS Central Cash Management Government Fund, 2.41% (g) | |
| 1,616,434 | | | 89,965,099 | | | | 89,283,873 | | | | — | | | | — | | | | 77,113 | | | | — | | | | 2,297,660 | | | | 2,297,660 | |
| 4,869,732 | | | 89,965,099 | | | | 90,466,475 | | | | — | | | | — | | | | 132,443 | | | | — | | | | 4,368,356 | | | | 4,368,356 | |
| * | Non-income producing security. |
| ** | Variable or floating rate security. These securities are shown at their current rate as of December 31, 2018. For securities based on a published reference rate and spread, the reference rate and spread are indicated within the description above. Certain variable rate securities are not based on a published reference rate and spread but adjust periodically based on current market conditions, prepayment of underlying positions and/or other variables. |
| *** | Annualized yield at time of purchase; not a coupon rate. |
| (a) | All or a portion of these securities were on loan. In addition, “Other Assets and Liabilities, Net” may include pending sales that are also on loan. The value of securities loaned at December 31, 2018 amounted to $1,975,245, which is 1.7% of net assets. |
| (b) | Investment was valued using significant unobservable inputs. |
| (c) | Principal amount stated in U.S. dollars unless otherwise noted. |
| (d) | Government-backed debt issued by financial companies or government sponsored enterprises. |
| (e) | At December 31, 2018, this security has been pledged, in whole or in part, to cover initial margin requirements for open futures contracts. |
| (f) | At December 31, 2018, this security has been pledged, in whole or in part, to cover initial margin requirements for open centrally cleared swap contracts. |
| (g) | Affiliated fund managed by DWS Investment Management Americas, Inc. The rate shown is the annualizedseven-day yield at period end. |
| (h) | Represents collateral held in connection with securities lending. Income earned by the Fund is net of borrower rebates. |
| (i) | Represents the net increase (purchase cost) or decrease (sales proceeds) in the amount invested for the year ended December 31, 2018. |
144A: Security exempt from registration under Rule 144A of the Securities Act of 1933. These securities may be resold in transactions exempt from registration, normally to qualified institutional buyers.
ADR: American Depositary Receipt
ASX: Australian Securities Exchange
CJSC: Closed Joint Stock Company
CLO: Collateralized Loan Obligation
EURIBOR: Euro Interbank Offered Rate
GDR: Global Depositary Receipt
Interest Only: Interest Only (IO) bonds represent the “interest only” portion of payments on a pool of underlying mortgages or mortgage-backed securities. IO securities are subject to prepayment risk of the pool of underlying mortgages.
JSC: Joint Stock Company
LIBOR: London Interbank Offered Rate
MSCI: Morgan Stanley Capital International
PIK: Denotes that all or a portion of the income is paidin-kind in the form of additional principal.
PJSC: Public Joint Stock Company
Principal Only: Principal Only (PO) bonds represent the “principal only” portion of payments on a pool of underlying mortgages or mortgage-backed securities.
REG S: Securities sold under Regulation S may not be offered, sold or delivered within the United States or to, or for the account or benefit of, U.S. persons, except pursuant to an exemption from, or in a transaction not subject to, the registration requirements of the Securities Act of 1933.
REIT: Real Estate Investment Trust
S&P: Standard & Poor’s
SPDR: Standard & Poor’s Depositary Receipt
The accompanying notes are an integral part of the financial statements.
| | | | |
Deutsche DWS Variable Series II — DWS Global Income Builder VIP | | | | | 15 |
At December 31, 2018, open futures contracts purchased were as follows:
| | | | | | | | | | | | | | | | | | | | | | | | |
| Futures | | Currency | | | Expiration
Date | | | Contracts | | | Notional
Amount ($) | | | Notional
Value ($) | | | Unrealized
Appreciation
(Depreciation) ($) | |
| 10 Year U.S. Treasury Note | | | USD | | | | 3/20/2019 | | | | 28 | | | | 3,332,055 | | | | 3,416,438 | | | | 84,383 | |
| 3 Month Euro Euribor Interest Rate | | | EUR | | | | 12/16/2019 | | | | 2 | | | | 574,110 | | | | 574,307 | | | | 197 | |
| 3 Month Euro Swiss Franc (Euroswiss) Interest Rate | | | CHF | | | | 12/16/2019 | | | | 2 | | | | 512,008 | | | | 512,005 | | | | (3 | ) |
| 3 Month Euroyen | | | JPY | | | | 12/16/2019 | | | | 2 | | | | 455,825 | | | | 455,819 | | | | (6 | ) |
| 3 Month Sterling (Short Sterling) Interest Rate | | | GBP | | | | 12/18/2019 | | | | 3 | | | | 472,602 | | | | 472,669 | | | | 67 | |
| 90 Day Eurodollar Time Deposit | | | USD | | | | 12/16/2019 | | | | 2 | | | | 484,755 | | | | 486,750 | | | | 1,995 | |
| ASX 90 Day Bank Accepted Bills | | | AUD | | | | 12/12/2019 | | | | 3 | | | | 2,102,634 | | | | 2,103,351 | | | | 717 | |
| MSCI Mini Emerging Market Index | | | USD | | | | 3/15/2019 | | | | 72 | | | | 3,515,938 | | | | 3,480,480 | | | | (35,458 | ) |
| MSCI World Index | | | USD | | | | 3/15/2019 | | | | 88 | | | | 4,878,867 | | | | 4,746,720 | | | | (132,147 | ) |
| S&P 500E-Mini Index | | | USD | | | | 3/15/2019 | | | | 46 | | | | 5,836,456 | | | | 5,761,960 | | | | (74,496 | ) |
| Ultra 10 Year U.S. Treasury Note | | | USD | | | | 3/20/2019 | | | | 69 | | | | 8,699,627 | | | | 8,975,391 | | | | 275,764 | |
| Total net unrealized appreciation | | | | | | | | | | | | | | | | | | | | | | | 121,013 | |
At December 31, 2018, open futures contracts sold were as follows:
| | | | | | | | | | | | | | | | | | | | | | | | |
| Futures | | Currency | | | Expiration
Date | | | Contracts | | | Notional
Amount ($) | | | Notional
Value ($) | | | Unrealized
Depreciation ($) | |
| 2 Year U.S. Treasury Note | | | USD | | | | 3/29/2019 | | | | 41 | | | | 8,695,367 | | | | 8,704,813 | | | | (9,446 | ) |
| 5 Year U.S. Treasury Note | | | USD | | | | 3/29/2019 | | | | 81 | | | | 9,147,341 | | | | 9,289,688 | | | | (142,347 | ) |
| Euro-Schatz | | | EUR | | | | 3/7/2019 | | | | 81 | | | | 10,382,982 | | | | 10,388,673 | | | | (5,691 | ) |
| U.S. Treasury Long Bond | | | USD | | | | 3/20/2019 | | | | 11 | | | | 1,531,982 | | | | 1,606,000 | | | | (74,018 | ) |
| Ultra Long U.S. Treasury Bond | | | USD | | | | 3/20/2019 | | | | 10 | | | | 1,522,087 | | | | 1,606,562 | | | | (84,475 | ) |
| Total net unrealized depreciation | | | | | | | | | | | | | | | | | | | | | | | (315,977 | ) |
At December 31, 2018, open credit default swap contracts purchased were as follows:
| | | | | | | | | | | | | | | | | | | | | | | | |
| Centrally Cleared Swaps | |
Underlying Reference
Obligation | | Fixed Cash
Flows Paid/
Frequency | | | Expiration
Date | | | Notional
Amount | | Currency | | Value ($) | | | Upfront
Payments
(Received) ($) | | | Unrealized
Appreciation ($) | |
| iTRAXX Europe Series 29 | |
| 1.0%/
Quarterly |
| | | 6/20/2023 | | | 3,000,000 | | EUR | | | (33,896) | | | | (55,355) | | | | 21,459 | |
Markit CDX North America
Investment Grade Index | |
| 1.0%/
Quarterly |
| | | 6/20/2023 | | | 3,000,000 | | USD | | | (25,039) | | | | (48,320) | | | | 23,281 | |
| Total unrealized appreciation | | | | | | | | | | | | | | | | | | | | 44,740 | |
At December 31, 2018, open credit default swap contracts sold were as follows:
| | | | | | | | | | | | | | | | | | | | | | | | |
| Centrally Cleared Swaps | |
Underlying Reference
Obligation | | Fixed Cash
Flows Received/
Frequency | | | Expiration
Date | | | Notional
Amount (j) | | Currency | | Value ($) | | | Upfront
Payments
Paid ($) | | | Unrealized
Depreciation ($) | |
iTRAXX Europe Crossover
Series 29 | |
| 5.0%/
Quarterly |
| | | 6/20/2023 | | | 1,500,000 | | EUR | | | 104,586 | | | | 146,287 | | | | (41,701) | |
Markit CDX North America
High Yield Index | |
| 5.0%/
Quarterly |
| | | 12/20/2023 | | | 2,800,000 | | USD | | | 60,691 | | | | 194,369 | | | | (133,678) | |
Markit CDX North America
High Yield Index | |
| 5.0%/
Quarterly |
| | | 6/20/2023 | | | 6,300,000 | | USD | | | 201,400 | | | | 378,118 | | | | (176,718) | |
| Total unrealized depreciation | | | | | | | | | | | | | | | | | | | | (352,097) | |
| (j) | The maximum potential amount of future undiscounted payments that the Fund could be required to make under a credit default swap contract would be the notional amount of the contract. These potential amounts would be partially offset by any recovery values of the underlying referenced obligation or net amounts received from the settlement of buy protection credit default swap contracts entered into by the Fund for the same underlying referenced obligation, if any. |
The accompanying notes are an integral part of the financial statements.
| | | | | | |
| | 16 | | | | | | Deutsche DWS Variable Series II — DWS Global Income Builder VIP |
At December 31, 2018, open interest rate swap contracts were as follows:
| | | | | | | | | | | | | | | | | | | | |
| Centrally Cleared Swaps | |
Cash Flows
Paid by
the Fund | | Cash Flows
Received by
the Fund | | Effective/
Expiration
Date | | Notional
Amount ($) | | Currency | | Value ($) | | | Upfront
Payments
Paid/
(Received) ($) | | | Unrealized
Appreciation/
(Depreciation) ($) | |
| Fixed —2.75%Semi-Annually | | Floating —3-Month LIBOR Quarterly | | 12/14/2018
12/14/2020 | | 500,000 | | USD | | | (773) | | | | 1,075 | | | | (1,848) | |
| Floating — 3-Month LIBOR Quarterly | | Fixed — 2.75%Semi-Annually | | 12/14/2018
12/14/2023 | | 10,500,000 | | USD | | | 82,901 | | | | (75,197) | | | | 158,098 | |
Fixed — 3.00%
Semi-Annually | | Floating —3-Month LIBORSemi-Annually | | 12/14/2018
12/14/2028 | | 11,800,000 | | USD | | | (283,882) | | | | (36,781) | | | | (247,101) | |
Floating — 3-
Month LIBOR Quarterly | | Fixed — 3.261%Semi-Annually | | 03/20/2018
3/20/2049 | | 3,600,000 | | USD | | | 289,808 | | | | — | | | | 289,808 | |
| Total net unrealized appreciation | | | | | | | | | | | | | | | 198,957 | |
LIBOR: London Interbank Offered Rate;3-month LIBOR rate as of December 31, 2018 is 2.808%.
As of December 31, 2018, the Fund had the following open forward foreign currency contracts:
| | | | | | | | | | | | | | | | | | | | |
| Contracts to Deliver | | | In Exchange For | | | Settlement
Date | | | Unrealized
Appreciation ($) | | | Counterparty |
| EUR | | | 5,630,000 | | | USD | | | 6,509,181 | | | | 1/9/2019 | | | | 55,425 | | | Credit Agricole |
| USD | | | 592,285 | | | CNY | | | 4,127,612 | | | | 1/9/2019 | | | | 8,921 | | | Credit Agricole |
| GBP | | | 1,912,600 | | | USD | | | 2,518,124 | | | | 1/9/2019 | | | | 79,603 | | | Credit Agricole |
| MXN | | | 12,800,000 | | | USD | | | 655,779 | | | | 1/23/2019 | | | | 6,359 | | | State Street Bank and Trust |
| AUD | | | 575,000 | | | USD | | | 416,110 | | | | 2/19/2019 | | | | 10,752 | | | Australia and New Zealand Banking Group Ltd. |
| Total unrealized appreciation | | | | | | | | | | | 161,060 | | | |
| Contracts to Deliver | | | In Exchange For | | | Settlement
Date | | | Unrealized
Depreciation ($) | | | Counterparty |
| EUR | | | 2,500,000 | | | USD | | | 2,864,662 | | | | 1/9/2019 | | | | (1,126) | | | Credit Agricole |
| CNY | | | 8,279,820 | | | USD | | | 1,191,129 | | | | 1/9/2019 | | | | (14,865) | | | Toronto-Dominion Bank |
| JPY | | | 424,934,000 | | | USD | | | 3,760,484 | | | | 1/9/2019 | | | | (117,099) | | | Morgan Stanley |
| USD | | | 6,536,554 | | | EUR | | | 5,650,300 | | | | 1/9/2019 | | | | (59,528) | | | Credit Agricole |
| EUR | | | 980,000 | | | USD | | | 1,120,045 | | | | 2/28/2019 | | | | (8,048) | | | JPMorgan Chase Securities, Inc. |
| Total unrealized depreciation | | | | | | | | | | | (200,666) | | | |
Currency Abbreviations
For information on the Fund’s policy and additional disclosures regarding futures contracts, credit default swap contracts, interest rate swap contracts and forward foreign currency contracts, please refer to the Derivatives section of Note B in the accompanying Notes to Financial Statements.
The accompanying notes are an integral part of the financial statements.
| | | | |
Deutsche DWS Variable Series II — DWS Global Income Builder VIP | | | | | 17 |
Fair Value Measurements
Various inputs are used in determining the value of the Fund’s investments. These inputs are summarized in three broad levels. Level 1 includes quoted prices in active markets for identical securities. Level 2 includes other significant observable inputs (including quoted prices for similar securities, interest rates, prepayment speeds and credit risk). Level 3 includes significant unobservable inputs (including the Fund’s own assumptions in determining the fair value of investments). The level assigned to the securities valuations may not be an indication of the risk or liquidity associated with investing in those securities.
The following is a summary of the inputs used as of December 31, 2018 in valuing the Fund’s investments. For information on the Fund’s policy regarding the valuation of investments, please refer to the Security Valuation section of Note A in the accompanying Notes to Financial Statements.
| | | | | | | | | | | | | | | | |
| Assets | | Level 1 | | | Level 2 | | | Level 3 | | | Total | |
| Common Stocks (k) | | | | | | | | | | | | | | | | |
Communication Services | | $ | 4,550,972 | | | $ | 2,406,378 | | | $ | — | | | $ | 6,957,350 | |
Consumer Discretionary | | | 4,252,812 | | | | 2,471,959 | | | | — | | | | 6,724,771 | |
Consumer Staples | | | 3,926,555 | | | | 1,202,770 | | | | — | | | | 5,129,325 | |
Energy | | | 3,384,704 | | | | 1,994,798 | | | | — | | | | 5,379,502 | |
Financials | | | 4,721,236 | | | | 4,739,331 | | | | — | | | | 9,460,567 | |
Health Care | | | 4,661,040 | | | | 2,234,943 | | | | — | | | | 6,895,983 | |
Industrials | | | 3,200,990 | | | | 3,146,632 | | | | — | | | | 6,347,622 | |
Information Technology | | | 9,806,852 | | | | 1,018,774 | | | | — | | | | 10,825,626 | |
Materials | | | 469,924 | | | | 262,935 | | | | 18,218 | | | | 751,077 | |
Real Estate | | | 3,159,530 | | | | 537,606 | | | | — | | | | 3,697,136 | |
Utilities | | | 2,980,459 | | | | 556,615 | | | | — | | | | 3,537,074 | |
| Preferred Stocks (k) | | | 6,931,662 | | | | — | | | | — | | | | 6,931,662 | |
| Warrant | | | — | | | | — | | | | 4,191 | | | | 4,191 | |
| Fixed Income Investments (k) | | | | | | | | | | | | | | | | |
Corporate Bonds | | | — | | | | 15,500,030 | | | | — | | | | 15,500,030 | |
Asset-Backed | | | — | | | | 6,926,386 | | | | — | | | | 6,926,386 | |
Mortgage-Backed Securities Pass-Throughs | | | — | | | | 20,434 | | | | — | | | | 20,434 | |
Commercial Mortgage-Backed Securities | | | — | | | | 1,521,976 | | | | — | | | | 1,521,976 | |
Collateralized Mortgage Obligations | | | — | | | | 2,138,184 | | | | — | | | | 2,138,184 | |
Government & Agency Obligations | | | — | | | | 10,064,681 | | | | — | | | | 10,064,681 | |
Convertible Bond | | | — | | | | — | | | | 275,864 | | | | 275,864 | |
Short-Term U.S. Treasury Obligations | | | — | | | | 3,349,843 | | | | — | | | | 3,349,843 | |
| Exchange-Traded Funds | | | 3,917,696 | | | | — | | | | — | | | | 3,917,696 | |
| Short-Term Investments (k) | | | 4,368,356 | | | | — | | | | — | | | | 4,368,356 | |
| Derivatives (l) | | | | | | | | | | | | | | | | |
Futures Contracts | | | 363,123 | | | | — | | | | — | | | | 363,123 | |
Credit Default Swap Contracts | | | — | | | | 44,740 | | | | — | | | | 44,740 | |
Interest Rate Swap Contracts | | | — | | | | 447,906 | | | | — | | | | 447,906 | |
Forward Foreign Currency Contracts | | | — | | | | 161,060 | | | | — | | | | 161,060 | |
| Total | | $ | 60,695,911 | | | $ | 60,747,981 | | | $ | 298,273 | | | $ | 121,742,165 | |
| | | | |
| Liabilities | | Level 1 | | | Level 2 | | | Level 3 | | | Total | |
| Derivatives (l) | | | | | | | | | | | | | | | | |
Futures Contracts | | $ | (558,087 | ) | | $ | — | | | $ | — | | | $ | (558,087 | ) |
Credit Default Swap Contracts | | | — | | | | (352,097 | ) | | | — | | | | (352,097 | ) |
Interest Rate Swap Contracts | | | — | | | | (248,949 | ) | | | — | | | | (248,949 | ) |
Forward Foreign Currency Contracts | | | — | | | | (200,666 | ) | | | — | | | | (200,666 | ) |
| Total | | $ | (558,087 | ) | | $ | (801,712 | ) | | $ | — | | | $ | (1,359,799 | ) |
| (k) | See Investment Portfolio for additional detailed categorizations. |
| (l) | Derivatives include unrealized appreciation (depreciation) on open futures contracts, credit default swap contracts, interest rate swap contracts and forward foreign currency contracts. |
The accompanying notes are an integral part of the financial statements.
| | | | | | |
| | 18 | | | | | | Deutsche DWS Variable Series II — DWS Global Income Builder VIP |
Statement of Assets and Liabilities
| | | | |
| as of December 31, 2018 | | | | |
| |
| Assets | | | | |
| Investments innon-affiliated securities, at value (cost $115,970,192) — including $1,975,245 of securities loaned | | $ | 116,356,980 | |
| Investment in DWS Government & Agency Securities Portfolio (cost $2,070,696)* | | | 2,070,696 | |
| Investment in DWS Central Cash Management Government Fund (cost $2,297,660) | | | 2,297,660 | |
| Cash | | | 321,921 | |
| Foreign currency, at value (cost $151,246) | | | 148,589 | |
| Receivable for investments sold | | | 4,457 | |
| Receivable for Fund shares sold | | | 3,488 | |
| Dividends receivable | | | 191,821 | |
| Interest receivable | | | 456,991 | |
| Receivable for variation margin on futures contracts | | | 45,247 | |
| Receivable for variation margin on centrally cleared swaps | | | 30,961 | |
| Unrealized appreciation on forward foreign currency contracts | | | 161,060 | |
| Foreign taxes recoverable | | | 102,484 | |
| Other assets | | | 3,381 | |
| Total assets | | | 122,195,736 | |
|
| Liabilities | |
| Payable upon return of securities loaned | | | 2,070,696 | |
| Payable for Fund shares redeemed | | | 90,369 | |
| Unrealized depreciation on forward foreign currency contracts | | | 200,666 | |
| Accrued management fee | | | 20,278 | |
| Accrued Trustees’ fees | | | 4,311 | |
| Other accrued expenses and payables | | | 188,906 | |
| Total liabilities | | | 2,575,226 | |
| Net assets, at value | | $ | 119,620,510 | |
|
| Net Assets Consist of | |
| Distributable earnings (loss) | | | 5,097,556 | |
| Paid-in capital | | | 114,522,954 | |
| Net assets, at value | | $ | 119,620,510 | |
|
| Net Asset Value | |
Class A | |
| |
| Net Asset Value,offering and redemption price per share ($119,611,105 ÷ 5,608,755 outstanding shares of beneficial interest, no par value, unlimited number of shares authorized) | | $ | 21.33 | |
Class B | |
| |
| Net Asset Value,offering and redemption price per share ($9,405 ÷ 441.5 outstanding shares of beneficial interest, no par value, unlimited number of shares authorized) | | $ | 21.30 | |
| * | Represents collateral on securities loaned. |
The accompanying notes are an integral part of the financial statements.
| | | | |
Deutsche DWS Variable Series II — DWS Global Income Builder VIP | | | | | 19 |
Statement of Operations
| | | | |
| for the year ended December 31, 2018 | |
| |
| Investment Income | | | | |
| Income: | |
| Dividends (net of foreign taxes withheld of $151,631) | | $ | 3,463,738 | |
| Interest (net of foreign taxes withheld of $4,993) | | | 1,897,129 | |
| Income distributions — DWS Central Cash Management Government Fund | | | 77,113 | |
| Securities lending income, net of borrower rebates | | | 55,330 | |
| Total income | | | 5,493,310 | |
| Expenses: | |
| Management fee | | | 505,792 | |
| Administration fee | | | 136,700 | |
| Services to Shareholders | | | 1,227 | |
| Distribution service fees (Class B) | | | 17 | |
| Custodian fee | | | 65,510 | |
| Professional fees | | | 114,255 | |
| Reports to shareholders | | | 66,530 | |
| Trustees’ fees and expenses | | | 10,190 | |
| Other | | | 48,519 | |
| Total expenses before expense reductions | | | 948,740 | |
| Expense reductions | | | (18,283 | ) |
| Total expenses after expense reductions | | | 930,457 | |
| Net investment income | | | 4,562,853 | |
|
| Realized and Unrealized Gain (Loss) | |
| Net realized gain (loss) from: | |
| Investments | | | 2,283,676 | |
| Swap contracts | | | 1,886,394 | |
| Futures | | | (2,804,146 | ) |
| Written options | | | 362,589 | |
| Forward foreign currency contracts | | | 464,627 | |
| Foreign currency | | | 8,195 | |
| | | | 2,201,335 | |
| Change in net unrealized appreciation (depreciation) on: | | | | |
| Investments | | | (14,985,048 | ) |
| Swap contracts | | | (1,284,644 | ) |
| Futures | | | (849,276 | ) |
| Forward foreign currency contracts | | | 191,206 | |
| Foreign currency | | | (1,851 | ) |
| | | | (16,929,613 | ) |
| Net gain (loss) | | | (14,728,278 | ) |
| Net increase (decrease) in net assets resulting from operations | | $ | (10,165,425 | ) |
The accompanying notes are an integral part of the financial statements.
| | | | | | |
| | 20 | | | | | | Deutsche DWS Variable Series II — DWS Global Income Builder VIP |
Statements of Changes in Net Assets
| | | | | | | | |
| | | Years Ended December 31, | |
| Increase (Decrease) in Net Assets | | 2018 | | | 2017 | |
| Operations: | | | | | | | | |
| Net investment income | | $ | 4,562,853 | | | $ | 5,099,423 | |
| Net realized gain (loss) | | | 2,201,335 | | | | 18,938,450 | |
| Change in net unrealized appreciation (depreciation) | | | (16,929,613 | ) | | | 3,377,582 | |
| Net increase (decrease) in net assets resulting from operations | | | (10,165,425 | ) | | | 27,415,455 | |
| Distributions to shareholders: | |
Class A | | | (17,909,607 | ) | | | (5,628,068 | )* |
| Fund share transactions: | | | | | | | | |
Class A | |
| Proceeds from shares sold | | | 2,336,008 | | | | 3,259,753 | |
| Reinvestment of distributions | | | 17,909,607 | | | | 5,628,068 | |
| Payments for shares redeemed | | | (19,079,316 | ) | | | (69,176,010 | ) |
| Net increase (decrease) in net assets from Class A share transactions | | | 1,166,299 | | | | (60,288,189 | ) |
Class B | |
| Proceeds from shares sold | | | 10,000 | ** | | | — | |
| Net increase (decrease) in net assets from Class B share transactions | | | 10,000 | ** | | | — | |
| Increase (decrease) in net assets | | | (26,898,733 | ) | | | (38,500,802 | ) |
| Net assets at beginning of year | | | 146,519,243 | | | | 185,020,239 | |
| | |
| Net assets at end of year | | | 119,620,510 | | | | 146,519,243 | *** |
|
| Other Information | |
Class A | |
| Shares outstanding at beginning of period | | | 5,517,134 | | | | 7,873,905 | |
| Shares sold | | | 97,250 | | | | 130,993 | |
| Shares issued to shareholders in reinvestment of distributions | | | 796,691 | | | | 233,530 | |
| Shares redeemed | | | (802,320 | ) | | | (2,721,294 | ) |
| Net increase (decrease) in Class A shares | | | 91,621 | | | | (2,356,771 | ) |
| | |
| Shares outstanding at end of period | | | 5,608,755 | | | | 5,517,134 | |
Class B | |
| Shares outstanding at beginning of period | | | — | | | | — | |
| Shares sold | | | 441.5 | ** | | | — | |
| Net increase (decrease) in Class B shares | | | 441.5 | ** | | | — | |
| | |
| Shares outstanding at end of period | | | 441.5 | ** | | | — | |
| * | Includes distributions from net investment income. |
| ** | For the period from May 1, 2018 (commencement of operations of Class B) to December 31, 2018. |
| *** | Includes undistributed net investment income of $4,363,984. |
The accompanying notes are an integral part of the financial statements.
| | | | |
Deutsche DWS Variable Series II — DWS Global Income Builder VIP | | | | | 21 |
Financial Highlights
| | | | | | | | | | | | | | | | | | | | |
| | | Years Ended December 31, | |
| Class A | | 2018 | | | 2017 | | | 2016 | | | 2015 | | | 2014 | |
| | | | | |
| Selected Per Share Data | | | | | | | | | | | | | | | | | | | | |
| Net asset value, beginning of period | | $ | 26.56 | | | $ | 23.50 | | | $ | 22.93 | | | $ | 24.62 | | | $ | 27.30 | |
| Income (loss) from investment operations: | | | | | | | | | | | | | | | | | | | | |
| | | | | |
Net investment incomea | | | .80 | | | | .71 | | | | .61 | | | | .68 | | | | .72 | |
Net realized and unrealized gain (loss) | | | (2.67 | ) | | | 3.10 | | | | .91 | | | | (.97 | ) | | | .25 | |
Total from investment operations | | | (1.87 | ) | | | 3.81 | | | | 1.52 | | | | (.29 | ) | | | .97 | |
| Less distributions from: | | | | | | | | | | | | | | | | | | | | |
| | | | | |
Net investment income | | | (.98 | ) | | | (.75 | ) | | | (.95 | ) | | | (.76 | ) | | | (.85 | ) |
Net realized gains | | | (2.38 | ) | | | — | | | | — | | | | (.64 | ) | | | (2.80 | ) |
Total distributions | | | (3.36 | ) | | | (.75 | ) | | | (.95 | ) | | | (1.40 | ) | | | (3.65 | ) |
| Net asset value, end of period | | $ | 21.33 | | | $ | 26.56 | | | $ | 23.50 | | | $ | 22.93 | | | $ | 24.62 | |
| Total Return (%) | | | (7.66 | )b | | | 16.54 | | | | 6.81 | | | | (1.44 | )b | | | 3.83 | |
| | | | | |
| Ratios to Average Net Assets and Supplemental Data | | | | | | | | | | | | | | | | | | | | |
| Net assets, end of period ($ millions) | | | 120 | | | | 147 | | | | 185 | | | | 202 | | | | 247 | |
| Ratio of expenses before expense reductions (%)c | | | .69 | | | | .63 | | | | .62 | | | | .60 | | | | .62 | |
| Ratio of expenses after expense reductions (%)c | | | .68 | | | | .63 | | | | .62 | | | | .58 | | | | .62 | |
| Ratio of net investment income (loss) (%) | | | 3.34 | | | | 2.85 | | | | 2.66 | | | | 2.85 | | | | 2.83 | |
| Portfolio turnover rate (%) | | | 70 | | | | 122 | | | | 135 | | | | 92 | | | | 88 | |
| a | Based on average shares outstanding during the period. |
| b | Total return would have been lower had certain expenses not been reduced. |
| c | Expense ratio does not reflect charges and fees associated with the separate account that invests in the Fund or any variable life insurance policy or variable annuity contract for which the Fund is an investment option. |
| | | | |
| | | Period Ended | |
| Class B | | 12/31/18a | |
| |
| Selected Per Share Data | | | | |
| Net asset value, beginning of period | | $ | 22.65 | |
| Income (loss) from investment operations: | | | | |
| |
Net investment incomeb | | | .50 | |
Net realized and unrealized gain (loss) | | | (1.85 | ) |
Total from investment operations | | | (1.35 | ) |
| Net asset value, end of period | | $ | 21.30 | |
| Total Return (%)c | | | (5.96 | )** |
| |
| Ratios to Average Net Assets and Supplemental Data | | | | |
| Net assets, end of period ($ thousands) | | | 9 | |
| Ratio of expenses before expense reductions (%)d | | | 1.15 | * |
| Ratio of expenses after expense reductions (%)d | | | .86 | * |
| Ratio of net investment income (loss) (%) | | | 3.30 | * |
| Portfolio turnover rate (%) | | | 70 | e |
| a | For the period from May 1, 2018 (commencement of operations) to December 31, 2018. |
| b | Based on average shares outstanding during the period. |
| c | Total return would have been lower had certain expenses not been reduced. |
| d | Expense ratio does not reflect charges and fees associated with the separate account that invests in the Fund or any variable life insurance policy or variable annuity contract for which the Fund is an investment option. |
| e | Represents the Fund’s portfolio turnover rate for the year ended December 31, 2018. |
The accompanying notes are an integral part of the financial statements.
| | | | | | |
| | 22 | | | | | | Deutsche DWS Variable Series ll — DWS Global Income Builder VIP |
| | | | |
| Notes to Financial Statements | | | | |
A. Organization and Significant Accounting Policies
DWS Global Income Builder VIP (formerly Deutsche Global Income Builder VIP) (the “Fund”) is a diversified series of Deutsche DWS Variable Series II (formerly Deutsche Variable Series II) (the “Trust”), which is registered under the Investment Company Act of 1940, as amended (the “1940 Act”), as an open-end management investment company organized as a Massachusetts business trust.
Multiple Classes of Shares of Beneficial Interest.The Fund offers two classes of shares (Class A shares and Class B shares). Class B shares commenced operations on May 1, 2018. Sales of Class B shares are subject to recordkeeping fees up to 0.15% and Rule 12b-1 fees under the 1940 Act equal to an annual rate of 0.25% of the average daily net assets of the Class B shares of the Fund. Class A shares are not subject to such fees.
Investment income, realized and unrealized gains and losses, and certain fund-level expenses and expense reductions, if any, are borne pro rata on the basis of relative net assets by the holders of all classes of shares, except that each class bears certain expenses unique to that class (including the applicable Rule 12b-1 distribution fees). Differences in class-level expenses may result in payment of different per share dividends by class. All shares have equal rights with respect to voting subject to class-specific arrangements.
The Fund’s financial statements are prepared in accordance with accounting principles generally accepted in the United States of America (“U.S. GAAP”) which require the use of management estimates. Actual results could differ from those estimates. The Fund qualifies as an investment company under Topic 946 of Accounting Standards Codification of U.S. GAAP. The policies described below are followed consistently by the Fund in the preparation of its financial statements.
In October 2018, the Securities and Exchange Commission adopted amendments to certain disclosure requirements in Securities Act Release No. 33-10532, Disclosure Update and Simplification, which is intended to facilitate the disclosure of information to investors and simplify compliance without significantly altering the total mix of information provided to investors. Effective with the current reporting period, the Fund adopted the amendments with the impacts being that the Fund is no longer required to present components of distributable earnings on the Statement of Assets and Liabilities or the sources of distributable earnings and the amount of undistributed net investment income on the Statements of Changes in Net Assets.
Security Valuation. Investments are stated at value determined as of the close of regular trading on the New York Stock Exchange on each day the exchange is open for trading.
Various inputs are used in determining the value of the Fund’s investments. These inputs are summarized in three broad levels. Level 1 includes quoted prices in active markets for identical securities. Level 2 includes other significant observable inputs (including quoted prices for similar securities, interest rates, prepayment speeds and credit risk). Level 3 includes significant unobservable inputs (including the Fund’s own assumptions in determining the fair value of investments). The level assigned to the securities valuations may not be an indication of the risk or liquidity associated with investing in those securities.
Equity securities and Exchange-Traded Funds (“ETFs”) are valued at the most recent sale price or official closing price reported on the exchange (U.S. or foreign) or over-the-counter market on which they trade. Equity securities or ETFs for which no sales are reported are valued at the calculated mean between the most recent bid and asked quotations on the relevant market or, if a mean cannot be determined, at the most recent bid quotation. Equity securities and ETFs are generally categorized as Level 1. For certain international equity securities, in order to adjust for events which may occur between the close of the foreign exchanges and the close of the New York Stock Exchange, a fair valuation model may be used. This fair valuation model takes into account comparisons to the valuation of American Depository Receipts (ADRs), exchange-traded funds, futures contracts and certain indices and these securities are categorized as Level 2.
Debt securities are valued at prices supplied by independent pricing services approved by the Fund’s Board. Such services may use various pricing techniques which take into account appropriate factors such as yield, quality, coupon rate, maturity, type of issue, trading characteristics, prepayment speeds and other data, as well as broker quotes. If the pricing services are unable to provide valuations, debt securities are valued at the average of the most recent reliable bid quotations or evaluated prices, as applicable, obtained from broker-dealers. These securities are generally categorized as Level 2.
Investments in open-end investment companies are valued at their net asset value each business day and are categorized as Level 1.
| | | | |
Deutsche DWS Variable Series II — DWS Global Income Builder VIP | | | | | 23 |
Futures contracts are generally valued at the settlement prices established each day on the exchange on which they are traded and are categorized as Level 1.
Forward currency contracts are valued at the prevailing forward exchange rate of the underlying currencies and are categorized as Level 2.
Swap contracts are valued daily based upon prices supplied by a Board approved pricing vendor, if available, and otherwise are valued at the price provided by the broker-dealer. Swap contracts are generally categorized as Level 2.
Exchange-traded options are valued at the last sale price or, in the absence of a sale, the mean between the closing bid and asked prices or at the most recent asked price (bid for purchased options) if no bid or asked price are available. Exchange-traded options are categorized as Level 1. Over-the-counter written or purchased options are valued at prices supplied by a Board approved pricing vendor, if available, and otherwise are valued at the price provided by the broker-dealer with which the option was traded. Over-the-counter written or purchased options are generally categorized as Level 2.
Securities and other assets for which market quotations are not readily available or for which the above valuation procedures are deemed not to reflect fair value are valued in a manner that is intended to reflect their fair value as determined in accordance with procedures approved by the Board and are generally categorized as Level 3. In accordance with the Fund’s valuation procedures, factors considered in determining value may include, but are not limited to, the type of the security; the size of the holding; the initial cost of the security; the existence of any contractual restrictions on the security’s disposition; the price and extent of public trading in similar securities of the issuer or of comparable companies; quotations or evaluated prices from broker-dealers and/or pricing services; information obtained from the issuer, analysts, and/or the appropriate stock exchange (for exchange-traded securities); an analysis of the company’s or issuer’s financial statements; an evaluation of the forces that influence the issuer and the market(s) in which the security is purchased and sold; and with respect to debt securities, the maturity, coupon, creditworthiness, currency denomination and the movement of the market in which the security is normally traded. The value determined under these procedures may differ from published values for the same securities.
Disclosure about the classification of fair value measurements is included in a table following the Fund’s Investment Portfolio.
Foreign Currency Translations. The books and records of the Fund are maintained in U.S. dollars. Investment securities and other assets and liabilities denominated in a foreign currency are translated into U.S. dollars at the prevailing exchange rates at period end. Purchases and sales of investment securities, income and expenses are translated into U.S. dollars at the prevailing exchange rates on the respective dates of the transactions.
Net realized and unrealized gains and losses on foreign currency transactions represent net gains and losses between trade and settlement dates on securities transactions, the acquisition and disposition of foreign currencies, and the difference between the amount of net investment income accrued and the U.S. dollar amount actually received. The portion of both realized and unrealized gains and losses on investments that results from fluctuations in foreign currency exchange rates is not separately disclosed but is included with net realized and unrealized gain/appreciation and loss/depreciation on investments.
Securities Lending. Deutsche Bank AG, as lending agent, lends securities of the Fund to certain financial institutions under the terms of its securities lending agreement. During the term of the loans, the Fund continues to receive interest and dividends generated by the securities and to participate in any changes in their market value. The Fund requires the borrowers of the securities to maintain collateral with the Fund consisting of either cash or liquid, unencumbered assets having a value at least equal to the value of the securities loaned. When the collateral falls below specified amounts, the lending agent will use its best effort to obtain additional collateral on the next business day to meet required amounts under the securities lending agreement. As of period end, any securities on loan were collateralized by cash. During the year ended December 31, 2018, the Fund invested the cash collateral into a joint trading account in affiliated money market funds managed by DWS Investment Management Americas, Inc. As of December 31, 2018, the Fund invested the cash collateral in DWS Government & Agency Securities Portfolio. DWS Investment Management Americas, Inc. receives a management/administration fee (0.12% annualized effective rate as of December 31, 2018) on the cash collateral invested in DWS Government & Agency Securities Portfolio. The Fund receives compensation for lending its securities either in the form of fees or by earning interest on invested cash collateral net of borrower rebates and fees paid to a lending agent. Either the Fund or the borrower may terminate the loan at any time, and the borrower, after notice, is required to return borrowed
| | | | | | |
| | 24 | | | | | | Deutsche DWS Variable Series II — DWS Global Income Builder VIP |
securities within a standard time period. There may be risks of delay and costs in recovery of securities or even loss of rights in the collateral should the borrower of the securities fail financially. If the Fund is not able to recover securities lent, the Fund may sell the collateral and purchase a replacement investment in the market, incurring the risk that the value of the replacement security is greater than the value of the collateral. The Fund is also subject to all investment risks associated with the reinvestment of any cash collateral received, including, but not limited to, interest rate, credit and liquidity risk associated with such investments.
As of December 31, 2018, the Fund had securities on loan, which were classified as common stocks and corporate bonds in the Investment Portfolio. The value of the related collateral exceeded the value of the securities loaned at period end.
| | | | | | | | | | | | | | | | | | | | |
| Remaining Contractual Maturity of the Agreementsas of December 31, 2018 | |
| | | Overnight
and
Continuous | | | <30 days | | | Between 30
& 90 days | | | >90 days | | | Total | |
Securities Lending Transactions | | | | | | | | | | | | | | | | | | | | |
| Common Stocks | | $ | 516,311 | | | $ | — | | | $ | — | | | $ | — | | | $ | 516,311 | |
| Corporate Bonds | | | 1,554,385 | | | | — | | | | — | | | | — | | | | 1,554,385 | |
| Total Borrowings | | $ | 2,070,696 | | | $ | — | | | $ | — | | | $ | — | | | $ | 2,070,696 | |
| | | |
Gross amount of recognized liabilities for securities lending transactions: | | | | | | | | | | | $ | 2,070,696 | |
When-Issued/Delayed Delivery Securities. The Fund may purchase or sell securities with delivery or payment to occur at a later date beyond the normal settlement period. At the time the Fund enters into a commitment to purchase or sell a security, the transaction is recorded and the value of the transaction is reflected in the net asset value. The price of such security and the date when the security will be delivered and paid for are fixed at the time the transaction is negotiated. The value of the security may vary with market fluctuations. At the time the Fund enters into a purchase transaction it is required to segregate cash or other liquid assets at least equal to the amount of the commitment. Additionally, the Fund may be required to post securities and/or cash collateral in accordance with the terms of the commitment.
Certain risks may arise upon entering into when-issued or delayed delivery transactions from the potential inability of counterparties to meet the terms of their contracts or if the issuer does not issue the securities due to political, economic or other factors. Additionally, losses may arise due to changes in the value of the underlying securities.
Taxes. The Fund’s policy is to comply with the requirements of the Internal Revenue Code, as amended, which are applicable to regulated investment companies and to distribute all of its taxable income to its shareholders.
Additionally, the Fund may be subject to taxes imposed by the governments of countries in which it invests and are generally based on income and/or capital gains earned or repatriated, a portion of which may be recoverable based upon the current interpretation of the tax rules and regulations. Estimated tax liabilities and recoveries on certain foreign securities are recorded on an accrual basis and are reflected as components of interest income or net change in unrealized gain/loss on investments. Tax liabilities realized as a result of security sales are reflected as a component of net realized gain/loss on investments.
The Fund has reviewed the tax positions for the open tax years as of December 31, 2018 and has determined that no provision for income tax and/or uncertain tax positions is required in the Fund’s financial statements. The Fund’s federal tax returns for the prior three fiscal years remain open subject to examination by the Internal Revenue Service.
Distribution of Income and Gains. Distributions from net investment income of the Fund, if any, are declared and distributed to shareholders annually. Net realized gains from investment transactions, in excess of available capital loss carryforwards, would be taxable to the Fund if not distributed and, therefore, will be distributed to shareholders at least annually. The Fund may also make additional distributions for tax purposes if necessary.
The timing and characterization of certain income and capital gain distributions are determined annually in accordance with federal tax regulations which may differ from accounting principles generally accepted in the United States of America. These differences primarily relate to investments in foreign denominated investments, forward currency contracts, futures contracts, swap contracts and certain securities sold at a loss. As a result, net investment income (loss) and net realized gain (loss) on investment transactions for a reporting period may differ significantly from distributions during such period. Accordingly, the Fund may
| | | | |
Deutsche DWS Variable Series II — DWS Global Income Builder VIP | | | | | 25 |
periodically make reclassifications among certain of its capital accounts without impacting the net asset value of the Fund.
At December 31, 2018, the Fund’s components of distributable earnings on a tax basis were as follows:
| | | | |
| Undistributed ordinary income* | | $ | 4,970,065 | |
| Unrealized appreciation (depreciation) on investments | | $ | 111,511 | |
At December 31, 2018, the aggregate cost of investments for federal income tax purposes was $120,776,965. The net unrealized appreciation for all investments based on tax cost was $111,511. This consisted of aggregate gross unrealized appreciation for all investments in which there was an excess of value over tax cost of $8,870,517 and aggregate gross unrealized depreciation for all investments in which there was an excess of tax cost over value of $8,759,006.
In addition, the tax character of distributions paid by the Fund is summarized as follows:
| | | | | | | | |
| | | Years Ended December 31, | |
| | | 2018 | | | 2017 | |
| Distributions from ordinary income* | | $ | 9,573,430 | | | $ | 5,628,068 | |
| Distributions from long-term capital gains | | $ | 8,336,177 | | | $ | — | |
| * | For tax purposes, short-term capital gain distributions are considered ordinary income distributions. |
Expenses. Expenses of the Trust arising in connection with a specific fund are allocated to that fund. Other Trust expenses which cannot be directly attributed to a fund are apportioned among the funds in the Trust based upon the relative net assets or other appropriate measures.
Contingencies. In the normal course of business, the Fund may enter into contracts with service providers that contain general indemnification clauses. The Fund’s maximum exposure under these arrangements is unknown, as this would involve future claims that may be made against the Fund that have not yet been made. However, based on experience, the Fund expects the risk of loss to be remote.
Other. Investment transactions are accounted for on a trade date plus one basis for daily net asset value calculations. However, for financial reporting purposes, investment transactions are reported on trade date. Interest income is recorded on the accrual basis. Dividend income is recorded on the ex-dividend date net of foreign withholding taxes. Certain dividends from foreign securities may be recorded subsequent to the ex-dividend date as soon as the Fund is informed of such dividends. Realized gains and losses from investment transactions are recorded on an identified cost basis. Proceeds from litigation payments, if any, are included in net realized gain (loss) from investments. All discounts and premiums are accreted/amortized for both tax and financial reporting purposes, with the exception of securities in default of principal.
B. Derivative Instruments
Swaps. A swap is a contract between two parties to exchange future cash flows at periodic intervals based on the notional amount of the swap. A bilateral swap is a transaction between the fund and a counterparty where cash flows are exchanged between the two parties. A centrally cleared swap is a transaction executed between the fund and a counterparty, then cleared by a clearing member through a central clearinghouse. The central clearinghouse serves as the counterparty, with whom the fund exchanges cash flows.
The value of a swap is adjusted daily, and the change in value, if any, is recorded as unrealized appreciation or depreciation in the Statement of Assets and Liabilities. Gains or losses are realized when the swap expires or is closed. Certain risks may arise when entering into swap transactions including counterparty default; liquidity; or unfavorable changes in interest rates or the value of the underlying reference security, commodity or index. In connection with bilateral swaps, securities and/or cash may be identified as collateral in accordance with the terms of the swap agreement to provide assets of value and recourse in the event of default. The maximum counterparty credit risk is the net present value of the cash flows to be received from or paid to the counterparty over the term of the swap, to the extent that this amount is beneficial to the Fund, in addition to any related collateral posted to the counterparty by the Fund. This risk may be partially reduced by a master netting arrangement between the Fund and the counterparty. Upon entering into a centrally cleared swap, the Fund is required to deposit with a financial intermediary cash or securities (“initial margin”) in an amount equal to a certain percentage of the notional amount of the swap. Subsequent payments (“variation margin”) are made or received by the Fund dependent upon the daily fluctuations in the value of the swap. In a cleared swap transaction, counterparty risk is minimized as the central clearinghouse acts as the counterparty.
| | | | | | |
| | 26 | | | | | | Deutsche DWS Variable Series II — DWS Global Income Builder VIP |
An upfront payment, if any, made by the Fund is recorded as an asset in the Statement of Assets and Liabilities. An upfront payment, if any, received by the Fund is recorded as a liability in the Statement of Assets and Liabilities. Payments received or made at the end of the measurement period are recorded as realized gain or loss in the Statement of Operations.
Interest Rate Swaps. Interest rate swaps are agreements in which the Fund agrees to pay to the counterparty a fixed rate payment in exchange for the counterparty agreeing to pay to the Fund a variable rate payment, or the Fund agrees to receive from the counterparty a fixed rate payment in exchange for the counterparty agreeing to receive from the Fund a variable rate payment. The payment obligations are based on the notional amount of the swap. For the year ended December 31, 2018, the Fund entered into interest rate swap agreements to gain exposure to different parts of the yield curve while managing overall duration.
A summary of the open interest rate swap contracts as of December 31, 2018 is included in a table following the Fund’s Investment Portfolio. For the year ended December 31, 2018, the investment in interest rate swap contracts had a total notional amount generally indicative of a range from $26,400,000 to approximately $38,398,000.
Credit Default Swaps. Credit default swaps are agreements between a buyer and a seller of protection against predefined credit events for the reference entity. The Fund may enter into credit default swaps to gain exposure to an underlying issuer’s credit quality characteristics without directly investing in that issuer or to hedge against the risk of a credit event on debt securities. As a seller of a credit default swap, the Fund is required to pay the par (or other agreed-upon) value of the referenced entity to the counterparty with the occurrence of a credit event by a third party, such as a U.S. or foreign corporate issuer, on the reference entity, which would likely result in a loss to the Fund. In return, the Fund receives from the counterparty a periodic stream of payments over the term of the swap provided that no credit event has occurred. If no credit event occurs, the Fund keeps the stream of payments with no payment obligations. The Fund may also buy credit default swaps, in which case the Fund functions as the counterparty referenced above. This involves the risk that the swap may expire worthless. It also involves counterparty risk that the seller may fail to satisfy its payment obligations to the Fund with the occurrence of a credit event. When the Fund sells a credit default swap, it will cover its commitment. This may be achieved by, among other methods, maintaining cash or liquid assets equal to the aggregate notional value of the reference entities for all outstanding credit default swaps sold by the Fund. For the year ended December 31, 2018, the Fund entered into credit default swap agreements to gain exposure to the underlying issuer’s credit quality characteristics and to hedge the risk of default or other specified credit events on portfolio assets.
Under the terms of a credit default swap, the Fund receives or makes periodic payments based on a specified interest rate on a fixed notional amount. These payments are recorded as a realized gain or loss in the Statement of Operations. Payments received or made as a result of a credit event or termination of the swap are recognized, net of a proportional amount of the upfront payment, as realized gains or losses in the Statement of Operations.
A summary of the open credit default swap contracts as of December 31, 2018 is included in a table following the Fund’s Investment Portfolio. For the year ended December 31, 2018, the investment in credit default swap contracts purchased had a total USD equivalent notional value generally indicative of a range from $0 to approximately $6,483,000 and the investment in credit default swap contracts sold had a total USD equivalent notional value generally indicative of a range from approximately $4,800,000 to $10,842,000.
Total Return Swap Contracts. Total return swaps involve commitments to pay interest in exchange for a market-linked return based on a notional amount. One counterparty pays out the total return of the reference security or index underlying the total return swap, and in return receives a fixed or variable rate. As a receiver, the Fund would receive payments based on any positive total return and would owe payments in the event of a negative total return. As the payer, the Fund would owe payments on any net positive total return, and would receive payments in the event of a negative total return. For the year ended December 31, 2018, the Fund entered into total return swap transactions as a means of gaining exposure to a particular asset class without investing directly in such asset class.
There were no open total return swap contracts as of December 31, 2018. For the year ended December 31, 2018, the investment in total return swap contracts had a total notional amount generally indicative of a range from $0 to approximately $15,727,000.
Futures Contracts. A futures contract is an agreement between a buyer or seller and an established futures exchange or its clearinghouse in which the buyer or seller agrees to take or make a delivery of a specific amount of a financial instrument at a specified price on a specific date (settlement date). For the year ended December 31, 2018, the Fund entered into interest rate futures to gain exposure to different parts of the
| | | | |
Deutsche DWS Variable Series II — DWS Global Income Builder VIP | | | | | 27 |
yield curve while managing overall duration. The Fund also entered into interest rate futures contracts for non-hedging purposes to seek to enhance potential gains. In addition, the Fund entered into equity index futures as a means of gaining exposure to the equity asset class without investing directly into such asset class and to manage the risk of stock market volatility.
Upon entering into a futures contract, the Fund is required to deposit with a financial intermediary cash or securities (“initial margin”) in an amount equal to a certain percentage of the face value indicated in the futures contract. Subsequent payments (“variation margin”) are made or received by the Fund dependent upon the daily fluctuations in the value and are recorded for financial reporting purposes as unrealized gains or losses by the Fund. Gains or losses are realized when the contract expires or is closed. Since all futures contracts are exchange-traded, counterparty risk is minimized as the exchange’s clearinghouse acts as the counterparty, and guarantees the futures against default.
Certain risks may arise upon entering into futures contracts, including the risk that an illiquid market will limit the Fund’s ability to close out a futures contract prior to the settlement date and the risk that the futures contract is not well correlated with the security, index or currency to which it relates. Risk of loss may exceed amounts disclosed in the Statement of Assets and Liabilities.
A summary of the open futures contracts as of December 31, 2018 is included in a table following the Fund’s Investment Portfolio. For the year ended December 31, 2018, the investment in futures contracts purchased had a total notional value generally indicative of a range from approximately $22,633,000 to $36,672,000, and the investment in futures contracts sold had a total notional value generally indicative of a range from approximately $24,751,000 to $39,926,000.
Options. An option contract is a contract in which the writer (seller) of the option grants the buyer of the option, upon payment of a premium, the right to purchase from (call option), or sell to (put option), the writer a designated instrument at a specified price within a specified period of time. The Fund may write or purchase interest rate swaption agreements which are options to enter into a pre-defined swap agreement. The interest rate swaption agreement will specify whether the buyer of the swaption will be a fixed-rate receiver or a fixed-rate payer upon exercise. Certain options, including options on indices and interest rate options, will require cash settlement by the Fund if exercised. For the year ended December 31, 2018, the Fund entered into options on interest rate swaps in order to hedge against potential adverse interest rate movements of portfolio assets.
If the Fund writes a covered call option, the Fund foregoes, in exchange for the premium, the opportunity to profit during the option period from an increase in the market value of the underlying security above the exercise price. If the Fund writes a put option it accepts the risk of a decline in the value of the underlying security below the exercise price. Over-the-counter options have the risk of the potential inability of counterparties to meet the terms of their contracts. For exchange traded contracts, the counterparty risk is minimized as the exchange’s clearinghouse acts as the counterparty, and guarantees the futures against default. The Fund’s maximum exposure to purchased options is limited to the premium initially paid. In addition, certain risks may arise upon entering into option contracts including the risk that an illiquid secondary market will limit the Fund’s ability to close out an option contract prior to the expiration date and that a change in the value of the option contract may not correlate exactly with changes in the value of the securities or currencies hedged.
There were no open written or purchased option contracts as of December 31, 2018. For the year ended December 31, 2018, the investment in written option contracts had a total value generally indicative of a range from $0 to approximately $844,000.
Forward Foreign Currency Contracts. A forward foreign currency contract (“forward currency contract”) is a commitment to purchase or sell a foreign currency at the settlement date at a negotiated rate. For the year ended December 31, 2018, the Fund entered into forward currency contracts in order to hedge its exposure to changes in foreign currency exchange rates on its foreign currency denominated portfolio holdings, to facilitate transactions in foreign currency denominated securities and for non-hedging purposes to seek to enhance potential gains.
Forward currency contracts are valued at the prevailing forward exchange rate of the underlying currencies and unrealized gain (loss) is recorded daily. On the settlement date of the forward currency contract, the Fund records a realized gain or loss equal to the difference between the value of the contract at the time it was opened and the value of the contract at the time it was closed. Certain risks may arise upon entering into forward currency contracts from the potential inability of counterparties to meet the terms of their contracts. The maximum counterparty credit risk to the Fund is measured by the unrealized gain on
| | | | | | |
| | 28 | | | | | | Deutsche DWS Variable Series II — DWS Global Income Builder VIP |
appreciated contracts. Additionally, when utilizing forward currency contracts to hedge, the Fund gives up the opportunity to profit from favorable exchange rate movements during the term of the contract.
A summary of the open forward currency contracts as of December 31, 2018 is included in a table following the Fund’s Investment Portfolio. For the year ended December 31, 2018, the investment in forward currency contracts short vs. U.S. dollars had a total contract value generally indicative of a range from approximately $14,346,000 to $31,634,000, and the investment in forward currency contracts long vs. U.S. dollars had a total contract value generally indicative of a range from approximately $3,261,000 to $22,565,000.
The following tables summarize the value of the Fund’s derivative instruments held as of December 31, 2018 and the related location in the accompanying Statement of Assets and Liabilities, presented by primary underlying risk exposure:
| | | | | | | | | | | | | | | | |
| Asset Derivatives | | Forward
Contracts | | | Swap
Contracts | | | Futures
Contracts | | | Total | |
| Credit Contracts (a) | | $ | — | | | $ | 44,740 | | | $ | — | | | $ | 44,740 | |
| Interest Rate Contracts (a) | | | — | | | | 447,906 | | | | 363,123 | | | | 811,029 | |
| Foreign Exchange Contracts (b) | | | 161,060 | | | | — | | | | — | | | | 161,060 | |
| | | $ | 161,060 | | | $ | 492,646 | | | $ | 363,123 | | | $ | 1,016,829 | |
Each of the above derivatives is located in the following Statement of Assets and Liabilities accounts:
| (a) | Includes cumulative appreciation of futures and centrally cleared swap contracts as disclosed in the Investment Portfolio. Unsettled variation margin is disclosed separately within the Statement of Assets and Liabilities. |
| (b) | Unrealized appreciation on forward foreign currency contracts |
| | | | | | | | | | | | | | | | |
| Liability Derivatives | | Forward
Contracts | | | Swap
Contracts | | | Futures
Contracts | | | Total | |
| Equity Contracts (c) | | $ | — | | | $ | — | | | $ | (242,101 | ) | | $ | (242,101 | ) |
| Credit Contracts (c) | | | — | | | | (352,097 | ) | | | — | | | | (352,097 | ) |
| Interest Rate Contracts (c) | | | — | | | | (248,949 | ) | | | (315,986 | ) | | | (564,935 | ) |
| Foreign Exchange Contracts (d) | | | (200,666 | ) | | | — | | | | — | | | | (200,666 | ) |
| | | $ | (200,666 | ) | | $ | (601,046 | ) | | $ | (558,087 | ) | | $ | (1,359,799 | ) |
Each of the above derivatives is located in the following Statement of Assets and Liabilities accounts:
| (c) | Includes cumulative depreciation of futures and centrally cleared swap contracts as disclosed in the Investment Portfolio. Unsettled variation margin is disclosed separately within the Statement of Assets and Liabilities. |
| (d) | Unrealized depreciation on forward foreign currency contracts |
Additionally, the amount of unrealized and realized gains and losses on derivative instruments recognized in Fund earnings during the year ended December 31, 2018, and the related location in the accompanying Statement of Operations is summarized in the following tables by primary underlying risk exposure:
| | | | | | | | | | | | | | | | | | | | |
| Realized Gain (Loss) | | Written
Options | | | Forward
Contracts | | | Swap
Contracts | | | Futures
Contracts | | | Total | |
| Equity Contracts (e) | | $ | — | | | $ | — | | | $ | 1,117,765 | | | $ | (2,015,444 | ) | | $ | (897,679 | ) |
| Credit Contracts (e) | | | — | | | | — | | | | 336,162 | | | | — | | | | 336,162 | |
| Interest Rate Contracts (e) | | | 362,589 | | | | — | | | | 432,467 | | | | (788,702 | ) | | | 6,354 | |
| Foreign Exchange Contracts (f) | | | — | | | | 464,627 | | | | — | | | | — | | | | 464,627 | |
| | | $ | 362,589 | | | $ | 464,627 | | | $ | 1,886,394 | | | $ | (2,804,146 | ) | | $ | (90,536 | ) |
Each of the above derivatives is located in the following Statement of Operations accounts:
| (e) | Net realized gain (loss) from written options, swap contracts and futures, respectively |
| (f) | Net realized gain (loss) from forward foreign currency contracts |
| | | | | | | | | | | | | | | | |
Change in Net Unrealized Appreciation (Depreciation) | | Forward
Contracts | | | Swap
Contracts | | | Futures
Contracts | | | Total | |
| Equity Contracts (g) | | $ | — | | | $ | (917,067 | ) | | $ | (888,521 | ) | | $ | (1,805,588 | ) |
| Credit Contracts (g) | | | — | | | | (452,207 | ) | | | — | | | | (452,207 | ) |
| Interest Rate Contracts (g) | | | — | | | | 84,630 | | | | 39,245 | | | | 123,875 | |
| Foreign Exchange Contracts (h) | | | 191,206 | | | | — | | | | — | | | | 191,206 | |
| | | $ | 191,206 | | | $ | (1,284,644 | ) | | $ | (849,276 | ) | | $ | (1,942,714 | ) |
Each of the above derivatives is located in the following Statement of Operations accounts:
| (g) | Change in net unrealized appreciation (depreciation) on swap contracts and futures, respectively |
| (h) | Change in net unrealized appreciation (depreciation) on forward foreign currency contracts |
| | | | |
Deutsche DWS Variable Series II — DWS Global Income Builder VIP | | | | | 29 |
As of December 31, 2018, the Fund has transactions subject to enforceable master netting agreements which govern the terms of certain transactions, and reduce the counterparty risk associated with such transactions. Master netting agreements allow a Fund to close out and net total exposure to a counterparty in the event of a deterioration in the credit quality or contractual default with respect to all of the transactions with a counterparty. As defined by the master netting agreement, the Fund may have collateral agreements with certain counterparties to mitigate risk. For financial reporting purposes the Statement of Assets and Liabilities generally shows derivatives assets and liabilities on a gross basis, which reflects the full risks and exposures prior to netting. A reconciliation of the gross amounts on the Statement of Assets and Liabilities to the net amounts by a counterparty, including any collateral exposure, is included in the following tables:
| | | | | | | | | | | | | | | | |
| Counterparty | | Gross Amounts
of Assets
Presented in the
Statement of
Assets and
Liabilities | | | Financial
Instruments
and
Derivatives
Available
for Offset | | | Collateral Received | | | Net Amount of
Derivative
Assets | |
| Australia and New Zealand Banking Group Ltd. | | $ | 10,752 | | | $ | — | | | $ | — | | | $ | 10,752 | |
| Credit Agricole | | | 143,949 | | | | (60,654 | ) | | | — | | | | 83,295 | |
| State Street Bank and Trust | | | 6,359 | | | | — | | | | — | | | | 6,359 | |
| | | $ | 161,060 | | | $ | (60,654 | ) | | $ | — | | | $ | 100,406 | |
| | | | | | | | | | | | | | | | |
| Counterparty | | Gross Amounts
of Liabilities
Presented in the
Statement of
Assets and
Liabilities | | | Financial
Instruments
and
Derivatives
Available
for Offset | | | Collateral Pledged | | | Net Amount of
Derivative
Liabilities | |
| Credit Agricole | | $ | 60,654 | | | $ | (60,654 | ) | | $ | — | | | $ | — | |
| JPMorgan Chase Securities, Inc. | | | 8,048 | | | | — | | | | — | | | | 8,048 | |
| Morgan Stanley | | | 117,099 | | | | — | | | | — | | | | 117,099 | |
| Toronto-Dominion Bank | | | 14,865 | | | | — | | | | — | | | | 14,865 | |
| | | $ | 200,666 | | | $ | (60,654 | ) | | $ | — | | | $ | 140,012 | |
C. Purchases and Sales of Securities
During the year ended December 31, 2018, purchases and sales of investment transactions, excluding short-term investments, were as follows:
| | | | | | | | |
| | | Purchases | | | Sales | |
| Non-U.S. Treasury Obligations | | $ | 84,428,247 | | | $ | 96,662,567 | |
| U.S. Treasury Obligations | | $ | 3,248,315 | | | $ | 1,699,308 | |
D. Related Parties
Management Agreement. Under the Investment Management Agreement with DWS Investment Management Americas, Inc. (formerly Deutsche Investment Management Americas Inc.) (“DIMA” or the “Advisor”), an indirect, wholly owned subsidiary of DWS Group GmbH & Co. KGaA (“DWS Group”), the Advisor directs the investments of the Fund in accordance with its investment objectives, policies and restrictions. The Advisor determines the securities, instruments and other contracts relating to investments to be purchased, sold or entered into by the Fund or delegates such responsibility to the Fund’s subadvisor.
DWS Alternatives Global Limited (formerly Deutsche Alternative Asset Management (Global) Limited), also an indirect, wholly owned subsidiary of DWS Group, serves as subadvisor for the Fund and, as such, provides portfolio manager services to the Fund. Pursuant to a sub-advisory agreement between DIMA and DWS Alternatives Global Limited, DIMA, not the Fund, compensates DWS Alternatives Global Limited for the services it provides to the Fund.
| | | | | | |
| | 30 | | | | | | Deutsche DWS Variable Series II — DWS Global Income Builder VIP |
Under the Investment Management Agreement, the Fund pays a monthly management fee based on the Fund’s average daily net assets, computed and accrued daily and payable monthly, at the following annual rates:
| | | | |
| First $250 million | | | .370 | % |
| Next $750 million | | | .345 | % |
| Over $1 billion | | | .310 | % |
Accordingly, for the year ended December 31, 2018, the fee pursuant to the Investment Management Agreement was equivalent to an annual rate (exclusive of any applicable waiver/reimbursements) of 0.37% of the Fund’s average daily net assets.
For the period from January 1, 2018 through September 30, 2018, the Advisor had contractually agreed to waive its fees and/or reimburse certain operating expenses to the extent necessary to maintain the total annual operating expenses (excluding certain expenses such as extraordinary expenses, taxes, brokerage and interest expense) of Class A shares at 0.69%.
Effective October 1, 2018 through September 30, 2019, the Advisor has contractually agreed to waive its fees and/or reimburse certain operating expenses to the extent necessary to maintain the total annual operating expenses (excluding certain expenses such as extraordinary expenses, taxes, brokerage and interest expense) of Class A shares at 0.73%.
Effective May 1, 2018 (commencement of operations) through September 30, 2019, the Advisor has contractually agreed to waive its fees and/or reimburse certain operating expenses to the extent necessary to maintain the total annual operating expenses (excluding certain expenses such as extraordinary expenses, taxes, brokerage and interest expense) of Class B shares at 0.86%.
For the year ended December 31, 2018, fees waived and/or expenses reimbursed for each class are as follows:
| | | | |
| Class A | | $ | 18,264 | |
| Class B | | | 19 | |
| | | $ | 18,283 | |
Administration Fee. Pursuant to an Administrative Services Agreement, DIMA provides most administrative services to the Fund. For all services provided under the Administrative Services Agreement, the Fund pays DIMA an annual fee (“Administration Fee”) of 0.10% of the Fund’s average daily net assets, computed and accrued daily and payable monthly. For the year ended December 31, 2018, the Administration Fee was $136,700, of which $10,420 is unpaid.
Distribution Service Agreement.DWS Distributors, Inc. (“DDI”), an affiliate of the Advisor, is the Fund’s distributor. In accordance with the Distribution Plan, DDI receives 12b-1 fees of 0.25% of average daily net assets of Class B shares. For the period from May 1, 2018 (commencement of operations) through December 31, 2018, the Distribution Service Fee was as follows:
| | | | | | | | |
| Distribution Fee | | Total
Aggregated | | | Unpaid at
December 31, 2018 | |
| Class B | | $ | 17 | | | $ | 2 | |
Service Provider Fees. DWS Service Company (“DSC”), an affiliate of the Advisor, is the transfer agent, dividend-paying agent and shareholder service agent for the Fund. Pursuant to a sub-transfer agency agreement between DSC and DST Systems, Inc. (“DST”), DSC has delegated certain transfer agent, dividend-paying agent and shareholder service agent functions to DST. DSC compensates DST out of the shareholder servicing fee it receives from the Fund. For the year ended December 31, 2018 and for the period from May 1, 2018 (commencement of operations) through December 31, 2018 for Class B shares, the amounts charged to the Fund by DSC were as follows:
| | | | | | | | |
| Services to Shareholders | | Total
Aggregated | | | Unpaid at
December 31, 2018 | |
| Class A | | $ | 533 | | | $ | 179 | |
| Class B | | | 14 | | | | 11 | |
| | | $ | 547 | | | $ | 190 | |
| | | | |
Deutsche DWS Variable Series II — DWS Global Income Builder VIP | | | | | 31 |
Typesetting and Filing Service Fees. Under an agreement with the Fund, DIMA is compensated for providing certain pre-press and regulatory filing services to the Fund. For the year ended December 31, 2018, the amount charged to the Fund by DIMA included in the Statement of Operations under “Reports to shareholders” aggregated $10,630, of which $3,902 unpaid.
Trustees’ Fees and Expenses. The Fund paid retainer fees to each Trustee not affiliated with the Advisor, plus specified amounts to the Board Chairperson and to each committee Chairperson.
Affiliated Cash Management Vehicles. The Fund may invest uninvested cash balances in DWS Central Cash Management Government Fund and DWS ESG Liquidity Fund, affiliated money market funds which are managed by the Advisor. Each affiliated money market fund is managed in accordance with Rule 2a-7 under the 1940 Act, which governs the quality, maturity, diversity and liquidity of instruments in which a money market fund may invest. DWS Central Cash Management Government Fund seeks to maintain a stable net asset value, and DWS ESG Liquidity Fund maintains a floating net asset value. The Fund indirectly bears its proportionate share of the expenses of each affiliated money market fund in which it invests. DWS Central Cash Management Government Fund does not pay the Advisor an investment management fee. To the extent that DWS ESG Liquidity Fund pays an investment management fee to the Advisor, the Advisor will waive an amount of the investment management fee payable to the Advisor by the Fund equal to the amount of the investment management fee payable on the Fund’s assets invested in DWS ESG Liquidity Fund.
Securities Lending Agent Fees. Deutsche Bank AG serves as securities lending agent for the Fund. For the year ended December 31, 2018, the Fund incurred securities lending agent fees to Deutsche Bank AG in the amount of $4,151.
E. Ownership of the Fund
At December 31, 2018, one participating insurance company was owner of record of 10% or more of the total outstanding Class A shares of the Fund, owning 71%.
F. Line of Credit
The Fund and other affiliated funds (the “Participants”) share in a $400 million revolving credit facility provided by a syndication of banks. The Fund may borrow for temporary or emergency purposes, including the meeting of redemption requests that otherwise might require the untimely disposition of securities. The Participants are charged an annual commitment fee which is allocated based on net assets, among each of the Participants. Interest is calculated at a rate per annum equal to the sum of the Federal Funds Rate plus 1.25 percent plus if the one-month LIBOR exceeds the Federal Funds Rate, the amount of such excess. The Fund may borrow up to a maximum of 33 percent of its net assets under the agreement. The Fund had no outstanding loans at December 31, 2018.
| | | | | | |
| | 32 | | | | | | Deutsche DWS Variable Series II — DWS Global Income Builder VIP |
Report of Independent Registered Public Accounting Firm
To the Board of Trustees of Deutsche DWS Variable Series II and Shareholders of DWS Global Income Builder VIP:
Opinion on the Financial Statements
We have audited the accompanying statement of assets and liabilities of DWS Global Income Builder VIP (formerly Deutsche Global Income Builder VIP) (the “Fund”) (one of the funds constituting Deutsche DWS Variable Series II (formerly Deutsche Variable Series II)) (the “Trust”), including the investment portfolio, as of December 31, 2018, and the related statement of operations for the year then ended, the statements of changes in net assets for each of the two years in the period then ended, the financial highlights for each of the five years in the period then ended and the related notes (collectively referred to as the “financial statements”). In our opinion, the financial statements present fairly, in all material respects, the financial position of the Fund (one of the funds constituting Deutsche DWS Variable Series II) at December 31, 2018, the results of its operations for the year then ended, the changes in its net assets for each of the two years in the period then ended and its financial highlights for each of the five years in the period then ended, in conformity with U.S. generally accepted accounting principles.
Basis for Opinion
These financial statements are the responsibility of the Trust’s management. Our responsibility is to express an opinion on the Fund’s financial statements based on our audits. We are a public accounting firm registered with the Public Company Accounting Oversight Board (United States) (“PCAOB”) and are required to be independent with respect to the Trust in accordance with the U.S. federal securities laws and the applicable rules and regulations of the Securities and Exchange Commission and the PCAOB.
We conducted our audits in accordance with the standards of the PCAOB. Those standards require that we plan and perform the audit to obtain reasonable assurance about whether the financial statements are free of material misstatement, whether due to error or fraud. The Trust is not required to have, nor were we engaged to perform, an audit of the Trust’s internal control over financial reporting. As part of our audits, we are required to obtain an understanding of internal control over financial reporting, but not for the purpose of expressing an opinion on the effectiveness of the Trust’s internal control over financial reporting. Accordingly, we express no such opinion.
Our audits included performing procedures to assess the risks of material misstatement of the financial statements, whether due to error or fraud, and performing procedures that respond to those risks. Such procedures included examining, on a test basis, evidence regarding the amounts and disclosures in the financial statements. Our procedures included confirmation of securities owned as of December 31, 2018, by correspondence with the custodian and brokers. Our audits also included evaluating the accounting principles used and significant estimates made by management, as well as evaluating the overall presentation of the financial statements. We believe that our audits provide a reasonable basis for our opinion.

We have served as the auditor of one or more investment companies in the DWS family of funds since at least 1979, but we are unable to determine the specific year.
Boston, Massachusetts
February 14, 2019
| | | | |
Deutsche DWS Variable Series II — DWS Global Income Builder VIP | | | | | 33 |
| | |
| Information About Your Fund’s Expenses | | (Unaudited) |
As an investor of the Fund, you incur two types of costs: ongoing expenses and transaction costs. Ongoing expenses include management fees and other Fund expenses. Examples of transaction costs include contract charges, which are not shown in this section. The following tables are intended to help you understand your ongoing expenses (in dollars) of investing in the Fund and to help you compare these expenses with the ongoing expenses of investing in other mutual funds. In the most recent six-month period, the Fund limited these expenses; had it not done so, expenses would have been higher. The example in the table is based on an investment of $1,000 invested at the beginning of the six-month period and held for the entire period (July 1, 2018 to December 31, 2018).
The tables illustrate your Fund’s expenses in two ways:
| – | Actual Fund Return. This helps you estimate the actual dollar amount of ongoing expenses (but not transaction costs) paid on a $1,000 investment in the Fund using the Fund’s actual return during the period. To estimate the expenses you paid over the period, simply divide your account value by $1,000 (for example, an $8,600 account value divided by $1,000 = 8.6), then multiply the result by the number in the “Expenses Paid per $1,000” line under the share class you hold. |
| – | Hypothetical 5% Fund Return. This helps you to compare your Fund’s ongoing expenses (but not transaction costs) with those of other mutual funds using the Fund’s actual expense ratio and a hypothetical rate of return of 5% per year before expenses. Examples using a 5% hypothetical Fund return may be found in the shareholder reports of other mutual funds. The hypothetical account values and expenses may not be used to estimate the actual ending account balance or expenses you paid for the period. |
Please note that the expenses shown in these tables are meant to highlight your ongoing expenses only and do not reflect any transaction costs. The “Expenses Paid per $1,000” line of the tables is useful in comparing ongoing expenses only and will not help you determine the relative total expense of owning different funds. If these transaction costs had been included, your costs would have been higher.
| | | | | | | | |
| Expenses and Value of a $1,000 Investment for the six months ended December 31, 2018 | | | | |
| | |
| Actual Fund Return | | Class A | | | Class B | |
| Beginning Account Value 7/1/18 | | $ | 1,000.00 | | | $ | 1,000.00 | |
| Ending Account Value 12/31/18 | | $ | 941.30 | | | $ | 940.40 | |
| Expenses Paid per $1,000* | | $ | 3.47 | | | $ | 4.21 | |
| | |
| Hypothetical 5% Fund Return | | Class A | | | Class B | |
| Beginning Account Value 7/1/18 | | $ | 1,000.00 | | | $ | 1,000.00 | |
| Ending Account Value 12/31/18 | | $ | 1,021.63 | | | $ | 1,020.87 | |
| Expenses Paid per $1,000* | | $ | 3.62 | | | $ | 4.38 | |
| * | Expenses are equal to the Fund’s annualized expense ratio for each share class, multiplied by the average account value over the period, multiplied by 184 (the number of days in the most recent six-month period), then divided by 365. |
| | | | | | | | |
| Annualized Expense Ratio | | Class A | | | Class B | |
| Deutsche DWS Variable Series II — DWS Global Income Builder VIP | | | .71 | % | | | .86 | % |
For more information, please refer to the Fund’s prospectus.
These tables do not reflect charges and fees (“contract charges”) associated with the separate account that invests in the Fund or any variable life insurance policy or variable annuity contract for which the Fund is an investment option.
For an analysis of the fees associated with an investment in the Fund or similar funds, please refer to the current and hypothetical expense calculators for Variable Insurance Products which can be found at dws.com/calculators.
| | | | | | |
| | 34 | | | | | | Deutsche DWS Variable Series II — DWS Global Income Builder VIP |
| | |
| Tax Information | | (Unaudited) |
Pursuant to Section 852 of the Internal Revenue Code, the Fund designates $33,000 as capital gain dividends for its year ended December 31, 2018.
For corporate shareholders, 11% of the ordinary dividends (i.e., income dividends plus short-term capital gains) paid during the Fund’s fiscal year ended December 31, 2018 qualified for the dividends received deduction.
Please consult a tax advisor if you have questions about federal or state income tax laws, or on how to prepare your tax returns. If you have specific questions about your account, please contact your insurance provider.
Proxy Voting
The Trust’s policies and procedures for voting proxies for portfolio securities and information about how the Trust voted proxies related to its portfolio securities during the most recent 12-month period ended June 30 are available on our Web site — dws.com/en-us/resources/proxy-voting — or on the SEC’s Web site — sec.gov. To obtain a written copy of the Trust’s policies and procedures without charge, upon request, call us toll free at(800) 728-3337.
| | | | |
Deutsche DWS Variable Series II — DWS Global Income Builder VIP | | | | | 35 |
Advisory Agreement Board Considerations and Fee Evaluation
The Board of Trustees (hereinafter referred to as the “Board” or “Trustees”) approved the renewal of DWS Global Income Builder VIP’s (the “Fund”) investment management agreement (the “Agreement”) with DWS Investment Management Americas, Inc. (“DIMA”) andsub-advisory agreement (the“Sub-Advisory Agreement” and together with the Agreement, the “Agreements”) between DIMA and Deutsche Alternative Asset Management (Global) Limited (now known as DWS Alternatives Global Limited) (“DAAM Global”), an affiliate of DIMA, in September 2018.
In terms of the process that the Board followed prior to approving the Agreements, shareholders should know that:
| – | | During the entire process, all of the Fund’s Trustees were independent of DIMA and its affiliates (the “Independent Trustees”). |
| – | | The Board met frequently during the past year to discuss fund matters and dedicated a substantial amount of time to contract review matters. Over the course of several months, the Board’s Contract Committee reviewed extensive materials received from DIMA, independent third parties and independent counsel. These materials included an analysis of the Fund’s performance, fees and expenses, and profitability from a fee consultant retained by the Fund’s Independent Trustees (the “Fee Consultant”). Based on its evaluation of the information provided, the Contract Committee presented its findings and recommendations to the Board. The Board then reviewed the Contract Committee’s findings and recommendations. |
| – | | The Board also received extensive information throughout the year regarding performance of the Fund. |
| – | | The Independent Trustees regularly met privately with counsel to discuss contract review and other matters. In addition, the Independent Trustees were advised by the Fee Consultant in the course of their review of the Fund’s contractual arrangements and considered a comprehensive report prepared by the Fee Consultant in connection with their deliberations. |
| – | | In connection with reviewing the Agreements, the Board also reviewed the terms of the Fund’sRule 12b-1 plan, distribution agreement, administrative services agreement, transfer agency agreement and other material service agreements. |
In connection with the contract review process, the Contract Committee and the Board considered the factors discussed below, among others. The Board also considered that DIMA and its predecessors have managed the Fund since its inception, and the Board believes that a long-term relationship with a capable, conscientious advisor is in the best interests of the Fund. The Board considered, generally, that shareholders chose to invest or remain invested in the Fund knowing that DIMA managed the Fund. DIMA and DAAM Global are part of DWS Group GmbH & Co. KGaA (“DWS Group”). DWS Group is a global asset management business that offers a wide range of investing expertise and resources, including research capabilities in many countries throughout the world. In 2018, approximately 20% of DWS Group’s shares were sold in an initial public offering, with Deutsche Bank AG owning the remaining shares.
As part of the contract review process, the Board carefully considered the fees and expenses of each DWS fund overseen by the Board in light of the fund’s performance. In many cases, this led to the negotiation and implementation of expense caps. As part of these negotiations, the Board indicated that it would consider relaxing these caps in future years following sustained improvements in performance, among other considerations.
While shareholders may focus primarily on fund performance and fees, the Fund’s Board considers these and many other factors, including the quality and integrity of DIMA’s and DAAM Global’s personnel and administrative support services provided by DIMA, such as back-office operations, fund valuations, and compliance policies and procedures.
Nature, Quality and Extent of Services. The Board considered the terms of the Agreements, including the scope of advisory services provided under the Agreements. The Board noted that, under the Agreements, DIMA and DAAM Global provide portfolio management services to the Fund and that, pursuant to a separate administrative services agreement, DIMA provides administrative services to the Fund. The Board considered the experience and skills of senior management and investment personnel and the resources made available to such personnel. Throughout the course of the year, the Board also received information regarding DIMA’s oversight of fundsub-advisers, including DAAM Global. The Board reviewed the Fund’s performance over short-term and long-term periods and compared those returns to various agreed-upon
| | | | | | |
| | 36 | | | | | | Deutsche DWS Variable Series II — DWS Global Income Builder VIP |
performance measures, including market index(es) and a peer universe compiled using information supplied by Morningstar Direct (“Morningstar”), an independent fund data service. The Board also noted that it has put into place a process of identifying “Funds in Review” (e.g., funds performing poorly relative to a peer universe), and receives additional reporting from DIMA regarding such funds and, where appropriate, DIMA’s plans to address underperformance. The Board believes this process is an effective manner of identifying and addressing underperforming funds. Based on the information provided, the Board noted that, for theone-, three- and five-year periods ended December 31, 2017, the Fund’s performance (Class A shares) was in the 1st quartile of the applicable Morningstar universe (the 1st quartile being the best performers and the 4th quartile being the worst performers). The Board also observed that the Fund has outperformed its benchmark in theone-, three- and five-year periods ended December 31, 2017.
Fees and Expenses. The Board considered the Fund’s investment management fee schedule,sub-advisory fee schedule, operating expenses and total expense ratios, and comparative information provided by Broadridge Financial Solutions, Inc. (“Broadridge”) and the Fee Consultant regarding investment management fee rates paid to other investment advisors by similar funds (1st quartile being the most favorable and 4th quartile being the least favorable). With respect to management fees paid to other investment advisors by similar funds, the Board noted that the contractual fee rates paid by the Fund, which include a 0.10% fee paid to DIMA under the Fund’s administrative services agreement, were lower than the median (1st quartile) of the applicable Broadridge peer group (based on Broadridge data provided as of December 31, 2017). With respect to thesub-advisory fee paid to DAAM Global, the Board noted that the fee is paid by DIMA out of its fee and not directly by the Fund. The Board noted that the Fund’s Class A shares total (net) operating expenses were expected to be lower than the median (2nd quartile) of the applicable Broadridge expense universe (based on Broadridge data provided as of December 31, 2017, and analyzing Broadridge expense universe Class A (net) expenses less any applicable12b-1 fees). The Board noted that the expense limitations agreed to by DIMA were expected to help the Fund’s total (net) operating expenses remain competitive. The Board considered the Fund’s management fee rate as compared to fees charged by DIMA to a comparable DWS U.S. registered fund (“DWS Funds”) and considered differences between the Fund and the comparable DWS Fund. The information requested by the Board as part of its review of fees and expenses also included information about institutional accounts (including anysub-advised funds and accounts) and funds offered primarily to European investors (“DWS Europe Funds”) managed by DWS Group. The Board noted that DIMA indicated that DWS Group does not manage any institutional accounts or DWS Europe Funds comparable to the Fund.
On the basis of the information provided, the Board concluded that management fees were reasonable and appropriate in light of the nature, quality and extent of services provided by DIMA and DAAM Global.
Profitability. The Board reviewed detailed information regarding revenues received by DIMA under the Agreement. The Board considered the estimated costs to DIMA, andpre-tax profits realized by DIMA, from advising the DWS Funds, as well as estimates of thepre-tax profits attributable to managing the Fund in particular. The Board also received information regarding the estimated enterprise-wide profitability of DIMA and its affiliates with respect to all fund services in totality and by fund. The Board and the Fee Consultant reviewed DIMA’s methodology in allocating its costs to the management of the Fund. Based on the information provided, the Board concluded that thepre-tax profits realized by DIMA in connection with the management of the Fund were not unreasonable. The Board also reviewed certain publicly available information regarding the profitability of certain similar investment management firms. The Board noted that, while information regarding the profitability of such firms is limited (and in some cases is not necessarily prepared on a comparable basis), DIMA and its affiliates’ overall profitability with respect to the DWS Funds (after taking into account distribution and other services provided to the funds by DIMA and its affiliates) was lower than the overall profitability levels of most comparable firms for which such data was available.
Economies of Scale. The Board considered whether there are economies of scale with respect to the management of the Fund and whether the Fund benefits from any economies of scale. The Board noted that the Fund’s investment management fee schedule includes fee breakpoints. The Board concluded that the Fund’s fee schedule represents an appropriate sharing between the Fund and DIMA of such economies of scale as may exist in the management of the Fund at current asset levels.
Other Benefits to DIMA and Its Affiliates. The Board also considered the character and amount of other incidental or“fall-out” benefits received by DIMA and its affiliates, including any fees received by DIMA for administrative services provided to the Fund, any fees received by an affiliate of DIMA for transfer agency services provided to the Fund and any fees received by an affiliate of DIMA for distribution services. The Board also considered benefits to DIMA related to brokerage and soft-dollar allocations, including allocating
| | | | |
Deutsche DWS Variable Series II — DWS Global Income Builder VIP | | | | | 37 |
brokerage to pay for research generated by parties other than the executing broker dealers, which pertain primarily to funds investing in equity securities. In addition, the Board considered the incidental public relations benefits to DIMA related to DWS Funds advertising and cross-selling opportunities among DIMA products and services. The Board considered these benefits in reaching its conclusion that the Fund’s management fees were reasonable.
Compliance. The Board considered the significant attention and resources dedicated by DIMA to its compliance processes in recent years. The Board noted in particular (i) the experience, seniority and time commitment of the individuals serving as DIMA’s and the Fund’s chief compliance officers and (ii) the substantial commitment of resources by DIMA and its affiliates to compliance matters, including the retention of compliance personnel.
Based on all of the information considered and the conclusions reached, the Board unanimously determined that the continuation of the Agreements is in the best interests of the Fund. In making this determination, the Board did not give particular weight to any single factor identified above. The Board considered these factors over the course of numerous meetings, certain of which were in executive session with only the Independent Trustees and counsel present. It is possible that individual Independent Trustees may have weighed these factors differently in reaching their individual decisions to approve the continuation of the Agreements.
| | | | | | |
| | 38 | | | | | | Deutsche DWS Variable Series II — DWS Global Income Builder VIP |
Board Members and Officers
The following table presents certain information regarding the Board Members and Officers of the Fund. Each Board Member’s year of birth is set forth in parentheses after his or her name. Unless otherwise noted, (i) each Board Member has engaged in the principal occupation(s) noted in the table for at least the most recent five years, although not necessarily in the same capacity; and (ii) the address of each Independent Board Member is c/o Keith R. Fox, DWS Funds Board Chair, c/o Thomas R. Hiller, Ropes & Gray LLP, Prudential Tower, 800 Boylston Street, Boston, MA02199-3600. Except as otherwise noted below, the term of office for each Board Member is until the election and qualification of a successor, or until such Board Member sooner dies, resigns, is removed or as otherwise provided in the governing documents of the Fund. Because the Fund does not hold an annual meeting of shareholders, each Board Member will hold office for an indeterminate period. The Board Members may also serve in similar capacities with other funds in the fund complex.
| | | | | | | | |
| Independent Board Members | | | | | | |
Name, Year of Birth,
Position with the Fund and
Length of Time Served1 | | Business Experience and Directorships During the Past Five Years | | Number of
Funds in
DWS Fund
Complex
Overseen | | | Other
Directorships
Held by Board
Member
|
Keith R. Fox, CFA (1954) Chairperson since 2017, and Board Member since 1996 | | Managing General Partner, Exeter Capital Partners (a series of private investment funds) (since 1986). Directorships: Progressive International Corporation (kitchen goods importer and distributor); The Kennel Shop (retailer); former Chairman, National Association of Small Business Investment Companies; former Directorships: BoxTop Media Inc. (advertising); Sun Capital Advisers Trust (mutual funds) (2011–2012) | | | 82 | | | — |
John W. Ballantine (1946) Board Member since 1999 | | Retired; formerly, Executive Vice President and Chief Risk Management Officer, First Chicago NBD Corporation/The First National Bank of Chicago (1996–1998); Executive Vice President and Head of International Banking (1995–1996); former Directorships: Director and former Chairman of the Board, Healthways, Inc.2 (population well-being and wellness services) (2003–2014); Stockwell Capital Investments PLC (private equity); Enron Corporation; FNB Corporation; Tokheim Corporation; First Oak Brook Bancshares, Inc. and Oak Brook Bank; Prisma Energy International; Public Radio International. Not-for-Profit Director, Trustee: Palm Beach Civic Association; Window to the World Communications (public media); Harris Theater for Music and Dance (Chicago); Life Director of Hubbard Street Dance Chicago | | | 82 | | | Portland
General
Electric2
(utility
company)
(2003–
present) |
Henry P. Becton, Jr. (1943) Board Member since 1990 | | Vice Chair and former President, WGBH Educational Foundation. Directorships: Public Radio International; Public Radio Exchange (PRX); The Pew Charitable Trusts (charitable organization); Massachusetts Humane Society; Overseer of the New England Conservatory; former Directorships: Becton Dickinson and Company2 (medical technology company); Belo Corporation2 (media company); The PBS Foundation; Association of Public Television Stations; Boston Museum of Science; American Public Television; Concord Academy; New England Aquarium; Mass. Corporation for Educational Telecommunications; Committee for Economic Development; Public Broadcasting Service; Connecticut College; North Bennett Street School (Boston); American Documentary, Inc. (public media) | | | 82 | | | — |
Dawn-Marie Driscoll (1946) Board Member since 1987 | | Emeritus Executive Fellow, Center for Business Ethics, Bentley University; formerly: President, Driscoll Associates (consulting firm); Partner, Palmer & Dodge (law firm) (1988–1990); Vice President of Corporate Affairs and General Counsel, Filene’s (retail) (1978–1988). Directorships: Advisory Board, Center for Business Ethics, Bentley University; Trustee and former Chairman of the Board, Southwest Florida Community Foundation (charitable organization); former Directorships: ICI Mutual Insurance Company (2007–2015); Sun Capital Advisers Trust (mutual funds) (2007–2012), Investment Company Institute (audit, executive, nominating committees) and Independent Directors Council (governance, executive committees) | | | 82 | | | — |
Paul K. Freeman* (1950) Board Member since 1993 | | Consultant, WorldBank/Inter-American Development Bank; Independent Directors Council (former chair); Investment Company Institute (executive committee); Adjunct Professor, University of Denver Law School (2017–present); formerly: Chairman of Education Committee of Independent Directors Council; Project Leader, International Institute for Applied Systems Analysis (1998–2001); Chief Executive Officer, The Eric Group, Inc. (environmental insurance) (1986–1998); Directorships: Knoebel Institute for Healthy Aging, University of Denver (2017–present); former Directorships: Prisma Energy International; Denver Zoo Foundation (2012–2018) | | | 82 | | | — |
| | | | |
Deutsche DWS Variable Series II — DWS Global Income Builder VIP | | | | | 39 |
| | | | | | | | |
Name, Year of Birth,
Position with the Fund and
Length of Time Served1 | | Business Experience and Directorships During the Past Five Years | | Number of
Funds in
DWS Fund
Complex
Overseen | | | Other
Directorships
Held by Board
Member
|
Richard J. Herring (1946) Board Member since 1990 | | Jacob Safra Professor of International Banking and Professor of Finance, The Wharton School, University of Pennsylvania (since July 1972); Director, The Wharton Financial Institutions Center (since 1994); formerly: Vice Dean and Director, Wharton Undergraduate Division (1995–2000) and Director, The Lauder Institute of International Management Studies (2000–2006); Member FDIC Systemic Risk Advisory Committee since 2011, member Systemic Risk Council since 2012 and member of the Advisory Board at the Yale Program on Financial Stability since 2013; Formerly Co-Chair of the Shadow Financial Regulatory Committee (2003–2015), Executive Director of The Financial Economists Roundtable (2008–2015), Director of The Thai Capital Fund (2007–2013), Director of The Aberdeen Singapore Fund (2007–2018), and Nonexecutive Director of Barclays Bank DE (2010–2018) | | | 82 | | | Director,
Aberdeen
Japan Fund
(since 2007) |
William McClayton (1944) Board Member since 2004 | | Private equity investor (since October 2009); previously, Managing Director, Diamond Management & Technology Consultants, Inc. (global consulting firm) (2001–2009); Directorship: Board of Managers, YMCA of Metropolitan Chicago; formerly: Senior Partner, Arthur Andersen LLP (accounting) (1966–2001); Trustee, Ravinia Festival | | | 82 | | | — |
Rebecca W. Rimel (1951) Board Member since 1995 | | President, Chief Executive Officer and Director, The Pew Charitable Trusts (charitable organization) (1994–present); formerly: Executive Vice President, The Glenmede Trust Company (investment trust and wealth management) (1983–2004); Board Member, Investor Education (charitable organization) (2004–2005); Trustee, Executive Committee, Philadelphia Chamber of Commerce (2001–2007); Director, Viasys Health Care2 (January 2007–June 2007); Trustee, Thomas Jefferson Foundation (charitable organization) (1994–2012) | | | 82 | | | Director,
Becton
Dickinson
and
Company2
(medical
technology
company)
(2012–
present);
Director,
BioTelemetry
Inc.2(health
care) (2009–
present) |
William N. Searcy, Jr. (1946) Board Member since 1993 | | Private investor since October 2003; formerly: Pension & Savings Trust Officer, Sprint Corporation2(telecommunications) (November 1989–September 2003); Trustee, Sun Capital Advisers Trust (mutual funds) (1998–2012) | | | 82 | | | — |
Jean Gleason Stromberg (1943) Board Member since 1997 | | Retired. Formerly, Consultant (1997–2001); Director, Financial Markets U.S. Government Accountability Office (1996–1997); Partner, Norton Rose Fulbright, L.L.P. (law firm) (1978–1996); former Directorships: The William and Flora Hewlett Foundation (charitable organization) (2000–2015); Service Source, Inc. (nonprofit), Mutual Fund Directors Forum (2002–2004), American Bar Retirement Association (funding vehicle for retirement plans) (1987–1990 and 1994–1996) | | | 82 | | | — |
| | |
| Officers4 | | |
Name, Year of Birth, Position with the Fund and Length of Time Served5 | | Business Experience and Directorships During the Past Five Years |
Hepsen Uzcan6 (1974) President and Chief Executive Officer, 2017–present Assistant Secretary, 2013–present | | Managing Director,3 DWS; Secretary, DWS USA Corporation (since March 2018); Assistant Secretary, DWS Distributors, Inc. (since June 25, 2018); Director and Vice President, DWS Service Company (since June 25, 2018); Assistant Secretary, DWS Investment Management Americas, Inc. (since June 25, 2018); and Director and President, DB Investment Managers, Inc. (since June 25, 2018); formerly: Vice President for the Deutsche funds (2016–2017) |
John Millette8(1962) Vice President and Secretary, 1999–present | | Director,3DWS; Chief Legal Officer, DWS Investment Management Americas, Inc. (2015–present); and Director and Vice President, DWS Trust Company (2016–present); formerly: Secretary, Deutsche Investment Management Americas Inc. (2015–2017) |
Diane Kenneally8,9 (1966) Treasurer and Chief Financial Officer since 2018 | | Director,3 DWS; formerly: Assistant Treasurer for the DWS funds (2007–2018) |
Caroline Pearson8(1962) Chief Legal Officer, 2010–present | | Managing Director,3DWS; formerly: Secretary, Deutsche AM Distributors, Inc. (2002–2017); and Secretary, Deutsche AM Service Company (2010–2017) |
Scott D. Hogan8(1970) Chief Compliance Officer, 2016–present | | Director,3DWS |
| | | | | | |
| | 40 | | | | | | Deutsche DWS Variable Series II — DWS Global Income Builder VIP |
| | |
Name, Year of Birth, Position with the Fund and Length of Time Served5 | | Business Experience and Directorships During the Past Five Years |
Wayne Salit7(1967) Anti-Money Laundering Compliance Officer, 2014–present | | Director,3 Deutsche Bank; and AML Officer, DWS Trust Company; formerly: Managing Director, AML Compliance Officer at BNY Mellon (2011–2014); and Director, AML Compliance Officer at Deutsche Bank (2004–2011) |
Sheila Cadogan8(1966) Assistant Treasurer, 2017–present | | Director,3DWS; Director and Vice President, DWS Trust Company (since 2018) |
Paul Antosca8(1957) Assistant Treasurer, 2007–present | | Director,3DWS |
| 1 | The length of time served represents the year in which the Board Member joined the board of one or more DWS funds currently overseen by the Board. |
| 2 | A publicly held company with securities registered pursuant to Section 12 of the Securities Exchange Act of 1934. |
| 3 | Executive title, not a board directorship. |
| 4 | As a result of their respective positions held with the Advisor or its affiliates, these individuals are considered “interested persons” of the Advisor within the meaning of the 1940 Act. Interested persons receive no compensation from the Fund. |
| 5 | The length of time served represents the year in which the officer was first elected in such capacity for one or more DWS funds. |
| 6 | Address: 345 Park Avenue, New York, NY 10154. |
| 7 | Address: 60 Wall Street, New York, NY 10005. |
| 8 | Address: One International Place, Boston, MA 02110. |
| 9 | Appointed Treasurer and Chief Financial Officer effective July 2, 2018. |
| * | Paul K. Freeman retired from the Board effective December 31, 2018. |
The Fund’s Statement of Additional Information (“SAI”) includes additional information about the Board Members. The SAI is available, without charge, upon request. If you would like to request a copy of the SAI, you may do so by calling the followingtoll-free number:(800) 728-3337.
| | | | |
Deutsche DWS Variable Series II — DWS Global Income Builder VIP | | | | | 41 |
Notes
Notes
| | |
| | |
VS2GIB-2 (R-025825-8 2/19) | | |
December 31, 2018
Annual Report
Deutsche DWS Variable Series II
(formerly Deutsche Variable Series II)
DWS Government & Agency Securities VIP
(formerly Deutsche Government & Agency Securities VIP)
Beginning on January 1, 2021, as permitted by regulations adopted by the Securities and Exchange Commission, you may not be receiving paper copies of the Fund’s shareholder reports from the insurance company that offers your contract unless you specifically request paper copies from your insurance company or from your financial intermediary. Instead, the shareholder reports will be made available on a Web site, and your insurance company will notify you by mail each time a report is posted and provide you with a Web site link to access the report. Instructions for requesting paper copies will be provided by your insurance company.
If you already elected to receive shareholder reports electronically, you will not be affected by this change and you need not take any action. You may elect to receive shareholder reports and other communications from your insurance company electronically by following the instructions provided by your insurance company.
You may elect to receive all future reports in paper free of charge from your insurance company. If your insurance company informs you that future reports will be delivered via Web access, you can inform your insurance company that you wish to continue receiving paper copies of your shareholder reports by following the instructions provided by your insurance company.

Contents
This report must be preceded or accompanied by a prospectus. To obtain an additional prospectus or summary prospectus, if available, call (800) 728-3337 or your financial representative. We advise you to consider the Fund’s objectives, risks, charges and expenses carefully before investing. The summary prospectus and prospectus contain this and other important information about the Fund. Please read the prospectus carefully before you invest.
Investing in derivatives entails special risks relating to liquidity, leverage and credit that may reduce returns and/or increase volatility. Bond investments are subject to interest-rate, credit, liquidity and market risks to varying degrees. When interest rates rise, bond prices generally fall. Credit risk refers to the ability of an issuer to make timely payments of principal and interest. The “full faith and credit” guarantee of the US government applies to the timely repayment of interest, and does not eliminate market risk. Because of the rising US government debt burden, it is possible that the US government may not be able to meet its financial obligations or that securities issued by the US government may experience credit downgrades. The Fund may lend securities to approved institutions. See the prospectus for details.
The brand DWS represents DWS Group GmbH & Co. KGaA and any of its subsidiaries such as DWS Distributors, Inc. which offers investment products or DWS Investment Management Americas, Inc. and RREEF America L.L.C. which offer advisory services.
DWS Distributors, Inc., 222 South Riverside Plaza, Chicago, IL 60606, (800) 621-1148
NOT FDIC/NCUA INSURED NO BANK GUARANTEE MAY LOSE VALUE NOT A DEPOSIT NOT INSURED BY ANY FEDERAL GOVERNMENT AGENCY
| | | | | | |
| | 2 | | | | | | Deutsche DWS Variable Series II — DWS Government & Agency Securities VIP |
| | |
| Performance Summary | | December 31, 2018 (Unaudited) |
Fund performance shown is historical, assumes reinvestment of all dividend and capital gain distributions and does not guarantee future results. Investment return and principal value fluctuate with changing market conditions so that, when redeemed, shares may be worth more or less than their original cost. Current performance may be lower or higher than the performance data quoted. Please contact your participating insurance company for the Fund’s most recent month-end performance. Performance does not reflect charges and fees (“contract charges”) associated with the separate account that invests in the Fund or any variable life insurance policy or variable annuity contract for which the Fund is an investment option. These charges and fees will reduce returns. While all share classes have the same underlying portfolio, their performance will differ.
The gross expense ratios of the Fund, as stated in the fee table of the prospectus dated May 1, 2018 are 0.87% and 1.21% for Class A and Class B shares, respectively, and may differ from the expense ratios disclosed in the Financial Highlights tables in this report.
Generally accepted accounting principles require adjustments to be made to the net assets of the Fund at period end for financial reporting purposes only, and as such, the total return based on the unadjusted net asset value per share may differ from the total return reported in the financial highlights.
Growth of an Assumed $10,000 Investment in DWS Government & Agency Securities VIP
| | |
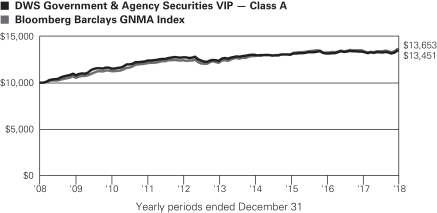 | | The Bloomberg Barclays GNMA Index is an unmanaged, market-value-weighted measure of all fixed-rate securities backed by mortgage pools of the Government National Mortgage Association. Index returns do not reflect any fees or expenses and it is not possible to invest directly into an index. |
| | | | | | | | | | |
Comparative Results | | | | | | | | | | |
| | | | |
DWS Government & Agency Securities VIP | | 1-Year | | 3-Year | | 5-Year | | 10-Year |
Class A | | Growth of $10,000 | | $10,055 | | $10,340 | | $10,885 | | $13,451 |
| | | Average annual total return | | 0.55% | | 1.12% | | 1.71% | | 3.01% |
Bloomberg Barclays GNMA Index | | Growth of $10,000 | | $10,102 | | $10,451 | | $11,229 | | $13,653 |
| | | Average annual total return | | 1.02% | | 1.48% | | 2.35% | | 3.16% |
| | | | |
DWS Government & Agency Securities VIP | | 1-Year | | 3-Year | | 5-Year | | 10-Year |
Class B | | Growth of $10,000 | | $10,019 | | $10,230 | | $10,698 | | $13,004 |
| | | Average annual total return | | 0.19% | | 0.76% | | 1.36% | | 2.66% |
Bloomberg Barclays GNMA Index | | Growth of $10,000 | | $10,102 | | $10,451 | | $11,229 | | $13,653 |
| | Average annual total return | | 1.02% | | 1.48% | | 2.35% | | 3.16% |
The growth of $10,000 is cumulative.
| | | | |
Deutsche DWS Variable Series II — DWS Government & Agency Securities VIP | | | | | 3 |
| | |
| Management Summary | | December 31, 2018 (Unaudited) |
During the12-month period ended December 31, 2018, the Fund provided a total return of 0.55% (Class A shares, unadjusted for contract charges) compared with the 1.02% return of its benchmark, the Bloomberg Barclays GNMA Index.
Against a backdrop of steady growth, strong corporate profits and arguably full employment, the bond markets in 2018 watched closely for any indications of an acceleration in inflation that could lead the U.S. Federal Reserve (the Fed) to push forward its timetable for returning interest rates to more historically normal levels. In early February, Treasury yields moved higher as hiring and wage growth data for January came in above expectations. March saw fears of a global trade war come to the forefront as the Trump administration announced plans to impose tariffs on steel and aluminum as well as on a wide range of imports coming from China. Risk sentiment would soon stabilize, as increasingly robust economic growth and corporate earnings data outweighed concerns over protectionist U.S. trade policy. However, the fourth quarter of 2018 witnessed declining prices for credit-oriented segments of the bond market as slowing growth overseas highlighted the downside risks of a global trade war. Notwithstanding the downturn in sentiment, the Fed continued to tighten monetary policy, raising its benchmark overnight lending rate inmid-December by a quarter point to the 2.25% to 2.50% range, the fourth such hike of 2018.
For the 12 months ended December 31, 2018, yields rose along the length of the U.S. Treasury yield curve and the curve flattened as increases on thefront-end were more significant. To illustrate, thetwo-year Treasury yield went from 1.89% to 2.48% while the30-year yield went from 2.74% to 3.02%.
As with most other areas of the bond market, GNMA performance was challenged in 2018 as Treasury yields moved higher. Premium coupon pools led performance within GNMAs as shorter duration assets were favored in a rising rate environment. The portfolio maintained an underweight to GNMAs in favor of conventional mortgage-backed securities (MBS) across lower coupons, while overweighting premium coupons within GNMAs as prepayments slowed notably with a crackdown on predatory lending practices by GNMA. As interest rates rose in the first half of 2018, we reduced exposure to super-seasoned high coupon pass-throughs as they outperformed within the GNMA space. In addition, the Fund’s MBS exposure was reduced over the 12 months. The portfolio’s above-benchmark stance with respect to duration was shifted to neutral while incorporating a flattening bias with respect to the yield curve. While we incorporated views on the direction of foreign sovereign interest rates in the portfolio over the 12 months, we currently express all interest rate and yield curve views in U.S. dollar assets. Derivatives were used primarily for hedging interest rate risk, with periodic use to express tactical duration views. For the period, GNMA security selection andoff-benchmark exposures added to relative performance, while positioning with respect to interest rates and currencies detracted to a roughly similar degree. The Fund remains positioned with a preference for higher coupons within GNMAs while maintaining an allocation to structured assets such as asset-backed securities and commercial mortgage-backed securities.
Gregory M. Staples, CFA, Managing Director
Scott Agi, CFA, Director
Portfolio Managers
The views expressed reflect those of the portfolio management team only through the end of the period of the report as stated on the cover. The management team’s views are subject to change at any time based on market and other conditions and should not be construed as a recommendation. Past performance is no guarantee of future results. Current and future portfolio holdings are subject to risk.
| | | | | | |
| | 4 | | | | | | Deutsche DWS Variable Series II — DWS Government & Agency Securities VIP |
Terms to Know
Theyield curve is a graphical representation of how yields on bonds of different maturities compare. Normally, yield curves slant up, as bonds with longer maturities typically offer higher yields than short-term bonds.
TheBloomberg Barclays GNMA Index tracks the performance of fixed-rate securities backed by mortgage pools of the Government National Mortgage Association (GNMA).
Duration, which is expressed in years, measures the sensitivity of the price of a bond or bond fund to a change in interest rates.
Coupon is the interest rate, expressed as an annual percentage of face value, which a bond issuer promises to pay until maturity.
Overweight means the Fund holds a higher weighting in a given sector or security than the benchmark.Underweight means the Fund holds a lower weighting.
Mortgage-backed securities (MBS) are secured by mortgage debt. Commercial mortgage-backed securities (CMBS) are secured by loans on commercial properties.Asset-backed securities (ABS) are secured by loans, credit or receivables, exclusive of mortgage debt.
| | | | |
Deutsche DWS Variable Series II — DWS Government & Agency Securities VIP | | | | | 5 |
| | |
| Portfolio Summary | | (Unaudited) |
| | | | | | | | |
| Asset Allocation (As a % of Net Assets) | | 12/31/18 | | | 12/31/17 | |
| Mortgage-Backed Securities Pass-Throughs | | | 82% | | | | 80% | |
| Collateralized Mortgage Obligations | | | 10% | | | | 22% | |
| Commercial Mortgage-Backed Securities | | | 4% | | | | 3% | |
| Asset-Backed | | | 3% | | | | 5% | |
| Government & Agency Obligations | | | 4% | | | | 16% | |
| Corporate Bonds | | | — | | | | 1% | |
| Cash Equivalents and Other Assets and Liabilities, net | | | –3% | | | | –27% | |
| | | | 100% | | | | 100% | |
| | |
| Coupons* | | 12/31/18 | | | 12/31/17 | |
| Less than 3.5% | | | 25% | | | | 35% | |
| 3.5%–4.49% | | | 52% | | | | 42% | |
| 4.5%–5.49% | | | 17% | | | | 15% | |
| 5.5%–6.49% | | | 3% | | | | 5% | |
| 6.5%–7.49% | | | 3% | | | | 3% | |
| 7.5% and Greater | | | 0% | | | | 0% | |
| | | | 100% | | | | 100% | |
| | |
| Interest Rate Sensitivity | | 12/31/18 | | | 12/31/17 | |
| Effective Maturity | | | 8.1 years | | | | 9.9 years | |
| Effective Duration | | | 4.7 years | | | | 4.0 years | |
| * | Excludes Cash Equivalents and U.S. Treasury Bills. |
Effective maturity is the weighted average of the maturity date of bonds held by the Fund taking into consideration any available maturity shortening features.
Effective duration is an approximate measure of the Fund’s sensitivity to interest rate changes taking into consideration any maturity shortening features.
Portfolio holdings and characteristics are subject to change.
For more complete details about the Fund’s investment portfolio, see page 7.
Following the Fund’s fiscal first and third quarter-end, a complete portfolio holdings listing is filed with the SEC on Form N-Q or Form N-PORT (available for filings after March 31, 2019). The Fund’s Form N-Q or Form N-PORT will be available on the SEC’s Web site at sec.gov. The Fund’s portfolio holdings are also posted on dws.com from time to time. Please see the Fund’s current prospectus for more information.
| | | | | | |
| | 6 | | | | | | Deutsche DWS Variable Series II — DWS Government & Agency Securities VIP |
| | |
| Investment Portfolio | | December 31, 2018 |
| | | | | | | | |
| | | Principal
Amount ($) | | | Value ($) | |
Mortgage-Backed Securities
Pass-Throughs 82.0% | |
Federal Home Loan Mortgage Corp.: | |
3.0%, with various maturities from 9/1/2047 until 1/1/2049 (a) | | | 2,682,766 | | | | 2,614,871 | |
4.0%, with various maturities from 1/1/2045 until 12/1/2045 | | | 558,814 | | | | 573,790 | |
Federal National Mortgage Association: | |
3.0%, with various maturities from 3/1/2047 until 10/1/2047 | | | 1,295,757 | | | | 1,263,738 | |
3.25%, 3/1/2030 | | | 900,000 | | | | 877,155 | |
3.5%, with various maturities from 8/1/2047 until 1/1/2049 (a) | | | 3,152,355 | | | | 3,153,665 | |
3.64%, 7/1/2030 | | | 1,000,000 | | | | 1,009,399 | |
Government National Mortgage Association: | |
3.0%, with various maturities from 4/20/2046 until 9/20/2047 | | | 2,230,587 | | | | 2,196,906 | |
3.5%, with various maturities from 4/15/2042 until 2/20/2048 | | | 4,888,933 | | | | 4,934,264 | |
4.0%, with various maturities from 9/20/2040 until 1/23/2049 (a) | | | 7,163,773 | | | | 7,349,163 | |
4.5%, with various maturities from 4/20/2035 until 8/20/2048 | | | 2,748,902 | | | | 2,861,539 | |
4.55%, 1/15/2041 | | | 128,796 | | | | 134,598 | |
4.625%, 5/15/2041 | | | 97,508 | | | | 101,026 | |
5.0%, with various maturities from 12/15/2032 until 1/1/2049 (a) | | | 1,551,923 | | | | 1,617,090 | |
5.5%, with various maturities from 1/15/2034 until 6/15/2042 | | | 559,741 | | | | 605,874 | |
6.0%, with various maturities from 5/20/2034 until 1/15/2038 | | | 276,815 | | | | 303,691 | |
6.5%, with various maturities from 9/15/2036 until 2/15/2039 | | | 225,643 | | | | 254,667 | |
7.0%, with various maturities from 2/20/2027 until 2/15/2038 | | | 68,974 | | | | 69,812 | |
7.5%, 10/20/2031 | | | 3,131 | | | | 3,536 | |
Total Mortgage-Backed SecuritiesPass-Throughs (Cost $30,210,861) | | | | 29,924,784 | |
|
| Asset-Backed 3.2% | |
| Automobile Receivables 0.4% | |
AmeriCredit Automobile Receivables Trust, “A3”,Series 2017-1, 1.87%, 8/18/2021 | | | 151,901 | | | | 150,954 | |
| Miscellaneous 2.8% | |
Carbone CLO Ltd., “A1”,Series 2017-1A, 144A,3-monthUSD-LIBOR + 1.140%, 3.609% *, 1/20/2031 | | | 380,000 | | | | 375,263 | |
| | | | | | | | |
| | | Principal
Amount ($) | | | Value ($) | |
Domino’s Pizza Master Issuer LLC, “A23”, Series2017-1A, 144A, 4.118%, 7/25/2047 | | | 444,375 | | | | 435,385 | |
NRZ Excess Spread-Collateralized Notes, “B”, Series 2018-PLS1, 144A, 3.588%, 1/25/2023 | | | 218,667 | | | | 217,350 | |
| | | | | | | | |
| | | | | | | | 1,027,998 | |
Total Asset-Backed (Cost $1,194,938) | | | | 1,178,952 | |
|
| Collateralized Mortgage Obligations 10.0% | |
BX Trust, “A”, Series2018-GW, 144A,1-monthUSD-LIBOR + 0.800%, 3.255% *, 5/15/2035 | | | 200,000 | | | | 195,675 | |
Federal Home Loan Mortgage Corp.: | |
“OA”, Series 3179, Principal Only, Zero Coupon, 7/15/2036 | | | 68,966 | | | | 59,980 | |
“CZ”, Series 4113, 3.0%, 9/15/2042 | | | 324,212 | | | | 301,165 | |
“PI”, Series 3940, Interest Only, 4.0%, 2/15/2041 | | | 248,618 | | | | 35,089 | |
“C1”, Series 329, Interest Only, 4.0%, 12/15/2041 | | | 725,915 | | | | 140,102 | |
“UA”, Series 4298, 4.0%, 2/15/2054 | | | 53,835 | | | | 55,578 | |
“C32”, Series 303, Interest Only, 4.5%, 12/15/2042 | | | 740,995 | | | | 159,985 | |
“C28”, Series 303, Interest Only, 4.5%, 1/15/2043 | | | 874,035 | | | | 199,001 | |
“MI”, Series 3871, Interest Only, 6.0%, 4/15/2040 | | | 28,978 | | | | 1,611 | |
“IJ”, Series 4472, Interest Only, 6.0%, 11/15/2043 | | | 285,220 | | | | 69,270 | |
“A”, Series 172, Interest Only, 6.5%, 1/1/2024 | | | 5,518 | | | | 644 | |
“C22”, Series 324, Interest Only, 6.5%, 4/15/2039 | | | 408,502 | | | | 105,754 | |
Federal National Mortgage Association: | |
“Z”, Series2013-44, 3.0%, 5/25/2043 | | | 99,375 | | | | 94,800 | |
‘‘IO”, Series2012-146, Interest Only, 3.5%, 1/25/2043 | | | 967,492 | | | | 192,595 | |
“4”, Series 406, Interest Only, 4.0%, 9/25/2040 | | | 186,198 | | | | 38,705 | |
“IO”, Series2016-26, Interest Only, 5.0%, 5/25/2046 | | | 797,816 | | | | 153,905 | |
“UI”, Series2010-126, Interest Only, 5.5%, 10/25/2040 | | | 308,331 | | | | 62,088 | |
“IO”, Series2014-70, Interest Only, 5.5%, 10/25/2044 | | | 419,804 | | | | 92,269 | |
“BI”, Series2015-97, Interest Only, 5.5%, 1/25/2046 | | | 349,308 | | | | 79,712 | |
“WI”, Series2011-59, Interest Only, 6.0%, 5/25/2040 | | | 34,011 | | | | 944 | |
“YT”, Series2013-35, 6.5%, 9/25/2032 | | | 460,305 | | | | 521,507 | |
Government National Mortgage Association: | |
“JI”, Series2013-10, Interest Only, 3.5%, 1/20/2043 | | | 464,479 | | | | 98,332 | |
“ID”, Series2013-70, Interest Only, 3.5%, 5/20/2043 | | | 212,315 | | | | 41,515 | |
The accompanying notes are an integral part of the financial statements.
| | | | |
Deutsche DWS Variable Series II — DWS Government & Agency Securities VIP | | | | | 7 |
| | | | | | | | |
| | | Principal
Amount ($) | | | Value ($) | |
| | |
“IP”, Series2015-50, Interest Only, 4.0%, 9/20/2040 | | | 686,789 | | | | 56,790 | |
| | |
“PI”, Series2015-40, Interest Only, 4.0%, 4/20/2044 | | | 208,577 | | | | 28,742 | |
| | |
“PI”, Series2014-108, Interest Only, 4.5%, 12/20/2039 | | | 175,011 | | | | 30,732 | |
| | |
“IP”, Series2014-115, Interest Only, 4.5%, 2/20/2044 | | | 119,539 | | | | 20,432 | |
| | |
“GZ”, Series2005-24, 5.0%, 3/20/2035 | | | 665,276 | | | | 751,225 | |
| | |
“IA”, Series2012-64, Interest Only, 5.5%, 5/16/2042 | | | 169,697 | | | | 36,403 | |
| | |
“DI”, Series2009-10, Interest Only, 6.0%, 4/16/2038 | | | 98,072 | | | | 13,215 | |
| | |
“IP”, Series2009-118, Interest Only, 6.5%, 12/16/2039 | | | 29,225 | | | | 7,763 | |
| | |
“IC”, Series1997-4, Interest Only, 7.5%, 3/16/2027 | | | 230,324 | | | | 1,667 | |
Total Collateralized Mortgage Obligations(Cost $3,455,991) | | | | 3,647,195 | |
|
| Commercial Mortgage-Backed Securities 4.0% | |
| | |
Atrium Hotel Portfolio Trust, “A”, Series 2018-ATRM, 144A,1-monthUSD-LIBOR + 0.95%, 3.405%*, 6/15/2035 | | | 427,500 | | | | 425,043 | |
| | |
CHT Mortgage Trust, “A”, Series 2017-CSMO,144A,1-monthUSD-LIBOR + 0.930%, 3.385%*, 11/15/2036 | | | 400,000 | | | | 395,125 | |
| | |
DBGS Mortgage Trust, “A”, Series2018-5BP,144A,1-monthUSD-LIBOR + 0.645%, 3.1%*, 6/15/2033 | | | 450,000 | | | | 443,339 | |
| | |
FHLMC Multifamily Structured Pass-Through Securities, “X1”, Series K055, Interest Only, 1.366%*, 3/25/2026 | | | 2,468,959 | | | | 202,478 | |
Total Commercial Mortgage-Backed Securities (Cost $1,476,032) | | | | 1,465,985 | |
| | | | | | | | |
| | | Principal
Amount ($) | | | Value ($) | |
| Government & Agency Obligation 1.9% | |
| U.S. Treasury Obligation | |
U.S. Treasury Inflation Indexed Note, 0.625%, 4/15/2023 (Cost $699,650) | | | 712,621 | | | | 700,781 | |
|
| Short-Term U.S. Treasury Obligations 2.4% | |
|
U.S. Treasury Bills: | |
| | |
2.36%**, 8/15/2019 (b) | | | 380,000 | | | | 374,024 | |
| | |
2.582%**, 10/10/2019 (c) | | | 500,000 | | | | 490,170 | |
Total Short-Term U.S. Treasury Obligations (Cost $864,257) | | | | 864,194 | |
| | |
| | | Shares | | | Value ($) | |
| Cash Equivalents 19.9% | |
| | |
DWS Central Cash Management Government Fund, 2.41% (d) | | | 3,485,215 | | | | 3,485,215 | |
| | |
DWS ESG Liquidity Fund “Capital Shares”, 2.66% (d) | | | 3,784,362 | | | | 3,784,362 | |
Total Cash Equivalents (Cost $7,269,198) | | | | 7,269,577 | |
| | |
| | | % of Net
Assets | | | Value ($) | |
Total Investment Portfolio (Cost $45,170,927) | | | 123.4 | | | | 45,051,468 | |
| Other Assets and Liabilities, Net | | | (23.4 | ) | | | (8,535,061 | ) |
| Net Assets | | | 100.0 | | | | 36,516,407 | |
A summary of the Fund’s transactions with affiliated investments during the year ended December 31, 2018 are as follows:
| | | | | | | | | | | | | | | | | | | | | | | | | | | | | | | | |
Value ($) at
12/31/2017 | | Purchases
Cost ($) | | | Sales
Proceeds ($) | | | Net
Realized
Gain/
(Loss) ($) | | | Net Change in
Unrealized
Appreciation
(Depreciation) ($) | | | Income ($) | | | Capital Gain
Distributions ($) | | | Number of
Shares
at
12/31/2018 | | | Value ($)
at
12/31/2018 | |
Securities Lending Collateral —% | | | | | | | | | | | | | | | | | |
DWS Government & Agency Securities Portfolio “DWS Government Cash Institutional Shares” (d) (e) | |
| — | | | 0 | (f) | | | — | | | | — | | | | — | | | | 383 | | | | — | | | | — | | | | — | |
Cash Equivalents 19.9% | | | | | | | | | | | | | | | | | |
DWS Central Cash Management Government Fund, 2.41% (d) | |
| 10,252 | | | 40,586,819 | | | | 37,111,856 | | | | — | | | | — | | | | 63,199 | | | | — | | | | 3,485,215 | | | | 3,485,215 | |
DWS ESG Liquidity Fund “Capital Shares”, 2.66% (d) | |
| — | | | 6,584,116 | | | | 2,800,000 | | | | (133 | ) | | | 379 | | | | 91,449 | | | | — | | | | 3,784,362 | | | | 3,784,362 | |
| 10,252 | | | 47,170,935 | | | | 39,911,856 | | | | (133 | ) | | | 379 | | | | 155,031 | | | | — | | | | 7,269,577 | | | | 7,269,577 | |
| * | Variable or floating rate security. These securities are shown at their current rate as of December 31, 2018. For securities based on a published reference rate and spread, the reference rate and spread are indicated within the description above. Certain variable rate securities are not based on a published reference rate and spread but adjust periodically based on current market conditions, prepayment of underlying positions and/or other variables. |
| ** | Annualized yield at time of purchase; not a coupon rate. |
| (a) | When-issued, delayed delivery or forward commitment securities included. |
The accompanying notes are an integral part of the financial statements.
| | | | | | |
| | 8 | | | | | | Deutsche DWS Variable Series II — DWS Government & Agency Securities VIP |
| (b) | At December 31, 2018, this security has been pledged, in whole or in part, to cover initial margin requirements for open futures contracts. |
| (c) | At December 31, 2018, this security has been pledged, in whole or in part, as collateral for open centrally cleared swap contracts. |
| (d) | Affiliated fund managed by DWS Investment Management Americas, Inc. The rate shown is the annualizedseven-day yield at period end. |
| (e) | Represents collateral held in connection with securities lending. Income earned by the Fund is net of borrower rebates. |
| (f) | Represents the net increase (purchase cost) or decrease (sales proceeds) in the amount invested for the year ended December 31, 2018. |
144A: Security exempt from registration under Rule 144A of the Securities Act of 1933. These securities may be resold in transactions exempt from registration, normally to qualified institutional buyers.
CLO: Collateralized Loan Obligation
Interest Only: Interest Only (IO) bonds represent the “interest only” portion of payments on a pool of underlying mortgages or mortgage-backed securities. IO securities are subject to prepayment risk of the pool of underlying mortgages.
LIBOR: London Interbank Offered Rate
Principal Only: Principal Only (PO) bonds represent the “principal only” portion of payments on a pool of underlying mortgages or mortgage-backed securities.
Included in the portfolio are investments in mortgage or asset-backed securities which are interests in separate pools of mortgages or assets. Effective maturities of these investments may be shorter than stated maturities due to prepayments. Some separate investments in the Federal Home Loan Mortgage Corp., Federal National Mortgage Association and Government National Mortgage Association issues which have similar coupon rates have been aggregated for presentation purposes in this investment portfolio.
At December 31, 2018, open futures contracts purchased were as follows:
| | | | | | | | | | | | | | | | | | | | | | | | |
| Futures | | Currency | | | Expiration
Date | | | Contracts | | | Notional
Amount ($) | | | Notional
Value ($) | | | Unrealized
Appreciation ($) | |
| 10 Year U.S. Treasury Note | | | USD | | | | 3/20/2019 | | | | 42 | | | | 5,015,179 | | | | 5,124,656 | | | | 109,477 | |
| U.S. Treasury Long Bond | | | USD | | | | 3/20/2019 | | | | 8 | | | | 1,129,516 | | | | 1,168,000 | | | | 38,484 | |
| Total unrealized appreciation | | | | 147,961 | |
At December 31, 2018, open futures contracts sold were as follows:
| | | | | | | | | | | | | | | | | | | | | | | | |
| Futures | | Currency | | | Expiration
Date | | | Contracts | | | Notional
Amount ($) | | | Notional
Value ($) | | | Unrealized
(Depreciation) ($) | |
| 5 Year U.S. Treasury Note | | | USD | | | | 3/29/2019 | | | | 16 | | | | 1,803,593 | | | | 1,835,000 | | | | (31,407 | ) |
At December 31, 2018, open interest rate swap contracts were as follows:
| | | | | | | | | | | | | | | | | | | | | | |
| Centrally Cleared Swaps | |
Cash Flows Paid by
the Fund/Frequency | | Cash Flows Received
by the Fund/
Frequency | | Effective/
Expiration Date | | Notional
Amount ($) | | | Currency | | Upfront
Payments
Paid/
(Received) ($) | | | Value ($) | | | Unrealized
Appreciation/
(Depreciation) ($) | |
| Floating — 3-Month LIBOR Quarterly | | Fixed — 2.25%
Semi-Annually | | 3/21/2018
3/21/2028 | | | 400,000 | | | USD | | | (17,004 | ) | | | (12,661 | ) | | | 4,343 | |
Fixed — 3.06%
Semi-Annually | | Floating —3-Month LIBOR Quarterly | | 9/17/2018
6/17/2030 | | | 1,600,000 | | | USD | | | — | | | | (49,394 | ) | | | (49,394 | ) |
Fixed — 3.125%
Semi-Annually | | Floating —3-Month LIBOR Quarterly | | 10/9/2018
10/9/2021 | | | 1,300,000 | | | USD | | | — | | | | (20,156 | ) | | | (20,156 | ) |
Fixed — 2.2239%
Semi-Annually | | Floating —3-Month LIBOR Quarterly | | 3/21/2018
3/21/2023 | | | 900,000 | | | USD | | | — | | | | 7,264 | | | | 7,264 | |
Fixed — 2.45%
Semi-Annually | | Floating —3-Month LIBOR Quarterly | | 12/20/2017
12/20/2032 | | | 500,000 | | | USD | | | — | | | | 21,825 | | | | 21,825 | |
| Total net unrealized depreciation | | | | (36,118 | ) |
LIBOR: London Interbank Offered Rate;3-Month LIBOR rate at December 31, 2018 is 2.808%.
At December 31, 2018, open total return swap contracts were as follows:
| | | | | | | | | | | | | | | | | | | | | | | | |
| Bilateral Swaps | | | | | | | | | | | | | | | | | | | |
Pay/Receive
Return of the
Reference Index | | Fixed Cash
Flows Received
Frequency | | Counterparty/
Expiration Date | | Notional
Amount | | | Currency | | | Upfront
Payments
Paid ($) | | | Value ($) | | | Unrealized
Depreciation ($) | |
| Long Position | |
| | | | | | | |
| Markit IOS INDEX FN30.400.10 | | 4.0%/Monthly | | Goldman Sachs & Co.
1/12/2041 | | | 347,603 | | | | USD | | | | — | | | | (3,136) | | | | (3,136) | |
The accompanying notes are an integral part of the financial statements.
| | | | |
Deutsche DWS Variable Series II — DWS Government & Agency Securities VIP | | | | | 9 |
As of December 31, 2018, the Fund had the following open forward foreign currency contracts:
| | | | | | | | | | | | | | | | | | | | | | | | |
| Contracts to Deliver | | | In Exchange For | | | Settlement
Date | | | Unrealized
Appreciation ($) | | | Counterparty | |
| NOK | | | 6,505,000 | | | | USD | | | | 785,490 | | | | 1/29/2019 | | | | 32,093 | | | | Danske Bank AS | |
| | | | | | | | | | | | | | | | | | | | | | | | |
| Contracts to Deliver | | | In Exchange For | | | Settlement
Date | | | Unrealized
Depreciation ($) | | | Counterparty | |
| USD | | | 780,187 | | | | NOK | | | | 6,505,000 | | | | 1/29/2019 | | | | (26,789 | ) | | | Danske Bank AS | |
Currency Abbreviations
For information on the Fund’s policy and additional disclosures regarding futures contracts, interest rate swap contracts, total return swap contracts and forward foreign currency contracts, please refer to the Derivatives section of Note B in the accompanying Notes to Financial Statements.
Fair Value Measurements
Various inputs are used in determining the value of the Fund’s investments. These inputs are summarized in three broad levels. Level 1 includes quoted prices in active markets for identical securities. Level 2 includes other significant observable inputs (including quoted prices for similar securities, interest rates, prepayment speeds and credit risk). Level 3 includes significant unobservable inputs (including the Fund’s own assumptions in determining the fair value of investments). The level assigned to the securities valuations may not be an indication of the risk or liquidity associated with investing in those securities.
The following is a summary of the inputs used as of December 31, 2018 in valuing the Fund’s investments. For information on the Fund’s policy regarding the valuation of investments, please refer to the Security Valuation section of Note A in the accompanying Notes to Financial Statements.
| | | | | | | | | | | | | | | | |
| Assets | | Level 1 | | | Level 2 | | | Level 3 | | | Total | |
| Fixed Income Investments (f) | | | | | | | | | | | | | | | | |
Mortgage-Backed Securities Pass-Throughs | | $ | — | | | $ | 29,924,784 | | | $ | — | | | $ | 29,924,784 | |
Asset-Backed | | | — | | | | 1,178,952 | | | | — | | | | 1,178,952 | |
Collateralized Mortgage Obligations | | | — | | | | 3,647,195 | | | | — | | | | 3,647,195 | |
Commercial Mortgage-Backed Securities | | | — | | | | 1,465,985 | | | | — | | | | 1,465,985 | |
Government & Agency Obligation | | | — | | | | 700,781 | | | | — | | | | 700,781 | |
Short-Term U.S. Treasury Obligations | | | — | | | | 864,194 | | | | — | | | | 864,194 | |
| Short-Term Investments | | | 7,269,577 | | | | — | | | | — | | | | 7,269,577 | |
| Derivatives (g) | | | | | | | | | | | | | | | | |
Futures Contracts | | | 147,961 | | | | — | | | | — | | | | 147,961 | |
Interest Rate Swap Contracts | | | — | | | | 33,432 | | | | — | | | | 33,432 | |
Forward Foreign Currency Contracts | | | — | | | | 32,093 | | | | — | | | | 32,093 | |
| Total | | $ | 7,417,538 | | | $ | 37,847,416 | | | $ | — | | | $ | 45,264,954 | |
| | | | |
| Liabilities | | Level 1 | | | Level 2 | | | Level 3 | | | Total | |
| Derivatives (g) | | | | | | | | | | | | | | | | |
Futures Contracts | | $ | (31,407 | ) | | $ | — | | | $ | — | | | $ | (31,407 | ) |
Interest Rate Swap Contracts | | | — | | | | (69,550 | ) | | | — | | | | (69,550 | ) |
Total Return Swap Contracts | | | — | | | | (3,136 | ) | | | — | | | | (3,136 | ) |
Forward Foreign Currency Contracts | | | — | | | | (26,789 | ) | | | — | | | | (26,789 | ) |
| Total | | $ | (31,407 | ) | | $ | (99,475 | ) | | $ | — | | | $ | (130,882 | ) |
| (f) | See Investment Portfolio for additional detailed categorizations. |
| (g) | Derivatives include unrealized appreciation (depreciation) on open futures contracts, interest rate swap contracts, total return swap contract and forward foreign currency contracts. |
The accompanying notes are an integral part of the financial statements.
| | | | | | |
| | 10 | | | | | | Deutsche DWS Variable Series II — DWS Government & Agency Securities VIP |
Statement of Assets and Liabilities
| | | | |
| As of December 31, 2018 | | | | |
| |
| Assets | | | | |
| Investments innon-affiliated securities, at value (cost $37,901,729) | | $ | 37,781,891 | |
Investment in affiliated securities, at value (cost $7,269,198) | | | 7,269,577 | |
| Foreign currency, at value (cost $63,827) | | | 64,193 | |
| Receivable for investments sold — forward commitments | | | 4,056,686 | |
| Receivable for Fund shares sold | | | 2,085 | |
| Interest receivable | | | 149,573 | |
| Receivable for variation margin on futures contracts | | | 16,134 | |
| Unrealized appreciation on forward foreign currency contracts | | | 32,093 | |
| Other assets | | | 1,278 | |
| Total assets | | | 49,373,510 | |
| |
| Liabilities | | | | |
| Cash overdraft | | | 1,686 | |
| Payable for investments purchased — forward commitments | | | 11,134,458 | |
| Payable for investments purchased | | | 1,493,555 | |
| Payable for Fund shares redeemed | | | 62,974 | |
| Payable for variation margin on centrally cleared swaps | | | 9,217 | |
| Unrealized depreciation on bilateral swap contracts | | | 3,136 | |
| Unrealized depreciation on forward foreign currency contracts | | | 26,789 | |
| Accrued management fee | | | 4,491 | |
| Accrued Trustees’ fees | | | 1,181 | |
| Other accrued expenses and payables | | | 119,616 | |
| Total liabilities | | | 12,857,103 | |
| Net assets, at value | | $ | 36,516,407 | |
| |
| Net Assets Consist of | | | | |
| Distributable earnings (loss) | | | 378,572 | |
| Paid-in capital | | | 36,137,835 | |
| Net assets, at value | | $ | 36,516,407 | |
| |
| Net Asset Value | | | | |
Class A | | | | |
| |
| Net Asset Value, offering and redemption price per share ($34,908,720 ÷ 3,199,776 outstanding shares of beneficial interest, no par value, unlimited number of shares authorized) | | $ | 10.91 | |
Class B | | | | |
| |
| Net Asset Value, offering and redemption price per share ($1,607,687 ÷ 147,546 outstanding shares of beneficial interest, no par value, unlimited number of shares authorized) | | $ | 10.90 | |
Statement of Operations
| | | | |
| For the year ended December 31, 2018 | | | | |
| |
| Investment Income | | | | |
| Income: | | | | |
| Interest | | $ | 1,072,600 | |
| Income distributions from affiliated securities | | | 154,648 | |
| Securities lending income, net of borrower rebates | | | 383 | |
| Total income | | | 1,227,631 | |
| Expenses: | | | | |
| Management fee | | | 176,733 | |
| Administration fee | | | 39,274 | |
| Services to Shareholders | | | 634 | |
| Record keeping fee (Class B) | | | 1,591 | |
| Distribution service fees (Class B) | | | 4,219 | |
| Custodian fee | | | 20,201 | |
| Professional fees | | | 85,037 | |
| Reports to shareholders | | | 24,693 | |
| Trustees’ fees and expenses | | | 3,492 | |
| Other | | | 16,621 | |
| Total expenses before expense reductions | | | 372,495 | |
| Expense reductions | | | (149,164 | ) |
| Total expenses after expense reductions | | | 223,331 | |
| Net investment income | | | 1,004,300 | |
| |
| Realized and Unrealized Gain/(Loss) | | | | |
| Net realized gain (loss) from: | | | | |
| Non-Affiliated investments | | | (708,805 | ) |
| Affiliated investments | | | (133 | ) |
| Swap contracts | | | 242,527 | |
| Futures | | | (109,713 | ) |
| Forward foreign currency contracts | | | 50,079 | |
| Foreign currency | | | 34,091 | |
| Payments by affiliates (see Note G) | | | 2,209 | |
| | | | (489,745 | ) |
| Change in net unrealized appreciation (depreciation) on: | | | | |
| Non-Affiliated investments | | | (373,928 | ) |
| Affiliated investments | | | 379 | |
| Swap contracts | | | (82,037 | ) |
| Futures | | | 82,518 | |
| Forward foreign currency contracts | | | (18,419 | ) |
| Foreign currency | | | 134 | |
| | | | (391,353 | ) |
| Net gain (loss) | | | (881,098 | ) |
Net increase (decrease) in net assets
resulting from operations | | $ | 123,202 | |
The accompanying notes are an integral part of the financial statements.
| | | | |
Deutsche DWS Variable Series II — DWS Government & Agency Securities VIP | | | | | 11 |
Statements of Changes in Net Assets
| | | | | | | | |
| | | Years Ended December 31, | |
| Increase (Decrease) in Net Assets | | 2018 | | | 2017 | |
Operations: | | | | | | | | |
Net investment income | | $ | 1,004,300 | | | $ | 988,088 | |
Net realized gain (loss) | | | (489,745 | ) | | | 851,798 | |
Change in net unrealized appreciation (depreciation) | | | (391,353 | ) | | | (979,021 | ) |
Net increase (decrease) in net assets resulting from operations | | | 123,202 | | | | 860,865 | |
Distributions to shareholders | | | | | | | | |
Class A | | | (1,045,563 | ) | | | (1,241,081 | ) |
Class B | | | (40,012 | ) | | | (46,826 | ) |
Total distributions | | | (1,085,575 | ) | | | (1,287,907 | )* |
Fund share transactions: | | | | | | | | |
Class A | | | | | | | | |
Proceeds from shares sold | | | 2,638,856 | | | | 3,259,096 | |
Reinvestment of distributions | | | 1,045,563 | | | | 1,241,081 | |
Payments for shares redeemed | | | (8,226,521 | ) | | | (15,457,312 | ) |
Net increase (decrease) in net assets from Class A share transactions | | | (4,542,102 | ) | | | (10,957,135 | ) |
Class B | | | | | | | | |
Proceeds from shares sold | | | 54,842 | | | | 67,053 | |
Reinvestment of distributions | | | 40,012 | | | | 46,826 | |
Payments for shares redeemed | | | (296,226 | ) | | | (642,815 | ) |
Net increase (decrease) in net assets from Class B share transactions | | | (201,372 | ) | | | (528,936 | ) |
Increase (decrease) in net assets | | | (5,705,847 | ) | | | (11,913,113 | ) |
Net assets at beginning of period | | | 42,222,254 | | | | 54,135,367 | |
| | |
Net assets at end of period | | $ | 36,516,407 | | | $ | 42,222,254 | ** |
| | |
Other Information | | | | | | | | |
Class A | | | | | | | | |
Shares outstanding at beginning of period | | | 3,619,812 | | | | 4,598,638 | |
Shares sold | | | 242,507 | | | | 291,446 | |
Shares issued to shareholders in reinvestment of distributions | | | 97,716 | | | | 112,315 | |
Shares redeemed | | | (760,259 | ) | | | (1,382,587 | ) |
Net increase (decrease) in Class A shares | | | (420,036 | ) | | | (978,826 | ) |
| | |
Shares outstanding at end of period | | | 3,199,776 | | | | 3,619,812 | |
Class B | | | | | | | | |
Shares outstanding at beginning of period | | | 165,975 | | | | 213,112 | |
Shares sold | | | 5,073 | | | | 6,013 | |
Shares issued to shareholders in reinvestment of distributions | | | 3,736 | | | | 4,234 | |
Shares redeemed | | | (27,238 | ) | | | (57,384 | ) |
Net increase (decrease) in Class B shares | | | (18,429 | ) | | | (47,137 | ) |
| | |
Shares outstanding at end of period | | | 147,546 | | | | 165,975 | |
| * | Includes distributions from net investment income. |
| ** | Includes undistributed net investment income of $1,051,322. |
The accompanying notes are an integral part of the financial statements.
| | | | | | |
| | 12 | | | | | | Deutsche DWS Variable Series II — DWS Government & Agency Securities VIP |
Financial Highlights
| | | | | | | | | | | | | | | | | | | | |
| | | Years Ended December 31, | |
| Class A | | 2018 | | | 2017 | | | 2016 | | | 2015 | | | 2014 | |
| | | | | |
| Selected Per Share Data | | | | | | | | | | | | | | | | | | | | |
| Net asset value, beginning of period | | $ | 11.15 | | | $ | 11.25 | | | $ | 11.48 | | | $ | 11.80 | | | $ | 11.47 | |
| Income (loss) from investment operations: | | | | | | | | | | | | | | | | | | | | |
Net investment incomea | | | .28 | | | | .23 | | | | .25 | | | | .27 | | | | .29 | |
Net realized and unrealized gain (loss) | | | (.22 | ) | | | (.04 | ) | | | (.13 | ) | | | (.26 | ) | | | .31 | |
Total from investment operations | | | .06 | | | | .19 | | | | .12 | | | | .01 | | | | .60 | |
| Less distributions from: | | | | | | | | | | | | | | | | | | | | |
Net investment income | | | (.30 | ) | | | (.29 | ) | | | (.35 | ) | | | (.33 | ) | | | (.27 | ) |
| Net asset value, end of period | | $ | 10.91 | | | $ | 11.15 | | | $ | 11.25 | | | $ | 11.48 | | | $ | 11.80 | |
| Total Return (%)b | | | .55 | | | | 1.67 | | | | 1.06 | | | | .06 | | | | 5.29 | |
| | | | | |
| Ratios to Average Net Assets and Supplemental Data | | | | | | | | | | | | | | | | | | | | |
| Net assets, end of period ($ millions) | | | 35 | | | | 40 | | | | 52 | | | | 66 | | | | 87 | |
| Ratio of expenses before expense reductions (%)c | | | .93 | | | | .87 | | | | .86 | | | | .74 | | | | .72 | |
| Ratio of expenses after expense reductions (%)c | | | .55 | | | | .61 | | | | .58 | | | | .68 | | | | .70 | |
| Ratio of net investment income (%) | | | 2.58 | | | | 2.03 | | | | 2.22 | | | | 2.33 | | | | 2.49 | |
| Portfolio turnover rate (%) | | | 448 | | | | 588 | | | | 521 | | | | 376 | | | | 393 | |
| a | Based on average shares outstanding during the period. |
| b | Total return would have been lower had certain expenses not been reduced. |
| c | Expense ratio does not reflect charges and fees associated with the separate account that invests in the Fund or any variable life insurance policy or variable annuity contract for which the Fund is an investment option. |
| | | | | | | | | | | | | | | | | | | | |
| | | Years Ended December 31, | |
| Class B | | 2018 | | | 2017 | | | 2016 | | | 2015 | | | 2014 | |
| | | | | |
| Selected Per Share Data | | | | | | | | | | | | | | | | | | | | |
| Net asset value, beginning of period | | $ | 11.14 | | | $ | 11.24 | | | $ | 11.46 | | | $ | 11.79 | | | $ | 11.46 | |
| Income (loss) from investment operations: | | | | | | | | | | | | | | | | | | | | |
Net investment incomea | | | .24 | | | | .19 | | | | .21 | | | | .23 | | | | .25 | |
Net realized and unrealized gain (loss) | | | (.22 | ) | | | (.04 | ) | | | (.12 | ) | | | (.27 | ) | | | .31 | |
Total from investment operations | | | .02 | | | | .15 | | | | .09 | | | | (.04 | ) | | | .56 | |
| Less distributions from: | | | | | | | | | | | | | | | | | | | | |
Net investment income | | | (.26 | ) | | | (.25 | ) | | | (.31 | ) | | | (.29 | ) | | | (.23 | ) |
| Net asset value, end of period | | $ | 10.90 | | | $ | 11.14 | | | $ | 11.24 | | | $ | 11.46 | | | $ | 11.79 | |
| Total Return (%)b | | | .19 | | | | 1.31 | | | | .79 | | | | (.36 | ) | | | 4.95 | |
| | | | | |
| Ratios to Average Net Assets and Supplemental Data | | | | | | | | | | | | | | | | | | | | |
| Net assets, end of period ($ millions) | | | 2 | | | | 2 | | | | 2 | | | | 3 | | | | 3 | |
| Ratio of expenses before expense reductions (%)c | | | 1.28 | | | | 1.21 | | | | 1.21 | | | | 1.09 | | | | 1.06 | |
| Ratio of expenses after expense reductions (%)c | | | .90 | | | | .95 | | | | .93 | | | | 1.03 | | | | 1.03 | |
| Ratio of net investment income (%) | | | 2.23 | | | | 1.69 | | | | 1.88 | | | | 1.99 | | | | 2.16 | |
| Portfolio turnover rate (%) | | | 448 | | | | 588 | | | | 521 | | | | 376 | | | | 393 | |
| a | Based on average shares outstanding during the period. |
| b | Total return would have been lower had certain expenses not been reduced. |
| c | Expense ratio does not reflect charges and fees associated with the separate account that invests in the Fund or any variable life insurance policy or variable annuity contract for which the Fund is an investment option. |
The accompanying notes are an integral part of the financial statements.
| | | | |
Deutsche DWS Variable Series II — DWS Government & Agency Securities VIP | | | | | 13 |
| | |
| Notes to Financial Statements | | |
A. Organization and Significant Accounting Policies
DWS Government & Agency Securities VIP (formerly Deutsche Government & Agency Securities VIP) (the “Fund”) is a diversified series of Deutsche DWS Variable Series II (formerly Deutsche Variable Series II) (the “Trust”), which is registered under the Investment Company Act of 1940, as amended (the “1940 Act”), as an open-end management investment company organized as a Massachusetts business trust.
Multiple Classes of Shares of Beneficial Interest. The Fund offers two classes of shares (Class A shares and Class B shares). Sales of Class B shares are subject to recordkeeping fees up to 0.15% and Rule 12b-1 fees under the 1940 Act equal to an annual rate of 0.25% of the average daily net assets of the Class B shares of the Fund. Class A shares are not subject to such fees.
Investment income, realized and unrealized gains and losses, and certain fund-level expenses and expense reductions, if any, are borne pro rata on the basis of relative net assets by the holders of all classes of shares except that each class bears certain expenses unique to that class (including the applicable Rule 12b-1 fee and recordkeeping fees). Differences in class-level expenses may result in payment of different per share dividends by class. All shares have equal rights with respect to voting subject to class-specific arrangements.
The Fund’s financial statements are prepared in accordance with accounting principles generally accepted in the United States of America (“U.S. GAAP”) which require the use of management estimates. Actual results could differ from those estimates. The Fund qualifies as an investment company under Topic 946 of Accounting Standards Codification of U.S. GAAP. The policies described below are followed consistently by the Fund in the preparation of its financial statements.
In October 2018, the Securities and Exchange Commission adopted amendments to certain disclosure requirements in Securities Act Release No. 33-10532, Disclosure Update and Simplification, which is intended to facilitate the disclosure of information to investors and simplify compliance without significantly altering the total mix of information provided to investors. Effective with the current reporting period, the Fund adopted the amendments with the impacts being that the Fund is no longer required to present components of distributable earnings on the Statement of Assets and Liabilities or the sources of distributable earnings and the amount of undistributed net investment income on the Statements of Changes in Net Assets.
Security Valuation. Investments are stated at value determined as of the close of regular trading on the New York Stock Exchange on each day the exchange is open for trading.
Various inputs are used in determining the value of the Fund’s investments. These inputs are summarized in three broad levels. Level 1 includes quoted prices in active markets for identical securities. Level 2 includes other significant observable inputs (including quoted prices for similar securities, interest rates, prepayment speeds and credit risk). Level 3 includes significant unobservable inputs (including the Fund’s own assumptions in determining the fair value of investments). The level assigned to the securities valuations may not be an indication of the risk or liquidity associated with investing in those securities.
Debt securities are valued at prices supplied by independent pricing services approved by the Fund’s Board. Such services may use various pricing techniques which take into account appropriate factors such as yield, quality, coupon rate, maturity, type of issue, trading characteristics, prepayment speeds and other data, as well as broker quotes. If the pricing services are unable to provide valuations, debt securities are valued at the average of the most recent reliable bid quotations or evaluated prices, as applicable, obtained from broker-dealers. These securities are generally categorized as Level 2.
Investments in open-end investment companies are valued at their net asset value each business day and are categorized as Level 1.
Futures contracts are generally valued at the settlement prices established each day on the exchange on which they are traded and are categorized as Level 1.
Forward currency contracts are valued at the prevailing forward exchange rate of the underlying currencies and are categorized as Level 2.
Swap contracts are valued daily based upon prices supplied by a Board approved pricing vendor, if available, and otherwise are valued at the price provided by the broker-dealer. Swap contracts are generally categorized as Level 2.
| | | | | | |
| | 14 | | | | | | Deutsche DWS Variable Series II — DWS Government & Agency Securities VIP |
Securities and other assets for which market quotations are not readily available or for which the above valuation procedures are deemed not to reflect fair value are valued in a manner that is intended to reflect their fair value as determined in accordance with procedures approved by the Board and are generally categorized as Level 3. In accordance with the Fund’s valuation procedures, factors considered in determining value may include, but are not limited to, the type of the security; the size of the holding; the initial cost of the security; the existence of any contractual restrictions on the security’s disposition; the price and extent of public trading in similar securities of the issuer or of comparable companies; quotations or evaluated prices from broker-dealers and/or pricing services; information obtained from the issuer, analysts, and/or the appropriate stock exchange (for exchange-traded securities); an analysis of the company’s or issuer’s financial statements; an evaluation of the forces that influence the issuer and the market(s) in which the security is purchased and sold; and with respect to debt securities, the maturity, coupon, creditworthiness, currency denomination and the movement of the market in which the security is normally traded. The value determined under these procedures may differ from published values for the same securities.
Disclosure about the classification of fair value measurements is included in a table following the Fund’s Investment Portfolio.
Foreign Currency Translations. The books and records of the Fund are maintained in U.S. dollars. Investment securities and other assets and liabilities denominated in a foreign currency are translated into U.S. dollars at the prevailing exchange rates at period end. Purchases and sales of investment securities, income and expenses are translated into U.S. dollars at the prevailing exchange rates on the respective dates of the transactions.
Net realized and unrealized gains and losses on foreign currency transactions represent net gains and losses between trade and settlement dates on securities transactions, the acquisition and disposition of foreign currencies, and the difference between the amount of net investment income accrued and the U.S. dollar amount actually received. The portion of both realized and unrealized gains and losses on investments that results from fluctuations in foreign currency exchange rates is not separately disclosed but is included with net realized and unrealized gain/appreciation and loss/depreciation on investments.
Securities Lending. Deutsche Bank AG, as lending agent, lends securities of the Fund to certain financial institutions under the terms of its securities lending agreement. During the term of the loans, the Fund continues to receive interest and dividends generated by the securities and to participate in any changes in their market value. The Fund requires the borrowers of the securities to maintain collateral with the Fund consisting of either cash or liquid, unencumbered assets having a value at least equal to the value of the securities loaned. When the collateral falls below specified amounts, the lending agent will use its best effort to obtain additional collateral on the next business day to meet required amounts under the securities lending agreement. During the year ended December 31, 2018, the Fund invested the cash collateral into a joint trading account in affiliated money market funds, including DWS Government & Agency Securities Portfolio, managed by DWS Investment Management Americas, Inc. DWS Investment Management Americas, Inc. receives a management/administration fee (0.12% annualized effective rate as of December 31, 2018) on the cash collateral invested in DWS Government & Agency Securities Portfolio. The Fund receives compensation for lending its securities either in the form of fees or by earning interest on invested cash collateral net of borrower rebates and fees paid to a lending agent. Either the Fund or the borrower may terminate the loan at any time, and the borrower, after notice, is required to return borrowed securities within a standard time period. There may be risks of delay and costs in recovery of securities or even loss of rights in the collateral should the borrower of the securities fail financially. If the Fund is not able to recover securities lent, the Fund may sell the collateral and purchase a replacement investment in the market, incurring the risk that the value of the replacement security is greater than the value of the collateral. The Fund is also subject to all investment risks associated with the reinvestment of any cash collateral received, including, but not limited to, interest rate, credit and liquidity risk associated with such investments.
As of December 31, 2018, the Fund had no securities on loan.
Forward Commitments. The Fund may purchase or sell securities on a when-issued, delayed delivery or forward commitment basis with delivery or payment to occur at a later date beyond the normal settlement period. At the time the Fund enters into a commitment to purchase or sell a security, the transaction is recorded and the value of the transaction is reflected in the net asset value. The price of such security and the date when the security will be delivered and paid for are fixed at the time the transaction is negotiated. The Fund may sell the forward commitment security before the settlement date or enter into a new commitment to extend the delivery date into the future. The value of the security may vary with market fluctuations. At the time the Fund enters into a purchase transaction it is required to segregate cash or other
| | | | |
Deutsche DWS Variable Series II — DWS Government & Agency Securities VIP | | | | | 15 |
liquid assets at least equal to the amount of the commitment. Additionally, the Fund or the counterparty may be required to post securities and/or cash collateral in accordance with the terms of the commitment.
Certain risks may arise upon entering into when-issued, delayed delivery or forward commitment transactions from the potential inability of counterparties to meet the terms of their contracts or if the issuer does not issue the securities due to political, economic or other factors. Such transactions may also have the effect of leverage on the Fund and may cause the Fund to be more volatile. Additionally, losses may arise due to changes in the value of the underlying securities.
Federal Income Taxes. The Fund’s policy is to comply with the requirements of the Internal Revenue Code, as amended, which are applicable to regulated investment companies and to distribute all of its taxable income to its shareholders.
At December 31, 2018, the Fund had a net tax basis capital loss carryforward of approximately $431,000, which may be applied against realized net taxable capital gains indefinitely, including short-term losses ($329,000) and long-term losses ($102,000).
The Fund has reviewed the tax positions for the open tax years as of December 31, 2018 and has determined that no provision for income tax and/or uncertain tax positions is required in the Fund’s financial statements. The Fund’s federal tax returns for the prior three fiscal years remain open subject to examination by the Internal Revenue Service.
Distribution of Income and Gains. Distributions from net investment income of the Fund, if any, are declared and distributed to shareholders annually. Net realized gains from investment transactions, in excess of available capital loss carryforwards, would be taxable to the Fund if not distributed and, therefore, will be distributed to shareholders at least annually. The Fund may also make additional distributions for tax purposes if necessary.
The timing and characterization of certain income and capital gain distributions are determined annually in accordance with federal tax regulations which may differ from accounting principles generally accepted in the United States of America. These differences primarily relate to investments in futures contracts, investments in swap contracts, forward currency contracts and certain securities sold at a loss. As a result, net investment income (loss) and net realized gain (loss) on investment transactions for a reporting period may differ significantly from distributions during such period. Accordingly, the Fund may periodically make reclassifications among certain of its capital accounts without impacting the net asset value of the Fund.
At December 31, 2018, the Fund’s components of distributable earnings on a tax basis were as follows:
| | | | |
| Undistributed ordinary income* | | $ | 954,354 | |
| Capital loss carryforward | | $ | (431,000 | ) |
| Unrealized appreciation (depreciation) on investments | | $ | (173,747 | ) |
At December 31, 2018, the aggregate cost of investments for federal income tax purposes was $45,177,145. The net unrealized depreciation for all investments based on tax cost was $173,747. This consisted of aggregate gross unrealized appreciation for all investments in which there was an excess of value over tax cost of $585,685 and aggregate gross unrealized depreciation for all investments in which there was an excess of tax cost over value of $759,432.
In addition, the tax character of distributions paid by the Fund is summarized as follows:
| | | | | | | | |
| | | Years Ended December 31, | |
| | | 2018 | | | 2017 | |
| Distributions from ordinary income* | | $ | 1,085,575 | | | $ | 1,287,907 | |
| * | For tax purposes, short-term capital gain distributions are considered ordinary income distributions. |
Expenses. Expenses of the Trust arising in connection with a specific fund are allocated to that fund. Other Trust expenses which cannot be directly attributed to a fund are apportioned among the funds in the Trust based upon the relative net assets or other appropriate measures.
Contingencies. In the normal course of business, the Fund may enter into contracts with service providers that contain general indemnification clauses. The Fund’s maximum exposure under these arrangements is unknown, as this would involve future claims that may be made against the Fund that have not yet been made. However, based on experience, the Fund expects the risk of loss to be remote.
Other. Investment transactions are accounted for on a trade date plus one basis for daily net asset value calculations. However, for financial reporting purposes, investment transactions are reported on trade date. Interest income is recorded on the accrual basis. Realized gains and losses from investment transactions are recorded on an identified cost basis. All discounts and premiums are accreted/amortized for both tax and financial reporting purposes for the Fund.
| | | | | | |
| | 16 | | | | | | Deutsche DWS Variable Series II — DWS Government & Agency Securities VIP |
B. Derivative Instruments
Swaps. A swap is a contract between two parties to exchange future cash flows at periodic intervals based on the notional amount of the swap. A bilateral swap is a transaction between the Fund and a counterparty where cash flows are exchanged between the two parties. A centrally cleared swap is a transaction executed between the Fund and a counterparty, then cleared by a clearing member through a central clearinghouse. The central clearinghouse serves as the counterparty, with whom the Fund exchanges cash flows.
The value of a swap is adjusted daily, and the change in value, if any, is recorded as unrealized appreciation or depreciation in the Statement of Assets and Liabilities. Gains or losses are realized when the swap expires or is closed. Certain risks may arise when entering into swap transactions including counterparty default; liquidity; or unfavorable changes in interest rates or the value of the underlying reference security, commodity or index. In connection with bilateral swaps, securities and/or cash may be identified as collateral in accordance with the terms of the swap agreement to provide assets of value and recourse in the event of default. The maximum counterparty credit risk is the net present value of the cash flows to be received from or paid to the counterparty over the term of the swap, to the extent that this amount is beneficial to the Fund, in addition to any related collateral posted to the counterparty by the Fund. This risk may be partially reduced by a master netting arrangement between the Fund and the counterparty. Upon entering into a centrally cleared swap, the Fund is required to deposit with a financial intermediary cash or securities (“initial margin”) in an amount equal to a certain percentage of the notional amount of the swap. Subsequent payments (“variation margin”) are made or received by the Fund dependent upon the daily fluctuations in the value of the swap. In a cleared swap transaction, counterparty risk is minimized as the central clearinghouse acts as the counterparty.
An upfront payment, if any, made by the Fund is recorded as an asset in the Statement of Assets and Liabilities. An upfront payment, if any, received by the Fund is recorded as a liability in the Statement of Assets and Liabilities. Payments received or made at the end of the measurement period are recorded as realized gain or loss in the Statement of Operations.
Total Return Swap Contracts. Total return swaps involve commitments to pay interest in exchange for a market-linked return based on a notional amount. One counterparty pays out the total return of the reference security or index underlying the total return swap, and in return receives a fixed or variable rate. As a receiver, the Fund would receive payments based on any positive total return and would owe payments in the event of a negative total return. As the payer, the Fund would owe payments on any net positive total return, and would receive payments in the event of a negative total return. For the year ended December 31, 2018, the Fund entered into total return swap transactions as a means of gaining exposure to a particular asset class without investing directly in such asset class.
A summary of the open total return swap contracts as of December 31, 2018 is included in a table following the Fund’s Investment Portfolio. For the year ended December 31, 2018, the investment in total return swap contracts had a total notional amount generally indicative of a range from $348,000 to $402,000.
Interest Rate Swaps. Interest rate swaps are agreements in which the Fund agrees to pay to the counterparty a fixed rate payment in exchange for the counterparty agreeing to pay to the Fund a variable rate payment, or the Fund agrees to receive from the counterparty a fixed rate payment in exchange for the counterparty agreeing to receive from the Fund a variable rate payment. The payment obligations are based on the notional amount of the swap. For the year ended December 31, 2018, the Fund entered into interest rate swap agreements to gain exposure to different parts of the yield curve while managing overall duration and for non-hedging purposes to seek to enhance potential gains.
A summary of the open interest rate swap contracts as of December 31, 2018 is included in a table following the Fund’s Investment Portfolio. For the year ended December 31, 2018, the investment in interest rate swap contracts had a total USD equivalent notional amount generally indicative of a range from $2,700,000 to $12,898,000.
Futures Contracts. A futures contract is an agreement between a buyer or seller and an established futures exchange or its clearinghouse in which the buyer or seller agrees to take or make a delivery of a specific amount of a financial instrument at a specified price on a specific date (settlement date). For the year ended December 31, 2018, the Fund entered into interest rate futures to gain exposure to different parts of the yield curve while managing overall duration and for non-hedging purposes to seek to enhance potential gains.
Upon entering into a futures contract, the Fund is required to deposit with a financial intermediary cash or securities (“initial margin”) in an amount equal to a certain percentage of the face value indicated in the futures contract. Subsequent payments (“variation margin”) are made or received by the Fund dependent
| | | | |
Deutsche DWS Variable Series II — DWS Government & Agency Securities VIP | | | | | 17 |
upon the daily fluctuations in the value and are recorded for financial reporting purposes as unrealized gains or losses by the Fund. Gains or losses are realized when the contract expires or is closed. Since all futures contracts are exchange-traded, counterparty risk is minimized as the exchange’s clearinghouse acts as the counterparty, and guarantees the futures against default.
Certain risks may arise upon entering into futures contracts, including the risk that an illiquid market will limit the Fund’s ability to close out a futures contract prior to the settlement date and the risk that the futures contract is not well correlated with the security, index or currency to which it relates. Risk of loss may exceed amounts disclosed in the Statement of Assets and Liabilities.
A summary of the open futures contracts as of December 31, 2018, is included in a table following the Fund’s Investment Portfolio. For the year ended December 31, 2018, the investment in futures contracts purchased had a total notional value generally indicative of a range from approximately $2,509,000 to $6,293,000 and the investment in futures contracts sold had a total notional value generally indicative of a range from approximately $949,000 to $3,993,000.
Forward Foreign Currency Contracts. A forward foreign currency contract (“forward currency contract”) is a commitment to purchase or sell a foreign currency at the settlement date at a negotiated rate. For the year ended December 31, 2018, the Fund entered into forward currency contracts in order to hedge its exposure to changes in foreign currency exchange rates on its foreign currency denominated portfolio holdings and for non-hedging purposes to seek to enhance potential gains.
Forward currency contracts are valued at the prevailing forward exchange rate of the underlying currencies and unrealized gain (loss) is recorded daily. On the settlement date of the forward currency contract, the Fund records a realized gain or loss equal to the difference between the value of the contract at the time it was opened and the value of the contract at the time it was closed. Certain risks may arise upon entering into forward currency contracts from the potential inability of counterparties to meet the terms of their contracts. The maximum counterparty credit risk to the Fund is measured by the unrealized gain on appreciated contracts. Additionally, when utilizing forward currency contracts to hedge, the Fund gives up the opportunity to profit from favorable exchange rate movements during the term of the contract.
A summary of the open forward currency contracts as of December 31, 2018 is included in a table following the Fund’s Investment Portfolio. For the year ended December 31, 2018, the investment in forward currency contracts short vs. U.S. dollars had a total contract value generally indicative of a range from approximately $785,000 to $2,905,000 and the investment in forward currency contracts long vs. U.S. dollars had a total contract value generally indicative of a range from approximately $0 to $2,243,000.
The following tables summarize the value of the Fund’s derivative instruments held as of December 31, 2018 and the related location in the accompanying Statement of Assets and Liabilities, presented by primary underlying risk exposure:
| | | | | | | | | | | | | | | | |
| Asset Derivatives | | Forward
Contracts | | | Swap
Contracts | | | Futures
Contracts | | | Total | |
| Interest Rate Contracts (a) | | $ | — | | | $ | 33,432 | | | $ | 147,961 | | | $ | 181,393 | |
| Foreign Exchange Contracts (b) | | | 32,093 | | | | — | | | | — | | | | 32,093 | |
| | | $ | 32,093 | | | $ | 33,432 | | | $ | 147,961 | | | $ | 213,486 | |
Each of the above derivatives is located in the following Statement of Assets and Liabilities accounts:
| (a) | Includes cumulative appreciation of swap contracts and futures as disclosed in the Investment Portfolio. Unsettled variation margin is disclosed separately within the Statement of Assets and Liabilities. |
| (b) | Unrealized appreciation on forward foreign currency contracts |
| | | | | | | | | | | | | | | | |
| Liability Derivatives | | Forward
Contracts | | | Swap
Contracts | | | Futures
Contracts | | | Total | |
| Interest Rate Contracts (c) (d) | | $ | — | | | $ | (72,686 | ) | | $ | (31,407 | ) | | $ | (104,093 | ) |
| Foreign Exchange Contracts (e) | | | (26,789 | ) | | | — | | | | — | | | | (26,789 | ) |
| | | $ | (26,789 | ) | | $ | (72,686 | ) | | $ | (31,407 | ) | | $ | (130,882 | ) |
Each of the above derivatives is located in the following Statement of Assets and Liabilities accounts:
| (c) | Includes cumulative depreciation of swap contracts and futures as disclosed in the Investment Portfolio. Unsettled variation margin is disclosed separately within the Statement of Assets and Liabilities. |
| (d) | Unrealized depreciation on bilateral swap contracts |
| (e) | Unrealized depreciation on forward foreign currency contracts |
| | | | | | |
| | 18 | | | | | | Deutsche DWS Variable Series II — DWS Government & Agency Securities VIP |
Additionally, the amount of unrealized and realized gains and losses on derivative instruments recognized in Fund earnings during the year ended December 31, 2018 and the related location in the accompanying Statement of Operations is summarized in the following tables by primary underlying risk exposure:
| | | | | | | | | | | | | | | | |
| Realized Gain (Loss) | | Forward
Contracts | | | Swap
Contracts | | | Futures
Contracts | | | Total | |
| Interest Rate Contracts (f) | | $ | — | | | $ | 242,527 | | | $ | (109,713 | ) | | $ | 132,814 | |
| Foreign Exchange Contracts (g) | | | 50,079 | | | | — | | | | — | | | | 50,079 | |
| | | $ | 50,079 | | | $ | 242,527 | | | $ | (109,713 | ) | | $ | 182,893 | |
Each of the above derivatives is located in the following Statement of Operations accounts:
| (f) | Net realized gain (loss) on swap contracts and futures, respectively |
| (g) | Net realized gain (loss) from forward foreign currency contracts |
| | | | | | | | | | | | | | | | |
Change in Net Unrealized
Appreciation (Depreciation) | | Forward
Contracts | | | Swap
Contracts | | | Futures
Contracts | | | Total | |
| Interest Rate Contracts (h) | | $ | — | | | $ | (82,037 | ) | | $ | 82,518 | | | $ | 481 | |
| Foreign Exchange Contracts (i) | | | (18,419 | ) | | | — | | | | — | | | | (18,419 | ) |
| | | $ | (18,419 | ) | | $ | (82,037 | ) | | $ | 82,518 | | | $ | (17,938 | ) |
Each of the above derivatives is located in the following Statement of Operations accounts:
| (h) | Change in net unrealized appreciation (depreciation) from swap contracts and futures, respectively |
| (i) | Change in net unrealized appreciation (depreciation) on forward foreign currency contracts |
As of December 31, 2018, the Fund has transactions subject to enforceable master netting agreements which govern the terms of certain transactions, and reduce the counterparty risk associated with such transactions. Master netting agreements allow a Fund to close out and net total exposure to a counterparty in the event of a deterioration in the credit quality or contractual default with respect to all of the transactions with a counterparty. As defined by the master netting agreement, the Fund may have collateral agreements with certain counterparties to mitigate risk. For financial reporting purposes the Statement of Assets and Liabilities generally shows derivatives assets and liabilities on a gross basis, which reflects the full risks and exposures prior to netting. A reconciliation of the gross amounts on the Statement of Assets and Liabilities to the net amounts by a counterparty, including any collateral exposure, is included in the following tables:
| | | | | | | | | | | | | | | | |
| Counterparty | | Gross Amounts
of Assets
Presented in the
Statement of
Assets and
Liabilities | | | Financial
Instruments
and
Derivatives
Available
for Offset | | | Collateral Received | | | Net Amount of
Derivative
Assets | |
| Danske Bank AS | | $ | 32,093 | | | $ | (26,789 | ) | | $ | — | | | $ | 5,304 | |
| | | | | | | | | | | | | | | | |
| Counterparty | | Gross Amounts
of Liabilities
Presented in the
Statement of
Assets and
Liabilities | | | Financial
Instruments
and
Derivatives
Available
for Offset | | | Collateral Pledged | | | Net Amount of
Derivative
Liabilities | |
| Danske Bank AS | | $ | 26,789 | | | $ | (26,789 | ) | | $ | — | | | $ | — | |
Goldman Sachs & Co. | | | 3,136 | | | | — | | | | — | | | | 3,136 | |
| | | $ | 29,925 | | | $ | (26,789 | ) | | $ | — | | | $ | 3,136 | |
C. Purchases and Sales of Securities
During the year ended December 31, 2018, purchases and sales of investment securities, excluding short-term investments, were as follows:
| | | | | | | | |
| | | Purchases | | | Sales | |
| Non-U.S. Treasury Obligations | | $ | 206,802,074 | | | $ | 218,956,643 | |
| U.S. Treasury Obligations | | $ | 698,474 | | | $ | 1,457,089 | |
| | | | |
Deutsche DWS Variable Series II — DWS Government & Agency Securities VIP | | | | | 19 |
D. Related Parties
Management Agreement. Under the Investment Management Agreement with DWS Investment Management Americas, Inc. (formerly Deutsche Investment Management Americas Inc.) (“DIMA” or the “Advisor”), an indirect, wholly owned subsidiary of DWS Group GmbH & Co. KGaA (“DWS Group”), the Advisor directs the investments of the Fund in accordance with its investment objectives, policies and restrictions. The Advisor determines the securities, instruments and other contracts relating to investments to be purchased, sold or entered into by the Fund.
Pursuant to the Investment Management Agreement with the Advisor, the Fund pays a monthly management fee based on the Fund’s average daily net assets, computed and accrued daily and payable monthly, at the following annual rates:
| | | | |
| First $250 million | | | .450 | % |
| Next $750 million | | | .430 | % |
| Next $1.5 billion | | | .410 | % |
| Next $2.5 billion | | | .400 | % |
| Next $2.5 billion | | | .380 | % |
| Next $2.5 billion | | | .360 | % |
| Next $2.5 billion | | | .340 | % |
| Over $12.5 billion | | | .320 | % |
Accordingly, for the year ended December 31, 2018, the fee pursuant to the Investment Management Agreement was equivalent to an annual rate (exclusive of any applicable waivers/reimbursements) of 0.45% of the Fund’s average daily net assets.
For the period from January 1, 2018 through September 30, 2018, the Advisor had contractually agreed to waive all or a portion of its fees and/or reimburse certain operating expenses of the Fund to the extent necessary to maintain the total annual operating expenses (excluding certain expenses such as extraordinary expenses, taxes, brokerage and interest) of each class as follows:
| | | | |
| Class A | | | .56 | % |
| Class B | | | .91 | % |
Effective October 1, 2018 through September 30, 2019, the Advisor has contractually agreed to waive all or a portion of its fees and/or reimburse certain operating expenses of the Fund to the extent necessary to maintain the total annual operating expenses (excluding certain expenses such as extraordinary expenses, taxes, brokerage and interest) of each class as follows:
| | | | |
| Class A | | | .53 | % |
| Class B | | | .88 | % |
For the year ended December 31, 2018, fees waived and/or expenses reimbursed for each class are as follows:
| | | | |
| Class A | | $ | 142,772 | |
| Class B | | | 6,392 | |
| | | $ | 149,164 | |
Administration Fee. Pursuant to an Administrative Services Agreement, DIMA provides most administrative services to the Fund. For all services provided under the Administrative Services Agreement, the Fund pays DIMA an annual fee (“Administration Fee”) of 0.10% of the Fund’s average daily net assets, computed and accrued daily and payable monthly. For the year ended December 31, 2018, the Administration Fee was $39,274, of which $3,108 is unpaid.
Service Provider Fees. DWS Service Company (“DSC”), an affiliate of the Advisor, is the transfer agent, dividend-paying agent and shareholder service agent for the Fund. Pursuant to a sub-transfer agency agreement between DSC and DST Systems, Inc. (“DST”), DSC has delegated certain transfer agent, dividend-paying agent and shareholder service agent functions to DST. DSC compensates DST out of the
| | | | | | |
| | 20 | | | | | | Deutsche DWS Variable Series II — DWS Government & Agency Securities VIP |
shareholder servicing fee it receives from the Fund. For the year ended December 31, 2018, the amounts charged to the Fund by DSC were as follows:
| | | | | | | | |
| | | Total
Aggregated | | | Unpaid at December 31, 2018 | |
| Class A | | $ | 253 | | | $ | 41 | |
| Class B | | | 51 | | | | 9 | |
| | | $ | 304 | | | $ | 50 | |
Distribution Service Agreement. Under the Fund’s Class B 12b-1 plan, DWS Distributors, Inc. (“DDI”) received a fee (“Distribution Service Fee”) of 0.25% of average daily net assets of Class B shares. For the year ended December 31, 2018, the Distribution Service Fee aggregated $4,219, of which $342 is unpaid.
Typesetting and Filing Service Fees. Under an agreement with the Fund, DIMA is compensated for providing certain pre-press and regulatory filing services to the Fund. For the year ended December 31, 2018, the amount charged to the Fund by DIMA included in the Statement of Operations under “Reports to shareholders” aggregated $9,713, of which $7,325 is unpaid.
Trustees’ Fees and Expenses. The Fund paid retainer fees to each Trustee not affiliated with the Advisor, plus specified amounts to the Board Chairperson and to each committee Chairperson.
Affiliated Cash Management Vehicles. The Fund may invest uninvested cash balances in DWS Central Cash Management Government Fund and DWS ESG Liquidity Fund, affiliated money market funds which are managed by the Advisor. Each affiliated money market fund is managed in accordance with Rule 2a-7 under the 1940 Act, which governs the quality, maturity, diversity and liquidity of instruments in which a money market fund may invest. DWS Central Cash Management Government Fund seeks to maintain a stable net asset value, and DWS ESG Liquidity Fund maintains a floating net asset value. The Fund indirectly bears its proportionate share of the expenses of each affiliated money market fund in which it invests. DWS Central Cash Management Government Fund does not pay the Advisor an investment management fee. To the extent that DWS ESG Liquidity Fund pays an investment management fee to the Advisor, the Advisor will waive an amount of the investment management fee payable to the Advisor by the Fund equal to the amount of the investment management fee payable on the Fund’s assets invested in DWS ESG Liquidity Fund.
Security Lending Fees. Deutsche Bank AG serves as securities lending agent for the Fund. For the year ended December 31, 2018, the Fund incurred securities lending agent fees to Deutsche Bank AG in the amount of $29.
E. Ownership of the Fund
At December 31, 2018, three participating insurance companies were owners of record of 10% or more of the total outstanding Class A shares of the Fund, each owning 48%, 34% and 13%. One participating insurance company was the owner of record of 10% or more of the total outstanding Class B shares of the Fund, owning 94%.
F. Line of Credit
The Fund and other affiliated funds (the “Participants”) share in a $400 million revolving credit facility provided by a syndication of banks. The Fund may borrow for temporary or emergency purposes, including the meeting of redemption requests that otherwise might require the untimely disposition of securities. The Participants are charged an annual commitment fee which is allocated based on net assets, among each of the Participants. Interest is calculated at a rate per annum equal to the sum of the Federal Funds Rate plus 1.25 percent plus if the one-month LIBOR exceeds the Federal Funds Rate, the amount of such excess. The Fund may borrow up to a maximum of 33 percent of its net assets under the agreement. The Fund had no outstanding loans at December 31, 2018.
G. Payments by Affiliates
During the year ended December 31, 2018, the Advisor agreed to reimburse the Fund $2,209 for losses incurred on trades executed incorrectly. The amount reimbursed was less than .01% of the Fund’s average net assets, thus having no impact on the Fund’s total return.
| | | | |
Deutsche DWS Variable Series II — DWS Government & Agency Securities VIP | | | | | 21 |
Report of Independent Registered Public Accounting Firm
To the Board of Trustees of Deutsche DWS Variable Series II and Shareholders of DWS Government & Agency Securities VIP:
Opinion on the Financial Statements
We have audited the accompanying statement of assets and liabilities of DWS Government & Agency Securities VIP (formerly Deutsche Government & Agency Securities VIP) (the “Fund”) (one of the funds constituting Deutsche DWS Variable Series II (formerly Deutsche Variable Series II)) (the “Trust”), including the investment portfolio, as of December 31, 2018, and the related statement of operations for the year then ended, the statements of changes in net assets for each of the two years in the period then ended, the financial highlights for each of the five years in the period then ended and the related notes (collectively referred to as the “financial statements”). In our opinion, the financial statements present fairly, in all material respects, the financial position of the Fund (one of the funds constituting Deutsche DWS Variable Series II) at December 31, 2018, the results of its operations for the year then ended, the changes in its net assets for each of the two years in the period then ended and its financial highlights for each of the five years in the period then ended, in conformity with U.S. generally accepted accounting principles.
Basis for Opinion
These financial statements are the responsibility of the Trust’s management. Our responsibility is to express an opinion on the Fund’s financial statements based on our audits. We are a public accounting firm registered with the Public Company Accounting Oversight Board (United States) (“PCAOB”) and are required to be independent with respect to the Trust in accordance with the U.S. federal securities laws and the applicable rules and regulations of the Securities and Exchange Commission and the PCAOB.
We conducted our audits in accordance with the standards of the PCAOB. Those standards require that we plan and perform the audit to obtain reasonable assurance about whether the financial statements are free of material misstatement, whether due to error or fraud. The Trust is not required to have, nor were we engaged to perform, an audit of the Trust’s internal control over financial reporting. As part of our audits, we are required to obtain an understanding of internal control over financial reporting, but not for the purpose of expressing an opinion on the effectiveness of the Trust’s internal control over financial reporting. Accordingly, we express no such opinion.
Our audits included performing procedures to assess the risks of material misstatement of the financial statements, whether due to error or fraud, and performing procedures that respond to those risks. Such procedures included examining, on a test basis, evidence regarding the amounts and disclosures in the financial statements. Our procedures included confirmation of securities owned as of December 31, 2018, by correspondence with the custodian and brokers or by other appropriate auditing procedures where replies from brokers were not received. Our audits also included evaluating the accounting principles used and significant estimates made by management, as well as evaluating the overall presentation of the financial statements. We believe that our audits provide a reasonable basis for our opinion.

We have served as the auditor of one or more investment companies in the DWS family of funds since at least 1979, but we are unable to determine the specific year.
Boston, Massachusetts
February 14, 2019
| | | | | | |
| | 22 | | | | | | Deutsche DWS Variable Series II — DWS Government & Agency Securities VIP |
| | |
| Information About Your Fund’s Expenses | | (Unaudited) |
As an investor of the Fund, you incur two types of costs: ongoing expenses and transaction costs. Ongoing expenses include management fees, distribution and service (12b-1) fees and other Fund expenses. Examples of transaction costs include contract charges, which are not shown in this section. The following tables are intended to help you understand your ongoing expenses (in dollars) of investing in the Fund and to help you compare these expenses with the ongoing expenses of investing in other mutual funds. In the most recent six-month period, the Fund limited these expenses; had it not done so, expenses would have been higher. The example in the table is based on an investment of $1,000 invested at the beginning of thesix-month period and held for the entire period (July 1, 2018 to December 31, 2018).
The tables illustrate your Fund’s expenses in two ways:
| – | | Actual Fund Return. This helps you estimate the actual dollar amount of ongoing expenses (but not transaction costs) paid on a $1,000 investment in the Fund using the Fund’s actual return during the period. To estimate the expenses you paid over the period, simply divide your account value by $1,000 (for example, an $8,600 account value divided by $1,000 = 8.6), then multiply the result by the number in the “Expenses Paid per $1,000” line under the share class you hold. |
| – | | Hypothetical 5% Fund Return. This helps you to compare your Fund’s ongoing expenses (but not transaction costs) with those of other mutual funds using the Fund’s actual expense ratio and a hypothetical rate of return of 5% per year before expenses. Examples using a 5% hypothetical Fund return may be found in the shareholder reports of other mutual funds. The hypothetical account values and expenses may not be used to estimate the actual ending account balance or expenses you paid for the period. |
Please note that the expenses shown in these tables are meant to highlight your ongoing expenses only and do not reflect any transaction costs. The “Expenses Paid per $1,000” line of the tables is useful in comparing ongoing expenses only and will not help you determine the relative total expense of owning different funds. If these transaction costs had been included, your costs would have been higher.
| | | | | | | | |
| Expenses and Value of a $1,000 Investment for the six months ended December 31, 2018 | | | | |
| | |
| Actual Fund Return | | Class A | | | Class B | |
| Beginning Account Value 7/1/18 | | $ | 1,000.00 | | | $ | 1,000.00 | |
| Ending Account Value 12/31/18 | | $ | 1,013.00 | | | $ | 1,011.10 | |
| Expenses Paid per $1,000* | | $ | 2.79 | | | $ | 4.51 | |
| | |
| Hypothetical 5% Fund Return | | Class A | | | Class B | |
| Beginning Account Value 7/1/18 | | $ | 1,000.00 | | | $ | 1,000.00 | |
| Ending Account Value 12/31/18 | | $ | 1,022.43 | | | $ | 1,020.72 | |
| Expenses Paid per $1,000* | | $ | 2.80 | | | $ | 4.53 | |
| * | Expenses are equal to the Fund’s annualized expense ratio for each share class, multiplied by the average account value over the period, multiplied by 184 (the number of days in the most recent six-month period), then divided by 365. |
| | | | | | | | |
| Annualized Expense Ratios | | Class A | | | Class B | |
| Deutsche DWS Variable Series II — DWS Government & Agency Securities VIP | | | .55 | % | | | .89 | % |
For more information, please refer to the Fund’s prospectus.
These tables do not reflect charges and fees (“contract charges”) associated with the separate account that invests in the Fund or any variable life insurance policy or variable annuity contract for which the Fund is an investment option.
For an analysis of the fees associated with an investment in the Fund or similar funds, please refer to the current and hypothetical expense calculators for Variable Insurance Products which can be found at dws.com/calculators.
| | | | |
Deutsche DWS Variable Series II — DWS Government & Agency Securities VIP | | | | | 23 |
| | |
| Tax Information | | (Unaudited) |
Please consult a tax advisor if you have questions about federal or state income tax laws, or on how to prepare your tax returns. If you have specific questions about your account, please contact your insurance provider.
Proxy Voting
The Trust’s policies and procedures for voting proxies for portfolio securities and information about how the Trust voted proxies related to its portfolio securities during the most recent 12-month period ended June 30 are available on our Web site — dws.com/en-us/resources/proxy-voting — or on the SEC’s Web site — sec.gov. To obtain a written copy of the Trust’s policies and procedures without charge, upon request, call us toll free at(800) 728-3337.
| | | | | | |
| | 24 | | | | | | Deutsche DWS Variable Series II — DWS Government & Agency Securities VIP |
Advisory Agreement Board Considerations and Fee Evaluation
The Board of Trustees (hereinafter referred to as the “Board” or “Trustees”) approved the renewal of DWS Government & Agency Securities VIP’s (the “Fund”) investment management agreement (the “Agreement”) with DWS Investment Management Americas, Inc. (“DIMA”) in September 2018.
In terms of the process that the Board followed prior to approving the Agreement, shareholders should know that:
| – | | During the entire process, all of the Fund’s Trustees were independent of DIMA and its affiliates (the “Independent Trustees”). |
| – | | The Board met frequently during the past year to discuss fund matters and dedicated a substantial amount of time to contract review matters. Over the course of several months, the Board’s Contract Committee reviewed extensive materials received from DIMA, independent third parties and independent counsel. These materials included an analysis of the Fund’s performance, fees and expenses, and profitability from a fee consultant retained by the Fund’s Independent Trustees (the “Fee Consultant”). Based on its evaluation of the information provided, the Contract Committee presented its findings and recommendations to the Board. The Board then reviewed the Contract Committee’s findings and recommendations. |
| – | | The Board also received extensive information throughout the year regarding performance of the Fund. |
| – | | The Independent Trustees regularly met privately with counsel to discuss contract review and other matters. In addition, the Independent Trustees were advised by the Fee Consultant in the course of their review of the Fund’s contractual arrangements and considered a comprehensive report prepared by the Fee Consultant in connection with their deliberations. |
| – | | In connection with reviewing the Agreement, the Board also reviewed the terms of the Fund’s Rule 12b-1 plan, distribution agreement, administrative services agreement, transfer agency agreement and other material service agreements. |
In connection with the contract review process, the Contract Committee and the Board considered the factors discussed below, among others. The Board also considered that DIMA and its predecessors have managed the Fund since its inception, and the Board believes that a long-term relationship with a capable, conscientious advisor is in the best interests of the Fund. The Board considered, generally, that shareholders chose to invest or remain invested in the Fund knowing that DIMA managed the Fund. DIMA is part of DWS Group GmbH & Co. KGaA (“DWS Group”). DWS Group is a global asset management business that offers a wide range of investing expertise and resources, including research capabilities in many countries throughout the world. In 2018, approximately 20% of DWS Group’s shares were sold in an initial public offering, with Deutsche Bank AG owning the remaining shares.
As part of the contract review process, the Board carefully considered the fees and expenses of each DWS fund overseen by the Board in light of the fund’s performance. In many cases, this led to the negotiation and implementation of expense caps. As part of these negotiations, the Board indicated that it would consider relaxing these caps in future years following sustained improvements in performance, among other considerations.
While shareholders may focus primarily on fund performance and fees, the Fund’s Board considers these and many other factors, including the quality and integrity of DIMA’s personnel and administrative support services provided by DIMA, such as back-office operations, fund valuations, and compliance policies and procedures.
Nature, Quality and Extent of Services.The Board considered the terms of the Agreement, including the scope of advisory services provided under the Agreement. The Board noted that, under the Agreement, DIMA provides portfolio management services to the Fund and that, pursuant to a separate administrative services agreement, DIMA provides administrative services to the Fund. The Board considered the experience and skills of senior management and investment personnel and the resources made available to such personnel. The Board reviewed the Fund’s performance over short-term and long-term periods and compared those returns to various agreed-upon performance measures, including market index(es) and a peer universe compiled using information supplied by Morningstar Direct (“Morningstar”), an independent fund data service. The Board also noted that it has put into place a process of identifying “Funds in Review” (e.g., funds performing poorly relative to a peer universe), and receives additional reporting from DIMA regarding such funds and, where appropriate, DIMA’s plans to address underperformance. The Board
| | | | |
Deutsche DWS Variable Series II — DWS Government & Agency Securities VIP | | | | | 25 |
believes this process is an effective manner of identifying and addressing underperforming funds. Based on the information provided, the Board noted that, for the one-, three- and five-year periods ended December 31, 2017, the Fund’s performance (Class A shares) was in the 4th quartile, 4th quartile and 3rd quartile, respectively, of the applicable Morningstar universe (the 1st quartile being the best performers and the 4th quartile being the worst performers). The Board also observed that the Fund has underperformed its benchmark in the one-, three- and five-year periods ended December 31, 2017. The Board noted the disappointing investment performance of the Fund in recent periods and continued to discuss with senior management of DIMA the factors contributing to such underperformance and actions being taken to improve performance. The Board observed that the Fund had experienced improved relative performance during the first eight months of 2018. The Board recognized the efforts by DIMA in recent years to enhance its investment platform and improve long-term performance across the DWS fund complex.
Fees and Expenses. The Board considered the Fund’s investment management fee schedule, operating expenses and total expense ratios, and comparative information provided by Broadridge Financial Solutions, Inc. (“Broadridge”) and the Fee Consultant regarding investment management fee rates paid to other investment advisors by similar funds (1st quartile being the most favorable and 4th quartile being the least favorable). With respect to management fees paid to other investment advisors by similar funds, the Board noted that the contractual fee rates paid by the Fund, which include a 0.10% fee paid to DIMA under the Fund’s administrative services agreement, were higher than the median (3rd quartile) of the applicable Broadridge peer group (based on Broadridge data provided as of December 31, 2017). The Board noted that the Fund’s Class A shares total (net) operating expenses were expected to be lower than the median (2nd quartile) of the applicable Broadridge expense universe (based on Broadridge data provided as of December 31, 2017, and analyzing Broadridge expense universe Class A (net) expenses less any applicable 12b-1 fees) (“Broadridge Universe Expenses”). The Board also reviewed data comparing each share class’s total (net) operating expenses to the applicable Broadridge Universe Expenses. The Board noted that the expense limitations agreed to by DIMA were expected to help the Fund’s total (net) operating expenses remain competitive. The Board considered the Fund’s management fee rate as compared to fees charged by DIMA to comparable DWS U.S. registered funds (“DWS Funds”), noting that DIMA indicated that it does not provide services to any other comparable DWS Funds. The information requested by the Board as part of its review of fees and expenses also included information about institutional accounts (including any sub-advised funds and accounts) and funds offered primarily to European investors (“DWS Europe Funds”) managed by DWS Group. The Board noted that DIMA indicated that DWS Group does not manage any institutional accounts or DWS Europe Funds comparable to the Fund.
On the basis of the information provided, the Board concluded that management fees were reasonable and appropriate in light of the nature, quality and extent of services provided by DIMA.
Profitability. The Board reviewed detailed information regarding revenues received by DIMA under the Agreement. The Board considered the estimated costs to DIMA, and pre-tax profits realized by DIMA, from advising the DWS Funds, as well as estimates of the pre-tax profits attributable to managing the Fund in particular. The Board also received information regarding the estimated enterprise-wide profitability of DIMA and its affiliates with respect to all fund services in totality and by fund. The Board and the Fee Consultant reviewed DIMA’s methodology in allocating its costs to the management of the Fund. Based on the information provided, the Board concluded that the pre-tax profits realized by DIMA in connection with the management of the Fund were not unreasonable. The Board also reviewed certain publicly available information regarding the profitability of certain similar investment management firms. The Board noted that, while information regarding the profitability of such firms is limited (and in some cases is not necessarily prepared on a comparable basis), DIMA and its affiliates’ overall profitability with respect to the DWS Funds (after taking into account distribution and other services provided to the funds by DIMA and its affiliates) was lower than the overall profitability levels of most comparable firms for which such data was available.
Economies of Scale. The Board considered whether there are economies of scale with respect to the management of the Fund and whether the Fund benefits from any economies of scale. The Board noted that the Fund’s investment management fee schedule includes fee breakpoints. The Board concluded that the Fund’s fee schedule represents an appropriate sharing between the Fund and DIMA of such economies of scale as may exist in the management of the Fund at current asset levels.
Other Benefits to DIMA and Its Affiliates. The Board also considered the character and amount of other incidental or “fall-out” benefits received by DIMA and its affiliates, including any fees received by DIMA for administrative services provided to the Fund, any fees received by an affiliate of DIMA for transfer agency services provided to the Fund and any fees received by an affiliate of DIMA for distribution services. The
| | | | | | |
| | 26 | | | | | | Deutsche DWS Variable Series II — DWS Government & Agency Securities VIP |
Board also considered benefits to DIMA related to brokerage and soft-dollar allocations, including allocating brokerage to pay for research generated by parties other than the executing broker dealers, which pertain primarily to funds investing in equity securities. In addition, the Board considered the incidental public relations benefits to DIMA related to DWS Funds advertising and cross-selling opportunities among DIMA products and services. The Board considered these benefits in reaching its conclusion that the Fund’s management fees were reasonable.
Compliance. The Board considered the significant attention and resources dedicated by DIMA to its compliance processes in recent years. The Board noted in particular (i) the experience, seniority and time commitment of the individuals serving as DIMA’s and the Fund’s chief compliance officers and (ii) the substantial commitment of resources by DIMA and its affiliates to compliance matters, including the retention of compliance personnel.
Based on all of the information considered and the conclusions reached, the Board unanimously determined that the continuation of the Agreement is in the best interests of the Fund. In making this determination, the Board did not give particular weight to any single factor identified above. The Board considered these factors over the course of numerous meetings, certain of which were in executive session with only the Independent Trustees and counsel present. It is possible that individual Independent Trustees may have weighed these factors differently in reaching their individual decisions to approve the continuation of the Agreement.
| | | | |
Deutsche DWS Variable Series II — DWS Government & Agency Securities VIP | | | | | 27 |
Board Members and Officers
The following table presents certain information regarding the Board Members and Officers of the Fund. Each Board Member’s year of birth is set forth in parentheses after his or her name. Unless otherwise noted, (i) each Board Member has engaged in the principal occupation(s) noted in the table for at least the most recent five years, although not necessarily in the same capacity; and (ii) the address of each Independent Board Member is c/o Keith R. Fox, DWS Funds Board Chair, c/o Thomas R. Hiller, Ropes & Gray LLP, Prudential Tower, 800 Boylston Street, Boston, MA02199-3600. Except as otherwise noted below, the term of office for each Board Member is until the election and qualification of a successor, or until such Board Member sooner dies, resigns, is removed or as otherwise provided in the governing documents of the Fund. Because the Fund does not hold an annual meeting of shareholders, each Board Member will hold office for an indeterminate period. The Board Members may also serve in similar capacities with other funds in the fund complex.
| | | | | | | | |
| Independent Board Members | | | | | | |
Name, Year of Birth,
Position with the Fund and
Length of Time Served1 | | Business Experience and Directorships During the Past Five Years | | Number of
Funds in
DWS Fund
Complex
Overseen | | | Other
Directorships
Held by Board
Member
|
Keith R. Fox, CFA (1954) Chairperson since 2017, and Board Member since 1996 | | Managing General Partner, Exeter Capital Partners (a series of private investment funds) (since 1986). Directorships: Progressive International Corporation (kitchen goods importer and distributor); The Kennel Shop (retailer); former Chairman, National Association of Small Business Investment Companies; former Directorships: BoxTop Media Inc. (advertising); Sun Capital Advisers Trust (mutual funds) (2011–2012) | | | 82 | | | — |
John W. Ballantine (1946) Board Member since 1999 | | Retired; formerly, Executive Vice President and Chief Risk Management Officer, First Chicago NBD Corporation/The First National Bank of Chicago (1996–1998); Executive Vice President and Head of International Banking (1995–1996); former Directorships: Director and former Chairman of the Board, Healthways, Inc.2 (population well-being and wellness services) (2003–2014); Stockwell Capital Investments PLC (private equity); Enron Corporation; FNB Corporation; Tokheim Corporation; First Oak Brook Bancshares, Inc. and Oak Brook Bank; Prisma Energy International; Public Radio International. Not-for-Profit Director, Trustee: Palm Beach Civic Association; Window to the World Communications (public media); Harris Theater for Music and Dance (Chicago); Life Director of Hubbard Street Dance Chicago | | | 82 | | | Portland
General
Electric2
(utility
company)
(2003–
present) |
Henry P. Becton, Jr. (1943) Board Member since 1990 | | Vice Chair and former President, WGBH Educational Foundation. Directorships: Public Radio International; Public Radio Exchange (PRX); The Pew Charitable Trusts (charitable organization); Massachusetts Humane Society; Overseer of the New England Conservatory; former Directorships: Becton Dickinson and Company2 (medical technology company); Belo Corporation2 (media company); The PBS Foundation; Association of Public Television Stations; Boston Museum of Science; American Public Television; Concord Academy; New England Aquarium; Mass. Corporation for Educational Telecommunications; Committee for Economic Development; Public Broadcasting Service; Connecticut College; North Bennett Street School (Boston); American Documentary, Inc. (public media) | | | 82 | | | — |
Dawn-Marie Driscoll (1946) Board Member since 1987 | | Emeritus Executive Fellow, Center for Business Ethics, Bentley University; formerly: President, Driscoll Associates (consulting firm); Partner, Palmer & Dodge (law firm) (1988–1990); Vice President of Corporate Affairs and General Counsel, Filene’s (retail) (1978–1988). Directorships: Advisory Board, Center for Business Ethics, Bentley University; Trustee and former Chairman of the Board, Southwest Florida Community Foundation (charitable organization); former Directorships: ICI Mutual Insurance Company (2007–2015); Sun Capital Advisers Trust (mutual funds) (2007–2012), Investment Company Institute (audit, executive, nominating committees) and Independent Directors Council (governance, executive committees) | | | 82 | | | — |
Paul K. Freeman* (1950) Board Member since 1993 | | Consultant, WorldBank/Inter-American Development Bank; Independent Directors Council (former chair); Investment Company Institute (executive committee); Adjunct Professor, University of Denver Law School (2017–present); formerly: Chairman of Education Committee of Independent Directors Council; Project Leader, International Institute for Applied Systems Analysis (1998–2001); Chief Executive Officer, The Eric Group, Inc. (environmental insurance) (1986–1998); Directorships: Knoebel Institute for Healthy Aging, University of Denver (2017–present); former Directorships: Prisma Energy International; Denver Zoo Foundation (2012–2018) | | | 82 | | | — |
| | | | | | |
| | 28 | | | | | | Deutsche DWS Variable Series II — DWS Government & Agency Securities VIP |
| | | | | | | | |
Name, Year of Birth,
Position with the Fund and
Length of Time Served1 | | Business Experience and Directorships During the Past Five Years | | Number of
Funds in
DWS Fund
Complex
Overseen | | | Other
Directorships
Held by Board
Member
|
Richard J. Herring (1946) Board Member since 1990 | | Jacob Safra Professor of International Banking and Professor of Finance, The Wharton School, University of Pennsylvania (since July 1972); Director, The Wharton Financial Institutions Center (since 1994); formerly: Vice Dean and Director, Wharton Undergraduate Division (1995–2000) and Director, The Lauder Institute of International Management Studies (2000–2006); Member FDIC Systemic Risk Advisory Committee since 2011, member Systemic Risk Council since 2012 and member of the Advisory Board at the Yale Program on Financial Stability since 2013; Formerly Co-Chair of the Shadow Financial Regulatory Committee (2003–2015), Executive Director of The Financial Economists Roundtable (2008–2015), Director of The Thai Capital Fund (2007–2013), Director of The Aberdeen Singapore Fund (2007–2018), and Nonexecutive Director of Barclays Bank DE (2010–2018) | | | 82 | | | Director,
Aberdeen
Japan Fund
(since 2007) |
William McClayton (1944) Board Member since 2004 | | Private equity investor (since October 2009); previously, Managing Director, Diamond Management & Technology Consultants, Inc. (global consulting firm) (2001–2009); Directorship: Board of Managers, YMCA of Metropolitan Chicago; formerly: Senior Partner, Arthur Andersen LLP (accounting) (1966–2001); Trustee, Ravinia Festival | | | 82 | | | — |
Rebecca W. Rimel (1951) Board Member since 1995 | | President, Chief Executive Officer and Director, The Pew Charitable Trusts (charitable organization) (1994–present); formerly: Executive Vice President, The Glenmede Trust Company (investment trust and wealth management) (1983–2004); Board Member, Investor Education (charitable organization) (2004–2005); Trustee, Executive Committee, Philadelphia Chamber of Commerce (2001–2007); Director, Viasys Health Care2 (January 2007–June 2007); Trustee, Thomas Jefferson Foundation (charitable organization) (1994–2012) | | | 82 | | | Director,
Becton
Dickinson
and
Company2
(medical
technology
company)
(2012–
present);
Director,
BioTelemetry
Inc.2(health
care) (2009–
present) |
William N. Searcy, Jr. (1946) Board Member since 1993 | | Private investor since October 2003; formerly: Pension & Savings Trust Officer, Sprint Corporation2(telecommunications) (November 1989–September 2003); Trustee, Sun Capital Advisers Trust (mutual funds) (1998–2012) | | | 82 | | | — |
Jean Gleason Stromberg (1943) Board Member since 1997 | | Retired. Formerly, Consultant (1997–2001); Director, Financial Markets U.S. Government Accountability Office (1996–1997); Partner, Norton Rose Fulbright, L.L.P. (law firm) (1978–1996); former Directorships: The William and Flora Hewlett Foundation (charitable organization) (2000–2015); Service Source, Inc. (nonprofit), Mutual Fund Directors Forum (2002–2004), American Bar Retirement Association (funding vehicle for retirement plans) (1987–1990 and 1994–1996) | | | 82 | | | — |
| | |
| Officers4 | | |
Name, Year of Birth, Position with the Fund and Length of Time Served5 | | Business Experience and Directorships During the Past Five Years |
Hepsen Uzcan6 (1974) President and Chief Executive Officer, 2017–present Assistant Secretary, 2013–present | | Managing Director,3 DWS; Secretary, DWS USA Corporation (since March 2018); Assistant Secretary, DWS Distributors, Inc. (since June 25, 2018); Director and Vice President, DWS Service Company (since June 25, 2018); Assistant Secretary, DWS Investment Management Americas, Inc. (since June 25, 2018); and Director and President, DB Investment Managers, Inc. (since June 25, 2018); formerly: Vice President for the Deutsche funds (2016–2017) |
John Millette8(1962) Vice President and Secretary, 1999–present | | Director,3DWS; Chief Legal Officer, DWS Investment Management Americas, Inc. (2015–present); and Director and Vice President, DWS Trust Company (2016–present); formerly: Secretary, Deutsche Investment Management Americas Inc. (2015–2017) |
Diane Kenneally8,9 (1966) Treasurer and Chief Financial Officer since 2018 | | Director,3 DWS; formerly: Assistant Treasurer for the DWS funds (2007–2018) |
Caroline Pearson8(1962) Chief Legal Officer, 2010–present | | Managing Director,3DWS; formerly: Secretary, Deutsche AM Distributors, Inc. (2002–2017); and Secretary, Deutsche AM Service Company (2010–2017) |
| | | | |
Deutsche DWS Variable Series II — DWS Government & Agency Securities VIP | | | | | 29 |
| | |
Name, Year of Birth, Position with the Fund and Length of Time Served5 | | Business Experience and Directorships During the Past Five Years |
Scott D. Hogan8(1970) Chief Compliance Officer, 2016–present | | Director,3DWS |
Wayne Salit7(1967) Anti-Money Laundering Compliance Officer, 2014–present | | Director,3 Deutsche Bank; and AML Officer, DWS Trust Company; formerly: Managing Director, AML Compliance Officer at BNY Mellon (2011–2014); and Director, AML Compliance Officer at Deutsche Bank (2004–2011) |
Sheila Cadogan8(1966) Assistant Treasurer, 2017–present | | Director,3DWS; Director and Vice President, DWS Trust Company (since 2018) |
Paul Antosca8(1957) Assistant Treasurer, 2007–present | | Director,3DWS |
| 1 | The length of time served represents the year in which the Board Member joined the board of one or more DWS funds currently overseen by the Board. |
| 2 | A publicly held company with securities registered pursuant to Section 12 of the Securities Exchange Act of 1934. |
| 3 | Executive title, not a board directorship. |
| 4 | As a result of their respective positions held with the Advisor or its affiliates, these individuals are considered “interested persons” of the Advisor within the meaning of the 1940 Act. Interested persons receive no compensation from the Fund. |
| 5 | The length of time served represents the year in which the officer was first elected in such capacity for one or more DWS funds. |
| 6 | Address: 345 Park Avenue, New York, NY 10154. |
| 7 | Address: 60 Wall Street, New York, NY 10005. |
| 8 | Address: One International Place, Boston, MA 02110. |
| 9 | Appointed Treasurer and Chief Financial Officer effective July 2, 2018. |
| * | Paul K. Freeman retired from the Board effective December 31, 2018. |
The Fund’s Statement of Additional Information (“SAI”) includes additional information about the Board Members. The SAI is available, without charge, upon request. If you would like to request a copy of the SAI, you may do so by calling the followingtoll-free number:(800) 728-3337.
| | | | | | |
| | 30 | | | | | | Deutsche DWS Variable Series II — DWS Government & Agency Securities VIP |
Notes
| | |
| | |
VS2GAS-2 (R-025831-8 2/19) | | |
December 31, 2018
Annual Report
Deutsche DWS Variable Series II
(formerly Deutsche Variable Series II)
DWS Government Money Market VIP
(formerly Deutsche Government Money Market VIP)
Beginning on January 1, 2021, as permitted by regulations adopted by the Securities and Exchange Commission, you may not be receiving paper copies of the Fund’s shareholder reports from the insurance company that offers your contract unless you specifically request paper copies from your insurance company or from your financial intermediary. Instead, the shareholder reports will be made available on a Web site, and your insurance company will notify you by mail each time a report is posted and provide you with a Web site link to access the report. Instructions for requesting paper copies will be provided by your insurance company.
If you already elected to receive shareholder reports electronically, you will not be affected by this change and you need not take any action. You may elect to receive shareholder reports and other communications from your insurance company electronically by following the instructions provided by your insurance company.
You may elect to receive all future reports in paper free of charge from your insurance company. If your insurance company informs you that future reports will be delivered via Web access, you can inform your insurance company that you wish to continue receiving paper copies of your shareholder reports by following the instructions provided by your insurance company.

Contents
This report must be preceded or accompanied by a prospectus. To obtain an additional prospectus or summary prospectus, if available, call (800)728-3337 or your financial representative. We advise you to consider the Fund’s objectives, risks, charges and expenses carefully before investing. The summary prospectus and prospectus contain this and other important information about the Fund. Please read the prospectus carefully before you invest.
You could lose money by investing in the Fund. Although the Fund seeks to preserve the value of your investment at $1.00 per share, it cannot guarantee it will do so. An investment in the Fund is not insured or guaranteed by the Federal Deposit Insurance Corporation or any other government agency. The Fund’s sponsor has no legal obligation to provide financial support to the Fund, and you should not expect that the sponsor will provide financial support to the Fund at any time.You should not rely on or expect the Advisor to enter into support agreements or take other actions to maintain the Fund’s $1.00 share price. The credit quality of the Fund’s holdings can change rapidly in certain markets, and the default of a single holding could have an adverse impact on the Fund’s share price. The Fund’s share price can also be negatively affected during periods of high redemption pressures and/or illiquid markets. The actions of a few large investors in the Fund may have a significant adverse effect on the share price of the Fund. Please read the prospectus for specific details regarding the Fund’s risk profile.
The brand DWS represents DWS Group GmbH & Co. KGaA and any of its subsidiaries such as DWS Distributors, Inc. which offers investment products or DWS Investment Management Americas, Inc. and RREEF America L.L.C. which offer advisory services.
DWS Distributors, Inc., 222 South Riverside Plaza, Chicago, IL 60606, (800)621-1148
NOT FDIC/NCUA INSURED NO BANK GUARANTEE MAY LOSE VALUE NOT A DEPOSIT
NOT INSURED BY ANY FEDERAL GOVERNMENT AGENCY
| | | | | | |
| | 2 | | | | | | Deutsche DWS Variable Series II — DWS Government Money Market VIP |
| | |
| Performance Summary | | December 31, 2018 (Unaudited) |
All performance shown is historical, assumes reinvestment of all dividend and capital gain distributions and does not guarantee future results. Investment return and principal value fluctuate with changing market conditions so that, when redeemed, shares may be worth more or less than their original cost. Current performance may be lower or higher than the performance data quoted. Please contact your participating insurance company for the Fund’s most recentmonth-end performance. Performance does not reflect charges and fees (“contract charges”) associated with the separate account that invests in the Fund or any variable life insurance policy or variable annuity contract for which the Fund is an investment option. These charges and fees will reduce returns. The yield quotation more closely reflects the current earnings of the Fund than the total return quotation.
You could lose money by investing in the Fund. Although the Fund seeks to preserve the value of your investment at $1.00 per share, it cannot guarantee it will do so. An investment in the Fund is not insured or guaranteed by the Federal Deposit Insurance Corporation or any other government agency. The Fund’s sponsor has no legal obligation to provide financial support to the Fund, and you should not expect that the sponsor will provide financial support to the Fund at any time.
| | |
| |
| | | 7-Day Current Yield |
| December 31, 2018 | | 2.01%* |
| December 31, 2017 | | .83% |
| * | The investment advisor has agreed to waive fees/reimburse expenses. Without such fee waivers/expense reimbursements, the7-day current yield would have been lower. |
Yields are historical, will fluctuate and do not guarantee future performance. The7-day current yield refers to the income paid by the Fund over a7-day period expressed as an annual percentage rate of the Fund’s shares outstanding.
| | | | |
Deutsche DWS Variable Series II — DWS Government Money Market VIP | | | | | 3 |
| | |
Management Summary | | December 31, 2018 (Unaudited) |
During the 12-month period ended December 31, 2018, the Fund provided a total return of 1.39% (Class A shares, unadjusted for contract charges). All performance is historical and does not guarantee future results. Yields fluctuate and are not guaranteed.
At the start of 2018, yields for longer-term money market securities rose based on the prospects for increased Treasury supply following the rise in the debt ceiling and the passage of federal tax overhaul in December 2017. Significant increases in supply did materialize, with the U.S. Treasury issuing more than $352 billion in Treasury bills during the first quarter. In light of continued strength in the economy and a tight labor market, the Federal Open Market Committee (FOMC) raised short-term rates at its March and June 2018 meetings. In September, the Fed once again raised rates, with accompanying statements that were viewed as aggressive regarding the prospects for future rate hikes. In December, a number of factors contributed to a considerable increase in financial market volatility and a tightening in overall financial conditions. These factors included statements by the Fed following its December 2018 rate hike. The Fed’s accompanying messaging disappointed market watchers because the central bank did not commit to a pause in its rate hikes, despite signs that growth was slowing in some parts of the global economy. This coincided with a major correction in the stock markets, an inverted yield curve (often a predictor of economic recession), a widening of credit spreads and signs of an expanding trade war with China. At the same time, U.S. economic growth indicators remained strong, with extremely low unemployment, and investors found some consolation in the fact that the Fed reduced its forecast for rate hikes in 2019 from three to two.
We were able to maintain what we believe to be a competitive yield for the Fund during the annual period ended December 31, 2018. The Fund held a large percentage of portfolio assets in agency and Treasury floating-rate securities to take advantage of incremental rises in LIBOR and Treasury bill rates, respectively, given the outlook for additional Treasury bill supply. At the same time, the Fund invested in overnight agency repurchase agreements for liquidity and looked for yield opportunities from three- to six-month agency and Treasury securities.
We believe that the U.S. economy can continue to expand, though we see more risks to growth than we did 12 months ago. For this reason, our current forecast is for just one to two short-term rate increases by the Fed in 2019. At present, we are positioning the Fund for continued growth as well as the possibility of additional rate hikes. We also look for increased Treasury bill supply, which should continue to exert upward pressure on money market rates.
A group of investment professionals is responsible for the day-to-day management of the Fund. These investment professionals have a broad range of experience managing money market funds.
The views expressed reflect those of the portfolio management team only through the end of the period of the report as stated on the cover. The management team’s views are subject to change at any time based on market and other conditions and should not be construed as a recommendation. Past performance is no guarantee of future results. Current and future portfolio holdings are subject to risk.
| | | | | | |
| | 4 | | | | | | Deutsche DWS Variable Series II — DWS Government Money Market VIP |
Terms to Know
Theyield curveis a graphical representation of how yields on bonds of different maturities compare. Normally, yield curves slant up, as bonds with longer maturities typically offer higher yields than short-term bonds.
Floating-rate securitiesare debt instruments with floating-rate coupons that generally reset every 30 to 90 days. While floating-rate securities are senior to equity and fixed-income securities, there is no guaranteed return of principal in case of default. Floating-rate issues often have less interest-rate risk than other fixed-income investments. Floating-rate securities are most often secured assets, generally senior to a company’s secured debt, and can be transferred to debt holders, resulting in potential downside risk.
LIBOR, or the London Interbank Offered Rate, is a widely used benchmark for short-term taxable interest rates.
Arepurchase agreement, or “overnight repo,” is an agreement between a seller and a buyer, usually of government securities, where the seller agrees to repurchase the securities at a given price and usually at a stated time. Repos are widely used money market instruments that serve as an interest-bearing, short-term “parking place” for large sums of money.
| | | | |
Deutsche DWS Variable Series II — DWS Government Money Market VIP | | | | | 5 |
| | |
| Portfolio Summary | | (Unaudited) |
| | | | | | | | |
| Asset Allocation (As a % of Investment Portfolio) | | 12/31/18 | | | 12/31/17 | |
| Government & Agency Obligations | | | 62% | | | | 76% | |
| Repurchase Agreement | | | 38% | | | | 24% | |
| | | | 100% | | | | 100% | |
| | |
| Weighted Average Maturity | | 12/31/18 | | | 12/31/17 | |
| Deutsche DWS Variable Series II — DWS Government Money Market VIP | | | 25 days | | | | 26 days | |
| Government & Agency Retail Money Fund Average* | | | 28 days | | | | 30 days | |
| * | The Fund is compared to its respective iMoneyNet Category: Government & Agency Retail Money Fund Average — Category includes the most broadly based of the government retail funds. These funds may invest in U.S. Treasury securities, securities issued or guaranteed by the U.S. Government or its agencies or instrumentalities. |
Weighted average maturity, also known as effective maturity, is the weighted average of the maturity date of bonds held by the Fund taking into consideration any available maturity shortening features.
Portfolio holdings and characteristics are subject to change.
For more complete details about the Fund’s investment portfolio, see page 7.
Following the Fund’s fiscal first and thirdquarter-end, a complete portfolio holdings listing is filed with the SEC on FormN-Q. In addition, each month, information about the Fund and its portfolio holdings is filed with the SEC on FormN-MFP. The SEC delays the public availability of the information filed on FormN-MFP for 60 days after the end of the reporting period included in the filing. These forms will be available on the SEC’s Web site at sec.gov. The Fund’s portfolio holdings are also posted on dws.com from time to time. Please see the Fund’s current prospectus for more information.
| | | | | | |
| | 6 | | | | | | Deutsche DWS Variable Series II — DWS Government Money Market VIP |
| | |
| Investment Portfolio | | December 31, 2018 |
| | | | | | | | |
| | | Principal
Amount ($) | | | Value ($) | |
| Government & Agency Obligations 61.7% | |
| U.S. Government Sponsored Agencies 47.0% | |
|
Federal Farm Credit Bank: | |
| | |
1-month LIBOR minus 0.135%, 2.265%*, 4/11/2019 | | | 500,000 | | | | 500,000 | |
| | |
1-month LIBOR minus 0.075%, 2.304%*, 11/5/2019 | | | 1,000,000 | | | | 999,914 | |
| | |
1-month LIBOR minus 0.123%, 2.309%*, 8/13/2019 | | | 1,000,000 | | | | 1,000,000 | |
| | |
1-month LIBOR minus 0.110%, 2.311%*, 3/12/2019 | | | 750,000 | | | | 749,992 | |
| | |
3-month LIBOR minus 0.180%, 2.361%*, 11/1/2019 | | | 500,000 | | | | 500,000 | |
| | |
1-month LIBOR minus 0.145%, 2.361%*, 2/26/2019 | | | 750,000 | | | | 749,995 | |
| | |
1-month LIBOR minus 0.145%, 2.377%*, 3/29/2019 | | | 1,000,000 | | | | 1,000,000 | |
| | |
1-month LIBOR minus 0.130%, 2.392%*, 4/29/2019 | | | 3,500,000 | | | | 3,500,000 | |
| | |
1-month LIBOR minus 0.095%, 2.411%*, 7/25/2019 | | | 1,000,000 | | | | 999,993 | |
| | |
1-month LIBOR plus 0.040%, 2.427%*, 1/10/2019 | | | 500,000 | | | | 500,009 | |
| | |
1-month LIBOR minus 0.075%, 2.447%*, 4/29/2019 | | | 1,000,000 | | | | 999,984 | |
| | |
2.626%**, 8/21/2019 | | | 350,000 | | | | 344,158 | |
| | |
1-month LIBOR plus 0.190%, 2.66%*, 6/20/2019 | | | 1,500,000 | | | | 1,501,878 | |
|
Federal Home Loan Bank: | |
| | |
3-month LIBOR minus 0.330%, 2.09%*, 1/11/2019 | | | 1,000,000 | | | | 1,000,000 | |
| | |
3-month LIBOR minus 0.310%, 2.11%*, 1/11/2019 | | | 1,500,000 | | | | 1,500,000 | |
| | |
2.225%**, 1/18/2019 | | | 400,000 | | | | 399,585 | |
| | |
3-month LIBOR minus 0.280%, 2.261%*, 2/1/2019 | | | 2,000,000 | | | | 2,000,000 | |
| | |
1-month LIBOR minus 0.080%, 2.267%*, 2/4/2019 | | | 800,000 | | | | 800,000 | |
| | |
1-month LIBOR minus 0.080%, 2.267%*, 4/4/2019 | | | 1,500,000 | | | | 1,500,000 | |
| | |
Step-Up Coupon, 2.53 to 3/20/2019, 2.78 to 6/20/2019, 3.03 to 9/20/019 | | | 1,200,000 | | | | 1,200,000 | |
| | |
1-month LIBOR minus 0.100%, 2.287%*, 3/8/2019 | | | 1,250,000 | | | | 1,250,000 | |
| | |
1-month LIBOR minus 0.060%, 2.32%*, 12/6/2019 | | | 500,000 | | | | 500,000 | |
| | |
2.342%**, 3/20/2019 | | | 350,000 | | | | 348,248 | |
| | |
1-month LIBOR minus 0.085%, 2.347%*, 9/13/2019 | | | 1,300,000 | | | | 1,300,000 | |
| | |
1-month LIBOR minus 0.125%, 2.354%*, 6/21/2019 | | | 1,000,000 | | | | 1,000,000 | |
| | |
1-month LIBOR minus 0.130%, 2.374%*, 3/22/2019 | | | 1,000,000 | | | | 1,000,000 | |
| | |
1-month LIBOR minus 0.055%, 2.385%*, 1/14/2020 | | | 500,000 | | | | 500,000 | |
| | |
2.393%**, 3/11/2019 | | | 1,000,000 | | | | 995,477 | |
| | |
1-month LIBOR minus 0.110%, 2.394%*, 2/22/2019 | | | 1,500,000 | | | | 1,500,000 | |
| | |
1-month LIBOR minus 0.065%, 2.441%*, 8/28/2019 | | | 500,000 | | | | 500,000 | |
| | | | | | | | |
| | | Principal
Amount ($) | | | Value ($) | |
| | |
1-month LIBOR minus 0.025%, 2.445%*, 4/20/2020 | | | 1,250,000 | | | | 1,250,000 | |
| | |
2.5%, 5/7/2019 | | | 1,000,000 | | | | 999,951 | |
| | |
SOFR plus 0.040%, 2.5%*, 6/21/2019 | | | 1,000,000 | | | | 1,000,000 | |
| | |
3-month LIBOR minus 0.230%, 2.508%*, 12/3/2019 | | | 500,000 | | | | 500,000 | |
| | |
3-month LIBOR minus 0.190%, 2.517%*, 8/28/2019 | | | 1,000,000 | | | | 1,000,000 | |
| | |
SOFR plus 0.060%, 2.52%*, 9/10/2019 | | | 500,000 | | | | 500,000 | |
| | |
SOFR plus 0.065%, 2.525%*, 11/15/2019 | | | 750,000 | | | | 750,000 | |
| | |
2.596%**, 7/29/2019 | | | 1,250,000 | | | | 1,231,422 | |
|
Federal Home Loan Bank Discount Notes: | |
| | |
2.413%**, 2/25/2019 | | | 1,000,000 | | | | 996,364 | |
| | |
2.433%**, 3/27/2019 | | | 1,500,000 | | | | 1,491,500 | |
| | |
Federal Home Loan Banks, 2.535%**, 6/19/2019 | | | 1,000,000 | | | | 988,264 | |
|
Federal Home Loan Mortgage Corp.: | |
| | |
Step-Up Coupon, 2.53 to 3/20/2019, 2.78 to 6/20/2019, 3.03 to 9/20/2019 | | | 400,000 | | | | 400,000 | |
| | |
1-month LIBOR minus 0.150%, 2.282%*, 2/13/2019 | | | 1,000,000 | | | | 1,000,000 | |
| | |
1-month LIBOR minus 0.100%, 2.287%*, 8/8/2019 | | | 2,500,000 | | | | 2,499,712 | |
| | |
1-month LIBOR minus 0.100%, 2.355%*, 3/18/2019 | | | 1,100,000 | | | | 1,100,000 | |
| | |
1-month LIBOR minus 0.110%, 2.396%*, 5/28/2019 | | | 1,250,000 | | | | 1,250,000 | |
| | |
SOFR plus 0.025%, 2.485%*, 5/8/2019 | | | 1,250,000 | | | | 1,250,000 | |
| | |
Federal Home Loan Mortgage Corp. Discount Notes, 2.393%**, 2/20/2019 | | | 1,000,000 | | | | 996,722 | |
|
Federal National Mortgage Association: | |
| | |
SOFR plus 0.070%, 2.53%*, 10/30/2019 | | | 250,000 | | | | 250,000 | |
| | |
SOFR plus 0.100%, 2.56%*, 4/30/2020 | | | 250,000 | | | | 250,000 | |
| | | | | | | | |
| | | | | | | 50,343,168 | |
|
| U.S. Treasury Obligations 14.7% | |
|
U.S. Treasury Bills: | |
| | |
2.225%**, 2/14/2019 | | | 750,000 | | | | 747,988 | |
| | |
2.368%**, 3/21/2019 | | | 1,500,000 | | | | 1,492,410 | |
| | |
2.368%**, 3/21/2019 | | | 1,500,000 | | | | 1,492,213 | |
| | |
2.423%**, 4/11/2019 | | | 1,500,000 | | | | 1,490,141 | |
| | |
2.424%**, 4/11/2019 | | | 1,500,000 | | | | 1,489,938 | |
| | |
2.514%**, 6/13/2019 | | | 775,000 | | | | 766,297 | |
|
U.S. Treasury Floating Rate Notes: | |
| | |
3-month U.S. Treasury Bill Money Market Yield plus 0.070%, 2.5%*, 4/30/2019 | | | 4,250,000 | | | | 4,251,197 | |
| | |
3-month U.S. Treasury Bill Money Market Yield plus 0.140%, 2.57%*, 1/31/2019 | | | 2,000,000 | | | | 2,000,357 | |
| | |
U.S. Treasury Note, 2.75%, 2/15/2019 | | | 2,000,000 | | | | 2,000,670 | |
| | | | | | | | |
| | | | | | | | 15,731,211 | |
Total Government & Agency Obligations
(Cost $66,074,379) | | | | 66,074,379 | |
The accompanying notes are an integral part of the financial statements.
| | | | |
Deutsche DWS Variable Series II — DWS Government Money Market VIP | | | | | 7 |
| | | | | | | | |
| | | Principal
Amount ($) | | | Value ($) | |
|
| Repurchase Agreements 38.4% | |
| | |
BNP Paribas, 2.95%, dated 12/31/2018, to be repurchased at $20,003,278 on 1/2/2019 (a) | | | 20,000,000 | | | | 20,000,000 | |
| | |
Wells Fargo Bank, 3.00%, dated 12/31/2018, to be repurchased at $21,203,533 on 1/2/2019 (b) | | | 21,200,000 | | | | 21,200,000 | |
Total Repurchase Agreements
(Cost $41,200,000) | | | | 41,200,000 | |
| | | | | | | | |
| | | % of Net
Assets | | | Value ($) | |
Total Investment Portfolio
(Cost $107,274,379) | | | 100.1 | | | | 107,274,379 | |
| Other Assets and Liabilities, Net | | | (0.1 | ) | | | (94,603 | ) |
| Net Assets | | | 100.0 | | | | 107,179,776 | |
| * | Floating rate security. These securities are shown at their current rate as of December 31, 2018. |
| ** | Annualized yield at time of purchase; not a coupon rate. |
| | | | | | | | | | | | |
Principal
Amount ($) | | | Security | | Rate (%) | | Maturity
Date | | Collateral
Value ($) | |
| | 200 | | | U.S. Treasury Bill | | Zero Coupon | | 02/21/2019 | | | 199 | |
| | 20,778,900 | | | U.S. Treasury Inflation Indexed Bond | | 0.375 | | 07/15/2027 | | | 20,362,912 | |
| | Total Collateral Value | | | 20,363,111 | |
| | | | | | | | | | | | | | |
Principal
Amount ($) | | | Security | | Rate (%) | | Maturity
Date | | | Collateral
Value ($) | |
| | 14,271,600 | | | Federal National Mortgage Association | | 2.495-5 | | | 1/1/2029–1/1/2049 | | | | 14,601,228 | |
| | 1,220,703 | | | Federal National Mortgage Corp. | | 2.368-3.138 | | | 11/1/2046–1/1/2048 | | | | 1,221,211 | |
| | 5,769,866 | | | Government National Mortgage Association | | 2.5-5.5 | | | 9/20/2045–12/20/2048 | | | | 5,801,561 | |
| | Total Collateral Value | | | | | | | 21,624,000 | |
LIBOR: London Interbank Offered Rate
SOFR: Secured Overnight Financing Rate
Fair Value Measurements
Various inputs are used in determining the value of the Fund’s investments. These inputs are summarized in three broad levels. Level 1 includes quoted prices in active markets for identical securities. Level 2 includes other significant observable inputs (including quoted prices for similar securities, interest rates, prepayment speeds and credit risk). Level 3 includes significant unobservable inputs (including the Fund’s own assumptions in determining the fair value of investments). The level assigned to the securities valuations may not be an indication of the risk or liquidity associated with investing in those securities. Securities held by the Fund are reflected as Level 2 because the securities are valued at amortized cost (which approximates fair value) and, accordingly, the inputs used to determine value are not quoted prices in an active market.
The following is a summary of the inputs used as of December 31, 2018 in valuing the Fund’s investments. For information on the Fund’s policy regarding the valuation of investments, please refer to the Security Valuation section of Note A in the accompanying Notes to Financial Statements.
| | | | | | | | | | | | | | | | |
| Assets | | Level 1 | | | Level 2 | | | Level 3 | | | Total | |
| Investments in Securities (c) | | $ | — | | | $ | 66,074,379 | | | $ | — | | | $ | 66,074,379 | |
| Repurchase Agreements | | | — | | | | 41,200,000 | | | | — | | | | 41,200,000 | |
| Total | | $ | — | | | $ | 107,274,379 | | | $ | — | | | $ | 107,274,379 | |
| (c) | See Investment Portfolio for additional detailed categorizations. |
The accompanying notes are an integral part of the financial statements.
| | | | | | |
| | 8 | | | | | | Deutsche DWS Variable Series II — DWS Government Money Market VIP |
Statement of Assets and Liabilities
| | | | |
| As of December 31, 2018 | |
|
| Assets | |
Investments in securities, valued at
amortized cost | | $ | 66,074,379 | |
Repurchase Agreements, valued at
amortized cost | | | 41,200,000 | |
| Cash | | | 106,228 | |
| Receivable for Fund shares sold | | | 78,481 | |
| Interest receivable | | | 118,203 | |
| Other assets | | | 2,734 | |
| Total assets | | | 107,580,025 | |
| |
| Liabilities | | | | |
| Payable for Fund shares redeemed | | | 182,488 | |
| Distributions payable | | | 79,139 | |
| Accrued management fee | | | 20,041 | |
| Accrued Trustees’ fees | | | 2,179 | |
| Other accrued expenses and payables | | | 116,402 | |
| Total liabilities | | | 400,249 | |
| Net assets, at value | | $ | 107,179,776 | |
| |
| Net Assets Consist of | | | | |
| Distributable earnings (loss) | | | 14,762 | |
| Paid-in capital | | | 107,165,014 | |
| Net assets, at value | | $ | 107,179,776 | |
Class A Net Asset Value | | | | |
| |
| Net asset value, offering and redemption price per share ($107,179,776 ÷ 107,248,730 outstanding shares of beneficial interest, no par value, unlimited number of shares authorized) | | $ | 1.00 | |
Statement of Operations
| | | | |
| For the year ended December 31, 2018 | | | | |
| |
| Investment Income | | | | |
| Income: | | | | |
| Interest | | $ | 1,962,649 | |
| Expenses: | | | | |
| Management fee | | | 246,119 | |
| Administration fee | | | 104,731 | |
| Services to Shareholders | | | 2,165 | |
| Custodian fee | | | 4,360 | |
| Professional fees | | | 65,997 | |
| Reports to shareholders | | | 84,375 | |
| Trustees’ fees and expenses | | | 6,653 | |
| Other | | | 11,132 | |
| Total expenses before expense reductions | | | 525,532 | |
| Expense reductions | | | (798 | ) |
| Total expenses after expense reductions | | | 524,734 | |
| Net investment income | | | 1,437,915 | |
| Net realized gain (loss) from investments | | | (141 | ) |
| Net increase (decrease) in net assets resulting from operations | | $ | 1,437,774 | |
The accompanying notes are an integral part of the financial statements.
| | | | |
Deutsche DWS Variable Series II — DWS Government Money Market VIP | | | | | 9 |
Statements of Changes in Net Assets
| | | | | | | | |
| | | Years Ended December 31, | |
| Increase (Decrease) in Net Assets | | 2018 | | | 2017 | |
| Operations: | | | | | | | | |
| Net investment income (loss) | | $ | 1,437,915 | | | $ | 547,826 | |
| Net realized gain (loss) | | | (141 | ) | | | 53 | |
| Net increase (decrease) in net assets resulting from operations | | | 1,437,774 | | | | 547,879 | |
| Distributions to shareholders : | | | | | | | | |
Class A | | | (1,437,977 | ) | | | (547,829 | )* |
| Fund share transactions: | | | | | | | | |
Class A | | | | | | | | |
| Proceeds from shares sold | | | 122,763,991 | | | | 111,220,770 | |
| Reinvestment of distributions | | | 1,393,905 | | | | 514,778 | |
| Payments for shares redeemed | | | (128,197,879 | ) | | | (122,921,320 | ) |
| Net increase (decrease) in net assets from Class A share transactions | | | (4,039,983 | ) | | | (11,185,772 | ) |
| Increase (decrease) in net assets | | | (4,040,186 | ) | | | (11,185,722 | ) |
| Net assets at beginning of period | | | 111,219,962 | | | | 122,405,684 | |
| | |
| Net assets at end of period | | $ | 107,179,776 | | | $ | 111,219,962 | ** |
| | |
| Other Information: | | | | | | | | |
Class A | | | | | | | | |
| Shares outstanding at beginning of period | | | 111,288,713 | | | | 122,474,485 | |
| Shares sold | | | 122,763,991 | | | | 111,220,770 | |
| Shares issued to shareholders in reinvestment of distributions | | | 1,393,905 | | | | 514,778 | |
| Shares redeemed | | | (128,197,879 | ) | | | (122,921,320 | ) |
| Net increase (decrease) in Fund shares | | | (4,039,983 | ) | | | (11,185,772 | ) |
| | |
| Shares outstanding at end of period | | | 107,248,730 | | | | 111,288,713 | |
| * | Includes distributions from net investment income. |
| ** | Includes undistributed net investment income of $14,912. |
The accompanying notes are an integral part of the financial statements.
| | | | | | |
| | 10 | | | | | | Deutsche DWS Variable Series II — DWS Government Money Market VIP |
Financial Highlights
| | | | | | | | | | | | | | | | | | | | |
| | | Years Ended December 31, | |
| Class A | | 2018 | | | 2017 | | | 2016 | | | 2015 | | | 2014 | |
| | | | | |
| Selected Per Share Data | | | | | | | | | | | | | | | | | | | | |
| Net asset value, beginning of period | | $ | 1.00 | | | $ | 1.00 | | | $ | 1.00 | | | $ | 1.00 | | | $ | 1.00 | |
| Income from investment operations: | | | | | | | | | | | | | | | | | | | | |
Net investment income | | | .014 | | | | .005 | | | | .001 | b | | | .000 | * | | | .000 | * |
Net realized gain (loss) | | | (.000 | )* | | | .000 | * | | | .000 | * | | | (.000 | )* | | | .000 | * |
Total from investment operations | | | .014 | | | | .005 | | | | .001 | | | | .000 | * | | | .000 | * |
| Less distributions from: | | | | | | | | | | | | | | | | | | | | |
| Net investment income | | | (.014 | ) | | | (.005 | ) | | | (.001 | ) | | | (.000 | )* | | | (.000 | )* |
| Net asset value, end of period | | $ | 1.00 | | | $ | 1.00 | | | $ | 1.00 | | | $ | 1.00 | | | $ | 1.00 | |
| Total Return (%) | | | 1.39 | a | | | .45 | | | | .05 | a,b | | | .01 | a | | | .01 | a |
| | | | | | |
| Ratios to Average Net Assets and Supplemental Data | | | | | | | | | | | | | | | | | | | | |
| Net assets, end of period ($ millions) | | | 107 | | | | 111 | | | | 122 | | | | 134 | | | | 177 | |
| Ratio of expenses before expense reductions (%)c | | | .50 | | | | .48 | | | | .51 | | | | .49 | | | | .49 | |
| Ratio of expenses after expense reductions (%)c | | | .50 | | | | .48 | | | | .44 | | | | .25 | | | | .18 | |
| Ratio of net investment income (%) | | | 1.37 | | | | .45 | | | | .05 | b | | | .01 | | | | .01 | |
| a | Total return would have been lower had certain expenses not been reduced. |
| b | Includes anon-recurring payment for overbilling of prior years’ custodianout-of-pocket fees. Excluding this payment, net investment income per share, total return, and ratio of net investment income to average net assets would have been reduced by $0.0004, 0.04%, and 0.04%, respectively. |
| c | Expense ratio does not reflect charges and fees associated with the separate account that invests in the Fund or any variable life insurance policy or variable annuity contract for which the Fund is an investment option. |
| * | Amount is less than $.0005. |
The accompanying notes are an integral part of the financial statements.
| | | | |
Deutsche DWS Variable Series II — DWS Government Money Market VIP | | | | | 11 |
| | |
| Notes to Financial Statements | | |
A. Organization and Significant Accounting Policies
DWS Government Money Market VIP (formerly Deutsche Government Money Market VIP) (the “Fund”) is a diversified series of Deutsche DWS Variable Series II (formerly Deutsche Variable Series II) (the “Trust”), which is registered under the Investment Company Act of 1940, as amended (the “1940 Act”), as anopen-end management investment company organized as a Massachusetts business trust.
The Fund’s financial statements are prepared in accordance with accounting principles generally accepted in the United States of America (“U.S. GAAP”) which require the use of management estimates. Actual results could differ from those estimates. The Fund qualifies as an investment company under Topic 946 of Accounting Standards Codification of U.S. GAAP. The policies described below are followed consistently by the Fund in the preparation of its financial statements.
In October 2018, the Securities and Exchange Commission adopted amendments to certain disclosure requirements in Securities Act Release No. 33-10532, Disclosure Update and Simplification, which is intended to facilitate the disclosure of information to investors and simplify compliance without significantly altering the total mix of information provided to investors. Effective with the current reporting period, the Fund adopted the amendments with the impacts being that the Fund is no longer required to present components of distributable earnings on the Statement of Assets and Liabilities or the sources of distributable earnings and the amount of undistributed net investment income on the Statements of Changes in Net Assets.
Security Valuation. Various inputs are used in determining the value of the Fund’s investments. These inputs are summarized in three broad levels. Level 1 includes quoted prices in active markets for identical securities. Level 2 includes other significant observable inputs (including quoted prices for similar securities, interest rates, prepayment speeds and credit risk). Level 3 includes significant unobservable inputs (including the Fund’s own assumptions in determining the fair value of investments). The level assigned to the securities valuations may not be an indication of the risk or liquidity associated with investing in those securities.
The Fund values all securities utilizing the amortized cost method permitted in accordance with Rule2a-7 under the 1940 Act and certain conditions therein. Under this method, which does not take into account unrealized capital gains or losses on securities, an instrument is initially valued at its cost and thereafter assumes a constant accretion/amortization rate to maturity of any discount or premium. Securities held by the Fund are reflected as Level 2 because the securities are valued at amortized cost (which approximates fair value) and, accordingly, the inputs used to determine value are not quoted prices in an active market.
Disclosure about the classification of fair value measurements is included in a table following the Fund’s Investment Portfolio.
Repurchase Agreements. The Fund may enter into repurchase agreements, under the terms of a Master Repurchase Agreement, with certain banks and broker/dealers whereby the Fund, through its custodian or asub-custodian bank, receives delivery of the underlying securities, the amount of which at the time of purchase and each subsequent business day is required to be maintained at such a level that the value is equal to at least the principal amount of the repurchase price plus accrued interest. The custodian bank or another designatedsub-custodian holds the collateral in a separate account until the agreement matures. If the value of the securities falls below the principal amount of the repurchase agreement plus accrued interest, the financial institution deposits additional collateral by the following business day. If the financial institution either fails to deposit the required additional collateral or fails to repurchase the securities as agreed, the Fund has the right to sell the securities and recover any resulting loss from the financial institution. If the financial institution enters into bankruptcy, the Fund’s claim on the collateral may be subject to legal proceedings.
As of December 31, 2018 the Fund held repurchase agreements with a gross value of $41,200,000. The value of the related collateral exceeded the value of the repurchase agreements at period end. The detail of the related collateral is included in the footnotes following the Fund’s Investment Portfolio.
Federal Income Taxes. The Fund’s policy is to comply with the requirements of the Internal Revenue Code, as amended, which are applicable to regulated investment companies and to distribute all of its taxable income to its shareholders.
| | | | | | |
| | 12 | | | | | | Deutsche DWS Variable Series II — DWS Government Money Market VIP |
At December 31, 2018, the Fund had $141 of short-term tax basis capital loss carryforwards, which maybe applied against realized net taxable capital gains indefinitely.
The Fund has reviewed the tax positions for the open tax years as of December 31, 2018 and has determined that no provision for income tax and/or uncertain tax positions is required in the Fund’s financial statements. The Fund’s federal tax returns for the prior three fiscal years remain open subject to examination by the Internal Revenue Service.
Distribution of Income and Gains. Net investment income of the Fund is declared as a daily dividend and is distributed to shareholders monthly. The Fund may take into account capital gains and losses in its daily dividend declarations. The Fund may also make additional distributions for tax purposes if necessary.
Permanent book and tax differences relating to shareholder distributions will result in reclassifications topaid-in capital. Temporary book and tax differences will reverse in a subsequent period. There were no significant book to tax differences for the Fund.
At December 31, 2018, the Fund’s components of distributable earnings on a tax basis were as follows:
| | | | |
| Undistributed ordinary income | | $ | 14,903 | |
| Capital loss carryforwards | | $ | (141 | ) |
At December 31, 2018, the aggregate cost of investments for federal income tax purposes was $107,274,379. In addition, the tax character of distributions paid by the Fund is summarized as follows:
| | | | | | | | |
| | | Years Ended December 31, | |
| | | 2018 | | | 2017 | |
| Distributions from ordinary income | | $ | 1,437,977 | | | $ | 547,829 | |
Expenses. Expenses of the Trust arising in connection with a specific fund are allocated to that fund. Other Trust expenses which cannot be directly attributed to a fund are apportioned among the funds in the Trust based upon the relative net assets or other appropriate measures.
Contingencies. In the normal course of business, the Fund may enter into contracts with service providers that contain general indemnification clauses. The Fund’s maximum exposure under these arrangements is unknown, as this would involve future claims that may be made against the Fund that have not yet been made. However, based on experience, the Fund expects the risk of loss to be remote.
Other. Investment transactions are accounted for on a trade date. Interest income is recorded on the accrual basis. Realized gains and losses from investment transactions are recorded on an identified cost basis. All discounts and premiums are accreted/amortized for both tax and financial reporting purposes.
B. Related Parties
Management Agreement. Under the Investment Management Agreement with DWS Investment Management Americas, Inc. (formerly Deutsche Investment Management Americas, Inc.) (“DIMA” or the “Advisor”), an indirect, wholly owned subsidiary of DWS Group GmbH & Co. KGaA (“DWS Group”), the Advisor directs the investments of the Fund in accordance with its investment objectives, policies and restrictions. The Advisor determines the securities, instruments and other contracts relating to investments to be purchased, sold or entered into by the Fund.
Pursuant to the Investment Management Agreement with the Advisor, the Fund pays the Advisor a monthly management fee based on its average daily net assets, computed and accrued daily and payable monthly, at the following annual rates:
| | | | |
| First $500 million | | | .235 | % |
| Next $500 million | | | .220 | % |
| Next $1.0 billion | | | .205 | % |
| Over $2.0 billion | | | .190 | % |
Accordingly, for the year ended December 31, 2018, the fee pursuant to the Investment Management Agreement was equivalent to an annual rate (exclusive of any applicable waivers/reimbursements) of 0.235% of the Fund’s average daily net assets.
For the period from January 1, 2018 through September 30, 2019, the Advisor has contractually agreed to waive its fee and/or reimburse certain operating expenses to the extent necessary to maintain the total annual operating expenses (excluding certain expenses such as extraordinary expenses, taxes, brokerage and interest expense) at 0.51%.
| | | | |
Deutsche DWS Variable Series II — DWS Government Money Market VIP | | | | | 13 |
For the year ended December 31, 2018, fees waived and/or expenses reimbursed amounted to $798.
Administration Fee. Pursuant to an Administrative Services Agreement, DIMA provides most administrative services to the Fund. For all services provided under the Administrative Services Agreement, the Fund pays DIMA an annual fee (“Administration Fee”) of 0.10% of the Fund’s average daily net assets, computed and accrued daily and payable monthly. For the year ended December 31, 2018 the Administration Fee was $104,731, of which $8,538 is unpaid.
Service Provider Fees. DWS Service Company (“DSC”), an affiliate of the Advisor, is the transfer agent,dividend-paying agent and shareholder service agent for the Fund. Pursuant to asub-transfer agency agreement between DSC and DST Systems, Inc. (“DST”), DSC has delegated certain transfer agent,dividend-paying agent and shareholder service agent functions to DST. DSC compensates DST out of the shareholder servicing fee it receives from the Fund. For the year ended December 31, 2018, the amounts charged to the Fund by DSC aggregated $1,773, of which $285 is unpaid.
Typesetting and Filing Service Fees. Under an agreement with the fund, DIMA is compensated for providing certainpre-press and regulatory filing services to the Fund. For the year ended December 31, 2018, the amount charged to the Fund by DIMA included in the Statement of Operations under “Reports to shareholders” aggregated $8,088 of which $6,061 is unpaid.
Trustees’ Fees and Expenses. The Fund paid retainer fees to each Trustee not affiliated with the Advisor, plus specified amounts to the Board Chairperson and to each committee Chairperson.
C. Ownership of the Fund
At December 31, 2018, three participating insurance companies were owners of record of 10% or more of the total outstanding Class A shares of the Fund, each owning 45%, 19% and 15%.
D. Line of Credit
The Fund and other affiliated funds (the “Participants”) share in a $400 million revolving credit facility provided by a syndication of banks. The Fund may borrow for temporary or emergency purposes, including the meeting of redemption requests that otherwise might require the untimely disposition of securities. The Participants are charged an annual commitment fee which is allocated based on net assets, among each of the Participants. Interest is calculated at a rate per annum equal to the sum of the Federal Funds Rate, plus 1.25 percent plus if theone-month LIBOR exceeds the Federal Funds Rate, the amount of such excess. The Fund may borrow up to a maximum of 33 percent of its net assets under the agreement. The Fund had no outstanding loans at December 31, 2018.
| | | | | | |
| | 14 | | | | | | Deutsche DWS Variable Series II — DWS Government Money Market VIP |
Report of Independent Registered Public Accounting Firm
To the Board of Trustees of Deutsche DWS Variable Series II and Shareholders of DWS Government Money Market VIP:
Opinion on the Financial Statements
We have audited the accompanying statement of assets and liabilities of DWS Government Money Market VIP (formerly Deutsche Government Money Market VIP) (the “Fund”) (one of the funds constituting Deutsche DWS Variable Series II (formerly Deutsche Variable Series II)) (the “Trust”), including the investment portfolio, as of December 31, 2018, and the related statement of operations for the year then ended, the statements of changes in net assets for each of the two years in the period then ended, the financial highlights for each of the five years in the period then ended and the related notes (collectively referred to as the “financial statements”). In our opinion, the financial statements present fairly, in all material respects, the financial position of the Fund (one of the funds constituting Deutsche DWS Variable Series II) at December 31, 2018, the results of its operations for the year then ended, the changes in its net assets for each of the two years in the period then ended and its financial highlights for each of the five years in the period then ended, in conformity with U.S. generally accepted accounting principles.
Basis for Opinion
These financial statements are the responsibility of the Trust’s management. Our responsibility is to express an opinion on the Fund’s financial statements based on our audits. We are a public accounting firm registered with the Public Company Accounting Oversight Board (United States) (“PCAOB”) and are required to be independent with respect to the Trust in accordance with the U.S. federal securities laws and the applicable rules and regulations of the Securities and Exchange Commission and the PCAOB.
We conducted our audits in accordance with the standards of the PCAOB. Those standards require that we plan and perform the audit to obtain reasonable assurance about whether the financial statements are free of material misstatement, whether due to error or fraud. The Trust is not required to have, nor were we engaged to perform, an audit of the Trust’s internal control over financial reporting. As part of our audits, we are required to obtain an understanding of internal control over financial reporting, but not for the purpose of expressing an opinion on the effectiveness of the Trust’s internal control over financial reporting. Accordingly, we express no such opinion.
Our audits included performing procedures to assess the risks of material misstatement of the financial statements, whether due to error or fraud, and performing procedures that respond to those risks. Such procedures included examining, on a test basis, evidence regarding the amounts and disclosures in the financial statements. Our procedures included confirmation of securities owned as of December 31, 2018, by correspondence with the custodian and brokers. Our audits also included evaluating the accounting principles used and significant estimates made by management, as well as evaluating the overall presentation of the financial statements. We believe that our audits provide a reasonable basis for our opinion.

We have served as the auditor of one or more investment companies in the DWS family of funds since at least 1979, but we are unable to determine the specific year.
Boston, Massachusetts
February 14, 2019
| | | | |
Deutsche DWS Variable Series II — DWS Government Money Market VIP | | | | | 15 |
| | |
| Information About Your Fund’s Expenses | | (Unaudited) |
As an investor of the Fund, you incur two types of costs: ongoing expenses and transaction costs. Ongoing expenses include management fees and other Fund expenses. Examples of transaction costs include contract charges, which are not shown in this section. The following tables are intended to help you understand your ongoing expenses (in dollars) of investing in the Fund and to help you compare these expenses with the ongoing expenses of investing in other mutual funds. In the most recent six-month period the Fund limited these expenses; had it not done so, expenses would have been higher. The example in the table is based on an investment of $1,000 invested at the beginning of thesix-month period and held for the entire period (July 1, 2018 to December 31, 2018).
The tables illustrate your Fund’s expenses in two ways:
| – | | Actual Fund Return. This helps you estimate the actual dollar amount of ongoing expenses (but not transaction costs) paid on a $1,000 investment in the Fund using the Fund’s actual return during the period. To estimate the expenses you paid over the period, simply divide your account value by $1,000 (for example, an $8,600 account value divided by $1,000 = 8.6), then multiply the result by the number in the “Expenses Paid per $1,000” line under the share class you hold. |
| – | | Hypothetical 5% Fund Return. This helps you to compare your Fund’s ongoing expenses (but not transaction costs) with those of other mutual funds using the Fund’s actual expense ratio and a hypothetical rate of return of 5% per year before expenses. Examples using a 5% hypothetical Fund return may be found in the shareholder reports of other mutual funds. The hypothetical account values and expenses may not be used to estimate the actual ending account balance or expenses you paid for the period. |
Please note that the expenses shown in these tables are meant to highlight your ongoing expenses only and do not reflect any transaction costs. The “Expenses Paid per $1,000” line of the tables is useful in comparing ongoing expenses only and will not help you determine the relative total expense of owning different funds. If these transaction costs had been included, your costs would have been higher.
| | | | |
| Expenses and Value of a $1,000 Investment for the six months December 31, 2018 | | | |
| |
| Actual Fund Return | | | Class A | |
| Beginning Account Value 7/1/18 | | $ | 1,000.00 | |
| Ending Account Value 12/31/18 | | $ | 1,008.20 | |
| Expenses Paid per $1,000* | | $ | 2.53 | |
| |
| Hypothetical 5% Fund Return | | | Class A | |
| Beginning Account Value 7/1/18 | | $ | 1,000.00 | |
| Ending Account Value 12/31/18 | | $ | 1,025.21 | |
| Expenses Paid per $1,000* | | $ | 2.55 | |
| * | Expenses are equal to the Fund’s annualized expense ratio, multiplied by the average account value over the period, multiplied by 184 (the number of days in the most recentsix-month period), then divided by 365. |
| | | | |
| Annualized Expense Ratio | | Class A | |
| Deutsche DWS Variable Series II — DWS Government Money Market VIP | | | .50 | % |
For more information, please refer to the Fund’s prospectus.
These tables do not reflect charges and fees (“contract charges”) associated with the separate account that invests in the Fund or any variable life insurance policy or variable annuity contract for which the Fund is an investment option.
For an analysis of the fees associated with an investment in the Fund or similar funds, please refer to the current and hypothetical expense calculators for Variable Insurance Products which can be found at dws.com/calculators.
| | | | | | |
| | 16 | | | | | | Deutsche DWS Variable Series II — DWS Government Money Market VIP |
| | |
| Tax Information | | (Unaudited) |
Please consult a tax advisor if you have questions about federal or state income tax laws, or on how to prepare your tax returns. If you have specific questions about your account, please contact your insurance provider.
Proxy Voting
The Trust’s policies and procedures for voting proxies for portfolio securities and information about how the Trust voted proxies related to its portfolio securities during the most recent12-month period ended June 30 are available on our Web site — dws.com/en-us/resources/proxy-voting — or on the SEC’s Web site — sec.gov. To obtain a written copy of the Trust’s policies and procedures without charge, upon request, call us toll free at (800)728-3337.
| | | | |
Deutsche DWS Variable Series II — DWS Government Money Market VIP | | | | | 17 |
Advisory Agreement Board Considerations and Fee Evaluation
The Board of Trustees (hereinafter referred to as the “Board” or “Trustees”) approved the renewal of DWS Government Money Market VIP’s (the “Fund”) investment management agreement (the “Agreement”) with DWS Investment Management Americas, Inc. (“DIMA”) in September 2018.
In terms of the process that the Board followed prior to approving the Agreement, shareholders should know that:
| – | | During the entire process, all of the Fund’s Trustees were independent of DIMA and its affiliates (the “Independent Trustees”). |
| – | | The Board met frequently during the past year to discuss fund matters and dedicated a substantial amount of time to contract review matters. Over the course of several months, the Board’s Contract Committee reviewed extensive materials received from DIMA, independent third parties and independent counsel. These materials included an analysis of the Fund’s performance, fees and expenses, and profitability from a fee consultant retained by the Fund’s Independent Trustees (the “Fee Consultant”). Based on its evaluation of the information provided, the Contract Committee presented its findings and recommendations to the Board. The Board then reviewed the Contract Committee’s findings and recommendations. |
| – | | The Board also received extensive information throughout the year regarding performance of the Fund. |
| – | | The Independent Trustees regularly met privately with counsel to discuss contract review and other matters. In addition, the Independent Trustees were advised by the Fee Consultant in the course of their review of the Fund’s contractual arrangements and considered a comprehensive report prepared by the Fee Consultant in connection with their deliberations. |
| – | | In connection with reviewing the Agreement, the Board also reviewed the terms of the Fund’s distribution agreement, administrative services agreement, transfer agency agreement and other material service agreements. |
In connection with the contract review process, the Contract Committee and the Board considered the factors discussed below, among others. The Board also considered that DIMA and its predecessors have managed the Fund since its inception, and the Board believes that a long-term relationship with a capable, conscientious advisor is in the best interests of the Fund. The Board considered, generally, that shareholders chose to invest or remain invested in the Fund knowing that DIMA managed the Fund. DIMA is part of DWS Group GmbH & Co. KGaA (“DWS Group”). DWS Group is a global asset management business that offers a wide range of investing expertise and resources, including research capabilities in many countries throughout the world. In 2018, approximately 20% of DWS Group’s shares were sold in an initial public offering, with Deutsche Bank AG owning the remaining shares.
As part of the contract review process, the Board carefully considered the fees and expenses of each DWS fund overseen by the Board in light of the fund’s performance. In many cases, this led to the negotiation and implementation of expense caps. As part of these negotiations, the Board indicated that it would consider relaxing these caps in future years following sustained improvements in performance, among other considerations.
While shareholders may focus primarily on fund performance and fees, the Fund’s Board considers these and many other factors, including the quality and integrity of DIMA’s personnel and administrative support services provided by DIMA, such as back-office operations, fund valuations, and compliance policies and procedures.
Nature, Quality and Extent of Services.The Board considered the terms of the Agreement, including the scope of advisory services provided under the Agreement. The Board noted that, under the Agreement, DIMA provides portfolio management services to the Fund and that, pursuant to a separate administrative services agreement, DIMA provides administrative services to the Fund. The Board considered the experience and skills of senior management and investment personnel and the resources made available to such personnel. The Board reviewed the Fund’s performance over short-term and long-term periods and compared those returns to various agreed-upon performance measures, including a peer universe compiled using information supplied by iMoneyNet, an independent fund data service. The Board also noted that it has put into place a process of identifying “Funds in Review” (e.g., funds performing poorly relative to a peer universe), and receives additional reporting from DIMA regarding such funds and, where appropriate, DIMA’s plans to address underperformance. The Board believes this process is an effective manner of identifying
| | | | | | |
| | 18 | | | | | | Deutsche DWS Variable Series II — DWS Government Money Market VIP |
and addressing underperforming funds. Based on the information provided, the Board noted that, for theone- and three-year periods ended December 31, 2017, the Fund’s gross performance (Class A shares) was in the 1st quartile of the applicable iMoneyNet universe (the 1st quartile being the best performers and the 4th quartile being the worst performers).
Fees and Expenses. The Board considered the Fund’s investment management fee schedule, operating expenses and total expense ratios, and comparative information provided by Broadridge Financial Solutions, Inc. (“Broadridge”) and the Fee Consultant regarding investment management fee rates paid to other investment advisors by similar funds (1st quartile being the most favorable and 4th quartile being the least favorable). With respect to management fees paid to other investment advisors by similar funds, the Board noted that the contractual fee rates paid by the Fund, which include a 0.10% fee paid to DIMA under the Fund’s administrative services agreement, were lower than the median (2nd quartile) of the applicable Broadridge peer group (based on Broadridge data provided as of December 31, 2017). The Board considered that the Fund’s management fee was reduced by 0.05% at all breakpoint levels in connection with the restructuring of the Fund into a government money market fund in 2016. The Board noted that the Fund’s Class A shares total (net) operating expenses were higher than the median (3rd quartile) of the applicable Broadridge expense universe (based on Broadridge data provided as of December 31, 2017, and analyzing Broadridge expense universe Class A (net) expenses less any applicable12b-1 fees). The Board noted the expense limitation agreed to by DIMA. The Board also noted the voluntary fee waivers implemented by DIMA prior to December 31, 2017 to ensure the Fund maintained a positive yield. The Board considered the Fund’s management fee rate as compared to fees charged by DIMA to comparable DWS U.S. registered funds (“DWS Funds”) and considered differences between the Fund and the comparable DWS Funds. The information requested by the Board as part of its review of fees and expenses also included information about institutional accounts (including anysub-advised funds and accounts) and funds offered primarily to European investors (“DWS Europe Funds”) managed by DWS Group. The Board noted that DIMA indicated that DWS Group does not manage any institutional accounts or DWS Europe Funds comparable to the Fund.
On the basis of the information provided, the Board concluded that management fees were reasonable and appropriate in light of the nature, quality and extent of services provided by DIMA.
Profitability. The Board reviewed detailed information regarding revenues received by DIMA under the Agreement. The Board considered the estimated costs to DIMA, andpre-tax profits realized by DIMA, from advising the DWS Funds, as well as estimates of thepre-tax profits attributable to managing the Fund in particular. The Board also received information regarding the estimated enterprise-wide profitability of DIMA and its affiliates with respect to all fund services in totality and by fund. The Board and the Fee Consultant reviewed DIMA’s methodology in allocating its costs to the management of the Fund. Based on the information provided, the Board concluded that thepre-tax profits realized by DIMA in connection with the management of the Fund were not unreasonable. The Board also reviewed certain publicly available information regarding the profitability of certain similar investment management firms. The Board noted that, while information regarding the profitability of such firms is limited (and in some cases is not necessarily prepared on a comparable basis), DIMA and its affiliates’ overall profitability with respect to the DWS Funds (after taking into account distribution and other services provided to the funds by DIMA and its affiliates) was lower than the overall profitability levels of most comparable firms for which such data was available.
Economies of Scale. The Board considered whether there are economies of scale with respect to the management of the Fund and whether the Fund benefits from any economies of scale. The Board noted that the Fund’s investment management fee schedule includes fee breakpoints. The Board concluded that the Fund’s fee schedule represents an appropriate sharing between the Fund and DIMA of such economies of scale as may exist in the management of the Fund at current asset levels.
Other Benefits to DIMA and Its Affiliates. The Board also considered the character and amount of other incidental or“fall-out” benefits received by DIMA and its affiliates, including any fees received by DIMA for administrative services provided to the Fund and any fees received by an affiliate of DIMA for transfer agency services provided to the Fund. The Board also considered benefits to DIMA related to brokerage and soft-dollar allocations, including allocating brokerage to pay for research generated by parties other than the executing broker dealers, which pertain primarily to funds investing in equity securities. In addition, the Board considered the incidental public relations benefits to DIMA related to DWS Funds advertising and cross-selling opportunities among DIMA products and services. The Board considered these benefits in reaching its conclusion that the Fund’s management fees were reasonable.
Compliance. The Board considered the significant attention and resources dedicated by DIMA to its compliance processes in recent years. The Board noted in particular (i) the experience, seniority and time
| | | | |
Deutsche DWS Variable Series II — DWS Government Money Market VIP | | | | | 19 |
commitment of the individuals serving as DIMA’s and the Fund’s chief compliance officers and (ii) the substantial commitment of resources by DIMA and its affiliates to compliance matters, including the retention of compliance personnel.
Based on all of the information considered and the conclusions reached, the Board unanimously determined that the continuation of the Agreement is in the best interests of the Fund. In making this determination, the Board did not give particular weight to any single factor identified above. The Board considered these factors over the course of numerous meetings, certain of which were in executive session with only the Independent Trustees and counsel present. It is possible that individual Independent Trustees may have weighed these factors differently in reaching their individual decisions to approve the continuation of the Agreement.
| | | | | | |
| | 20 | | | | | | Deutsche DWS Variable Series II — DWS Government Money Market VIP |
Board Members and Officers
The following table presents certain information regarding the Board Members and Officers of the Fund. Each Board Member’s year of birth is set forth in parentheses after his or her name. Unless otherwise noted, (i) each Board Member has engaged in the principal occupation(s) noted in the table for at least the most recent five years, although not necessarily in the same capacity; and (ii) the address of each Independent Board Member is c/o Keith R. Fox, DWS Funds Board Chair, c/o Thomas R. Hiller, Ropes & Gray LLP, Prudential Tower, 800 Boylston Street, Boston, MA02199-3600. Except as otherwise noted below, the term of office for each Board Member is until the election and qualification of a successor, or until such Board Member sooner dies, resigns, is removed or as otherwise provided in the governing documents of the Fund. Because the Fund does not hold an annual meeting of shareholders, each Board Member will hold office for an indeterminate period. The Board Members may also serve in similar capacities with other funds in the fund complex.
| | | | | | | | |
| Independent Board Members | | | | | | |
Name, Year of Birth,
Position with the Fund and
Length of Time Served1 | | Business Experience and Directorships During the Past Five Years | | Number of
Funds in
DWS Fund
Complex
Overseen | | | Other
Directorships
Held by Board
Member
|
Keith R. Fox, CFA (1954) Chairperson since 2017, and Board Member since 1996 | | Managing General Partner, Exeter Capital Partners (a series of private investment funds) (since 1986). Directorships: Progressive International Corporation (kitchen goods importer and distributor); The Kennel Shop (retailer); former Chairman, National Association of Small Business Investment Companies; former Directorships: BoxTop Media Inc. (advertising); Sun Capital Advisers Trust (mutual funds) (2011–2012) | | | 82 | | | — |
John W. Ballantine (1946) Board Member since 1999 | | Retired; formerly, Executive Vice President and Chief Risk Management Officer, First Chicago NBD Corporation/The First National Bank of Chicago (1996–1998); Executive Vice President and Head of International Banking (1995–1996); former Directorships: Director and former Chairman of the Board, Healthways, Inc.2 (population well-being and wellness services) (2003–2014); Stockwell Capital Investments PLC (private equity); Enron Corporation; FNB Corporation; Tokheim Corporation; First Oak Brook Bancshares, Inc. and Oak Brook Bank; Prisma Energy International; Public Radio International. Not-for-Profit Director, Trustee: Palm Beach Civic Association; Window to the World Communications (public media); Harris Theater for Music and Dance (Chicago); Life Director of Hubbard Street Dance Chicago | | | 82 | | | Portland
General
Electric2
(utility
company)
(2003–
present) |
Henry P. Becton, Jr. (1943) Board Member since 1990 | | Vice Chair and former President, WGBH Educational Foundation. Directorships: Public Radio International; Public Radio Exchange (PRX); The Pew Charitable Trusts (charitable organization); Massachusetts Humane Society; Overseer of the New England Conservatory; former Directorships: Becton Dickinson and Company2 (medical technology company); Belo Corporation2 (media company); The PBS Foundation; Association of Public Television Stations; Boston Museum of Science; American Public Television; Concord Academy; New England Aquarium; Mass. Corporation for Educational Telecommunications; Committee for Economic Development; Public Broadcasting Service; Connecticut College; North Bennett Street School (Boston); American Documentary, Inc. (public media) | | | 82 | | | — |
Dawn-Marie Driscoll (1946) Board Member since 1987 | | Emeritus Executive Fellow, Center for Business Ethics, Bentley University; formerly: President, Driscoll Associates (consulting firm); Partner, Palmer & Dodge (law firm) (1988–1990); Vice President of Corporate Affairs and General Counsel, Filene’s (retail) (1978–1988). Directorships: Advisory Board, Center for Business Ethics, Bentley University; Trustee and former Chairman of the Board, Southwest Florida Community Foundation (charitable organization); former Directorships: ICI Mutual Insurance Company (2007–2015); Sun Capital Advisers Trust (mutual funds) (2007–2012), Investment Company Institute (audit, executive, nominating committees) and Independent Directors Council (governance, executive committees) | | | 82 | | | — |
Paul K. Freeman* (1950) Board Member since 1993 | | Consultant, WorldBank/Inter-American Development Bank; Independent Directors Council (former chair); Investment Company Institute (executive committee); Adjunct Professor, University of Denver Law School (2017–present); formerly: Chairman of Education Committee of Independent Directors Council; Project Leader, International Institute for Applied Systems Analysis (1998–2001); Chief Executive Officer, The Eric Group, Inc. (environmental insurance) (1986–1998); Directorships: Knoebel Institute for Healthy Aging, University of Denver (2017–present); former Directorships: Prisma Energy International; Denver Zoo Foundation (2012–2018) | | | 82 | | | — |
| | | | |
Deutsche DWS Variable Series II — DWS Government Money Market VIP | | | | | 21 |
| | | | | | | | |
Name, Year of Birth,
Position with the Fund and
Length of Time Served1 | | Business Experience and Directorships During the Past Five Years | | Number of
Funds in
DWS Fund
Complex
Overseen | | | Other
Directorships
Held by Board
Member
|
Richard J. Herring (1946) Board Member since 1990 | | Jacob Safra Professor of International Banking and Professor of Finance, The Wharton School, University of Pennsylvania (since July 1972); Director, The Wharton Financial Institutions Center (since 1994); formerly: Vice Dean and Director, Wharton Undergraduate Division (1995–2000) and Director, The Lauder Institute of International Management Studies (2000–2006); Member FDIC Systemic Risk Advisory Committee since 2011, member Systemic Risk Council since 2012 and member of the Advisory Board at the Yale Program on Financial Stability since 2013; Formerly Co-Chair of the Shadow Financial Regulatory Committee (2003–2015), Executive Director of The Financial Economists Roundtable (2008–2015), Director of The Thai Capital Fund (2007–2013), Director of The Aberdeen Singapore Fund (2007–2018), and Nonexecutive Director of Barclays Bank DE (2010–2018) | | | 82 | | | Director,
Aberdeen
Japan Fund
(since 2007) |
William McClayton (1944) Board Member since 2004 | | Private equity investor (since October 2009); previously, Managing Director, Diamond Management & Technology Consultants, Inc. (global consulting firm) (2001–2009); Directorship: Board of Managers, YMCA of Metropolitan Chicago; formerly: Senior Partner, Arthur Andersen LLP (accounting) (1966–2001); Trustee, Ravinia Festival | | | 82 | | | — |
Rebecca W. Rimel (1951) Board Member since 1995 | | President, Chief Executive Officer and Director, The Pew Charitable Trusts (charitable organization) (1994–present); formerly: Executive Vice President, The Glenmede Trust Company (investment trust and wealth management) (1983–2004); Board Member, Investor Education (charitable organization) (2004–2005); Trustee, Executive Committee, Philadelphia Chamber of Commerce (2001–2007); Director, Viasys Health Care2 (January 2007–June 2007); Trustee, Thomas Jefferson Foundation (charitable organization) (1994–2012) | | | 82 | | | Director,
Becton
Dickinson
and
Company2
(medical
technology
company)
(2012–
present);
Director,
BioTelemetry
Inc.2(health
care) (2009–
present) |
William N. Searcy, Jr. (1946) Board Member since 1993 | | Private investor since October 2003; formerly: Pension & Savings Trust Officer, Sprint Corporation2(telecommunications) (November 1989–September 2003); Trustee, Sun Capital Advisers Trust (mutual funds) (1998–2012) | | | 82 | | | — |
Jean Gleason Stromberg (1943) Board Member since 1997 | | Retired. Formerly, Consultant (1997–2001); Director, Financial Markets U.S. Government Accountability Office (1996–1997); Partner, Norton Rose Fulbright, L.L.P. (law firm) (1978–1996); former Directorships: The William and Flora Hewlett Foundation (charitable organization) (2000–2015); Service Source, Inc. (nonprofit), Mutual Fund Directors Forum (2002–2004), American Bar Retirement Association (funding vehicle for retirement plans) (1987–1990 and 1994–1996) | | | 82 | | | — |
| | |
| Officers4 | | |
Name, Year of Birth, Position with the Fund and Length of Time Served5 | | Business Experience and Directorships During the Past Five Years |
Hepsen Uzcan6 (1974) President and Chief Executive Officer, 2017–present Assistant Secretary, 2013–present | | Managing Director,3 DWS; Secretary, DWS USA Corporation (since March 2018); Assistant Secretary, DWS Distributors, Inc. (since June 25, 2018); Director and Vice President, DWS Service Company (since June 25, 2018); Assistant Secretary, DWS Investment Management Americas, Inc. (since June 25, 2018); and Director and President, DB Investment Managers, Inc. (since June 25, 2018); formerly: Vice President for the Deutsche funds (2016–2017) |
John Millette8(1962) Vice President and Secretary, 1999–present | | Director,3DWS; Chief Legal Officer, DWS Investment Management Americas, Inc. (2015–present); and Director and Vice President, DWS Trust Company (2016–present); formerly: Secretary, Deutsche Investment Management Americas Inc. (2015–2017) |
Diane Kenneally8,9 (1966) Treasurer and Chief Financial Officer since 2018 | | Director,3 DWS; formerly: Assistant Treasurer for the DWS funds (2007–2018) |
Caroline Pearson8(1962) Chief Legal Officer, 2010–present | | Managing Director,3DWS; formerly: Secretary, Deutsche AM Distributors, Inc. (2002–2017); and Secretary, Deutsche AM Service Company (2010–2017) |
| | | | | | |
| | 22 | | | | | | Deutsche DWS Variable Series II — DWS Government Money Market VIP |
| | |
Name, Year of Birth, Position with the Fund and Length of Time Served5 | | Business Experience and Directorships During the Past Five Years |
Scott D. Hogan8(1970) Chief Compliance Officer, 2016–present | | Director,3DWS |
Wayne Salit7(1967) Anti-Money Laundering Compliance Officer, 2014–present | | Director,3 Deutsche Bank; and AML Officer, DWS Trust Company; formerly: Managing Director, AML Compliance Officer at BNY Mellon (2011–2014); and Director, AML Compliance Officer at Deutsche Bank (2004–2011) |
Sheila Cadogan8(1966) Assistant Treasurer, 2017–present | | Director,3DWS; Director and Vice President, DWS Trust Company (since 2018) |
Paul Antosca8(1957) Assistant Treasurer, 2007–present | | Director,3DWS |
| 1 | The length of time served represents the year in which the Board Member joined the board of one or more DWS funds currently overseen by the Board. |
| 2 | A publicly held company with securities registered pursuant to Section 12 of the Securities Exchange Act of 1934. |
| 3 | Executive title, not a board directorship. |
| 4 | As a result of their respective positions held with the Advisor or its affiliates, these individuals are considered “interested persons” of the Advisor within the meaning of the 1940 Act. Interested persons receive no compensation from the Fund. |
| 5 | The length of time served represents the year in which the officer was first elected in such capacity for one or more DWS funds. |
| 6 | Address: 345 Park Avenue, New York, NY 10154. |
| 7 | Address: 60 Wall Street, New York, NY 10005. |
| 8 | Address: One International Place, Boston, MA 02110. |
| 9 | Appointed Treasurer and Chief Financial Officer effective July 2, 2018. |
| * | Paul K. Freeman retired from the Board effective December 31, 2018. |
The Fund’s Statement of Additional Information (“SAI”) includes additional information about the Board Members. The SAI is available, without charge, upon request. If you would like to request a copy of the SAI, you may do so by calling the followingtoll-free number:(800) 728-3337.
| | | | |
Deutsche DWS Variable Series II — DWS Government Money Market VIP | | | | | 23 |
| | |
| | |
VS2GMM-2 (R-025834-8 2/19) | | |
December 31, 2018
Annual Report
Deutsche DWS Variable Series II
(formerly Deutsche Variable Series II)
DWS High Income VIP
(formerly Deutsche High Income VIP)
Beginning on January 1, 2021, as permitted by regulations adopted by the Securities and Exchange Commission, you may not be receiving paper copies of the Fund’s shareholder reports from the insurance company that offers your contract unless you specifically request paper copies from your insurance company or from your financial intermediary. Instead, the shareholder reports will be made available on a Web site, and your insurance company will notify you by mail each time a report is posted and provide you with a Web site link to access the report. Instructions for requesting paper copies will be provided by your insurance company.
If you already elected to receive shareholder reports electronically, you will not be affected by this change and you need not take any action. You may elect to receive shareholder reports and other communications from your insurance company electronically by following the instructions provided by your insurance company.
You may elect to receive all future reports in paper free of charge from your insurance company. If your insurance company informs you that future reports will be delivered via Web access, you can inform your insurance company that you wish to continue receiving paper copies of your shareholder reports by following the instructions provided by your insurance company.

Contents
This report must be preceded or accompanied by a prospectus. To obtain an additional prospectus or summary prospectus, if available, call (800) 728-3337 or your financial representative. We advise you to consider the Fund’s objectives, risks, charges and expenses carefully before investing. The summary prospectus and prospectus contain this and other important information about the Fund. Please read the prospectus carefully before you invest.
Bond investments are subject to interest-rate, credit, liquidity and market risks to varying degrees. When interest rates rise, bond prices generally fall. Credit risk refers to the ability of an issuer to make timely payments of principal and interest. Investments in lower-quality (“junk bonds”) and non-rated securities present greater risk of loss than investments in higher-quality securities. Investing in derivatives entails special risks relating to liquidity, leverage and credit that may reduce returns and/or increase volatility. The Fund may lend securities to approved institutions. Please read the prospectus for details.
The brand DWS represents DWS Group GmbH & Co. KGaA and any of its subsidiaries such as DWS Distributors, Inc. which offers investment products or DWS Investment Management Americas, Inc. and RREEF America L.L.C. which offer advisory services.
DWS Distributors, Inc., 222 South Riverside Plaza, Chicago, IL 60606, (800) 621-1148
NOT FDIC/NCUA INSURED NO BANK GUARANTEE MAY LOSE VALUE NOT A DEPOSIT NOT INSURED BY ANY FEDERAL GOVERNMENT AGENCY
| | | | | | |
| | 2 | | | | | | Deutsche DWS Variable Series II — DWS High Income VIP |
| | |
| Performance Summary | | December 31, 2018 (Unaudited) |
Fund performance shown is historical, assumes reinvestment of all dividend and capital gain distributions and does not guarantee future results. Investment return and principal value fluctuate with changing market conditions so that, when redeemed, shares may be worth more or less than their original cost. Current performance may be lower or higher than the performance data quoted. Please contact your participating insurance company for the Fund’s most recent month-end performance. Performance does not reflect charges and fees (“contract charges”) associated with the separate account that invests in the Fund or any variable life insurance policy or variable annuity contract for which the Fund is an investment option. These charges and fees will reduce returns. While all share classes have the same underlying portfolio, their performance will differ.
The gross expense ratios of the Fund, as stated in the fee table of the prospectus dated May 1, 2018 are 0.78% and 1.15% for Class A and Class B shares, respectively, and may differ from the expense ratios disclosed in the Financial Highlights tables in this report.
Generally accepted accounting principles require adjustments to be made to the net assets of the Fund at period end for financial reporting purposes only, and as such, the total return based on the unadjusted net asset value per share may differ from the total return reported in the financial highlights.
Growth of an Assumed $10,000 Investment in DWS High Income VIP
| | |
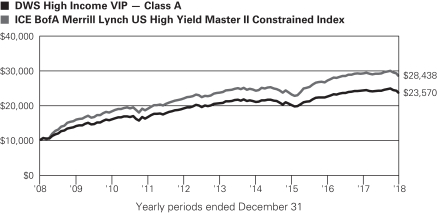 | | ICE BofA Merrill Lynch US High Yield Master II Constrained Index tracks the performance of US dollar denominated below investment grade corporate debt publicly issued in the US domestic market. Index returns do not reflect any fees or expenses and it is not possible to invest directly into an index. |
| | | | | | | | | | |
| Comparative Results | | | | | | | | | | |
| | | | | |
| DWS High Income VIP | | | | 1-Year | | 3-Year | | 5-Year | | 10-Year |
| Class A | | Growth of $10,000 | | $9,748 | | $11,829 | | $11,470 | | $23,570 |
| | | Average annual total return | | –2.52% | | 5.76% | | 2.78% | | 8.95% |
| ICE BofA Merrill Lynch US High Yield Master II Constrained Index | | Growth of $10,000 | | $9,773 | | $12,342 | | $12,068 | | $28,438 |
| | Average annual total return | | –2.27% | | 7.27% | | 3.83% | | 11.02% |
| | | | | |
| DWS High Income VIP | | | | 1-Year | | 3-Year | | 5-Year | | 10-Year |
| Class B | | Growth of $10,000 | | $9,724 | | $11,746 | | $11,302 | | $22,889 |
| | | Average annual total return | | –2.76% | | 5.51% | | 2.48% | | 8.63% |
| ICE BofA Merrill Lynch US High Yield Master II Constrained Index | | Growth of $10,000 | | $9,773 | | $12,342 | | $12,068 | | $28,438 |
| | Average annual total return | | –2.27% | | 7.27% | | 3.83% | | 11.02% |
The growth of $10,000 is cumulative.
| | | | |
Deutsche DWS Variable Series II — DWS High Income VIP | | | | | 3 |
| | |
| Management Summary | | December 31, 2018 (Unaudited) |
The Fund returned –2.52% in 2018 (Class A shares, unadjusted for contract charges), slightly underperforming the –2.27% return of its benchmark, the ICE BofA ML U.S. High Yield Master II Constrained Index. Much of the downturn for the index occurred in the fourth calendar quarter, when the combination of emerging concerns about the global growth outlook, uncertainty regarding U.S. trade policy, and shifting expectations for interest rates weighed heavily on higher-risk assets across the globe. A sharp drop in oil prices exacerbated the weakness in high yield in the final three months of the year, causing the index to decline 4.67% in that time.
In terms of the Fund’s broad positioning, an underweight in the poor-performing oil field services industry contributed to performance, as did an overweight in wireline communications. However, an overweight in chemicals, which lagged, was a detractor. From a ratings perspective, an underweight in lower-rated issues — particularly those rated CCC and below — aided results. Lower-rated bonds, after outperforming in the first nine months of the year, trailed the broader market by a wide margin in the fourth quarter.
At the individual security level, an overweight position in the short-dated bonds of the telecommunications company Frontier Communications Corp. contributed to performance. The bonds moved higher as it became increasingly clear that the company would refinance its near-term maturities. The exploration and production firm MEG Energy Corp., whose bonds rallied after the company became the target of a potential acquisition, also aided Fund performance. A zero weighting in Sanchez Energy Corp. further benefited results. The bonds traded weaker as the downturn in oil prices caused the company to encounter financial difficulties.
Adient Global Holdings Ltd., an automotive parts manufacturing firm that was hurt by operational issues, higher raw material prices, and changes to its senior management team, was a key detractor. Overweights in the energy exploration and production companies Halcon Resources Corp. and Hilcorp Energy LP also weighed on Fund returns, as the decline in oil prices eroded their financial health.
The Fund used derivatives to hedge its modest euro exposure back into U.S. dollars, which had no impact on relative performance. We also used a small investment in the credit default swap index (CDX) to gain short-term exposure to the broad market. The CDX position rose in value, slightly benefiting performance. While we use derivatives periodically for specific purposes, they are not a core aspect of our strategy.
We retain a cautiously positive view on the high-yield market, as we see a low probability of a recession in the near term. In addition, corporate fundamentals are solid and the default rate appears likely to remain low. The use of proceeds from new issuance remains focused on refinancing, which has reduced concerns about near-term maturities for high-yield issuers and contributing to low default expectations. Potential disruptions to this outlook include the possibility of poorly communicated or faster-than-expected tightening by the U.S. Federal Reserve, lingering geopolitical and macroeconomic issues, and/or resurgent global trade tensions.We continue to monitor the overall credit quality and covenant terms ofnew-issue bonds, as we view an increase in equity-friendly use of proceeds as a possible source of market disruption once the business cycle turns and credit conditions tighten.
We think the recent steep decline in the prices created an opportunity for select high-yield investments to generate favorable total returns. However, even with yield spreads having risen to more compelling levels, we believe fundamental credit analysis remains necessary to identify securities with attractive total return potential relative to the underlying risks. In addition, we seek to recognize broader investment themes that can translate to opportunities from sector allocation.
The views expressed reflect those of the portfolio management team only through the end of the period of the report as stated on the cover. The management team’s views are subject to change at any time based on market and other conditions and should not be construed as a recommendation. Past performance is no guarantee of future results. Current and future portfolio holdings are subject to risk.
Gary Russell, CFA, Managing Director
Thomas R. Bouchard, Director
Lonnie Fox, Director
Portfolio Managers
The views expressed reflect those of the portfolio management team only through the end of the period of the report as stated on the cover. The management team’s views are subject to change at any time based on market and other conditions and should not be construed as a recommendation. Past performance is no guarantee of future results. Current and future portfolio holdings are subject to risk.
| | | | | | |
| | 4 | | | | | | Deutsche DWS Variable Series II — DWS High Income VIP |
Terms to Know
TheICE BofA ML US High Yield Master II Constrained Index tracks the performance of U.S. dollar denominated below-investment-grade corporate debt publicly issued in the U.S. domestic market.
Credit quality measures a bond issuer’s ability to repay interest and principal in a timely manner. Rating agencies assign letter designations, such as AAA, AA and so forth. The lower the rating, the higher the probability of default. Credit quality does not remove market risk and is subject to change.
Overweightmeans a fund holds a higher weighting in a given sector or individual security compared with its benchmark index;underweightmeans a fund holds a lower weighting.
Contribution anddetraction incorporate both an investment’s total return and its weighting in the Fund.
Derivatives are contracts whose values can be based on a variety of instruments, including indices, currencies or securities. They can be utilized for a variety of reasons, including for hedging purposes, for risk management, fornon-hedging purposes to seek to enhance potential gains, as a substitute for direct investment in a particular asset class or to keep cash on hand to meet shareholder redemptions. Investing in derivatives entails special risks relating to liquidity, leverage and credit that may reduce returns and/or increase volatility.
Aswap is a derivative in which two counterparties exchange cash flows of one party’s financial instrument for those of the other party’s financial instrument for a set period of time.
| | | | |
Deutsche DWS Variable Series II — DWS High Income VIP | | | | | 5 |
| | |
| Portfolio Summary | | (Unaudited) |
| | | | | | | | |
| Asset Allocation (As a % of Investment Portfolio excluding Securities Lending Collateral) | | 12/31/18 | | | 12/31/17 | |
| Corporate Bonds | | | 83% | | | | 93% | |
| Cash Equivalent | | | 8% | | | | 4% | |
Loan Participations and Assignments | | | 6% | | | | — | |
| Convertible Bonds | | | 3% | | | | 3% | |
Common Stocks | | | 0% | | | | 0% | |
Warrants | | | 0% | | | | 0% | |
| | | | 100% | | | | 100% | |
| | |
Sector Diversification (As a % of Investment Portfolio excluding Cash Equivalent and Securities
Lending Collateral) | | 12/31/18 | | | 12/31/17 | |
Communication Services | | | 23% | | | | 21% | |
| Energy | | | 22% | | | | 23% | |
| Materials | | | 17% | | | | 18% | |
| Consumer Discretionary | | | 10% | | | | 12% | |
| Health Care | | | 10% | | | | 7% | |
| Industrials | | | 7% | | | | 7% | |
| Real Estate | | | 3% | | | | 2% | |
| Utilities | | | 3% | | | | 4% | |
Information Technology | | | 2% | | | | 3% | |
Consumer Staples | | | 2% | | | | 2% | |
| Financials | | | 1% | | | | 1% | |
| | | | 100% | | | | 100% | |
| | |
| Quality (As a % of Investment Portfolio excluding Cash Equivalent and Securities Lending Collateral) | | 12/31/18 | | | 12/31/17 | |
| BBB | | | 10% | | | | 5% | |
| BB | | | 56% | | | | 54% | |
| B | | | 28% | | | | 34% | |
| CCC | | | 2% | | | | 3% | |
| Not Rated | | | 4% | | | | 4% | |
| | | | 100% | | | | 100% | |
The quality ratings represent the higher of Moody’s Investors Service, Inc. (“Moody’s”), Fitch Ratings, Inc. (“Fitch”) or Standard & Poor’s Corporation (“S&P”) credit ratings. The ratings of Moody’s, Fitch and S&P represent their opinions as to the quality of the securities they rate. Credit quality measures a bond issuer’s ability to repay interest and principal in a timely manner. Ratings are relative and subjective and are not absolute standards of quality. Credit quality does not remove market risk and is subject to change.
Portfolio holdings and characteristics are subject to change.
For more complete details about the Fund’s investment portfolio, see page 7.
Following the Fund’s fiscal first and third quarter-end, a complete portfolio holdings listing is filed with the SEC on Form N-Q or Form N-PORT (available for filings after March 31, 2019). The Fund’s Form N-Q or Form N-PORT will be available on the SEC’s Web site at sec.gov. The Fund’s portfolio holdings are also posted on dws.com from time to time. Please see the Fund’s current prospectus for more information.
| | | | | | |
| | 6 | | | | | | Deutsche DWS Variable Series II — DWS High Income VIP |
| | |
| Investment Portfolio | | December 31, 2018 |
| | | | | | | | |
| | | Principal
Amount ($)(a) | | | Value ($) | |
| Corporate Bonds 83.5% | |
| Communication Services 17.0% | |
Altice France SA: | |
144A, 7.375%, 5/1/2026 | | | 910,000 | | | | 834,925 | |
144A, 8.125%, 2/1/2027 | | | 200,000 | | | | 188,500 | |
Altice Luxembourg SA, 144A, 7.75%, 5/15/2022 | | | 243,000 | | | | 221,130 | |
CCO Holdings LLC: | |
144A, 5.0%, 2/1/2028 | | | 150,000 | | | | 138,000 | |
144A, 5.125%, 5/1/2027 | | | 125,000 | | | | 116,425 | |
5.25%, 9/30/2022 | | | 680,000 | | | | 674,050 | |
144A, 5.5%, 5/1/2026 | | | 210,000 | | | | 201,862 | |
144A, 5.875%, 4/1/2024 | | | 170,000 | | | | 169,150 | |
144A, 5.875%, 5/1/2027 | | | 200,000 | | | | 194,000 | |
CenturyLink, Inc.: | |
Series V, 5.625%, 4/1/2020 | | | 180,000 | | | | 179,100 | |
Series W, 6.75%, 12/1/2023 (b) | | | 90,000 | | | | 86,738 | |
Clear Channel Worldwide Holdings, Inc., Series A,
6.5%, 11/15/2022 | | | 180,000 | | | | 178,200 | |
CSC Holdings LLC: | |
144A, 5.125%, 12/15/2021 | | | 437,000 | | | | 428,260 | |
144A, 5.5%, 4/15/2027 | | | 345,000 | | | | 320,850 | |
144A, 7.5%, 4/1/2028 | | | 200,000 | | | | 199,500 | |
144A, 10.875%, 10/15/2025 | | | 230,000 | | | | 258,462 | |
DISH DBS Corp.: | |
5.875%, 7/15/2022 | | | 260,000 | | | | 239,200 | |
5.875%, 11/15/2024 | | | 135,000 | | | | 108,675 | |
7.75%, 7/1/2026 | | | 60,000 | | | | 49,650 | |
Frontier Communications Corp.: | |
7.125%, 1/15/2023 | | | 440,000 | | | | 248,600 | |
10.5%, 9/15/2022 | | | 50,000 | | | | 34,750 | |
11.0%, 9/15/2025 | | | 80,000 | | | | 49,796 | |
Intelsat Jackson Holdings SA: | |
144A, 8.5%, 10/15/2024 | | | 215,000 | | | | 208,550 | |
144A, 9.75%, 7/15/2025 | | | 170,000 | | | | 170,476 | |
Netflix, Inc.: | |
4.375%, 11/15/2026 (b) | | | 180,000 | | | | 163,350 | |
144A, 4.625%, 5/15/2029 | | | EUR 130,000 | | | | 145,986 | |
5.875%, 2/15/2025 | | | 60,000 | | | | 60,525 | |
Sirius XM Radio, Inc., 144A, 3.875%, 8/1/2022 | | | 300,000 | | | | 285,000 | |
SoftBank Group Corp., REG S, 5.0%, 4/15/2028 | | | EUR 100,000 | | | | 110,777 | |
Sprint Capital Corp.: | |
6.875%, 11/15/2028 | | | 85,000 | | | | 80,325 | |
8.75%, 3/15/2032 | | | 115,000 | | | | 121,325 | |
Sprint Corp.: | |
7.125%, 6/15/2024 | | | 805,000 | | | | 797,224 | |
7.625%, 3/1/2026 | | | 135,000 | | | | 133,312 | |
T-Mobile U.S.A., Inc.: | |
4.75%, 2/1/2028 | | | 65,000 | | | | 58,825 | |
6.0%, 4/15/2024 | | | 164,000 | | | | 164,000 | |
6.5%, 1/15/2026 | | | 10,000 | | | | 10,200 | |
Telesat Canada, 144A, 8.875%, 11/15/2024 | | | 130,000 | | | | 135,200 | |
ViaSat, Inc., 144A, 5.625%, 9/15/2025 | | | 55,000 | | | | 50,600 | |
Virgin Media Secured Finance PLC: | |
144A, 5.25%, 1/15/2026 | | | 200,000 | | | | 183,250 | |
144A, 5.5%, 8/15/2026 | | | 215,000 | | | | 198,843 | |
| | | | | | | | |
| | | Principal
Amount ($)(a) | | | Value ($) | |
Zayo Group LLC: | |
144A, 5.75%, 1/15/2027 | | | 240,000 | | | | 214,200 | |
6.0%, 4/1/2023 | | | 185,000 | | | | 175,308 | |
6.375%, 5/15/2025 | | | 281,000 | | | | 261,330 | |
| | | | | | | | |
| | | | | | | 8,848,429 | |
|
| Consumer Discretionary 9.0% | |
Adient Global Holdings Ltd.,
REG S, 3.5%, 8/15/2024 | | | EUR 185,000 | | | | 170,096 | |
Ally Financial, Inc., 5.75%, 11/20/2025 (b) | | | 110,000 | | | | 109,450 | |
American Axle & Manufacturing, Inc.: | |
6.25%, 4/1/2025 (b) | | | 160,000 | | | | 145,600 | |
6.25%, 3/15/2026 | | | 65,000 | | | | 58,338 | |
Asbury Automotive Group, Inc., 6.0%, 12/15/2024 | | | 219,000 | | | | 209,692 | |
Ashtead Capital, Inc., 144A, 5.25%, 8/1/2026 | | | 240,000 | | | | 231,600 | |
Ashton Woods U.S.A. LLC, 144A, 6.75%, 8/1/2025 | | | 165,000 | | | | 143,550 | |
Boyd Gaming Corp.: | |
6.0%, 8/15/2026 | | | 160,000 | | | | 149,600 | |
6.875%, 5/15/2023 | | | 100,000 | | | | 101,000 | |
Cumberland Farms, Inc., 144A, 6.75%, 5/1/2025 | | | 48,000 | | | | 48,240 | |
Dana Financing Luxembourg Sarl: | |
144A, 5.75%, 4/15/2025 | | | 155,000 | | | | 144,537 | |
144A, 6.5%, 6/1/2026 | | | 160,000 | | | | 153,400 | |
Dana, Inc., 5.5%, 12/15/2024 | | | 65,000 | | | | 60,450 | |
Eldorado Resorts Inc, 144A, 6.0%, 9/15/2026 | | | 173,000 | | | | 163,485 | |
Fiat Chrysler Automobiles NV, 5.25%, 4/15/2023 | | | 445,000 | | | | 435,544 | |
Group 1 Automotive, Inc., 5.0%, 6/1/2022 | | | 80,000 | | | | 75,800 | |
HD Supply, Inc., 144A, 5.375%, 10/15/2026 | | | 190,000 | | | | 184,300 | |
Lennar Corp.: | |
4.75%, 11/15/2022 | | | 110,000 | | | | 106,700 | |
4.75%, 11/29/2027 | | | 120,000 | | | | 108,300 | |
5.0%, 6/15/2027 | | | 50,000 | | | | 45,625 | |
Merlin Entertainments PLC, 144A, 5.75%, 6/15/2026 | | | 200,000 | | | | 197,500 | |
MGM Resorts International, 5.75%, 6/15/2025 | | | 190,000 | | | | 183,350 | |
NCL Corp., Ltd., 144A, 4.75%, 12/15/2021 | | | 93,000 | | | | 92,303 | |
Netflix, Inc., 144A, 5.875%, 11/15/2028 | | | 71,000 | | | | 68,991 | |
Penn National Gaming, Inc., 144A, 5.625%, 1/15/2027 | | | 80,000 | | | | 71,600 | |
Penske Automotive Group, Inc., 5.5%, 5/15/2026 | | | 165,000 | | | | 153,450 | |
Rivers Pittsburgh Borrower LP, 144A, 6.125%, 8/15/2021 | | | 50,000 | | | | 48,500 | |
Seminole Hard Rock Entertainment, Inc., 144A, 5.875%, 5/15/2021 | | | 90,000 | | | | 89,775 | |
Sonic Automotive, Inc., 6.125%, 3/15/2027 | | | 55,000 | | | | 48,125 | |
Stars Group Holdings BV, 144A, 7.0%, 7/15/2026 | | | 200,000 | | | | 194,500 | |
The accompanying notes are an integral part of the financial statements.
| | | | |
Deutsche DWS Variable Series II — DWS High Income VIP | | | | | 7 |
| | | | | | | | |
| | | Principal
Amount ($)(a) | | | Value ($) | |
Suburban Propane Partners LP, 5.75%, 3/1/2025 | | | 105,000 | | | | 96,075 | |
Toll Brothers Finance Corp., 4.35%, 2/15/2028 | | | 127,000 | | | | 108,585 | |
TRI Pointe Group, Inc., 5.25%, 6/1/2027 | | | 135,000 | | | | 105,259 | |
United Rentals North America, Inc., 6.5%, 12/15/2026 | | | 125,000 | | | | 123,125 | |
Viking Cruises Ltd., 144A, 5.875%, 9/15/2027 | | | 205,000 | | | | 191,162 | |
WMG Acquisition Corp., 144A, 5.0%, 8/1/2023 | | | 75,000 | | | | 72,938 | |
| | | | | | | | |
| | | | | | | 4,690,545 | |
|
| Consumer Staples 2.1% | |
Cott Holdings, Inc., 144A, 5.5%, 4/1/2025 | | | 225,000 | | | | 212,063 | |
FAGE International SA, 144A, 5.625%, 8/15/2026 | | | 220,000 | | | | 188,100 | |
JBS U.S.A. LUX SA: | |
144A, 5.75%, 6/15/2025 | | | 210,000 | | | | 200,550 | |
144A, 6.75%, 2/15/2028 | | | 235,000 | | | | 229,125 | |
Pilgrim’s Pride Corp.: | |
144A, 5.75%, 3/15/2025 | | | 50,000 | | | | 46,875 | |
144A, 5.875%, 9/30/2027 | | | 150,000 | | | | 136,125 | |
Simmons Foods, Inc., 144A, 5.75%, 11/1/2024 | | | 100,000 | | | | 71,000 | |
| | | | | | | | |
| | | | | | | 1,083,838 | |
|
| Energy 20.3% | |
Antero Midstream Partners LP, 5.375%, 9/15/2024 | | | 125,000 | | | | 116,563 | |
Antero Resources Corp.: | |
5.125%, 12/1/2022 | | | 100,000 | | | | 94,000 | |
5.375%, 11/1/2021 | | | 420,000 | | | | 405,300 | |
5.625%, 6/1/2023 | | | 45,000 | | | | 42,750 | |
Ascent Resources Utica Holdings LLC, 144A, 7.0%, 11/1/2026 | | | 85,000 | | | | 76,925 | |
Blue Racer Midstream LLC, 144A, 6.125%, 11/15/2022 | | | 295,000 | | | | 284,675 | |
Carrizo Oil & Gas, Inc.,
8.25%, 7/15/2025 | | | 100,000 | | | | 98,000 | |
Cheniere Corpus Christi Holdings LLC: | |
5.125%, 6/30/2027 | | | 230,000 | | | | 217,131 | |
5.875%, 3/31/2025 | | | 165,000 | | | | 164,175 | |
7.0%, 6/30/2024 | | | 470,000 | | | | 495,850 | |
Cheniere Energy Partners LP, 144A, 5.625%, 10/1/2026 | | | 160,000 | | | | 149,600 | |
Chesapeake Energy Corp.: | |
7.5%, 10/1/2026 | | | 80,000 | | | | 68,400 | |
8.0%, 1/15/2025 (b) | | | 165,000 | | | | 145,613 | |
8.0%, 6/15/2027 | | | 315,000 | | | | 264,600 | |
CNX Midstream Partners LP, 144A, 6.5%, 3/15/2026 | | | 107,000 | | | | 101,650 | |
Crestwood Midstream Partners LP: | |
5.75%, 4/1/2025 | | | 65,000 | | | | 60,288 | |
6.25%, 4/1/2023 | | | 245,000 | | | | 235,812 | |
DCP Midstream Operating LP: | |
3.875%, 3/15/2023 | | | 100,000 | | | | 93,750 | |
5.375%, 7/15/2025 | | | 215,000 | | | | 210,162 | |
Diamondback Energy, Inc.: | |
144A, 4.75%, 11/1/2024 | | | 220,000 | | | | 212,300 | |
4.75%, 11/1/2024 | | | 125,000 | | | | 120,625 | |
| | | | | | | | |
| | | Principal
Amount ($)(a) | | | Value ($) | |
Endeavor Energy Resources LP: | |
144A, 5.5%, 1/30/2026 | | | 35,000 | | | | 35,875 | |
144A, 5.75%, 1/30/2028 | | | 35,000 | | | | 35,707 | |
Energy Transfer LP,
5.5%, 6/1/2027 | | | 145,000 | | | | 141,375 | |
Extraction Oil & Gas, Inc., 144A, 5.625%, 2/1/2026 | | | 135,000 | | | | 98,550 | |
Genesis Energy LP: | |
6.25%, 5/15/2026 | | | 215,000 | | | | 184,362 | |
6.5%, 10/1/2025 | | | 305,000 | | | | 268,400 | |
Gulfport Energy Corp.: | |
6.0%, 10/15/2024 | | | 60,000 | | | | 53,100 | |
6.375%, 5/15/2025 | | | 100,000 | | | | 88,500 | |
6.375%, 1/15/2026 | | | 150,000 | | | | 129,750 | |
Halcon Resources Corp.,
6.75%, 2/15/2025 | | | 125,000 | | | | 91,250 | |
Hilcorp Energy I LP: | |
144A, 5.0%, 12/1/2024 | | | 105,000 | | | | 92,925 | |
144A, 5.75%, 10/1/2025 | | | 245,000 | | | | 218,050 | |
144A, 6.25%, 11/1/2028 | | | 205,000 | | | | 180,400 | |
Holly Energy Partners LP, 144A, 6.0%, 8/1/2024 | | | 225,000 | | | | 220,500 | |
Jagged Peak Energy LLC, 144A, 5.875%, 5/1/2026 | | | 74,000 | | | | 68,820 | |
Laredo Petroleum, Inc.: | |
5.625%, 1/15/2022 | | | 70,000 | | | | 62,825 | |
6.25%, 3/15/2023 (b) | | | 215,000 | | | | 192,962 | |
Matador Resources Co., 5.875%, 9/15/2026 | | | 134,000 | | | | 123,280 | |
MEG Energy Corp., 144A,
6.5%, 1/15/2025 | | | 234,000 | | | | 237,510 | |
Murphy Oil U.S.A., Inc.,
5.625%, 5/1/2027 | | | 65,000 | | | | 62,400 | |
Nabors Industries, Inc.: | |
5.5%, 1/15/2023 (b) | | | 15,000 | | | | 11,906 | |
5.75%, 2/1/2025 | | | 80,000 | | | | 60,566 | |
NuStar Logistics LP,
5.625%, 4/28/2027 | | | 236,000 | | | | 220,070 | |
Oasis Petroleum, Inc.: | |
6.875%, 3/15/2022 (b) | | | 138,000 | | | | 130,065 | |
6.875%, 1/15/2023 | | | 60,000 | | | | 55,425 | |
Parsley Energy LLC: | |
144A, 5.25%, 8/15/2025 | | | 55,000 | | | | 49,775 | |
144A, 5.375%, 1/15/2025 | | | 85,000 | | | | 78,200 | |
144A, 5.625%, 10/15/2027 | | | 120,000 | | | | 109,050 | |
PDC Energy, Inc.,
6.125%, 9/15/2024 | | | 150,000 | | | | 138,750 | |
Peabody Energy Corp., 144A, 6.0%, 3/31/2022 | | | 295,000 | | | | 286,150 | |
Precision Drilling Corp., 144A, 7.125%, 1/15/2026 | | | 110,000 | | | | 94,600 | |
Range Resources Corp.: | |
4.875%, 5/15/2025 | | | 125,000 | | | | 102,500 | |
5.0%, 8/15/2022 | | | 305,000 | | | | 272,975 | |
5.0%, 3/15/2023 | | | 125,000 | | | | 110,000 | |
5.875%, 7/1/2022 | | | 140,000 | | | | 129,500 | |
Resolute Energy Corp., 8.5%, 5/1/2020 | | | 31,000 | | | | 30,535 | |
Shelf Drilling Holdings Ltd., 144A, 8.25%, 2/15/2025 | | | 180,000 | | | | 153,900 | |
Southwestern Energy Co.: | |
6.2%, 1/23/2025 | | | 60,000 | | | | 53,625 | |
7.75%, 10/1/2027 | | | 330,000 | | | | 313,500 | |
The accompanying notes are an integral part of the financial statements.
| | | | | | |
| | 8 | | | | | | Deutsche DWS Variable Series II — DWS High Income VIP |
| | | | | | | | |
| | | Principal
Amount ($)(a) | | | Value ($) | |
Sunoco LP: | |
5.5%, 2/15/2026 | | | 130,000 | | | | 123,175 | |
5.875%, 3/15/2028 | | | 35,000 | | | | 32,738 | |
Targa Resources Partners LP: | |
4.25%, 11/15/2023 | | | 210,000 | | | | 194,512 | |
5.0%, 1/15/2028 | | | 235,000 | | | | 212,675 | |
5.375%, 2/1/2027 | | | 260,000 | | | | 243,750 | |
144A, 5.875%, 4/15/2026 | | | 113,000 | | | | 109,893 | |
Transocean, Inc., 144A,
9.0%, 7/15/2023 | | | 110,000 | | | | 109,450 | |
U.S.A. Compression Partners LP, 144A, 6.875%, 4/1/2026 | | | 142,000 | | | | 136,320 | |
Weatherford International Ltd.: | |
4.5%, 4/15/2022 (b) | | | 190,000 | | | | 111,150 | |
8.25%, 6/15/2023 | | | 70,000 | | | | 42,000 | |
Whiting Petroleum Corp.,
5.75%, 3/15/2021 | | | 300,000 | | | | 285,000 | |
WPX Energy, Inc.: | |
5.25%, 9/15/2024 | | | 145,000 | | | | 131,225 | |
6.0%, 1/15/2022 | | | 43,000 | | | | 41,818 | |
8.25%, 8/1/2023 | | | 105,000 | | | | 109,725 | |
| | | | | | | | |
| | | | | | | 10,529,233 | |
|
| Financials 1.1% | |
CIT Group, Inc.: | |
4.75%, 2/16/2024 | | | 210,000 | | | | 202,125 | |
4.125%, 3/9/2021 | | | 15,000 | | | | 14,775 | |
CNO Financial Group, Inc.,
5.25%, 5/30/2025 | | | 100,000 | | | | 95,250 | |
Lincoln Finance Ltd., 144A, 7.375%, 4/15/2021 | | | 105,000 | | | | 106,313 | |
Tempo Acquisition LLC, 144A, 6.75%, 6/1/2025 | | | 75,000 | | | | 69,375 | |
Travelport Corporate Finance PLC, 144A, 6.0%, 3/15/2026 | | | 101,000 | | | | 102,010 | |
| | | | | | | | |
| | | | | | | 589,848 | |
|
| Health Care 8.9% | |
Avantor, Inc., 144A,
6.0%, 10/1/2024 | | | 70,000 | | | | 68,775 | |
Bausch Health Companies, Inc.: | |
144A, 5.625%, 12/1/2021 | | | 97,000 | | | | 95,545 | |
144A, 5.875%, 5/15/2023 | | | 170,000 | | | | 157,250 | |
144A, 6.125%, 4/15/2025 | | | 150,000 | | | | 130,875 | |
144A, 6.5%, 3/15/2022 | | | 105,000 | | | | 105,525 | |
144A, 7.0%, 3/15/2024 | | | 255,000 | | | | 257,550 | |
144A, 8.5%, 1/31/2027 | | | 275,000 | | | | 266,750 | |
144A, 9.25%, 4/1/2026 | | | 85,000 | | | | 85,000 | |
Centene Corp., 144A,
5.375%, 6/1/2026 | | | 95,000 | | | | 92,388 | |
Charles River Laboratories International, Inc., 144A,
5.5%, 4/1/2026 | | | 20,000 | | | | 19,700 | |
DaVita, Inc.: | |
5.0%, 5/1/2025 | | | 110,000 | | | | 99,825 | |
5.125%, 7/15/2024 | | | 110,000 | | | | 103,125 | |
Endo Dac, 144A, 6.0%, 7/15/2023 | | | 195,000 | | | | 148,688 | |
HCA, Inc.: | |
5.625%, 9/1/2028 | | | 340,000 | | | | 328,100 | |
4.75%, 5/1/2023 | | | 360,000 | | | | 354,600 | |
5.25%, 6/15/2026 | | | 580,000 | | | | 575,650 | |
5.375%, 9/1/2026 | | | 170,000 | | | | 165,325 | |
5.875%, 2/15/2026 | | | 190,000 | | | | 189,050 | |
| | | | | | | | |
| | | Principal
Amount ($)(a) | | | Value ($) | |
Mallinckrodt International Finance SA, 144A,
5.625%, 10/15/2023 (b) | | | 100,000 | | | | 76,000 | |
Tenet Healthcare Corp.: | |
4.5%, 4/1/2021 | | | 90,000 | | | | 87,525 | |
5.125%, 5/1/2025 | | | 225,000 | | | | 209,812 | |
6.75%, 6/15/2023 (b) | | | 45,000 | | | | 42,244 | |
7.0%, 8/1/2025 | | | 25,000 | | | | 23,125 | |
Teva Pharmaceutical Finance Netherlands III BV: | |
2.2%, 7/21/2021 | | | 335,000 | | | | 307,936 | |
6.0%, 4/15/2024 | | | 250,000 | | | | 240,803 | |
6.75%, 3/1/2028 | | | 200,000 | | | | 193,788 | |
WellCare Health Plans, Inc., 144A, 5.375%, 8/15/2026 | | | 210,000 | | | | 202,650 | |
| | | | | | | | |
| | | | | | | 4,627,604 | |
|
| Industrials 6.5% | |
Bombardier, Inc.: | |
144A, 5.75%, 3/15/2022 | | | 230,000 | | | | 214,475 | |
144A, 6.0%, 10/15/2022 | | | 283,000 | | | | 265,312 | |
BWX Technologies, Inc., 144A, 5.375%, 7/15/2026 | | | 30,000 | | | | 28,866 | |
Covanta Holding Corp.: | |
5.875%, 3/1/2024 | | | 160,000 | | | | 150,400 | |
5.875%, 7/1/2025 | | | 85,000 | | | | 78,200 | |
DAE Funding LLC: | |
144A, 4.5%, 8/1/2022 | | | 8,000 | | | | 7,680 | |
144A, 5.0%, 8/1/2024 | | | 25,000 | | | | 24,188 | |
144A, 5.75%, 11/15/2023 | | | 115,000 | | | | 113,850 | |
Energizer Gamma Acquisition, Inc., 144A, 6.375%, 7/15/2026 | | | 120,000 | | | | 110,100 | |
Meritor, Inc., 6.25%, 2/15/2024 | | | 75,000 | | | | 71,625 | |
Moog, Inc., 144A,
5.25%, 12/1/2022 | | | 120,000 | | | | 119,100 | |
Novelis Corp.: | |
144A, 5.875%, 9/30/2026 | | | 230,000 | | | | 203,550 | |
144A, 6.25%, 8/15/2024 | | | 290,000 | | | | 272,600 | |
Park Aerospace Holdings Ltd.: | |
144A, 4.5%, 3/15/2023 | | | 310,000 | | | | 289,850 | |
144A, 5.25%, 8/15/2022 | | | 327,000 | | | | 316,372 | |
144A, 5.5%, 2/15/2024 | | | 245,000 | | | | 236,425 | |
Prime Security Services Borrower LLC, 144A, 9.25%, 5/15/2023 | | | 4,000 | | | | 4,125 | |
Summit Materials LLC,
6.125%, 7/15/2023 | | | 200,000 | | | | 198,000 | |
Tennant Co., 5.625%, 5/1/2025 | | | 30,000 | | | | 28,275 | |
TransDigm, Inc.,
5.5%, 10/15/2020 | | | 150,000 | | | | 148,875 | |
United Rentals North America, Inc., 5.75%, 11/15/2024 | | | 540,000 | | | | 519,750 | |
| | | | | | | | |
| | | | | | | 3,401,618 | |
|
| Information Technology 1.8% | |
Cardtronics, Inc., 144A,
5.5%, 5/1/2025 | | | 95,000 | | | | 87,875 | |
Change Healthcare Holdings LLC, 144A, 5.75%, 3/1/2025 | | | 210,000 | | | | 195,825 | |
Dell International LLC, 144A, 5.875%, 6/15/2021 | | | 110,000 | | | | 109,881 | |
Fair Isaac Corp., 144A,
5.25%, 5/15/2026 | | | 130,000 | | | | 125,775 | |
First Data Corp., 144A,
5.375%, 8/15/2023 | | | 175,000 | | | | 171,938 | |
Refinitiv U.S. Holdings, Inc., 144A, 8.25%, 11/15/2026 | | | 85,000 | | | | 77,669 | |
The accompanying notes are an integral part of the financial statements.
| | | | |
Deutsche DWS Variable Series II — DWS High Income VIP | | | | | 9 |
| | | | | | | | |
| | | Principal
Amount ($)(a) | | | Value ($) | |
TTM Technologies, Inc., 144A, 5.625%, 10/1/2025 | | | 155,000 | | | | 144,150 | |
| | | | | | | | |
| | | | | | | 913,113 | |
|
| Materials 12.0% | |
AK Steel Corp.: | |
6.375%, 10/15/2025 (b) | | | 100,000 | | | | 77,000 | |
7.0%, 3/15/2027 | | | 60,000 | | | | 46,800 | |
7.5%, 7/15/2023 | | | 340,000 | | | | 337,450 | |
Ardagh Packaging Finance PLC, 144A, 6.0%, 2/15/2025 | | | 220,000 | | | | 203,086 | |
Axalta Coating Systems LLC, 144A, 4.875%, 8/15/2024 | | | 175,000 | | | | 165,375 | |
Berry Global, Inc.,
5.5%, 5/15/2022 | | | 315,000 | | | | 313,425 | |
BWAY Holding Co., 144A,
5.5%, 4/15/2024 | | | 175,000 | | | | 164,500 | |
Cascades, Inc., 144A,
5.5%, 7/15/2022 | | | 26,000 | �� | | | 25,350 | |
CF Industries, Inc.,
3.45%, 6/1/2023 | | | 145,000 | | | | 134,850 | |
Chemours Co.: | |
5.375%, 5/15/2027 | | | 115,000 | | | | 103,500 | |
6.625%, 5/15/2023 | | | 99,000 | | | | 99,990 | |
7.0%, 5/15/2025 | | | 60,000 | | | | 60,450 | |
Clearwater Paper Corp., 144A, 5.375%, 2/1/2025 | | | 110,000 | | | | 99,275 | |
Constellium NV: | |
144A, 4.625%, 5/15/2021 | | | EUR 150,000 | | | | 170,646 | |
144A, 5.75%, 5/15/2024 | | | 250,000 | | | | 230,000 | |
144A, 6.625%, 3/1/2025 | | | 250,000 | | | | 231,875 | |
Flex Acquisition Co., Inc, 144A, 7.875%, 7/15/2026 | | | 165,000 | | | | 148,500 | |
Freeport-McMoRan, Inc.: | |
3.55%, 3/1/2022 | | | 440,000 | | | | 416,350 | |
3.875%, 3/15/2023 | | | 115,000 | | | | 106,375 | |
4.0%, 11/14/2021 | | | 180,000 | | | | 175,050 | |
5.4%, 11/14/2034 | | | 65,000 | | | | 51,188 | |
5.45%, 3/15/2043 | | | 18,000 | | | | 13,703 | |
Hexion, Inc.: | |
6.625%, 4/15/2020 | | | 165,000 | | | | 131,587 | |
144A, 10.375%, 2/1/2022 | | | 40,000 | | | | 31,900 | |
Hudbay Minerals, Inc.: | |
144A, 7.25%, 1/15/2023 | | | 175,000 | | | | 172,812 | |
144A, 7.625%, 1/15/2025 (b) | | | 150,000 | | | | 146,625 | |
Kaiser Aluminum Corp.,
5.875%, 5/15/2024 | | | 145,000 | | | | 141,737 | |
Kronos International, Inc., REG S, 3.75%, 9/15/2025 | | | EUR 100,000 | | | | 102,545 | |
Mercer International, Inc.,
6.5%, 2/1/2024 | | | 110,000 | | | | 107,525 | |
NOVA Chemicals Corp.: | |
144A, 4.875%, 6/1/2024 | | | 185,000 | | | | 166,962 | |
144A, 5.25%, 6/1/2027 | | | 140,000 | | | | 123,900 | |
Platform Specialty Products Corp.: | |
144A, 5.875%, 12/1/2025 | | | 85,000 | | | | 79,475 | |
144A, 6.5%, 2/1/2022 | | | 290,000 | | | | 290,000 | |
Reynolds Group Issuer, Inc.: | |
144A, 5.125%, 7/15/2023 | | | 290,000 | | | | 276,225 | |
144A, 7.0%, 7/15/2024 | | | 35,000 | | | | 33,338 | |
Teck Resources Ltd.: | |
6.125%, 10/1/2035 | | | 225,000 | | | | 214,875 | |
6.25%, 7/15/2041 | | | 330,000 | | | | 312,675 | |
| | | | | | | | |
| | | Principal
Amount ($)(a) | | | Value ($) | |
Tronox Finance PLC, 144A, 5.75%, 10/1/2025 | | | 66,000 | | | | 53,460 | |
Tronox, Inc., 144A,
6.5%, 4/15/2026 (b) | | | 122,000 | | | | 101,260 | |
United States Steel Corp.: | |
6.25%, 3/15/2026 | | | 64,000 | | | | 56,000 | |
6.875%, 8/15/2025 | | | 295,000 | | | | 269,925 | |
WR Grace &Co-Conn, 144A, 5.125%, 10/1/2021 | | | 65,000 | | | | 64,350 | |
| | | | | | | | |
| | | | | | | 6,251,914 | |
|
| Real Estate 2.4% | |
CyrusOne LP: | |
(REIT), 5.0%, 3/15/2024 | | | 200,000 | | | | 196,000 | |
(REIT), 5.375%, 3/15/2027 | | | 165,000 | | | | 160,050 | |
Iron Mountain, Inc.: | |
144A, (REIT), 5.25%, 3/15/2028 | | | 115,000 | | | | 101,488 | |
5.75%, 8/15/2024 | | | 130,000 | | | | 123,500 | |
(REIT), 6.0%, 8/15/2023 | | | 300,000 | | | | 303,750 | |
MPT Operating Partnership LP, (REIT), 6.375%, 3/1/2024 | | | 170,000 | | | | 174,250 | |
SBA Communications Corp., (REIT), 4.0%, 10/1/2022 | | | 215,000 | | | | 204,787 | |
| | | | | | | | |
| | | | | | | 1,263,825 | |
|
| Utilities 2.4% | |
AmeriGas Partners LP: | |
5.5%, 5/20/2025 | | | 205,000 | | | | 187,575 | |
5.75%, 5/20/2027 | | | 110,000 | | | | 97,350 | |
Calpine Corp.: | |
144A, 5.25%, 6/1/2026 | | | 90,000 | | | | 82,125 | |
5.75%, 1/15/2025 | | | 45,000 | | | | 41,175 | |
NGL Energy Partners LP,
5.125%, 7/15/2019 | | | 140,000 | | | | 138,950 | |
NRG Energy, Inc.,
5.75%, 1/15/2028 | | | 200,000 | | | | 192,000 | |
Vistra Energy Corp.: | |
5.875%, 6/1/2023 | | | 70,000 | | | | 70,000 | |
7.625%, 11/1/2024 | | | 264,000 | | | | 278,520 | |
Vistra Operations Co., LLC, 144A, 5.5%, 9/1/2026 | | | 175,000 | | | | 168,438 | |
| | | | | | | | |
| | | | | | | | 1,256,133 | |
Total Corporate Bonds (Cost $46,342,438) | | | | 43,456,100 | |
|
| Loan Participations and Assignments 5.4% | |
| Senior Loans** | |
AMC Entertainment Holdings, Inc., Term Loan, USD LIBOR + 2.250%, 12/15/2022 (c) | | | 110,000 | | | | 106,178 | |
Axalta Coating Systems U.S. Holdings, Inc., Term Loan B3,3-month USD LIBOR + 1.750%, 4.553%, 6/1/2024 | | | 198,998 | | | | 188,135 | |
CenturyLink, Inc., Term Loan B,1-month USD LIBOR + 2.750%, 5.272%, 1/31/2025 | | | 1,326,799 | | | | 1,242,547 | |
CSC Holdings LLC, First Lien Term Loan,1-month USD LIBOR + 2.250%,
4.705%, 7/17/2025 | | | 238,187 | | | | 226,754 | |
First Data Corp., Term Loan, USD LIBOR + 2.00%, 7/8/2022 (c) | | | 250,000 | | | | 240,820 | |
The accompanying notes are an integral part of the financial statements.
| | | | | | |
| | 10 | | | | | | Deutsche DWS Variable Series II — DWS High Income VIP |
| | | | | | | | |
| | | Principal
Amount ($)(a) | | | Value ($) | |
| | |
Mediacom Illinois LLC, Term Loan N, USD LIBOR +
1.750%, 2/15/2024 (c) | | | 225,000 | | | | 215,251 | |
| | |
Sprint Communications, Inc., First Lien Term Loan B, USD LIBOR + 2.500%, 2/2/2024 (c) | | | 150,000 | | | | 143,126 | |
| | |
TransDigm, Inc., Term Loan F, USD LIBOR + 2.500%, 6/9/2023 (c) | | | 139,648 | | | | 132,142 | |
| | |
Unitymedia Finance LLC, Term Loan D,1-month USD LIBOR + 2.250%, 4.705%, 1/15/2026 | | | 88,493 | | | | 85,690 | |
| | |
UPC Financing Partnership, Term Loan AR, USD LIBOR + 2.500%, 1/15/2026 (c) | | | 225,000 | | | | 214,705 | |
Total Loan Participations and Assignments
(Cost $2,914,744) | | | | 2,795,348 | |
|
| Convertible Bonds 3.3% | |
| Communication Services 0.1% | |
DISH Network Corp.,
2.375%, 3/15/2024 | | | 35,000 | | | | 27,866 | |
|
| Materials 3.2% | |
| | |
GEO Specialty Chemicals, Inc.,3-monthUSD-LIBOR + 14.0%, 16.707%** PIK, 10/18/2025 (d) | | | 1,585,459 | | | | 1,710,710 | |
Total Convertible Bonds (Cost $1,612,280) | | | | 1,738,576 | |
| | |
| | | Shares | | | Value ($) | |
| Common Stocks 0.2% | | | | |
| Industrials 0.0% | |
Quad Graphics, Inc. | | | 287 | | | | 3,536 | |
| | | | | | | | |
| | | Shares | | | Value ($) | |
| Materials 0.2% | |
| | |
GEO Specialty Chemicals, Inc.* (d) | | | 927,264 | | | | 116,001 | |
| | |
GEO Specialty Chemicals, Inc. 144A* (d) | | | 2,206 | | | | 276 | |
| | | | | | | | |
| | | | | 116,277 | |
Total Common Stocks (Cost $502,972) | | | | 119,813 | |
|
| Warrant 0.1% | |
| Materials | |
Hercules Trust II, Expiration Date 3/31/2029* (d) (Cost $244,286) | | | 1,100 | | | | 27,119 | |
|
| Securities Lending Collateral 2.8% | |
DWS Government & Agency Securities Portfolio “DWS Government Cash Institutional Shares, 2.29% (e) (f)
(Cost $1,464,490) | | | 1,464,490 | | | | 1,464,490 | |
| |
| Cash Equivalent 8.4% | | | | |
DWS Central Cash Management Government Fund, 2.41% (e) (Cost $4,341,875) | | | 4,341,875 | | | | 4,341,875 | |
| | |
| | | % of Net
Assets | | | Value ($) | |
Total Investment Portfolio
(Cost $57,423,085) | | | 103.7 | | | | 53,943,321 | |
| Other Assets and Liabilities, Net | | | (3.7 | ) | | | (1,920,340 | ) |
| Net Assets | | | 100.0 | | | | 52,022,981 | |
A summary of the Fund’s transactions with affiliated investments during the year ended December 31, 2018 are as follows:
| | | | | | | | | | | | | | | | | | | | | | | | | | | | | | | | |
Value ($) at
12/31/2017 | | Purchases
Cost ($) | | | Sales
Proceeds ($) | | | Net
Realized
Gain/
(Loss) ($) | | | Net Change in
Unrealized
Appreciation
(Depreciation) ($) | | | Income ($) | | | Capital Gain
Distributions ($) | | | Number
of Shares
at
12/31/2018 | | | Value ($) at
12/31/2018 | |
Securities Lending Collateral 2.8% | |
DWS Government & Agency Securities Portfolio “DWS Government Cash Institutional Shares”, 2.29% (e) (f) | |
| 1,697,463 | | | — | | | | 232,973 | (g) | | | — | | | | — | | | | 33,635 | | | | — | | | | 1,464,490 | | | | 1,464,490 | |
Cash Equivalent 8.4% | |
DWS Central Cash Management Government Fund, 2.41% (e) | |
| 2,240,926 | | | 25,477,738 | | | | 23,376,789 | | | | — | | | | — | | | | 69,371 | | | | — | | | | 4,341,875 | | | | 4,341,875 | |
| 3,938,389 | | | 25,477,738 | | | | 23,609,762 | | | | — | | | | — | | | | 103,006 | | | | — | | | | 5,806,365 | | | | 5,806,365 | |
| * | Non-income producing security. |
| ** | Variable or floating rate security. These securities are shown at their current rate as of December 31, 2018. For securities based on a published reference rate and spread, the reference rate and spread are indicated within the description above. Certain variable rate securities are not based on a published reference rate and spread but adjust periodically based on current market conditions, prepayment of underlying positions and/or other variables. |
| (a) | Principal amount stated in U.S. dollars unless otherwise noted. |
| (b) | All or a portion of these securities were on loan. In addition, “Other Assets and Liabilities, Net” may include pending sales that are also on loan. The value of securities loaned at December 31, 2018 amounted to $1,401,654, which is 2.7% of net assets. |
| (c) | All or a portion of the security represents unsettled loan commitments at December 31, 2018 where the rate will be determined at time of settlement. |
| (d) | Investment was valued using significant unobservable inputs. |
| (e) | Affiliated fund managed by DWS Investment Management Americas, Inc. The rate shown is the annualizedseven-day yield at period end. |
The accompanying notes are an integral part of the financial statements.
| | | | |
Deutsche DWS Variable Series II — DWS High Income VIP | | | | | 11 |
| (f) | Represents collateral held in connection with securities lending. Income earned by the Fund is net of borrower rebates. |
| (g) | Represents the net increase (purchase cost) or decrease (sales proceeds) in the amount invested for the year ended December 31, 2018. |
144A: Security exempt from registration under Rule 144A of the Securities Act of 1933. These securities may be resold in transactions exempt from registration, normally to qualified institutional buyers.
LIBOR: London Interbank Offered Rate
PIK: Denotes that all or a portion of the income is paidin-kind in the form of additional principal.
REG S: Securities sold under Regulation S may not be offered, sold or delivered within the United States or to, or for the account or benefit of, U.S. persons, except pursuant to an exemption from, or in a transaction not subject to, the registration requirements of the Securities Act of 1933.
REIT: Real Estate Investment Trust
As of December 31, 2018, the Fund had the following open forward foreign currency contracts:
| | | | | | | | | | | | | | | | | | | | | | |
| Contracts to Deliver | | | In Exchange For | | | Settlement
Date | | | Unrealized
Depreciation ($) | | | Counterparty |
| EUR | | | 627,271 | | | | USD | | | | 719,179 | | | | 1/31/2019 | | | | (1,436 | ) | | Bank of America |
Currency Abbreviations
For information on the Fund’s policy and additional disclosures regarding forward foreign currency contracts, please refer to the Derivatives section of Note A in the accompanying Notes to Financial Statements.
Fair Value Measurements
Various inputs are used in determining the value of the Fund’s investments. These inputs are summarized in three broad levels. Level 1 includes quoted prices in active markets for identical securities. Level 2 includes other significant observable inputs (including quoted prices for similar securities, interest rates, prepayment speeds and credit risk). Level 3 includes significant unobservable inputs (including the Fund’s own assumptions in determining the fair value of investments). The level assigned to the securities valuations may not be an indication of the risk or liquidity associated with investing in those securities.
The following is a summary of the inputs used as of December 31, 2018 in valuing the Fund’s investments. For information on the Fund’s policy regarding the valuation of investments, please refer to the Security Valuation section of Note A in the accompanying Notes to Financial Statements.
| | | | | | | | | | | | | | | | |
| Assets | | Level 1 | | | Level 2 | | | Level 3 | | | Total | |
| Fixed Income Investments (h) | | | | | | | | | | | | | | | | |
Corporate Bonds | | $ | — | | | $ | 43,456,100 | | | $ | — | | | $ | 43,456,100 | |
Loan Participations and Assignments | | | — | | | | 2,795,348 | | | | — | | | | 2,795,348 | |
Convertible Bonds | | | — | | | | 27,866 | | | | 1,710,710 | | | | 1,738,576 | |
| Common Stocks (h) | | | 3,536 | | | | — | | | | 116,277 | | | | 119,813 | |
| Warrant | | | — | | | | — | | | | 27,119 | | | | 27,119 | |
| Short-Term Investments (h) | | | 5,806,365 | | | | — | | | | — | | | | 5,806,365 | |
| Total | | $ | 5,809,901 | | | $ | 46,279,314 | | | $ | 1,854,106 | | | $ | 53,943,321 | |
| | | | |
| Liabilities | | Level 1 | | | Level 2 | | | Level 3 | | | Total | |
| Derivatives (i) | | | | | | | | | | | | | | | | |
Forward Foreign Currency Exchange Contracts | | $ | — | | | $ | (1,436 | ) | | $ | — | | | $ | (1,436 | ) |
| Total | | $ | — | | | $ | (1,436 | ) | | $ | — | | | $ | (1,436 | ) |
| (h) | See Investment Portfolio for additional detailed categorizations. |
| (i) | Derivatives include unrealized appreciation (depreciation) on open forward foreign currency contract. |
The accompanying notes are an integral part of the financial statements.
| | | | | | |
| | 12 | | | | | | Deutsche DWS Variable Series II — DWS High Income VIP |
Level 3 Reconciliation
The following is a reconciliation of the Fund’s Level 3 investments for which significant unobservable inputs were used in determining value:
| | | | | | | | | | | | | | | | |
| | | Convertible
Bonds | | | Common
Stocks | | | Warrant | | | Total | |
Balance as of December 31, 2017 | | $ | 1,950,703 | | | $ | 49,368 | | | $ | 29,732 | | | $ | 2,029,803 | |
| Realized gains (loss) | | | — | | | | — | | | | — | | | | — | |
| Change in unrealized appreciation (depreciation) | | | (283,013 | ) | | | (143,913 | ) | | | (2,613 | ) | | | (429,539 | ) |
| Amortization of premium/accretion of discount | | | 229 | | | | — | | | | — | | | | 229 | |
| Purchases/PIK | | | 42,791 | | | | 210,822 | | | | — | | | | 253,613 | |
| (Sales) | | | — | | | | — | | | | — | | | | — | |
| Transfer into Level 3 | | | — | | | | — | | | | — | | | | — | |
| Transfer (out) of Level 3 | | | — | | | | — | | | | — | | | | — | |
| Balance as of December 31, 2018 | | $ | 1,710,710 | | | $ | 116,277 | | | $ | 27,119 | | | $ | 1,854,106 | |
| Net change in unrealized appreciation (depreciation) from investments still held as of December 31, 2018 | | $ | (283,013 | ) | | $ | (143,913 | ) | | $ | (2,613 | ) | | $ | (429,539 | ) |
| | | | | | | | | | | | |
| Quantitative Disclosure About Significant Unobservable Inputs |
| Asset Class | | Fair Value at 12/31/18 | | | Valuation Technique(s) | | | Unobservable Input | | Range (Weighted Average) |
| Common Stocks | | | | | | | | | | | | |
| Materials | | | $116,277 | | | | Market Approach | | | EBITDA Multiple | | 5.56% |
| | | | | | | | | | | Discount for lack of marketability | | 22% |
| Warrant | | | | | | | | | | | | |
| Materials | | | $27,119 | | | | Black Scholes Option Pricing Model | | | Implied Volatility of Option | | 21.61% |
| | | | | | | | | | | Discount for lack of marketability | | 20% |
| Convertible Bond | | | | | | | | | | | | |
| Materials | | | $1,710,710 | | | | Option Pricing Model | | | Implied Volatility of Option | | 45% |
| | | | | | | | | | Discount Rate | | 18.38% |
| | | | | | | | | | EBITDA Multiple | | 5.56% |
| | | | | | | | | | | Discount for lack of marketability | | 22% |
Qualitative Disclosure About Unobservable Inputs
Significant unobservable inputs developed by the Pricing Committee and used in the fair value measurement of the Fund’s convertible bond investment include enterprise value (EV) to earnings before interest, taxes, depreciation and amortization (EBITDA) ratio with a discount for lack of marketability; implied volatility of option; and discount rate. A significant change in the EV to EBITDA ratio and implied volatility of option may result in a significant change in the fair value measurement, while a significant change in the discount for lack of marketability and discount rate are unlikely to result in a materially higher or lower fair value measurement.
Significant unobservable inputs developed by the Pricing Committee and used in the fair value measurement of the Fund’s commonstock investment include enterprise value (EV) to earnings before interest, taxes, depreciation and amortization (EBITDA) ratio with a discount for lack of marketability. A significant change in the EV to EBITDA ratio may result in a significant change in the fair value measurement, while a significant change in the discount for lack of marketability is unlikely to result in a materially higher or lower fair value measurement.
Significant unobservable inputs developed by the Pricing Committee and used in the fair value measurement of the Fund’s warrants include volatility and discount for lack of marketability. A change in the volatility of the underlying asset as an input to the Black-Scholes model may have a significant change in the fair value measurement. A significant change in the discount for lack of marketability is unlikely to have a material impact to the fair value measurement.
A significant change in the broker quotes for the Fund’s senior loan investments could have a material change on the fair value measurement.
The accompanying notes are an integral part of the financial statements.
| | | | |
Deutsche DWS Variable Series II — DWS High Income VIP | | | | | 13 |
Statement of Assets and Liabilities
| | | | |
| as of December 31, 2018 | | | | |
| |
| Assets | | | | |
| Investments innon-affiliated securities, at value (cost $51,616,720) — including $1,401,654 of securities loaned | | $ | 48,136,956 | |
| Investment in DWS Government & Agency Securities Portfolio (cost $1,464,490)* | | | 1,464,490 | |
| Investment in DWS Central Cash Management Government Fund (cost $4,341,875) | | | 4,341,875 | |
| Foreign currency, at value (cost $10,056) | | | 10,057 | |
| Receivable for investments sold | | | 3,852 | |
| Receivable for Fund shares sold | | | 2,489 | |
| Interest receivable | | | 792,585 | |
| Due from Advisor | | | 10,933 | |
| Other assets | | | 1,446 | |
| Total assets | | | 54,764,683 | |
| |
| Liabilities | | | | |
| Payable upon return of securities loaned | | | 1,464,490 | |
| Payable for investments purchased | | | 1,075,792 | |
| Payable for Fund shares redeemed | | | 55,350 | |
| Unrealized depreciation on forward foreign currency contracts | | | 1,436 | |
| Accrued Trustees’ fees | | | 1,709 | |
| Other accrued expenses and payables | | | 142,925 | |
| Total liabilities | | | 2,741,702 | |
| Net assets, at value | | $ | 52,022,981 | |
| |
| Net Assets Consist of | | | | |
Distributable earnings (loss) | | | (6,881,707 | ) |
| Paid-in capital | | | 58,904,688 | |
| Net assets, at value | | $ | 52,022,981 | |
| |
| Net Asset Value | | | | |
Class A | | | | |
| |
| Net Asset Value, offering and redemption price per share ($51,888,699 ÷ 9,081,584 outstanding shares of beneficial interest, no par value, unlimited number of shares authorized) | | $ | 5.71 | |
Class B | | | | |
| |
| Net Asset Value, offering and redemption price per share ($134,282 ÷ 23,418 outstanding shares of beneficial interest, no par value, unlimited number of shares authorized) | | $ | 5.73 | |
| * | Represents collateral on securities loaned. |
Statement of Operations
| | | | |
| for the year ended December 31, 2018 | |
| |
| Investment Income | | | | |
| Income: | | | | |
| |
| Interest | | $ | 3,439,837 | |
| Income distributions — DWS Central Cash Management Government Fund | | | 69,371 | |
| Securities lending income, net of borrower rebates | | | 33,635 | |
| Total income | | | 3,542,843 | |
| Expenses: | | | | |
| |
| Management fee | | | 290,414 | |
| Administration fee | | | 58,083 | |
| Services to Shareholders | | | 1,012 | |
| Record keeping fee (Class B) | | | 206 | |
| Distribution service fees (Class B) | | | 417 | |
| Custodian fee | | | 20,838 | |
| Professional fees | | | 94,343 | |
| Reports to shareholders | | | 43,566 | |
| Trustees’ fees and expenses | | | 4,511 | |
| Pricing service fee | | | 30,287 | |
| Other | | | 4,728 | |
| Total expenses before expense reductions | | | 548,405 | |
| Expense reductions | | | (148,560 | ) |
| Total expenses after expense reductions | | | 399,845 | |
| Net investment income | | | 3,142,998 | |
| |
| Realized and Unrealized Gain (Loss) | | | | |
| Net realized gain (loss) from: | | | | |
| Investments | | | (202,767 | ) |
| Swap contracts | | | 2,106 | |
| Forward foreign currency contracts | | | 23,762 | |
| Foreign currency | | | 243 | |
| | | | (176,656 | ) |
| Change in net unrealized appreciation (depreciation) on: | | | | |
| |
| Investments | | | (4,261,780 | ) |
| Forward foreign currency contracts | | | 5,480 | |
| Foreign currency | | | (26 | ) |
| | | | (4,256,326 | ) |
| Net gain (loss) | | | (4,432,982 | ) |
| Net increase (decrease) in net assets resulting from operations | | $ | (1,289,984 | ) |
The accompanying notes are an integral part of the financial statements.
| | | | | | |
| | 14 | | | | | | Deutsche DWS Variable Series II — DWS High Income VIP |
Statements of Changes in Net Assets
| | | | | | | | |
| | | Years Ended December 31, | |
| Increase (Decrease) in Net Assets | | 2018 | | | 2017 | |
| Operations: | | | | | | | | |
| Net investment income (loss) | | $ | 3,142,998 | | | $ | 4,649,907 | |
| Net realized gain (loss) | | | (176,656 | ) | | | 3,495,016 | |
| Change in net unrealized appreciation (depreciation) | | | (4,256,326 | ) | | | (975,421 | ) |
| Net increase (decrease) in net assets resulting from operations | | | (1,289,984 | ) | | | 7,169,502 | |
| Distributions to shareholders: | | | | | | | | |
Class A | | | (4,670,013 | ) | | | (5,780,980 | ) |
Class B | | | (14,079 | ) | | | (94,574 | ) |
| Total distributions | | | (4,684,092 | ) | | | (5,875,554 | )* |
| Fund share transactions: | | | | | | | | |
Class A | | | | | | | | |
| Proceeds from shares sold | | | 4,796,087 | | | | 12,759,797 | |
| Reinvestment of distributions | | | 4,670,013 | | | | 5,780,980 | |
| Payments for shares redeemed | | | (12,180,108 | ) | | | (58,823,711 | ) |
| Net increase (decrease) in net assets from Class A share transactions | | | (2,714,008 | ) | | | (40,282,934 | ) |
Class B | | | | | | | | |
| Proceeds from shares sold | | | 63,056 | | | | 120,675 | |
| Reinvestment of distributions | | | 14,079 | | | | 94,574 | |
| Payments for shares redeemed | | | (64,199 | ) | | | (1,640,132 | ) |
| Net increase (decrease) in net assets from Class B share transactions | | | 12,936 | | | | (1,424,883 | ) |
| Increase (decrease) in net assets | | | (8,675,148 | ) | | | (40,413,869 | ) |
| Net assets at beginning of period | | | 60,698,129 | | | | 101,111,998 | |
| | |
| Net assets at end of period | | $ | 52,022,981 | | | $ | 60,698,129 | ** |
| | |
| Other Information | | | | | | |
Class A | | | | | | | | |
| Shares outstanding at beginning of period | | | 9,527,083 | | | | 15,845,238 | |
| Shares sold | | | 775,176 | | | | 2,017,781 | |
| Shares issued to shareholders in reinvestment of distributions | | | 803,789 | | | | 946,151 | |
| Shares redeemed | | | (2,024,464 | ) | | | (9,282,087 | ) |
| Net increase (decrease) in Class A shares | | | (445,499 | ) | | | (6,318,155 | ) |
| | |
| Shares outstanding at end of period | | | 9,081,584 | | | | 9,527,083 | |
Class B | | | | | | | | |
| Shares outstanding at beginning of period | | | 21,761 | | | | 254,095 | |
| Shares sold | | | 9,962 | | | | 18,818 | |
| Shares issued to shareholders in reinvestment of distributions | | | 2,411 | | | | 15,403 | |
| Shares redeemed | | | (10,716 | ) | | | (266,555 | ) |
| Net increase (decrease) in Class B shares | | | 1,657 | | | | (232,334 | ) |
| | |
| Shares outstanding at end of period | | | 23,418 | | | | 21,761 | |
| * | Includes distributions from net investment income. |
| ** | Includes undistributed net investment income of $4,654,101. |
The accompanying notes are an integral part of the financial statements.
| | | | |
Deutsche DWS Variable Series II — DWS High Income VIP | | | | | 15 |
Financial Highlights
| | | | | | | | | | | | | | | | | | | | |
| | | Years Ended December 31, | |
| Class A | | 2018 | | | 2017 | | | 2016 | | | 2015 | | | 2014 | |
| | | | | |
| Selected Per Share Data | | | | | | | | | | | | | | | | | | | | |
| Net asset value, beginning of period | | $ | 6.36 | | | $ | 6.28 | | | $ | 5.93 | | | $ | 6.60 | | | $ | 6.96 | |
| Income (loss) from investment operations: | | | | | | | | | | | | | | | | | | | | |
| | | | | |
Net investment incomea | | | .33 | | | | .31 | | | | .32 | | | | .32 | | | | .36 | |
Net realized and unrealized gain (loss) | | | (.48 | ) | | | .15 | | | | .41 | | | | (.58 | ) | | | (.25 | ) |
Total from investment operations | | | (.15 | ) | | | .46 | | | | .73 | | | | (.26 | ) | | | .11 | |
| Less distributions from: | | | | | | | | | | | | | | | | | | | | |
Net investment income | | | (.50 | ) | | | (.38 | ) | | | (.38 | ) | | | (.41 | ) | | | (.47 | ) |
| Net asset value, end of period | | $ | 5.71 | | | $ | 6.36 | | | $ | 6.28 | | | $ | 5.93 | | | $ | 6.60 | |
| Total Return (%)b | | | (2.52 | ) | | | 7.51 | | | | 12.87 | | | | (4.44 | ) | | | 1.47 | |
| | | | | |
| Ratios to Average Net Assets and Supplemental Data | | | | | | | | | | | | | | | | | | | | |
| Net assets, end of period ($ millions) | | | 52 | | | | 61 | | | | 100 | | | | 101 | | | | 135 | |
| Ratio of expenses before expense reductions (%)c | | | .94 | | | | .78 | | | | .80 | | | | .75 | | | | .75 | |
| Ratio of expenses after expense reductions (%)c | | | .69 | | | | .72 | | | | .72 | | | | .72 | | | | .73 | |
| Ratio of net investment income (%) | | | 5.41 | | | | 4.98 | | | | 5.38 | | | | 5.09 | | | | 5.21 | |
| Portfolio turnover rate (%) | | | 62 | | | | 71 | | | | 77 | | | | 47 | | | | 52 | |
| a | Based on average shares outstanding during the period. |
| b | Total return would have been lower had certain expenses not been reduced. |
| c | Expense ratio does not reflect charges and fees associated with the separate account that invests in the Fund or any variable life insurance policy or variable annuity contract for which the Fund is an investment option. |
| | | | | | | | | | | | | | | | | | | | |
| | | Years Ended December 31, | |
| Class B | | 2018 | | | 2017 | | | 2016 | | | 2015 | | | 2014 | |
| | | | | |
| Selected Per Share Data | | | | | | | | | | | | | | | | | | | | |
| Net asset value, beginning of period | | $ | 6.38 | | | $ | 6.30 | | | $ | 5.94 | | | $ | 6.63 | | | $ | 6.99 | |
| Income (loss) from investment operations: | | | | | | | | | | | | | | | | | | | | |
| | | | | |
Net investment incomea | | | .31 | | | | .31 | | | | .31 | | | | .32 | | | | .35 | |
Net realized and unrealized gain (loss) | | | (.48 | ) | | | .13 | | | | .41 | | | | (.61 | ) | | | (.26 | ) |
Total from investment operations | | | (.17 | ) | | | .44 | | | | .72 | | | | (.29 | ) | | | .09 | |
| Less distributions from: | | | | | | | | | | | | | | | | | | | | |
Net investment income | �� | | (.48 | ) | | | (.36 | ) | | | (.36 | ) | | | (.40 | ) | | | (.45 | ) |
| Net asset value, end of period | | $ | 5.73 | | | $ | 6.38 | | | $ | 6.30 | | | $ | 5.94 | | | $ | 6.63 | |
| Total Return (%)b | | | (2.76 | ) | | | 7.21 | | | | 12.67 | | | | (4.95 | ) | | | 1.22 | |
| | | | | |
| Ratios to Average Net Assets and Supplemental Data | | | | | | | | | | | | | | | | | | | | |
| Net assets, end of period ($ millions) | | | .1 | | | | .1 | | | | 2 | | | | 3 | | | | .03 | |
| Ratio of expenses before expense reductions (%)c | | | 1.34 | | | | 1.15 | | | | 1.21 | | | | 1.14 | | | | 1.13 | |
| Ratio of expenses after expense reductions (%)c | | | .96 | | | | .98 | | | | .98 | | | | 1.02 | | | | .97 | |
| Ratio of net investment income (%) | | | 5.14 | | | | 4.88 | | | | 5.15 | | | | 4.86 | | | | 5.09 | |
| Portfolio turnover rate (%) | | | 62 | | | | 71 | | | | 77 | | | | 47 | | | | 52 | |
| a | Based on average shares outstanding during the period. |
| b | Total return would have been lower had certain expenses not been reduced. |
| c | Expense ratio does not reflect charges and fees associated with the separate account that invests in the Fund or any variable life insurance policy or variable annuity contract for which the Fund is an investment option. |
The accompanying notes are an integral part of the financial statements.
| | | | | | |
| | 16 | | | | | | Deutsche DWS Variable Series II — DWS High Income VIP |
| | |
| Notes to Financial Statements | | |
A. Organization and Significant Accounting Policies
DWS High Income VIP (formerly Deutsche High Income VIP) (the “Fund”) is a diversified series of Deutsche DWS Variable Series II (formerly Deutsche Variable Series II) (the “Trust”), which is registered under the Investment Company Act of 1940, as amended (the “1940 Act”), as an open-end management investment company organized as a Massachusetts business trust.
Multiple Classes of Shares of Beneficial Interest. The Fund offers two classes of shares (Class A shares and Class B shares). Sales of Class B shares are subject to recordkeeping fees up to 0.15% and Rule 12b-1 fees under the 1940 Act equal to an annual rate of 0.25% of the average daily net assets of the Class B shares of the Fund. Class A shares are not subject to such fees.
Investment income, realized and unrealized gains and losses, and certain fund-level expenses and expense reductions, if any, are borne pro rata on the basis of relative net assets by the holders of all classes of shares except that each class bears certain expenses unique to that class (including the applicable Rule 12b-1 fee and recordkeeping fees). Differences in class-level expenses may result in payment of different per share dividends by class. All shares have equal rights with respect to voting subject to class-specific arrangements.
The Fund’s financial statements are prepared in accordance with accounting principles generally accepted in the United States of America (“U.S. GAAP”) which require the use of management estimates. Actual results could differ from those estimates. The Fund qualifies as an investment company under Topic 946 of Accounting Standards Codification of U.S. GAAP. The policies described below are followed consistently by the Fund in the preparation of its financial statements.
In October 2018, the Securities and Exchange Commission adopted amendments to certain disclosure requirements in Securities Act Release No. 33-10532, Disclosure Update and Simplification, which is intended to facilitate the disclosure of information to investors and simplify compliance without significantly altering the total mix of information provided to investors. Effective with the current reporting period, the Fund adopted the amendments with the impacts being that the Fund is no longer required to present components of distributable earnings on the Statement of Assets and Liabilities or the sources of distributable earnings and the amount of undistributed net investment income on the Statements of Changes in Net Assets.
Security Valuation. Investments are stated at value determined as of the close of regular trading on the New York Stock Exchange on each day the exchange is open for trading.
Various inputs are used in determining the value of the Fund’s investments. These inputs are summarized in three broad levels. Level 1 includes quoted prices in active markets for identical securities. Level 2 includes other significant observable inputs (including quoted prices for similar securities, interest rates, prepayment speeds and credit risk). Level 3 includes significant unobservable inputs (including the Fund’s own assumptions in determining the fair value of investments). The level assigned to the securities valuations may not be an indication of the risk or liquidity associated with investing in those securities.
Debt securities and loan participations and assignments are valued at prices supplied by independent pricing services approved by the Fund’s Board. Such services may use various pricing techniques which take into account appropriate factors such as yield, quality, coupon rate, maturity, type of issue, trading characteristics, prepayment speeds and other data, as well as broker quotes. If the pricing services are unable to provide valuations, debt securities are valued at the average of the most recent reliable bid quotations or evaluated prices, as applicable, obtained from broker-dealers and loan participations and assignments are valued at the mean of the most recent bid and ask quotations or evaluated prices, as applicable, obtained from broker-dealers. Certain securities may be valued on the basis of a price provided by a single source or broker-dealer. No active trading market may exist for some senior loans and they may be subject to restrictions on resale. The inability to dispose of senior loans in a timely fashion could result in losses. These securities are generally categorized as Level 2.
Equity securities are valued at the most recent sale price or official closing price reported on the exchange (U.S. or foreign) or over-the-counter market on which they trade. Securities for which no sales are reported are valued at the calculated mean between the most recent bid and asked quotations on the relevant market or, if a mean cannot be determined, at the most recent bid quotation. Equity securities are generally categorized as Level 1 securities.
| | | | |
Deutsche DWS Variable Series II — DWS High Income VIP | | | | | 17 |
Investments in open-end investment companies are valued at their net asset value each business day and are categorized as Level 1.
Forward currency contracts are valued at the prevailing forward exchange rate of the underlying currencies and are categorized as Level 2.
Swap contracts are valued daily based upon prices supplied by a Board approved pricing vendor, if available, and otherwise are valued at the price provided by the broker-dealer. Swap contracts are generally categorized as Level 2.
Securities and other assets for which market quotations are not readily available or for which the above valuation procedures are deemed not to reflect fair value are valued in a manner that is intended to reflect their fair value as determined in accordance with procedures approved by the Board and are generally categorized as Level 3. In accordance with the Fund’s valuation procedures, factors considered in determining value may include, but are not limited to, the type of the security; the size of the holding; the initial cost of the security; the existence of any contractual restrictions on the security’s disposition; the price and extent of public trading in similar securities of the issuer or of comparable companies; quotations or evaluated prices from broker-dealers and/or pricing services; information obtained from the issuer, analysts and/or the appropriate stock exchange (for exchange-traded securities); an analysis of the company’s or issuer’s financial statements; an evaluation of the forces that influence the issuer and the market(s) in which the security is purchased and sold; and with respect to debt securities, the maturity, coupon, creditworthiness, currency denomination and the movement of the market in which the security is normally traded. The value determined under these procedures may differ from published values for the same securities.
Disclosure about the classification of fair value measurements is included in a table following the Fund’s Investment Portfolio.
Foreign Currency Translations. The books and records of the Fund are maintained in U.S. dollars. Investment securities and other assets and liabilities denominated in a foreign currency are translated into U.S. dollars at the prevailing exchange rates at period end. Purchases and sales of investment securities, income and expenses are translated into U.S. dollars at the prevailing exchange rates on the respective dates of the transactions.
Net realized and unrealized gains and losses on foreign currency transactions represent net gains and losses between trade and settlement dates on securities transactions, the acquisition and disposition of foreign currencies, and the difference between the amount of net investment income accrued and the U.S. dollar amount actually received. That portion of both realized and unrealized gains and losses on investments that results from fluctuations in foreign currency exchange rates is not separately disclosed but is included with net realized and unrealized gain/appreciation and loss/depreciation on investments.
Securities Lending. Deutsche Bank AG, as lending agent, lends securities of the Fund to certain financial institutions under the terms of its securities lending agreement. During the term of the loans, the Fund continues to receive interest and dividends generated by the securities and to participate in any changes in their market value. The Fund requires the borrowers of the securities to maintain collateral with the Fund consisting of either cash or liquid, unencumbered assets having a value at least equal to the value of the securities loaned. When the collateral falls below specified amounts, the lending agent will use its best effort to obtain additional collateral on the next business day to meet required amounts under the securities lending agreement. As of period end, any securities on loan were collateralized by cash. During the year ended December 31, 2018, the Fund invested the cash collateral into a joint trading account in affiliated money market funds managed by DWS Investment Management Americas, Inc. As of December 31, 2018, the Fund invested the cash collateral in DWS Government & Agency Securities Portfolio. DWS Investment Management Americas, Inc. receives a management/administration fee (0.12% annualized effective rate as of December 31, 2018) on the cash collateral invested in DWS Government & Agency Securities Portfolio. The Fund receives compensation for lending its securities either in the form of fees or by earning interest on invested cash collateral net of borrower rebates and fees paid to a lending agent. Either the Fund or the borrower may terminate the loan at any time, and the borrower, after notice, is required to return borrowed securities within a standard time period. There may be risks of delay and costs in recovery of securities or even loss of rights in the collateral should the borrower of the securities fail financially. If the Fund is not able to recover securities lent, the Fund may sell the collateral and purchase a replacement investment in the market, incurring the risk that the value of the replacement security is greater than the value of the collateral. The Fund is also subject to all investment risks associated with the reinvestment of any cash collateral received, including, but not limited to, interest rate, credit and liquidity risk associated with such investments.
| | | | | | |
| | 18 | | | | | | Deutsche DWS Variable Series II — DWS High Income VIP |
As of December 31, 2018, the Fund had securities on loan, which were classified as corporate bonds in the Investment Portfolio. The value of the related collateral exceeded the value of the securities loaned at period end. As of period end, the remaining contractual maturity of the collateral agreements were overnight and continuous.
Taxes. The Fund’s policy is to comply with the requirements of the Internal Revenue Code, as amended, which are applicable to regulated investment companies and to distribute all of its taxable income to its shareholders.
At December 31, 2018, the Fund had a net tax basis capital loss carryforward of approximately $6,549,000, which may be applied against realized net taxable capital gains indefinitely, including short-term losses ($843,000) and long-term losses ($5,706,000).
The Fund has reviewed the tax positions for the open tax years as of December 31, 2018 and has determined that no provision for income tax and/or uncertain tax positions is required in the Fund’s financial statements. The Fund’s federal tax returns for the prior three fiscal years remain open subject to examination by the Internal Revenue Service.
Distribution of Income and Gains. Distributions from net investment income of the Fund, if any, are declared and distributed to shareholders annually. Net realized gains from investment transactions, in excess of available capital loss carryforwards, would be taxable to the Fund if not distributed and, therefore, will be distributed to shareholders at least annually. The Fund may also make additional distributions for tax purposes if necessary.
The timing and characterization of certain income and capital gain distributions are determined annually in accordance with federal tax regulations which may differ from accounting principles generally accepted in the United States of America. These differences primarily relate to investments in swap contracts and certain securities sold at a loss. As a result, net investment income (loss) and net realized gain (loss) on investment transactions for a reporting period may differ significantly from distributions during such period. Accordingly, the Fund may periodically make reclassifications among certain of its capital accounts without impacting the net asset value of the Fund.
At December 31, 2018, the Fund’s components of distributable earnings on a tax basis were as follows:
| | | | |
| Undistributed ordinary income* | | $ | 3,149,185 | |
| Capital loss carryforwards | | $ | (6,549,000 | ) |
| Unrealized appreciation (depreciation) on investments | | $ | (3,482,138 | ) |
At December 31, 2018, the aggregate cost of investments for federal income tax purposes was $57,425,459. The net unrealized depreciation for all investments based on tax cost was $3,482,138. This consisted of aggregate gross unrealized appreciation for all investments in which there was an excess of value over tax cost of $256,747 and aggregate gross unrealized depreciation for all investments in which there was an excess of tax cost over value of $3,738,885.
In addition, the tax character of distributions paid by the Fund is summarized as follows:
| | | | | | | | |
| | | Years Ended December 31, | |
| | | 2018 | | | 2017 | |
| Distributions from ordinary income* | | $ | 4,684,092 | | | $ | 5,875,554 | |
| * | For tax purposes, short-term capital gain distributions are considered ordinary income distributions. |
Expenses. Expenses of the Trust arising in connection with a specific fund are allocated to that fund. Other Trust expenses which cannot be directly attributed to a fund are apportioned among the funds in the Trust based upon the relative net assets or other appropriate measures.
Contingencies. In the normal course of business, the Fund may enter into contracts with service providers that contain general indemnification clauses. The Fund’s maximum exposure under these arrangements is unknown, as this would involve future claims that may be made against the Fund that have not yet been made. However, based on experience, the Fund expects the risk of loss to be remote.
Other. Investment transactions are accounted for on a trade date plus one basis for daily net asset value calculations. However, for financial reporting purposes, investment transactions are reported on trade date. Interest income is recorded on the accrual basis. Dividend income is recorded on ex-dividend date. Realized gains and losses from investment transactions are recorded on an identified cost basis. Proceeds from litigation payments, if any, are included in net realized gain (loss) from investments. All discounts and
| | | | |
Deutsche DWS Variable Series II — DWS High Income VIP | | | | | 19 |
premiums are accreted/amortized for both tax and financial reporting purposes for the Fund, with the exception of securities in default of principal.
B. Derivative Instruments
Swaps. A swap is a contract between two parties to exchange future cash flows at periodic intervals based on the notional amount of the swap. A bilateral swap is a transaction between the fund and a counterparty where cash flows are exchanged between the two parties. A centrally cleared swap is a transaction executed between the fund and a counterparty, then cleared by a clearing member through a central clearinghouse. The central clearinghouse serves as the counterparty, with whom the fund exchanges cash flows.
The value of a swap is adjusted daily, and the change in value, if any, is recorded as unrealized appreciation or depreciation in the Statement of Assets and Liabilities. Gains or losses are realized when the swap expires or is closed. Certain risks may arise when entering into swap transactions including counterparty default; liquidity; or unfavorable changes in interest rates or the value of the underlying reference security, commodity or index. In connection with bilateral swaps, securities and/or cash may be identified as collateral in accordance with the terms of the swap agreement to provide assets of value and recourse in the event of default. The maximum counterparty credit risk is the net present value of the cash flows to be received from or paid to the counterparty over the term of the swap, to the extent that this amount is beneficial to the Fund, in addition to any related collateral posted to the counterparty by the Fund. This risk may be partially reduced by a master netting arrangement between the Fund and the counterparty. Upon entering into a centrally cleared swap, the Fund is required to deposit with a financial intermediary cash or securities (“initial margin”) in an amount equal to a certain percentage of the notional amount of the swap. Subsequent payments (“variation margin”) are made or received by the Fund dependent upon the daily fluctuations in the value of the swap. In a cleared swap transaction, counterparty risk is minimized as the central clearinghouse acts as the counterparty.
An upfront payment, if any, made by the Fund is recorded as an asset in the Statement of Assets and Liabilities. An upfront payment, if any, received by the Fund is recorded as a liability in the Statement of Assets and Liabilities. Payments received or made at the end of the measurement period are recorded as realized gain or loss in the Statement of Operations.
Credit default swaps are agreements between a buyer and a seller of protection against predefined credit events for the reference entity. The Fund may enter into credit default swaps to gain exposure to an underlying issuer’s credit quality characteristics without directly investing in that issuer or to hedge against the risk of a credit event on debt securities. As a seller of a credit default swap, the Fund is required to pay the par (or other agreed-upon) value of the referenced entity to the counterparty with the occurrence of a credit event by a third party, such as a U.S. or foreign corporate issuer, on the reference entity, which would likely result in a loss to the Fund. In return, the Fund receives from the counterparty a periodic stream of payments over the term of the swap provided that no credit event has occurred. If no credit event occurs, the Fund keeps the stream of payments with no payment obligations. The Fund may also buy credit default swaps, in which case the Fund functions as the counterparty referenced above. This involves the risk that the swap may expire worthless. It also involves counterparty risk that the seller may fail to satisfy its payment obligations to the Fund with the occurrence of a credit event. When the Fund sells a credit default swap, it will cover its commitment. This may be achieved by, among other methods, maintaining cash or liquid assets equal to the aggregate notional value of the reference entities for all outstanding credit default swaps sold by the Fund. For the year ended December 31, 2018, the Fund entered into credit default swap agreements to gain exposure to the underlying issuer’s credit quality characteristics.
Under the terms of a credit default swap, the Fund receives or makes periodic payments based on a specified interest rate on a fixed notional amount. These payments are recorded as a realized gain or loss in the Statement of Operations. Payments received or made as a result of a credit event or termination of the swap are recognized, net of a proportional amount of the upfront payment, as realized gains or losses in the Statement of Operations.
There were no open credit default swap contracts as of December 31, 2018. For the year ended December 31, 2018, the Fund’s investment in credit default swap contracts sold had a total notional value generally indicative of a range from $0 to $600,000.
Forward Foreign Currency Exchange Contracts. A forward foreign currency exchange contract (“forward currency contract”) is a commitment to purchase or sell a foreign currency at the settlement date at a negotiated rate. For the year ended December 31, 2018, the Fund entered into forward currency contracts in
| | | | | | |
| | 20 | | | | | | Deutsche DWS Variable Series II — DWS High Income VIP |
order to hedge its exposure to changes in foreign currency exchange rates on its foreign currency denominated portfolio holdings and to facilitate transactions in foreign currency denominated securities.
Forward currency contracts are valued at the prevailing forward exchange rate of the underlying currencies and unrealized gain (loss) is recorded daily. On the settlement date of the forward currency contract, the Fund records a realized gain or loss equal to the difference between the value of the contract at the time it was opened and the value of the contract at the time it was closed. Certain risks may arise upon entering into forward currency contracts from the potential inability of counterparties to meet the terms of their contracts. The maximum counterparty credit risk to the Fund is measured by the unrealized gain on appreciated contracts. Additionally, when utilizing forward currency contracts to hedge, the Fund gives up the opportunity to profit from favorable exchange rate movements during the term of the contract.
A summary of the open forward currency contracts as of December 31, 2018 is included in a table following the Fund’s Investment Portfolio. For the year ended December 31, 2018, the investment in forward currency contracts short vs. U.S. dollars had a total contract value generally indicative of a range from approximately $399,000 to $719,000.
The following table summarizes the value of the Fund’s derivative instruments held as of December 31, 2018 and the related location in the accompanying Statement of Assets and Liabilities, presented by primary underlying risk exposure:
| | | | |
| Liability Derivative | | Forward
Contract | |
| Foreign Exchange Contract (a) | | $ | (1,436 | ) |
The above derivative is located in the following Statement of Assets and Liabilities account:
| (a) | Unrealized depreciation on forward foreign currency contract. |
Additionally, the amount of unrealized and realized gains and losses on derivative instruments recognized in Fund earnings during the year ended December 31, 2018 and the related location in the accompanying Statement of Operations is summarized in the following tables by primary underlying risk exposure:
| | | | | | | | | | | | |
| Realized Gain (Loss) | | Forward
Contracts | | | Swap
Contracts | | | Total | |
| Credit Contracts (b) | | $ | — | | | $ | 2,106 | | | $ | 2,106 | |
| Foreign Exchange Contracts (c) | | | 23,762 | | | | — | | | | 23,762 | |
| | | $ | 23,762 | | | $ | 2,106 | | | $ | 25,868 | |
Each of the above derivatives is located in the following Statement of Operations accounts:
| (b) | Net realized gain (loss) from swap contracts |
| (c) | Net realized gain (loss) from forward foreign currency contracts |
| | | | |
| Change in Net Unrealized Appreciation (Depreciation) | | Forward
Contract | |
| Foreign Exchange Contract (d) | | $ | 5,480 | |
The above derivative is located in the following Statement of Operations accounts:
| (d) | Change in net unrealized appreciation (depreciation) on forward foreign currency contracts |
As of December 31, 2018, the Fund has transactions subject to enforceable master netting agreements which govern the terms of certain transactions, and reduce the counterparty risk associated with such transactions. Master netting agreements allow a Fund to close out and net total exposure to a counterparty in the event of a deterioration in the credit quality or contractual default with respect to all of the transactions with a counterparty. As defined by the master netting agreement, the Fund may have collateral agreements with certain counterparties to mitigate risk. For financial reporting purposes the Statement of Assets and Liabilities generally shows derivatives assets and liabilities on a gross basis, which reflects the full risks and exposures prior to netting. A reconciliation of the gross amounts on the Statement of Assets and Liabilities to the net amounts by a counterparty, including any collateral exposure, is included in the following table:
| | | | | | | | | | | | | | | | |
| Counterparty | | Gross Amounts
of Liabilities
Presented in the
Statement of
Assets and
Liabilities | | | Financial
Instruments
and
Derivatives
Available
for Offset | | | Collateral
Pledged | | | Net Amount of
Derivative
Liabilities | |
| Bank of America | | $ | 1,436 | | | $ | — | | | $ | — | | | $ | 1,436 | |
| | | | |
Deutsche DWS Variable Series II — DWS High Income VIP | | | | | 21 |
C. Purchases and Sales of Securities
During the year ended December 31, 2018, purchases and sales of investment transactions (excluding short-term investments and U.S. Treasury securities) aggregated $33,354,764 and $38,461,744, respectively.
D. Related Parties
Management Agreement. Under the Investment Management Agreement with DWS Investment Management Americas, Inc. (formerly Deutsche Investment Management Americas Inc.) (“DIMA” or the “Advisor”), an indirect, wholly owned subsidiary of DWS Group GmbH & Co. KGaA (“DWS Group”), the Advisor directs the investments of the Fund in accordance with its investment objectives, policies and restrictions. The Advisor determines the securities, instruments and other contracts relating to investments to be purchased, sold or entered into by the Fund.
Pursuant to the Investment Management Agreement with the Advisor, the Fund pays a monthly management fee based on the Fund’s average daily net assets, computed and accrued daily and payable monthly, at the following annual rates:
| | | | |
| First $250 million | | | .500 | % |
| Next $750 million | | | .470 | % |
| Next $1.5 billion | | | .450 | % |
| Next $2.5 billion | | | .430 | % |
| Next $2.5 billion | | | .400 | % |
| Next $2.5 billion | | | .380 | % |
| Next $2.5 billion | | | .360 | % |
| Over $12.5 billion | | | .340 | % |
Accordingly, for the year ended December 31, 2018, the fee pursuant to the Investment Management Agreement was equivalent to an annual rate (exclusive of any applicable waivers/reimbursements) of 0.50% of the Fund’s average daily net assets.
For the period from January 1, 2018 through September 30, 2018, the Advisor had contractually agreed to waive all or a portion of its fees and/or reimburse certain operating expenses of the Fund to the extent necessary to maintain the total annual operating expenses (excluding certain expenses such as extraordinary expenses, taxes, brokerage and interest expense) of each class as follows:
| | | | |
| Class A | | | .69 | % |
| Class B | | | .97 | % |
Effective October 1, 2018 through September 30, 2019, the Advisor has contractually agreed to waive all or a portion of its fees and/or reimburse certain operating expenses of the Fund to the extent necessary to maintain the total annual operating expenses (excluding certain expenses such as extraordinary expenses, taxes, brokerage and interest expense) of each class as follows:
| | | | |
| Class A | | | .68 | % |
| Class B | | | .94 | % |
For the year ended December 31, 2018, fees waived and/or expenses reimbursed for each class were as follows:
| | | | |
| Class A | | $ | 147,926 | |
| Class B | | | 634 | |
| | | $ | 148,560 | |
Administration Fee. Pursuant to an Administrative Services Agreement, DIMA provides most administrative services to the Fund. For all services provided under the Administrative Services Agreement, the Fund pays DIMA an annual fee (“Administration Fee”) of 0.10% of the Fund’s average daily net assets, computed and accrued daily and payable monthly. For the year ended December 31, 2018, the Administration Fee was $58,083, of which $4,543 is unpaid.
Service Provider Fees. DWS Service Company (“DSC”), an affiliate of the Advisor, is the transfer agent, dividend-paying agent and shareholder service agent for the Fund. Pursuant to a sub-transfer agency agreement between DSC and DST Systems, Inc. (“DST”), DSC has delegated certain transfer agent,
| | | | | | |
| | 22 | | | | | | Deutsche DWS Variable Series II — DWS High Income VIP |
dividend-paying agent and shareholder service agent functions to DST. DSC compensates DST out of the shareholder servicing fee it receives from the Fund. For the year ended December 31, 2018, the amounts charged to the Fund by DSC were as follows:
| | | | | | | | |
| Services to Shareholders | | Total
Aggregated | | | Unpaid at
December 31, 2018 | |
| Class A | | $ | 271 | | | $ | 45 | |
| Class B | | | 51 | | | | 8 | |
| | | $ | 322 | | | $ | 53 | |
Distribution Service Agreement. Under the Fund’s Class B 12b-1 plan, DWS Distributors, Inc. (“DDI”) received a fee (“Distribution Service Fee”) of 0.25% of average daily net assets of Class B shares. For the year ended December 31, 2018, the Distribution Service Fee was $417, of which $30 is unpaid.
Typesetting and Filing Service Fees. Under an agreement with the Fund, DIMA is compensated for providing certain pre-press and regulatory filing services to the Fund. For the year ended December 31, 2018, the amount charged to the Fund by DIMA included in the Statement of Operations under “Reports to shareholders” aggregated $9,572, of which $7,400 is unpaid.
Trustees’ Fees and Expenses. The Fund paid retainer fees to each Trustee not affiliated with the Advisor, plus specified amounts to the Board Chairperson and to each committee Chairperson.
Affiliated Cash Management Vehicles. The Fund may invest uninvested cash balances in DWS Central Cash Management Government Fund and DWS ESG Liquidity Fund, affiliated money market funds which are managed by the Advisor. Each affiliated money market fund is managed in accordance with Rule 2a-7 under the 1940 Act, which governs the quality, maturity, diversity and liquidity of instruments in which a money market fund may invest. DWS Central Cash Management Government Fund seeks to maintain a stable net asset value, and DWS ESG Liquidity Fund maintains a floating net asset value. The Fund indirectly bears its proportionate share of the expenses of each affiliated money market fund in which it invests. DWS Central Cash Management Government Fund does not pay the Advisor an investment management fee. To the extent that DWS ESG Liquidity Fund pays an investment management fee to the Advisor, the Advisor will waive an amount of the investment management fee payable to the Advisor by the Fund equal to the amount of the investment management fee payable on the Fund’s assets invested in DWS ESG Liquidity Fund.
Security Lending Fees. Deutsche Bank AG serves as lending agent for the Fund. For the year ended December 31, 2018, the Fund incurred lending agent fees to Deutsche Bank AG for the amount of $2,532.
E. Investing in High-Yield Debt Securities
High-yield debt securities or junk bonds are generally regarded as speculative with respect to the issuer’s continuing ability to meet principal and interest payments. The Fund’s performance could be hurt if an issuer of a debt security suffers an adverse change in financial condition that results in the issuer not making timely payments of interest or principal, a security downgrade or an inability to meet a financial obligation. High-yield debt securities’ total return and yield may generally be expected to fluctuate more than the total return and yield of investment-grade debt securities. A real or perceived economic downturn or an increase in market interest rates could cause a decline in the value of high-yield debt securities, result in increased redemptions and/or result in increased portfolio turnover, which could result in a decline in net asset value of the fund, reduce liquidity for certain investments and/or increase costs. High-yield debt securities are often thinly traded and can be more difficult to sell and value accurately than investment-grade debt securities as there may be no established secondary market. Investments in high yield debt securities could increase liquidity risk for the fund. In addition, the market for high-yield debt securities can experience sudden and sharp volatility which is generally associated more with investments in stocks.
F. Ownership of the Fund
At December 31, 2018, two participating insurance companies were owners of record of 10% or more of the total outstanding Class A shares of the Fund, each owning 72% and 19%. One participating insurance company was owner of record of 10% or more of the total outstanding Class B shares of the Fund, owning 92%.
| | | | |
Deutsche DWS Variable Series II — DWS High Income VIP | | | | | 23 |
G. Line of Credit
The Fund and other affiliated funds (the “Participants”) share in a $400 million revolving credit facility provided by a syndication of banks. The Fund may borrow for temporary or emergency purposes, including the meeting of redemption requests that otherwise might require the untimely disposition of securities. The Participants are charged an annual commitment fee which is allocated based on net assets, among each of the Participants. Interest is calculated at a rate per annum equal to the sum of the Federal Funds Rate plus 1.25 percent plus if the one-month LIBOR exceeds the Federal Funds Rate, the amount of such excess. The Fund may borrow up to a maximum of 33 percent of its net assets under the agreement. The Fund had no outstanding loans at December 31, 2018.
| | | | | | |
| | 24 | | | | | | Deutsche DWS Variable Series II — DWS High Income VIP |
Report of Independent Registered Public Accounting Firm
To the Board of Trustees of Deutsche DWS Variable Series II and Shareholders of DWS High Income VIP:
Opinion on the Financial Statements
We have audited the accompanying statement of assets and liabilities of DWS High Income VIP (formerly Deutsche High Income VIP) (the “Fund”) (one of the funds constituting Deutsche DWS Variable Series II (formerly Deutsche Variable Series II)) (the “Trust”), including the investment portfolio, as of December 31, 2018, and the related statement of operations for the year then ended, the statements of changes in net assets for each of the two years in the period then ended, the financial highlights for each of the five years in the period then ended and the related notes (collectively referred to as the “financial statements”). In our opinion, the financial statements present fairly, in all material respects, the financial position of the Fund (one of the funds constituting Deutsche DWS Variable Series II) at December 31, 2018, the results of its operations for the year then ended, the changes in its net assets for each of the two years in the period then ended and its financial highlights for each of the five years in the period then ended, in conformity with U.S. generally accepted accounting principles.
Basis for Opinion
These financial statements are the responsibility of the Trust’s management. Our responsibility is to express an opinion on the Fund’s financial statements based on our audits. We are a public accounting firm registered with the Public Company Accounting Oversight Board (United States) (“PCAOB”) and are required to be independent with respect to the Trust in accordance with the U.S. federal securities laws and the applicable rules and regulations of the Securities and Exchange Commission and the PCAOB.
We conducted our audits in accordance with the standards of the PCAOB. Those standards require that we plan and perform the audit to obtain reasonable assurance about whether the financial statements are free of material misstatement, whether due to error or fraud. The Trust is not required to have, nor were we engaged to perform, an audit of the Trust’s internal control over financial reporting. As part of our audits, we are required to obtain an understanding of internal control over financial reporting, but not for the purpose of expressing an opinion on the effectiveness of the Trust’s internal control over financial reporting. Accordingly, we express no such opinion.
Our audits included performing procedures to assess the risks of material misstatement of the financial statements, whether due to error or fraud, and performing procedures that respond to those risks. Such procedures included examining, on a test basis, evidence regarding the amounts and disclosures in the financial statements. Our procedures included confirmation of securities owned as of December 31, 2018, by correspondence with the custodian and brokers. Our audits also included evaluating the accounting principles used and significant estimates made by management, as well as evaluating the overall presentation of the financial statements. We believe that our audits provide a reasonable basis for our opinion.

We have served as the auditor of one or more investment companies in the DWS family of funds since at least 1979, but we are unable to determine the specific year.
Boston, Massachusetts
February 14, 2019
| | | | |
Deutsche DWS Variable Series II — DWS High Income VIP | | | | | 25 |
| | |
| Information About Your Fund’s Expenses | | (Unaudited) |
As an investor of the Fund, you incur two types of costs: ongoing expenses and transaction costs. Ongoing expenses include management fees, distribution and service (12b-1) fees and other Fund expenses. Examples of transaction costs include contract charges, which are not shown in this section. The following tables are intended to help you understand your ongoing expenses (in dollars) of investing in the Fund and to help you compare these expenses with the ongoing expenses of investing in other mutual funds. In the most recent six-month period, the Fund limited these expenses; had it not done so, expenses would have been higher. The example in the table is based on an investment of $1,000 invested at the beginning of the six-month period and held for the entire period (July 1, 2018 to December 31, 2018).
The tables illustrate your Fund’s expenses in two ways:
| – | Actual Fund Return.This helps you estimate the actual dollar amount of ongoing expenses (but not transaction costs) paid on a $1,000 investment in the Fund using the Fund’s actual return during the period. To estimate the expenses you paid over the period, simply divide your account value by $1,000 (for example, an $8,600 account value divided by $1,000 = 8.6), then multiply the result by the number in the “Expenses Paid per $1,000” line under the share class you hold. |
| – | Hypothetical 5% Fund Return.This helps you to compare your Fund’s ongoing expenses (but not transaction costs) with those of other mutual funds using the Fund’s actual expense ratio and a hypothetical rate of return of 5% per year before expenses. Examples using a 5% hypothetical Fund return may be found in the shareholder reports of other mutual funds. The hypothetical account values and expenses may not be used to estimate the actual ending account balance or expenses you paid for the period. |
Please note that the expenses shown in these tables are meant to highlight your ongoing expenses only and do not reflect any transaction costs. The “Expenses Paid per $1,000” line of the tables is useful in comparing ongoing expenses only and will not help you determine the relative total expense of owning different funds. If these transaction costs had been included, your costs would have been higher.
| | | | | | | | |
| Expenses and Value of a $1,000 Investment for the six months ended December 31, 2018 | |
| | |
| Actual Fund Return | | Class A | | | Class B | |
| Beginning Account Value 7/1/18 | | $ | 1,000.00 | | | $ | 1,000.00 | |
| Ending Account Value 12/31/18 | | $ | 977.70 | | | $ | 976.10 | |
| Expenses Paid per $1,000* | | $ | 3.44 | | | $ | 4.78 | |
| | |
| Hypothetical 5% Fund Return | | Class A | | | Class B | |
| Beginning Account Value 7/1/18 | | $ | 1,000.00 | | | $ | 1,000.00 | |
| Ending Account Value 12/31/18 | | $ | 1,021.73 | | | $ | 1,020.37 | |
| Expenses Paid per $1,000* | | $ | 3.52 | | | $ | 4.89 | |
| * | Expenses are equal to the Fund’s annualized expense ratio for each share class, multiplied by the average account value over the period, multiplied by 184 (the number of days in the most recent six-month period), then divided by 365. |
| | | | | | | | |
| Annualized Expense Ratios | | Class A | | | Class B | |
| Deutsche DWS Variable Series II — DWS High Income VIP | | | .69 | % | | | .96 | % |
For more information, please refer to the Fund’s prospectus.
These tables do not reflect charges and fees (“contract charges”) associated with the separate account that invests in the Fund or any variable life insurance policy or variable annuity contract for which the Fund is an investment option.
For an analysis of the fees associated with an investment in the Fund or similar funds, please refer to the current and hypothetical expense calculators for Variable Insurance Products which can be found at dws.com/calculators.
| | | | | | |
| | 26 | | | | | | Deutsche DWS Variable Series II — DWS High Income VIP |
| | |
| Tax Information | | (Unaudited) |
Please consult a tax advisor if you have questions about federal or state income tax laws, or on how to prepare your tax returns. If you have specific questions about your account, please contact your insurance provider.
Proxy Voting
The Trust’s policies and procedures for voting proxies for portfolio securities and information about how the Trust voted proxies related to its portfolio securities during the most recent 12-month period ended June 30 are available on our Web site — dws.com/en-us/resources/proxy-voting — or on the SEC’s Web site — sec.gov. To obtain a written copy of the Trust’s policies and procedures without charge, upon request, call us toll free at (800) 728-3337.
| | | | |
Deutsche DWS Variable Series II — DWS High Income VIP | | | | | 27 |
Advisory Agreement Board Considerations and Fee Evaluation
The Board of Trustees (hereinafter referred to as the “Board” or “Trustees”) approved the renewal of DWS High Income VIP’s (the “Fund”) investment management agreement (the “Agreement”) with DWS Investment Management Americas, Inc. (“DIMA”) in September 2018.
In terms of the process that the Board followed prior to approving the Agreement, shareholders should know that:
| – | | During the entire process, all of the Fund’s Trustees were independent of DIMA and its affiliates (the “Independent Trustees”). |
| – | | The Board met frequently during the past year to discuss fund matters and dedicated a substantial amount of time to contract review matters. Over the course of several months, the Board’s Contract Committee reviewed extensive materials received from DIMA, independent third parties and independent counsel. These materials included an analysis of the Fund’s performance, fees and expenses, and profitability from a fee consultant retained by the Fund’s Independent Trustees (the “Fee Consultant”). Based on its evaluation of the information provided, the Contract Committee presented its findings and recommendations to the Board. The Board then reviewed the Contract Committee’s findings and recommendations. |
| – | | The Board also received extensive information throughout the year regarding performance of the Fund. |
| – | | The Independent Trustees regularly met privately with counsel to discuss contract review and other matters. In addition, the Independent Trustees were advised by the Fee Consultant in the course of their review of the Fund’s contractual arrangements and considered a comprehensive report prepared by the Fee Consultant in connection with their deliberations. |
| – | | In connection with reviewing the Agreement, the Board also reviewed the terms of the Fund’s Rule 12b-1 plan, distribution agreement, administrative services agreement, transfer agency agreement and other material service agreements. |
In connection with the contract review process, the Contract Committee and the Board considered the factors discussed below, among others. The Board also considered that DIMA and its predecessors have managed the Fund since its inception, and the Board believes that a long-term relationship with a capable, conscientious advisor is in the best interests of the Fund. The Board considered, generally, that shareholders chose to invest or remain invested in the Fund knowing that DIMA managed the Fund. DIMA is part of DWS Group GmbH & Co. KGaA (“DWS Group”). DWS Group is a global asset management business that offers a wide range of investing expertise and resources, including research capabilities in many countries throughout the world. In 2018, approximately 20% of DWS Group’s shares were sold in an initial public offering, with Deutsche Bank AG owning the remaining shares.
As part of the contract review process, the Board carefully considered the fees and expenses of each DWS fund overseen by the Board in light of the fund’s performance. In many cases, this led to the negotiation and implementation of expense caps. As part of these negotiations, the Board indicated that it would consider relaxing these caps in future years following sustained improvements in performance, among other considerations.
While shareholders may focus primarily on fund performance and fees, the Fund’s Board considers these and many other factors, including the quality and integrity of DIMA’s personnel and administrative support services provided by DIMA, such as back-office operations, fund valuations, and compliance policies and procedures.
Nature, Quality and Extent of Services.The Board considered the terms of the Agreement, including the scope of advisory services provided under the Agreement. The Board noted that, under the Agreement, DIMA provides portfolio management services to the Fund and that, pursuant to a separate administrative services agreement, DIMA provides administrative services to the Fund. The Board considered the experience and skills of senior management and investment personnel and the resources made available to such personnel. The Board reviewed the Fund’s performance over short-term and long-term periods and compared those returns to various agreed-upon performance measures, including market index(es) and a peer universe compiled using information supplied by Morningstar Direct (“Morningstar”), an independent fund data service. The Board also noted that it has put into place a process of identifying “Funds in Review” (e.g., funds performing poorly relative to a peer universe), and receives additional reporting from DIMA regarding such funds and, where appropriate, DIMA’s plans to address underperformance. The Board
| | | | | | |
| | 28 | | | | | | Deutsche DWS Variable Series II — DWS High Income VIP |
believes this process is an effective manner of identifying and addressing underperforming funds. Based on the information provided, the Board noted that, for the one-, three- and five-year periods ended December 31, 2017, the Fund’s performance (Class A shares) was in the 2nd quartile, 4th quartile and 3rd quartile, respectively, of the applicable Morningstar universe (the 1st quartile being the best performers and the 4th quartile being the worst performers). The Board also observed that the Fund has outperformed its benchmark in the one-year period and has underperformed its benchmark in the three- and five-year periods ended December 31, 2017. The Board noted the disappointing investment performance of the Fund in some past periods and continued to discuss with senior management of DIMA the factors contributing to such underperformance and actions being taken to improve performance. The Board observed that the Fund had experienced improved relative performance in 2017 and during the first eight months of 2018. The Board recognized the efforts by DIMA in recent years to enhance its investment platform and improve long-term performance across the DWS fund complex.
Fees and Expenses. The Board considered the Fund’s investment management fee schedule, operating expenses and total expense ratios, and comparative information provided by Broadridge Financial Solutions, Inc. (“Broadridge”) and the Fee Consultant regarding investment management fee rates paid to other investment advisors by similar funds (1st quartile being the most favorable and 4th quartile being the least favorable). With respect to management fees paid to other investment advisors by similar funds, the Board noted that the contractual fee rates paid by the Fund, which include a 0.10% fee paid to DIMA under the Fund’s administrative services agreement, were lower than the median (1st quartile) of the applicable Broadridge peer group (based on Broadridge data provided as of December 31, 2017). The Board noted that the Fund’s Class A shares total (net) operating expenses were expected to be lower than the median (2nd quartile) of the applicable Broadridge expense universe (based on Broadridge data provided as of December 31, 2017, and analyzing Broadridge expense universe Class A (net) expenses less any applicable 12b-1 fees) (“Broadridge Universe Expenses”). The Board also reviewed data comparing each share class’s total (net) operating expenses to the applicable Broadridge Universe Expenses. The Board noted that the expense limitations agreed to by DIMA were expected to help the Fund’s total (net) operating expenses remain competitive. The Board considered the Fund’s management fee rate as compared to fees charged by DIMA to comparable DWS U.S. registered funds (“DWS Funds”) and considered differences between the Fund and the comparable DWS Funds. The information requested by the Board as part of its review of fees and expenses also included information about institutional accounts (including any sub-advised funds and accounts) and funds offered primarily to European investors (“DWS Europe Funds”) managed by DWS Group. The Board noted that DIMA indicated that DWS Group does not manage any institutional accounts or DWS Europe Funds comparable to the Fund.
On the basis of the information provided, the Board concluded that management fees were reasonable and appropriate in light of the nature, quality and extent of services provided by DIMA.
Profitability. The Board reviewed detailed information regarding revenues received by DIMA under the Agreement. The Board considered the estimated costs to DIMA, and pre-tax profits realized by DIMA, from advising the DWS Funds, as well as estimates of the pre-tax profits attributable to managing the Fund in particular. The Board also received information regarding the estimated enterprise-wide profitability of DIMA and its affiliates with respect to all fund services in totality and by fund. The Board and the Fee Consultant reviewed DIMA’s methodology in allocating its costs to the management of the Fund. Based on the information provided, the Board concluded that the pre-tax profits realized by DIMA in connection with the management of the Fund were not unreasonable. The Board also reviewed certain publicly available information regarding the profitability of certain similar investment management firms. The Board noted that, while information regarding the profitability of such firms is limited (and in some cases is not necessarily prepared on a comparable basis), DIMA and its affiliates’ overall profitability with respect to the DWS Funds (after taking into account distribution and other services provided to the funds by DIMA and its affiliates) was lower than the overall profitability levels of most comparable firms for which such data was available.
Economies of Scale. The Board considered whether there are economies of scale with respect to the management of the Fund and whether the Fund benefits from any economies of scale. The Board noted that the Fund’s investment management fee schedule includes fee breakpoints. The Board concluded that the Fund’s fee schedule represents an appropriate sharing between the Fund and DIMA of such economies of scale as may exist in the management of the Fund at current asset levels.
Other Benefits to DIMA and Its Affiliates. The Board also considered the character and amount of other incidental or “fall-out” benefits received by DIMA and its affiliates, including any fees received by DIMA for administrative services provided to the Fund, any fees received by an affiliate of DIMA for transfer agency
| | | | |
Deutsche DWS Variable Series II — DWS High Income VIP | | | | | 29 |
services provided to the Fund and any fees received by an affiliate of DIMA for distribution services. The Board also considered benefits to DIMA related to brokerage and soft-dollar allocations, including allocating brokerage to pay for research generated by parties other than the executing broker dealers, which pertain primarily to funds investing in equity securities. In addition, the Board considered the incidental public relations benefits to DIMA related to DWS Funds advertising and cross-selling opportunities among DIMA products and services. The Board considered these benefits in reaching its conclusion that the Fund’s management fees were reasonable.
Compliance. The Board considered the significant attention and resources dedicated by DIMA to its compliance processes in recent years. The Board noted in particular (i) the experience, seniority and time commitment of the individuals serving as DIMA’s and the Fund’s chief compliance officers and (ii) the substantial commitment of resources by DIMA and its affiliates to compliance matters, including the retention of compliance personnel.
Based on all of the information considered and the conclusions reached, the Board unanimously determined that the continuation of the Agreement is in the best interests of the Fund. In making this determination, the Board did not give particular weight to any single factor identified above. The Board considered these factors over the course of numerous meetings, certain of which were in executive session with only the Independent Trustees and counsel present. It is possible that individual Independent Trustees may have weighed these factors differently in reaching their individual decisions to approve the continuation of the Agreement.
| | | | | | |
| | 30 | | | | | | Deutsche DWS Variable Series II — DWS High Income VIP |
Board Members and Officers
The following table presents certain information regarding the Board Members and Officers of the Fund. Each Board Member’s year of birth is set forth in parentheses after his or her name. Unless otherwise noted, (i) each Board Member has engaged in the principal occupation(s) noted in the table for at least the most recent five years, although not necessarily in the same capacity; and (ii) the address of each Independent Board Member is c/o Keith R. Fox, DWS Funds Board Chair, c/o Thomas R. Hiller, Ropes & Gray LLP, Prudential Tower, 800 Boylston Street, Boston, MA02199-3600. Except as otherwise noted below, the term of office for each Board Member is until the election and qualification of a successor, or until such Board Member sooner dies, resigns, is removed or as otherwise provided in the governing documents of the Fund. Because the Fund does not hold an annual meeting of shareholders, each Board Member will hold office for an indeterminate period. The Board Members may also serve in similar capacities with other funds in the fund complex.
| | | | | | | | |
| Independent Board Members | | | | | | |
Name, Year of Birth,
Position with the Fund and
Length of Time Served1 | | Business Experience and Directorships During the Past Five Years | | Number of
Funds in
DWS Fund
Complex
Overseen | | | Other
Directorships
Held by Board
Member
|
Keith R. Fox, CFA (1954) Chairperson since 2017, and Board Member since 1996 | | Managing General Partner, Exeter Capital Partners (a series of private investment funds) (since 1986). Directorships: Progressive International Corporation (kitchen goods importer and distributor); The Kennel Shop (retailer); former Chairman, National Association of Small Business Investment Companies; former Directorships: BoxTop Media Inc. (advertising); Sun Capital Advisers Trust (mutual funds) (2011–2012) | | | 82 | | | — |
John W. Ballantine (1946) Board Member since 1999 | | Retired; formerly, Executive Vice President and Chief Risk Management Officer, First Chicago NBD Corporation/The First National Bank of Chicago (1996–1998); Executive Vice President and Head of International Banking (1995–1996); former Directorships: Director and former Chairman of the Board, Healthways, Inc.2 (population well-being and wellness services) (2003–2014); Stockwell Capital Investments PLC (private equity); Enron Corporation; FNB Corporation; Tokheim Corporation; First Oak Brook Bancshares, Inc. and Oak Brook Bank; Prisma Energy International; Public Radio International. Not-for-Profit Director, Trustee: Palm Beach Civic Association; Window to the World Communications (public media); Harris Theater for Music and Dance (Chicago); Life Director of Hubbard Street Dance Chicago | | | 82 | | | Portland
General
Electric2
(utility
company)
(2003–
present) |
Henry P. Becton, Jr. (1943) Board Member since 1990 | | Vice Chair and former President, WGBH Educational Foundation. Directorships: Public Radio International; Public Radio Exchange (PRX); The Pew Charitable Trusts (charitable organization); Massachusetts Humane Society; Overseer of the New England Conservatory; former Directorships: Becton Dickinson and Company2 (medical technology company); Belo Corporation2 (media company); The PBS Foundation; Association of Public Television Stations; Boston Museum of Science; American Public Television; Concord Academy; New England Aquarium; Mass. Corporation for Educational Telecommunications; Committee for Economic Development; Public Broadcasting Service; Connecticut College; North Bennett Street School (Boston); American Documentary, Inc. (public media) | | | 82 | | | — |
Dawn-Marie Driscoll (1946) Board Member since 1987 | | Emeritus Executive Fellow, Center for Business Ethics, Bentley University; formerly: President, Driscoll Associates (consulting firm); Partner, Palmer & Dodge (law firm) (1988–1990); Vice President of Corporate Affairs and General Counsel, Filene’s (retail) (1978–1988). Directorships: Advisory Board, Center for Business Ethics, Bentley University; Trustee and former Chairman of the Board, Southwest Florida Community Foundation (charitable organization); former Directorships: ICI Mutual Insurance Company (2007–2015); Sun Capital Advisers Trust (mutual funds) (2007–2012), Investment Company Institute (audit, executive, nominating committees) and Independent Directors Council (governance, executive committees) | | | 82 | | | — |
Paul K. Freeman* (1950) Board Member since 1993 | | Consultant, WorldBank/Inter-American Development Bank; Independent Directors Council (former chair); Investment Company Institute (executive committee); Adjunct Professor, University of Denver Law School (2017–present); formerly: Chairman of Education Committee of Independent Directors Council; Project Leader, International Institute for Applied Systems Analysis (1998–2001); Chief Executive Officer, The Eric Group, Inc. (environmental insurance) (1986–1998); Directorships: Knoebel Institute for Healthy Aging, University of Denver (2017–present); former Directorships: Prisma Energy International; Denver Zoo Foundation (2012–2018) | | | 82 | | | — |
| | | | |
Deutsche DWS Variable Series II — DWS High Income VIP | | | | | 31 |
| | | | | | | | |
Name, Year of Birth,
Position with the Fund and
Length of Time Served1 | | Business Experience and Directorships During the Past Five Years | | Number of
Funds in
DWS Fund
Complex
Overseen | | | Other
Directorships
Held by Board
Member
|
Richard J. Herring (1946) Board Member since 1990 | | Jacob Safra Professor of International Banking and Professor of Finance, The Wharton School, University of Pennsylvania (since July 1972); Director, The Wharton Financial Institutions Center (since 1994); formerly: Vice Dean and Director, Wharton Undergraduate Division (1995–2000) and Director, The Lauder Institute of International Management Studies (2000–2006); Member FDIC Systemic Risk Advisory Committee since 2011, member Systemic Risk Council since 2012 and member of the Advisory Board at the Yale Program on Financial Stability since 2013; Formerly Co-Chair of the Shadow Financial Regulatory Committee (2003–2015), Executive Director of The Financial Economists Roundtable (2008–2015), Director of The Thai Capital Fund (2007–2013), Director of The Aberdeen Singapore Fund (2007–2018), and Nonexecutive Director of Barclays Bank DE (2010–2018) | | | 82 | | | Director,
Aberdeen
Japan Fund
(since 2007) |
William McClayton (1944) Board Member since 2004 | | Private equity investor (since October 2009); previously, Managing Director, Diamond Management & Technology Consultants, Inc. (global consulting firm) (2001–2009); Directorship: Board of Managers, YMCA of Metropolitan Chicago; formerly: Senior Partner, Arthur Andersen LLP (accounting) (1966–2001); Trustee, Ravinia Festival | | | 82 | | | — |
Rebecca W. Rimel (1951) Board Member since 1995 | | President, Chief Executive Officer and Director, The Pew Charitable Trusts (charitable organization) (1994–present); formerly: Executive Vice President, The Glenmede Trust Company (investment trust and wealth management) (1983–2004); Board Member, Investor Education (charitable organization) (2004–2005); Trustee, Executive Committee, Philadelphia Chamber of Commerce (2001–2007); Director, Viasys Health Care2 (January 2007–June 2007); Trustee, Thomas Jefferson Foundation (charitable organization) (1994–2012) | | | 82 | | | Director,
Becton
Dickinson
and
Company2
(medical
technology
company)
(2012–
present);
Director,
BioTelemetry
Inc.2(health
care) (2009–
present) |
William N. Searcy, Jr. (1946) Board Member since 1993 | | Private investor since October 2003; formerly: Pension & Savings Trust Officer, Sprint Corporation2(telecommunications) (November 1989–September 2003); Trustee, Sun Capital Advisers Trust (mutual funds) (1998–2012) | | | 82 | | | — |
Jean Gleason Stromberg (1943) Board Member since 1997 | | Retired. Formerly, Consultant (1997–2001); Director, Financial Markets U.S. Government Accountability Office (1996–1997); Partner, Norton Rose Fulbright, L.L.P. (law firm) (1978–1996); former Directorships: The William and Flora Hewlett Foundation (charitable organization) (2000–2015); Service Source, Inc. (nonprofit), Mutual Fund Directors Forum (2002–2004), American Bar Retirement Association (funding vehicle for retirement plans) (1987–1990 and 1994–1996) | | | 82 | | | — |
| | |
| Officers4 | | |
Name, Year of Birth, Position with the Fund and Length of Time Served5 | | Business Experience and Directorships During the Past Five Years |
Hepsen Uzcan6 (1974) President and Chief Executive Officer, 2017–present Assistant Secretary, 2013–present | | Managing Director,3 DWS; Secretary, DWS USA Corporation (since March 2018); Assistant Secretary, DWS Distributors, Inc. (since June 25, 2018); Director and Vice President, DWS Service Company (since June 25, 2018); Assistant Secretary, DWS Investment Management Americas, Inc. (since June 25, 2018); and Director and President, DB Investment Managers, Inc. (since June 25, 2018); formerly: Vice President for the Deutsche funds (2016–2017) |
John Millette8(1962) Vice President and Secretary, 1999–present | | Director,3DWS; Chief Legal Officer, DWS Investment Management Americas, Inc. (2015–present); and Director and Vice President, DWS Trust Company (2016–present); formerly: Secretary, Deutsche Investment Management Americas Inc. (2015–2017) |
Diane Kenneally8,9 (1966) Treasurer and Chief Financial Officer since 2018 | | Director,3 DWS; formerly: Assistant Treasurer for the DWS funds (2007–2018) |
Caroline Pearson8(1962) Chief Legal Officer, 2010–present | | Managing Director,3DWS; formerly: Secretary, Deutsche AM Distributors, Inc. (2002–2017); and Secretary, Deutsche AM Service Company (2010–2017) |
Scott D. Hogan8(1970) Chief Compliance Officer, 2016–present | | Director,3DWS |
| | | | | | |
| | 32 | | | | | | Deutsche DWS Variable Series II — DWS High Income VIP |
| | |
Name, Year of Birth, Position with the Fund and Length of Time Served5 | | Business Experience and Directorships During the Past Five Years |
Wayne Salit7(1967) Anti-Money Laundering Compliance Officer, 2014–present | | Director,3 Deutsche Bank; and AML Officer, DWS Trust Company; formerly: Managing Director, AML Compliance Officer at BNY Mellon (2011–2014); and Director, AML Compliance Officer at Deutsche Bank (2004–2011) |
Sheila Cadogan8(1966) Assistant Treasurer, 2017–present | | Director,3DWS; Director and Vice President, DWS Trust Company (since 2018) |
Paul Antosca8(1957) Assistant Treasurer, 2007–present | | Director,3DWS |
| 1 | The length of time served represents the year in which the Board Member joined the board of one or more DWS funds currently overseen by the Board. |
| 2 | A publicly held company with securities registered pursuant to Section 12 of the Securities Exchange Act of 1934. |
| 3 | Executive title, not a board directorship. |
| 4 | As a result of their respective positions held with the Advisor or its affiliates, these individuals are considered “interested persons” of the Advisor within the meaning of the 1940 Act. Interested persons receive no compensation from the Fund. |
| 5 | The length of time served represents the year in which the officer was first elected in such capacity for one or more DWS funds. |
| 6 | Address: 345 Park Avenue, New York, NY 10154. |
| 7 | Address: 60 Wall Street, New York, NY 10005. |
| 8 | Address: One International Place, Boston, MA 02110. |
| 9 | Appointed Treasurer and Chief Financial Officer effective July 2, 2018. |
| * | Paul K. Freeman retired from the Board effective December 31, 2018. |
The Fund’s Statement of Additional Information (“SAI”) includes additional information about the Board Members. The SAI is available, without charge, upon request. If you would like to request a copy of the SAI, you may do so by calling the followingtoll-free number:(800) 728-3337.
| | | | |
Deutsche DWS Variable Series II — DWS High Income VIP | | | | | 33 |
Notes
Notes
|
|
VS2HI-2 (R-025832-8 2/19) |
December 31, 2018
Annual Report
Deutsche DWS Variable Series II
(formerly Deutsche Variable Series II)
DWS International Growth VIP
(formerly Deutsche International Growth VIP)
Beginning on January 1, 2021, as permitted by regulations adopted by the Securities and Exchange Commission, you may not be receiving paper copies of the Fund’s shareholder reports from the insurance company that offers your contract unless you specifically request paper copies from your insurance company or from your financial intermediary. Instead, the shareholder reports will be made available on a Web site, and your insurance company will notify you by mail each time a report is posted and provide you with a Web site link to access the report. Instructions for requesting paper copies will be provided by your insurance company.
If you already elected to receive shareholder reports electronically, you will not be affected by this change and you need not take any action. You may elect to receive shareholder reports and other communications from your insurance company electronically by following the instructions provided by your insurance company.
You may elect to receive all future reports in paper free of charge from your insurance company. If your insurance company informs you that future reports will be delivered via Web access, you can inform your insurance company that you wish to continue receiving paper copies of your shareholder reports by following the instructions provided by your insurance company.

Contents
This report must be preceded or accompanied by a prospectus. To obtain an additional prospectus or summary prospectus, if available, call (800)728-3337 or your financial representative. We advise you to consider the Fund’s objectives, risks, charges and expenses carefully before investing. The summary prospectus and prospectus contain this and other important information about the Fund. Please read the prospectus carefully before you invest.
Stocks may decline in value. Smaller company stocks tend to be more volatile thanmedium-sized or large company stocks. Investing in foreign securities, particularly those of emerging markets, presents certain risks, such as currency fluctuations, political and economic changes, and market risks. Emerging markets tend to be more volatile and less liquid than the markets of more mature economies, and generally have less diverse and less mature economic structures and less stable political systems than those of developed countries. Investing in derivatives entails special risks relating to liquidity, leverage and credit that may reduce returns and/or increase volatility. The Fund may lend securities to approved institutions. Please read prospectus for details.
The brand DWS represents DWS Group GmbH & Co. KGaA and any of its subsidiaries such as DWS Distributors, Inc. which offers investment products or DWS Investment Management Americas, Inc. and RREEF America L.L.C. which offer advisory services.
DWS Distributors, Inc., 222 South Riverside Plaza, Chicago, IL 60606, (800)621-1148
NOT FDIC/NCUA INSURED NO BANK GUARANTEE MAY LOSE VALUE NOT A DEPOSIT
NOT INSURED BY ANY FEDERAL GOVERNMENT AGENCY
| | | | | | |
| | 2 | | | | | | Deutsche DWS Variable Series II — DWS International Growth VIP |
| | |
| Performance Summary | | December 31, 2018 (Unaudited) |
Fund performance shown is historical, assumes reinvestment of all dividend and capital gain distributions and does not guarantee future results. Investment return and principal value fluctuate with changing market conditions so that, when redeemed, shares may be worth more or less than their original cost. Current performance may be lower or higher than the performance data quoted. Please contact your participating insurance company for the Fund’s most recentmonth-end performance. Performance does not reflect charges and fees (“contract charges”) associated with the separate account that invests in the Fund or any variable life insurance policy or variable annuity contract for which the Fund is an investment option. These charges and fees will reduce returns. While all share classes have the same underlying portfolio, their performance will differ.
The gross expense ratios of the Fund, as stated in the fee table of the prospectus dated May 1, 2018 are 1.33% and 1.67% for Class A and Class B shares, respectively, and may differ from the expense ratios disclosed in the Financial Highlights tables in this report.
Generally accepted accounting principles require adjustments to be made to the net assets of the Fund at period end for financial reporting purposes only, and as such, the total return based on the unadjusted net asset value per share may differ from the total return reported in the financial highlights.
Growth of an Assumed $10,000 Investment in DWS Global Growth VIP
| | |
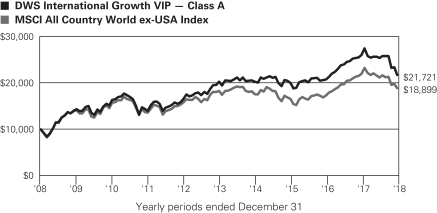 | | TheMSCIAll Country Worldex-USAIndexis designed to provide a broad measure of stock performance throughout the world, with the exception of U.S.-based companies. The MSCI All Country World ex-USA Index includes both developed and emerging markets. Index returns do not reflect any fees or expenses and it is not possible to invest directly into an index. |
The growth of $10,000 is cumulative.
| | | | | | | | | | |
| Comparative Results | | | | | | | | | | |
| | | | | |
| DWS International Growth VIP | | | | 1-Year | | 3-Year | | 5-Year | | 10-Year |
| Class A | | Growth of $10,000 | | $8,331 | | $10,841 | | $10,721 | | $21,721 |
| | | Average annual total return | | –16.69% | | 2.73% | | 1.40% | | 8.07% |
MSCI All Country World
ex-USA Index | | Growth of $10,000 | | $8,580 | | $11,404 | | $10,342 | | $18,899 |
| | Average annual total return | | –14.20% | | 4.48% | | 0.68% | | 6.57% |
| | | | | |
| DWS International Growth VIP | | | | 1-Year | | 3-Year | | 5-Year | | 10-Year |
| Class B | | Growth of $10,000 | | $8,308 | | $10,759 | | $10,566 | | $21,017 |
| | | Average annual total return | | –16.92% | | 2.47% | | 1.11% | | 7.71% |
MSCI All Country World
ex-USA Index | | Growth of $10,000 | | $8,580 | | $11,404 | | $10,342 | | $18,899 |
| | Average annual total return | | –14.20% | | 4.48% | | 0.68% | | 6.57% |
| | | | |
Deutsche DWS Variable Series II — DWS International Growth VIP | | | | | 3 |
| | |
| Management Summary | | December 31, 2018 (Unaudited) |
The Fund’s Class A shares returned –16.69% during 2018 (unadjusted for contract charges), trailing the –14.20% return of the MSCIAll-Country Worldex-USA Index. After rallying in January, international stocks moved steadily lower for the remainder of the year amid mounting evidence that economic growth outside of the United States was slowing. The selloff gained momentum in the fourth quarter as heightened uncertainty about the investment outlook began to weigh heavily on market sentiment. The index return was pressured not just by falling stock prices, but also the weakness in foreign currencies relative to the U.S dollar.
The Fund’s underperformance was largely the result of stock selection in the health care, communications services, and financials sectors. The largest detractors were the health care stocks Fresenius Medical Care AG & Co. KGaA (Germany) and Eurofins Scientific (Luxembourg). The companies specialize in dialysis treatment and laboratory testing, respectively. Fresenius posted weaker-than-expected earnings, while Eurofins was hurt by investor concerns about its ability to maintain its high growth rate and attractive profit margins. On the plus side, the Fund’s overweight position in health care made a positive contribution to performance. In the communications services sector, Spotify Technology SA was a key detractor. The stock was negatively affected by the negative sentiment toward internet stocks in the latter part of the year, as well as slightly lower subscriber guidance for the fourth quarter. Several positions fueled the Fund’s shortfall in financials, including ING Groep NV (Netherlands), Julius Baer Group Ltd. (Switzerland), and Mitsubishi UFJ Financial Group, Inc. (Japan).
Our stock selection in the consumer discretionary sector made the largest contribution to performance. The apparel producer Canada Goose Holdings, Inc. — which rallied due to better-than-expected sales results and optimism surrounding its potential for geographic expansion — was the top contributor in the sector, followed by LVMH Moet Hennessy Louis Vuitton SE (France) and Compass Group PLC (United Kingdom). Stock selection in the information technology and consumer staples also added value in the annual period. Experian PLC, based in the United Kingdom, was the top contributor in the Fund as a whole. Experian impressed the markets with its high organic growth, profit-margin improvement, and product innovation.
We believe volatility could remain a factor in market performance in the coming year due to ongoing questions about economic growth, corporate profits, U.S. trade policy, and the direction of global interest rates. However, these issues already led to a large decrease in valuations in the fourth calendar. Believing these circumstances provided the chance to buy high-quality growth companies at attractive prices, we remained on the lookout for opportunities to use temporary price dislocations to our advantage. In addition, we continued to focus our attention on identifying growth companies whose strengthening fundamentals and higher earnings power can offset the effect of slowing global growth. We also sought to balance the portfolio’s risk exposure by diversifying across regions and different stages of companies’ growth lifecycles.
Ourbottom-up investment process led us to hold overweight positions in the industrials, consumer discretionary, health care, and information technology sectors. Conversely, the portfolio was underweight in consumer staples, energy, financials, and materials. The Fund remained well diversified among all geographic regions, with the largest underweights in Japan and the United Kingdom and the most meaningful overweights in Germany and France. We continued to look for attractive investment candidates in the emerging markets, especially Asia. In particular, we sought to identify those with valuations that pulled back due to the trade-related macroeconomic concerns, but whose long-term fundamental trends and earnings potential had not changed in any significant way. We also saw opportunities in Japan, where improvements in structural economic growth and corporations’ returns on equity created a stronger foundation for the nation’s stock market.
Sebastian P. Werner, PhD, Director
Mark Schumann, CFA, Director
Portfolio Managers
The views expressed reflect those of the portfolio management team only through the end of the period of the report as stated on the cover. The management team’s views are subject to change at any time based on market and other conditions and should not be construed as a recommendation. Past performance is no guarantee of future results. Current and future portfolio holdings are subject to risk.
| | | | | | |
| | 4 | | | | | | Deutsche DWS Variable Series II — DWS International Growth VIP |
Terms to Know
TheMSCI All Country (AC) World Indexex-USA Index is designed to provide a broad measure of stock performance throughout the world, with the exception of U.S.-based companies. The MSCI All Country World IndexEx-U.S. includes both developed and emerging markets.
Contribution anddetractionincorporate both a stock’s total return and its weighting in the fund.
| | | | |
Deutsche DWS Variable Series II — DWS International Growth VIP | | | | | 5 |
| | |
| Portfolio Summary | | (Unaudited) |
| | | | | | | | |
| Asset Allocation (As a % of Investment Portfolio excluding Securities Lending Collateral) | | 12/31/18 | | | 12/31/17 | |
| Common Stocks | | | 99% | | | | 96% | |
| Cash Equivalents | | | 1% | | | | 4% | |
| Preferred Stocks | | | 0% | | | | 0% | |
| Warrants | | | 0% | | | | 0% | |
| | | | 100% | | | | 100% | |
| | |
Sector Diversification (As a % of Investment Portfolio excluding Cash Equivalents and Securities Lending Collateral) | | 12/31/18 | | | 12/31/17 | |
| Financials | | | 20% | | | | 22% | |
| Industrials | | | 15% | | | | 17% | |
| Consumer Discretionary | | | 15% | | | | 12% | |
| Health Care | | | 14% | | | | 14% | |
| Information Technology | | | 14% | | | | 14% | |
| Consumer Staples | | | 7% | | | | 6% | |
| Communication Services | | | 7% | | | | 6% | |
| Materials | | | 6% | | | | 6% | |
| Energy | | | 2% | | | | 3% | |
| | | | 100% | | | | 100% | |
| | |
Geographical Diversification (As a % of Investment Portfolio excluding Cash Equivalents and Securities Lending Collateral) | | 12/31/18 | | | 12/31/17 | |
| Germany | | | 13% | | | | 11% | |
| Japan | | | 12% | | | | 6% | |
| France | | | 11% | | | | 12% | |
| Canada | | | 10% | | | | 12% | |
| Switzerland | | | 9% | | | | 7% | |
| China | | | 8% | | | | 7% | |
| United States | | | 7% | | | | 12% | |
| United Kingdom | | | 7% | | | | 10% | |
| Netherlands | | | 4% | | | | 3% | |
| Sweden | | | 3% | | | | 2% | |
| Singapore | | | 2% | | | | 2% | |
| Argentina | | | 2% | | | | — | |
| Korea | | | 2% | | | | 1% | |
| Finland | | | 1% | | | | 2% | |
| Other | | | 9% | | | | 13% | |
| | | | 100% | | | | 100% | |
Portfolio holdings and characteristics are subject to change.
For more complete details about the Fund’s investment portfolio, see page 7.
Following the Fund’s fiscal first and thirdquarter-end, a complete portfolio holdings listing is filed with the SEC on FormN-Q or Form N-PORT (available for filings after March 31, 2019). The Fund’s Form N-Q or Form N-PORT will be available on the SEC’s Web site at sec.gov. The Fund’s portfolio holdings are also posted on dws.com from time to time. Please see the Fund’s current prospectus for more information.
| | | | | | |
| | 6 | | | | | | Deutsche DWS Variable Series II — DWS International Growth VIP |
| | |
Investment Portfolio | | December 31, 2018 |
| | | | | | | | |
| | | Shares | | | Value ($) | |
| Common Stocks 97.7% | | | | | | | | |
| Argentina 1.8% | | | | | | | | |
Globant SA* (a) | | | 3,947 | | | | 222,295 | |
Grupo Supervielle SA (ADR) | | | 3,900 | | | | 33,852 | |
| | | | | | | | |
(Cost $265,787) | | | | | | | 256,147 | |
| | |
| Brazil 0.4% | | | | | | | | |
Pagseguro Digital Ltd. “A”* (a) (b) (Cost $70,885) | | | 2,615 | | | | 48,979 | |
| | |
| Canada 9.5% | | | | | | | | |
Agnico Eagle Mines, Ltd. | | | 4,850 | | | | 195,748 | |
Alimentation Couche-Tard, Inc. “B” | | | 4,081 | | | | 203,004 | |
Brookfield Asset Management, Inc. “A” | | | 9,386 | | | | 359,709 | |
Canada Goose Holdings, Inc.* | | | 3,086 | | | | 134,905 | |
Canadian National Railway Co. | | | 2,508 | | | | 185,748 | |
Gildan Activewear, Inc. | | | 2,315 | | | | 70,271 | |
Toronto-Dominion Bank | | | 4,295 | | | | 213,492 | |
| | | | | | | | |
(Cost $1,038,892) | | | | | | | 1,362,877 | |
| | |
| China 8.2% | | | | | | | | |
Alibaba Group Holding Ltd. (ADR)* | | | 1,500 | | | | 205,605 | |
China Life Insurance Co., Ltd. “H” | | | 66,000 | | | | 140,151 | |
Minth Group Ltd. | | | 26,870 | | | | 86,822 | |
Momo, Inc. (ADR)* | | | 3,200 | | | | 76,000 | |
New Oriental Education & Technology Group, Inc. (ADR)* | | | 1,800 | | | | 98,658 | |
Ping An Healthcare and Technology Co., Ltd. 144A* | | | 2,100 | | | | 7,334 | |
Ping An Insurance (Group) Co. of China Ltd. “H” | | | 30,500 | | | | 269,558 | |
Tencent Holdings Ltd. | | | 7,300 | | | | 292,191 | |
| | | | | | | | |
(Cost $1,185,748) | | | | | | | 1,176,319 | |
| | |
| Denmark 0.7% | | | | | | | | |
Chr Hansen Holding AS (Cost $100,652) | | | 1,148 | | | | 101,838 | |
| | |
| Finland 1.2% | | | | | | | | |
Sampo Oyj “A” (Cost $183,782) | | | 3,765 | | | | 166,629 | |
| | |
| France 10.9% | | | | | | | | |
Airbus SE | | | 1,186 | | | | 114,356 | |
Capgemini SE | | | 2,140 | | | | 213,415 | |
LVMH Moet Hennessy Louis Vuitton SE | | | 950 | | | | 281,576 | |
SMCP SA 144A* | | | 7,900 | | | | 122,087 | |
Teleperformance | | | 1,174 | | | | 188,039 | |
TOTAL SA | | | 4,716 | | | | 249,561 | |
VINCI SA | | | 2,630 | | | | 217,191 | |
Vivendi SA | | | 7,074 | | | | 172,518 | |
| | | | | | | | |
(Cost $1,661,350) | | | | | | | 1,558,743 | |
| | |
| Germany 12.9% | | | | | | | | |
adidas AG | | | 587 | | | | 123,147 | |
Allianz SE (Registered) | | | 1,125 | | | | 226,642 | |
BASF SE | | | 2,275 | | | | 159,680 | |
Continental AG | | | 687 | | | | 95,690 | |
Deutsche Boerse AG | | | 2,693 | | | | 324,857 | |
Deutsche Post AG (Registered) | | | 3,700 | | | | 101,623 | |
Evonik Industries AG | | | 6,810 | | | | 170,755 | |
| | | | | | | | |
| | | Shares | | | Value ($) | |
Fresenius Medical Care AG & Co. KGaA | | | 3,000 | | | | 195,047 | |
Infineon Technologies AG | | | 3,760 | | | | 75,285 | |
LANXESS AG | | | 2,149 | | | | 99,402 | |
SAP SE | | | 1,621 | | | | 162,292 | |
Siemens AG (Registered) | | | 1,000 | | | | 111,912 | |
| | | | | | | | |
(Cost $2,206,471) | | | | | | | 1,846,332 | |
| | |
| Hong Kong 0.8% | | | | | | | | |
Techtronic Industries Co., Ltd. (Cost $51,080) | | | 21,597 | | | | 115,053 | |
| | |
| Ireland 1.4% | | | | | | | | |
Kerry Group PLC “A” (Cost $131,801) | | | 1,955 | | | | 194,048 | |
| | |
| Italy 1.1% | | | | | | | | |
Luxottica Group SpA (Cost $159,850) | | | 2,632 | | | | 156,090 | |
| | |
| Japan 11.2% | | | | | | | | |
Daikin Industries Ltd. | | | 2,400 | | | | 254,789 | |
FANUC Corp. | | | 400 | | | | 60,535 | |
Fast Retailing Co., Ltd. | | | 500 | | | | 255,210 | |
Hoya Corp. | | | 3,800 | | | | 228,766 | |
Kao Corp. | | | 1,500 | | | | 111,340 | |
Keyence Corp. | | | 400 | | | | 202,423 | |
Komatsu Ltd. | | | 3,500 | | | | 74,848 | |
MISUMI Group, Inc. | | | 4,911 | | | | 103,024 | |
Mitsubishi UFJ Financial Group, Inc. | | | 36,600 | | | | 179,319 | |
Pigeon Corp. | | | 3,100 | | | | 132,671 | |
| | | | | | | | |
(Cost $1,690,145) | | | | | | | 1,602,925 | |
| | |
| Korea 1.4% | | | | | | | | |
Samsung Electronics Co., Ltd. (Cost $253,931) | | | 5,868 | | | | 203,291 | |
| | |
| Luxembourg 1.2% | | | | | | | | |
Eurofins Scientific (Cost $135,670) | | | 460 | | | | 172,015 | |
| | |
| Macau 1.0% | | | | | | | | |
Sands China Ltd. (b) (Cost $163,702) | | | 30,800 | | | | 134,903 | |
| | |
| Malaysia 1.0% | | | | | | | | |
IHH Healthcare Bhd. (Cost $154,924) | | | 111,500 | | | | 145,326 | |
| | |
| Netherlands 3.9% | | | | | | | | |
Adyen NV 144A* | | | 11 | | | | 6,022 | |
ASML Holding NV | | | 1,020 | | | | 160,949 | |
Core Laboratories NV (a) | | | 755 | | | | 45,043 | |
ING Groep NV | | | 15,743 | | | | 170,139 | |
Koninklijke Philips NV | | | 5,000 | | | | 177,257 | |
| | | | | | | | |
(Cost $685,249) | | | | | | | 559,410 | |
| | |
| Norway 0.6% | | | | | | | | |
Marine Harvest ASA (Cost $46,840) | | | 4,065 | | | | 85,715 | |
| | |
| Singapore 2.3% | | | | | | | | |
DBS Group Holdings Ltd. (Cost $305,399) | | | 19,100 | | | | 331,554 | |
The accompanying notes are an integral part of the financial statements.
| | | | |
Deutsche DWS Variable Series II — DWS International Growth VIP | | | | | 7 |
| | | | | | | | |
| | | Shares | | | Value ($) | |
| | |
| South Africa 1.0% | | | | | | | | |
Naspers Ltd. “N” (Cost $173,160) | | | 745 | | | | 149,044 | |
| | |
| Sweden 3.1% | | | | | | | | |
| | |
Assa Abloy AB “B” | | | 8,701 | | | | 156,042 | |
| | |
Nobina AB 144A | | | 21,995 | | | | 149,262 | |
| | |
Spotify Technology SA* (a) | | | 1,150 | | | | 130,525 | |
| | | | | | | | |
(Cost $455,690) | | | | | | | 435,829 | |
| | |
| Switzerland 8.5% | | | | | | | | |
| | |
Julius Baer Group Ltd. | | | 2,470 | | | | 88,339 | |
| | |
Lonza Group AG (Registered)* | | | 1,538 | | | | 401,402 | |
| | |
Nestle SA (Registered) | | | 3,349 | | | | 272,362 | |
| | |
Novartis AG (Registered) | | | 3,078 | | | | 264,111 | |
| | |
Roche Holding AG (Genusschein) | | | 783 | | | | 194,821 | |
| | | | | | | | |
(Cost $1,034,277) | | | | | | | 1,221,035 | |
| | |
| Taiwan 1.1% | | | | | | | | |
Taiwan Semiconductor Manufacturing Co., Ltd. (Cost $127,110) | | | 21,000 | | | | 153,833 | |
| | |
| United Kingdom 6.3% | | | | | | | | |
| | |
Clinigen Healthcare Ltd.* | | | 9,300 | | | | 89,412 | |
| | |
Compass Group PLC | | | 6,790 | | | | 142,927 | |
| | |
Experian PLC | | | 13,989 | | | | 339,876 | |
| | |
Farfetch Ltd. “A”* (a) | | | 1,600 | | | | 28,336 | |
| | |
Halma PLC | | | 6,129 | | | | 106,733 | |
| | |
Prudential PLC | | | 11,150 | | | | 199,707 | |
| | | | | | | | |
(Cost $857,273) | | | | | | | 906,991 | |
| | |
| United States 6.2% | | | | | | | | |
| | |
Activision Blizzard, Inc. | | | 2,482 | | | | 115,587 | |
| | |
Ecolab, Inc. | | | 538 | | | | 79,274 | |
| | |
EPAM Systems, Inc.* | | | 1,310 | | | | 151,973 | |
| | |
Marsh & McLennan Companies, Inc. | | | 1,860 | | | | 148,335 | |
| | |
MasterCard, Inc. “A” | | | 780 | | | | 147,147 | |
| | |
NVIDIA Corp. | | | 673 | | | | 89,845 | |
| | |
Schlumberger Ltd. | | | 1,698 | | | | 61,264 | |
| | |
Thermo Fisher Scientific, Inc. | | | 429 | | | | 96,006 | |
| | | | | | | | |
(Cost $675,935) | | | | | | | 889,431 | |
Total Common Stocks (Cost $13,815,603) | | | | 13,974,357 | |
| | | | | | | | |
| | | Shares | | | Value ($) | |
| | |
| Warrants 0.0% | | | | | | | | |
| France | | | | | | | | |
| | |
Parrot SA Expiration Date 12/15/2022* (c) | | | 924 | | | | 9 | |
| | |
Parrot SA Expiration Date 12/22/2022* (c) | | | 924 | | | | 7 | |
Total Warrants (Cost $0) | | | | | | | 16 | |
| |
| Convertible Preferred Stock 0.1% | | | | | |
| United States | | | | | | | | |
Providence Service Corp. (c) (Cost $13,600) | | | 136 | | | | 20,468 | |
| |
| Securities Lending Collateral 1.1% | | | | | |
DWS Government & Agency Securities Portfolio “DWS Government Cash Institutional Shares”, 2.29% (d) (e) (Cost $156,436) | | | 156,436 | | | | 156,436 | |
| | |
| Cash Equivalents 1.0% | | | | | | | | |
DWS Central Cash Management Government Fund, 2.41% (d) (Cost $148,953) | | | 148,953 | | | | 148,953 | |
| | |
| | | % of Net
Assets | | | Value ($) | |
Total Investment Portfolio
(Cost $14,134,592) | | | 99.9 | | | | 14,300,230 | |
| Other Assets and Liabilities, Net | | | 0.1 | | | | 7,605 | |
| Net Assets | | | 100.0 | | | | 14,307,835 | |
A summary of the Fund’s transactions with affiliated investments during the year ended December 31, 2018 are as follows:
| | | | | | | | | | | | | | | | | | | | | | | | | | | | | | | | |
Value ($) at
12/31/2017 | | Purchases
Cost ($) | | | Sales
Proceeds ($) | | | Net
Realized
Gain/
(Loss) ($) | | | Net Change in
Unrealized
Appreciation
(Depreciation) ($) | | | Income ($) | | | Capital Gain
Distributions ($) | | | Number of
Shares at
12/31/2018 | | | Value ($) at
12/31/2018 | |
Securities Lending Collateral 1.1% | | | | | | | | | | | | | | | | | |
DWS Government & Agency Securities Portfolio “DWS Government Cash Institutional Shares”, 2.29% (d) (e) | |
| 88,780 | | | 67,656 | (f) | | | — | | | | — | | | | — | | | | 3,108 | | | | — | | | | 156,436 | | | | 156,436 | |
Cash Equivalents 1.0% | | | | | | | | | | | | | | | | | |
DWS Central Cash Management Government Fund, 2.41% (d) | |
| 687,282 | | | 5,635,961 | | | | 6,174,290 | | | | — | | | | — | | | | 6,099 | | | | — | | | | 148,953 | | | | 148,953 | |
| 776,062 | | | 5,703,617 | | | | 6,174,290 | | | | — | | | | — | | | | 9,207 | | | | — | | | | 305,389 | | | | 305,389 | |
| * | Non-income producing security. |
| (a) | Listed on the New York Stock Exchange. |
| (b) | All or a portion of these securities were on loan. In addition, “Other Assets and Liabilities, Net” may include pending sales that are also on loan. The value of securities loaned at December 31, 2018 amounted to $156,396, which is 1.1% of net assets. |
| (c) | Investment was valued using significant unobservable inputs. |
The accompanying notes are an integral part of the financial statements.
| | | | | | |
| | 8 | | | | | | Deutsche DWS Variable Series II — DWS International Growth VIP |
| (d) | Affiliated fund managed by DWS Investment Management Americas, Inc. The rate shown is the annualized seven-day yield at period end. |
| (e) | Represents collateral held in connection with securities lending. Income earned by the Fund is net of borrower rebates. |
| (f) | Represents the net increase (purchase cost) or decrease (sales proceeds) in the amount invested for the year ended December 31, 2018. |
144A: Security exempt from registration under Rule 144A of the Securities Act of 1933. These securities may be resold in transactions exempt from registration, normally to qualified institutional buyers.
ADR: American Depositary Receipt
Fair Value Measurements
Various inputs are used in determining the value of the Fund’s investments. These inputs are summarized in three broad levels. Level 1 includes quoted prices in active markets for identical securities. Level 2 includes other significant observable inputs (including quoted prices for similar securities, interest rates, prepayment speeds and credit risk). Level 3 includes significant unobservable inputs (including the Fund’s own assumptions in determining the fair value of investments). The level assigned to the securities valuations may not be an indication of the risk or liquidity associated with investing in those securities.
The following is a summary of the inputs used as of December 31, 2018 in valuing the Fund’s investments. For information on the Fund’s policy regarding the valuation of investments, please refer to the Security Valuation section of Note A in the accompanying Notes to Financial Statements.
| | | | | | | | | | | | | | | | |
| Assets | | Level 1 | | | Level 2 | | | Level 3 | | | Total | |
Common Stocks | | | | | | | | | | | | | | | | |
Argentina | | $ | 256,147 | | | $ | — | | | $ | — | | | $ | 256,147 | |
Brazil | | | 48,979 | | | | — | | | | — | | | | 48,979 | |
Canada | | | 1,362,877 | | | | — | | | | — | | | | 1,362,877 | |
China | | | 380,263 | | | | 796,056 | | | | — | | | | 1,176,319 | |
Denmark | | | — | | | | 101,838 | | | | — | | | | 101,838 | |
Finland | | | — | | | | 166,629 | | | | — | | | | 166,629 | |
France | | | — | | | | 1,558,743 | | | | — | | | | 1,558,743 | |
Germany | | | — | | | | 1,846,332 | | | | — | | | | 1,846,332 | |
Hong Kong | | | — | | | | 115,053 | | | | — | | | | 115,053 | |
Ireland | | | — | | | | 194,048 | | | | — | | | | 194,048 | |
Italy | | | — | | | | 156,090 | | | | — | | | | 156,090 | |
Japan | | | — | | | | 1,602,925 | | | | — | | | | 1,602,925 | |
Korea | | | — | | | | 203,291 | | | | — | | | | 203,291 | |
Luxembourg | | | — | | | | 172,015 | | | | — | | | | 172,015 | |
Macau | | | — | | | | 134,903 | | | | — | | | | 134,903 | |
Malaysia | | | — | | | | 145,326 | | | | — | | | | 145,326 | |
Netherlands | | | 45,043 | | | | 514,367 | | | | — | | | | 559,410 | |
Norway | | | — | | | | 85,715 | | | | — | | | | 85,715 | |
Singapore | | | — | | | | 331,554 | | | | — | | | | 331,554 | |
South Africa | | | — | | | | 149,044 | | | | — | | | | 149,044 | |
Sweden | | | 130,525 | | | | 305,304 | | | | — | | | | 435,829 | |
Switzerland | | | — | | | | 1,221,035 | | | | — | | | | 1,221,035 | |
Taiwan | | | — | | | | 153,833 | | | | — | | | | 153,833 | |
United Kingdom | | | 28,336 | | | | 878,655 | | | | — | | | | 906,991 | |
United States | | | 889,431 | | | | — | | | | — | | | | 889,431 | |
| Warrants | | | — | | | | — | | | | 16 | | | | 16 | |
| Convertible Preferred Stock | | | — | | | | — | | | | 20,468 | | | | 20,468 | |
| Short-Term Investments (g) | | | 305,389 | | | | — | | | | — | | | | 305,389 | |
| Total | | $ | 3,446,990 | | | $ | 10,832,756 | | | $ | 20,484 | | | $ | 14,300,230 | |
| (g) | See Investment Portfolio for additional detailed categorizations. |
The accompanying notes are an integral part of the financial statements.
| | | | |
Deutsche DWS Variable Series II — DWS International Growth VIP | | | | | 9 |
Statement of Assets and Liabilities
| | | | |
| as of December 31, 2018 | | | | |
| |
| Assets | | | | |
| Investments innon-affiliated securities, at value (cost $13,829,203) — including $156,396 of securities loaned | | $ | 13,994,841 | |
| Investment in DWS Government & Agency Securities Portfolio (cost $156,436)* | | | 156,436 | |
| Investment in DWS Central Cash Management Government Fund (cost $148,953) | | | 148,953 | |
| Foreign currency, at value (cost $185,077) | | | 182,176 | |
| Receivable for investments sold | | | 65,630 | |
| Receivable for Fund shares sold | | | 2,856 | |
| Dividends receivable | | | 4,823 | |
| Interest receivable | | | 816 | |
| Foreign taxes recoverable | | | 26,590 | |
| Other assets | | | 988 | |
| Total assets | | | 14,584,109 | |
| |
| Liabilities | | | | |
| Payable upon return of securities loaned | | | 156,436 | |
| Payable for Fund shares redeemed | | | 9,510 | |
| Accrued management fee | | | 1,643 | |
| Accrued Trustees’ fees | | | 1,639 | |
| Other accrued expenses and payables | | | 107,046 | |
| Total liabilities | | | 276,274 | |
| Net assets, at value | | $ | 14,307,835 | |
| |
| Net Assets Consist of | | | | |
| Distributable earnings (loss) | | | 563,874 | |
| Paid-in capital | | | 13,743,961 | |
| Net assets, at value | | $ | 14,307,835 | |
| |
| Net Asset Value | | | | |
Class A | | | | |
| |
| Net Asset Value, offering and redemption price per share ($14,089,015 ÷ 1,228,635 outstanding shares of beneficial interest, no par value, unlimited number of shares authorized) | | $ | 11.47 | |
Class B | | | | |
| |
| Net Asset Value, offering and redemption price per share ($218,820 ÷ 19,045 outstanding shares of beneficial interest, no par value, unlimited number of shares authorized) | | $ | 11.49 | |
| * | Represents collateral on securities loaned. |
Statement of Operations
| | | | |
| for the year ended December 31, 2018 | |
| |
| Investment Income | | | | |
| Income: | | | | |
Dividends (net of foreign taxes withheld
of $41,704) | | $ | 342,428 | |
| Income distributions — DWS Central Cash Management Government Fund | | | 6,099 | |
| Securities lending income, net of borrower rebates | | | 3,108 | |
| Total income | | | 351,635 | |
| Expenses: | | | | |
| Management fee | | | 107,910 | |
| Administration fee | | | 17,405 | |
| Services to Shareholders | | | 987 | |
| Record keeping fee (Class B) | | | 177 | |
| Distribution service fee (Class B) | | | 580 | |
| Custodian fee | | | 45,605 | |
| Professional fees | | | 79,895 | |
| Reports to shareholders | | | 24,999 | |
| Trustees’ fees and expenses | | | 3,605 | |
| Other | | | 18,952 | |
| Total expenses before expense reductions | | | 300,115 | |
| Expense reductions | | | (158,555 | ) |
| Total expenses after expense reductions | | | 141,560 | |
| Net investment income (loss) | | | 210,075 | |
| |
| Realized and Unrealized Gain (Loss) | | | | |
| Net realized gain (loss) from: | | | | |
| Investments | | | 234,224 | |
| Foreign currency | | | (5,587 | ) |
| | | | 228,637 | |
| Change in net unrealized appreciation (depreciation) on: | | | | |
| Investments | | | (3,346,652 | ) |
| Foreign currency | | | (5,730 | ) |
| | | | (3,352,382 | ) |
| Net gain (loss) | | | (3,123,745 | ) |
| Net increase (decrease) in net assets resulting from operations | | $ | (2,913,670 | ) |
The accompanying notes are an integral part of the financial statements.
| | | | | | |
| | 10 | | | | | | Deutsche DWS Variable Series II — DWS International Growth VIP |
Statements of Changes in Net Assets
| | | | | | | | |
| | | Years Ended December 31, | |
| Increase (Decrease) in Net Assets | | 2018 | | | 2017 | |
| Operations: | | | | | | | | |
| Net investment income (loss) | | $ | 210,075 | | | $ | 164,259 | |
| Net realized gain (loss) | | | 228,637 | | | | 4,651,131 | |
| Change in net unrealized appreciation (depreciation) | | | (3,352,382 | ) | | | 1,414,699 | |
| Net increase (decrease) in net assets resulting from operations | | | (2,913,670 | ) | | | 6,230,089 | |
| Distributions to shareholders: | | | | | | | | |
Class A | | | (169,762 | ) | | | (106,825 | ) |
Class B | | | (1,806 | ) | | | (65 | ) |
| Total distributions | | | (171,568 | ) | | | (106,890 | )* |
| Fund share transactions: | | | | | | | | |
Class A | | | | | | | | |
| Proceeds from shares sold | | | 1,452,220 | | | | 2,240,215 | |
| Reinvestment of distributions | | | 169,762 | | | | 106,825 | |
| Payments for shares redeemed | | | (3,127,727 | ) | | | (16,678,132 | ) |
| Net increase (decrease) in net assets from Class A share transactions | | | (1,505,745 | ) | | | (14,331,092 | ) |
Class B | | | | | | | | |
| Proceeds from shares sold | | | 82,846 | | | | 117,051 | |
| Reinvestment of distributions | | | 1,806 | | | | 65 | |
| Payments for shares redeemed | | | (28,351 | ) | | | (6,431 | ) |
| Net increase (decrease) in net assets from Class B share transactions | | | 56,301 | | | | 110,685 | |
| Increase (decrease) in net assets | | | (4,534,682 | ) | | | (8,097,208 | ) |
| Net assets at beginning of period | | | 18,842,517 | | | | 26,939,725 | |
| | |
| Net assets at end of period | | $ | 14,307,835 | | | $ | 18,842,517 | ** |
| | |
| Other Information | | | | | | | | |
Class A | | | | | | | | |
| Shares outstanding at beginning of period | | | 1,340,522 | | | | 2,417,159 | |
| Shares sold | | | 108,093 | | | | 171,566 | |
| Shares issued to shareholders in reinvestment of distributions | | | 12,631 | | | | 8,713 | |
| Shares redeemed | | | (232,611 | ) | | | (1,256,916 | ) |
| Net increase (decrease) in Class A shares | | | (111,887 | ) | | | (1,076,637 | ) |
| | |
| Shares outstanding at end of period | | | 1,228,635 | | | | 1,340,522 | |
Class B | | | | | | | | |
| Shares outstanding at beginning of period | | | 14,862 | | | | 6,272 | |
| Shares sold | | | 6,136 | | | | 9,077 | |
| Shares issued to shareholders in reinvestment of distributions | | | 134 | | | | 5 | |
| Shares redeemed | | | (2,087 | ) | | | (492 | ) |
| Net increase (decrease) in Class B shares | | | 4,183 | | | | 8,590 | |
| | |
| Shares outstanding at end of period | | | 19,045 | | | | 14,862 | |
| * | Includes distributions from net investment income. |
| ** | Includes undistributed net investment income of $166,256. |
The accompanying notes are an integral part of the financial statements.
| | | | |
Deutsche DWS Variable Series II — DWS International Growth VIP | | | | | 11 |
Financial Highlights
| | | | | | | | | | | | | | | | | | | | |
| | | Years Ended December 31, | |
| Class A | | 2018 | | | 2017 | | | 2016 | | | 2015 | | | 2014 | |
| | | | | |
| Selected Per Share Data | | | | | | | | | | | | | | | | | | | | |
| Net asset value, beginning of period | | $ | 13.90 | | | $ | 11.12 | | | $ | 10.81 | | | $ | 11.04 | | | $ | 11.13 | |
| Income (loss) from investment operations: | | | | | | | | | | | | | | | | | | | | |
Net investment incomea | | | .16 | | | | .08 | | | | .06 | | | | .07 | | | | .08 | |
Net realized and unrealized gain (loss) | | | (2.46 | ) | | | 2.75 | | | | .34 | | | | (.21 | ) | | | (.06 | ) |
Total from investment operations | | | (2.30 | ) | | | 2.83 | | | | .40 | | | | (.14 | ) | | | .02 | |
| Less distributions from: | | | | | | | | | | | | | | | | | | | | |
Net investment income | | | (.13 | ) | | | (.05 | ) | | | (.09 | ) | | | (.09 | ) | | | (.11 | ) |
| Net asset value, end of period | | $ | 11.47 | | | $ | 13.90 | | | $ | 11.12 | | | $ | 10.81 | | | $ | 11.04 | |
| Total Return (%)b | | | (16.69 | ) | | | 25.47 | | | | 3.72 | | | | (1.32 | ) | | | .21 | |
| | | |
| Ratios to Average Net Assets and Supplemental Data | | | | | | | | | | | | | |
| Net assets, end of period ($ millions) | | | 14 | | | | 19 | | | | 27 | | | | 34 | | | | 47 | |
| Ratio of expenses before expense reductions (%)c | | | 1.72 | | | | 1.56 | | | | 1.66 | | | | 1.44 | | | | 1.41 | |
| Ratio of expenses after expense reductions (%)c | | | .81 | | | | .92 | | | | .95 | | | | .90 | | | | .82 | |
| Ratio of net investment income (%) | | | 1.21 | | | | .61 | | | | .51 | | | | .65 | | | | .71 | |
| Portfolio turnover rate (%) | | | 38 | | | | 62 | | | | 70 | | | | 64 | | | | 63 | |
| a | Based on average shares outstanding during the period. |
| b | Total return would have been lower had certain expenses not been reduced. |
| c | Expense ratio does not reflect charges and fees associated with the separate account that invests in the Fund or any variable life insurance policy or variable annuity contract for which the Fund is an investment option. |
| | | | | | | | | | | | | | | | | | | | |
| | | Years Ended December 31, | |
| Class B | | 2018 | | | 2017 | | | 2016 | | | 2015 | | | 2014 | |
| | | | | |
| Selected Per Share Data | | | | | | | | | | | | | | | | | | | | |
| Net asset value, beginning of period | | $ | 13.93 | | | $ | 11.13 | | | $ | 10.82 | | | $ | 11.05 | | | $ | 11.14 | |
| Income (loss) from investment operations: | | | | | | | | | | | | | | | | | | | | |
Net investment incomea | | | .12 | | | | .02 | | | | .02 | | | | .05 | | | | .02 | |
Net realized and unrealized gain (loss) | | | (2.46 | ) | | | 2.79 | | | | .35 | | | | (.23 | ) | | | (.04 | ) |
Total from investment operations | | | (2.34 | ) | | | 2.81 | | | | .37 | | | | (.18 | ) | | | (.02 | ) |
| Less distributions from: | | | | | | | | | | | | | | | | | | | | |
Net investment income | | | (.10 | ) | | | (.01 | ) | | | (.06 | ) | | | (.05 | ) | | | (.07 | ) |
| Net asset value, end of period | | $ | 11.49 | | | $ | 13.93 | | | $ | 11.13 | | | $ | 10.82 | | | $ | 11.05 | |
| Total Return (%)b | | | (16.92 | ) | | | 25.26 | | | | 3.38 | | | | (1.64 | ) | | | (.15 | ) |
| | | | | |
| Ratios to Average Net Assets and Supplemental Data | | | | | | | | | | | | | | | | | | | | |
| Net assets, end of period ($ millions) | | | .2 | | | | .2 | | | | .07 | | | | .1 | | | | .1 | |
| Ratio of expenses before expense reductions (%)c | | | 2.07 | | | | 1.90 | | | | 1.98 | | | | 1.76 | | | | 1.76 | |
| Ratio of expenses after expense reductions (%)c | | | 1.06 | | | | 1.15 | | | | 1.24 | | | | 1.22 | | | | 1.15 | |
| Ratio of net investment income (%) | | | .92 | | | | .12 | | | | .17 | | | | .40 | | | | .14 | |
| Portfolio turnover rate (%) | | | 38 | | | | 62 | | | | 70 | | | | 64 | | | | 63 | |
| a | Based on average shares outstanding during the period. |
| b | Total return would have been lower had certain expenses not been reduced. |
| c | Expense ratio does not reflect charges and fees associated with the separate account that invests in the Fund or any variable life insurance policy or variable annuity contract for which the Fund is an investment option. |
The accompanying notes are an integral part of the financial statements.
| | | | | | |
| | 12 | | | | | | Deutsche DWS Variable Series II — DWS International Growth VIP |
| | |
| Notes to Financial Statements | | |
A. Organization and Significant Accounting Policies
DWS International Growth VIP (formerly Deutsche International Growth VIP) (the “Fund”) is a diversified series of Deutsche DWS Variable Series II (formerly Deutsche Variable Series II) (the “Trust”), which is registered under the Investment Company Act of 1940, as amended (the “1940 Act”), as anopen-end management investment company organized as a Massachusetts business trust.
Multiple Classes of Shares of Beneficial Interest. The Fund offers two classes of shares (Class A shares and Class B shares). Sales of Class B shares are subject to recordkeeping fees up to 0.15% and Rule12b-1 fees under the 1940 Act equal to an annual rate of 0.25% of the average daily net assets for Class B shares of the Fund. Class A shares are not subject to such fees.
Investment income, realized and unrealized gains and losses, and certainfund-level expenses and expense reductions, if any, are borne pro rata on the basis of relative net assets by the holders of all classes of shares except that each class bears certain expenses unique to that class (including the applicable Rule12b-1 fee and recordkeeping fees). Differences inclass-level expenses may result in payment of different per share dividends by class. All shares have equal rights with respect to voting subject toclass-specific arrangements.
The Fund’s financial statements are prepared in accordance with accounting principles generally accepted in the United States of America (“U.S. GAAP”) which require the use of management estimates. Actual results could differ from those estimates. The Fund qualifies as an investment company under Topic 946 of Accounting Standards Codification of U.S. GAAP. The policies described below are followed consistently by the Fund in the preparation of its financial statements.
In October 2018, the Securities and Exchange Commission adopted amendments to certain disclosure requirements in Securities Act Release No. 33-10532, Disclosure Update and Simplification, which is intended to facilitate the disclosure of information to investors and simplify compliance without significantly altering the total mix of information provided to investors. Effective with the current reporting period, the Fund adopted the amendments with the impacts being that the Fund is no longer required to present components of distributable earnings on the Statement of Assets and Liabilities or the sources of distributable earnings and the amount of undistributed net investment income on the Statements of Changes in Net Assets.
Security Valuation. Investments are stated at value determined as of the close of regular trading on the New York Stock Exchange on each day the exchange is open for trading.
Various inputs are used in determining the value of the Fund’s investments. These inputs are summarized in three broad levels. Level 1 includes quoted prices in active markets for identical securities. Level 2 includes other significant observable inputs (including quoted prices for similar securities, interest rates, prepayment speeds and credit risk). Level 3 includes significant unobservable inputs (including the Fund’s own assumptions in determining the fair value of investments). The level assigned to the securities valuations may not be an indication of the risk or liquidity associated with investing in those securities.
Equity securities are valued at the most recent sale price or official closing price reported on the exchange (U.S. or foreign) orover-the-counter market on which they trade. Securities for which no sales are reported are valued at the calculated mean between the most recent bid and asked quotations on the relevant market or, if a mean cannot be determined, at the most recent bid quotation. Equity securities are generally categorized as Level 1. For certain international equity securities, in order to adjust for events which may occur between the close of the foreign exchanges and the close of the New York Stock Exchange, a fair valuation model may be used. This fair valuation model takes into account comparisons to the valuation of American Depository Receipts (ADRs),exchange-traded funds, futures contracts and certain indices and these securities are categorized as Level 2.
Investments inopen-end investment companies are valued at their net asset value each business day and are categorized as Level 1.
Securities and other assets for which market quotations are not readily available or for which the above valuation procedures are deemed not to reflect fair value are valued in a manner that is intended to reflect their fair value as determined in accordance with procedures approved by the Board and are generally categorized as Level 3. In accordance with the Fund’s valuation procedures, factors considered in determining value may include, but are not limited to, the type of the security; the size of the holding; the initial cost of the security; the existence of any contractual restrictions on the security’s disposition; the price and extent of public trading in similar securities of the issuer or of comparable companies; quotations or
| | | | |
Deutsche DWS Variable Series II — DWS International Growth VIP | | | | | 13 |
evaluated prices frombroker-dealers and/or pricing services; information obtained from the issuer, analysts, and/or the appropriate stock exchange (forexchange-traded securities); an analysis of the company’s or issuer’s financial statements; an evaluation of the forces that influence the issuer and the market(s) in which the security is purchased and sold; and with respect to debt securities, the maturity, coupon, creditworthiness, currency denomination and the movement of the market in which the security is normally traded. The value determined under these procedures may differ from published values for the same securities.
Disclosure about the classification of fair value measurements is included in a table following the Fund’s Investment Portfolio.
Foreign Currency Translations. The books and records of the Fund are maintained in U.S. dollars. Investment securities and other assets and liabilities denominated in a foreign currency are translated into U.S. dollars at the prevailing exchange rates at period end. Purchases and sales of investment securities, income and expenses are translated into U.S. dollars at the prevailing exchange rates on the respective dates of the transactions.
Net realized and unrealized gains and losses on foreign currency transactions represent net gains and losses between trade and settlement dates on securities transactions, the acquisition and disposition of foreign currencies, and the difference between the amount of net investment income accrued and the U.S. dollar amount actually received. The portion of both realized and unrealized gains and losses on investments that results from fluctuations in foreign currency exchange rates is not separately disclosed but is included with net realized and unrealized gain/appreciation and loss/depreciation on investments.
Securities Lending. Brown Brothers Harriman & Co., as lending agent, lends securities of the Fund to certain financial institutions under the terms of its securities lending agreement. During the term of the loans, the Fund continues to receive interest and dividends generated by the securities and to participate in any changes in their market value. The Fund requires the borrowers of the securities to maintain collateral with the Fund consisting of either cash or liquid, unencumbered assets having a value at least equal to the value of the securities loaned. When the collateral falls below specified amounts, the lending agent will use its best effort to obtain additional collateral on the next business day to meet required amounts under the securities lending agreement. As of period end, any securities on loan were collateralized by cash. During the year ended December 31, 2018, the Fund invested the cash collateral into a joint trading account in affiliated money market funds managed by DWS Investment Management Americas, Inc. As of December 31, 2018, the Fund invested the cash collateral in DWS Government & Agency Securities Portfolio. DWS Investment Management Americas, Inc. receives a management/administration fee (0.12% annualized effective rate as of December 31, 2018) on the cash collateral invested in DWS Government & Agency Securities Portfolio. The Fund receives compensation for lending its securities either in the form of fees or by earning interest on invested cash collateral net of borrower rebates and fees paid to a lending agent. Either the Fund or the borrower may terminate the loan at any time, and the borrower, after notice, is required to return borrowed securities within a standard time period. There may be risks of delay and costs in recovery of securities or even loss of rights in the collateral should the borrower of the securities fail financially. If the Fund is not able to recover securities lent, the Fund may sell the collateral and purchase a replacement investment in the market, incurring the risk that the value of the replacement security is greater than the value of the collateral. The Fund is also subject to all investment risks associated with the reinvestment of any cash collateral received, including, but not limited to, interest rate, credit and liquidity risk associated with such investments.
As of December 31, 2018, the Fund had securities on loan, which were classified as common stocks in the Investment Portfolio. The value of the related collateral exceeded the value of the securities loaned at period end. As of period end, the remaining contractual maturity of the collateral agreements were overnight and continuous.
Taxes. The Fund’s policy is to comply with the requirements of the Internal Revenue Code, as amended, which are applicable to regulated investment companies and to distribute all of its taxable income to its shareholders.
Additionally, the Fund may be subject to taxes imposed by the governments of countries in which it invests and are generally based on income and/or capital gains earned or repatriated, a portion of which may be recoverable. Based upon the current interpretation of the tax rules and regulations, estimated tax liabilities and recoveries on certain foreign securities are recorded on an accrual basis and are reflected as components of interest income or net change in unrealized gain/loss on investments. Tax liabilities realized as a result of security sales are reflected as a component of net realized gain/loss on investments.
| | | | | | |
| | 14 | | | | | | Deutsche DWS Variable Series II — DWS International Growth VIP |
The Fund has reviewed the tax positions for the open tax years as of December 31, 2018 and has determined that no provision for income tax and/or uncertain tax positions is required in the Fund’s financial statements. The Fund’s federal tax returns for the prior three fiscal years remain open subject to examination by the Internal Revenue Service.
Distribution of Income and Gains. Distributions from net investment income of the Fund, if any, are declared and distributed to shareholders annually. Net realized gains from investment transactions, in excess of available capital loss carryforwards, would be taxable to the Fund if not distributed and, therefore, will be distributed to shareholders at least annually. The Fund may also make additional distributions for tax purposes if necessary.
The timing and characterization of certain income and capital gain distributions are determined annually in accordance with federal tax regulations which may differ from accounting principles generally accepted in the United States of America. These differences primarily relate to investments in foreign denominated investments and certain securities sold at a loss. As a result, net investment income (loss) and net realized gain (loss) on investment transactions for a reporting period may differ significantly from distributions during such period. Accordingly, the Fund may periodically make reclassifications among certain of its capital accounts without impacting the net asset value of the Fund.
At December 31, 2018, the Fund’s components of distributable earnings on a tax basis were as follows:
| | | | |
| Undistributed ordinary income* | | $ | 199,175 | |
| Undistributed long-term capital gains | | $ | 234,678 | |
| Unrealized appreciation (depreciation) on investments | | $ | 133,241 | |
At December 31, 2018, the aggregate cost of investments for federal income tax purposes was $14,166,989. The net unrealized appreciation for all investments based on tax cost was $133,241. This consisted of aggregate gross unrealized appreciation for all investments in which there was an excess of value over tax cost of $1,769,647 aggregate gross unrealized depreciation for all investments in which was an excess of tax cost over value of $1,636,406.
In addition, the tax character of distributions paid by the Fund is summarized as follows:
| | | | | | | | |
| | | Years Ended December 31, | |
| | | 2018 | | | 2017 | |
| Distributions from ordinary income* | | $ | 171,568 | | | $ | 106,890 | |
| * | For tax purposes, short-term capital gain distributions are considered ordinary income distributions. |
Expenses. Expenses of the Trust arising in connection with a specific fund are allocated to that fund. Other Trust expenses which cannot be directly attributed to a fund are apportioned among the funds in the Trust based upon the relative net assets or other appropriate measures.
Contingencies. In the normal course of business, the Fund may enter into contracts with service providers that contain general indemnification clauses. The Fund’s maximum exposure under these arrangements is unknown, as this would involve future claims that may be made against the Fund that have not yet been made. However, based on experience, the Fund expects the risk of loss to be remote.
Other. Investment transactions are accounted for on a trade date plus one basis for daily net asset value calculations. However, for financial reporting purposes, investment transactions are reported on trade date. Interest income is recorded on the accrual basis. Dividend income is recorded on theex-dividend date net of foreign withholding taxes. Realized gains and losses from investment transactions are recorded on an identified cost basis. Proceeds from litigation payments, if any, are included in net realized gain (loss) from investments.
B. Purchases and Sales of Securities
During the year ended December 31, 2018, purchases and sales of investment transactions (excludingshort-term investments) aggregated $6,449,400 and $7,245,698, respectively.
C. Related Parties
Management Agreement. Under the Investment Management Agreement with DWS Investment Management Americas, Inc. (formerly Deutsche Investment Management Americas Inc.) (“DIMA” or the “Advisor”), an indirect, wholly owned subsidiary of DWS Group GmbH & Co. KGaA (“DWS Group”), the Advisor directs the investments of the Fund in accordance with its investment objectives, policies and restrictions. The Advisor determines the securities, instruments and other contracts relating to investments to be purchased, sold or entered into by the Fund.
| | | | |
Deutsche DWS Variable Series II — DWS International Growth VIP | | | | | 15 |
Pursuant to the Investment Management Agreement with the Advisor, the Fund pays the Advisor an annual fee based on its average daily net assets, computed and accrued daily and payable monthly at the annual rate (exclusive of any applicable waivers/reimbursements) of 0.62%.
For the period from January 1, 2018 through April 30, 2019, the Advisor has contractually agreed to waive its fees and/or reimburse certain operating expenses to the extent necessary to maintain the total annual operating expenses (excluding certain expenses such as extraordinary expenses, taxes, brokerage and interest expense) of each class as follows:
| | | | |
| Class A | | | .81 | % |
| Class B | | | 1.06 | % |
For the year ended December 31, 2018, fees waived and/or expenses reimbursed for each class are as follows:
| | | | |
| Class A | | $ | 156,212 | |
| Class B | | | 2,343 | |
| | | $ | 158,555 | |
Administration Fee. Pursuant to an Administrative Services Agreement, DIMA provides most administrative services to the Fund. For all services provided under the Administrative Services Agreement, the Fund pays DIMA an annual fee (“Administration Fee”) of 0.10% of the Fund’s average daily net assets, computed and accrued daily and payable monthly. For the year ended December 31, 2018, the Administration Fee was $17,405, of which $1,257 is unpaid.
Service Provider Fees. DWS Service Company (“DSC”), an affiliate of the Advisor, is the transfer agent,dividend-paying agent and shareholder service agent for the Fund. Pursuant to asub-transfer agency agreement between DSC and DST Systems, Inc. (“DST”), DSC has delegated certain transfer agent,dividend-paying agent and shareholder service agent functions to DST. DSC compensates DST out of the shareholder servicing fee it receives from the Fund. For the year ended December 31, 2018, the amounts charged to the Fund by DSC were as follows:
| | | | | | | | |
| Services to Shareholders | | Total
Aggregated | | | Unpaid at
December 31, 2018 | |
| Class A | | $ | 243 | | | $ | 41 | |
| Class B | | | 51 | | | | 9 | |
| | | $ | 294 | | | $ | 50 | |
Distribution Service Agreement. Under the Fund’s Class B12b-1 plan, DWS Distributors, Inc. (“DDI”) received a fee (“Distribution Service Fee”) of 0.25% of average daily net assets of Class B shares. For the year ended December 31, 2018, the Distribution Service Fee aggregated $580, of which $47 is unpaid.
Typesetting and Filing Service Fees. Under an agreement with the Fund, DIMA is compensated for providing certainpre-press and regulatory filing services to the Fund. For the year ended December 31, 2018, the amount charged to the Fund by DIMA included in the Statement of Operations under “Reports to shareholders” aggregated $10,725, of which $6,359 is unpaid.
Trustees’ Fees and Expenses. The Fund paid retainer fees to each Trustee not affiliated with the Advisor, plus specified amounts to the Board Chairperson and to each committee Chairperson.
Affiliated Cash Management Vehicles. The Fund may invest uninvested cash balances in DWS Central Cash Management Government Fund and DWS ESG Liquidity Fund, affiliated money market funds which are managed by the Advisor. Each affiliated money market fund is managed in accordance with Rule2a-7 under the 1940 Act, which governs the quality, maturity, diversity and liquidity of instruments in which a money market fund may invest. DWS Central Cash Management Government Fund seeks to maintain a stable net asset value, and DWS ESG Liquidity Fund maintains a floating net asset value. The Fund indirectly bears its proportionate share of the expenses of each affiliated money market fund in which it invests. DWS Central Cash Management Government Fund does not pay the Advisor an investment management fee. To the extent that DWS ESG Liquidity Fund pays an investment management fee to the Advisor, the Advisor will waive an amount of the investment management fee payable to the Advisor by the Fund equal to the amount of the investment management fee payable on the Fund’s assets invested in DWS ESG Liquidity Fund.
| | | | | | |
| | 16 | | | | | | Deutsche DWS Variable Series II — DWS International Growth VIP |
D. Ownership of the Fund
At December 31, 2018, one participating insurance company was owner of record of 10% or more of the total outstanding Class A shares of the Fund, owning 87%. Three participating insurance companies were owners of record of 10% or more of the total outstanding Class B shares of the Fund, owning 48%, 28%, and 24%.
E. Line of Credit
The Fund and other affiliated funds (the “Participants”) share in a $400 million revolving credit facility provided by a syndication of banks. The Fund may borrow for temporary or emergency purposes, including the meeting of redemption requests that otherwise might require the untimely disposition of securities. The Participants are charged an annual commitment fee which is allocated based on net assets, among each of the Participants. Interest is calculated at a rate per annum equal to the sum of the Federal Funds Rate plus 1.25 percent plus if theone-month LIBOR exceeds the Federal Funds Rate, the amount of such excess. The Fund may borrow up to a maximum of 33 percent of its net assets under the agreement. The Fund had no outstanding loans at December 31, 2018.
| | | | |
Deutsche DWS Variable Series II — DWS International Growth VIP | | | | | 17 |
Report of Independent Registered Public Accounting Firm
To the Board of Trustees of Deutsche DWS Variable Series II and Shareholders of DWS International Growth VIP:
Opinion on the Financial Statements
We have audited the accompanying statement of assets and liabilities of DWS International Growth VIP (formerly International Growth VIP) (the “Fund”) (one of the funds constituting Deutsche DWS Variable Series II (formerly Deutsche Variable Series II)) (the “Trust”), including the investment portfolio, as of December 31, 2018, and the related statement of operations for the year then ended, the statements of changes in net assets for each of the two years in the period then ended, the financial highlights for each of the five years in the period then ended and the related notes (collectively referred to as the “financial statements”). In our opinion, the financial statements present fairly, in all material respects, the financial position of the Fund (one of the funds constituting Deutsche DWS Variable Series II) at December 31, 2018, the results of its operations for the year then ended, the changes in its net assets for each of the two years in the period then ended and its financial highlights for each of the five years in the period then ended, in conformity with U.S. generally accepted accounting principles.
Basis for Opinion
These financial statements are the responsibility of the Trust’s management. Our responsibility is to express an opinion on the Fund’s financial statements based on our audits. We are a public accounting firm registered with the Public Company Accounting Oversight Board (United States) (“PCAOB”) and are required to be independent with respect to the Trust in accordance with the U.S. federal securities laws and the applicable rules and regulations of the Securities and Exchange Commission and the PCAOB.
We conducted our audits in accordance with the standards of the PCAOB. Those standards require that we plan and perform the audit to obtain reasonable assurance about whether the financial statements are free of material misstatement, whether due to error or fraud. The Trust is not required to have, nor were we engaged to perform, an audit of the Trust’s internal control over financial reporting. As part of our audits, we are required to obtain an understanding of internal control over financial reporting, but not for the purpose of expressing an opinion on the effectiveness of the Trust’s internal control over financial reporting. Accordingly, we express no such opinion.
Our audits included performing procedures to assess the risks of material misstatement of the financial statements, whether due to error or fraud, and performing procedures that respond to those risks. Such procedures included examining, on a test basis, evidence regarding the amounts and disclosures in the financial statements. Our procedures included confirmation of securities owned as of December 31, 2018, by correspondence with the custodian and brokers. Our audits also included evaluating the accounting principles used and significant estimates made by management, as well as evaluating the overall presentation of the financial statements. We believe that our audits provide a reasonable basis for our opinion.

We have served as the auditor of one or more investment companies in the DWS family of funds since at least 1979, but we are unable to determine the specific year.
Boston, Massachusetts
February 14, 2019
| | | | | | |
| | 18 | | | | | | Deutsche DWS Variable Series II — DWS International Growth VIP |
| | |
| Information About Your Fund’s Expenses | | (Unaudited) |
As an investor of the Fund, you incur two types of costs: ongoing expenses and transaction costs. Ongoing expenses include management fees, distribution and service(12b-1) fees and other Fund expenses. Examples of transaction costs include contract charges, which are not shown in this section. The following tables are intended to help you understand your ongoing expenses (in dollars) of investing in the Fund and to help you compare these expenses with the ongoing expenses of investing in other mutual funds. In the most recentsix-month period, the Fund limited these expenses; had it not done so, expenses would have been higher. The example in the table is based on an investment of $1,000 invested at the beginning of thesix-month period and held for the entire period (July 1, 2018 to December 31, 2018).
The tables illustrate your Fund’s expenses in two ways:
| – | | Actual Fund Return. This helps you estimate the actual dollar amount of ongoing expenses (but not transaction costs) paid on a $1,000 investment in the Fund using the Fund’s actual return during the period. To estimate the expenses you paid over the period, simply divide your account value by $1,000 (for example, an $8,600 account value divided by $1,000 = 8.6), then multiply the result by the number in the “Expenses Paid per $1,000” line under the share class you hold. |
| – | | Hypothetical 5% Fund Return. This helps you to compare your Fund’s ongoing expenses (but not transaction costs) with those of other mutual funds using the Fund’s actual expense ratio and a hypothetical rate of return of 5% per year before expenses. Examples using a 5% hypothetical Fund return may be found in the shareholder reports of other mutual funds. The hypothetical account values and expenses may not be used to estimate the actual ending account balance or expenses you paid for the period. |
Please note that the expenses shown in these tables are meant to highlight your ongoing expenses only and do not reflect any transaction costs. The “Expenses Paid per $1,000” line of the tables is useful in comparing ongoing expenses only and will not help you determine the relative total expense of owning different funds. If these transaction costs had been included, your costs would have been higher.
| | | | | | | | |
| Expenses and Value of a $1,000 Investment for the six months ended December 31, 2018 | | | | |
| | |
| Actual Fund Return | | | Class A | | | | Class B | |
| Beginning Account Value 7/1/18 | | $ | 1,000.00 | | | $ | 1,000.00 | |
| Ending Account Value 12/31/18 | | $ | 854.70 | | | $ | 853.00 | |
| Expenses Paid per $1,000* | | $ | 3.79 | | | $ | 4.95 | |
| | |
| Hypothetical 5% Fund Return | | | | | | | | |
| Beginning Account Value 7/1/18 | | $ | 1,000.00 | | | $ | 1,000.00 | |
| Ending Account Value 12/31/18 | | $ | 1,021.12 | | | $ | 1,019.86 | |
| Expenses Paid per $1,000* | | $ | 4.13 | | | $ | 5.40 | |
| * | Expenses are equal to the Fund’s annualized expense ratio for each share class, multiplied by the average account value over the period, multiplied by 184 (the number of days in the most recentsix-month period), then divided by 365. |
| | | | | | | | |
| Annualized Expense Ratios | | Class A | | | Class B | |
| Deutsche DWS Variable Series II — DWS International Growth VIP | | | .81 | % | | | 1.06 | % |
For more information, please refer to the Fund’s prospectus.
These tables do not reflect charges and fees (“contract charges”) associated with the separate account that invests in the Fund or any variable life insurance policy or variable annuity contract for which the Fund is an investment option.
For an analysis of the fees associated with an investment in the Fund or similar funds, please refer to the current and hypothetical expense calculators for Variable Insurance Products which can be found at dws.com/calculators.
| | | | |
Deutsche DWS Variable Series II — DWS International Growth VIP | | | | | 19 |
| | |
| Tax Information | | (Unaudited) |
For corporate shareholders, 84% of the ordinary dividends (i.e., income dividends plus short-term capital gains) paid during the Fund’s fiscal year ended December 31, 2018, qualified for the dividends received deduction.
The Fund paid foreign taxes of $31,116 and earned $200,097 of foreign source income during the year ended December 31, 2018. Pursuant to Section 853 of the Internal Revenue Code, the Fund designates $0.02 per share as foreign taxes paid and $0.16 per share as income earned from foreign sources for the year ended December 31, 2018.
Pursuant to Section 852 of the Internal Revenue Code, the Fund designates $258,000 as capital gain dividends for its year ended December 31, 2018.
Please consult a tax advisor if you have questions about federal or state income tax laws, or on how to prepare your tax returns. If you have specific questions about your account, please contact your insurance provider.
Proxy Voting
The Trust’s policies and procedures for voting proxies for portfolio securities and information about how the Trust voted proxies related to its portfolio securities during the most recent12-month period ended June 30 are available on our Web site — dws.com/en-us/resources/proxy-voting — or on the SEC’s Web site — sec.gov. To obtain a written copy of the Trust’s policies and procedures without charge, upon request, call us toll free at (800)728-3337.
| | | | | | |
| | 20 | | | | | | Deutsche DWS Variable Series II — DWS International Growth VIP |
Advisory Agreement Board Considerations and Fee Evaluation
The Board of Trustees (hereinafter referred to as the “Board” or “Trustees”) approved the renewal of DWS International Growth VIP’s (the “Fund”) investment management agreement (the “Agreement”) with DWS Investment Management Americas, Inc. (“DIMA”) in September 2018.
In terms of the process that the Board followed prior to approving the Agreement, shareholders should know that:
| – | | During the entire process, all of the Fund’s Trustees were independent of DIMA and its affiliates (the “Independent Trustees”). |
| – | | The Board met frequently during the past year to discuss fund matters and dedicated a substantial amount of time to contract review matters. Over the course of several months, the Board’s Contract Committee reviewed extensive materials received from DIMA, independent third parties and independent counsel. These materials included an analysis of the Fund’s performance, fees and expenses, and profitability from a fee consultant retained by the Fund’s Independent Trustees (the “Fee Consultant”). Based on its evaluation of the information provided, the Contract Committee presented its findings and recommendations to the Board. The Board then reviewed the Contract Committee’s findings and recommendations. |
| – | | The Board also received extensive information throughout the year regarding performance of the Fund. |
| – | | The Independent Trustees regularly met privately with counsel to discuss contract review and other matters. In addition, the Independent Trustees were advised by the Fee Consultant in the course of their review of the Fund’s contractual arrangements and considered a comprehensive report prepared by the Fee Consultant in connection with their deliberations. |
| – | | In connection with reviewing the Agreement, the Board also reviewed the terms of the Fund’s Rule12b-1 plan, distribution agreement, administrative services agreement, transfer agency agreement and other material service agreements. |
In connection with the contract review process, the Contract Committee and the Board considered the factors discussed below, among others. The Board also considered that DIMA and its predecessors have managed the Fund since its inception, and the Board believes that a long-term relationship with a capable, conscientious advisor is in the best interests of the Fund. The Board considered, generally, that shareholders chose to invest or remain invested in the Fund knowing that DIMA managed the Fund. DIMA is part of DWS Group GmbH & Co. KGaA (“DWS Group”). DWS Group is a global asset management business that offers a wide range of investing expertise and resources, including research capabilities in many countries throughout the world. In 2018, approximately 20% of DWS Group’s shares were sold in an initial public offering, with Deutsche Bank AG owning the remaining shares.
As part of the contract review process, the Board carefully considered the fees and expenses of each DWS fund overseen by the Board in light of the fund’s performance. In many cases, this led to the negotiation and implementation of expense caps. As part of these negotiations, the Board indicated that it would consider relaxing these caps in future years following sustained improvements in performance, among other considerations.
While shareholders may focus primarily on fund performance and fees, the Fund’s Board considers these and many other factors, including the quality and integrity of DIMA’s personnel and administrative support services provided by DIMA, such as back-office operations, fund valuations, and compliance policies and procedures.
Nature, Quality and Extent of Services.The Board considered the terms of the Agreement, including the scope of advisory services provided under the Agreement. The Board noted that, under the Agreement, DIMA provides portfolio management services to the Fund and that, pursuant to a separate administrative services agreement, DIMA provides administrative services to the Fund. The Board considered the experience and skills of senior management and investment personnel and the resources made available to such personnel. The Board reviewed the Fund’s performance over short-term and long-term periods and compared those returns to various agreed-upon performance measures, including market index(es) and a peer universe compiled using information supplied by Morningstar Direct (“Morningstar”), an independent fund data service. The Board also noted that it has put into place a process of identifying “Funds in Review” (e.g., funds performing poorly relative to a peer universe), and receives additional reporting from DIMA regarding such funds and, where appropriate, DIMA’s plans to address underperformance. The Board
| | | | |
Deutsche DWS Variable Series II — DWS International Growth VIP | | | | | 21 |
believes this process is an effective manner of identifying and addressing underperforming funds. Based on the information provided, the Board noted that, for theone-, three- and five-year periods ended December 31, 2017, the Fund’s performance (Class A shares) was in the 2nd quartile, 3rd quartile and 3rd quartile, respectively, of the applicable Morningstar universe (the 1st quartile being the best performers and the 4th quartile being the worst performers). The Board also observed that the Fund has outperformed its benchmark in the three- and five-year periods and has underperformed its benchmark in theone-year period ended December 31, 2017. The Board considered that, effective October 3, 2016, the Fund’s investment strategy and certain members of the portfolio management team were changed, and that, effective October 1, 2017, the Fund further changed its investment strategy.
Fees and Expenses. The Board considered the Fund’s investment management fee schedule, operating expenses and total expense ratios, and comparative information provided by Broadridge Financial Solutions, Inc. (“Broadridge”) and the Fee Consultant regarding investment management fee rates paid to other investment advisors by similar funds (1st quartile being the most favorable and 4th quartile being the least favorable). With respect to management fees paid to other investment advisors by similar funds, the Board noted that the contractual fee rates paid by the Fund, which include a 0.10% fee paid to DIMA under the Fund’s administrative services agreement, were lower than the median (1st quartile) of the applicable Broadridge peer group (based on Broadridge data provided as of December 31, 2017). The Board noted that, effective October 1, 2017, DIMA agreed to reduce the Fund’s contractual management fee rate to an annual rate of 0.62% in connection with changes to the Fund’s investment strategy. The Board noted that the Fund’s Class A shares total (net) operating expenses were expected to be higher than the median (3rd quartile) of the applicable Broadridge expense universe (based on Broadridge data provided as of December 31, 2017, and analyzing Broadridge expense universe Class A (net) expenses less any applicable12b-1 fees) (“Broadridge Universe Expenses”). The Board also reviewed data comparing each share class’s total (net) operating expenses to the applicable Broadridge Universe Expenses. The Board noted that the expense limitations agreed to by DIMA were expected to help the Fund’s total (net) operating expenses remain competitive. The Board considered the Fund’s management fee rate as compared to fees charged by DIMA to a comparable DWS U.S. registered fund (“DWS Funds”) and considered differences between the Fund and the comparable DWS Fund. The information requested by the Board as part of its review of fees and expenses also included information about institutional accounts (including anysub-advised funds and accounts) and funds offered primarily to European investors (“DWS Europe Funds”) managed by DWS Group. The Board noted that DIMA indicated that DWS Group does not manage any institutional accounts or DWS Europe Funds comparable to the Fund.
On the basis of the information provided, the Board concluded that management fees were reasonable and appropriate in light of the nature, quality and extent of services provided by DIMA.
Profitability. The Board reviewed detailed information regarding revenues received by DIMA under the Agreement. The Board considered the estimated costs to DIMA, andpre-tax profits realized by DIMA, from advising the DWS Funds, as well as estimates of thepre-tax profits attributable to managing the Fund in particular. The Board also received information regarding the estimated enterprise-wide profitability of DIMA and its affiliates with respect to all fund services in totality and by fund. The Board and the Fee Consultant reviewed DIMA’s methodology in allocating its costs to the management of the Fund. Based on the information provided, the Board concluded that thepre-tax profits realized by DIMA in connection with the management of the Fund were not unreasonable. The Board also reviewed certain publicly available information regarding the profitability of certain similar investment management firms. The Board noted that, while information regarding the profitability of such firms is limited (and in some cases is not necessarily prepared on a comparable basis), DIMA and its affiliates’ overall profitability with respect to the DWS Funds (after taking into account distribution and other services provided to the funds by DIMA and its affiliates) was lower than the overall profitability levels of most comparable firms for which such data was available.
Economies of Scale. The Board considered whether there are economies of scale with respect to the management of the Fund and whether the Fund benefits from any economies of scale. In this regard, the Board observed that while the Fund’s current investment management fee schedule does not include breakpoints, the Fund’s fee schedule represents an appropriate sharing between the Fund and DIMA of such economies of scale as may exist in the management of the Fund at current asset levels.
Other Benefits to DIMA and Its Affiliates. The Board also considered the character and amount of other incidental or“fall-out” benefits received by DIMA and its affiliates, including any fees received by DIMA for administrative services provided to the Fund, any fees received by an affiliate of DIMA for transfer agency services provided to the Fund and any fees received by an affiliate of DIMA for distribution services. The
| | | | | | |
| | 22 | | | | | | Deutsche DWS Variable Series II — DWS International Growth VIP |
Board also considered benefits to DIMA related to brokerage and soft-dollar allocations, including allocating brokerage to pay for research generated by parties other than the executing broker dealers, which pertain primarily to funds investing in equity securities. In addition, the Board considered the incidental public relations benefits to DIMA related to DWS Funds advertising and cross-selling opportunities among DIMA products and services. The Board considered these benefits in reaching its conclusion that the Fund’s management fees were reasonable.
Compliance. The Board considered the significant attention and resources dedicated by DIMA to its compliance processes in recent years. The Board noted in particular (i) the experience, seniority and time commitment of the individuals serving as DIMA’s and the Fund’s chief compliance officers and (ii) the substantial commitment of resources by DIMA and its affiliates to compliance matters, including the retention of compliance personnel.
Based on all of the information considered and the conclusions reached, the Board unanimously determined that the continuation of the Agreement is in the best interests of the Fund. In making this determination, the Board did not give particular weight to any single factor identified above. The Board considered these factors over the course of numerous meetings, certain of which were in executive session with only the Independent Trustees and counsel present. It is possible that individual Independent Trustees may have weighed these factors differently in reaching their individual decisions to approve the continuation of the Agreement.
| | | | |
Deutsche DWS Variable Series II — DWS International Growth VIP | | | | | 23 |
Board Members and Officers
The following table presents certain information regarding the Board Members and Officers of the Fund. Each Board Member’s year of birth is set forth in parentheses after his or her name. Unless otherwise noted, (i) each Board Member has engaged in the principal occupation(s) noted in the table for at least the most recent five years, although not necessarily in the same capacity; and (ii) the address of each Independent Board Member is c/o Keith R. Fox, DWS Funds Board Chair, c/o Thomas R. Hiller, Ropes & Gray LLP, Prudential Tower, 800 Boylston Street, Boston, MA02199-3600. Except as otherwise noted below, the term of office for each Board Member is until the election and qualification of a successor, or until such Board Member sooner dies, resigns, is removed or as otherwise provided in the governing documents of the Fund. Because the Fund does not hold an annual meeting of shareholders, each Board Member will hold office for an indeterminate period. The Board Members may also serve in similar capacities with other funds in the fund complex.
| | | | | | | | |
| Independent Board Members | | | | | | |
Name, Year of Birth,
Position with the Fund and
Length of Time Served1 | | Business Experience and Directorships During the Past Five Years | | Number of
Funds in
DWS Fund
Complex
Overseen | | | Other
Directorships
Held by Board
Member
|
Keith R. Fox, CFA (1954) Chairperson since 2017, and Board Member since 1996 | | Managing General Partner, Exeter Capital Partners (a series of private investment funds) (since 1986). Directorships: Progressive International Corporation (kitchen goods importer and distributor); The Kennel Shop (retailer); former Chairman, National Association of Small Business Investment Companies; former Directorships: BoxTop Media Inc. (advertising); Sun Capital Advisers Trust (mutual funds) (2011–2012) | | | 82 | | | — |
John W. Ballantine (1946) Board Member since 1999 | | Retired; formerly, Executive Vice President and Chief Risk Management Officer, First Chicago NBD Corporation/The First National Bank of Chicago (1996–1998); Executive Vice President and Head of International Banking (1995–1996); former Directorships: Director and former Chairman of the Board, Healthways, Inc.2 (population well-being and wellness services) (2003–2014); Stockwell Capital Investments PLC (private equity); Enron Corporation; FNB Corporation; Tokheim Corporation; First Oak Brook Bancshares, Inc. and Oak Brook Bank; Prisma Energy International; Public Radio International. Not-for-Profit Director, Trustee: Palm Beach Civic Association; Window to the World Communications (public media); Harris Theater for Music and Dance (Chicago); Life Director of Hubbard Street Dance Chicago | | | 82 | | | Portland
General
Electric2
(utility
company)
(2003–
present) |
Henry P. Becton, Jr. (1943) Board Member since 1990 | | Vice Chair and former President, WGBH Educational Foundation. Directorships: Public Radio International; Public Radio Exchange (PRX); The Pew Charitable Trusts (charitable organization); Massachusetts Humane Society; Overseer of the New England Conservatory; former Directorships: Becton Dickinson and Company2 (medical technology company); Belo Corporation2 (media company); The PBS Foundation; Association of Public Television Stations; Boston Museum of Science; American Public Television; Concord Academy; New England Aquarium; Mass. Corporation for Educational Telecommunications; Committee for Economic Development; Public Broadcasting Service; Connecticut College; North Bennett Street School (Boston); American Documentary, Inc. (public media) | | | 82 | | | — |
Dawn-Marie Driscoll (1946) Board Member since 1987 | | Emeritus Executive Fellow, Center for Business Ethics, Bentley University; formerly: President, Driscoll Associates (consulting firm); Partner, Palmer & Dodge (law firm) (1988–1990); Vice President of Corporate Affairs and General Counsel, Filene’s (retail) (1978–1988). Directorships: Advisory Board, Center for Business Ethics, Bentley University; Trustee and former Chairman of the Board, Southwest Florida Community Foundation (charitable organization); former Directorships: ICI Mutual Insurance Company (2007–2015); Sun Capital Advisers Trust (mutual funds) (2007–2012), Investment Company Institute (audit, executive, nominating committees) and Independent Directors Council (governance, executive committees) | | | 82 | | | — |
Paul K. Freeman* (1950) Board Member since 1993 | | Consultant, WorldBank/Inter-American Development Bank; Independent Directors Council (former chair); Investment Company Institute (executive committee); Adjunct Professor, University of Denver Law School (2017–present); formerly: Chairman of Education Committee of Independent Directors Council; Project Leader, International Institute for Applied Systems Analysis (1998–2001); Chief Executive Officer, The Eric Group, Inc. (environmental insurance) (1986–1998); Directorships: Knoebel Institute for Healthy Aging, University of Denver (2017–present); former Directorships: Prisma Energy International; Denver Zoo Foundation (2012–2018) | | | 82 | | | — |
| | | | | | |
| | 24 | | | | | | Deutsche DWS Variable Series II — DWS International Growth VIP |
| | | | | | | | |
Name, Year of Birth,
Position with the Fund and
Length of Time Served1 | | Business Experience and Directorships During the Past Five Years | | Number of
Funds in
DWS Fund
Complex
Overseen | | | Other
Directorships
Held by Board
Member
|
Richard J. Herring (1946) Board Member since 1990 | | Jacob Safra Professor of International Banking and Professor of Finance, The Wharton School, University of Pennsylvania (since July 1972); Director, The Wharton Financial Institutions Center (since 1994); formerly: Vice Dean and Director, Wharton Undergraduate Division (1995–2000) and Director, The Lauder Institute of International Management Studies (2000–2006); Member FDIC Systemic Risk Advisory Committee since 2011, member Systemic Risk Council since 2012 and member of the Advisory Board at the Yale Program on Financial Stability since 2013; Formerly Co-Chair of the Shadow Financial Regulatory Committee (2003–2015), Executive Director of The Financial Economists Roundtable (2008–2015), Director of The Thai Capital Fund (2007–2013), Director of The Aberdeen Singapore Fund (2007–2018), and Nonexecutive Director of Barclays Bank DE (2010–2018) | | | 82 | | | Director,
Aberdeen
Japan Fund
(since 2007) |
William McClayton (1944) Board Member since 2004 | | Private equity investor (since October 2009); previously, Managing Director, Diamond Management & Technology Consultants, Inc. (global consulting firm) (2001–2009); Directorship: Board of Managers, YMCA of Metropolitan Chicago; formerly: Senior Partner, Arthur Andersen LLP (accounting) (1966–2001); Trustee, Ravinia Festival | | | 82 | | | — |
Rebecca W. Rimel (1951) Board Member since 1995 | | President, Chief Executive Officer and Director, The Pew Charitable Trusts (charitable organization) (1994–present); formerly: Executive Vice President, The Glenmede Trust Company (investment trust and wealth management) (1983–2004); Board Member, Investor Education (charitable organization) (2004–2005); Trustee, Executive Committee, Philadelphia Chamber of Commerce (2001–2007); Director, Viasys Health Care2 (January 2007–June 2007); Trustee, Thomas Jefferson Foundation (charitable organization) (1994–2012) | | | 82 | | | Director,
Becton
Dickinson
and
Company2
(medical
technology
company)
(2012–
present);
Director,
BioTelemetry
Inc.2(health
care) (2009–
present) |
William N. Searcy, Jr. (1946) Board Member since 1993 | | Private investor since October 2003; formerly: Pension & Savings Trust Officer, Sprint Corporation2(telecommunications) (November 1989–September 2003); Trustee, Sun Capital Advisers Trust (mutual funds) (1998–2012) | | | 82 | | | — |
Jean Gleason Stromberg (1943) Board Member since 1997 | | Retired. Formerly, Consultant (1997–2001); Director, Financial Markets U.S. Government Accountability Office (1996–1997); Partner, Norton Rose Fulbright, L.L.P. (law firm) (1978–1996); former Directorships: The William and Flora Hewlett Foundation (charitable organization) (2000–2015); Service Source, Inc. (nonprofit), Mutual Fund Directors Forum (2002–2004), American Bar Retirement Association (funding vehicle for retirement plans) (1987–1990 and 1994–1996) | | | 82 | | | — |
| | |
| Officers4 | | |
Name, Year of Birth, Position with the Fund and Length of Time Served5 | | Business Experience and Directorships During the Past Five Years |
Hepsen Uzcan6 (1974) President and Chief Executive Officer, 2017–present Assistant Secretary, 2013–present | | Managing Director,3 DWS; Secretary, DWS USA Corporation (since March 2018); Assistant Secretary, DWS Distributors, Inc. (since June 25, 2018); Director and Vice President, DWS Service Company (since June 25, 2018); Assistant Secretary, DWS Investment Management Americas, Inc. (since June 25, 2018); and Director and President, DB Investment Managers, Inc. (since June 25, 2018); formerly: Vice President for the Deutsche funds (2016–2017) |
John Millette8(1962) Vice President and Secretary, 1999–present | | Director,3DWS; Chief Legal Officer, DWS Investment Management Americas, Inc. (2015–present); and Director and Vice President, DWS Trust Company (2016–present); formerly: Secretary, Deutsche Investment Management Americas Inc. (2015–2017) |
Diane Kenneally8,9 (1966) Treasurer and Chief Financial Officer since 2018 | | Director,3 DWS; formerly: Assistant Treasurer for the DWS funds (2007–2018) |
Caroline Pearson8(1962) Chief Legal Officer, 2010–present | | Managing Director,3DWS; formerly: Secretary, Deutsche AM Distributors, Inc. (2002–2017); and Secretary, Deutsche AM Service Company (2010–2017) |
| | | | |
Deutsche DWS Variable Series II — DWS International Growth VIP | | | | | 25
|
| | |
Name, Year of Birth, Position with the Fund and Length of Time Served5 | | Business Experience and Directorships During the Past Five Years |
Scott D. Hogan8(1970) Chief Compliance Officer, 2016–present | | Director,3DWS |
Wayne Salit7(1967) Anti-Money Laundering Compliance Officer, 2014–present | | Director,3 Deutsche Bank; and AML Officer, DWS Trust Company; formerly: Managing Director, AML Compliance Officer at BNY Mellon (2011–2014); and Director, AML Compliance Officer at Deutsche Bank (2004–2011) |
Sheila Cadogan8(1966) Assistant Treasurer, 2017–present | | Director,3DWS; Director and Vice President, DWS Trust Company (since 2018) |
Paul Antosca8(1957) Assistant Treasurer, 2007–present | | Director,3DWS |
| 1 | The length of time served represents the year in which the Board Member joined the board of one or more DWS funds currently overseen by the Board. |
| 2 | A publicly held company with securities registered pursuant to Section 12 of the Securities Exchange Act of 1934. |
| 3 | Executive title, not a board directorship. |
| 4 | As a result of their respective positions held with the Advisor or its affiliates, these individuals are considered “interested persons” of the Advisor within the meaning of the 1940 Act. Interested persons receive no compensation from the Fund. |
| 5 | The length of time served represents the year in which the officer was first elected in such capacity for one or more DWS funds. |
| 6 | Address: 345 Park Avenue, New York, NY 10154. |
| 7 | Address: 60 Wall Street, New York, NY 10005. |
| 8 | Address: One International Place, Boston, MA 02110. |
| 9 | Appointed Treasurer and Chief Financial Officer effective July 2, 2018. |
| * | Paul K. Freeman retired from the Board effective December 31, 2018. |
The Fund’s Statement of Additional Information (“SAI”) includes additional information about the Board Members. The SAI is available, without charge, upon request. If you would like to request a copy of the SAI, you may do so by calling the followingtoll-free number:(800) 728-3337.
| | | | | | |
| | 26 | | | | | | Deutsche DWS Variable Series II — DWS International Growth VIP |
Notes
| | |
| | |
VS2IG-2 (R-025830-9 2/19) | | |
December 31, 2018
Annual Report
Deutsche DWS Variable Series II
(formerly Deutsche Variable Series II)
DWS Multisector Income VIP
(formerly Deutsche Multisector Income VIP)
Beginning on January 1, 2021, as permitted by regulations adopted by the Securities and Exchange Commission, you may not be receiving paper copies of the Fund’s shareholder reports from the insurance company that offers your contract unless you specifically request paper copies from your insurance company or from your financial intermediary. Instead, the shareholder reports will be made available on a Web site, and your insurance company will notify you by mail each time a report is posted and provide you with a Web site link to access the report. Instructions for requesting paper copies will be provided by your insurance company.
If you already elected to receive shareholder reports electronically, you will not be affected by this change and you need not take any action. You may elect to receive shareholder reports and other communications from your insurance company electronically by following the instructions provided by your insurance company.
You may elect to receive all future reports in paper free of charge from your insurance company. If your insurance company informs you that future reports will be delivered via Web access, you can inform your insurance company that you wish to continue receiving paper copies of your shareholder reports by following the instructions provided by your insurance company.

Contents
This report must be preceded or accompanied by a prospectus. To obtain an additional prospectus or summary prospectus, if available, call (800)728-3337 or your financial representative. We advise you to consider the Fund’s objectives, risks, charges and expenses carefully before investing. The summary prospectus and prospectus contain this and other important information about the Fund. Please read the prospectus carefully before you invest.
Bond investments are subject tointerest-rate, credit, liquidity and market risks to varying degrees. When interest rates rise, bond prices generally fall. Credit risk refers to the ability of an issuer to make timely payments of principal and interest. Investments inlower-quality (“junk bonds”) andnon-rated securities present greater risk of loss than investments inhigher-quality securities. Investing in foreign securities, particularly those of emerging markets, presents certain risks, such as currency fluctuations, political and economic changes, and market risks. Emerging markets tend to be more volatile and less liquid than the markets of more mature economies, and generally have less diverse and less mature economic structures and less stable political systems than those of developed countries. Investing in derivatives entails special risks relating to liquidity, leverage and credit that may reduce returns and/or increase volatility. The Fund may lend securities to approved institutions. See the prospectus for details.
The brand DWS represents DWS Group GmbH & Co. KGaA and any of its subsidiaries such as DWS Distributors, Inc. which offers investment products or DWS Investment Management Americas, Inc. and RREEF America L.L.C. which offer advisory services.
DWS Distributors, Inc., 222 South Riverside Plaza, Chicago, IL 60606, (800)621-1148
NOT FDIC/NCUA INSURED NO BANK GUARANTEE MAY LOSE VALUE NOT A DEPOSIT NOT INSURED BY ANY FEDERAL GOVERNMENT AGENCY
| | | | | | |
| | 2 | | | | | | Deutsche DWS Variable Series II — DWS Multisector Income VIP |
| | |
| Performance Summary | | December 31, 2018 (Unaudited) |
Fund performance shown is historical, assumes reinvestment of all dividend and capital gain distributions and does not guarantee future results. Investment return and principal value fluctuate with changing market conditions so that, when redeemed, shares may be worth more or less than their original cost. Current performance may be lower or higher than the performance data quoted. Please contact your participating insurance company for the Fund’s most recentmonth-end performance. Performance does not reflect charges and fees (“contract charges”) associated with the separate account that invests in the Fund or any variable life insurance policy or variable annuity contract for which the Fund is an investment option. These charges and fees will reduce returns.
The gross expense ratio of the Fund, as stated in the fee table of the prospectus dated May 1, 2018 is 1.41% for Class A shares and may differ from the expense ratio disclosed in the Financial Highlights table in this report.
Generally accepted accounting principles require adjustments to be made to the net assets of the Fund at period end for financial reporting purposes only, and as such, the total return based on the unadjusted net asset value per share may differ from the total return reported in the financial highlights.
Growth of an Assumed $10,000 Investment in DWS Multisector Income VIP
| | |
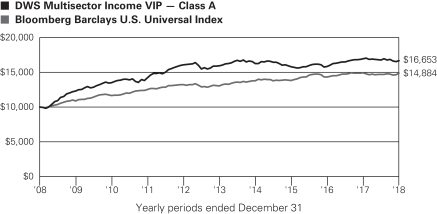
| | The unmanaged Bloomberg Barclays U.S. Universal Index represents the union of the U.S. Aggregate Index, the U.S.High-Yield Corporate Index, the 144A Index, the Eurodollar Index, the Emerging Markets Index and thenon-ERISA portion of the CMBS Index. Index returns do not reflect any fees or expenses and it is not possible to invest directly into an index. |
| | | | | | | | | | |
| Comparative Results | | | | | | | | | | |
| | | | | |
| DWS Multisector Income VIP | | | | 1-Year | | 3-Year | | 5-Year | | 10-Year |
| Class A | | Growth of $10,000 | | $9,835 | | $10,554 | | $10,464 | | $16,653 |
| | | Average annual total return | | –1.65% | | 1.81% | | 0.91% | | 5.23% |
| Bloomberg Barclays U.S. Universal Index | | Growth of $10,000 | | $9,975 | | $10,789 | | $11,437 | | $14,884 |
| | Average annual total return | | –0.25% | | 2.56% | | 2.72% | | 4.06% |
The growth of $10,000 is cumulative.
| | | | |
Deutsche DWS Variable Series II — DWS Multisector Income VIP | | | | | 3 |
| | |
| Management Summary | | December 31, 2018 (Unaudited) |
The Class A shares of the Fund returned –1.65% (unadjusted for contract charges) in 2018, underperforming the –0.25% return of the Bloomberg Barclays U.S. Universal Index.
The major segments of the global fixed-income markets experienced a wide range of returns in the past 12 months. While U.S. Treasuries outpaced the index due to their strong fourth quarter rally, categories with a higher degree of credit risk were hurt by the prospect of slower growth. As a result, investment-grade corporate, high yield, and emerging-markets bonds all finished in the red.
Several factors played a role in the Fund’s underperformance, but the overarching theme was our continued emphasis on the credit sectors. We believed these segments offered an attractive opportunity due to their higher absolute yields and ability to benefit from the ongoing economic expansion. While we saw the risk of a recession in 2020, we expected that the markets would not start factoring this into prices until later in 2019. Instead, a series of weak economic data from around the globe prompted investors to recalibrate their expectations in favor of much slower growth in the year ahead. Our overweight position in the credit-sensitive areas of the market was therefore the largest detractor in 2018.
The Fund’s large allocation to high-yield bonds played a key role in its shortfall by providing exposure to one of the weakest areas of the market. An overweight in the emerging markets was also an important factor in the Fund’s underperformance. Holdings in local-currency issues had an adverse impact on results, as did a position in Argentina. While we pared back risk inmid-2018, we continue to have a positive long-term view on the asset class in general, and the Africa/Middle East region in particular.
We kept the Fund’s duration (interest-rate sensitivity) below the index, as we saw little benefit from having a longer duration at a time in which the U.S. Federal Reserve was raising interest rates. This strategy contributed positively given that yields increased modestly. We reduced the extent of the underweight in the second half of the year on the belief that the majority of the upward move in yields had already occurred.
The Fund used derivatives in order to facilitate exposure to thehigh-yield market, adjust foreign-currency exposure, manage duration, and adjust portfolio positioning in domestic commercial mortgage-backed securities and the European market. In the aggregate, our use of derivatives was a small net detractor. Derivatives are used to achieve the Fund’s risk and return objectives and should therefore be evaluated within the context of the entire portfolio rather than as a standalone strategy.
The Fund maintained an underweight allocation to investment-grade bonds. We held an underweight in corporate issues due to their low yield spreads versus Treasuries. Instead, we focused on securitized assets to capture their attractive yields in relation to their underlying credit quality. The Fund’s investment-grade allocation had a neutral impact on results, but we continue to view it as an important source of portfolio diversification.
We believe an emphasis on the credit sectors remains appropriate even after the fourth-quartersell-off in the financial markets. We see the elevated volatility as largely the result of investors’ overreaction to adverse headlines rather than a sign of a broader, systemic problem. In our view, the continued strength of the U.S. economy and positive growth in the world as a whole can provide a firm foundation for risk assets once news flow calms and investors return their focus to fundamentals.
John D. Ryan, Managing Director
Kevin Bliss, Director
Portfolio Managers
The views expressed reflect those of the portfolio management team only through the end of the period of the report as stated on the cover. The management team’s views are subject to change at any time based on market and other conditions and should not be construed as a recommendation. Past performance is no guarantee of future results. Current and future portfolio holdings are subject to risk.
| | | | | | |
| | 4 | | | | | | Deutsche DWS Variable Series II — DWS Multisector Income VIP |
Terms to Know
TheBarclays U.S. Universal Index represents the union of the U.S. Aggregate Index, the U.S. High-Yield Corporate Index, the 144A Index, the Eurodollar Index, the Emerging Markets Index and thenon-ERISA portion of the CMBS Index. Index returns do not reflect fees or expenses and it is not possible to invest directly in an index.
Overweight means the Fund holds a higher weighting in a given sector or security than the benchmark.Underweightmeans the Fund holds a lower weighting.
Contribution anddetraction incorporate both a stock’s total return and its weighting in the index.
Duration, which is expressed in years, measures the sensitivity of the price of a bond or bond fund to a change in interest rates.
Yield spread refers to differences between yields on differing debt instruments, calculated by deducting the yield of one instrument from another. The higher the yield spread, the greater the difference between the yields offered by each instrument.
Derivativesare contracts whose values can be based on a variety of instruments, including indices, currencies or securities. They can be utilized for a variety of reasons, including for hedging purposes, for risk management, fornon-hedging purposes to seek to enhance potential gains, or as a substitute for direct investment in a particular asset class or to keep cash on hand to meet shareholder redemptions. Investing in derivatives entails special risks relating to liquidity, leverage and credit that may reduce returns and/or increase volatility.
| | | | |
Deutsche DWS Variable Series II — DWS Multisector Income VIP | | | | | 5 |
| | | | |
| Portfolio Summary | | (Unaudited) | | |
| | | | | | | | |
| Asset Allocation (As a % of Investment Portfolio excluding Securities Lending Collateral) | | 12/31/18 | | | 12/31/17 | |
Government & Agency Obligations | | | 44% | | | | 29% | |
Collateralized Mortgage Obligations | | | 17% | | | | 13% | |
Corporate Bonds | | | 11% | | | | 24% | |
Mortgage-Backed Securities Pass-Throughs | | | 6% | | | | — | |
Loan Participations and Assignments | | | 5% | | | | 7% | |
Cash Equivalent | | | 5% | | | | 6% | |
Commercial Mortgage-Backed Securities | | | 5% | | | | 5% | |
Short-Term U.S. Treasury Obligations | | | 3% | | | | 12% | |
Asset-Backed | | | 2% | | | | 2% | |
Convertible Bond | | | 2% | | | | 2% | |
Common Stocks | | | 0% | | | | 0% | |
| Warrants | | | 0% | | | | 0% | |
| | | | 100% | | | | 100% | |
| | |
| Quality (Excludes Cash Equivalents and Securities Lending Collateral) | | 12/31/18 | | | 12/31/17 | |
| AAA | | | 38% | | | | 25% | |
| AA | | | 0% | | | | 1% | |
| A | | | 8% | | | | 8% | |
| BBB | | | 12% | | | | 24% | |
| BB | | | 22% | | | | 23% | |
| B | | | 11% | | | | 9% | |
| CCC or Below | | | 2% | | | | 3% | |
| Non Rated | | | 7% | | | | 7% | |
| | | | 100% | | | | 100% | |
| | |
| Interest Rate Sensitivity | | 12/31/18 | | | 12/31/17 | |
| Effective Maturity | | | 4.8 years | | | | 5.4 years | |
| Effective Duration | | | 3.6 years | | | | 3.6 years | |
The quality ratings represent the higher of Moody’s Investors Service, Inc. (“Moody’s”), Fitch Ratings, Inc. (“Fitch”) or Standard & Poor’s Corporation (“S&P”) credit ratings. The ratings of Moody’s, Fitch and S&P represent their opinions as to the quality of the securities they rate. Credit quality measures a bond issuer’s ability to repay interest and principal in a timely manner. Ratings are relative and subjective and are not absolute standards of quality. Credit quality does not remove market risk and is subject to change.
Effective maturity is the weighted average of the maturity date of bonds held by the Fund taking into consideration any available maturity shortening features.
Effective duration is an approximate measure of the Fund’s sensitivity to interest rate changes taking into consideration any maturity shortening features.
Portfolio holdings and characteristics are subject to change.
For more complete details about the Fund’s investment portfolio, see page 7.
Following the Fund’s fiscal first and thirdquarter-end, a complete portfolio holdings listing is filed with the SEC on FormN-Q or Form N-PORT (available for filings after March 31, 2019). The Fund’s Form N-Q or Form N-PORT will be available on the SEC’s Web site at sec.gov. The Fund’s portfolio holdings are also posted on dws.com from time to time. Please see the Fund’s current prospectus for more information.
| | | | | | |
| | 6 | | | | | | Deutsche DWS Variable Series II — DWS Multisector Income VIP |
| | |
| Investment Portfolio | | as of December 31, 2018 |
| | | | | | | | |
| | | Principal
Amount ($)(a) | | | Value ($) | |
| Corporate Bonds 10.9% | |
| Communication Services 0.6% | |
Expedia Group, Inc., 3.8%, 2/15/2028 | | | 55,000 | | | | 49,876 | |
|
| Consumer Discretionary 0.7% | |
American Axle & Manufacturing, Inc., 6.25%, 4/1/2025 (b) | | | 60,000 | | | | 54,600 | |
|
| Energy 4.3% | |
| | |
Chesapeake Energy Corp.,
8.0%, 1/15/2025 (b) | | | 65,000 | | | | 57,363 | |
| | |
KazMunayGas National Co. JSC, 144A, 4.75%, 4/19/2027 | | | 200,000 | | | | 194,492 | |
| | |
Oasis Petroleum, Inc.,
6.875%, 3/15/2022 (b) | | | 48,000 | | | | 45,240 | |
| | |
Weatherford International Ltd., 9.875%, 2/15/2024 (b) | | | 100,000 | | | | 61,000 | |
| | | | | | | | |
| | | | | | | 358,095 | |
|
| Financials 0.5% | |
FS KKR Capital Corp., 4.75%, 5/15/2022 | | | 40,000 | | | | 39,603 | |
|
| Industrials 0.7% | |
Park Aerospace Holdings Ltd., 144A, 5.25%, 8/15/2022 | | | 60,000 | | | | 58,050 | |
|
| Information Technology 0.7% | |
DXC Technology Co.,
4.75%, 4/15/2027 | | | 60,000 | | | | 60,211 | |
|
| Materials 1.0% | |
| | |
AK Steel Corp.,
7.0%, 3/15/2027 (b) | | | 100,000 | | | | 78,000 | |
| | |
CF Industries, Inc., 144A,
4.5%, 12/1/2026 | | | 5,000 | | | | 4,887 | |
| | | | | | | | |
| | | | | | | 82,887 | |
|
| Real Estate 1.2% | |
| | |
Government Properties Income Trust, (REIT), 4.0%, 7/15/2022 | | | 25,000 | | | | 24,604 | |
| | |
Omega Healthcare Investors, Inc., (REIT), 4.75%, 1/15/2028 | | | 35,000 | | | | 34,289 | |
| | |
Select Income REIT: | | | | | | | | |
| | |
(REIT), 4.15%, 2/1/2022 | | | 30,000 | | | | 29,675 | |
| | |
(REIT), 4.25%, 5/15/2024 | | | 10,000 | | | | 9,636 | |
| | | | | | | | |
| | | | | | | 98,204 | |
|
| Utilities 1.2% | |
Southern California Edison Co., Series E, 3.7%, 8/1/2025 | | | 100,000 | | | | 99,750 | |
| Total Corporate Bonds(Cost $1,004,418) | | | | 901,276 | |
|
Mortgage-Backed Securities Pass-Throughs 6.1% | |
Federal National Mortgage Association, 4.0%, 9/1/2048 (Cost $496,085) | | | 495,852 | | | | 507,407 | |
| | | | | | | | |
| | | Principal
Amount ($)(a) | | | Value ($) | |
|
| Asset-Backed 2.2% | |
| Home Equity Loans 0.2% | |
CIT Group Home Equity Loan Trust, “AF6”, Series2002-1, 6.2%, 2/25/2030 | | | 13,107 | | | | 13,332 | |
|
| Miscellaneous 2.0% | |
| | |
Domino’s Pizza Master Issuer LLC, “A23”, Series2017-1A, 144A, 4.118%, 7/25/2047 | | | 108,625 | | | | 106,428 | |
| | |
Hilton Grand Vacations Trust, “B”, Series2014-AA, 144A,
2.07%, 11/25/2026 | | | 62,947 | | | | 62,001 | |
| | | | | | | | |
| | | | | | | | 168,429 | |
| Total Asset-Backed(Cost $184,363) | | | | 181,761 | |
|
| Commercial Mortgage-Backed Security 4.8% | |
GMAC Commercial Mortgage Securities, Inc., “G”, Series2004-C1, 144A,
5.455%, 3/10/2038
(Cost $426,492) | | | 423,843 | | | | 394,070 | |
|
| Collateralized Mortgage Obligations 17.0% | |
| | |
Banc of America Mortgage Securities, “2A2”, Series2004-A, 3.917% **, 2/25/2034 | | | 29,312 | | | | 29,210 | |
| | |
Bear Stearns Adjustable Rate Mortgage Trust, “2A1”,
Series2005-11,
4.794% **, 12/25/2035 | | | 33,904 | | | | 34,466 | |
| | |
Countrywide Home Loans, “2A5”, Series2004-13,
5.75%, 8/25/2034 | | | 28,697 | | | | 28,362 | |
|
Fannie Mae Connecticut Avenue Securities: | |
| | |
“1M2”, Series2018-C06,1-monthUSD-LIBOR + 2.000%, 4.506% ** , 3/25/2031 | | | 62,500 | | | | 60,045 | |
| | |
“1M1”, Series2016-C02,1-monthUSD-LIBOR + 2.150%, 4.656% ** , 9/25/2028 | | | 9,976 | | | | 9,990 | |
| | |
“1M2”, Series2018-C05,1-monthUSD-LIBOR + 2.350%, 4.856% ** , 1/25/2031 | | | 100,000 | | | | 97,469 | |
|
Federal Home Loan Mortgage Corp.: | |
| | |
“PI”, Series 3843, Interest Only, 4.5%, 5/15/2038 | | | 94,117 | | | | 5,366 | |
| | |
“C31”, Series 303, Interest Only, 4.5%, 12/15/2042 | | | 395,176 | | | | 86,784 | |
| | |
Federal National Mortgage Association, “4”, Series 406, Interest Only, 4.0%, 9/25/2040 | | | 93,099 | | | | 19,353 | |
| | |
Freddie Mac Structured Agency Credit Risk Debt Notes, “M2”, Series 2017-DNA2,1-monthUSD-LIBOR + 3.450%,
5.956% **, 10/25/2029 | | | 250,000 | | | | 264,548 | |
The accompanying notes are an integral part of the financial statements.
| | | | |
Deutsche DWS Variable Series II — DWS Multisector Income VIP | | | | | 7 |
| | | | | | | | |
| | | Principal
Amount ($)(a) | | | Value ($) | |
|
Government National Mortgage Association: | |
| | |
“GI”, Series2014-146, Interest Only, 3.5%, 9/20/2029 | | | 833,224 | | | | 94,097 | |
| | |
“PI”, Series2015-40, Interest Only, 4.0%, 4/20/2044 | | | 104,289 | | | | 14,371 | |
| | |
“HI”, Series2015-77, Interest Only, 4.0%, 5/20/2045 | | | 220,915 | | | | 41,437 | |
| | |
“IP”, Series2014-115, Interest Only, 4.5%, 2/20/2044 | | | 34,154 | | | | 5,838 | |
| | |
“IN”, Series2009-69, Interest Only, 5.5%, 8/20/2039 | | | 114,729 | | | | 21,531 | |
| | |
“IV”, Series2009-69, Interest Only, 5.5%, 8/20/2039 | | | 111,382 | | | | 20,875 | |
| | |
“IJ”, Series2009-75, Interest Only, 6.0%, 8/16/2039 | | | 96,696 | | | | 16,635 | |
| | |
JPMorgan Mortgage Trust, “2A1”, Series2006-A2,
3.722% **, 4/25/2036 | | | 121,051 | | | | 114,461 | |
| | |
Merrill Lynch Mortgage Investors Trust, “2A”, Series2003-A6, 4.588% **, 10/25/2033 | | | 23,986 | | | | 23,924 | |
| | |
RESIMAC, “A2”, Series2017-2, Australian Bank Bill Short Term Rates1-Month Mid + 1.200%, 3.143% **, 1/15/2049 | | AUD | 405,002 | | | | 284,542 | |
| | |
STACR Trust, “M2”,
Series 2018-DNA3, 144A,1-monthUSD-LIBOR + 2.100%, 4.606% **, 9/25/2048 | | | 108,108 | | | | 103,814 | |
| | |
Wells Fargo Mortgage-Backed Securities Trust, “2A3”,
Series2004-EE,
4.482% **, 12/25/2034 | | | 28,666 | | | | 28,653 | |
Total Collateralized Mortgage Obligations (Cost $1,204,534) | | | | 1,405,771 | |
|
| Government & Agency Obligations 44.2% | |
| Other Government Related (c) 6.1% | |
| | |
Sberbank of Russia, 144A, 5.125%, 10/29/2022 | | | 200,000 | | | | 195,349 | |
| | |
Southern Gas Corridor CJSC, 144A, 6.875%, 3/24/2026 | | | 290,000 | | | | 313,211 | |
| | | | | | | | |
| | | | | | | 508,560 | |
|
| Sovereign Bonds 16.5% | |
| | |
Ivory Coast Government International Bond, 144A, 5.375%, 7/23/2024 | | | 200,000 | | | | 183,408 | |
| | |
Mexican Udibonos Inflation-Linked Bond, Series S,
2.0%, 6/9/2022 | | MXN | 3,004,972 | | | | 141,785 | |
| | |
Republic of Angola, 144A, 9.5%, 11/12/2025 | | | 200,000 | | | | 209,988 | |
| | |
Republic of Argentina-Inflation Linked Bond, 5.83%, 12/31/2033 | | ARS | 375 | | | | 86 | |
| | |
Republic of Hungary, Series 19/A, 6.5%, 6/24/2019 | | HUF | 11,600,000 | | | | 42,647 | |
| | |
Republic of Namibia, 144A, 5.25%, 10/29/2025 | | | 200,000 | | | | 179,328 | |
| | |
Republic of Senegal, 144A, 6.25%, 7/30/2024 | | | 200,000 | | | | 194,064 | |
| | |
Republic of Slovenia, 144A,
5.5%, 10/26/2022 | | | 100,000 | | | | 106,430 | |
| | | | | | | | |
| | | Principal
Amount ($)(a) | | | Value ($) | |
| | |
Republic of Zambia, 144A, 5.375%, 9/20/2022 | | | 200,000 | | | | 142,992 | |
| | |
United Mexican States,
Series M, 5.75%, 3/5/2026 | | MXN | 3,845,600 | | | | 165,299 | |
| | | | | | | | |
| | | | | | | 1,366,027 | |
|
| U.S. Treasury Obligations 21.6% | |
|
U.S. Treasury Bonds: | |
| | |
3.0%, 5/15/2047 | | | 20,000 | | | | 19,914 | |
| | |
3.0%, 2/15/2048 | | | 5,000 | | | | 4,973 | |
| | |
U.S. Treasury Inflation Indexed Note, 0.625%, 4/15/2023 | | | 534,466 | | | | 525,586 | |
|
U.S. Treasury Notes: | |
| | |
1.5%, 5/31/2019 | | | 232,600 | | | | 231,655 | |
| | |
1.625%, 12/31/2019 | | | 109,000 | | | | 107,914 | |
| | |
2.625%, 8/31/2020 | | | 900,000 | | | | 901,196 | |
| | | | | | | | |
| | | | | | | | 1,791,238 | |
Total Government & Agency Obligations (Cost $3,798,868) | | | | 3,665,825 | |
|
| Short-Term U.S. Treasury Obligations 2.8% | |
|
U.S. Treasury Bills: | |
| | |
2.362% ***, 8/15/2019 (d) | | | 200,000 | | | | 196,855 | |
| | |
2.573%***, 10/10/2019 | | | 40,000 | | | | 39,213 | |
Total Short-Term U.S. Treasury Obligations (Cost $236,228) | | | | 236,068 | |
|
| Loan Participations and Assignments 5.4% | |
| Senior Loans ** | |
| | |
DaVita, Inc., Term Loan B,1-month USD LIBOR + 2.750%, 5.272%, 6/24/2021 | | | 66,850 | | | | 66,516 | |
| | |
Level 3 Financing, Inc., Term Loan B,1-month USD LIBOR + 2.250%, 4.754%, 2/22/2024 | | | 60,000 | | | | 57,175 | |
| | |
MacDermid, Inc., Term Loan B6,1-month USD LIBOR + 3.000%, 5.522%, 6/7/2023 (e) | | | 57,187 | | | | 56,865 | |
| | |
MEG Energy Corp., Term Loan B,1-month USD LIBOR + 3.500%, 6.03%, 12/31/2023 | | | 5,402 | | | | 5,301 | |
| | |
NRG Energy, Inc., Term Loan B,1-month USD LIBOR + 1.750%, 4.272%, 6/30/2023 | | | 112,845 | | | | 108,825 | |
| | |
Quebecor Media, Inc., Term Loan B1,3-month USD LIBOR + 2.250%, 4.866%, 8/17/2020 | | | 85,275 | | | | 84,280 | |
| | |
Valeant Pharmaceuticals International, Inc., Term Loan B,1-month USD LIBOR + 3.000%, 5.379%, 6/2/2025 | | | 72,674 | | | | 69,615 | |
Total Loan Participations and Assignments (Cost $460,203) | | | | 448,577 | |
The accompanying notes are an integral part of the financial statements.
| | | | | | |
| | 8 | | | | | | Deutsche DWS Variable Series II — DWS Multisector Income VIP |
| | | | | | | | |
| | | Principal
Amount ($)(a) | | | Value ($) | |
|
| Convertible Bond 1.9% | |
| Materials | |
GEO Specialty Chemicals, Inc.,3-monthUSD-LIBOR + 14.0%, 16.707%** PIK, 10/18/2025 (e) (Cost $145,946) | | | 146,805 | | | | 158,403 | |
| | |
| | | Shares | | | Value ($) | |
|
| Common Stocks 0.1% | |
| Industrials 0.0% | |
Quad Graphics, Inc. | | | 4 | | | | 49 | |
|
| Materials 0.1% | |
| | |
GEO Specialty Chemicals, Inc.* (e) | | | 85,721 | | | | 10,724 | |
Total Common Stocks (Cost $39,455) | | | | 10,773 | |
|
| Warrant 0.0% | |
| Materials | |
Hercules Trust II, Expiration Date 3/31/2029* (e) (Cost $17,432) | | | 85 | | | | 2,096 | |
| | | | | | | | |
| | |
| | | Shares | | | Value ($) | |
|
| Securities Lending Collateral 3.6% | |
DWS Government & Agency Securities Portfolio “DWS Government Cash Institutional Shares, 2.29% (f) (g)
(Cost $302,310) | | | 302,310 | | | | 302,310 | |
| | |
| Cash Equivalent 4.8% | | | | | | | | |
DWS Central Cash Management Government Fund, 2.41% (f) (Cost $395,710) | | | 395,710 | | | | 395,710 | |
| | |
| | | % of Net
Assets | | | Value ($) | |
Total Investment Portfolio
(Cost $8,712,044) | | | 103.8 | | | | 8,610,047 | |
| Other Assets and Liabilities, Net | | | (3.8 | ) | | | (318,212 | ) |
| Net Assets | | | 100.0 | | | | 8,291,835 | |
A summary of the Fund’s transactions with affiliated investments during the year ended December 31, 2018 are as follows:
| | | | | | | | | | | | | | | | | | | | | | | | | | | | | | | | |
Value ($) at
12/31/2017 | | Purchases
Cost ($) | | | Sales
Proceeds ($) | | | Net
Realized
Gain/
(Loss) ($) | | | Net Change in
Unrealized
Appreciation
(Depreciation) ($) | | | Income ($) | | | Capital Gain
Distributions ($) | | | Number
of Shares at
12/31/2018 | | | Value ($) at
12/31/2018 | |
Securities Lending Collateral 3.6% | | | | | | | | | | | | | | | | | |
DWS Government & Agency Securities Portfolio “DWS Government Cash Institutional Shares”, 2.29% (f) (g) | |
| 154,990 | | | 147,320 | (h) | | | — | | | | — | | | | — | | | | 4,702 | | | | — | | | | 302,310 | | | | 302,310 | |
Cash Equivalent 4.8% | | | | | | | | | | | | | | | | | |
DWS Central Cash Management Government Fund, 2.41% (f) | |
| 539,169 | | | 4,831,276 | | | | 4,974,735 | | | | — | | | | — | | | | 14,308 | | | | — | | | | 395,710 | | | | 395,710 | |
| 694,159 | | | 4,978,596 | | | | 4,974,735 | | | | — | | | | — | | | | 19,010 | | | | — | | | | 698,020 | | | | 698,020 | |
| * | Non-income producing security. |
| ** | Variable or floating rate security. These securities are shown at their current rate as of December 31, 2018. For securities based on a published reference rate and spread, the reference rate and spread are indicated within the description above. Certain variable rate securities are not based on a published reference rate and spread but adjust periodically based on current market conditions, prepayment of underlying positions and/or other variables. |
| *** | Annualized yield at time of purchase; not a coupon rate. |
| (a) | Principal amount stated in U.S. dollars unless otherwise noted. |
| (b) | All or a portion of these securities were on loan. In addition, “Other Assets and Liabilities, Net” may include pending sales that are also on loan. The value of securities loaned at December 31, 2018 amounted to $287,953, which is 3.5% of net assets. |
| (c) | Government-backed debt issued by financial companies or government sponsored enterprises. |
| (d) | At December 31, 2018, this security has been pledged, in whole or in part, to cover initial margin requirements for open futures contracts. |
| (e) | Investment was valued using significant unobservable inputs. |
| (f) | Affiliated fund managed by DWS Investment Management Americas, Inc. The rate shown is the annualizedseven-day yield at period end. |
| (g) | Represents collateral held in connection with securities lending. Income earned by the Fund is net of borrower rebates. |
| (h) | Represents the net increase (purchase cost) or decrease (sales proceeds) in the amount invested for the year ended December 31, 2018. |
144A: Security exempt from registration under Rule 144A of the Securities Act of 1933. These securities may be resold in transactions exempt from registration, normally to qualified institutional buyers.
CJSC: Closed Joint Stock Company
Interest Only: Interest Only (IO) bonds represent the “interest only” portion of payments on a pool of underlying mortgages or mortgage-backed securities. IO securities are subject to prepayment risk of the pool of underlying mortgages.
JSC: Joint Stock Company
The accompanying notes are an integral part of the financial statements.
| | | | |
Deutsche DWS Variable Series II — DWS Multisector Income VIP | | | | | 9 |
LIBOR: London Interbank Offered Rate
PIK: Denotes that all or a portion of the income is paidin-kind in the form of additional principal.
REIT: Real Estate Investment Trust
Included in the portfolio are investments in mortgage or asset-backed securities which are interests in separate pools of mortgages or assets. Effective maturities of these investments may be shorter than stated maturities due to prepayments.
At December 31, 2018, open futures contracts purchased were as follows:
| | | | | | | | | | | | | | | | | | | | | | | | |
| Futures | | Currency | | | Expiration
Date | | | Contracts | | | Notional
Amount ($) | | | Notional
Value ($) | | | Unrealized
Appreciation ($) | |
| 2 Year U.S. Treasury Note | | | USD | | | | 3/29/2019 | | | | 4 | | | | 843,874 | | | | 849,250 | | | | 5,376 | |
| U.S. Treasury Long Bond | | | USD | | | | 3/20/2019 | | | | 2 | | | | 278,567 | | | | 292,000 | | | | 13,433 | |
| Ultra 10 Year U.S. Treasury Note | | | USD | | | | 3/20/2019 | | | | 8 | | | | 1,008,723 | | | | 1,040,625 | | | | 31,902 | |
| Total unrealized appreciation | | | | 50,711 | |
At December 31, 2018, open futures contracts sold were as follows:
| | | | | | | | | | | | | | | | | | | | | | | | |
| Futures | | Currency | | | Expiration
Date | | | Contracts | | | Notional
Amount ($) | | | Notional
Value ($) | | | Unrealized
Depreciation ($) | |
| 5 Year U.S. Treasury Note | | | USD | | | | 3/29/2019 | | | | 1 | | | | 112,991 | | | | 114,688 | | | | (1,697 | ) |
| Euro-Schatz | | | EUR | | | | 3/7/2019 | | | | 8 | | | | 1,025,480 | | | | 1,026,042 | | | | (562 | ) |
| Ultra Long U.S. Treasury Bond | | | USD | | | | 3/20/2019 | | | | 1 | | | | 152,208 | | | | 160,656 | | | | (8,448 | ) |
| Total unrealized depreciation | | | | (10,707 | ) |
As of December 31, 2018, the Fund had the following open forward foreign currency contracts:
| | | | | | | | | | | | | | | | | | | | |
| Contracts to Deliver | | | In Exchange For | | | Settlement
Date | | | Unrealized
Appreciation ($) | | | Counterparty |
| USD | | | 86,534 | | | CNY | | | 603,054 | | | | 1/9/2019 | | | | 1,303 | | | Credit Agricole |
| MXN | | | 5,100,000 | | | USD | | | 261,287 | | | | 1/23/2019 | | | | 2,534 | | | State Street Bank and Trust |
| AUD | | | 450,000 | | | USD | | | 325,651 | | | | 2/19/2019 | | | | 8,415 | | | Australia and New Zealand Banking Group Ltd. |
| Total unrealized appreciation | | | | | | | | 12,252 | | | |
| | | | |
| Contracts to Deliver | | | In Exchange For | | | Settlement
Date | | | Unrealized
Depreciation ($) | | | Counterparty |
| CNY | | | 1,379,970 | | | USD | | | 198,522 | | | | 1/9/2019 | | | | (2,478) | | | Toronto-Dominion Bank |
Currency Abbreviations
For information on the Fund’s policy and additional disclosures regarding futures contracts and forward foreign currency contracts, please refer to the Derivatives section of Note B in the accompanying Notes to Financial Statements.
The accompanying notes are an integral part of the financial statements.
| | | | | | |
| | 10 | | | | | | Deutsche DWS Variable Series II — DWS Multisector Income VIP |
Fair Value Measurements
Various inputs are used in determining the value of the Fund’s investments. These inputs are summarized in three broad levels. Level 1 includes quoted prices in active markets for identical securities. Level 2 includes other significant observable inputs (including quoted prices for similar securities, interest rates, prepayment speeds and credit risk). Level 3 includes significant unobservable inputs (including the Fund’s own assumptions in determining the fair value of investments). The level assigned to the securities valuations may not be an indication of the risk or liquidity associated with investing in those securities.
The following is a summary of the inputs used as of December 31, 2018 in valuing the Fund’s investments. For information on the Fund’s policy regarding the valuation of investments, please refer to the Security Valuation section of Note A in the accompanying Notes to Financial Statements.
| | | | | | | | | | | | | | | | |
| Assets | | Level 1 | | | Level 2 | | | Level 3 | | | Total | |
| Fixed Income Investments (i) | | | | | | | | | | | | | | | | |
Corporate Bonds | | $ | — | | | $ | 901,276 | | | $ | — | | | $ | 901,276 | |
Mortgage-Backed Securities Pass-Throughs | | | — | | | | 507,407 | | | | — | | | | 507,407 | |
Asset-Backed | | | — | | | | 181,761 | | | | — | | | | 181,761 | |
Commercial Mortgage-Backed Security | | | — | | | | 394,070 | | | | — | | | | 394,070 | |
Collateralized Mortgage Obligations | | | — | | | | 1,405,771 | | | | — | | | | 1,405,771 | |
Government & Agency Obligations | | | — | | | | 3,665,825 | | | | — | | | | 3,665,825 | |
Short-Term U.S. Treasury Obligations | | | — | | | | 236,068 | | | | — | | | | 236,068 | |
Loan Participations and Assignments | | | — | | | | 391,712 | | | | 56,865 | | | | 448,577 | |
Convertible Bond | | | — | | | | — | | | | 158,403 | | | | 158,403 | |
| Common Stocks (i) | | | 49 | | | | — | | | | 10,724 | | | | 10,773 | |
| Warrant | | | — | | | | — | | | | 2,096 | | | | 2,096 | |
| Short-Term Investments (i) | | | 698,020 | | | | — | | | | — | | | | 698,020 | |
| Derivatives (j) | | | | | | | | | | | | | | | | |
Futures Contracts | | $ | 50,711 | | | $ | — | | | $ | — | | | $ | 50,711 | |
Forward Foreign Currency Contracts | | | — | | | | 12,252 | | | | — | | | | 12,252 | |
| Total | | $ | 748,780 | | | $ | 7,696,142 | | | $ | 228,088 | | | $ | 8,673,010 | |
| | | | |
| Liabilities | | Level 1 | | | Level 2 | | | Level 3 | | | Total | |
| Derivatives (j) | | | | | | | | | | | | | | | | |
Futures Contracts | | $ | (10,707 | ) | | $ | — | | | $ | — | | | $ | (10,707 | ) |
Forward Foreign Currency Contracts | | | — | | | | (2,478 | ) | | | — | | | | (2,478 | ) |
| Total | | $ | (10,707 | ) | | $ | (2,478 | ) | | $ | — | | | $ | (13,185 | ) |
During the year ended December 31, 2018, the amount of transfers between Level 2 and Level 3 was $56,865. The investment was transferred from Level 2 to Level 3 due to the lack of observable market data due to a decrease in market activity.
Transfers between price levels are recognized at the beginning of the reporting period.
| (i) | See Investment Portfolio for additional detailed categorizations. |
| (j) | Derivatives include unrealized appreciation (depreciation) on open futures contracts and forward foreign currency contract. |
Level 3 Reconciliation
The following is a reconciliation of the Fund’s Level 3 investments for which significant unobservable inputs were used in determining value:
| | | | | | | | | | | | | | | | | | | | |
| | | Bank
Loan | | | Convertible
Bond | | | Common
Stock | | | Warrants | | | Total | |
Balance as of December 31, 2017 | | $ | — | | | $ | 180,626 | | | $ | 4,455 | | | $ | 2,298 | | | $ | 187,379 | |
| Realized gains (loss) | | | — | | | | — | | | | — | | | | — | | | | — | |
| Change in unrealized appreciation (depreciation) | | | (685 | ) | | | (26,204 | ) | | | (13,253 | ) | | | (202 | ) | | | (40,344 | ) |
| Amortization premium/discount | | | (2 | ) | | | 20 | | | | — | | | | — | | | | 18 | |
| Purchases/PIK | | | — | | | | 3,961 | | | | 19,522 | | | | — | | | | 23,483 | |
| (Sales) | | | — | | | | — | | | | — | | | | — | | | | — | |
| Transfers into Level 3 | | | 57,552 | | | | — | | | | — | | | | — | | | | 57,552 | |
| Transfers (out) of Level 3 | | | — | | | | — | | | | — | | | | — | | | | — | |
| Balance as of December 31, 2018 | | $ | 56,865 | | | $ | 158,403 | | | $ | 10,724 | | | $ | 2,096 | | | $ | 228,088 | |
| Net change in unrealized appreciation (depreciation) from investments still held as of December 31, 2018 | | $ | (685 | ) | | $ | (26,204 | ) | | $ | (13,253 | ) | | $ | (202 | ) | | $ | (40,344 | ) |
The accompanying notes are an integral part of the financial statements.
| | | | |
Deutsche DWS Variable Series II — DWS Multisector Income VIP | | | | | 11 |
| | | | | | | | | | |
| Quantitative Disclosure About Significant Unobservable Inputs |
| Asset Class | | Fair Value at 12/31/18 | | | Valuation Technique(s) | | Unobservable Input | | Range (Weighted Average) |
| Convertible Bond: | | | | | | | | | | |
| Materials | | | $158,403 | | | Option Pricing Model | | Implied Volatility of Option | | 45% |
| | | | | | | | Discount Rate | | 18.38% |
| | | | | | | | EV/EBITDA Multiple | | 5.56 |
| | | | | | | | | Discount for lack of marketability | | 22% |
| Common Stock: | | | | | | | | | | |
| Materials | | | $10,724 | | | Market Approach | | EV/EBITDA Multiple | | 5.56 |
| | | | | | | | | Discount for lack of marketability | | 22% |
| Warrants: | | | | | | | | | | |
| Materials | | | $2,096 | | | Black Scholes Option Pricing Model | | Implied Volatility of Option | | 21.61% |
| | | | | | | | | Discount for lack of marketability | | 20% |
| Senior Loans | | | $56,865 | | | Dealer Quote | | Dealer Quote | | — |
Qualitative Disclosure About Unobservable Inputs
Significant unobservable inputs developed by the Pricing Committee and used in the fair value measurement of the Fund’s convertible bond investment include enterprise value (EV) to earnings before interest, taxes, depreciation and amortization (EBITDA) ratio with a discount for lack of marketability; implied volatility of option; and discount rate. A significant change in the EV to EBITDA ratio and implied volatility of option may result in a significant change in the fair value measurement, while a significant change in the discount for lack of marketability and discount rate are unlikely to result in a materially higher or lower fair value measurement.
Significant unobservable inputs developed by the Pricing Committee and used in the fair value measurement of the Fund’s common stock investment include enterprise value (EV) to earnings before interest, taxes, depreciation and amortization (EBITDA) ratio with a discount for lack of marketability. A significant change in the EV to EBITDA ratio may result in a significant change in the fair value measurement, while a significant change in the discount for lack of marketability is unlikely to result in a materially higher or lower fair value measurement.
Significant unobservable inputs developed by the Pricing Committee and used in the fair value measurement of the Fund’s warrants include volatility and discount for lack of marketability. A change in the volatility of the underlying asset as an input to the Black-Scholes model may have a significant change in the fair value measurement. A significant change in the discount for lack of marketability is unlikely to have a material impact to the fair value measurement.
A significant change in the broker quotes for the Fund’s senior loan investments could have a material change on the fair value measurement.
The accompanying notes are an integral part of the financial statements.
| | | | | | |
| | 12 | | | | | | Deutsche DWS Variable Series II — DWS Multisector Income VIP |
Statement of Assets and Liabilities
| | | | |
| as of December 31, 2018 | | | | |
| |
| Assets | | | | |
| Investments innon-affiliated securities, at value (cost $8,014,024) — including $287,953 of securities loaned | | $ | 7,912,027 | |
| Investment in DWS Government & Agency Securities Portfolio (cost $302,310)* | | | 302,310 | |
| Investment in DWS Central Cash Management Government Fund (cost $395,710) | | | 395,710 | |
| Cash | | | 2,618 | |
| Foreign currency, at value (cost $19,475) | | | 19,299 | |
| Interest receivable | | | 77,050 | |
| Receivable for variation margin on futures contracts | | | 4,512 | |
| Unrealized appreciation on forward foreign currency contracts | | | 12,252 | |
| Foreign taxes recoverable | | | 625 | |
| Other assets | | | 1,172 | |
| Total assets | | | 8,727,575 | |
| |
| Liabilities | | | | |
| Payable upon return of securities loaned | | | 302,310 | |
| Payable for Fund shares redeemed | | | 17,628 | |
| Unrealized depreciation on forward foreign currency contracts | | | 2,478 | |
| Accrued management fee | | | 5,426 | |
| Accrued Trustees’ fees | | | 747 | |
| Other accrued expenses and payables | | | 107,151 | |
| Total liabilities | | | 435,740 | |
| Net assets, at value | | $ | 8,291,835 | |
| |
| Net Assets Consist of | | | | |
| Distributable earnings (loss) | | | (4,409,778 | ) |
| Paid-in capital | | | 12,701,613 | |
| Net assets, at value | | $ | 8,291,835 | |
|
| Net Asset Value | |
Class A | | | | |
| |
| Net asset value, offering and redemption price per share ($8,291,835 ÷ 888,694 outstanding shares of beneficial interest, no par value, unlimited number of shares authorized) | | $ | 9.33 | |
| * | Represents collateral on securities loaned. |
Statement of Operations
| | | | |
| for the year ended December 31, 2018 | | | | |
| |
| Investment Income | | | | |
| Income: | | | | |
| Interest (net of foreign taxes withheld of $913) | | $ | 347,905 | |
| Income distributions — DWS Central Cash Management Government Fund | | | 14,308 | |
| Securities lending income, net of borrower rebates | | | 4,702 | |
| Total income | | | 366,915 | |
| Expenses: | | | | |
| Management fee | | | 48,680 | |
| Administration fee | | | 8,851 | |
| Services to Shareholders | | | 207 | |
| Custodian fee | | | 19,492 | |
| Professional fees | | | 85,127 | |
| Reports to shareholders | | | 19,521 | |
| Trustees’ fees and expenses | | | 2,063 | |
| Other | | | 9,527 | |
| Total expenses before expense reductions | | | 193,468 | |
| Expense reductions | | | (135,937 | ) |
| Total expenses after expense reductions | | | 57,531 | |
| Net investment income | | | 309,384 | |
| |
| Realized and Unrealized Gain (Loss) | | | | |
| Net realized gain (loss) from: | | | | |
| Investments | | | (72,473 | ) |
| Swap contracts | | | 956 | |
| Futures | | | (66,904 | ) |
| Forward foreign currency contracts | | | 26,618 | |
| Foreign currency | | | 5,022 | |
| | | | (106,781 | ) |
| Change in net unrealized appreciation (depreciation) on: | | | | |
| Investments | | | (404,117 | ) |
| Futures | | | 43,567 | |
| Forward foreign currency contracts | | | 8,305 | |
| Foreign currency | | | 6,500 | |
| | | | (345,745 | ) |
| Net gain (loss) | | | (452,526 | ) |
| Net increase (decrease) in net assets resulting from operations | | $ | (143,142 | ) |
The accompanying notes are an integral part of the financial statements.
| | | | |
Deutsche DWS Variable Series II — DWS Multisector Income VIP | | | | | 13 |
Statements of Changes in Net Assets
| | | | | | | | |
| | | Years Ended December 31, | |
| Increase (Decrease) in Net Assets | | 2018 | | | 2017 | |
| Operations: | | | | | | | | |
| Net investment income | | $ | 309,384 | | | $ | 612,061 | |
| Net realized gain (loss) | | | (106,781 | ) | | | 498,625 | |
| Change in net unrealized appreciation (depreciation) | | | (345,745 | ) | | | 372,805 | |
| Net increase (decrease) in net assets resulting from operations | | | (143,142 | ) | | | 1,483,491 | |
| Distributions to shareholders: | | | | | | | | |
Class A | | | (641,992 | ) | | | (201,605 | )* |
| Fund share transactions: | | | | | | | | |
Class A | | | | | | | | |
| Proceeds from shares sold | | | 612,918 | | | | 710,821 | |
| Reinvestment of distributions | | | 641,992 | | | | 201,605 | |
| Payments for shares redeemed | | | (1,895,400 | ) | | | (17,200,328 | ) |
| Net increase (decrease) in net assets from Class A share transactions | | | (640,490 | ) | | | (16,287,902 | ) |
| Increase (decrease) in net assets | | | (1,425,624 | ) | | | (15,006,016 | ) |
| Net assets at beginning of period | | | 9,717,459 | | | | 24,723,475 | |
| | |
| Net assets at end of period | | $ | 8,291,835 | | | $ | 9,717,459 | ** |
| | |
| Other Information | | | | | | | | |
Class A | | | | | | | | |
| Shares outstanding at beginning of period | | | 951,249 | | | | 2,560,974 | |
| Shares sold | | | 64,660 | | | | 71,456 | |
| Shares issued to shareholders in reinvestment of distributions | | | 68,080 | | | | 20,405 | |
| Shares redeemed | | | (195,295 | ) | | | (1,701,586 | ) |
| Net increase (decrease) in Class A shares | | | (62,555 | ) | | | (1,609,725 | ) |
| | |
| Shares outstanding at end of period | | | 888,694 | | | | 951,249 | |
| * | Includes distributions from net investment income. |
| ** | Includes undistributed net investment income of $636,964. |
The accompanying notes are an integral part of the financial statements.
| | | | | | |
| | 14 | | | | | | Deutsche DWS Variable Series II — DWS Multisector Income VIP |
Financial Highlights
| | | | | | | | | | | | | | | | | | | | |
| | | Years Ended December 31, | |
| Class A | | 2018 | | | 2017 | | | 2016 | | | 2015 | | | 2014 | |
| | | | | |
| Selected Per Share Data | | | | | | | | | | | | | | | | | | | | |
| Net asset value, beginning of period | | $ | 10.22 | | | $ | 9.65 | | | $ | 10.43 | | | $ | 11.20 | | | $ | 11.53 | |
| Income (loss) from investment operations: | | | | | | | | | | | | | | | | | | | | |
Net investment incomea | | | .34 | | | | .28 | | | | .22 | | | | .40 | | | | .49 | |
Net realized and unrealized gain (loss) | | | (.50 | ) | | | .37 | | | | (.17 | ) | | | (.72 | ) | | | (.23 | ) |
Total from investment operations | | | (.16 | ) | | | .65 | | | | .05 | | | | (.32 | ) | | | .26 | |
| Less distributions from: | | | | | | | | | | | | | | | | | | | | |
Net investment income | | | (.73 | ) | | | (.08 | ) | | | (.83 | ) | | | (.45 | ) | | | (.59 | ) |
| Net asset value, end of period | | $ | 9.33 | | | $ | 10.22 | | | $ | 9.65 | | | $ | 10.43 | | | $ | 11.20 | |
| Total Return (%)b | | | (1.65 | ) | | | 6.78 | | | | .50 | | | | (3.02 | ) | | | 2.23 | |
| | | | | |
| Ratios to Average Net Assets and Supplemental Data | | | | | | | | | | | | | | | | | | | | |
| Net assets, end of period ($ millions) | | | 8 | | | | 10 | | | | 25 | | | | 33 | | | | 54 | |
| Ratio of expenses before expense reductions (%)c | | | 2.19 | | | | 1.37 | | | | 1.31 | | | | 1.15 | | | | 1.08 | |
| Ratio of expenses after expense reductions (%)c | | | .65 | | | | .67 | | | | .68 | | | | .70 | | | | .77 | |
| Ratio of net investment income (%) | | | 3.50 | | | | 2.81 | | | | 2.19 | | | | 3.67 | | | | 4.23 | |
| Portfolio turnover rate (%) | | | 85 | | | | 96 | | | | 159 | | | | 185 | | | | 185 | |
| a | Based on average shares outstanding during the period. |
| b | Total return would have been lower had certain expenses not been reduced. |
| c | Expense ratio does not reflect charges and fees associated with the separate account that invests in the Fund or any variable life insurance policy or variable annuity contract for which the Fund is an investment option. |
The accompanying notes are an integral part of the financial statements.
| | | | |
Deutsche DWS Variable Series II — DWS Multisector Income VIP | | | | | 15 |
| | |
| Notes to Financial Statements | | (Unaudited) |
A. Organization and Significant Accounting Policies
DWS Multisector Income VIP (formerly Deutsche Multisector Income VIP) (the “Fund”) is a diversified series of Deutsche DWS Variable Series II (formerly Deutsche Variable Series II) (the “Trust”), which is registered under the Investment Company Act of 1940, as amended (the “1940 Act”), as anopen-end management investment company organized as a Massachusetts business trust.
The Fund’s financial statements are prepared in accordance with accounting principles generally accepted in the United States of America (“U.S. GAAP”) which require the use of management estimates. Actual results could differ from those estimates. The Fund qualifies as an investment company under Topic 946 of Accounting Standards Codification of U.S. GAAP. The policies described below are followed consistently by the Fund in the preparation of its financial statements.
In October 2018, the Securities and Exchange Commission adopted amendments to certain disclosure requirements in Securities Act Release No. 33-10532, Disclosure Update and Simplification, which is intended to facilitate the disclosure of information to investors and simplify compliance without significantly altering the total mix of information provided to investors. Effective with the current reporting period, the Fund adopted the amendments with the impacts being that the Fund is no longer required to present components of distributable earnings on the Statement of Assets and Liabilities or the sources of distributable earnings and the amount of undistributed net investment income on the Statements of Changes in Net Assets.
Security Valuation. Investments are stated at value determined as of the close of regular trading on the New York Stock Exchange on each day the exchange is open for trading.
Various inputs are used in determining the value of the Fund’s investments. These inputs are summarized in three broad levels. Level 1 includes quoted prices in active markets for identical securities. Level 2 includes other significant observable inputs (including quoted prices for similar securities, interest rates, prepayment speeds and credit risk). Level 3 includes significant unobservable inputs (including the Fund’s own assumptions in determining the fair value of investments). The level assigned to the securities valuations may not be an indication of the risk or liquidity associated with investing in those securities.
Debt securities and loan participations and assignments are valued at prices supplied by independent pricing services approved by the Fund’s Board. Such services may use various pricing techniques which take into account appropriate factors such as yield, quality, coupon rate, maturity, type of issue, trading characteristics, prepayment speeds and other data, as well as broker quotes. If the pricing services are unable to provide valuations, debt securities are valued at the average of the most recent reliable bid quotations or evaluated prices, as applicable, obtained frombroker-dealers and loan participations and assignments are valued at the mean of the most recent bid and ask quotations or evaluated prices, as applicable, obtained from one or morebroker-dealers. Certain securities may be valued on the basis of a price provided by a single source orbroker-dealer. No active trading market may exist for some senior loans and they may be subject to restrictions on resale. The inability to dispose of senior loans in a timely fashion could result in losses. These securities are generally categorized as Level 2. Certain securities may be valued on the basis of a price provided by a single source or broker-dealer. No active trading market may exist for some senior loans and they may be subject to restrictions on resale. The inability to dispose of senior loans in a timely fashion could result in losses. These securities are generally categorized as Level 3.
Equity securities are valued at the most recent sale price or official closing price reported on the exchange (U.S. or foreign) or over-the-counter market on which they trade. Securities for which no sales are reported are valued at the calculated mean between the most recent bid and asked quotations on the relevant market or, if a mean cannot be determined, at the most recent bid quotation. Equity securities are generally categorized as Level 1.
Futures contracts are generally valued at the settlement prices established each day on the exchange on which they are traded and are categorized as Level 1.
Forward currency contracts are valued at the prevailing forward exchange rate of the underlying currencies and are categorized as Level 2.
Swap contracts are valued daily based upon prices supplied by a Board approved pricing vendor, if available, and otherwise are valued at the price provided by thebroker-dealer. Swap contracts are generally categorized as Level 2.
| | | | | | |
| | 16 | | | | | | Deutsche DWS Variable Series II — DWS Multisector Income VIP |
Securities and other assets for which market quotations are not readily available or for which the above valuation procedures are deemed not to reflect fair value are valued in a manner that is intended to reflect their fair value as determined in accordance with procedures approved by the Board and are generally categorized as Level 3. In accordance with the Fund’s valuation procedures, factors considered in determining value may include, but are not limited to, the type of the security; the size of the holding; the initial cost of the security; the existence of any contractual restrictions on the security’s disposition; the price and extent of public trading in similar securities of the issuer or of comparable companies; quotations or evaluated prices frombroker-dealers and/or pricing services; information obtained from the issuer, analysts, and/or the appropriate stock exchange (forexchange-traded securities); an analysis of the company’s or issuer’s financial statements; an evaluation of the forces that influence the issuer and the market(s) in which the security is purchased and sold; and with respect to debt securities, the maturity, coupon, creditworthiness, currency denomination and the movement of the market in which the security is normally traded. The value determined under these procedures may differ from published values for the same securities.
Disclosure about the classification of fair value measurements is included in a table following the Fund’s Investment Portfolio.
Foreign Currency Translations. The books and records of the Fund are maintained in U.S. dollars. Investment securities and other assets and liabilities denominated in a foreign currency are translated into U.S. dollars at the prevailing exchange rates at period end. Purchases and sales of investment securities, income and expenses are translated into U.S. dollars at the prevailing exchange rates on the respective dates of the transactions.
Net realized and unrealized gains and losses on foreign currency transactions represent net gains and losses between trade and settlement dates on securities transactions, the acquisition and disposition of foreign currencies, and the difference between the amount of net investment income accrued and the U.S. dollar amount actually received. The portion of both realized and unrealized gains and losses on investments that results from fluctuations in foreign currency exchange rates is not separately disclosed but is included with net realized and unrealized gain/appreciation and loss/depreciation on investments.
Securities Lending. Deutsche Bank AG, as lending agent, lends securities of the Fund to certain financial institutions under the terms of its securities lending agreement. During the term of the loans, the Fund continues to receive interest and dividends generated by the securities and to participate in any changes in their market value. The Fund requires the borrowers of the securities to maintain collateral with the Fund consisting of either cash or liquid, unencumbered assets having a value at least equal to the value of the securities loaned. When the collateral falls below specified amounts, the lending agent will use its best effort to obtain additional collateral on the next business day to meet required amounts under the securities lending agreement. As of period end, any securities on loan were collateralized by cash. During the year ended December 31, 2018, the Fund invested the cash collateral into a joint trading account in affiliated money market funds managed by DWS Investment Management Americas, Inc. As of December 31, 2018, the Fund invested the cash collateral in DWS Government & Agency Securities Portfolio. DWS Investment Management Americas, Inc. receives a management/administration fee (0.12% annualized effective rate as of December 31, 2018) on the cash collateral invested in DWS Government & Agency Securities Portfolio. The Fund receives compensation for lending its securities either in the form of fees or by earning interest on invested cash collateral net of borrower rebates and fees paid to a lending agent. Either the Fund or the borrower may terminate the loan at any time, and the borrower, after notice, is required to return borrowed securities within a standard time period. There may be risks of delay and costs in recovery of securities or even loss of rights in the collateral should the borrower of the securities fail financially. If the Fund is not able to recover securities lent, the Fund may sell the collateral and purchase a replacement investment in the market, incurring the risk that the value of the replacement security is greater than the value of the collateral. The Fund is also subject to all investment risks associated with the reinvestment of any cash collateral received, including, but not limited to, interest rate, credit and liquidity risk associated with such investments.
As of December 31, 2018, the Fund had securities on loan, which were classified as corporate bonds in the Investment Portfolio. The value of the related collateral exceeded the value of the securities loaned at period end. As of period end, the remaining contractual maturity of the collateral agreements were overnight and continuous.
Loan Participations and Assignments. Loan Participations and Assignments are portions of loans originated by banks and sold in pieces to investors. Thesefloating-rate loans (“Loans”) in which the Fund invests are arranged between the borrower and one or more financial institutions (“Lenders”). These Loans
| | | | |
Deutsche DWS Variable Series II — DWS Multisector Income VIP | | | | | 17 |
may take the form of Senior Loans, which are corporate obligations often issued in connection with recapitalizations, acquisitions, leveraged buy outs and refinancing. The Fund invests in such Loans in the form of participations in Loans (“Participations”) or assignments of all or a portion of Loans from third parties (“Assignments”). Participations typically result in the Fund having a contractual relationship with only the Lender, not with the borrower. The Fund has the right to receive payments of principal, interest and any fees to which it is entitled from the Lender selling the Participation and only upon receipt by the Lender of the payments from the borrower. In connection with purchasing Participations, the Fund generally has no right to enforce compliance by the borrower with the terms of the loan agreement relating to the Loan, or any rights of set off against the borrower, and the Fund will not benefit directly from any collateral supporting the Loan in which it has purchased the Participation. As a result, the Fund assumes the credit risk of both the borrower and the Lender that is selling the Participation. Assignments typically result in the Fund having a direct contractual relationship with the borrower, and the Fund may enforce compliance by the borrower with the terms of the loan agreement. Loans held by the Fund are generally in the form of Assignments, but the Fund may also invest in Participations. If affiliates of the Advisor participate in the primary and secondary market for senior loans, legal limitations may restrict the Fund’s ability to participate in restructuring or acquiring some senior loans. All Loans involve interest rate risk, liquidity risk and credit risk, including the potential default or insolvency of the borrower.
Taxes. The Fund’s policy is to comply with the requirements of the Internal Revenue Code, as amended, which are applicable to regulated investment companies and to distribute all of its taxable income to its shareholders.
Additionally, the Fund may be subject to taxes imposed by the governments of countries in which it invests and are generally based on income and/or capital gains earned or repatriated, a portion of which may be recoverable. Based upon the current interpretation of the tax rules and regulations, estimated tax liabilities and recoveries on certain foreign securities are recorded on an accrual basis and are reflected as components of interest income or net change in unrealized gain/loss on investments. Tax liabilities realized as a result of security sales are reflected as a component of net realized gain/loss on investments.
At December 31, 2018, the Fund had net tax basis capital loss carryforwards of approximately $4,643,000, which may be applied against realized net taxable capital gains indefinitely, includingshort-term losses ($1,959,000) andlong-term losses ($2,684,000).
The Fund has reviewed the tax positions for the open tax years as of December 31, 2018 and has determined that no provision for income tax and/or uncertain tax provisions is required in the Fund’s financial statements. The Fund’s federal tax returns for the prior three fiscal years remain open subject to examination by the Internal Revenue Service.
Distribution of Income and Gains. Distributions from net investment income of the Fund, if any, are declared and distributed to shareholders annually. Net realized gains from investment transactions, in excess of available capital loss carryforwards, would be taxable to the Fund if not distributed and, therefore, will be distributed to shareholders at least annually. The Fund may also make additional distributions for tax purposes if necessary.
The timing and characterization of certain income and capital gain distributions are determined annually in accordance with federal tax regulations which may differ from accounting principles generally accepted in the United States of America. These differences primarily relate to investments in foreign denominated investments, futures contracts, swap contracts and certain securities sold at a loss. As a result, net investment income (loss) and net realized gain (loss) on investment transactions for a reporting period may differ significantly from distributions during such period. Accordingly, the Fund may periodically make reclassifications among certain of its capital accounts without impacting the net asset value of the Fund.
At December 31, 2018, the Fund’s components of distributable earnings on a tax basis were as follows:
| | | | |
| Undistributed ordinary income* | | $ | 336,273 | |
| Capital loss carryforwards | | $ | (4,643,000 | ) |
| Unrealized appreciation (depreciation) on investments | | $ | (102,899 | ) |
At December 31, 2018, the aggregate cost of investments for federal income tax purposes was $8,712,946. The net unrealized depreciation for all investments based on tax cost was $102,899. This consisted of aggregate gross unrealized appreciation for all investments in which there was an excess of value over tax cost of $344,975 and aggregate gross unrealized depreciation for all investments in which there was an excess of tax cost over value of $447,874.
| | | | | | |
| | 18 | | | | | | Deutsche DWS Variable Series II — DWS Multisector Income VIP |
In addition, the tax character of distributions paid by the Fund is summarized as follows:
| | | | | | | | |
| | | Years Ended December 31, | |
| | | 2018 | | | 2017 | |
| Distributions from ordinary income* | | $ | 641,992 | | | $ | 201,605 | |
| * | For tax purposes, short-term capital gain distributions are considered ordinary income distributions. |
Expenses. Expenses of the Trust arising in connection with a specific fund are allocated to that fund. Other Trust expenses which cannot be directly attributed to a fund are apportioned among the funds in the Trust based upon the relative net assets or other appropriate measures.
Contingencies. In the normal course of business, the Fund may enter into contracts with service providers that contain general indemnification clauses. The Fund’s maximum exposure under these arrangements is unknown, as this would involve future claims that may be made against the Fund that have not yet been made. However, based on experience, the Fund expects the risk of loss to be remote.
Other. Investment transactions are accounted for on a trade date plus one basis for daily net asset value calculations. However, for financial reporting purposes, investment transactions are reported on trade date. Interest income is recorded on the accrual basis. Dividend income is recorded on theex-dividend date net of foreign withholding taxes. Realized gains and losses from investment transactions are recorded on an identified cost basis. Proceeds from litigation payments, if any, are included in net realized gain (loss) from investments. All discounts and premiums are accreted/amortized for both tax and financial reporting purposes for the Fund, with the exception of securities in default of principal.
B. Derivative Instruments
Swaps. A swap is a contract between two parties to exchange future cash flows at periodic intervals based on the notional amount of the swap. A bilateral swap is a transaction between the fund and a counterparty where cash flows are exchanged between the two parties. A centrally cleared swap is a transaction executed between the fund and a counterparty, then cleared by a clearing member through a central clearinghouse. The central clearinghouse serves as the counterparty, with whom the fund exchanges cash flows.
The value of a swap is adjusted daily, and the change in value, if any, is recorded as unrealized appreciation or depreciation in the Statement of Assets and Liabilities. Gains or losses are realized when the swap expires or is closed. Certain risks may arise when entering into swap transactions including counterparty default; liquidity; or unfavorable changes in interest rates or the value of the underlying reference security, commodity or index. In connection with bilateral swaps, securities and/or cash may be identified as collateral in accordance with the terms of the swap agreement to provide assets of value and recourse in the event of default. The maximum counterparty credit risk is the net present value of the cash flows to be received from or paid to the counterparty over the term of the swap, to the extent that this amount is beneficial to the Fund, in addition to any related collateral posted to the counterparty by the Fund. This risk may be partially reduced by a master netting arrangement between the Fund and the counterparty. Upon entering into a centrally cleared swap, the Fund is required to deposit with a financial intermediary cash or securities (“initial margin”) in an amount equal to a certain percentage of the notional amount of the swap. Subsequent payments (“variation margin”) are made or received by the Fund dependent upon the daily fluctuations in the value of the swap. In a cleared swap transaction, counterparty risk is minimized as the central clearinghouse acts as the counterparty.
An upfront payment, if any, made by the Fund is recorded as an asset in the Statement of Assets and Liabilities. An upfront payment, if any, received by the Fund is recorded as a liability in the Statement of Assets and Liabilities. Payments received or made at the end of the measurement period are recorded as realized gain or loss in the Statement of Operations.
Interest rate swaps are agreements in which the Fund agrees to pay to the counterparty a fixed rate payment in exchange for the counterparty agreeing to pay to the Fund a variable rate payment, or the Fund agrees to receive from the counterparty a fixed rate payment in exchange for the counterparty agreeing to receive from the Fund a variable rate payment. The payment obligations are based on the notional amount of the swap. For the year ended December 31, 2018, the Fund entered into interest rate swap agreements to gain exposure to different parts of the yield curve while managing overall duration.
There were no open interest rate swap contracts as of December 31, 2018. For the year ended December 31, 2018 the investment in interest rate swap contracts had a total notional amount generally indicative of a range from $0 to $1,700,000.
| | | | |
Deutsche DWS Variable Series II — DWS Multisector Income VIP | | | | | 19 |
Futures Contracts. A futures contract is an agreement between a buyer or seller and an established futures exchange or its clearinghouse in which the buyer or seller agrees to take or make a delivery of a specific amount of a financial instrument at a specified price on a specific date (settlement date). For the year ended December 31, 2018, the Fund entered into interest rate futures to gain exposure to different parts of the yield curve while managing overall duration and fornon-hedging purposes to seek to enhance potential gains.
Upon entering into a futures contract, the Fund is required to deposit with a financial intermediary cash or securities (“initial margin”) in an amount equal to a certain percentage of the face value indicated in the futures contract. Subsequent payments (“variation margin”) are made or received by the Fund dependent upon the daily fluctuations in the value and are recorded for financial reporting purposes as unrealized gains or losses by the Fund. Gains or losses are realized when the contract expires or is closed. Since all futures contracts areexchange-traded, counterparty risk is minimized as the exchange’s clearinghouse acts as the counterparty, and guarantees the futures against default.
Certain risks may arise upon entering into futures contracts, including the risk that an illiquid market will limit the Fund’s ability to close out a futures contract prior to the settlement date and the risk that the futures contract is not well correlated with the security, index or currency to which it relates. Risk of loss may exceed amounts disclosed in the Statement of Assets and Liabilities.
A summary of the open futures contracts as of December 31, 2018 is included in a table following the Fund’s Investment Portfolio. For the year ended December 31, 2018, the investment in futures contracts purchased had a total notional value generally indicative of a range from approximately $801,000 to $2,497,000, and the investment in futures contracts sold had a total notional value generally indicative of a range from approximately $0 to approximately $1,440,000.
Forward Foreign Currency Contracts. A forward foreign currency contract (“forward currency contract”) is a commitment to purchase or sell a foreign currency at the settlement date at a negotiated rate. For the year ended December 31, 2018, the Fund entered into forward currency contracts in order to hedge against anticipated currency market changes and fornon-hedging purposes to seek to enhance potential gains.
Forward currency contracts are valued at the prevailing forward exchange rate of the underlying currencies and unrealized gain (loss) is recorded daily. On the settlement date of the forward currency contract, the Fund records a realized gain or loss equal to the difference between the value of the contract at the time it was opened and the value of the contract at the time it was closed. Certain risks may arise upon entering into forward currency contracts from the potential inability of counterparties to meet the terms of their contracts. The maximum counterparty credit risk to the Fund is measured by the unrealized gain on appreciated contracts. Additionally, when utilizing forward currency contracts to hedge, the Fund gives up the opportunity to profit from favorable exchange rate movements during the term of the contract.
A summary of the open forward currency contracts as of December 31, 2018, is included in a table following the Fund’s Investment Portfolio. For the year ended December 31, 2018, the investment in forward currency contracts short vs. U.S. dollars had a total contract value generally indicative of a range from approximately $582,000 to $1,435,000, and the investment in forward currency contracts long vs. U.S. dollars had a total contract value generally indicative of a range from $0 to approximately $562,000.
The following tables summarize the value of the Fund’s derivative instruments held as of December 31, 2018 and the related location in the accompanying Statement of Assets and Liabilities, presented by primary underlying risk exposure:
| | | | | | | | | | | | |
| Asset Derivatives | | Forward
Contracts | | | Futures
Contracts | | | Total | |
| Interest Rate Contracts (a) | | $ | — | | | $ | 50,711 | | | $ | 50,711 | |
| Foreign Exchange Contracts (b) | | | 12,252 | | | | — | | | | 12,252 | |
| | | $ | 12,252 | | | $ | 50,711 | | | $ | 62,963 | |
Each of the above derivatives is located in the following Statement of Assets and Liabilities accounts:
| (a) | Includes cumulative appreciation of futures contracts as disclosed in the Investment Portfolio. Unsettled variation margin is disclosed separately within the statement of Assets and Liabilities. |
| (b) | Unrealized appreciation on forward foreign currency contracts |
| | | | | | |
| | 20 | | | | | | Deutsche DWS Variable Series II — DWS Multisector Income VIP |
| | | | | | | | | | | | |
| Liability Derivatives | | Forward
Contracts | | | Futures
Contracts | | | Total | |
| Interest Rate Contracts (c) | | $ | — | | | $ | 10,707 | | | $ | 10,707 | |
| Foreign Exchange Contracts (d) | | | 2,478 | | | | — | | | | 2,478 | |
| | | $ | 2,478 | | | $ | 10,707 | | | $ | 13,185 | |
Each of the above derivatives is located in the following Statement of Assets and Liabilities accounts:
| (c) | Includes cumulative depreciation of futures contracts as disclosed in the Investment Portfolio. Unsettled variation margin is disclosed separately within the Statement of Assets and Liabilities. |
| (d) | Unrealized depreciation on forward foreign currency contracts |
Additionally, the amount of unrealized and realized gains and losses on derivative instruments recognized in Fund earnings during the year ended December 31, 2018 and the related location in the accompanying Statement of Operations is summarized in the following tables by primary underlying risk exposure:
| | | | | | | | | | | | | | | | |
| Realized Gain (Loss) | | Forward
Contracts | | | Swap Contracts | | | Futures
Contracts | | | Total | |
| Interest Rate Contracts (e) | | $ | — | | | $ | 956 | | | $ | (66,904 | ) | | $ | (65,948 | ) |
| Foreign Exchange Contracts (f) | | | 26,618 | | | | — | | | | — | | | | 26,618 | |
| | | $ | 26,618 | | | $ | 956 | | | $ | (66,904 | ) | | $ | (39,330 | ) |
Each of the above derivatives is located in the following Statement of Operations accounts:
| (e) | Net realized gain (loss) from swap contracts and futures, respectively |
| (f) | Net realized gain (loss) from forward foreign currency contracts |
| | | | | | | | | | | | |
| Change in Net Unrealized Appreciation (Depreciation) | | Forward
Contracts | | | Futures
Contracts | | | Total | |
| Interest Rate Contracts (g) | | $ | — | | | $ | 43,567 | | | $ | 43,567 | |
| Foreign Exchange Contracts (h) | | | 8,305 | | | | — | | | | 8,305 | |
| | | $ | 8,305 | | | $ | 43,567 | | | $ | 51,872 | |
Each of the above derivatives is located in the following Statement of Operations accounts:
| (g) | Change in net unrealized appreciation (depreciation) on futures |
| (h) | Change in net unrealized appreciation (depreciation) on forward foreign currency contracts |
As of December 31, 2018, the Fund has transactions subject to enforceable master netting agreements which govern the terms of certain transactions, and reduce the counterparty risk associated with such transactions. Master netting agreements allow a Fund to close out and net total exposure to a counterparty in the event of a deterioration in the credit quality or contractual default with respect to all of the transactions with a counterparty. As defined by the master netting agreement, the Fund may have collateral agreements with certain counterparties to mitigate risk. For financial reporting purposes the Statement of Assets and Liabilities generally shows derivatives assets and liabilities on a gross basis, which reflects the full risks and exposures prior to netting. A reconciliation of the gross amounts on the Statement of Assets and Liabilities to the net amounts by a counterparty, including any collateral exposure, is included in the following tables:
| | | | | | | | | | | | | | | | |
| Counterparty | | Gross Amounts
of Assets
Presented in the
Statement of
Assets and
Liabilities | | | Financial
Instruments
and
Derivatives
Available
for Offset | | | Collateral
Received | | | Net Amount of
Derivative
Assets | |
| Australia and New Zealand Banking Group Ltd. | | $ | 8,415 | | | $ | — | | | $ | — | | | $ | 8,415 | |
| Credit Agricole | | | 1,303 | | | | — | | | | — | | | | 1,303 | |
| State Street Bank and Trust | | | 2,534 | | | | — | | | | — | | | | 2,534 | |
| | | $ | 12,252 | | | $ | — | | | $ | — | | | $ | 12,252 | |
| | | | |
Deutsche DWS Variable Series II — DWS Multisector Income VIP | | | | | 21 |
| | | | | | | | | | | | | | | | |
| Counterparty | | Gross Amounts
of Liabilities
Presented in the
Statement of
Assets and
Liabilities | | | Financial
Instruments
and
Derivatives
Available
for Offset | | | Collateral
Pledged | | | Net Amount of
Derivative
Liabilities | |
| Toronto-Dominion Bank | | $ | 2,478 | | | $ | — | | | $ | — | | | $ | 2,478 | |
| | | $ | 2,478 | | | $ | — | | | $ | — | | | $ | 2,478 | |
C. Purchases and Sales of Securities
During the year ended December 31, 2018, purchases and sales of investment securities, excluding short-term investments, were as follows:
| | | | | | | | |
| | | Purchases | | | Sales | |
| Non-U.S. Treasury Obligations | | $ | 5,212,011 | | | $ | 6,007,954 | |
| U.S. Treasury Obligations | | $ | 1,427,568 | | | $ | — | |
D. Related Parties
Management Agreement. Under the Investment Management Agreement with DWS Investment Management Americas, Inc. (formerly Deutsche Investment Management Americas Inc.) (“DIMA” or the “Advisor”), an indirect, wholly owned subsidiary of DWS Group GmbH & Co. KGaA (“DWS Group”), the Advisor directs the investments of the Fund in accordance with its investment objectives, policies and restrictions. The Advisor determines the securities, instruments and other contracts relating to investments to be purchased, sold or entered into by the Fund or delegates such responsibility to the Fund’s subadvisor.
DWS Alternatives Global Limited (formerly Deutsche Alternative Asset Management (Global) Limited), also an indirect, wholly owned subsidiary of DWS Group, serves as subadvisor for the Fund and, as such, provides portfolio manager services to the Fund. Pursuant to a sub-advisory agreement between DIMA and DWS Alternatives Global Limited, DIMA, not the Fund, compensates DWS Alternatives Global Limited for the services it provides to the Fund.
Pursuant to the Investment Management Agreement with the Advisor, the Fund pays a monthly management fee based on the Fund’s average daily net assets, computed and accrued daily and payable monthly, at the following annual rates:
| | | | |
| First $250 million | | | .550 | % |
| Next $750 million | | | .520 | % |
| Next $1.5 billion | | | .500 | % |
| Next $2.5 billion | | | .480 | % |
| Next $2.5 billion | | | .450 | % |
| Next $2.5 billion | | | .430 | % |
| Next $2.5 billion | | | .410 | % |
| Over $12.5 billion | | | .390 | % |
Accordingly, for the year ended December 31, 2018, the fee pursuant to the Investment Management Agreement was equivalent to an annual rate (exclusive of any applicable waivers/reimbursements) of 0.55% of the Fund’s average daily net assets.
For the period from January 1, 2018 through April 30, 2019, the Advisor has contractually agreed to waive its fee and/or reimburse certain operating expenses to the extent necessary to maintain the total annual operating expenses (excluding certain expenses such as extraordinary expenses, taxes, brokerage and interest expense) at 0.65%.
For the year ended December 31, 2018, fees waived and/or expenses reimbursed amounted to $135,937.
Administration Fee. Pursuant to an Administrative Services Agreement, DIMA provides most administrative services to the Fund. For all services provided under the Administrative Services Agreement, the Fund pays DIMA an annual fee (“Administration Fee”) of 0.10% of the Fund’s average daily net assets, computed and accrued daily and payable monthly. For the year ended December 31, 2018, the Administration Fee was $8,851, of which $711 is unpaid.
Service Provider Fees. DWS Service Company (“DSC”), an affiliate of the Advisor, is the transfer agent,dividend-paying agent and shareholder service agent for the Fund. Pursuant to asub-transfer agency
| | | | | | |
| | 22 | | | | | | Deutsche DWS Variable Series II — DWS Multisector Income VIP |
agreement between DSC and DST Systems, Inc. (“DST”), DSC has delegated certain transfer agent,dividend-paying agent and shareholder service agent functions to DST. DSC compensates DST out of the shareholder servicing fee it receives from the Fund. For the year ended December 31, 2018, the amounts charged to the Fund by DSC aggregated $117, of which $19 is unpaid.
Typesetting and Filing Service Fees. Under an agreement with the Fund, DIMA is compensated for providing typesetting and certain regulatory filing services to the Fund. For the year ended December 31, 2018, the amount charged to the Fund by DIMA included in the Statement of Operations under “Reports to shareholders” aggregated $10,993, of which $8,358 is unpaid.
Trustees’ Fees and Expenses. The Fund paid retainer fees to each Trustee not affiliated with the Advisor, plus specified amounts to the Board Chairperson and to each committee Chairperson.
Affiliated Cash Management Vehicles. The Fund may invest uninvested cash balances in DWS Central Cash Management Government Fund and DWS ESG Liquidity Fund, affiliated money market funds which are managed by the Advisor. Each affiliated money market fund is managed in accordance withRule 2a-7 under the 1940 Act, which governs the quality, maturity, diversity and liquidity of instruments in which a money market fund may invest. DWS Central Cash Management Government Fund seeks to maintain a stable net asset value, and DWS ESG Liquidity Fund maintains a floating net asset value. The Fund indirectly bears its proportionate share of the expenses of each affiliated money market fund in which it invests. DWS Central Cash Management Government Fund does not pay the Advisor an investment management fee. To the extent that DWS ESG Liquidity Fund pays an investment management fee to the Advisor, the Advisor will waive an amount of the investment management fee payable to the Advisor by the Fund equal to the amount of the investment management fee payable on the Fund’s assets invested in DWS ESG Liquidity Fund.
Security Lending Fees. Deutsche Bank AG serves as securities lending agent for the Fund. For the year ended December 31, 2018, the Fund incurred securities lending agent fees to Deutsche Bank AG in the amount of $354.
E. Line of Credit
The Fund and other affiliated funds (the “Participants”) share in a $400 million revolving credit facility provided by a syndication of banks. The Fund may borrow for temporary or emergency purposes, including the meeting of redemption requests that otherwise might require the untimely disposition of securities. The Participants are charged an annual commitment fee which is allocated based on net assets, among each of the Participants. Interest is calculated at a rate per annum equal to the sum of the Federal Funds Rate plus 1.25 percent plus if theone-month LIBOR exceeds the Federal Funds Rate, the amount of such excess. The Fund may borrow up to a maximum of 33 percent of its net assets under the agreement. The Fund had no outstanding loans at December 31, 2018.
F. Investing inHigh-Yield Securities
High-yield debt securities or junk bonds are generally regarded as speculative with respect to the issuer’s continuing ability to meet principal and interest payments. The Fund’s performance could be hurt if an issuer of a debt security suffers an adverse change in financial condition that results in the issuer not making timely payments of interest or principal, a security downgrade or an inability to meet a financial obligation.High-yield debt securities’ total return and yield may generally be expected to fluctuate more than the total return and yield ofinvestment-grade debt securities. A real or perceived economic downturn or an increase in market interest rates could cause a decline in the value ofhigh-yield debt securities, result in increased redemptions and/or result in increased portfolio turnover, which could result in a decline in net asset value of the Fund, reduce liquidity for certain investments and/or increase costs.High-yield debt securities are often thinly traded and can be more difficult to sell and value accurately thaninvestment-grade debt securities as there may be no established secondary market. Investments in high yield debt securities could increase liquidity risk for the Fund. In addition, the market forhigh-yield debt securities can experience sudden and sharp volatility which is generally associated more with investments in stocks.
G. Investing in Emerging Markets
Investing in emerging markets may involve special risks and considerations not typically associated with investing in developed markets. These risks include revaluation of currencies, high rates of inflation or deflation, repatriation restrictions on income and capital, and future adverse political, social and economic
| | | | |
Deutsche DWS Variable Series II — DWS Multisector Income VIP | | | | | 23 |
developments. Moreover, securities issued in these markets may be less liquid, subject to government ownership controls or delayed settlements, and may have prices that are more volatile or less easily assessed than those of comparable securities of issuers in developed markets.
H. Ownership of the Fund
At December 31, 2018, one participating insurance company was the owner of record of 10% or more of the total outstanding Class A shares of the Fund, owning 97%.
| | | | | | |
| | 24 | | | | | | Deutsche DWS Variable Series II — DWS Multisector Income VIP |
Report of Independent Registered Public Accounting Firm
To the Board of Trustees of Deutsche DWS Variable Series II and Shareholders of DWS Multisector Income VIP:
Opinion on the Financial Statements
We have audited the accompanying statement of assets and liabilities of DWS Multisector Income VIP (formerly Deutsche Multisector Income VIP) (the “Fund”) (one of the funds constituting Deutsche DWS Variable Series II (formerly Deutsche Variable Series II)) (the “Trust”), including the investment portfolio, as of December 31, 2018, and the related statement of operations for the year then ended, the statements of changes in net assets for each of the two years in the period then ended, the financial highlights for each of the five years in the period then ended and the related notes (collectively referred to as the “financial statements”). In our opinion, the financial statements present fairly, in all material respects, the financial position of the Fund (one of the funds constituting Deutsche DWS Variable Series II) at December 31, 2018, the results of its operations for the year then ended, the changes in its net assets for each of the two years in the period then ended and its financial highlights for each of the five years in the period then ended, in conformity with U.S. generally accepted accounting principles.
Basis for Opinion
These financial statements are the responsibility of the Trust’s management. Our responsibility is to express an opinion on the Fund’s financial statements based on our audits. We are a public accounting firm registered with the Public Company Accounting Oversight Board (United States) (“PCAOB”) and are required to be independent with respect to the Trust in accordance with the U.S. federal securities laws and the applicable rules and regulations of the Securities and Exchange Commission and the PCAOB.
We conducted our audits in accordance with the standards of the PCAOB. Those standards require that we plan and perform the audit to obtain reasonable assurance about whether the financial statements are free of material misstatement, whether due to error or fraud. The Trust is not required to have, nor were we engaged to perform, an audit of the Trust’s internal control over financial reporting. As part of our audits, we are required to obtain an understanding of internal control over financial reporting, but not for the purpose of expressing an opinion on the effectiveness of the Trust’s internal control over financial reporting. Accordingly, we express no such opinion.
Our audits included performing procedures to assess the risks of material misstatement of the financial statements, whether due to error or fraud, and performing procedures that respond to those risks. Such procedures included examining, on a test basis, evidence regarding the amounts and disclosures in the financial statements. Our procedures included confirmation of securities owned as of December 31, 2018, by correspondence with the custodian and brokers. Our audits also included evaluating the accounting principles used and significant estimates made by management, as well as evaluating the overall presentation of the financial statements. We believe that our audits provide a reasonable basis for our opinion.

We have served as the auditor of one or more investment companies in the DWS family of funds since at least 1979, but we are unable to determine the specific year.
Boston, Massachusetts
February 14, 2019
| | | | |
Deutsche DWS Variable Series II — DWS Multisector Income VIP | | | | | 25 |
| | |
| Information About Your Fund’s Expenses | | (Unaudited) |
As an investor of the Fund, you incur two types of costs: ongoing expenses and transaction costs. Ongoing expenses include management fees and other Fund expenses. Examples of transaction costs include contract charges, which are not shown in this section. The following tables are intended to help you understand your ongoing expenses (in dollars) of investing in the Fund and to help you compare these expenses with the ongoing expenses of investing in other mutual funds. In the most recentsix-month period, the Fund limited these expenses; had it not done so, expenses would have been higher. The example in the table is based on an investment of $1,000 invested at the beginning of thesix-month period and held for the entire period (July 1, 2018 to December 31, 2018).
The tables illustrate your Fund’s expenses in two ways:
| – | | Actual Fund Return. This helps you estimate the actual dollar amount of ongoing expenses (but not transaction costs) paid on a $1,000 investment in the Fund using the Fund’s actual return during the period. To estimate the expenses you paid over the period, simply divide your account value by $1,000 (for example, an $8,600 account value divided by $1,000 = 8.6), then multiply the result by the number in the “Expenses Paid per $1,000” line under the share class you hold. |
| – | | Hypothetical 5% Fund Return. This helps you to compare your Fund’s ongoing expenses (but not transaction costs) with those of other mutual funds using the Fund’s actual expense ratio and a hypothetical rate of return of 5% per year before expenses. Examples using a 5% hypothetical Fund return may be found in the shareholder reports of other mutual funds. The hypothetical account values and expenses may not be used to estimate the actual ending account balance or expenses you paid for the period. |
Please note that the expenses shown in these tables are meant to highlight your ongoing expenses only and do not reflect any transaction costs. The “Expenses Paid per $1,000” line of the tables is useful in comparing ongoing expenses only and will not help you determine the relative total expense of owning different funds. If these transaction costs had been included, your costs would have been higher.
| | | | |
| Expenses and Value of a $1,000 Investmentfor the six months ended December 31, 2018 | | | |
| |
| Actual Fund Return | | | Class A | |
| Beginning Account Value 7/1/18 | | $ | 1,000.00 | |
| Ending Account Value 12/31/18 | | $ | 993.60 | |
| Expenses Paid per $1,000* | | $ | 3.27 | |
| |
| Hypothetical 5% Fund Return | | | Class A | |
| Beginning Account Value 7/1/18 | | $ | 1,000.00 | |
| Ending Account Value 12/31/18 | | $ | 1,021.93 | |
| Expenses Paid per $1,000* | | $ | 3.31 | |
| * | Expenses are equal to the Fund’s annualized expense ratio, multiplied by the average account value over the period, multiplied by 184 (the number of days in the most recentsix-month period), then divided by 365. |
| | | | |
| Annualized Expense Ratio | | Class A | |
| Deutsche DWS Variable Series II — DWS Multisector Income VIP | | | .65 | % |
For more information, please refer to the Fund’s prospectus.
These tables do not reflect charges and fees (“contract charges”) associated with the separate account that invests in the Fund or any variable life insurance policy or variable annuity contract for which the Fund is an investment option.
For an analysis of the fees associated with an investment in the Fund or similar funds, please refer to the current and hypothetical expense calculators for Variable Insurance Products which can be found at dws.com/calculators.
| | | | | | |
| | 26 | | | | | | Deutsche DWS Variable Series II — DWS Multisector Income VIP |
| | |
| Tax Information | | (Unaudited) |
Please consult a tax advisor if you have questions about federal or state income tax laws, or on how to prepare your tax returns. If you have specific questions about your account, please contact your insurance provider.
Proxy Voting
The Trust’s policies and procedures for voting proxies for portfolio securities and information about how the Trust voted proxies related to its portfolio securities during the most recent12-month period ended June 30 are available on our Web site — dws.com/en-us/resources/proxy-voting — or on the SEC’s Web site — sec.gov. To obtain a written copy of the Trust’s policies and procedures without charge, upon request, call us toll free at (800)728-3337.
| | | | |
Deutsche DWS Variable Series II — DWS Multisector Income VIP | | | | | 27 |
Advisory Agreement Board Considerations and Fee Evaluation
The Board of Trustees (hereinafter referred to as the “Board” or “Trustees”) approved the renewal of DWS Multisector Income VIP’s (the “Fund”) investment management agreement (the “Agreement”) with DWS Investment Management Americas, Inc. (“DIMA”) andsub-advisory agreement (the“Sub-Advisory Agreement” and together with the Agreement, the “Agreements”) between DIMA and Deutsche Alternative Asset Management (Global) Limited (now known as DWS Alternatives Global Limited) (“DAAM Global”), an affiliate of DIMA, in September 2018.
In terms of the process that the Board followed prior to approving the Agreements, shareholders should know that:
| – | | During the entire process, all of the Fund’s Trustees were independent of DIMA and its affiliates (the “Independent Trustees”). |
| – | | The Board met frequently during the past year to discuss fund matters and dedicated a substantial amount of time to contract review matters. Over the course of several months, the Board’s Contract Committee reviewed extensive materials received from DIMA, independent third parties and independent counsel. These materials included an analysis of the Fund’s performance, fees and expenses, and profitability from a fee consultant retained by the Fund’s Independent Trustees (the “Fee Consultant”). Based on its evaluation of the information provided, the Contract Committee presented its findings and recommendations to the Board. The Board then reviewed the Contract Committee’s findings and recommendations. |
| – | | The Board also received extensive information throughout the year regarding performance of the Fund. |
| – | | The Independent Trustees regularly met privately with counsel to discuss contract review and other matters. In addition, the Independent Trustees were advised by the Fee Consultant in the course of their review of the Fund’s contractual arrangements and considered a comprehensive report prepared by the Fee Consultant in connection with their deliberations. |
| – | | In connection with reviewing the Agreements, the Board also reviewed the terms of the Fund’s distribution agreement, administrative services agreement, transfer agency agreement and other material service agreements. |
In connection with the contract review process, the Contract Committee and the Board considered the factors discussed below, among others. The Board also considered that DIMA and its predecessors have managed the Fund since its inception, and the Board believes that a long-term relationship with a capable, conscientious advisor is in the best interests of the Fund. The Board considered, generally, that shareholders chose to invest or remain invested in the Fund knowing that DIMA managed the Fund. DIMA and DAAM Global are part of DWS Group GmbH & Co. KGaA (“DWS Group”). DWS Group is a global asset management business that offers a wide range of investing expertise and resources, including research capabilities in many countries throughout the world. In 2018, approximately 20% of DWS Group’s shares were sold in an initial public offering, with Deutsche Bank AG owning the remaining shares.
As part of the contract review process, the Board carefully considered the fees and expenses of each DWS fund overseen by the Board in light of the fund’s performance. In many cases, this led to the negotiation and implementation of expense caps. As part of these negotiations, the Board indicated that it would consider relaxing these caps in future years following sustained improvements in performance, among other considerations.
While shareholders may focus primarily on fund performance and fees, the Fund’s Board considers these and many other factors, including the quality and integrity of DIMA’s and DAAM Global’s personnel and administrative support services provided by DIMA, such as back-office operations, fund valuations, and compliance policies and procedures.
Nature, Quality and Extent of Services.The Board considered the terms of the Agreements, including the scope of advisory services provided under the Agreements. The Board noted that, under the Agreements, DIMA and DAAM Global provide portfolio management services to the Fund and that, pursuant to a separate administrative services agreement, DIMA provides administrative services to the Fund. The Board considered the experience and skills of senior management and investment personnel and the resources made available to such personnel. Throughout the course of the year, the Board also received information regarding DIMA’s oversight of fundsub-advisers, including DAAM Global. The Board reviewed the Fund’s performance over short-term and long-term periods and compared those returns to various agreed-upon performance measures, including market index(es) and a peer universe compiled using information supplied
| | | | | | |
| | 28 | | | | | | Deutsche DWS Variable Series II — DWS Multisector Income VIP |
by Morningstar Direct (“Morningstar”), an independent fund data service. The Board also noted that it has put into place a process of identifying “Funds in Review” (e.g., funds performing poorly relative to a peer universe), and receives additional reporting from DIMA regarding such funds and, where appropriate, DIMA’s plans to address underperformance. The Board believes this process is an effective manner of identifying and addressing underperforming funds. Based on the information provided, the Board noted that, for theone-, three- and five-year periods ended December 31, 2017, the Fund’s performance (Class A shares) was in the 1st quartile, 4th quartile and 4th quartile, respectively, of the applicable Morningstar universe (the 1st quartile being the best performers and the 4th quartile being the worst performers). The Board also observed that the Fund has outperformed its benchmark in theone-year period and has underperformed its benchmark in the three- and five-year periods ended December 31, 2017. The Board noted the disappointing investment performance of the Fund in some past periods and continued to discuss with senior management of DIMA and DAAM Global the factors contributing to such underperformance and actions being taken to improve performance. The Board noted certain changes in the Fund’s portfolio management team that were made effective August 1, 2017. The Board observed that the Fund had experienced improved relative performance in 2017. The Board recognized the efforts by DIMA in recent years to enhance its investment platform and improve long-term performance across the DWS fund complex.
Fees and Expenses. The Board considered the Fund’s investment management fee schedule,sub-advisory fee schedule, operating expenses and total expense ratios, and comparative information provided by Broadridge Financial Solutions, Inc. (“Broadridge”) and the Fee Consultant regarding investment management fee rates paid to other investment advisors by similar funds (1st quartile being the most favorable and 4th quartile being the least favorable). With respect to management fees paid to other investment advisors by similar funds, the Board noted that the contractual fee rates paid by the Fund, which include a 0.10% fee paid to DIMA under the Fund’s administrative services agreement, were higher than the median (3rd quartile) of the applicable Broadridge peer group (based on Broadridge data provided as of December 31, 2017). With respect to thesub-advisory fee paid to DAAM Global, the Board noted that the fee is paid by DIMA out of its fee and not directly by the Fund. The Board noted that the Fund’s Class A shares total (net) operating expenses were expected to be lower than the median (2nd quartile) of the applicable Broadridge expense universe (based on Broadridge data provided as of December 31, 2017, and analyzing Broadridge expense universe Class A (net) expenses less any applicable12b-1 fees) (“Broadridge Universe Expenses”). The Board noted that the expense limitation agreed to by DIMA was expected to help the Fund’s total (net) operating expenses remain competitive. The Board considered the Fund’s management fee rate as compared to fees charged by DIMA to comparable DWS U.S. registered funds (“DWS Funds”) and considered differences between the Fund and the comparable DWS Funds. The information requested by the Board as part of its review of fees and expenses also included information about institutional accounts (including anysub-advised funds and accounts) and funds offered primarily to European investors (“DWS Europe Funds”) managed by DWS Group. The Board noted that DIMA indicated that DWS Group does not manage any institutional accounts or DWS Europe Funds comparable to the Fund.
On the basis of the information provided, the Board concluded that management fees were reasonable and appropriate in light of the nature, quality and extent of services provided by DIMA and DAAM Global.
Profitability. The Board reviewed detailed information regarding revenues received by DIMA under the Agreement. The Board considered the estimated costs to DIMA, andpre-tax profits realized by DIMA, from advising the DWS Funds, as well as estimates of thepre-tax profits attributable to managing the Fund in particular. The Board also received information regarding the estimated enterprise-wide profitability of DIMA and its affiliates with respect to all fund services in totality and by fund. The Board and the Fee Consultant reviewed DIMA’s methodology in allocating its costs to the management of the Fund. Based on the information provided, the Board concluded that thepre-tax profits realized by DIMA in connection with the management of the Fund were not unreasonable. The Board also reviewed certain publicly available information regarding the profitability of certain similar investment management firms. The Board noted that, while information regarding the profitability of such firms is limited (and in some cases is not necessarily prepared on a comparable basis), DIMA and its affiliates’ overall profitability with respect to the DWS Funds (after taking into account distribution and other services provided to the funds by DIMA and its affiliates) was lower than the overall profitability levels of most comparable firms for which such data was available.
Economies of Scale. The Board considered whether there are economies of scale with respect to the management of the Fund and whether the Fund benefits from any economies of scale. The Board noted that the Fund’s investment management fee schedule includes fee breakpoints. The Board concluded that the Fund’s fee schedule represents an appropriate sharing between the Fund and DIMA of such economies of scale as may exist in the management of the Fund at current asset levels.
| | | | |
Deutsche DWS Variable Series II — DWS Multisector Income VIP | | | | | 29 |
Other Benefits to DIMA and Its Affiliates. The Board also considered the character and amount of other incidental or“fall-out” benefits received by DIMA and its affiliates, including any fees received by DIMA for administrative services provided to the Fund and any fees received by an affiliate of DIMA for transfer agency services provided to the Fund. The Board also considered benefits to DIMA related to brokerage and soft-dollar allocations, including allocating brokerage to pay for research generated by parties other than the executing broker dealers, which pertain primarily to funds investing in equity securities. In addition, the Board considered the incidental public relations benefits to DIMA related to DWS Funds advertising and cross-selling opportunities among DIMA products and services. The Board considered these benefits in reaching its conclusion that the Fund’s management fees were reasonable.
Compliance. The Board considered the significant attention and resources dedicated by DIMA to its compliance processes in recent years. The Board noted in particular (i) the experience, seniority and time commitment of the individuals serving as DIMA’s and the Fund’s chief compliance officers and (ii) the substantial commitment of resources by DIMA and its affiliates to compliance matters, including the retention of compliance personnel.
Based on all of the information considered and the conclusions reached, the Board unanimously determined that the continuation of the Agreements is in the best interests of the Fund. In making this determination, the Board did not give particular weight to any single factor identified above. The Board considered these factors over the course of numerous meetings, certain of which were in executive session with only the Independent Trustees and counsel present. It is possible that individual Independent Trustees may have weighed these factors differently in reaching their individual decisions to approve the continuation of the Agreements.
| | | | | | |
| | 30 | | | | | | Deutsche DWS Variable Series II — DWS Multisector Income VIP |
Board Members and Officers
The following table presents certain information regarding the Board Members and Officers of the Fund. Each Board Member’s year of birth is set forth in parentheses after his or her name. Unless otherwise noted, (i) each Board Member has engaged in the principal occupation(s) noted in the table for at least the most recent five years, although not necessarily in the same capacity; and (ii) the address of each Independent Board Member is c/o Keith R. Fox, DWS Funds Board Chair, c/o Thomas R. Hiller, Ropes & Gray LLP, Prudential Tower, 800 Boylston Street, Boston, MA02199-3600. Except as otherwise noted below, the term of office for each Board Member is until the election and qualification of a successor, or until such Board Member sooner dies, resigns, is removed or as otherwise provided in the governing documents of the Fund. Because the Fund does not hold an annual meeting of shareholders, each Board Member will hold office for an indeterminate period. The Board Members may also serve in similar capacities with other funds in the fund complex.
| | | | | | | | |
| Independent Board Members | | | | | | |
Name, Year of Birth,
Position with the Fund and
Length of Time Served1 | | Business Experience and Directorships During the Past Five Years | | Number of
Funds in
DWS Fund
Complex
Overseen | | | Other
Directorships
Held by Board
Member
|
Keith R. Fox, CFA (1954) Chairperson since 2017, and Board Member since 1996 | | Managing General Partner, Exeter Capital Partners (a series of private investment funds) (since 1986). Directorships: Progressive International Corporation (kitchen goods importer and distributor); The Kennel Shop (retailer); former Chairman, National Association of Small Business Investment Companies; former Directorships: BoxTop Media Inc. (advertising); Sun Capital Advisers Trust (mutual funds) (2011–2012) | | | 82 | | | — |
John W. Ballantine (1946) Board Member since 1999 | | Retired; formerly, Executive Vice President and Chief Risk Management Officer, First Chicago NBD Corporation/The First National Bank of Chicago (1996–1998); Executive Vice President and Head of International Banking (1995–1996); former Directorships: Director and former Chairman of the Board, Healthways, Inc.2 (population well-being and wellness services) (2003–2014); Stockwell Capital Investments PLC (private equity); Enron Corporation; FNB Corporation; Tokheim Corporation; First Oak Brook Bancshares, Inc. and Oak Brook Bank; Prisma Energy International; Public Radio International. Not-for-Profit Director, Trustee: Palm Beach Civic Association; Window to the World Communications (public media); Harris Theater for Music and Dance (Chicago); Life Director of Hubbard Street Dance Chicago | | | 82 | | | Portland
General
Electric2
(utility
company)
(2003–
present) |
Henry P. Becton, Jr. (1943) Board Member since 1990 | | Vice Chair and former President, WGBH Educational Foundation. Directorships: Public Radio International; Public Radio Exchange (PRX); The Pew Charitable Trusts (charitable organization); Massachusetts Humane Society; Overseer of the New England Conservatory; former Directorships: Becton Dickinson and Company2 (medical technology company); Belo Corporation2 (media company); The PBS Foundation; Association of Public Television Stations; Boston Museum of Science; American Public Television; Concord Academy; New England Aquarium; Mass. Corporation for Educational Telecommunications; Committee for Economic Development; Public Broadcasting Service; Connecticut College; North Bennett Street School (Boston); American Documentary, Inc. (public media) | | | 82 | | | — |
Dawn-Marie Driscoll (1946) Board Member since 1987 | | Emeritus Executive Fellow, Center for Business Ethics, Bentley University; formerly: President, Driscoll Associates (consulting firm); Partner, Palmer & Dodge (law firm) (1988–1990); Vice President of Corporate Affairs and General Counsel, Filene’s (retail) (1978–1988). Directorships: Advisory Board, Center for Business Ethics, Bentley University; Trustee and former Chairman of the Board, Southwest Florida Community Foundation (charitable organization); former Directorships: ICI Mutual Insurance Company (2007–2015); Sun Capital Advisers Trust (mutual funds) (2007–2012), Investment Company Institute (audit, executive, nominating committees) and Independent Directors Council (governance, executive committees) | | | 82 | | | — |
Paul K. Freeman* (1950) Board Member since 1993 | | Consultant, WorldBank/Inter-American Development Bank; Independent Directors Council (former chair); Investment Company Institute (executive committee); Adjunct Professor, University of Denver Law School (2017–present); formerly: Chairman of Education Committee of Independent Directors Council; Project Leader, International Institute for Applied Systems Analysis (1998–2001); Chief Executive Officer, The Eric Group, Inc. (environmental insurance) (1986–1998); Directorships: Knoebel Institute for Healthy Aging, University of Denver (2017–present); former Directorships: Prisma Energy International; Denver Zoo Foundation (2012–2018) | | | 82 | | | — |
| | | | |
Deutsche DWS Variable Series II — DWS Multisector Income VIP | | | | | 31 |
| | | | | | | | |
Name, Year of Birth,
Position with the Fund and
Length of Time Served1 | | Business Experience and Directorships During the Past Five Years | | Number of
Funds in
DWS Fund
Complex
Overseen | | | Other
Directorships
Held by Board
Member
|
Richard J. Herring (1946) Board Member since 1990 | | Jacob Safra Professor of International Banking and Professor of Finance, The Wharton School, University of Pennsylvania (since July 1972); Director, The Wharton Financial Institutions Center (since 1994); formerly: Vice Dean and Director, Wharton Undergraduate Division (1995–2000) and Director, The Lauder Institute of International Management Studies (2000–2006); Member FDIC Systemic Risk Advisory Committee since 2011, member Systemic Risk Council since 2012 and member of the Advisory Board at the Yale Program on Financial Stability since 2013; Formerly Co-Chair of the Shadow Financial Regulatory Committee (2003–2015), Executive Director of The Financial Economists Roundtable (2008–2015), Director of The Thai Capital Fund (2007–2013), Director of The Aberdeen Singapore Fund (2007–2018), and Nonexecutive Director of Barclays Bank DE (2010–2018) | | | 82 | | | Director,
Aberdeen
Japan Fund
(since 2007) |
William McClayton (1944) Board Member since 2004 | | Private equity investor (since October 2009); previously, Managing Director, Diamond Management & Technology Consultants, Inc. (global consulting firm) (2001–2009); Directorship: Board of Managers, YMCA of Metropolitan Chicago; formerly: Senior Partner, Arthur Andersen LLP (accounting) (1966–2001); Trustee, Ravinia Festival | | | 82 | | | — |
Rebecca W. Rimel (1951) Board Member since 1995 | | President, Chief Executive Officer and Director, The Pew Charitable Trusts (charitable organization) (1994–present); formerly: Executive Vice President, The Glenmede Trust Company (investment trust and wealth management) (1983–2004); Board Member, Investor Education (charitable organization) (2004–2005); Trustee, Executive Committee, Philadelphia Chamber of Commerce (2001–2007); Director, Viasys Health Care2 (January 2007–June 2007); Trustee, Thomas Jefferson Foundation (charitable organization) (1994–2012) | | | 82 | | | Director,
Becton
Dickinson
and
Company2
(medical
technology
company)
(2012–
present);
Director,
BioTelemetry
Inc.2(health
care) (2009–
present) |
William N. Searcy, Jr. (1946) Board Member since 1993 | | Private investor since October 2003; formerly: Pension & Savings Trust Officer, Sprint Corporation2(telecommunications) (November 1989–September 2003); Trustee, Sun Capital Advisers Trust (mutual funds) (1998–2012) | | | 82 | | | — |
Jean Gleason Stromberg (1943) Board Member since 1997 | | Retired. Formerly, Consultant (1997–2001); Director, Financial Markets U.S. Government Accountability Office (1996–1997); Partner, Norton Rose Fulbright, L.L.P. (law firm) (1978–1996); former Directorships: The William and Flora Hewlett Foundation (charitable organization) (2000–2015); Service Source, Inc. (nonprofit), Mutual Fund Directors Forum (2002–2004), American Bar Retirement Association (funding vehicle for retirement plans) (1987–1990 and 1994–1996) | | | 82 | | | — |
| | |
| Officers4 | | |
Name, Year of Birth, Position with the Fund and Length of Time Served5 | | Business Experience and Directorships During the Past Five Years |
Hepsen Uzcan6 (1974) President and Chief Executive Officer, 2017–present Assistant Secretary, 2013–present | | Managing Director,3 DWS; Secretary, DWS USA Corporation (since March 2018); Assistant Secretary, DWS Distributors, Inc. (since June 25, 2018); Director and Vice President, DWS Service Company (since June 25, 2018); Assistant Secretary, DWS Investment Management Americas, Inc. (since June 25, 2018); and Director and President, DB Investment Managers, Inc. (since June 25, 2018); formerly: Vice President for the Deutsche funds (2016–2017) |
John Millette8(1962) Vice President and Secretary, 1999–present | | Director,3DWS; Chief Legal Officer, DWS Investment Management Americas, Inc. (2015–present); and Director and Vice President, DWS Trust Company (2016–present); formerly: Secretary, Deutsche Investment Management Americas Inc. (2015–2017) |
Diane Kenneally8,9 (1966) Treasurer and Chief Financial Officer since 2018 | | Director,3 DWS; formerly: Assistant Treasurer for the DWS funds (2007–2018) |
Caroline Pearson8(1962) Chief Legal Officer, 2010–present | | Managing Director,3DWS; formerly: Secretary, Deutsche AM Distributors, Inc. (2002–2017); and Secretary, Deutsche AM Service Company (2010–2017) |
| | | | | | |
| | 32 | | | | | | Deutsche DWS Variable Series II — DWS Multisector Income VIP |
| | |
Name, Year of Birth, Position with the Fund and Length of Time Served5 | | Business Experience and Directorships During the Past Five Years |
Scott D. Hogan8(1970) Chief Compliance Officer, 2016–present | | Director,3DWS |
Wayne Salit7(1967) Anti-Money Laundering Compliance Officer, 2014–present | | Director,3 Deutsche Bank; and AML Officer, DWS Trust Company; formerly: Managing Director, AML Compliance Officer at BNY Mellon (2011–2014); and Director, AML Compliance Officer at Deutsche Bank (2004–2011) |
Sheila Cadogan8(1966) Assistant Treasurer, 2017–present | | Director,3DWS; Director and Vice President, DWS Trust Company (since 2018) |
Paul Antosca8(1957) Assistant Treasurer, 2007–present | | Director,3DWS |
| 1 | The length of time served represents the year in which the Board Member joined the board of one or more DWS funds currently overseen by the Board. |
| 2 | A publicly held company with securities registered pursuant to Section 12 of the Securities Exchange Act of 1934. |
| 3 | Executive title, not a board directorship. |
| 4 | As a result of their respective positions held with the Advisor or its affiliates, these individuals are considered “interested persons” of the Advisor within the meaning of the 1940 Act. Interested persons receive no compensation from the Fund. |
| 5 | The length of time served represents the year in which the officer was first elected in such capacity for one or more DWS funds. |
| 6 | Address: 345 Park Avenue, New York, NY 10154. |
| 7 | Address: 60 Wall Street, New York, NY 10005. |
| 8 | Address: One International Place, Boston, MA 02110. |
| 9 | Appointed Treasurer and Chief Financial Officer effective July 2, 2018. |
| * | Paul K. Freeman retired from the Board effective December 31, 2018. |
The Fund’s Statement of Additional Information (“SAI”) includes additional information about the Board Members. The SAI is available, without charge, upon request. If you would like to request a copy of the SAI, you may do so by calling the followingtoll-free number:(800) 728-3337.
| | | | |
Deutsche DWS Variable Series II — DWS Multisector Income VIP | | | | | 33 |
Notes
Notes
| | |
| | |
VS2MSI-2 (R-025836-8 2/19) | | |
December 31, 2018
Annual Report
Deutsche DWS Variable Series II
(formerly Deutsche Variable Series II)
DWS Small Mid Cap Growth VIP
(formerly Deutsche Small Mid Cap Growth VIP)
Beginning on January 1, 2021, as permitted by regulations adopted by the Securities and Exchange Commission, you may not be receiving paper copies of the Fund’s shareholder reports from the insurance company that offers your contract unless you specifically request paper copies from your insurance company or from your financial intermediary. Instead, the shareholder reports will be made available on a Web site, and your insurance company will notify you by mail each time a report is posted and provide you with a Web site link to access the report. Instructions for requesting paper copies will be provided by your insurance company.
If you already elected to receive shareholder reports electronically, you will not be affected by this change and you need not take any action. You may elect to receive shareholder reports and other communications from your insurance company electronically by following the instructions provided by your insurance company.
You may elect to receive all future reports in paper free of charge from your insurance company. If your insurance company informs you that future reports will be delivered via Web access, you can inform your insurance company that you wish to continue receiving paper copies of your shareholder reports by following the instructions provided by your insurance company.

Contents
This report must be preceded or accompanied by a prospectus. To obtain an additional prospectus or summary prospectus, if available, call (800)728-3337 or your financial representative. We advise you to consider the Fund’s objectives, risks, charges and expenses carefully before investing. The summary prospectus and prospectus contain this and other important information about the Fund. Please read the prospectus carefully before you invest.
Stocks may decline in value. Smaller and medium company stocks tend to be more volatile than large company stocks. Investing in derivatives entails special risks relating to liquidity, leverage and credit that may reduce returns and/or increase volatility. The Fund may lend securities to approved institutions. Please read the prospectus for details.
The brand DWS represents DWS Group GmbH & Co. KGaA and any of its subsidiaries such as DWS Distributors, Inc. which offers investment products or DWS Investment Management Americas, Inc. and RREEF America L.L.C. which offer advisory services.
DWS Distributors, Inc., 222 South Riverside Plaza, Chicago, IL 60606, (800)621-1148
NOT FDIC/NCUA INSURED NO BANK GUARANTEE MAY LOSE VALUE NOT A DEPOSIT
NOT INSURED BY ANY FEDERAL GOVERNMENT AGENCY
| | | | | | |
| | 2 | | | | | | Deutsche DWS Variable Series II — DWS Small Mid Cap Growth VIP |
| | |
| Performance Summary | | December 31, 2018 (Unaudited) |
Fund performance shown is historical, assumes reinvestment of all dividend and capital gain distributions and does not guarantee future results. Investment return and principal value fluctuate with changing market conditions so that, when redeemed, shares may be worth more or less than their original cost. Current performance may be lower or higher than the performance data quoted. Please contact your participating insurance company for the Fund’s most recentmonth-end performance. Performance does not reflect charges and fees (“contract charges”) associated with the separate account that invests in the Fund or any variable life insurance policy or variable annuity contract for which the Fund is an investment option. These charges and fees will reduce returns.
The gross expense ratio of the Fund, as stated in the fee table of the prospectus dated May 1, 2018 is 0.75% for Class A shares and may differ from the expense ratio disclosed in the Financial Highlights table in this report.
Generally accepted accounting principles require adjustments to be made to the net assets of the Fund at period end for financial reporting purposes only, and as such, the total return based on the unadjusted net asset value per share may differ from the total return reported in the financial highlights.
Growth of an Assumed $10,000 Investment in DWS Small Mid Cap Growth VIP
| | |
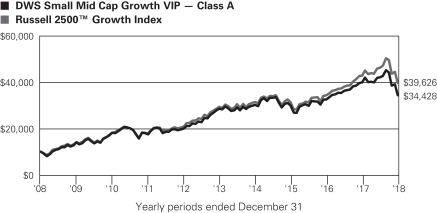 | | The Russell 2500TM Growth Index is an unmanaged index that measures the performance of the small- to mid-cap growth segment of the U.S. equity universe. It includes those Russell 2500 companies with higher price-to-book ratios and higher forecasted growth values. Index returns do not reflect any fees or expenses and it is not possible to invest directly into an index. |
| | | | | | | | | | |
| Comparative Results | | | | | | | | | | |
| | | | |
| DWS Small Mid Cap Growth VIP | | 1-Year | | 3-Year | | 5-Year | | 10-Year |
| Class A | | Growth of $10,000 | | $8,641 | | $11,510 | | $12,057 | | $34,428 |
| | | Average annual total return | | –13.59% | | 4.80% | | 3.81% | | 13.16% |
| Russell 2500 Growth Index | | Growth of $10,000 | | $9,253 | | $12,637 | | $13,503 | | $39,626 |
| | | Average annual total return | | –7.47% | | 8.11% | | 6.19% | | 14.76% |
The growth of $10,000 is cumulative.
| | | | |
Deutsche DWS Variable Series II — DWS Small Mid Cap Growth VIP | | | | | 3 |
| | |
| Management Summary | | December 31, 2018 (Unaudited) |
For the 12-month period ended December 31, 2018, the Fund returned –13.59% (Class A shares, unadjusted for contract charges), compared with the –7.47% return of the Russell 2500™ Growth Index.
During most of the past year, financial markets seemed to rise above trade uncertainty, Brexit concerns, Federal Reserve policy changes and increased volatility, as investors focused on steady economic expansion, earnings growth and the tailwind from federal tax reform. However, as the 12-month period progressed, tailwinds turned to headwinds for the U.S. small- and mid-cap markets. Oil prices peaked in early October before worries regarding a possible oversupply of crude oil as well as general “risk-off” sentiment pervaded the market in the fourth quarter. For the Russell 2500 Growth Index, only three sectors posted positive returns for the 12-month period as macroeconomic concerns and uncertainty over monetary and fiscal policy negatively impacted performance.
The portfolio’s underperformance derived in part from sector allocation, as an underweight in information technology and an overweight in energy detracted from returns. In addition, stock selection within information technology, energy and consumer staples weighed on performance. The top individual contributors to performance during the period were the health care provider Molina Healthcare, Inc. and the software company Five9, Inc. Molina effectively executed its cost-savings plan, which translated to better than expected profits. Five9 continued to gain market share as its contact center infrastructure migrates from on-premises to cloud-based. The largest individual detractors from performance were the industrial firm Rush Enterprises, Inc. and the construction materials company Eagle Materials, Inc. Shares of Rush Enterprises, a leading dealer of commercial vehicles, declined on concerns that the truck replacement cycle may be extended due to delivery delays. Eagle Materials, a diversified producer of basic building products, underperformed as the company faced weakness in U.S. housing data and adverse weather that negatively impacted sales.
We continue to position the Fund for sustained economic recovery and remain focused on our bottom-up stock selection process. We maintain a long-term perspective, investing in quality small- and mid-cap growth companies whose shares trade at attractive valuations, with strong management teams that align shareholders’ interests with their own.
Peter Barsa, Director
Michael A. Sesser, CFA, Director
Portfolio Managers
The views expressed reflect those of the portfolio management team only through the end of the period of the report as stated on the cover. The management team’s views are subject to change at any time based on market and other conditions and should not be construed as a recommendation. Past performance is no guarantee of future results. Current and future portfolio holdings are subject to risk.
Terms to Know
TheRussell 2500TM Growth Index is an unmanaged index that measures the performance of the small- to midcap growth segment of the U.S. equity universe. It includes those Russell 2500 companies with higher price-to-book ratios and higher forecasted growth values. Index returns do not reflect any fees or expenses and it is not possible to invest directly into an index.
“Overweight” means that the Fund holds a higher weighting in a given sector or security than the benchmark.“Underweight” means that the Fund holds a lower weighting.
Contribution anddetraction incorporate both a stock’s total return and its weighting in the Fund.
| | | | | | |
| | 4 | | | | | | Deutsche DWS Variable Series II — DWS Small Mid Cap Growth VIP |
| | |
| Portfolio Summary | | (Unaudited) |
| | | | | | | | |
| Asset Allocation (As a % of Investment Portfolio excluding Securities Lending Collateral) | | 12/31/18 | | | 12/31/17 | |
| Common Stocks | | | 93% | | | | 97% | |
| Cash Equivalents | | | 6% | | | | 2% | |
| Convertible Preferred Stock | | | 1% | | | | 1% | |
| | | | 100% | | | | 100% | |
| | |
Sector Diversification
(As a % of Investment Portfolio excluding Cash Equivalents and Securities Lending Collateral) | | 12/31/18 | | | 12/31/17 | |
| Health Care | | | 25% | | | | 21% | |
| Information Technology | | | 22% | | | | 23% | |
| Industrials | | | 18% | | | | 19% | |
| Consumer Discretionary | | | 16% | | | | 15% | |
| Financials | | | 7% | | | | 6% | |
| Materials | | | 4% | | | | 7% | |
| Real Estate | | | 3% | | | | 3% | |
| Energy | | | 2% | | | | 2% | |
| Consumer Staples | | | 2% | | | | 3% | |
| Communication Services | | | 1% | | | | 1% | |
| | | | 100% | | | | 100% | |
Portfolio holdings and characteristics are subject to change.
For more complete details about the Fund’s investment portfolio, see page 6.
Following the Fund’s fiscal first and thirdquarter-end, a complete portfolio holdings listing is filed with the SEC on FormN-Q or Form N-PORT (available for filings after March 31, 2019). The Fund’s Form N-Q or Form N-PORT will be available on the SEC’s Web site at sec.gov. The Fund’s portfolio holdings are also posted on dws.com from time to time. Please see the Fund’s current prospectus for more information.
| | | | |
Deutsche DWS Variable Series II — DWS Small Mid Cap Growth VIP | | | | | 5 |
| | |
| Investment Portfolio | | December 31, 2018 |
| | | | | | | | |
| | | Shares | | | Value ($) | |
| Common Stocks 93.4% | |
| Communication Services 1.1% | |
Entertainment | | | | | | | | |
| | |
Cinemark Holdings, Inc. | | | 13,014 | | | | 465,901 | |
| | |
Take-Two Interactive Software, Inc.* | | | 2,302 | | | | 236,968 | |
| | | | | | | | |
| | | | | | | 702,869 | |
| Consumer Discretionary 15.2% | |
Auto Components 1.2% | | | | | | | | |
| | |
Gentherm, Inc.* | | | 7,798 | | | | 311,764 | |
| | |
Tenneco, Inc. | | | 16,869 | | | | 462,042 | |
| | | | | | | | |
| | | | | | | 773,806 | |
|
Diversified Consumer Services 2.4% | |
| | |
Bright Horizons Family Solutions, Inc.* | | | 9,008 | | | | 1,003,941 | |
| | |
ServiceMaster Global Holdings, Inc.* | | | 13,978 | | | | 513,552 | |
| | | | | | | | |
| | | | | | | 1,517,493 | |
|
Hotels, Restaurants & Leisure 1.6% | |
| | |
Hilton Grand Vacations, Inc.* | | | 15,442 | | | | 407,514 | |
| | |
Jack in the Box, Inc. | | | 8,357 | | | | 648,754 | |
| | | | | | | | |
| | | | | | | 1,056,268 | |
|
Household Durables 3.7% | |
| | |
Helen of Troy Ltd.* | | | 6,902 | | | | 905,404 | |
| | |
iRobot Corp.* (a) | | | 13,414 | | | | 1,123,289 | |
| | |
TopBuild Corp.* | | | 7,521 | | | | 338,445 | |
| | | | | | | | |
| | | | | | | 2,367,138 | |
|
Internet & Direct Marketing Retail 1.1% | |
| | |
GrubHub, Inc.* | | | 3,879 | | | | 297,946 | |
| | |
Shutterfly, Inc.* | | | 10,991 | | | | 442,498 | |
| | | | | | | | |
| | | | | | | 740,444 | |
|
Leisure Products 0.4% | |
YETI Holdings, Inc.* (a) | | | 17,273 | | | | 256,331 | |
|
Specialty Retail 4.0% | |
| | |
Burlington Stores, Inc.* | | | 7,180 | | | | 1,167,971 | |
| | |
Camping World Holdings,
Inc. “A” (a) | | | 30,031 | | | | 344,455 | |
| | |
Tailored Brands, Inc. | | | 26,951 | | | | 367,612 | |
| | |
The Children’s Place, Inc. | | | 7,548 | | | | 679,999 | |
| | | | | | | | |
| | | | | | | 2,560,037 | |
|
Textiles, Apparel & Luxury Goods 0.8% | |
Carter’s, Inc. | | | 6,302 | | | | 514,369 | |
|
| Consumer Staples 1.8% | |
Food & Staples Retailing 1.1% | |
Casey’s General Stores, Inc. | | | 5,389 | | | | 690,547 | |
|
Food Products 0.2% | |
SunOpta, Inc.* | | | 44,516 | | | | 172,277 | |
|
Household Products 0.5% | |
Spectrum Brands Holdings, Inc. | | | 7,393 | | | | 312,354 | |
|
| Energy 2.1% | |
Energy Equipment & Services 1.3% | |
| | |
Dril-Quip, Inc.* | | | 16,509 | | | | 495,765 | |
| | |
Oil States International, Inc.* | | | 23,188 | | | | 331,125 | |
| | | | | | | | |
| | | | | | | 826,890 | |
| | | | | | | | |
| | | Shares | | | Value ($) | |
|
Oil, Gas & Consumable Fuels 0.8% | |
| | |
California Resources Corp.* | | | 22,013 | | | | 375,102 | |
| | |
Contango Oil & Gas Co.* | | | 41,553 | | | | 135,047 | |
| | | | | | | | |
| | | | | | | 510,149 | |
|
| Financials 6.3% | |
Banks 4.0% | |
| | |
Eagle Bancorp., Inc.* | | | 9,086 | | | | 442,579 | |
| | |
FCB Financial Holdings, Inc. “A”* | | | 17,761 | | | | 596,414 | |
| | |
Pinnacle Financial Partners, Inc. | | | 7,734 | | | | 356,538 | |
| | |
South State Corp. | | | 8,497 | | | | 509,395 | |
| | |
SVB Financial Group* | | | 3,490 | | | | 662,821 | |
| | | | | | | | |
| | | | | | | 2,567,747 | |
|
Capital Markets 1.3% | |
| | |
Lazard Ltd. “A” | | | 14,525 | | | | 536,118 | |
| | |
Moelis & Co. “A” | | | 9,674 | | | | 332,592 | |
| | | | | | | | |
| | | | | | | 868,710 | |
|
Consumer Finance 1.0% | |
Green Dot Corp. “A”* | | | 7,735 | | | | 615,087 | |
|
| Health Care 22.5% | |
Biotechnology 7.9% | |
| | |
Acceleron Pharma, Inc.* | | | 4,129 | | | | 179,818 | |
| | |
Alkermes PLC* | | | 11,391 | | | | 336,148 | |
| | |
Amicus Therapeutics, Inc.* | | | 18,313 | | | | 175,439 | |
| | |
Arena Pharmaceuticals, Inc.* | | | 7,580 | | | | 295,241 | |
| | |
Bluebird Bio, Inc.* | | | 2,454 | | | | 243,437 | |
| | |
Emergent BioSolutions, Inc.* | | | 12,303 | | | | 729,322 | |
| | |
Heron Therapeutics, Inc.* | | | 26,667 | | | | 691,742 | |
| | |
Ligand Pharmaceuticals, Inc.* | | | 4,929 | | | | 668,865 | |
| | |
Neurocrine Biosciences, Inc.* | | | 10,796 | | | | 770,942 | |
| | |
Retrophin, Inc.* | | | 44,541 | | | | 1,007,963 | |
| | | | | | | | |
| | | | | | | 5,098,917 | |
|
Health Care Equipment & Supplies 4.0% | |
| | |
Cardiovascular Systems, Inc.* | | | 23,977 | | | | 683,105 | |
| | |
Globus Medical, Inc. “A”* | | | 8,079 | | | | 349,659 | |
| | |
iRhythm Technologies, Inc.* | | | 2,213 | | | | 153,759 | |
| | |
Masimo Corp.* | | | 5,350 | | | | 574,430 | |
| | |
Merit Medical Systems, Inc.* | | | 6,389 | | | | 356,570 | |
| | |
Natus Medical, Inc.* | | | 13,683 | | | | 465,632 | |
| | | | | | | | |
| | | | | | | 2,583,155 | |
|
Health Care Providers & Services 8.0% | |
| | |
AMN Healthcare Services, Inc.* | | | 16,063 | | | | 910,130 | |
| | |
BioScrip, Inc.* | | | 257,972 | | | | 920,960 | |
| | |
Molina Healthcare, Inc.* | | | 12,438 | | | | 1,445,544 | |
| | |
Providence Service Corp.* | | | 14,969 | | | | 898,439 | |
| | |
RadNet, Inc.* | | | 58,745 | | | | 597,437 | |
| | |
Tivity Health, Inc.* | | | 14,185 | | | | 351,930 | |
| | | | | | | | |
| | | | | | | 5,124,440 | |
|
Health Care Technology 1.6% | |
athenahealth, Inc.* | | | 2,411 | | | | 318,083 | |
| | |
HMS Holdings Corp.* | | | 26,025 | | | | 732,083 | |
| | | | | | | | |
| | | | | | | 1,050,166 | |
|
Pharmaceuticals 1.0% | |
| | |
Assertio Therapeutics, Inc.* | | | 12,006 | | | | 43,342 | |
| | |
Avadel Pharmaceuticals PLC (ADR)* | | | 24,612 | | | | 63,499 | |
The accompanying notes are an integral part of the financial statements.
| | | | | | |
| | 6 | | | | | | Deutsche DWS Variable Series II — DWS Small Mid Cap Growth VIP |
| | | | | | | | |
| | | Shares | | | Value ($) | |
| | |
Pacira Pharmaceuticals, Inc.* | | | 12,502 | | | | 537,836 | |
| | | | | | | | |
| | | | | | | 644,677 | |
|
| Industrials 17.5% | |
Aerospace & Defense 1.0% | |
HEICO Corp. | | | 8,035 | | | | 622,552 | |
|
Building Products 3.2% | |
| | |
A.O. Smith Corp. | | | 16,215 | | | | 692,380 | |
| | |
Allegion PLC | | | 11,168 | | | | 890,201 | |
| | |
Fortune Brands Home & Security, Inc. | | | 12,443 | | | | 472,710 | |
| | | | | | | | |
| | | | | | | 2,055,291 | |
|
Commercial Services & Supplies 3.3% | |
| | |
Advanced Disposal Services, Inc.* | | | 39,685 | | | | 950,059 | |
| | |
MSA Safety, Inc. | | | 3,811 | | | | 359,263 | |
| | |
The Brink’s Co. | | | 13,160 | | | | 850,794 | |
| | | | | | | | |
| | | | | | | 2,160,116 | |
|
Construction & Engineering 0.7% | |
MasTec, Inc.* (a) | | | 10,594 | | | | 429,693 | |
|
Electrical Equipment 1.3% | |
Thermon Group Holdings, Inc.* | | | 41,624 | | | | 844,135 | |
|
Machinery 2.8% | |
| | |
Chart Industries, Inc.* | | | 9,241 | | | | 600,942 | |
| | |
Hillenbrand, Inc. | | | 11,100 | | | | 421,023 | |
| | |
IDEX Corp. | | | 2,649 | | | | 334,463 | |
| | |
Kennametal, Inc. | | | 14,028 | | | | 466,852 | |
| | | | | | | | |
| | | | | | | 1,823,280 | |
|
Professional Services 1.5% | |
| | |
Kforce, Inc. | | | 23,789 | | | | 735,556 | |
| | |
Mistras Group, Inc.* | | | 15,322 | | | | 220,330 | |
| | | | | | | | |
| | | | | | | 955,886 | |
|
Trading Companies & Distributors 3.7% | |
| | |
H&E Equipment Services, Inc. | | | 28,818 | | | | 588,464 | |
| | |
Rush Enterprises, Inc. “A” | | | 35,301 | | | | 1,217,178 | |
| | |
Titan Machinery, Inc.* | | | 42,049 | | | | 552,944 | |
| | | | | | | | |
| | | | | | | 2,358,586 | |
|
| Information Technology 20.7% | |
Communications Equipment 0.7% | |
Lumentum Holdings, Inc.* | | | 10,532 | | | | 442,449 | |
|
Electronic Equipment, Instruments & Components 1.5% | |
| | |
Anixter International, Inc.* | | | 7,752 | | | | 421,011 | |
| | |
Cognex Corp. | | | 8,337 | | | | 322,392 | |
| | |
IPG Photonics Corp.* | | | 1,994 | | | | 225,900 | |
| | | | | | | | |
| | | | | | | 969,303 | |
|
IT Services 4.5% | |
| | |
Broadridge Financial Solutions, Inc. | | | 11,030 | | | | 1,061,638 | |
| | |
MAXIMUS, Inc. | | | 9,060 | | | | 589,715 | |
| | |
WEX, Inc.* | | | 4,517 | | | | 632,651 | |
| | |
WNS Holdings Ltd. (ADR)* | | | 15,577 | | | | 642,707 | |
| | | | | | | | |
| | | | | | | 2,926,711 | |
|
Semiconductors & Semiconductor Equipment 3.4% | |
| | |
Advanced Energy Industries, Inc.* | | | 13,373 | | | | 574,103 | |
| | |
Advanced Micro Devices, Inc.* | | | 22,933 | | | | 423,343 | |
| | |
Cabot Microelectronics Corp. | | | 3,315 | | | | 316,085 | |
| | |
Cypress Semiconductor Corp. | | | 35,012 | | | | 445,353 | |
| | |
Entegris, Inc. | | | 14,392 | | | | 401,465 | |
| | | | | | | | |
| | | | | | | 2,160,349 | |
| | | | | | | | |
| | | Shares | | | Value ($) | |
| | |
Software 10.6% | | | | | | | | |
| | |
2U, Inc.* | | | 4,424 | | | | 219,961 | |
| | |
Aspen Technology, Inc.* | | | 12,688 | | | | 1,042,700 | |
| | |
Cision Ltd.* | | | 52,770 | | | | 617,409 | |
| | |
Envestnet, Inc.* | | | 10,432 | | | | 513,150 | |
| | |
Five9, Inc.* | | | 20,949 | | | | 915,890 | |
| | |
Proofpoint, Inc.* | | | 8,009 | | | | 671,235 | |
| | |
QAD, Inc. “A” | | | 16,918 | | | | 665,385 | |
| | |
Tyler Technologies, Inc.* | | | 6,582 | | | | 1,223,067 | |
| | |
Varonis Systems, Inc.* | | | 17,800 | | | | 941,620 | |
| | | | | | | | |
| | | | | | | 6,810,417 | |
| | |
| Materials 3.6% | | | | | | | | |
Chemicals 0.9% | | | | | | | | |
Trinseo SA | | | 12,784 | | | | 585,251 | |
| | |
Construction Materials 0.9% | | | | | | | | |
Eagle Materials, Inc. | | | 10,034 | | | | 612,375 | |
| | |
Containers & Packaging 0.6% | | | | | | | | |
Berry Global Group, Inc.* | | | 8,183 | | | | 388,938 | |
| | |
Metals & Mining 1.2% | | | | | | | | |
| | |
Cleveland-Cliffs, Inc.* | | | 71,240 | | | | 547,836 | |
| | |
First Quantum Minerals Ltd. | | | 26,721 | | | | 216,085 | |
| | | | | | | | |
| | | | | | | 763,921 | |
| | |
| Real Estate 2.6% | | | | | | | | |
Equity Real Estate Investment Trusts (REITs) | |
| | |
Americold Realty Trust | | | 9,400 | | | | 240,076 | |
| | |
National Storage Affiliates Trust | | | 24,731 | | | | 654,382 | |
| | |
SBA Communications Corp. * | | | 2,141 | | | | 346,607 | |
| | |
Urban Edge Properties | | | 27,384 | | | | 455,122 | |
| | | | | | | | |
| | | | | | | | 1,696,187 | |
Total Common Stocks (Cost $51,485,155) | | | | 60,159,311 | |
|
| Convertible Preferred Stock 0.7% | |
| Health Care | |
| | |
Providence Service Corp., 5.5% (b)
(Cost $283,300) | | | 2,833 | | | | 426,371 | |
|
| Securities Lending Collateral 3.2% | |
| | |
DWS Government & Agency Securities Portfolio “DWS Government Cash Institutional Shares”, 2.29% (c) (d)
(Cost $2,032,950) | | | 2,032,950 | | | | 2,032,950 | |
| | |
| Cash Equivalents 6.0% | | | | | | | | |
| | |
DWS Central Cash Management Government Fund, 2.41% (c) (Cost $3,874,651) | | | 3,874,651 | | | | 3,874,651 | |
| | |
| | | % of Net
Assets | | | Value ($) | |
Total Investment Portfolio
(Cost $57,676,056) | | | 103.3 | | | | 66,493,283 | |
| Other Assets and Liabilities, Net | | | (3.3 | ) | | | (2,119,166 | ) |
| Net Assets | | | 100.0 | | | | 64,374,117 | |
The accompanying notes are an integral part of the financial statements.
| | | | |
Deutsche DWS Variable Series II — DWS Small Mid Cap Growth VIP | | | | | 7 |
A summary of the Fund’s transactions with affiliated investments during the year ended December 31, 2018 are as follows:
| | | | | | | | | | | | | | | | | | | | | | | | | | | | | | | | |
Value ($) at
12/31/2017 | | Purchases
Cost ($) | | | Sales
Proceeds ($) | | | Net
Realized
Gain/
(Loss) ($) | | | Net Change in
Unrealized
Appreciation
(Depreciation) ($) | | | Income ($) | | | Capital
Gain
Distribu-
tions ($) | | | Number of
Shares at
12/31/2018 | | | Value ($)
at
12/31/2018 | |
Securities Lending Collateral 3.2% | |
DWS Government & Agency Securities Portfolio “DWS Government Cash Institutional Shares”, 2.29% (c) (d) | |
| 3,961,099 | | | — | | | | 1,928,149 | (e) | | | — | | | | — | | | | 49,053 | | | | — | | | | 2,032,950 | | | | 2,032,950 | |
Cash Equivalents 6.0% | |
DWS Central Cash Management Government Fund, 2.41% (c) | |
| 1,762,858 | | | 16,441,823 | | | | 14,330,030 | | | | — | | | | — | | | | 50,358 | | | | — | | | | 3,874,651 | | | | 3,874,651 | |
| 5,723,957 | | | 16,441,823 | | | | 16,258,179 | | | | — | | | | — | | | | 99,411 | | | | — | | | | 5,907,601 | | | | 5,907,601 | |
| * | Non-income producing security. |
| (a) | All or a portion of these securities were on loan. In addition, “Other Assets and Liabilities, Net” may include pending sales that are also on loan. The value of securities loaned at December 31, 2018 amounted to $1,994,879, which is 3.1% of net assets. |
| (b) | Investment was valued using significant unobservable inputs. |
| (c) | Affiliated fund managed by DWS Investment Management Americas, Inc. The rate shown is the annualizedseven-day yield at period end. |
| (d) | Represents collateral held in connection with securities lending. Income earned by the Fund is net of borrower rebates. |
| (e) | Represents the net increase (purchase cost) or decrease (sales proceeds) in the amount invested for the year ended December 31, 2018. |
ADR: American Depositary Receipt
Fair Value Measurements
Various inputs are used in determining the value of the Fund’s investments. These inputs are summarized in three broad levels. Level 1 includes quoted prices in active markets for identical securities. Level 2 includes other significant observable inputs (including quoted prices for similar securities, interest rates, prepayment speeds and credit risk). Level 3 includes significant unobservable inputs (including the Fund’s own assumptions in determining the fair value of investments). The level assigned to the securities valuations may not be an indication of the risk or liquidity associated with investing in those securities.
The following is a summary of the inputs used as of December 31, 2018 in valuing the Fund’s investments. For information on the Fund’s policy regarding the valuation of investments, please refer to the Security Valuation section of Note A in the accompanying Notes to Financial Statements.
| | | | | | | | | | | | | | | | |
| Assets | | Level 1 | | | Level 2 | | | Level 3 | | | Total | |
| Common Stocks (f) | | $ | 60,159,311 | | | $ | — | | | $ | — | | | $ | 60,159,311 | |
| Convertible Preferred Stock | | | — | | | | — | | | | 426,371 | | | | 426,371 | |
| Short-Term Investments (f) | | | 5,907,601 | | | | — | | | | — | | | | 5,907,601 | |
| Total | | $ | 66,066,912 | | | $ | — | | | $ | 426,371 | | | $ | 66,493,283 | |
| (f) | See Investment Portfolio for additional detailed categorizations. |
The accompanying notes are an integral part of the financial statements.
| | | | | | |
| | 8 | | | | | | Deutsche DWS Variable Series II — DWS Small Mid Cap Growth VIP |
Statement of Assets and Liabilities
| | | | |
| as of December 31, 2018 | | | | |
| |
| Assets | | | | |
Investments in non-affiliated securities, at value (cost $51,768,455) — including $1,994,879 of securities loaned | | $ | 60,585,682 | |
Investment in DWS Government & Agency Securities Portfolio (cost $2,032,950)* | | | 2,032,950 | |
Investment in DWS Central Cash Management Government Fund (cost $3,874,651) | | | 3,874,651 | |
Cash | | | 10,000 | |
Foreign currency, at value (cost $82) | | | 78 | |
Receivable for Fund shares sold | | | 3,288 | |
Dividends receivable | | | 14,511 | |
Interest receivable | | | 14,812 | |
Other assets | | | 1,784 | |
Total assets | | | 66,537,756 | |
| |
| Liabilities | | | | |
Payable upon return of securities loaned | | | 2,032,950 | |
Payable for Fund shares redeemed | | | 9,536 | |
Accrued management fee | | | 25,398 | |
Accrued Trustees’ fees | | | 1,522 | |
Other accrued expenses and payables | | | 94,233 | |
Total liabilities | | | 2,163,639 | |
Net assets, at value | | $ | 64,374,117 | |
| |
| Net Assets Consist of | | | | |
Distributable earnings (loss) | | | 17,238,373 | |
Paid-in capital | | | 47,135,744 | |
Net assets, at value | | $ | 64,374,117 | |
| |
| Net Asset Value | | | | |
| |
Net Asset Value, offering and redemption price per share ($64,374,117 ÷ 5,077,014 outstanding shares of beneficial interest, no par value, unlimited number of shares authorized) | | $ | 12.68 | |
| * | Represents collateral on securities loaned. |
Statement of Operations
| | | | |
| for the year ended December 31, 2018 | |
| |
| Investment Income | | | | |
| Income: | | | | |
Dividends (net of foreign taxes withheld of $31) | | $ | 481,654 | |
Income distributions — DWS Central Cash Management Government Fund | | | 50,358 | |
Securities lending income, net of borrower rebates | | | 49,053 | |
Total income | | | 581,065 | |
| Expenses: | | | | |
Management fee | | | 431,200 | |
Administration fee | | | 78,400 | |
Services to Shareholders | | | 844 | |
Custodian fee | | | 6,777 | |
Professional fees | | | 78,022 | |
Reports to shareholders | | | 28,214 | |
Trustees’ fees and expenses | | | 5,259 | |
Other | | | 7,389 | |
Total expenses before expense reductions | | | 636,105 | |
Expense reductions | | | (6,672 | ) |
Total expenses after expense reductions | | | 629,433 | |
Net investment income (loss) | | | (48,368 | ) |
| |
Realized and Unrealized Gain (Loss) | | | | |
Net realized gain (loss) from: | | | | |
| Investments | | | 8,988,112 | |
Foreign currency | | | 1,291 | |
| | | | 8,989,403 | |
Change in net unrealized appreciation (depreciation) on: | | | | |
Investments | | | (19,054,036 | ) |
| Foreign currency | | | (4 | ) |
| | | | (19,054,040 | ) |
| Net gain (loss) | | | (10,064,637 | ) |
| Net increase (decrease) in net assets resulting from operations | | $ | (10,113,005 | ) |
The accompanying notes are an integral part of the financial statements.
| | | | |
Deutsche DWS Variable Series II — DWS Small Mid Cap Growth VIP | | | | | 9 |
Statements of Changes in Net Assets
| | | | | | | | |
| | | Years Ended December 31, | |
| Increase (Decrease) in Net Assets | | 2018 | | | 2017 | |
Operations: | | | | | | | | |
Net investment income (loss) | | $ | (48,368 | ) | | $ | (87,390 | ) |
Net realized gain (loss) | | | 8,989,403 | | | | 25,564,282 | |
Change in net unrealized appreciation (depreciation) | | | (19,054,040 | ) | | | (2,783,953 | ) |
Net increase (decrease) in net assets resulting from operations | | | (10,113,005 | ) | | | 22,692,939 | |
Distributions to shareholders: | | | | | | | | |
Class A | | | (25,334,744 | ) | | | (6,576,947 | )* |
Fund share transactions: | | | | | | | | |
Class A | | | | | | | | |
Proceeds from shares sold | | | 6,446,792 | | | | 3,919,157 | |
Reinvestment of distributions | | | 25,334,744 | | | | 6,576,947 | |
Payments for shares redeemed | | | (9,303,196 | ) | | | (67,645,663 | ) |
Net increase (decrease) in net assets from Class A share transactions | | | 22,478,340 | | | | (57,149,559 | ) |
Increase (decrease) in net assets | | | (12,969,409 | ) | | | (41,033,567 | ) |
Net assets at beginning of period | | | 77,343,526 | | | | 118,377,093 | |
Net assets at end of period | | $ | 64,374,117 | | | $ | 77,343,526 | ** |
| | |
Other Information | | | | | | | | |
Class A | | | | | | | | |
Shares outstanding at beginning of period | | | 3,525,232 | | | | 6,244,931 | |
Shares sold | | | 381,309 | | | | 194,850 | |
Shares issued to shareholders in reinvestment of distributions | | | 1,711,807 | | | | 336,589 | |
Shares redeemed | | | (541,334 | ) | | | (3,251,138 | ) |
Net increase (decrease) in Class A shares | | | 1,551,782 | | | | (2,719,699 | ) |
Shares outstanding at end of period | | | 5,077,014 | | | | 3,525,232 | |
| * | Includes distributions from net investment income of $124,128 and distributions from net realized gains of $6,452,819. |
| ** | Includes undistributed net investment income of $0. |
The accompanying notes are an integral part of the financial statements.
| | | | | | |
| | 10 | | | | | | Deutsche DWS Variable Series II — DWS Small Mid Cap Growth VIP |
Financial Highlights
| | | | | | | | | | | | | | | | | | | | |
| | | Years Ended December 31, | |
| Class A | | 2018 | | | 2017 | | | 2016 | | | 2015 | | | 2014 | |
| | | | | |
| Selected Per Share Data | | | | | | | | | | | | | | | | | | | | |
| Net asset value, beginning of period | | $ | 21.94 | | | $ | 18.96 | | | $ | 20.90 | | | $ | 22.83 | | | $ | 21.59 | |
| Income (loss) from investment operations: | | | | | | | | | | | | | | | | | | | | |
| | | | | |
Net investment income (loss)a | | | (.01 | ) | | | (.02 | ) | | | .02 | | | | (.04 | ) | | | (.02 | ) |
Net realized and unrealized gain (loss) | | | (1.92 | ) | | | 4.08 | | | | 1.64 | | | | (.00 | ) | | | 1.26 | |
Total from investment operations | | | (1.93 | ) | | | 4.06 | | | | 1.66 | | | | (.04 | ) | | | 1.24 | |
| Less distributions from: | | | | | | | | | | | | | | | | | | | | |
| | | | | |
Net investment income | | | — | | | | (.02 | ) | | | — | | | | — | | | | — | |
Net realized gains | | | (7.33 | ) | | | (1.06 | ) | | | (3.60 | ) | | | (1.89 | ) | | | — | |
Total distributions | | | (7.33 | ) | | | (1.08 | ) | | | (3.60 | ) | | | (1.89 | ) | | | — | |
| Net asset value, end of period | | $ | 12.68 | | | $ | 21.94 | | | $ | 18.96 | | | $ | 20.90 | | | $ | 22.83 | |
| Total Return (%) | | | (13.59 | )b | | | 22.12 | | | | 9.08 | | | | (.90 | ) | | | 5.74 | |
| | | | | |
| Ratios to Average Net Assets and Supplemental Data | | | | | | | | | | | | | | | | | | | | |
| Net assets, end of period ($ millions) | | | 64 | | | | 77 | | | | 118 | | | | 135 | | | | 172 | |
| Ratio of expenses before expense reductions (%)c | | | .81 | | | | .75 | | | | .75 | | | | .72 | | | | .73 | |
| Ratio of expenses after expense reductions (%)c | | | .80 | | | | .75 | | | | .75 | | | | .72 | | | | .73 | |
| Ratio of net investment income (loss) (%) | | | (.06 | ) | | | (.08 | ) | | | .11 | | | | (.19 | ) | | | (.11 | ) |
| Portfolio turnover rate (%) | | | 32 | | | | 32 | | | | 28 | | | | 42 | | | | 44 | |
| a | Based on average shares outstanding during the period. |
| b | Total return would have been lower had certain expenses not been reduced. |
| c | Expense ratio does not reflect charges and fees associated with the separate account that invests in the Fund or any variable life insurance policy or variable annuity contract for which the Fund is an investment option. |
The accompanying notes are an integral part of the financial statements.
| | | | |
Deutsche DWS Variable Series II — DWS Small Mid Cap Growth VIP | | | | | 11 |
| | |
| Notes to Financial Statements | | |
A. Organization and Significant Accounting Policies
DWS Small Mid Cap Growth VIP (formerly Deutsche Small Mid Cap Growth VIP) (the “Fund”) is a diversified series of Deutsche DWS Variable Series II (formerly Deutsche Variable Series II) (the “Trust”), which is registered under the Investment Company Act of 1940, as amended (the “1940 Act”), as anopen-end management investment company organized as a Massachusetts business trust.
The Fund’s financial statements are prepared in accordance with accounting principles generally accepted in the United States of America (“U.S. GAAP”) which require the use of management estimates. Actual results could differ from those estimates. The Fund qualifies as an investment company under Topic 946 of Accounting Standards Codification of U.S. GAAP. The policies described below are followed consistently by the Fund in the preparation of its financial statements.
In October 2018, the Securities and Exchange Commission adopted amendments to certain disclosure requirements in Securities Act Release No. 33-10532, Disclosure Update and Simplification, which is intended to facilitate the disclosure of information to investors and simplify compliance without significantly altering the total mix of information provided to investors. Effective with the current reporting period, the Fund adopted the amendments with the impacts being that the Fund is no longer required to present components of distributable earnings on the Statement of Assets and Liabilities or the sources of distributable earnings and the amount of undistributed net investment income on the Statements of Changes in Net Assets.
Security Valuation. Investments are stated at value determined as of the close of regular trading on the New York Stock Exchange on each day the exchange is open for trading.
Various inputs are used in determining the value of the Fund’s investments. These inputs are summarized in three broad levels. Level 1 includes quoted prices in active markets for identical securities. Level 2 includes other significant observable inputs (including quoted prices for similar securities, interest rates, prepayment speeds and credit risk). Level 3 includes significant unobservable inputs (including the Fund’s own assumptions in determining the fair value of investments). The level assigned to the securities valuations may not be an indication of the risk or liquidity associated with investing in those securities.
Equity securities are valued at the most recent sale price or official closing price reported on the exchange (U.S. or foreign) orover-the-counter market on which they trade. Securities for which no sales are reported are valued at the calculated mean between the most recent bid and asked quotations on the relevant market or, if a mean cannot be determined, at the most recent bid quotation. Equity securities are generally categorized as Level 1.
Investments inopen-end investment companies are valued at their net asset value each business day and are categorized as Level 1.
Securities and other assets for which market quotations are not readily available or for which the above valuation procedures are deemed not to reflect fair value are valued in a manner that is intended to reflect their fair value as determined in accordance with procedures approved by the Board and are generally categorized as Level 3. In accordance with the Fund’s valuation procedures, factors considered in determining value may include, but are not limited to, the type of the security; the size of the holding; the initial cost of the security; the existence of any contractual restrictions on the security’s disposition; the price and extent of public trading in similar securities of the issuer or of comparable companies; quotations or evaluated prices frombroker-dealers and/or pricing services; information obtained from the issuer, analysts, and/or the appropriate stock exchange (forexchange-traded securities); an analysis of the company’s or issuer’s financial statements; an evaluation of the forces that influence the issuer and the market(s) in which the security is purchased and sold; and with respect to debt securities, the maturity, coupon, creditworthiness, currency denomination and the movement of the market in which the security is normally traded. The value determined under these procedures may differ from published values for the same securities.
Disclosure about the classification of fair value measurements is included in a table following the Fund’s Investment Portfolio.
Foreign Currency Translations. The books and records of the Fund are maintained in U.S. dollars. Investment securities and other assets and liabilities denominated in a foreign currency are translated into U.S. dollars at the prevailing exchange rates at period end. Purchases and sales of investment securities, income and expenses are translated into U.S. dollars at the prevailing exchange rates on the respective dates of the transactions.
| | | | | | |
| | 12 | | | | | | Deutsche DWS Variable Series II — DWS Small Mid Cap Growth VIP |
Net realized and unrealized gains and losses on foreign currency transactions represent net gains and losses between trade and settlement dates on securities transactions, the acquisition and disposition of foreign currencies, and the difference between the amount of net investment income accrued and the U.S. dollar amount actually received. The portion of both realized and unrealized gains and losses on investments that results from fluctuations in foreign currency exchange rates is not separately disclosed but is included with net realized and unrealized gain/appreciation and loss/depreciation on investments.
Securities Lending. Deutsche Bank AG, as lending agent, lends securities of the Fund to certain financial institutions under the terms of its securities lending agreement. During the term of the loans, the Fund continues to receive interest and dividends generated by the securities and to participate in any changes in their market value. The Fund requires the borrowers of the securities to maintain collateral with the Fund consisting of either cash or liquid, unencumbered assets having a value at least equal to the value of the securities loaned. When the collateral falls below specified amounts, the lending agent will use its best effort to obtain additional collateral on the next business day to meet required amounts under the securities lending agreement. As of period end, any securities on loan were collateralized by cash. During the year ended December 31, 2018, the Fund invested the cash collateral into a joint trading account in affiliated money market funds managed by DWS Investment Management Americas, Inc. As of December 31, 2018, the Fund invested the cash collateral in DWS Government & Agency Securities Portfolio. DWS Investment Management Americas, Inc. receives a management/administration fee (0.12% annualized effective rate as of December 31, 2018) on the cash collateral invested in DWS Government & Agency Securities Portfolio. The Fund receives compensation for lending its securities either in the form of fees or by earning interest on invested cash collateral net of borrower rebates and fees paid to a lending agent. Either the Fund or the borrower may terminate the loan at any time, and the borrower, after notice, is required to return borrowed securities within a standard time period. There may be risks of delay and costs in recovery of securities or even loss of rights in the collateral should the borrower of the securities fail financially. If the Fund is not able to recover securities lent, the Fund may sell the collateral and purchase a replacement investment in the market, incurring the risk that the value of the replacement security is greater than the value of the collateral. The Fund is also subject to all investment risks associated with the reinvestment of any cash collateral received, including, but not limited to, interest rate, credit and liquidity risk associated with such investments.
As of December 31, 2018, the Fund had securities on loan, which were classified as common stock in the Investment Portfolio. The value of the related collateral exceeded the value of the securities loaned at period end. As of period end, the remaining contractual maturity of the collateral agreements were overnight and continuous.
Federal Income Taxes. The Fund’s policy is to comply with the requirements of the Internal Revenue Code, as amended, which are applicable to regulated investment companies, and to distribute all of its taxable income to its shareholders.
The Fund has reviewed the tax positions for the open tax years as of December 31, 2018 and has determined that no provision for income tax and/or uncertain tax positions is required in the Fund’s financial statements. The Fund’s federal tax returns for the prior three fiscal years remain open subject to examination by the Internal Revenue Service.
Distribution of Income and Gains. Distributions from net investment income of the Fund, if any, are declared and distributed to shareholders annually. Net realized gains from investment transactions, in excess of available capital loss carryforwards, would be taxable to the Fund if not distributed and, therefore, will be distributed to shareholders at least annually. The Fund may also make additional distributions for tax purposes if necessary.
The timing and characterization of certain income and capital gain distributions are determined annually in accordance with federal tax regulations which may differ from accounting principles generally accepted in the United States of America. These differences primarily relate to certain securities sold at a loss. As a result, net investment income (loss) and net realized gain (loss) on investment transactions for a reporting period may differ significantly from distributions during such period. Accordingly, the Fund may periodically make reclassifications among certain of its capital accounts without impacting the net asset value of the Fund.
At December 31, 2018, the Fund’s components of distributable earnings on a tax basis were as follows:
| | | | |
| Undistributed long-term capital gains | | $ | 8,742,232 | |
| Net unrealized appreciation (depreciation) on investments | | $ | 8,496,145 | |
| | | | |
Deutsche DWS Variable Series II — DWS Small Mid Cap Growth VIP | | | | | 13 |
At December 31, 2018, the aggregate cost of investments for federal income tax purposes was $57,997,138. The net unrealized appreciation for all investments based on tax cost was $8,496,145. This consisted of aggregate gross unrealized appreciation for all investments in which there was an excess of value over tax cost of $15,613,579 aggregate gross unrealized depreciation for all investments in which was an excess of tax cost over value of $7,117,434.
In addition, the tax character of distributions paid by the Fund is summarized as follows:
| | | | | | | | |
| | | Years Ended December 31, | |
| | | 2018 | | | 2017 | |
| Distributions from ordinary income* | | $ | 1,616,576 | | | $ | 124,128 | |
| Distributions from long-term capital gains | | $ | 23,718,168 | | | $ | 6,452,819 | |
| * | For tax purposes, short-term capital gain distributions are considered ordinary income distributions. |
Expenses. Expenses of the Trust arising in connection with a specific fund are allocated to that fund. Other Trust expenses which cannot be directly attributed to a fund are apportioned among the funds in the Trust based upon the relative net assets or other appropriate measures.
Contingencies. In the normal course of business, the Fund may enter into contracts with service providers that contain general indemnification clauses. The Fund’s maximum exposure under these arrangements is unknown, as this would involve future claims that may be made against the Fund that have not yet been made. However, based on experience, the Fund expects the risk of loss to be remote.
Other. Investment transactions are accounted for on a trade date plus one basis for daily net asset value calculations. However, for financial reporting purposes, investment transactions are reported on trade date. Interest income is recorded on the accrual basis. Dividend income is recorded on theex-dividend date net of foreign withholding taxes. Realized gains and losses from investment transactions are recorded on an identified cost basis. Proceeds from litigation payments, if any, are included in net realized gain (loss) from investments.
B. Purchases and Sales of Securities
During the year ended December 31, 2018, purchases and sales of investment transactions (excludingshort-term investments) aggregated $23,655,787 and $27,697,820, respectively.
C. Related Parties
Management Agreement. Under the Investment Management Agreement with DWS Investment Management Americas, Inc. (formerly Deutsche Investment Management Americas Inc.) (“DIMA” or the “Advisor”), an indirect, wholly owned subsidiary of DWS Group GmbH & Co. KGaA (“DWS Group”), the Advisor directs the investments of the Fund in accordance with its investment objectives, policies and restrictions. The Advisor determines the securities, instruments and other contracts relating to investments to be purchased, sold or entered into by the Fund.
Pursuant to the Investment Management Agreement with the Advisor, the Fund pays a monthly management fee based on the Fund’s average daily net assets, computed and accrued daily and payable monthly, at the following annual rates:
| | | | |
| First $250 million | | | .550 | % |
| Next $750 million | | | .525 | % |
| Over $1 billion | | | .500 | % |
Accordingly, for the year ended December 31, 2018, the fee pursuant to the Investment Management Agreement was equivalent to an annual rate (exclusive of any applicable waivers/reimbursements) of 0.55% of the Fund’s average daily net assets.
For the period from January 1, 2018 through September 30, 2018, the Advisor had contractually agreed to waive its fees and/or reimburse certain operating expenses to the extent necessary to maintain the total annual operating expenses (excluding certain expenses such as extraordinary expenses, taxes, brokerage and interest expense) of Class A at 0.84%.
Effective October 1, 2018 through September 30, 2019, the Advisor has contractually agreed to waive its fees and/or reimburse certain operating expenses to the extent necessary to maintain the total annual operating expenses (excluding certain expenses such as extraordinary expenses, taxes, brokerage and interest expense) of Class A at 0.81%.
| | | | | | |
| | 14 | | | | | | Deutsche DWS Variable Series II — DWS Small Mid Cap Growth VIP |
For the year ended December 31, 2018, fees waived and/or expenses reimbursed were $6,672.
Administration Fee. Pursuant to an Administrative Services Agreement, DIMA provides most administrative services to the Fund. For all services provided under the Administrative Services Agreement, the Fund pays DIMA an annual fee (“Administration Fee”) of 0.10% of the Fund’s average daily net assets, computed and accrued daily and payable monthly. For the year ended December 31, 2018, the Administration Fee was $78,400, of which $5,724 is unpaid.
Service Provider Fees. DWS Service Company (“DSC”), an affiliate of the Advisor, is the transfer agent,dividend-paying agent and shareholder service agent for the Fund. Pursuant to asub-transfer agency agreement between DSC and DST Systems, Inc. (“DST”), DSC has delegated certain transfer agent,dividend-paying agent and shareholder service agent functions to DST. DSC compensates DST out of the shareholder servicing fee it receives from the Fund. For the year ended December 31, 2018, the amounts charged to the Fund by DSC aggregated $392, of which $64 is unpaid.
Typesetting and Filing Service Fees. Under an agreement with the Fund, DIMA is compensated for providing certainpre-press and regulatory filing services to the Fund. For the year ended December 31, 2018, the amount charged to the Fund by DIMA included in the Statement of Operations under “Reports to shareholders” aggregated $9,232, of which $6,057 is unpaid.
Trustees’ Fees and Expenses. The Fund paid retainer fees to each Trustee not affiliated with the Advisor, plus specified amounts to the Board Chairperson and to each committee Chairperson.
Affiliated Cash Management Vehicles. The Fund may invest uninvested cash balances in DWS Central Cash Management Government Fund and DWS ESG Liquidity Fund, affiliated money market funds which are managed by the Advisor. Each affiliated money market fund is managed in accordance withRule 2a-7 under the 1940 Act, which governs the quality, maturity, diversity and liquidity of instruments in which a money market fund may invest. DWS Central Cash Management Government Fund seeks to maintain a stable net asset value, and DWS ESG Liquidity Fund maintains a floating net asset value. The Fund indirectly bears its proportionate share of the expenses of each affiliated money market fund in which it invests. DWS Central Cash Management Government Fund does not pay the Advisor an investment management fee. To the extent that DWS ESG Liquidity Fund pays an investment management fee to the Advisor, the Advisor will waive an amount of the investment management fee payable to the Advisor by the Fund equal to the amount of the investment management fee payable on the Fund’s assets invested in DWS ESG Liquidity Fund.
Securities Lending Agent Fees. Deutsche Bank AG serves as securities lending agent for the Fund. For the year ended December 31, 2018, the Fund incurred securities lending agent fees to Deutsche Bank AG in the amount of $3,692.
D. Ownership of the Fund
At December 31, 2018, one participating insurance company was owner of record of 10% or more of the total outstanding Class A shares of the Fund, owning 92%.
E. Line of Credit
The Fund and other affiliated funds (the “Participants”) share in a $400 million revolving credit facility provided by a syndication of banks. The Fund may borrow for temporary or emergency purposes, including the meeting of redemption requests that otherwise might require the untimely disposition of securities. The Participants are charged an annual commitment fee which is allocated based on net assets, among each of the Participants. Interest is calculated at a rate per annum equal to the sum of the Federal Funds Rate plus 1.25 percent plus if theone-month LIBOR exceeds the Federal Funds Rate the amount of such excess. The Fund may borrow up to a maximum of 33 percent of its net assets under the agreement. The Fund had no outstanding loans at December 31, 2018.
| | | | |
Deutsche DWS Variable Series II — DWS Small Mid Cap Growth VIP | | | | | 15 |
Report of Independent Registered Public Accounting Firm
To the Board of Trustees of Deutsche DWS Variable Series II and Shareholders of DWS Small Mid Cap Growth VIP:
Opinion on the Financial Statements
We have audited the accompanying statement of assets and liabilities of DWS Small Mid Cap Growth VIP (formerly Deutsche Small Mid Cap Growth VIP) (the “Fund”) (one of the funds constituting Deutsche DWS Variable Series II (formerly Deutsche Variable Series II)) (the “Trust”), including the investment portfolio, as of December 31, 2018, and the related statement of operations for the year then ended, the statements of changes in net assets for each of the two years in the period then ended, the financial highlights for each of the five years in the period then ended and the related notes (collectively referred to as the “financial statements”). In our opinion, the financial statements present fairly, in all material respects, the financial position of the Fund (one of the funds constituting Deutsche DWS Variable Series II) at December 31, 2018, the results of its operations for the year then ended, the changes in its net assets for each of the two years in the period then ended and its financial highlights for each of the five years in the period then ended, in conformity with U.S. generally accepted accounting principles.
Basis for Opinion
These financial statements are the responsibility of the Trust’s management. Our responsibility is to express an opinion on the Fund’s financial statements based on our audits. We are a public accounting firm registered with the Public Company Accounting Oversight Board (United States) (“PCAOB”) and are required to be independent with respect to the Trust in accordance with the U.S. federal securities laws and the applicable rules and regulations of the Securities and Exchange Commission and the PCAOB.
We conducted our audits in accordance with the standards of the PCAOB. Those standards require that we plan and perform the audit to obtain reasonable assurance about whether the financial statements are free of material misstatement, whether due to error or fraud. The Trust is not required to have, nor were we engaged to perform, an audit of the Trust’s internal control over financial reporting. As part of our audits, we are required to obtain an understanding of internal control over financial reporting, but not for the purpose of expressing an opinion on the effectiveness of the Trust’s internal control over financial reporting. Accordingly, we express no such opinion.
Our audits included performing procedures to assess the risks of material misstatement of the financial statements, whether due to error or fraud, and performing procedures that respond to those risks. Such procedures included examining, on a test basis, evidence regarding the amounts and disclosures in the financial statements. Our procedures included confirmation of securities owned as of December 31, 2018, by correspondence with the custodian and brokers. Our audits also included evaluating the accounting principles used and significant estimates made by management, as well as evaluating the overall presentation of the financial statements. We believe that our audits provide a reasonable basis for our opinion.

We have served as the auditor of one or more investment companies in the DWS family of funds since at least 1979, but we are unable to determine the specific year.
Boston, Massachusetts
February 14, 2019
| | | | | | |
| | 16 | | | | | | Deutsche DWS Variable Series II — DWS Small Mid Cap Growth VIP |
| | |
| Information About Your Fund’s Expenses | | (Unaudited) |
As an investor of the Fund, you incur two types of costs: ongoing expenses and transaction costs. Ongoing expenses include management fees and other Fund expenses. Examples of transaction costs include contract charges, which are not shown in this section. The following tables are intended to help you understand your ongoing expenses (in dollars) of investing in the Fund and to help you compare these expenses with the ongoing expenses of investing in other mutual funds. In the most recent six-month period, the Fund limited these expenses; had it not done so, expenses would have been higher. The example in the table is based on an investment of $1,000 invested at the beginning of thesix-month period and held for the entire period (July 1, 2018 to December 31, 2018).
The tables illustrate your Fund’s expenses in two ways:
| – | Actual Fund Return. This helps you estimate the actual dollar amount of ongoing expenses (but not transaction costs) paid on a $1,000 investment in the Fund using the Fund’s actual return during the period. To estimate the expenses you paid over the period, simply divide your account value by $1,000 (for example, an $8,600 account value divided by $1,000 = 8.6), then multiply the result by the number in the “Expenses Paid per $1,000” line under the share class you hold. |
| – | Hypothetical 5% Fund Return. This helps you to compare your Fund’s ongoing expenses (but not transaction costs) with those of other mutual funds using the Fund’s actual expense ratio and a hypothetical rate of return of 5% per year before expenses. Examples using a 5% hypothetical Fund return may be found in the shareholder reports of other mutual funds. The hypothetical account values and expenses may not be used to estimate the actual ending account balance or expenses you paid for the period. |
Please note that the expenses shown in these tables are meant to highlight your ongoing expenses only and do not reflect any transaction costs. The “Expenses Paid per $1,000” line of the tables is useful in comparing ongoing expenses only and will not help you determine the relative total expense of owning different funds. If these transaction costs had been included, your costs would have been higher.
| | | | |
| Expenses and Value of a $1,000 Investment for the six months ended December 31, 2018 | | | |
| |
| Actual Fund Return | | Class A | |
| Beginning Account Value 7/1/18 | | $ | 1,000.00 | |
| Ending Account Value 12/31/18 | | $ | 816.50 | |
| Expenses Paid per $1,000* | | $ | 3.66 | |
| |
| Hypothetical 5% Fund Return | | Class A | |
| Beginning Account Value 7/1/18 | | $ | 1,000.00 | |
| Ending Account Value 12/31/18 | | $ | 1,021.17 | |
| Expenses Paid per $1,000* | | $ | 4.08 | |
| * | Expenses are equal to the Fund’s annualized expense ratio, multiplied by the average account value over the period, multiplied by 184 (the number of days in the most recentsix-month period), then divided by 365. |
| | | | |
| Annualized Expense Ratio | | Class A | |
| Deutsche DWS Variable Series II — DWS Small Mid Cap Growth VIP | | | .80 | % |
For more information, please refer to the Fund’s prospectus.
These tables do not reflect charges and fees (“contract charges”) associated with the separate account that invests in the Fund or any variable life insurance policy or variable annuity contract for which the Fund is an investment option.
For an analysis of the fees associated with an investment in the Fund or similar funds, please refer to the current and hypothetical expense calculators for Variable Insurance Products which can be found at dws.com/calculators.
| | | | |
Deutsche DWS Variable Series II — DWS Small Mid Cap Growth VIP | | | | | 17 |
| | |
| Tax Information | | (Unaudited) |
The Fund paid distributions of $6.86 per share from net long-term capital gains during its year ended December 31, 2018.
Pursuant to Section 852 of the Internal Revenue Code, the Fund designates $9,660,000 as capital gain dividends for its year ended December 31, 2018.
For corporate shareholders, 26% of the ordinary dividends (i.e., income dividends plus short-term capital gains) paid during the Fund’s fiscal year ended December 31, 2018, qualified for the dividends received deduction.
Please consult a tax advisor if you have questions about federal or state income tax laws, or on how to prepare your tax returns. If you have specific questions about your account, please contact your insurance provider.
Proxy Voting
The Trust’s policies and procedures for voting proxies for portfolio securities and information about how the Trust voted proxies related to its portfolio securities during the most recent12-month period ended June 30 are available on our Web site — dws.com/en-us/resources/proxy-voting — or on the SEC’s Web site — sec.gov. To obtain a written copy of the Trust’s policies and procedures without charge, upon request, call us toll free at (800)728-3337.
| | | | | | |
| | 18 | | | | | | Deutsche DWS Variable Series II — DWS Small Mid Cap Growth VIP |
Advisory Agreement Board Considerations and Fee Evaluation
The Board of Trustees (hereinafter referred to as the “Board” or “Trustees”) approved the renewal of DWS Small Mid Cap Growth VIP’s (the “Fund”) investment management agreement (the “Agreement”) with DWS Investment Management Americas, Inc. (“DIMA”) in September 2018.
In terms of the process that the Board followed prior to approving the Agreement, shareholders should know that:
| – | | During the entire process, all of the Fund’s Trustees were independent of DIMA and its affiliates (the “Independent Trustees”). |
| – | | The Board met frequently during the past year to discuss fund matters and dedicated a substantial amount of time to contract review matters. Over the course of several months, the Board’s Contract Committee reviewed extensive materials received from DIMA, independent third parties and independent counsel. These materials included an analysis of the Fund’s performance, fees and expenses, and profitability from a fee consultant retained by the Fund’s Independent Trustees (the “Fee Consultant”). Based on its evaluation of the information provided, the Contract Committee presented its findings and recommendations to the Board. The Board then reviewed the Contract Committee’s findings and recommendations. |
| – | | The Board also received extensive information throughout the year regarding performance of the Fund. |
| – | | The Independent Trustees regularly met privately with counsel to discuss contract review and other matters. In addition, the Independent Trustees were advised by the Fee Consultant in the course of their review of the Fund’s contractual arrangements and considered a comprehensive report prepared by the Fee Consultant in connection with their deliberations. |
| – | | In connection with reviewing the Agreement, the Board also reviewed the terms of the Fund’s distribution agreement, administrative services agreement, transfer agency agreement and other material service agreements. |
In connection with the contract review process, the Contract Committee and the Board considered the factors discussed below, among others. The Board also considered that DIMA and its predecessors have managed the Fund since its inception, and the Board believes that a long-term relationship with a capable, conscientious advisor is in the best interests of the Fund. The Board considered, generally, that shareholders chose to invest or remain invested in the Fund knowing that DIMA managed the Fund. DIMA is part of DWS Group GmbH & Co. KGaA (“DWS Group”). DWS Group is a global asset management business that offers a wide range of investing expertise and resources, including research capabilities in many countries throughout the world. In 2018, approximately 20% of DWS Group’s shares were sold in an initial public offering, with Deutsche Bank AG owning the remaining shares.
As part of the contract review process, the Board carefully considered the fees and expenses of each DWS fund overseen by the Board in light of the fund’s performance. In many cases, this led to the negotiation and implementation of expense caps. As part of these negotiations, the Board indicated that it would consider relaxing these caps in future years following sustained improvements in performance, among other considerations.
While shareholders may focus primarily on fund performance and fees, the Fund’s Board considers these and many other factors, including the quality and integrity of DIMA’s personnel and administrative support services provided by DIMA, such as back-office operations, fund valuations, and compliance policies and procedures.
Nature, Quality and Extent of Services. The Board considered the terms of the Agreement, including the scope of advisory services provided under the Agreement. The Board noted that, under the Agreement, DIMA provides portfolio management services to the Fund and that, pursuant to a separate administrative services agreement, DIMA provides administrative services to the Fund. The Board considered the experience and skills of senior management and investment personnel and the resources made available to such personnel. The Board reviewed the Fund’s performance over short-term and long-term periods and compared those returns to various agreed-upon performance measures, including market index(es) and a peer universe compiled using information supplied by Morningstar Direct (“Morningstar”), an independent fund data service. The Board also noted that it has put into place a process of identifying “Funds in Review” (e.g., funds performing poorly relative to a peer universe), and receives additional reporting from DIMA regarding such funds and, where appropriate, DIMA’s plans to address underperformance. The Board
| | | | |
Deutsche DWS Variable Series II — DWS Small Mid Cap Growth VIP | | | | | 19 |
believes this process is an effective manner of identifying and addressing underperforming funds. Based on the information provided, the Board noted that, for theone-, three- and five-year periods ended December 31, 2017, the Fund’s performance (Class A shares) was in the 3rd quartile, 3rd quartile and 2nd quartile, respectively, of the applicable Morningstar universe (the 1st quartile being the best performers and the 4th quartile being the worst performers). The Board also observed that the Fund has underperformed its benchmark in theone-, three- and five-year periods ended December 31, 2017. The Board noted the disappointing investment performance of the Fund in recent periods and continued to discuss with senior management of DIMA the factors contributing to such underperformance and actions being taken to improve performance. The Board noted changes in the portfolio management team, effective April 19, 2018. The Board recognized the efforts by DIMA in recent years to enhance its investment platform and improve long-term performance across the DWS fund complex.
Fees and Expenses. The Board considered the Fund’s investment management fee schedule, operating expenses and total expense ratios, and comparative information provided by Broadridge Financial Solutions, Inc. (“Broadridge”) and the Fee Consultant regarding investment management fee rates paid to other investment advisors by similar funds (1st quartile being the most favorable and 4th quartile being the least favorable). With respect to management fees paid to other investment advisors by similar funds, the Board noted that the contractual fee rates paid by the Fund, which include a 0.10% fee paid to DIMA under the Fund’s administrative services agreement, were lower than the median (1st quartile) of the applicable Broadridge peer group (based on Broadridge data provided as of December 31, 2017). The Board noted that the Fund’s Class A shares total (net) operating expenses were expected to be lower than the median (2nd quartile) of the applicable Broadridge expense universe (based on Broadridge data provided as of December 31, 2017, and analyzing Broadridge expense universe Class A (net) expenses less any applicable12b-1 fees) (“Broadridge Universe Expenses”). The Board noted that the expense limitation agreed to by DIMA was expected to help the Fund’s total (net) operating expenses remain competitive. The Board considered the Fund’s management fee rate as compared to fees charged by DIMA to comparable DWS U.S. registered funds (“DWS Funds”), noting that DIMA indicated that it does not provide services to any comparable DWS Funds. The information requested by the Board as part of its review of fees and expenses also included information about institutional accounts (including anysub-advised funds and accounts) and funds offered primarily to European investors (“DWS Europe Funds”) managed by DWS Group. The Board noted that DIMA indicated that DWS Group does not manage any institutional accounts or DWS Europe Funds comparable to the Fund.
On the basis of the information provided, the Board concluded that management fees were reasonable and appropriate in light of the nature, quality and extent of services provided by DIMA.
Profitability. The Board reviewed detailed information regarding revenues received by DIMA under the Agreement. The Board considered the estimated costs to DIMA, andpre-tax profits realized by DIMA, from advising the DWS Funds, as well as estimates of thepre-tax profits attributable to managing the Fund in particular. The Board also received information regarding the estimated enterprise-wide profitability of DIMA and its affiliates with respect to all fund services in totality and by fund. The Board and the Fee Consultant reviewed DIMA’s methodology in allocating its costs to the management of the Fund. Based on the information provided, the Board concluded that thepre-tax profits realized by DIMA in connection with the management of the Fund were not unreasonable. The Board also reviewed certain publicly available information regarding the profitability of certain similar investment management firms. The Board noted that, while information regarding the profitability of such firms is limited (and in some cases is not necessarily prepared on a comparable basis), DIMA and its affiliates’ overall profitability with respect to the DWS Funds (after taking into account distribution and other services provided to the funds by DIMA and its affiliates) was lower than the overall profitability levels of most comparable firms for which such data was available.
Economies of Scale. The Board considered whether there are economies of scale with respect to the management of the Fund and whether the Fund benefits from any economies of scale. The Board noted that the Fund’s investment management fee schedule includes fee breakpoints. The Board concluded that the Fund’s fee schedule represents an appropriate sharing between the Fund and DIMA of such economies of scale as may exist in the management of the Fund at current asset levels.
Other Benefits to DIMA and Its Affiliates. The Board also considered the character and amount of other incidental or“fall-out” benefits received by DIMA and its affiliates, including any fees received by DIMA for administrative services provided to the Fund and any fees received by an affiliate of DIMA for transfer agency services provided to the Fund. The Board also considered benefits to DIMA related to brokerage and soft-dollar allocations, including allocating brokerage to pay for research generated by parties other than the
| | | | | | |
| | 20 | | | | | | Deutsche DWS Variable Series II — DWS Small Mid Cap Growth VIP |
executing broker dealers, which pertain primarily to funds investing in equity securities. In addition, the Board considered the incidental public relations benefits to DIMA related to DWS Funds advertising and cross-selling opportunities among DIMA products and services. The Board considered these benefits in reaching its conclusion that the Fund’s management fees were reasonable.
Compliance. The Board considered the significant attention and resources dedicated by DIMA to its compliance processes in recent years. The Board noted in particular (i) the experience, seniority and time commitment of the individuals serving as DIMA’s and the Fund’s chief compliance officers and (ii) the substantial commitment of resources by DIMA and its affiliates to compliance matters, including the retention of compliance personnel.
Based on all of the information considered and the conclusions reached, the Board unanimously determined that the continuation of the Agreement is in the best interests of the Fund. In making this determination, the Board did not give particular weight to any single factor identified above. The Board considered these factors over the course of numerous meetings, certain of which were in executive session with only the Independent Trustees and counsel present. It is possible that individual Independent Trustees may have weighed these factors differently in reaching their individual decisions to approve the continuation of the Agreement.
| | | | |
Deutsche DWS Variable Series II — DWS Small Mid Cap Growth VIP | | | | | 21 |
Board Members and Officers
The following table presents certain information regarding the Board Members and Officers of the Fund. Each Board Member’s year of birth is set forth in parentheses after his or her name. Unless otherwise noted, (i) each Board Member has engaged in the principal occupation(s) noted in the table for at least the most recent five years, although not necessarily in the same capacity; and (ii) the address of each Independent Board Member is c/o Keith R. Fox, DWS Funds Board Chair, c/o Thomas R. Hiller, Ropes & Gray LLP, Prudential Tower, 800 Boylston Street, Boston, MA02199-3600. Except as otherwise noted below, the term of office for each Board Member is until the election and qualification of a successor, or until such Board Member sooner dies, resigns, is removed or as otherwise provided in the governing documents of the Fund. Because the Fund does not hold an annual meeting of shareholders, each Board Member will hold office for an indeterminate period. The Board Members may also serve in similar capacities with other funds in the fund complex.
| | | | | | | | |
| Independent Board Members | | | | | | |
Name, Year of Birth,
Position with the Fund and
Length of Time Served1 | | Business Experience and Directorships During the Past Five Years | | Number of
Funds in
DWS Fund
Complex
Overseen | | | Other
Directorships
Held by Board
Member
|
Keith R. Fox, CFA (1954) Chairperson since 2017, and Board Member since 1996 | | Managing General Partner, Exeter Capital Partners (a series of private investment funds) (since 1986). Directorships: Progressive International Corporation (kitchen goods importer and distributor); The Kennel Shop (retailer); former Chairman, National Association of Small Business Investment Companies; former Directorships: BoxTop Media Inc. (advertising); Sun Capital Advisers Trust (mutual funds) (2011���2012) | | | 82 | | | — |
John W. Ballantine (1946) Board Member since 1999 | | Retired; formerly, Executive Vice President and Chief Risk Management Officer, First Chicago NBD Corporation/The First National Bank of Chicago (1996–1998); Executive Vice President and Head of International Banking (1995–1996); former Directorships: Director and former Chairman of the Board, Healthways, Inc.2 (population well-being and wellness services) (2003–2014); Stockwell Capital Investments PLC (private equity); Enron Corporation; FNB Corporation; Tokheim Corporation; First Oak Brook Bancshares, Inc. and Oak Brook Bank; Prisma Energy International; Public Radio International. Not-for-Profit Director, Trustee: Palm Beach Civic Association; Window to the World Communications (public media); Harris Theater for Music and Dance (Chicago); Life Director of Hubbard Street Dance Chicago | | | 82 | | | Portland
General
Electric2
(utility
company)
(2003–
present) |
Henry P. Becton, Jr. (1943) Board Member since 1990 | | Vice Chair and former President, WGBH Educational Foundation. Directorships: Public Radio International; Public Radio Exchange (PRX); The Pew Charitable Trusts (charitable organization); Massachusetts Humane Society; Overseer of the New England Conservatory; former Directorships: Becton Dickinson and Company2 (medical technology company); Belo Corporation2 (media company); The PBS Foundation; Association of Public Television Stations; Boston Museum of Science; American Public Television; Concord Academy; New England Aquarium; Mass. Corporation for Educational Telecommunications; Committee for Economic Development; Public Broadcasting Service; Connecticut College; North Bennett Street School (Boston); American Documentary, Inc. (public media) | | | 82 | | | — |
Dawn-Marie Driscoll (1946) Board Member since 1987 | | Emeritus Executive Fellow, Center for Business Ethics, Bentley University; formerly: President, Driscoll Associates (consulting firm); Partner, Palmer & Dodge (law firm) (1988–1990); Vice President of Corporate Affairs and General Counsel, Filene’s (retail) (1978–1988). Directorships: Advisory Board, Center for Business Ethics, Bentley University; Trustee and former Chairman of the Board, Southwest Florida Community Foundation (charitable organization); former Directorships: ICI Mutual Insurance Company (2007–2015); Sun Capital Advisers Trust (mutual funds) (2007–2012), Investment Company Institute (audit, executive, nominating committees) and Independent Directors Council (governance, executive committees) | | | 82 | | | — |
Paul K. Freeman* (1950) Board Member since 1993 | | Consultant, WorldBank/Inter-American Development Bank; Independent Directors Council (former chair); Investment Company Institute (executive committee); Adjunct Professor, University of Denver Law School (2017–present); formerly: Chairman of Education Committee of Independent Directors Council; Project Leader, International Institute for Applied Systems Analysis (1998–2001); Chief Executive Officer, The Eric Group, Inc. (environmental insurance) (1986–1998); Directorships: Knoebel Institute for Healthy Aging, University of Denver (2017–present); former Directorships: Prisma Energy International; Denver Zoo Foundation (2012–2018) | | | 82 | | | — |
| | | | | | |
| | 22 | | | | | | Deutsche DWS Variable Series II — DWS Small Mid Cap Growth VIP |
| | | | | | | | |
Name, Year of Birth,
Position with the Fund and
Length of Time Served1 | | Business Experience and Directorships During the Past Five Years | | Number of
Funds in
DWS Fund
Complex
Overseen | | | Other
Directorships
Held by Board
Member
|
Richard J. Herring (1946) Board Member since 1990 | | Jacob Safra Professor of International Banking and Professor of Finance, The Wharton School, University of Pennsylvania (since July 1972); Director, The Wharton Financial Institutions Center (since 1994); formerly: Vice Dean and Director, Wharton Undergraduate Division (1995–2000) and Director, The Lauder Institute of International Management Studies (2000–2006); Member FDIC Systemic Risk Advisory Committee since 2011, member Systemic Risk Council since 2012 and member of the Advisory Board at the Yale Program on Financial Stability since 2013; Formerly Co-Chair of the Shadow Financial Regulatory Committee (2003–2015), Executive Director of The Financial Economists Roundtable (2008–2015), Director of The Thai Capital Fund (2007–2013), Director of The Aberdeen Singapore Fund (2007–2018), and Nonexecutive Director of Barclays Bank DE (2010–2018) | | | 82 | | | Director,
Aberdeen
Japan Fund
(since 2007) |
William McClayton (1944) Board Member since 2004 | | Private equity investor (since October 2009); previously, Managing Director, Diamond Management & Technology Consultants, Inc. (global consulting firm) (2001–2009); Directorship: Board of Managers, YMCA of Metropolitan Chicago; formerly: Senior Partner, Arthur Andersen LLP (accounting) (1966–2001); Trustee, Ravinia Festival | | | 82 | | | — |
Rebecca W. Rimel (1951) Board Member since 1995 | | President, Chief Executive Officer and Director, The Pew Charitable Trusts (charitable organization) (1994–present); formerly: Executive Vice President, The Glenmede Trust Company (investment trust and wealth management) (1983–2004); Board Member, Investor Education (charitable organization) (2004–2005); Trustee, Executive Committee, Philadelphia Chamber of Commerce (2001–2007); Director, Viasys Health Care2 (January 2007–June 2007); Trustee, Thomas Jefferson Foundation (charitable organization) (1994–2012) | | | 82 | | | Director,
Becton
Dickinson
and
Company2
(medical
technology
company)
(2012–
present);
Director,
BioTelemetry
Inc.2(health
care) (2009–
present) |
William N. Searcy, Jr. (1946) Board Member since 1993 | | Private investor since October 2003; formerly: Pension & Savings Trust Officer, Sprint Corporation2(telecommunications) (November 1989–September 2003); Trustee, Sun Capital Advisers Trust (mutual funds) (1998–2012) | | | 82 | | | — |
Jean Gleason Stromberg (1943) Board Member since 1997 | | Retired. Formerly, Consultant (1997–2001); Director, Financial Markets U.S. Government Accountability Office (1996–1997); Partner, Norton Rose Fulbright, L.L.P. (law firm) (1978–1996); former Directorships: The William and Flora Hewlett Foundation (charitable organization) (2000–2015); Service Source, Inc. (nonprofit), Mutual Fund Directors Forum (2002–2004), American Bar Retirement Association (funding vehicle for retirement plans) (1987–1990 and 1994–1996) | | | 82 | | | — |
| | |
| Officers4 | | |
Name, Year of Birth, Position with the Fund and Length of Time Served5 | | Business Experience and Directorships During the Past Five Years |
Hepsen Uzcan6 (1974) President and Chief Executive Officer, 2017–present Assistant Secretary, 2013–present | | Managing Director,3 DWS; Secretary, DWS USA Corporation (since March 2018); Assistant Secretary, DWS Distributors, Inc. (since June 25, 2018); Director and Vice President, DWS Service Company (since June 25, 2018); Assistant Secretary, DWS Investment Management Americas, Inc. (since June 25, 2018); and Director and President, DB Investment Managers, Inc. (since June 25, 2018); formerly: Vice President for the Deutsche funds (2016–2017) |
John Millette8(1962) Vice President and Secretary, 1999–present | | Director,3DWS; Chief Legal Officer, DWS Investment Management Americas, Inc. (2015–present); and Director and Vice President, DWS Trust Company (2016–present); formerly: Secretary, Deutsche Investment Management Americas Inc. (2015–2017) |
Diane Kenneally8,9 (1966) Treasurer and Chief Financial Officer since 2018 | | Director,3 DWS; formerly: Assistant Treasurer for the DWS funds (2007–2018) |
Caroline Pearson8(1962) Chief Legal Officer, 2010–present | | Managing Director,3DWS; formerly: Secretary, Deutsche AM Distributors, Inc. (2002–2017); and Secretary, Deutsche AM Service Company (2010–2017) |
Scott D. Hogan8(1970) Chief Compliance Officer, 2016–present | | Director,3DWS |
| | | | |
Deutsche DWS Variable Series II — DWS Small Mid Cap Growth VIP | | | | | 23 |
| | |
Name, Year of Birth, Position with the Fund and Length of Time Served5 | | Business Experience and Directorships During the Past Five Years |
Wayne Salit7(1967) Anti-Money Laundering Compliance Officer, 2014–present | | Director,3 Deutsche Bank; and AML Officer, DWS Trust Company; formerly: Managing Director, AML Compliance Officer at BNY Mellon (2011–2014); and Director, AML Compliance Officer at Deutsche Bank (2004–2011) |
Sheila Cadogan8(1966) Assistant Treasurer, 2017–present | | Director,3DWS; Director and Vice President, DWS Trust Company (since 2018) |
Paul Antosca8(1957) Assistant Treasurer, 2007–present | | Director,3DWS |
| 1 | The length of time served represents the year in which the Board Member joined the board of one or more DWS funds currently overseen by the Board. |
| 2 | A publicly held company with securities registered pursuant to Section 12 of the Securities Exchange Act of 1934. |
| 3 | Executive title, not a board directorship. |
| 4 | As a result of their respective positions held with the Advisor or its affiliates, these individuals are considered “interested persons” of the Advisor within the meaning of the 1940 Act. Interested persons receive no compensation from the Fund. |
| 5 | The length of time served represents the year in which the officer was first elected in such capacity for one or more DWS funds. |
| 6 | Address: 345 Park Avenue, New York, NY 10154. |
| 7 | Address: 60 Wall Street, New York, NY 10005. |
| 8 | Address: One International Place, Boston, MA 02110. |
| 9 | Appointed Treasurer and Chief Financial Officer effective July 2, 2018. |
| * | Paul K. Freeman retired from the Board effective December 31, 2018. |
The Fund’s Statement of Additional Information (“SAI”) includes additional information about the Board Members. The SAI is available, without charge, upon request. If you would like to request a copy of the SAI, you may do so by calling the followingtoll-free number:(800) 728-3337.
| | | | | | |
| | 24 | | | | | | Deutsche DWS Variable Series II — DWS Small Mid Cap Growth VIP |
Notes
Notes
Notes
| | |
| | |
VS2SMCG-2 (R-025835-8 2/19) | | |
December 31, 2018
Annual Report
Deutsche DWS Variable Series II
(formerly Deutsche Variable Series II)
DWS Small Mid Cap Value VIP
(formerly Deutsche Small Mid Cap Value VIP)
Beginning on January 1, 2021, as permitted by regulations adopted by the Securities and Exchange Commission, you may not be receiving paper copies of the Fund’s shareholder reports from the insurance company that offers your contract unless you specifically request paper copies from your insurance company or from your financial intermediary. Instead, the shareholder reports will be made available on a Web site, and your insurance company will notify you by mail each time a report is posted and provide you with a Web site link to access the report. Instructions for requesting paper copies will be provided by your insurance company.
If you already elected to receive shareholder reports electronically, you will not be affected by this change and you need not take any action. You may elect to receive shareholder reports and other communications from your insurance company electronically by following the instructions provided by your insurance company.
You may elect to receive all future reports in paper free of charge from your insurance company. If your insurance company informs you that future reports will be delivered via Web access, you can inform your insurance company that you wish to continue receiving paper copies of your shareholder reports by following the instructions provided by your insurance company.

Contents
This report must be preceded or accompanied by a prospectus. To obtain an additional prospectus or summary prospectus, if available, call (800)728-3337 or your financial representative. We advise you to consider the Fund’s objectives, risks, charges and expenses carefully before investing. The summary prospectus and prospectus contain this and other important information about the Fund. Please read the prospectus carefully before you invest.
Stocks may decline in value. Smaller and medium company stocks tend to be more volatile than large company stocks. Any fund that focuses in a particular segment of the market or region of the world will generally be more volatile than a fund that invests more broadly. The Fund may lend securities to approved institutions. Please read the prospectus for details.
The brand DWS represents DWS Group GmbH & Co. KGaA and any of its subsidiaries such as DWS Distributors, Inc. which offers investment products or DWS Investment Management Americas, Inc. and RREEF America L.L.C. which offer advisory services.
DWS Distributors, Inc., 222 South Riverside Plaza, Chicago, IL 60606, (800)621-1148
NOT FDIC/NCUA INSURED NO BANK GUARANTEE MAY LOSE VALUE NOT A DEPOSIT
NOT INSURED BY ANY FEDERAL GOVERNMENT AGENCY
| | | | | | |
| | 2 | | | | | | Deutsche DWS Variable Series II — DWS Small Mid Cap Value VIP |
| | |
| Performance Summary | | December 31, 2018 (Unaudited) |
Fund performance shown is historical, assumes reinvestment of all dividend and capital gain distributions and does not guarantee future results. Investment return and principal value fluctuate with changing market conditions so that, when redeemed, shares may be worth more or less than their original cost. Current performance may be lower or higher than the performance data quoted. Please contact your participating insurance company for the Fund’s most recentmonth-end performance. Performance does not reflect charges and fees (“contract charges”) associated with the separate account that invests in the Fund or any variable life insurance policy or variable annuity contract for which the Fund is an investment option. These charges and fees will reduce returns. While all share classes have the same underlying portfolio, their performance will differ.
The gross expense ratios of the Fund, as stated in the fee table of the prospectus dated May 1, 2018 are 0.83% and 1.19% for Class A and Class B shares, respectively, and may differ from the expense ratios disclosed in the Financial Highlights tables in this report.
Generally accepted accounting principles require adjustments to be made to the net assets of the Fund at period end for financial reporting purposes only, and as such, the total return based on the unadjusted net asset value per share may differ from the total return reported in the financial highlights.
Growth of an Assumed $10,000 Investment in DWS Small Mid Cap Value VIP
| | |
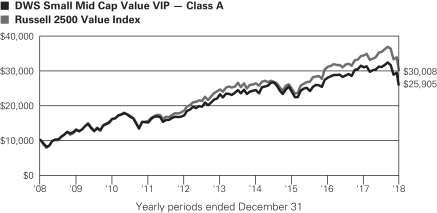 | | The Russell 2500 Value Index is an unmanaged Index of those securities in the Russell 3000® Index with lower price-to-book ratios and lower forecasted growth values. Index returns do not reflect any fees or expenses and it is not possible to invest directly into an index. |
| | | | | | | | | | |
| Comparative Results | | | | | | | | |
| | | | |
| DWS Small Mid Cap Value VIP | | 1-Year | | 3-Year | | 5-Year | | 10-Year |
| Class A | | Growth of $10,000 | | $8,399 | | $10,850 | | $11,231 | | $25,905 |
| | | Average annual total return | | –16.01% | | 2.76% | | 2.35% | | 9.99% |
| Russell 2500 Value Index | | Growth of $10,000 | | $8,764 | | $12,110 | | $12,259 | | $30,008 |
| | | Average annual total return | | –12.36% | | 6.59% | | 4.16% | | 11.62% |
| | | | |
| DWS Small Mid Cap Value VIP | | 1-Year | | 3-Year | | 5-Year | | 10-Year |
| Class B | | Growth of $10,000 | | $8,368 | | $10,733 | | $11,030 | | $25,022 |
| | | Average annual total return | | –16.32% | | 2.39% | | 1.98% | | 9.61% |
| Russell 2500 Value Index | | Growth of $10,000 | | $8,764 | | $12,110 | | $12,259 | | $30,008 |
| | | Average annual total return | | –12.36% | | 6.59% | | 4.16% | | 11.62% |
The growth of $10,000 is cumulative.
| | | | |
Deutsche DWS Variable Series II — DWS Small Mid Cap Value VIP | | | | | 3 |
| | |
| Management Summary | | December 31, 2018 (Unaudited) |
Class A shares of DWS Small Mid Cap Value VIP returned –16.01% in 2018 (unadjusted for contract charges) and underperformed the –12.36% return of the Russell 2500TM Value Index.Mid- andsmall-cap stocks lagged theirlarge-cap peers during the period, while the value style finished well behind growth. Nearly all of the negative return for the index occurred in the fourth calendar quarter, when it declined 11.05%.
The Fund’s general investment approach was a key reason for its shortfall. Our style was out of step with the market through the first nine months of the period, during which higher-beta and momentum-driven stocks outpaced those with lowerprice-to-earnings (P/E) ratios and higher returns on equity. This trend was visible not just across the market as a whole, but also within the value benchmark. At a time of rising short-term interest rates and heightened headline risk surrounding trade policy, investors appeared to gravitate to faster growers and stronger recent performers regardless of their valuations. These circumstances created a headwind for the Fund due to our emphasis on value and fundamentals. In addition to only buying stocks that we believe are attractively valued, we are also very disciplined in selling those that have reached our price targets. We therefore do not typically gain the full benefit of momentum-oriented markets. Nevertheless, we think that investing in growing, fundamentally sound companies when the shares are cheap and selling them when they’re expensive continues to be a prudent path to long-term performance. This aspect of our approach indeed began to be reflected in results in the fourth calendar quarter once the market weakened and momentum stocks started to lose steam.
The Fund’s sector allocations, which are largely a function of ourbottom-up stock selection process, also played a role in the underperformance. We were hurt by having underweights in the real estate, utilities, and communications services sectors. We have been steadily working to reduce the extent of the Fund’s underweights in real estate and utilities in order to minimize the effect of allocation on Fund returns, but the gradual nature of the process meant that our weightings in these areas were still well below those of the index.
Stock selection was also a net detractor. Our holdings trailed the corresponding benchmark components in the financial, energy, and materials sectors, offsetting a stronger showing in the health care, information technology, and consumer staples. Among individual stocks, the consumer products company Helen of Troy Ltd. was the top contributor to Fund performance. The company has built its business over time through accretive acquisitions of faster-growing, smaller players, and this strategy has begun to feed through to its results. Encompass Health Corp., a provider of inpatient and home-based rehabilitation services that rallied after raising its guidance for earnings and cash flows twice in 2018, was another key contributor. Winnebago Industries, Inc. was the largest detractor. The company exceeded earnings estimates in each of its four fiscal quarters, but the stock fell due to weak sentiment surrounding the recreational vehicle industry.
Although the Fund underperformed in the past 12 months, we believe it’s essential to stick to our disciplined,bottom-up strategy. There are always times when lower-quality and richly valued stocks outperform the overall market, and the 2017–2018 rally in this group proved especially persistent. Still, we don’t see an advantage of chasing performance in the lower-quality end of thesmall-cap universe given that such companies tend to underperform over longer-term intervals.
This emphasis on quality and value was reflected in our portfolio activity, which focused on making moves at astock-by-stock level rather than executing broad-based changes. Specifically, we continued to rotate gradually out of strong performers that reached our price targets and redeploy the proceeds into stocks whose lower valuations may indicate greater upside potential. We believe this patient approach, instead of one that seeks to capture momentum, is a prudent long-term strategy.
Richard Hanlon, CFA, Director
Portfolio Manager
The views expressed reflect those of the portfolio management team only through the end of the period of the report as stated on the cover. The management team’s views are subject to change at any time based on market and other conditions and should not be construed as a recommendation. Past performance is no guarantee of future results. Current and future portfolio holdings are subject to risk.
| | | | | | |
| | 4 | | | | | | Deutsche DWS Variable Series II — DWS Small Mid Cap Value VIP |
Terms to Know
TheRussell 2500 Value Index is an unmanaged index of those securities in the Russell 3000 Index with lowerprice-to-book ratios and lower forecasted growth values. Index returns do not reflect fees or expenses and it is not possible to invest directly into an index.
Beta measures a security’s sensitivity to the movements of the Fund’s benchmark or the market as a whole.
Momentum investing is the practice of investing in the market’s top performing stocks in order to capture additional upward movements in their prices.
Price-to-earnings (P/E) ratio compares share price toper-share earnings.
Overweight means the Fund holds a higher weighting in a given sector or security than the benchmark.Underweightmeans the Fund holds a lower weighting.
Contribution anddetraction incorporate both a stock’s total return and its weighting in the Fund.
| | | | |
Deutsche DWS Variable Series II — DWS Small Mid Cap Value VIP | | | | | 5 |
| | |
| Portfolio Summary | | (Unaudited) |
| | | | | | | | |
| Asset Allocation (As a % of Investment Portfolio) | | 12/31/18 | | | 12/31/17 | |
| Common Stocks | | | 97% | | | | 96% | |
Cash Equivalent | | | 3% | | | | 4% | |
| | | | 100% | | | | 100% | |
| | |
Sector Diversification
(As a % of Investment Portfolio excluding Cash Equivalent) | | 12/31/18 | | | 12/31/17 | |
| Financials | | | 22% | | | | 20% | |
| Industrials | | | 16% | | | | 19% | |
| Real Estate | | | 13% | | | | 13% | |
| Consumer Discretionary | | | 12% | | | | 9% | |
| Information Technology | | | 11% | | | | 11% | |
| Utilities | | | 6% | | | | 5% | |
| Health Care | | | 6% | | | | 4% | |
| Materials | | | 5% | | | | 5% | |
| Energy | | | 4% | | | | 7% | |
| Consumer Staples | | | 3% | | | | 7% | |
| Communication Services | | | 2% | | | | — | |
| | | | 100% | | | | 100% | |
Portfolio holdings and characteristics are subject to change.
For more complete details about the Fund’s investment portfolio, see page 7.
Following the Fund’s fiscal first and thirdquarter-end, a complete portfolio holdings listing is filed with the SEC on FormN-Q or Form N-PORT (available for filings after March 31, 2019). The Fund’s Form N-Q or Form N-PORT will be available on the SEC’s Web site at sec.gov. The Fund’s portfolio holdings are also posted on dws.com from time to time. Please see the Fund’s current prospectus for more information.
| | | | | | |
| | 6 | | | | | | Deutsche DWS Variable Series II — DWS Small Mid Cap Value VIP |
| | |
| Investment Portfolio | | December 31, 2018 |
| | | | | | | | |
| | | Shares | | | Value ($) | |
| Common Stocks 97.1% | |
| Communication Services 1.7% | |
Media 1.7% | |
Interpublic Group of Companies, Inc. | | | 69,952 | | | | 1,443,110 | |
|
| Consumer Discretionary 11.3% | |
Auto Components 1.1% | |
Visteon Corp.* | | | 15,913 | | | | 959,236 | |
|
Automobiles 1.5% | |
Winnebago Industries, Inc. | | | 51,382 | | | | 1,243,958 | |
|
Diversified Consumer Services 1.6% | |
Regis Corp.* | | | 79,032 | | | | 1,339,592 | |
|
Hotels, Restaurants & Leisure 2.2% | |
| | |
Aramark | | | 33,800 | | | | 979,186 | |
| | |
Denny’s Corp.* | | | 54,840 | | | | 888,957 | |
| | | | | | | | |
| | | | 1,868,143 | |
|
Household Durables 2.5% | |
Helen of Troy Ltd.* | | | 16,578 | | | | 2,174,702 | |
|
Leisure Products 0.7% | |
Brunswick Corp. | | | 12,814 | | | | 595,210 | |
|
Textiles, Apparel & Luxury Goods 1.7% | |
Columbia Sportswear Co. | | | 17,354 | | | | 1,459,298 | |
|
| Consumer Staples 3.4% | |
Food Products 2.1% | |
| | |
Conagra Brands, Inc. | | | 21,388 | | | | 456,847 | |
| | |
Lamb Weston Holdings, Inc. | | | 18,123 | | | | 1,333,128 | |
| | | | | | | | |
| | | | 1,789,975 | |
|
Household Products 1.3% | |
Central Garden & Pet Co.* | | | 31,515 | | | | 1,085,692 | |
|
| Energy 4.4% | |
Energy Equipment & Services 0.6% | |
Patterson-UTI Energy, Inc. | | | 48,705 | | | | 504,097 | |
|
Oil, Gas & Consumable Fuels 3.8% | |
| | |
HollyFrontier Corp. | | | 12,696 | | | | 649,019 | |
| | |
Matador Resources Co.* | | | 26,296 | | | | 408,377 | |
| | |
Murphy Oil Corp. | | | 26,957 | | | | 630,524 | |
| | |
Parsley Energy, Inc. “A”* | | | 27,357 | | | | 437,165 | |
| | |
Targa Resources Corp. | | | 15,978 | | | | 575,528 | |
| | |
WPX Energy, Inc.* | | | 52,173 | | | | 592,163 | |
| | | | | | | | |
| | | | 3,292,776 | |
|
| Financials 20.9% | |
Banks 12.2% | |
| | |
Eagle Bancorp., Inc.* | | | 28,517 | | | | 1,389,063 | |
| | |
East West Bancorp., Inc. | | | 24,968 | | | | 1,086,857 | |
| | |
Great Western Bancorp., Inc. | | | 58,045 | | | | 1,813,906 | |
| | |
Hancock Whitney Corp. | | | 46,301 | | | | 1,604,330 | |
| | |
Pacific Premier Bancorp., Inc.* | | | 24,378 | | | | 622,127 | |
| | |
Sterling Bancorp. | | | 84,654 | | | | 1,397,637 | |
| | |
TCF Financial Corp. | | | 71,128 | | | | 1,386,285 | |
| | |
UMB Financial Corp. | | | 18,452 | | | | 1,125,018 | |
| | | | | | | | |
| | | | 10,425,223 | |
|
Capital Markets 0.8% | |
E*TRADE Financial Corp. | | | 16,234 | | | | 712,348 | |
| | | | | | | | |
| | | Shares | | | Value ($) | |
|
Insurance 6.4% | |
| | |
American Financial Group, Inc. | | | 9,600 | | | | 869,088 | |
| | |
Assurant, Inc. | | | 13,300 | | | | 1,189,552 | |
| | |
Brown & Brown, Inc. | | | 51,769 | | | | 1,426,753 | |
| | |
CNO Financial Group, Inc. | | | 42,786 | | | | 636,656 | |
| | |
ProAssurance Corp. | | | 10,411 | | | | 422,270 | |
| | |
Torchmark Corp. | | | 12,000 | | | | 894,360 | |
| | | | | | | | |
| | | | 5,438,679 | |
|
Thrifts & Mortgage Finance 1.5% | |
Walker & Dunlop, Inc. | | | 29,822 | | | | 1,289,802 | |
|
| Health Care 5.9% | |
Health Care Providers & Services 3.3% | |
| | |
Encompass Health Corp. | | | 24,337 | | | | 1,501,593 | |
| | |
Premier, Inc. “A”* | | | 34,121 | | | | 1,274,419 | |
| | | | | | | | |
| | | | 2,776,012 | |
|
Life Sciences Tools & Services 2.6% | |
| | |
Bruker Corp. | | | 42,574 | | | | 1,267,428 | |
| | |
PerkinElmer, Inc. | | | 12,605 | | | | 990,123 | |
| | | | | | | | |
| | | | 2,257,551 | |
|
| Industrials 15.2% | |
Building Products 1.2% | |
Simpson Manufacturing Co., Inc. | | | 18,098 | | | | 979,645 | |
|
Commercial Services & Supplies 2.7% | |
| | |
Interface, Inc. | | | 85,328 | | | | 1,215,924 | |
| | |
The Brink’s Co. | | | 17,413 | | | | 1,125,750 | |
| | | | | | | | |
| | | | 2,341,674 | |
|
Electrical Equipment 1.9% | |
EnerSys | | | 20,357 | | | | 1,579,907 | |
|
Machinery 5.9% | |
| | |
Douglas Dynamics, Inc. | | | 20,212 | | | | 725,409 | |
| | |
Federal Signal Corp. | | | 59,274 | | | | 1,179,552 | |
| | |
Global Brass & Copper Holdings, Inc. | | | 56,284 | | | | 1,415,542 | |
| | |
Hillenbrand, Inc. | | | 23,503 | | | | 891,469 | |
| | |
Stanley Black & Decker, Inc. | | | 6,963 | | | | 833,750 | |
| | | | | | | | |
| | | | 5,045,722 | |
|
Professional Services 2.7% | |
| | |
ICF International, Inc. | | | 13,149 | | | | 851,792 | |
| | |
ManpowerGroup, Inc. | | | 8,734 | | | | 565,963 | |
| | |
Nielsen Holdings PLC | | | 36,986 | | | | 862,884 | |
| | | | | | | | |
| | | | 2,280,639 | |
|
Trading Companies & Distributors 0.8% | |
AerCap Holdings NV* | | | 17,738 | | | | 702,425 | |
|
| Information Technology 10.6% | |
Electronic Equipment, Instruments & Components 5.0% | |
| | |
CTS Corp. | | | 24,200 | | | | 626,538 | |
| | |
Dolby Laboratories, Inc. “A” | | | 16,724 | | | | 1,034,212 | |
| | |
Insight Enterprises, Inc.* | | | 37,400 | | | | 1,524,050 | |
| | |
Rogers Corp.* | | | 10,470 | | | | 1,037,158 | |
| | | | | | | | |
| | | | 4,221,958 | |
|
IT Services 3.7% | |
| | |
Euronet Worldwide, Inc.* | | | 10,261 | | | | 1,050,521 | |
| | |
Leidos Holdings, Inc. | | | 15,800 | | | | 832,976 | |
| | |
Travelport Worldwide Ltd. | | | 83,672 | | | | 1,306,957 | |
| | | | | | | | |
| | | | 3,190,454 | |
The accompanying notes are an integral part of the financial statements.
| | | | |
Deutsche DWS Variable Series II — DWS Small Mid Cap Value VIP | | | | | 7 |
| | | | | | | | |
| | | Shares | | | Value ($) | |
|
Software 1.9% | |
Verint Systems, Inc.* | | | 39,135 | | | | 1,655,802 | |
|
| Materials 4.6% | |
Chemicals 1.1% | |
Minerals Technologies, Inc. | | | 18,144 | | | | 931,513 | |
|
Containers & Packaging 2.0% | |
Owens-Illinois, Inc.* | | | 95,971 | | | | 1,654,540 | |
|
Metals & Mining 1.5% | |
| | |
Commercial Metals Co. | | | 28,909 | | | | 463,122 | |
| | |
Steel Dynamics, Inc. | | | 28,062 | | | | 842,983 | |
| | | | | | | | |
| | | | 1,306,105 | |
|
| Real Estate 13.1% | |
Equity Real Estate Investment Trusts (REITs) 13.1% | |
| | |
Agree Realty Corp. | | | 32,916 | | | | 1,945,994 | |
| | |
Community Healthcare Trust, Inc. | | | 60,375 | | | | 1,740,611 | |
| | |
Duke Realty Corp. | | | 17,200 | | | | 445,480 | |
| | |
Easterly Government Properties, Inc. | | | 71,737 | | | | 1,124,836 | |
| | |
Gaming and Leisure Properties, Inc. | | | 28,066 | | | | 906,813 | |
| | |
Highwoods Properties, Inc. | | | 28,870 | | | | 1,116,980 | |
| | |
Pebblebrook Hotel Trust | | | 48,416 | | | | 1,370,657 | |
| | |
STAG Industrial, Inc. | | | 56,593 | | | | 1,408,034 | |
| | |
WP Carey, Inc. | | | 17,000 | | | | 1,110,780 | |
| | | | | | | | |
| | | | 11,170,185 | |
| | | | | | | | |
| | | Shares | | | Value ($) | |
|
| Utilities 6.0% | |
Electric Utilities 4.4% | |
| | |
Alliant Energy Corp. | | | 38,308 | | | | 1,618,513 | |
| | |
IDACORP, Inc. | | | 18,329 | | | | 1,705,697 | |
| | |
Pinnacle West Capital Corp. | | | 5,400 | | | | 460,080 | |
| | | | | | | | |
| | | | 3,784,290 | |
|
Gas Utilities 1.6% | |
| | |
ONE Gas, Inc. | | | 16,572 | | | | 1,319,131 | |
| Total Common Stocks(Cost $84,454,782) | | | | 82,819,394 | |
|
| Cash Equivalent 2.9% | |
DWS Central Cash Management Government Fund, 2.41% (a) (Cost $2,497,809) | | | 2,497,809 | | | | 2,497,809 | |
| | |
| | | % of Net
Assets | | | Value ($) | |
Total Investment Portfolio (Cost $86,952,591) | | | 100.0 | | | | 85,317,203 | |
| Other Assets and Liabilities, Net | | | 0.0 | | | | (23,461 | ) |
| Net Assets | | | 100.0 | | | | 85,293,742 | |
A summary of the Fund’s transactions with affiliated investments during the year ended December 31, 2018 are as follows:
| | | | | | | | | | | | | | | | | | | | | | | | | | | | | | | | |
Value ($) at
12/31/2017 | | Purchases
Cost ($) | | | Sales
Proceeds ($) | | | Net
Realized
Gain/
(Loss) ($) | | | Net Change in
Unrealized
Appreciation
(Depreciation) ($) | | | Income ($) | | | Capital Gain
Distributions ($) | | | Number
of Shares
at
12/31/2018 | | | Value ($)
at
12/31/2018 | |
Securities Lending Collateral 0.0% | | | | | | | | | | | | | | | | | |
DWS Government & Agency Securities Portfolio “DWS Government Cash Institutional Shares”, 2.29% (a) (b) | |
| — | | | 0 | (c) | | | — | | | | — | | | | — | | | | 2,975 | | | | — | | | | — | | | | — | |
Cash Equivalent 2.9% | | | | | | | | | | | | | | | | | |
DWS Central Cash Management Government Fund, 2.41% (a) | |
| 4,418,900 | | | 38,654,188 | | | | 40,575,279 | | | | — | | | | — | | | | 60,969 | | | | — | | | | 2,497,809 | | | | 2,497,809 | |
| 4,418,900 | | | 38,654,188 | | | | 40,575,279 | | | | — | | | | — | | | | 63,944 | | | | — | | | | 2,497,809 | | | | 2,497,809 | |
| * | Non-income producing security. |
| (a) | Affiliated fund managed by DWS Investment Management Americas, Inc. The rate shown is the annualizedseven-day yield at period end. |
| (b) | Represents collateral held in connection with securities lending. Income earned by the Fund is net of borrower rebates. |
| (c) | Represents the net increase (purchase cost) or decrease (sales proceeds) in the amount invested for the year ended December 31, 2018. |
REIT: Real Estate Investment Trust
Fair Value Measurements
Various inputs are used in determining the value of the Fund’s investments. These inputs are summarized in three broad levels. Level 1 includes quoted prices in active markets for identical securities. Level 2 includes other significant observable inputs (including quoted prices for similar securities, interest rates, prepayment speeds and credit risk). Level 3 includes significant unobservable inputs (including the Fund’s own assumptions in determining the fair value of investments). The level assigned to the securities valuations may not be an indication of the risk or liquidity associated with investing in those securities.
The following is a summary of the inputs used as of December 31, 2018 in valuing the Fund’s investments. For information on the Fund’s policy regarding the valuation of investments, please refer to the Security Valuation section of Note A in the accompanying Notes to Financial Statements.
| | | | | | | | | | | | | | | | |
| Assets | | Level 1 | | | Level 2 | | | Level 3 | | | Total | |
| Common Stocks (d) | | $ | 82,819,394 | | | $ | — | | | $ | — | | | $ | 82,819,394 | |
Short-Term Investment | | | 2,497,809 | | | | — | | | | — | | | | 2,497,809 | |
| Total | | $ | 85,317,203 | | | $ | — | | | $ | — | | | $ | 85,317,203 | |
| (d) | See Investment Portfolio for additional detailed categorizations. |
The accompanying notes are an integral part of the financial statements.
| | | | | | |
| | 8 | | | | | | Deutsche DWS Variable Series II — DWS Small Mid Cap Value VIP |
Statement of Assets and Liabilities
| | | | |
| as of December 31, 2018 | | | | |
| |
| Assets | | | | |
| Investments innon-affiliated securities, at value (cost $84,454,782) | | $ | 82,819,394 | |
| Investment in DWS Central Cash Management Government Fund (cost $2,497,809) | | | 2,497,809 | |
| Receivable for Fund shares sold | | | 31,502 | |
| Dividends receivable | | | 89,483 | |
| Interest receivable | | | 5,489 | |
| Other assets | | | 2,244 | |
| Total assets | | | 85,445,921 | |
| |
| Liabilities | | | | |
| Payable for Fund shares redeemed | | | 15,067 | |
| Accrued management fee | | | 37,563 | |
| Accrued Trustees’ fees | | | 2,187 | |
| Other accrued expenses and payables | | | 97,362 | |
| Total liabilities | | | 152,179 | |
| Net assets, at value | | $ | 85,293,742 | |
| |
| Net Assets Consist of | | | | |
| Distributable earnings (loss) | | | 5,558,368 | |
| Paid-in capital | | | 79,735,374 | |
| Net assets, at value | | $ | 85,293,742 | |
| |
| Net Asset Value | | | | |
Class A | | | | |
| |
| Net Asset Value, offering and redemption price per share ($70,125,075 ÷ 5,742,711 outstanding shares of beneficial interest, no par value, unlimited number of shares authorized) | | $ | 12.21 | |
Class B | | | | |
| |
| Net Asset Value, offering and redemption price per share ($15,168,667 ÷ 1,243,269 outstanding shares of beneficial interest, no par value, unlimited number of shares authorized) | | $ | 12.20 | |
Statement of Operations
| | | | |
| for the year ended December 31, 2018 | |
| |
| Investment Income | | | | |
| Income: | | | | |
| Dividends | | $ | 1,478,463 | |
| Income distributions — DWS Cash Management Government Fund | | | 60,969 | |
| Securities lending income, net of borrower rebates | | | 2,975 | |
| Total income | | | 1,542,407 | |
| Expenses: | | | | |
| Management fee | | | 688,120 | |
| Administration fee | | | 105,865 | |
| Services to Shareholders | | | 2,863 | |
| Record keeping fee (Class B) | | | 22,518 | |
| Distribution service fees (Class B) | | | 45,904 | |
| Custodian fee | | | 5,093 | |
| Professional fees | | | 71,591 | |
| Reports to shareholders | | | 27,630 | |
| Trustees’ fees and expenses | | | 6,881 | |
| Other | | | 8,563 | |
| Total expenses before expense reductions | | | 985,028 | |
| Expense reductions | | | (63,258 | ) |
| Total expenses after expense reductions | | | 921,770 | |
| Net investment income | | | 620,637 | |
| |
| Realized and Unrealized gain (loss) | | | | |
| Net realized gain (loss) from investments | | | 6,571,650 | |
| Change in net unrealized appreciation (depreciation) on investments | | | (23,519,638 | ) |
| Net gain (loss) | | | (16,947,988 | ) |
| Net increase (decrease) in net assets resulting from operations | | $ | (16,327,351 | ) |
The accompanying notes are an integral part of the financial statements.
| | | | |
Deutsche DWS Variable Series II — DWS Small Mid Cap Value VIP | | | | | 9 |
Statements of Changes in Net Assets
| | | | | | | | |
| | | Years Ended December 31, | |
| Increase (Decrease) in Net Assets | | 2018 | | | 2017 | |
| Operations: | | | | | | | | |
| Net investment income (loss) | | $ | 620,637 | | | $ | 1,467,106 | |
| Net realized gain (loss) | | | 6,571,650 | | | | 18,971,820 | |
| Change in net unrealized appreciation (depreciation) | | | (23,519,638 | ) | | | (5,654,443 | ) |
| Net increase (decrease) in net assets resulting from operations | | | (16,327,351 | ) | | | 14,784,483 | |
| Distributions to shareholders: | | | | | | | | |
Class A | | | (17,037,935 | ) | | | (4,370,464 | ) |
Class B | | | (3,363,724 | ) | | | (412,631 | ) |
| Total distributions | | | (20,401,659 | ) | | | (4,783,095 | )* |
| Fund share transactions: | | | | | | | | |
Class A | | | | | | | | |
| Proceeds from shares sold | | | 4,320,688 | | | | 6,806,078 | |
| Reinvestment of distributions | | | 17,037,935 | | | | 4,370,464 | |
| Payments for shares redeemed | | | (16,960,024 | ) | | | (77,117,368 | ) |
| Net increase (decrease) in net assets from Class A share transactions | | | 4,398,599 | | | | (65,940,826 | ) |
Class B | | | | | | | | |
| Proceeds from shares sold | | | 2,796,123 | | | | 4,800,663 | |
| Reinvestment of distributions | | | 3,363,724 | | | | 412,631 | |
| Payments for shares redeemed | | | (3,194,564 | ) | | | (3,308,695 | ) |
| Net increase (decrease) in net assets from Class B share transactions | | | 2,965,283 | | | | 1,904,599 | |
| Increase (decrease) in net assets | | | (29,365,128 | ) | | | (54,034,839 | ) |
| Net assets at beginning of period | | | 114,658,870 | | | | 168,693,709 | |
| | |
| Net assets at end of period | | $ | 85,293,742 | | | $ | 114,658,870 | ** |
| | |
| Other Information | | | | | | |
Class A | | | | | | | | |
| Shares outstanding at beginning of period | | | 5,375,574 | | | | 9,208,579 | |
| Shares sold | | | 286,538 | | | | 399,609 | |
| Shares issued to shareholders in reinvestment of distributions | | | 1,188,970 | | | | 259,221 | |
| Shares redeemed | | | (1,108,371 | ) | | | (4,491,835 | ) |
| Net increase (decrease) in Class A shares | | | 367,137 | | | | (3,833,005 | ) |
| | |
| Shares outstanding at end of period | | | 5,742,711 | | | | 5,375,574 | |
Class B | | | | | | | | |
| Shares outstanding at beginning of period | | | 1,037,183 | | | | 923,852 | |
| Shares sold | | | 183,198 | | | | 283,457 | |
| Shares issued to shareholders in reinvestment of distributions | | | 234,243 | | | | 24,445 | |
| Shares redeemed | | | (211,355 | ) | | | (194,571 | ) |
| Net increase (decrease) in Class B shares | | | 206,086 | | | | 113,331 | |
| | |
| Shares outstanding at end of period | | | 1,243,269 | | | | 1,037,183 | |
| * | Includes distributions from net investment income of $1,100,828 and $59,126 for Class A and B shares, respectively and distributions from net realized gains of $3,269,636 and $353,503 for Class A and B shares, respectively. |
| ** | Includes undistributed net investment income of $1,432,026. |
The accompanying notes are an integral part of the financial statements.
| | | | | | |
| | 10 | | | | | | Deutsche DWS Variable Series II — DWS Small Mid Cap Value VIP |
Financial Highlights
| | | | | | | | | | | | | | | | | | | | |
| | | Years Ended December 31, | |
| Class A | | 2018 | | | 2017 | | | 2016 | | | 2015 | | | 2014 | |
| | | | | |
| Selected Per Share Data | | | | | | | | | | | | | | | | | | | | |
| Net asset value, beginning of period | | | $17.88 | | | | $16.65 | | | | $15.97 | | | | $17.79 | | | | $17.08 | |
| Income (loss) from investment operations: | | | | | | | | | | | | | | | | | | | | |
Net investment incomea | | | .10 | | | | .17 | | | | .15 | | | | .09 | | | | .05 | |
Net realized and unrealized gain (loss) | | | (2.47 | ) | | | 1.55 | | | | 2.34 | | | | (.31 | ) | | | .88 | |
Total from investment operations | | | (2.37 | ) | | | 1.72 | | | | 2.49 | | | | (.22 | ) | | | .93 | |
| Less distributions from: | | | | | | | | | | | | | | | | | | | | |
Net investment income | | | (.24 | ) | | | (.12 | ) | | | (.10 | ) | | | (.05 | ) | | | (.14 | ) |
Net realized gains | | | (3.06 | ) | | | (.37 | ) | | | (1.71 | ) | | | (1.55 | ) | | | (.08 | ) |
Total distributions | | | (3.30 | ) | | | (.49 | ) | | | (1.81 | ) | | | (1.60 | ) | | | (.22 | ) |
| Net asset value, end of period | | | $12.21 | | | | $17.88 | | | | $16.65 | | | | $15.97 | | | | $17.79 | |
| Total Return (%) | | | (16.01 | )b | | | 10.52 | b | | | 16.89 | b | | | (1.91 | ) | | | 5.53 | |
| | | | | |
| Ratios to Average Net Assets and Supplemental Data | | | | | | | | | | | | | | | | | | | | |
| Net assets, end of period ($ millions) | | | 70 | | | | 96 | | | | 153 | | | | 161 | | | | 205 | |
| Ratio of expenses before expense reductions (%)c | | | .87 | | | | .83 | | | | .83 | | | | .80 | | | | .82 | |
| Ratio of expenses after expense reductions (%)c | | | .81 | | | | .83 | | | | .82 | | | | .80 | | | | .82 | |
| Ratio of net investment income (%) | | | .65 | | | | .98 | | | | .99 | | | | .51 | | | | .32 | |
| Portfolio turnover rate (%) | | | 64 | | | | 35 | | | | 53 | | | | 25 | | | | 34 | |
| a | Based on average shares outstanding during the period. |
| b | Total return would have been lower had certain expenses not been reduced. |
| c | Expense ratio does not reflect charges and fees associated with the separate account that invests in the Fund or any variable life insurance policy or variable annuity contract for which the Fund is an investment option. |
| | | | | | | | | | | | | | | | | | | | |
| | | Years Ended December 31, | |
| Class B | | 2018 | | | 2017 | | | 2016 | | | 2015 | | | 2014 | |
| | | | | |
| Selected Per Share Data | | | | | | | | | | | | | | | | | | | | |
| Net asset value, beginning of period | | | $17.86 | | | | $16.63 | | | | $15.95 | | | | $17.77 | | | | $17.07 | |
| Income (loss) from investment operations: | | | | | | | | | | | | | | | | | | | | |
Net investment incomea | | | .05 | | | | .11 | | | | .09 | | | | .02 | | | | (.01 | ) |
Net realized and unrealized gain (loss) | | | (2.48 | ) | | | 1.55 | | | | 2.34 | | | | (.29 | ) | | | .87 | |
Total from investment operations | | | (2.43 | ) | | | 1.66 | | | | 2.43 | | | | (.27 | ) | | | .86 | |
| Less distributions from: | | | | | | | | | | | | | | | | | | | | |
Net investment income | | | (.17 | ) | | | (.06 | ) | | | (.04 | ) | | | — | | | | (.08 | ) |
Net realized gains | | | (3.06 | ) | | | (.37 | ) | | | (1.71 | ) | | | (1.55 | ) | | | (.08 | ) |
Total distributions | | | (3.23 | ) | | | (.43 | ) | | | (1.75 | ) | | | (1.55 | ) | | | (.16 | ) |
| Net asset value, end of period | | | $12.20 | | | | $17.86 | | | | $16.63 | | | | $15.95 | | | | $17.77 | |
| Total Return (%) | | | (16.32 | )b | | | 10.13 | b | | | 16.47 | b | | | (2.21 | ) | | | 5.09 | |
| | | | | |
| Ratios to Average Net Assets and Supplemental Data | | | | | | | | | | | | | | | | | | | | |
| Net assets, end of period ($ millions) | | | 15 | | | | 19 | | | | 15 | | | | 14 | | | | 17 | |
| Ratio of expenses before expense reductions (%)c | | | 1.24 | | | | 1.19 | | | | 1.19 | | | | 1.16 | | | | 1.17 | |
| Ratio of expenses after expense reductions (%)c | | | 1.16 | | | | 1.19 | | | | 1.18 | | | | 1.16 | | | | 1.17 | |
| Ratio of net investment income (loss) (%) | | | .30 | | | | .65 | | | | .57 | | | | .14 | | | | (.04 | ) |
| Portfolio turnover rate (%) | | | 64 | | | | 35 | | | | 53 | | | | 25 | | | | 34 | |
| a | Based on average shares outstanding during the period. |
| b | Total return would have been lower had certain expenses not been reduced. |
| c | Expense ratio does not reflect charges and fees associated with the separate account that invests in the Fund or any variable life insurance policy or variable annuity contract for which the Fund is an investment option. |
The accompanying notes are an integral part of the financial statements.
| | | | |
Deutsche DWS Variable Series II — DWS Small Mid Cap Value VIP | | | | | 11 |
| | |
| Notes to Financial Statements | | |
A. Organization and Significant Accounting Policies
DWS Small Mid Cap Value VIP (formerly Deutsche Small Mid Cap Value VIP) (the “Fund”) is a diversified series of Deutsche DWS Variable Series II (formerly Deutsche Variable Series II) (the “Trust”), which is registered under the Investment Company Act of 1940, as amended (the “1940 Act”), as anopen-end management investment company organized as a Massachusetts business trust.
Multiple Classes of Shares of Beneficial Interest. The Fund offers two classes of shares (Class A shares and Class B shares). Sales of Class B shares are subject to recordkeeping fees up to 0.15% and Rule12b-1 fees under the 1940 Act equal to an annual rate of 0.25% of the average daily net assets of the Class B shares of the Fund. Class A shares are not subject to such fees.
Investment income, realized and unrealized gains and losses, and certainfund-level expenses and expense reductions, if any, are borne pro rata on the basis of relative net assets by the holders of all classes of shares except that each class bears certain expenses unique to that class (including the applicable Rule12b-1 fee and recordkeeping fees). Differences inclass-level expenses may result in payment of different per share dividends by class. All shares have equal rights with respect to voting subject toclass-specific arrangements.
The Fund’s financial statements are prepared in accordance with accounting principles generally accepted in the United States of America (“U.S. GAAP”) which require the use of management estimates. Actual results could differ from those estimates. The Fund qualifies as an investment company under Topic 946 of Accounting Standards Codification of U.S. GAAP. The policies described below are followed consistently by the Fund in the preparation of its financial statements.
In October 2018, the Securities and Exchange Commission adopted amendments to certain disclosure requirements in Securities Act Release No. 33-10532, Disclosure Update and Simplification, which is intended to facilitate the disclosure of information to investors and simplify compliance without significantly altering the total mix of information provided to investors. Effective with the current reporting period, the Fund adopted the amendments with the impacts being that the Fund is no longer required to present components of distributable earnings on the Statement of Assets and Liabilities or the sources of distributable earnings and the amount of undistributed net investment income on the Statements of Changes in Net Assets.
Security Valuation. Investments are stated at value determined as of the close of regular trading on the New York Stock Exchange on each day the exchange is open for trading.
Various inputs are used in determining the value of the Fund’s investments. These inputs are summarized in three broad levels. Level 1 includes quoted prices in active markets for identical securities. Level 2 includes other significant observable inputs (including quoted prices for similar securities, interest rates, prepayment speeds and credit risk). Level 3 includes significant unobservable inputs (including the Fund’s own assumptions in determining the fair value of investments). The level assigned to the securities valuations may not be an indication of the risk or liquidity associated with investing in those securities.
Equity securities are valued at the most recent sale price or official closing price reported on the exchange (U.S. or foreign) orover-the-counter market on which they trade. Securities for which no sales are reported are valued at the calculated mean between the most recent bid and asked quotations on the relevant market or, if a mean cannot be determined, at the most recent bid quotation. Equity securities are generally categorized as Level 1.
Investments inopen-end investment companies are valued at their net asset value each business day and are categorized as Level 1.
Securities and other assets for which market quotations are not readily available or for which the above valuation procedures are deemed not to reflect fair value are valued in a manner that is intended to reflect their fair value as determined in accordance with procedures approved by the Board and are generally categorized as Level 3. In accordance with the Fund’s valuation procedures, factors considered in determining value may include, but are not limited to, the type of the security; the size of the holding; the initial cost of the security; the existence of any contractual restrictions on the security’s disposition; the price and extent of public trading in similar securities of the issuer or of comparable companies; quotations or evaluated prices frombroker-dealers and/or pricing services; information obtained from the issuer, analysts, and/or the appropriate stock exchange (forexchange-traded securities); an analysis of the company’s or issuer’s financial statements; an evaluation of the forces that influence the issuer and the market(s) in which the security is purchased and sold; and with respect to debt securities, the maturity, coupon, creditworthiness, currency
| | | | | | |
| | 12 | | | | | | Deutsche DWS Variable Series II — DWS Small Mid Cap Value VIP |
denomination and the movement of the market in which the security is normally traded. The value determined under these procedures may differ from published values for the same securities.
Disclosure about the classification of fair value measurements is included in a table following the Fund’s Investment Portfolio.
Foreign Currency Translations. The books and records of the Fund are maintained in U.S. dollars. Investment securities and other assets and liabilities denominated in a foreign currency are translated into U.S. dollars at the prevailing exchange rates at period end. Purchases and sales of investment securities, income and expenses are translated into U.S. dollars at the prevailing exchange rates on the respective dates of the transactions.
Net realized and unrealized gains and losses on foreign currency transactions represent net gains and losses between trade and settlement dates on securities transactions, the acquisition and disposition of foreign currencies, and the difference between the amount of net investment income accrued and the U.S. dollar amount actually received. The portion of both realized and unrealized gains and losses on investments that results from fluctuations in foreign currency exchange rates is not separately disclosed but is included with net realized and unrealized gain/appreciation and loss/depreciation on investments.
Securities Lending. Brown Brothers Harriman & Co., as lending agent, lends securities of the Fund to certain financial institutions under the terms of its securities lending agreement. During the term of the loans, the Fund continues to receive interest and dividends generated by the securities and to participate in any changes in their market value. The Fund requires the borrowers of the securities to maintain collateral with the Fund consisting of either cash or liquid, unencumbered assets having a value at least equal to the value of the securities loaned. When the collateral falls below specified amounts, the lending agent will use its best effort to obtain additional collateral on the next business day to meet required amounts under the securities lending agreement. As of period end, any securities on loan were collateralized by cash. During the year ended December 31, 2018, the Fund invested the cash collateral into a joint trading account in affiliated money market funds managed by DWS Investment Management Americas, Inc. As of December 31, 2018, the Fund invested the cash collateral in DWS Government & Agency Securities Portfolio. DWS Investment Management Americas Inc. receives a management/administration fee (0.12% annualized effective rate as of December 31, 2018) on the cash collateral invested in DWS Government & Agency Securities Portfolio. The Fund receives compensation for lending its securities either in the form of fees or by earning interest on invested cash collateral net of borrower rebates and fees paid to a lending agent. Either the Fund or the borrower may terminate the loan at any time, and the borrower, after notice, is required to return borrowed securities within a standard time period There may be risks of delay and costs in recovery of securities or even loss of rights in the collateral should the borrower of the securities fail financially. If the Fund is not able to recover securities lent, the Fund may sell the collateral and purchase a replacement investment in the market, incurring the risk that the value of the replacement security is greater than the value of the collateral. The Fund is also subject to all investment risks associated with the reinvestment of any cash collateral received, including, but not limited to, interest rate, credit and liquidity risk associated with such investments.
As of December 31, 2018, the Fund had no securities on loan.
Taxes. The Fund’s policy is to comply with the requirements of the Internal Revenue Code, as amended, which are applicable to regulated investment companies and to distribute all of its taxable income to its shareholders.
The Fund has reviewed the tax positions for the open tax years as of December 31, 2018 and has determined that no provision for income tax and/or uncertain tax positions is required in the Fund’s financial statements. The Fund’s federal tax returns for the prior three fiscal years remain open subject to examination by the Internal Revenue Service.
Distribution of Income and Gains. Distributions from net investment income of the Fund, if any, are declared and distributed to shareholders annually. Net realized gains from investment transactions, in excess of available capital loss carryforwards, would be taxable to the Fund if not distributed and, therefore, will be distributed to shareholders at least annually. The Fund may also make additional distributions for tax purposes if necessary.
The timing and characterization of certain income and capital gain distributions are determined annually in accordance with federal tax regulations which may differ from accounting principles generally accepted in the United States of America. These differences primarily relate to income received from Real Estate Investment Trusts and certain securities sold at a loss. As a result, net investment income (loss) and net realized gain
| | | | |
Deutsche DWS Variable Series II — DWS Small Mid Cap Value VIP | | | | | 13 |
(loss) on investment transactions for a reporting period may differ significantly from distributions during such period. Accordingly, the Fund may periodically make reclassifications among certain of its capital accounts without impacting the net asset value of the Fund.
At December 31, 2018, the Fund’s components of distributable earnings on a tax basis were as follows:
| | | | |
| Undistributed ordinary income* | | $ | 615,277 | |
| Undistributed long-term capital gains | | $ | 6,638,069 | |
| Unrealized appreciation (depreciation) on investments | | $ | (1,725,584 | ) |
At December 31, 2018, the aggregate cost of investments for federal income tax purposes was $87,042,787. The net unrealized depreciation for all investments based on tax cost was $1,725,584. This consisted of aggregate gross unrealized appreciation for all investments in which there was an excess of value over tax cost of $9,441,928 aggregate gross unrealized depreciation for all investments in which was an excess of tax cost over value of $11,167,512.
In addition, the tax character of distributions paid by the Fund is summarized as follows:
| | | | | | | | |
| | | Years Ended December 31, | |
| | | 2018 | | | 2017 | |
| Distributions from ordinary income* | | $ | 1,404,457 | | | $ | 1,159,954 | |
| Distributions from long-term capital gains | | $ | 18,997,202 | | | $ | 3,623,141 | |
| * | For tax purposes, short-term capital gain distributions are considered ordinary income distributions. |
Expenses. Expenses of the Trust arising in connection with a specific fund are allocated to that fund. Other Trust expenses which cannot be directly attributed to a fund are apportioned among the funds in the Trust based upon the relative net assets or other appropriate measures.
Contingencies. In the normal course of business, the Fund may enter into contracts with service providers that contain general indemnification clauses. The Fund’s maximum exposure under these arrangements is unknown, as this would involve future claims that may be made against the Fund that have not yet been made. However, based on experience, the Fund expects the risk of loss to be remote.
Real Estate Investment Trusts.The Fund at its fiscal year end recharacterizes distributions received from a Real Estate Investment Trust (“REIT”) investment based on information provided by the REIT into the following categories: ordinary income,long-term andshort-term capital gains, and return of capital. If information is not available timely from a REIT, the recharacterization will be estimated for financial reporting purposes and a recharacterization will be made to the accounting records in the following year when such information becomes available. Distributions received from REITs in excess of income are recorded as either a reduction of cost of investments or realized gains.
Other. Investment transactions are accounted for on a trade date plus one basis for daily net asset value calculations. However, for financial reporting purposes, investment transactions are reported on trade date. Interest income is recorded on the accrual basis. Dividend income is recorded on theex-dividend date net of foreign withholding taxes. Realized gains and losses from investment transactions are recorded on an identified cost basis. Proceeds from litigation payments, if any, are included in net realized gain (loss) from investments.
B. Purchases and Sales of Securities
During the year ended December 31, 2018, purchases and sales of investment transactions (excludingshort-term investments) aggregated $65,451,292 and $75,262,064, respectively.
C. Related Parties
Management Agreement. Under the Investment Management Agreement with DWS Investment Management Americas, Inc. (formerly Deutsche Investment Management Americas Inc.) (“DIMA” or the “Advisor”), an indirect, wholly owned subsidiary of DWS Group GmbH & Co. KGaA (“DWS Group”), the Advisor directs the investments of the Fund in accordance with its investment objectives, policies and restrictions. The Advisor determines the securities, instruments and other contracts relating to investments to be purchased, sold or entered into by the Fund.
| | | | | | |
| | 14 | | | | | | Deutsche DWS Variable Series II — DWS Small Mid Cap Value VIP |
Pursuant to the Investment Management Agreement with the Advisor, the Fund pays a monthly management fee based on the Fund’s average daily net assets, computed and accrued daily and payable monthly, at the following annual rates:
| | | | |
| First $250 million | | | .650 | % |
| Next $750 million | | | .620 | % |
| Next $1.5 billion | | | .600 | % |
| Next $2.5 billion | | | .580 | % |
| Next $2.5 billion | | | .550 | % |
| Next $2.5 billion | | | .540 | % |
| Next $2.5 billion | | | .530 | % |
| Over $12.5 billion | | | .520 | % |
Accordingly, for the year ended December 31, 2018, the fee pursuant to the Investment Management Agreement was equivalent to an annual rate (exclusive of any applicable waivers/reimbursements) of 0.65% of the Fund’s average daily net assets.
For the period from January 1, 2018 through April 30, 2019, the Advisor has contractually agreed to waive its fees and/or reimburse certain operating expenses to the extent necessary to maintain the total annual operating expenses (excluding certain expenses such as extraordinary expenses, taxes, brokerage and interest expense) of each class as follows:
| | | | |
| Class A | | | .81 | % |
| Class B | | | 1.16 | % |
For the year ended December 31, 2018, fees waived and/or expenses reimbursed for each class were as follows:
| | | | |
| Class A | | $ | 48,572 | |
| Class B | | | 14,686 | |
| | | $ | 63,258 | |
Administration Fee. Pursuant to an Administrative Services Agreement, DIMA provides most administrative services to the Fund. For all services provided under the Administrative Services Agreement, the Fund pays DIMA an annual fee (“Administration Fee”) of 0.10% of the Fund’s average daily net assets, computed and accrued daily and payable monthly. For the year ended December 31, 2018, the Administration Fee was $105,865, of which $7,577 is unpaid.
Service Provider Fees. DWS Service Company (“DSC”), an affiliate of the Advisor, is the transfer agent,dividend-paying agent and shareholder service agent for the Fund. Pursuant to asub-transfer agency agreement between DSC and DST Systems, Inc. (“DST”), DSC has delegated certain transfer agent,dividend-paying agent and shareholder service agent functions to DST. DSC compensates DST out of the shareholder servicing fee it receives from the Fund. For the year ended December 31, 2018, the amounts charged to the Fund by DSC were as follows:
| | | | | | | | |
| Service to Shareholders | | Total
Aggregated | | | Unpaid at
December 31, 2018 | |
| Class A | | $ | 627 | | | $ | 104 | |
| Class B | | | 470 | | | | 78 | |
| | | $ | 1,097 | | | $ | 182 | |
Distribution Service Agreement. Under the Fund’s Class B12b-1 plan, DWS Distributors, Inc. (“DDI”) received a fee (“Distribution Service Fee”) of 0.25% of average daily net assets of Class B shares. For the year ended December 31, 2018, the Distribution Service Fee aggregated $45,904, of which $3,352 is unpaid.
Typesetting and Filing Service Fees. Under an agreement with the Fund, DIMA is compensated for providing certainpre-press and regulatory filing services to the Fund. For the year ended December 31, 2018, the amount charged to the Fund by DIMA included in the Statement of Operations under “Reports to shareholders” aggregated $9,095, of which $6,374 is unpaid.
Trustees’ Fees and Expenses. The Fund paid retainer fees to each Trustee not affiliated with the Advisor, plus specified amounts to the Board Chairperson and to each committee Chairperson.
| | | | |
Deutsche DWS Variable Series II — DWS Small Mid Cap Value VIP | | | | | 15 |
Affiliated Cash Management Vehicles. The Fund may invest uninvested cash balances in DWS Central Cash Management Government Fund and DWS ESG Liquidity Fund, affiliated money market funds which are managed by the Advisor. Each affiliated money market fund is managed in accordance withRule 2a-7 under the 1940 Act, which governs the quality, maturity, diversity and liquidity of instruments in which a money market fund may invest. DWS Central Cash Management Government Fund seeks to maintain a stable net asset value, and DWS ESG Liquidity Fund maintains a floating net asset value. The Fund indirectly bears its proportionate share of the expenses of each affiliated money market fund in which it invests. DWS Central Cash Management Government Fund does not pay the Advisor an investment management fee. To the extent that DWS ESG Liquidity Fund pays an investment management fee to the Advisor, the Advisor will waive an amount of the investment management fee payable to the Advisor by the Fund equal to the amount of the investment management fee payable on the Fund’s assets invested in DWS ESG Liquidity Fund.
D. Ownership of the Fund
At December 31, 2018, one participating insurance company was owner of record of 10% or more of the total outstanding Class A shares of the Fund, owning 70%. Four participating insurance companies were owners of record of 10% or more of the total outstanding Class B shares of the Fund, each owning 32%, 21%, 17% and 13%.
E. Line of Credit
The Fund and other affiliated funds (the “Participants”) share in a $400 million revolving credit facility provided by a syndication of banks. The Fund may borrow for temporary or emergency purposes, including the meeting of redemption requests that otherwise might require the untimely disposition of securities. The Participants are charged an annual commitment fee which is allocated based on net assets, among each of the Participants. Interest is calculated at a rate per annum equal to the sum of the Federal Funds Rate plus 1.25 percent plus if theone-month LIBOR exceeds the Federal Funds Rate, the amount of such excess. The Fund may borrow up to a maximum of 33 percent of its net assets under the agreement. The Fund had no outstanding loans at December 31, 2018.
| | | | | | |
| | 16 | | | | | | Deutsche DWS Variable Series II — DWS Small Mid Cap Value VIP |
Report of Independent Registered Public Accounting Firm
To the Board of Trustees of Deutsche DWS Variable Series II and Shareholders of DWS Small Mid Cap Value VIP:
Opinion on the Financial Statements
We have audited the accompanying statement of assets and liabilities of DWS Small Mid Cap Value VIP (formerly Deutsche Small Mid Cap Value VIP) (the “Fund”) (one of the funds constituting Deutsche DWS Variable Series II (formerly Deutsche Variable Series II)) (the “Trust”), including the investment portfolio, as of December 31, 2018, and the related statement of operations for the year then ended, the statements of changes in net assets for each of the two years in the period then ended, the financial highlights for each of the five years in the period then ended and the related notes (collectively referred to as the “financial statements”). In our opinion, the financial statements present fairly, in all material respects, the financial position of the Fund (one of the funds constituting Deutsche DWS Variable Series II) at December 31, 2018, the results of its operations for the year then ended, the changes in its net assets for each of the two years in the period then ended and its financial highlights for each of the five years in the period then ended, in conformity with U.S. generally accepted accounting principles.
Basis for Opinion
These financial statements are the responsibility of the Trust’s management. Our responsibility is to express an opinion on the Fund’s financial statements based on our audits. We are a public accounting firm registered with the Public Company Accounting Oversight Board (United States) (“PCAOB”) and are required to be independent with respect to the Trust in accordance with the U.S. federal securities laws and the applicable rules and regulations of the Securities and Exchange Commission and the PCAOB.
We conducted our audits in accordance with the standards of the PCAOB. Those standards require that we plan and perform the audit to obtain reasonable assurance about whether the financial statements are free of material misstatement, whether due to error or fraud. The Trust is not required to have, nor were we engaged to perform, an audit of the Trust’s internal control over financial reporting. As part of our audits, we are required to obtain an understanding of internal control over financial reporting, but not for the purpose of expressing an opinion on the effectiveness of the Trust’s internal control over financial reporting. Accordingly, we express no such opinion.
Our audits included performing procedures to assess the risks of material misstatement of the financial statements, whether due to error or fraud, and performing procedures that respond to those risks. Such procedures included examining, on a test basis, evidence regarding the amounts and disclosures in the financial statements. Our procedures included confirmation of securities owned as of December 31, 2018, by correspondence with the custodian and brokers. Our audits also included evaluating the accounting principles used and significant estimates made by management, as well as evaluating the overall presentation of the financial statements. We believe that our audits provide a reasonable basis for our opinion.

We have served as the auditor of one or more investment companies in the DWS family of funds since at least 1979, but we are unable to determine the specific year.
Boston, Massachusetts
February 14, 2019
| | | | |
Deutsche DWS Variable Series II — DWS Small Mid Cap Value VIP | | | | | 17 |
| | |
| Information About Your Fund’s Expenses | | (Unaudited) |
As an investor of the Fund, you incur two types of costs: ongoing expenses and transaction costs. Ongoing expenses include management fees, distribution and service(12b-1) fees and other Fund expenses. Examples of transaction costs include contract charges, which are not shown in this section. The following tables are intended to help you understand your ongoing expenses (in dollars) of investing in the Fund and to help you compare these expenses with the ongoing expenses of investing in other mutual funds. In the most recent six-month period, the Fund limited these expenses; had it not done so, expenses would have been higher. The example in the table is based on an investment of $1,000 invested at the beginning of thesix-month period and held for the entire period (July 1, 2018 to December 31, 2018).
The tables illustrate your Fund’s expenses in two ways:
| – | | Actual Fund Return. This helps you estimate the actual dollar amount of ongoing expenses (but not transaction costs) paid on a $1,000 investment in the Fund using the Fund’s actual return during the period. To estimate the expenses you paid over the period, simply divide your account value by $1,000 (for example, an $8,600 account value divided by $1,000 = 8.6), then multiply the result by the number in the “Expenses Paid per $1,000” line under the share class you hold. |
| – | | Hypothetical 5% Fund Return.This helps you to compare your Fund’s ongoing expenses (but not transaction costs) with those of other mutual funds using the Fund’s actual expense ratio and a hypothetical rate of return of 5% per year before expenses. Examples using a 5% hypothetical Fund return may be found in the shareholder reports of other mutual funds. The hypothetical account values and expenses may not be used to estimate the actual ending account balance or expenses you paid for the period. |
Please note that the expenses shown in these tables are meant to highlight your ongoing expenses only and do not reflect any transaction costs. The “Expenses Paid per $1,000” line of the tables is useful in comparing ongoing expenses only and will not help you determine the relative total expense of owning different funds. If these transaction costs had been included, your costs would have been higher.
| | | | | | | | |
| Expenses and Value of a $1,000 Investment for the six months ended December 31, 2018 | |
| | |
| Actual Fund Return | | | Class A | | | | Class B | |
| Beginning Account Value 7/1/18 | | $ | 1,000.00 | | | $ | 1,000.00 | |
| Ending Account Value 12/31/18 | | $ | 836.90 | | | $ | 835.00 | |
| Expenses Paid per $1,000* | | $ | 3.75 | | | $ | 5.37 | |
| | |
| Hypothetical 5% Fund Return | | | Class A | | | | Class B | |
| Beginning Account Value 7/1/18 | | $ | 1,000.00 | | | $ | 1,000.00 | |
| Ending Account Value 12/31/18 | | $ | 1,021.12 | | | $ | 1,019.36 | |
| Expenses Paid per $1,000* | | $ | 4.13 | | | $ | 5.90 | |
| * | Expenses are equal to the Fund’s annualized expense ratio for each share class, multiplied by the average account value over the period, multiplied by 184 (the number of days in the most recentsix-month period), then divided by 365. |
| | | | | | | | |
| Annualized Expense Ratios | | Class A | | | Class B | |
| Deutsche DWS Variable Series II — DWS Small Mid Cap Value VIP | | | .81 | % | | | 1.16 | % |
For more information, please refer to the Fund’s prospectus.
These tables do not reflect charges and fees (“contract charges”) associated with the separate account that invests in the Fund or any variable life insurance policy or variable annuity contract for which the Fund is an investment option.
For an analysis of the fees associated with an investment in the Fund or similar funds, please refer to the current and hypothetical expense calculators for Variable Insurance Products which can be found at dws.com/calculators.
| | | | | | |
| | 18 | | | | | | Deutsche DWS Variable Series II — DWS Small Mid Cap Value VIP |
| | |
| Tax Information | | (Unaudited) |
Please consult a tax advisor if you have questions about federal or state income tax laws, or on how to prepare your tax returns. If you have specific questions about your account, please contact your insurance provider.
The Fund paid distributions of $3.06 per share from net long-term capital gains during its year ended December 31, 2018.
Pursuant to Section 852 of the Internal Revenue Code, the Fund designates $7,357,000 as capital gain dividends for its year ended December 31, 2018.
For corporate shareholders, 100% of the ordinary dividends (i.e., income dividends plus short-term capital gains) paid during the Fund’s fiscal year ended December 31, 2018, qualified for the dividends received deduction.
Proxy Voting
The Trust’s policies and procedures for voting proxies for portfolio securities and information about how the Trust voted proxies related to its portfolio securities during the most recent12-month period ended June 30 are available on our Web site — dws.com/en-us/resources/proxy-voting — or on the SEC’s Web site — sec.gov. To obtain a written copy of the Trust’s policies and procedures without charge, upon request, call us toll free at (800)728-3337.
| | | | |
Deutsche DWS Variable Series II — DWS Small Mid Cap Value VIP | | | | | 19 |
Advisory Agreement Board Considerations and Fee Evaluation
The Board of Trustees (hereinafter referred to as the “Board” or “Trustees”) approved the renewal of DWS Small Mid Cap Value VIP’s (the “Fund”) investment management agreement (the “Agreement”) with DWS Investment Management Americas, Inc. (“DIMA”) in September 2018.
In terms of the process that the Board followed prior to approving the Agreement, shareholders should know that:
| – | | During the entire process, all of the Fund’s Trustees were independent of DIMA and its affiliates (the “Independent Trustees”). |
| – | | The Board met frequently during the past year to discuss fund matters and dedicated a substantial amount of time to contract review matters. Over the course of several months, the Board’s Contract Committee reviewed extensive materials received from DIMA, independent third parties and independent counsel. These materials included an analysis of the Fund’s performance, fees and expenses, and profitability from a fee consultant retained by the Fund’s Independent Trustees (the “Fee Consultant”). Based on its evaluation of the information provided, the Contract Committee presented its findings and recommendations to the Board. The Board then reviewed the Contract Committee’s findings and recommendations. |
| – | | The Board also received extensive information throughout the year regarding performance of the Fund. |
| – | | The Independent Trustees regularly met privately with counsel to discuss contract review and other matters. In addition, the Independent Trustees were advised by the Fee Consultant in the course of their review of the Fund’s contractual arrangements and considered a comprehensive report prepared by the Fee Consultant in connection with their deliberations. |
| – | | In connection with reviewing the Agreement, the Board also reviewed the terms of the Fund’s Rule12b-1 plan, distribution agreement, administrative services agreement, transfer agency agreement and other material service agreements. |
In connection with the contract review process, the Contract Committee and the Board considered the factors discussed below, among others. The Board also considered that DIMA and its predecessors have managed the Fund since its inception, and the Board believes that a long-term relationship with a capable, conscientious advisor is in the best interests of the Fund. The Board considered, generally, that shareholders chose to invest or remain invested in the Fund knowing that DIMA managed the Fund. DIMA is part of DWS Group GmbH & Co. KGaA (“DWS Group”). DWS Group is a global asset management business that offers a wide range of investing expertise and resources, including research capabilities in many countries throughout the world. In 2018, approximately 20% of DWS Group’s shares were sold in an initial public offering, with Deutsche Bank AG owning the remaining shares.
As part of the contract review process, the Board carefully considered the fees and expenses of each DWS fund overseen by the Board in light of the fund’s performance. In many cases, this led to the negotiation and implementation of expense caps. As part of these negotiations, the Board indicated that it would consider relaxing these caps in future years following sustained improvements in performance, among other considerations.
While shareholders may focus primarily on fund performance and fees, the Fund’s Board considers these and many other factors, including the quality and integrity of DIMA’s personnel and administrative support services provided by DIMA, such as back-office operations, fund valuations, and compliance policies and procedures.
Nature, Quality and Extent of Services.The Board considered the terms of the Agreement, including the scope of advisory services provided under the Agreement. The Board noted that, under the Agreement, DIMA provides portfolio management services to the Fund and that, pursuant to a separate administrative services agreement, DIMA provides administrative services to the Fund. The Board considered the experience and skills of senior management and investment personnel and the resources made available to such personnel. The Board reviewed the Fund’s performance over short-term and long-term periods and compared those returns to various agreed-upon performance measures, including market index(es) and a peer universe compiled using information supplied by Morningstar Direct (“Morningstar”), an independent fund data service. The Board also noted that it has put into place a process of identifying “Funds in Review” (e.g., funds performing poorly relative to a peer universe), and receives additional reporting from DIMA regarding such funds and, where appropriate, DIMA’s plans to address underperformance. The Board
| | | | | | |
| | 20 | | | | | | Deutsche DWS Variable Series II — DWS Small Mid Cap Value VIP |
believes this process is an effective manner of identifying and addressing underperforming funds. Based on the information provided, the Board noted that, for theone-, three- and five-year periods ended December 31, 2017, the Fund’s performance (Class A shares) was in the 4th quartile, 3rd quartile and 3rd quartile, respectively, of the applicable Morningstar universe (the 1st quartile being the best performers and the 4th quartile being the worst performers). The Board also observed that the Fund has outperformed its benchmark in theone-year period and has underperformed its benchmark in the three- and five-year periods ended December 31, 2017. The Board noted the disappointing investment performance of the Fund in recent periods and continued to discuss with senior management of DIMA the factors contributing to such underperformance and actions being taken to improve performance. The Board observed that the Fund had experienced improved relative performance during the first eight months of 2018. The Board recognized the efforts by DIMA in recent years to enhance its investment platform and improve long-term performance across the DWS fund complex.
Fees and Expenses. The Board considered the Fund’s investment management fee schedule, operating expenses and total expense ratios, and comparative information provided by Broadridge Financial Solutions, Inc. (“Broadridge”) and the Fee Consultant regarding investment management fee rates paid to other investment advisors by similar funds (1st quartile being the most favorable and 4th quartile being the least favorable). With respect to management fees paid to other investment advisors by similar funds, the Board noted that the contractual fee rates paid by the Fund, which include a 0.10% fee paid to DIMA under the Fund’s administrative services agreement, were lower than the median (1st quartile) of the applicable Broadridge peer group (based on Broadridge data provided as of December 31, 2017). The Board noted that the Fund’s Class A shares total (net) operating expenses were expected to be higher than the median (3rd quartile) of the applicable Broadridge expense universe (based on Broadridge data provided as of December 31, 2017, and analyzing Broadridge expense universe Class A (net) expenses less any applicable12b-1 fees) (“Broadridge Universe Expenses”). The Board also reviewed data comparing each share class’s total (net) operating expenses to the applicable Broadridge Universe Expenses. The Board noted that the expense limitations agreed to by DIMA were expected to help the Fund’s total (net) operating expenses remain competitive. The Board considered the Fund’s management fee rate as compared to fees charged by DIMA to a comparable DWS U.S. registered fund (“DWS Funds”) and considered differences between the Fund and the comparable DWS Fund. The information requested by the Board as part of its review of fees and expenses also included information about institutional accounts (including anysub-advised funds and accounts) and funds offered primarily to European investors (“DWS Europe Funds”) managed by DWS Group. The Board noted that DIMA indicated that DWS Group does not manage any institutional accounts or DWS Europe Funds comparable to the Fund.
On the basis of the information provided, the Board concluded that management fees were reasonable and appropriate in light of the nature, quality and extent of services provided by DIMA.
Profitability. The Board reviewed detailed information regarding revenues received by DIMA under the Agreement. The Board considered the estimated costs to DIMA, andpre-tax profits realized by DIMA, from advising the DWS Funds, as well as estimates of thepre-tax profits attributable to managing the Fund in particular. The Board also received information regarding the estimated enterprise-wide profitability of DIMA and its affiliates with respect to all fund services in totality and by fund. The Board and the Fee Consultant reviewed DIMA’s methodology in allocating its costs to the management of the Fund. Based on the information provided, the Board concluded that thepre-tax profits realized by DIMA in connection with the management of the Fund were not unreasonable. The Board also reviewed certain publicly available information regarding the profitability of certain similar investment management firms. The Board noted that, while information regarding the profitability of such firms is limited (and in some cases is not necessarily prepared on a comparable basis), DIMA and its affiliates’ overall profitability with respect to the DWS Funds (after taking into account distribution and other services provided to the funds by DIMA and its affiliates) was lower than the overall profitability levels of most comparable firms for which such data was available.
Economies of Scale. The Board considered whether there are economies of scale with respect to the management of the Fund and whether the Fund benefits from any economies of scale. The Board noted that the Fund’s investment management fee schedule includes fee breakpoints. The Board concluded that the Fund’s fee schedule represents an appropriate sharing between the Fund and DIMA of such economies of scale as may exist in the management of the Fund at current asset levels.
Other Benefits to DIMA and Its Affiliates. The Board also considered the character and amount of other incidental or“fall-out” benefits received by DIMA and its affiliates, including any fees received by DIMA for administrative services provided to the Fund, any fees received by an affiliate of DIMA for transfer agency
| | | | |
Deutsche DWS Variable Series II — DWS Small Mid Cap Value VIP | | | | | 21 |
services provided to the Fund and any fees received by an affiliate of DIMA for distribution services. The Board also considered benefits to DIMA related to brokerage and soft-dollar allocations, including allocating brokerage to pay for research generated by parties other than the executing broker dealers, which pertain primarily to funds investing in equity securities. In addition, the Board considered the incidental public relations benefits to DIMA related to DWS Funds advertising and cross-selling opportunities among DIMA products and services. The Board considered these benefits in reaching its conclusion that the Fund’s management fees were reasonable.
Compliance. The Board considered the significant attention and resources dedicated by DIMA to its compliance processes in recent years. The Board noted in particular (i) the experience, seniority and time commitment of the individuals serving as DIMA’s and the Fund’s chief compliance officers and (ii) the substantial commitment of resources by DIMA and its affiliates to compliance matters, including the retention of compliance personnel.
Based on all of the information considered and the conclusions reached, the Board unanimously determined that the continuation of the Agreement is in the best interests of the Fund. In making this determination, the Board did not give particular weight to any single factor identified above. The Board considered these factors over the course of numerous meetings, certain of which were in executive session with only the Independent Trustees and counsel present. It is possible that individual Independent Trustees may have weighed these factors differently in reaching their individual decisions to approve the continuation of the Agreement.
| | | | | | |
| | 22 | | | | | | Deutsche DWS Variable Series II — DWS Small Mid Cap Value VIP |
Board Members and Officers
The following table presents certain information regarding the Board Members and Officers of the Fund. Each Board Member’s year of birth is set forth in parentheses after his or her name. Unless otherwise noted, (i) each Board Member has engaged in the principal occupation(s) noted in the table for at least the most recent five years, although not necessarily in the same capacity; and (ii) the address of each Independent Board Member is c/o Keith R. Fox, DWS Funds Board Chair, c/o Thomas R. Hiller, Ropes & Gray LLP, Prudential Tower, 800 Boylston Street, Boston, MA02199-3600. Except as otherwise noted below, the term of office for each Board Member is until the election and qualification of a successor, or until such Board Member sooner dies, resigns, is removed or as otherwise provided in the governing documents of the Fund. Because the Fund does not hold an annual meeting of shareholders, each Board Member will hold office for an indeterminate period. The Board Members may also serve in similar capacities with other funds in the fund complex.
| | | | | | | | |
| Independent Board Members | | | | | | |
Name, Year of Birth,
Position with the Fund and
Length of Time Served1 | | Business Experience and Directorships During the Past Five Years | | Number of
Funds in
DWS Fund
Complex
Overseen | | | Other
Directorships
Held by Board
Member
|
Keith R. Fox, CFA (1954) Chairperson since 2017, and Board Member since 1996 | | Managing General Partner, Exeter Capital Partners (a series of private investment funds) (since 1986). Directorships: Progressive International Corporation (kitchen goods importer and distributor); The Kennel Shop (retailer); former Chairman, National Association of Small Business Investment Companies; former Directorships: BoxTop Media Inc. (advertising); Sun Capital Advisers Trust (mutual funds) (2011–2012) | | | 82 | | | — |
John W. Ballantine (1946) Board Member since 1999 | | Retired; formerly, Executive Vice President and Chief Risk Management Officer, First Chicago NBD Corporation/The First National Bank of Chicago (1996–1998); Executive Vice President and Head of International Banking (1995–1996); former Directorships: Director and former Chairman of the Board, Healthways, Inc.2 (population well-being and wellness services) (2003–2014); Stockwell Capital Investments PLC (private equity); Enron Corporation; FNB Corporation; Tokheim Corporation; First Oak Brook Bancshares, Inc. and Oak Brook Bank; Prisma Energy International; Public Radio International. Not-for-Profit Director, Trustee: Palm Beach Civic Association; Window to the World Communications (public media); Harris Theater for Music and Dance (Chicago); Life Director of Hubbard Street Dance Chicago | | | 82 | | | Portland
General
Electric2
(utility
company)
(2003–
present) |
Henry P. Becton, Jr. (1943) Board Member since 1990 | | Vice Chair and former President, WGBH Educational Foundation. Directorships: Public Radio International; Public Radio Exchange (PRX); The Pew Charitable Trusts (charitable organization); Massachusetts Humane Society; Overseer of the New England Conservatory; former Directorships: Becton Dickinson and Company2 (medical technology company); Belo Corporation2 (media company); The PBS Foundation; Association of Public Television Stations; Boston Museum of Science; American Public Television; Concord Academy; New England Aquarium; Mass. Corporation for Educational Telecommunications; Committee for Economic Development; Public Broadcasting Service; Connecticut College; North Bennett Street School (Boston); American Documentary, Inc. (public media) | | | 82 | | | — |
Dawn-Marie Driscoll (1946) Board Member since 1987 | | Emeritus Executive Fellow, Center for Business Ethics, Bentley University; formerly: President, Driscoll Associates (consulting firm); Partner, Palmer & Dodge (law firm) (1988–1990); Vice President of Corporate Affairs and General Counsel, Filene’s (retail) (1978–1988). Directorships: Advisory Board, Center for Business Ethics, Bentley University; Trustee and former Chairman of the Board, Southwest Florida Community Foundation (charitable organization); former Directorships: ICI Mutual Insurance Company (2007–2015); Sun Capital Advisers Trust (mutual funds) (2007–2012), Investment Company Institute (audit, executive, nominating committees) and Independent Directors Council (governance, executive committees) | | | 82 | | | — |
Paul K. Freeman* (1950) Board Member since 1993 | | Consultant, WorldBank/Inter-American Development Bank; Independent Directors Council (former chair); Investment Company Institute (executive committee); Adjunct Professor, University of Denver Law School (2017–present); formerly: Chairman of Education Committee of Independent Directors Council; Project Leader, International Institute for Applied Systems Analysis (1998–2001); Chief Executive Officer, The Eric Group, Inc. (environmental insurance) (1986–1998); Directorships: Knoebel Institute for Healthy Aging, University of Denver (2017–present); former Directorships: Prisma Energy International; Denver Zoo Foundation (2012–2018) | | | 82 | | | — |
| | | | |
Deutsche DWS Variable Series II — DWS Small Mid Cap Value VIP | | | | | 23 |
| | | | | | | | |
Name, Year of Birth,
Position with the Fund and
Length of Time Served1 | | Business Experience and Directorships During the Past Five Years | | Number of
Funds in
DWS Fund
Complex
Overseen | | | Other
Directorships
Held by Board
Member
|
Richard J. Herring (1946) Board Member since 1990 | | Jacob Safra Professor of International Banking and Professor of Finance, The Wharton School, University of Pennsylvania (since July 1972); Director, The Wharton Financial Institutions Center (since 1994); formerly: Vice Dean and Director, Wharton Undergraduate Division (1995–2000) and Director, The Lauder Institute of International Management Studies (2000–2006); Member FDIC Systemic Risk Advisory Committee since 2011, member Systemic Risk Council since 2012 and member of the Advisory Board at the Yale Program on Financial Stability since 2013; Formerly Co-Chair of the Shadow Financial Regulatory Committee (2003–2015), Executive Director of The Financial Economists Roundtable (2008–2015), Director of The Thai Capital Fund (2007–2013), Director of The Aberdeen Singapore Fund (2007–2018), and Nonexecutive Director of Barclays Bank DE (2010–2018) | | | 82 | | | Director,
Aberdeen
Japan Fund
(since 2007) |
William McClayton (1944) Board Member since 2004 | | Private equity investor (since October 2009); previously, Managing Director, Diamond Management & Technology Consultants, Inc. (global consulting firm) (2001–2009); Directorship: Board of Managers, YMCA of Metropolitan Chicago; formerly: Senior Partner, Arthur Andersen LLP (accounting) (1966–2001); Trustee, Ravinia Festival | | | 82 | | | — |
Rebecca W. Rimel (1951) Board Member since 1995 | | President, Chief Executive Officer and Director, The Pew Charitable Trusts (charitable organization) (1994–present); formerly: Executive Vice President, The Glenmede Trust Company (investment trust and wealth management) (1983–2004); Board Member, Investor Education (charitable organization) (2004–2005); Trustee, Executive Committee, Philadelphia Chamber of Commerce (2001–2007); Director, Viasys Health Care2 (January 2007–June 2007); Trustee, Thomas Jefferson Foundation (charitable organization) (1994–2012) | | | 82 | | | Director,
Becton
Dickinson
and
Company2
(medical
technology
company)
(2012–
present);
Director,
BioTelemetry
Inc.2(health
care) (2009–
present) |
William N. Searcy, Jr. (1946) Board Member since 1993 | | Private investor since October 2003; formerly: Pension & Savings Trust Officer, Sprint Corporation2(telecommunications) (November 1989–September 2003); Trustee, Sun Capital Advisers Trust (mutual funds) (1998–2012) | | | 82 | | | — |
Jean Gleason Stromberg (1943) Board Member since 1997 | | Retired. Formerly, Consultant (1997–2001); Director, Financial Markets U.S. Government Accountability Office (1996–1997); Partner, Norton Rose Fulbright, L.L.P. (law firm) (1978–1996); former Directorships: The William and Flora Hewlett Foundation (charitable organization) (2000–2015); Service Source, Inc. (nonprofit), Mutual Fund Directors Forum (2002–2004), American Bar Retirement Association (funding vehicle for retirement plans) (1987–1990 and 1994–1996) | | | 82 | | | — |
| | |
| Officers4 | | |
Name, Year of Birth, Position with the Fund and Length of Time Served5 | | Business Experience and Directorships During the Past Five Years |
Hepsen Uzcan6 (1974) President and Chief Executive Officer, 2017–present Assistant Secretary, 2013–present | | Managing Director,3 DWS; Secretary, DWS USA Corporation (since March 2018); Assistant Secretary, DWS Distributors, Inc. (since June 25, 2018); Director and Vice President, DWS Service Company (since June 25, 2018); Assistant Secretary, DWS Investment Management Americas, Inc. (since June 25, 2018); and Director and President, DB Investment Managers, Inc. (since June 25, 2018); formerly: Vice President for the Deutsche funds (2016–2017) |
John Millette8(1962) Vice President and Secretary, 1999–present | | Director,3DWS; Chief Legal Officer, DWS Investment Management Americas, Inc. (2015–present); and Director and Vice President, DWS Trust Company (2016–present); formerly: Secretary, Deutsche Investment Management Americas Inc. (2015–2017) |
Diane Kenneally8,9 (1966) Treasurer and Chief Financial Officer since 2018 | | Director,3 DWS; formerly: Assistant Treasurer for the DWS funds (2007–2018) |
Caroline Pearson8(1962) Chief Legal Officer, 2010–present | | Managing Director,3DWS; formerly: Secretary, Deutsche AM Distributors, Inc. (2002–2017); and Secretary, Deutsche AM Service Company (2010–2017) |
Scott D. Hogan8(1970) Chief Compliance Officer, 2016–present | | Director,3DWS |
| | | | | | |
| | 24 | | | | | | Deutsche DWS Variable Series II — DWS Small Mid Cap Value VIP |
| | |
Name, Year of Birth, Position with the Fund and Length of Time Served5 | | Business Experience and Directorships During the Past Five Years |
Wayne Salit7(1967) Anti-Money Laundering Compliance Officer, 2014–present | | Director,3 Deutsche Bank; and AML Officer, DWS Trust Company; formerly: Managing Director, AML Compliance Officer at BNY Mellon (2011–2014); and Director, AML Compliance Officer at Deutsche Bank (2004–2011) |
Sheila Cadogan8(1966) Assistant Treasurer, 2017–present | | Director,3DWS; Director and Vice President, DWS Trust Company (since 2018) |
Paul Antosca8(1957) Assistant Treasurer, 2007–present | | Director,3DWS |
| 1 | The length of time served represents the year in which the Board Member joined the board of one or more DWS funds currently overseen by the Board. |
| 2 | A publicly held company with securities registered pursuant to Section 12 of the Securities Exchange Act of 1934. |
| 3 | Executive title, not a board directorship. |
| 4 | As a result of their respective positions held with the Advisor or its affiliates, these individuals are considered “interested persons” of the Advisor within the meaning of the 1940 Act. Interested persons receive no compensation from the Fund. |
| 5 | The length of time served represents the year in which the officer was first elected in such capacity for one or more DWS funds. |
| 6 | Address: 345 Park Avenue, New York, NY 10154. |
| 7 | Address: 60 Wall Street, New York, NY 10005. |
| 8 | Address: One International Place, Boston, MA 02110. |
| 9 | Appointed Treasurer and Chief Financial Officer effective July 2, 2018. |
| * | Paul K. Freeman retired from the Board effective December 31, 2018. |
The Fund’s Statement of Additional Information (“SAI”) includes additional information about the Board Members. The SAI is available, without charge, upon request. If you would like to request a copy of the SAI, you may do so by calling the followingtoll-free number:(800) 728-3337.
| | | | |
Deutsche DWS Variable Series II — DWS Small Mid Cap Value VIP | | | | | 25 |
Notes
Notes
| | |
| | |
VS2SMCV-2 (R-025829-8 2/19) | | |
| | |
| ITEM 2. | CODE OF ETHICS |
| | |
| | As of the end of the period covered by this report, the registrant has adopted a code of ethics, as defined in Item 2 of Form N-CSR that applies to its Principal Executive Officer and Principal Financial Officer. There have been no amendments to, or waivers from, a provision of the code of ethics during the period covered by this report that would require disclosure under Item 2. A copy of the code of ethics is filed as an exhibit to this Form N-CSR. |
| | |
| ITEM 3. | AUDIT COMMITTEE FINANCIAL EXPERT |
| | |
| | The fund’s audit committee is comprised solely of trustees who are "independent" (as such term has been defined by the Securities and Exchange Commission ("SEC") in regulations implementing Section 407 of the Sarbanes-Oxley Act (the "Regulations")). The fund’s Board of Trustees has determined that there are several "audit committee financial experts" (as such term has been defined by the Regulations) serving on the fund’s audit committee including Mr. William McClayton, the chair of the fund’s audit committee. An “audit committee financial expert” is not an “expert” for any purpose, including for purposes of Section 11 of the Securities Act of 1933 and the designation or identification of a person as an “audit committee financial expert” does not impose on such person any duties, obligations or liability that are greater than the duties, obligations and liability imposed on such person as a member of the audit committee and board of directors in the absence of such designation or identification. |
| | |
| ITEM 4. | PRINCIPAL ACCOUNTANT FEES AND SERVICES |
| | |
Deutsche DWS Variable Series II
form n-csr disclosure re: AUDIT FEES
The following table shows the amount of fees that Ernst & Young LLP (“EY”), the Fund’s Independent Registered Public Accounting Firm, billed to the Fund during the Fund’s last two fiscal years. The Audit Committee approved in advance all audit services and non-audit services that EY provided to the Fund.
Services that the Fund’s Independent Registered Public Accounting Firm Billed to the Fund
Fiscal Year
Ended
December 31, | Audit Fees Billed to Fund | Audit-Related
Fees Billed to Fund | Tax Fees Billed to Fund | All
Other Fees Billed to Fund |
| 2018 | $631,694 | $0 | $71,823 | $1,639 |
| 2017 | $631,691 | $0 | $71,822 | $0 |
The above “Tax Fees” were billed for professional services rendered for tax return preparation. “All Other Fees Billed to the Fund” were billed for services associated with foreign tax filings.
Services that the Fund’s Independent Registered Public Accounting Firm Billed to the Adviser and Affiliated Fund Service Providers
The following table shows the amount of fees billed by EY to DWS Investment Management Americas, Inc. (“DIMA” or the “Adviser”), and any entity controlling, controlled by or under common control with DIMA (“Control Affiliate”) that provides ongoing services to the Fund (“Affiliated Fund Service Provider”), for engagements directly related to the Fund’s operations and financial reporting, during the Fund’s last two fiscal years.
Fiscal Year
Ended
December 31, | Audit-Related
Fees Billed to Adviser and Affiliated Fund Service Providers | Tax Fees Billed to Adviser and Affiliated Fund Service Providers | All
Other Fees Billed to Adviser and Affiliated Fund Service Providers |
| 2018 | $0 | $470,936 | $0 |
| 2017 | $0 | $502,238 | $0 |
The above “Tax Fees” were billed in connection with tax compliance services and agreed upon procedures.
Non-Audit Services
The following table shows the amount of fees that EY billed during the Fund’s last two fiscal years for non-audit services. The Audit Committee pre-approved all non-audit services that EY provided to the Adviser and any Affiliated Fund Service Provider that related directly to the Fund’s operations and financial reporting. The Audit Committee requested and received information from EY about any non-audit services that EY rendered during the Fund’s last fiscal year to the Adviser and any Affiliated Fund Service Provider. The Committee considered this information in evaluating EY’s independence.
Fiscal Year
Ended
December 31, | Total
Non-Audit Fees Billed to Fund (A) | Total Non-Audit Fees billed to Adviser and Affiliated Fund Service Providers (engagements related directly to the operations and financial reporting of the Fund) (B) | Total Non-Audit Fees billed to Adviser and Affiliated Fund Service Providers (all other engagements) (C) | Total of (A), (B)
and (C) |
| 2018 | $73,462 | $470,936 | $513,130 | $1,057,528 |
| 2017 | $71,822 | $502,238 | $606,585 | $1,180,645 |
All other engagement fees were billed for services in connection with agreed upon procedures and tax compliance for DIMA and other related entities.
Audit Committee Pre-Approval Policies and Procedures. Generally, each Fund’s Audit Committee must pre approve (i) all services to be performed for a Fund by a Fund’s Independent Registered Public Accounting Firm and (ii) all non-audit services to be performed by a Fund’s Independent Registered Public Accounting Firm for the DIMA Entities with respect to operations and financial reporting of the Fund, except that the Chairperson or Vice Chairperson of each Fund’s Audit Committee may grant the pre-approval for non-audit services described in items (i) and (ii) above for non-prohibited services for engagements of less than $100,000. All such delegated pre approvals shall be presented to each Fund’s Audit Committee no later than the next Audit Committee meeting.
There were no amounts that were approved by the Audit Committee pursuant to the de minimis exception under Rule 2-01 of Regulation S-X.
According to the registrant’s principal Independent Registered Public Accounting Firm, substantially all of the principal Independent Registered Public Accounting Firm's hours spent on auditing the registrant's financial statements were attributed to work performed by full-time permanent employees of the principal Independent Registered Public Accounting Firm.
***
In connection with the audit of the 2017 and 2018 financial statements, the Fund entered into an engagement letter with EY. The terms of the engagement letter required by EY, and agreed to by the Audit Committee, include a provision mandating the use of mediation and arbitration to resolve any controversy or claim between the parties arising out of or relating to the engagement letter or services provided thereunder.
***
Pursuant to PCAOB Rule 3526, EY is required to describe in writing to the Fund’s Audit Committee, on at least an annual basis, all relationships between EY, or any of its affiliates, and the DWS Funds, including the Fund, or persons in financial reporting oversight roles at the DWS Funds that, as of the date of the communication, may reasonably be thought to bear on EY’s independence. Pursuant to PCAOB Rule 3526, EY has reported the matters set forth below that may reasonably be thought to bear on EY’s independence. With respect to each reported matter, individually and in the aggregate, EY advised the Audit Committee that, after careful consideration of the facts and circumstances and the applicable independence rules, it concluded that the matters do not and will not impair EY’s ability to exercise objective and impartial judgement in connection with the audits of the financial statements for the Fund and a reasonable investor with knowledge of all relevant facts and circumstances would conclude that EY has been and is capable of exercising objective and impartial judgment on all issues encompassed within EY’s audit engagements. EY also confirmed to the Audit Committee that it can continue act as the Independent Registered Public Accounting Firm for the Fund.
| · | EY advised the Fund’s Audit Committee that EY Stiftung e.V., an affiliate of the EY member firm in Germany, and various other covered persons within EY and its affiliates held investments in, or had other financial relationships with, entities within the DWS Funds “investment company complex” (as defined in Regulation S-X) (the “DWS Funds Complex”). EY informed the Audit Committee that these investments and financial relationships were inconsistent with Rule 2-01(c)(1) of Regulation S-X. EY reported that all breaches have been resolved and that none of the breaches involved any investments in the Fund or any professionals who were part of the audit engagement team for the Fund or in a position to influence the audit engagement team. In addition, EY noted that the independence breaches did not (i) create a mutual or conflicting interest with the Fund, (ii) place EY in the position of auditing its own work, (iii) result in EY acting as management or an employee of the Fund, or (iv) place EY in a position of being an advocate of the Fund. |
| · | EY advised the Fund’s Audit Committee of certain lending relationships of EY with owners of greater than 10% of the shares of certain investment companies within the DWS Funds Complex that EY had identified as inconsistent with Rule 2-01(c)(l)(ii)(A) of Regulation S-X (referred to as the “Loan Rule”). The Loan Rule specifically provides that an accounting firm would not be independent if it receives a loan from a lender that is a record or beneficial owner of more than ten percent of an audit client’s equity securities. For purposes of the Loan Rule, an audit client includes the Fund as well as all other investment companies in the DWS Funds Complex. EY’s lending relationships affect EY’s independence under the Loan Rule with respect to all investment companies in the DWS Funds Complex. |
EY stated its belief that, in each lending relationship, the lender is or was not able to impact the impartiality of EY or assert any influence over the investment companies in the DWS Funds Complex whose shares the lender owns or owned, or the applicable investment company’s investment adviser. In addition, on June 20, 2016, the SEC Staff issued a “no-action” letter to another mutual fund complex, Fidelity Management & Research Company et al., SEC Staff No-Action Letter (June 20, 2016) (the “Fidelity Letter”), related to similar Loan Rule issues as those described above. In the Fidelity Letter, the SEC Staff confirmed that it would not recommend enforcement action against an investment company that relied on the audit services performed by an audit firm that was not in compliance with the Loan Rule in certain specified circumstances. With respect to each lending relationship identified by EY, the circumstances described in the Fidelity Letter appear to be substantially similar to the circumstances that affected EY’s independence under the Loan Rule with respect to the Fund, and, in each case, EY confirmed to the Audit Committee that it meets the conditions of the Fidelity Letter.
| | |
| ITEM 5. | AUDIT COMMITTEE OF LISTED REGISTRANTS |
| | |
| | Not applicable |
| | |
| ITEM 6. | SCHEDULE OF INVESTMENTS |
| | |
| | Not applicable |
| | |
| ITEM 7. | DISCLOSURE OF PROXY VOTING POLICIES AND PROCEDURES FOR CLOSED-END MANAGEMENT INVESTMENT COMPANIES |
| | |
| | Not applicable |
| | |
| ITEM 8. | PORTFOLIO MANAGERS OF CLOSED-END MANAGEMENT INVESTMENT COMPANIES |
| | |
| | Not applicable |
| | |
| ITEM 9. | PURCHASES OF EQUITY SECURITIES BY CLOSED-END MANAGEMENT INVESTMENT COMPANY AND AFFILIATED PURCHASERS |
| | |
| | Not applicable |
| | |
| ITEM 10. | SUBMISSION OF MATTERS TO A VOTE OF SECURITY HOLDERS |
| | |
| | There were no material changes to the procedures by which shareholders may recommend nominees to the Fund’s Board. The primary function of the Nominating and Governance Committee is to identify and recommend individuals for membership on the Board and oversee the administration of the Board Governance Guidelines. Shareholders may recommend candidates for Board positions by forwarding their correspondence by U.S. mail or courier service to Keith R. Fox, DWS Funds Board Chair, c/o Thomas R. Hiller, Ropes & Gray LLP, Prudential Tower, 800 Boylston Street, Boston, MA 02199-3600. |
| | |
| ITEM 11. | CONTROLS AND PROCEDURES |
| | |
| | (a) | The Chief Executive and Financial Officers concluded that the Registrant’s Disclosure Controls and Procedures are effective based on the evaluation of the Disclosure Controls and Procedures as of a date within 90 days of the filing date of this report. |
| | |
| | (b) | There have been no changes in the registrant’s internal control over financial reporting that occurred during the second fiscal quarter of the period covered by this report that has materially affected, or is reasonably likely to materially affect, the registrant’s internal controls over financial reporting. |
| | |
| ITEM 12. | Disclosure of Securities Lending Activities for Closed-End Management Investment Companies |
| | |
| | Not applicable |
| | |
| ITEM 13. | EXHIBITS |
| | |
| | (a)(1) | Code of Ethics pursuant to Item 2 of Form N-CSR is filed and attached hereto as EX-99.CODE ETH. |
| | |
| | (a)(2) | Certification pursuant to Rule 30a-2(a) under the Investment Company Act of 1940 (17 CFR 270.30a-2(a)) is filed and attached hereto as Exhibit 99.CERT. |
| | |
| | (b) | Certification pursuant to Rule 30a-2(b) under the Investment Company Act of 1940 (17 CFR 270.30a-2(b)) is furnished and attached hereto as Exhibit 99.906CERT. |
SIGNATURES
Pursuant to the requirements of the Securities Exchange Act of 1934 and the Investment Company Act of 1940, the registrant has duly caused this report to be signed on its behalf by the undersigned, thereunto duly authorized.
| Registrant: | Deutsche DWS Variable Series II |
| | |
| | |
| By: | /s/Hepsen Uzcan Hepsen Uzcan President |
| | |
| Date: | 2/15/2019 |
Pursuant to the requirements of the Securities Exchange Act of 1934 and the Investment Company Act of 1940, this report has been signed below by the following persons on behalf of the registrant and in the capacities and on the dates indicated.
| By: | /s/Hepsen Uzcan Hepsen Uzcan President |
| | |
| Date: | 2/15/2019 |
| | |
| | |
| | |
| By: | /s/Diane Kenneally Diane Kenneally Chief Financial Officer and Treasurer |
| | |
| Date: | 2/15/2019 |
| | |