UNITED STATES
SECURITIES AND EXCHANGE COMMISSION
WASHINGTON, D. C. 20549
FORM N-CSR
Investment Company Act file number: 811-05002
Deutsche DWS Variable Series II
(Exact Name of Registrant as Specified in Charter)
875 Third Avenue
New York, NY 10022-6225
(Address of Principal Executive Offices) (Zip Code)
Registrant’s Telephone Number, including Area Code:(212) 454-4500
Diane Kenneally
One International Place
Boston, MA 02110
(Name and Address of Agent for Service)
| Date of fiscal year end: | 12/31 |
| | |
| Date of reporting period: | 12/31/2019 |
| ITEM 1. | REPORT TO STOCKHOLDERS |
December 31, 2019
Annual Report
Deutsche DWS Variable Series II
DWS Alternative Asset Allocation VIP
Beginning on January 1, 2021, as permitted by regulations adopted by the Securities and Exchange Commission, you may not be receiving paper copies of the Fund’s shareholder reports from the insurance company that offers your contract unless you specifically request paper copies from your insurance company or from your financial intermediary. Instead, the shareholder reports will be made available on a Web site, and your insurance company will notify you by mail each time a report is posted and provide you with a Web site link to access the report. Instructions for requesting paper copies will be provided by your insurance company.
If you already elected to receive shareholder reports electronically, you will not be affected by this change and you need not take any action. You may elect to receive shareholder reports and other communications from your insurance company electronically by following the instructions provided by your insurance company.
You may elect to receive all future reports in paper free of charge from your insurance company. If your insurance company informs you that future reports will be delivered via Web access, you can inform your insurance company that you wish to continue receiving paper copies of your shareholder reports by following the instructions provided by your insurance company.

Contents
This report must be preceded or accompanied by a prospectus. To obtain an additional prospectus or summary prospectus, if available, call (800) 728-3337 or your financial representative. We advise you to consider the Fund’s objectives, risks, charges and expenses carefully before investing. The summary prospectus and prospectus contain this and other important information about the Fund. Please read the prospectus carefully before you invest.
Although allocation among different asset categories generally limits risk, portfolio management may favor an asset category that underperforms other assets or markets as a whole. The Fund expects to invest in underlying funds that emphasize alternatives or non-traditional asset categories or investment strategies, and as a result, it is subject to the risk factors of those underlying funds. Some of those risks include: stock market risk; the political, general economic, liquidity and currency risks of foreign investments, which may be particularly significant for emerging markets; credit and interest rate risk; floating rate loan risk; volatility in commodity prices, infrastructure and high-yield debt securities; market direction risk (market advances when short, market declines when long); and short sales risk. Because Exchange Traded Funds (ETFs) trade on a securities exchange, their shares may trade at a premium or discount to their net asset value. ETFs also incur fees and expenses so they may not fully match the performance of the indexes they are designed to track. The Fund may use derivatives, including as part of its currency and interest-rate strategies. Investing in derivatives entails special risks relating to liquidity, leverage and credit that may reduce returns and/or increase volatility. The success of the Fund’s currency and interest-rate strategies are dependent, in part, on the effectiveness and implementation of portfolio management’s proprietary models. As part of these strategies, the Fund’s exposure to foreign currencies could cause lower returns or even losses because foreign currency rates may fluctuate significantly over short periods of time for a number of reasons. The risk of loss is heightened during periods of rapid rises in interest rates. In addition, the notional amount of the Fund’s aggregate currency and interest-rate exposure resulting from these strategies may significantly exceed the net assets of the Fund. Please read the prospectus for additional risks and specific details regarding the Fund’s risk profile.
The brand DWS represents DWS Group GmbH & Co. KGaA and any of its subsidiaries such as DWS Distributors, Inc. which offers investment products or DWS Investment Management Americas, Inc. and RREEF America L.L.C. which offer advisory services.
DWS Distributors, Inc., 222 South Riverside Plaza, Chicago, IL 60606, (800) 621-1148
NOT FDIC/NCUA INSURED NO BANK GUARANTEE MAY LOSE VALUE NOT A DEPOSIT
NOT INSURED BY ANY FEDERAL GOVERNMENT AGENCY
| | | | | | |
| | 2 | | | | | | Deutsche DWS Variable Series II — DWS Alternative Asset Allocation VIP |
| | |
| Performance Summary | | December 31, 2019 (Unaudited) |
Fund performance shown is historical, assumes reinvestment of all dividend and capital gain distributions and does not guarantee future results. Investment return and principal value fluctuate with changing market conditions so that, when redeemed, shares may be worth more or less than their original cost. Current performance may be lower or higher than the performance data quoted. Please contact your participating insurance company for the Fund’s most recent month-end performance. Performance does not reflect charges and fees (“contract charges”) associated with the separate account that invests in the Fund or any variable life insurance policy or variable annuity contract for which the Fund is an investment option. These charges and fees will reduce returns. While all share classes have the same underlying portfolio, their performance will differ.
The gross expense ratios of the Fund, as stated in the fee table of the prospectus supplement dated September 23, 2019 are 0.96% and 1.31% for Class A and Class B shares, respectively, and may differ from the expense ratios disclosed in the Financial Highlights tables in this report. These expense ratios include net expenses of the underlying funds in which the Fund invests.
Generally accepted accounting principles require adjustments to be made to the net assets of the Fund at period end for financial reporting purposes only, and as such, the total return based on the unadjusted net asset value per share may differ from the total return reported in the financial highlights.
Growth of an Assumed $10,000
| | |
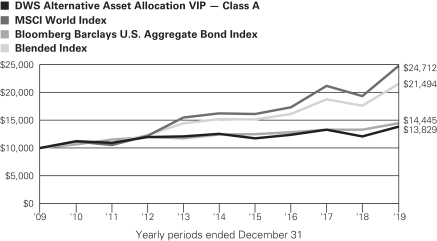
| | MSCI World Index is an unmanaged index representing large and mid-cap equity performance across 23 developed markets countries. It covers approximately 85% of the free float-adjusted market capitalization in each country. Bloomberg Barclays U.S. Aggregate Bond Index is an unmanaged index representing domestic taxable investment-grade bonds, with index components for government and corporate securities, mortgage pass-through securities, and asset-backed securities with average maturities of one year or more. TheBlended Index consists of 70% MSCI World Index and 30% Bloomberg Barclays U.S. Aggregate Bond Index. Index returns do not reflect any fees or expenses and it is not possible to invest directly into an index. |
| | | | | | | | | | |
| Comparative Results | | | | | | | | |
| | | | | |
DWS Alternative Asset
Allocation VIP | | | | 1-Year | | 3-Year | | 5-Year | | 10-Year |
| Class A | | Growth of $10,000 | | $11,468 | | $11,193 | | $11,044 | | $13,829 |
| | | Average annual total return | | 14.68% | | 3.83% | | 2.01% | | 3.29% |
| MSCI World Index | | Growth of $10,000 | | $12,767 | | $14,266 | | $15,203 | | $24,712 |
| | | Average annual total return | | 27.67% | | 12.57% | | 8.74% | | 9.47% |
| Bloomberg Barclays U.S. Aggregate Bond Index | | Growth of $10,000 | | $10,872 | | $11,258 | | $11,620 | | $14,445 |
| | Average annual total return | | 8.72% | | 4.03% | | 3.05% | | 3.75% |
| Blended Index | | Growth of $10,000 | | $12,192 | | $13,350 | | $14,141 | | $21,494 |
| | | Average annual total return | | 21.92% | | 10.11% | | 7.18% | | 7.95% |
| | | | |
Deutsche DWS Variable Series II — DWS Alternative Asset Allocation VIP | | | | | 3 |
| | | | | | | | | | |
| | | | | |
| DWS Alternative Asset Allocation VIP | | | | 1-Year | | 3-Year | | 5-Year | | 10-Year |
| Class B | | Growth of $10,000 | | $11,435 | | $11,093 | | $10,884 | | $13,452 |
| | Average annual total return | | 14.35% | | 3.52% | | 1.71% | | 3.01% |
| MSCI World Index | | Growth of $10,000 | | $12,767 | | $14,266 | | $15,203 | | $24,712 |
| | Average annual total return | | 27.67% | | 12.57% | | 8.74% | | 9.47% |
| Bloomberg Barclays U.S. Aggregate Bond Index | | Growth of $10,000 | | $10,872 | | $11,258 | | $11,620 | | $14,445 |
| | Average annual total return | | 8.72% | | 4.03% | | 3.05% | | 3.75% |
| Blended Index | | Growth of $10,000 | | $12,192 | | $13,350 | | $14,141 | | $21,494 |
| | Average annual total return | | 21.92% | | 10.11% | | 7.18% | | 7.95% |
The growth of $10,000 is cumulative.
| | | | | | |
| | 4 | | | | | | Deutsche DWS Variable Series II — DWS Alternative Asset Allocation VIP |
| | |
| Management Summary | | December 31, 2019 (Unaudited) |
The Fund returned 14.68% (Class A shares, unadjusted for contract charges) during the12-month period ended December 31, 2019, trailing the 21.92% return of its blended benchmark.
All of the underlying holdings in the portfolio delivered gains for the year, helping the Fund post a healthy absolute return. However, the Fund lagged its benchmark due to the unusually strong performance of traditional asset classes. Stocks and bonds both rallied in 2019 in response to an environment of stronger-than-expected economic growth and the three quarter-point interest rate cuts by the U.S. Federal Reserve. The two components of the blended benchmark, the MSCI World Index and the Bloomberg Barclays U.S. Aggregate Bond Index, returned 27.67 % and 8.72%, respectively. When assessing Fund performance, it’s important to keep in mind that we structure the portfolio to provide a source of diversification rather than attempting to keep pace when traditional assets produce gains of this magnitude.
Among the various categories in which the Fund is invested, infrastructure stocks generated the strongest returns in 2019. The category benefited from the improving economy and expectations for stable earnings growth. Real estate investment trusts also registered an impressive advance thanks to the backdrop of falling interest rates, healthy global property markets, and the strength in equities more generally. Convertible bonds and preferred stocks, which offer above-average income and exposure to trends in the equity and fixed-income markets, were also robust performers for the year.
The Fund’s position in fixed-income securities added value, with the best results coming from emerging-market bonds. The category was boosted by a variety of supportive trends, including positive global growth, falling interest rates, and the downturn in the U.S. dollar late in the year. Floating-rate securities, while also posting gains, lagged the fixed-income benchmark. At a time in which the Fed was cutting rates, bonds with floating-rate features experienced weaker demand.
We maintained a position in DWS Global Macro Fund, which uses a flexible, absolute-return strategy that seeks to capitalize on favorable risk/return opportunities anywhere in the world financial markets. The Fund posted a solid, double-digit gain and made a positive contribution to performance.
The Fund’s allocation to commodities, which it achieves through a position in DWS Enhanced Commodity Strategy Fund, was the weakest performer in 2019. Commodities produced mixed returns due in part to uncertainty surrounding the U.S.-China trade dispute and weaker-than-expected economic data out of China. A small position in Invesco DB US Dollar Index Bullish Fund, while posting a narrow gain despite asell-off late in the period, was also a headwind for relative performance.
We held a higher-than-normal cash position throughout the course of the year. We saw this as a way to cushion volatility and maintain the flexibility to capitalize on any sizable drawdowns in the markets, but cash proved to be a drag on results given the broad-based strength in higher-risk assets.
We made no major changes to the Fund in 2019, as we believed the portfolio was well positioned to provide both positive returns and a source of diversification. However, we did make a number of tactical adjustments in an effort to shift the portfolio’s risk profile as market conditions warranted. We also continued to research potential additions to the Fund, but we would like to see valuations become more attractive before establishing new positions.
We believe it may prove more difficult to add value through asset allocation in traditional categories in 2020. Government bonds offer yields on the low end of the historic range, and the major stock indices finished the year close to record highs. In this environment, we see an advantage from our ability to leverage numerous sources of return potential across the full spectrum of alternative investments. Our strategy provides us with the ability to capture value and avoid risk, an active approach whose merits may become more apparent if financial-market performance cools in the year ahead.
Pankaj Bhatnagar, PhD, Managing Director (Portfolio Manager until February 1, 2020)
Dokyoung Lee, CFA, Director
Darwei Kung, Managing Director
Sophia Noisten, Associate (Portfolio Manager beginning February 1, 2020)
Portfolio Managers
The views expressed reflect those of the portfolio management team only through the end of the period of the report as stated on the cover. The management team’s views are subject to change at any time based on market and other conditions and should not be construed as a recommendation. Past performance is no guarantee of future results. Current and future portfolio holdings are subject to risk.
| | | | |
Deutsche DWS Variable Series II — DWS Alternative Asset Allocation VIP | | | | | 5 |
Terms to Know
TheBlended Index is calculated using the performance of two unmanaged indices, representative of stocks (the Morgan Stanley Capital International (MSCI) World Index, 70%) and bonds (the Bloomberg Barclays U.S. Aggregate Bond Index, 30%). These results are summed to produce the aggregate benchmark. Index returns do not reflect fees or expenses and it is not possible to invest directly into an index.
MSCI World Index is an unmanaged index representing large and mid-cap equity performance across 23 developed markets countries. It covers approximately 85% of the free float-adjusted market capitalization in each country.
Bloomberg Barclays U.S. Aggregate Bond Index is an unmanaged index representing domestic taxable investment-grade bonds, with index components for government and corporate securities, mortgage pass-through securities, and asset-backed securities with average maturities of one year or more.
Convertible bonds are bonds that are issued by corporations and that can be converted to shares of the issuing company’s stock at the bondholder’s discretion.
Preferred stocks are hybrid securities that offer some of the features of both stocks and bonds.
| | | | | | |
| | 6 | | | | | | Deutsche DWS Variable Series II — DWS Alternative Asset Allocation VIP |
| | |
| Portfolio Summary | | (Unaudited) |
| | | | | | | | |
| Asset Allocation* (As a % of Investment Portfolio) | | 12/31/19 | | | 12/31/18 | |
Real Asset | | | 39% | | | | 40% | |
DWS Enhanced Commodity Strategy Fund | | | 12% | | | | 15% | |
DWS RREEF Global Infrastructure Fund | | | 11% | | | | 5% | |
DWS RREEF Real Estate Securities Fund | | | 7% | | | | 8% | |
iShares Global Infrastructure ETF | | | 6% | | | | 6% | |
DWS RREEF Global Real Estate Securities Fund | | | 3% | | | | 6% | |
| | |
Alternative Fixed Income | | | 22% | | | | 21% | |
DWS Floating Rate Fund | | | 11% | | | | 12% | |
iShares JP Morgan USD Emerging Markets Bond ETF | | | 6% | | | | 2% | |
DWS Emerging Markets Fixed Income Fund | | | 5% | | | | 7% | |
| | |
Alternative Equity | | | 23% | | | | 19% | |
SPDR Bloomberg Barclays Convertible Securities ETF | | | 15% | | | | 14% | |
iShares U.S. Preferred Stock ETF | | | 8% | | | | 5% | |
| | |
Absolute Return | | | 3% | | | | 4% | |
DWS Global Macro Fund | | | 2% | | | | 3% | |
Invesco DB U.S. Dollar Index Bullish Fund | | | 1% | | | | 1% | |
| | |
Cash Equivalents | | | 13% | | | | 16% | |
DWS Central Cash Management Government Fund | | | 7% | | | | 8% | |
DWS ESG Liquidity Fund | | | 6% | | | | 8% | |
| | | | 100% | | | | 100% | |
| * | During the periods indicated, asset categories and investment strategies represented in the Fund’s portfolio fell into the following categories: Real Assets, Alternative Fixed Income, Alternative Equity, and Absolute Return. Real Asset investments have a tangible or physical aspect such as real estate or commodities. Alternative Fixed Income investments seek to offer exposure to categories generally not included in investors’ allocations and to foreign investments, many of which are not denominated in US dollars. Alternative Equity investments are investments primarily in convertible and preferred instruments that offer equity exposure. Absolute Return investments seek positive returns in all market environments or seek to increase the diversification or liquidity of the Fund’s portfolio. |
Portfolio holdings and characteristics are subject to change.
For more complete details about the Fund’s investment portfolio, see page 8.
Following the Fund’s fiscal first and third quarter-end, a complete portfolio holdings listing is filed with the SEC on Form N-PORT. The Fund’s Form N-PORT will be available on the SEC’s Web site at sec.gov. The Fund’s portfolio holdings are also posted on dws.com from time to time. Please read the Fund’s current prospectus for more information.
| | | | |
Deutsche DWS Variable Series II — DWS Alternative Asset Allocation VIP | | | | | 7 |
| | |
| Investment Portfolio | | as of December 31, 2019 |
| | | | | | | | |
| | | Shares | | | Value ($) | |
| Mutual Funds 50.7% | | | | | | | | |
| | |
DWS Emerging Markets Fixed Income Fund “Institutional” (a) | | | 2,064,471 | | | | 19,550,537 | |
| | |
DWS Enhanced Commodity Strategy Fund “Institutional” (a) | | | 4,732,215 | | | | 45,239,972 | |
| | |
DWS Floating Rate Fund “Institutional” (a) | | | 4,871,736 | | | | 39,558,492 | |
| | |
DWS Global Macro Fund “Institutional” (a) | | | 898,644 | | | | 8,887,591 | |
| | |
DWS RREEF Global Infrastructure Fund “Institutional” (a) | | | 2,634,366 | | | | 43,335,324 | |
| | |
DWS RREEF Global Real Estate Securities Fund “Institutional” (a) | | | 1,247,371 | | | | 11,176,441 | |
| | |
DWS RREEF Real Estate Securities Fund “Institutional” (a) | | | 1,169,160 | | | | 26,423,025 | |
Total Mutual Funds (Cost $192,656,129) | | | | 194,171,382 | |
| |
Exchange-Traded Funds 36.3% | | | | | |
| | |
Invesco DB U.S. Dollar Index Bullish Fund | | | 120,520 | | | | 3,129,904 | |
| | |
iShares Global Infrastructure ETF | | | 435,715 | | | | 20,875,106 | |
| | |
iShares JP Morgan USD Emerging Markets Bond ETF | | | 204,060 | | | | 23,377,113 | |
| | | | | | | | |
| | | Shares | | | Value ($) | |
| | |
iShares U.S. Preferred Stock ETF | | | 764,600 | | | | 28,741,314 | |
| | |
SPDR Bloomberg Barclays Convertible Securities ETF | | | 1,136,132 | | | | 63,055,326 | |
Total Exchange-Traded Funds
(Cost $131,359,875) | | | | 139,178,763 | |
| | |
| Cash Equivalents 12.9% | | | | | | | | |
| | |
DWS Central Cash Management Government Fund, 1.62% (a) (b) | | | 27,144,085 | | | | 27,144,085 | |
| | |
DWS ESG Liquidity Fund “Institutional Shares”, 1.76% (a) (b) | | | 22,400,634 | | | | 22,402,874 | |
Total Cash Equivalents
(Cost $49,544,823) | | | | | | | 49,546,959 | |
| | |
| | | % of Net
Assets | | | Value ($) | |
Total Investment Portfolio
(Cost $373,560,827) | | | 99.9 | | | | 382,897,104 | |
| Other Assets and Liabilities, Net | | | 0.1 | | | | 209,697 | |
| Net Assets | | | 100.0 | | | | 383,106,801 | |
A summary of the Fund’s transactions with affiliated Underlying DWS Funds during the year ended December 31, 2019 are as follows:
| | | | | | | | | | | | | | | | | | | | | | | | | | | | | | | | |
Value ($) at
12/31/2018 | | Purchases
Cost ($) | | | Sales
Proceeds ($) | | | Net
Realized
Gain/
(Loss) ($) | | | Net Change in
Unrealized
Appreciation
(Depreciation) ($) | | | Income
($) | | | Capital Gain
Distributions ($) | | | Number
of Shares
at
12/31/2019 | | | Value ($)
at
12/31/2019 | |
Mutual Funds 50.7% | |
DWS Emerging Markets Fixed Income Fund “Institutional” (a) | |
| 17,037,469 | | | 789,223 | | | | — | | | | — | | | | 1,723,845 | | | | 789,223 | | | | — | | | | 2,064,471 | | | | 19,550,537 | |
DWS Enhanced Commodity Strategy Fund “Institutional” (a) | |
| 34,471,696 | | | 10,355,446 | | | | — | | | | — | | | | 412,830 | | | | 698,546 | | | | — | | | | 4,732,215 | | | | 45,239,972 | |
DWS Floating Rate Fund “Institutional” (a) | |
| 29,538,196 | | | 8,985,508 | | | | — | | | | — | | | | 1,034,788 | | | | 1,531,508 | | | | — | | | | 4,871,736 | | | | 39,558,492 | |
DWS Global Macro Fund “Institutional” (a) | |
| 6,302,154 | | | 1,917,034 | | | | — | | | | — | | | | 668,403 | | | | 278,034 | | | | — | | | | 898,644 | | | | 8,887,591 | |
DWS RREEF Global Infrastructure Fund “Institutional” (a) | |
| 12,746,320 | | | 25,003,621 | | | | — | | | | — | | | | 5,585,383 | | | | 783,490 | | | | — | | | | 2,634,366 | | | | 43,335,324 | |
DWS RREEF Global Real Estate Securities Fund “Institutional” (a) | |
| 13,651,660 | | | 1,599,191 | | | | 5,254,000 | | | | 26,045 | | | | 1,153,545 | | | | 1,599,190 | | | | 909,270 | | | | 1,247,371 | | | | 11,176,441 | |
DWS RREEF Real Estate Securities Fund “Institutional” (a) | |
| 17,837,606 | | | 15,498,782 | | | | 10,763,600 | | | | 278,871 | | | | 3,571,366 | | | | 2,003,582 | | | | 1,481,884 | | | | 1,169,160 | | | | 26,423,025 | |
Cash Equivalents 12.9% | |
DWS Central Cash Management Government Fund, 1.62% (a) (b) | |
| 17,736,862 | | | 127,708,957 | | | | 118,301,734 | | | | — | | | | — | | | | 405,020 | | | | — | | | | 27,144,085 | | | | 27,144,085 | |
DWS ESG Liquidity Fund, 1.76% (a) (b) | |
| 18,321,686 | | | 11,596,501 | | | | 7,519,271 | | | | (9 | ) | | | 3,967 | | | | 604,802 | | | | — | | | | 22,400,634 | | | | 22,402,874 | |
| 167,643,649 | | | 203,454,263 | | | | 141,838,605 | | | | 304,907 | | | | 14,154,127 | | | | 8,693,395 | | | | 2,391,154 | | | | 67,162,682 | | | | 243,718,341 | |
| (a) | Affiliated fund managed by DWS Investment Management Americas, Inc. |
| (b) | The rate shown is the annualizedseven-day yield at period end. |
SPDR: Standard & Poor’s Depositary Receipt
The accompanying notes are an integral part of the financial statements.
| | | | | | |
| | 8 | | | | | | Deutsche DWS Variable Series II — DWS Alternative Asset Allocation VIP |
Fair Value Measurements
Various inputs are used in determining the value of the Fund’s investments. These inputs are summarized in three broad levels. Level 1 includes quoted prices in active markets for identical securities. Level 2 includes other significant observable inputs (including quoted prices for similar securities, interest rates, prepayment speeds and credit risk). Level 3 includes significant unobservable inputs (including the Fund’s own assumptions in determining the fair value of investments). The level assigned to the securities valuations may not be an indication of the risk or liquidity associated with investing in those securities.
The following is a summary of the inputs used as of December 31, 2019 in valuing the Fund’s investments. For information on the Fund’s policy regarding the valuation of investments, please refer to the Security Valuation section of Note A in the accompanying Notes to Financial Statements.
| | | | | | | | | | | | | | | | |
| Assets | | Level 1 | | | Level 2 | | | Level 3 | | | Total | |
| Mutual Funds | | $ | 194,171,382 | | | $ | — | | | $ | — | | | $ | 194,171,382 | |
| Exchange-Traded Funds | | | 139,178,763 | | | | — | | | | — | | | | 139,178,763 | |
| Short-Term Investments | | | 49,546,959 | | | | — | | | | — | | | | 49,546,959 | |
| Total | | $ | 382,897,104 | | | $ | — | | | $ | — | | | $ | 382,897,104 | |
The accompanying notes are an integral part of the financial statements.
| | | | |
Deutsche DWS Variable Series II — DWS Alternative Asset Allocation VIP | | | | | 9 |
Statement of Assets and Liabilities
| | | | |
| as of December 31, 2019 | | | | |
| |
| Assets | | | | |
| Investments in affiliated Underlying Funds, at value (cost $242,200,952) | | $ | 243,718,341 | |
| Investments innon-affiliated securities, at value (cost $131,359,875) | | | 139,178,763 | |
| Cash | | | 10,000 | |
| Receivable for Fund shares sold | | | 413,853 | |
| Interest receivable | | | 36,332 | |
| Other assets | | | 6,313 | |
| Total assets | | | 383,363,602 | |
| |
| Liabilities | | | | |
| Payable for Fund shares redeemed | | | 12,749 | |
| Accrued Trustees’ fees | | | 3,751 | |
| Other accrued expenses and payables | | | 240,301 | |
| Total liabilities | | | 256,801 | |
| Net assets, at value | | $ | 383,106,801 | |
| |
| Net Assets Consist of | | | | |
| Distributable earnings (loss) | | | 7,215,871 | |
| Paid-in capital | | | 375,890,930 | |
| Net assets, at value | | $ | 383,106,801 | |
Class A | | | | |
| |
| Net Asset Value, offering and redemption price per share ($33,924,683 ÷ 2,541,554 outstanding shares of beneficial interest, no par value, unlimited number of shares authorized) | | $ | 13.35 | |
Class B | | | | |
| |
| Net Asset Value, offering and redemption price per share ($349,182,118 ÷ 26,180,029 outstanding shares of beneficial interest, no par value, unlimited number of shares authorized) | | $ | 13.34 | |
Statement of Operations
| | | | |
| for the year ended December 31, 2019 | | | | |
| |
| Investment Income | | | | |
| Income: | | | | |
| Income distributions from affiliated Underlying Funds | | $ | 8,693,395 | |
| Dividends | | | 1,851,201 | |
| Total income | | | 10,544,596 | |
| Expenses: | | | | |
| Management fee | | | 1,224,710 | |
| Administration fee | | | 309,457 | |
| Recordkeeping fees (Class B) | | | 341,988 | |
| Services to shareholders | | | 2,184 | |
| Distribution and service fees (Class B) | | | 697,082 | |
| Custodian fee | | | 6,330 | |
| Professional fees | | | 77,499 | |
| Reports to shareholders | | | 46,979 | |
| Trustees’ fees and expenses | | | 13,790 | |
| Other | | | 8,680 | |
| Total expenses before expense reductions | | | 2,728,699 | |
| Expense reductions | | | (1,208,333 | ) |
| Total expenses after expense reductions | | | 1,520,366 | |
| Net investment income | | | 9,024,230 | |
| |
| Realized and Unrealized Gain (Loss) | | | | |
| Net realized gain (loss) from: | | | | |
| Sale of affiliated Underlying Funds | | | 304,907 | |
| Sale of non-affiliated Underlying Funds | | | (59,514 | ) |
| Capital gain distributions from affiliated Underlying Funds | | | 2,391,154 | |
| | | | 2,636,547 | |
| Change in net unrealized appreciation (depreciation) on: | | | | |
| Affiliated Underlying Funds | | | 14,154,127 | |
| Non-affiliated Underlying Funds | | | 12,827,527 | |
| | | | 26,981,654 | |
| Net gain (loss) | | | 29,618,201 | |
| Net increase (decrease) in net assets resulting from operations | | $ | 38,642,431 | |
The accompanying notes are an integral part of the financial statements.
| | | | | | |
| | 10 | | | | | | Deutsche DWS Variable Series II — DWS Alternative Asset Allocation VIP |
Statements of Changes in Net Assets
| | | | | | | | |
| | | Years Ended December 31, | |
| Increase (Decrease) in Net Assets | | 2019 | | | 2018 | |
| Operations: | | | | | | | | |
| Net investment income (loss) | | $ | 9,024,230 | | | $ | 9,946,992 | |
| Net realized gain (loss) | | | 2,636,547 | | | | (7,030,042 | ) |
| Change in net unrealized appreciation (depreciation) | | | 26,981,654 | | | | (23,318,609 | ) |
| Net increase (decrease) in net assets resulting from operations | | | 38,642,431 | | | | (20,401,659 | ) |
| Distributions to shareholders: | | | | | | | | |
Class A | | | (1,142,148 | ) | | | (576,122 | ) |
Class B | | | (9,062,974 | ) | | | (3,035,192 | ) |
| Total distributions | | | (10,205,122 | ) | | | (3,611,314 | ) |
| Fund share transactions: | | | | | | | | |
Class A | | | | | | | | |
| Proceeds from shares sold | | | 5,519,916 | | | | 4,125,802 | |
| Reinvestment of distributions | | | 1,142,148 | | | | 576,122 | |
| Payments for shares redeemed | | | (2,018,312 | ) | | | (2,134,243 | ) |
| Net increase (decrease) in net assets from Class A share transactions | | | 4,643,752 | | | | 2,567,681 | |
Class B | | | | | | | | |
| Proceeds from shares sold | | | 118,564,810 | | | | 83,793,280 | |
| Reinvestment of distributions | | | 9,062,974 | | | | 3,035,192 | |
| Payments for shares redeemed | | | (11,692,494 | ) | | | (15,136,874 | ) |
| Net increase (decrease) in net assets from Class B share transactions | | | 115,935,290 | | | | 71,691,598 | |
| Increase (decrease) in net assets | | | 149,016,351 | | | | 50,246,306 | |
| Net assets at beginning of period | | | 234,090,450 | | | | 183,844,144 | |
| | |
| Net assets at end of period | | $ | 383,106,801 | | | $ | 234,090,450 | |
| | |
| Other Information | | | | | | | | |
Class A | | | | | | | | |
| Shares outstanding at beginning of period | | | 2,180,831 | | | | 1,982,448 | |
| Shares sold | | | 428,198 | | | | 319,659 | |
| Shares issued to shareholders in reinvestment of distributions | | | 90,217 | | | | 45,508 | |
| Shares redeemed | | | (157,692 | ) | | | (166,784 | ) |
| Net increase (decrease) in Class A shares | | | 360,723 | | | | 198,383 | |
| | |
| Shares outstanding at end of period | | | 2,541,554 | | | | 2,180,831 | |
Class B | | | | | | | | |
| Shares outstanding at beginning of period | | | 17,175,164 | | | | 11,540,895 | |
| Shares sold | | | 9,198,591 | | | | 6,569,707 | |
| Shares issued to shareholders in reinvestment of distributions | | | 715,310 | | | | 239,557 | |
| Shares redeemed | | | (909,036 | ) | | | (1,174,995 | ) |
| Net increase (decrease) in Class B shares | | | 9,004,865 | | | | 5,634,269 | |
| | |
| Shares outstanding at end of period | | | 26,180,029 | | | | 17,175,164 | |
The accompanying notes are an integral part of the financial statements.
| | | | |
Deutsche DWS Variable Series II — DWS Alternative Asset Allocation VIP | | | | | 11 |
Financial Highlights
| | | | | | | | | | | | | | | | | | | | |
| | | Years Ended December 31, | |
| Class A | | 2019 | | | 2018 | | | 2017 | | | 2016 | | | 2015 | |
| | | | | |
| Selected Per Share Data | | | | | | | | | | | | | | | | | | | | |
| Net asset value, beginning of period | | $ | 12.10 | | | $ | 13.61 | | | $ | 12.97 | | | $ | 12.60 | | | $ | 13.88 | |
| Income (loss) from investment operations: | | | | | | | | | | | | | | | | | | | | |
Net investment incomea | | | .40 | | | | .61 | | | | .33 | | | | .35 | | | | .29 | |
Net realized and unrealized gain (loss) | | | 1.35 | | | | (1.84 | ) | | | .62 | | | | .31 | | | | (1.13 | ) |
Total from investment operations | | | 1.75 | | | | (1.23 | ) | | | .95 | | | | .66 | | | | (.84 | ) |
| Less distributions from: | | | | | | | | | | | | | | | | | | | | |
Net investment income | | | (.50 | ) | | | (.28 | ) | | | (.31 | ) | | | (.29 | ) | | | (.41 | ) |
Net realized gains | | | — | | | | — | | | | — | | | | — | | | | (.03 | ) |
Total distributions | | | (.50 | ) | | | (.28 | ) | | | (.31 | ) | | | (.29 | ) | | | (.44 | ) |
| Net asset value, end of period | | $ | 13.35 | | | $ | 12.10 | | | $ | 13.61 | | | $ | 12.97 | | | $ | 12.60 | |
| Total Return (%)b,c | | | 14.68 | | | | (9.14 | ) | | | 7.41 | | | | 5.30 | | | | (6.29 | ) |
| | | | | |
| Ratios to Average Net Assets and Supplemental Data | | | | | | | | | | | | | | | | | | | | |
| Net assets, end of period ($ millions) | | | 34 | | | | 26 | | | | 27 | | | | 24 | | | | 21 | |
| Ratio of expenses before expense reductions (%)d,e | | | .56 | | | | .73 | | | | .64 | | | | .56 | | | | .53 | |
| Ratio of expenses after expense reductions (%)d,e | | | .23 | | | | .16 | | | | .19 | | | | .27 | | | | .33 | |
| Ratio of net investment income (%) | | | 3.09 | | | | 4.78 | | | | 2.50 | | | | 2.70 | | | | 2.19 | |
| Portfolio turnover rate (%) | | | 10 | | | | 32 | | | | 55 | | | | 51 | | | | 21 | |
| | | | | | | | | | | | | | | | | | | | |
| | | Years Ended December 31, | |
| Class B | | 2019 | | | 2018 | | | 2017 | | | 2016 | | | 2015 | |
| | | | | |
| Selected Per Share Data | | | | | | | | | | | | | | | | | | | | |
| Net asset value, beginning of period | | $ | 12.09 | | | $ | 13.59 | | | $ | 12.96 | | | $ | 12.59 | | | $ | 13.87 | |
| Income (loss) from investment operations: | | | | | | | | | | | | | | | | | | | | |
Net investment incomea | | | .37 | | | | .62 | | | | .31 | | | | .31 | | | | .25 | |
Net realized and unrealized gain (loss) | | | 1.34 | | | | (1.88 | ) | | | .59 | | | | .31 | | | | (1.12 | ) |
Total from investment operations | | | 1.71 | | | | (1.26 | ) | | | .90 | | | | .62 | | | | (.87 | ) |
| Less distributions from: | | | | | | | | | | | | | | | | | | | | |
Net investment income | | | (.46 | ) | | | (.24 | ) | | | (.27 | ) | | | (.25 | ) | | | (.38 | ) |
Net realized gains | | | — | | | | — | | | | — | | | | — | | | | (.03 | ) |
Total distributions | | | (.46 | ) | | | (.24 | ) | | | (.27 | ) | | | (.25 | ) | | | (.41 | ) |
| Net asset value, end of period | | $ | 13.34 | | | $ | 12.09 | | | $ | 13.59 | | | $ | 12.96 | | | $ | 12.59 | |
| Total Return (%)b,c | | | 14.35 | | | | (9.35 | ) | | | 7.01 | | | | 4.99 | | | | (6.54 | ) |
| | | | | |
| Ratios to Average Net Assets and Supplemental Data | | | | | | | | | | | | | | | | | | | | |
| Net assets, end of period ($ millions) | | | 349 | | | | 208 | | | | 157 | | | | 107 | | | | 88 | |
| Ratio of expenses before expense reductions (%)d,e | | | .92 | | | | 1.08 | | | | .93 | | | | .85 | | | | .83 | |
| Ratio of expenses after expense reductions (%)d,e | | | .52 | | | | .45 | | | | .48 | | | | .57 | | | | .62 | |
| Ratio of net investment income (%) | | | 2.90 | | | | 4.85 | | | | 2.31 | | | | 2.45 | | | | 1.84 | |
| Portfolio turnover rate (%) | | | 10 | | | | 32 | | | | 55 | | | | 51 | | | | 21 | |
| a | Based on average shares outstanding during the period. |
| b | Total return would have been lower had certain expenses not been reduced. |
| c | Total return would have been lower if the Advisor had not reduced some Underlying DWS Funds’ expenses. |
| d | The Fund invests in other Funds and indirectly bears its proportionate share of fees and expenses incurred by the Underlying Funds in which the Fund is invested. This ratio does not include these indirect fees and expenses. |
| e | Expense ratio does not reflect charges and fees associated with the separate account that invests in the Fund or any variable life insurance policy or variable annuity contract for which the Fund is an investment option. |
The accompanying notes are an integral part of the financial statements.
| | | | | | |
| | 12 | | | | | | Deutsche DWS Variable Series II — DWS Alternative Asset Allocation VIP |
| | |
| Notes to Financial Statements | | |
A. Organization and Significant Accounting Policies
DWS Alternative Asset Allocation VIP (the “Fund”) is a diversified series of Deutsche DWS Variable Series II (the “Trust”), which is registered under the Investment Company Act of 1940, as amended (the “1940 Act”), as an open-end management investment company organized as a Massachusetts business trust. The Fund mainly invests in other affiliated DWS funds (i.e., mutual funds, exchange-traded funds and other pooled investment vehicles managed by DWS Investment Management Americas, Inc. or one of its affiliates, together the “Underlying DWS Funds”), non-affiliated exchange-traded funds (“Non-affiliated ETFs”), non-affiliated exchange-traded notes (“Non-affiliated ETNs”) and derivative investments. Non-affiliated ETFs, Non-affiliated ETNs and Underlying DWS Funds are collectively referred to as “Underlying Funds.” During the year ended December 31, 2019, the Fund primarily invested in Underlying DWS Funds and non-affiliated ETFs. Each Underlying DWS Fund’s accounting policies and investment holdings are outlined in the Underlying DWS Funds’ financial statements and are available upon request.
Multiple Classes of Shares of Beneficial Interest. The Fund offers two classes of shares (Class A shares and Class B shares). Sales of Class B shares are subject to recordkeeping fees up to 0.15% and Rule 12b-1 fees under the 1940 Act equal to an annual rate of 0.25% of the average daily net assets of the Class B shares of the Fund. Class A shares are not subject to such fees.
Investment income, realized and unrealized gains and losses, and certain fund-level expenses and expense reductions, if any, are borne pro rata on the basis of relative net assets by the holders of all classes of shares except that each class bears certain expenses unique to that class (including the applicable Rule 12b-1 fee). Differences in class-level expenses may result in payment of different per share dividends by class. All shares have equal rights with respect to voting subject to class-specific arrangements.
The Fund’s financial statements are prepared in accordance with accounting principles generally accepted in the United States of America (“U.S. GAAP”) which require the use of management estimates. Actual results could differ from those estimates. The Fund qualifies as an investment company under Topic 946 of Accounting Standards Codification of U.S. GAAP. The policies described below are followed consistently by the Fund in the preparation of its financial statements.
Security Valuation. Investments are stated at value determined as of the close of regular trading on the New York Stock Exchange on each day the exchange is open for trading.
Various inputs are used in determining the value of the Fund’s investments. These inputs are summarized in three broad levels. Level 1 includes quoted prices in active markets for identical securities. Level 2 includes other significant observable inputs (including quoted prices for similar securities, interest rates, prepayment speeds and credit risk). Level 3 includes significant unobservable inputs (including the Fund’s own assumptions in determining the fair value of investments). The level assigned to the securities valuations may not be an indication of the risk or liquidity associated with investing in those securities.
Investments in mutual funds are valued at the net asset value per share of each class of the Underlying DWS Funds and are categorized as Level 1.
ETFs and ETNs are valued at the most recent sale price or official closing price reported on the exchange (U.S. or foreign) or over-the-counter market on which they trade. ETFs and ETNs for which no sales are reported are valued at the calculated mean between the most recent bid and asked quotations on the relevant market or, if a mean cannot be determined, at the most recent bid quotation. ETFs and ETNs securities are generally categorized as Level 1.
Disclosure about the classification of fair value measurements is included in a table following the Fund’s Investment Portfolio.
Federal Income Taxes. The Fund’s policy is to comply with the requirements of the Internal Revenue Code, as amended, which are applicable to regulated investment companies and to distribute all of its taxable income to its shareholders.
At December 31, 2019, the Fund had approximately $8,227,000 of tax basis capital loss carryforwards, which may be applied against realized net taxable capital gains indefinitely, including short-term losses ($6,598,000) and long-term losses ($1,629,000).
| | | | |
Deutsche DWS Variable Series II — DWS Alternative Asset Allocation VIP | | | | | 13 |
The Fund has reviewed the tax positions for the open tax years as of December 31, 2019 and has determined that no provision for income tax and/or uncertain tax positions is required in the Fund’s financial statements. The Fund’s federal tax returns for the prior three fiscal years remain open subject to examination by the Internal Revenue Service.
Distribution of Income and Gains. Distributions from net investment income of the Fund, if any, are declared and distributed to shareholders annually. Net realized gains from investment transactions, in excess of available capital loss carryforwards, would be taxable to the Fund if not distributed and, therefore, will be distributed to shareholders at least annually. The Fund may also make additional distributions for tax purposes if necessary.
The timing and characterization of certain income and capital gain distributions are determined annually in accordance with federal tax regulations which may differ from accounting principles generally accepted in the United States of America. These differences primarily relate to certain securities sold at a loss and capital gain distributions from Underlying Funds. As a result, net investment income (loss) and net realized gain (loss) on investment transactions for a reporting period may differ significantly from distributions during such period. Accordingly, the Fund may periodically make reclassifications among certain of its capital accounts without impacting the net asset value of the Fund.
At December 31, 2019, the Fund’s components of distributable earnings on a tax basis were as follows:
| | | | |
| Undistributed ordinary income* | | $ | 9,828,228 | |
| Capital loss carryforward | | $ | (8,227,000 | ) |
| Net unrealized appreciation (depreciation) on investments | | $ | 5,614,469 | |
At December 31, 2019, the aggregate cost of investments for federal income tax purposes was $377,282,635. The net unrealized appreciation for all investments based on tax cost was $5,614,469. This consisted of aggregate gross unrealized appreciation for all investments in which there was an excess of value over tax cost of $18,388,692 and aggregate gross unrealized depreciation for all investments in which there was an excess of tax cost over value of $12,774,223.
In addition, the tax character of distributions paid by the Fund is summarized as follows:
| | | | | | | | |
| | | Years Ended December 31, | |
| | | 2019 | | | 2018 | |
| Distributions from ordinary income* | | $ | 10,205,122 | | | $ | 3,611,314 | |
| * | For tax purposes, short-term capital gain distributions are considered ordinary income distributions. |
Expenses. Expenses of the Trust arising in connection with a specific fund are allocated to that fund. Other Trust expenses which cannot be directly attributed to a fund are apportioned among the funds in the Trust based upon the relative net assets or other appropriate measures.
Contingencies.In the normal course of business, the Fund may enter into contracts with service providers that contain general indemnification clauses. The Fund’s maximum exposure under these arrangements is unknown, as this would involve future claims that may be made against the Fund that have not yet been made. However, based on experience, the Fund expects the risk of loss to be remote.
Other.Investment transactions are accounted for on a trade date plus one basis for daily net asset value calculations. However, for financial reporting purposes, investment transactions are reported on trade date. Interest income is recorded on the accrual basis. Dividend Income is recorded on the ex-dividend date. Distributions of income and capital gains from the Underlying Funds are recorded on the ex-dividend date. Realized gains and losses from investment transactions are recorded on an identified cost basis.
B. Purchases and Sales of Securities
During the year ended December 31, 2019, purchases and sales of affiliated Underlying Funds (excluding short-term investments) aggregated $64,088,672 and $16,017,600, respectively. Purchases and sales of Non-affiliated ETFs aggregated $73,874,915 and $13,440,376, respectively.
C. Related Parties
Management Agreement.Under the Investment Management Agreement with DWS Investment Management Americas, Inc. (“DIMA” or the “Advisor”), an indirect, wholly owned subsidiary of DWS Group GmbH & Co. KGaA (“DWS Group”), the Advisor directs the investments of the Fund in accordance with its
| | | | | | |
| | 14 | | | | | | Deutsche DWS Variable Series II — DWS Alternative Asset Allocation VIP |
investment objectives, policies and restrictions. The Advisor determines the securities, instruments and other contracts relating to investments in Underlying Funds to be purchased, sold or entered into by the Fund or delegates such responsibility to the Fund’s subadvisors.
RREEF America L.L.C. (“RREEF”), an indirect, wholly owned subsidiary of DWS Group, acts as an investment subadvisor to the Fund. As an investment subadvisor to the Fund, RREEF provides investment management services to the portions of the Fund’s portfolio allocated to direct investments in global real estate and global infrastructure securities. RREEF is paid by the Advisor for the services RREEF provides to the Fund. As of the date of this report, the Fund obtained its exposure to global real estate and global infrastructure securities indirectly through investments in other Underlying DWS Funds.
Prior to October 1, 2019, pursuant to the Investment Management Agreement with the Advisor, the Fund paid a monthly management fee based on the Fund’s average daily net assets, computed and accrued daily and payable monthly, at the following annual rates:
| | | | |
| On assets invested in other DWS Funds | | | .20 | % |
| On assets invested in all other assets not considered DWS Funds | | | 1.20 | % |
Effective October 1, 2019, pursuant to the Investment Management Agreement with the Advisor, the Fund pays a monthly management fee based on the Fund’s average daily net assets, computed and accrued daily and payable monthly, at the following annual rates:
| | | | |
| On assets invested in exchange-traded funds and mutual funds | | | .10 | % |
| On assets invested in all other assets not considered exchange-traded funds and mutual funds | | | 1.00 | % |
Accordingly, for the year ended December 31, 2019, the fee pursuant to the Investment Management Agreement was equivalent to an annual rate (exclusive of any applicable waivers/reimbursements) of 0.40% of the Fund’s average daily net assets.
In addition, the Advisor will receive management fees from managing the Underlying DWS Funds in which the Fund invests.
The Fund does not invest in the Underlying DWS Funds for the purpose of exercising management or control; however, investments within the set limits may represent 5% or more of an Underlying DWS Fund’s outstanding shares. At December 31, 2019, the Fund held approximately 25% of DWS Emerging Markets Fixed Income Fund, 19% of DWS Floating Rate Fund, 5% of DWS ESG Liquidity Fund and 5% of DWS Global Macro Fund.
For the period from January 1, 2019 through April 30, 2019, the Advisor had contractually agreed to waive its fees and/or reimburse certain operating expenses to the extent necessary to maintain the total annual operating expenses (excluding certain expenses such as extraordinary expenses, taxes, brokerage, interest expense and Underlying Funds) of each class as follows:
| | | | |
| Class A | | | .23 | % |
| Class B | | | .53 | % |
In addition, the Advisor has contractually agreed to waive its fees and/or reimburse Fund expenses for the period January 1, 2019 through September 30, 2020 to the extent necessary to maintain the total annual operating expenses (including indirect expenses of Underlying Funds and excluding certain expenses such as extraordinary expenses, taxes, brokerage and interest expenses) of each class as follows:
| | | | |
| Class A | | | .86 | % |
| Class B | | | 1.15 | % |
For the period from January 1, 2019 through September 30, 2019, the Advisor had voluntarily agreed to waive 0.15% of its management fee. Effective October 1, 2019, the Advisor has terminated the 0.15% waiver of its management fee.
For the year ended December 31, 2019, fees waived and/or expenses reimbursed for each class are as follows:
| | | | |
| Class A | | $ | 99,790 | |
| Class B | | | 1,108,543 | |
| | | $ | 1,208,333 | |
The Fund indirectly bears its proportionate share of fees and expenses incurred by the Underlying Funds in which it is invested.
| | | | |
Deutsche DWS Variable Series II — DWS Alternative Asset Allocation VIP | | | | | 15 |
Administration Fee. Pursuant to an Administrative Services Agreement, DIMA provides most administrative services to the Fund. For all services provided under the Administrative Services Agreement, the Fund pays DIMA an annual fee (“Administration Fee”) of 0.10% of the Fund’s average daily net assets, computed and accrued daily and payable monthly. For the year ended December 31, 2019, the Administration Fee was $309,457, of which $31,528 is unpaid.
Service Provider Fees. DWS Service Company (“DSC”), an affiliate of the Advisor, is the transfer agent, dividend-paying agent and shareholder service agent for the Fund. Pursuant to a sub-transfer agency agreement between DSC and DST Systems, Inc. (“DST”), DSC has delegated certain transfer agent, dividend-paying agent and shareholder service agent functions to DST. DSC compensates DST out of the shareholder servicing fee it receives from the Fund. For the year ended December 31, 2019, the amounts charged to the Fund by DSC were as follows:
| | | | | | | | |
| Services to Shareholders | | Total
Aggregated | | | Unpaid at
December 31, 2019 | |
| Class A | | $ | 144 | | | $ | 26 | |
| Class B | | | 260 | | | | 47 | |
| | | $ | 404 | | | $ | 73 | |
Distribution Service Agreement. Under the Fund’s Class B 12b-1 plan, DWS Distributors, Inc. (“DDI”) received a fee (“Distribution Service Fee”) of 0.25% of average daily net assets of Class B shares. For the year ended December 31, 2019, the Distribution Service Fee aggregated $697,082, of which $71,746 is unpaid.
Typesetting and Filing Service Fees. Under an agreement with the Fund, DIMA is compensated for providing certain pre-press and regulatory filing services to the Fund. For the year ended December 31, 2019, the amount charged to the Fund by DIMA included in the Statement of Operations under “Reports to shareholders” aggregated $5,044, of which $3,472 is unpaid.
Trustees’ Fees and Expenses. The Fund paid retainer fees to each Trustee not affiliated with the Advisor, plus specified amounts to the Board Chairperson and to each committee Chairperson.
Affiliated Cash Management Vehicles. The Fund may invest uninvested cash balances in DWS Central Cash Management Government Fund and DWS ESG Liquidity Fund, affiliated money market funds which are managed by the Advisor. Each affiliated money market fund is managed in accordance with Rule 2a-7 under the 1940 Act, which governs the quality, maturity, diversity and liquidity of instruments in which a money market fund may invest. DWS Central Cash Management Government Fund seeks to maintain a stable net asset value, and DWS ESG Liquidity Fund maintains a floating net asset value. The Fund indirectly bears its proportionate share of the expenses of each affiliated money market fund in which it invests. DWS Central Cash Management Government Fund does not pay the Advisor an investment management fee.
D. Ownership of the Fund
At December 31, 2019, two participating insurance companies were owners of record of 10% or more of the total outstanding Class A shares of the Fund, each owning 82% and 16%. Two participating insurance companies were owners of record of 10% or more of the total outstanding Class B shares of the Fund, each owning 79% and 14%, respectively.
| | | | | | |
| | 16 | | | | | | Deutsche DWS Variable Series II — DWS Alternative Asset Allocation VIP |
Report of Independent Registered Public Accounting Firm
To the Board of Trustees of Deutsche DWS Variable Series II and Shareholders of DWS Alternative Asset Allocation VIP:
Opinion on the Financial Statements
We have audited the accompanying statement of assets and liabilities of DWS Alternative Asset Allocation VIP (the “Fund”) (one of the funds constituting Deutsche DWS Variable Series II) (the “Trust”), including the investment portfolio, as of December 31, 2019, and the related statement of operations for the year then ended, the statements of changes in net assets for each of the two years in the period then ended, the financial highlights for each of the five years in the period then ended and the related notes (collectively referred to as the “financial statements”). In our opinion, the financial statements present fairly, in all material respects, the financial position of the Fund (one of the funds constituting Deutsche DWS Variable Series II) at December 31, 2019, the results of its operations for the year then ended, the changes in its net assets for each of the two years in the period then ended and its financial highlights for each of the five years in the period then ended, in conformity with U.S. generally accepted accounting principles.
Basis for Opinion
These financial statements are the responsibility of the Trust’s management. Our responsibility is to express an opinion on the Fund’s financial statements based on our audits. We are a public accounting firm registered with the Public Company Accounting Oversight Board (United States) (“PCAOB”) and are required to be independent with respect to the Trust in accordance with the U.S. federal securities laws and the applicable rules and regulations of the Securities and Exchange Commission and the PCAOB.
We conducted our audits in accordance with the standards of the PCAOB. Those standards require that we plan and perform the audit to obtain reasonable assurance about whether the financial statements are free of material misstatement, whether due to error or fraud. The Trust is not required to have, nor were we engaged to perform, an audit of the Trust’s internal control over financial reporting. As part of our audits, we are required to obtain an understanding of internal control over financial reporting, but not for the purpose of expressing an opinion on the effectiveness of the Trust’s internal control over financial reporting. Accordingly, we express no such opinion.
Our audits included performing procedures to assess the risks of material misstatement of the financial statements, whether due to error or fraud, and performing procedures that respond to those risks. Such procedures included examining, on a test basis, evidence regarding the amounts and disclosures in the financial statements. Our procedures included confirmation of securities owned as of December 31, 2019, by correspondence with the custodian and others. Our audits also included evaluating the accounting principles used and significant estimates made by management, as well as evaluating the overall presentation of the financial statements. We believe that our audits provide a reasonable basis for our opinion.

We have served as the auditor of one or more investment companies in the DWS family of funds since at least 1979, but we are unable to determine the specific year.
Boston, Massachusetts
February 14, 2020
| | | | |
Deutsche DWS Variable Series II — DWS Alternative Asset Allocation VIP | | | | | 17 |
| | |
| Information About Your Fund’s Expenses | | (Unaudited) |
As an investor of the Fund, you incur two types of costs: ongoing expenses and transaction costs. Ongoing expenses include management fees, distribution and service (12b-1) fees and other Fund expenses. Examples of transaction costs include contract charges, which are not shown in this section. The following tables are intended to help you understand your ongoing expenses (in dollars) of investing in the Fund and to help you compare these expenses with the ongoing expenses of investing in other mutual funds. In addition to the ongoing expenses which the Fund bears directly, the Fund’s shareholders indirectly bear the expense of the Underlying Funds in which the Fund invests. These expenses are not included in the Fund’s annualized expense ratios used to calculate the expense estimate in the tables. In the most recent six-month period, the Fund limited the ongoing expenses the Fund bears directly; had it not done so, expenses would have been higher. The examples in the table are based on an investment of $1,000 invested at the beginning of the six-month period and held for the entire period (July 1, 2019 to December 31, 2019).
The tables illustrate your Fund’s expenses in two ways:
| – | | Actual Fund Return. This helps you estimate the actual dollar amount of ongoing expenses (but not transaction costs) paid on a $1,000 investment in the Fund using the Fund’s actual return during the period. To estimate the expenses you paid over the period, simply divide your account value by $1,000 (for example, an $8,600 account value divided by $1,000 = 8.6), then multiply the result by the number in the “Expenses Paid per $1,000” line under the share class you hold. |
| – | | Hypothetical 5% Fund Return. This helps you to compare your Fund’s ongoing expenses (but not transaction costs) with those of other mutual funds using the Fund’s actual expense ratio and a hypothetical rate of return of 5% per year before expenses. Examples using a 5% hypothetical Fund return may be found in the shareholder reports of other mutual funds. The hypothetical account values and expenses may not be used to estimate the actual ending account balance or expenses you paid for the period. |
Please note that the expenses shown in these tables are meant to highlight your ongoing expenses only and do not reflect any transaction costs. The “Expenses Paid per $1,000” line of the tables is useful in comparing ongoing expenses only and will not help you determine the relative total expense of owning different funds. If these transaction costs had been included, your costs would have been higher.
| | | | | | | | |
| Expenses and Value of a $1,000 Investment for the six months ended December 31, 2019 | |
| | |
| Actual Fund Return | | Class A | | | Class B | |
| Beginning Account Value 7/1/19 | | $ | 1,000.00 | | | $ | 1,000.00 | |
| Ending Account Value 12/31/19 | | $ | 1,045.40 | | | $ | 1,043.80 | |
| Expenses Paid per $1,000* | | $ | 1.24 | | | $ | 2.73 | |
| | |
| Hypothetical 5% Fund Return | | | Class A | | | | Class B | |
| Beginning Account Value 7/1/19 | | $ | 1,000.00 | | | $ | 1,000.00 | |
| Ending Account Value 12/31/19 | | $ | 1,024.00 | | | $ | 1,022.53 | |
| Expenses Paid per $1,000* | | $ | 1.22 | | | $ | 2.70 | |
| * | Expenses are equal to the Fund’s annualized expense ratio for each share class, multiplied by the average account value over the period, multiplied by 184 (the number of days in the most recent six-month period), then divided by 365. |
| | | | | | | | |
| Annualized Expense Ratios** | | Class A | | | Class B | |
| Deutsche DWS Variable Series II — DWS Alternative Asset Allocation VIP | | | .24 | % | | | .53 | % |
| ** | The Fund invests in other funds and indirectly bears its proportionate share of fees and expenses incurred by the Underlying Funds in which the Fund is invested. These ratios do not include these indirect fees and expenses. |
For more information, please refer to the Fund’s prospectus.
These tables do not reflect charges and fees (“contract charges”) associated with the separate account that invests in the Fund or any variable life insurance policy or variable annuity contract for which the Fund is an investment option.
For an analysis of the fees associated with an investment in the Fund or similar funds, please refer to the current and hypothetical expense calculators for Variable Insurance Products which can be found at dws.com/calculators.
| | | | | | |
| | 18 | | | | | | Deutsche DWS Variable Series II — DWS Alternative Asset Allocation VIP |
| | |
| Tax Information | | (Unaudited) |
Please consult a tax advisor if you have questions about federal or state income tax laws, or on how to prepare your tax returns. If you have specific questions about your account, please contact your insurance provider.
Proxy Voting
The Trust’s policies and procedures for voting proxies for portfolio securities and information about how the Trust voted proxies related to its portfolio securities during the most recent 12-month period ended June 30 are available on our Web site — dws.com/en-us/resources/proxy-voting — or on the SEC’s Web site — sec.gov. To obtain a written copy of the Trust’s policies and procedures without charge, upon request, call us toll free at (800) 728-3337.
| | | | |
Deutsche DWS Variable Series II — DWS Alternative Asset Allocation VIP | | | | | 19 |
Advisory Agreement Board Considerations and Fee Evaluation
The Board of Trustees (hereinafter referred to as the “Board” or “Trustees”) approved the renewal of DWS Alternative Asset Allocation VIP’s (the “Fund”) investment management agreement (the “Agreement”) with DWS Investment Management Americas, Inc. (“DIMA”) andsub-advisory agreement (the“Sub-Advisory Agreement” and together with the Agreement, the “Agreements”) between DIMA and RREEF America L.L.C. (“RREEF”), an affiliate of DIMA, in September 2019.
In terms of the process that the Board followed prior to approving the Agreements, shareholders should know that:
| – | | During the entire process, all of the Fund’s Trustees were independent of DIMA and its affiliates (the “Independent Trustees”). |
| – | | The Board met frequently during the past year to discuss fund matters and dedicated a substantial amount of time to contract review matters. Over the course of several months, the Board’s Contract Committee reviewed extensive materials received from DIMA, independent third parties and independent counsel. These materials included an analysis of the Fund’s performance, fees and expenses, and profitability from a fee consultant retained by the Fund’s Independent Trustees (the “Fee Consultant”). Based on its evaluation of the information provided, the Contract Committee presented its findings and recommendations to the Board. The Board then reviewed the Contract Committee’s findings and recommendations. |
| – | | The Board also received extensive information throughout the year regarding performance of the Fund. |
| – | | The Independent Trustees regularly met privately with counsel to discuss contract review and other matters. In addition, the Independent Trustees were advised by the Fee Consultant in the course of their review of the Fund’s contractual arrangements and considered a comprehensive report prepared by the Fee Consultant in connection with their deliberations. |
| – | | In connection with reviewing the Agreements, the Board also reviewed the terms of the Fund’s Rule12b-1 plan, distribution agreement, administrative services agreement, transfer agency agreement and other material service agreements. |
In connection with the contract review process, the Contract Committee and the Board considered the factors discussed below, among others. The Board also considered that DIMA has managed the Fund since its inception, and the Board believes that a long-term relationship with a capable, conscientious advisor is in the best interests of the Fund. The Board considered, generally, that shareholders chose to invest or remain invested in the Fund knowing that DIMA managed the Fund. DIMA and RREEF are part of DWS Group GmbH & Co. KGaA (“DWS Group”). DWS Group is a global asset management business that offers a wide range of investing expertise and resources, including research capabilities in many countries throughout the world. In 2018, approximately 20% of DWS Group’s shares were sold in an initial public offering, with Deutsche Bank AG owning the remaining shares.
As part of the contract review process, the Board carefully considered the fees and expenses of each DWS fund overseen by the Board in light of the fund’s performance. In many cases, this led to the negotiation and implementation of expense caps. As part of these negotiations, the Board indicated that it would consider relaxing these caps in future years following sustained improvements in performance, among other considerations.
While shareholders may focus primarily on fund performance and fees, the Fund’s Board considers these and many other factors, including the quality and integrity of DIMA’s and RREEF’s personnel and administrative support services provided by DIMA, such as back-office operations, fund valuations, and compliance policies and procedures.
Nature, Quality and Extent of Services.The Board considered the terms of the Agreements, including the scope of advisory services provided under the Agreements. The Board noted that, under the Agreements, DIMA and RREEF provide portfolio management services to the Fund and that, pursuant to a separate administrative services agreement, DIMA provides administrative services to the Fund. The Board considered the experience and skills of senior management and investment personnel and the resources made available to such personnel. Throughout the course of the year, the Board also received information regarding DIMA’s oversight of fundsub-advisors, including RREEF. The Board reviewed the Fund’s performance over short-term and long-term periods and compared those returns to various agreed-upon performance measures, including market index(es) and a peer universe compiled using information supplied
| | | | | | |
| | 20 | | | | | | Deutsche DWS Variable Series II — DWS Alternative Asset Allocation VIP |
by Morningstar Direct (“Morningstar”), an independent fund data service. The Board also noted that it has put into place a process of identifying “Funds in Review” (e.g., funds performing poorly relative to a peer universe), and receives additional reporting from DIMA regarding such funds and, where appropriate, DIMA’s plans to address underperformance. The Board believes this process is an effective manner of identifying and addressing underperforming funds. Based on the information provided, the Board noted that, for theone-,three- andfive-year periods ended December 31, 2018, the Fund’s performance (Class A shares) was in the 4th quartile, 2nd quartile and 3rd quartile, respectively, of the applicable Morningstar universe (the 1st quartile being the best performers and the 4th quartile being the worst performers). The Board also observed that the Fund has underperformed its benchmark in theone-,three- andfive-year periods ended December 31, 2018. The Board noted the disappointing investment performance of the Fund in recent periods and continued to discuss with senior management of DIMA the factors contributing to such underperformance and actions being taken to improve performance. The Board considered that changes to the portfolio management team were made effective December 6, 2018. The Board observed that the Fund had experienced improved relative performance during the first eight months of 2019. The Board recognized the efforts by DIMA in recent years to enhance its investment platform and improve long-term performance across the DWS fund complex.
Fees and Expenses. The Board considered the Fund’s investment management fee schedule,sub-advisory fee schedule, operating expenses and total expense ratios, and comparative information provided by Broadridge Financial Solutions, Inc. (“Broadridge”) and the Fee Consultant regarding investment management fee rates paid to other investment advisors by similar funds (1st quartile being the most favorable and 4th quartile being the least favorable). With respect to management fees paid to other investment advisors by similar funds, the Board noted that the contractual fee rates paid by the Fund, which include a 0.10% fee paid to DIMA under the Fund’s administrative services agreement, were higher than the median (3rd quartile) of the applicable Broadridge peer group (based on Broadridge data provided as of December 31, 2018). The Board noted that, from inception through October 1, 2019, in connection with the 2019 contract renewal process, DIMA waived voluntarily a portion (0.15%) of the Fund’s management fee, and noted further that, effective October 1, 2019, DIMA agreed to reduce the Fund’s contractual management fee by 0.10% on assets invested in other funds and by 0.20% on assets invested in direct investments. With respect to anysub-advisory fee paid to RREEF, the Board noted that the fee is paid by DIMA out of its fee and not directly by the Fund. The Board noted the Fund’s total (net) operating expenses and noted that the expense limitations agreed to by DIMA were expected to help the Fund’s total (net) operating expenses remain competitive. The Board considered the Fund’s management fee rate as compared to fees charged by DIMA to comparable DWS U.S. registered funds (“DWS Funds”) and considered differences between the Fund and the comparable DWS Funds. The information requested by the Board as part of its review of fees and expenses also included information about institutional accounts (including anysub-advised funds and accounts) and funds offered primarily to European investors (“DWS Europe Funds”) managed by DWS Group. The Board noted that DIMA indicated that DWS Group does not manage any institutional accounts or DWS Europe Funds comparable to the Fund.
On the basis of the information provided, the Board concluded that management fees were reasonable and appropriate in light of the nature, quality and extent of services provided by DIMA and RREEF.
Profitability. The Board reviewed detailed information regarding revenues received by DIMA from advising the DWS Funds along with the estimated costs to DIMA, andpre-tax profits realized by DIMA, from advising the DWS Funds. The Board also received information regarding the estimated enterprise-wide profitability of DIMA and its affiliates with respect to all fund services in totality. The Board did not receive profitability information with respect to the Fund, but did receive such information with respect to the DWS Funds in which the Fund invests. The Board also reviewed certain publicly available information regarding the profitability of certain similar investment management firms. The Board noted that, while information regarding the profitability of such firms is limited (and in some cases is not necessarily prepared on a comparable basis), DIMA and its affiliates’ overall profitability with respect to the DWS Funds (after taking into account distribution and other services provided to the funds by DIMA and its affiliates) was lower than the overall profitability levels of most comparable firms for which such data was available.
Economies of Scale. The Board considered whether there are economies of scale with respect to the management of the Fund and whether the Fund benefits from any economies of scale. In this regard, the Board observed that while the Fund’s current investment management fee schedule does not include breakpoints, the Fund’s fee schedule represents an appropriate sharing between the Fund and DIMA of such economies of scale as may exist in the management of the Fund at current asset levels.
| | | | |
Deutsche DWS Variable Series II — DWS Alternative Asset Allocation VIP | | | | | 21 |
Other Benefits to DIMA and Its Affiliates. The Board also considered the character and amount of other incidental or“fall-out” benefits received by DIMA and its affiliates, including any fees received by DIMA for administrative services provided to the Fund, any fees received by an affiliate of DIMA for transfer agency services provided to the Fund and any fees received by an affiliate of DIMA for distribution services. The Board also considered benefits to DIMA related to brokerage and soft-dollar allocations, including allocating brokerage to pay for research generated by parties other than the executing broker dealers, which pertain primarily to funds investing in equity securities. In addition, the Board considered the incidental public relations benefits to DIMA related to DWS Funds advertising and cross-selling opportunities among DIMA products and services. The Board considered these benefits in reaching its conclusion that the Fund’s management fees were reasonable.
Compliance. The Board considered the significant attention and resources dedicated by DIMA to its compliance processes in recent years. The Board noted in particular (i) the experience, seniority and time commitment of the individuals serving as DIMA’s and the Fund’s chief compliance officers and (ii) the substantial commitment of resources by DIMA and its affiliates to compliance matters, including the retention of compliance personnel.
Based on all of the information considered and the conclusions reached, the Board determined that the continuation of the Agreements is in the best interests of the Fund. In making this determination, the Board did not give particular weight to any single factor identified above. The Board considered these factors over the course of numerous meetings, certain of which were in executive session with only the Independent Trustees and counsel present. It is possible that individual Independent Trustees may have weighed these factors differently in reaching their individual decisions to approve the continuation of the Agreements.
| | | | | | |
| | 22 | | | | | | Deutsche DWS Variable Series II — DWS Alternative Asset Allocation VIP |
Board Members and Officers
The following table presents certain information regarding the Board Members and Officers of the Trust/Corporation. Each Board Member’s year of birth is set forth in parentheses after his or her name. Unless otherwise noted, (i) each Board Member has engaged in the principal occupation(s) noted in the table for at least the most recent five years, although not necessarily in the same capacity; and (ii) the address of each Independent Board Member is Keith R. Fox, DWS Funds Board Chair, c/o Thomas R. Hiller, Ropes & Gray LLP, Prudential Tower, 800 Boylston Street, Boston, MA02199-3600. Except as otherwise noted below, the term of office for each Board Member is until the election and qualification of a successor, or until such Board Member sooner dies, resigns, is removed or as otherwise provided in the governing documents of the Trust/Corporation. Because the Fund does not hold an annual meeting of shareholders, each Board Member will hold office for an indeterminate period.
The Board Members may also serve in similar capacities with other funds in the fund complex. The number of funds in DWS fund complex shown in the table below includes all registered open- and closed-end funds (including all of their portfolios) advised by the Advisor and any registered funds that have an investment advisor that is an affiliated person of the Advisor.
| | | | | | | | |
| Independent Board Members | | | | | |
Name, Year of Birth,
Position with the Trust/
Corporation and
Length of Time Served1 | | Business Experience and Directorships During the Past Five Years | | Number of
Funds in
DWS Fund
Complex
Overseen | | | Other
Directorships
Held by Board
Member
|
Keith R. Fox, CFA (1954) Chairperson since 2017, and Board Member since 1996 | | Managing General Partner, Exeter Capital Partners (a series of private investment funds) (since 1986). Directorships: ICI Mutual Insurance Company; Progressive International Corporation (kitchen goods importer and distributor); former Chairman, National Association of Small Business Investment Companies; former Directorships: The Kennel Shop (retailer); BoxTop Media Inc. (advertising); Sun Capital Advisers Trust (mutual funds) (2011–2012) | | | 77 | | | — |
John W. Ballantine (1946) Board Member since 1999 | | Retired; formerly, Executive Vice President and Chief Risk Management Officer, First Chicago NBD Corporation/The First National Bank of Chicago (1996–1998); Executive Vice President and Head of International Banking (1995–1996); former Directorships: Director and Chairman of the Board, Healthways, Inc.2 (population well-being and wellness services) (2003–2014); Stockwell Capital Investments PLC (private equity); Enron Corporation; FNB Corporation; Tokheim Corporation; First Oak Brook Bancshares, Inc.; Oak Brook Bank; and Prisma Energy International. Not-for-Profit Director/Trustee: Palm Beach Civic Association; Window to the World Communications (public media); Life Director of Harris Theater for Music and Dance (Chicago); Life Director of Hubbard Street Dance Chicago; former Not-for-Profit Directorships: Public Radio International | | | 77 | | | Portland
General
Electric2
(utility
company)
(2003–
present) |
Dawn-Marie Driscoll (1946) Board Member since 1987 | | Emeritus Executive Fellow, Center for Business Ethics, Bentley University; formerly: Partner, Palmer & Dodge (law firm) (1988–1990); Vice President of Corporate Affairs and General Counsel, Filene’s (retail) (1978–1988). Directorships: Advisory Board, Center for Business Ethics, Bentley University; Trustee and former Chairman of the Board, Southwest Florida Community Foundation (charitable organization); former Directorships: ICI Mutual Insurance Company (2007–2015); Sun Capital Advisers Trust (mutual funds) (2007–2012), Investment Company Institute (audit, executive, nominating committees) and Independent Directors Council (governance, executive committees) | | | 77 | | | — |
Richard J. Herring (1946) Board Member since 1990 | | Jacob Safra Professor of International Banking and Professor of Finance, The Wharton School, University of Pennsylvania (since July 1972); Director, The Wharton Financial Institutions Center (since 1994); formerly: Vice Dean and Director, Wharton Undergraduate Division (1995–2000) and Director, The Lauder Institute of International Management Studies (2000–2006); Member FDIC Systemic Risk Advisory Committee since 2011, member Systemic Risk Council since 2012 and member of the Advisory Board at the Yale Program on Financial Stability since 2013; Formerly Co-Chair of the Shadow Financial Regulatory Committee (2003–2015), Executive Director of The Financial Economists Roundtable (2008–2015), Director of The Thai Capital Fund (2007–2013), Director of The Aberdeen Singapore Fund (2007–2018), and Nonexecutive Director of Barclays Bank DE (2010–2018) | | | 77 | | | Director,
Aberdeen
Japan Fund
(since 2007) |
| | | | |
Deutsche DWS Variable Series II — DWS Alternative Asset Allocation VIP | | | | | 23 |
| | | | | | | | |
Name, Year of Birth,
Position with the Trust/
Corporation and
Length of Time Served1 | | Business Experience and Directorships During the Past Five Years | | Number of
Funds in
DWS Fund
Complex
Overseen | | | Other
Directorships
Held by Board
Member
|
William McClayton (1944) Board Member since 2004 | | Private equity investor (since October 2009); previously, Managing Director, Diamond Management & Technology Consultants, Inc. (global consulting firm) (2001–2009); Directorship: Board of Managers, YMCA of Metropolitan Chicago; formerly: Senior Partner, Arthur Andersen LLP (accounting) (1966–2001); Trustee, Ravinia Festival | | | 77 | | | — |
Rebecca W. Rimel (1951) Board Member since 1995 | | President, Chief Executive Officer and Director, The Pew Charitable Trusts (charitable organization) (1994–present); formerly: Executive Vice President, The Glenmede Trust Company (investment trust and wealth management) (1983–2004); Board Member, Investor Education (charitable organization) (2004–2005); Trustee, Executive Committee, Philadelphia Chamber of Commerce (2001–2007); Director, Viasys Health Care2 (January 2007–June 2007); Trustee, Thomas Jefferson Foundation (charitable organization) (1994–2012) | | | 77 | | | Director,
Becton
Dickinson
and
Company2
(medical
technology
company)
(2012–
present);
Director,
BioTelemetry
Inc.2(health
care) (2009–
present) |
William N. Searcy, Jr. (1946) Board Member since 1993 | | Private investor since October 2003; formerly: Pension & Savings Trust Officer, Sprint Corporation2(telecommunications) (November 1989–September 2003); Trustee, Sun Capital Advisers Trust (mutual funds) (1998–2012) | | | 77 | | | — |
| | |
| Officers4 | | |
Name, Year of Birth,
Position with the Trust/
Corporation and
Length of Time Served5 | | Business Experience and Directorships During the Past Five Years |
Hepsen Uzcan6(1974) President and Chief Executive Officer, 2017–present | | Managing Director,3 DWS; Secretary, DWS USA Corporation (2018–present); Assistant Secretary, DWS Distributors, Inc. (2018–present); Director and Vice President, DWS Service Company (2018–present); Assistant Secretary, DWS Investment Management Americas, Inc. (2018–present); and Director and President, DB Investment Managers, Inc. (2018–present); formerly: Vice President for the Deutsche funds (2016–2017); Assistant Secretary for the DWS funds (2013–2019) |
John Millette7(1962) Vice President and Secretary, 1999–present | | Director,3DWS; Chief Legal Officer, DWS Investment Management Americas, Inc. (2015–present); Director and Vice President, DWS Trust Company (2016–present); and Assistant Secretary, DBX ETF Trust (2019–present); formerly: Secretary, Deutsche Investment Management Americas Inc. (2015–2017) |
Diane Kenneally7(1966) Chief Financial Officer and Treasurer, 2018–present | | Director,3 DWS; and Treasurer, Chief Financial Officer and Controller, DBX ETF Trust (2019–present); formerly: Assistant Treasurer for the DWS funds (2007–2018) |
Paul Antosca7(1957) Assistant Treasurer, 2007–present | | Director,3DWS; and Assistant Treasurer, DBX ETF Trust (2019–present) |
Sheila Cadogan7(1966) Assistant Treasurer, 2017–present | | Director,3DWS; Director and Vice President, DWS Trust Company (2018–present); and Assistant Treasurer, DBX ETF Trust (2019–present) |
Scott D. Hogan7(1970) Chief Compliance Officer, 2016–present | | Director,3DWS |
Caroline Pearson7(1962) Chief Legal Officer, 2010–present | | Managing Director,3DWS; formerly: Secretary, Deutsche AM Distributors, Inc. (2002–2017); and Secretary, Deutsche AM Service Company (2010–2017) |
Wayne Salit6(1967) Anti-Money Laundering Compliance Officer, 2014–present | | Director,3 Deutsche Bank; and AML Officer, DWS Trust Company; formerly: Managing Director, AML Compliance Officer at BNY Mellon (2011–2014); and Director, AML Compliance Officer at Deutsche Bank (2004–2011) |
Ciara Crawford8 (1984) Assistant Secretary, (2019–present) | | Associate, DWS (since 2015); previously, Legal Assistant at Accelerated Tax Solutions. |
| | | | | | |
| | 24 | | | | | | Deutsche DWS Variable Series II — DWS Alternative Asset Allocation VIP |
| 1 | The length of time served represents the year in which the Board Member joined the board of one or more DWS funds currently overseen by the Board. |
| 2 | A publicly held company with securities registered pursuant to Section 12 of the Securities Exchange Act of 1934. |
| 3 | Executive title, not a board directorship. |
| 4 | As a result of their respective positions held with the Advisor or its affiliates, these individuals are considered “interested persons” of the Advisor within the meaning of the 1940 Act. Interested persons receive no compensation from the Fund. |
| 5 | The length of time served represents the year in which the officer was first elected in such capacity for one or more DWS funds. |
| 6 | Address: 875 Third Avenue, New York, NY 10022. |
| 7 | Address: One International Place, Boston, MA 02110. |
| 8 | Address: 5022 Gate Parkway, Suite 400, Jacksonville, FL 32256. |
The Fund’s Statement of Additional Information (“SAI”) includes additional information about the Board Members. The SAI is available, without charge, upon request. If you would like to request a copy of the SAI, you may do so by calling the followingtoll-free number:(800) 728-3337.
| | | | |
Deutsche DWS Variable Series II — DWS Alternative Asset Allocation VIP | | | | | 25 |
Notes
Notes
| | |
| | |
VS2AAA-2 (R-025824-9 2/20) | | |
December 31, 2019
Annual Report
Deutsche DWS Variable Series II
DWS CROCI® U.S. VIP
Beginning on January 1, 2021, as permitted by regulations adopted by the Securities and Exchange Commission, you may not be receiving paper copies of the Fund’s shareholder reports from the insurance company that offers your contract unless you specifically request paper copies from your insurance company or from your financial intermediary. Instead, the shareholder reports will be made available on a Web site, and your insurance company will notify you by mail each time a report is posted and provide you with a Web site link to access the report. Instructions for requesting paper copies will be provided by your insurance company.
If you already elected to receive shareholder reports electronically, you will not be affected by this change and you need not take any action. You may elect to receive shareholder reports and other communications from your insurance company electronically by following the instructions provided by your insurance company.
You may elect to receive all future reports in paper free of charge from your insurance company. If your insurance company informs you that future reports will be delivered via Web access, you can inform your insurance company that you wish to continue receiving paper copies of your shareholder reports by following the instructions provided by your insurance company.

Contents
This report must be preceded or accompanied by a prospectus. To obtain an additional prospectus or summary prospectus, if available, call (800)728-3337 or your financial representative. We advise you to consider the Fund’s objectives, risks, charges and expenses carefully before investing. The summary prospectus and prospectus contain this and other important information about the Fund. Please read the prospectus carefully before you invest.
The Fund will be managed using the CROCI® Investment Process which is based on portfolio management’s belief that, over time, stocks which display more favorable financial metrics (for example, the CROCI® Economic P/E Ratio) as generated by this process may outperform stocks which display less favorable metrics. This premise may not prove to be correct and prospective investors should evaluate this assumption prior to investing in the Fund. Stocks may decline in value. The Fund may lend securities to approved institutions. Please read the prospectus for details.
The brand DWS represents DWS Group GmbH & Co. KGaA and any of its subsidiaries such as DWS Distributors, Inc. which offers investment products or DWS Investment Management Americas, Inc. and RREEF America L.L.C. which offer advisory services.
DWS Distributors, Inc., 222 South Riverside Plaza, Chicago, IL 60606, (800)621-1148
NOT FDIC/NCUA INSURED NO BANK GUARANTEE MAY LOSE VALUE NOT A DEPOSIT NOT INSURED BY ANY FEDERAL GOVERNMENT AGENCY
| | | | | | |
| | 2 | | | | | | Deutsche DWS Variable Series II — DWS CROCI® U.S. VIP |
| | |
| Performance Summary | | December 31, 2019 (Unaudited) |
Fund performance shown is historical, assumes reinvestment of all dividend and capital gain distributions and does not guarantee future results. Investment return and principal value fluctuate with changing market conditions so that, when redeemed, shares may be worth more or less than their original cost. Current performance may be lower or higher than the performance data quoted. Please contact your participating insurance company for the Fund’s most recentmonth-end performance. Performance does not reflect charges and fees (“contract charges”) associated with the separate account that invests in the Fund or any variable life insurance policy or variable annuity contract for which the Fund is an investment option. These charges and fees will reduce returns. While all share classes have the same underlying portfolio, their performance will differ.
The gross expense ratios of the Fund, as stated in the fee table of the prospectus dated May 1, 2019 are 0.84% and 1.16% for Class A and Class B shares, respectively, and may differ from the expense ratios disclosed in the Financial Highlights tables in this report.
Generally accepted accounting principles require adjustments to be made to the net assets of the Fund at period end for financial reporting purposes only, and as such, the total return based on the unadjusted net asset value per share may differ from the total return reported in the financial highlights.
Growth of an Assumed $10,000
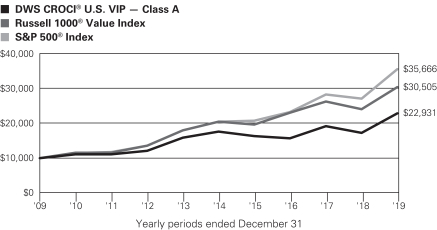
Russell 1000® Value Index is an unmanaged market capitalization-weighted index of value-oriented stocks of the largest U.S. domiciled companies that are included in the Russell 1000 Index. Value-oriented stocks tend to have lower price-to-book ratios and lower forecasted growth values. Russell 1000 Index is an unmanaged price-only index of the 1,000 largest capitalized companies that are domiciled in the U.S. and whose common stocks are traded.
Standard & Poor’s 500® Index (S&P 500) Index is an unmanaged,capitalization-weighted index of 500 stocks. The index is designed to measure performance of the broad domestic economy through changes in the aggregate market value of 500 stocks representing all major industries.
Effective December 1, 2019, the Russell 1000® Value Index has replaced the S&P 500® Index as the fund’s primary benchmark index. The Advisor believes that the new index better represents the fund’s investment strategy and is therefore more suitable for performance comparison.
Index returns do not reflect any fees or expenses and it is not possible to invest directly into an index.
Prior to May 1, 2017, the Fund operated with a different investment strategy. Prior to October 3, 2016, the Fund had a team that operated with a different investment strategy. Performance would have been different if the Fund’s current strategy had been in effect.
| | | | |
Deutsche DWS Variable Series II — DWS CROCI® U.S. VIP | | | | | 3 |
| | | | | | | | | | |
| Comparative Results | | | | | | | | |
| | | | | |
| DWS CROCI® U.S. VIP | | | | 1-Year | | 3-Year | | 5-Year | | 10-Year |
| Class A | | Growth of $10,000 | | $13,295 | | $14,623 | | $13,020 | | $22,931 |
| | | Average annual total return | | 32.95% | | 13.50% | | 5.42% | | 8.65% |
| Russell 1000® Value Index | | Growth of $10,000 | | $12,654 | | $13,194 | | $14,890 | | $30,505 |
| | Average annual total return | | 26.54% | | 9.68% | | 8.29% | | 11.80% |
| S&P 500® Index | | Growth of $10,000 | | $13,149 | | $15,317 | | $17,386 | | $35,666 |
| | Average annual total return | | 31.49% | | 15.27% | | 11.70% | | 13.56% |
| | | | | |
| DWS CROCI® U.S. VIP | | | | 1-Year | | 3-Year | | 5-Year | | 10-Year |
| Class B | | Growth of $10,000 | | $13,249 | | $14,486 | | $12,826 | | $22,270 |
| | | Average annual total return | | 32.49% | | 13.15% | | 5.10% | | 8.34% |
| Russell 1000® Value Index | | Growth of $10,000 | | $12,654 | | $13,194 | | $14,890 | | $30,505 |
| | Average annual total return | | 26.54% | | 9.68% | | 8.29% | | 11.80% |
| S&P 500® Index | | Growth of $10,000 | | $13,149 | | $15,317 | | $17,386 | | $35,666 |
| | Average annual total return | | 31.49% | | 15.27% | | 11.70% | | 13.56% |
The growth of $10,000 is cumulative.
| | | | | | |
| | 4 | | | | | | Deutsche DWS Variable Series II — DWS CROCI® U.S. VIP |
| | |
| Management Summary | | December 31, 2019 (Unaudited) |
The Fund returned 32.95% (Class A shares, unadjusted for contract charges) in 2019 and outperformed the 26.54% return of its benchmark, the Russell 1000® Value Index. The Russell 1000 Value Index replaced the Standard & Poor’s 500® Index (S&P 500®) as the Fund’s benchmark on December 1, 2019.
U.S. equities delivered a robust, double-digit gain despite the potential headwinds of slowing global growth and the ongoing U.S.-China trade dispute. The U.S. Federal Reserve’s (Fed’s) shift to a more accommodative interest-rate policy was the key driver of the rally. The Fed cut rates by a quarter point on three occasions, bringing its benchmark federal funds rate to a range of 1.50% to 1.75%. This marked an important departure from the consensus that existed in late 2018, when the markets were anticipating several additional rate increases before the Fed wrapped up its tightening cycle. Investors were also encouraged by the fact that both domestic economic growth and corporate profits remained in positive territory, calming the recession fears that pressured the market in late 2018.
In a continuation of a longstanding trend, the value style underperformed growth in the12-month period. The Russell 1000 Value Index, while producing a robust absolute return of 26.54%, nonetheless trailed the 36.39% gain of the Russell 1000® Growth Index. At of time of slowing economic conditions across the globe, investors continued to demonstrate a preference for faster-growing companies over those with attractive valuations and/or high dividends.
Sector allocations and individual stock selection both played a role in the Fund’s strong performance in 2019. With regard to the former, the Fund was helped by having an overweight in financials and an underweight in the poor-performing energy sector. In terms of selection, the Fund’s holdings outpaced the corresponding benchmark components in eight of the ten sectors in which the Fund was invested. We generated the widest margin of outperformance in the health care, where shares of the biotechnology firm Celgene Corp.* rose sharply in January after the company received a takeover bid from Bristol-Myers Squibb Co. A position in the device/supply company Medtronic PLC* was an additional positive, as were themega-cap pharmaceutical stocks Pfizer, Inc. and Eli Lilly & Co. The financial sector proved to be a further area of strength, led by investments in Synchrony Financial and Berkshire Hathaway, Inc.* Stock selection also provided a meaningful advantage in the energy, consumer discretionary, and industrials sectors.
Conversely, the Fund lost some ground through the underperformance of its holdings in the communication services, real estate, and utilities sectors. Positions in CBS Corp.* and Viacom, Inc.* were key detractors in communication services, as their merger was viewed negatively by investors. (The merger was completed on December 4, 2019, at which point the two companies became ViacomCBS, Inc.)
The Fund’sbottom-up approach to value investing continued to result in divergent sector weightings in relation to the benchmark. At the close of the period, the portfolio had meaningful overweights in financials and utilities, together with smaller overweights in health care and communication services. Its largest underweights were in consumer staples, energy, and real estate, followed by information technology and consumer discretionary.
Although the overall market staged a sizable rally in the past year, we continued to find attractive ideas at the individual company level. This was evident in the Fund’s metrics, which demonstrated what we see as a favorable balance of compelling valuations and positive fundamentals. As of December 31, 2019, the Fund had aprice-to-earnings ratio of 11.8 based onone-year forward earnings estimates, versus 15.7 for the Russell 1000 Value Index. At the same time, the companies in the portfolio featured a return on equity of 21.7%, compared with 11.1% for the index. We believe these characteristics help create a firm foundation for longer-term results.
Di Kumble, CFA, Managing Director
John Moody, Vice President
Portfolio Managers
The views expressed reflect those of the portfolio management team only through the end of the period of the report as stated on the cover. The management team’s views are subject to change at any time based on market and other conditions and should not be construed as a recommendation. Past performance is no guarantee of future results. Current and future portfolio holdings are subject to risk.
| | | | |
Deutsche DWS Variable Series II — DWS CROCI® U.S. VIP | | | | | 5 |
Terms to Know
Russell 1000 Value Index is an unmanaged market capitalization-weighted index of value-oriented stocks of the largest U.S. domiciled companies that are included in the Russell 1000 Index. Value-oriented stocks tend to have lowerprice-to-book ratios and lower forecasted growth values. Russell 1000 Index is an unmanaged price-only index of the 1,000 largest capitalized companies that are domiciled in the U.S. and whose common stocks are traded.
Standard & Poor’s 500 Index (S&P 500) is an unmanaged, capitalization-weighted index of 500 stocks. The index is designed to measure performance of the broad domestic economy through changes in the aggregate market value of 500 stocks representing all major industries.
Russell 1000 Growth Indexis an unmanaged index that consists of those stocks in the Russell 1000® Index that have higherprice-to-book ratios and higher forecasted growth values. Russell 1000 Index is an unmanaged price-only index of the 1,000 largest capitalized companies that are domiciled in the U.S. and whose common stocks are traded.
Thefederal funds rate is the interest rate a borrowing bank pays to a lending bank, with the rate determined by members of the Federal Open Market Committee (FOMC) at their regular meetings. The federal funds rate sets the standard for short-term U.S. interest rates.
Contribution anddetraction incorporate both a stock’s total return and its weighting in the index.
Overweight means the fund holds a higher weighting in a given sector or security than the benchmark.Underweight means the fund holds a lower weighting.
Price-to-earnings ratio (P/E) ratio (or accounting P/E ratio) compares a company’s current share price to itsper-share earnings. The CROCI economic P/E ratio is a measure of valuation that incorporates all of the assets and liabilities of a company which are adjusted systematically by the CROCI team.
Return on equity is the amount of net income returned as a percentage of shareholders’ equity.
| * | Not held at December 31, 2019. |
| | | | | | |
| | 6 | | | | | | Deutsche DWS Variable Series II — DWS CROCI® U.S. VIP |
| | |
| Portfolio Summary | | (Unaudited) |
| | | | | | | | |
| Asset Allocation (As a % of Investment Portfolio excluding Securities Lending Collateral) | | 12/31/19 | | | 12/31/18 | |
| Common Stocks | | | 99% | | | | 97% | |
| Cash Equivalents | | | 1% | | | | 3% | |
| | | | 100% | | | | 100% | |
| | |
Sector Diversification (As a % of Investment Portfolio excluding Cash Equivalents and Securities Lending Collateral) | | 12/31/19 | | | 12/31/18 | |
| Financials | | | 38% | | | | 27% | |
| Utilities | | | 17% | | | | 2% | |
| Health Care | | | 16% | | | | 16% | |
| Communication Services | | | 10% | | | | — | |
| Industrials | | | 10% | | | | 11% | |
| Energy | | | 3% | | | | — | |
| Materials | | | 2% | | | | 10% | |
| Consumer Discretionary | | | 2% | | | | 8% | |
| Information Technology | | | 2% | | | | 21% | |
| Consumer Staples | | | — | | | | 5% | |
| | | | 100% | | | | 100% | |
Portfolio holdings and characteristics are subject to change.
For more complete details about the Fund’s investment portfolio, see page 8.
Following the Fund’s fiscal first and thirdquarter-end, a complete portfolio holdings listing is filed with the SEC on Form N-PORT. The Fund’s Form N-PORT will be available on the SEC’s Web site at sec.gov. The Fund’s portfolio holdings are also posted on dws.com from time to time. Please read the Fund’s current prospectus for more information.
| | | | |
Deutsche DWS Variable Series II — DWS CROCI® U.S. VIP | | | | | 7 |
| | |
| Investment Portfolio | | as of December 31, 2019 |
| | | | | | | | |
| | | Shares | | | Value ($) | |
| Common Stocks 99.4% | | | | | | | | |
| Communication Services 10.2% | |
Media | |
| | |
Comcast Corp. “A” | | | 84,318 | | | | 3,791,780 | |
| | |
Discovery, Inc. “A”* (a) | | | 121,871 | | | | 3,990,057 | |
| | |
ViacomCBS, Inc. “B” | | | 193,293 | | | | 8,112,507 | |
| | | | | | | | |
| | | | 15,894,344 | |
|
| Consumer Discretionary 2.3% | |
Household Durables | |
D.R. Horton, Inc. | | | 69,404 | | | | 3,661,061 | |
|
| Energy 2.5% | |
Oil, Gas & Consumable Fuels | |
Cabot Oil & Gas Corp. | | | 220,573 | | | | 3,840,176 | |
|
| Financials 37.3% | |
Banks 25.0% | |
| | |
Citigroup, Inc. | | | 50,536 | | | | 4,037,321 | |
| | |
Citizens Financial Group, Inc. | | | 99,255 | | | | 4,030,746 | |
| | |
Comerica, Inc. | | | 54,317 | | | | 3,897,245 | |
| | |
Huntington Bancshares, Inc. | | | 255,901 | | | | 3,859,002 | |
| | |
JPMorgan Chase & Co. | | | 28,920 | | | | 4,031,448 | |
| | |
M&T Bank Corp. | | | 23,197 | | | | 3,937,691 | |
| | |
PNC Financial Services Group, Inc. | | | 24,909 | | | | 3,976,224 | |
| | |
Truist Financial Corp. | | | 69,098 | | | | 3,891,599 | |
| | |
U.S. Bancorp. | | | 63,641 | | | | 3,773,275 | |
| | |
Wells Fargo & Co. | | | 69,802 | | | | 3,755,348 | |
| | | | | | | | |
| | | | 39,189,899 | |
|
Capital Markets 2.5% | |
Bank of New York Mellon Corp. | | | 77,475 | | | | 3,899,316 | |
|
Consumer Finance 9.8% | |
| | |
American Express Co. | | | 31,372 | | | | 3,905,500 | |
| | |
Capital One Financial Corp. | | | 38,905 | | | | 4,003,714 | |
| | |
Discover Financial Services | | | 44,836 | | | | 3,802,989 | |
| | |
Synchrony Financial | | | 101,952 | | | | 3,671,292 | |
| | | | | | | | |
| | | | 15,383,495 | |
|
| Health Care 15.7% | |
Biotechnology 5.1% | |
| | |
Gilead Sciences, Inc. | | | 58,145 | | | | 3,778,262 | |
| | |
Regeneron Pharmaceuticals, Inc.* | | | 11,042 | | | | 4,146,050 | |
| | | | | | | | |
| | | | 7,924,312 | |
|
Pharmaceuticals 10.6% | |
| | |
Bristol-Myers Squibb Co. | | | 66,634 | | | | 4,277,237 | |
| | |
Eli Lilly & Co. | | | 32,911 | | | | 4,325,493 | |
| | |
Merck & Co., Inc. | | | 44,775 | | | | 4,072,286 | |
| | |
Pfizer, Inc. | | | 100,861 | | | | 3,951,734 | |
| | | | | | | | |
| | | | 16,626,750 | |
|
| Industrials 9.5% | |
Airlines 2.3% | |
United Airlines Holdings, Inc.* | | | 40,498 | | | | 3,567,469 | |
|
Machinery 4.7% | |
| | |
Cummins, Inc. | | | 20,636 | | | | 3,693,019 | |
| | |
PACCAR, Inc. | | | 47,502 | | | | 3,757,408 | |
| | | | | | | | |
| | | | 7,450,427 | |
| | | | | | | | |
| | | Shares | | | Value ($) | |
|
Professional Services 2.5% | |
ManpowerGroup, Inc. | | | 40,342 | | | | 3,917,208 | |
|
| Information Technology 2.2% | |
Technology Hardware, Storage & Peripherals | |
Hewlett Packard Enterprise Co. | | | 216,707 | | | | 3,436,973 | |
|
| Materials 2.4% | |
Chemicals | |
LyondellBasell Industries NV “A” | | | 40,287 | | | | 3,806,316 | |
|
| Utilities 17.3% | |
Electric Utilities 7.5% | |
| | |
Duke Energy Corp. | | | 43,289 | | | | 3,948,390 | |
| | |
Exelon Corp. | | | 82,465 | | | | 3,759,579 | |
| | |
PPL Corp. | | | 112,273 | | | | 4,028,355 | |
| | | | | | | | |
| | | | 11,736,324 | |
|
Multi-Utilities 9.8% | |
| | |
Consolidated Edison, Inc. | | | 43,337 | | | | 3,920,698 | |
| | |
Dominion Energy, Inc | | | 45,761 | | | | 3,789,926 | |
| | |
DTE Energy Co. | | | 30,512 | | | | 3,962,594 | |
| | |
Public Service Enterprise Group, Inc. | | | 62,387 | | | | 3,683,952 | |
| | | | | | | | |
| | | | | 15,357,170 | |
| Total Common Stocks (Cost $142,728,054) | | | | 155,691,240 | |
|
| Securities Lending Collateral 2.0% | |
DWS Government & Agency Securities Portfolio “DWS Government Cash Institutional Shares”, 1.50% (b) (c) (Cost $3,120,056) | | | 3,120,056 | | | | 3,120,056 | |
| | |
| Cash Equivalents 0.5% | | | | | | | | |
DWS Central Cash Management Government Fund, 1.62% (b) (Cost $845,193) | | | 845,193 | | | | 845,193 | |
| | |
| | | % of Net
Assets | | | Value ($) | |
Total Investment Portfolio (Cost $146,693,303) | | | 101.9 | | | | 159,656,489 | |
| Other Assets and Liabilities, Net | | | (1.9 | ) | | | (3,016,017 | ) |
| Net Assets | | | 100.0 | | | | 156,640,472 | |
The accompanying notes are an integral part of the financial statements.
| | | | | | |
| | 8 | | | | | | Deutsche DWS Variable Series II — DWS CROCI® U.S. VIP |
A summary of the Fund’s transactions with affiliated investments during the year ended December 31, 2019 are as follows:
| | | | | | | | | | | | | | | | | | | | | | | | | | | | | | | | |
Value ($) at
12/31/2018 | | Purchases
Cost ($) | | | Sales
Proceeds ($) | | | Net
Realized
Gain/
(Loss) ($) | | | Net Change in
Unrealized
Appreciation
(Depreciation) ($) | | | Income ($) | | | Capital Gain
Distributions ($) | | | Number
of Shares
at
12/31/2019 | | | Value ($)
at
12/31/2019 | |
Securities Lending Collateral 2.0% | |
DWS Government & Agency Securities Portfolio “DWS Government Cash Institutional Shares”, 1.50% (b) (c) | |
| — | | | 3,120,056 | (d) | | | — | | | | — | | | | — | | | | 341 | | | | — | | | | 3,120,056 | | | | 3,120,056 | |
Cash Equivalents 0.5% | |
DWS Central Cash Management Government Fund, 1.62% (b) | |
| 3,576,006 | | | 11,132,733 | | | | 13,863,546 | | | | — | | | | — | | | | 28,191 | | | | — | | | | 845,193 | | | | 845,193 | |
| 3,576,006 | | | 14,252,789 | | | | 13,863,546 | | | | — | | | | — | | | | 28,532 | | | | — | | | | 3,965,249 | | | | 3,965,249 | |
| * | Non-income producing security. |
| (a) | All or a portion of these securities were on loan. In addition, “Other Assets and Liabilities, Net” may include pending sales that are also on loan. The value of securities loaned at December 31, 2019 amounted to $3,049,273, which is 2% of net assets. |
| (b) | Affiliated fund managed by DWS Investment Management Americas, Inc. The rate shown is the annualizedseven-day yield at period end. |
| (c) | Represents cash collateral held in connection with securities lending. Income earned by the Fund is net of borrower rebates. |
| (d) | Represents the net increase (purchase cost) or decrease (sales proceeds) in the amount invested in cash collateral for the year ended December 31, 2019. |
Fair Value Measurements
Various inputs are used in determining the value of the Fund’s investments. These inputs are summarized in three broad levels. Level 1 includes quoted prices in active markets for identical securities. Level 2 includes other significant observable inputs (including quoted prices for similar securities, interest rates, prepayment speeds and credit risk). Level 3 includes significant unobservable inputs (including the Fund’s own assumptions in determining the fair value of investments). The level assigned to the securities valuations may not be an indication of the risk or liquidity associated with investing in those securities.
The following is a summary of the inputs used as of December 31, 2019 in valuing the Fund’s investments. For information on the Fund’s policy regarding the valuation of investments, please refer to the Security Valuation section of Note A in the accompanying Notes to Financial Statements.
| | | | | | | | | | | | | | | | |
| Assets | | Level 1 | | | Level 2 | | | Level 3 | | | Total | |
| Common Stocks (e) | | $ | 155,691,240 | | | $ | — | | | $ | — | | | $ | 155,691,240 | |
| Short-Term Investment (e) | | | 3,965,249 | | | | — | | | | — | | | | 3,965,249 | |
| Total | | $ | 159,656,489 | | | $ | — | | | $ | — | | | $ | 159,656,489 | |
| (e) | See Investment Portfolio for additional detailed categorizations. |
The accompanying notes are an integral part of the financial statements.
| | | | |
Deutsche DWS Variable Series II — DWS CROCI® U.S. VIP | | | | | 9 |
Statement of Assets and Liabilities
| | | | |
| |
| Assets | | | | |
| Investments innon-affiliated securities, at value (cost $142,728,054) — including $3,049,273 of securities loaned | | $ | 155,691,240 | |
| Investment in DWS Government & Agency Securities Portfolio (cost $3,120,056)* | | | 3,120,056 | |
| Investment in DWS Central Cash Management Government Fund (cost $845,193) | | | 845,193 | |
| Cash | | | 518 | |
| Receivable for Fund shares sold | | | 234 | |
| Dividends receivable | | | 387,675 | |
| Interest receivable | | | 1,789 | |
| Other assets | | | 3,370 | |
| Total assets | | | 160,050,075 | |
| |
| Liabilities | | | | |
| Payable upon return of securities loaned | | | 3,120,056 | |
| Payable for Fund shares redeemed | | | 118,504 | |
| Accrued management fee | | | 64,719 | |
| Accrued Trustees’ fees | | | 3,566 | |
| Other accrued expenses and payables | | | 102,758 | |
| Total liabilities | | | 3,409,603 | |
| Net assets, at value | | $ | 156,640,472 | |
| |
| Net Assets Consist of | | | | |
| Distributable earnings (loss) | | | 22,212,401 | |
| Paid-in capital | | | 134,428,071 | |
| Net assets, at value | | $ | 156,640,472 | |
| |
| Net Asset Value | | | | |
Class A | | | | |
| |
| Net Asset Value, and redemption price per share ($152,970,644 ÷ 9,489,452 outstanding shares of beneficial interest, no par value, unlimited shares authorized) | | $ | 16.12 | |
Class B | | | | |
| |
| Net Asset Value, offering and redemption price per share ($3,669,828 ÷ 226,957 outstanding shares of beneficial interest, no par value, unlimited shares authorized) | | $ | 16.17 | |
| * | Represents collateral on securities loaned. |
Statement of Operations
| | |
| for the year ended December 31, 2019 |
| | | | |
| |
| Investment Income | | | | |
| Income: | | | | |
| Dividends | | $ | 4,087,298 | |
| Income distributions — DWS Central Cash Management Government Fund | | | 28,191 | |
| Securities lending income, net of borrower rebates | | | 341 | |
| Total income | | | 4,115,830 | |
| Expenses: | | | | |
| Management fee | | | 943,964 | |
| Administration fee | | | 145,225 | |
| Services to Shareholders | | | 2,531 | |
| Recordkeeping fee (Class B) | | | 2,344 | |
| Distribution service fee (Class B) | | | 8,538 | |
| Custodian fee | | | 4,453 | |
| Professional fees | | | 76,582 | |
| Reports to shareholders | | | 28,960 | |
| Trustees’ fees and expenses | | | 9,962 | |
| Other | | | 8,342 | |
| Total expenses before expense reductions | | | 1,230,901 | |
| Expense reductions | | | (207,268 | ) |
| Total expenses after expense reductions | | | 1,023,633 | |
| Net investment income | | | 3,092,197 | |
| |
| Realized and Unrealized gain (loss) | | | | |
| Net realized gain (loss) from investments | | | 6,704,808 | |
| Change in net unrealized appreciation (depreciation) on investments | | | 31,036,303 | |
| Net gain (loss) | | | 37,741,111 | |
| Net increase (decrease) in net assets resulting from operations | | $ | 40,833,308 | |
The accompanying notes are an integral part of the financial statements.
| | | | | | |
| | 10 | | | | | | Deutsche DWS Variable Series II — DWS CROCI® U.S. VIP |
Statements of Changes in Net Assets
| | | | | | | | |
| | | Years Ended December 31, | |
| Increase (Decrease) in Net Assets | | 2019 | | | 2018 | |
| Operations: | | | | | | | | |
| Net investment income (loss) | | $ | 3,092,197 | | | $ | 2,797,835 | |
| Net realized gain (loss) | | | 6,704,808 | | | | 12,382,135 | |
| Change in net unrealized appreciation (depreciation) | | | 31,036,303 | | | | (30,136,434 | ) |
| Net increase (decrease) in net assets resulting from operations | | | 40,833,308 | | | | (14,956,464 | ) |
| Distributions to shareholders: | | | | | | | | |
Class A | | | (14,271,121 | ) | | | (14,077,923 | ) |
Class B | | | (332,950 | ) | | | (318,032 | ) |
| Total distributions | | | (14,604,071 | ) | | | (14,395,955 | ) |
Class A | | | | | | | | |
| Proceeds from shares sold | | | 3,373,728 | | | | 2,162,910 | |
| Reinvestment of distributions | | | 14,271,121 | | | | 14,077,923 | |
| Payments of shares redeemed | | | (15,030,273 | ) | | | (15,569,405 | ) |
| Net increase (decrease) in net assets from Class A share transactions | | | 2,614,576 | | | | 671,428 | |
Class B | | | | | | | | |
| Proceeds from shares sold | | | 146,155 | | | | 1,589,334 | |
| Reinvestment of distributions | | | 332,950 | | | | 318,032 | |
| Payments of shares redeemed | | | (438,366 | ) | | | (1,755,739 | ) |
| Net increase (decrease) in net assets from Class B share transactions | | | 40,739 | | | | 151,627 | |
| Increase (decrease) in net assets | | | 28,884,552 | | | | (28,529,364 | ) |
| Net assets at beginning of period | | | 127,755,920 | | | | 156,285,284 | |
| | |
| Net assets at end of period | | $ | 156,640,472 | | | $ | 127,755,920 | |
| | |
| Other Information | | | | | | | | |
Class A | | | | | | | | |
| Shares outstanding at beginning of period | | | 9,266,278 | | | | 9,181,648 | |
| Shares sold | | | 231,369 | | | | 140,074 | |
| Shares issued to shareholders in reinvestment of distributions | | | 1,002,890 | | | | 953,143 | |
| Shares redeemed | | | (1,011,085 | ) | | | (1,008,587 | ) |
| Net increase (decrease) in Class A shares | | | 223,174 | | | | 84,630 | |
| | |
| Shares outstanding at end of period | | | 9,489,452 | | | | 9,266,278 | |
Class B | | | | | | | | |
| Shares outstanding at beginning of period | | | 223,302 | | | | 210,410 | |
| Shares sold | | | 9,627 | | | | 104,157 | |
| Shares issued to shareholders in reinvestment of distributions | | | 23,283 | | | | 21,431 | |
| Shares redeemed | | | (29,255 | ) | | | (112,696 | ) |
| Net increase (decrease) in Class B shares | | | 3,655 | | | | 12,892 | |
| | |
| Shares outstanding at end of period | | | 226,957 | | | | 223,302 | |
The accompanying notes are an integral part of the financial statements.
| | | | |
Deutsche DWS Variable Series II — DWS CROCI® U.S. VIP | | | | | 11 |
Financial Highlights
| | | | | | | | | | | | | | | | | | | | |
| | | Years Ended December 31, | |
| Class A | | 2019 | | | 2018 | | | 2017 | | | 2016 | | | 2015 | |
| | | | | |
| Selected Per Share Data | | | | | | | | | | | | | | | | | | | | |
| Net asset value, beginning of period | | $ | 13.46 | | | $ | 16.64 | | | $ | 13.75 | | | $ | 15.29 | | | $ | 17.38 | |
| Income (loss) from investment operations: | | | | | | | | | | | | | | | | | | | | |
| | | | | |
Net investment income (loss)a | | | .31 | | | | .29 | | | | .24 | | | | .23 | | | | .11 | |
Net realized and unrealized gain (loss) | | | 3.92 | | | | (1.89 | ) | | | 2.88 | | | | (.93 | ) | | | (1.20 | ) |
Total from investment operations | | | 4.23 | | | | (1.60 | ) | | | 3.12 | | | | (.70 | ) | | | (1.09 | ) |
| Less distributions from: | | | | | | | | | | | | | | | | | | | | |
| | | | | |
Net investment income | | | (.30 | ) | | | (.41 | ) | | | (.23 | ) | | | (.14 | ) | | | (.25 | ) |
Net realized gains on investment transactions | | | (1.27 | ) | | | (1.17 | ) | | | — | | | | (.70 | ) | | | (.75 | ) |
Total distributions | | | (1.57 | ) | | | (1.58 | ) | | | (.23 | ) | | | (.84 | ) | | | (1.00 | ) |
| Net asset value, end of period | | $ | 16.12 | | | $ | 13.46 | | | $ | 16.64 | | | $ | 13.75 | | | $ | 15.29 | |
| Total Return (%)b | | | 32.95 | | | | (10.50 | ) | | | 22.88 | c | | | (4.39 | ) | | | (6.87 | ) |
| | | | | |
| Ratios to Average Net Assets and Supplemental Data | | | | | | | | | | | | | | | | | | | | |
| Net assets, end of period ($ millions) | | | 153 | | | | 125 | | | | 153 | | | | 227 | | | | 293 | |
| Ratio of expenses before expense reductions (%)d | | | .84 | | | | .84 | | | | .82 | | | | .81 | | | | .78 | |
| Ratio of expenses after expense reductions (%)d | | | .70 | | | | .72 | | | | .72 | | | | .74 | | | | .73 | |
| Ratio of net investment income (loss) (%) | | | 2.13 | | | | 1.89 | | | | 1.59 | | | | 1.66 | | | | .65 | |
| Portfolio turnover rate (%) | | | 111 | | | | 100 | | | | 97 | | | | 293 | | | | 121 | |
| a | Based on average shares outstanding during the period. |
| b | Total return would have been lower had certain expenses not been reduced. |
| c | The Fund’s total return includes a reimbursement by the Adviser for commission costs incurred in connection with purchases and sales of portfolio assets due to the change in investment strategy, which otherwise would have reduced total return by 0.03%. |
| d | Expense ratio does not reflect charges and fees associated with the separate account that invests in the Fund or any variable life insurance policy or variable annuity contract for which the Fund is an investment option. |
| | | | | | | | | | | | | | | | | | | | |
| | | Years Ended December 31, | |
| Class B | | 2019 | | | 2018 | | | 2017 | | | 2016 | | | 2015 | |
| | | | | |
| Selected Per Share Data | | | | | | | | | | | | | | | | | | | | |
| Net asset value, beginning of period | | $ | 13.50 | | | $ | 16.67 | | | $ | 13.78 | | | $ | 15.31 | | | $ | 17.40 | |
| Income (loss) from investment operations: | | | | | | | | | | | | | | | | | | | | |
| | | | | |
Net investment income (loss)a | | | .27 | | | | .24 | | | | .20 | | | | .19 | | | | .06 | |
Net realized and unrealized gain (loss) | | | 3.92 | | | | (1.88 | ) | | | 2.87 | | | | (.92 | ) | | | (1.21 | ) |
Total from investment operations | | | 4.19 | | | | (1.64 | ) | | | 3.07 | | | | (.73 | ) | | | (1.15 | ) |
| Less distributions from: | | | | | | | | | | | | | | | | | | | | |
| | | | | |
Net investment income | | | (.25 | ) | | | (.36 | ) | | | (.18 | ) | | | (.10 | ) | | | (.19 | ) |
Net realized gains on investment transactions | | | (1.27 | ) | | | (1.17 | ) | | | — | | | | (.70 | ) | | | (.75 | ) |
Total distributions | | | (1.52 | ) | | | (1.53 | ) | | | (.18 | ) | | | (.80 | ) | | | (.94 | ) |
| Net asset value, end of period | | $ | 16.17 | | | $ | 13.50 | | | $ | 16.67 | | | $ | 13.78 | | | $ | 15.31 | |
| Total Return (%)b | | | 32.49 | | | | (10.71 | ) | | | 22.45 | c | | | (4.62 | ) | | | (7.16 | ) |
| | | | | |
| Ratios to Average Net Assets and Supplemental Data | | | | | | | | | | | | | | | | | | | | |
| Net assets, end of period ($ millions) | | | 4 | | | | 3 | | | | 4 | | | | 4 | | | | 4 | |
| Ratio of expenses before expense reductions (%)d | | | 1.16 | | | | 1.16 | | | | 1.15 | | | | 1.13 | | | | 1.10 | |
| Ratio of expenses after expense reductions (%)d | | | 1.02 | | | | 1.04 | | | | 1.03 | | | | 1.05 | | | | 1.04 | |
| Ratio of net investment income (loss) (%) | | | 1.82 | | | | 1.55 | | | | 1.31 | | | | 1.37 | | | | .35 | |
| Portfolio turnover rate (%) | | | 111 | | | | 100 | | | | 97 | | | | 293 | | | | 121 | |
| a | Based on average shares outstanding during the period. |
| b | Total return would have been lower had certain expenses not been reduced. |
| c | The Fund’s total return includes a reimbursement by the Adviser for commission costs incurred in connection with purchases and sales of portfolio assets due to the change in investment strategy, which otherwise would have reduced total return by 0.03%. |
| d | Expense ratio does not reflect charges and fees associated with the separate account that invests in the Fund or any variable life insurance policy or variable annuity contract for which the Fund is an investment option. |
The accompanying notes are an integral part of the financial statements.
| | | | | | |
| | 12 | | | | | | Deutsche DWS Variable Series II — DWS CROCI® U.S. VIP |
| | |
| Notes to Financial Statements | | |
A. Organization and Significant Accounting Policies
DWS CROCI® U.S. VIP (the “Fund”) is a diversified series of Deutsche DWS Variable Series II (the “Trust”), which is registered under the Investment Company Act of 1940, as amended (the “1940 Act”), as anopen-end management investment company organized as a Massachusetts business trust.
Multiple Classes of Shares of Beneficial Interest. The Fund offers two classes of shares (Class A shares and Class B shares). Sales of Class B shares are subject to recordkeeping fees up to 0.15% and Rule12b-1 fees under the 1940 Act equal to an annual rate of 0.25% of the average daily net assets of the Class B shares of the Fund. Class A shares are not subject to such fees.
Investment income, realized and unrealized gains and losses, and certainfund-level expenses and expense reductions, if any, are borne pro rata on the basis of relative net assets by the holders of all classes of shares except that each class bears certain expenses unique to that class (including the applicable Rule12b-1 fee and recordkeeping fees). Differences inclass-level expenses may result in payment of different per share dividends by class. All shares have equal rights with respect to voting subject toclass-specific arrangements.
The Fund’s financial statements are prepared in accordance with accounting principles generally accepted in the United States of America (“U.S. GAAP”) which require the use of management estimates. Actual results could differ from those estimates. The Fund qualifies as an investment company under Topic 946 of Accounting Standards Codification of U.S. GAAP. The policies described below are followed consistently by the Fund in the preparation of its financial statements.
Security Valuation. Investments are stated at value determined as of the close of regular trading on the New York Stock Exchange on each day the exchange is open for trading.
Various inputs are used in determining the value of the Fund’s investments. These inputs are summarized in three broad levels. Level 1 includes quoted prices in active markets for identical securities. Level 2 includes other significant observable inputs (including quoted prices for similar securities, interest rates, prepayment speeds and credit risk). Level 3 includes significant unobservable inputs (including the Fund’s own assumptions in determining the fair value of investments). The level assigned to the securities valuations may not be an indication of the risk or liquidity associated with investing in those securities.
Equity securities are valued at the most recent sale price or official closing price reported on the exchange (U.S. or foreign) orover-the-counter market on which they trade. Securities for which no sales are reported are valued at the calculated mean between the most recent bid and asked quotations on the relevant market or, if a mean cannot be determined, at the most recent bid quotation. Equity securities are generally categorized as Level 1.
Investments inopen-end investment companies are valued at their net asset value each business day and are categorized as Level 1.
Securities and other assets for which market quotations are not readily available or for which the above valuation procedures are deemed not to reflect fair value are valued in a manner that is intended to reflect their fair value as determined in accordance with procedures approved by the Board and are generally categorized as Level 3. In accordance with the Fund’s valuation procedures, factors considered in determining value may include, but are not limited to, the type of the security; the size of the holding; the initial cost of the security; the existence of any contractual restrictions on the security’s disposition; the price and extent of public trading in similar securities of the issuer or of comparable companies; quotations or evaluated prices frombroker-dealers and/or pricing services; information obtained from the issuer, analysts, and/or the appropriate stock exchange (forexchange-traded securities); an analysis of the company’s or issuer’s financial statements; an evaluation of the forces that influence the issuer and the market(s) in which the security is purchased and sold; and with respect to debt securities, the maturity, coupon, creditworthiness, currency denomination and the movement of the market in which the security is normally traded. The value determined under these procedures may differ from published values for the same securities.
Disclosure about the classification of fair value measurements is included in a table following the Fund’s Investment Portfolio.
Foreign Currency Translations. The books and records of the Fund are maintained in U.S. dollars. Investment securities and other assets and liabilities denominated in a foreign currency are translated into
| | | | |
Deutsche DWS Variable Series II — DWS CROCI® U.S. VIP | | | | | 13 |
U.S. dollars at the prevailing exchange rates at period end. Purchases and sales of investment securities, income and expenses are translated into U.S. dollars at the prevailing exchange rates on the respective dates of the transactions.
Net realized and unrealized gains and losses on foreign currency transactions represent net gains and losses between trade and settlement dates on securities transactions, the acquisition and disposition of foreign
currencies, and the difference between the amount of net investment income accrued and the U.S. dollar amount actually received. The portion of both realized and unrealized gains and losses on investments that results from fluctuations in foreign currency exchange rates is not separately disclosed but is included with net realized and unrealized gain/appreciation and loss/depreciation on investments.
Securities Lending. Deutsche Bank AG, as lending agent, lends securities of the Fund to certain financial institutions under the terms of its securities lending agreement. During the term of the loans, the Fund continues to receive interest and dividends generated by the securities and to participate in any changes in their market value. The Fund requires the borrowers of the securities to maintain collateral with the Fund consisting of either cash or liquid, unencumbered assets having a value at least equal to the value of the securities loaned. When the collateral falls below specified amounts, the lending agent will use its best effort to obtain additional collateral on the next business day to meet required amounts under the securities lending agreement. During the year ended December 31, 2019, the Fund invested the cash collateral into a joint trading account in DWS Government & Agency Securities Portfolio, an affiliated money market fund managed by DWS Investment Management Americas, Inc. DWS Investment Management Americas, Inc. receives a management/administration fee (0.12% annualized effective rate as of December 31, 2019) on the cash collateral invested in DWS Government & Agency Securities Portfolio. The Fund receives compensation for lending its securities either in the form of fees or by earning interest on invested cash collateral net of borrower rebates and fees paid to a lending agent. Either the Fund or the borrower may terminate the loan at any time, and the borrower, after notice, is required to return borrowed securities within a standard time period. There may be risks of delay and costs in recovery of securities or even loss of rights in the collateral should the borrower of the securities fail financially. If the Fund is not able to recover securities lent, the Fund may sell the collateral and purchase a replacement investment in the market, incurring the risk that the value of the replacement security is greater than the value of the collateral. The Fund is also subject to all investment risks associated with the reinvestment of any cash collateral received, including, but not limited to, interest rate, credit and liquidity risk associated with such investments.
As of December 31, 2019, the Fund had securities on loan, which were classified as common stocks in the Investment Portfolio. The value of the related collateral exceeded the value of the securities loaned at period end. As of period end, the remaining contractual maturity of the collateral agreements was overnight and continuous.
Federal Income Taxes. The Fund’s policy is to comply with the requirements of the Internal Revenue Code, as amended, which are applicable to regulated investment companies and to distribute all of its taxable income to its shareholders.
The Fund has reviewed the tax positions for the open tax years as of December 31, 2019 and has determined that no provision for income tax and/or uncertain tax positions is required in the Fund’s financial statements. The Fund’s federal tax returns for the prior three fiscal years remain open subject to examination by the Internal Revenue Service.
Distribution of Income and Gains. Distributions from net investment income of the Fund, if any, are declared and distributed to shareholders annually. Net realized gains from investment transactions, in excess of available capital loss carryforwards, would be taxable to the Fund if not distributed, and, therefore, will be distributed to shareholders at least annually. The Fund may also make additional distributions for tax purposes if necessary.
The timing and characterization of certain income and capital gain distributions are determined annually in accordance with federal tax regulations which may differ from accounting principles generally accepted in the United States of America. These differences primarily relate to certain securities sold at a loss. As a result, net investment income (loss) and net realized gain (loss) on investment transactions for a reporting period may differ significantly from distributions during such period. Accordingly, the Fund may periodically make reclassifications among certain of its capital accounts without impacting the net asset value of the Fund.
| | | | | | |
| | 14 | | | | | | Deutsche DWS Variable Series II — DWS CROCI® U.S. VIP |
At December 31, 2019, the Fund’s components of distributable earnings on a tax basis were as follows:
| | | | |
| Undistributed ordinary income* | | $ | 9,621,506 | |
| Net unrealized appreciation (depreciation) on investments | | $ | 12,590,896 | |
At December 31, 2019, the aggregate cost of investments for federal income tax purposes was $147,065,593. The net unrealized appreciation for all investments based on tax cost was $12,590,896. This consisted of aggregate gross unrealized appreciation for all investments in which there was an excess of value over tax cost of $14,741,218 and aggregate gross unrealized depreciation for all investments in which was an excess of tax cost over value of $2,150,322.
In addition, the tax character of distributions paid by the Fund is summarized as follows:
| | | | | | | | |
| | | Years Ended December 31, | |
| | | 2019 | | | 2018 | |
| Distributions from ordinary income* | | $ | 4,413,315 | | | $ | 7,103,422 | |
| Distributions from long-term capital gains | | $ | 10,190,756 | | | $ | 7,292,533 | |
| * | For tax purposes, short-term capital gain distributions are considered ordinary income distributions. |
Expenses. Expenses of the Trust arising in connection with a specific fund are allocated to that fund. Other Trust expenses which cannot be directly attributed to a fund are apportioned among the funds in the Trust based upon the relative net assets or other appropriate measures.
Contingencies. In the normal course of business, the Fund may enter into contracts with service providers that contain general indemnification clauses. The Fund’s maximum exposure under these arrangements is unknown, as this would involve future claims that may be made against the Fund that have not yet been made. However, based on experience, the Fund expects the risk of loss to be remote.
Other. Investment transactions are accounted for on a trade date plus one basis for daily net asset value calculations. However, for financial reporting purposes, investment transactions are reported on trade date. Interest income is recorded on the accrual basis. Dividend income is recorded on theex-dividend date net of foreign withholding taxes. Realized gains and losses from investment transactions are recorded on an identified cost basis. Proceeds from litigation payments, if any, are included in net realized gain (loss) from investments.
B. Purchases and Sales of Securities
During the year ended December 31, 2019, purchases and sales of investment transactions (excludingshort-term investments) aggregated $159,560,395 and $165,409,844, respectively.
C. Related Parties
Management Agreement. Under the Investment Management Agreement with DWS Investment Management Americas, Inc. (“DIMA” or the “Advisor”), an indirect, wholly owned subsidiary of DWS Group GmbH & Co. KGaA (“DWS Group”), the Advisor directs the investments of the Fund in accordance with its investment objectives, policies and restrictions. The Advisor determines the securities, instruments and other contracts relating to investments to be purchased, sold or entered into by the Fund.
Under the Investment Management Agreement with the Advisor, the Fund pays a monthly management fee based on the Fund’s average daily net assets, computed and accrued daily and payable monthly, at the following annual rates:
| | | | |
| First $250 million | | | .650 | % |
| Next $750 million | | | .625 | % |
| Next $1.5 billion | | | .600 | % |
| Next $2.5 billion | | | .575 | % |
| Next $2.5 billion | | | .550 | % |
| Next $2.5 billion | | | .525 | % |
| Next $2.5 billion | | | .500 | % |
| Over $12.5 billion | | | .475 | % |
Accordingly, for the year ended December 31, 2019, the fee pursuant to the Investment Management Agreement was equivalent to an annual rate (exclusive of any applicable waivers/reimbursements) of 0.65% of the Fund’s average daily net assets.
| | | | |
Deutsche DWS Variable Series II — DWS CROCI® U.S. VIP | | | | | 15 |
For the period from January 1, 2019 through September 30, 2019, the Advisor had contractually agreed to waive all or a portion of its fee and/or reimburse certain operating expenses of the Fund to the extent necessary to maintain the total annual operating expenses (excluding certain expenses such as extraordinary expenses, taxes, brokerage and interest expense) of each class as follows:
| | | | |
| Class A | | | .70 | % |
| Class B | | | 1.02 | % |
Effective October 1, 2019 through September 30, 2020, the Advisor has contractually agreed to waive all or a portion of its fee and/or reimburse certain operating expenses of the Fund to the extent necessary to maintain the total annual operating expenses (excluding certain expenses such as extraordinary expenses, taxes, brokerage and interest expense) of each class as follows:
| | | | |
| Class A | | | .69 | % |
| Class B | | | 1.00 | % |
For the year ended December 31, 2019, fees waived and/or expenses reimbursed for each class are as follows:
| | | | |
| Class A | | $ | 202,153 | |
| Class B | | | 5,115 | |
| |
| | | $ | 207,268 | |
Administration Fee. Pursuant to an Administrative Services Agreement, DIMA provides most administrative services to the Fund. For all services provided under the Administrative Services Agreement, the Fund pays DIMA an annual fee (“Administration Fee”) of 0.10% of the Fund’s average daily net assets, computed and accrued daily and payable monthly. For the year ended December 31, 2019, the Administration Fee was $145,225, of which $13,192 is unpaid.
Service Provider Fees. DWS Service Company (“DSC”), an affiliate of the Advisor, is the transfer agent,dividend-paying agent and shareholder service agent for the Fund. Pursuant to asub-transfer agency agreement between DSC and DST Systems, Inc. (“DST”), DSC has delegated certain transfer agent,dividend-paying agent and shareholder service agent functions to DST. DSC compensates DST out of the shareholder servicing fee it receives from the Fund. For the year ended December 31, 2019, the amounts charged to the Fund by DSC were as follows:
| | | | | | | | |
| Services to Shareholders | | Total
Aggregated | | | Unpaid at
December 31, 2019 | |
| Class A | | $ | 383 | | | $ | 64 | |
| Class B | | | 225 | | | | 37 | |
| | |
| | | $ | 608 | | | $ | 101 | |
Distribution Service Agreement. Under the Fund’s Class B12b-1 plan, DWS Distributors, Inc. (“DDI”) received a fee (“Distribution Service Fee”) of 0.25% of average daily net assets of Class B shares. For the year ended December 31, 2019, the Distribution Service Fee aggregated $8,538, of which $772 is unpaid.
Typesetting and Filing Service Fees. Under an agreement with the Fund, DIMA is compensated for providing certainpre-press and regulatory filing services to the Fund. For the year ended December 31, 2019, the amount charged to the Fund by DIMA included in the Statement of Operations under “Reports to shareholders” aggregated $7,802, of which $3,290 is unpaid.
Trustees’ Fees and Expenses. The Fund paid retainer fees to each Trustee not affiliated with the Advisor, plus specified amounts to the Board Chairperson and to each committee Chairperson.
Affiliated Cash Management Vehicles. The Fund may invest uninvested cash balances in DWS Central Cash Management Government Fund and DWS ESG Liquidity Fund, affiliated money market funds which are managed by the Advisor. Each affiliated money market fund is managed in accordance withRule 2a-7 under the 1940 Act, which governs the quality, maturity, diversity and liquidity of instruments in which a money market fund may invest. DWS Central Cash Management Government Fund seeks to maintain a stable net asset value, and DWS ESG Liquidity Fund maintains a floating net asset value. The Fund indirectly bears its proportionate share of the expenses of each affiliated money market fund in which it invests. DWS Central Cash Management Government Fund does not pay the Advisor an investment management fee. To the extent that DWS ESG Liquidity Fund pays an investment management fee to the Advisor, the Advisor will waive an amount of the investment management fee payable to the Advisor by the Fund equal to the amount of the investment management fee payable on the Fund’s assets invested in DWS ESG Liquidity Fund.
Securities Lending Agent Fees. Deutsche Bank AG serves as securities lending agent for the Fund. For the year ended December 31, 2019, the Fund incurred securities lending agent fees to Deutsche Bank AG in the amount of $26.
| | | | | | |
| | 16 | | | | | | Deutsche DWS Variable Series II — DWS CROCI® U.S. VIP |
D. Ownership of the Fund
At December 31, 2019, two participating insurance companies were owners of record of 10% or more of the total outstanding Class A shares of the Fund, each owning 62% and 31%. Two participating insurance companies were owners of record of 10% or more of the total outstanding Class B shares of the Fund, each owning 62% and 15%.
E. Line of Credit
The Fund and other affiliated funds (the “Participants”) share in a $400 million revolving credit facility provided by a syndication of banks. The Fund may borrow for temporary or emergency purposes, including the meeting of redemption requests that otherwise might require the untimely disposition of securities. The Participants are charged an annual commitment fee, which is allocated based on net assets, among each of the Participants. Interest is calculated at a rate per annum equal to the sum of the Federal Funds Rate plus 1.25 percent plus if theone-month LIBOR exceeds the Federal Funds Rate, the amount of such excess. The Fund may borrow up to a maximum of 33 percent of its net assets under the agreement. The Fund had no outstanding loans at December 31, 2019.
| | | | |
Deutsche DWS Variable Series II — DWS CROCI® U.S. VIP | | | | | 17 |
Report of Independent Registered Public Accounting Firm
To the Board of Trustees of Deutsche DWS Variable Series II and Shareholders of DWS CROCI U.S. VIP:
Opinion on the Financial Statements
We have audited the accompanying statement of assets and liabilities of DWS CROCI U.S. VIP (the “Fund”) (one of the funds constituting Deutsche DWS Variable Series II) (the “Trust”), including the investment portfolio, as of December 31, 2019, and the related statement of operations for the year then ended, the statements of changes in net assets for each of the two years in the period then ended, the financial highlights for each of the five years in the period then ended and the related notes (collectively referred to as the “financial statements”). In our opinion, the financial statements present fairly, in all material respects, the financial position of the Fund (one of the funds constituting Deutsche DWS Variable Series II) at December 31, 2019, the results of its operations for the year then ended, the changes in its net assets for each of the two years in the period then ended and its financial highlights for each of the five years in the period then ended, in conformity with U.S. generally accepted accounting principles.
Basis for Opinion
These financial statements are the responsibility of the Trust’s management. Our responsibility is to express an opinion on the Fund’s financial statements based on our audit. We are a public accounting firm registered with the Public Company Accounting Oversight Board (United States) (“PCAOB”) and are required to be independent with respect to the Trust in accordance with the U.S. federal securities laws and the applicable rules and regulations of the Securities and Exchange Commission and the PCAOB.
We conducted our audit in accordance with the standards of the PCAOB. Those standards require that we plan and perform the audit to obtain reasonable assurance about whether the financial statements are free of material misstatement, whether due to error or fraud. The Trust is not required to have, nor were we engaged to perform, an audit of the Trust’s internal control over financial reporting. As part of our audit, we are required to obtain an understanding of internal control over financial reporting, but not for the purpose of expressing an opinion on the effectiveness of the Trust’s internal control over financial reporting. Accordingly, we express no such opinion.
Our audit included performing procedures to assess the risks of material misstatement of the financial statements, whether due to error or fraud, and performing procedures that respond to those risks. Such procedures included examining, on a test basis, evidence regarding the amounts and disclosures in the financial statements. Our procedures included confirmation of securities owned as of December 31, 2019, by correspondence with the custodian and others. Our audit also included evaluating the accounting principles used and significant estimates made by management, as well as evaluating the overall presentation of the financial statements. We believe that our audit provides a reasonable basis for our opinion.

We have served as the auditor of one or more investment companies in the DWS family of funds since at least 1979, but we are unable to determine the specific year.
Boston, Massachusetts
February 14, 2020
| | | | | | |
| | 18 | | | | | | Deutsche DWS Variable Series II — DWS CROCI® U.S. VIP |
| | |
| Information About Your Fund’s Expenses | | (Unaudited) |
As an investor of the Fund, you incur two types of costs: ongoing expenses and transaction costs. Ongoing expenses include management fees, distribution and service(12b-1) fees and other Fund expenses. Examples of transaction costs include contract charges, which are not shown in this section. The following tables are intended to help you understand your ongoing expenses (in dollars) of investing in the Fund and to help you compare these expenses with the ongoing expenses of investing in other mutual funds. In the most recentsix-month period, the Fund limited these expenses; had it not done so, expenses would have been higher. The example in the table is based on an investment of $1,000 invested at the beginning of thesix-month period and held for the entire period (July 1, 2019 to December 31, 2019).
The tables illustrate your Fund’s expenses in two ways:
| – | Actual Fund Return. This helps you estimate the actual dollar amount of ongoing expenses (but not transaction costs) paid on a $1,000 investment in the Fund using the Fund’s actual return during the period. To estimate the expenses you paid over the period, simply divide your account value by $1,000 (for example, an $8,600 account value divided by $1,000 = 8.6), then multiply the result by the number in the “Expenses Paid per $1,000” line under the share class you hold. |
| – | Hypothetical 5% Fund Return. This helps you to compare your Fund’s ongoing expenses (but not transaction costs) with those of other mutual funds using the Fund’s actual expense ratio and a hypothetical rate of return of 5% per year before expenses. Examples using a 5% hypothetical Fund return may be found in the shareholder reports of other mutual funds. The hypothetical account values and expenses may not be used to estimate the actual ending account balance or expenses you paid for the period. |
Please note that the expenses shown in these tables are meant to highlight your ongoing expenses only and do not reflect any transaction costs. The “Expenses Paid per $1,000” line of the tables is useful in comparing ongoing expenses only and will not help you determine the relative total expense of owning different funds. If these transaction costs had been included, your costs would have been higher.
| | | | | | | | |
| Expenses and Value of a $1,000 Investment for the six months ended December 31, 2019 | |
| | |
| Actual Fund Return | | | Class A | | | | Class B | |
| Beginning Account Value 7/1/19 | | $ | 1,000.00 | | | $ | 1,000.00 | |
| Ending Account Value 12/31/19 | | $ | 1,122.60 | | | $ | 1,120.60 | |
| Expenses Paid per $1,000* | | $ | 3.69 | | | $ | 5.40 | |
| | |
| Hypothetical 5% Fund Return | | | Class A | | | | Class B | |
| Beginning Account Value 7/1/19 | | $ | 1,000.00 | | | $ | 1,000.00 | |
| Ending Account Value 12/31/19 | | $ | 1,021.73 | | | $ | 1,020.11 | |
| Expenses Paid per $1,000* | | $ | 3.52 | | | $ | 5.14 | |
| * | Expenses are equal to the Fund’s annualized expense ratio for each share class, multiplied by the average account value over the period, multiplied by 184 (the number of days in the most recentsix-month period), then divided by 365. |
| | | | | | | | |
| Annualized Expense Ratios | | Class A | | | Class B | |
| Deutsche DWS Variable Series II — DWS CROCI®U.S. VIP | | | .69 | % | | | 1.01 | % |
For more information, please refer to the Fund’s prospectus.
These tables do not reflect charges and fees (“contract charges”) associated with the separate account that invests in the Fund or any variable life insurance policy or variable annuity contract for which the Fund is an investment option.
For an analysis of the fees associated with an investment in the Fund or similar funds, please refer to the current and hypothetical expense calculators for Variable Insurance Products which can be found at dws.com/calculators.
| | | | |
Deutsche DWS Variable Series II — DWS CROCI® U.S. VIP | | | | | 19 |
| | |
| Tax Information | | (Unaudited) |
The Fund paid distributions of $1.10 per share from net long-term capital gains during its year ended December 31, 2019.
For corporate shareholders, 76% of the ordinary dividends (i.e., income dividends plus short-term capital gains) paid during the Fund’s fiscal year ended December 31, 2019, qualified for the dividends received deduction.
Please consult a tax advisor if you have questions about federal or state income tax laws, or on how to prepare your tax returns. If you have specific questions about your account, please contact your insurance provider.
Proxy Voting
The Trust’s policies and procedures for voting proxies for portfolio securities and information about how the Trust voted proxies related to its portfolio securities during the most recent12-month period ended June 30 are available on our Web site — dws.com/en-us/resources/proxy-voting — or on the SEC’s Web site — sec.gov. To obtain a written copy of the Trust’s policies and procedures without charge, upon request, call us toll free at (800)728-3337.
| | | | | | |
| | 20 | | | | | | Deutsche DWS Variable Series II — DWS CROCI® U.S. VIP |
Advisory Agreement Board Considerations and Fee Evaluation
The Board of Trustees (hereinafter referred to as the “Board” or “Trustees”) approved the renewal of DWS CROCI® U.S. VIP’s (the “Fund”) investment management agreement (the “Agreement”) with DWS Investment Management Americas, Inc. (“DIMA”) in September 2019.
In terms of the process that the Board followed prior to approving the Agreement, shareholders should know that:
| – | | During the entire process, all of the Fund’s Trustees were independent of DIMA and its affiliates (the “Independent Trustees”). |
| – | | The Board met frequently during the past year to discuss fund matters and dedicated a substantial amount of time to contract review matters. Over the course of several months, the Board’s Contract Committee reviewed extensive materials received from DIMA, independent third parties and independent counsel. These materials included an analysis of the Fund’s performance, fees and expenses, and profitability from a fee consultant retained by the Fund’s Independent Trustees (the “Fee Consultant”). Based on its evaluation of the information provided, the Contract Committee presented its findings and recommendations to the Board. The Board then reviewed the Contract Committee’s findings and recommendations. |
| – | | The Board also received extensive information throughout the year regarding performance of the Fund. |
| – | | The Independent Trustees regularly met privately with counsel to discuss contract review and other matters. In addition, the Independent Trustees were advised by the Fee Consultant in the course of their review of the Fund’s contractual arrangements and considered a comprehensive report prepared by the Fee Consultant in connection with their deliberations. |
| – | | In connection with reviewing the Agreement, the Board also reviewed the terms of the Fund’s Rule12b-1 plan, distribution agreement, administrative services agreement, transfer agency agreement and other material service agreements. |
In connection with the contract review process, the Contract Committee and the Board considered the factors discussed below, among others. The Board also considered that DIMA and its predecessors have managed the Fund since its inception, and the Board believes that a long-term relationship with a capable, conscientious advisor is in the best interests of the Fund. The Board considered, generally, that shareholders chose to invest or remain invested in the Fund knowing that DIMA managed the Fund. DIMA is part of DWS Group GmbH & Co. KGaA (“DWS Group”). DWS Group is a global asset management business that offers a wide range of investing expertise and resources, including research capabilities in many countries throughout the world. In 2018, approximately 20% of DWS Group’s shares were sold in an initial public offering, with Deutsche Bank AG owning the remaining shares.
As part of the contract review process, the Board carefully considered the fees and expenses of each DWS fund overseen by the Board in light of the fund’s performance. In many cases, this led to the negotiation and implementation of expense caps. As part of these negotiations, the Board indicated that it would consider relaxing these caps in future years following sustained improvements in performance, among other considerations.
While shareholders may focus primarily on fund performance and fees, the Fund’s Board considers these and many other factors, including the quality and integrity of DIMA’s personnel and administrative support services provided by DIMA, such as back-office operations, fund valuations, and compliance policies and procedures.
Nature, Quality and Extent of Services. The Board considered the terms of the Agreement, including the scope of advisory services provided under the Agreement. The Board noted that, under the Agreement, DIMA provides portfolio management services to the Fund and that, pursuant to a separate administrative services agreement, DIMA provides administrative services to the Fund. The Board considered the experience and skills of senior management and investment personnel and the resources made available to such personnel. The Board reviewed the Fund’s performance over short-term and long-term periods and compared those returns to various agreed-upon performance measures, including market index(es) and a peer universe compiled using information supplied by Morningstar Direct (“Morningstar”), an independent fund data service. The Board also noted that it has put into place a process of identifying “Funds in Review” (e.g., funds performing poorly relative to a peer universe), and receives additional reporting from DIMA regarding such funds and, where appropriate, DIMA’s plans to address underperformance. The Board
| | | | |
Deutsche DWS Variable Series II — DWS CROCI® U.S. VIP | | | | | 21 |
believes this process is an effective manner of identifying and addressing underperforming funds. Based on the information provided, the Board noted that, for theone-, three- and five-year periods ended December 31, 2018, the Fund’s performance (Class A shares) was in the 3rd quartile, 4th quartile and 4th quartile, respectively, of the applicable Morningstar universe (the 1st quartile being the best performers and the 4th quartile being the worst performers). The Board also observed that the Fund has underperformed its benchmark in theone-, three- and five-year periods ended December 31, 2018. The Board noted the disappointing investment performance of the Fund in recent periods and continued to discuss with senior management of DIMA the factors contributing to such underperformance and actions being taken to improve performance. The Board considered that, effective October 3, 2016, the Fund changed its investment strategy and portfolio management team, and noted that the Fund further changed its investment strategy, effective May 1, 2017. The Board recognized the efforts by DIMA in recent years to enhance its investment platform and improve long-term performance across the DWS fund complex.
Fees and Expenses. The Board considered the Fund’s investment management fee schedule, operating expenses and total expense ratios, and comparative information provided by Broadridge Financial Solutions, Inc. (“Broadridge”) and the Fee Consultant regarding investment management fee rates paid to other investment advisors by similar funds (1st quartile being the most favorable and 4th quartile being the least favorable). With respect to management fees paid to other investment advisors by similar funds, the Board noted that the contractual fee rates paid by the Fund, which include a 0.10% fee paid to DIMA under the Fund’s administrative services agreement, were higher than the median (3rd quartile) of the applicable Broadridge peer group (based on Broadridge data provided as of December 31, 2018). The Board noted that the Fund’s Class A shares total (net) operating expenses were expected to be lower than the median (2nd quartile) of the applicable Broadridge expense universe (based on Broadridge data provided as of December 31, 2018, and analyzing Broadridge expense universe Class A (net) expenses less any applicable12b-1 fees) (“Broadridge Universe Expenses”). The Board also reviewed data comparing each other operational share class’s total (net) operating expenses to the applicable Broadridge Universe Expenses. The Board noted that the expense limitations agreed to by DIMA were expected to help the Fund’s total (net) operating expenses remain competitive. The Board considered the Fund’s management fee rate as compared to fees charged by DIMA to comparable DWS U.S. registered funds (“DWS Funds”) and considered differences between the Fund and the comparable DWS Funds. The information requested by the Board as part of its review of fees and expenses also included information about institutional accounts (including anysub-advised funds and accounts) and funds offered primarily to European investors (“DWS Europe Funds”) managed by DWS Group. The Board noted that DIMA indicated that DWS Group does not manage any institutional accounts or DWS Europe Funds comparable to the Fund.
On the basis of the information provided, the Board concluded that management fees were reasonable and appropriate in light of the nature, quality and extent of services provided by DIMA.
Profitability. The Board reviewed detailed information regarding revenues received by DIMA under the Agreement. The Board considered the estimated costs to DIMA, andpre-tax profits realized by DIMA, from advising the DWS Funds, as well as estimates of thepre-tax profits attributable to managing the Fund in particular. The Board also received information regarding the estimated enterprise-wide profitability of DIMA and its affiliates with respect to all fund services in totality and by fund. The Board and the Fee Consultant reviewed DIMA’s methodology in allocating its costs to the management of the Fund. Based on the information provided, the Board concluded that thepre-tax profits realized by DIMA in connection with the management of the Fund were not unreasonable. The Board also reviewed certain publicly available information regarding the profitability of certain similar investment management firms. The Board noted that, while information regarding the profitability of such firms is limited (and in some cases is not necessarily prepared on a comparable basis), DIMA and its affiliates’ overall profitability with respect to the DWS Funds (after taking into account distribution and other services provided to the funds by DIMA and its affiliates) was lower than the overall profitability levels of most comparable firms for which such data was available.
Economies of Scale. The Board considered whether there are economies of scale with respect to the management of the Fund and whether the Fund benefits from any economies of scale. The Board noted that the Fund’s investment management fee schedule includes fee breakpoints. The Board concluded that the Fund’s fee schedule represents an appropriate sharing between the Fund and DIMA of such economies of scale as may exist in the management of the Fund at current asset levels.
Other Benefits to DIMA and Its Affiliates. The Board also considered the character and amount of other incidental or“fall-out” benefits received by DIMA and its affiliates, including any fees received by DIMA for administrative services provided to the Fund, any fees received by an affiliate of DIMA for transfer agency
| | | | | | |
| | 22 | | | | | | Deutsche DWS Variable Series II — DWS CROCI® U.S. VIP |
services provided to the Fund and any fees received by an affiliate of DIMA for distribution services. The Board noted that DIMA pays a licensing fee to an affiliate related to the Fund’s use of the CROCI® strategy. The Board also considered benefits to DIMA related to brokerage and soft-dollar allocations, including allocating brokerage to pay for research generated by parties other than the executing broker dealers, which pertain primarily to funds investing in equity securities. In addition, the Board considered the incidental public relations benefits to DIMA related to DWS Funds advertising and cross-selling opportunities among DIMA products and services. The Board considered these benefits in reaching its conclusion that the Fund’s management fees were reasonable.
Compliance. The Board considered the significant attention and resources dedicated by DIMA to its compliance processes in recent years. The Board noted in particular (i) the experience, seniority and time commitment of the individuals serving as DIMA’s and the Fund’s chief compliance officers and (ii) the substantial commitment of resources by DIMA and its affiliates to compliance matters, including the retention of compliance personnel.
Based on all of the information considered and the conclusions reached, the Board determined that the continuation of the Agreement is in the best interests of the Fund. In making this determination, the Board did not give particular weight to any single factor identified above. The Board considered these factors over the course of numerous meetings, certain of which were in executive session with only the Independent Trustees and counsel present. It is possible that individual Independent Trustees may have weighed these factors differently in reaching their individual decisions to approve the continuation of the Agreement.
| | | | |
Deutsche DWS Variable Series II — DWS CROCI® U.S. VIP | | | | | 23 |
Board Members and Officers
The following table presents certain information regarding the Board Members and Officers of the Trust/Corporation. Each Board Member’s year of birth is set forth in parentheses after his or her name. Unless otherwise noted, (i) each Board Member has engaged in the principal occupation(s) noted in the table for at least the most recent five years, although not necessarily in the same capacity; and (ii) the address of each Independent Board Member is Keith R. Fox, DWS Funds Board Chair, c/o Thomas R. Hiller, Ropes & Gray LLP, Prudential Tower, 800 Boylston Street, Boston, MA02199-3600. Except as otherwise noted below, the term of office for each Board Member is until the election and qualification of a successor, or until such Board Member sooner dies, resigns, is removed or as otherwise provided in the governing documents of the Trust/Corporation. Because the Fund does not hold an annual meeting of shareholders, each Board Member will hold office for an indeterminate period.
The Board Members may also serve in similar capacities with other funds in the fund complex. The number of funds in DWS fund complex shown in the table below includes all registered open- and closed-end funds (including all of their portfolios) advised by the Advisor and any registered funds that have an investment advisor that is an affiliated person of the Advisor.
| | | | | | | | |
| Independent Board Members | | | | | |
Name, Year of Birth,
Position with the Trust/
Corporation and
Length of Time Served1 | | Business Experience and Directorships During the Past Five Years | | Number of
Funds in
DWS Fund
Complex
Overseen | | | Other
Directorships
Held by Board
Member
|
Keith R. Fox, CFA (1954) Chairperson since 2017, and Board Member since 1996 | | Managing General Partner, Exeter Capital Partners (a series of private investment funds) (since 1986). Directorships: ICI Mutual Insurance Company; Progressive International Corporation (kitchen goods importer and distributor); former Chairman, National Association of Small Business Investment Companies; former Directorships: The Kennel Shop (retailer); BoxTop Media Inc. (advertising); Sun Capital Advisers Trust (mutual funds) (2011–2012) | | | 77 | | | — |
John W. Ballantine (1946) Board Member since 1999 | | Retired; formerly, Executive Vice President and Chief Risk Management Officer, First Chicago NBD Corporation/The First National Bank of Chicago (1996–1998); Executive Vice President and Head of International Banking (1995–1996); former Directorships: Director and Chairman of the Board, Healthways, Inc.2 (population well-being and wellness services) (2003–2014); Stockwell Capital Investments PLC (private equity); Enron Corporation; FNB Corporation; Tokheim Corporation; First Oak Brook Bancshares, Inc.; Oak Brook Bank; and Prisma Energy International. Not-for-Profit Director/Trustee: Palm Beach Civic Association; Window to the World Communications (public media); Life Director of Harris Theater for Music and Dance (Chicago); Life Director of Hubbard Street Dance Chicago; former Not-for-Profit Directorships: Public Radio International | | | 77 | | | Portland
General
Electric2
(utility
company)
(2003–
present) |
Dawn-Marie Driscoll (1946) Board Member since 1987 | | Emeritus Executive Fellow, Center for Business Ethics, Bentley University; formerly: Partner, Palmer & Dodge (law firm) (1988–1990); Vice President of Corporate Affairs and General Counsel, Filene’s (retail) (1978–1988). Directorships: Advisory Board, Center for Business Ethics, Bentley University; Trustee and former Chairman of the Board, Southwest Florida Community Foundation (charitable organization); former Directorships: ICI Mutual Insurance Company (2007–2015); Sun Capital Advisers Trust (mutual funds) (2007–2012), Investment Company Institute (audit, executive, nominating committees) and Independent Directors Council (governance, executive committees) | | | 77 | | | — |
Richard J. Herring (1946) Board Member since 1990 | | Jacob Safra Professor of International Banking and Professor of Finance, The Wharton School, University of Pennsylvania (since July 1972); Director, The Wharton Financial Institutions Center (since 1994); formerly: Vice Dean and Director, Wharton Undergraduate Division (1995–2000) and Director, The Lauder Institute of International Management Studies (2000–2006); Member FDIC Systemic Risk Advisory Committee since 2011, member Systemic Risk Council since 2012 and member of the Advisory Board at the Yale Program on Financial Stability since 2013; Formerly Co-Chair of the Shadow Financial Regulatory Committee (2003–2015), Executive Director of The Financial Economists Roundtable (2008–2015), Director of The Thai Capital Fund (2007–2013), Director of The Aberdeen Singapore Fund (2007–2018), and Nonexecutive Director of Barclays Bank DE (2010–2018) | | | 77 | | | Director,
Aberdeen
Japan Fund
(since 2007) |
| | | | | | |
| | 24 | | | | | | Deutsche DWS Variable Series II — DWS CROCI® U.S. VIP |
| | | | | | | | |
Name, Year of Birth,
Position with the Trust/
Corporation and
Length of Time Served1 | | Business Experience and Directorships During the Past Five Years | | Number of
Funds in
DWS Fund
Complex
Overseen | | | Other
Directorships
Held by Board
Member
|
William McClayton (1944) Board Member since 2004 | | Private equity investor (since October 2009); previously, Managing Director, Diamond Management & Technology Consultants, Inc. (global consulting firm) (2001–2009); Directorship: Board of Managers, YMCA of Metropolitan Chicago; formerly: Senior Partner, Arthur Andersen LLP (accounting) (1966–2001); Trustee, Ravinia Festival | | | 77 | | | — |
Rebecca W. Rimel (1951) Board Member since 1995 | | President, Chief Executive Officer and Director, The Pew Charitable Trusts (charitable organization) (1994–present); formerly: Executive Vice President, The Glenmede Trust Company (investment trust and wealth management) (1983–2004); Board Member, Investor Education (charitable organization) (2004–2005); Trustee, Executive Committee, Philadelphia Chamber of Commerce (2001–2007); Director, Viasys Health Care2 (January 2007–June 2007); Trustee, Thomas Jefferson Foundation (charitable organization) (1994–2012) | | | 77 | | | Director,
Becton
Dickinson
and
Company2
(medical
technology
company)
(2012–
present);
Director,
BioTelemetry
Inc.2(health
care) (2009–
present) |
William N. Searcy, Jr. (1946) Board Member since 1993 | | Private investor since October 2003; formerly: Pension & Savings Trust Officer, Sprint Corporation2(telecommunications) (November 1989–September 2003); Trustee, Sun Capital Advisers Trust (mutual funds) (1998–2012) | | | 77 | | | — |
| | |
| Officers4 | | |
Name, Year of Birth,
Position with the Trust/
Corporation and
Length of Time Served5 | | Business Experience and Directorships During the Past Five Years |
Hepsen Uzcan6(1974) President and Chief Executive Officer, 2017–present | | Managing Director,3 DWS; Secretary, DWS USA Corporation (2018–present); Assistant Secretary, DWS Distributors, Inc. (2018–present); Director and Vice President, DWS Service Company (2018–present); Assistant Secretary, DWS Investment Management Americas, Inc. (2018–present); and Director and President, DB Investment Managers, Inc. (2018–present); formerly: Vice President for the Deutsche funds (2016–2017); Assistant Secretary for the DWS funds (2013–2019) |
John Millette7(1962) Vice President and Secretary, 1999–present | | Director,3DWS; Chief Legal Officer, DWS Investment Management Americas, Inc. (2015–present); Director and Vice President, DWS Trust Company (2016–present); and Assistant Secretary, DBX ETF Trust (2019–present); formerly: Secretary, Deutsche Investment Management Americas Inc. (2015–2017) |
Diane Kenneally7(1966) Chief Financial Officer and Treasurer, 2018–present | | Director,3 DWS; and Treasurer, Chief Financial Officer and Controller, DBX ETF Trust (2019–present); formerly: Assistant Treasurer for the DWS funds (2007–2018) |
Paul Antosca7(1957) Assistant Treasurer, 2007–present | | Director,3DWS; and Assistant Treasurer, DBX ETF Trust (2019–present) |
Sheila Cadogan7(1966) Assistant Treasurer, 2017–present | | Director,3DWS; Director and Vice President, DWS Trust Company (2018–present); and Assistant Treasurer, DBX ETF Trust (2019–present) |
Scott D. Hogan7(1970) Chief Compliance Officer, 2016–present | | Director,3DWS |
Caroline Pearson7(1962) Chief Legal Officer, 2010–present | | Managing Director,3DWS; formerly: Secretary, Deutsche AM Distributors, Inc. (2002–2017); and Secretary, Deutsche AM Service Company (2010–2017) |
Wayne Salit6(1967) Anti-Money Laundering Compliance Officer, 2014–present | | Director,3 Deutsche Bank; and AML Officer, DWS Trust Company; formerly: Managing Director, AML Compliance Officer at BNY Mellon (2011–2014); and Director, AML Compliance Officer at Deutsche Bank (2004–2011) |
Ciara Crawford8 (1984) Assistant Secretary, (2019–present) | | Associate, DWS (since 2015); previously, Legal Assistant at Accelerated Tax Solutions. |
| | | | |
Deutsche DWS Variable Series II — DWS CROCI® U.S. VIP | | | | | 25 |
| 1 | The length of time served represents the year in which the Board Member joined the board of one or more DWS funds currently overseen by the Board. |
| 2 | A publicly held company with securities registered pursuant to Section 12 of the Securities Exchange Act of 1934. |
| 3 | Executive title, not a board directorship. |
| 4 | As a result of their respective positions held with the Advisor or its affiliates, these individuals are considered “interested persons” of the Advisor within the meaning of the 1940 Act. Interested persons receive no compensation from the Fund. |
| 5 | The length of time served represents the year in which the officer was first elected in such capacity for one or more DWS funds. |
| 6 | Address: 875 Third Avenue, New York, NY 10022. |
| 7 | Address: One International Place, Boston, MA 02110. |
| 8 | Address: 5022 Gate Parkway, Suite 400, Jacksonville, FL 32256. |
The Fund’s Statement of Additional Information (“SAI”) includes additional information about the Board Members. The SAI is available, without charge, upon request. If you would like to request a copy of the SAI, you may do so by calling the followingtoll-free number:(800) 728-3337.
| | | | | | |
| | 26 | | | | | | Deutsche DWS Variable Series II — DWS CROCI® U.S. VIP |
Notes
| | |
| | |
VS2CUS-2 (R-025833-9 2/20) | | |
December 31, 2019
Annual Report
Deutsche DWS Variable Series II
DWS Government & Agency Securities VIP
Beginning on January 1, 2021, as permitted by regulations adopted by the Securities and Exchange Commission, you may not be receiving paper copies of the Fund’s shareholder reports from the insurance company that offers your contract unless you specifically request paper copies from your insurance company or from your financial intermediary. Instead, the shareholder reports will be made available on a Web site, and your insurance company will notify you by mail each time a report is posted and provide you with a Web site link to access the report. Instructions for requesting paper copies will be provided by your insurance company.
If you already elected to receive shareholder reports electronically, you will not be affected by this change and you need not take any action. You may elect to receive shareholder reports and other communications from your insurance company electronically by following the instructions provided by your insurance company.
You may elect to receive all future reports in paper free of charge from your insurance company. If your insurance company informs you that future reports will be delivered via Web access, you can inform your insurance company that you wish to continue receiving paper copies of your shareholder reports by following the instructions provided by your insurance company.

Contents
This report must be preceded or accompanied by a prospectus. To obtain an additional prospectus or summary prospectus, if available, call (800) 728-3337 or your financial representative. We advise you to consider the Fund’s objectives, risks, charges and expenses carefully before investing. The summary prospectus and prospectus contain this and other important information about the Fund. Please read the prospectus carefully before you invest.
Investing in derivatives entails special risks relating to liquidity, leverage and credit that may reduce returns and/or increase volatility. Bond investments are subject to interest-rate, credit, liquidity and market risks to varying degrees. When interest rates rise, bond prices generally fall. Credit risk refers to the ability of an issuer to make timely payments of principal and interest. The “full faith and credit” guarantee of the US government applies to the timely repayment of interest, and does not eliminate market risk. Because of the rising US government debt burden, it is possible that the US government may not be able to meet its financial obligations or that securities issued by the US government may experience credit downgrades. The Fund may lend securities to approved institutions. See the prospectus for details.
The brand DWS represents DWS Group GmbH & Co. KGaA and any of its subsidiaries such as DWS Distributors, Inc. which offers investment products or DWS Investment Management Americas, Inc. and RREEF America L.L.C. which offer advisory services.
DWS Distributors, Inc., 222 South Riverside Plaza, Chicago, IL 60606, (800) 621-1148
NOT FDIC/NCUA INSURED NO BANK GUARANTEE MAY LOSE VALUE NOT A DEPOSIT NOT INSURED BY ANY FEDERAL GOVERNMENT AGENCY
| | | | | | |
| | 2 | | | | | | Deutsche DWS Variable Series II — DWS Government & Agency Securities VIP |
| | |
| Performance Summary | | December 31, 2019 (Unaudited) |
Fund performance shown is historical, assumes reinvestment of all dividend and capital gain distributions and does not guarantee future results. Investment return and principal value fluctuate with changing market conditions so that, when redeemed, shares may be worth more or less than their original cost. Current performance may be lower or higher than the performance data quoted. Please contact your participating insurance company for the Fund’s most recent month-end performance. Performance does not reflect charges and fees (“contract charges”) associated with the separate account that invests in the Fund or any variable life insurance policy or variable annuity contract for which the Fund is an investment option. These charges and fees will reduce returns. While all share classes have the same underlying portfolio, their performance will differ.
The gross expense ratios of the Fund, as stated in the fee table of the prospectus dated May 1, 2019 are 0.93% and 1.28% for Class A and Class B shares, respectively, and may differ from the expense ratios disclosed in the Financial Highlights tables in this report.
Generally accepted accounting principles require adjustments to be made to the net assets of the Fund at period end for financial reporting purposes only, and as such, the total return based on the unadjusted net asset value per share may differ from the total return reported in the financial highlights.
Growth of an Assumed $10,000 Investment
| | |
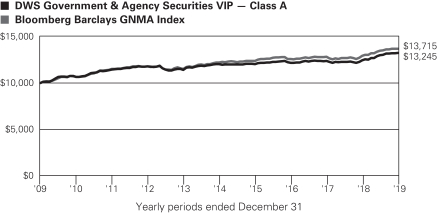
| | The Bloomberg Barclays GNMA Index is an unmanaged, market-value-weighted measure of all fixed-rate securities backed by mortgage pools of the Government National Mortgage Association. Index returns do not reflect any fees or expenses and it is not possible to invest directly into an index. |
| | | | | | | | | | |
| Comparative Results | | | | | | | | | | |
| | | | |
| DWS Government & Agency Securities VIP | | 1-Year | | 3-Year | | 5-Year | | 10-Year |
| Class A | | Growth of $10,000 | | $10,643 | | $10,880 | | $11,002 | | $13,245 |
| | | Average annual total return | | 6.43% | | 2.85% | | 1.93% | | 2.85% |
| Bloomberg Barclays GNMA Index | | Growth of $10,000 | | $10,585 | | $10,892 | | $11,216 | | $13,715 |
| | Average annual total return | | 5.85% | | 2.89% | | 2.32% | | 3.21% |
| | | | |
| DWS Government & Agency Securities VIP | | 1-Year | | 3-Year | | 5-Year | | 10-Year |
| Class B | | Growth of $10,000 | | $10,605 | | $10,764 | | $10,809 | | $12,805 |
| | | Average annual total return | | 6.05% | | 2.49% | | 1.57% | | 2.50% |
| Bloomberg Barclays GNMA Index | | Growth of $10,000 | | $10,585 | | $10,892 | | $11,216 | | $13,715 |
| | Average annual total return | | 5.85% | | 2.89% | | 2.32% | | 3.21% |
The growth of $10,000 is cumulative.
| | | | |
Deutsche DWS Variable Series II — DWS Government & Agency Securities VIP | | | | | 3 |
| | |
| Management Summary | | December 31, 2019 (Unaudited) |
During the12-month period ended December 31, 2019, the portfolio provided a total return of 6.43% (Class A shares, unadjusted for contract charges) compared with the 5.85% return of its benchmark, the Bloomberg Barclays GNMA Index.
The fixed income markets broadly produced exceptionally strong returns in 2019. A backdrop of moderate economic growth and low inflation led the U.S. Federal Reserve (the Fed) to lower its benchmark lending rate by a quarter point on three occasions between the end of July and the end of October. Other major central banks globally also moved to ease monetary policy. U.S. Treasuries performed well in this environment, as yields fell (and prices rose) for bonds of all maturities. For the 12 months ended December 31, 2019, the yield on the10-year note fell from 2.69% to 1.92% while thetwo-year yield fell from 2.48% to 1.58%, resulting in a steepening of the curve. Treasury yields bottomed out around late August, when the market began to factor in improving economic data and the reduced outlook for further Fed rate cuts. Investment-grade corporate bonds led performance within the U.S. bond market for the year, benefiting from the decline in Treasury yields and continued corporate profit growth, followed closely by lower-rated, high yield corporates. Securitized assets including mortgage backed securities, asset backed securities, and commercial mortgage backed securities were also comfortably in positive territory, while lagging securities more sensitive to credit and interest rate conditions.
Performance for some sectors of the GNMA universe was challenged in 2019 as Treasury yields moved notably lower. Discount coupons and specified pools led performance within GNMAs as longer duration assets with greater interest rate sensitivity were favored in a declining rate environment. The portfolio maintained an underweight to GNMAs in favor of conventional mortgage-backed securities (MBS) across liquid coupons, while overweighting specified pools within GNMAs due to favorable prepayment behavior. As interest rates rallied in the first half of 2019, we reduced exposure to high coupon pass-throughs and increased duration via U.S. Treasury exposure. The portfolio’s overweight stance with respect to duration was shifted to neutral late in the year while initiating a steepening bias with respect to the yield curve. For the period, GNMA security selection, in particular a bias toward seasoned collateral, added to relative performance, as didoff-benchmark exposures to other securitized categories including commercial mortgage-backed securities and asset-backed securities. The portfolio’s overweight stance with respect to duration for much of the period also benefited performance. The portfolio continues to utilize derivatives for both hedging and active management of duration and yield curve positioning.
The Fund is scheduled to liquidate on or about February 27, 2020.
Gregory M. Staples, CFA, Managing Director
Scott Agi, CFA, Director
Portfolio Managers
The views expressed reflect those of the portfolio management team only through the end of the period of the report as stated on the cover. The management team’s views are subject to change at any time based on market and other conditions and should not be construed as a recommendation. Past performance is no guarantee of future results. Current and future portfolio holdings are subject to risk.
| | | | | | |
| | 4 | | | | | | Deutsche DWS Variable Series II — DWS Government & Agency Securities VIP |
Terms to Know
Theyield curve is a graphical representation of how yields on bonds of different maturities compare. Normally, yield curves slant up, as bonds with longer maturities typically offer higher yields than short-term bonds.
Credit spread is the additional yield provided by bonds rated AA and below vs. comparable maturity bonds rated AAA.
Mortgage-backed securities are securities made up of a bundle of home loans bought from the banks that issued them. Investors receive periodic payments similar to coupon payments on bonds.Commercial mortgage-backed securities are secured by loans on commercial properties.Asset-backed securities are secured by loans, credit or receivables, exclusive of mortgage debt.
TheBloomberg Barclays GNMA Index tracks the performance of fixed-rate securities backed by mortgage pools of the Government National Mortgage Association (GNMA). Index returns, unlike fund returns, do not reflect any fees or expenses. It is not possible to invest directly into an index.
Duration is a gauge of price sensitivity to changes in interest rates.
Overweight means the fund holds a higher weighting in a given sector or security than the benchmark.Underweight means the fund holds a lower weighting.
Contributors and detractors incorporate both a holding’s return and its weight. If two holdings have the same return but one has a larger weighting in the fund, it will have a larger contribution to return in the period.
| | | | |
Deutsche DWS Variable Series II — DWS Government & Agency Securities VIP | | | | | 5 |
| | |
| Portfolio Summary | | (Unaudited) |
| | | | | | | | |
| Asset Allocation (As a % of Net Assets) | | 12/31/19 | | | 12/31/18 | |
| Mortgage-Backed Securities Pass-Throughs | | | 74% | | | | 82% | |
| Collateralized Mortgage Obligations | | | 14% | | | | 10% | |
| Commercial Mortgage-Backed Securities | | | 6% | | | | 4% | |
| Asset-Backed | | | 6% | | | | 3% | |
| Government & Agency Obligations | | | 4% | | | | 4% | |
| Cash Equivalents and Other Assets and Liabilities, net | | | –4% | | | | –3% | |
| | | | 100% | | | | 100% | |
| | |
| Coupons* | | 12/31/19 | | | 12/31/18 | |
| Less than 3.5% | | | 46% | | | | 25% | |
| 3.5%–4.49% | | | 41% | | | | 52% | |
| 4.5%–5.49% | | | 8% | | | | 17% | |
| 5.5%–6.49% | | | 3% | | | | 3% | |
| 6.5%–7.49% | | | 2% | | | | 3% | |
| 7.5% and Greater | | | 0% | | | | 0% | |
| | | | 100% | | | | 100% | |
| | |
| Interest Rate Sensitivity | | 12/31/19 | | | 12/31/18 | |
| Effective Maturity | | | 5.3 years | | | | 8.1 years | |
| Effective Duration | | | 3.4 years | | | | 4.7 years | |
| * | Excludes Cash Equivalents and U.S. Treasury Bills. |
Effective maturity is the weighted average of the maturity date of bonds held by the Fund taking into consideration any available maturity shortening features.
Effective duration is an approximate measure of the Fund’s sensitivity to interest rate changes taking into consideration any maturity shortening features.
Portfolio holdings and characteristics are subject to change.
For more complete details about the Fund’s investment portfolio, see page 7.
Following the Fund’s fiscal first and third quarter-end, a complete portfolio holdings listing is filed with the SEC on Form N-PORT. The Fund’s Form N-PORT will be available on the SEC’s Web site at sec.gov. The Fund’s portfolio holdings are also posted on dws.com from time to time. Please read the Fund’s current prospectus for more information.
| | | | | | |
| | 6 | | | | | | Deutsche DWS Variable Series II — DWS Government & Agency Securities VIP |
| | |
| Investment Portfolio | | as of December 31, 2019 |
| | | | | | | | |
| | | Principal
Amount ($) | | | Value ($) | |
| Mortgage-Backed SecuritiesPass-Throughs 74.5% | |
| | |
Federal Home Loan Mortgage Corp.: | | | | | | | | |
| | |
3.0%, with various maturities from 9/1/2047 until 11/1/2049 | | | 1,163,183 | | | | 1,180,276 | |
| | |
3.5%, 9/1/2047 | | | 572,809 | | | | 594,950 | |
| | |
4.0%, with various maturities from 1/1/2045 until 12/1/2045 | | | 481,357 | | | | 516,456 | |
| | |
Federal National Mortgage Association: | | | | | | | | |
| | |
3.0%, with various maturities from 3/1/2047 until 10/1/2047 | | | 1,150,666 | | | | 1,174,763 | |
| | |
3.5%, with various maturities from 8/1/2047 until 1/1/2048 | | | 1,724,102 | | | | 1,796,579 | |
| | |
4.0%, 8/1/2047 | | | 836,625 | | | | 882,322 | |
| | |
Government National Mortgage Association: | | | | | | | | |
| | |
3.0%, with various maturities from 5/20/2045 until 1/1/2050 (a) | | | 7,270,368 | | | | 7,464,889 | |
| | |
3.5%, with various maturities from 4/15/2042 until 9/20/2049 | | | 8,921,483 | | | | 9,293,812 | |
| | |
4.0%, 6/20/2047 | | | 341,978 | | | | 361,732 | |
| | |
4.5%, with various maturities from 4/20/2035 until 4/15/2041 | | | 866,485 | | | | 941,292 | |
| | |
4.55%, 1/15/2041 | | | 78,677 | | | | 84,962 | |
| | |
4.625%, 5/15/2041 | | | 95,125 | | | | 98,190 | |
| | |
5.0%, with various maturities from 12/15/2032 until 8/15/2040 | | | 127,722 | | | | 140,494 | |
| | |
5.5%, with various maturities from 1/15/2034 until 6/15/2042 | | | 470,944 | | | | 537,891 | |
| | |
6.0%, with various maturities from 5/20/2034 until 1/15/2038 | | | 234,433 | | | | 271,386 | |
| | |
6.5%, with various maturities from 9/15/2036 until 2/15/2039 | | | 187,447 | | | | 217,851 | |
| | |
7.0%, with various maturities from 2/20/2027 until 2/15/2038 | | | 58,346 | | | | 61,966 | |
| | |
7.5%, 10/20/2031 | | | 2,948 | | | | 3,460 | |
Total Mortgage-Backed SecuritiesPass-Throughs (Cost $25,228,457) | | | | 25,623,271 | |
|
| Asset-Backed 5.5% | |
| Automobile Receivables 2.9% | |
| | |
AmeriCredit Automobile Receivables Trust: | | | | | | | | |
| | |
“A3”, Series2017-1, 1.87%, 8/18/2021 | | | 6,251 | | | | 6,250 | |
| | |
“C”, Series2019-2, 2.74%, 4/18/2025 | | | 330,000 | | | | 332,919 | |
| | |
“D”, Series2017-3, 3.18%, 7/18/2023 | | | 210,000 | | | | 213,305 | |
| | |
Hertz Vehicle Financing II LP, “A”, Series2018-1A, 144A, 3.29%, 2/25/2024 | | | 350,000 | | | | 358,202 | |
| | | | | | | | |
| | | Principal
Amount ($) | | | Value ($) | |
| | |
United Auto Credit Securitization Trust, “A”, Series2019-1, 144A, 2.82%, 7/12/2021 | | | 84,876 | | | | 85,016 | |
| | | | | | | | |
| | | | | | | 995,692 | |
| | |
| Miscellaneous 2.6% | | | | | | | | |
| | |
GMF Floorplan Owner Revolving Trust, “B”, Series2019-2, 144A, 3.1%, 4/15/2026 | | | 440,000 | | | | 448,282 | |
| | |
MVW Owner Trust, “A”, Series2019-1A, 144A, 2.89%, 11/20/2036 | | | 294,163 | | | | 297,860 | |
| | |
NRZ Excess Spread-Collateralized Notes, “B”, Series 2018-PLS1, 144A, 3.588%, 1/25/2023 | | | 167,045 | | | | 167,831 | |
| | | | | | | | |
| | | | | | | | 913,973 | |
Total Asset-Backed (Cost $1,885,251) | | | | 1,909,665 | |
|
| Collateralized Mortgage Obligations 14.2% | |
| | |
Federal Home Loan Mortgage Corp.: | | | | | | | | |
| | |
“OA”, Series 3179, Principal Only, Zero Coupon, 7/15/2036 | | | 60,884 | | | | 53,260 | |
| | |
“CZ”, Series 4113, 3.0%, 9/15/2042 | | | 334,073 | | | | 325,481 | |
| | |
“PI”, Series 3940, Interest Only, 4.0%, 2/15/2041 | | | 207,778 | | | | 24,942 | |
| | |
“UA”, Series 4298, 4.0%, 2/15/2054 | | | 53,835 | | | | 55,598 | |
| | |
“C32”, Series 303, Interest Only, 4.5%, 12/15/2042 | | | 627,591 | | | | 137,796 | |
| | |
“MI”, Series 3871, Interest Only, 6.0%, 4/15/2040 | | | 15,926 | | | | 555 | |
| | |
“IJ”, Series 4472, Interest Only, 6.0%, 11/15/2043 | | | 237,588 | | | | 52,917 | |
| | |
“A”, Series 172, Interest Only, 6.5%, 1/1/2024 | | | 3,804 | | | | 359 | |
| | |
“C22”, Series 324, Interest Only, 6.5%, 4/15/2039 | | | 344,750 | | | | 87,720 | |
| | |
Federal National Mortgage Association: | | | | | | | | |
| | |
“FE”, Series2018-94,1-monthUSD-LIBOR + 0.400%, 2.192%*, 1/25/2049 | | | 285,565 | | | | 284,127 | |
| | |
“Z”, Series2013-44, 3.0%, 5/25/2043 | | | 102,397 | | | | 94,888 | |
| | |
“4”, Series 406, Interest Only, 4.0%, 9/25/2040 | | | 158,652 | | | | 24,905 | |
| | |
“DZ”, Series2019-9, 4.0%, 3/25/2049 | | | 310,151 | | | | 333,656 | |
| | |
“IO”, Series2016-26, Interest Only, 5.0%, 5/25/2046 | | | 672,507 | | | | 122,901 | |
| | |
“UI”, Series2010-126, Interest Only, 5.5%, 10/25/2040 | | | 255,419 | | | | 44,383 | |
| | |
“IO”, Series2014-70, Interest Only, 5.5%, 10/25/2044 | | | 356,383 | | | | 73,640 | |
| | |
“BI”, Series2015-97, Interest Only, 5.5%, 1/25/2046 | | | 292,042 | | | | 58,762 | |
| | |
“WI”, Series2011-59, Interest Only, 6.0%, 5/25/2040 | | | 9,533 | | | | 91 | |
| | |
“YT”, Series2013-35, 6.5%, 9/25/2032 | | | 386,571 | | | | 442,736 | |
The accompanying notes are an integral part of the financial statements.
| | | | |
Deutsche DWS Variable Series II — DWS Government & Agency Securities VIP | | | | | 7 |
| | | | | | | | |
| | | Principal
Amount ($) | | | Value ($) | |
| | |
Government National Mortgage Association: | | | | | | | | |
| | |
“JZ”, Series110-2017, 3.0%, 7/20/2047 | | | 261,248 | | | | 245,474 | |
| | |
“JI”, Series2013-10, Interest Only, 3.5%, 1/20/2043 | | | 395,294 | | | | 69,648 | |
| | |
“IP”, Series2015-50, Interest Only, 4.0%, 9/20/2040 | | | 508,640 | | | | 23,159 | |
| | |
“PI”, Series2015-40, Interest Only, 4.0%, 4/20/2044 | | | 162,942 | | | | 11,711 | |
| | |
“GZ”, Series2005-24, 5.0%, 3/20/2035 | | | 699,313 | | | | 822,589 | |
| | |
“AZ”, Series2019-31, 5.0%, 3/20/2049 | | | 299,335 | | | | 337,252 | |
| | |
“IA”, Series2012-64, Interest Only, 5.5%, 5/16/2042 | | | 141,172 | | | | 30,713 | |
| | |
“DI”, Series2009-10, Interest Only, 6.0%, 4/16/2038 | | | 68,847 | | | | 6,382 | |
| | |
“IP”, Series2009-118, Interest Only, 6.5%, 12/16/2039 | | | 25,049 | | | | 5,305 | |
| | |
“IC”, Series1997-4, Interest Only, 7.5%, 3/16/2027 | | | 171,948 | | | | 25,496 | |
| | |
JP Morgan Mortgage Trust: | | | | | | | | |
| | |
“A6”, Series2017-2, 144A, 3.0%, 5/25/2047 | | | 398,228 | | | | 400,835 | |
| | |
“A5”, Series2017-4, 144A, 3.5%, 11/25/2048 | | | 231,759 | | | | 234,240 | |
| | |
New Residential Mortgage Loan: | | | | | | | | |
| | |
“A1”, Series 2019-NQM3, 144A, 2.802%, 7/25/2049 | | | 270,201 | | | | 270,546 | |
| | |
“A1”, Series 2019-NQM2, 144A, 3.6%, 4/25/2049 | | | 181,596 | | | | 182,989 | |
Total Collateralized Mortgage Obligations (Cost $4,691,378) | | | | | | | 4,885,056 | |
|
| Commercial Mortgage-Backed Securities 6.0% | |
| | |
BANK, “A3”, Series 2019-BN20, 3.011%, 9/15/2061 | | | 350,000 | | | | 360,434 | |
| | |
Benchmark Mortgage Trust, “A4” Series2019-B13, 2.952%, 8/15/2057 | | | 413,045 | | | | 422,936 | |
| | |
FHLMC Multifamily Structured Pass-Through Certificates, “X1P”, Series KL05, Interest Only, 0.892%, 6/25/2029 | | | 1,400,000 | | | | 101,712 | |
| | | | | | | | |
| | | Principal
Amount ($) | | | Value ($) | |
| | |
Morgan Stanley Capital I Trust, “A4” Series2019-L3, 3.127%, 11/15/2029 | | | 400,000 | | | | 412,789 | |
| | |
Wells Fargo Commercial Mortgage Trust, “A4”, Series 2016-NXS6, 2.918%, 11/15/2049 | | | 750,000 | | | | 769,012 | |
Total Commercial Mortgage-Backed Securities (Cost $2,027,726) | | | | 2,066,883 | |
|
| Government & Agency Obligations 1.5% | |
| U.S. Treasury Obligation | | | | | | | | |
U.S. Treasury Notes, 2.125%, 7/31/2024 (Cost $509,692) | | | 500,000 | | | | 509,726 | |
|
| Short-Term U.S. Treasury Obligations 2.5% | |
| | |
U.S. Treasury Bills: | | | | | | | | |
| | |
1.495%**, 7/16/2020 | | | 100,000 | | | | 99,163 | |
| | |
1.598%**, 9/10/2020 (c) | | | 400,000 | | | | 395,744 | |
| | |
1.802%**, 7/16/2020 (b) | | | 380,000 | | | | 376,822 | |
Total Short-Term U.S. Treasury Obligations (Cost $870,944) | | | | | | | 871,729 | |
| | |
| | | Shares | | | Value ($) | |
| Cash Equivalents 7.3% | |
| | |
DWS Central Cash Management Government Fund, 1.62% (d) | | | 1,400,632 | | | | 1,400,632 | |
| | |
DWS ESG Liquidity Fund “Capital Shares”, 1.76% (d) | | | 1,123,733 | | | | 1,123,845 | |
Total Cash Equivalents (Cost $2,524,259) | | | | | | | 2,524,477 | |
| | |
| | | % of Net
Assets | | | Value ($) | |
Total Investment Portfolio (Cost $37,737,707) | | | 111.5 | | | | 38,390,807 | |
| Other Assets and Liabilities, Net | | | (11.5 | ) | | | (3,969,180 | ) |
| Net Assets | | | 100.0 | | | | 34,421,627 | |
A summary of the Fund’s transactions with affiliated investments during the year ended December 31, 2019 are as follows:
| | | | | | | | | | | | | | | | | | | | | | | | | | | | | | | | |
Value ($) at
12/31/2018 | | Purchases
Cost ($) | | | Sales
Proceeds ($) | | | Net
Realized
Gain/
(Loss) ($) | | | Net Change in
Unrealized
Appreciation
(Depreciation) ($) | | | Income ($) | | | Capital Gain
Distributions ($) | | | Number
of Shares
at
12/31/2019 | | | Value ($)
at
12/31/2019 | |
Cash Equivalents 7.3% | |
DWS Central Cash Management Government Fund, 1.62% (d) | |
| 3,485,215 | | | 33,127,069 | | | | 35,211,652 | | | | — | | | | — | | | | 53,547 | | | | — | | | | 1,400,632 | | | | 1,400,632 | |
DWS ESG Liquidity Fund “Capital Shares”, 1.76% (d) | |
| 3,784,362 | | | 39,374 | | | | 2,700,540 | | | | 810 | | | | (161 | ) | | | 22,058 | | | | — | | | | 1,123,733 | | | | 1,123,845 | |
| 7,269,577 | | | 33,166,443 | | | | 37,912,192 | | | | 810 | | | | (161 | ) | | | 75,605 | | | | — | | | | 2,524,365 | | | | 2,524,477 | |
| * | Variable or floating rate security. These securities are shown at their current rate as of December 31, 2019. For securities based on a published reference rate and spread, the reference rate and spread are indicated within the description above. Certain variable rate securities are not based on a published reference rate and spread but adjust periodically based on current market conditions, prepayment of underlying positions and/or other variables. |
The accompanying notes are an integral part of the financial statements.
| | | | | | |
| | 8 | | | | | | Deutsche DWS Variable Series II — DWS Government & Agency Securities VIP |
| ** | Annualized yield at time of purchase; not a coupon rate. |
| (a) | When-issued, delayed delivery or forward commitment securities included. |
| (b) | At December 31, 2019, this security has been pledged, in whole or in part, to cover initial margin requirements for open futures contracts. |
| (c) | At December 31, 2019, this security has been pledged, in whole or in part, to cover initial margin requirements for open centrally cleared swap contracts. |
| (d) | Affiliated fund managed by DWS Investment Management Americas, Inc. The rate shown is the annualizedseven-day yield at period end. |
144A: Security exempt from registration under Rule 144A of the Securities Act of 1933. These securities may be resold in transactions exempt from registration, normally to qualified institutional buyers.
Interest Only: Interest Only (IO) bonds represent the “interest only” portion of payments on a pool of underlying mortgages or mortgage-backed securities. IO securities are subject to prepayment risk of the pool of underlying mortgages.
LIBOR: London Interbank Offered Rate
Principal Only: Principal Only (PO) bonds represent the “principal only” portion of payments on a pool of underlying mortgages or mortgage-backed securities.
Included in the portfolio are investments in mortgage or asset-backed securities which are interests in separate pools of mortgages or assets. Effective maturities of these investments may be shorter than stated maturities due to prepayments. Some separate investments in the Federal Home Loan Mortgage Corp., Federal National Mortgage Association and Government National Mortgage Association issues which have similar coupon rates have been aggregated for presentation purposes in this investment portfolio.
At December 31, 2019, open futures contracts sold were as follows:
| | | | | | | | | | | | | | | | | | | | | | | | |
| Futures | | Currency | | | Expiration
Date | | | Contracts | | | Notional
Amount ($) | | | Notional
Value ($) | | | Unrealized
Appreciation ($) | |
| 10 Year U.S. Treasury Note | | | USD | | | | 3/20/2020 | | | | 6 | | | | 771,641 | | | | 770,531 | | | | 1,110 | |
| U.S. Treasury Long Bond | | | USD | | | | 3/20/2020 | | | | 6 | | | | 944,312 | | | | 935,438 | | | | 8,874 | |
| Total unrealized appreciation | | | | | | | | 9,984 | |
At December 31, 2019, open interest rate swap contracts were as follows:
| | | | | | | | | | | | | | | | | | | | | | |
| Centrally Cleared Swaps | | | | | | | | | |
Cash Flows
Paid by
the Fund/
Frequency | | Cash Flows
Received by
the Fund/
Frequency | | Effective/
Expiration
Date | | Notional
Amount ($) | | | Currency | | Value ($) | | | Upfront
Payments
Paid/
(Received) ($) | | | Unrealized
Appreciation/
(Depreciation) ($) | |
| Floating — 3-Month LIBOR Quarterly | | Fixed — 1.62%
Semi-Annually | | 11/8/2019
11/8/2021 | | | 4,400,000 | | | USD | | | (7,057 | ) | | | — | | | | (7,057 | ) |
| Floating —3-Month LIBOR Quarterly | | Fixed — 1.652%
Semi-Annually | | 11/26/2019
11/26/2029 | | | 300,000 | | | USD | | | (6,320 | ) | | | — | | | | (6,320 | ) |
| Floating —3-Month LIBOR Quarterly | | Fixed — 1.659%
Semi-Annually | | 10/15/2019
10/15/2021 | | | 13,400,000 | | | USD | | | (17,876 | ) | | | — | | | | (17,876 | ) |
Fixed — 2.724%
Semi-Annually | | Floating — 3-Month LIBOR Quarterly | | 3/4/2019
3/5/2029 | | | 700,000 | | | USD | | | (56,985 | ) | | | — | | | | (56,985 | ) |
Fixed — 2.179%
Semi-Annually | | Floating — 3-Month LIBOR Quarterly | | 5/21/2019
2/21/2023 | | | 300,000 | | | USD | | | (6,385 | ) | | | — | | | | (6,385 | ) |
Fixed — 1.756%
Semi-Annually | | Floating —3-Month LIBOR Quarterly | | 9/17/2019
9/17/2029 | | | 400,000 | | | USD | | | 2,508 | | | | — | | | | 2,508 | |
Fixed — 2.085%
Semi-Annually | | Floating —3-Month LIBOR Quarterly | | 5/30/2019
5/31/2022 | | | 200,000 | | | USD | | | (1,986 | ) | | | — | | | | (1,986 | ) |
Fixed — 2.45%
Semi-Annually | | Floating —3-Month LIBOR Quarterly | | 12/20/2017
12/20/2032 | | | 500,000 | | | USD | | | (27,790 | ) | | | — | | | | (27,790 | ) |
Fixed — 1.537%
Semi-Annually | | Floating —3-Month LIBOR Quarterly | | 11/26/2019
11/26/2024 | | | 3,200,000 | | | USD | | | 27,994 | | | | — | | | | 27,994 | |
Fixed — 1.961%
Semi-Annually | | Floating —3-Month LIBOR Quarterly | | 6/28/2019
6/28/2029 | | | 300,000 | | | USD | | | (2,437 | ) | | | — | | | | (2,437 | ) |
Fixed — 1.565%
Semi-Annually | | Floating —3-Month LIBOR Quarterly | | 9/27/2019
9/27/2029 | | | 400,000 | | | USD | | | 9,690 | | | | — | | | | 9,690 | |
| Total net unrealized depreciation | | | | (86,644 | ) |
LIBOR: London Interbank Offered Rate;3-Month LIBOR rate at December 30, 2019 is 1.908%.
Currency Abbreviations
The accompanying notes are an integral part of the financial statements.
| | | | |
Deutsche DWS Variable Series II — DWS Government & Agency Securities VIP | | | | | 9 |
For information on the Fund’s policy and additional disclosures regarding futures contracts, interest rate swap contracts, total return swap contracts and forward foreign currency contracts, please refer to the Derivatives section of Note B in the accompanying Notes to Financial Statements.
Fair Value Measurements
Various inputs are used in determining the value of the Fund’s investments. These inputs are summarized in three broad levels. Level 1 includes quoted prices in active markets for identical securities. Level 2 includes other significant observable inputs (including quoted prices for similar securities, interest rates, prepayment speeds and credit risk). Level 3 includes significant unobservable inputs (including the Fund’s own assumptions in determining the fair value of investments). The level assigned to the securities valuations may not be an indication of the risk or liquidity associated with investing in those securities.
The following is a summary of the inputs used as of December 31, 2019 in valuing the Fund’s investments. For information on the Fund’s policy regarding the valuation of investments, please refer to the Security Valuation section of Note A in the accompanying Notes to Financial Statements.
| | | | | | | | | | | | | | | | |
| Assets | | Level 1 | | | Level 2 | | | Level 3 | | | Total | |
| Fixed Income Investments (e) | | | | | | | | | | | | | | | | |
Mortgage-Backed Securities Pass-Throughs | | $ | — | | | $ | 25,623,271 | | | $ | — | | | $ | 25,623,271 | |
Asset-Backed | | | — | | | | 1,909,665 | | | | — | | | | 1,909,665 | |
Collateralized Mortgage Obligations | | | — | | | | 4,885,056 | | | | — | | | | 4,885,056 | |
Commercial Mortgage-Backed Securities | | | — | | | | 2,066,883 | | | | — | | | | 2,066,883 | |
Government & Agency Obligations | | | — | | | | 509,726 | | | | — | | | | 509,726 | |
Short-Term U.S. Treasury Obligations | | | — | | | | 871,729 | | | | — | | | | 871,729 | |
| Short-Term Investments (e) | | | 2,524,477 | | | | — | | | | — | | | | 2,524,477 | |
| Derivatives (f) | | | | | | | | | | | | | | | | |
Futures Contracts | | | 9,984 | | | | — | | | | — | | | | 9,984 | |
Interest Rate Swap Contracts | | | — | | | | 40,192 | | | | — | | | | 40,192 | |
| Total | | $ | 2,534,461 | | | $ | 35,906,522 | | | $ | — | | | $ | 38,440,983 | |
| | | | |
| Liabilities | | Level 1 | | | Level 2 | | | Level 3 | | | Total | |
| Derivatives (f) | | | | | | | | | | | | | | | | |
Interest Rate Swap Contracts | | $ | — | | | $ | (126,836 | ) | | $ | — | | | $ | (126,836 | ) |
| Total | | $ | — | | | $ | (126,836 | ) | | $ | — | | | $ | (126,836 | ) |
| (e) | See Investment Portfolio for additional detailed categorizations. |
| (f) | Derivatives include unrealized appreciation (depreciation) on open futures contracts and interest rate swap contracts. |
The accompanying notes are an integral part of the financial statements.
| | | | | | |
| | 10 | | | | | | Deutsche DWS Variable Series II — DWS Government & Agency Securities VIP |
Statement of Assets and Liabilities
| | | | |
| as of December 31, 2019 | | | | |
| |
| Assets | | | | |
| Investments innon-affiliated securities, at value (cost $35,213,448) | | $ | 35,866,330 | |
Investment in affiliated securities, at value
(cost $2,524,259) | | | 2,524,477 | |
| Foreign currency, at value | | | 17 | |
| Receivable for investments sold — forward commitments | | | 1,033,898 | |
| Receivable for Fund shares sold | | | 12,307 | |
| Interest receivable | | | 118,026 | |
| Receivable for variation margin on futures contracts | | | 2,703 | |
| Receivable for variation margin on centrally cleared swaps | | | 4,561 | |
| Other assets | | | 1,073 | |
| Total assets | | | 39,563,392 | |
| |
| Liabilities | | | | |
| Cash overdraft | | | 2,650 | |
| Payable for investments purchased — forward commitments | | | 5,042,081 | |
| Payable for Fund shares redeemed | | | 9,138 | |
| Accrued management fee | | | 6,611 | |
| Accrued Trustees’ fees | | | 1,902 | |
| Other accrued expenses and payables | | | 79,383 | |
| Total liabilities | | | 5,141,765 | |
| Net assets, at value | | $ | 34,421,627 | |
| |
| Net Assets Consist of | | | | |
| Distributable earnings (loss) | | | 1,654,579 | |
| Paid-in capital | | | 32,767,048 | |
| Net assets, at value | | $ | 34,421,627 | |
| |
| Net Asset Value | | | | |
Class A | | | | |
| |
| Net Asset Value, offering and redemption price per share ($33,073,826 ÷ 2,926,799 outstanding shares of beneficial interest, no par value, unlimited number of shares authorized) | | $ | 11.30 | |
Class B | | | | |
| |
| Net Asset Value, offering and redemption price per share ($1,347,801 ÷ 119,399 outstanding shares of beneficial interest, no par value, unlimited number of shares authorized) | | $ | 11.29 | |
Statement of Operations
| | | | |
| for the year ended December 31, 2019 | |
| |
| Investment Income | | | | |
| Income: | | | | |
| Interest | | $ | 1,077,129 | |
| Income distributions from affiliated securities | | | 75,605 | |
| Total income | | | 1,152,734 | |
| Expenses: | | | | |
| Management fee | | | 160,744 | |
| Administration fee | | | 35,721 | |
| Services to Shareholders | | | 656 | |
| Record keeping fee (Class B) | | | 1,386 | |
| Distribution service fees (Class B) | | | 3,711 | |
| Custodian fee | | | 13,541 | |
| Professional fees | | | 52,651 | |
| Reports to shareholders | | | 37,315 | |
| Trustees’ fees and expenses | | | 4,464 | |
| Other | | | 8,502 | |
| Total expenses before expense reductions | | | 318,691 | |
| Expense reductions | | | (124,218 | ) |
| Total expenses after expense reductions | | | 194,473 | |
| Net investment income | | | 958,261 | |
| |
| Realized and Unrealized Gain/(Loss) | | | | |
| Net realized gain (loss) from: | | | | |
| Non-Affiliated investments | | | 145,531 | |
| Affiliated investments | | | 810 | |
| Swap contracts | | | (53,187 | ) |
| Futures | | | 568,103 | |
| Forward foreign currency contracts | | | 12,444 | |
| Foreign currency | | | (1,514 | ) |
| | | | 672,187 | |
| Change in net unrealized appreciation (depreciation) on: | | | | |
| Non-Affiliated investments | | | 772,720 | |
| Affiliated investments | | | (161 | ) |
| Swap contracts | | | (47,390 | ) |
| Futures | | | (106,570 | ) |
| Forward foreign currency contracts | | | (5,304 | ) |
| Foreign currency | | | (461 | ) |
| | | | 612,834 | |
| Net gain (loss) | | | 1,285,021 | |
Net increase (decrease) in net assets
resulting from operations | | $ | 2,243,282 | |
The accompanying notes are an integral part of the financial statements.
| | | | |
Deutsche DWS Variable Series II — DWS Government & Agency Securities VIP | | | | | 11 |
Statements of Changes in Net Assets
| | | | | | | | |
| | | Years Ended December 31, | |
| Increase (Decrease) in Net Assets | | 2019 | | | 2018 | |
| Operations: | | | | | | | | |
| Net investment income | | $ | 958,261 | | | $ | 1,004,300 | |
| Net realized gain (loss) | | | 672,187 | | | | (489,745 | ) |
| Change in net unrealized appreciation (depreciation) | | | 612,834 | | | | (391,353 | ) |
| Net increase (decrease) in net assets resulting from operations | | | 2,243,282 | | | | 123,202 | |
| Distributions to shareholders | | | | | | | | |
Class A | | | (931,223 | ) | | | (1,045,563 | ) |
Class B | | | (36,052 | ) | | | (40,012 | ) |
| Total distributions | | | (967,275 | ) | | | (1,085,575 | ) |
| Fund share transactions: | | | | | | | | |
Class A | | | | | | | | |
| Proceeds from shares sold | | | 3,483,018 | | | | 2,638,856 | |
| Reinvestment of distributions | | | 931,223 | | | | 1,045,563 | |
| Payments for shares redeemed | | | (7,472,223 | ) | | | (8,226,521 | ) |
| Net increase (decrease) in net assets from Class A share transactions | | | (3,057,982 | ) | | | (4,542,102 | ) |
Class B | | | | | | | | |
| Proceeds from shares sold | | | 111,055 | | | | 54,842 | |
| Reinvestment of distributions | | | 36,052 | | | | 40,012 | |
| Payments for shares redeemed | | | (459,912 | ) | | | (296,226 | ) |
| Net increase (decrease) in net assets from Class B share transactions | | | (312,805 | ) | | | (201,372 | ) |
| Increase (decrease) in net assets | | | (2,094,780 | ) | | | (5,705,847 | ) |
| Net assets at beginning of period | | | 36,516,407 | | | | 42,222,254 | |
| | |
| Net assets at end of period | | $ | 34,421,627 | | | $ | 36,516,407 | |
| | |
| Other Information | | | | | | | | |
Class A | | | | | | | | |
| Shares outstanding at beginning of period | | | 3,199,776 | | | | 3,619,812 | |
| Shares sold | | | 314,630 | | | | 242,507 | |
| Shares issued to shareholders in reinvestment of distributions | | | 85,985 | | | | 97,716 | |
| Shares redeemed | | | (673,592 | ) | | | (760,259 | ) |
| Net increase (decrease) in Class A shares | | | (272,977 | ) | | | (420,036 | ) |
| | |
| Shares outstanding at end of period | | | 2,926,799 | | | | 3,199,776 | |
Class B | | | | | | | | |
| Shares outstanding at beginning of period | | | 147,546 | | | | 165,975 | |
| Shares sold | | | 9,978 | | | | 5,073 | |
| Shares issued to shareholders in reinvestment of distributions | | | 3,326 | | | | 3,736 | |
| Shares redeemed | | | (41,451 | ) | | | (27,238 | ) |
| Net increase (decrease) in Class B shares | | | (28,147 | ) | | | (18,429 | ) |
| | |
| Shares outstanding at end of period | | | 119,399 | | | | 147,546 | |
The accompanying notes are an integral part of the financial statements.
| | | | | | |
| | 12 | | | | | | Deutsche DWS Variable Series II — DWS Government & Agency Securities VIP |
Financial Highlights
| | | | | | | | | | | | | | | | | | | | |
| | | Years Ended December 31, | |
| Class A | | 2019 | | | 2018 | | | 2017 | | | 2016 | | | 2015 | |
| | | | | |
| Selected Per Share Data | | | | | | | | | | | | | | | | | | | | |
| Net asset value, beginning of period | | $ | 10.91 | | | $ | 11.15 | | | $ | 11.25 | | | $ | 11.48 | | | $ | 11.80 | |
| Income (loss) from investment operations: | | | | | | | | | | | | | | | | | | | | |
| | | | | |
Net investment incomea | | | .30 | | | | .28 | | | | .23 | | | | .25 | | | | .27 | |
Net realized and unrealized gain (loss) | | | .39 | | | | (.22 | ) | | | (.04 | ) | | | (.13 | ) | | | (.26 | ) |
Total from investment operations | | | .69 | | | | .06 | | | | .19 | | | | .12 | | | | .01 | |
| Less distributions from: | | | | | | | | | | | | | | | | | | | | |
| | | | | |
Net investment income | | | (.30 | ) | | | (.30 | ) | | | (.29 | ) | | | (.35 | ) | | | (.33 | ) |
| Net asset value, end of period | | $ | 11.30 | | | $ | 10.91 | | | $ | 11.15 | | | $ | 11.25 | | | $ | 11.48 | |
| Total Return (%)b | | | 6.43 | | | | .55 | | | | 1.67 | | | | 1.06 | | | | .06 | |
| | | | | |
| Ratios to Average Net Assets and Supplemental Data | | | | | | | | | | | | | | | | | | | | |
| Net assets, end of period ($ millions) | | | 33 | | | | 35 | | | | 40 | | | | 52 | | | | 66 | |
| Ratio of expenses before expense reductions (%)c | | | .88 | | | | .93 | | | | .87 | | | | .86 | | | | .74 | |
| Ratio of expenses after expense reductions (%)c | | | .53 | | | | .55 | | | | .61 | | | | .58 | | | | .68 | |
| Ratio of net investment income (%) | | | 2.70 | | | | 2.58 | | | | 2.03 | | | | 2.22 | | | | 2.33 | |
| Portfolio turnover rate (%) | | | 334 | | | | 448 | | | | 588 | | | | 521 | | | | 376 | |
| a | Based on average shares outstanding during the period. |
| b | Total return would have been lower had certain expenses not been reduced. |
| c | Expense ratio does not reflect charges and fees associated with the separate account that invests in the Fund or any variable life insurance policy or variable annuity contract for which the Fund is an investment option. |
| | | | | | | | | | | | | | | | | | | | |
| | | Years Ended December 31, | |
| Class B | | 2019 | | | 2018 | | | 2017 | | | 2016 | | | 2015 | |
| | | | | |
| Selected Per Share Data | | | | | | | | | | | | | | | | | | | | |
| Net asset value, beginning of period | | $ | 10.90 | | | $ | 11.14 | | | $ | 11.24 | | | $ | 11.46 | | | $ | 11.79 | |
| Income (loss) from investment operations: | | | | | | | | | | | | | | | | | | | | |
| | | | | |
Net investment incomea | | | .26 | | | | .24 | | | | .19 | | | | .21 | | | | .23 | |
Net realized and unrealized gain (loss) | | | .39 | | | | (.22 | ) | | | (.04 | ) | | | (.12 | ) | | | (.27 | ) |
Total from investment operations | | | .65 | | | | .02 | | | | .15 | | | | .09 | | | | (.04 | ) |
| Less distributions from: | | | | | | | | | | | | | | | | | | | | |
| | | | | |
Net investment income | | | (.26 | ) | | | (.26 | ) | | | (.25 | ) | | | (.31 | ) | | | (.29 | ) |
| Net asset value, end of period | | $ | 11.29 | | | $ | 10.90 | | | $ | 11.14 | | | $ | 11.24 | | | $ | 11.46 | |
| Total Return (%)b | | | 6.05 | | | | .19 | | | | 1.31 | | | | .79 | | | | (.36 | ) |
| | | | | |
| Ratios to Average Net Assets and Supplemental Data | | | | | | | | | | | | | | | | | | | | |
| Net assets, end of period ($ millions) | | | 1 | | | | 2 | | | | 2 | | | | 2 | | | | 3 | |
| Ratio of expenses before expense reductions (%)c | | | 1.23 | | | | 1.28 | | | | 1.21 | | | | 1.21 | | | | 1.09 | |
| Ratio of expenses after expense reductions (%)c | | | .88 | | | | .90 | | | | .95 | | | | .93 | | | | 1.03 | |
| Ratio of net investment income (%) | | | 2.35 | | | | 2.23 | | | | 1.69 | | | | 1.88 | | | | 1.99 | |
| Portfolio turnover rate (%) | | | 334 | | | | 448 | | | | 588 | | | | 521 | | | | 376 | |
| a | Based on average shares outstanding during the period. |
| b | Total return would have been lower had certain expenses not been reduced. |
| c | Expense ratio does not reflect charges and fees associated with the separate account that invests in the Fund or any variable life insurance policy or variable annuity contract for which the Fund is an investment option. |
The accompanying notes are an integral part of the financial statements.
| | | | |
Deutsche DWS Variable Series II — DWS Government & Agency Securities VIP | | | | | 13 |
| | |
| Notes to Financial Statements | | |
A. Organization and Significant Accounting Policies
DWS Government & Agency Securities VIP (the “Fund”) is a diversified series of Deutsche DWS Variable Series II (the “Trust”), which is registered under the Investment Company Act of 1940, as amended (the “1940 Act”), as an open-end management investment company organized as a Massachusetts business trust.
Multiple Classes of Shares of Beneficial Interest. The Fund offers two classes of shares (Class A shares and Class B shares). Sales of Class B shares are subject to recordkeeping fees up to 0.15% and Rule 12b-1 fees under the 1940 Act equal to an annual rate of 0.25% of the average daily net assets of the Class B shares of the Fund. Class A shares are not subject to such fees.
Investment income, realized and unrealized gains and losses, and certain fund-level expenses and expense reductions, if any, are borne pro rata on the basis of relative net assets by the holders of all classes of shares except that each class bears certain expenses unique to that class (including the applicable Rule 12b-1 fee and recordkeeping fees). Differences in class-level expenses may result in payment of different per share dividends by class. All shares have equal rights with respect to voting subject to class-specific arrangements.
The Fund’s financial statements are prepared in accordance with accounting principles generally accepted in the United States of America (“U.S. GAAP”) which require the use of management estimates. Actual results could differ from those estimates. The Fund qualifies as an investment company under Topic 946 of Accounting Standards Codification of U.S. GAAP. The policies described below are followed consistently by the Fund in the preparation of its financial statements.
Security Valuation. Investments are stated at value determined as of the close of regular trading on the New York Stock Exchange on each day the exchange is open for trading.
Various inputs are used in determining the value of the Fund’s investments. These inputs are summarized in three broad levels. Level 1 includes quoted prices in active markets for identical securities. Level 2 includes other significant observable inputs (including quoted prices for similar securities, interest rates, prepayment speeds and credit risk). Level 3 includes significant unobservable inputs (including the Fund’s own assumptions in determining the fair value of investments). The level assigned to the securities valuations may not be an indication of the risk or liquidity associated with investing in those securities.
Debt securities are valued at prices supplied by independent pricing services approved by the Fund’s Board. Such services may use various pricing techniques which take into account appropriate factors such as yield, quality, coupon rate, maturity, type of issue, trading characteristics, prepayment speeds and other data, as well as broker quotes. If the pricing services are unable to provide valuations, debt securities are valued at the average of the most recent reliable bid quotations or evaluated prices, as applicable, obtained from broker-dealers. These securities are generally categorized as Level 2.
Investments in open-end investment companies are valued at their net asset value each business day and are categorized as Level 1.
Futures contracts are generally valued at the settlement prices established each day on the exchange on which they are traded and are categorized as Level 1.
Forward currency contracts are valued at the prevailing forward exchange rate of the underlying currencies and are categorized as Level 2.
Swap contracts are valued daily based upon prices supplied by a Board approved pricing vendor, if available, and otherwise are valued at the price provided by the broker-dealer. Swap contracts are generally categorized as Level 2.
Exchange-traded options are valued at the last sale price or, in the absence of a sale, the mean between the closing bid and asked prices or at the most recent asked price (bid for purchased options) if no bid or asked price are available. Exchange-traded options are generally categorized as Level 1. Over-the-counter written or purchased options are valued at prices supplied by a Board approved pricing vendor, if available, and otherwise are valued at the price provided by the broker-dealer with which the option was traded. Over-the-counter written or purchased options are generally categorized as Level 2.
Securities and other assets for which market quotations are not readily available or for which the above valuation procedures are deemed not to reflect fair value are valued in a manner that is intended to reflect their fair value as determined in accordance with procedures approved by the Board and are generally
| | | | | | |
| | 14 | | | | | | Deutsche DWS Variable Series II — DWS Government & Agency Securities VIP |
categorized as Level 3. In accordance with the Fund’s valuation procedures, factors considered in determining value may include, but are not limited to, the type of the security; the size of the holding; the initial cost of the security; the existence of any contractual restrictions on the security’s disposition; the price and extent of public trading in similar securities of the issuer or of comparable companies; quotations or evaluated prices from broker-dealers and/or pricing services; information obtained from the issuer, analysts, and/or the appropriate stock exchange (for exchange-traded securities); an analysis of the company’s or issuer’s financial statements; an evaluation of the forces that influence the issuer and the market(s) in which the security is purchased and sold; and with respect to debt securities, the maturity, coupon, creditworthiness, currency denomination and the movement of the market in which the security is normally traded. The value determined under these procedures may differ from published values for the same securities.
Disclosure about the classification of fair value measurements is included in a table following the Fund’s Investment Portfolio.
Foreign Currency Translations. The books and records of the Fund are maintained in U.S. dollars. Investment securities and other assets and liabilities denominated in a foreign currency are translated into U.S. dollars at the prevailing exchange rates at period end. Purchases and sales of investment securities, income and expenses are translated into U.S. dollars at the prevailing exchange rates on the respective dates of the transactions.
Net realized and unrealized gains and losses on foreign currency transactions represent net gains and losses between trade and settlement dates on securities transactions, the acquisition and disposition of foreign currencies, and the difference between the amount of net investment income accrued and the U.S. dollar amount actually received. The portion of both realized and unrealized gains and losses on investments that results from fluctuations in foreign currency exchange rates is not separately disclosed but is included with net realized and unrealized gain/appreciation and loss/depreciation on investments.
Securities Lending. Deutsche Bank AG, as lending agent, lends securities of the Fund to certain financial institutions under the terms of its securities lending agreement. During the term of the loans, the Fund continues to receive interest and dividends generated by the securities and to participate in any changes in their market value. The Fund requires the borrowers of the securities to maintain collateral with the Fund consisting of either cash or liquid, unencumbered assets having a value at least equal to the value of the securities loaned. When the collateral falls below specified amounts, the lending agent will use its best effort to obtain additional collateral on the next business day to meet required amounts under the securities lending agreement. During the year ended December 31, 2019, the Fund invested the cash collateral into a joint trading account in DWS Government & Agency Securities Portfolio, an affiliated money market fund managed by DWS Investment Management Americas, Inc. DWS Investment Management Americas, Inc. receives a management/administration fee (0.12% annualized effective rate as of December 31, 2019) on the cash collateral invested in DWS Government & Agency Securities Portfolio. The Fund receives compensation for lending its securities either in the form of fees or by earning interest on invested cash collateral net of borrower rebates and fees paid to a lending agent. Either the Fund or the borrower may terminate the loan at any time, and the borrower, after notice, is required to return borrowed securities within a standard time period. There may be risks of delay and costs in recovery of securities or even loss of rights in the collateral should the borrower of the securities fail financially. If the Fund is not able to recover securities lent, the Fund may sell the collateral and purchase a replacement investment in the market, incurring the risk that the value of the replacement security is greater than the value of the collateral. The Fund is also subject to all investment risks associated with the reinvestment of any cash collateral received, including, but not limited to, interest rate, credit and liquidity risk associated with such investments.
During the year ended December 31, 2019, the Fund had no securities on loan.
Forward Commitments. The Fund may purchase or sell securities on a when-issued, delayed delivery or forward commitment basis with delivery or payment to occur at a later date beyond the normal settlement period. At the time the Fund enters into a commitment to purchase or sell a security, the transaction is recorded and the value of the transaction is reflected in the net asset value. The price of such security and the date when the security will be delivered and paid for are fixed at the time the transaction is negotiated. The Fund may sell the forward commitment security before the settlement date or enter into a new commitment to extend the delivery date into the future. The value of the security may vary with market fluctuations. At the time the Fund enters into a purchase transaction it is required to segregate cash or other liquid assets at least equal to the amount of the commitment. Additionally, the Fund or the counterparty may be required to post securities and/or cash collateral in accordance with the terms of the commitment.
| | | | |
Deutsche DWS Variable Series II — DWS Government & Agency Securities VIP | | | | | 15 |
Certain risks may arise upon entering into when-issued, delayed delivery or forward commitment transactions from the potential inability of counterparties to meet the terms of their contracts or if the issuer does not issue the securities due to political, economic or other factors. Such transactions may also have the effect of leverage on the Fund and may cause the Fund to be more volatile. Additionally, losses may arise due to changes in the value of the underlying securities.
Federal Income Taxes. The Fund’s policy is to comply with the requirements of the Internal Revenue Code, as amended, which are applicable to regulated investment companies and to distribute all of its taxable income to its shareholders.
The Fund has reviewed the tax positions for the open tax years as of December 31, 2019 and has determined that no provision for income tax and/or uncertain tax positions is required in the Fund’s financial statements. The Fund’s federal tax returns for the prior three fiscal years remain open subject to examination by the Internal Revenue Service.
Distribution of Income and Gains. Distributions from net investment income of the Fund, if any, are declared and distributed to shareholders annually. Net realized gains from investment transactions, in excess of available capital loss carryforwards, would be taxable to the Fund if not distributed and, therefore, will be distributed to shareholders at least annually. The Fund may also make additional distributions for tax purposes if necessary.
The timing and characterization of certain income and capital gain distributions are determined annually in accordance with federal tax regulations which may differ from accounting principles generally accepted in the United States of America. These differences primarily relate to investments in futures contracts, investments in swap contracts and certain securities sold at a loss. As a result, net investment income (loss) and net realized gain (loss) on investment transactions for a reporting period may differ significantly from distributions during such period. Accordingly, the Fund may periodically make reclassifications among certain of its capital accounts without impacting the net asset value of the Fund.
At December 31, 2019, the Fund’s components of distributable earnings on a tax basis were as follows:
| | | | |
| Undistributed ordinary income* | | $ | 1,066,070 | |
| Net unrealized appreciation (depreciation) on investments | | $ | 588,603 | |
At December 31, 2019, the aggregate cost of investments for federal income tax purposes was $37,737,707. The net unrealized appreciation for all investments based on tax cost was $588,603. This consisted of aggregate gross unrealized appreciation for all investments in which there was an excess of value over tax cost of $824,381 and aggregate gross unrealized depreciation for all investments in which there was an excess of tax cost over value of $235,778.
In addition, the tax character of distributions paid by the Fund is summarized as follows:
| | | | | | | | |
| | | Years Ended December 31, | |
| | | 2019 | | | 2018 | |
| Distributions from ordinary income* | | $ | 967,275 | | | $ | 1,085,575 | |
| * | For tax purposes, short-term capital gain distributions are considered ordinary income distributions. |
Expenses. Expenses of the Trust arising in connection with a specific fund are allocated to that fund. Other Trust expenses which cannot be directly attributed to a fund are apportioned among the funds in the Trust based upon the relative net assets or other appropriate measures.
Contingencies. In the normal course of business, the Fund may enter into contracts with service providers that contain general indemnification clauses. The Fund’s maximum exposure under these arrangements is unknown, as this would involve future claims that may be made against the Fund that have not yet been made. However, based on experience, the Fund expects the risk of loss to be remote.
Other. Investment transactions are accounted for on a trade date plus one basis for daily net asset value calculations. However, for financial reporting purposes, investment transactions are reported on trade date. Interest income is recorded on the accrual basis. Realized gains and losses from investment transactions are recorded on an identified cost basis. All discounts and premiums are accreted/amortized for both tax and financial reporting purposes for the Fund.
| | | | | | |
| | 16 | | | | | | Deutsche DWS Variable Series II — DWS Government & Agency Securities VIP |
B. Derivative Instruments
Swaps. A swap is a contract between two parties to exchange future cash flows at periodic intervals based on the notional amount of the swap. A bilateral swap is a transaction between the Fund and a counterparty where cash flows are exchanged between the two parties. A centrally cleared swap is a transaction executed between the Fund and a counterparty, then cleared by a clearing member through a central clearinghouse. The central clearinghouse serves as the counterparty, with whom the Fund exchanges cash flows.
The value of a swap is adjusted daily, and the change in value, if any, is recorded as unrealized appreciation or depreciation in the Statement of Assets and Liabilities. Gains or losses are realized when the swap expires or is closed. Certain risks may arise when entering into swap transactions including counterparty default; liquidity; or unfavorable changes in interest rates or the value of the underlying reference security, commodity or index. In connection with bilateral swaps, securities and/or cash may be identified as collateral in accordance with the terms of the swap agreement to provide assets of value and recourse in the event of default. The maximum counterparty credit risk is the net present value of the cash flows to be received from or paid to the counterparty over the term of the swap, to the extent that this amount is beneficial to the Fund, in addition to any related collateral posted to the counterparty by the Fund. This risk may be partially reduced by a master netting arrangement between the Fund and the counterparty. Upon entering into a centrally cleared swap, the Fund is required to deposit with a financial intermediary cash or securities (“initial margin”) in an amount equal to a certain percentage of the notional amount of the swap. Subsequent payments (“variation margin”) are made or received by the Fund dependent upon the daily fluctuations in the value of the swap. In a cleared swap transaction, counterparty risk is minimized as the central clearinghouse acts as the counterparty.
An upfront payment, if any, made by the Fund is recorded as an asset in the Statement of Assets and Liabilities. An upfront payment, if any, received by the Fund is recorded as a liability in the Statement of Assets and Liabilities. Payments received or made at the end of the measurement period are recorded as realized gain or loss in the Statement of Operations.
Total Return Swap Contracts. Total return swaps involve commitments to pay interest in exchange for a market-linked return based on a notional amount. One counterparty pays out the total return of the reference security or index underlying the total return swap, and in return receives a fixed or variable rate. As a receiver, the Fund would receive payments based on any positive total return and would owe payments in the event of a negative total return. As the payer, the Fund would owe payments on any net positive total return, and would receive payments in the event of a negative total return. For the year ended December 31, 2019, the Fund entered into total return swap transactions as a means of gaining exposure to a particular asset class without investing directly in such asset class.
There were no open total return swap contracts as of December 31, 2019. For the year ended December 31, 2019, the investment in total return swap contracts had a total notional amount generally indicative of a range from $0 to approximately $348,000.
Interest Rate Swaps. Interest rate swaps are agreements in which the Fund agrees to pay to the counterparty a fixed rate payment in exchange for the counterparty agreeing to pay to the Fund a variable rate payment, or the Fund agrees to receive from the counterparty a fixed rate payment in exchange for the counterparty agreeing to receive from the Fund a variable rate payment. The payment obligations are based on the notional amount of the swap. For the year ended December 31, 2019, the Fund entered into interest rate swap agreements to gain exposure to different parts of the yield curve while managing overall duration and for non-hedging purposes to seek to enhance potential gains.
A summary of the open interest rate swap contracts as of December 31, 2019 is included in a table following the Fund’s Investment Portfolio. For the year ended December 31, 2019, the investment in interest rate swap contracts had a total USD equivalent notional amount generally indicative of a range from $1,600,000 to $24,100,000.
Futures Contracts. A futures contract is an agreement between a buyer or seller and an established futures exchange or its clearinghouse in which the buyer or seller agrees to take or make a delivery of a specific amount of a financial instrument at a specified price on a specific date (settlement date). For the year ended December 31, 2019, the Fund entered into interest rate futures to gain exposure to different parts of the yield curve while managing overall duration and for non-hedging purposes to seek to enhance potential gains.
Upon entering into a futures contract, the Fund is required to deposit with a financial intermediary cash or securities (“initial margin”) in an amount equal to a certain percentage of the face value indicated in the futures contract. Subsequent payments (“variation margin”) are made or received by the Fund dependent
| | | | |
Deutsche DWS Variable Series II — DWS Government & Agency Securities VIP | | | | | 17 |
upon the daily fluctuations in the value and are recorded for financial reporting purposes as unrealized gains or losses by the Fund. Gains or losses are realized when the contract expires or is closed. Since all futures contracts are exchange-traded, counterparty risk is minimized as the exchange’s clearinghouse acts as the counterparty, and guarantees the futures against default.
Certain risks may arise upon entering into futures contracts, including the risk that an illiquid market will limit the Fund’s ability to close out a futures contract prior to the settlement date and the risk that the futures contract is not well correlated with the security, index or currency to which it relates. Risk of loss may exceed amounts disclosed in the Statement of Assets and Liabilities.
A summary of the open futures contracts as of December 31, 2019, is included in a table following the Fund’s Investment Portfolio. For the year ended December 31, 2019, the investment in futures contracts purchased had a total notional value generally indicative of a range from $0 to approximately $13,329,000 and the investment in futures contracts sold had a total notional value generally indicative of a range from approximately $579,000 to $4,963,000.
Options.An option contract is a contract in which the writer (seller) of the option grants the buyer of the option, upon payment of a premium, the right to purchase from (call option), or sell to (put option), the writer a designated instrument at a specified price within a specified period of time. The Fund may write or purchase interest rate swaption agreements which are options to enter into a pre-defined swap agreement. The interest rate swaption agreement will specify whether the buyer of the swaption will be a fixed-rate receiver or a fixed-rate payer upon exercise. Certain options, including options on indices and interest rate options, will require cash settlement by the Fund if exercised. For the year ended December 31, 2019, the Fund entered into options on interest rate swaps in order to hedge against potential adverse interest rate movements of portfolio assets.
If the Fund writes a covered call option, the Fund foregoes, in exchange for the premium, the opportunity to profit during the option period from an increase in the market value of the underlying security above the exercise price. If the Fund writes a put option it accepts the risk of a decline in the value of the underlying security below the exercise price. Over-the-counter options have the risk of the potential inability of counterparties to meet the terms of their contracts. The Fund’s maximum exposure to purchased options is limited to the premium initially paid. In addition, certain risks may arise upon entering into option contracts including the risk that an illiquid secondary market will limit the Fund’s ability to close out an option contract prior to the expiration date and that a change in the value of the option contract may not correlate exactly with changes in the value of the securities hedged.
There were no open option contracts as of December 31, 2019. For the year ended December 31, 2019, the investment in purchased option contracts had a total value generally indicative of a range from $0 to approximately $3,000.
Forward Foreign Currency Contracts. A forward foreign currency contract (“forward currency contract”) is a commitment to purchase or sell a foreign currency at the settlement date at a negotiated rate. For the year ended December 31, 2019, the Fund entered into forward currency contracts in order to hedge its exposure to changes in foreign currency exchange rates on its foreign currency denominated portfolio holdings and for non-hedging purposes to seek to enhance potential gains.
Forward currency contracts are valued at the prevailing forward exchange rate of the underlying currencies and unrealized gain (loss) is recorded daily. On the settlement date of the forward currency contract, the Fund records a realized gain or loss equal to the difference between the value of the contract at the time it was opened and the value of the contract at the time it was closed. Certain risks may arise upon entering into forward currency contracts from the potential inability of counterparties to meet the terms of their contracts. The maximum counterparty credit risk to the Fund is measured by the unrealized gain on appreciated contracts. Additionally, when utilizing forward currency contracts to hedge, the Fund gives up the opportunity to profit from favorable exchange rate movements during the term of the contract.
There were no open forward currency contracts as of December 31, 2019. For the year ended December 31, 2019, the investment in forward currency contracts short vs. U.S. dollars had a total contract value generally indicative of a range from $0 to approximately $785,000 and the investment in forward currency contracts long vs. U.S. dollars had a total contract value generally indicative of a range from $0 to approximately $780,000. The investment in forward currency contracts long vs. other foreign currencies sold had a total contract value generally indicative of a range from $0 to approximately $720,000.
| | | | | | |
| | 18 | | | | | | Deutsche DWS Variable Series II — DWS Government & Agency Securities VIP |
The following tables summarize the value of the Fund’s derivative instruments held as of December 31, 2019 and the related location in the accompanying Statement of Assets and Liabilities, presented by primary underlying risk exposure:
| | | | | | | | | | | | |
| Asset Derivatives | | Swap
Contracts | | | Futures
Contracts | | | Total | |
| Interest Rate Contracts (a) | | $ | 40,192 | | | $ | 9,984 | | | $ | 50,176 | |
Each of the above derivatives is located in the following Statement of Assets and Liabilities accounts:
| (a) | Includes cumulative appreciation of swap contracts and futures contracts as disclosed in the Investment Portfolio. Unsettled variation margin is disclosed separately within the Statement of Assets and Liabilities. |
| | | | |
| Liability Derivatives | | Swap
Contracts | |
| Interest Rate Contracts (b) | | $ | (126,836 | ) |
The above derivative is located in the following Statement of Assets and Liabilities accounts:
| (b) | Includes cumulative depreciation of swap contracts as disclosed in the Investment Portfolio. Unsettled variation margin is disclosed separately within the Statement of Assets and Liabilities. |
Additionally, the amount of unrealized and realized gains and losses on derivative instruments recognized in Fund earnings during the year ended December 31, 2019 and the related location in the accompanying Statement of Operations is summarized in the following tables by primary underlying risk exposure:
| | | | | | | | | | | | | | | | | | | | |
| Realized Gain (Loss) | | Purchased
Options | | | Forward
Contracts | | | Swap
Contracts | | | Futures
Contracts | | | Total | |
| Interest Rate Contracts (c) | | $ | (150 | ) | | $ | — | | | $ | (53,187 | ) | | $ | 568,103 | | | $ | 514,766 | |
| Foreign Exchange Contracts (d) | | | — | | | | 12,444 | | | | — | | | | — | | | | 12,444 | |
| | | $ | (150 | ) | | $ | 12,444 | | | $ | (53,187 | ) | | $ | 568,103 | | | $ | 527,210 | |
Each of the above derivatives is located in the following Statement of Operations accounts:
| (c) | Net realized gain (loss) from investments (includes purchased options), swap contracts and futures, respectively |
| (d) | Net realized gain (loss) from forward foreign currency contracts |
| | | | | | | | | | | | | | | | |
Change in Net Unrealized
Appreciation (Depreciation) | | Forward
Contracts | | | Swap
Contracts | | | Futures
Contracts | | | Total | |
| Interest Rate Contracts (e) | | $ | — | | | $ | (47,390 | ) | | $ | (106,570 | ) | | $ | (153,960 | ) |
| Foreign Exchange Contracts (f) | | | (5,304 | ) | | | — | | | | — | | | | (5,304 | ) |
| | | $ | (5,304 | ) | | $ | (47,390 | ) | | $ | (106,570 | ) | | $ | (159,264 | ) |
Each of the above derivatives is located in the following Statement of Operations accounts:
| (e) | Change in net unrealized appreciation (depreciation) from swap contracts and futures, respectively |
| (f) | Change in net unrealized appreciation (depreciation) on forward foreign currency contracts |
C. Purchases and Sales of Securities
During the year ended December 31, 2019, purchases and sales of investment securities, excluding short-term investments, were as follows:
| | | | | | | | |
| | | Purchases | | | Sales | |
| Non-U.S. Treasury Obligations | | $ | 126,446,654 | | | $ | 128,703,642 | |
| U.S. Treasury Obligations | | $ | 1,609,820 | | | $ | 1,819,417 | |
D. Related Parties
Management Agreement. Under the Investment Management Agreement with DWS Investment Management Americas, Inc. (“DIMA” or the “Advisor”), an indirect, wholly owned subsidiary of DWS Group GmbH & Co. KGaA (“DWS Group”), the Advisor directs the investments of the Fund in accordance with its investment objectives, policies and restrictions. The Advisor determines the securities, instruments and other contracts relating to investments to be purchased, sold or entered into by the Fund.
| | | | |
Deutsche DWS Variable Series II — DWS Government & Agency Securities VIP | | | | | 19 |
Pursuant to the Investment Management Agreement with the Advisor, the Fund pays a monthly management fee based on the Fund’s average daily net assets, computed and accrued daily and payable monthly, at the following annual rates:
| | | | |
| First $250 million | | | .450 | % |
| Next $750 million | | | .430 | % |
| Next $1.5 billion | | | .410 | % |
| Next $2.5 billion | | | .400 | % |
| Next $2.5 billion | | | .380 | % |
| Next $2.5 billion | | | .360 | % |
| Next $2.5 billion | | | .340 | % |
| Over $12.5 billion | | | .320 | % |
Accordingly, for the year ended December 31, 2019, the fee pursuant to the Investment Management Agreement was equivalent to an annual rate (exclusive of any applicable waivers/reimbursements) of 0.45% of the Fund’s average daily net assets.
For the period from January 1, 2019 through September 30, 2019, the Advisor had contractually agreed to waive all or a portion of its fees and/or reimburse certain operating expenses of the Fund to the extent necessary to maintain the total annual operating expenses (excluding certain expenses such as extraordinary expenses, taxes, brokerage and interest) of each class as follows:
| | | | |
| Class A | | | .53 | % |
| Class B | | | .88 | % |
Effective October 1, 2019 through February 27, 2020 (see Note G), the Advisor has contractually agreed to waive all or a portion of its fees and/or reimburse certain operating expenses of the Fund to the extent necessary to maintain the total annual operating expenses (excluding certain expenses such as extraordinary expenses, taxes, brokerage and interest) of each class as follows:
| | | | |
| Class A | | | .53 | % |
| Class B | | | .87 | % |
For the year ended December 31, 2019, fees waived and/or expenses reimbursed for each class are as follows:
| | | | |
| Class A | | $ | 119,044 | |
| Class B | | | 5,174 | |
| | | $ | 124,218 | |
Administration Fee. Pursuant to an Administrative Services Agreement, DIMA provides most administrative services to the Fund. For all services provided under the Administrative Services Agreement, the Fund pays DIMA an annual fee (“Administration Fee”) of 0.10% of the Fund’s average daily net assets, computed and accrued daily and payable monthly. For the year ended December 31, 2019, the Administration Fee was $35,721, of which $2,939 is unpaid.
Service Provider Fees. DWS Service Company (“DSC”), an affiliate of the Advisor, is the transfer agent, dividend-paying agent and shareholder service agent for the Fund. Pursuant to a sub-transfer agency agreement between DSC and DST Systems, Inc. (“DST”), DSC has delegated certain transfer agent, dividend-paying agent and shareholder service agent functions to DST. DSC compensates DST out of the shareholder servicing fee it receives from the Fund. For the year ended December 31, 2019, the amounts charged to the Fund by DSC were as follows:
| | | | | | | | |
| | | Total
Aggregated | | | Unpaid at
December 31, 2019 | |
| Class A | | $ | 253 | | | $ | 39 | |
| Class B | | | 38 | | | | 6 | |
| | | $ | 291 | | | $ | 45 | |
Distribution Service Agreement. Under the Fund’s Class B 12b-1 plan, DWS Distributors, Inc. (“DDI”) received a fee (“Distribution Service Fee”) of 0.25% of average daily net assets of Class B shares. For the year ended December 31, 2019, the Distribution Service Fee aggregated $3,711, of which $294 is unpaid.
| | | | | | |
| | 20 | | | | | | Deutsche DWS Variable Series II — DWS Government & Agency Securities VIP |
Typesetting and Filing Service Fees. Under an agreement with the Fund, DIMA is compensated for providing certain pre-press and regulatory filing services to the Fund. For the year ended December 31, 2019, the amount charged to the Fund by DIMA included in the Statement of Operations under “Reports to shareholders” aggregated $9,724, of which $4,281 is unpaid.
Trustees’ Fees and Expenses. The Fund paid retainer fees to each Trustee not affiliated with the Advisor, plus specified amounts to the Board Chairperson and to each committee Chairperson.
Affiliated Cash Management Vehicles. The Fund may invest uninvested cash balances in DWS Central Cash Management Government Fund and DWS ESG Liquidity Fund, affiliated money market funds which are managed by the Advisor. Each affiliated money market fund is managed in accordance with Rule 2a-7 under the 1940 Act, which governs the quality, maturity, diversity and liquidity of instruments in which a money market fund may invest. DWS Central Cash Management Government Fund seeks to maintain a stable net asset value, and DWS ESG Liquidity Fund maintains a floating net asset value. The Fund indirectly bears its proportionate share of the expenses of each affiliated money market fund in which it invests. DWS Central Cash Management Government Fund does not pay the Advisor an investment management fee. To the extent that DWS ESG Liquidity Fund pays an investment management fee to the Advisor, the Advisor will waive an amount of the investment management fee payable to the Advisor by the Fund equal to the amount of the investment management fee payable on the Fund’s assets invested in DWS ESG Liquidity Fund.
Security Lending Fees. Deutsche Bank AG serves as securities lending agent for the Fund. For the year ended December 31, 2019, the Fund did not incur securities lending agent fees to Deutsche Bank AG.
E. Ownership of the Fund
At December 31, 2019, three participating insurance companies were owners of record of 10% or more of the total outstanding Class A shares of the Fund, each owning 50%, 32% and 15%. One participating insurance company was the owner of record of 10% or more of the total outstanding Class B shares of the Fund, owning 92%.
F. Line of Credit
The Fund and other affiliated funds (the “Participants”) share in a $400 million revolving credit facility provided by a syndication of banks. The Fund may borrow for temporary or emergency purposes, including the meeting of redemption requests that otherwise might require the untimely disposition of securities. The Participants are charged an annual commitment fee, which is allocated based on net assets, among each of the Participants. Interest is calculated at a rate per annum equal to the sum of the Federal Funds Rate plus 1.25 percent plus if the one-month LIBOR exceeds the Federal Funds Rate, the amount of such excess. The Fund may borrow up to a maximum of 33 percent of its net assets under the agreement. The Fund had no outstanding loans at December 31, 2019.
G. Fund Liquidation
Upon the recommendation of the Advisor, the Fund’s Board of Trustees has authorized the Fund’s termination and liquidation, effective on or about February 27, 2020 (the “Liquidation Date”). Accordingly, the Fund will involuntarily redeem the shares of any shareholder (i.e. participating insurance company that offers the Fund) outstanding on the Liquidation Date. Existing participating insurance company investors that currently offer the Fund as an investment option may continue to offer it to their contract owners until the Liquidation Date.
| | | | |
Deutsche DWS Variable Series II — DWS Government & Agency Securities VIP | | | | | 21 |
Report of Independent Registered Public Accounting Firm
To the Board of Trustees of Deutsche DWS Variable Series II and Shareholders of DWS Government & Agency Securities VIP:
Opinion on the Financial Statements
We have audited the accompanying statement of assets and liabilities of DWS Government & Agency Securities VIP (the “Fund”) (one of the funds constituting Deutsche DWS Variable Series II) (the “Trust”), including the investment portfolio, as of December 31, 2019, and the related statement of operations for the year then ended, the statements of changes in net assets for each of the two years in the period then ended, the financial highlights for each of the five years in the period then ended and the related notes (collectively referred to as the “financial statements”). In our opinion, the financial statements present fairly, in all material respects, the financial position of the Fund (one of the funds constituting Deutsche DWS Variable Series II) at December 31, 2019, the results of its operations for the year then ended, the changes in its net assets for each of the two years in the period then ended and its financial highlights for each of the five years in the period then ended, in conformity with U.S. generally accepted accounting principles.
Basis for Opinion
These financial statements are the responsibility of the Trust’s management. Our responsibility is to express an opinion on the Fund’s financial statements based on our audits. We are a public accounting firm registered with the Public Company Accounting Oversight Board (United States) (“PCAOB”) and are required to be independent with respect to the Trust in accordance with the U.S. federal securities laws and the applicable rules and regulations of the Securities and Exchange Commission and the PCAOB.
We conducted our audits in accordance with the standards of the PCAOB. Those standards require that we plan and perform the audit to obtain reasonable assurance about whether the financial statements are free of material misstatement, whether due to error or fraud. The Trust is not required to have, nor were we engaged to perform, an audit of the Trust’s internal control over financial reporting. As part of our audits, we are required to obtain an understanding of internal control over financial reporting, but not for the purpose of expressing an opinion on the effectiveness of the Trust’s internal control over financial reporting. Accordingly, we express no such opinion.
Our audits included performing procedures to assess the risks of material misstatement of the financial statements, whether due to error or fraud, and performing procedures that respond to those risks. Such procedures included examining, on a test basis, evidence regarding the amounts and disclosures in the financial statements. Our procedures included confirmation of securities owned as of December 31, 2019, by correspondence with the custodian and others or by other appropriate auditing procedures where replies from others were not received. Our audits also included evaluating the accounting principles used and significant estimates made by management, as well as evaluating the overall presentation of the financial statements. We believe that our audits provide a reasonable basis for our opinion.

We have served as the auditor of one or more investment companies in the DWS family of funds since at least 1979, but we are unable to determine the specific year.
Boston, Massachusetts
February 14, 2020
| | | | | | |
| | 22 | | | | | | Deutsche DWS Variable Series II — DWS Government & Agency Securities VIP |
| | |
| Information About Your Fund’s Expenses | | (Unaudited) |
As an investor of the Fund, you incur two types of costs: ongoing expenses and transaction costs. Ongoing expenses include management fees, distribution and service (12b-1) fees and other Fund expenses. Examples of transaction costs include contract charges, which are not shown in this section. The following tables are intended to help you understand your ongoing expenses (in dollars) of investing in the Fund and to help you compare these expenses with the ongoing expenses of investing in other mutual funds. In the most recent six-month period, the Fund limited these expenses; had it not done so, expenses would have been higher. The example in the table is based on an investment of $1,000 invested at the beginning of thesix-month period and held for the entire period (July 1, 2019 to December 31, 2019).
The tables illustrate your Fund’s expenses in two ways:
| – | | Actual Fund Return. This helps you estimate the actual dollar amount of ongoing expenses (but not transaction costs) paid on a $1,000 investment in the Fund using the Fund’s actual return during the period. To estimate the expenses you paid over the period, simply divide your account value by $1,000 (for example, an $8,600 account value divided by $1,000 = 8.6), then multiply the result by the number in the “Expenses Paid per $1,000” line under the share class you hold. |
| – | | Hypothetical 5% Fund Return. This helps you to compare your Fund’s ongoing expenses (but not transaction costs) with those of other mutual funds using the Fund’s actual expense ratio and a hypothetical rate of return of 5% per year before expenses. Examples using a 5% hypothetical Fund return may be found in the shareholder reports of other mutual funds. The hypothetical account values and expenses may not be used to estimate the actual ending account balance or expenses you paid for the period. |
Please note that the expenses shown in these tables are meant to highlight your ongoing expenses only and do not reflect any transaction costs. The “Expenses Paid per $1,000” line of the tables is useful in comparing ongoing expenses only and will not help you determine the relative total expense of owning different funds. If these transaction costs had been included, your costs would have been higher.
| | | | | | | | |
| Expenses and Value of a $1,000 Investment for the six months ended December 31, 2019 | | | | |
| | |
| Actual Fund Return | | Class A | | | Class B | |
| Beginning Account Value 7/1/19 | | $ | 1,000.00 | | | $ | 1,000.00 | |
| Ending Account Value 12/31/19 | | $ | 1,018.90 | | | $ | 1,018.00 | |
| Expenses Paid per $1,000* | | $ | 2.70 | | | $ | 4.48 | |
| | |
| Hypothetical 5% Fund Return | | Class A | | | Class B | |
| Beginning Account Value 7/1/19 | | $ | 1,000.00 | | | $ | 1,000.00 | |
| Ending Account Value 12/31/19 | | $ | 1,022.53 | | | $ | 1,020.77 | |
| Expenses Paid per $1,000* | | $ | 2.70 | | | $ | 4.48 | |
| * | Expenses are equal to the Fund’s annualized expense ratio for each share class, multiplied by the average account value over the period, multiplied by 184 (the number of days in the most recent six-month period), then divided by 365. |
| | | | | | | | |
| Annualized Expense Ratios | | Class A | | | Class B | |
| Deutsche DWS Variable Series II — DWS Government & Agency Securities VIP | | | .53 | % | | | .88 | % |
For more information, please refer to the Fund’s prospectus.
These tables do not reflect charges and fees (“contract charges”) associated with the separate account that invests in the Fund or any variable life insurance policy or variable annuity contract for which the Fund is an investment option.
For an analysis of the fees associated with an investment in the Fund or similar funds, please refer to the current and hypothetical expense calculators for Variable Insurance Products which can be found at dws.com/calculators.
| | | | |
Deutsche DWS Variable Series II — DWS Government & Agency Securities VIP | | | | | 23 |
| | | | |
| Tax Information | | (Unaudited) | | |
Please consult a tax advisor if you have questions about federal or state income tax laws, or on how to prepare your tax returns. If you have specific questions about your account, please contact your insurance provider.
The Trust’s policies and procedures for voting proxies for portfolio securities and information about how the Trust voted proxies related to its portfolio securities during the most recent 12-month period ended June 30 are available on our Web site — dws.com/en-us/resources/proxy-voting — or on the SEC’s Web site — sec.gov. To obtain a written copy of the Trust’s policies and procedures without charge, upon request, call us toll free at(800) 728-3337.
| | | | | | |
| | 24 | | | | | | Deutsche DWS Variable Series II — DWS Government & Agency Securities VIP |
Advisory Agreement Board Considerations and Fee Evaluation
The Board of Trustees (hereinafter referred to as the “Board” or “Trustees”) approved the renewal of DWS Government & Agency Securities VIP’s (the “Fund”) investment management agreement (the “Agreement”) with DWS Investment Management Americas, Inc. (“DIMA”) in September 2019.
In terms of the process that the Board followed prior to approving the Agreement, shareholders should know that:
| – | | During the entire process, all of the Fund’s Trustees were independent of DIMA and its affiliates (the “Independent Trustees”). |
| – | | The Board met frequently during the past year to discuss fund matters and dedicated a substantial amount of time to contract review matters. Over the course of several months, the Board’s Contract Committee reviewed extensive materials received from DIMA, independent third parties and independent counsel. These materials included an analysis of the Fund’s performance, fees and expenses, and profitability from a fee consultant retained by the Fund’s Independent Trustees (the “Fee Consultant”). Based on its evaluation of the information provided, the Contract Committee presented its findings and recommendations to the Board. The Board then reviewed the Contract Committee’s findings and recommendations. |
| – | | The Board also received extensive information throughout the year regarding performance of the Fund. |
| – | | The Independent Trustees regularly met privately with counsel to discuss contract review and other matters. In addition, the Independent Trustees were advised by the Fee Consultant in the course of their review of the Fund’s contractual arrangements and considered a comprehensive report prepared by the Fee Consultant in connection with their deliberations. |
| – | | In connection with reviewing the Agreement, the Board also reviewed the terms of the Fund’s Rule12b-1 plan, distribution agreement, administrative services agreement, transfer agency agreement and other material service agreements. |
In connection with the contract review process, the Contract Committee and the Board considered the factors discussed below, among others. The Board also considered that DIMA and its predecessors have managed the Fund since its inception, and the Board believes that a long-term relationship with a capable, conscientious advisor is in the best interests of the Fund. The Board considered, generally, that shareholders chose to invest or remain invested in the Fund knowing that DIMA managed the Fund. DIMA is part of DWS Group GmbH & Co. KGaA (“DWS Group”). DWS Group is a global asset management business that offers a wide range of investing expertise and resources, including research capabilities in many countries throughout the world. In 2018, approximately 20% of DWS Group’s shares were sold in an initial public offering, with Deutsche Bank AG owning the remaining shares.
As part of the contract review process, the Board carefully considered the fees and expenses of each DWS fund overseen by the Board in light of the fund’s performance. In many cases, this led to the negotiation and implementation of expense caps. As part of these negotiations, the Board indicated that it would consider relaxing these caps in future years following sustained improvements in performance, among other considerations.
While shareholders may focus primarily on fund performance and fees, the Fund’s Board considers these and many other factors, including the quality and integrity of DIMA’s personnel and administrative support services provided by DIMA, such as back-office operations, fund valuations, and compliance policies and procedures.
Nature, Quality and Extent of Services.The Board considered the terms of the Agreement, including the scope of advisory services provided under the Agreement. The Board noted that, under the Agreement, DIMA provides portfolio management services to the Fund and that, pursuant to a separate administrative services agreement, DIMA provides administrative services to the Fund. The Board considered the experience and skills of senior management and investment personnel and the resources made available to such personnel. The Board reviewed the Fund’s performance over short-term and long-term periods and compared those returns to various agreed-upon performance measures, including market index(es) and a peer universe compiled using information supplied by Morningstar Direct (“Morningstar”), an independent fund data service. The Board also noted that it has put into place a process of identifying “Funds in Review” (e.g., funds performing poorly relative to a peer universe), and receives additional reporting from DIMA regarding such funds and, where appropriate, DIMA’s plans to address underperformance. The Board
| | | | |
Deutsche DWS Variable Series II — DWS Government & Agency Securities VIP | | | | | 25 |
believes this process is an effective manner of identifying and addressing underperforming funds. Based on the information provided, the Board noted that, for theone-, three- and five-year periods ended December 31, 2018, the Fund’s performance (Class A shares) was in the 2nd quartile, 3rd quartile and 3rd quartile, respectively, of the applicable Morningstar universe (the 1st quartile being the best performers and the 4th quartile being the worst performers). The Board also observed that the Fund has underperformed its benchmark in theone-, three- and five-year periods ended December 31, 2018.
Fees and Expenses. The Board considered the Fund’s investment management fee schedule, operating expenses and total expense ratios, and comparative information provided by Broadridge Financial Solutions, Inc. (“Broadridge”) and the Fee Consultant regarding investment management fee rates paid to other investment advisors by similar funds (1st quartile being the most favorable and 4th quartile being the least favorable). With respect to management fees paid to other investment advisors by similar funds, the Board noted that the contractual fee rates paid by the Fund, which include a 0.10% fee paid to DIMA under the Fund’s administrative services agreement, were higher than the median (4th quartile) of the applicable Broadridge peer group (based on Broadridge data provided as of December 31, 2018). The Board noted that the Fund’s Class A shares total (net) operating expenses were expected to be higher than the median (3rd quartile) of the applicable Broadridge expense universe (based on Broadridge data provided as of December 31, 2018, and analyzing Broadridge expense universe Class A (net) expenses less any applicable12b-1 fees) (“Broadridge Universe Expenses”). The Board also reviewed data comparing each other operational share class’s total (net) operating expenses to the applicable Broadridge Universe Expenses. The Board noted that the expense limitations agreed to by DIMA were expected to help the Fund’s total (net) operating expenses remain competitive. The Board considered the Fund’s management fee rate as compared to fees charged by DIMA to comparable DWS U.S. registered funds (“DWS Funds”), noting that DIMA indicated that it does not provide services to any other comparable DWS Funds. The information requested by the Board as part of its review of fees and expenses also included information about institutional accounts (including anysub-advised funds and accounts) and funds offered primarily to European investors (“DWS Europe Funds”) managed by DWS Group. The Board noted that DIMA indicated that DWS Group does not manage any institutional accounts or DWS Europe Funds comparable to the Fund.
On the basis of the information provided, the Board concluded that management fees were reasonable and appropriate in light of the nature, quality and extent of services provided by DIMA.
Profitability. The Board reviewed detailed information regarding revenues received by DIMA under the Agreement. The Board considered the estimated costs to DIMA, andpre-tax profits realized by DIMA, from advising the DWS Funds, as well as estimates of thepre-tax profits attributable to managing the Fund in particular. The Board also received information regarding the estimated enterprise-wide profitability of DIMA and its affiliates with respect to all fund services in totality and by fund. The Board and the Fee Consultant reviewed DIMA’s methodology in allocating its costs to the management of the Fund. Based on the information provided, the Board concluded that thepre-tax profits realized by DIMA in connection with the management of the Fund were not unreasonable. The Board also reviewed certain publicly available information regarding the profitability of certain similar investment management firms. The Board noted that, while information regarding the profitability of such firms is limited (and in some cases is not necessarily prepared on a comparable basis), DIMA and its affiliates’ overall profitability with respect to the DWS Funds (after taking into account distribution and other services provided to the funds by DIMA and its affiliates) was lower than the overall profitability levels of most comparable firms for which such data was available.
Economies of Scale. The Board considered whether there are economies of scale with respect to the management of the Fund and whether the Fund benefits from any economies of scale. The Board noted that the Fund’s investment management fee schedule includes fee breakpoints. The Board concluded that the Fund’s fee schedule represents an appropriate sharing between the Fund and DIMA of such economies of scale as may exist in the management of the Fund at current asset levels.
Other Benefits to DIMA and Its Affiliates. The Board also considered the character and amount of other incidental or“fall-out” benefits received by DIMA and its affiliates, including any fees received by DIMA for administrative services provided to the Fund, any fees received by an affiliate of DIMA for transfer agency services provided to the Fund and any fees received by an affiliate of DIMA for distribution services. The Board also considered benefits to DIMA related to brokerage and soft-dollar allocations, including allocating brokerage to pay for research generated by parties other than the executing broker dealers, which pertain primarily to funds investing in equity securities. In addition, the Board considered the incidental public relations benefits to DIMA related to DWS Funds advertising and cross-selling opportunities among DIMA products and services. The Board considered these benefits in reaching its conclusion that the Fund’s management fees were reasonable.
| | | | | | |
| | 26 | | | | | | Deutsche DWS Variable Series II — DWS Government & Agency Securities VIP |
Compliance. The Board considered the significant attention and resources dedicated by DIMA to its compliance processes in recent years. The Board noted in particular (i) the experience, seniority and time commitment of the individuals serving as DIMA’s and the Fund’s chief compliance officers and (ii) the substantial commitment of resources by DIMA and its affiliates to compliance matters, including the retention of compliance personnel.
Based on all of the information considered and the conclusions reached, the Board determined that the continuation of the Agreement is in the best interests of the Fund. In making this determination, the Board did not give particular weight to any single factor identified above. The Board considered these factors over the course of numerous meetings, certain of which were in executive session with only the Independent Trustees and counsel present. It is possible that individual Independent Trustees may have weighed these factors differently in reaching their individual decisions to approve the continuation of the Agreement.
| | | | |
Deutsche DWS Variable Series II — DWS Government & Agency Securities VIP | | | | | 27 |
Board Members and Officers
The following table presents certain information regarding the Board Members and Officers of the Trust/Corporation. Each Board Member’s year of birth is set forth in parentheses after his or her name. Unless otherwise noted, (i) each Board Member has engaged in the principal occupation(s) noted in the table for at least the most recent five years, although not necessarily in the same capacity; and (ii) the address of each Independent Board Member is Keith R. Fox, DWS Funds Board Chair, c/o Thomas R. Hiller, Ropes & Gray LLP, Prudential Tower, 800 Boylston Street, Boston, MA02199-3600. Except as otherwise noted below, the term of office for each Board Member is until the election and qualification of a successor, or until such Board Member sooner dies, resigns, is removed or as otherwise provided in the governing documents of the Trust/Corporation. Because the Fund does not hold an annual meeting of shareholders, each Board Member will hold office for an indeterminate period.
The Board Members may also serve in similar capacities with other funds in the fund complex. The number of funds in DWS fund complex shown in the table below includes all registered open- and closed-end funds (including all of their portfolios) advised by the Advisor and any registered funds that have an investment advisor that is an affiliated person of the Advisor.
| | | | | | | | |
| Independent Board Members | | | | | |
Name, Year of Birth,
Position with the Trust/
Corporation and
Length of Time Served1 | | Business Experience and Directorships During the Past Five Years | | Number of
Funds in
DWS Fund
Complex
Overseen | | | Other
Directorships
Held by Board
Member
|
Keith R. Fox, CFA (1954) Chairperson since 2017, and Board Member since 1996 | | Managing General Partner, Exeter Capital Partners (a series of private investment funds) (since 1986). Directorships: ICI Mutual Insurance Company; Progressive International Corporation (kitchen goods importer and distributor); former Chairman, National Association of Small Business Investment Companies; former Directorships: The Kennel Shop (retailer); BoxTop Media Inc. (advertising); Sun Capital Advisers Trust (mutual funds) (2011–2012) | | | 77 | | | — |
John W. Ballantine (1946) Board Member since 1999 | | Retired; formerly, Executive Vice President and Chief Risk Management Officer, First Chicago NBD Corporation/The First National Bank of Chicago (1996–1998); Executive Vice President and Head of International Banking (1995–1996); former Directorships: Director and Chairman of the Board, Healthways, Inc.2 (population well-being and wellness services) (2003–2014); Stockwell Capital Investments PLC (private equity); Enron Corporation; FNB Corporation; Tokheim Corporation; First Oak Brook Bancshares, Inc.; Oak Brook Bank; and Prisma Energy International. Not-for-Profit Director/Trustee: Palm Beach Civic Association; Window to the World Communications (public media); Life Director of Harris Theater for Music and Dance (Chicago); Life Director of Hubbard Street Dance Chicago; former Not-for-Profit Directorships: Public Radio International | | | 77 | | | Portland
General
Electric2
(utility
company)
(2003–
present) |
Dawn-Marie Driscoll (1946) Board Member since 1987 | | Emeritus Executive Fellow, Center for Business Ethics, Bentley University; formerly: Partner, Palmer & Dodge (law firm) (1988–1990); Vice President of Corporate Affairs and General Counsel, Filene’s (retail) (1978–1988). Directorships: Advisory Board, Center for Business Ethics, Bentley University; Trustee and former Chairman of the Board, Southwest Florida Community Foundation (charitable organization); former Directorships: ICI Mutual Insurance Company (2007–2015); Sun Capital Advisers Trust (mutual funds) (2007–2012), Investment Company Institute (audit, executive, nominating committees) and Independent Directors Council (governance, executive committees) | | | 77 | | | — |
Richard J. Herring (1946) Board Member since 1990 | | Jacob Safra Professor of International Banking and Professor of Finance, The Wharton School, University of Pennsylvania (since July 1972); Director, The Wharton Financial Institutions Center (since 1994); formerly: Vice Dean and Director, Wharton Undergraduate Division (1995–2000) and Director, The Lauder Institute of International Management Studies (2000–2006); Member FDIC Systemic Risk Advisory Committee since 2011, member Systemic Risk Council since 2012 and member of the Advisory Board at the Yale Program on Financial Stability since 2013; Formerly Co-Chair of the Shadow Financial Regulatory Committee (2003–2015), Executive Director of The Financial Economists Roundtable (2008–2015), Director of The Thai Capital Fund (2007–2013), Director of The Aberdeen Singapore Fund (2007–2018), and Nonexecutive Director of Barclays Bank DE (2010–2018) | | | 77 | | | Director,
Aberdeen
Japan Fund
(since 2007) |
| | | | | | |
| | 28 | | | | | | Deutsche DWS Variable Series II — DWS Government & Agency Securities VIP |
| | | | | | | | |
Name, Year of Birth,
Position with the Trust/
Corporation and
Length of Time Served1 | | Business Experience and Directorships During the Past Five Years | | Number of
Funds in
DWS Fund
Complex
Overseen | | | Other
Directorships
Held by Board
Member
|
William McClayton (1944) Board Member since 2004 | | Private equity investor (since October 2009); previously, Managing Director, Diamond Management & Technology Consultants, Inc. (global consulting firm) (2001–2009); Directorship: Board of Managers, YMCA of Metropolitan Chicago; formerly: Senior Partner, Arthur Andersen LLP (accounting) (1966–2001); Trustee, Ravinia Festival | | | 77 | | | — |
Rebecca W. Rimel (1951) Board Member since 1995 | | President, Chief Executive Officer and Director, The Pew Charitable Trusts (charitable organization) (1994–present); formerly: Executive Vice President, The Glenmede Trust Company (investment trust and wealth management) (1983–2004); Board Member, Investor Education (charitable organization) (2004–2005); Trustee, Executive Committee, Philadelphia Chamber of Commerce (2001–2007); Director, Viasys Health Care2 (January 2007–June 2007); Trustee, Thomas Jefferson Foundation (charitable organization) (1994–2012) | | | 77 | | | Director,
Becton
Dickinson
and
Company2
(medical
technology
company)
(2012–
present);
Director,
BioTelemetry
Inc.2(health
care) (2009–
present) |
William N. Searcy, Jr. (1946) Board Member since 1993 | | Private investor since October 2003; formerly: Pension & Savings Trust Officer, Sprint Corporation2(telecommunications) (November 1989–September 2003); Trustee, Sun Capital Advisers Trust (mutual funds) (1998–2012) | | | 77 | | | — |
| | |
| Officers4 | | |
Name, Year of Birth,
Position with the Trust/
Corporation and
Length of Time Served5 | | Business Experience and Directorships During the Past Five Years |
Hepsen Uzcan6(1974) President and Chief Executive Officer, 2017–present | | Managing Director,3 DWS; Secretary, DWS USA Corporation (2018–present); Assistant Secretary, DWS Distributors, Inc. (2018–present); Director and Vice President, DWS Service Company (2018–present); Assistant Secretary, DWS Investment Management Americas, Inc. (2018–present); and Director and President, DB Investment Managers, Inc. (2018–present); formerly: Vice President for the Deutsche funds (2016–2017); Assistant Secretary for the DWS funds (2013–2019) |
John Millette7(1962) Vice President and Secretary, 1999–present | | Director,3DWS; Chief Legal Officer, DWS Investment Management Americas, Inc. (2015–present); Director and Vice President, DWS Trust Company (2016–present); and Assistant Secretary, DBX ETF Trust (2019–present); formerly: Secretary, Deutsche Investment Management Americas Inc. (2015–2017) |
Diane Kenneally7(1966) Chief Financial Officer and Treasurer, 2018–present | | Director,3 DWS; and Treasurer, Chief Financial Officer and Controller, DBX ETF Trust (2019–present); formerly: Assistant Treasurer for the DWS funds (2007–2018) |
Paul Antosca7(1957) Assistant Treasurer, 2007–present | | Director,3DWS; and Assistant Treasurer, DBX ETF Trust (2019–present) |
Sheila Cadogan7(1966) Assistant Treasurer, 2017–present | | Director,3DWS; Director and Vice President, DWS Trust Company (2018–present); and Assistant Treasurer, DBX ETF Trust (2019–present) |
Scott D. Hogan7(1970) Chief Compliance Officer, 2016–present | | Director,3DWS |
Caroline Pearson7(1962) Chief Legal Officer, 2010–present | | Managing Director,3DWS; formerly: Secretary, Deutsche AM Distributors, Inc. (2002–2017); and Secretary, Deutsche AM Service Company (2010–2017) |
Wayne Salit6(1967) Anti-Money Laundering Compliance Officer, 2014–present | | Director,3 Deutsche Bank; and AML Officer, DWS Trust Company; formerly: Managing Director, AML Compliance Officer at BNY Mellon (2011–2014); and Director, AML Compliance Officer at Deutsche Bank (2004–2011) |
Ciara Crawford8 (1984) Assistant Secretary, (2019–present) | | Associate, DWS (since 2015); previously, Legal Assistant at Accelerated Tax Solutions. |
| | | | |
Deutsche DWS Variable Series II — DWS Government & Agency Securities VIP | | | | | 29 |
| 1 | The length of time served represents the year in which the Board Member joined the board of one or more DWS funds currently overseen by the Board. |
| 2 | A publicly held company with securities registered pursuant to Section 12 of the Securities Exchange Act of 1934. |
| 3 | Executive title, not a board directorship. |
| 4 | As a result of their respective positions held with the Advisor or its affiliates, these individuals are considered “interested persons” of the Advisor within the meaning of the 1940 Act. Interested persons receive no compensation from the Fund. |
| 5 | The length of time served represents the year in which the officer was first elected in such capacity for one or more DWS funds. |
| 6 | Address: 875 Third Avenue, New York, NY 10022. |
| 7 | Address: One International Place, Boston, MA 02110. |
| 8 | Address: 5022 Gate Parkway, Suite 400, Jacksonville, FL 32256. |
The Fund’s Statement of Additional Information (“SAI”) includes additional information about the Board Members. The SAI is available, without charge, upon request. If you would like to request a copy of the SAI, you may do so by calling the followingtoll-free number:(800) 728-3337.
| | | | | | |
| | 30 | | | | | | Deutsche DWS Variable Series II — DWS Government & Agency Securities VIP |
Notes
| | |
| | |
VS2GAS-2 (R-025831-9 2/20) | | |
December 31, 2019
Annual Report
Deutsche DWS Variable Series II
DWS Global Equity VIP
Beginning on January 1, 2021, as permitted by regulations adopted by the Securities and Exchange Commission, you may not be receiving paper copies of the Fund’s shareholder reports from the insurance company that offers your contract unless you specifically request paper copies from your insurance company or from your financial intermediary. Instead, the shareholder reports will be made available on a Web site, and your insurance company will notify you by mail each time a report is posted and provide you with a Web site link to access the report. Instructions for requesting paper copies will be provided by your insurance company.
If you already elected to receive shareholder reports electronically, you will not be affected by this change and you need not take any action. You may elect to receive shareholder reports and other communications from your insurance company electronically by following the instructions provided by your insurance company.
You may elect to receive all future reports in paper free of charge from your insurance company. If your insurance company informs you that future reports will be delivered via Web access, you can inform your insurance company that you wish to continue receiving paper copies of your shareholder reports by following the instructions provided by your insurance company.

Contents
This report must be preceded or accompanied by a prospectus. To obtain an additional prospectus or summary prospectus, if available, call (800)728-3337 or your financial representative. We advise you to consider the Fund’s objectives, risks, charges and expenses carefully before investing. The summary prospectus and prospectus contain this and other important information about the Fund. Please read the prospectus carefully before you invest.
Stocks may decline in value. Investing in foreign securities, particularly those of emerging markets, presents certain risks, such as currency fluctuations, political and economic changes, and market risks. Emerging markets tend to be more volatile and less liquid than the markets of more mature economies, and generally have less diverse and less mature economic structures and less stable political systems than those of developed countries. Investing in derivatives entails special risks relating to liquidity, leverage and credit that may reduce returns and/or increase volatility. The Fund may lend securities to approved institutions. Please read the prospectus for details.
The brand DWS represents DWS Group GmbH & Co. KGaA and any of its subsidiaries such as DWS Distributors, Inc. which offers investment products or DWS Investment Management Americas, Inc. and RREEF America L.L.C. which offer advisory services.
DWS Distributors, Inc., 222 South Riverside Plaza, Chicago, IL 60606, (800)621-1148
NOT FDIC/NCUA INSURED NO BANK GUARANTEE MAY LOSE VALUE NOT A DEPOSIT
NOT INSURED BY ANY FEDERAL GOVERNMENT AGENCY
| | | | | | |
| | 2 | | | | | | Deutsche DWS Variable Series II — DWS Global Equity VIP |
| | |
| Performance Summary | | December 31, 2019 (Unaudited) |
Fund performance shown is historical, assumes reinvestment of all dividend and capital gain distributions and does not guarantee future results. Investment return and principal value fluctuate with changing market conditions so that, when redeemed, shares may be worth more or less than their original cost. Current performance may be lower or higher than the performance data quoted. Please contact your participating insurance company for the Fund’s most recentmonth-end performance. Performance does not reflect charges and fees (“contract charges”) associated with the separate account that invests in the Fund or any variable life insurance policy or variable annuity contract for which the Fund is an investment option. These charges and fees will reduce returns.
The gross expense ratio of the Fund, as stated in the fee table of the prospectus dated May 1, 2019 is 1.22% for Class A shares and may differ from the expense ratio disclosed in the Financial Highlights table in this report.
Generally accepted accounting principles require adjustments to be made to the net assets of the Fund at period end for financial reporting purposes only, and as such, the total return based on the unadjusted net asset value per share may differ from the total return reported in the financial highlights.
Growth of an Assumed $10,000 Investment
| | |
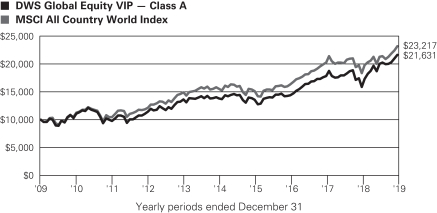
| | The MSCI All Country World Index is an unmanaged equity index which captures large and mid-capitalization representation across 23 developed markets and 26 emerging markets countries. It covers approximately 85% of the global investable equity opportunity set. Index returns do not reflect any fees or expenses and it is not possible to invest directly into an index. |
| | | | | | | | | | |
| Comparative Results | | | | | | | | | | |
| | | | |
| DWS Global Equity VIP | | 1-Year | | 3-Year | | 5-Year | | 10-Year |
| Class A | | Growth of $10,000 | | $13,626 | | $15,023 | | $15,662 | | $21,631 |
| | | Average annual total return | | 36.26% | | 14.53% | | 9.39% | | 8.02% |
| MSCI All Country World Index | | Growth of $10,000 | | $12,660 | | $14,217 | | $14,973 | | $23,217 |
| | Average annual total return | | 26.60% | | 12.44% | | 8.41% | | 8.79% |
The growth of $10,000 is cumulative.
| | | | |
Deutsche DWS Variable Series II — DWS Global Equity VIP | | | | | 3 |
| | |
| Management Summary | | December 31, 2019 (Unaudited) |
Class A shares of the Fund gained 36.26% (unadjusted for contract charges) in 2019, outperforming the 26.60% return of the MSCI All Country World Index. The Fund’s average annual return for the five-year period ended December 31, 2019 was 9.39%, versus 8.41% for the index in the same span.
Our emphasis on growth stocks was a key factor driving performance in 2019. Stock selection also played a large role in the Fund’s strong showing. The Fund outpaced the corresponding index components in nine of the ten sectors in which it was invested, led by consumer discretionary, information technology, financials, and health care. Energy was the only area in which the Fund lagged, but we made up for the shortfall by having an underweight allocation to this underperforming sector.
Our performance advantage in the consumer discretionary sector was led by a position in YETI Holdings, Inc. (United States). We participated in the initial public offering (IPO) in the second half of 2018 on the belief that the company’s potential for expansion both domestically and overseas would fuel robust growth. After some initial weakness following the IPO, the stock rallied on the combination of improved inventory management, positive earnings results, and continued brand momentum. Brookfield Asset Management, Inc. (Canada) which reported steady growth, was another key contributor in both the financial sector and the Fund as a whole. Globant SA, a software company based in Argentina, was the top performer in technology. The company beat earnings estimates and raised its guidance thanks to a favorable demand environment. A number of health care stocks also finished among the Fund’s top contributors for the year, including the U.S. companies TransMedics Group, Inc.*, Zoetis, Inc., and Danaher Corp.
At a time of robust relative performance, few aspects of the Fund’s positioning stood out as negatives. Evolent Health, Inc., which we purchased on the belief that the company was well positioned for the U.S. health care industry’s transition to value-based payment models, was the largest individual detractor. The stock was hit by concerns about contract losses and an acquisition that was poorly received by the markets. SmileDirectClub Inc. (U.S.) and Canada Goose Holdings, Inc. were also key detractors, as were underweights in the domesticmega-cap stocks Apple, Inc. and Facebook, Inc.*
The strong performance of the global markets led to a significant increase in valuations in 2019, resulting in a narrower set of investment opportunities. We therefore became increasingly selective in identifying investment candidates for the Fund. The companies held in the portfolio continue to have robust drivers of growth, however, and in general are maintaining their competitive leadership positions by leveraging advanced technologies and executing well. We found a number of higher-conviction ideas in the technology sector over the course of the year, and we increased the portfolio’s weightings in Microsoft Corp. (U.S.), EPAM Systems, Inc. (U.S.), Alibaba Group Holding, Ltd. (China), and Globant SA. We also incrementally added to the Fund’s weighting in higher-growth companies, including DexCom, Inc. (U.S), and we built positions in high-quality firms that we believe offer cyclical upside and reasonable valuations, such as Cie de Saint-Gobain SA (France) and 3M Co. (U.S.). Conversely, we either sold or reduced stocks with deteriorating fundamentals, including China Life Insurance Co. Ltd.*, A.O. Smith Corp.* (U.S.), Komatsu Ltd.* (Japan), and Mitsubishi UFJ Financial Group, Inc.* (Japan).
From a regional perspective, we held a relatively neutral stance with the largest absolute weighting in the United States. On a longer-term basis, we think the emerging markets offer the most compelling growth prospects — particularly in areas that are sensitive to domestic consumption trends.
The Fund ended the year with a cash weighting of about 1.2%, which we think provides us with the flexibility to add to positions in our favored companies if macro-related headlines begin to fuel market volatility in the months ahead. We would welcome such disruptions, as they can provide an opportunity to build positions in attractive, higher-growth stocks at more reasonable valuations.
Sebastian P. Werner, PhD, Director
Portfolio Manager
The views expressed reflect those of the portfolio management team only through the end of the period of the report as stated on the cover. The management team’s views are subject to change at any time based on market and other conditions and should not be construed as a recommendation. Past performance is no guarantee of future results. Current and future portfolio holdings are subject to risk.
| | | | | | |
| | 4 | | | | | | Deutsche DWS Variable Series II — DWS Global Equity VIP |
Terms to Know
MSCI All Country World Index is an unmanaged equity index which captures large andmid-capitalization representation across 23 developed markets and 26 emerging markets countries. It covers approximately 85% of the global investable equity opportunity set.
Index returns do not reflect fees or expenses and it is not possible to invest directly into an index.
Underweightmeans the Fund holds a lower weighting in a given sector or security than the benchmark.Overweightmeans it holds a higher weighting.
Contributionincorporates both a stock’s total return and its weighting in the Fund.
| * | Not held at December 31, 2019. |
| | | | |
Deutsche DWS Variable Series II — DWS Global Equity VIP | | | | | 5 |
| | |
| Portfolio Summary | | (Unaudited) |
| | | | | | | | |
| Asset Allocation (As a % of Investment Portfolio excluding Securities Lending Collateral) | | 12/31/19 | | | 12/31/18 | |
| Common Stocks | | | 99% | | | | 99% | |
| Cash Equivalent | | | 1% | | | | 1% | |
| | | | 100% | | | | 100% | |
| | |
Sector Diversification (As a % of Investment Portfolio excluding Cash Equivalent and Securities
Lending Collateral) | | 12/31/19 | | | 12/31/18 | |
| Information Technology | | | 21% | | | | 18% | |
| Financials | | | 20% | | | | 20% | |
| Health Care | | | 15% | | | | 15% | |
| Consumer Discretionary | | | 11% | | | | 11% | |
| Industrials | | | 10% | | | | 11% | |
| Communication Services | | | 8% | | | | 9% | |
| Consumer Staples | | | 7% | | | | 8% | |
| Materials | | | 4% | | | | 4% | |
| Energy | | | 3% | | | | 3% | |
| Real Estate | | | 1% | | | | 1% | |
| | | | 100% | | | | 100% | |
| | |
Geographical Diversification (As a % of Investment Portfolio excluding Cash Equivalent and
Securities Lending Collateral) | | 12/31/19 | | | 12/31/18 | |
| United States | | | 52% | | | | 51% | |
| Germany | | | 9% | | | | 10% | |
| China | | | 7% | | | | 7% | |
| Canada | | | 7% | | | | 7% | |
| Switzerland | | | 5% | | | | 4% | |
| France | | | 4% | | | | 3% | |
| Japan | | | 4% | | | | 5% | |
| United Kingdom | | | 3% | | | | 5% | |
| Ireland | | | 3% | | | | 2% | |
| Argentina | | | 2% | | | | 2% | |
| Sweden | | | 1% | | | | 2% | |
| Others | | | 3% | | | | 2% | |
| | | | 100% | | | | 100% | |
Portfolio holdings and characteristics are subject to change.
For more complete details about the Fund’s investment portfolio, see page 7.
Following the Fund’s fiscal first and thirdquarter-end, a complete portfolio holdings listing is filed with the SEC on Form N-PORT. The Fund’s Form N-PORT will be available on the SEC’s Web site at sec.gov. The Fund’s portfolio holdings are also posted on dws.com from time to time. Please read the Fund’s current prospectus for more information.
| | | | | | |
| | 6 | | | | | | Deutsche DWS Variable Series II — DWS Global Equity VIP |
| | |
| Investment Portfolio | | as of December 31, 2019 |
| | | | | | | | |
| | | Shares | | | Value ($) | |
| Common Stocks 99.1% | |
| Argentina 1.9% | |
Globant SA* (Cost $274,381) | | | 5,300 | | | | 562,065 | |
|
| Brazil 0.4% | |
Pagseguro Digital Ltd. “A”* (Cost $102,067) | | | 3,000 | | | | 102,480 | |
|
| Canada 6.8% | |
| | |
Agnico Eagle Mines Ltd. | | | 4,650 | | | | 286,486 | |
| | |
Alimentation Couche-Tard, Inc. “B” | | | 10,340 | | | | 328,144 | |
| | |
Brookfield Asset Management, Inc. “A” | | | 18,200 | | | | 1,051,593 | |
| | |
Canada Goose Holdings, Inc.* (a) | | | 4,200 | | | | 152,048 | |
| | |
Toronto-Dominion Bank | | | 3,860 | | | | 216,491 | |
| | | | | | | | |
(Cost $998,712) | | | | 2,034,762 | |
|
| China 6.9% | |
| | |
Alibaba Group Holding Ltd. (ADR)* | | | 2,650 | | | | 562,065 | |
| | |
China Literature Ltd. 144A* | | | 14 | | | | 58 | |
| | |
Luckin Coffee, Inc. (ADR)* (a) | | | 2,480 | | | | 97,613 | |
| | |
Momo, Inc. (ADR) | | | 4,200 | | | | 140,700 | |
| | |
New Oriental Education & Technology Group, Inc. (ADR)* | | | 1,840 | | | | 223,100 | |
| | |
Ping An Insurance (Group) Co. of China Ltd. “H” | | | 41,500 | | | | 492,609 | |
| | |
Tencent Holdings Ltd. | | | 11,200 | | | | 539,098 | |
| | | | | | | | |
(Cost $1,390,507) | | | | 2,055,243 | |
|
| France 3.9% | |
| | |
Cie deSt-Gobain SA | | | 5,400 | | | | 221,283 | |
| | |
LVMH Moet Hennessy Louis Vuitton SE | | | 275 | | | | 128,049 | |
| | |
TOTAL SA | | | 6,060 | | | | 335,554 | |
| | |
VINCI SA | | | 4,400 | | | | 489,725 | |
| | | | | | | | |
(Cost $1,124,085) | | | | 1,174,611 | |
|
| Germany 8.6% | |
| | |
adidas AG | | | 485 | | | | 158,410 | |
| | |
Allianz SE (Registered) | | | 2,525 | | | | 618,844 | |
| | |
BASF SE | | | 2,930 | | | | 222,238 | |
| | |
Deutsche Boerse AG | | | 3,650 | | | | 575,480 | |
| | |
Evonik Industries AG | | | 7,800 | | | | 239,985 | |
| | |
Fresenius Medical Care AG & Co. KGaA | | | 6,107 | | | | 453,453 | |
| | |
Siemens AG (Registered) | | | 2,400 | | | | 314,494 | |
| | | | | | | | |
(Cost $2,168,450) | | | | 2,582,904 | |
|
| Ireland 2.9% | |
| | |
Experian PLC | | | 12,350 | | | | 417,602 | |
| | |
Kerry Group PLC “A” (b) | | | 49 | | | | 6,048 | |
| | |
Kerry Group PLC “A” (b) | | | 3,451 | | | | 430,289 | |
| | | | | | | | |
(Cost $514,472) | | | | 853,939 | |
|
| Japan 3.6% | |
| | |
Kao Corp. | | | 2,800 | | | | 231,124 | |
| | |
Keyence Corp. | | | 1,200 | | | | 422,498 | |
| | |
SMC Corp. | | | 900 | | | | 410,655 | |
| | | | | | | | |
(Cost $876,459) | | | | 1,064,277 | |
| | | | | | | | |
| | | Shares | | | Value ($) | |
|
| Luxembourg 0.7% | |
Eurofins Scientific SE (a) (Cost $84,118) | | | 390 | | | | 216,301 | |
|
| Malaysia 0.6% | |
IHH Healthcare Bhd. (Cost $177,866) | | | 136,600 | | | | 182,699 | |
|
| Norway 0.6% | |
Mowi ASA (Cost $82,231) | | | 7,200 | | | | 186,918 | |
|
| Singapore 1.0% | |
DBS Group Holdings Ltd. (Cost $279,300) | | | 15,200 | | | | 292,744 | |
|
| Sweden 1.3% | |
| | |
Assa Abloy AB “B” | | | 6,700 | | | | 156,592 | |
| | |
Spotify Technology SA* (c) | | | 1,445 | | | | 216,100 | |
| | | | | | | | |
(Cost $343,591) | | | | 372,692 | |
|
| Switzerland 4.4% | |
| | |
Lonza Group AG (Registered)* | | | 2,200 | | | | 802,772 | |
| | |
Nestle SA (Registered) | | | 4,834 | | | | 523,297 | |
| | | | | | | | |
(Cost $476,148) | | | | 1,326,069 | |
|
| United Kingdom 3.4% | |
| | |
Aon PLC (c) | | | 1,500 | | | | 312,435 | |
| | |
Compass Group PLC | | | 8,360 | | | | 209,763 | |
| | |
Halma PLC | | | 8,200 | | | | 231,143 | |
| | |
Spirax-Sarco Engineering PLC | | | 2,300 | | | | 270,949 | |
| | | | | | | | |
(Cost $464,520) | | | | 1,024,290 | |
|
| United States 52.1% | |
| | |
3M Co. | | | 850 | | | | 149,957 | |
| | |
Activision Blizzard, Inc. | | | 7,600 | | | | 451,592 | |
| | |
Alphabet, Inc. “A”* | | | 450 | | | | 602,726 | |
| | |
American Express Co. | | | 3,040 | | | | 378,450 | |
| | |
AMETEK, Inc. | | | 4,445 | | | | 443,344 | |
| | |
Amphenol Corp. “A” | | | 6,000 | | | | 649,380 | |
| | |
Apple, Inc. | | | 1,155 | | | | 339,166 | |
| | |
Applied Materials, Inc. | | | 5,750 | | | | 350,980 | |
| | |
Becton, Dickinson & Co. | | | 2,820 | | | | 766,955 | |
| | |
Boeing Co. | | | 590 | | | | 192,198 | |
| | |
CBRE Group, Inc. “A”* | | | 4,500 | | | | 275,805 | |
| | |
Danaher Corp. | | | 6,000 | | | | 920,880 | |
| | |
DexCom, Inc.* | | | 760 | | | | 166,242 | |
| | |
Ecolab, Inc. | | | 2,060 | | | | 397,559 | |
| | |
EOG Resources., Inc. | | | 3,800 | | | | 318,288 | |
| | |
EPAM Systems, Inc.* | | | 2,460 | | | | 521,914 | |
| | |
Eventbrite, Inc. “A”* | | | 4,675 | | | | 94,295 | |
| | |
Evolent Health, Inc. “A”* | | | 17,000 | | | | 153,850 | |
| | |
Fiserv, Inc.* | | | 4,200 | | | | 485,646 | |
| | |
Intuit, Inc. | | | 1,600 | | | | 419,088 | |
| | |
JPMorgan Chase & Co. | | | 5,300 | | | | 738,820 | |
| | |
Las Vegas Sands Corp. | | | 2,460 | | | | 169,838 | |
| | |
MasterCard, Inc. “A” | | | 2,950 | | | | 880,841 | |
| | |
McDonald’s Corp. | | | 2,285 | | | | 451,539 | |
| | |
Microsoft Corp. | | | 4,620 | | | | 728,574 | |
| | |
Mondelez International, Inc. “A” | | | 6,590 | | | | 362,977 | |
| | |
NVIDIA Corp. | | | 1,130 | | | | 265,889 | |
| | |
Progressive Corp. | | | 15,200 | | | | 1,100,328 | |
| | |
Schlumberger Ltd. | | | 3,960 | | | | 159,192 | |
The accompanying notes are an integral part of the financial statements.
| | | | |
Deutsche DWS Variable Series II — DWS Global Equity VIP | | | | | 7 |
| | | | | | | | |
| | | Shares | | | Value ($) | |
| | |
ServiceMaster Global Holdings, Inc.* | | | 9,400 | | | | 363,404 | |
| | |
ServiceNow, Inc.* | | | 1,530 | | | | 431,950 | |
| | |
SmileDirectClub, Inc.* (a) | | | 9,484 | | | | 82,890 | |
| | |
T-Mobile U.S., Inc.* | | | 4,300 | | | | 337,206 | |
| | |
TJX Companies, Inc. | | | 5,491 | | | | 335,280 | |
| | |
YETI Holdings, Inc.* (a) | | | 12,000 | | | | 417,360 | |
| | |
Zoetis, Inc. | | | 5,140 | | | | 680,279 | |
| | | | | | | | |
(Cost $9,103,863) | | | | 15,584,682 | |
Total Common Stocks (Cost $18,460,770) | | | | 29,616,676 | |
|
| Securities Lending Collateral 2.8% | |
DWS Government & Agency Securities Portfolio “DWS Government Cash Institutional Shares”, 1.50% (d) (e) (Cost $836,078) | | | 836,078 | | | | 836,078 | |
| | | | | | | | |
| | | Shares | | | Value ($) | |
| Cash Equivalents 1.2% | |
DWS Central Cash Management Government Fund, 1.62% (d) (Cost $364,206) | | | 364,206 | | | | 364,206 | |
| | |
| | | % of Net
Assets | | | Value ($) | |
Total Investment Portfolio
(Cost $19,661,054) | | | 103.1 | | | | 30,816,960 | |
| Other Assets and Liabilities, Net | | | (3.1 | ) | | | (915,623 | ) |
| Net Assets | | | 100.0 | | | | 29,901,337 | |
A summary of the Fund’s transactions with affiliated investments during the year ended December 31, 2019 are as follows:
| | | | | | | | | | | | | | | | | | | | | | | | | | | | | | | | |
Value ($) at
12/31/2018 | | Purchases
Cost ($) | | | Sales
Proceeds ($) | | | Net
Realized
Gain/
(Loss) ($) | | | Net Change in
Unrealized
Appreciation
(Depreciation) ($) | | | Income ($) | | | Capital Gain
Distributions ($) | | | Number
of Shares
at
12/31/2019 | | | Value ($)
at
12/31/2019 | |
Securities Lending Collateral 2.8% | |
DWS Government & Agency Securities Portfolio “DWS Government Cash Institutional Shares”, 1.50% (d) (e) | |
| 111,625 | | | 724,453 | (f) | | | — | | | | — | | | | — | | | | 37,844 | | | | — | | | | 836,078 | | | | 836,078 | |
Cash Equivalents 1.2% | |
DWS Central Cash Management Government Fund, 1.62% (d) | |
| 238,530 | | | 5,659,501 | | | | 5,533,825 | | | | — | | | | — | | | | 6,061 | | | | — | | | | 364,206 | | | | 364,206 | |
| 350,155 | | | 6,383,954 | | | | 5,533,825 | | | | — | | | | — | | | | 43,905 | | | | — | | | | 1,200,284 | | | | 1,200,284 | |
| * | Non-income producing security. |
| (a) | All or a portion of these securities were on loan. In addition, “Other Assets and Liabilities, Net” may include pending sales that are also on loan. The value of securities loaned at December 31, 2019 amounted to $818,832, which is 2.7% of net assets. |
| (b) | Securities with the same description are the same corporate entity but trade on different stock exchanges. |
| (c) | Listed on the New York Stock Exchange. |
| (d) | Affiliated fund managed by DWS Investment Management Americas, Inc. The rate shown is the annualizedseven-day yield at period end. |
| (e) | Represents cash collateral held in connection with securities lending. Income earned by the Fund is net of borrower rebates. |
| (f) | Represents the net increase (purchase cost) or decrease (sales proceeds) in the amount invested in cash collateral for the year ended December 31, 2019. |
144A: Security exempt from registration under Rule 144A of the Securities Act of 1933. These securities may be resold in transactions exempt from registration, normally to qualified institutional buyers.
ADR: American Depositary Receipt
The accompanying notes are an integral part of the financial statements.
| | | | | | |
| | 8 | | | | | | Deutsche DWS Variable Series II — DWS Global Equity VIP |
Fair Value Measurements
Various inputs are used in determining the value of the Fund’s investments. These inputs are summarized in three broad levels. Level 1 includes quoted prices in active markets for identical securities. Level 2 includes other significant observable inputs (including quoted prices for similar securities, interest rates, prepayment speeds and credit risk). Level 3 includes significant unobservable inputs (including the Fund’s own assumptions in determining the fair value of investments). The level assigned to the securities valuations may not be an indication of the risk or liquidity associated with investing in those securities.
The following is a summary of the inputs used as of December 31, 2019 in valuing the Fund’s investments. For information on the Fund’s policy regarding the valuation of investments, please refer to the Security Valuation section of Note A in the accompanying Notes to Financial Statements.
| | | | | | | | | | | | | | | | |
| Assets | | Level 1 | | | Level 2 | | | Level 3 | | | Total | |
| Common Stocks | | | | | | | | | | | | | | | | |
Argentina | | $ | 562,065 | | | $ | — | | | $ | — | | | $ | 562,065 | |
Brazil | | | 102,480 | | | | — | | | | — | | | | 102,480 | |
Canada | | | 2,034,762 | | | | — | | | | — | | | | 2,034,762 | |
China | | | 1,023,478 | | | | 1,031,765 | | | | — | | | | 2,055,243 | |
France | | | — | | | | 1,174,611 | | | | — | | | | 1,174,611 | |
Germany | | | — | | | | 2,582,904 | | | | — | | | | 2,582,904 | |
Ireland | | | — | | | | 853,939 | | | | — | | | | 853,939 | |
Japan | | | — | | | | 1,064,277 | | | | — | | | | 1,064,277 | |
Luxembourg | | | — | | | | 216,301 | | | | — | | | | 216,301 | |
Malaysia | | | — | | | | 182,699 | | | | — | | | | 182,699 | |
Norway | | | — | | | | 186,918 | | | | — | | | | 186,918 | |
Singapore | | | — | | | | 292,744 | | | | — | | | | 292,744 | |
Sweden | | | 216,100 | | | | 156,592 | | | | — | | | | 372,692 | |
Switzerland | | | — | | | | 1,326,069 | | | | — | | | | 1,326,069 | |
United Kingdom | | | 312,435 | | | | 711,855 | | | | — | | | | 1,024,290 | |
United States | | | 15,584,682 | | | | — | | | | — | | | | 15,584,682 | |
Short-Term Investments (g) | | | 1,200,284 | | | | — | | | | — | | | | 1,200,284 | |
Total | | $
| 21,036,286
|
| | $
| 9,780,674
|
| | $ | — | | | $ | 30,816,960 | |
| (g) | See Investment Portfolio for additional detailed categorizations. |
The accompanying notes are an integral part of the financial statements.
| | | | |
Deutsche DWS Variable Series II — DWS Global Equity VIP | | | | | 9 |
| | | | |
Statement of
Assets and Liabilities | |
| as of December 31, 2019 | | | | |
| |
| Assets | | | | |
| Investments innon-affiliated securities, at value (cost $18,460,770) — including $818,832 of securities loaned | | $ | 29,616,676 | |
| Investment in DWS Government & Agency Securities Portfolio (cost $836,078)* | | | 836,078 | |
| Investment in DWS Central Cash Management Government Fund (cost $364,206) | | | 364,206 | |
| Foreign currency, at value (cost $81,880) | | | 81,354 | |
| Receivable for investments sold | | | 174,925 | |
| Dividends receivable | | | 11,984 | |
| Interest receivable | | | 873 | |
| Foreign taxes recoverable | | | 26,189 | |
| Other assets | | | 804 | |
| Total assets | | | 31,113,089 | |
| |
| Liabilities | | | | |
| Payable upon return of securities loaned | | | 836,078 | |
Payable for investments purchased | | | 240,942 | |
Payable for Fund shares redeemed | | | 45,052 | |
| Accrued Trustees’ fees | | | 875 | |
| Other accrued expenses and payables | | | 88,805 | |
| Total liabilities | | | 1,211,752 | |
| Net assets, at value | | $ | 29,901,337 | |
| |
| Net Assets Consist of | | | | |
| Distributable earnings (loss) | | | 12,247,374 | |
| Paid-in capital | | | 17,653,963 | |
| Net assets, at value | | $ | 29,901,337 | |
| |
| Net Asset Value | | | | |
Class A | | | | |
| |
| Net asset value, offering and redemption price per share ($29,901,337 ÷ 2,310,277 outstanding shares of beneficial interest, no par value, unlimited number of shares authorized) | | $ | 12.94 | |
| * | Represents collateral on securities loaned. |
| | | | |
Statement of Operations | |
| for the year ended December 31, 2019 | |
| |
| Investment Income | | | | |
| Income: | | | | |
Dividends (net of foreign taxes withheld of $29,066) | | $ | 403,860 | |
| Income distributions — DWS Central Cash Management Government Fund | | | 6,061 | |
| Securities lending income, net of borrower rebates | | | 37,844 | |
| Total income | | | 447,765 | |
| Expenses: | | | | |
| Management fee | | | 185,282 | |
| Administration fee | | | 28,505 | |
| Services to shareholders | | | 230 | |
| Custodian fee | | | 17,673 | |
| Professional fees | | | 75,133 | |
| Reports to shareholders | | | 28,736 | |
| Trustees’ fees and expenses | | | 3,382 | |
| Other | | | 9,276 | |
| Total expenses before expense reductions | | | 348,217 | |
| Expense reductions | | | (98,174 | ) |
| Total expenses after expense reductions | | | 250,043 | |
| Net investment income | | | 197,722 | |
| |
| Realized and Unrealized Gain (Loss) | | | | |
| Net realized gain (loss) from: | | | | |
| Investments | | | 988,479 | |
| Foreign currency | | | (1,323 | ) |
| | | | 987,156 | |
| Change in net unrealized appreciation (depreciation) on: | | | | |
| Investments | | | 7,406,735 | |
| Foreign currency | | | 5,167 | |
| | | | 7,411,902 | |
| Net gain (loss) | | | 8,399,058 | |
| Net increase (decrease) in net assets resulting from operations | | $ | 8,596,780 | |
The accompanying notes are an integral part of the financial statements.
| | | | | | |
| | 10 | | | | | | Deutsche DWS Variable Series II — DWS Global Equity VIP |
| | | | |
| Statements of Changes in Net Assets | | | | |
| | | | | | | | |
| | | Years Ended December 31, | |
| Increase (Decrease) in Net Assets | | 2019 | | | 2018 | |
| Operations: | | | | | | | | |
| Net investment income (loss) | | $ | 197,722 | | | $ | 149,728 | |
| Net realized gain (loss) | | | 987,156 | | | | 2,189,088 | |
| Change in net unrealized appreciation (depreciation) | | | 7,411,902 | | | | (5,431,199 | ) |
| Net increase (decrease) in net assets resulting from operations | | | 8,596,780 | | | | (3,092,383 | ) |
| Distributions to shareholders: | | | | | | | | |
Class A | | | (2,329,682 | ) | | | (219,217 | ) |
| Fund share transactions: | | | | | | | | |
Class A | | | | | | | | |
| Proceeds from shares sold | | | 1,084,314 | | | | 730,055 | |
| Reinvestment of distributions | | | 2,329,682 | | | | 219,217 | |
| Payments for shares redeemed | | | (4,708,430 | ) | | | (3,317,394 | ) |
| Net increase (decrease) in net assets from Class A share transactions | | | (1,294,434 | ) | | | (2,368,122 | ) |
| Increase (decrease) in net assets | | | 4,972,664 | | | | (5,679,722 | ) |
| Net assets at beginning of period | | | 24,928,673 | | | | 30,608,395 | |
| | |
| Net assets at end of period | | | 29,901,337 | | | | 24,928,673 | |
| | |
| Other Information | | | | | | | | |
Class A | | | | | | | | |
| Shares outstanding at beginning of period | | | 2,415,204 | | | | 2,616,821 | |
| Shares sold | | | 87,985 | | | | 62,443 | |
| Shares issued to shareholders in reinvestment of distributions | | | 200,144 | | | | 19,281 | |
| Shares redeemed | | | (393,056 | ) | | | (283,341 | ) |
| Net increase (decrease) in Class A shares | | | (104,927 | ) | | | (201,617 | ) |
| | |
| Shares outstanding at end of period | | | 2,310,277 | | | | 2,415,204 | |
The accompanying notes are an integral part of the financial statements.
| | | | |
Deutsche DWS Variable Series II — DWS Global Equity VIP | | | | | 11 |
| | | | | | | | | | | | | | | | | | | | |
| | | Years Ended December 31, | |
| Class A | | 2019 | | | 2018 | | | 2017 | | | 2016 | | | 2015 | |
| | | | | |
| Selected Per Share Data | | | | | | | | | | | | | | | | | | | | |
| Net asset value, beginning of period | | $ | 10.32 | | | $ | 11.70 | | | $ | 9.48 | | | $ | 9.00 | | | $ | 9.21 | |
| Income (loss) from investment operations: | | | | | | | | | | | | | | | | | | | | |
| | | | | |
Net investment incomea | | | .08 | | | | .06 | | | | .05 | | | | .04 | | | | .05 | |
Net realized and unrealized gain (loss) | | | 3.55 | | | | (1.35 | ) | | | 2.22 | | | | .51 | | | | (.21 | ) |
Total from investment operations | | | 3.63 | | | | (1.29 | ) | | | 2.27 | | | | .55 | | | | (.16 | ) |
| Less distributions from: | | | | | | | | | | | | | | | | | | | | |
| | | | | |
Net investment income | | | (.06 | ) | | | (.09 | ) | | | (.05 | ) | | | (.07 | ) | | | (.05 | ) |
Net realized gains | | | (.95 | ) | | | — | | | | — | | | | — | | | | — | |
Total distributions | | | (1.01 | ) | | | (.09 | ) | | | (.05 | ) | | | (.07 | ) | | | (.05 | ) |
| Net asset value, end of period | | $ | 12.94 | | | $ | 10.32 | | | $ | 11.70 | | | $ | 9.48 | | | $ | 9.00 | |
| Total Return (%)b | | | 36.26 | | | | (11.12 | ) | | | 24.04 | | | | 6.11 | c | | | (1.75 | ) |
| | | | | |
| Ratios to Average Net Assets and Supplemental Data | | | | | | | | | | | | | | | | | | | | |
| Net assets, end of period ($ millions) | | | 30 | | | | 25 | | | | 31 | | | | 43 | | | | 49 | |
| Ratio of expenses before expense reductions (%)d | | | 1.22 | | | | 1.22 | | | | 1.06 | | | | 1.03 | | | | 1.00 | |
| Ratio of expenses after expense reductions (%)d | | | .88 | | | | .92 | | | | .95 | | | | .95 | | | | .91 | |
| Ratio of net investment income (%) | | | .69 | | | | .51 | | | | .49 | | | | .49 | | | | .58 | |
| Portfolio turnover rate (%) | | | 12 | | | | 43 | | | | 19 | | | | 46 | | | | 79 | |
| a | Based on average shares outstanding during the period. |
| b | Total return would have been lower had certain expenses not been reimbursed. |
| c | Includes a reimbursement by the Advisor for a realized loss on a trade executed incorrectly, which otherwise would have reduced total return by 0.31%. |
| d | Expense ratio does not reflect charges and fees associated with the separate account that invests in the Fund or any variable life insurance policy or variable annuity contract for which the Fund is an investment option. |
The accompanying notes are an integral part of the financial statements.
| | | | | | |
| | 12 | | | | | | Deutsche DWS Variable Series II — DWS Global Equity VIP |
| | |
| Notes to Financial Statements | | |
A. Organization and Significant Accounting Policies
DWS Global Equity VIP (the “Fund”) is a diversified series of Deutsche DWS Variable Series II (the “Trust”), which is registered under the Investment Company Act of 1940, as amended (the “1940 Act”), as anopen-end management investment company organized as a Massachusetts business trust.
The Fund’s financial statements are prepared in accordance with accounting principles generally accepted in the United States of America (“U.S. GAAP”) which require the use of management estimates. Actual results could differ from those estimates. The Fund qualifies as an investment company under Topic 946 of Accounting Standards Codification of U.S. GAAP. The policies described below are followed consistently by the Fund in the preparation of its financial statements.
Security Valuation. Investments are stated at value determined as of the close of regular trading on the New York Stock Exchange on each day the exchange is open for trading.
Various inputs are used in determining the value of the Fund’s investments. These inputs are summarized in three broad levels. Level 1 includes quoted prices in active markets for identical securities. Level 2 includes other significant observable inputs (including quoted prices for similar securities, interest rates, prepayment speeds and credit risk). Level 3 includes significant unobservable inputs (including the Fund’s own assumptions in determining the fair value of investments). The level assigned to the securities valuations may not be an indication of the risk or liquidity associated with investing in those securities.
Equity securities are valued at the most recent sale price or official closing price reported on the exchange (U.S. or foreign) orover-the-counter market on which they trade. Securities for which no sales are reported are valued at the calculated mean between the most recent bid and asked quotations on the relevant market or, if a mean cannot be determined, at the most recent bid quotation. Equity securities are generally categorized as Level 1. For certain international equity securities, in order to adjust for events which may occur between the close of the foreign exchanges and the close of the New York Stock Exchange, a fair valuation model may be used. This fair valuation model takes into account comparisons to the valuation of American Depository Receipts (ADRs), futures contracts and certain indices and these securities are categorized as Level 2.
Investments inopen-end investment companies are valued at their net asset value each business day and are categorized as Level 1.
Securities and other assets for which market quotations are not readily available or for which the above valuation procedures are deemed not to reflect fair value are valued in a manner that is intended to reflect their fair value as determined in accordance with procedures approved by the Board and are generally categorized as Level 3. In accordance with the Fund’s valuation procedures, factors considered in determining value may include, but are not limited to, the type of the security; the size of the holding; the initial cost of the security; the existence of any contractual restrictions on the security’s disposition; the price and extent of public trading in similar securities of the issuer or of comparable companies; quotations or evaluated prices frombroker-dealers and/or pricing services; information obtained from the issuer, analysts, and/or the appropriate stock exchange (forexchange-traded securities); an analysis of the company’s or issuer’s financial statements; an evaluation of the forces that influence the issuer and the market(s) in which the security is purchased and sold; and with respect to debt securities, the maturity, coupon, creditworthiness, currency denomination and the movement of the market in which the security is normally traded. The value determined under these procedures may differ from published values for the same securities.
Disclosure about the classification of fair value measurements is included in a table following the Fund’s Investment Portfolio.
Securities Lending. Deutsche Bank AG, as lending agent, lends securities of the Fund to certain financial institutions under the terms of its securities lending agreement. During the term of the loans, the Fund continues to receive interest and dividends generated by the securities and to participate in any changes in their market value. The Fund requires the borrowers of the securities to maintain collateral with the Fund consisting of either cash or liquid, unencumbered assets having a value at least equal to the value of the securities loaned. When the collateral falls below specified amounts, the lending agent will use its best effort to obtain additional collateral on the next business day to meet required amounts under the securities lending agreement. As of period end, any securities on loan were collateralized by cash. During the year ended December 31, 2019, the Fund invested the cash collateral into a joint trading account in DWS Government &
| | | | |
Deutsche DWS Variable Series II — DWS Global Equity VIP | | | | | 13 |
Agency Securities Portfolio, an affiliated money market fund managed by DWS Investment Management Americas, Inc. DWS Investment Management Americas, Inc. receives a management/administration fee (0.12% annualized effective rate as of December 31, 2019) on the cash collateral invested in DWS Government & Agency Securities Portfolio. The Fund receives compensation for lending its securities either in the form of fees or by earning interest on invested cash collateral net of borrower rebates and fees paid to a lending agent. Either the Fund or the borrower may terminate the loan at any time, and the borrower, after notice, is required to return borrowed securities within a standard time period. There may be risks of delay and costs in recovery of securities or even loss of rights in the collateral should the borrower of the securities fail financially. If the Fund is not able to recover securities lent, the Fund may sell the collateral and purchase a replacement investment in the market, incurring the risk that the value of the replacement security is greater than the value of the collateral. The Fund is also subject to all investment risks associated with the reinvestment of any cash collateral received, including, but not limited to, interest rate, credit and liquidity risk associated with such investments.
As of December 31, 2019, the Fund had securities on loan, which were classified as common stocks in the Investment Portfolio. The value of the related collateral exceeded the value of the securities loaned at period end. As of period end, the remaining contractual maturity of the collateral agreements were overnight and continuous.
Foreign Currency Translations. The books and records of the Fund are maintained in U.S. dollars. Investment securities and other assets and liabilities denominated in a foreign currency are translated into U.S. dollars at the prevailing exchange rates at period end. Purchases and sales of investment securities, income and expenses are translated into U.S. dollars at the prevailing exchange rates on the respective dates of the transactions.
Net realized and unrealized gains and losses on foreign currency transactions represent net gains and losses between trade and settlement dates on securities transactions, the acquisition and disposition of foreign currencies, and the difference between the amount of net investment income accrued and the U.S. dollar amount actually received. The portion of both realized and unrealized gains and losses on investments that results from fluctuations in foreign currency exchange rates is not separately disclosed but is included with net realized and unrealized gain/appreciation and loss/depreciation on investments.
Taxes. The Fund’s policy is to comply with the requirements of the Internal Revenue Code, as amended, which are applicable to regulated investment companies, and to distribute all of its taxable income to its shareholders.
Additionally, the Fund may be subject to taxes imposed by the governments of countries in which it invests and are generally based on income and/or capital gains earned or repatriated, a portion of which may be recoverable. Based upon the current interpretation of the tax rules and regulations, estimated tax liabilities and recoveries on certain foreign securities are recorded on an accrual basis and are reflected as components of interest income or net change in unrealized gain/loss on investments. Tax liabilities realized as a result of security sales are reflected as a component of net realized gain/loss on investments.
The Fund has reviewed the tax positions for the open tax years as of December 31, 2019 and has determined that no provision for income tax and/or uncertain tax positions is required in the Fund’s financial statements. The Fund’s federal tax returns for the prior three fiscal years remain open subject to examination by the Internal Revenue Service.
Distribution of Income and Gains. Distributions from net investment income of the Fund, if any, are declared and distributed to shareholders annually. Net realized gains from investment transactions, in excess of available capital loss carryforwards, would be taxable to the Fund if not distributed and, therefore, will be distributed to shareholders at least annually. The Fund may also make additional distributions for tax purposes if necessary.
The timing and characterization of certain income and capital gain distributions are determined annually in accordance with federal tax regulations which may differ from accounting principles generally accepted in the United States of America. These differences primarily relate to investments in foreign denominated investments and certain securities sold at a loss. As a result, net investment income (loss) and net realized gain (loss) on investment transactions for a reporting period may differ significantly from distributions during such period. Accordingly, the Fund may periodically make reclassifications among certain of its capital accounts without impacting the net asset value of the Fund.
| | | | | | |
| | 14 | | | | | | Deutsche DWS Variable Series II — DWS Global Equity VIP |
At December 31, 2019, the Fund’s components of distributable earnings on a tax basis were as follows:
| | | | |
| Undistributed ordinary income* | | $ | 468,101 | |
| Undistributed long-term capital gains | | $ | 682,875 | |
| Net unrealized appreciation (depreciation) on investments | | $ | 11,097,195 | |
At December 31, 2019, the aggregate cost of investments for federal income tax purposes was $19,719,765. The net unrealized appreciation for all investments based on tax cost was $11,097,195. This consisted of aggregate gross unrealized appreciation for all investments in which there was an excess of value over tax cost of $11,707,039 and aggregate gross unrealized depreciation for all investments in which there was an excess of tax cost over value of $609,844.
In addition, the tax character of distributions paid by the Fund is summarized as follows:
| | | | | | | | |
| | | Years Ended December 31, | |
| | | 2019 | | | 2018 | |
| Distributions from ordinary income* | | $ | 144,985 | | | $ | 219,217 | |
| Distributions from long-term capital gains | | $ | 2,184,697 | | | $ | — | |
| * | For tax purposes, short-term capital gain distributions are considered ordinary income distributions. |
Expenses. Expenses of the Trust arising in connection with a specific fund are allocated to that fund. Other Trust expenses which cannot be directly attributed to a fund are apportioned among the funds in the Trust based upon the relative net assets or other appropriate measures.
Contingencies. In the normal course of business, the Fund may enter into contracts with service providers that contain general indemnification clauses. The Fund’s maximum exposure under these arrangements is unknown, as this would involve future claims that may be made against the Fund that have not yet been made. However, based on experience, the Fund expects the risk of loss to be remote.
Other. Investment transactions are accounted for on a trade date plus one basis for daily net asset value calculations. However, for financial reporting purposes, investment transactions are reported on trade date. Interest income is recorded on the accrual basis. Dividend income is recorded on theex-dividend date net of foreign withholding taxes. Certain dividends from foreign securities may be recorded subsequent to theex-dividend date as soon as the Fund is informed of such dividends. Realized gains and losses from investment transactions are recorded on an identified cost basis. Proceeds from litigation payments, if any, are included in net realized gain (loss) from investments.
B. Purchases and Sales of Securities
During the year ended December 31, 2019, purchases and sales of investment transactions (excludingshort-term investments) aggregated $3,317,739 and $6,688,990, respectively.
C. Related Parties
Management Agreement. Under the Investment Management Agreement with DWS Investment Management Americas, Inc. (“DIMA” or the “Advisor”), an indirect, wholly owned subsidiary of DWS Group GmbH & Co. KGaA (“DWS Group”), the Advisor directs the investments of the Fund in accordance with its investment objectives, policies and restrictions. The Advisor determines the securities, instruments and other contracts relating to investments to be purchased, sold or entered into by the Fund.
Pursuant to the Investment Management Agreement with the Advisor, the Fund pays a monthly management fee based on the Fund’s average daily net assets, computed and accrued daily and payable monthly, at the following annual rates:
| | | | |
| First $1.5 billion | | | .650 | % |
| Next $1.75 billion | | | .635 | % |
| Next $1.75 billion | | | .620 | % |
| Over $5 billion | | | .605 | % |
Accordingly, for the year ended December 31, 2019, the fee pursuant to the Investment Management Agreement was equivalent to an annual rate (exclusive of any applicable waivers/reimbursements) of 0.65% of the Fund’s average daily net assets.
| | | | |
Deutsche DWS Variable Series II — DWS Global Equity VIP | | | | | 15 |
For the period from January 1, 2019 through September 30, 2019, the Advisor had contractually agreed to waive its fee and/or reimburse certain operating expenses to the extent necessary to maintain the total annual operating expenses (excluding certain expenses such as extraordinary expenses, taxes, brokerage and interest expense) of Class A shares at 0.89%.
Effective from October 1, 2019 through September 30, 2020, the Advisor has contractually agreed to waive its fee and/or reimburse certain operating expenses to the extent necessary to maintain the total annual operating expenses (excluding certain expenses such as extraordinary expenses, taxes, brokerage and interest expense) of Class A shares at 0.84%.
For the year ended December 31, 2019, fees waived and/or expenses reimbursed were $98,174.
Administration Fee. Pursuant to an Administrative Services Agreement, DIMA provides most administrative services to the Fund. For all services provided under the Administrative Services Agreement, the Fund pays DIMA an annual fee (“Administration Fee”) of 0.10% of the Fund’s average daily net assets, computed and accrued daily and payable monthly. For the year ended December 31, 2019 the Administration Fee was $28,505, of which $2,506 is unpaid.
Service Provider Fees. DWS Service Company (“DSC”), an affiliate of the Advisor, is the transfer agent,dividend-paying agent and shareholder service agent for the Fund. Pursuant to asub-transfer agency agreement between DSC and DST Systems, Inc. (“DST”), DSC has delegated certain transfer agent,dividend-paying agent and shareholder service agent functions to DST. DSC compensates DST out of the shareholder servicing fee it receives from the Fund. For the year ended December 31, 2019, the amounts charged to the Fund by DSC aggregated $81, of which $13 is unpaid.
Typesetting and Filing Service Fees. Under an agreement with the Fund, DIMA is compensated for providing certainpre-press and regulatory filing services to the Fund. For the year ended December 31, 2019, the amount charged to the Fund by DIMA included in the Statement of Operations under “Reports to shareholders” aggregated $9,090, of which $3,141 is unpaid.
Trustees’ Fees and Expenses. The Fund paid retainer fees to each Trustee not affiliated with the Advisor, plus specified amounts to the Board Chairperson and to each committee Chairperson.
Affiliated Cash Management Vehicles. The Fund may invest uninvested cash balances in DWS Central Cash Management Government Fund and DWS ESG Liquidity Fund, affiliated money market funds which are managed by the Advisor. Each affiliated money market fund is managed in accordance withRule 2a-7 under the 1940 Act, which governs the quality, maturity, diversity and liquidity of instruments in which a money market fund may invest. DWS Central Cash Management Government Fund seeks to maintain a stable net asset value, and DWS ESG Liquidity Fund maintains a floating net asset value. The Fund indirectly bears its proportionate share of the expenses of each affiliated money market fund in which it invests. DWS Central Cash Management Government Fund does not pay the Advisor an investment management fee. To the extent that DWS ESG Liquidity Fund pays an investment management fee to the Advisor, the Advisor will waive an amount of the investment management fee payable to the Advisor by the Fund equal to the amount of the investment management fee payable on the Fund’s assets invested in DWS ESG Liquidity Fund.
Securities Lending Fees. Deutsche Bank AG serves as lending agent for the Fund. For the year ended December 31, 2019, the Fund incurred lending agent fees to Deutsche Bank AG in the amount of $2,860.
D. Ownership of the Fund
At December 31, 2019, one participating insurance company was owner of record of 10% or more of the total outstanding Class A shares of the Fund, owning 99%.
E. Line of Credit
The Fund and other affiliated funds (the “Participants”) share in a $400 million revolving credit facility provided by a syndication of banks. The Fund may borrow for temporary or emergency purposes, including the meeting of redemption requests that otherwise might require the untimely disposition of securities. The Participants are charged an annual commitment fee, which is allocated based on net assets, among each of the Participants. Interest is calculated at a rate per annum equal to the sum of the Federal Funds Rate plus 1.25 percent plus if theone-month LIBOR exceeds the Federal Funds Rate, the amount of such excess. The Fund may borrow up to a maximum of 33 percent of its net assets under the agreement. The Fund had no outstanding loans at December 31, 2019.
| | | | | | |
| | 16 | | | | | | Deutsche DWS Variable Series II — DWS Global Equity VIP |
Report of Independent Registered Public Accounting Firm
To the Board of Trustees of Deutsche DWS Variable Series II and Shareholders of DWS Global Equity VIP:
Opinion on the Financial Statements
We have audited the accompanying statement of assets and liabilities of DWS Global Equity VIP (the “Fund”) (one of the funds constituting Deutsche DWS Variable Series II) (the “Trust”), including the investment portfolio, as of December 31, 2019, and the related statement of operations for the year then ended, the statements of changes in net assets for each of the two years in the period then ended, the financial highlights for each of the five years in the period then ended and the related notes (collectively referred to as the “financial statements”). In our opinion, the financial statements present fairly, in all material respects, the financial position of the Fund (one of the funds constituting Deutsche DWS Variable Series II) at December 31, 2019, the results of its operations for the year then ended, the changes in its net assets for each of the two years in the period then ended and its financial highlights for each of the five years in the period then ended, in conformity with U.S. generally accepted accounting principles.
Basis for Opinion
These financial statements are the responsibility of the Trust’s management. Our responsibility is to express an opinion on the Fund’s financial statements based on our audits. We are a public accounting firm registered with the Public Company Accounting Oversight Board (United States) (“PCAOB”) and are required to be independent with respect to the Trust in accordance with the U.S. federal securities laws and the applicable rules and regulations of the Securities and Exchange Commission and the PCAOB.
We conducted our audits in accordance with the standards of the PCAOB. Those standards require that we plan and perform the audit to obtain reasonable assurance about whether the financial statements are free of material misstatement, whether due to error or fraud. The Trust is not required to have, nor were we engaged to perform, an audit of the Trust’s internal control over financial reporting. As part of our audits, we are required to obtain an understanding of internal control over financial reporting, but not for the purpose of expressing an opinion on the effectiveness of the Trust’s internal control over financial reporting. Accordingly, we express no such opinion.
Our audits included performing procedures to assess the risks of material misstatement of the financial statements, whether due to error or fraud, and performing procedures that respond to those risks. Such procedures included examining, on a test basis, evidence regarding the amounts and disclosures in the financial statements. Our procedures included confirmation of securities owned as of December 31, 2019, by correspondence with the custodian and others or by other appropriate auditing procedures where replies from others were not received. Our audits also included evaluating the accounting principles used and significant estimates made by management, as well as evaluating the overall presentation of the financial statements. We believe that our audits provide a reasonable basis for our opinion.

We have served as the auditor of one or more investment companies in the DWS family of funds since at least 1979, but we are unable to determine the specific year.
Boston, Massachusetts
February 14, 2020
| | | | |
Deutsche DWS Variable Series II — DWS Global Equity VIP | | | | | 17 |
| | |
| Information About Your Fund’s Expenses | | (Unaudited) |
As an investor of the Fund, you incur two types of costs: ongoing expenses and transaction costs. Ongoing expenses include management fees and other Fund expenses. Examples of transaction costs include contract charges, which are not shown in this section. The following tables are intended to help you understand your ongoing expenses (in dollars) of investing in the Fund and to help you compare these expenses with the ongoing expenses of investing in other mutual funds. In the most recentsix-month period, the Fund limited these expenses; had it not done so, expenses would have been higher. The example in the table is based on an investment of $1,000 invested at the beginning of thesix-month period and held for the entire period (July 1, 2019 to December 31, 2019).
The tables illustrate your Fund’s expenses in two ways:
| – | | Actual Fund Return. This helps you estimate the actual dollar amount of ongoing expenses (but not transaction costs) paid on a $1,000 investment in the Fund using the Fund’s actual return during the period. To estimate the expenses you paid over the period, simply divide your account value by $1,000 (for example, an $8,600 account value divided by $1,000 = 8.6), then multiply the result by the number in the “Expenses Paid per $1,000” line under the share class you hold. |
| – | | Hypothetical 5% Fund Return. This helps you to compare your Fund’s ongoing expenses (but not transaction costs) with those of other mutual funds using the Fund’s actual expense ratio and a hypothetical rate of return of 5% per year before expenses. Examples using a 5% hypothetical Fund return may be found in the shareholder reports of other mutual funds. The hypothetical account values and expenses may not be used to estimate the actual ending account balance or expenses you paid for the period. |
Please note that the expenses shown in these tables are meant to highlight your ongoing expenses only and do not reflect any transaction costs. The “Expenses Paid per $1,000” line of the tables is useful in comparing ongoing expenses only and will not help you determine the relative total expense of owning different funds. If these transaction costs had been included, your costs would have been higher.
| | | | |
| Expenses and Value of a $1,000 Investment for the six months ended December 31, 2019 | | | |
| |
| Actual Fund Return | | | Class A | |
| Beginning Account Value 7/1/19 | | $ | 1,000.00 | |
| Ending Account Value 12/31/19 | | $ | 1,080.10 | |
| Expenses Paid per $1,000* | | $ | 4.56 | |
| |
| Hypothetical 5% Fund Return | | | Class A | �� |
| Beginning Account Value 7/1/19 | | $ | 1,000.00 | |
| Ending Account Value 12/31/19 | | $ | 1,020.82 | |
| Expenses Paid per $1,000* | | $ | 4.43 | |
| * | Expenses are equal to the Fund’s annualized expense ratio, multiplied by the average account value over the period, multiplied by 184 (the number of days in the most recentsix-month period), then divided by 365. |
| | | | |
| Annualized Expense Ratio | | Class A | |
| Deutsche DWS Variable Series II — DWS Global Equity VIP | | | .87 | % |
For more information, please refer to the Fund’s prospectus.
These tables do not reflect charges and fees (“contract charges”) associated with the separate account that invests in the Fund or any variable life insurance policy or variable annuity contract for which the Fund is an investment option.
For an analysis of the fees associated with an investment in the Fund or similar funds, please refer to the current and hypothetical expense calculators for Variable Insurance Products which can be found at dws.com/calculators.
| | | | | | |
| | 18 | | | | | | Deutsche DWS Variable Series II — DWS Global Equity VIP |
| | |
| Tax Information | | (Unaudited) |
The Fund paid distributions of $.95 per share from net long-term capital gains during its year ended December 31, 2019.
For corporate shareholders, 100% of the ordinary dividends (i.e., income dividends plus short-term capital gains) paid during the Fund’s fiscal year ended December 31, 2019 qualified for the dividends received deduction.
Pursuant to Section 852 of the Internal Revenue Code, the Fund designates $771,000 as capital gain dividends for its year ended December 31, 2019.
Please consult a tax advisor if you have questions about federal or state income tax laws, or on how to prepare your tax returns. If you have specific questions about your account, please contact your insurance provider.
Proxy Voting
The Trust’s policies and procedures for voting proxies for portfolio securities and information about how the Trust voted proxies related to its portfolio securities during the most recent12-month period ended June 30 are available on our Web site — dws.com/en-us/resources/proxy-voting — or on the SEC’s Web site — sec.gov. To obtain a written copy of the Trust’s policies and procedures without charge, upon request, call us toll free at(800) 728-3337.
| | | | |
Deutsche DWS Variable Series II — DWS Global Equity VIP | | | | | 19 |
Advisory Agreement Board Considerations and Fee Evaluation
The Board of Trustees (hereinafter referred to as the “Board” or “Trustees”) approved the renewal of DWS Global Equity VIP’s (the “Fund”) investment management agreement (the “Agreement”) with DWS Investment Management Americas, Inc. (“DIMA”) in September 2019.
In terms of the process that the Board followed prior to approving the Agreement, shareholders should know that:
| – | | During the entire process, all of the Fund’s Trustees were independent of DIMA and its affiliates (the “Independent Trustees”). |
| – | | The Board met frequently during the past year to discuss fund matters and dedicated a substantial amount of time to contract review matters. Over the course of several months, the Board’s Contract Committee reviewed extensive materials received from DIMA, independent third parties and independent counsel. These materials included an analysis of the Fund’s performance, fees and expenses, and profitability from a fee consultant retained by the Fund’s Independent Trustees (the “Fee Consultant”). Based on its evaluation of the information provided, the Contract Committee presented its findings and recommendations to the Board. The Board then reviewed the Contract Committee’s findings and recommendations. |
| – | | The Board also received extensive information throughout the year regarding performance of the Fund. |
| – | | The Independent Trustees regularly met privately with counsel to discuss contract review and other matters. In addition, the Independent Trustees were advised by the Fee Consultant in the course of their review of the Fund’s contractual arrangements and considered a comprehensive report prepared by the Fee Consultant in connection with their deliberations. |
| – | | In connection with reviewing the Agreement, the Board also reviewed the terms of the Fund’s distribution agreement, administrative services agreement, transfer agency agreement and other material service agreements. |
In connection with the contract review process, the Contract Committee and the Board considered the factors discussed below, among others. The Board also considered that DIMA and its predecessors have managed the Fund since its inception, and the Board believes that a long-term relationship with a capable, conscientious advisor is in the best interests of the Fund. The Board considered, generally, that shareholders chose to invest or remain invested in the Fund knowing that DIMA managed the Fund. DIMA is part of DWS Group GmbH & Co. KGaA (“DWS Group”). DWS Group is a global asset management business that offers a wide range of investing expertise and resources, including research capabilities in many countries throughout the world. In 2018, approximately 20% of DWS Group’s shares were sold in an initial public offering, with Deutsche Bank AG owning the remaining shares.
As part of the contract review process, the Board carefully considered the fees and expenses of each DWS fund overseen by the Board in light of the fund’s performance. In many cases, this led to the negotiation and implementation of expense caps. As part of these negotiations, the Board indicated that it would consider relaxing these caps in future years following sustained improvements in performance, among other considerations.
While shareholders may focus primarily on fund performance and fees, the Fund’s Board considers these and many other factors, including the quality and integrity of DIMA’s personnel and administrative support services provided by DIMA, such as back-office operations, fund valuations, and compliance policies and procedures.
Nature, Quality and Extent of Services.The Board considered the terms of the Agreement, including the scope of advisory services provided under the Agreement. The Board noted that, under the Agreement, DIMA provides portfolio management services to the Fund and that, pursuant to a separate administrative services agreement, DIMA provides administrative services to the Fund. The Board considered the experience and skills of senior management and investment personnel and the resources made available to such personnel. The Board reviewed the Fund’s performance over short-term and long-term periods and compared those returns to various agreed-upon performance measures, including market index(es) and a peer universe compiled using information supplied by Morningstar Direct (“Morningstar”), an independent fund data service. The Board also noted that it has put into place a process of identifying “Funds in Review” (e.g., funds performing poorly relative to a peer universe), and receives additional reporting from DIMA regarding such funds and, where appropriate, DIMA’s plans to address underperformance. The Board
| | | | | | |
| | 20 | | | | | | Deutsche DWS Variable Series II — DWS Global Equity VIP |
believes this process is an effective manner of identifying and addressing underperforming funds. Based on the information provided, the Board noted that, for theone-,three- and five-year periods ended December 31, 2018, the Fund’s performance (Class A shares) was in the 3rd quartile of the applicable Morningstar universe (the 1st quartile being the best performers and the 4th quartile being the worst performers). The Board also observed that the Fund has underperformed its benchmark in theone-,three- and five-year periods ended December 31, 2018.
Fees and Expenses. The Board considered the Fund’s investment management fee schedule, operating expenses and total expense ratios, and comparative information provided by Broadridge Financial Solutions, Inc. (“Broadridge”) and the Fee Consultant regarding investment management fee rates paid to other investment advisors by similar funds (1st quartile being the most favorable and 4th quartile being the least favorable). With respect to management fees paid to other investment advisors by similar funds, the Board noted that the contractual fee rates paid by the Fund, which include a 0.10% fee paid to DIMA under the Fund’s administrative services agreement, were lower than the median (2nd quartile) of the applicable Broadridge peer group (based on Broadridge data provided as of December 31, 2018). The Board noted that the Fund’s Class A shares total (net) operating expenses were expected to be higher than the median (3rd quartile) of the applicable Broadridge expense universe (based on Broadridge data provided as of December 31, 2018, and analyzing Broadridge expense universe Class A (net) expenses less any applicable12b-1 fees) (“Broadridge Universe Expenses”). The Board noted that the expense limitation agreed to by DIMA was expected to help the Fund’s total (net) operating expenses remain competitive. The Board considered the Fund’s management fee rate as compared to fees charged by DIMA to comparable DWS U.S. registered funds (“DWS Funds”) and considered differences between the Fund and the comparable DWS Funds. The information requested by the Board as part of its review of fees and expenses also included information about institutional accounts (including anysub-advised funds and accounts) and funds offered primarily to European investors (“DWS Europe Funds”) managed by DWS Group. The Board noted that DIMA indicated that DWS Group does not manage any institutional accounts or DWS Europe Funds comparable to the Fund.
On the basis of the information provided, the Board concluded that management fees were reasonable and appropriate in light of the nature, quality and extent of services provided by DIMA.
Profitability. The Board reviewed detailed information regarding revenues received by DIMA under the Agreement. The Board considered the estimated costs to DIMA, andpre-tax profits realized by DIMA, from advising the DWS Funds, as well as estimates of thepre-tax profits attributable to managing the Fund in particular. The Board also received information regarding the estimated enterprise-wide profitability of DIMA and its affiliates with respect to all fund services in totality and by fund. The Board and the Fee Consultant reviewed DIMA’s methodology in allocating its costs to the management of the Fund. Based on the information provided, the Board concluded that thepre-tax profits realized by DIMA in connection with the management of the Fund were not unreasonable. The Board also reviewed certain publicly available information regarding the profitability of certain similar investment management firms. The Board noted that, while information regarding the profitability of such firms is limited (and in some cases is not necessarily prepared on a comparable basis), DIMA and its affiliates’ overall profitability with respect to the DWS Funds (after taking into account distribution and other services provided to the funds by DIMA and its affiliates) was lower than the overall profitability levels of most comparable firms for which such data was available.
Economies of Scale. The Board considered whether there are economies of scale with respect to the management of the Fund and whether the Fund benefits from any economies of scale. The Board noted that the Fund’s investment management fee schedule includes fee breakpoints. The Board concluded that the Fund’s fee schedule represents an appropriate sharing between the Fund and DIMA of such economies of scale as may exist in the management of the Fund at current asset levels.
Other Benefits to DIMA and Its Affiliates. The Board also considered the character and amount of other incidental or“fall-out” benefits received by DIMA and its affiliates, including any fees received by DIMA for administrative services provided to the Fund and any fees received by an affiliate of DIMA for transfer agency services provided to the Fund. The Board also considered benefits to DIMA related to brokerage and soft-dollar allocations, including allocating brokerage to pay for research generated by parties other than the executing broker dealers, which pertain primarily to funds investing in equity securities. In addition, the Board considered the incidental public relations benefits to DIMA related to DWS Funds advertising and cross-selling opportunities among DIMA products and services. The Board considered these benefits in reaching its conclusion that the Fund’s management fees were reasonable.
| | | | |
Deutsche DWS Variable Series II — DWS Global Equity VIP | | | | | 21 |
Compliance. The Board considered the significant attention and resources dedicated by DIMA to its compliance processes in recent years. The Board noted in particular (i) the experience, seniority and time commitment of the individuals serving as DIMA’s and the Fund’s chief compliance officers and (ii) the substantial commitment of resources by DIMA and its affiliates to compliance matters, including the retention of compliance personnel.
Based on all of the information considered and the conclusions reached, the Board determined that the continuation of the Agreement is in the best interests of the Fund. In making this determination, the Board did not give particular weight to any single factor identified above. The Board considered these factors over the course of numerous meetings, certain of which were in executive session with only the Independent Trustees and counsel present. It is possible that individual Independent Trustees may have weighed these factors differently in reaching their individual decisions to approve the continuation of the Agreement.
| | | | | | |
| | 22 | | | | | | Deutsche DWS Variable Series II — DWS Global Equity VIP |
Board Members and Officers
The following table presents certain information regarding the Board Members and Officers of the Trust/Corporation. Each Board Member’s year of birth is set forth in parentheses after his or her name. Unless otherwise noted, (i) each Board Member has engaged in the principal occupation(s) noted in the table for at least the most recent five years, although not necessarily in the same capacity; and (ii) the address of each Independent Board Member is Keith R. Fox, DWS Funds Board Chair, c/o Thomas R. Hiller, Ropes & Gray LLP, Prudential Tower, 800 Boylston Street, Boston, MA02199-3600. Except as otherwise noted below, the term of office for each Board Member is until the election and qualification of a successor, or until such Board Member sooner dies, resigns, is removed or as otherwise provided in the governing documents of the Trust/Corporation. Because the Fund does not hold an annual meeting of shareholders, each Board Member will hold office for an indeterminate period.
The Board Members may also serve in similar capacities with other funds in the fund complex. The number of funds in DWS fund complex shown in the table below includes all registered open- and closed-end funds (including all of their portfolios) advised by the Advisor and any registered funds that have an investment advisor that is an affiliated person of the Advisor.
| | | | | | | | |
| Independent Board Members | | | | | |
Name, Year of Birth,
Position with the Trust/
Corporation and
Length of Time Served1 | | Business Experience and Directorships During the Past Five Years | | Number of
Funds in
DWS Fund
Complex
Overseen | | | Other
Directorships
Held by Board
Member
|
Keith R. Fox, CFA (1954) Chairperson since 2017, and Board Member since 1996 | | Managing General Partner, Exeter Capital Partners (a series of private investment funds) (since 1986). Directorships: ICI Mutual Insurance Company; Progressive International Corporation (kitchen goods importer and distributor); former Chairman, National Association of Small Business Investment Companies; former Directorships: The Kennel Shop (retailer); BoxTop Media Inc. (advertising); Sun Capital Advisers Trust (mutual funds) (2011–2012) | | | 77 | | | — |
John W. Ballantine (1946) Board Member since 1999 | | Retired; formerly, Executive Vice President and Chief Risk Management Officer, First Chicago NBD Corporation/The First National Bank of Chicago (1996–1998); Executive Vice President and Head of International Banking (1995–1996); former Directorships: Director and Chairman of the Board, Healthways, Inc.2 (population well-being and wellness services) (2003–2014); Stockwell Capital Investments PLC (private equity); Enron Corporation; FNB Corporation; Tokheim Corporation; First Oak Brook Bancshares, Inc.; Oak Brook Bank; and Prisma Energy International. Not-for-Profit Director/Trustee: Palm Beach Civic Association; Window to the World Communications (public media); Life Director of Harris Theater for Music and Dance (Chicago); Life Director of Hubbard Street Dance Chicago; former Not-for-Profit Directorships: Public Radio International | | | 77 | | | Portland
General
Electric2
(utility
company)
(2003–
present) |
Dawn-Marie Driscoll (1946) Board Member since 1987 | | Emeritus Executive Fellow, Center for Business Ethics, Bentley University; formerly: Partner, Palmer & Dodge (law firm) (1988–1990); Vice President of Corporate Affairs and General Counsel, Filene’s (retail) (1978–1988). Directorships: Advisory Board, Center for Business Ethics, Bentley University; Trustee and former Chairman of the Board, Southwest Florida Community Foundation (charitable organization); former Directorships: ICI Mutual Insurance Company (2007–2015); Sun Capital Advisers Trust (mutual funds) (2007–2012), Investment Company Institute (audit, executive, nominating committees) and Independent Directors Council (governance, executive committees) | | | 77 | | | — |
Richard J. Herring (1946) Board Member since 1990 | | Jacob Safra Professor of International Banking and Professor of Finance, The Wharton School, University of Pennsylvania (since July 1972); Director, The Wharton Financial Institutions Center (since 1994); formerly: Vice Dean and Director, Wharton Undergraduate Division (1995–2000) and Director, The Lauder Institute of International Management Studies (2000–2006); Member FDIC Systemic Risk Advisory Committee since 2011, member Systemic Risk Council since 2012 and member of the Advisory Board at the Yale Program on Financial Stability since 2013; Formerly Co-Chair of the Shadow Financial Regulatory Committee (2003–2015), Executive Director of The Financial Economists Roundtable (2008–2015), Director of The Thai Capital Fund (2007–2013), Director of The Aberdeen Singapore Fund (2007–2018), and Nonexecutive Director of Barclays Bank DE (2010–2018) | | | 77 | | | Director,
Aberdeen
Japan Fund
(since 2007) |
| | | | |
Deutsche DWS Variable Series II — DWS Global Equity VIP | | | | | 23 |
| | | | | | | | |
Name, Year of Birth,
Position with the Trust/
Corporation and
Length of Time Served1 | | Business Experience and Directorships During the Past Five Years | | Number of
Funds in
DWS Fund
Complex
Overseen | | | Other
Directorships
Held by Board
Member
|
William McClayton (1944) Board Member since 2004 | | Private equity investor (since October 2009); previously, Managing Director, Diamond Management & Technology Consultants, Inc. (global consulting firm) (2001–2009); Directorship: Board of Managers, YMCA of Metropolitan Chicago; formerly: Senior Partner, Arthur Andersen LLP (accounting) (1966–2001); Trustee, Ravinia Festival | | | 77 | | | — |
Rebecca W. Rimel (1951) Board Member since 1995 | | President, Chief Executive Officer and Director, The Pew Charitable Trusts (charitable organization) (1994–present); formerly: Executive Vice President, The Glenmede Trust Company (investment trust and wealth management) (1983–2004); Board Member, Investor Education (charitable organization) (2004–2005); Trustee, Executive Committee, Philadelphia Chamber of Commerce (2001–2007); Director, Viasys Health Care2 (January 2007–June 2007); Trustee, Thomas Jefferson Foundation (charitable organization) (1994–2012) | | | 77 | | | Director,
Becton
Dickinson
and
Company2
(medical
technology
company)
(2012–
present);
Director,
BioTelemetry
Inc.2(health
care) (2009–
present) |
William N. Searcy, Jr. (1946) Board Member since 1993 | | Private investor since October 2003; formerly: Pension & Savings Trust Officer, Sprint Corporation2(telecommunications) (November 1989–September 2003); Trustee, Sun Capital Advisers Trust (mutual funds) (1998–2012) | | | 77 | | | — |
| | |
| Officers4 | | |
Name, Year of Birth,
Position with the Trust/
Corporation and
Length of Time Served5 | | Business Experience and Directorships During the Past Five Years |
Hepsen Uzcan6(1974) President and Chief Executive Officer, 2017–present | | Managing Director,3 DWS; Secretary, DWS USA Corporation (2018–present); Assistant Secretary, DWS Distributors, Inc. (2018–present); Director and Vice President, DWS Service Company (2018–present); Assistant Secretary, DWS Investment Management Americas, Inc. (2018–present); and Director and President, DB Investment Managers, Inc. (2018–present); formerly: Vice President for the Deutsche funds (2016–2017); Assistant Secretary for the DWS funds (2013–2019) |
John Millette7(1962) Vice President and Secretary, 1999–present | | Director,3DWS; Chief Legal Officer, DWS Investment Management Americas, Inc. (2015–present); Director and Vice President, DWS Trust Company (2016–present); and Assistant Secretary, DBX ETF Trust (2019–present); formerly: Secretary, Deutsche Investment Management Americas Inc. (2015–2017) |
Diane Kenneally7(1966) Chief Financial Officer and Treasurer, 2018–present | | Director,3 DWS; and Treasurer, Chief Financial Officer and Controller, DBX ETF Trust (2019–present); formerly: Assistant Treasurer for the DWS funds (2007–2018) |
Paul Antosca7(1957) Assistant Treasurer, 2007–present | | Director,3DWS; and Assistant Treasurer, DBX ETF Trust (2019–present) |
Sheila Cadogan7(1966) Assistant Treasurer, 2017–present | | Director,3DWS; Director and Vice President, DWS Trust Company (2018–present); and Assistant Treasurer, DBX ETF Trust (2019–present) |
Scott D. Hogan7(1970) Chief Compliance Officer, 2016–present | | Director,3DWS |
Caroline Pearson7(1962) Chief Legal Officer, 2010–present | | Managing Director,3DWS; formerly: Secretary, Deutsche AM Distributors, Inc. (2002–2017); and Secretary, Deutsche AM Service Company (2010–2017) |
Wayne Salit6(1967) Anti-Money Laundering Compliance Officer, 2014–present | | Director,3 Deutsche Bank; and AML Officer, DWS Trust Company; formerly: Managing Director, AML Compliance Officer at BNY Mellon (2011–2014); and Director, AML Compliance Officer at Deutsche Bank (2004–2011) |
Ciara Crawford8 (1984) Assistant Secretary, (2019–present) | | Associate, DWS (since 2015); previously, Legal Assistant at Accelerated Tax Solutions. |
| | | | | | |
| | 24 | | | | | | Deutsche DWS Variable Series II — DWS Global Equity VIP |
| 1 | The length of time served represents the year in which the Board Member joined the board of one or more DWS funds currently overseen by the Board. |
| 2 | A publicly held company with securities registered pursuant to Section 12 of the Securities Exchange Act of 1934. |
| 3 | Executive title, not a board directorship. |
| 4 | As a result of their respective positions held with the Advisor or its affiliates, these individuals are considered “interested persons” of the Advisor within the meaning of the 1940 Act. Interested persons receive no compensation from the Fund. |
| 5 | The length of time served represents the year in which the officer was first elected in such capacity for one or more DWS funds. |
| 6 | Address: 875 Third Avenue, New York, NY 10022. |
| 7 | Address: One International Place, Boston, MA 02110. |
| 8 | Address: 5022 Gate Parkway, Suite 400, Jacksonville, FL 32256. |
The Fund’s Statement of Additional Information (“SAI”) includes additional information about the Board Members. The SAI is available, without charge, upon request. If you would like to request a copy of the SAI, you may do so by calling the followingtoll-free number:(800) 728-3337.
| | | | |
Deutsche DWS Variable Series II — DWS Global Equity VIP | | | | | 25 |
Notes
Notes
| | |
| | |
VS2GE-2 (R-025828-9 2/20) | | |
December 31, 2019
Annual Report
Deutsche DWS Variable Series II
DWS Global Income Builder VIP
Beginning on January 1, 2021, as permitted by regulations adopted by the Securities and Exchange Commission, you may not be receiving paper copies of the Fund’s shareholder reports from the insurance company that offers your contract unless you specifically request paper copies from your insurance company or from your financial intermediary. Instead, the shareholder reports will be made available on a Web site, and your insurance company will notify you by mail each time a report is posted and provide you with a Web site link to access the report. Instructions for requesting paper copies will be provided by your insurance company.
If you already elected to receive shareholder reports electronically, you will not be affected by this change and you need not take any action. You may elect to receive shareholder reports and other communications from your insurance company electronically by following the instructions provided by your insurance company.
You may elect to receive all future reports in paper free of charge from your insurance company. If your insurance company informs you that future reports will be delivered via Web access, you can inform your insurance company that you wish to continue receiving paper copies of your shareholder reports by following the instructions provided by your insurance company.

Contents
This report must be preceded or accompanied by a prospectus. To obtain an additional prospectus or summary prospectus, if available, call (800) 728-3337 or your financial representative. We advise you to consider the Fund’s objectives, risks, charges and expenses carefully before investing. The summary prospectus and prospectus contain this and other important information about the Fund. Please read the prospectus carefully before you invest.
Although allocation among different asset categories generally limits risk, fund management may favor an asset category that underperforms other assets or markets as a whole. Stocks may decline in value. Smaller company stocks tend to be more volatile than medium-sized or large company stocks. Dividends are not guaranteed. If the dividend-paying stocks held by the Fund reduce or stop paying dividends, the Fund’s ability to generate income may be adversely affected. Preferred stocks, a type of dividend-paying stock, present certain additional risks. Investing in foreign securities, particularly those of emerging markets, presents certain risks, such as currency fluctuations, political and economic changes, and market risks. Emerging markets tend to be more volatile and less liquid than the markets of more mature economies, and generally have less diverse and less mature economic structures and less stable political systems than those of developed countries. Investing in derivatives entails special risks relating to liquidity, leverage and credit that may reduce returns and/or increase volatility. Bond investments are subject to interest-rate, credit, liquidity and market risks to varying degrees. When interest rates rise, bond prices generally fall. Credit risk refers to the ability of an issuer to make timely payments of principal and interest. Because Exchange Traded Funds (ETFs) trade on a securities exchange, their shares may trade at a premium or discount to their net asset value. ETFs also incur fees and expenses so they may not fully match the performance of the indexes they are designed to track. The Fund may lend securities to approved institutions. Any fund that focuses in a particular segment of the market or region of the world will generally be more volatile than a fund that invests more broadly. Please read the prospectus for details.
The brand DWS represents DWS Group GmbH & Co. KGaA and any of its subsidiaries such as DWS Distributors, Inc. which offers investment products or DWS Investment Management Americas, Inc. and RREEF America L.L.C. which offer advisory services.
DWS Distributors, Inc., 222 South Riverside Plaza, Chicago, IL 60606, (800) 621-1148
NOT FDIC/NCUA INSURED NO BANK GUARANTEE MAY LOSE VALUE NOT A DEPOSIT
NOT INSURED BY ANY FEDERAL GOVERNMENT AGENCY
| | | | | | |
| | 2 | | | | | | Deutsche DWS Variable Series II — DWS Global Income Builder VIP |
| | |
| Performance Summary | | December 31, 2019 (Unaudited) |
Fund performance shown is historical, assumes reinvestment of all dividend and capital gain distributions and does not guarantee future results. Investment return and principal value fluctuate with changing market conditions so that, when redeemed, shares may be worth more or less than their original cost. Current performance may be lower or higher than the performance data quoted. Please contact your participating insurance company for the Fund’s most recent month-end performance. Performance does not reflect charges and fees (“contract charges”) associated with the separate account that invests in the Fund or any variable life insurance policy or variable annuity contract for which the Fund is an investment option. These charges and fees will reduce returns.
The gross expense ratios of the Fund, as stated in the fee table of the prospectus dated May 1, 2019 are 0.69% and 1.15% for Class A and Class B shares, respectively, and may differ from the expense ratios disclosed in the Financial Highlights tables in this report.
Generally accepted accounting principles require adjustments to be made to the net assets of the Fund at period end for financial reporting purposes only, and as such, the total return based on the unadjusted net asset value per share may differ from the total return reported in the financial highlights.
Growth of an Assumed $10,000 Investment
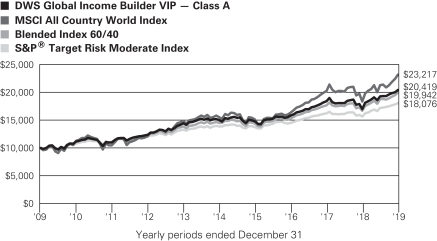
MSCI All Country World Index is an unmanaged equity index which captures large and mid-capitalization representation across 23 developed markets and 26 emerging markets countries. It covers approximately 85% of the global investable equity opportunity set.
The S&P® Target Risk Moderate Index offers significant exposure to fixed income, while also increasing opportunities for higher returns through equities.
The Blended Index 60/40 consists of an equally weighted blend of 60% MSCI All Country World Index and 40% Bloomberg Barclays U.S. Universal Index.
Bloomberg Barclays U.S. Universal Index measures the performance of U.S. dollar-denominated taxable bonds that are rated either investment grade or high yield. The index includes U.S. Treasury bonds, investment-grade and high yield U.S. corporate bonds, mortgage-backed securities, and Eurodollar bonds.
Effective December 1, 2019, the MSCI All Country World Index has replaced the S&P Target Risk Moderate Index as the fund’s primary comparative broad-based securities market index. The Blended Index 60/40 and the Bloomberg Barclays U.S. Universal Index have replaced the Blended Index 50/50 as the additional secondary and tertiary comparative indexes, respectively. The Advisor believes that the new indexes collectively better represent the fund’s investment strategy and overall strategic asset allocations and are therefore more suitable for performance comparison.
Index returns do not reflect any fees or expenses and it is not possible to invest directly into an index.
| | | | |
Deutsche DWS Variable Series II — DWS Global Income Builder VIP | | | | | 3 |
| | | | | | | | | | |
| Comparative Results | | | | | | | | | | |
| | | | |
| DWS Global Income Builder VIP | | 1-Year | | 3-Year | | 5-Year | | 10-Year |
| Class A | | Growth of $10,000 | | $12,016 | | $12,931 | | $13,612 | | $20,419 |
| | | Average annual total return | | 20.16% | | 8.94% | | 6.36% | | 7.40% |
| MSCI All Country World Index | | Growth of $10,000 | | $12,660 | | $14,217 | | $14,973 | | $23,217 |
| | | Average annual total return | | 26.60% | | 12.44% | | 8.41% | | 8.79% |
| Blended Index 60/40 | | Growth of $10,000 | | $11,956 | | $13,045 | | $13,752 | | $19,942 |
| | | Average annual total return | | 19.56% | | 9.27% | | 6.58% | | 7.15% |
| S&P®Target Risk Moderate Index | | Growth of $10,000 | | $11,571 | | $12,452 | | $13,032 | | $18,076 |
| | | Average annual total return | | 15.71% | | 7.58% | | 5.44% | | 6.10% |
The growth of $10,000 is cumulative.
| | | | | | | | | | |
| | | | |
| DWS Global Income Builder VIP | | | | | | 1-Year | | Life of Class* |
| Class B | | Growth of $10,000 | | | | | | $12,001 | | $11,286 |
| | | Average annual total return | | | | | | 20.01% | | 7.52% |
| MSCI All Country World Index | | Growth of $10,000 | | | | | | $12,660 | | $11,470 |
| | | Average annual total return | | | | | | 26.60% | | 8.58% |
| Blended Index 60/40 | | Growth of $10,000 | | | | | | $11,956 | | $11,366 |
| | | Average annual total return | | | | | | 19.56% | | 7.99% |
| S&P®Target Risk Moderate Index | | Growth of $10,000 | | | | | | $11,571 | | $11,259 |
| | | Average annual total return | | | | | | 15.71% | | 7.37% |
The growth of $10,000 is cumulative.
| * | Class B commenced operations on May 1, 2018. |
| | | | | | |
| | 4 | | | | | | Deutsche DWS Variable Series II — DWS Global Income Builder VIP |
| | |
| Management Summary | | December 31, 2019 (Unaudited) |
The Fund returned 20.16% during the 12 months ended December 31, 2019 (Class A shares, unadjusted for contract charges). In comparison, the MSCI All-Country World Index (which is allocated entirely to equities) returned 26.60%. Its other benchmark — the Blended Index 60/40 — returned 19.56%. The Blended Index 60/40 is a 60%/40% blend of the MSCI All Country World Index and the Bloomberg Barclays U.S. Universal Index. The latter index rose 9.29%.*
Stock selection made a positive contribution to 12-month performance, led by our strong showing in the information technology, consumer discretionary, and energy sectors. However, some of the benefit was offset by selection in financials and an underweight position in consumer staples. An overweight position in the United States aided results. Conversely, the Fund’s allocation to the emerging markets — while positive on an absolute basis — was somewhat detrimental to relative performance.
The Fund’s broader allocation strategy slightly detracted from performance against the Blended Index 60%/40%. The Fund had an average weighting in stocks below 60%, which prevented it from gaining the full benefit of equities’ outperformance.
The bond portfolio performed in line with the fixed-income benchmark. An overweight in credit-sensitive investments contributed, as did security selection. Duration and yield curve management was a further plus, as we positioned the portfolio to take advantage of both falling yields and the outperformance of longer-term bonds. Conversely, we lost some relative performance through an underweight in investment-grade corporates — the best-performing segment of the market.
The Fund benefited from our decision to allocate a portion of the fixed-income position to a portfolio of alternative investments that includes real estate investment trusts (REITs), convertible bonds, and preferred stocks. All three categories outpaced the Blended Index 60%/40% for the year. We reduced the portfolio’s weighting in REITs in the fourth quarter, as the strong run in the category throughout 2019 caused valuations to reach levels that we viewed as being less attractive.
The Fund used derivatives during the past 12 months. On the equity side, we used futures on equity indexes to achieve our desired weightings in a more efficient manner than buying and selling individual securities. In the fixed-income portfolio, we used credit default swaps to facilitate or to hedge exposure to the high-yield market, along with derivatives to manage the currency exposure of certain positions in foreign bonds. We also used interest-rate futures and swaps to manage the Fund’s duration (interest-rate sensitivity). In the aggregate, our use of derivatives was a net contributor. Derivatives are used to achieve the Fund’s risk and return objectives and should be evaluated within the context of the entire portfolio rather than as a standalone strategy.
The Fund closed the year with a moderately defensive posture. This aspect of our positioning had three elements: the narrow underweight in equities, a continued emphasis on dividend-paying stocks, and lower weightings in the bond market’s credit sectors. We believe this approach is warranted given the rising risks across the investment landscape as we move into 2020. Expectations for both economic growth and corporate earnings appear elevated, setting the stage for a potential disappointment. The markets also face ongoing uncertainty from issues such as trade, geopolitical factors, and the approaching U.S. elections. We therefore don’t see this as being an appropriate time to take on excessive portfolio risk, especially with most asset categories coming off a year of such robust performance. With that said, we did not reduce risk to such a low level that the Fund would be unable to participate in continued gains for the markets. We think this balanced strategy is well suited for the current environment, but we remain alert for opportunities to use market volatility as an opportunity to shift the Fund’s risk profile.
Darwei Kung, Managing Director
Di Kumble, CFA, Managing Director
Thomas M. Farina, CFA, Managing Director
Dokyoung Lee, CFA, Director
Scott Agi, CFA, Director
Portfolio Managers
The views expressed reflect those of the portfolio management team only through the end of the period of the report as stated on the cover. The management team’s views are subject to change at any time based on market and other conditions and should not be construed as a recommendation. Past performance is no guarantee of future results. Current and future portfolio holdings are subject to risk.
| | | | |
Deutsche DWS Variable Series II — DWS Global Income Builder VIP | | | | | 5 |
Terms to Know
MSCIAllCountryWorldIndexis an unmanaged equity index which captures large and mid-capitalization representation across 23 developed markets and 26 emerging markets countries. It covers approximately 85% of the global investable equity opportunity set.
Blended Index 60/40 consists of an equally weighted blend of 60% MSCI All Country World Index and 40% Bloomberg Barclays U.S. Universal Index.
Bloomberg Barclays U.S. Universal Index measures the performance of U.S. dollar-denominated taxable bonds that are rated either investment grade or high yield. The index includes U.S. Treasury bonds, investment-grade and high yield U.S. corporate bonds, mortgage-backed securities, and Eurodollar bonds.
S&P Target Risk Moderate Index offers significant exposure to fixed income, while also increasing opportunities for higher returns through equities.
Index returns do not reflect any fees or expenses and it is not possible to invest directly into an index.
Contribution anddetraction incorporate both an investment’s total return and its weighting in the Fund.
Overweight means the Fund holds a higher weighting in a given sector or security than the benchmark.Underweightmeans the Fund holds a lower weighting.
Duration is a measure of bond price volatility. Duration can be defined as the approximate percentage change in price for a 100 basis point (one single percentage point) change in market interest rate levels. A duration of 5, for example, means that the price of a bond should rise by approximately 5% for a one percentage point drop in interest rates, and fall by 5% for a one percentage point rise in interest rates.
Derivativesare contracts whose value is based on the performance of an underlying financial asset. Derivatives afford leverage, but when used by investors who are able to handle the inherent risks, can enhance returns or protect a portfolio. Derivatives experience significant losses if the underlying security moves contrary to the investor’s expectations.
Futures contracts are contractual agreements to buy or sell a particular commodity or financial instrument at a pre-determined price in the future.
Aswap is a derivative in which two counterparties exchange cash flows of one party’s financial instrument for those of the other party’s financial instrument for a set period of time.
| * | The MSCI All Country World Index replaced the S&P Target Risk Moderate Index as the Fund’s primary benchmark on December 1, 2019. The Blended Index 60/40 and the Bloomberg Barclays U.S. Universal Index replaced the Blended Index 50/50 as the additional secondary and tertiary comparative indexes, respectively. The Advisor believes that the new indexes collectively better represent the Fund’s investment strategy and overall strategic asset allocations and are therefore more suitable for performance comparison. |
| | | | | | |
| | 6 | | | | | | Deutsche DWS Variable Series II — DWS Global Income Builder VIP |
| | |
| Portfolio Summary | | (Unaudited) |
| | | | | | | | |
| Asset Allocation (As a % of Investment Portfolio excluding Securities Lending Collateral) | | 12/31/19 | | | 12/31/18 | |
Equity | | | 64% | | | | 61% | |
Common Stocks | | | 60% | | | | 55% | |
Preferred Stocks | | | 4% | | | | 6% | |
| | |
Fixed Income | | | 35% | | | | 37% | |
Corporate Bonds | | | 9% | | | | 13% | |
Collateralized Mortgage Obligations | | | 8% | | | | 2% | |
Asset-Backed | | | 6% | | | | 6% | |
Commercial Mortgage-Backed Securities | | | 5% | | | | 1% | |
Short-Term U.S. Treasury Obligations | | | 2% | | | | 3% | |
Mortgage-Backed Securities Pass-Throughs | | | 1% | | | | 0% | |
Government & Agency Obligations | | | 1% | | | | 9% | |
Exchange-Traded Funds | | | 3% | | | | 3% | |
Convertible Bonds | | | — | | | | 0% | |
| | |
| Cash Equivalents | | | 1% | | | | 2% | |
| | | | 100% | | | | 100% | |
| | |
Sector Diversification (As a % of Equities, Corporate Bonds, Preferred Securities and
Convertible Bonds) | | 12/31/19 | | | 12/31/18 | |
Financials | | | 19% | | | | 17% | |
Information Technology | | | 15% | | | | 12% | |
Communication Services | | | 10% | | | | 12% | |
Health Care | | | 9% | | | | 9% | |
Consumer Discretionary | | | 9% | | | | 9% | |
Utilities | | | 8% | | | | 5% | |
Industrials | | | 7% | | | | 8% | |
Energy | | | 7% | | | | 13% | |
Real Estate | | | 6% | | | | 6% | |
Consumer Staples | | | 6% | | | | 6% | |
Materials | | | 4% | | | | 3% | |
| | | | 100% | | | | 100% | |
Portfolio holdings and characteristics are subject to change.
For more complete details about the Fund’s investment portfolio, see page 8.
Following the Fund’s fiscal first and third quarter-end, a complete portfolio holdings listing is filed with the SEC on Form N-PORT. The Fund’s Form N-PORT will be available on the SEC’s Web site at sec.gov. The Fund’s portfolio holdings are also posted on dws.com from time to time. Please read the Fund’s current prospectus for more information.
| | | | |
Deutsche DWS Variable Series II — DWS Global Income Builder VIP | | | | | 7 |
| | |
| Investment Portfolio | | as of December 31, 2019 |
| | | | | | | | |
| | | Shares | | | Value ($) | |
| Common Stocks 59.2% | |
| Communication Services 5.8% | |
Diversified Telecommunication Services 2.6% | |
| | |
AT&T, Inc. | | | 19,434 | | | | 759,481 | |
| | |
BCE, Inc. | | | 3,319 | | | | 153,765 | |
| | |
Deutsche Telekom AG (Registered) | | | 9,131 | | | | 149,162 | |
| | |
HKT Trust & HKT Ltd. “SS”, (Units) | | | 52,000 | | | | 73,339 | |
| | |
Koninklijke KPN NV | | | 54,892 | | | | 162,050 | |
| | |
Nippon Telegraph & Telephone Corp. | | | 6,914 | | | | 175,532 | |
| | |
Orange SA | | | 10,811 | | | | 159,063 | |
| | |
Proximus SADP | | | 5,303 | | | | 151,646 | |
| | |
Singapore Telecommunications Ltd. | | | 62,487 | | | | 154,437 | |
| | |
Swisscom AG (Registered) | | | 309 | | | | 163,583 | |
| | |
Telefonica SA | | | 21,807 | | | | 152,487 | |
| | |
Telenor ASA | | | 8,314 | | | | 148,935 | |
| | |
Telia Co. AB | | | 41,044 | | | | 176,460 | |
| | |
TELUS Corp. | | | 5,930 | | | | 229,610 | |
| | |
Verizon Communications, Inc. | | | 9,144 | | | | 561,442 | |
| | | | | | | | |
| | | | 3,370,992 | |
|
Entertainment 0.5% | |
| | |
NetEase, Inc. (ADR) | | | 932 | | | | 285,789 | |
| | |
Walt Disney Co. | | | 2,467 | | | | 356,802 | |
| | | | | | | | |
| | | | 642,591 | |
|
Interactive Media & Services 1.2% | |
| | |
Alphabet, Inc. “A”* | | | 270 | | | | 361,635 | |
| | |
Alphabet, Inc. “C”* | | | 294 | | | | 393,084 | |
| | |
Facebook, Inc. “A”* | | | 2,674 | | | | 548,838 | |
| | |
Tencent Holdings Ltd. (ADR) | | | 5,079 | | | | 243,843 | |
| | | | | | | | |
| | | | 1,547,400 | |
|
Media 1.0% | |
| | |
Comcast Corp. “A” | | | 6,682 | | | | 300,489 | |
| | |
Interpublic Group of Companies, Inc. | | | 6,904 | | | | 159,482 | |
| | |
ITV PLC | | | 94,486 | | | | 189,617 | |
| | |
Omnicom Group, Inc. | | | 1,933 | | | | 156,612 | |
| | |
Shaw Communications, Inc. “B” | | | 7,631 | | | | 154,847 | |
| | |
Singapore Press Holdings Ltd. | | | 49,600 | | | | 80,509 | |
| | |
WPP PLC | | | 12,409 | | | | 175,879 | |
| | | | | | | | |
| | | | 1,217,435 | |
|
Wireless Telecommunication Services 0.5% | |
| | |
China Mobile Ltd. (ADR) | | | 3,200 | | | | 135,264 | |
| | |
KDDI Corp. | | | 6,846 | | | | 204,331 | |
| | |
NTT DoCoMo, Inc. | | | 7,548 | | | | 210,235 | |
| | |
Vodafone Group PLC | | | 74,608 | | | | 145,473 | |
| | | | | | | | |
| | | | 695,303 | |
|
| Consumer Discretionary 6.0% | |
Auto Components 0.2% | |
| | |
Bridgestone Corp. | | | 3,594 | | | | 133,505 | |
| | |
Nokian Renkaat Oyj | | | 4,963 | | | | 142,765 | |
| | | | | | | | |
| | | | 276,270 | |
|
Automobiles 1.3% | |
| | |
Bayerische Motoren Werke AG | | | 2,179 | | | | 179,159 | |
| | |
Daimler AG (Registered) | | | 5,810 | | | | 322,399 | |
| | | | | | | | |
| | | Shares | | | Value ($) | |
| | |
Fiat Chrysler Automobiles NV | | | 5,154 | | | | 75,632 | |
| | |
Ford Motor Co. | | | 45,863 | | | | 426,526 | |
| | |
General Motors Co. | | | 4,502 | | | | 164,773 | |
| | |
Honda Motor Co., Ltd. | | | 5,066 | | | | 143,399 | |
| | |
Subaru Corp. | | | 7,188 | | | | 177,721 | |
| | |
Toyota Motor Corp. | | | 3,491 | | | | 246,080 | |
| | | | | | | | |
| | | | 1,735,689 | |
|
Diversified Consumer Services 0.5% | |
| | |
H&R Block, Inc. | | | 6,238 | | | | 146,468 | |
| | |
New Oriental Education & Technology Group, Inc. (ADR)* | | | 1,819 | | | | 220,554 | |
| | |
Tal Education Group (ADR)* | | | 4,276 | | | | 206,103 | |
| | | | | | | | |
| | | | 573,125 | |
|
Hotels, Restaurants & Leisure 1.1% | |
| | |
Carnival Corp. | | | 3,493 | | | | 177,549 | |
| | |
Darden Restaurants, Inc. | | | 1,364 | | | | 148,690 | |
| | |
Las Vegas Sands Corp. | | | 3,842 | | | | 265,252 | |
| | |
McDonald’s Corp. | | | 1,406 | | | | 277,840 | |
| | |
Sands China Ltd. | | | 46,096 | | | | 246,739 | |
| | |
Starbucks Corp. | | | 1,962 | | | | 172,499 | |
| | |
Wynn Macau Ltd. | | | 70,761 | | | | 172,744 | |
| | | | | | | | |
| | | | 1,461,313 | |
|
Household Durables 0.5% | |
| | |
Garmin Ltd. | | | 1,558 | | | | 151,998 | |
| | |
Leggett & Platt, Inc. | | | 2,760 | | | | 140,291 | |
| | |
Newell Brands, Inc. | | | 10,808 | | | | 207,730 | |
| | |
Sekisui House Ltd. | | | 6,949 | | | | 148,749 | |
| | | | | | | | |
| | | | 648,768 | |
|
Internet & Direct Marketing Retail 1.0% | |
| | |
Alibaba Group Holding Ltd. (ADR)* | | | 804 | | | | 170,528 | |
| | |
Amazon.com, Inc.* | | | 411 | | | | 759,462 | |
| | |
JD.com, Inc. (ADR)* | | | 4,450 | | | | 156,774 | |
| | |
Naspers Ltd. ADR | | | 4,286 | | | | 139,552 | |
| | | | | | | | |
| | | | 1,226,316 | |
|
Multiline Retail 0.4% | |
| | |
Kohl’s Corp. | | | 4,026 | | | | 205,125 | |
| | |
Target Corp. | | | 1,448 | | | | 185,648 | |
| | |
Wesfarmers Ltd. | | | 5,868 | | | | 170,413 | |
| | | | | | | | |
| | | | 561,186 | |
|
Specialty Retail 0.9% | |
| | |
Dufry AG (Registered) | | | 762 | | | | 75,647 | |
| | |
Hennes & Mauritz AB “B” | | | 8,467 | | | | 172,319 | |
| | |
Home Depot, Inc. | | | 2,023 | | | | 441,783 | |
| | |
Lowe’s Companies, Inc. | | | 1,321 | | | | 158,203 | |
| | |
The Gap, Inc. | | | 10,517 | | | | 185,940 | |
| | |
TJX Companies, Inc. | | | 2,676 | | | | 163,397 | |
| | | | | | | | |
| | | | 1,197,289 | |
|
Textiles, Apparel & Luxury Goods 0.1% | |
Tapestry, Inc. | | | 6,323 | | | | 170,531 | |
|
| Consumer Staples 3.9% | |
Beverages 0.7% | |
| | |
Ambev SA (ADR) | | | 41,427 | | | | 193,050 | |
| | |
Coca-Cola Co. | | | 7,751 | | | | 429,018 | |
| | |
PepsiCo, Inc. | | | 2,490 | | | | 340,308 | |
| | | | | | | | |
| | | | 962,376 | |
The accompanying notes are an integral part of the financial statements.
| | | | | | |
| | 8 | | | | | | Deutsche DWS Variable Series II — DWS Global Income Builder VIP |
| | | | | | | | |
| | | Shares | | | Value ($) | |
|
Food & Staples Retailing 0.4% | |
| | |
Casino Guichard-Perrachon SA (a) | | | 3,546 | | | | 165,740 | |
| | |
Walgreens Boots Alliance, Inc. | | | 2,380 | | | | 140,325 | |
| | |
Walmart, Inc. | | | 2,019 | | | | 239,938 | |
| | | | | | | | |
| | | | 546,003 | |
|
Food Products 1.3% | |
| | |
Archer-Daniels-Midland Co. | | | 3,455 | | | | 160,139 | |
| | |
General Mills, Inc. | | | 2,876 | | | | 154,039 | |
| | |
Kellogg Co. | | | 2,344 | | | | 162,111 | |
| | |
Kraft Heinz Co. | | | 5,289 | | | | 169,936 | |
| | |
Mondelez International, Inc. “A” | | | 2,882 | | | | 158,740 | |
| | |
Mowi ASA | | | 6,366 | | | | 165,267 | |
| | |
Nestle SA (Registered) | | | 5,134 | | | | 555,773 | |
| | |
The JM Smucker Co. | | | 1,422 | | | | 148,073 | |
| | | | | | | | |
| | | | 1,674,078 | |
|
Household Products 0.7% | |
| | |
Colgate-Palmolive Co. | | | 2,243 | | | | 154,408 | |
| | |
Kimberly-Clark Corp. | | | 1,139 | | | | 156,669 | |
| | |
Procter & Gamble Co. | | | 4,300 | | | | 537,070 | |
| | | | | | | | |
| | | | 848,147 | |
|
Personal Products 0.2% | |
| | |
Coty, Inc. “A” | | | 12,049 | | | | 135,551 | |
| | |
Unilever NV (CVA) | | | 2,519 | | | | 145,059 | |
| | | | | | | | |
| | | | 280,610 | |
|
Tobacco 0.6% | |
| | |
Japan Tobacco, Inc. | | | 13,863 | | | | 308,968 | |
| | |
Philip Morris International, Inc. | | | 5,652 | | | | 480,929 | |
| | | | | | | | |
| | | | 789,897 | |
|
| Energy 3.1% | |
Energy Equipment & Services 0.2% | |
Schlumberger Ltd. | | | 6,834 | | | | 274,727 | |
|
Oil, Gas & Consumable Fuels 2.9% | |
| | |
BP PLC | | | 47,376 | | | | 297,100 | |
| | |
Chevron Corp. | | | 2,627 | | | | 316,580 | |
| | |
CNOOC Ltd. (ADR) | | | 600 | | | | 100,002 | |
| | |
Enbridge, Inc. | | | 5,968 | | | | 237,291 | |
| | |
Eni SpA | | | 12,570 | | | | 195,108 | |
| | |
Equinor ASA | | | 8,402 | | | | 167,764 | |
| | |
Exxon Mobil Corp. | | | 7,225 | | | | 504,160 | |
| | |
Keyera Corp. | | | 4,000 | | | | 104,794 | |
| | |
Kinder Morgan, Inc. | | | 7,457 | | | | 157,865 | |
| | |
ONEOK, Inc. | | | 2,135 | | | | 161,555 | |
| | |
Petroleo Brasileiro SA (ADR) | | | 9,558 | | | | 152,354 | |
| | |
Repsol SA | | | 10,070 | | | | 157,891 | |
| | |
Royal Dutch Shell PLC “A” | | | 10,964 | | | | 325,583 | |
| | |
Royal Dutch Shell PLC “B” | | | 8,749 | | | | 260,412 | |
| | |
Suncor Energy, Inc. | | | 2,900 | | | | 95,047 | |
| | |
Total SA | | | 3,086 | | | | 170,878 | |
| | |
Williams Companies, Inc. | | | 10,488 | | | | 248,775 | |
| | |
Woodside Petroleum Ltd. | | | 5,250 | | | | 127,480 | |
| | | | | | | | |
| | | | 3,780,639 | |
|
| Financials 9.3% | |
Banks 5.6% | |
| | |
AIB Group PLC | | | 21,189 | | | | 74,052 | |
| | |
Australia & New Zealand Banking Group Ltd. | | | 8,627 | | | | 149,181 | |
| | |
Banco Bradesco SA (ADR) | | | 29,102 | | | | 260,463 | |
| | |
Banco Santander SA | | | 40,407 | | | | 169,468 | |
| | |
Bank of America Corp. | | | 9,402 | | | | 331,138 | |
| | | | | | | | |
| | | Shares | | | Value ($) | |
| | |
Bank of Nova Scotia | | | 3,148 | | | | 177,818 | |
| | |
Bankia SA | | | 43,510 | | | | 93,009 | |
| | |
Bendigo & Adelaide Bank Ltd. | | | 19,617 | | | | 134,744 | |
| | |
BNP Paribas SA | | | 4,869 | | | | 289,456 | |
| | |
BOC Hong Kong Holdings Ltd. | | | 24,500 | | | | 85,149 | |
| | |
CaixaBank SA | | | 38,400 | | | | 120,791 | |
| | |
Canadian Imperial Bank of Commerce | | | 1,857 | | | | 154,532 | |
| | |
Citigroup, Inc. | | | 2,184 | | | | 174,480 | |
| | |
Commonwealth Bank of Australia | | | 3,928 | | | | 220,114 | |
| | |
Credit Agricole SA | | | 13,879 | | | | 201,594 | |
| | |
DBS Group Holdings Ltd. | | | 6,900 | | | | 132,891 | |
| | |
DNB ASA | | | 4,420 | | | | 82,624 | |
| | |
Hang Seng Bank Ltd. | | | 3,700 | | | | 76,477 | |
| | |
HSBC Holdings PLC | | | 73,814 | | | | 579,769 | |
| | |
ICICI Bank Ltd. (ADR) | | | 10,988 | | | | 165,809 | |
| | |
ING Groep NV | | | 23,044 | | | | 276,900 | |
| | |
JPMorgan Chase & Co. | | | 4,426 | | | | 616,984 | |
| | |
Lloyds Banking Group PLC | | | 237,568 | | | | 197,220 | |
| | |
Mitsubishi UFJ Financial Group, Inc. | | | 29,660 | | | | 160,433 | |
| | |
Mizuho Financial Group, Inc. | | | 98,479 | | | | 151,459 | |
| | |
National Australia Bank Ltd. | | | 12,766 | | | | 220,567 | |
| | |
Oversea-Chinese Banking Corp., Ltd. | | | 10,100 | | | | 82,645 | |
| | |
People’s United Financial, Inc. | | | 9,725 | | | | 164,352 | |
| | |
Royal Bank of Canada | | | 3,032 | | | | 239,912 | |
| | |
Skandinaviska Enskilda Banken AB “A” | | | 22,272 | | | | 209,531 | |
| | |
Sumitomo Mitsui Financial Group, Inc. | | | 4,399 | | | | 162,064 | |
| | |
Svenska Handelsbanken AB “A” | | | 8,221 | | | | 88,492 | |
| | |
Toronto-Dominion Bank | | | 3,787 | | | | 212,396 | |
| | |
Truist Financial Corp. | | | 2,946 | | | | 165,919 | |
| | |
Wells Fargo & Co. | | | 6,916 | | | | 372,081 | |
| | |
Westpac Banking Corp. | | | 14,187 | | | | 241,614 | |
| | | | | | | | |
| | | | 7,236,128 | |
|
Capital Markets 0.4% | |
| | |
Amundi SA 144A | | | 981 | | | | 77,112 | |
| | |
CME Group, Inc. | | | 736 | | | | 147,730 | |
| | |
UBS Group AG (Registered) | | | 21,495 | | | | 271,410 | |
| | | | | | | | |
| | | | 496,252 | |
|
Diversified Financial Services 0.1% | |
Berkshire Hathaway, Inc. “B”* | | | 685 | | | | 155,153 | |
|
Insurance 3.2% | |
| | |
Ageas | | | 2,776 | | | | 164,225 | |
| | |
Allianz SE (Registered) | | | 833 | | | | 204,157 | |
| | |
American Financial Group, Inc. | | | 1,478 | | | | 162,063 | |
| | |
Assicurazioni Generali SpA | | | 10,393 | | | | 214,560 | |
| | |
AXA SA | | | 9,687 | | | | 272,950 | |
| | |
Baloise Holding AG (Registered) | | | 800 | | | | 144,665 | |
| | |
Chubb Ltd. | | | 990 | | | | 154,103 | |
| | |
Fidelity National Financial, Inc. | | | 3,207 | | | | 145,437 | |
| | |
Great-West Lifeco, Inc. | | | 7,717 | | | | 197,657 | |
| | |
Legal & General Group PLC | | | 74,938 | | | | 303,126 | |
| | |
Mapfre SA | | | 26,112 | | | | 69,191 | |
| | |
MetLife, Inc. | | | 3,237 | | | | 164,990 | |
| | |
Muenchener Rueckversicherungs-Gesellschaft AG (Registered) | | | 533 | | | | 157,231 | |
| | |
NN Group NV | | | 4,404 | | | | 167,198 | |
| | |
Poste Italiane SpA 144A | | | 13,876 | | | | 157,330 | |
| | |
Power Corp. of Canada | | | 8,269 | | | | 213,005 | |
| | |
Power Financial Corp. | | | 8,299 | | | | 223,301 | |
The accompanying notes are an integral part of the financial statements.
| | | | |
Deutsche DWS Variable Series II — DWS Global Income Builder VIP | | | | | 9 |
| | | | | | | | |
| | | Shares | | | Value ($) | |
| | |
Prudential Financial, Inc. | | | 1,609 | | | | 150,828 | |
| | |
Swiss Life Holding AG (Registered) | | | 308 | | | | 154,682 | |
| | |
Swiss Re AG | | | 3,029 | | | | 340,124 | |
| | |
Zurich Insurance Group AG | | | 879 | | | | 360,574 | |
| | | | | | | | |
| | | | 4,121,397 | |
|
| Health Care 5.7% | |
Biotechnology 0.9% | |
| | |
AbbVie, Inc. | | | 6,611 | | | | 585,338 | |
| | |
Amgen, Inc. | | | 1,524 | | | | 367,391 | |
| | |
Gilead Sciences, Inc. | | | 4,099 | | | | 266,353 | |
| | | | | | | | |
| | | | 1,219,082 | |
|
Health Care Equipment & Supplies 0.4% | |
| | |
Abbott Laboratories | | | 2,836 | | | | 246,335 | |
| | |
Medtronic PLC | | | 2,580 | | | | 292,701 | |
| | | | | | | | |
| | | | 539,036 | |
|
Health Care Providers & Services 0.6% | |
| | |
Cardinal Health, Inc. | | | 3,157 | | | | 159,681 | |
| | |
CVS Health Corp. | | | 2,668 | | | | 198,206 | |
| | |
UnitedHealth Group, Inc. | | | 1,315 | | | | 386,583 | |
| | | | | | | | |
| | | | 744,470 | |
|
Pharmaceuticals 3.8% | |
| | |
Astellas Pharma, Inc. | | | 9,088 | | | | 155,291 | |
| | |
AstraZeneca PLC | | | 2,490 | | | | 251,259 | |
| | |
Bayer AG (Registered) | | | 2,328 | | | | 190,045 | |
| | |
Bristol-Myers Squibb Co. | | | 5,118 | | | | 328,524 | |
| | |
Eli Lilly & Co. | | | 1,814 | | | | 238,414 | |
| | |
GlaxoSmithKline PLC | | | 14,427 | | | | 340,303 | |
| | |
H. Lundbeck AS | | | 2,649 | | | | 101,164 | |
| | |
Johnson & Johnson | | | 5,379 | | | | 784,635 | |
| | |
Merck & Co., Inc. | | | 5,576 | | | | 507,137 | |
| | |
Novartis AG (Registered) | | | 4,490 | | | | 425,901 | |
| | |
Novo Nordisk AS “B” | | | 3,119 | | | | 181,102 | |
| | |
Pfizer, Inc. | | | 11,845 | | | | 464,087 | |
| | |
Roche Holding AG (Genusschein) | | | 1,518 | | | | 492,592 | |
| | |
Sanofi | | | 2,629 | | | | 264,584 | |
| | |
Takeda Pharmaceutical Co., Ltd. | | | 5,699 | | | | 225,649 | |
| | | | | | | | |
| | | | 4,950,687 | |
|
| Industrials 4.9% | |
Aerospace & Defense 0.8% | |
| | |
BAE Systems PLC | | | 21,367 | | | | 159,908 | |
| | |
Boeing Co. | | | 744 | | | | 242,365 | |
| | |
General Dynamics Corp. | | | 855 | | | | 150,779 | |
| | |
Lockheed Martin Corp. | | | 432 | | | | 168,212 | |
| | |
Raytheon Co. | | | 777 | | | | 170,738 | |
| | |
United Technologies Corp. | | | 1,114 | | | | 166,833 | |
| | | | | | | | |
| | | | 1,058,835 | |
|
Air Freight & Logistics 0.1% | |
United Parcel Service, Inc. “B” | | | 1,427 | | | | 167,045 | |
|
Airlines 0.3% | |
| | |
Deutsche Lufthansa AG (Registered) | | | 9,164 | | | | 169,196 | |
| | |
easyJet PLC | | | 11,838 | | | | 223,293 | |
| | | | | | | | |
| | | | 392,489 | |
|
Building Products 0.1% | |
Johnson Controls International PLC | | | 3,638 | | | | 148,103 | |
| | | | | | | | |
| | | Shares | | | Value ($) | |
|
Commercial Services & Supplies 0.1% | |
| | |
Quad Graphics, Inc. | | | 2 | | | | 9 | |
| | |
Waste Management, Inc. | | | 1,371 | | | | 156,239 | |
| | | | | | | | |
| | | | 156,248 | |
|
Construction & Engineering 0.4% | |
| | |
ACS Actividades de Construccion y Servicios SA | | | 3,834 | | | | 153,680 | |
| | |
Bouygues SA | | | 3,488 | | | | 148,438 | |
| | |
Kajima Corp. | | | 12,032 | | | | 159,971 | |
| | | | | | | | |
| | | | 462,089 | |
|
Electrical Equipment 0.4% | |
| | |
ABB Ltd. (Registered) | | | 6,850 | | | | 165,728 | |
| | |
Eaton Corp. PLC | | | 1,853 | | | | 175,516 | |
| | |
Emerson Electric Co. | | | 2,029 | | | | 154,732 | |
| | | | | | | | |
| | | | 495,976 | |
|
Industrial Conglomerates 0.4% | |
| | |
3M Co. | | | 936 | | | | 165,129 | |
| | |
Honeywell International, Inc. | | | 1,081 | | | | 191,337 | |
| | |
Siemens AG (Registered) | | | 1,448 | | | | 189,745 | |
| | | | | | | | |
| | | | 546,211 | |
|
Machinery 0.8% | |
| | |
Caterpillar, Inc. | | | 1,227 | | | | 181,203 | |
| | |
Cummins, Inc. | | | 808 | | | | 144,600 | |
| | |
Illinois Tool Works, Inc. | | | 968 | | | | 173,882 | |
| | |
Komatsu Ltd. | | | 3,800 | | | | 91,452 | |
| | |
PACCAR, Inc. | | | 3,274 | | | | 258,973 | |
| | |
Yangzijiang Shipbuilding Holdings Ltd. | | | 154,500 | | | | 129,187 | |
| | | | | | | | |
| | | | 979,297 | |
|
Marine 0.1% | |
Kuehne + Nagel International AG (Registered) | | | 1,016 | | | | 171,365 | |
|
Professional Services 0.5% | |
| | |
Adecco Group AG (Registered) | | | 2,683 | | | | 169,577 | |
| | |
Nielsen Holdings PLC | | | 20,249 | | | | 411,055 | |
| | | | | | | | |
| | | | 580,632 | |
|
Road & Rail 0.3% | |
| | |
Aurizon Holdings Ltd. | | | 39,211 | | | | 144,250 | |
| | |
Union Pacific Corp. | | | 1,016 | | | | 183,683 | |
| | | | | | | | |
| | | | 327,933 | |
|
Trading Companies & Distributors 0.6% | |
| | |
ITOCHU Corp. | | | 8,712 | | | | 202,293 | |
| | |
Marubeni Corp. | | | 20,007 | | | | 147,757 | |
| | |
Mitsubishi Corp. | | | 5,939 | | | | 157,268 | |
| | |
Mitsui & Co., Ltd. | | | 9,020 | | | | 160,109 | |
| | |
Sumitomo Corp. | | | 9,824 | | | | 145,660 | |
| | | | | | | | |
| | | | 813,087 | |
|
| Information Technology 10.9% | |
Communications Equipment 0.7% | |
| | |
Cisco Systems, Inc. | | | 9,318 | | | | 446,891 | |
| | |
Juniper Networks, Inc. | | | 6,255 | | | | 154,061 | |
| | |
Motorola Solutions, Inc. | | | 934 | | | | 150,505 | |
| | |
Nokia Oyj | | | 42,386 | | | | 157,230 | |
| | | | | | | | |
| | | | 908,687 | |
|
Electronic Equipment, Instruments & Components 0.4% | |
| | |
Corning, Inc. | | | 5,190 | | | | 151,081 | |
| | |
Murata Manufacturing Co., Ltd. | | | 1,600 | | | | 98,190 | |
The accompanying notes are an integral part of the financial statements.
| | | | | | |
| | 10 | | | | | | Deutsche DWS Variable Series II — DWS Global Income Builder VIP |
| | | | | | | | |
| | | Shares | | | Value ($) | |
| | |
TE Connectivity Ltd. | | | 1,618 | | | | 155,069 | |
| | |
Venture Corp., Ltd. | | | 10,000 | | | | 120,930 | |
| | | | | | | | |
| | | | 525,270 | |
|
IT Services 3.2% | |
| | |
Accenture PLC “A” | | | 1,307 | | | | 275,215 | |
| | |
Automatic Data Processing, Inc. | | | 1,232 | | | | 210,056 | |
| | |
Broadridge Financial Solutions, Inc. | | | 1,284 | | | | 158,625 | |
| | |
Cognizant Technology Solutions Corp. “A” | | | 2,442 | | | | 151,453 | |
| | |
DXC Technology Co. | | | 3,300 | | | | 124,047 | |
| | |
Fidelity National Information Services, Inc. | | | 1,142 | | | | 158,841 | |
| | |
Fujitsu Ltd. | | | 1,746 | | | | 164,196 | |
| | |
Infosys Ltd. (ADR) | | | 37,892 | | | | 391,045 | |
| | |
International Business Machines Corp. | | | 3,493 | | | | 468,202 | |
| | |
Leidos Holdings, Inc. | | | 1,680 | | | | 164,455 | |
| | |
MasterCard, Inc. “A” | | | 1,483 | | | | 442,809 | |
| | |
Paychex, Inc. | | | 2,803 | | | | 238,423 | |
| | |
PayPal Holdings, Inc.* | | | 1,474 | | | | 159,443 | |
| | |
Sabre Corp. | | | 6,967 | | | | 156,339 | |
| | |
Shopify, Inc.* | | | 300 | | | | 119,279 | |
| | |
Visa, Inc. “A” | | | 2,883 | | | | 541,716 | |
| | |
Western Union Co. | | | 11,570 | | | | 309,845 | |
| | | | | | | | |
| | | | 4,233,989 | |
|
Semiconductors & Semiconductor Equipment 2.3% | |
| | |
Analog Devices, Inc. | | | 1,382 | | | | 164,237 | |
| | |
Broadcom, Inc. | | | 1,095 | | | | 346,042 | |
| | |
Intel Corp. | | | 7,576 | | | | 453,424 | |
| | |
KLA Corp. | | | 949 | | | | 169,083 | |
| | |
Lam Research Corp. | | | 300 | | | | 87,720 | |
| | |
Maxim Integrated Products, Inc. | | | 3,128 | | | | 192,403 | |
| | |
QUALCOMM., Inc. | | | 2,864 | | | | 252,691 | |
| | |
SUMCO Corp. | | | 4,700 | | | | 77,738 | |
| | |
Taiwan Semiconductor Manufacturing Co., Ltd. (ADR) | | | 12,932 | | | | 751,349 | |
| | |
Texas Instruments, Inc. | | | 2,405 | | | | 308,537 | |
| | |
Tokyo Electron Ltd. | | | 770 | | | | 167,749 | |
| | | | | | | | |
| | | | 2,970,973 | |
|
Software 1.9% | |
| | |
Adobe, Inc.* | | | 741 | | | | 244,389 | |
| | |
Intuit, Inc. | | | 573 | | | | 150,086 | |
| | |
Microsoft Corp. | | | 7,382 | | | | 1,164,142 | |
| | |
Oracle Corp. | | | 4,896 | | | | 259,390 | |
| | |
salesforce.com, Inc.* | | | 1,002 | | | | 162,965 | |
| | |
SAP SE | | | 1,101 | | | | 149,385 | |
| | |
ServiceNow, Inc.* | | | 602 | | | | 169,957 | |
| | |
Trend Micro, Inc.* | | | 2,858 | | | | 146,154 | |
| | | | | | | | |
| | | | 2,446,468 | |
|
Technology Hardware, Storage & Peripherals 2.4% | |
| | |
Apple, Inc. | | | 4,261 | | | | 1,251,243 | |
| | |
Brother Industries Ltd. | | | 3,600 | | | | 74,111 | |
| | |
Canon, Inc. (a) | | | 10,267 | | | | 280,591 | |
| | |
Hewlett Packard Enterprise Co. | | | 7,200 | | | | 114,192 | |
| | |
HP, Inc. | | | 8,266 | | | | 169,866 | |
| | |
NetApp, Inc. | | | 3,100 | | | | 192,975 | |
| | |
Samsung Electronics Co., Ltd. (GDR) | | | 119 | | | | 141,967 | |
| | |
Seagate Technology PLC | | | 5,282 | | | | 314,279 | |
| | |
Seiko Epson Corp. | | | 10,303 | | | | 155,767 | |
| | | | | | | | |
| | | Shares | | | Value ($) | |
| | |
Western Digital Corp. | | | 4,953 | | | | 314,367 | |
| | |
Xerox Holding Corp.* | | | 2,600 | | | | 95,862 | |
| | | | | | | | |
| | | | 3,105,220 | |
|
| Materials 2.7% | |
Chemicals 1.1% | |
| | |
Air Products & Chemicals, Inc. | | | 637 | | | | 149,689 | |
| | |
BASF SE | | | 2,246 | | | | 170,357 | |
| | |
Covestro AG 144A | | | 2,872 | | | | 134,381 | |
| | |
Dow, Inc.* | | | 5,416 | | | | 296,418 | |
| | |
Evonik Industries AG | | | 2,540 | | | | 78,149 | |
| | |
Linde PLC | | | 768 | | | | 163,507 | |
| | |
LyondellBasell Industries NV “A” | | | 1,838 | | | | 173,654 | |
| | |
Mitsubishi Chemical Holdings Corp. | | | 20,709 | | | | 154,803 | |
| | |
Showa Denko KK (a) | | | 2,700 | | | | 71,119 | |
| | | | | | | | |
| | | | 1,392,077 | |
|
Construction Materials 0.2% | |
| | |
Boral Ltd. | | | 24,030 | | | | 75,595 | |
| | |
LafargeHolcim Ltd. (Registered) | | | 3,141 | | | | 174,396 | |
| | | | | | | | |
| | | | 249,991 | |
|
Containers & Packaging 0.4% | |
| | |
Amcor PLC* | | | 21,666 | | | | 234,859 | |
| | |
International Paper Co. | | | 3,813 | | | | 175,589 | |
| | |
Westrock Co. | | | 4,281 | | | | 183,698 | |
| | | | | | | | |
| | | | 594,146 | |
|
Metals & Mining 0.9% | |
| | |
BHP Group Ltd. | | | 6,951 | | | | 190,132 | |
| | |
Fortescue Metals Group Ltd. | | | 24,193 | | | | 182,020 | |
| | |
Glencore PLC | | | 49,551 | | | | 154,676 | |
| | |
JFE Holdings, Inc. | | | 12,032 | | | | 154,659 | |
| | |
Rio Tinto Ltd. | | | 1,704 | | | | 120,326 | |
| | |
Rio Tinto PLC | | | 2,811 | | | | 168,240 | |
| | |
Vale SA (ADR) | | | 13,002 | | | | 171,627 | |
| | | | | | | | |
| | | | 1,141,680 | |
|
Paper & Forest Products 0.1% | |
UPM-Kymmene Oyj | | | 4,912 | | | | 170,272 | |
|
| Real Estate 2.9% | |
Equity Real Estate Investment Trusts (REITs) | |
| | |
Ascendas Real Estate Investment Trust | | | 90,550 | | | | 199,985 | |
| | |
British Land Co. PLC | | | 22,425 | | | | 190,849 | |
| | |
Crown Castle International Corp. | | | 1,180 | | | | 167,737 | |
| | |
Host Hotels & Resorts, Inc. | | | 9,031 | | | | 167,525 | |
| | |
Kimco Realty Corp. | | | 10,107 | | | | 209,316 | |
| | |
Klepierre SA | | | 4,944 | | | | 187,825 | |
| | |
Mid-America Apartment Communities, Inc. | | | 1,156 | | | | 152,430 | |
| | |
National Retail Properties, Inc. | | | 2,749 | | | | 147,401 | |
| | |
Omega Healthcare Investors, Inc. | | | 1,900 | | | | 80,465 | |
| | |
Prologis, Inc. | | | 1,778 | | | | 158,491 | |
| | |
Public Storage | | | 711 | | | | 151,415 | |
| | |
Realty Income Corp. | | | 2,118 | | | | 155,948 | |
| | |
RioCan Real Estate Investment Trust | | | 7,821 | | | | 161,172 | |
| | |
Scentre Group | | | 57,038 | | | | 153,903 | |
| | |
Simon Property Group, Inc. | | | 1,236 | | | | 184,115 | |
| | |
Stockland (a) | | | 62,655 | | | | 203,090 | |
| | |
Ventas, Inc. | | | 2,556 | | | | 147,583 | |
| | |
VEREIT, Inc. | | | 27,363 | | | | 252,834 | |
| | |
Vicinity Centres (a) | | | 87,688 | | | | 153,473 | |
The accompanying notes are an integral part of the financial statements.
| | | | |
Deutsche DWS Variable Series II — DWS Global Income Builder VIP | | | | | 11 |
| | | | | | | | |
| | | Shares | | | Value ($) | |
| | |
Welltower, Inc. | | | 1,937 | | | | 158,408 | |
| | |
Weyerhaeuser Co. | | | 5,863 | | | | 177,063 | |
| | |
WP Carey, Inc. | | | 2,522 | | | | 201,861 | |
| | | | | | | | |
| | | | 3,762,889 | |
|
| Utilities 4.0% | |
Electric Utilities 2.3% | |
| | |
American Electric Power Co., Inc. | | | 1,692 | | | | 159,911 | |
| | |
Duke Energy Corp. | | | 2,248 | | | | 205,040 | |
| | |
EDP — Energias de Portugal SA | | | 37,995 | | | | 164,658 | |
| | |
Endesa SA | | | 8,101 | | | | 216,449 | |
| | |
Enel SpA | | | 22,192 | | | | 176,246 | |
| | |
Entergy Corp. | | | 1,388 | | | | 166,282 | |
| | |
Evergy, Inc. | | | 2,375 | | | | 154,589 | |
| | |
Exelon Corp. | | | 3,386 | | | | 154,368 | |
| | |
FirstEnergy Corp. | | | 3,245 | | | | 157,707 | |
| | |
Fortum Oyj | | | 7,469 | | | | 184,342 | |
| | |
NextEra Energy, Inc. | | | 801 | | | | 193,970 | |
| | |
OGE Energy Corp. | | | 3,612 | | | | 160,625 | |
| | |
Power Assets Holdings Ltd. | | | 20,966 | | | | 153,409 | |
| | |
PPL Corp. | | | 7,815 | | | | 280,402 | |
| | |
Red Electrica Corp. SA | | | 9,103 | | | | 183,310 | |
| | |
Southern Co. | | | 3,747 | | | | 238,684 | |
| | | | | | | | |
| | | | 2,949,992 | |
|
Gas Utilities 0.4% | |
| | |
Enagas SA | | | 6,750 | | | | 172,210 | |
| | |
Naturgy Energy Group SA | | | 6,966 | | | | 175,622 | |
| | |
Snam SpA | | | 29,905 | | | | 157,354 | |
| | | | | | | | |
| | | | 505,186 | |
|
Multi-Utilities 1.3% | |
| | |
AGL Energy Ltd. | | | 11,595 | | | | 166,895 | |
| | |
CenterPoint Energy, Inc. | | | 5,541 | | | | 151,103 | |
| | |
Consolidated Edison, Inc. | | | 1,742 | | | | 157,599 | |
| | |
Dominion Energy, Inc | | | 3,028 | | | | 250,779 | |
| | |
DTE Energy Co. | | | 1,239 | | | | 160,909 | |
| | |
Engie SA | | | 9,643 | | | | 155,887 | |
| | |
National Grid PLC | | | 14,351 | | | | 180,003 | |
| | |
Public Service Enterprise Group, Inc. | | | 2,559 | | | | 151,109 | |
| | |
Sempra Energy | | | 1,036 | | | | 156,933 | |
| | |
WEC Energy Group, Inc. | | | 1,712 | | | | 157,898 | |
| | | | | | | | |
| | | | | 1,689,115 | |
Total Common Stocks (Cost $60,525,502) | | | | 76,888,155 | |
|
| Preferred Stocks 4.5% | |
| Financials 2.9% | |
| | |
AGNC Investment Corp. Series C, 7.0% | | | 14,427 | | | | 374,381 | |
| | |
Bank of America Corp. Series Y, 6.5% | | | 15,000 | | | | 374,700 | |
| | |
Capital One Financial Corp. Series G, 5.2% | | | 10,000 | | | | 257,200 | |
| | |
Citigroup, Inc. Series S, 6.3% | | | 15,000 | | | | 393,150 | |
| | |
Fifth Third Bancorp. Series I, 6.625% | | | 10,000 | | | | 287,100 | |
| | |
JPMorgan Chase & Co. Series AA, 6.1% | | | 15,000 | | | | 386,100 | |
| | |
KeyCorp Series E, 6.125% | | | 10,000 | | | | 284,800 | |
| | |
Morgan Stanley Series K, 5.85% | | | 10,000 | | | | 283,600 | |
| | |
The Goldman Sachs Group, Inc. Series J, 5.5% | | | 17,000 | | | | 455,940 | |
| | | | | | | | |
| | | Shares | | | Value ($) | |
| | |
Truist Financial Corp., Series H, 5.625% | | | 10,000 | | | | 268,800 | |
| | |
Wells Fargo & Co. Series Y, 5.625% | | | 15,000 | | | | 400,350 | |
| | | | | | | | |
| | | | | | | 3,766,121 | |
|
| Real Estate 1.0% | |
| | |
Kimco Realty Corp. Series L, 5.125% | | | 15,000 | | | | 386,100 | |
| | |
Prologis, Inc. Series Q, 8.54% | | | 164 | | | | 12,251 | |
| | |
Simon Property Group, Inc. Series J, 8.375% | | | 8,000 | | | | 579,200 | |
| | |
VEREIT, Inc. Series F, 6.7% | | | 10,801 | | | | 275,425 | |
| | | | | | | | |
| | | | | | | 1,252,976 | |
|
| Utilities 0.6% | |
| | |
Dominion Energy, Inc. Series A, 5.25% | | | 30,000 | | | | 785,400 | |
Total Preferred Stocks (Cost $5,853,027) | | | | 5,804,497 | |
|
| Warrants 0.0% | |
| Materials | |
Hercules Trust II, Expiration Date 3/31/2029* (d) (Cost $30,283) | | | 170 | | | | 6,499 | |
| | |
| | | Principal
Amount ($)(b) | | | Value ($) | |
| Corporate Bonds 9.3% | |
| Communication Services 1.7% | |
| | |
Cablevision Systems Corp., 5.875%, 9/15/2022 | | | 200,000 | | | | 215,500 | |
|
CCO Holdings LLC: | |
| | |
144A, 4.75%, 3/1/2030 | | | 100,000 | | | | 101,803 | |
| | |
144A, 5.875%, 5/1/2027 | | | 250,000 | | | | 264,375 | |
|
Netflix, Inc.: | |
| | |
4.375%, 11/15/2026 | | | 100,000 | | | | 102,500 | |
| | |
5.5%, 2/15/2022 | | | 365,000 | | | | 386,444 | |
| | |
5.875%, 11/15/2028 | | | 140,000 | | | | 155,198 | |
| | |
NortonLifeLock, Inc., 3.95%, 6/15/2022 | | | 275,000 | | | | 281,955 | |
|
VeriSign, Inc.: | |
| | |
4.625%, 5/1/2023 | | | 300,000 | | | | 304,800 | |
| | |
5.25%, 4/1/2025 | | | 300,000 | | | | 330,693 | |
| | |
Verizon Communications, Inc., 4.016%, 12/3/2029 | | | 100,000 | | | | 111,475 | |
| | | | | | | | |
| | | | | | | 2,254,743 | |
|
| Consumer Discretionary 0.6% | |
| | |
1011778 B.C. Unlimited Liability Co., 144A, 4.375%, 1/15/2028 | | | 225,000 | | | | 225,562 | |
| | |
Boyd Gaming Corp., 144A, 4.75%, 12/1/2027 | | | 60,000 | | | | 62,325 | |
| | |
Ford Motor Credit Co. LLC, 4.542%, 8/1/2026 | | | 202,000 | | | | 206,709 | |
| | |
Las Vegas Sands Corp., 3.9%, 8/8/2029 | | | 45,000 | | | | 46,987 | |
| | |
NCL Corp. Ltd., 144A, 3.625%, 12/15/2024 | | | 200,000 | | | | 202,750 | |
| | | | | | | | |
| | | | | | | 744,333 | |
|
| Consumer Staples 0.2% | |
| | |
Altria Group, Inc., 5.95%, 2/14/2049 | | | 70,000 | | | | 84,873 | |
The accompanying notes are an integral part of the financial statements.
| | | | | | |
| | 12 | | | | | | Deutsche DWS Variable Series II — DWS Global Income Builder VIP |
| | | | | | | | |
| | | Principal
Amount ($)(b) | | | Value ($) | |
| | |
Anheuser-Busch InBev Worldwide, Inc., 5.55%, 1/23/2049 | | | 121,000 | | | | 157,217 | |
| | |
PepsiCo, Inc., 3.375%, 7/29/2049 | | | 55,000 | | | | 57,695 | |
| | | | | | | | |
| | | | | | | 299,785 | |
|
| Energy 1.7% | |
| | |
Apache Corp., 4.25%, 1/15/2030 (a) | | | 211,000 | | | | 218,853 | |
| | |
Cheniere Corpus Christi Holdings LLC, 5.875%, 3/31/2025 | | | 200,000 | | | | 224,892 | |
| | |
Cheniere Energy Partners LP, 5.625%, 10/1/2026 | | | 350,000 | | | | 370,125 | |
| | |
Devon Energy Corp., 5.0%, 6/15/2045 | | | 110,000 | | | | 127,674 | |
| | |
Empresa Nacional del Petroleo, 144A, 5.25%, 11/6/2029 | | | 200,000 | | | | 224,162 | |
| | |
Energy Transfer Operating LP, 5.5%, 6/1/2027 | | | 100,000 | | | | 112,425 | |
| | |
Enterprise Products Operating LLC, 4.2%, 1/31/2050 | | | 332,000 | | | | 356,379 | |
| | |
Hess Corp., 5.8%, 4/1/2047 | | | 70,000 | | | | 85,732 | |
| | |
Kinder Morgan, Inc., 5.2%, 3/1/2048 | | | 65,000 | | | | 75,481 | |
| | |
MPLX LP, 5.5%, 2/15/2049 | | | 70,000 | | | | 79,526 | |
| | |
Occidental Petroleum Corp., 3.5%, 8/15/2029 | | | 87,000 | | | | 88,816 | |
| | |
Plains All American Pipeline LP, 2.85%, 1/31/2023 | | | 55,000 | | | | 55,549 | |
| | |
Range Resources Corp., 5.0%, 8/15/2022 | | | 200,000 | | | | 196,000 | |
| | | | | | | | |
| | | | | | | 2,215,614 | |
|
| Financials 1.6% | |
| | |
BPCE SA, 144A, 4.875%, 4/1/2026 | | | 500,000 | | | | 550,304 | |
| | |
Citigroup, Inc., 3.98%, 3/20/2030 | | | 120,000 | | | | 131,377 | |
| | |
Hartford Financial Services Group, Inc., 2.8%, 8/19/2029 | | | 40,000 | | | | 40,468 | |
| | |
Morgan Stanley, 4.431%, 1/23/2030 | | | 94,000 | | | | 106,321 | |
| | |
Park Aerospace Holdings Ltd., 144A, 5.25%, 8/15/2022 | | | 175,000 | | | | 186,445 | |
|
PayPal Holdings, Inc.: | |
| | |
2.65%, 10/1/2026 | | | 101,000 | | | | 102,419 | |
| | |
2.85%, 10/1/2029 | | | 150,000 | | | | 151,393 | |
| | |
REC Ltd., 144A, 5.25%, 11/13/2023 | | | 200,000 | | | | 213,945 | |
| | |
Truist Financial Corp., 4.8%, Perpetual (c) | | | 300,000 | | | | 309,750 | |
| | |
Wells Fargo & Co., 3.196%, 6/17/2027 | | | 100,000 | | | | 103,767 | |
| | |
Westpac Banking Corp., 5.0%, Perpetual (c) | | | 200,000 | | | | 201,414 | |
| | | | | | | | |
| | | | | | | 2,097,603 | |
|
| Health Care 1.4% | |
| | |
AbbVie, Inc., 4.875%, 11/14/2048 | | | 75,000 | | | | 86,650 | |
| | |
Bausch Health Companies, Inc., 144A, 5.25%, 1/30/2030 | | | 40,000 | | | | 41,480 | |
| | |
Bristol-Myers Squibb Co., 144A, 4.25%, 10/26/2049 | | | 100,000 | | | | 118,728 | |
|
Centene Corp.: | |
| | |
144A, 4.25%, 12/15/2027 | | | 90,000 | | | | 92,587 | |
| | |
144A, 4.625%, 12/15/2029 | | | 60,000 | | | | 63,081 | |
| | | | | | | | |
| | | Principal
Amount ($)(b) | | | Value ($) | |
| | |
CVS Health Corp., 5.05%, 3/25/2048 | | | 285,000 | | | | 337,732 | |
|
HCA, Inc.: | |
| | |
4.125%, 6/15/2029 | | | 110,000 | | | | 116,719 | |
| | |
5.25%, 6/15/2026 | | | 500,000 | | | | 560,166 | |
| | |
7.5%, 2/15/2022 | | | 100,000 | | | | 110,500 | |
| | |
Select Medical Corp., 144A, 6.25%, 8/15/2026 | | | 160,000 | | | | 173,203 | |
| | |
UnitedHealth Group, Inc., 2.875%, 8/15/2029 | | | 54,000 | | | | 55,582 | |
| | | | | | | | |
| | | | | | | 1,756,428 | |
|
| Industrials 0.4% | |
| | |
Prime Security Services Borrower LLC, 144A, 5.25%, 4/15/2024 | | | 255,000 | | | | 269,790 | |
| | |
Signature Aviation US Holdings Inc, 144A, 4.0%, 3/1/2028 | | | 200,000 | | | | 197,260 | |
| | | | | | | | |
| | | | | | | 467,050 | |
|
| Information Technology 0.2% | |
| | |
Fiserv, Inc., 3.5%, 7/1/2029 | | | 140,000 | | | | 147,151 | |
| | |
MSCI, Inc., 144A, 4.0%, 11/15/2029 | | | 70,000 | | | | 70,962 | |
| | | | | | | | |
| | | | | | | 218,113 | |
|
| Real Estate 0.4% | |
| | |
American Tower Corp., (REIT), 3.8%, 8/15/2029 | | | 165,000 | | | | 176,406 | |
|
Office Properties Income Trust: | |
| | |
(REIT), 4.15%, 2/1/2022 | | | 60,000 | | | | 61,452 | |
| | |
(REIT), 4.25%, 5/15/2024 | | | 45,000 | | | | 46,775 | |
|
Omega Healthcare Investors, Inc.: | |
| | |
(REIT), 4.5%, 4/1/2027 | | | 50,000 | | | | 53,981 | |
| | |
(REIT), 4.75%, 1/15/2028 | | �� | 60,000 | | | | 65,351 | |
|
VICI Properties LP: | |
| | |
144A (REIT), 4.25%, 12/1/2026 | | | 62,000 | | | | 63,860 | |
| | |
144A (REIT), 4.625%, 12/1/2029 | | | 34,000 | | | | 35,445 | |
| | | | | | | | |
| | | | | | | 503,270 | |
|
| Utilities 1.1% | |
|
Calpine Corp.: | |
| | |
144A, 4.5%, 2/15/2028 | | | 225,000 | | | | 226,996 | |
| | |
144A, 5.125%, 3/15/2028 | | | 100,000 | | | | 102,070 | |
| | |
Edison International, 5.75%, 6/15/2027 | | | 300,000 | | | | 336,841 | |
|
NextEra Energy Operating Partners LP: | |
| | |
144A, 3.875%, 10/15/2026 | | | 190,000 | | | | 190,712 | |
| | |
144A, 4.25%, 7/15/2024 | | | 275,000 | | | | 286,344 | |
| | |
Perusahaan Listrik Negara PT, 144A, 2.875%, 10/25/2025 | | | EUR 260,000 | | | | 320,514 | |
| | | | | | | | |
| | | | | | | | 1,463,477 | |
Total Corporate Bonds (Cost $11,560,529) | | | | 12,020,416 | |
|
| Asset-Backed 5.6% | |
| Automobile Receivables 3.8% | |
| | |
AmeriCredit Automobile Receivables Trust, “C”, Series2019-2, 2.74%, 4/18/2025 | | | 720,000 | | | | 726,368 | |
| | |
Avis Budget Rental Car Funding AESOP LLC, “C”, Series2019-1A, 144A, 4.53%, 3/20/2023 | | | 100,000 | | | | 102,541 | |
The accompanying notes are an integral part of the financial statements.
| | | | |
Deutsche DWS Variable Series II — DWS Global Income Builder VIP | | | | | 13 |
| | | | | | | | |
| | | Principal
Amount ($)(b) | | | Value ($) | |
| | |
CPS Auto Receivables Trust, “E”, Series2015-C, 144A, 6.54%, 8/16/2021 | | | 500,000 | | | | 513,192 | |
| | |
Flagship Credit Auto Trust, “C”, Series2019-4, 144A, 2.77%, 12/15/2025 | | | 1,100,000 | | | | 1,098,945 | |
| | |
Ford Credit Floorplan Master Owner Trust A, “A”, Series2019-4, 2.44%, 9/15/2026 | | | 720,000 | | | | 721,877 | |
|
Hertz Vehicle Financing II LP: | |
| | |
“A”, Series2018-1A, 144A, 3.29%, 2/25/2024 | | | 500,000 | | | | 511,717 | |
| | |
“B”, Series2017-2A, 144A, 4.2%, 10/25/2023 | | | 500,000 | | | | 517,168 | |
| | |
Hyundai Auto Receivables Trust, “C”, Series2019-B, 2.4%, 6/15/2026 | | | 500,000 | | | | 498,958 | |
| | |
Santander Drive Auto Receivables Trust, “C”, Series2019-1, 3.42%, 4/15/2025 | | | 250,000 | | | | 254,050 | |
| | | | | |
| | | | | | | 4,944,816 | |
|
| Miscellaneous 1.8% | |
| | |
DB Master Finance LLC, “A2I”, Series2019-1A, 144A, 3.787%, 5/20/2049 | | | 218,900 | | | | 223,573 | |
| | |
Dell Equipment Finance Trust, “D”, Series2017-1, 144A, 3.44%, 4/24/2023 | | | 280,000 | | | | 280,361 | |
| | |
Domino’s Pizza Master Issuer LLC, “A23”, Series2017-1A, 144A, 4.118%, 7/25/2047 | | | 333,200 | | | | 345,142 | |
| | |
GMF Floorplan Owner Revolving Trust, “C”, Series2019-1, 144A, 3.06%, 4/15/2024 | | | 260,000 | | | | 263,930 | |
| | |
Hilton Grand Vacations Trust, “B”, Series2014-AA, 144A, 2.07%, 11/25/2026 | | | 65,395 | | | | 65,122 | |
| | |
MVW Owner Trust, “A”, Series2019-1A, 144A, 2.89%, 11/20/2036 | | | 472,444 | | | | 478,381 | |
| | |
Taco Bell Funding LLC, “A2I”, Series2018-1A, 144A, 4.318%, 11/25/2048 | | | 495,000 | | | | 506,474 | |
| | |
Wendy’s Funding LLC, “A2I”, Series2018-1A, 144A, 3.573%, 3/15/2048 | | | 156,800 | | | | 158,438 | |
| | | | | | | | |
| | | | | | | | 2,321,421 | |
Total Asset-Backed (Cost $7,213,563) | | | | 7,266,237 | |
|
| Mortgage-Backed SecuritiesPass-Throughs 0.9% | |
| | |
Federal Home Loan Mortgage Corp., 6.0%, 3/1/2038 | | | 2,755 | | | | 3,171 | |
|
Federal National Mortgage Association: | |
| | |
3.5%, 10/1/2049 | | | 1,180,037 | | | | 1,213,979 | |
| | |
4.5%, 9/1/2035 | | | 4,928 | | | | 5,280 | |
| | |
6.0%, 1/1/2024 | | | 6,344 | | | | 6,700 | |
Total Mortgage-Backed Securities Pass-Throughs (Cost $1,225,687) | | | | 1,229,130 | |
| | | | | | | | |
| | | Principal
Amount ($)(b) | | | Value ($) | |
|
| Commercial Mortgage-Backed Securities 5.2% | |
| | |
Barclays Commercial Mortgage Trust, “A4”, Series2019-C5, 3.063%, 11/15/2052 | | | 800,000 | | | | 826,029 | |
| | |
Benchmark Mortgage Trust, “A4” Series2019-B13, 2.952%, 8/15/2057 | | | 1,400,000 | | | | 1,433,526 | |
| | |
BX Commercial Mortgage Trust, “D”, Series2018-IND, 144A,1-monthUSD-LIBOR + 1.300%, 3.04%**, 11/15/2035 | | | 175,000 | | | | 175,052 | |
| | |
Citigroup Commercial Mortgage Trust, “D”, Series2019-PRM, 144A, 4.35%, 5/10/2036 | | | 500,000 | | | | 519,722 | |
| | |
CSAIL Commercial Mortgage Trust, “B”, Series2019-C15, 4.476%, 3/15/2052 | | | 500,000 | | | | 546,925 | |
| | |
DBWF Mortgage Trust, “C”, Series 2018-GLKS, 144A,1-monthUSD-LIBOR + 1.750%, 3.514%**, 11/19/2035 | | | 250,000 | | | | 250,008 | |
| | |
FHLMC Multifamily Structured Pass-Through Certificates: | | | | | | | | |
| | |
“X1”, Series K043, Interest Only, 0.537%, 12/25/2024 | | | 4,873,062 | | | | 114,459 | |
| | |
“X1P”, Series KL05, Interest Only, 0.892%, 6/25/2029 | | | 4,800,000 | | | | 348,726 | |
| | |
GMAC Commercial Mortgage Securities, Inc., “G”, Series2004-C1, 144A, 5.455%, 3/10/2038 | | | 394,448 | | | | 376,387 | |
| | |
Morgan Stanley Capital I Trust, “A4” Series2019-L3, 3.127%, 11/15/2029 | | | 1,100,000 | | | | 1,135,169 | |
| | |
MTRO Commercial Mortgage Trust, “C”, Series 2019-TECH, 144A,1-monthUSD-LIBOR + 1.300%, 3.04%**, 12/15/2033 | | | 250,000 | | | | 249,374 | |
| | |
Multifamily Connecticut Avenue Securities Trust, “M7”, Series2019-01, 144A,1-monthUSD-LIBOR + 1.700%, 3.492%**, 10/15/2049 | | | 399,366 | | | | 400,878 | |
| | |
NYT Mortgage Trust, “B”, Series2019-NYT, 144A,1-monthUSD-LIBOR + 1.400%, 3.14%**, 11/15/2035 | | | 350,000 | | | | 350,434 | |
Total Commercial Mortgage-Backed Securities (Cost $6,716,746) | | | | 6,726,689 | |
|
| Collateralized Mortgage Obligations 7.9% | |
|
Connecticut Avenue Securities Trust: | |
| | |
“1M2”, Series2019-R05, 144A,1-monthUSD-LIBOR + 2.000%, 3.792%**, 7/25/2039 | | | 850,000 | | | | 854,290 | |
| | |
“1M2”, Series2019-R03, 144A,1-monthUSD-LIBOR + 2.150%, 3.942%**, 9/25/2031 | | | 168,000 | | | | 169,265 | |
| | |
“1M2”, Series2019-R02, 144A,1-monthUSD-LIBOR + 2.300%, 4.092%**, 8/25/2031 | | | 256,667 | | | | 259,037 | |
The accompanying notes are an integral part of the financial statements.
| | | | | | |
| | 14 | | | | | | Deutsche DWS Variable Series II — DWS Global Income Builder VIP |
| | | | | | | | |
| | | Principal
Amount ($)(b) | | | Value ($) | |
| | |
Fannie Mae Connecticut Avenue Securities: | | | | | | | | |
| | |
“1M2”, Series2018-C06,1-monthUSD-LIBOR + 2.000%, 3.792%**, 3/25/2031 | | | 177,945 | | | | 178,692 | |
| | |
“1M2”, Series2018-C01,1-monthUSD-LIBOR + 2.250%, 4.042%**, 7/25/2030 | | | 172,000 | | | | 174,262 | |
| | |
“1M2”, Series2018-C05,1-monthUSD-LIBOR + 2.350%, 4.142%**, 1/25/2031 | | | 500,000 | | | | 507,125 | |
| | |
Federal Home Loan Mortgage Corp.: | | | | | | | | |
| | |
“GV”, Series 4827, 4.0%, 7/15/2031 | | | 678,945 | | | | 708,716 | |
| | |
“AS”, Series 4885, Interest Only, 6.050% minus 1-month USD LIBOR 4.31%**, 6/15/2049 | | | 1,378,614 | | | | 289,447 | |
| | |
“PI”, Series 3843, Interest Only, 4.5%, 5/15/2038 | | | 85,909 | | | | 2,549 | |
| | |
“C31”, Series 303, Interest Only, 4.5%, 12/15/2042 | | | 902,642 | | | | 145,359 | |
| | |
“H”, Series 2278, 6.5%, 1/15/2031 | | | 106 | | | | 114 | |
| | |
Federal National Mortgage Association: | | | | | | | | |
| | |
“WO”, Series2013-27, Principal Only, Zero Coupon, 12/25/2042 | | | 220,000 | | | | 143,402 | |
| | |
“4”, Series 406, Interest Only, 4.0%, 9/25/2040 | | | 396,629 | | | | 62,261 | |
| | |
“I”, Series2003-84, Interest Only, 6.0%, 9/25/2033 | | | 92,391 | | | | 16,616 | |
| | |
Freddie Mac Structured Agency Credit Risk Debt Notes: | | | | | | | | |
| | |
“M2”, Series 2019-DNA3, 144A,1-monthUSD-LIBOR + 2.050%, 3.842%**, 7/25/2049 | | | 400,000 | | | | 401,853 | |
| | |
“M2”, Series 2019-DNA2, 144A,1-monthUSD-LIBOR + 2.450%, 4.242%**, 3/25/2049 | | | 636,020 | | | | 641,606 | |
| | |
“M2”, Series 2019-DNA1, 144A,1-monthUSD-LIBOR + 2.650%, 4.442%**, 1/25/2049 | | | 60,000 | | | | 61,089 | |
| | |
Government National Mortgage Association: | | | | | | | | |
| | |
“PI”, Series2015-40, Interest Only, 4.0%, 4/20/2044 | | | 162,942 | | | | 11,711 | |
| | |
“IN”, Series2009-69, Interest Only, 5.5%, 8/20/2039 | | | 143,861 | | | | 24,832 | |
| | |
“IV”, Series2009-69, Interest Only, 5.5%, 8/20/2039 | | | 138,245 | | | | 23,852 | |
| | |
“IJ”, Series2009-75, Interest Only, 6.0%, 8/16/2039 | | | 95,721 | | | | 16,487 | |
|
JPMorgan Mortgage Trust: | |
| | |
“A11”, Series2019-9, 144A,1-monthUSD-LIBOR + 0.900%, 2.603%**, 5/25/2050 | | | 295,909 | | | | 294,570 | |
| | |
“AM”, Series2016-3, 144A, 3.374%, 10/25/2046 | | | 633,950 | | | | 642,128 | |
| | | | | | | | |
| | | Principal
Amount ($)(b) | | | Value ($) | |
| | |
“A3”, Series 2019-INV3, 144A, 3.5%, 5/25/2050 | | | 1,200,000 | | | | 1,223,063 | |
| | |
“A4”, Series2019-2, 144A, 4.0%, 8/25/2049 | | | 1,075,630 | | | | 1,081,470 | |
|
New Residential Mortgage Loan: | |
| | |
“A1”, Series 2019-NQM3, 144A, 2.802%, 7/25/2049 | | | 450,336 | | | | 450,910 | |
| | |
“A1”, Series 2019-NQM2, 144A, 3.6%, 4/25/2049 | | | 161,418 | | | | 162,657 | |
|
Sequoia Mortgage Trust: | |
| | |
“A4”, Series2018-7, 144A, 4.0%, 9/25/2048 | | | 662,114 | | | | 665,957 | |
| | |
“A4”, Series2018-8, 144A, 4.0%, 11/25/2048 | | | 215,307 | | | | 217,014 | |
| | |
STACR Trust, “M2”, Series 2018-DNA3, 144A,1-monthUSD-LIBOR + 2.100%, 3.892%**, 9/25/2048 | | | 324,324 | | | | 326,912 | |
| | |
Verus Securitization Trust, “A1”, Series 2019-INV1, 144A, 3.402%, 12/25/2059 | | | 484,221 | | | | 487,149 | |
Total Collateralized Mortgage Obligations (Cost $10,005,527) | | | | 10,244,395 | |
|
| Government & Agency Obligations 0.6% | |
| Sovereign Bonds | |
| | |
Republic of Indonesia, 4.45%, 2/11/2024 | | | 225,000 | | | | 242,262 | |
| | |
Republic of Kazakhstan, 144A, 1.55%, 11/9/2023 | | | EUR 270,000 | | | | 316,749 | |
| | |
Republic of South Africa, 4.875%, 4/14/2026 | | | 200,000 | | | | 208,076 | |
Total Government & Agency Obligations (Cost $742,205) | | | | 767,087 | |
|
| Short-Term U.S. Treasury Obligations 2.2% | |
|
U.S. Treasury Bills: | |
| | |
1.598%***, 9/10/2020 (e) | | | 1,200,000 | | | | 1,187,232 | |
| | |
1.806%***, 7/16/2020 (f) | | | 1,723,000 | | | | 1,708,589 | |
Total Short-Term U.S. Treasury Obligations (Cost $2,892,500) | | | | 2,895,821 | |
| | |
| | | Shares | | | Value ($) | |
| Exchange-Traded Funds 2.8% | |
SPDR Bloomberg Barclays Convertible Securities ETF (Cost $3,528,968) | | | 66,160 | | | | 3,671,880 | |
|
| Securities Lending Collateral 0.8% | |
DWS Government & Agency Securities Portfolio “DWS Government Cash Institutional Shares”, 1.50% (g) (h) (Cost $1,105,478) | | | 1,105,478 | | | | 1,105,478 | |
The accompanying notes are an integral part of the financial statements.
| | | | |
Deutsche DWS Variable Series II — DWS Global Income Builder VIP | | | | | 15 |
| | | | | | | | |
| | |
| | | Shares | | | Value ($) | |
|
| Cash Equivalents 1.2% | |
DWS Central Cash Management Government Fund, 1.62% (g) (Cost $1,544,128) | | | 1,544,128 | | | | 1,544,128 | |
| | |
| | | % of
Net Assets | | | Value ($) | |
Total Investment Portfolio (Cost $112,944,143) | | | 100.2 | | | | 130,170,412 | |
| Other Assets and Liabilities, Net | | | (0.2 | ) | | | (322,137 | ) |
| Net Assets | | | 100.0 | | | | 129,848,275 | |
A summary of the Fund’s transactions with affiliated investments during the year ended December 31, 2019 are as follows:
| | | | | | | | | | | | | | | | | | | | | | | | | | | | | | | | |
Value ($) at
12/31/2018 | | Purchases
Cost ($) | | | Sales
Proceeds ($) | | | Net
Realized
Gain/
(Loss) ($) | | | Net Change in
Unrealized
Appreciation
(Depreciation) ($) | | | Income ($) | | | Capital Gain
Distributions ($) | | | Number
of Shares
at
12/31/2019 | | | Value ($)
at
12/31/2019 | |
Securities Lending Collateral 0.8% | |
DWS Government & Agency Securities Portfolio “DWS Government Cash Institutional Shares”, 1.50% (g) (h) | |
| 2,070,696 | | | — | | | | 965,218 | (i) | | | — | | | | — | | | | 18,414 | | | | — | | | | 1,105,478 | | | | 1,105,478 | |
Cash Equivalents 1.2% | |
DWS Central Cash Management Government Fund, 1.62% (g) | |
| 2,297,660 | | | 71,962,781 | | | | 72,716,313 | | | | — | | | | — | | | | 84,222 | | | | — | | | | 1,544,128 | | | | 1,544,128 | |
| 4,368,356 | | | 71,962,781 | | | | 73,681,531 | | | | — | | | | — | | | | 102,636 | | | | — | | | | 2,649,606 | | | | 2,649,606 | |
| * | Non-income producing security. |
| ** | Variable or floating rate security. These securities are shown at their current rate as of December 31, 2019. For securities based on a published reference rate and spread, the reference rate and spread are indicated within the description above. Certain variable rate securities are not based on a published reference rate and spread but adjust periodically based on current market conditions, prepayment of underlying positions and/or other variables. |
| *** | Annualized yield at time of purchase; not a coupon rate. |
| (a) | All or a portion of these securities were on loan. In addition, “Other Assets and Liabilities, Net” may include pending sales that are also on loan. The value of securities loaned at December 31, 2019 amounted to $1,047,048, which is 0.8% of net assets. |
| (b) | Principal amount stated in U.S. dollars unless otherwise noted. |
| (c) | Perpetual, callable security with no stated maturity date. |
| (d) | Investment was valued using significant unobservable inputs. |
| (e) | At December 31, 2019, this security has been pledged, in whole or in part, to cover initial margin requirements for open centrally cleared swap contracts. |
| (f) | At December 31, 2019, this security has been pledged, in whole or in part, to cover initial margin requirements for open futures contracts. |
| (g) | Affiliated fund managed by DWS Investment Management Americas, Inc. The rate shown is the annualizedseven-day yield at period end. |
| (h) | Represents cash collateral held in connection with securities lending. Income earned by the Fund is net of borrower rebates. |
| (i) | Represents the net increase (purchase cost) or decrease (sales proceeds) in the amount invested in cash collateral for the year ended December 31, 2019. |
144A: Security exempt from registration under Rule 144A of the Securities Act of 1933. These securities may be resold in transactions exempt from registration, normally to qualified institutional buyers.
ADR: American Depositary Receipt
ASX: Australian Securities Exchange
CVA: Certificaten Van Aandelen (Certificate of Stock)
GDR: Global Depositary Receipt
Interest Only: Interest Only (IO) bonds represent the “interest only” portion of payments on a pool of underlying mortgages or mortgage-backed securities. IO securities are subject to prepayment risk of the pool of underlying mortgages.
LIBOR: London Interbank Offered Rate
MSCI: Morgan Stanley Capital International
Principal Only: Principal Only (PO) bonds represent the “principal only” portion of payments on a pool of underlying mortgages or mortgage-backed securities.
REIT: Real Estate Investment Trust
S&P: Standard & Poor’s
SPDR: Standard & Poor’s Depositary Receipt
The accompanying notes are an integral part of the financial statements.
| | | | | | |
| | 16 | | | | | | Deutsche DWS Variable Series II — DWS Global Income Builder VIP |
Included in the portfolio are investments in mortgage or asset-backed securities which are interests in separate pools of mortgages or assets. Effective maturities of these investments may be shorter than stated maturities due to prepayments.
At December 31, 2019, open futures contracts purchased were as follows:
| | | | | | | | | | | | | | | | | | | | | | | | |
| Futures | | Currency | | | Expiration
Date | | | Contracts | | | Notional
Amount ($) | | | Notional
Value ($) | | | Unrealized
Appreciation
(Depreciation) ($) | |
| 10 Year U.S. Treasury Note | | | USD | | | | 3/20/2020 | | | | 32 | | | | 4,152,083 | | | | 4,109,500 | | | | (42,583 | ) |
| 2 Year U.S. Treasury Note | | | USD | | | | 3/31/2020 | | | | 117 | | | | 25,230,236 | | | | 25,213,500 | | | | (16,736 | ) |
| 3 Month Euro Euribor Interest Rate | | | EUR | | | | 12/14/2020 | | | | 2 | | | | 563,181 | | | | 562,897 | | | | (284 | ) |
| 3 Month Euro Swiss Franc (Euroswiss) Interest Rate | | | CHF | | | | 12/14/2020 | | | | 2 | | | | 520,670 | | | | 520,200 | | | | (470 | ) |
| 3 Month Euroyen | | | JPY | | | | 12/14/2020 | | | | 2 | | | | 460,110 | | | | 460,034 | | | | (76 | ) |
| 3 Month Sterling (Short Sterling) Interest Rate | | | GBP | | | | 12/16/2020 | | | | 3 | | | | 493,054 | | | | 493,223 | | | | 169 | |
| 5 Year U.S. Treasury Note | | | USD | | | | 3/31/2020 | | | | 21 | | | | 2,502,497 | | | | 2,490,797 | | | | (11,700 | ) |
| 90 Day Eurodollar Time Deposit | | | USD | | | | 12/14/2020 | | | | 2 | | | | 492,781 | | | | 491,900 | | | | (881 | ) |
| ASX 90 Day Bank Accepted Bills | | | AUD | | | | 12/10/2020 | | | | 3 | | | | 2,101,784 | | | | 2,100,795 | | | | (989 | ) |
| MSCI Mini Emerging Market Index | | | USD | | | | 3/20/2020 | | | | 53 | | | | 2,914,630 | | | | 2,968,530 | | | | 53,900 | |
| Ultra Long U.S. Treasury Bond | | | USD | | | | 3/20/2020 | | | | 16 | | | | 2,993,173 | | | | 2,906,500 | | | | (86,673 | ) |
| Total net unrealized depreciation | | | | (106,323 | ) |
At December 31, 2019, open futures contracts sold were as follows:
| | | | | | | | | | | | | | | | | | | | | | | | |
| Futures | | Currency | | | Expiration
Date | | | Contracts | | | Notional
Amount ($) | | | Notional
Value ($) | | | Unrealized
Appreciation
(Depreciation) ($) | |
| Euro Stoxx 50 Index | | | EUR | | | | 3/20/2020 | | | | 101 | | | | 4,256,180 | | | | 4,224,647 | | | | 31,533 | |
| S&P 500E-Mini Index | | | USD | | | | 3/20/2020 | | | | 11 | | | | 1,746,552 | | | | 1,777,105 | | | | (30,553 | ) |
| TOPIX Index | | | JPY | | | | 3/12/2020 | | | | 5 | | | | 789,079 | | | | 791,956 | | | | (2,877 | ) |
| Ultra 10 Year U.S. Treasury Note | | | USD | | | | 3/20/2020 | | | | 39 | | | | 5,541,648 | | | | 5,487,422 | | | | 54,226 | |
| Total net unrealized appreciation | | | | 52,329 | |
At December 31, 2019, open credit default swap contracts sold were as follows:
| | | | | | | | | | | | | | | | | | | | | | | | |
| Bilateral Swaps | |
Underlying
Reference
Obligation | | Fixed Cash
Flows Received/
Frequency | | Counterparty/
Expiration Date | | Notional
Amount (j) | | | Currency | | | Value ($) | | | Upfront
Payments
Received ($) | | | Unrealized
Appreciation ($) | |
| | | | | | | |
| Markit Commercial Mortgage Backed Securities Index Series 12 | | 2.0%/Monthly | | Morgan Stanley
8/17/2061 | | | 500,000 | | | | USD | | | | (1,837) | | | | (15,207) | | | | 13,370 | |
| (j) | The maximum potential amount of future undiscounted payments that the Fund could be required to make under a credit default swap contract would be the notional amount of the contract. These potential amounts would be partially offset by any recovery values of the referenced debt obligation or net amounts received from the settlement of buy protection credit default swap contracts entered into by the Fund for the same referenced debt obligation, if any. |
At December 31, 2019, open interest rate swap contracts were as follows:
| | | | | | | | | | | | | | | | | | | | |
| Centrally Cleared Swaps | |
Cash Flows
Paid by
the Fund/
Frequency | | Cash Flows
Received by
the Fund/
Frequency | | Effective/
Expiration
Date | | Notional
Amount ($) | | Currency | | Value ($) | | | Upfront
Payments
Paid/
(Received) ($) | | | Unrealized
Depreciation ($) | |
Fixed — 1.961%
Semi-Annually | | Floating — 3-Month LIBOR Quarterly | | 6/28/2019
6/28/2029 | | 400,000 | | USD | | | (3,250) | | | | — | | | | (3,250) | |
Fixed —2.729%
Semi-Annually | | Floating —3-Month LIBOR Quarterly | | 3/4/2019
3/5/2029 | | 400,000 | | USD | | | (32,739) | | | | — | | | | (32,739) | |
| Total unrealized depreciation | | | | (35,989) | |
LIBOR: London Interbank Offered Rate;3-Month LIBOR rate at December 30, 2019 is 1.908%.
The accompanying notes are an integral part of the financial statements.
| | | | |
Deutsche DWS Variable Series II — DWS Global Income Builder VIP | | | | | 17 |
As of December 31, 2019, the Fund had the following open forward foreign currency contracts:
| | | | | | | | | | | | | | | | | | | | | | |
| Contracts to Deliver | | | In Exchange For | | | Settlement
Date | | | Unrealized
Depreciation ($) | | | Counterparty |
| EUR | | | 567,000 | | | | USD | | | | 632,083 | | | | 2/19/2020 | | | | (5,783 | ) | | Bank of America |
Currency Abbreviations
For information on the Fund’s policy and additional disclosures regarding futures contracts, credit default swap contracts, interest rate swap contracts and forward foreign currency contracts, please refer to the Derivatives section of Note B in the accompanying Notes to Financial Statements.
Fair Value Measurements
Various inputs are used in determining the value of the Fund’s investments. These inputs are summarized in three broad levels. Level 1 includes quoted prices in active markets for identical securities. Level 2 includes other significant observable inputs (including quoted prices for similar securities, interest rates, prepayment speeds and credit risk). Level 3 includes significant unobservable inputs (including the Fund’s own assumptions in determining the fair value of investments). The level assigned to the securities valuations may not be an indication of the risk or liquidity associated with investing in those securities.
The following is a summary of the inputs used as of December 31, 2019 in valuing the Fund’s investments. For information on the Fund’s policy regarding the valuation of investments, please refer to the Security Valuation section of Note A in the accompanying Notes to Financial Statements.
| | | | | | | | | | | | | | | | |
| Assets | | Level 1 | | | Level 2 | | | Level 3 | | | Total | |
| Common Stocks (k) | | | | | | | | | | | | | | | | |
Communication Services | | $ | 4,800,983 | | | $ | 2,672,738 | | | $ | — | | | $ | 7,473,721 | |
Consumer Discretionary | | | 5,443,216 | | | | 2,407,271 | | | | — | | | | 7,850,487 | |
Consumer Staples | | | 3,760,304 | | | | 1,340,807 | | | | — | | | | 5,101,111 | |
Energy | | | 2,353,150 | | | | 1,702,216 | | | | — | | | | 4,055,366 | |
Financials | | | 4,750,151 | | | | 7,258,779 | | | | — | | | | 12,008,930 | |
Health Care | | | 4,825,385 | | | | 2,627,890 | | | | — | | | | 7,453,275 | |
Industrials | | | 3,410,433 | | | | 2,888,877 | | | | — | | | | 6,299,310 | |
Information Technology | | | 12,598,566 | | | | 1,592,041 | | | | — | | | | 14,190,607 | |
Materials | | | 1,549,041 | | | | 1,999,125 | | | | — | | | | 3,548,166 | |
Real Estate | | | 2,673,764 | | | | 1,089,125 | | | | — | | | | 3,762,889 | |
Utilities | | | 3,057,908 | | | | 2,086,385 | | | | — | | | | 5,144,293 | |
| Preferred Stocks (k) | | | 5,804,497 | | | | — | | | | — | | | | 5,804,497 | |
| Warrants | | | — | | | | — | | | | 6,499 | | | | 6,499 | |
| Fixed Income Investments (k) | | | | | | | | | | | | | | | | |
Corporate Bonds | | | — | | | | 12,020,416 | | | | — | | | | 12,020,416 | |
Asset-Backed | | | — | | | | 7,266,237 | | | | — | | | | 7,266,237 | |
Mortgage-Backed Securities Pass-Throughs | | | — | | | | 1,229,130 | | | | — | | | | 1,229,130 | |
Commercial Mortgage-Backed Securities | | | — | | | | 6,726,689 | | | | — | | | | 6,726,689 | |
Collateralized Mortgage Obligations | | | — | | | | 10,244,395 | | | | — | | | | 10,244,395 | |
Government & Agency Obligations | | | — | | | | 767,087 | | | | — | | | | 767,087 | |
Short-Term U.S. Treasury Obligations | | | — | | | | 2,895,821 | | | | — | | | | 2,895,821 | |
| Exchange-Traded Funds | | | 3,671,880 | | | | — | | | | — | | | | 3,671,880 | |
| Short-Term Investments (k) | | | 2,649,606 | | | | — | | | | — | | | | 2,649,606 | |
| Derivatives (l) | | | | | | | | | | | | | | | | |
Futures Contracts | | | 139,828 | | | | — | | | | — | | | | 139,828 | |
Credit Default Swap Contracts | | | — | | | | 13,370 | | | | — | | | | 13,370 | |
| Total | | $ | 61,488,712 | | | $ | 68,828,399 | | | $ | 6,499 | | | $ | 130,323,610 | |
| | | | |
| Liabilities | | Level 1 | | | Level 2 | | | Level 3 | | | Total | |
| Derivatives (l) | | | | | | | | | | | | | | | | |
Futures Contracts | | $ | (193,822 | ) | | $ | — | | | $ | — | | | $ | (193,822 | ) |
Interest Rate Swap Contracts | | | — | | | | (35,989 | ) | | | — | | | | (35,989 | ) |
Forward Foreign Currency Contracts | | | — | | | | (5,783 | ) | | | — | | | | (5,783 | ) |
| Total | | $ | (193,822 | ) | | $ | (41,772 | ) | | $ | — | | | $ | (235,594 | ) |
| (k) | See Investment Portfolio for additional detailed categorizations. |
| (l) | Derivatives include unrealized appreciation (depreciation) on open futures contracts, credit default swap contracts, interest rate swap contracts and forward foreign currency contracts. |
The accompanying notes are an integral part of the financial statements.
| | | | | | |
| | 18 | | | | | | Deutsche DWS Variable Series II — DWS Global Income Builder VIP |
Statement of Assets and Liabilities
| | | | |
| as of December 31, 2019 | | | | |
| |
| Assets | | | | |
| Investments innon-affiliated securities, at value (cost $110,294,537) — including $1,047,048 of securities loaned | | $ | 127,520,806 | |
| Investment in DWS Government & Agency Securities Portfolio (cost $1,105,478)* | | | 1,105,478 | |
| Investment in DWS Central Cash Management Government Fund (cost $1,544,128) | | | 1,544,128 | |
| Cash | | | 98,271 | |
| Foreign currency, at value (cost $506,646) | | | 509,124 | |
| Receivable for Fund shares sold | | | 701 | |
| Dividends receivable | | | 178,375 | |
| Interest receivable | | | 203,956 | |
| Receivable for variation margin on centrally cleared swaps | | | 8,597 | |
| Unrealized appreciation on bilateral swap contracts | | | 13,370 | |
| Foreign taxes recoverable | | | 76,644 | |
| Other assets | | | 3,077 | |
| Total assets | | | 131,262,527 | |
| |
| Liabilities | | | | |
| Payable upon return of securities loaned | | | 1,105,478 | |
| Payable for Fund shares redeemed | | | 53,571 | |
| Payable for variation margin on futures contracts | | | 2,140 | |
| Unrealized depreciation on forward foreign currency contracts | | | 5,783 | |
| Upfront payments received on swap contracts | | | 15,207 | |
| Accrued management fee | | | 40,592 | |
| Accrued Trustees’ fees | | | 3,242 | |
| Other accrued expenses and payables | | | 188,239 | |
| Total liabilities | | | 1,414,252 | |
| Net assets, at value | | $ | 129,848,275 | |
|
| Net Assets Consist of | |
| Distributable earnings (loss) | | | 23,283,542 | |
| Paid-in capital | | | 106,564,733 | |
| Net assets, at value | | $ | 129,848,275 | |
|
| Net Asset Value | |
Class A | |
| |
| Net Asset Value,offering and redemption price per share ($129,836,991 ÷ 5,271,275 outstanding shares of beneficial interest, no par value, unlimited number of shares authorized) | | $ | 24.63 | |
Class B | |
| |
| Net Asset Value,offering and redemption price per share ($11,284 ÷ 458.6 outstanding shares of beneficial interest, no par value, unlimited number of shares authorized) | | $ | 24.61 | |
| * | Represents collateral on securities loaned. |
The accompanying notes are an integral part of the financial statements.
| | | | |
Deutsche DWS Variable Series II — DWS Global Income Builder VIP | | | | | 19 |
Statement of Operations
| | | | |
| for the year ended December 31, 2019 | |
| |
| Investment Income | | | | |
| Income: | |
| Dividends (net of foreign taxes withheld of $142,000) | | $ | 2,928,492 | |
| Interest | | | 1,617,231 | |
| Income distributions — DWS Central Cash Management Government Fund | | | 84,222 | |
| Securities lending income, net of borrower rebates | | | 18,414 | |
| Total income | | | 4,648,359 | |
| Expenses: | | | | |
| Management fee | | | 473,154 | |
| Administration fee | | | 127,880 | |
| Services to Shareholders | | | 782 | |
| Distribution service fees (Class B) | | | 26 | |
| Custodian fee | | | 61,136 | |
| Professional fees | | | 103,122 | |
| Reports to shareholders | | | 55,368 | |
| Trustees’ fees and expenses | | | 7,095 | |
| Other | | | 44,163 | |
| Total expenses before expense reductions | | | 872,726 | |
| Expense reductions | | | (25 | ) |
| Total expenses after expense reductions | | | 872,701 | |
| Net investment income | | | 3,775,658 | |
| |
| Realized and Unrealized Gain (Loss) | | | | |
| Net realized gain (loss) from: | | | | |
| Investments | | | 1,209,759 | |
| Swap contracts | | | (143,938 | ) |
| Futures | | | 1,274,090 | |
| Forward foreign currency contracts | | | 17,110 | |
| Foreign currency | | | 385 | |
| Payments by affiliates (see Note G) | | | 1,511 | |
| | | | 2,358,917 | |
| Change in net unrealized appreciation (depreciation) on: | | | | |
| Investments | | | 16,839,481 | |
| Swap contracts | | | 85,781 | |
| Futures | | | 140,970 | |
| Forward foreign currency contracts | | | 33,823 | |
| Foreign currency | | | 7,366 | |
| | | | 17,107,421 | |
| Net gain (loss) | | | 19,466,338 | |
| Net increase (decrease) in net assets resulting from operations | | $ | 23,241,996 | |
The accompanying notes are an integral part of the financial statements.
| | | | | | |
| | 20 | | | | | | Deutsche DWS Variable Series II — DWS Global Income Builder VIP |
Statements of Changes in Net Assets
| | | | | | | | |
| | | Years Ended December 31, | |
| Increase (Decrease) in Net Assets | | 2019 | | | 2018 | |
| Operations: | | | | | | | | |
| Net investment income | | $ | 3,775,658 | | | $ | 4,562,853 | |
| Net realized gain (loss) | | | 2,358,917 | | | | 2,201,335 | |
| Change in net unrealized appreciation (depreciation) | | | 17,107,421 | | | | (16,929,613 | ) |
| Net increase (decrease) in net assets resulting from operations | | | 23,241,996 | | | | (10,165,425 | ) |
| Distributions to shareholders: | | | | | | | | |
Class A | | | (5,055,619 | ) | | | (17,909,607 | ) |
Class B | | | (391 | ) | | | — | |
| Total distributions | | | (5,056,010 | ) | | | (17,909,607 | ) |
| Fund share transactions: | | | | | | | | |
Class A | | | | | | | | |
| Proceeds from shares sold | | | 3,126,739 | | | | 2,336,008 | |
| Reinvestment of distributions | | | 5,055,619 | | | | 17,909,607 | |
| Payments for shares redeemed | | | (16,140,970 | ) | | | (19,079,316 | ) |
| Net increase (decrease) in net assets from Class A share transactions | | | (7,958,612 | ) | | | 1,166,299 | |
Class B | | | | | | | | |
| Reinvestment of distributions | | | 391 | | | | 10,000 | * |
| Net increase (decrease) in net assets from Class B share transactions | | | 391 | | | | 10,000 | * |
| Increase (decrease) in net assets | | | 10,227,765 | | | | (26,898,733 | ) |
| Net assets at beginning of period | | | 119,620,510 | | | | 146,519,243 | |
| | |
| Net assets at end of period | | $ | 129,848,275 | | | $ | 119,620,510 | |
|
| Other Information | |
Class A | |
| Shares outstanding at beginning of period | | | 5,608,755 | | | | 5,517,134 | |
| Shares sold | | | 133,321 | | | | 97,250 | |
| Shares issued to shareholders in reinvestment of distributions | | | 220,866 | | | | 796,691 | |
| Shares redeemed | | | (691,667 | ) | | | (802,320 | ) |
| Net increase (decrease) in Class A shares | | | (337,480 | ) | | | 91,621 | |
| | |
| Shares outstanding at end of period | | | 5,271,275 | | | | 5,608,755 | |
Class B | |
| Shares outstanding at beginning of period | | | 441.5 | | | | — | |
| Shares sold | | | 17.1 | | | | 441.5 | * |
| Net increase (decrease) in Class B shares | | | 17.1 | | | | 441.5 | * |
| | |
| Shares outstanding at end of period | | | 458.6 | | | | 441.5 | * |
| * | For the period from May 1, 2018 (commencement of operations of Class B) to December 31, 2018. |
The accompanying notes are an integral part of the financial statements.
| | | | |
Deutsche DWS Variable Series II — DWS Global Income Builder VIP | | | | | 21 |
Financial Highlights
| | | | | | | | | | | | | | | | | | | | |
| | | Years Ended December 31, | |
| Class A | | 2019 | | | 2018 | | | 2017 | | | 2016 | | | 2015 | |
| | | | | |
| Selected Per Share Data | | | | | | | | | | | | | | | | | | | | |
| Net asset value, beginning of period | | $ | 21.33 | | | $ | 26.56 | | | $ | 23.50 | | | $ | 22.93 | | | $ | 24.62 | |
| Income (loss) from investment operations: | | | | | | | | | | | | | | | | | | | | |
| | | | | |
Net investment incomea | | | .69 | | | | .80 | | | | .71 | | | | .61 | | | | .68 | |
Net realized and unrealized gain (loss) | | | 3.54 | | | | (2.67 | ) | | | 3.10 | | | | .91 | | | | (.97 | ) |
Total from investment operations | | | 4.23 | | | | (1.87 | ) | | | 3.81 | | | | 1.52 | | | | (.29 | ) |
| Less distributions from: | | | | | | | | | | | | | | | | | | | | |
| | | | | |
Net investment income | | | (.90 | ) | | | (.98 | ) | | | (.75 | ) | | | (.95 | ) | | | (.76 | ) |
Net realized gains | | | (.03 | ) | | | (2.38 | ) | | | — | | | | — | | | | (.64 | ) |
Total distributions | | | (.93 | ) | | | (3.36 | ) | | | (.75 | ) | | | (.95 | ) | | | (1.40 | ) |
| Net asset value, end of period | | $ | 24.63 | | | $ | 21.33 | | | $ | 26.56 | | | $ | 23.50 | | | $ | 22.93 | |
| Total Return (%) | | | 20.16 | | | | (7.66 | )b | | | 16.54 | | | | 6.81 | | | | (1.44 | )b |
| | | | | |
| Ratios to Average Net Assets and Supplemental Data | | | | | | | | | | | | | | | | | | | | |
| Net assets, end of period ($ millions) | | | 130 | | | | 120 | | | | 147 | | | | 185 | | | | 202 | |
| Ratio of expenses before expense reductions (%)c | | | .68 | | | | .69 | | | | .63 | | | | .62 | | | | .60 | |
| Ratio of expenses after expense reductions (%)c | | | .68 | | | | .68 | | | | .63 | | | | .62 | | | | .58 | |
| Ratio of net investment income (loss) (%) | | | 2.96 | | | | 3.34 | | | | 2.85 | | | | 2.66 | | | | 2.85 | |
| Portfolio turnover rate (%) | | | 182 | | | | 70 | | | | 122 | | | | 135 | | | | 92 | |
| a | Based on average shares outstanding during the period. |
| b | Total return would have been lower had certain expenses not been reduced. |
| c | Expense ratio does not reflect charges and fees associated with the separate account that invests in the Fund or any variable life insurance policy or variable annuity contract for which the Fund is an investment option. |
| | | | | | | | |
| Class B | | Year Ended
December 31,
2019 | | | Period
Ended
12/31/18a | |
| | |
| Selected Per Share Data | | | | | | | | |
| Net asset value, beginning of period | | $ | 21.30 | | | $ | 22.65 | |
| Income (loss) from investment operations: | | | | | | | | |
| | |
Net investment incomeb | | | .65 | | | | .50 | |
Net realized and unrealized gain (loss) | | | 3.55 | | | | (1.85 | ) |
Total from investment operations | | | 4.20 | | | | (1.35 | ) |
| Less distributions from: | | | | | | | | |
| | |
Net investment income | | | (.86 | ) | | | — | |
Net realized gains | | | (.03 | ) | | | — | |
Total distributions | | | (.89 | ) | | | — | |
| Net asset value, end of period | | $ | 24.61 | | | $ | 21.30 | |
| Total Return (%)c | | | 20.01 | | | | (5.96 | )** |
| | |
| Ratios to Average Net Assets and Supplemental Data | | | | | | | | |
| Net assets, end of period ($ thousands) | | | 11 | | | | 9 | |
| Ratio of expenses before expense reductions (%)d | | | 1.10 | | | | 1.15 | * |
| Ratio of expenses after expense reductions (%)d | | | .86 | | | | .86 | * |
| Ratio of net investment income (loss) (%) | | | 2.77 | | | | 3.30 | * |
| Portfolio turnover rate (%) | | | 182 | | | | 70 | e |
| a | For the period from May 1, 2018 (commencement of operations) to December 31, 2018. |
| b | Based on average shares outstanding during the period. |
| c | Total return would have been lower had certain expenses not been reduced. |
| d | Expense ratio does not reflect charges and fees associated with the separate account that invests in the Fund or any variable life insurance policy or variable annuity contract for which the Fund is an investment option. |
| e | Represents the Fund’s portfolio turnover rate for the year ended December 31, 2018. |
The accompanying notes are an integral part of the financial statements.
| | | | | | |
| | 22 | | | | | | Deutsche DWS Variable Series II — DWS Global Income Builder VIP |
| | | | |
| Notes to Financial Statements | | | | |
A. Organization and Significant Accounting Policies
DWS Global Income Builder VIP (the “Fund”) is a diversified series of Deutsche DWS Variable Series II (the “Trust”), which is registered under the Investment Company Act of 1940, as amended (the “1940 Act”), as an open-end management investment company organized as a Massachusetts business trust.
Multiple Classes of Shares of Beneficial Interest.The Fund offers two classes of shares (Class A shares and Class B shares). Sales of Class B shares are subject to recordkeeping fees up to 0.15% and Rule 12b-1 fees under the 1940 Act equal to an annual rate of 0.25% of the average daily net assets of the Class B shares of the Fund. Class A shares are not subject to such fees.
Investment income, realized and unrealized gains and losses, and certain fund-level expenses and expense reductions, if any, are borne pro rata on the basis of relative net assets by the holders of all classes of shares, except that each class bears certain expenses unique to that class (including the applicable Rule12b-1 distribution fees). Differences in class-level expenses may result in payment of different per share dividends by class. All shares have equal rights with respect to voting subject to class-specific arrangements.
The Fund’s financial statements are prepared in accordance with accounting principles generally accepted in the United States of America (“U.S. GAAP”) which require the use of management estimates. Actual results could differ from those estimates. The Fund qualifies as an investment company under Topic 946 of Accounting Standards Codification of U.S. GAAP. The policies described below are followed consistently by the Fund in the preparation of its financial statements.
Security Valuation. Investments are stated at value determined as of the close of regular trading on the New York Stock Exchange on each day the exchange is open for trading.
Various inputs are used in determining the value of the Fund’s investments. These inputs are summarized in three broad levels. Level 1 includes quoted prices in active markets for identical securities. Level 2 includes other significant observable inputs (including quoted prices for similar securities, interest rates, prepayment speeds and credit risk). Level 3 includes significant unobservable inputs (including the Fund’s own assumptions in determining the fair value of investments). The level assigned to the securities valuations may not be an indication of the risk or liquidity associated with investing in those securities.
Equity securities and Exchange-Traded Funds (“ETFs”) are valued at the most recent sale price or official closing price reported on the exchange (U.S. or foreign) or over-the-counter market on which they trade. Equity securities or ETFs for which no sales are reported are valued at the calculated mean between the most recent bid and asked quotations on the relevant market or, if a mean cannot be determined, at the most recent bid quotation. Equity securities and ETFs are generally categorized as Level 1. For certain international equity securities, in order to adjust for events which may occur between the close of the foreign exchanges and the close of the New York Stock Exchange, a fair valuation model may be used. This fair valuation model takes into account comparisons to the valuation of American Depository Receipts (ADRs), exchange-traded funds, futures contracts and certain indices and these securities are categorized as Level 2.
Debt securities are valued at prices supplied by independent pricing services approved by the Fund’s Board. Such services may use various pricing techniques which take into account appropriate factors such as yield, quality, coupon rate, maturity, type of issue, trading characteristics, prepayment speeds and other data, as well as broker quotes. If the pricing services are unable to provide valuations, debt securities are valued at the average of the most recent reliable bid quotations or evaluated prices, as applicable, obtained from broker-dealers. These securities are generally categorized as Level 2.
Investments in open-end investment companies are valued at their net asset value each business day and are categorized as Level 1.
Futures contracts are generally valued at the settlement prices established each day on the exchange on which they are traded and are categorized as Level 1.
Forward currency contracts are valued at the prevailing forward exchange rate of the underlying currencies and are categorized as Level 2.
Swap contracts are valued daily based upon prices supplied by a Board approved pricing vendor, if available, and otherwise are valued at the price provided by the broker-dealer. Swap contracts are generally categorized as Level 2.
| | | | |
Deutsche DWS Variable Series II — DWS Global Income Builder VIP | | | | | 23 |
Exchange-traded options are valued at the last sale price or, in the absence of a sale, the mean between the closing bid and asked prices or at the most recent asked price (bid for purchased options) if no bid or asked price are available. Exchange-traded options are categorized as Level 1. Over-the-counter written or purchased options are valued at prices supplied by a Board approved pricing vendor, if available, and otherwise are valued at the price provided by the broker-dealer with which the option was traded. Over-the-counter written or purchased options are generally categorized as Level 2.
Securities and other assets for which market quotations are not readily available or for which the above valuation procedures are deemed not to reflect fair value are valued in a manner that is intended to reflect their fair value as determined in accordance with procedures approved by the Board and are generally categorized as Level 3. In accordance with the Fund’s valuation procedures, factors considered in determining value may include, but are not limited to, the type of the security; the size of the holding; the initial cost of the security; the existence of any contractual restrictions on the security’s disposition; the price and extent of public trading in similar securities of the issuer or of comparable companies; quotations or evaluated prices from broker-dealers and/or pricing services; information obtained from the issuer, analysts, and/or the appropriate stock exchange (for exchange-traded securities); an analysis of the company’s or issuer’s financial statements; an evaluation of the forces that influence the issuer and the market(s) in which the security is purchased and sold; and with respect to debt securities, the maturity, coupon, creditworthiness, currency denomination and the movement of the market in which the security is normally traded. The value determined under these procedures may differ from published values for the same securities.
Disclosure about the classification of fair value measurements is included in a table following the Fund’s Investment Portfolio.
Foreign Currency Translations. The books and records of the Fund are maintained in U.S. dollars. Investment securities and other assets and liabilities denominated in a foreign currency are translated into U.S. dollars at the prevailing exchange rates at period end. Purchases and sales of investment securities, income and expenses are translated into U.S. dollars at the prevailing exchange rates on the respective dates of the transactions.
Net realized and unrealized gains and losses on foreign currency transactions represent net gains and losses between trade and settlement dates on securities transactions, the acquisition and disposition of foreign currencies, and the difference between the amount of net investment income accrued and the U.S. dollar amount actually received. The portion of both realized and unrealized gains and losses on investments that results from fluctuations in foreign currency exchange rates is not separately disclosed but is included with net realized and unrealized gain/appreciation and loss/depreciation on investments.
Securities Lending. Deutsche Bank AG, as lending agent, lends securities of the Fund to certain financial institutions under the terms of its securities lending agreement. During the term of the loans, the Fund continues to receive interest and dividends generated by the securities and to participate in any changes in their market value. The Fund requires the borrowers of the securities to maintain collateral with the Fund consisting of either cash or liquid, unencumbered assets having a value at least equal to the value of the securities loaned. When the collateral falls below specified amounts, the lending agent will use its best effort to obtain additional collateral on the next business day to meet required amounts under the securities lending agreement. As of period end, any securities on loan were collateralized by cash. During the year ended December 31, 2019, the Fund invested the cash collateral into a joint trading account in DWS Government & Agency Securities Portfolio, an affiliated money market fund managed by DWS Investment Management Americas, Inc. DWS Investment Management Americas, Inc. receives a management/administration fee (0.12% annualized effective rate as of December 31, 2019) on the cash collateral invested in DWS Government & Agency Securities Portfolio. The Fund receives compensation for lending its securities either in the form of fees or by earning interest on invested cash collateral net of borrower rebates and fees paid to a lending agent. Either the Fund or the borrower may terminate the loan at any time, and the borrower, after notice, is required to return borrowed securities within a standard time period. There may be risks of delay and costs in recovery of securities or even loss of rights in the collateral should the borrower of the securities fail financially. If the Fund is not able to recover securities lent, the Fund may sell the collateral and purchase a replacement investment in the market, incurring the risk that the value of the replacement security is greater than the value of the collateral. The Fund is also subject to all investment risks associated with the reinvestment of any cash collateral received, including, but not limited to, interest rate, credit and liquidity risk associated with such investments.
| | | | | | |
| | 24 | | | | | | Deutsche DWS Variable Series II — DWS Global Income Builder VIP |
As of December 31, 2019, the Fund had securities on loan, which were classified as common stocks and corporate bonds in the Investment Portfolio. The value of the related collateral exceeded the value of the securities loaned at period end.
| | | | | | | | | | | | | | | | | | | | |
| Remaining Contractual Maturity of the Agreementsas of December 31, 2019 | |
| | | Overnight
and
Continuous | | | <30 days | | | Between 30
& 90 days | | | >90 days | | | Total | |
Securities Lending Transactions | | | | | | | | | | | | | | | | | | | | |
| Common Stocks | | $ | 879,235 | | | $ | — | | | $ | — | | | $ | — | | | $ | 879,235 | |
| Corporate Bonds | | | 226,243 | | | | — | | | | — | | | | — | | | | 226,243 | |
| Total Borrowings | | $ | 1,105,478 | | | $ | — | | | $ | — | | | $ | — | | | $ | 1,105,478 | |
| | | |
Gross amount of recognized liabilities for securities lending transactions: | | | | | | | | | | | $ | 1,105,478 | |
When-Issued/Delayed Delivery Securities. The Fund may purchase or sell securities with delivery or payment to occur at a later date beyond the normal settlement period. At the time the Fund enters into a commitment to purchase or sell a security, the transaction is recorded and the value of the transaction is reflected in the net asset value. The price of such security and the date when the security will be delivered and paid for are fixed at the time the transaction is negotiated. The value of the security may vary with market fluctuations. At the time the Fund enters into a purchase transaction it is required to segregate cash or other liquid assets at least equal to the amount of the commitment. Additionally, the Fund may be required to post securities and/or cash collateral in accordance with the terms of the commitment.
Certain risks may arise upon entering into when-issued or delayed delivery transactions from the potential inability of counterparties to meet the terms of their contracts or if the issuer does not issue the securities due to political, economic or other factors. Additionally, losses may arise due to changes in the value of the underlying securities.
Taxes. The Fund’s policy is to comply with the requirements of the Internal Revenue Code, as amended, which are applicable to regulated investment companies and to distribute all of its taxable income to its shareholders.
Additionally, the Fund may be subject to taxes imposed by the governments of countries in which it invests and are generally based on income and/or capital gains earned or repatriated, a portion of which may be recoverable based upon the current interpretation of the tax rules and regulations. Estimated tax liabilities and recoveries on certain foreign securities are recorded on an accrual basis and are reflected as components of interest income or net change in unrealized gain/loss on investments. Tax liabilities realized as a result of security sales are reflected as a component of net realized gain/loss on investments.
The Fund has reviewed the tax positions for the open tax years as of December 31, 2019 and has determined that no provision for income tax and/or uncertain tax positions is required in the Fund’s financial statements. The Fund’s federal tax returns for the prior three fiscal years remain open subject to examination by the Internal Revenue Service.
Distribution of Income and Gains. Distributions from net investment income of the Fund, if any, are declared and distributed to shareholders annually. Net realized gains from investment transactions, in excess of available capital loss carryforwards, would be taxable to the Fund if not distributed and, therefore, will be distributed to shareholders at least annually. The Fund may also make additional distributions for tax purposes if necessary.
The timing and characterization of certain income and capital gain distributions are determined annually in accordance with federal tax regulations which may differ from accounting principles generally accepted in the United States of America. These differences primarily relate to investments in foreign denominated investments, forward currency contracts, futures contracts, swap contracts and certain securities sold at a loss. As a result, net investment income (loss) and net realized gain (loss) on investment transactions for a reporting period may differ significantly from distributions during such period. Accordingly, the Fund may periodically make reclassifications among certain of its capital accounts without impacting the net asset value of the Fund.
At December 31, 2019, the Fund’s components of distributable earnings on a tax basis were as follows:
| | | | |
| Undistributed ordinary income* | | $ | 4,845,598 | |
| Undistributed long-term capital gains | | $ | 1,686,663 | |
| Net unrealized appreciation (depreciation) on investments | | $ | 16,729,561 | |
| | | | |
Deutsche DWS Variable Series II — DWS Global Income Builder VIP | | | | | 25 |
At December 31, 2019, the aggregate cost of investments for federal income tax purposes was $113,404,844. The net unrealized appreciation for all investments based on tax cost was $16,729,561. This consisted of aggregate gross unrealized appreciation for all investments in which there was an excess of value over tax cost of $18,234,031 and aggregate gross unrealized depreciation for all investments in which there was an excess of tax cost over value of $1,504,470.
In addition, the tax character of distributions paid by the Fund is summarized as follows:
| | | | | | | | |
| | | Years Ended December 31, | |
| | | 2019 | | | 2018 | |
| Distributions from ordinary income* | | $ | 4,909,285 | | | $ | 9,573,430 | |
| Distributions from long-term capital gains | | $ | 146,725 | | | $ | 8,336,177 | |
| * | For tax purposes, short-term capital gain distributions are considered ordinary income distributions. |
Expenses. Expenses of the Trust arising in connection with a specific fund are allocated to that fund. Other Trust expenses which cannot be directly attributed to a fund are apportioned among the funds in the Trust based upon the relative net assets or other appropriate measures.
Contingencies. In the normal course of business, the Fund may enter into contracts with service providers that contain general indemnification clauses. The Fund’s maximum exposure under these arrangements is unknown, as this would involve future claims that may be made against the Fund that have not yet been made. However, based on experience, the Fund expects the risk of loss to be remote.
Other. Investment transactions are accounted for on a trade date plus one basis for daily net asset value calculations. However, for financial reporting purposes, investment transactions are reported on trade date. Interest income is recorded on the accrual basis. Dividend income is recorded on the ex-dividend date net of foreign withholding taxes. Certain dividends from foreign securities may be recorded subsequent to the ex-dividend date as soon as the Fund is informed of such dividends. Realized gains and losses from investment transactions are recorded on an identified cost basis. Proceeds from litigation payments, if any, are included in net realized gain (loss) from investments. All discounts and premiums are accreted/amortized for both tax and financial reporting purposes, with the exception of securities in default of principal.
B. Derivative Instruments
Swaps. A swap is a contract between two parties to exchange future cash flows at periodic intervals based on the notional amount of the swap. A bilateral swap is a transaction between the fund and a counterparty where cash flows are exchanged between the two parties. A centrally cleared swap is a transaction executed between the fund and a counterparty, then cleared by a clearing member through a central clearinghouse. The central clearinghouse serves as the counterparty, with whom the fund exchanges cash flows.
The value of a swap is adjusted daily, and the change in value, if any, is recorded as unrealized appreciation or depreciation in the Statement of Assets and Liabilities. Gains or losses are realized when the swap expires or is closed. Certain risks may arise when entering into swap transactions including counterparty default; liquidity; or unfavorable changes in interest rates or the value of the underlying reference security, commodity or index. In connection with bilateral swaps, securities and/or cash may be identified as collateral in accordance with the terms of the swap agreement to provide assets of value and recourse in the event of default. The maximum counterparty credit risk is the net present value of the cash flows to be received from or paid to the counterparty over the term of the swap, to the extent that this amount is beneficial to the Fund, in addition to any related collateral posted to the counterparty by the Fund. This risk may be partially reduced by a master netting arrangement between the Fund and the counterparty. Upon entering into a centrally cleared swap, the Fund is required to deposit with a financial intermediary cash or securities (“initial margin”) in an amount equal to a certain percentage of the notional amount of the swap. Subsequent payments (“variation margin”) are made or received by the Fund dependent upon the daily fluctuations in the value of the swap. In a cleared swap transaction, counterparty risk is minimized as the central clearinghouse acts as the counterparty.
An upfront payment, if any, made by the Fund is recorded as an asset in the Statement of Assets and Liabilities. An upfront payment, if any, received by the Fund is recorded as a liability in the Statement of Assets and Liabilities. Payments received or made at the end of the measurement period are recorded as realized gain or loss in the Statement of Operations.
| | | | | | |
| | 26 | | | | | | Deutsche DWS Variable Series II — DWS Global Income Builder VIP |
Interest Rate Swaps. Interest rate swaps are agreements in which the Fund agrees to pay to the counterparty a fixed rate payment in exchange for the counterparty agreeing to pay to the Fund a variable rate payment, or the Fund agrees to receive from the counterparty a fixed rate payment in exchange for the counterparty agreeing to receive from the Fund a variable rate payment. The payment obligations are based on the notional amount of the swap. For the year ended December 31, 2019, the Fund entered into interest rate swap agreements to gain exposure to different parts of the yield curve while managing overall duration.
A summary of the open interest rate swap contracts as of December 31, 2019 is included in a table following the Fund’s Investment Portfolio. For the year ended December 31, 2019, the investment in interest rate swap contracts had a total notional amount generally indicative of a range from $800,000 to $26,400,000.
Credit Default Swaps. Credit default swaps are agreements between a buyer and a seller of protection against predefined credit events for the reference entity. The Fund may enter into credit default swaps to gain exposure to an underlying issuer’s credit quality characteristics without directly investing in that issuer or to hedge against the risk of a credit event on debt securities. As a seller of a credit default swap, the Fund is required to pay the par (or other agreed-upon) value of the referenced entity to the counterparty with the occurrence of a credit event by a third party, such as a U.S. or foreign corporate issuer, on the reference entity, which would likely result in a loss to the Fund. In return, the Fund receives from the counterparty a periodic stream of payments over the term of the swap provided that no credit event has occurred. If no credit event occurs, the Fund keeps the stream of payments with no payment obligations. The Fund may also buy credit default swaps, in which case the Fund functions as the counterparty referenced above. This involves the risk that the swap may expire worthless. It also involves counterparty risk that the seller may fail to satisfy its payment obligations to the Fund with the occurrence of a credit event. When the Fund sells a credit default swap, it will cover its commitment. This may be achieved by, among other methods, maintaining cash or liquid assets equal to the aggregate notional value of the reference entities for all outstanding credit default swaps sold by the Fund. For the year ended December 31, 2019, the Fund entered into credit default swap agreements to gain exposure to the underlying issuer’s credit quality characteristics and to hedge the risk of default or other specified credit events on portfolio assets.
Under the terms of a credit default swap, the Fund receives or makes periodic payments based on a specified interest rate on a fixed notional amount. These payments are recorded as a realized gain or loss in the Statement of Operations. Payments received or made as a result of a credit event or termination of the swap are recognized, net of a proportional amount of the upfront payment, as realized gains or losses in the Statement of Operations.
A summary of the open credit default swap contracts as of December 31, 2019 is included in a table following the Fund’s Investment Portfolio. For the year ended December 31, 2019, the investment in credit default swap contracts purchased had a total USD equivalent notional value generally indicative of a range from $0 to approximately $6,437,000 and the investment in credit default swap contracts sold had a total USD equivalent notional value generally indicative of a range from $0 to approximately $10,819,000.
Futures Contracts. A futures contract is an agreement between a buyer or seller and an established futures exchange or its clearinghouse in which the buyer or seller agrees to take or make a delivery of a specific amount of a financial instrument at a specified price on a specific date (settlement date). For the year ended December 31, 2019, the Fund entered into interest rate futures to gain exposure to different parts of the yield curve while managing overall duration. The Fund also entered into interest rate futures contracts for non-hedging purposes to seek to enhance potential gains. In addition, the Fund entered into equity index futures as a means of gaining exposure to the equity asset class without investing directly into such asset class and to manage the risk of stock market volatility.
Upon entering into a futures contract, the Fund is required to deposit with a financial intermediary cash or securities (“initial margin”) in an amount equal to a certain percentage of the face value indicated in the futures contract. Subsequent payments (“variation margin”) are made or received by the Fund dependent upon the daily fluctuations in the value and are recorded for financial reporting purposes as unrealized gains or losses by the Fund. Gains or losses are realized when the contract expires or is closed. Since all futures contracts are exchange-traded, counterparty risk is minimized as the exchange’s clearinghouse acts as the counterparty, and guarantees the futures against default.
Certain risks may arise upon entering into futures contracts, including the risk that an illiquid market will limit the Fund’s ability to close out a futures contract prior to the settlement date and the risk that the futures contract is not well correlated with the security, index or currency to which it relates. Risk of loss may exceed amounts disclosed in the Statement of Assets and Liabilities.
| | | | |
Deutsche DWS Variable Series II — DWS Global Income Builder VIP | | | | | 27 |
A summary of the open futures contracts as of December 31, 2019 is included in a table following the Fund’s Investment Portfolio. For the year ended December 31, 2019, the investment in futures contracts purchased had a total notional value generally indicative of a range from approximately $23,383,000 to $46,132,000, and the investment in futures contracts sold had a total notional value generally indicative of a range from approximately $5,178,000 to $31,596,000.
Forward Foreign Currency Contracts. A forward foreign currency contract (“forward currency contract”) is a commitment to purchase or sell a foreign currency at the settlement date at a negotiated rate. For the year ended December 31, 2019, the Fund entered into forward currency contracts in order to hedge its exposure to changes in foreign currency exchange rates on its foreign currency denominated portfolio holdings, to facilitate transactions in foreign currency denominated securities and for non-hedging purposes to seek to enhance potential gains.
Forward currency contracts are valued at the prevailing forward exchange rate of the underlying currencies and unrealized gain (loss) is recorded daily. On the settlement date of the forward currency contract, the Fund records a realized gain or loss equal to the difference between the value of the contract at the time it was opened and the value of the contract at the time it was closed. Certain risks may arise upon entering into forward currency contracts from the potential inability of counterparties to meet the terms of their contracts. The maximum counterparty credit risk to the Fund is measured by the unrealized gain on appreciated contracts. Additionally, when utilizing forward currency contracts to hedge, the Fund gives up the opportunity to profit from favorable exchange rate movements during the term of the contract.
A summary of the open forward currency contracts as of December 31, 2019 is included in a table following the Fund’s Investment Portfolio. For the year ended December 31, 2019, the investment in forward currency contracts short vs. U.S. dollars had a total contract value generally indicative of a range from approximately $632,000 to $19,036,000, and the investment in forward currency contracts long vs. U.S. dollars had a total contract value generally indicative of a range from $0 to approximately $7,786,000. The investment in forward currency contracts long vs. other foreign currencies sold had a total contract value generally indicative of a range from $0 to approximately $2,222,000.
The following tables summarize the value of the Fund’s derivative instruments held as of December 31, 2019 and the related location in the accompanying Statement of Assets and Liabilities, presented by primary underlying risk exposure:
| | | | | | | | | | | | |
| Asset Derivatives | | Swap
Contracts | | | Futures
Contracts | | | Total | |
| Equity Contracts (a) | | $ | — | | | $ | 85,433 | | | $ | 85,433 | |
| Interest Rate Contracts (a) | | | — | | | | 54,395 | | | | 54,395 | |
Credit Contracts (b) | | | 13,370 | | | | — | | | | 13,370 | |
| | | $ | 13,370 | | | $ | 139,828 | | | $ | 153,198 | |
Each of the above derivatives is located in the following Statement of Assets and Liabilities accounts:
| (a) | Includes cumulative appreciation of futures contracts as disclosed in the Investment Portfolio. Unsettled variation margin is disclosed separately within the Statement of Assets and Liabilities. |
| (b) | Unrealized appreciation on bilateral swap contracts |
| | | | | | | | | | | | | | | | |
| Liability Derivatives | | Forward
Contracts | | | Swap
Contracts | | | Futures
Contracts | | | Total | |
| Equity Contracts (c) | | $ | — | | | $ | — | | | $ | (33,430 | ) | | $ | (33,430 | ) |
| Interest Rate Contracts (c) | | | — | | | | (35,989 | ) | | | (160,392 | ) | | | (196,381 | ) |
| Foreign Exchange Contracts (d) | | | (5,783 | ) | | | — | | | | — | | | | (5,783 | ) |
| | | $ | (5,783 | ) | | $ | (35,989 | ) | | $ | (193,822 | ) | | $ | (235,594 | ) |
Each of the above derivatives is located in the following Statement of Assets and Liabilities accounts:
| (c) | Includes cumulative depreciation of futures and centrally cleared swap contracts as disclosed in the Investment Portfolio. Unsettled variation margin is disclosed separately within the Statement of Assets and Liabilities. |
| (d) | Unrealized depreciation on forward foreign currency contracts |
| | | | | | |
| | 28 | | | | | | Deutsche DWS Variable Series II — DWS Global Income Builder VIP |
Additionally, the amount of unrealized and realized gains and losses on derivative instruments recognized in Fund earnings during the year ended December 31, 2019, and the related location in the accompanying Statement of Operations is summarized in the following tables by primary underlying risk exposure:
| | | | | | | | | | | | | | | | |
| Realized Gain (Loss) | | Forward
Contracts | | | Swap
Contracts | | | Futures
Contracts | | | Total | |
| Equity Contracts (e) | | $ | — | | | $ | — | | | $ | 120,575 | | | $ | 120,575 | |
| Credit Contracts (e) | | | — | | | | (252,351 | ) | | | — | | | | (252,351 | ) |
| Interest Rate Contracts (e) | | | — | | | | 108,413 | | | | 1,153,515 | | | | 1,261,928 | |
| Foreign Exchange Contracts (f) | | | 17,110 | | | | — | | | | — | | | | 17,110 | |
| | | $ | 17,110 | | | $ | (143,938 | ) | | $ | 1,274,090 | | | $ | 1,147,262 | |
Each of the above derivatives is located in the following Statement of Operations accounts:
| (e) | Net realized gain (loss) from swap contracts and futures, respectively |
| (f) | Net realized gain (loss) from forward foreign currency contracts |
| | | | | | | | | | | | | | | | |
Change in Net Unrealized Appreciation (Depreciation) | | Forward
Contracts | | | Swap
Contracts | | | Futures
Contracts | | | Total | |
| Equity Contracts (g) | | $ | — | | | $ | — | | | $ | 294,104 | | | $ | 294,104 | |
| Credit Contracts (g) | | | — | | | | 320,727 | | | | — | | | | 320,727 | |
| Interest Rate Contracts (g) | | | — | | | | (234,946 | ) | | | (153,134 | ) | | | (388,080 | ) |
| Foreign Exchange Contracts (h) | | | 33,823 | | | | — | | | | — | | | | 33,823 | |
| | | $ | 33,823 | | | $ | 85,781 | | | $ | 140,970 | | | $ | 260,574 | |
Each of the above derivatives is located in the following Statement of Operations accounts:
| (g) | Change in net unrealized appreciation (depreciation) on swap contracts and futures, respectively |
| (h) | Change in net unrealized appreciation (depreciation) on forward foreign currency contracts |
As of December 31, 2019, the Fund has transactions subject to enforceable master netting agreements which govern the terms of certain transactions, and reduce the counterparty risk associated with such transactions. Master netting agreements allow a Fund to close out and net total exposure to a counterparty in the event of a deterioration in the credit quality or contractual default with respect to all of the transactions with a counterparty. As defined by the master netting agreement, the Fund may have collateral agreements with certain counterparties to mitigate risk. For financial reporting purposes the Statement of Assets and Liabilities generally shows derivatives assets and liabilities on a gross basis, which reflects the full risks and exposures prior to netting. A reconciliation of the gross amounts on the Statement of Assets and Liabilities to the net amounts by a counterparty, including any collateral exposure, is included in the following tables:
| | | | | | | | | | | | | | | | |
| Counterparty | | Gross Amounts
of Assets
Presented in the
Statement of
Assets and
Liabilities | | | Financial
Instruments
and
Derivatives
Available
for Offset | | | Collateral Received | | | Net Amount of
Derivative
Assets | |
| Morgan Stanley | | $ | 13,370 | | | $ | — | | | $ | — | | | $ | 13,370 | |
| | | | | | | | | | | | | | | | |
| Counterparty | | Gross Amounts
of Liabilities
Presented in the
Statement of
Assets and
Liabilities | | | Financial
Instruments
and
Derivatives
Available
for Offset | | | Collateral Pledged | | | Net Amount of
Derivative
Liabilities | |
| Bank of America | | $ | 5,783 | | | $ | — | | | $ | — | | | $ | 5,783 | |
C. Purchases and Sales of Securities
During the year ended December 31, 2019, purchases and sales of investment transactions, excluding short-term investments, were as follows:
| | | | | | | | |
| | | Purchases | | | Sales | |
| Non-U.S. Treasury Obligations | | $ | 206,380,459 | | | $ | 209,379,797 | |
| U.S. Treasury Obligations | | $ | 14,301,823 | | | $ | 17,036,822 | |
| | | | |
Deutsche DWS Variable Series II — DWS Global Income Builder VIP | | | | | 29 |
D. Related Parties
Management Agreement. Under the Investment Management Agreement with DWS Investment Management Americas, Inc. (“DIMA” or the “Advisor”), an indirect, wholly owned subsidiary of DWS Group GmbH & Co. KGaA (“DWS Group”), the Advisor directs the investments of the Fund in accordance with its investment objectives, policies and restrictions. The Advisor determines the securities, instruments and other contracts relating to investments to be purchased, sold or entered into by the Fund or delegates such responsibility to the Fund’s subadvisor.
Effective May 16, 2019, DWS Alternatives Global Limited, also an indirect, wholly owned subsidiary of DWS Group, no longer serves as subadvisor for the Fund. DWS Alternatives Global Limited provided portfolio manager services to the Fund and pursuant to a sub-advisory agreement between DIMA and DWS Alternatives Global Limited, DIMA, not the Fund, compensated DWS Alternatives Global Limited for the services it provided to the Fund.
Under the Investment Management Agreement, the Fund pays a monthly management fee based on the Fund’s average daily net assets, computed and accrued daily and payable monthly, at the following annual rates:
| | | | |
| First $250 million | | | .370 | % |
| Next $750 million | | | .345 | % |
| Over $1 billion | | | .310 | % |
Accordingly, for the year ended December 31, 2019, the fee pursuant to the Investment Management Agreement was equivalent to an annual rate (exclusive of any applicable waiver/reimbursements) of 0.37% of the Fund’s average daily net assets.
For the period from January 1, 2019 through September 30, 2019 the Advisor had contractually agreed to waive its fees and/or reimburse certain operating expenses to the extent necessary to maintain the total annual operating expenses (excluding certain expenses such as extraordinary expenses, taxes, brokerage and interest expense) of each class as follows:
| | | | |
| Class A | | | .73 | % |
| Class B | | | .86 | % |
Effective October 1, 2019 through September 30, 2020 (and through April 30, 2020 for Class B shares), the Advisor has contractually agreed to waive its fees and/or reimburse certain operating expenses to the extent necessary to maintain the total annual operating expenses (excluding certain expenses such as extraordinary expenses, taxes, brokerage and interest expense) of each class as follows:
| | | | |
| Class A | | | .71 | % |
| Class B | | | .86 | % |
For the year ended December 31, 2019, fees waived and/or expenses reimbursed for Class B are $25.
Administration Fee. Pursuant to an Administrative Services Agreement, DIMA provides most administrative services to the Fund. For all services provided under the Administrative Services Agreement, the Fund pays DIMA an annual fee (“Administration Fee”) of 0.10% of the Fund’s average daily net assets, computed and accrued daily and payable monthly. For the year ended December 31, 2019, the Administration Fee was $127,880, of which $10,972 is unpaid.
Distribution Service Agreement.DWS Distributors, Inc. (“DDI”), an affiliate of the Advisor, is the Fund’s distributor. In accordance with the Distribution Plan, DDI receives 12b-1 fees of 0.25% of average daily net assets of Class B shares. For the year ended December 31, 2019, the Distribution Service Fee was as follows:
| | | | | | | | |
| Distribution Fee | | Total
Aggregated | | | Unpaid at
December 31, 2019 | |
| Class B | | $ | 26 | | | $ | 2 | |
Service Provider Fees. DWS Service Company (“DSC”), an affiliate of the Advisor, is the transfer agent, dividend-paying agent and shareholder service agent for the Fund. Pursuant to a sub-transfer agency agreement between DSC and DST Systems, Inc. (“DST”), DSC has delegated certain transfer agent,
| | | | | | |
| | 30 | | | | | | Deutsche DWS Variable Series II — DWS Global Income Builder VIP |
dividend-paying agent and shareholder service agent functions to DST. DSC compensates DST out of the shareholder servicing fee it receives from the Fund. For the year ended December 31, 2019, the amounts charged to the Fund by DSC were as follows:
| | | | | | | | |
| Services to Shareholders | | Total
Aggregated | | | Unpaid at
December 31, 2019 | |
| Class A | | $ | 319 | | | $ | 71 | |
| Class B | | | 18 | | | | 3 | |
| | | $ | 337 | | | $ | 74 | |
Typesetting and Filing Service Fees. Under an agreement with the Fund, DIMA is compensated for providing certain pre-press and regulatory filing services to the Fund. For the year ended December 31, 2019, the amount charged to the Fund by DIMA included in the Statement of Operations under “Reports to shareholders” aggregated $17,964, of which $5,660 unpaid.
Trustees’ Fees and Expenses. The Fund paid retainer fees to each Trustee not affiliated with the Advisor, plus specified amounts to the Board Chairperson and to each committee Chairperson.
Affiliated Cash Management Vehicles. The Fund may invest uninvested cash balances in DWS Central Cash Management Government Fund and DWS ESG Liquidity Fund, affiliated money market funds which are managed by the Advisor. Each affiliated money market fund is managed in accordance withRule 2a-7 under the 1940 Act, which governs the quality, maturity, diversity and liquidity of instruments in which a money market fund may invest. DWS Central Cash Management Government Fund seeks to maintain a stable net asset value, and DWS ESG Liquidity Fund maintains a floating net asset value. The Fund indirectly bears its proportionate share of the expenses of each affiliated money market fund in which it invests. DWS Central Cash Management Government Fund does not pay the Advisor an investment management fee. To the extent that DWS ESG Liquidity Fund pays an investment management fee to the Advisor, the Advisor will waive an amount of the investment management fee payable to the Advisor by the Fund equal to the amount of the investment management fee payable on the Fund’s assets invested in DWS ESG Liquidity Fund.
Securities Lending Agent Fees. Deutsche Bank AG serves as securities lending agent for the Fund. For the year ended December 31, 2019, the Fund incurred securities lending agent fees to Deutsche Bank AG in the amount of $1,400.
E. Ownership of the Fund
At December 31, 2019, one participating insurance company was owner of record of 10% or more of the total outstanding Class A shares of the Fund, owning 69%.
F. Line of Credit
The Fund and other affiliated funds (the “Participants”) share in a $400 million revolving credit facility provided by a syndication of banks. The Fund may borrow for temporary or emergency purposes, including the meeting of redemption requests that otherwise might require the untimely disposition of securities. The Participants are charged an annual commitment fee, which is allocated based on net assets, among each of the Participants. Interest is calculated at a rate per annum equal to the sum of the Federal Funds Rate plus 1.25 percent plus if the one-month LIBOR exceeds the Federal Funds Rate, the amount of such excess. The Fund may borrow up to a maximum of 33 percent of its net assets under the agreement. The Fund had no outstanding loans at December 31, 2019.
G. Payments by Affiliates
During the year ended December 31, 2019, the Advisor agreed to reimburse the Fund $1,511 for losses incurred on trades executed incorrectly. The amount reimbursed was less than 0.01% of the Fund’s average net assets, thus having no impact on the Fund’s total return.
| | | | |
Deutsche DWS Variable Series II — DWS Global Income Builder VIP | | | | | 31 |
Report of Independent Registered Public Accounting Firm
To the Board of Trustees of Deutsche DWS Variable Series II and Shareholders of DWS Global Income Builder VIP:
Opinion on the Financial Statements
We have audited the accompanying statement of assets and liabilities of DWS Global Income Builder VIP (the “Fund”) (one of the funds constituting Deutsche DWS Variable Series II) (the “Trust”), including the investment portfolio, as of December 31, 2019, and the related statement of operations for the year then ended, the statements of changes in net assets for each of the two years in the period then ended, the financial highlights for each of the five years in the period then ended and the related notes (collectively referred to as the “financial statements”). In our opinion, the financial statements present fairly, in all material respects, the financial position of the Fund (one of the funds constituting Deutsche DWS Variable Series II) at December 31, 2019, the results of its operations for the year then ended, the changes in its net assets for each of the two years in the period then ended and its financial highlights for each of the five years in the period then ended, in conformity with U.S. generally accepted accounting principles.
Basis for Opinion
These financial statements are the responsibility of the Trust’s management. Our responsibility is to express an opinion on the Fund’s financial statements based on our audits. We are a public accounting firm registered with the Public Company Accounting Oversight Board (United States) (“PCAOB”) and are required to be independent with respect to the Trust in accordance with the U.S. federal securities laws and the applicable rules and regulations of the Securities and Exchange Commission and the PCAOB.
We conducted our audits in accordance with the standards of the PCAOB. Those standards require that we plan and perform the audit to obtain reasonable assurance about whether the financial statements are free of material misstatement, whether due to error or fraud. The Trust is not required to have, nor were we engaged to perform, an audit of the Trust’s internal control over financial reporting. As part of our audits, we are required to obtain an understanding of internal control over financial reporting, but not for the purpose of expressing an opinion on the effectiveness of the Trust’s internal control over financial reporting. Accordingly, we express no such opinion.
Our audits included performing procedures to assess the risks of material misstatement of the financial statements, whether due to error or fraud, and performing procedures that respond to those risks. Such procedures included examining, on a test basis, evidence regarding the amounts and disclosures in the financial statements. Our procedures included confirmation of securities owned as of December 31, 2019, by correspondence with the custodian and others. Our audits also included evaluating the accounting principles used and significant estimates made by management, as well as evaluating the overall presentation of the financial statements. We believe that our audits provide a reasonable basis for our opinion.

We have served as the auditor of one or more investment companies in the DWS family of funds since at least 1979, but we are unable to determine the specific year.
Boston, Massachusetts
February 14, 2020
| | | | | | |
| | 32 | | | | | | Deutsche DWS Variable Series II — DWS Global Income Builder VIP |
| | |
| Information About Your Fund’s Expenses | | (Unaudited) |
As an investor of the Fund, you incur two types of costs: ongoing expenses and transaction costs. Ongoing expenses include management fees and other Fund expenses. Examples of transaction costs include contract charges, which are not shown in this section. The following tables are intended to help you understand your ongoing expenses (in dollars) of investing in the Fund and to help you compare these expenses with the ongoing expenses of investing in other mutual funds. In the most recent six-month period, Class B limited these expenses; had it not done so, expenses would have been higher. The example in the table is based on an investment of $1,000 invested at the beginning of the six-month period and held for the entire period (July 1, 2019 to December 31, 2019).
The tables illustrate your Fund’s expenses in two ways:
| – | Actual Fund Return. This helps you estimate the actual dollar amount of ongoing expenses (but not transaction costs) paid on a $1,000 investment in the Fund using the Fund’s actual return during the period. To estimate the expenses you paid over the period, simply divide your account value by $1,000 (for example, an $8,600 account value divided by $1,000 = 8.6), then multiply the result by the number in the “Expenses Paid per $1,000” line under the share class you hold. |
| – | Hypothetical 5% Fund Return. This helps you to compare your Fund’s ongoing expenses (but not transaction costs) with those of other mutual funds using the Fund’s actual expense ratio and a hypothetical rate of return of 5% per year before expenses. Examples using a 5% hypothetical Fund return may be found in the shareholder reports of other mutual funds. The hypothetical account values and expenses may not be used to estimate the actual ending account balance or expenses you paid for the period. |
Please note that the expenses shown in these tables are meant to highlight your ongoing expenses only and do not reflect any transaction costs. The “Expenses Paid per $1,000” line of the tables is useful in comparing ongoing expenses only and will not help you determine the relative total expense of owning different funds. If these transaction costs had been included, your costs would have been higher.
| | | | | | | | |
| Expenses and Value of a $1,000 Investment for the six months ended December 31, 2019 | | | | |
| | |
| Actual Fund Return | | Class A | | | Class B | |
| Beginning Account Value 7/1/19 | | $ | 1,000.00 | | | $ | 1,000.00 | |
| Ending Account Value 12/31/19 | | $ | 1,058.40 | | | $ | 1,058.00 | |
| Expenses Paid per $1,000* | | $ | 3.53 | | | $ | 4.46 | |
| | |
| Hypothetical 5% Fund Return | | Class A | | | Class B | |
| Beginning Account Value 7/1/19 | | $ | 1,000.00 | | | $ | 1,000.00 | |
| Ending Account Value 12/31/19 | | $ | 1,021.78 | | | $ | 1,020.87 | |
| Expenses Paid per $1,000* | | $ | 3.47 | | | $ | 4.38 | |
| * | Expenses are equal to the Fund’s annualized expense ratio for each share class, multiplied by the average account value over the period, multiplied by 184 (the number of days in the most recent six-month period), then divided by 365. |
| | | | | | | | |
| Annualized Expense Ratio | | Class A | | | Class B | |
| Deutsche DWS Variable Series II — DWS Global Income Builder VIP | | | .68 | % | | | .86 | % |
For more information, please refer to the Fund’s prospectus.
These tables do not reflect charges and fees (“contract charges”) associated with the separate account that invests in the Fund or any variable life insurance policy or variable annuity contract for which the Fund is an investment option.
For an analysis of the fees associated with an investment in the Fund or similar funds, please refer to the current and hypothetical expense calculators for Variable Insurance Products which can be found at dws.com/calculators.
| | | | |
Deutsche DWS Variable Series II — DWS Global Income Builder VIP | | | | | 33 |
| | |
| Tax Information | | (Unaudited) |
The Fund paid distributions of $0.03 per share from net long-term capital gains during its year ended December 31, 2019.
Pursuant to Section 852 of the Internal Revenue Code, the Fund designates $1,903,000 as capital gain dividends for its year ended December 31, 2019.
For corporate shareholders, 24% of the ordinary dividends (i.e., income dividends plus short-term capital gains) paid during the Fund’s fiscal year ended December 31, 2019 qualified for the dividends received deduction.
Please consult a tax advisor if you have questions about federal or state income tax laws, or on how to prepare your tax returns. If you have specific questions about your account, please contact your insurance provider.
Proxy Voting
The Trust’s policies and procedures for voting proxies for portfolio securities and information about how the Trust voted proxies related to its portfolio securities during the most recent 12-month period ended June 30 are available on our Web site — dws.com/en-us/resources/proxy-voting — or on the SEC’s Web site — sec.gov. To obtain a written copy of the Trust’s policies and procedures without charge, upon request, call us toll free at(800) 728-3337.
| | | | | | |
| | 34 | | | | | | Deutsche DWS Variable Series II — DWS Global Income Builder VIP |
Advisory Agreement Board Considerations and Fee Evaluation
The Board of Trustees (hereinafter referred to as the “Board” or “Trustees”) approved the renewal of DWS Global Income Builder VIP’s (the “Fund”) investment management agreement (the “Agreement”) with DWS Investment Management Americas, Inc. (“DIMA”) in September 2019.
In terms of the process that the Board followed prior to approving the Agreement, shareholders should know that:
| – | | During the entire process, all of the Fund’s Trustees were independent of DIMA and its affiliates (the “Independent Trustees”). |
| – | | The Board met frequently during the past year to discuss fund matters and dedicated a substantial amount of time to contract review matters. Over the course of several months, the Board’s Contract Committee reviewed extensive materials received from DIMA, independent third parties and independent counsel. These materials included an analysis of the Fund’s performance, fees and expenses, and profitability from a fee consultant retained by the Fund’s Independent Trustees (the “Fee Consultant”). Based on its evaluation of the information provided, the Contract Committee presented its findings and recommendations to the Board. The Board then reviewed the Contract Committee’s findings and recommendations. |
| – | | The Board also received extensive information throughout the year regarding performance of the Fund. |
| – | | The Independent Trustees regularly met privately with counsel to discuss contract review and other matters. In addition, the Independent Trustees were advised by the Fee Consultant in the course of their review of the Fund’s contractual arrangements and considered a comprehensive report prepared by the Fee Consultant in connection with their deliberations. |
| – | | In connection with reviewing the Agreement, the Board also reviewed the terms of the Fund’s Rule12b-1 plan, distribution agreement, administrative services agreement, transfer agency agreement and other material service agreements. |
In connection with the contract review process, the Contract Committee and the Board considered the factors discussed below, among others. The Board also considered that DIMA and its predecessors have managed the Fund since its inception, and the Board believes that a long-term relationship with a capable, conscientious advisor is in the best interests of the Fund. The Board considered, generally, that shareholders chose to invest or remain invested in the Fund knowing that DIMA managed the Fund. DIMA is part of DWS Group GmbH & Co. KGaA (“DWS Group”). DWS Group is a global asset management business that offers a wide range of investing expertise and resources, including research capabilities in many countries throughout the world. In 2018, approximately 20% of DWS Group’s shares were sold in an initial public offering, with Deutsche Bank AG owning the remaining shares.
As part of the contract review process, the Board carefully considered the fees and expenses of each DWS fund overseen by the Board in light of the fund’s performance. In many cases, this led to the negotiation and implementation of expense caps. As part of these negotiations, the Board indicated that it would consider relaxing these caps in future years following sustained improvements in performance, among other considerations.
While shareholders may focus primarily on fund performance and fees, the Fund’s Board considers these and many other factors, including the quality and integrity of DIMA’s personnel and administrative support services provided by DIMA, such as back-office operations, fund valuations, and compliance policies and procedures.
Nature, Quality and Extent of Services. The Board considered the terms of the Agreement, including the scope of advisory services provided under the Agreement. The Board noted that, under the Agreement, DIMA provides portfolio management services to the Fund and that, pursuant to a separate administrative services agreement, DIMA provides administrative services to the Fund. The Board considered the experience and skills of senior management and investment personnel and the resources made available to such personnel. The Board reviewed the Fund’s performance over short-term and long-term periods and compared those returns to various agreed-upon performance measures, including market index(es) and a peer universe compiled using information supplied by Morningstar Direct (“Morningstar”), an independent fund data service. The Board also noted that it has put into place a process of identifying “Funds in Review” (e.g., funds performing poorly relative to a peer universe), and receives additional reporting from DIMA regarding such funds and, where appropriate, DIMA’s plans to address underperformance. The Board
| | | | |
Deutsche DWS Variable Series II — DWS Global Income Builder VIP | | | | | 35 |
believes this process is an effective manner of identifying and addressing underperforming funds. Based on the information provided, the Board noted that, for theone-,three- andfive-year periods ended December 31, 2018, the Fund’s performance (Class A shares) was in the 4th quartile, 2nd quartile and 1st quartile, respectively, of the applicable Morningstar universe (the 1st quartile being the best performers and the 4th quartile being the worst performers). The Board also observed that the Fund has outperformed its benchmark in the three-year period and has underperformed its benchmark in theone- and five-year periods ended December 31, 2018. The Board noted the disappointing investment performance of the Fund in recent periods and continued to discuss with senior management of DIMA the factors contributing to such underperformance and actions being taken to improve performance. The Board noted a change in the Fund’s portfolio management team, effective December 6, 2018, and that certain additional changes to the portfolio management team were made effective April 10, 2019 and May 17, 2019. The Board observed that the Fund had experienced improved relative performance during the first eight months of 2019. The Board recognized the efforts by DIMA in recent years to enhance its investment platform and improve long-term performance across the DWS fund complex.
Fees and Expenses. The Board considered the Fund’s investment management fee schedule, operating expenses and total expense ratios, and comparative information provided by Broadridge Financial Solutions, Inc. (“Broadridge”) and the Fee Consultant regarding investment management fee rates paid to other investment advisors by similar funds (1st quartile being the most favorable and 4th quartile being the least favorable). With respect to management fees paid to other investment advisors by similar funds, the Board noted that the contractual fee rates paid by the Fund, which include a 0.10% fee paid to DIMA under the Fund’s administrative services agreement, were lower than the median (1st quartile) of the applicable Broadridge peer group (based on Broadridge data provided as of December 31, 2018). The Board noted that the Fund’s Class A shares total (net) operating expenses were expected to be equal to the median of the applicable Broadridge expense universe (based on Broadridge data provided as of December 31, 2018, and analyzing Broadridge expense universe Class A (net) expenses less any applicable12b-1 fees) (“Broadridge Universe Expenses”). The Board also reviewed data comparing each other operational share class’s total (net) operating expenses to the applicable Broadridge Universe Expenses. The Board noted that the expense limitations agreed to by DIMA were expected to help the Fund’s total (net) operating expenses remain competitive. The Board considered the Fund’s management fee rate as compared to fees charged by DIMA to a comparable DWS U.S. registered fund (“DWS Funds”) and considered differences between the Fund and the comparable DWS Fund. The information requested by the Board as part of its review of fees and expenses also included information about institutional accounts (including anysub-advised funds and accounts) and funds offered primarily to European investors (“DWS Europe Funds”) managed by DWS Group. The Board noted that DIMA indicated that DWS Group does not manage any institutional accounts or DWS Europe Funds comparable to the Fund.
On the basis of the information provided, the Board concluded that management fees were reasonable and appropriate in light of the nature, quality and extent of services provided by DIMA.
Profitability. The Board reviewed detailed information regarding revenues received by DIMA under the Agreement. The Board considered the estimated costs to DIMA, andpre-tax profits realized by DIMA, from advising the DWS Funds, as well as estimates of thepre-tax profits attributable to managing the Fund in particular. The Board also received information regarding the estimated enterprise-wide profitability of DIMA and its affiliates with respect to all fund services in totality and by fund. The Board and the Fee Consultant reviewed DIMA’s methodology in allocating its costs to the management of the Fund. Based on the information provided, the Board concluded that thepre-tax profits realized by DIMA in connection with the management of the Fund were not unreasonable. The Board also reviewed certain publicly available information regarding the profitability of certain similar investment management firms. The Board noted that, while information regarding the profitability of such firms is limited (and in some cases is not necessarily prepared on a comparable basis), DIMA and its affiliates’ overall profitability with respect to the DWS Funds (after taking into account distribution and other services provided to the funds by DIMA and its affiliates) was lower than the overall profitability levels of most comparable firms for which such data was available.
Economies of Scale. The Board considered whether there are economies of scale with respect to the management of the Fund and whether the Fund benefits from any economies of scale. The Board noted that the Fund’s investment management fee schedule includes fee breakpoints. The Board concluded that the Fund’s fee schedule represents an appropriate sharing between the Fund and DIMA of such economies of scale as may exist in the management of the Fund at current asset levels.
| | | | | | |
| | 36 | | | | | | Deutsche DWS Variable Series II — DWS Global Income Builder VIP |
Other Benefits to DIMA and Its Affiliates. The Board also considered the character and amount of other incidental or“fall-out” benefits received by DIMA and its affiliates, including any fees received by DIMA for administrative services provided to the Fund, any fees received by an affiliate of DIMA for transfer agency services provided to the Fund and any fees received by an affiliate of DIMA for distribution services. The Board also considered benefits to DIMA related to brokerage and soft-dollar allocations, including allocating brokerage to pay for research generated by parties other than the executing broker dealers, which pertain primarily to funds investing in equity securities. In addition, the Board considered the incidental public relations benefits to DIMA related to DWS Funds advertising and cross-selling opportunities among DIMA products and services. The Board considered these benefits in reaching its conclusion that the Fund’s management fees were reasonable.
Compliance. The Board considered the significant attention and resources dedicated by DIMA to its compliance processes in recent years. The Board noted in particular (i) the experience, seniority and time commitment of the individuals serving as DIMA’s and the Fund’s chief compliance officers and (ii) the substantial commitment of resources by DIMA and its affiliates to compliance matters, including the retention of compliance personnel.
Based on all of the information considered and the conclusions reached, the Board determined that the continuation of the Agreement is in the best interests of the Fund. In making this determination, the Board did not give particular weight to any single factor identified above. The Board considered these factors over the course of numerous meetings, certain of which were in executive session with only the Independent Trustees and counsel present. It is possible that individual Independent Trustees may have weighed these factors differently in reaching their individual decisions to approve the continuation of the Agreement.
| | | | |
Deutsche DWS Variable Series II — DWS Global Income Builder VIP | | | | | 37 |
Board Members and Officers
The following table presents certain information regarding the Board Members and Officers of the Trust/Corporation. Each Board Member’s year of birth is set forth in parentheses after his or her name. Unless otherwise noted, (i) each Board Member has engaged in the principal occupation(s) noted in the table for at least the most recent five years, although not necessarily in the same capacity; and (ii) the address of each Independent Board Member is Keith R. Fox, DWS Funds Board Chair, c/o Thomas R. Hiller, Ropes & Gray LLP, Prudential Tower, 800 Boylston Street, Boston, MA02199-3600. Except as otherwise noted below, the term of office for each Board Member is until the election and qualification of a successor, or until such Board Member sooner dies, resigns, is removed or as otherwise provided in the governing documents of the Trust/Corporation. Because the Fund does not hold an annual meeting of shareholders, each Board Member will hold office for an indeterminate period.
The Board Members may also serve in similar capacities with other funds in the fund complex. The number of funds in DWS fund complex shown in the table below includes all registered open- and closed-end funds (including all of their portfolios) advised by the Advisor and any registered funds that have an investment advisor that is an affiliated person of the Advisor.
| | | | | | | | |
| Independent Board Members | | | | | |
Name, Year of Birth,
Position with the Trust/
Corporation and
Length of Time Served1 | | Business Experience and Directorships During the Past Five Years | | Number of
Funds in
DWS Fund
Complex
Overseen | | | Other
Directorships
Held by Board
Member
|
Keith R. Fox, CFA (1954) Chairperson since 2017, and Board Member since 1996 | | Managing General Partner, Exeter Capital Partners (a series of private investment funds) (since 1986). Directorships: ICI Mutual Insurance Company; Progressive International Corporation (kitchen goods importer and distributor); former Chairman, National Association of Small Business Investment Companies; former Directorships: The Kennel Shop (retailer); BoxTop Media Inc. (advertising); Sun Capital Advisers Trust (mutual funds) (2011–2012) | | | 77 | | | — |
John W. Ballantine (1946) Board Member since 1999 | | Retired; formerly, Executive Vice President and Chief Risk Management Officer, First Chicago NBD Corporation/The First National Bank of Chicago (1996–1998); Executive Vice President and Head of International Banking (1995–1996); former Directorships: Director and Chairman of the Board, Healthways, Inc.2 (population well-being and wellness services) (2003–2014); Stockwell Capital Investments PLC (private equity); Enron Corporation; FNB Corporation; Tokheim Corporation; First Oak Brook Bancshares, Inc.; Oak Brook Bank; and Prisma Energy International. Not-for-Profit Director/Trustee: Palm Beach Civic Association; Window to the World Communications (public media); Life Director of Harris Theater for Music and Dance (Chicago); Life Director of Hubbard Street Dance Chicago; former Not-for-Profit Directorships: Public Radio International | | | 77 | | | Portland
General
Electric2
(utility
company)
(2003–
present) |
Dawn-Marie Driscoll (1946) Board Member since 1987 | | Emeritus Executive Fellow, Center for Business Ethics, Bentley University; formerly: Partner, Palmer & Dodge (law firm) (1988–1990); Vice President of Corporate Affairs and General Counsel, Filene’s (retail) (1978–1988). Directorships: Advisory Board, Center for Business Ethics, Bentley University; Trustee and former Chairman of the Board, Southwest Florida Community Foundation (charitable organization); former Directorships: ICI Mutual Insurance Company (2007–2015); Sun Capital Advisers Trust (mutual funds) (2007–2012), Investment Company Institute (audit, executive, nominating committees) and Independent Directors Council (governance, executive committees) | | | 77 | | | — |
Richard J. Herring (1946) Board Member since 1990 | | Jacob Safra Professor of International Banking and Professor of Finance, The Wharton School, University of Pennsylvania (since July 1972); Director, The Wharton Financial Institutions Center (since 1994); formerly: Vice Dean and Director, Wharton Undergraduate Division (1995–2000) and Director, The Lauder Institute of International Management Studies (2000–2006); Member FDIC Systemic Risk Advisory Committee since 2011, member Systemic Risk Council since 2012 and member of the Advisory Board at the Yale Program on Financial Stability since 2013; Formerly Co-Chair of the Shadow Financial Regulatory Committee (2003–2015), Executive Director of The Financial Economists Roundtable (2008–2015), Director of The Thai Capital Fund (2007–2013), Director of The Aberdeen Singapore Fund (2007–2018), and Nonexecutive Director of Barclays Bank DE (2010–2018) | | | 77 | | | Director,
Aberdeen
Japan Fund
(since 2007) |
| | | | | | |
| | 38 | | | | | | Deutsche DWS Variable Series II — DWS Global Income Builder VIP |
| | | | | | | | |
Name, Year of Birth,
Position with the Trust/
Corporation and
Length of Time Served1 | | Business Experience and Directorships During the Past Five Years | | Number of
Funds in
DWS Fund
Complex
Overseen | | | Other
Directorships
Held by Board
Member
|
William McClayton (1944) Board Member since 2004 | | Private equity investor (since October 2009); previously, Managing Director, Diamond Management & Technology Consultants, Inc. (global consulting firm) (2001–2009); Directorship: Board of Managers, YMCA of Metropolitan Chicago; formerly: Senior Partner, Arthur Andersen LLP (accounting) (1966–2001); Trustee, Ravinia Festival | | | 77 | | | — |
Rebecca W. Rimel (1951) Board Member since 1995 | | President, Chief Executive Officer and Director, The Pew Charitable Trusts (charitable organization) (1994–present); formerly: Executive Vice President, The Glenmede Trust Company (investment trust and wealth management) (1983–2004); Board Member, Investor Education (charitable organization) (2004–2005); Trustee, Executive Committee, Philadelphia Chamber of Commerce (2001–2007); Director, Viasys Health Care2 (January 2007–June 2007); Trustee, Thomas Jefferson Foundation (charitable organization) (1994–2012) | | | 77 | | | Director,
Becton
Dickinson
and
Company2
(medical
technology
company)
(2012–
present);
Director,
BioTelemetry
Inc.2(health
care) (2009–
present) |
William N. Searcy, Jr. (1946) Board Member since 1993 | | Private investor since October 2003; formerly: Pension & Savings Trust Officer, Sprint Corporation2(telecommunications) (November 1989–September 2003); Trustee, Sun Capital Advisers Trust (mutual funds) (1998–2012) | | | 77 | | | — |
| | |
| Officers4 | | |
Name, Year of Birth,
Position with the Trust/
Corporation and
Length of Time Served5 | | Business Experience and Directorships During the Past Five Years |
Hepsen Uzcan6(1974) President and Chief Executive Officer, 2017–present | | Managing Director,3 DWS; Secretary, DWS USA Corporation (2018–present); Assistant Secretary, DWS Distributors, Inc. (2018–present); Director and Vice President, DWS Service Company (2018–present); Assistant Secretary, DWS Investment Management Americas, Inc. (2018–present); and Director and President, DB Investment Managers, Inc. (2018–present); formerly: Vice President for the Deutsche funds (2016–2017); Assistant Secretary for the DWS funds (2013–2019) |
John Millette7(1962) Vice President and Secretary, 1999–present | | Director,3DWS; Chief Legal Officer, DWS Investment Management Americas, Inc. (2015–present); Director and Vice President, DWS Trust Company (2016–present); and Assistant Secretary, DBX ETF Trust (2019–present); formerly: Secretary, Deutsche Investment Management Americas Inc. (2015–2017) |
Diane Kenneally7(1966) Chief Financial Officer and Treasurer, 2018–present | | Director,3 DWS; and Treasurer, Chief Financial Officer and Controller, DBX ETF Trust (2019–present); formerly: Assistant Treasurer for the DWS funds (2007–2018) |
Paul Antosca7(1957) Assistant Treasurer, 2007–present | | Director,3DWS; and Assistant Treasurer, DBX ETF Trust (2019–present) |
Sheila Cadogan7(1966) Assistant Treasurer, 2017–present | | Director,3DWS; Director and Vice President, DWS Trust Company (2018–present); and Assistant Treasurer, DBX ETF Trust (2019–present) |
Scott D. Hogan7(1970) Chief Compliance Officer, 2016–present | | Director,3DWS |
Caroline Pearson7(1962) Chief Legal Officer, 2010–present | | Managing Director,3DWS; formerly: Secretary, Deutsche AM Distributors, Inc. (2002–2017); and Secretary, Deutsche AM Service Company (2010–2017) |
Wayne Salit6(1967) Anti-Money Laundering Compliance Officer, 2014–present | | Director,3 Deutsche Bank; and AML Officer, DWS Trust Company; formerly: Managing Director, AML Compliance Officer at BNY Mellon (2011–2014); and Director, AML Compliance Officer at Deutsche Bank (2004–2011) |
Ciara Crawford8 (1984) Assistant Secretary, (2019–present) | | Associate, DWS (since 2015); previously, Legal Assistant at Accelerated Tax Solutions. |
| | | | |
Deutsche DWS Variable Series II — DWS Global Income Builder VIP | | | | | 39 |
| 1 | The length of time served represents the year in which the Board Member joined the board of one or more DWS funds currently overseen by the Board. |
| 2 | A publicly held company with securities registered pursuant to Section 12 of the Securities Exchange Act of 1934. |
| 3 | Executive title, not a board directorship. |
| 4 | As a result of their respective positions held with the Advisor or its affiliates, these individuals are considered “interested persons” of the Advisor within the meaning of the 1940 Act. Interested persons receive no compensation from the Fund. |
| 5 | The length of time served represents the year in which the officer was first elected in such capacity for one or more DWS funds. |
| 6 | Address: 875 Third Avenue, New York, NY 10022. |
| 7 | Address: One International Place, Boston, MA 02110. |
| 8 | Address: 5022 Gate Parkway, Suite 400, Jacksonville, FL 32256. |
The Fund’s Statement of Additional Information (“SAI”) includes additional information about the Board Members. The SAI is available, without charge, upon request. If you would like to request a copy of the SAI, you may do so by calling the followingtoll-free number:(800) 728-3337.
| | | | | | |
| | 40 | | | | | | Deutsche DWS Variable Series II — DWS Global Income Builder VIP |
Notes
Notes
Notes
| | |
| | |
VS2GIB-2 (R-025825-9 2/20) | | |
December 31, 2019
Annual Report
Deutsche DWS Variable Series II
DWS Government Money Market VIP
Beginning on January 1, 2021, as permitted by regulations adopted by the Securities and Exchange Commission, you may not be receiving paper copies of the Fund’s shareholder reports from the insurance company that offers your contract unless you specifically request paper copies from your insurance company or from your financial intermediary. Instead, the shareholder reports will be made available on a Web site, and your insurance company will notify you by mail each time a report is posted and provide you with a Web site link to access the report. Instructions for requesting paper copies will be provided by your insurance company.
If you already elected to receive shareholder reports electronically, you will not be affected by this change and you need not take any action. You may elect to receive shareholder reports and other communications from your insurance company electronically by following the instructions provided by your insurance company.
You may elect to receive all future reports in paper free of charge from your insurance company. If your insurance company informs you that future reports will be delivered via Web access, you can inform your insurance company that you wish to continue receiving paper copies of your shareholder reports by following the instructions provided by your insurance company.

Contents
This report must be preceded or accompanied by a prospectus. To obtain an additional prospectus or summary prospectus, if available, call (800)728-3337 or your financial representative. We advise you to consider the Fund’s objectives, risks, charges and expenses carefully before investing. The summary prospectus and prospectus contain this and other important information about the Fund. Please read the prospectus carefully before you invest.
You could lose money by investing in the Fund. Although the Fund seeks to preserve the value of your investment at $1.00 per share, it cannot guarantee it will do so. An investment in the Fund is not insured or guaranteed by the Federal Deposit Insurance Corporation or any other government agency. The Fund’s sponsor has no legal obligation to provide financial support to the Fund, and you should not expect that the sponsor will provide financial support to the Fund at any time.You should not rely on or expect the Advisor to enter into support agreements or take other actions to maintain the Fund’s $1.00 share price. The credit quality of the Fund’s holdings can change rapidly in certain markets, and the default of a single holding could have an adverse impact on the Fund’s share price. The Fund’s share price can also be negatively affected during periods of high redemption pressures and/or illiquid markets. The actions of a few large investors in the Fund may have a significant adverse effect on the share price of the Fund. Please read the prospectus for specific details regarding the Fund’s risk profile.
The brand DWS represents DWS Group GmbH & Co. KGaA and any of its subsidiaries such as DWS Distributors, Inc. which offers investment products or DWS Investment Management Americas, Inc. and RREEF America L.L.C. which offer advisory services.
DWS Distributors, Inc., 222 South Riverside Plaza, Chicago, IL 60606, (800)621-1148
NOT FDIC/NCUA INSURED NO BANK GUARANTEE MAY LOSE VALUE NOT A DEPOSIT
NOT INSURED BY ANY FEDERAL GOVERNMENT AGENCY
| | | | | | |
| | 2 | | | | | | Deutsche DWS Variable Series II — DWS Government Money Market VIP |
| | |
| Management Summary | | December 31, 2019 (Unaudited) |
During the 12-month period ended December 31, 2019, the Fund provided a total return of 1.77% (Class A shares, unadjusted for contract charges). All performance is historical and does not guarantee future results. Yields fluctuate and are not guaranteed.
Over the past 12 months ended December 31, 2019, yields across the money market yield curve fluctuated based on the still-expanding U.S. economy and evolving U.S. Federal Reserve (the Fed) statements and actions. In January 2019, the Fed pivoted dramatically, changing from a hawkish to a dovish monetary policy stance. The Fed not only walked backed its prior projections of federal funds rate increases, but also lowered its U.S. economic growth estimates. In June, a breakdown in the trade negotiations between the United States and China and some signs of a slight U.S. economic slowdown (amid an abruptly decelerating global economy) disrupted financial markets and sent interest rates significantly lower. Though the Federal Open Market Committee (FOMC) did not cut interest rates at its June meeting, the Fed implied that it would now be more “data dependent” in determining its rate policy. Driven by economic uncertainty resulting from the trade war, the FOMC reduced short-term rates to 2.0%–2.25% at its July 2019 meeting. On the following day, the U.S. administration rattled equity markets and again sent fixed-income yields significantly lower by threatening to impose tariffs on the remaining $300 billion in Chinese imports not yet subject to tariffs. As a way of managing the attendant risks to the U.S. economy, the Fed cut short-term rates at the September and October FOMC meetings. Also in September, the money markets suddenly experienced a sharp spike in overnight repurchase agreement (overnight repo) rates caused by a supply/demand imbalance and regulatory constraints within the repo market. The Fed was forced to step in immediately and inject a large amount of liquidity in order to ensure an orderly repo market through year end 2019. The Fed’s efforts — performed through open market operations and a Treasury bill purchase program — were successful, but they also pushed Treasury bill rates to artificially low levels. During the remainder of the fourth quarter, many nagging concerns for financial market participants such as U.S./China trade tensions, Brexit uncertainty and global economic weakness receded, and most markets ended the year very strongly. The Fed shifted back from a policy of economic risk management to a more data dependent, “wait and see” stance as U.S. third quarter GDP came in higher than anticipated at 2.1%.
During the first half of the year, the Fund held a large percentage of portfolio assets in agency and Treasury floating-rate securities to take advantage of incremental rises in LIBOR and Treasury bill rates. At the same time, the Fund invested in overnight agency repurchase agreements for liquidity and looked for yield opportunities from three- to six-month agency and Treasury securities. During the second half of 2019, when the Fed was engaged in lowering short-term rates, we slightly extended duration at times and purchased longer-term fixed-rate instruments to capture additional yield.
With presidential primaries and the U.S. general election due this year, we believe that the Fed will remain “on hold” for much of 2020 if not the entire year, and will not act unless there is an unforeseen catalyst or crisis that would force a change in the federal funds rate. With the economy and markets in favorable shape at year end, the money market yield curve has become relatively flat, meaning that there is less incentive to purchase longer money market instruments that currently do not offer significantly higher yields.
A group of investment professionals is responsible for the day-to-day management of the Fund. These investment professionals have a broad range of experience managing money market funds.
The views expressed reflect those of the portfolio management team only through the end of the period of the report as stated on the cover. The management team’s views are subject to change at any time based on market and other conditions and should not be construed as a recommendation. Past performance is no guarantee of future results. Current and future portfolio holdings are subject to risk.
| | | | |
Deutsche DWS Variable Series II — DWS Government Money Market VIP | | | | | 3 |
Fund Performance(as of December 31, 2019)
All performance shown is historical, assumes reinvestment of all dividend and capital gain distributions and does not guarantee future results. Investment return and principal value fluctuate with changing market conditions so that, when redeemed, shares may be worth more or less than their original cost. Current performance may be lower or higher than the performance data quoted. Please contact your participating insurance company for the Fund’s most recentmonth-end performance. Performance does not reflect charges and fees (“contract charges”) associated with the separate account that invests in the Fund or any variable life insurance policy or variable annuity contract for which the Fund is an investment option. These charges and fees will reduce returns. The yield quotation more closely reflects the current earnings of the Fund than the total return quotation.
You could lose money by investing in the Fund. Although the Fund seeks to preserve the value of your investment at $1.00 per share, it cannot guarantee it will do so. An investment in the Fund is not insured or guaranteed by the Federal Deposit Insurance Corporation or any other government agency. The Fund’s sponsor has no legal obligation to provide financial support to the Fund, and you should not expect that the sponsor will provide financial support to the Fund at any time.
| | |
| |
| | | 7-Day Current Yield |
| December 31, 2019 | | 1.16% |
Yields are historical, will fluctuate and do not guarantee future performance. The7-day current yield refers to the income paid by the Fund over a7-day period expressed as an annual percentage rate of the Fund’s shares outstanding.
Terms to Know
Theyield curveis a graphical representation of how yields on bonds of different maturities compare. Normally, yield curves slant up, as bonds with longer maturities typically offer higher yields than short-term bonds.
Thefederal funds rateis the interest rate a borrowing bank pays to a lending bank, with the rate determined by members of the Federal Open Market Committee (FOMC) at their regular meetings. The federal funds rate sets the standard for short-term U.S. interest rates.
Arepurchase agreement, or “overnight repo,” is an agreement between a seller and a buyer, usually of government securities, where the seller agrees to repurchase the securities at a given price and usually at a stated time. Repos are widely used money market instruments that serve as an interest-bearing, short-term “parking place” for large sums of money.
Gross domestic product (GDP)is the monetary value of goods and services produced within a country’s borders in a specific time frame.
Floating-ratesecuritiesare debt instruments with floating-rate coupons that generally reset every 30 to 90 days. While floating-rate securities are senior to equity and fixed- income securities, there is no guaranteed return of principal in case of default. Floating- rate issues often have less interest-rate risk than other fixed-income investments.
Floating-rate securities are most often secured assets, generally senior to a company’s secured debt, and can be transferred to debt holders, resulting in potential downside risk.
Duration is a measure of price volatility for fixed-income instruments. Duration can be defined as the approximate percentage change in price for a 100 basis point (one single percentage point) change in market interest rate levels.
| | | | | | |
| | 4 | | | | | | Deutsche DWS Variable Series II — DWS Government Money Market VIP |
| | |
| Portfolio Summary | | (Unaudited) |
| | | | | | | | |
| Asset Allocation (As a % of Investment Portfolio) | | 12/31/19 | | | 12/31/18 | |
| Government & Agency Obligations | | | 79% | | | | 62% | |
| Repurchase Agreements | | | 21% | | | | 38% | |
| | | | 100% | | | | 100% | |
| | |
| Weighted Average Maturity | | 12/31/19 | | | 12/31/18 | |
| Deutsche DWS Variable Series II — DWS Government Money Market VIP | | | 29 days | | | | 25 days | |
| iMoneyNet Money Fund AverageTM — Gov’t & Agency Retail* | | | 29 days | | | | 28 days | |
| * | The Fund is compared to its respective iMoneyNet Money Fund Average category: Gov’t & Agency Retail — Category includes the most broadly based of the government retail funds. These funds may invest in U.S. Treasury securities, securities issued or guaranteed by the U.S. Government or its agencies or instrumentalities. |
Weighted average maturity, also known as effective maturity, is the weighted average of the maturity date of bonds held by the Fund taking into consideration any available maturity shortening features.
Portfolio holdings and characteristics are subject to change.
For more complete details about the Fund’s investment portfolio, see page 6.
Following the Fund’s fiscal first and thirdquarter-end, a complete portfolio holdings listing was filed with the SEC on FormN-Q. Effective from and after the Fund’s third fiscal quarter-end of 2019, Form N-Q is rescinded and will not be filed with the SEC. In addition, each month, information about the Fund and its portfolio holdings is filed with the SEC on FormN-MFP. The SEC delays the public availability of the information filed on FormN-MFP for 60 days after the end of the reporting period included in the filing. These forms will be available on the SEC’s Web site at sec.gov. The Fund’s portfolio holdings are also posted on dws.com as of each month-end. Please see the Fund’s current prospectus for more information.
| | | | |
Deutsche DWS Variable Series II — DWS Government Money Market VIP | | | | | 5 |
| | |
| Investment Portfolio | | as of December 31, 2019 |
| | | | | | | | |
| | | Principal
Amount ($) | | | Value ($) | |
| Government & Agency Obligations 79.0% | |
| U.S. Government Sponsored Agencies 58.8% | |
|
Federal Farm Credit Bank: | |
| | |
1-month LIBOR minus 0.050%, 1.644%*, 2/4/2020 | | | 1,180,000 | | | | 1,180,000 | |
| | |
1-month LIBOR minus 0.035%,
1.73%*, 8/20/2020 | | | 1,500,000 | | | | 1,500,000 | |
| | |
1-month LIBOR minus 0.050%, 1.742%*, 2/25/2020 | | | 500,000 | | | | 499,996 | |
| | |
1-month LIBOR minus 0.025%,
1.78%*, 5/29/2020 | | | 500,000 | | | | 499,990 | |
| | |
1-month LIBOR minus 0.020%, 1.785%*, 4/30/2020 | | | 2,000,000 | | | | 2,000,000 | |
|
Federal Home Loan Bank: | |
| | |
SOFR plus 0.025%, 1.565%*, 4/22/2020 | | | 1,000,000 | | | | 1,000,000 | |
| | |
SOFR plus 0.030%, 1.57%*, 11/6/2020 | | | 1,750,000 | | | | 1,750,000 | |
| | |
SOFR plus 0.035%, 1.575%*, 2/21/2020 | | | 1,000,000 | | | | 1,000,000 | |
| | |
SOFR plus 0.035%, 1.575%*, 5/8/2020 | | | 1,000,000 | | | | 1,000,000 | |
| | |
SOFR plus 0.035%, 1.575%*, 6/19/2020 | | | 1,250,000 | | | | 1,250,000 | |
| | |
SOFR plus 0.040%, 1.58%*, 2/9/2021 | | | 1,000,000 | | | | 1,000,000 | |
| | |
SOFR plus 0.050%, 1.59%*, 1/22/2021 | | | 300,000 | | | | 300,000 | |
| | |
SOFR plus 0.050%, 1.59%*, 1/28/2021 | | | 2,500,000 | | | | 2,500,000 | |
| | |
1.591%**, 2/19/2020 | | | 2,500,000 | | | | 2,494,661 | |
| | |
SOFR plus 0.065%, 1.605%*, 2/26/2021 | | | 1,500,000 | | | | 1,500,000 | |
| | |
1.618%**, 2/26/2020 | | | 1,500,000 | | | | 1,496,276 | |
| | |
SOFR plus 0.105%, 1.645%*, 10/1/2020 | | | 500,000 | | | | 500,000 | |
| | |
1-month LIBOR minus 0.010%, 1.681%*, 9/1/2020 | | | 650,000 | | | | 650,000 | |
| | |
1-month LIBOR minus 0.055%, 1.685%*, 1/14/2020 | | | 500,000 | | | | 500,000 | |
| | |
3-month LIBOR minus 0.195%, 1.714%*, 2/14/2020 | | | 1,000,000 | | | | 1,000,000 | |
| | |
1-month LIBOR minus 0.020%, 1.716%*, 5/12/2020 | | | 750,000 | | | | 750,000 | |
| | |
1-month LIBOR minus 0.025%,
1.74%*, 4/20/2020 | | | 1,250,000 | | | | 1,250,000 | |
| | |
3-month LIBOR minus 0.200%, 1.801%*, 1/16/2020 | | | 1,000,000 | | | | 1,000,000 | |
| | |
3-month LIBOR minus 0.200%,
1.81%*, 1/10/2020 | | | 1,000,000 | | | | 1,000,000 | |
| | |
1.813%**, 4/1/2020 | | | 2,500,000 | | | | 2,488,701 | |
|
Federal Home Loan Bank Discount Notes: | |
| | |
SOFR plus 0.040%, 1.58%*, 9/10/2020 | | | 1,000,000 | | | | 1,000,000 | |
| | |
1.59%**, 5/22/2020 | | | 3,250,000 | | | | 3,229,899 | |
| | |
1.591%**, 5/20/2020 | | | 3,000,000 | | | | 2,981,695 | |
| | |
1.593%**, 2/21/2020 | | | 2,000,000 | | | | 1,995,549 | |
| | |
1.602%**, 3/10/2020 | | | 2,000,000 | | | | 1,993,943 | |
| | |
1.621%**, 5/29/2020 | | | 3,000,000 | | | | 2,980,146 | |
| | |
1.663%**, 1/31/2020 | | | 1,500,000 | | | | 1,497,950 | |
| | |
1.678%**, 1/21/2020 | | | 1,500,000 | | | | 1,498,621 | |
| | |
1.916%**, 3/20/2020 | | | 1,250,000 | | | | 1,244,816 | |
| | | | | | | | |
| | | Principal
Amount ($) | | | Value ($) | |
|
Federal Home Loan Mortgage Corp.: | |
| | |
SOFR, 1.54%*, 2/12/2020 | | | 3,750,000 | | | | 3,750,000 | |
| | |
SOFR plus 0.005%, 1.545%*, 5/13/2020 | | | 1,000,000 | | | | 1,000,000 | |
| | |
SOFR plus 0.010%, 1.55%*, 2/21/2020 | | | 1,500,000 | | | | 1,500,000 | |
| | |
SOFR plus 0.020%, 1.56%*, 2/28/2020 | | | 1,000,000 | | | | 1,000,000 | |
| | |
SOFR plus 0.030%, 1.57%*, 5/8/2020 | | | 750,000 | | | | 750,000 | |
| | |
SOFR plus 0.030%, 1.57%*, 6/2/2020 | | | 1,500,000 | | | | 1,500,000 | |
| | |
SOFR plus 0.030%, 1.57%*, 6/4/2020 | | | 3,500,000 | | | | 3,500,000 | |
| | |
SOFR plus 0.030%, 1.57%*, 8/21/2020 | | | 2,250,000 | | | | 2,250,000 | |
| | |
SOFR plus 0.030%, 1.57%*, 1/22/2021 | | | 1,200,000 | | | | 1,200,000 | |
| | |
1.592%**, 4/17/2020 | | | 2,500,000 | | | | 2,488,334 | |
| | |
1.713%**, 2/20/2020 | | | 1,500,000 | | | | 1,496,479 | |
|
Federal National Mortgage Association: | |
| | |
SOFR plus 0.040%, 1.58%*, 1/29/2021 | | | 1,500,000 | | | | 1,500,000 | |
| | |
SOFR plus 0.060%, 1.6%*, 7/30/2020 | | | 400,000 | | | | 400,000 | |
| | |
SOFR plus 0.075%, 1.615%*, 10/30/2020 | | | 750,000 | | | | 750,000 | |
| | |
SOFR plus 0.100%, 1.64%*, 4/30/2020 | | | 250,000 | | | | 250,000 | |
| | | | | | | | |
| | | | | | | 71,867,056 | |
|
| U.S. Treasury Obligations 20.2% | |
|
U.S. Treasury Bills: | |
| | |
1.65%**, 4/16/2020 | | | 1,000,000 | | | | 995,209 | |
| | |
1.659%**, 1/30/2020 | | | 3,000,000 | | | | 2,996,046 | |
| | |
1.678%**, 1/9/2020 | | | 500,000 | | | | 499,816 | |
| | |
1.695%**, 4/9/2020 | | | 500,000 | | | | 497,700 | |
| | |
1.713%**, 4/9/2020 | | | 500,000 | | | | 497,677 | |
| | |
1.81%**, 4/2/2020 | | | 1,000,000 | | | | 995,437 | |
| | |
1.866%**, 1/2/2020 | | | 1,000,000 | | | | 999,949 | |
| | |
1.886%**, 3/26/2020 | | | 500,000 | | | | 497,804 | |
|
U.S. Treasury Floating Rate Notes: | |
| | |
3-month U.S. Treasury Bill Money Market Yield, 1.526%*, 1/31/2020 | | | 4,500,000 | | | | 4,499,613 | |
| | |
3-month U.S. Treasury Bill Money Market Yield plus 0.033%, 1.559%*, 4/30/2020 | | | 4,750,000 | | | | 4,748,880 | |
| | |
3-month U.S. Treasury Bill Money Market Yield plus 0.043%, 1.569%*, 7/31/2020 | | | 2,500,000 | | | | 2,499,482 | |
| | |
3-month U.S. Treasury Bill Money Market Yield plus 0.045%, 1.571%*, 10/31/2020 | | | 3,500,000 | | | | 3,497,816 | |
|
U.S. Treasury Notes: | |
| | |
1.125%, 4/30/2020 | | | 500,000 | | | | 499,209 | |
| | |
1.375%, 4/30/2020 | | | 1,000,000 | | | | 999,238 | |
| | | | | | | | |
| | | | | | | | 24,723,876 | |
Total Government & Agency Obligations
(Cost $96,590,932) | | | | 96,590,932 | |
The accompanying notes are an integral part of the financial statements.
| | | | | | |
| | 6 | | | | | | Deutsche DWS Variable Series II — DWS Government Money Market VIP |
| | | | | | | | |
| | | Principal
Amount ($) | | | Value ($) | |
|
| Repurchase Agreements 20.9% | |
Wells Fargo Bank, 1.57%, dated 12/31/2019, to be repurchased at $25,502,224 on 1/2/2020 (a) (Cost $25,500,000) | | | 25,500,000 | | | | 25,500,000 | |
| | |
| | | % of Net
Assets | | | Value ($) | |
Total Investment Portfolio
(Cost $122,090,932) | | | 99.9 | | | | 122,090,932 | |
| Other Assets and Liabilities, Net | | | 0.1 | | | | 178,650 | |
| Net Assets | | | 100.0 | | | | 122,269,582 | |
| * | Floating rate security. These securities are shown at their current rate as of December 31, 2019. |
| ** | Annualized yield at time of purchase; not a coupon rate. |
| | | | | | | | | | | | |
Principal
Amount ($) | | | Security | | Rate (%) | | Maturity
Date | | Collateral
Value ($) | |
| | 1,416 | | | Federal Home Loan Mortgage Corp. | | 4 | | 2/1/2049 | | | 1,483 | |
| | 25,358,460 | | | Federal National Mortgage Association | | 2 – 5 | | 1/1/2029 – 11/1/2049 | | | 26,008,517 | |
| | Total Collateral Value | | | 26,010,000 | |
LIBOR: London Interbank Offered Rate
SOFR: Secured Overnight Financing Rate
Fair Value Measurements
Various inputs are used in determining the value of the Fund’s investments. These inputs are summarized in three broad levels. Level 1 includes quoted prices in active markets for identical securities. Level 2 includes other significant observable inputs (including quoted prices for similar securities, interest rates, prepayment speeds and credit risk). Level 3 includes significant unobservable inputs (including the Fund’s own assumptions in determining the fair value of investments). The level assigned to the securities valuations may not be an indication of the risk or liquidity associated with investing in those securities. Securities held by the Fund are reflected as Level 2 because the securities are valued at amortized cost (which approximates fair value) and, accordingly, the inputs used to determine value are not quoted prices in an active market.
The following is a summary of the inputs used as of December 31, 2019 in valuing the Fund’s investments. For information on the Fund’s policy regarding the valuation of investments, please refer to the Security Valuation section of Note A in the accompanying Notes to Financial Statements.
| | | | | | | | | | | | | | | | |
| Assets | | Level 1 | | | Level 2 | | | Level 3 | | | Total | |
| Investments in Securities (b) | | $ | — | | | $ | 96,590,932 | | | $ | — | | | $ | 96,590,932 | |
| Repurchase Agreements | | | — | | | | 25,500,000 | | | | — | | | | 25,500,000 | |
| Total | | $ | — | | | $ | 122,090,932 | | | $ | — | | | $ | 122,090,932 | |
| (b) | See Investment Portfolio for additional detailed categorizations. |
The accompanying notes are an integral part of the financial statements.
| | | | |
Deutsche DWS Variable Series II — DWS Government Money Market VIP | | | | | 7 |
Statement of Assets and Liabilities
| | | | |
| as of December 31, 2019 | |
|
| Assets | |
Investments in securities, valued at
amortized cost | | $ | 96,590,932 | |
Repurchase Agreements, valued at
amortized cost | | | 25,500,000 | |
| Cash | | | 41,532 | |
| Receivable for Fund shares sold | | | 206,884 | |
| Interest receivable | | | 129,408 | |
| Other assets | | | 2,797 | |
| Total assets | | | 122,471,553 | |
| |
| Liabilities | | | | |
| Payable for Fund shares redeemed | | | 4,009 | |
| Distributions payable | | | 59,137 | |
| Accrued management fee | | | 25,065 | |
| Accrued Trustees’ fees | | | 2,796 | |
| Other accrued expenses and payables | | | 110,964 | |
| Total liabilities | | | 201,971 | |
| Net assets, at value | | $ | 122,269,582 | |
| |
| Net Assets Consist of | | | | |
| Distributable earnings (loss) | | | 14,866 | |
| Paid-in capital | | | 122,254,716 | |
| Net assets, at value | | $ | 122,269,582 | |
Class A Net Asset Value | | | | |
| |
| Net asset value, offering and redemption price per share ($122,269,582 ÷ 122,338,432 outstanding shares of beneficial interest, no par value, unlimited number of shares authorized) | | $ | 1.00 | |
Statement of Operations
| | | | |
| for the year ended December 31, 2019 | |
| |
| Investment Income | | | | |
| Income: | | | | |
| Interest | | $ | 2,457,147 | |
| Expenses: | | | | |
| Management fee | | | 261,153 | |
| Administration fee | | | 111,129 | |
| Services to Shareholders | | | 2,693 | |
| Custodian fee | | | 8,434 | |
| Professional fees | | | 50,463 | |
| Reports to shareholders | | | 74,009 | |
| Trustees’ fees and expenses | | | 7,651 | |
| Other | | | 12,077 | |
| Total expenses before expense reductions | | | 527,609 | |
| Expense reductions | | | (120 | ) |
| Total expenses after expense reductions | | | 527,489 | |
| Net investment income | | | 1,929,658 | |
| Net realized gain (loss) from investments | | | 42 | |
| Net increase (decrease) in net assets resulting from operations | | $ | 1,929,700 | |
The accompanying notes are an integral part of the financial statements.
| | | | | | |
| | 8 | | | | | | Deutsche DWS Variable Series II — DWS Government Money Market VIP |
Statements of Changes in Net Assets
| | | | | | | | |
| | | Years Ended December 31, | |
| Increase (Decrease) in Net Assets | | 2019 | | | 2018 | |
| Operations: | | | | | | | | |
| Net investment income (loss) | | $ | 1,929,658 | | | $ | 1,437,915 | |
| Net realized gain (loss) | | | 42 | | | | (141 | ) |
| Net increase (decrease) in net assets resulting from operations | | | 1,929,700 | | | | 1,437,774 | |
| Distributions to shareholders : | | | | | | | | |
Class A | | | (1,929,596 | ) | | | (1,437,977 | ) |
| Fund share transactions: | | | | | | | | |
Class A | | | | | | | | |
| Proceeds from shares sold | | | 121,681,165 | | | | 122,763,991 | |
| Reinvestment of distributions | | | 1,949,598 | | | | 1,393,905 | |
| Payments for shares redeemed | | | (108,541,061 | ) | | | (128,197,879 | ) |
| Net increase (decrease) in net assets from Class A share transactions | | | 15,089,702 | | | | (4,039,983 | ) |
| Increase (decrease) in net assets | | | 15,089,806 | | | | (4,040,186 | ) |
| Net assets at beginning of period | | | 107,179,776 | | | | 111,219,962 | |
| | |
| Net assets at end of period | | $ | 122,269,582 | | | $ | 107,179,776 | |
| | |
| Other Information: | | | | | | | | |
Class A | | | | | | | | |
| Shares outstanding at beginning of period | | | 107,248,730 | | | | 111,288,713 | |
| Shares sold | | | 121,681,165 | | | | 122,763,991 | |
| Shares issued to shareholders in reinvestment of distributions | | | 1,949,598 | | | | 1,393,905 | |
| Shares redeemed | | | (108,541,061 | ) | | | (128,197,879 | ) |
| Net increase (decrease) in Fund shares | | | 15,089,702 | | | | (4,039,983 | ) |
| | |
| Shares outstanding at end of period | | | 122,338,432 | | | | 107,248,730 | |
The accompanying notes are an integral part of the financial statements.
| | | | |
Deutsche DWS Variable Series II — DWS Government Money Market VIP | | | | | 9 |
Financial Highlights
| | | | | | | | | | | | | | | | | | | | |
| | | Years Ended December 31, | |
| Class A | | 2019 | | | 2018 | | | 2017 | | | 2016 | | | 2015 | |
| | | | | |
| Selected Per Share Data | | | | | | | | | | | | | | | | | | | | |
| Net asset value, beginning of period | | $ | 1.00 | | | $ | 1.00 | | | $ | 1.00 | | | $ | 1.00 | | | $ | 1.00 | |
| Income from investment operations: | | | | | | | | | | | | | | | | | | | | |
| | | | | |
Net investment income | | | .018 | | | | .014 | | | | .005 | | | | .001 | b | | | .000 | * |
Net realized gain (loss) | | | .000 | * | | | (.000 | )* | | | .000 | * | | | .000 | * | | | (.000 | )* |
Total from investment operations | | | .018 | | | | .014 | | | | .005 | | | | .001 | | | | .000 | * |
| Less distributions from: | | | | | | | | | | | | | | | | | | | | |
| | | | | |
Net investment income | | | (.018 | ) | | | (.014 | ) | | | (.005 | ) | | | (.001 | ) | | | (.000 | )* |
| Net asset value, end of period | | $ | 1.00 | | | $ | 1.00 | | | $ | 1.00 | | | $ | 1.00 | | | $ | 1.00 | |
| Total Return (%) | | | 1.77 | a | | | 1.39 | a | | | .45 | | | | .05 | a,b | | | .01 | a |
| | | | | |
| Ratios to Average Net Assets and Supplemental Data | | | | | | | | | | | | | | | | | | | | |
| Net assets, end of period ($ millions) | | | 122 | | | | 107 | | | | 111 | | | | 122 | | | | 134 | |
| Ratio of expenses before expense reductions (%)c | | | .47 | | | | .50 | | | | .48 | | | | .51 | | | | .49 | |
| Ratio of expenses after expense reductions (%)c | | | .47 | | | | .50 | | | | .48 | | | | .44 | | | | .25 | |
| Ratio of net investment income (%) | | | 1.74 | | | | 1.37 | | | | .45 | | | | .05 | b | | | .01 | |
| a | Total return would have been lower had certain expenses not been reduced. |
| b | Includes anon-recurring payment for overbilling of prior years’ custodianout-of-pocket fees. Excluding this payment, net investment income per share, total return, and ratio of net investment income to average net assets would have been reduced by $0.0004, 0.04%, and 0.04%, respectively. |
| c | Expense ratio does not reflect charges and fees associated with the separate account that invests in the Fund or any variable life insurance policy or variable annuity contract for which the Fund is an investment option. |
| * | Amount is less than $.0005. |
The accompanying notes are an integral part of the financial statements.
| | | | | | |
| | 10 | | | | | | Deutsche DWS Variable Series II — DWS Government Money Market VIP |
| | |
| Notes to Financial Statements | | |
A. Organization and Significant Accounting Policies
DWS Government Money Market VIP (the “Fund”) is a diversified series of Deutsche DWS Variable Series II (the “Trust”), which is registered under the Investment Company Act of 1940, as amended (the “1940 Act”), as anopen-end management investment company organized as a Massachusetts business trust.
The Fund’s financial statements are prepared in accordance with accounting principles generally accepted in the United States of America (“U.S. GAAP”) which require the use of management estimates. Actual results could differ from those estimates. The Fund qualifies as an investment company under Topic 946 of Accounting Standards Codification of U.S. GAAP. The policies described below are followed consistently by the Fund in the preparation of its financial statements.
Security Valuation. Various inputs are used in determining the value of the Fund’s investments. These inputs are summarized in three broad levels. Level 1 includes quoted prices in active markets for identical securities. Level 2 includes other significant observable inputs (including quoted prices for similar securities, interest rates, prepayment speeds and credit risk). Level 3 includes significant unobservable inputs (including the Fund’s own assumptions in determining the fair value of investments). The level assigned to the securities valuations may not be an indication of the risk or liquidity associated with investing in those securities.
The Fund values all securities utilizing the amortized cost method permitted in accordance with Rule2a-7 under the 1940 Act and certain conditions therein. Under this method, which does not take into account unrealized capital gains or losses on securities, an instrument is initially valued at its cost and thereafter assumes a constant accretion/amortization rate to maturity of any discount or premium. Securities held by the Fund are reflected as Level 2 because the securities are valued at amortized cost (which approximates fair value) and, accordingly, the inputs used to determine value are not quoted prices in an active market.
Disclosure about the classification of fair value measurements is included in a table following the Fund’s Investment Portfolio.
Repurchase Agreements. The Fund may enter into repurchase agreements, under the terms of a Master Repurchase Agreement, with certain banks and broker/dealers whereby the Fund, through its custodian or asub-custodian bank, receives delivery of the underlying securities, the amount of which at the time of purchase and each subsequent business day is required to be maintained at such a level that the value is equal to at least the principal amount of the repurchase price plus accrued interest. The custodian bank or another designatedsub-custodian holds the collateral in a separate account until the agreement matures. If the value of the securities falls below the principal amount of the repurchase agreement plus accrued interest, the financial institution deposits additional collateral by the following business day. If the financial institution either fails to deposit the required additional collateral or fails to repurchase the securities as agreed, the Fund has the right to sell the securities and recover any resulting loss from the financial institution. If the financial institution enters into bankruptcy, the Fund’s claim on the collateral may be subject to legal proceedings.
As of December 31, 2019, the Fund held repurchase agreements with a gross value of $25,500,000. The value of the related collateral exceeded the value of the repurchase agreements at period end. The detail of the related collateral is included in the footnotes following the Fund’s Investment Portfolio.
Federal Income Taxes. The Fund’s policy is to comply with the requirements of the Internal Revenue Code, as amended, which are applicable to regulated investment companies and to distribute all of its taxable income to its shareholders.
At December 31, 2019, the Fund had $99 of short-term tax basis capital loss carryforwards, which may be applied against realized net taxable capital gains indefinitely.
The Fund has reviewed the tax positions for the open tax years as of December 31, 2019 and has determined that no provision for income tax and/or uncertain tax positions is required in the Fund’s financial statements. The Fund’s federal tax returns for the prior three fiscal years remain open subject to examination by the Internal Revenue Service.
Distribution of Income and Gains. Net investment income of the Fund is declared as a daily dividend and is distributed to shareholders monthly. The Fund may take into account capital gains and losses in its daily dividend declarations. The Fund may also make additional distributions for tax purposes if necessary.
| | | | |
Deutsche DWS Variable Series II — DWS Government Money Market VIP | | | | | 11 |
Permanent book and tax differences relating to shareholder distributions will result in reclassifications topaid-in capital. Temporary book and tax differences will reverse in a subsequent period. There were no significant book to tax differences for the Fund.
At December 31, 2019, the Fund’s components of distributable earnings on a tax basis were as follows:
| | | | |
| Undistributed ordinary income | | $ | 14,965 | |
| Capital loss carryforwards | | $ | (99 | ) |
At December 31, 2019, the aggregate cost of investments for federal income tax purposes was $122,090,932.
In addition, the tax character of distributions paid by the Fund is summarized as follows:
| | | | | | | | |
| | | Years Ended December 31, | |
| | | 2019 | | | 2018 | |
| Distributions from ordinary income | | $ | 1,929,596 | | | $ | 1,437,977 | |
Expenses. Expenses of the Trust arising in connection with a specific fund are allocated to that fund. Other Trust expenses which cannot be directly attributed to a fund are apportioned among the funds in the Trust based upon the relative net assets or other appropriate measures.
Contingencies. In the normal course of business, the Fund may enter into contracts with service providers that contain general indemnification clauses. The Fund’s maximum exposure under these arrangements is unknown, as this would involve future claims that may be made against the Fund that have not yet been made. However, based on experience, the Fund expects the risk of loss to be remote.
Other. Investment transactions are accounted for on a trade date. Interest income is recorded on the accrual basis. Realized gains and losses from investment transactions are recorded on an identified cost basis. All discounts and premiums are accreted/amortized for both tax and financial reporting purposes.
B. Related Parties
Management Agreement. Under the Investment Management Agreement with DWS Investment Management Americas, Inc. (“DIMA” or the “Advisor”), an indirect, wholly owned subsidiary of DWS Group GmbH & Co. KGaA (“DWS Group”), the Advisor directs the investments of the Fund in accordance with its investment objectives, policies and restrictions. The Advisor determines the securities, instruments and other contracts relating to investments to be purchased, sold or entered into by the Fund.
Pursuant to the Investment Management Agreement with the Advisor, the Fund pays the Advisor a monthly management fee based on its average daily net assets, computed and accrued daily and payable monthly, at the following annual rates:
| | | | |
| First $500 million | | | .235 | % |
| Next $500 million | | | .220 | % |
| Next $1.0 billion | | | .205 | % |
| Over $2.0 billion | | | .190 | % |
Accordingly, for the year ended December 31, 2019, the fee pursuant to the Investment Management Agreement was equivalent to an annual rate (exclusive of any applicable waivers/reimbursements) of 0.235% of the Fund’s average daily net assets.
For the period from January 1, 2019 through September 30, 2020, the Advisor has contractually agreed to waive its fee and/or reimburse certain operating expenses to the extent necessary to maintain the total annual operating expenses (excluding certain expenses such as extraordinary expenses, taxes, brokerage and interest expense) at 0.51%.
For the year ended December 31, 2019, fees waived and/or expenses reimbursed amounted to $120.
Administration Fee. Pursuant to an Administrative Services Agreement, DIMA provides most administrative services to the Fund. For all services provided under the Administrative Services Agreement, the Fund pays DIMA an annual fee (“Administration Fee”) of 0.10% of the Fund’s average daily net assets, computed and accrued daily and payable monthly. For the year ended December 31, 2019 the Administration Fee was $111,129, of which $10,666 is unpaid.
| | | | | | |
| | 12 | | | | | | Deutsche DWS Variable Series II — DWS Government Money Market VIP |
Service Provider Fees. DWS Service Company (“DSC”), an affiliate of the Advisor, is the transfer agent,dividend-paying agent and shareholder service agent for the Fund. Pursuant to asub-transfer agency agreement between DSC and DST Systems, Inc. (“DST”), DSC has delegated certain transfer agent,dividend-paying agent and shareholder service agent functions to DST. DSC compensates DST out of the shareholder servicing fee it receives from the Fund. For the year ended December 31, 2019, the amounts charged to the Fund by DSC aggregated $2,237, of which $414 is unpaid.
Typesetting and Filing Service Fees. Under an agreement with the Fund, DIMA is compensated for providing certainpre-press and regulatory filing services to the Fund. For the year ended December 31, 2019, the amount charged to the Fund by DIMA included in the Statement of Operations under “Reports to shareholders” aggregated $7,946, of which $3,040 is unpaid.
Trustees’ Fees and Expenses. The Fund paid retainer fees to each Trustee not affiliated with the Advisor, plus specified amounts to the Board Chairperson and to each committee Chairperson.
C. Ownership of the Fund
At December 31, 2019, four participating insurance companies were owners of record of 10% or more of the total outstanding Class A shares of the Fund, each owning 37%, 16%,15% and 13%.
D. Line of Credit
The Fund and other affiliated funds (the “Participants”) share in a $400 million revolving credit facility provided by a syndication of banks. The Fund may borrow for temporary or emergency purposes, including the meeting of redemption requests that otherwise might require the untimely disposition of securities. The Participants are charged an annual commitment fee, which is allocated based on net assets, among each of the Participants. Interest is calculated at a rate per annum equal to the sum of the Federal Funds Rate, plus 1.25 percent plus if theone-month LIBOR exceeds the Federal Funds Rate, the amount of such excess. The Fund may borrow up to a maximum of 33 percent of its net assets under the agreement. The Fund had no outstanding loans at December 31, 2019.
| | | | |
Deutsche DWS Variable Series II — DWS Government Money Market VIP | | | | | 13 |
Report of Independent Registered Public Accounting Firm
To the Board of Trustees of Deutsche DWS Variable Series II and Shareholders of DWS Government Money Market VIP:
Opinion on the Financial Statements
We have audited the accompanying statement of assets and liabilities of DWS Government Money Market VIP (the “Fund”) (one of the funds constituting Deutsche DWS Variable Series II) (the “Trust”), including the investment portfolio, as of December 31, 2019, and the related statement of operations for the year then ended, the statements of changes in net assets for each of the two years in the period then ended, the financial highlights for each of the five years in the period then ended and the related notes (collectively referred to as the “financial statements”). In our opinion, the financial statements present fairly, in all material respects, the financial position of the Fund (one of the funds constituting Deutsche DWS Variable Series II) at December 31, 2019, the results of its operations for the year then ended, the changes in its net assets for each of the two years in the period then ended and its financial highlights for each of the five years in the period then ended, in conformity with U.S. generally accepted accounting principles.
Basis for Opinion
These financial statements are the responsibility of the Trust’s management. Our responsibility is to express an opinion on the Fund’s financial statements based on our audits. We are a public accounting firm registered with the Public Company Accounting Oversight Board (United States) (“PCAOB”) and are required to be independent with respect to the Trust in accordance with the U.S. federal securities laws and the applicable rules and regulations of the Securities and Exchange Commission and the PCAOB.
We conducted our audits in accordance with the standards of the PCAOB. Those standards require that we plan and perform the audit to obtain reasonable assurance about whether the financial statements are free of material misstatement, whether due to error or fraud. The Trust is not required to have, nor were we engaged to perform, an audit of the Trust’s internal control over financial reporting. As part of our audits, we are required to obtain an understanding of internal control over financial reporting, but not for the purpose of expressing an opinion on the effectiveness of the Trust’s internal control over financial reporting. Accordingly, we express no such opinion.
Our audits included performing procedures to assess the risks of material misstatement of the financial statements, whether due to error or fraud, and performing procedures that respond to those risks. Such procedures included examining, on a test basis, evidence regarding the amounts and disclosures in the financial statements. Our procedures included confirmation of securities owned as of December 31, 2019, by correspondence with the custodian and brokers. Our audits also included evaluating the accounting principles used and significant estimates made by management, as well as evaluating the overall presentation of the financial statements. We believe that our audits provide a reasonable basis for our opinion.

We have served as the auditor of one or more investment companies in the DWS family of funds since at least 1979, but we are unable to determine the specific year.
Boston, Massachusetts
February 14, 2020
| | | | | | |
| | 14 | | | | | | Deutsche DWS Variable Series II — DWS Government Money Market VIP |
| | |
| Information About Your Fund’s Expenses | | (Unaudited) |
As an investor of the Fund, you incur two types of costs: ongoing expenses and transaction costs. Ongoing expenses include management fees and other Fund expenses. Examples of transaction costs include contract charges, which are not shown in this section. The following tables are intended to help you understand your ongoing expenses (in dollars) of investing in the Fund and to help you compare these expenses with the ongoing expenses of investing in other mutual funds. The example in the table is based on an investment of $1,000 invested at the beginning of thesix-month period and held for the entire period (July 1, 2019 to December 31, 2019).
The tables illustrate your Fund’s expenses in two ways:
| – | | Actual Fund Return. This helps you estimate the actual dollar amount of ongoing expenses (but not transaction costs) paid on a $1,000 investment in the Fund using the Fund’s actual return during the period. To estimate the expenses you paid over the period, simply divide your account value by $1,000 (for example, an $8,600 account value divided by $1,000 = 8.6), then multiply the result by the number in the “Expenses Paid per $1,000” line under the share class you hold. |
| – | | Hypothetical 5% Fund Return. This helps you to compare your Fund’s ongoing expenses (but not transaction costs) with those of other mutual funds using the Fund’s actual expense ratio and a hypothetical rate of return of 5% per year before expenses. Examples using a 5% hypothetical Fund return may be found in the shareholder reports of other mutual funds. The hypothetical account values and expenses may not be used to estimate the actual ending account balance or expenses you paid for the period. |
Please note that the expenses shown in these tables are meant to highlight your ongoing expenses only and do not reflect any transaction costs. The “Expenses Paid per $1,000” line of the tables is useful in comparing ongoing expenses only and will not help you determine the relative total expense of owning different funds. If these transaction costs had been included, your costs would have been higher.
| | | | |
| Expenses and Value of a $1,000 Investment for the six months ended December 31, 2019 | | | |
| |
| Actual Fund Return | | | Class A | |
| Beginning Account Value 7/1/19 | | $ | 1,000.00 | |
| Ending Account Value 12/31/19 | | $ | 1,007.90 | |
| Expenses Paid per $1,000* | | $ | 2.28 | |
| |
| Hypothetical 5% Fund Return | | | Class A | |
| Beginning Account Value 7/1/19 | | $ | 1,000.00 | |
| Ending Account Value 12/31/19 | | $ | 1,022.94 | |
| Expenses Paid per $1,000* | | $ | 2.29 | |
| * | Expenses are equal to the Fund’s annualized expense ratio, multiplied by the average account value over the period, multiplied by 184 (the number of days in the most recentsix-month period), then divided by 365. |
| | | | |
| Annualized Expense Ratio | | Class A | |
| Deutsche DWS Variable Series II — DWS Government Money Market VIP | | | .45 | % |
For more information, please refer to the Fund’s prospectus.
These tables do not reflect charges and fees (“contract charges”) associated with the separate account that invests in the Fund or any variable life insurance policy or variable annuity contract for which the Fund is an investment option.
For an analysis of the fees associated with an investment in the Fund or similar funds, please refer to the current and hypothetical expense calculators for Variable Insurance Products which can be found at dws.com/calculators.
| | | | |
Deutsche DWS Variable Series II — DWS Government Money Market VIP | | | | | 15 |
| | |
| Tax Information | | (Unaudited) |
Please consult a tax advisor if you have questions about federal or state income tax laws, or on how to prepare your tax returns. If you have specific questions about your account, please contact your insurance provider.
Proxy Voting
The Trust’s policies and procedures for voting proxies for portfolio securities and information about how the Trust voted proxies related to its portfolio securities during the most recent12-month period ended June 30 are available on our Web site — dws.com/en-us/resources/proxy-voting — or on the SEC’s Web site — sec.gov. To obtain a written copy of the Trust’s policies and procedures without charge, upon request, call us toll free at(800) 728-3337.
| | | | | | |
| | 16 | | | | | | Deutsche DWS Variable Series II — DWS Government Money Market VIP |
Advisory Agreement Board Considerations and Fee Evaluation
The Board of Trustees (hereinafter referred to as the “Board” or “Trustees”) approved the renewal of DWS Government Money Market VIP’s (the “Fund”) investment management agreement (the “Agreement”) with DWS Investment Management Americas, Inc. (“DIMA”) in September 2019.
In terms of the process that the Board followed prior to approving the Agreement, shareholders should know that:
| – | | During the entire process, all of the Fund’s Trustees were independent of DIMA and its affiliates (the “Independent Trustees”). |
| – | | The Board met frequently during the past year to discuss fund matters and dedicated a substantial amount of time to contract review matters. Over the course of several months, the Board’s Contract Committee reviewed extensive materials received from DIMA, independent third parties and independent counsel. These materials included an analysis of the Fund’s performance, fees and expenses, and profitability from a fee consultant retained by the Fund’s Independent Trustees (the “Fee Consultant”). Based on its evaluation of the information provided, the Contract Committee presented its findings and recommendations to the Board. The Board then reviewed the Contract Committee’s findings and recommendations. |
| – | | The Board also received extensive information throughout the year regarding performance of the Fund. |
| – | | The Independent Trustees regularly met privately with counsel to discuss contract review and other matters. In addition, the Independent Trustees were advised by the Fee Consultant in the course of their review of the Fund’s contractual arrangements and considered a comprehensive report prepared by the Fee Consultant in connection with their deliberations. |
| – | | In connection with reviewing the Agreement, the Board also reviewed the terms of the Fund’s distribution agreement, administrative services agreement, transfer agency agreement and other material service agreements. |
In connection with the contract review process, the Contract Committee and the Board considered the factors discussed below, among others. The Board also considered that DIMA and its predecessors have managed the Fund since its inception, and the Board believes that a long-term relationship with a capable, conscientious advisor is in the best interests of the Fund. The Board considered, generally, that shareholders chose to invest or remain invested in the Fund knowing that DIMA managed the Fund. DIMA is part of DWS Group GmbH & Co. KGaA (“DWS Group”). DWS Group is a global asset management business that offers a wide range of investing expertise and resources, including research capabilities in many countries throughout the world. In 2018, approximately 20% of DWS Group’s shares were sold in an initial public offering, with Deutsche Bank AG owning the remaining shares.
As part of the contract review process, the Board carefully considered the fees and expenses of each DWS fund overseen by the Board in light of the fund’s performance. In many cases, this led to the negotiation and implementation of expense caps. As part of these negotiations, the Board indicated that it would consider relaxing these caps in future years following sustained improvements in performance, among other considerations.
While shareholders may focus primarily on fund performance and fees, the Fund’s Board considers these and many other factors, including the quality and integrity of DIMA’s personnel and administrative support services provided by DIMA, such as back-office operations, fund valuations, and compliance policies and procedures.
Nature, Quality and Extent of Services. The Board considered the terms of the Agreement, including the scope of advisory services provided under the Agreement. The Board noted that, under the Agreement, DIMA provides portfolio management services to the Fund and that, pursuant to a separate administrative services agreement, DIMA provides administrative services to the Fund. The Board considered the experience and skills of senior management and investment personnel and the resources made available to such personnel. The Board reviewed the Fund’s performance over short-term and long-term periods and compared those returns to various agreed-upon performance measures, including a peer universe compiled using information supplied by iMoneyNet, an independent fund data service. The Board also noted that it has put into place a process of identifying “Funds in Review” (e.g., funds performing poorly relative to a peer universe), and receives additional reporting from DIMA regarding such funds and, where appropriate, DIMA’s plans to address underperformance. The Board believes this process is an effective manner of identifying and addressing underperforming funds. Based on the information provided, the Board noted that, for theone-
| | | | |
Deutsche DWS Variable Series II — DWS Government Money Market VIP | | | | | 17 |
and three-year periods ended December 31, 2018, the Fund’s gross performance (Class A shares) was in the 1st quartile of the applicable iMoneyNet universe (the 1st quartile being the best performers and the 4th quartile being the worst performers).
Fees and Expenses. The Board considered the Fund’s investment management fee schedule, operating expenses and total expense ratios, and comparative information provided by Broadridge Financial Solutions, Inc. (“Broadridge”) and the Fee Consultant regarding investment management fee rates paid to other investment advisors by similar funds (1st quartile being the most favorable and 4th quartile being the least favorable). With respect to management fees paid to other investment advisors by similar funds, the Board noted that the contractual fee rates paid by the Fund, which include a 0.10% fee paid to DIMA under the Fund’s administrative services agreement, were lower than the median (2nd quartile) of the applicable Broadridge peer group (based on Broadridge data provided as of December 31, 2018). Based on Broadridge data provided as of December 31, 2018, the Board noted that the Fund’s Class A shares total operating expenses were higher than the median (4th quartile) of the applicable Broadridge expense universe (less any applicable12b-1 fees). The Board noted the expense limitation agreed to by DIMA. The Board also noted the voluntary fee waivers implemented by DIMA prior to December 31, 2017 to ensure the Fund maintained a positive yield. The Board considered the Fund’s management fee rate as compared to fees charged by DIMA to comparable DWS U.S. registered funds (“DWS Funds”) and considered differences between the Fund and the comparable DWS Funds. The information requested by the Board as part of its review of fees and expenses also included information about institutional accounts (including anysub-advised funds and accounts) and funds offered primarily to European investors (“DWS Europe Funds”) managed by DWS Group. The Board noted that DIMA indicated that DWS Group does not manage any institutional accounts or DWS Europe Funds comparable to the Fund.
On the basis of the information provided, the Board concluded that management fees were reasonable and appropriate in light of the nature, quality and extent of services provided by DIMA.
Profitability. The Board reviewed detailed information regarding revenues received by DIMA under the Agreement. The Board considered the estimated costs to DIMA, andpre-tax profits realized by DIMA, from advising the DWS Funds, as well as estimates of thepre-tax profits attributable to managing the Fund in particular. The Board also received information regarding the estimated enterprise-wide profitability of DIMA and its affiliates with respect to all fund services in totality and by fund. The Board and the Fee Consultant reviewed DIMA’s methodology in allocating its costs to the management of the Fund. Based on the information provided, the Board concluded that thepre-tax profits realized by DIMA in connection with the management of the Fund were not unreasonable. The Board also reviewed certain publicly available information regarding the profitability of certain similar investment management firms. The Board noted that, while information regarding the profitability of such firms is limited (and in some cases is not necessarily prepared on a comparable basis), DIMA and its affiliates’ overall profitability with respect to the DWS Funds (after taking into account distribution and other services provided to the funds by DIMA and its affiliates) was lower than the overall profitability levels of most comparable firms for which such data was available.
Economies of Scale. The Board considered whether there are economies of scale with respect to the management of the Fund and whether the Fund benefits from any economies of scale. The Board noted that the Fund’s investment management fee schedule includes fee breakpoints. The Board concluded that the Fund’s fee schedule represents an appropriate sharing between the Fund and DIMA of such economies of scale as may exist in the management of the Fund at current asset levels.
Other Benefits to DIMA and Its Affiliates. The Board also considered the character and amount of other incidental or“fall-out” benefits received by DIMA and its affiliates, including any fees received by DIMA for administrative services provided to the Fund and any fees received by an affiliate of DIMA for transfer agency services provided to the Fund. The Board also considered benefits to DIMA related to brokerage and soft-dollar allocations, including allocating brokerage to pay for research generated by parties other than the executing broker dealers, which pertain primarily to funds investing in equity securities. In addition, the Board considered the incidental public relations benefits to DIMA related to DWS Funds advertising and cross-selling opportunities among DIMA products and services. The Board considered these benefits in reaching its conclusion that the Fund’s management fees were reasonable.
Compliance. The Board considered the significant attention and resources dedicated by DIMA to its compliance processes in recent years. The Board noted in particular (i) the experience, seniority and time commitment of the individuals serving as DIMA’s and the Fund’s chief compliance officers and (ii) the substantial commitment of resources by DIMA and its affiliates to compliance matters, including the retention of compliance personnel.
| | | | | | |
| | 18 | | | | | | Deutsche DWS Variable Series II — DWS Government Money Market VIP |
Based on all of the information considered and the conclusions reached, the Board determined that the continuation of the Agreement is in the best interests of the Fund. In making this determination, the Board did not give particular weight to any single factor identified above. The Board considered these factors over the course of numerous meetings, certain of which were in executive session with only the Independent Trustees and counsel present. It is possible that individual Independent Trustees may have weighed these factors differently in reaching their individual decisions to approve the continuation of the Agreement.
| | | | |
Deutsche DWS Variable Series II — DWS Government Money Market VIP | | | | | 19 |
Board Members and Officers
The following table presents certain information regarding the Board Members and Officers of the Trust/Corporation. Each Board Member’s year of birth is set forth in parentheses after his or her name. Unless otherwise noted, (i) each Board Member has engaged in the principal occupation(s) noted in the table for at least the most recent five years, although not necessarily in the same capacity; and (ii) the address of each Independent Board Member is Keith R. Fox, DWS Funds Board Chair, c/o Thomas R. Hiller, Ropes & Gray LLP, Prudential Tower, 800 Boylston Street, Boston, MA02199-3600. Except as otherwise noted below, the term of office for each Board Member is until the election and qualification of a successor, or until such Board Member sooner dies, resigns, is removed or as otherwise provided in the governing documents of the Trust/Corporation. Because the Fund does not hold an annual meeting of shareholders, each Board Member will hold office for an indeterminate period.
The Board Members may also serve in similar capacities with other funds in the fund complex. The number of funds in DWS fund complex shown in the table below includes all registered open- and closed-end funds (including all of their portfolios) advised by the Advisor and any registered funds that have an investment advisor that is an affiliated person of the Advisor.
| | | | | | | | |
| Independent Board Members | | | | | |
Name, Year of Birth,
Position with the Trust/
Corporation and
Length of Time Served1 | | Business Experience and Directorships During the Past Five Years | | Number of
Funds in
DWS Fund
Complex
Overseen | | | Other
Directorships
Held by Board
Member
|
Keith R. Fox, CFA (1954) Chairperson since 2017, and Board Member since 1996 | | Managing General Partner, Exeter Capital Partners (a series of private investment funds) (since 1986). Directorships: ICI Mutual Insurance Company; Progressive International Corporation (kitchen goods importer and distributor); former Chairman, National Association of Small Business Investment Companies; former Directorships: The Kennel Shop (retailer); BoxTop Media Inc. (advertising); Sun Capital Advisers Trust (mutual funds) (2011–2012) | | | 77 | | | — |
John W. Ballantine (1946) Board Member since 1999 | | Retired; formerly, Executive Vice President and Chief Risk Management Officer, First Chicago NBD Corporation/The First National Bank of Chicago (1996–1998); Executive Vice President and Head of International Banking (1995–1996); former Directorships: Director and Chairman of the Board, Healthways, Inc.2 (population well-being and wellness services) (2003–2014); Stockwell Capital Investments PLC (private equity); Enron Corporation; FNB Corporation; Tokheim Corporation; First Oak Brook Bancshares, Inc.; Oak Brook Bank; and Prisma Energy International. Not-for-Profit Director/Trustee: Palm Beach Civic Association; Window to the World Communications (public media); Life Director of Harris Theater for Music and Dance (Chicago); Life Director of Hubbard Street Dance Chicago; former Not-for-Profit Directorships: Public Radio International | | | 77 | | | Portland
General
Electric2
(utility
company)
(2003–
present) |
Dawn-Marie Driscoll (1946) Board Member since 1987 | | Emeritus Executive Fellow, Center for Business Ethics, Bentley University; formerly: Partner, Palmer & Dodge (law firm) (1988–1990); Vice President of Corporate Affairs and General Counsel, Filene’s (retail) (1978–1988). Directorships: Advisory Board, Center for Business Ethics, Bentley University; Trustee and former Chairman of the Board, Southwest Florida Community Foundation (charitable organization); former Directorships: ICI Mutual Insurance Company (2007–2015); Sun Capital Advisers Trust (mutual funds) (2007–2012), Investment Company Institute (audit, executive, nominating committees) and Independent Directors Council (governance, executive committees) | | | 77 | | | — |
Richard J. Herring (1946) Board Member since 1990 | | Jacob Safra Professor of International Banking and Professor of Finance, The Wharton School, University of Pennsylvania (since July 1972); Director, The Wharton Financial Institutions Center (since 1994); formerly: Vice Dean and Director, Wharton Undergraduate Division (1995–2000) and Director, The Lauder Institute of International Management Studies (2000–2006); Member FDIC Systemic Risk Advisory Committee since 2011, member Systemic Risk Council since 2012 and member of the Advisory Board at the Yale Program on Financial Stability since 2013; Formerly Co-Chair of the Shadow Financial Regulatory Committee (2003–2015), Executive Director of The Financial Economists Roundtable (2008–2015), Director of The Thai Capital Fund (2007–2013), Director of The Aberdeen Singapore Fund (2007–2018), and Nonexecutive Director of Barclays Bank DE (2010–2018) | | | 77 | | | Director,
Aberdeen
Japan Fund
(since 2007) |
| | | | | | |
| | 20 | | | | | | Deutsche DWS Variable Series II — DWS Government Money Market VIP |
| | | | | | | | |
Name, Year of Birth,
Position with the Trust/
Corporation and
Length of Time Served1 | | Business Experience and Directorships During the Past Five Years | | Number of
Funds in
DWS Fund
Complex
Overseen | | | Other
Directorships
Held by Board
Member
|
William McClayton (1944) Board Member since 2004 | | Private equity investor (since October 2009); previously, Managing Director, Diamond Management & Technology Consultants, Inc. (global consulting firm) (2001–2009); Directorship: Board of Managers, YMCA of Metropolitan Chicago; formerly: Senior Partner, Arthur Andersen LLP (accounting) (1966–2001); Trustee, Ravinia Festival | | | 77 | | | — |
Rebecca W. Rimel (1951) Board Member since 1995 | | President, Chief Executive Officer and Director, The Pew Charitable Trusts (charitable organization) (1994–present); formerly: Executive Vice President, The Glenmede Trust Company (investment trust and wealth management) (1983–2004); Board Member, Investor Education (charitable organization) (2004–2005); Trustee, Executive Committee, Philadelphia Chamber of Commerce (2001–2007); Director, Viasys Health Care2 (January 2007–June 2007); Trustee, Thomas Jefferson Foundation (charitable organization) (1994–2012) | | | 77 | | | Director,
Becton
Dickinson
and
Company2
(medical
technology
company)
(2012–
present);
Director,
BioTelemetry
Inc.2(health
care) (2009–
present) |
William N. Searcy, Jr. (1946) Board Member since 1993 | | Private investor since October 2003; formerly: Pension & Savings Trust Officer, Sprint Corporation2(telecommunications) (November 1989–September 2003); Trustee, Sun Capital Advisers Trust (mutual funds) (1998–2012) | | | 77 | | | — |
| | |
| Officers4 | | |
Name, Year of Birth,
Position with the Trust/
Corporation and
Length of Time Served5 | | Business Experience and Directorships During the Past Five Years |
Hepsen Uzcan6(1974) President and Chief Executive Officer, 2017–present | | Managing Director,3 DWS; Secretary, DWS USA Corporation (2018–present); Assistant Secretary, DWS Distributors, Inc. (2018–present); Director and Vice President, DWS Service Company (2018–present); Assistant Secretary, DWS Investment Management Americas, Inc. (2018–present); and Director and President, DB Investment Managers, Inc. (2018–present); formerly: Vice President for the Deutsche funds (2016–2017); Assistant Secretary for the DWS funds (2013–2019) |
John Millette7(1962) Vice President and Secretary, 1999–present | | Director,3DWS; Chief Legal Officer, DWS Investment Management Americas, Inc. (2015–present); Director and Vice President, DWS Trust Company (2016–present); and Assistant Secretary, DBX ETF Trust (2019–present); formerly: Secretary, Deutsche Investment Management Americas Inc. (2015–2017) |
Diane Kenneally7(1966) Chief Financial Officer and Treasurer, 2018–present | | Director,3 DWS; and Treasurer, Chief Financial Officer and Controller, DBX ETF Trust (2019–present); formerly: Assistant Treasurer for the DWS funds (2007–2018) |
Paul Antosca7(1957) Assistant Treasurer, 2007–present | | Director,3DWS; and Assistant Treasurer, DBX ETF Trust (2019–present) |
Sheila Cadogan7(1966) Assistant Treasurer, 2017–present | | Director,3DWS; Director and Vice President, DWS Trust Company (2018–present); and Assistant Treasurer, DBX ETF Trust (2019–present) |
Scott D. Hogan7(1970) Chief Compliance Officer, 2016–present | | Director,3DWS |
Caroline Pearson7(1962) Chief Legal Officer, 2010–present | | Managing Director,3DWS; formerly: Secretary, Deutsche AM Distributors, Inc. (2002–2017); and Secretary, Deutsche AM Service Company (2010–2017) |
Wayne Salit6(1967) Anti-Money Laundering Compliance Officer, 2014–present | | Director,3 Deutsche Bank; and AML Officer, DWS Trust Company; formerly: Managing Director, AML Compliance Officer at BNY Mellon (2011–2014); and Director, AML Compliance Officer at Deutsche Bank (2004–2011) |
Ciara Crawford8 (1984) Assistant Secretary, (2019–present) | | Associate, DWS (since 2015); previously, Legal Assistant at Accelerated Tax Solutions. |
| | | | |
Deutsche DWS Variable Series II — DWS Government Money Market VIP | | | | | 21 |
| 1 | The length of time served represents the year in which the Board Member joined the board of one or more DWS funds currently overseen by the Board. |
| 2 | A publicly held company with securities registered pursuant to Section 12 of the Securities Exchange Act of 1934. |
| 3 | Executive title, not a board directorship. |
| 4 | As a result of their respective positions held with the Advisor or its affiliates, these individuals are considered “interested persons” of the Advisor within the meaning of the 1940 Act. Interested persons receive no compensation from the Fund. |
| 5 | The length of time served represents the year in which the officer was first elected in such capacity for one or more DWS funds. |
| 6 | Address: 875 Third Avenue, New York, NY 10022. |
| 7 | Address: One International Place, Boston, MA 02110. |
| 8 | Address: 5022 Gate Parkway, Suite 400, Jacksonville, FL 32256. |
The Fund’s Statement of Additional Information (“SAI”) includes additional information about the Board Members. The SAI is available, without charge, upon request. If you would like to request a copy of the SAI, you may do so by calling the followingtoll-free number:(800) 728-3337.
| | | | | | |
| | 22 | | | | | | Deutsche DWS Variable Series II — DWS Government Money Market VIP |
Notes
| | |
| | |
VS2GMM-2 (R-025834-9 2/20) | | |
December 31, 2019
Annual Report
Deutsche DWS Variable Series II
DWS High Income VIP
Beginning on January 1, 2021, as permitted by regulations adopted by the Securities and Exchange Commission, you may not be receiving paper copies of the Fund’s shareholder reports from the insurance company that offers your contract unless you specifically request paper copies from your insurance company or from your financial intermediary. Instead, the shareholder reports will be made available on a Web site, and your insurance company will notify you by mail each time a report is posted and provide you with a Web site link to access the report. Instructions for requesting paper copies will be provided by your insurance company.
If you already elected to receive shareholder reports electronically, you will not be affected by this change and you need not take any action. You may elect to receive shareholder reports and other communications from your insurance company electronically by following the instructions provided by your insurance company.
You may elect to receive all future reports in paper free of charge from your insurance company. If your insurance company informs you that future reports will be delivered via Web access, you can inform your insurance company that you wish to continue receiving paper copies of your shareholder reports by following the instructions provided by your insurance company.

Contents
This report must be preceded or accompanied by a prospectus. To obtain an additional prospectus or summary prospectus, if available, call (800) 728-3337 or your financial representative. We advise you to consider the Fund’s objectives, risks, charges and expenses carefully before investing. The summary prospectus and prospectus contain this and other important information about the Fund. Please read the prospectus carefully before you invest.
Bond investments are subject to interest-rate, credit, liquidity and market risks to varying degrees. When interest rates rise, bond prices generally fall. Credit risk refers to the ability of an issuer to make timely payments of principal and interest. Investments in lower-quality (“junk bonds”) and non-rated securities present greater risk of loss than investments in higher-quality securities. Investing in derivatives entails special risks relating to liquidity, leverage and credit that may reduce returns and/or increase volatility. The Fund may lend securities to approved institutions. Please read the prospectus for details.
The brand DWS represents DWS Group GmbH & Co. KGaA and any of its subsidiaries such as DWS Distributors, Inc. which offers investment products or DWS Investment Management Americas, Inc. and RREEF America L.L.C. which offer advisory services.
DWS Distributors, Inc., 222 South Riverside Plaza, Chicago, IL 60606, (800) 621-1148
NOT FDIC/NCUA INSURED NO BANK GUARANTEE MAY LOSE VALUE NOT A DEPOSIT NOT INSURED BY ANY FEDERAL GOVERNMENT AGENCY
| | | | | | |
| | 2 | | | | | | Deutsche DWS Variable Series II — DWS High Income VIP |
| | |
| Performance Summary | | December 31, 2019 (Unaudited) |
Fund performance shown is historical, assumes reinvestment of all dividend and capital gain distributions and does not guarantee future results. Investment return and principal value fluctuate with changing market conditions so that, when redeemed, shares may be worth more or less than their original cost. Current performance may be lower or higher than the performance data quoted. Please contact your participating insurance company for the Fund’s most recent month-end performance. Performance does not reflect charges and fees (“contract charges”) associated with the separate account that invests in the Fund or any variable life insurance policy or variable annuity contract for which the Fund is an investment option. These charges and fees will reduce returns. While all share classes have the same underlying portfolio, their performance will differ.
The gross expense ratios of the Fund, as stated in the fee table of the prospectus dated May 1, 2019 are 0.94% and 1.34% for Class A and Class B shares, respectively, and may differ from the expense ratios disclosed in the Financial Highlights tables in this report.
Generally accepted accounting principles require adjustments to be made to the net assets of the Fund at period end for financial reporting purposes only, and as such, the total return based on the unadjusted net asset value per share may differ from the total return reported in the financial highlights.
Growth of an Assumed $10,000 Investment
| | |
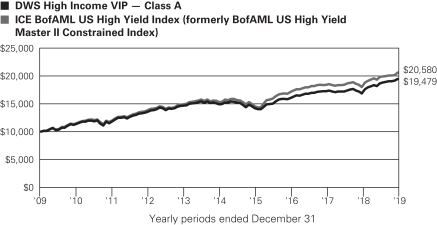
| | ICE BofAML US High Yield Index (formerly BofAML US High Yield Master II Constrained Index) tracks the performance of US dollar denominated below investment grade corporate debt publicly issued in the US domestic market. Index returns do not reflect any fees or expenses and it is not possible to invest directly into an index. |
| | | | | | | | | | |
| Comparative Results | | | | | | | | | | |
| | | | | |
| DWS High Income VIP | | | | 1-Year | | 3-Year | | 5-Year | | 10-Year |
| Class A | | Growth of $10,000 | | $11,569 | | $12,124 | | $13,077 | | $19,479 |
| | | Average annual total return | | 15.69% | | 6.63% | | 5.51% | | 6.89% |
| ICE BofAML US High Yield Index (formerly BofAML US High Yield Master II Constrained Index) | | Growth of $10,000 | | $11,441 | | $12,019 | | $13,469 | | $20,580 |
| | Average annual total return | | 14.41% | | 6.32% | | 6.14% | | 7.48% |
| | | | | |
| DWS High Income VIP | | | | 1-Year | | 3-Year | | 5-Year | | 10-Year |
| Class B | | Growth of $10,000 | | $11,533 | | $12,023 | | $12,877 | | $18,904 |
| | | Average annual total return | | 15.33% | | 6.33% | | 5.19% | | 6.57% |
| ICE BofAML US High Yield Index (formerly BofAML US High Yield Master II Constrained Index) | | Growth of $10,000 | | $11,441 | | $12,019 | | $13,469 | | $20,580 |
| | Average annual total return | | 14.41% | | 6.32% | | 6.14% | | 7.48% |
The growth of $10,000 is cumulative.
| | | | |
Deutsche DWS Variable Series II — DWS High Income VIP | | | | | 3 |
| | |
| Management Summary | | December 31, 2019 (Unaudited) |
The Fund returned 15.69% in 2019 (Class A shares, unadjusted for contract charges), outperforming the 14.41% return of its benchmark, the ICE BofA ML U.S. High Yield Index. Much of the gain for high yield occurred in the first calendar quarter, when the market strongly rebounded from pronounced weakness in late 2018. The positive market sentiment was driven by a number of factors, including a shift to more dovish stance by global central banks and expectations for a resolution to global trade conflicts.
In terms of the Fund’s broad positioning, an overweight in the outperforming cable and satellite industry contributed to performance, as did an overweight in wireless communications. However, an underweight in technology, which outperformed the index, detracted. From a ratings perspective, an overweight in BB rated securities aided results despite their relative weakness in the “risk on” market of the fourth quarter.
At the individual security level, an overweight position in the telecommunications company Altice France SA was a key contributor performance. The bonds moved higher after the company posted solid results and issued new bonds to repay near-term maturities. An overweight in Vistra Operations Co. LLC, a power generation firm whose bonds outperformed as its improving credit profile resulted in multiple upgrades to its credit rating, also contributed. An overweight in the healthcare firm HCA, Inc. further benefited performance. The bonds traded higher as the company reported better results and was upgraded to an investment-grade rating.
An underweight in the health care services provider Community Health Systems, Inc., whose bonds rallied as the company divested hospitals and used the proceeds to strengthen its balance sheet, detracted. Underweights in the finance companies Springleaf Finance Corp. and Navient Corp. also hurt Fund performance. The outstanding bonds of the two issuers performed well after the companies refinanced near-term maturities by issuing new debt with favorable terms.
The Fund used derivatives to hedge its modest euro exposure back into U.S. dollars, which had no impact on relative performance. While we use derivatives periodically for specific purposes, they are not a core aspect of our strategy.
We retained a constructive view on the high-yield market atyear-end. U.S. economic growth remained slow, but we saw a low probability of recession in the near term. Credit fundamentals for high-yield issuers were largely positive, and we did not anticipate an increase in default rates. The use of proceeds from new issuance was focused on refinancing, diminishing refinancing risk for high-yield issuers and alleviating concerns about a large wall of near-term maturities. This trend further contributed to expectations for low defaults.
An expansion of geopolitical risks, including the possibility of a broader conflict in the Middle East, represents a potential disruption to this view. Additionally, are-escalation of trade tensions between the United States and China or the failure to reach a“phase-two” agreement could dampen the outlook for global economic growth. While we believe the U.S. Federal Reserve is likely to remain accommodative at least through the 2020 election, the possibility of poorly communicated Fed policy could provide a headwind for risk assets, including high yield. We continue to monitor the overall credit quality and covenant terms ofnew-issue bonds, as we view an increase in the equity-friendly use of proceeds as a possible source of market disruption once the business cycle turns and credit conditions tighten.
We believe the fourth-quarter strength in high yield, which drove the category’s yield spread over U.S. Treasuries to12-month lows in December, created more challenging conditions in which to find investments with the potential for favorable risk-adjusted total returns. In this environment, we believe fundamental credit analysis remains necessary to identify securities with attractive total return potential relative to the underlying risks. In addition, we seek to recognize broader investment themes that can translate to opportunities from sector allocation.
Gary Russell, CFA, Managing Director
Thomas R. Bouchard, Director
Lonnie Fox, Director
Portfolio Managers
The views expressed reflect those of the portfolio management team only through the end of the period of the report as stated on the cover. The management team’s views are subject to change at any time based on market and other conditions and should not be construed as a recommendation. Past performance is no guarantee of future results. Current and future portfolio holdings are subject to risk.
| | | | | | |
| | 4 | | | | | | Deutsche DWS Variable Series II — DWS High Income VIP |
Terms to Know
ICE BofA Merrill Lynch US High Yield Index tracks the performance of U.S. dollar denominated below investment grade corporate debt publicly issued in the US domestic market.
Credit quality measures a bond issuer’s ability to repay interest and principal in a timely manner. Rating agencies assign letter designations, such as AAA, AA and so forth. The lower the rating, the higher the probability of default. Credit quality does not remove market risk and is subject to change.
Overweightmeans a fund holds a higher weighting in a given sector or individual security compared with its benchmark index;underweightmeans a fund holds a lower weighting.
Contribution anddetraction incorporate both an investment’s total return and its weighting in the Fund.
Derivatives are contracts whose values can be based on a variety of instruments, including indices, currencies or securities. They can be utilized for a variety of reasons, including for hedging purposes, for risk management, fornon-hedging purposes to seek to enhance potential gains, as a substitute for direct investment in a particular asset class or to keep cash on hand to meet shareholder redemptions. Investing in derivatives entails special risks relating to liquidity, leverage and credit that may reduce returns and/or increase volatility.
| | | | |
Deutsche DWS Variable Series II — DWS High Income VIP | | | | | 5 |
| | |
| Portfolio Summary | | (Unaudited) |
| | | | | | | | |
| Asset Allocation (As a % of Investment Portfolio excluding Securities Lending Collateral) | | 12/31/19 | | | 12/31/18 | |
| Corporate Bonds | | | 96% | | | | 83% | |
| Cash Equivalent | | | 4% | | | | 8% | |
| Convertible Bonds | | | 0% | | | | 3% | |
| Loan Participations and Assignments | | | 0% | | | | 6% | |
| Common Stocks | | | 0% | | | | 0% | |
| Warrants | | | 0% | | | | 0% | |
| | | | 100% | | | | 100% | |
| | |
Sector Diversification (As a % of Investment Portfolio excluding Cash Equivalent and Securities
Lending Collateral) | | 12/31/19 | | | 12/31/18 | |
| Communication Services | | | 24% | | | | 23% | |
| Consumer Discretionary | | | 14% | | | | 10% | |
| Energy | | | 13% | | | | 22% | |
| Materials | | | 12% | | | | 17% | |
| Health Care | | | 9% | | | | 10% | |
| Industrials | | | 9% | | | | 7% | |
| Utilities | | | 6% | | | | 3% | |
| Consumer Staples | | | 4% | | | | 2% | |
| Real Estate | | | 3% | | | | 3% | |
| Information Technology | | | 3% | | | | 2% | |
| Financials | | | 3% | | | | 1% | |
| | | | 100% | | | | 100% | |
| | |
| Quality (As a % of Investment Portfolio excluding Cash Equivalent and Securities Lending Collateral) | | 12/31/19 | | | 12/31/18 | |
| BBB | | | 5% | | | | 10% | |
| BB | | | 61% | | | | 56% | |
| B | | | 32% | | | | 28% | |
| CCC | | | 2% | | | | 2% | |
| Not Rated | | | 0% | | | | 4% | |
| | | | 100% | | | | 100% | |
The quality ratings represent the higher of Moody’s Investors Service, Inc. (“Moody’s”), Fitch Ratings, Inc. (“Fitch”) or Standard & Poor’s Corporation (“S&P”) credit ratings. The ratings of Moody’s, Fitch and S&P represent their opinions as to the quality of the securities they rate. Credit quality measures a bond issuer’s ability to repay interest and principal in a timely manner. Ratings are relative and subjective and are not absolute standards of quality. Credit quality does not remove market risk and is subject to change.
Portfolio holdings and characteristics are subject to change.
For more complete details about the Fund’s investment portfolio, see page 7.
Following the Fund’s fiscal first and third quarter-end, a complete portfolio holdings listing is filed with the SEC on Form N-PORT. The Fund’s Form N-PORT will be available on the SEC’s Web site at sec.gov. The Fund’s portfolio holdings are also posted on dws.com from time to time. Please read the Fund’s current prospectus for more information.
| | | | | | |
| | 6 | | | | | | Deutsche DWS Variable Series II — DWS High Income VIP |
| | |
| Investment Portfolio | | as of December 31, 2019 |
| | | | | | | | |
| | | Principal
Amount ($)(a) | | | Value ($) | |
| Corporate Bonds 94.4% | |
| Communication Services 23.1% | |
| | |
Altice France SA: | | | | | | | | |
| | |
144A, 5.5%, 1/15/2028 | | | 200,000 | | | | 205,510 | |
| | |
144A, 7.375%, 5/1/2026 | | | 910,000 | | | | 977,012 | |
| | |
144A, 8.125%, 2/1/2027 | | | 200,000 | | | | 225,250 | |
| | |
Altice Luxembourg SA, 144A, 10.5%, 5/15/2027 | | | 200,000 | | | | 228,010 | |
| | |
AMC Networks, Inc., 4.75%, 8/1/2025 | | | 220,000 | | | | 220,825 | |
| | |
CCO Holdings LLC: | | | | | | | | |
| | |
144A, 4.75%, 3/1/2030 | | | 135,000 | | | | 137,434 | |
| | |
144A, 5.0%, 2/1/2028 | | | 150,000 | | | | 157,398 | |
| | |
144A, 5.125%, 5/1/2027 | | | 125,000 | | | | 131,875 | |
| | |
144A, 5.375%, 6/1/2029 | | | 130,000 | | | | 139,100 | |
| | |
144A, 5.5%, 5/1/2026 | | | 210,000 | | | | 221,288 | |
| | |
144A, 5.75%, 2/15/2026 | | | 530,000 | | | | 559,161 | |
| | |
144A, 5.875%, 4/1/2024 | | | 170,000 | | | | 175,738 | |
| | |
144A, 5.875%, 5/1/2027 | | | 200,000 | | | | 211,500 | |
| | |
CenturyLink, Inc.: | | | | | | | | |
| | |
144A, 5.125%, 12/15/2026 | | | 246,000 | | | | 250,337 | |
| | |
5.625%, 4/1/2025 | | | 225,000 | | | | 239,074 | |
| | |
Series W, 6.75%, 12/1/2023 | | | 45,000 | | | | 50,231 | |
| | |
Clear Channel Worldwide Holdings, Inc.: | | | | | | | | |
| | |
144A, 5.125%, 8/15/2027 | | | 320,000 | | | | 333,216 | |
| | |
144A, 9.25%, 2/15/2024 | | | 217,000 | | | | 240,328 | |
| | |
CommScope, Inc.: | | | | | | | | |
| | |
144A, 5.5%, 3/1/2024 | | | 130,000 | | | | 135,525 | |
| | |
144A, 8.25%, 3/1/2027 | | | 130,000 | | | | 136,825 | |
| | |
CSC Holdings LLC: | | | | | | | | |
| | |
144A, 5.5%, 4/15/2027 | | | 345,000 | | | | 370,478 | |
| | |
144A, 5.75%, 1/15/2030 | | | 200,000 | | | | 213,500 | |
| | |
144A, 6.5%, 2/1/2029 | | | 200,000 | | | | 223,000 | |
| | |
144A, 7.5%, 4/1/2028 | | | 200,000 | | | | 226,000 | |
| | |
144A, 10.875%, 10/15/2025 | | | 230,000 | | | | 257,025 | |
| | |
Diamond Sports Group LLC: | | | | | | | | |
| | |
144A, 5.375%, 8/15/2026 | | | 279,000 | | | | 282,223 | |
| | |
144A, 6.625%, 8/15/2027 (b) | | | 50,000 | | | | 48,625 | |
| | |
DISH DBS Corp.: | | | | | | | | |
| | |
5.875%, 11/15/2024 | | | 231,000 | | | | 236,053 | |
| | |
7.75%, 7/1/2026 | | | 160,000 | | | | 169,502 | |
| | |
Entercom Media Corp.: | | | | | | | | |
| | |
144A, 6.5%, 5/1/2027 | | | 96,000 | | | | 102,720 | |
| | |
144A, 7.25%, 11/1/2024 | | | 80,000 | | | | 84,200 | |
| | |
Frontier Communications Corp., 144A, 8.0%, 4/1/2027 | | | 240,000 | | | | 250,800 | |
| | |
Intelsat Connect Finance SA, 144A, 9.5%, 2/15/2023 | | | 90,000 | | | | 62,973 | |
| | |
Intelsat Jackson Holdings SA: | | | | | | | | |
| | |
144A, 8.5%, 10/15/2024 | | | 251,000 | | | | 228,618 | |
| | |
144A, 9.75%, 7/15/2025 | | | 95,000 | | | | 87,875 | |
| | |
Lamar Media Corp., 5.75%, 2/1/2026 | | | 140,000 | | | | 148,386 | |
| | |
LCPR Senior Secured Financing DAC, 144A, 6.75%, 10/15/2027 | | | 210,000 | | | | 222,600 | |
| | |
Level 3 Financing, Inc.: | | | | | | | | |
| | |
144A, 4.625%, 9/15/2027 | | | 339,000 | | | | 347,068 | |
| | |
5.25%, 3/15/2026 | | | 110,000 | | | | 114,400 | |
| | |
5.375%, 5/1/2025 | | | 100,000 | | | | 103,500 | |
| | | | | | | | |
| | | Principal
Amount ($)(a) | | | Value ($) | |
| | |
Netflix, Inc.: | | | | | | | | |
| | |
REG S, 3.625%, 6/15/2030 | | EUR | 100,000 | | | | 115,255 | |
| | |
4.375%, 11/15/2026 | | | 330,000 | | | | 338,250 | |
| | |
4.625%, 5/15/2029 | | EUR | 230,000 | | | | 287,531 | |
| | |
4.875%, 4/15/2028 | | | 210,000 | | | | 218,127 | |
| | |
5.875%, 2/15/2025 | | | 60,000 | | | | 66,900 | |
| | |
5.875%, 11/15/2028 | | | 71,000 | | | | 78,708 | |
| | |
Nexstar Broadcasting, Inc., 144A, 5.625%, 7/15/2027 | | | 55,000 | | | | 57,959 | |
| | |
Sprint Capital Corp.: | | | | | | | | |
| | |
6.875%, 11/15/2028 | | | 365,000 | | | | 393,287 | |
| | |
8.75%, 3/15/2032 | | | 115,000 | | | | 139,581 | |
| | |
Sprint Corp.: | | | | | | | | |
| | |
7.125%, 6/15/2024 | | | 165,000 | | | | 177,994 | |
| | |
7.625%, 3/1/2026 | | | 135,000 | | | | 148,878 | |
| | |
T-Mobile U.S.A., Inc., 4.75%, 2/1/2028 | | | 215,000 | | | | 225,279 | |
| | |
Telecom Italia Capital SA, 6.375%, 11/15/2033 | | | 155,000 | | | | 172,050 | |
| | |
Telecom Italia SpA, 144A, 5.303%, 5/30/2024 | | | 200,000 | | | | 215,000 | |
| | |
Telefonica Europe BV, REG S, 7.625%, Perpetual (c) | | EUR | 100,000 | | | | 125,490 | |
| | |
Telesat Canada: | | | | | | | | |
| | |
144A, 4.875%, 6/1/2027 | | | 110,000 | | | | 111,925 | |
| | |
144A, 6.5%, 10/15/2027 | | | 160,000 | | | | 166,800 | |
| | |
ViaSat, Inc.: | | | | | | | | |
| | |
144A, 5.625%, 9/15/2025 | | | 55,000 | | | | 56,650 | |
| | |
144A, 5.625%, 4/15/2027 | | | 120,000 | | | | 128,400 | |
| | |
Virgin Media Secured Finance PLC: | | | | | | | | |
| | |
144A, 5.5%, 8/15/2026 | | | 215,000 | | | | 225,750 | |
| | |
144A, 5.5%, 5/15/2029 | | | 345,000 | | | | 365,269 | |
| | |
Vodafone Group PLC, 7.0%, 4/4/2079 | | | 70,000 | | | | 82,240 | |
| | |
Ziggo BV, 144A, 4.875%, 1/15/2030 | | | 290,000 | | | | 299,370 | |
| | | | | | | | |
| | | | | | | 12,951,876 | |
|
| Consumer Discretionary 13.1% | |
| | |
1011778 B.C. Unlimited Liability Co., 144A, 4.375%, 1/15/2028 | | | 90,000 | | | | 90,225 | |
| | |
American Axle & Manufacturing, Inc.: | | | | | | | | |
| | |
6.25%, 4/1/2025 | | | 135,000 | | | | 140,569 | |
| | |
6.25%, 3/15/2026 | | | 75,000 | | | | 76,781 | |
| | |
American Builders & Contractors Supply Co., Inc., 144A, 4.0%, 1/15/2028 | | | 164,000 | | | | 166,460 | |
| | |
Asbury Automotive Group, Inc., 6.0%, 12/15/2024 | | | 219,000 | | | | 226,117 | |
| | |
Beacon Roofing Supply, Inc., 144A, 4.5%, 11/15/2026 | | | 30,000 | | | | 30,900 | |
| | |
Beazer Homes USA, Inc., 5.875%, 10/15/2027 | | | 170,000 | | | | 171,700 | |
| | |
Boyd Gaming Corp.: | | | | | | | | |
| | |
144A, 4.75%, 12/1/2027 | | | 60,000 | | | | 62,325 | |
| | |
6.0%, 8/15/2026 | | | 160,000 | | | | 171,600 | |
| | |
Dana Financing Luxembourg Sarl: | | | | | | | | |
| | |
144A, 5.75%, 4/15/2025 | | | 155,000 | | | | 161,975 | |
| | |
144A, 6.5%, 6/1/2026 | | | 160,000 | | | | 171,000 | |
| | |
Dana, Inc.: | | | | | | | | |
| | |
5.375%, 11/15/2027 | | | 55,000 | | | | 56,650 | |
| | |
5.5%, 12/15/2024 | | | 65,000 | | | | 66,815 | |
The accompanying notes are an integral part of the financial statements.
| | | | |
Deutsche DWS Variable Series II — DWS High Income VIP | | | | | 7 |
| | | | | | | | |
| | | Principal
Amount ($)(a) | | | Value ($) | |
| | |
Eldorado Resorts, Inc., 6.0%, 9/15/2026 | | | 173,000 | | | | 190,516 | |
| | |
Fiat Chrysler Automobiles NV, 5.25%, 4/15/2023 | | | 245,000 | | | | 261,844 | |
| | |
HD Supply, Inc., 144A, 5.375%, 10/15/2026 | | | 100,000 | | | | 106,000 | |
| | |
Hilton Domestic Operating Co., Inc., 4.875%, 1/15/2030 | | | 139,000 | | | | 147,257 | |
| | |
IAA, Inc., 144A, 5.5%, 6/15/2027 | | | 75,000 | | | | 79,687 | |
| | |
Korn Ferry, 144A, 4.625%, 12/15/2027 | | | 30,000 | | | | 30,150 | |
| | |
Lennar Corp., 5.0%, 6/15/2027 | | | 50,000 | | | | 54,250 | |
| | |
Lithia Motors, Inc., 144A, 4.625%, 12/15/2027 | | | 140,000 | | | | 143,900 | |
| | |
Mattel, Inc., 144A, 6.75%, 12/31/2025 | | | 325,000 | | | | 349,310 | |
| | |
Meritor, Inc., 6.25%, 2/15/2024 | | | 75,000 | | | | 76,852 | |
| | |
MGM Resorts International: | | | | | | | | |
| | |
5.5%, 4/15/2027 | | | 100,000 | | | | 111,000 | |
| | |
5.75%, 6/15/2025 | | | 190,000 | | | | 212,800 | |
| | |
NCL Corp. Ltd., 144A, 3.625%, 12/15/2024 | | | 200,000 | | | | 202,750 | |
| | |
Newell Brands, Inc., 4.2%, 4/1/2026 | | | 640,000 | | | | 667,363 | |
| | |
Outfront Media Capital LLC: | | | | | | | | |
| | |
144A, 4.625%, 3/15/2030 | | | 30,000 | | | | 30,525 | |
| | |
144A, 5.0%, 8/15/2027 | | | 140,000 | | | | 146,650 | |
| | |
Panther BF Aggregator 2 LP: | | | | | | | | |
| | |
144A, 4.375%, 5/15/2026 | | EUR | 100,000 | | | | 117,577 | |
| | |
REG S, 4.375%, 5/15/2026 | | EUR | 100,000 | | | | 117,577 | |
| | |
144A, 6.25%, 5/15/2026 | | | 55,000 | | | | 59,263 | |
| | |
Penn National Gaming, Inc., 144A, 5.625%, 1/15/2027 | | | 80,000 | | | | 84,544 | |
| | |
PetSmart, Inc.: | | | | | | | | |
| | |
144A, 7.125%, 3/15/2023 | | | 270,000 | | | | 264,600 | |
| | |
144A, 8.875%, 6/1/2025 | | | 90,000 | | | | 88,875 | |
| | |
Prestige Brands, Inc., 144A, 5.125%, 1/15/2028 | | | 60,000 | | | | 62,850 | |
| | |
PulteGroup, Inc., 6.375%, 5/15/2033 | | | 100,000 | | | | 116,750 | |
| | |
Scientific Games International, Inc., 144A, 7.0%, 5/15/2028 | | | 165,000 | | | | 176,962 | |
| | |
Sonic Automotive, Inc., 6.125%, 3/15/2027 | | | 55,000 | | | | 57,338 | |
| | |
Spectrum Brands, Inc., 144A, 5.0%, 10/1/2029 | | | 30,000 | | | | 30,975 | |
| | |
Staples, Inc.: | | | | | | | | |
| | |
144A, 7.5%, 4/15/2026 | | | 210,000 | | | | 217,875 | |
| | |
144A, 10.75%, 4/15/2027 | | | 160,000 | | | | 162,400 | |
| | |
Stars Group Holdings BV, 144A, 7.0%, 7/15/2026 | | | 105,000 | | | | 113,662 | |
| | |
Suburban Propane Partners LP, 5.75%, 3/1/2025 | | | 105,000 | | | | 107,887 | |
| | |
Taylor Morrison Communities, Inc., 144A, 5.75%, 1/15/2028 | | | 170,000 | | | | 185,300 | |
| | |
Tesla, Inc., 144A, 5.3%, 8/15/2025 | | | 135,000 | | | | 130,950 | |
| | |
Toll Brothers Finance Corp., 4.35%, 2/15/2028 | | | 67,000 | | | | 69,848 | |
| | |
TRI Pointe Group, Inc., 5.25%, 6/1/2027 | | | 55,000 | | | | 57,475 | |
| | |
United Rentals North America, Inc., 5.25%, 1/15/2030 | | | 80,000 | | | | 86,104 | |
| | |
Viking Cruises Ltd., 144A, 5.875%, 9/15/2027 | | | 205,000 | | | | 219,094 | |
| | | | | | | | |
| | | Principal
Amount ($)(a) | | | Value ($) | |
| | |
WMG Acquisition Corp., 144A, 5.0%, 8/1/2023 | | | 75,000 | | | | 76,688 | |
| | |
Wynn Las Vegas LLC, 144A, 5.5%, 3/1/2025 | | | 285,000 | | | | 304,950 | |
| | |
Wynn Resorts Finance LLC, 144A, 5.125%, 10/1/2029 | | | 5,000 | | | | 5,363 | |
| | |
Yum! Brands, Inc., 144A, 4.75%, 1/15/2030 | | | 35,000 | | | | 36,663 | |
| | | | | | | | |
| | | | | | | 7,355,541 | |
| | |
| Consumer Staples 3.4% | | | | | | | | |
| | |
Albertsons Companies, Inc.: | | | | | | | | |
| | |
144A, 4.625%, 1/15/2027 | | | 140,000 | | | | 139,832 | |
| | |
144A, 5.875%, 2/15/2028 | | | 60,000 | | | | 63,750 | |
| | |
Cott Holdings, Inc., 144A, 5.5%, 4/1/2025 | | | 325,000 | | | | 339,625 | |
| | |
Darling Ingredients, Inc., 144A, 5.25%, 4/15/2027 | | | 30,000 | | | | 31,913 | |
| | |
JBS U.S.A. LUX SA: | | | | | | | | |
| | |
144A, 5.5%, 1/15/2030 | | | 60,000 | | | | 64,446 | |
| | |
144A, 5.75%, 6/15/2025 | | | 210,000 | | | | 217,350 | |
| | |
144A, 6.5%, 4/15/2029 | | | 132,000 | | | | 146,689 | |
| | |
144A, 6.75%, 2/15/2028 | | | 235,000 | | | | 259,677 | |
| | |
Pilgrim’s Pride Corp.: | | | | | | | | |
| | |
144A, 5.75%, 3/15/2025 | | | 50,000 | | | | 51,682 | |
| | |
144A, 5.875%, 9/30/2027 | | | 150,000 | | | | 162,187 | |
| | |
Post Holdings, Inc.: | | | | | | | | |
| | |
144A, 5.0%, 8/15/2026 | | | 65,000 | | | | 68,656 | |
| | |
144A, 5.5%, 3/1/2025 | | | 250,000 | | | | 261,875 | |
| | |
144A, 5.5%, 12/15/2029 | | | 110,000 | | | | 117,293 | |
| | | | | | | | |
| | | | | | | 1,924,975 | |
| | |
| Energy 12.8% | | | | | | | | |
| | |
Antero Midstream Partners LP: | | | | | | | | |
| | |
5.375%, 9/15/2024 | | | 95,000 | | | | 88,113 | |
| | |
144A, 5.75%, 3/1/2027 | | | 80,000 | | | | 70,350 | |
| | |
144A, 5.75%, 1/15/2028 | | | 90,000 | | | | 78,300 | |
| | |
Archrock Partners LP: | | | | | | | | |
| | |
144A, 6.25%, 4/1/2028 | | | 30,000 | | | | 30,900 | |
| | |
144A, 6.875%, 4/1/2027 | | | 110,000 | | | | 116,325 | |
| | |
Cheniere Energy Partners LP: | | | | | | | | |
| | |
144A, 4.5%, 10/1/2029 | | | 217,000 | | | | 222,989 | |
| | |
5.625%, 10/1/2026 | | | 80,000 | | | | 84,600 | |
| | |
Chesapeake Energy Corp., 144A, 11.5%, 1/1/2025 (b) | | | 115,500 | | | | 109,148 | |
| | |
Crestwood Midstream Partners LP: | | | | | | | | |
| | |
144A, 5.625%, 5/1/2027 | | | 150,000 | | | | 152,062 | |
| | |
6.25%, 4/1/2023 | | | 245,000 | | | | 249,900 | |
| | |
DCP Midstream Operating LP, 5.375%, 7/15/2025 | | | 387,000 | | | | 420,862 | |
| | |
Endeavor Energy Resources LP: | | | | | | | | |
| | |
144A, 5.5%, 1/30/2026 | | | 35,000 | | | | 36,138 | |
| | |
144A, 5.75%, 1/30/2028 | | | 35,000 | | | | 36,794 | |
| | |
EnLink Midstream Partners LP, 4.4%, 4/1/2024 | | | 280,000 | | | | 271,628 | |
| | |
Genesis Energy LP: | | | | | | | | |
| | |
6.25%, 5/15/2026 | | | 115,000 | | | | 109,825 | |
| | |
6.5%, 10/1/2025 | | | 85,000 | | | | 82,238 | |
| | |
Hilcorp Energy I LP: | | | | | | | | |
| | |
144A, 5.0%, 12/1/2024 | | | 105,000 | | | | 101,532 | |
| | |
144A, 5.75%, 10/1/2025 | | | 145,000 | | | | 141,381 | |
| | |
144A, 6.25%, 11/1/2028 | | | 105,000 | | | | 99,750 | |
| | |
Holly Energy Partners LP, 144A, 6.0%, 8/1/2024 | | | 225,000 | | | | 234,562 | |
The accompanying notes are an integral part of the financial statements.
| | | | | | |
| | 8 | | | | | | Deutsche DWS Variable Series II — DWS High Income VIP |
| | | | | | | | |
| | | Principal
Amount ($)(a) | | | Value ($) | |
| | |
Matador Resources Co., 5.875%, 9/15/2026 | | | 134,000 | | | | 134,335 | |
| | |
MEG Energy Corp., 144A, 6.5%, 1/15/2025 | | | 234,000 | | | | 243,383 | |
| | |
Murphy Oil U.S.A., Inc.: | | | | | | | | |
| | |
4.75%, 9/15/2029 | | | 115,000 | | | | 121,448 | |
| | |
5.625%, 5/1/2027 | | | 65,000 | | | | 69,713 | |
| | |
Nabors Industries, Inc., 5.75%, 2/1/2025 | | | 80,000 | | | | 72,000 | |
| | |
NuStar Logistics LP: | | | | | | | | |
| | |
5.625%, 4/28/2027 | | | 236,000 | | | | 242,490 | |
| | |
6.0%, 6/1/2026 | | | 160,000 | | | | 169,200 | |
| | |
Oasis Petroleum, Inc.: | | | | | | | | |
| | |
6.875%, 3/15/2022 | | | 373,000 | | | | 359,012 | |
| | |
6.875%, 1/15/2023 (b) | | | 60,000 | | | | 58,650 | |
| | |
Parkland Fuel Corp., 144A, 5.875%, 7/15/2027 | | | 170,000 | | | | 182,811 | |
| | |
Parsley Energy LLC: | | | | | | | | |
| | |
144A, 5.25%, 8/15/2025 | | | 55,000 | | | | 56,513 | |
| | |
144A, 5.375%, 1/15/2025 | | | 185,000 | | | | 190,550 | |
| | |
144A, 5.625%, 10/15/2027 | | | 175,000 | | | | 185,062 | |
| | |
Precision Drilling Corp., 144A, 7.125%, 1/15/2026 | | | 110,000 | | | | 104,500 | |
| | |
Range Resources Corp., 5.0%, 8/15/2022 | | | 185,000 | | | | 181,300 | |
| | |
Shelf Drilling Holdings Ltd., 144A, 8.25%, 2/15/2025 | | | 180,000 | | | | 171,450 | |
| | |
Southwestern Energy Co.: | | | | | | | | |
| | |
6.2%, 1/23/2025 | | | 60,000 | | | | 55,032 | |
| | |
7.75%, 10/1/2027 (b) | | | 30,000 | | | | 27,786 | |
| | |
Sunoco LP: | | | | | | | | |
| | |
5.5%, 2/15/2026 | | | 130,000 | | | | 134,875 | |
| | |
5.875%, 3/15/2028 | | | 35,000 | | | | 37,163 | |
| | |
6.0%, 4/15/2027 | | | 52,000 | | | | 55,510 | �� |
| | |
Targa Resources Partners LP: | | | | | | | | |
| | |
5.0%, 1/15/2028 | | | 235,000 | | | | 239,700 | |
| | |
5.375%, 2/1/2027 | | | 260,000 | | | | 269,750 | |
| | |
144A, 5.5%, 3/1/2030 | | | 90,000 | | | | 92,475 | |
| | |
TerraForm Power Operating LLC, 144A, 4.75%, 1/15/2030 | | | 135,000 | | | | 137,363 | |
| | |
Transocean Poseidon Ltd., 144A, 6.875%, 2/1/2027 | | | 105,000 | | | | 111,300 | |
| | |
USA Compression Partners LP, 6.875%, 4/1/2026 | | | 142,000 | | | | 149,100 | |
| | |
Whiting Petroleum Corp.: | | | | | | | | |
| | |
5.75%, 3/15/2021 | | | 160,000 | | | | 151,360 | |
| | |
6.625%, 1/15/2026 | | | 75,000 | | | | 51,111 | |
| | |
WPX Energy, Inc.: | | | | | | | | |
| | |
5.25%, 9/15/2024 | | | 145,000 | | | | 154,062 | |
| | |
5.25%, 10/15/2027 | | | 105,000 | | | | 110,775 | |
| | |
8.25%, 8/1/2023 | | | 105,000 | | | | 120,750 | |
| | | | | | | | |
| | | | | | | 7,177,926 | |
|
| Financials 2.4% | |
| | |
AmWINS Group, Inc., 144A, 7.75%, 7/1/2026 | | | 70,000 | | | | 77,359 | |
| | |
Hertz Corp., 144A, 6.0%, 1/15/2028 | | | 220,000 | | | | 220,000 | |
| | |
Intesa Sanpaolo SpA, 144A, 5.71%, 1/15/2026 | | | 200,000 | | | | 216,489 | |
| | |
Lions Gate Capital Holdings LLC, 144A, 6.375%, 2/1/2024 | | | 80,000 | | | | 83,602 | |
| | |
LPL Holdings, Inc., 144A, 4.625%, 11/15/2027 | | | 30,000 | | | | 30,600 | |
| | | | | | | | |
| | | Principal
Amount ($)(a) | | | Value ($) | |
| | |
Navient Corp.: | | | | | | | | |
| | |
5.5%, 1/25/2023 | | | 235,000 | | | | 250,862 | |
| | |
6.5%, 6/15/2022 | | | 100,000 | | | | 108,375 | |
| | |
6.75%, 6/25/2025 | | | 80,000 | | | | 88,320 | |
| | |
Springleaf Finance Corp.: | | | | | | | | |
| | |
5.375%, 11/15/2029 | | | 160,000 | | | | 167,008 | |
| | |
6.625%, 1/15/2028 | | | 35,000 | | | | 39,508 | |
| | |
Tempo Acquisition LLC, 144A, 6.75%, 6/1/2025 | | | 75,000 | | | | 77,438 | |
| | | | | | | | |
| | | | | | | 1,359,561 | |
|
| Health Care 8.3% | |
| | |
Avantor, Inc.: | | | | | | | | |
| | |
144A, 6.0%, 10/1/2024 | | | 130,000 | | | | 138,610 | |
| | |
144A, 9.0%, 10/1/2025 | | | 125,000 | | | | 139,691 | |
| | |
Bausch Health Americas, Inc.: | | | | | | | | |
| | |
144A, 8.5%, 1/31/2027 | | | 385,000 | | | | 438,438 | |
| | |
144A, 9.25%, 4/1/2026 | | | 85,000 | | | | 97,631 | |
| | |
Bausch Health Companies, Inc.: | | | | | | | | |
| | |
144A, 5.0%, 1/30/2028 | | | 110,000 | | | | 112,903 | |
| | |
144A, 5.25%, 1/30/2030 | | | 80,000 | | | | 82,960 | |
| | |
144A, 5.75%, 8/15/2027 | | | 115,000 | | | | 124,775 | |
| | |
144A, 5.875%, 5/15/2023 | | | 9,000 | | | | 9,079 | |
| | |
144A, 6.125%, 4/15/2025 | | | 150,000 | | | | 154,984 | |
| | |
144A, 6.5%, 3/15/2022 | | | 105,000 | | | | 107,362 | |
| | |
144A, 7.0%, 3/15/2024 | | | 255,000 | | | | 265,200 | |
| | |
144A, 7.0%, 1/15/2028 | | | 40,000 | | | | 44,152 | |
| | |
144A, 7.25%, 5/30/2029 | | | 20,000 | | | | 22,850 | |
| | |
Catalent Pharma Solutions, Inc., 144A, 5.0%, 7/15/2027 | | | 125,000 | | | | 130,937 | |
| | |
Centene Corp.: | | | | | | | | |
| | |
144A, 4.25%, 12/15/2027 | | | 90,000 | | | | 92,588 | |
| | |
144A, 4.625%, 12/15/2029 | | | 135,000 | | | | 141,932 | |
| | |
144A, 5.375%, 6/1/2026 | | | 95,000 | | | | 100,819 | |
| | |
Charles River Laboratories International, Inc.: | | | | | | | | |
| | |
144A, 4.25%, 5/1/2028 | | | 275,000 | | | | 280,156 | |
| | |
144A, 5.5%, 4/1/2026 | | | 20,000 | | | | 21,500 | |
| | |
Community Health Systems, Inc.: | | | | | | | | |
| | |
6.25%, 3/31/2023 | | | 280,000 | | | | 284,200 | |
| | |
144A, 8.0%, 3/15/2026 | | | 95,000 | | | | 97,850 | |
| | |
Encompass Health Corp.: | | | | | | | | |
| | |
4.5%, 2/1/2028 | | | 45,000 | | | | 46,631 | |
| | |
4.75%, 2/1/2030 | | | 37,000 | | | | 38,388 | |
| | |
HCA, Inc.: | | | | | | | | |
| | |
5.375%, 9/1/2026 | | | 90,000 | | | | 100,238 | |
| | |
5.875%, 2/15/2026 | | | 100,000 | | | | 113,713 | |
| | |
Hill-Rom Holdings, Inc., 144A, 4.375%, 9/15/2027 | | | 85,000 | | | | 87,444 | |
| | |
Select Medical Corp., 144A, 6.25%, 8/15/2026 | | | 275,000 | | | | 297,693 | |
| | |
Tenet Healthcare Corp.: | | | | | | | | |
| | |
144A, 4.875%, 1/1/2026 | | | 190,000 | | | | 199,006 | |
| | |
5.125%, 5/1/2025 | | | 215,000 | | | | 221,450 | |
| | |
144A, 5.125%, 11/1/2027 | | | 220,000 | | | | 232,375 | |
| | |
144A, 6.25%, 2/1/2027 | | | 60,000 | | | | 64,575 | |
| | |
6.75%, 6/15/2023 | | | 85,000 | | | | 93,390 | |
| | |
7.0%, 8/1/2025 (b) | | | 55,000 | | | | 58,094 | |
| | |
Teva Pharmaceutical Finance Netherlands III BV, 2.2%, 7/21/2021 | | | 46,000 | | | | 44,549 | |
| | |
WellCare Health Plans, Inc., 144A, 5.375%, 8/15/2026 | | | 130,000 | | | | 138,450 | |
| | | | | | | | |
| | | | | | | 4,624,613 | |
The accompanying notes are an integral part of the financial statements.
| | | | |
Deutsche DWS Variable Series II — DWS High Income VIP | | | | | 9 |
| | | | | | | | |
| | | Principal
Amount ($)(a) | | | Value ($) | |
|
| Industrials 8.3% | |
| | |
Bombardier, Inc.: | | | | | | | | |
| | |
144A, 5.75%, 3/15/2022 | | | 179,000 | | | | 184,873 | |
| | |
144A, 6.0%, 10/15/2022 | | | 143,000 | | | | 142,957 | |
| | |
144A, 7.875%, 4/15/2027 | | | 244,000 | | | | 251,015 | |
| | |
Builders Firstsource, Inc., 144A, 6.75%, 6/1/2027 | | | 15,000 | | | | 16,444 | |
| | |
BWX Technologies, Inc., 144A, 5.375%, 7/15/2026 | | | 30,000 | | | | 31,800 | |
| | |
Clean Harbors, Inc.: | | | | | | | | |
| | |
144A, 4.875%, 7/15/2027 | | | 65,000 | | | | 68,412 | |
| | |
144A, 5.125%, 7/15/2029 | | | 30,000 | | | | 32,178 | |
| | |
Colfax Corp.: | | | | | | | | |
| | |
144A, 6.0%, 2/15/2024 | | | 25,000 | | | | 26,563 | |
| | |
144A, 6.375%, 2/15/2026 | | | 95,000 | | | | 103,550 | |
| | |
Covanta Holding Corp., 5.875%, 7/1/2025 | | | 205,000 | | | | 216,275 | |
| | |
DAE Funding LLC: | | | | | | | | |
| | |
144A, 4.5%, 8/1/2022 | | | 8,000 | | | | 8,120 | |
| | |
144A, 5.0%, 8/1/2024 | | | 25,000 | | | | 26,249 | |
| | |
144A, 5.75%, 11/15/2023 | | | 115,000 | | | | 120,606 | |
| | |
Energizer Holdings, Inc.: | | | | | | | | |
| | |
144A, 5.5%, 6/15/2025 | | | 115,000 | | | | 119,312 | |
| | |
144A, 6.375%, 7/15/2026 | | | 120,000 | | | | 127,800 | |
| | |
144A, 7.75%, 1/15/2027 | | | 105,000 | | | | 117,343 | |
| | |
EnerSys, 144A, 4.375%, 12/15/2027 | | | 90,000 | | | | 88,884 | |
| | |
GFL Environmental, Inc.: | | | | | | | | |
| | |
144A, 5.125%, 12/15/2026 | | | 50,000 | | | | 52,569 | |
| | |
144A, 7.0%, 6/1/2026 | | | 160,000 | | | | 169,024 | |
| | |
Graphic Packaging International LLC, 144A, 4.75%, 7/15/2027 | | | 30,000 | | | | 32,100 | |
| | |
Itron, Inc., 144A, 5.0%, 1/15/2026 | | | 140,000 | | | | 145,075 | |
| | |
Masonite International Corp., 144A, 5.375%, 2/1/2028 | | | 74,000 | | | | 78,162 | |
| | |
Moog, Inc.: | | | | | | | | |
| | |
144A, 4.25%, 12/15/2027 | | | 160,000 | | | | 162,816 | |
| | |
144A, 5.25%, 12/1/2022 | | | 120,000 | | | | 121,644 | |
| |
Prime Security Services Borrower LLC: | | | | | |
| | |
144A, 5.75%, 4/15/2026 | | | 135,000 | | | | 146,729 | |
| | |
144A, 9.25%, 5/15/2023 | | | 2,000 | | | | 2,098 | |
| | |
Sensata Technologies, Inc., 144A, 4.375%, 2/15/2030 | | | 30,000 | | | | 30,583 | |
| | |
Signature Aviation US Holdings Inc, 144A, 4.0%, 3/1/2028 | | | 155,000 | | | | 152,876 | |
| | |
Summit Materials LLC, 6.125%, 7/15/2023 | | | 200,000 | | | | 203,250 | |
| | |
Tennant Co., 5.625%, 5/1/2025 | | | 30,000 | | | | 31,350 | |
| | |
TransDigm, Inc.: | | | | | | | | |
| | |
144A, 5.5%, 11/15/2027 | | | 170,000 | | | | 171,909 | |
| | |
144A, 6.25%, 3/15/2026 | | | 315,000 | | | | 341,022 | |
| | |
Triumph Group, Inc., 144A, 6.25%, 9/15/2024 | | | 64,000 | | | | 67,280 | |
| |
United Rentals North America, Inc.: | | | | | |
| | |
4.625%, 10/15/2025 | | | 800,000 | | | | 822,480 | |
| | |
6.5%, 12/15/2026 | | | 220,000 | | | | 241,794 | |
| | | | | | | | |
| | | | | | | 4,655,142 | |
Information Technology 2.6% | |
| | |
Camelot Finance SA, 144A, 4.5%, 11/1/2026 | | | 55,000 | | | | 56,513 | |
| | |
Cardtronics, Inc., 144A, 5.5%, 5/1/2025 | | | 95,000 | | | | 98,562 | |
| | | | | | | | |
| | | Principal
Amount ($)(a) | | | Value ($) | |
| | |
CDK Global, Inc., 144A, 5.25%, 5/15/2029 | | | 85,000 | | | | 91,162 | |
| | |
Change Healthcare Holdings LLC, 144A, 5.75%, 3/1/2025 | | | 210,000 | | | | 215,775 | |
| | |
Fair Isaac Corp., 144A, 5.25%, 5/15/2026 | | | 130,000 | | | | 143,000 | |
| | |
Go Daddy Operating Co. LLC, 144A, 5.25%, 12/1/2027 | | | 165,000 | | | | 173,662 | |
| | |
IQVIA, Inc., 144A, 5.0%, 5/15/2027 | | | 220,000 | | | | 232,728 | |
| | |
MTS Systems Corp., 144A, 5.75%, 8/15/2027 | | | 32,000 | | | | 33,440 | |
| | |
Qorvo, Inc., 144A, 4.375%, 10/15/2029 | | | 55,000 | | | | 57,613 | |
| | |
Refinitiv U.S. Holdings, Inc., 144A, 8.25%, 11/15/2026 | | | 85,000 | | | | 95,731 | |
| | |
SS&C Technologies, Inc., 144A, 5.5%, 9/30/2027 | | | 85,000 | | | | 90,738 | |
| | |
TTM Technologies, Inc., 144A, 5.625%, 10/1/2025 | | | 155,000 | | | | 160,231 | |
| | | | | | | | |
| | | | | | | 1,449,155 | |
|
| Materials 11.2% | |
| | |
AK Steel Corp., 7.5%, 7/15/2023 | | | 85,000 | | | | 88,400 | |
| | |
Ardagh Packaging Finance PLC, 144A, 6.0%, 2/15/2025 | | | 220,000 | | | | 230,725 | |
| | |
Axalta Coating Systems LLC, 144A, 4.875%, 8/15/2024 | | | 175,000 | | | | 181,125 | |
| | |
Berry Global, Inc.: | | | | | | | | |
| | |
144A, 4.875%, 7/15/2026 | | | 105,000 | | | | 110,744 | |
| | |
5.5%, 5/15/2022 | | | 315,000 | | | | 318,544 | |
| | |
144A, 5.625%, 7/15/2027 | | | 15,000 | | | | 16,088 | |
| | |
Cascades, Inc.: | | | | | | | | |
| | |
144A, 5.125%, 1/15/2026 | | | 10,000 | | | | 10,275 | |
| | |
144A, 5.375%, 1/15/2028 | | | 15,000 | | | | 15,413 | |
| | |
CF Industries, Inc., 5.15%, 3/15/2034 | | | 105,000 | | | | 117,338 | |
| | |
Chemours Co.: | | | | | | | | |
| | |
5.375%, 5/15/2027 | | | 115,000 | | | | 101,775 | |
| | |
7.0%, 5/15/2025 (b) | | | 60,000 | | | | 60,450 | |
| | |
Clearwater Paper Corp., 144A, 5.375%, 2/1/2025 | | | 110,000 | | | | 109,175 | |
| | |
Constellium SE: | | | | | | | | |
| | |
144A, 4.625%, 5/15/2021 | | | EUR 100,000 | | | | 112,432 | |
| | |
144A, 5.75%, 5/15/2024 | | | 250,000 | | | | 256,875 | |
| | |
144A, 6.625%, 3/1/2025 | | | 250,000 | | | | 259,400 | |
| | |
Element Solutions, Inc., 144A, 5.875%, 12/1/2025 | | | 85,000 | | | | 88,931 | |
| | |
First Quantum Minerals Ltd.: | | | | | | | | |
| | |
144A, 6.5%, 3/1/2024 | | | 245,000 | | | | 245,612 | |
| | |
144A, 6.875%, 3/1/2026 | | | 200,000 | | | | 202,500 | |
| | |
Freeport-McMoRan, Inc.: | | | | | | | | |
| | |
3.875%, 3/15/2023 | | | 100,000 | | | | 101,823 | |
| | |
5.0%, 9/1/2027 | | | 240,000 | | | | 252,000 | |
| | |
5.25%, 9/1/2029 | | | 280,000 | | | | 299,964 | |
| | |
Hudbay Minerals, Inc.: | | | | | | | | |
| | |
144A, 7.25%, 1/15/2023 | | | 95,000 | | | | 98,503 | |
| | |
144A, 7.625%, 1/15/2025 | | | 220,000 | | | | 232,210 | |
| | |
Kaiser Aluminum Corp., 144A, 4.625%, 3/1/2028 | | | 70,000 | | | | 71,820 | |
| | |
LABL Escrow Issuer LLC, 144A, 6.75%, 7/15/2026 | | | 100,000 | | | | 106,250 | |
The accompanying notes are an integral part of the financial statements.
| | | | | | |
| | 10 | | | | | | Deutsche DWS Variable Series II — DWS High Income VIP |
| | | | | | | | |
| | | Principal
Amount ($)(a) | | | Value ($) | |
| |
Mauser Packaging Solutions Holding Co.: | | | | | |
| | |
144A, 5.5%, 4/15/2024 | | | 175,000 | | | | 180,268 | |
| | |
144A, 7.25%, 4/15/2025 | | | 205,000 | | | | 202,437 | |
| | |
Mercer International, Inc.: | | | | | | | | |
| | |
6.5%, 2/1/2024 | | | 110,000 | | | | 114,125 | |
| | |
7.375%, 1/15/2025 | | | 175,000 | | | | 188,379 | |
| | |
NOVA Chemicals Corp.: | | | | | | | | |
| | |
144A, 4.875%, 6/1/2024 | | | 185,000 | | | | 191,013 | |
| | |
144A, 5.25%, 6/1/2027 | | | 140,000 | | | | 143,850 | |
| | |
Novelis Corp., 144A, 5.875%, 9/30/2026 | | | 230,000 | | | | 244,744 | |
| | |
Olin Corp., 5.625%, 8/1/2029 | | | 314,000 | | | | 331,647 | |
| | |
Reynolds Group Issuer, Inc.: | | | | | | | | |
| | |
144A, 5.125%, 7/15/2023 | | | 290,000 | | | | 296,887 | |
| | |
144A, 7.0%, 7/15/2024 | | | 35,000 | | | | 36,181 | |
| | |
Tronox Finance PLC, 144A, 5.75%, 10/1/2025 | | | 266,000 | | | | 270,980 | |
| | |
Tronox, Inc., 144A, 6.5%, 4/15/2026 | | | 192,000 | | | | 197,798 | |
| | |
United States Steel Corp., 6.25%, 3/15/2026 | | | 124,000 | | | | 106,032 | |
| | |
Univar Solutions USA, Inc., 144A, 5.125%, 12/1/2027 | | | 80,000 | | | | 83,502 | |
| | | | | | | | |
| | | | | | | 6,276,215 | |
|
| Real Estate 3.2% | |
| | |
Iron Mountain, Inc.: | | | | | | | | |
| | |
144A, (REIT), 4.875%, 9/15/2029 | | | 125,000 | | | | 126,975 | |
| | |
144A, (REIT), 5.25%, 3/15/2028 | | | 50,000 | | | | 52,000 | |
| | |
(REIT), 5.75%, 8/15/2024 | | | 320,000 | | | | 323,600 | |
| | |
(REIT), 6.0%, 8/15/2023 | | | 300,000 | | | | 306,375 | |
| | |
iStar, Inc.: | | | | | | | | |
| | |
(REIT), 4.25%, 8/1/2025 | | | 100,000 | | | | 101,096 | |
| | |
(REIT), 4.75%, 10/1/2024 | | | 170,000 | | | | 176,162 | |
| | |
MGM Growth Properties Operating Partnership LP, 144A, (REIT), 5.75%, 2/1/2027 | | | 310,000 | | | | 345,650 | |
| | |
MPT Operating Partnership LP: | | | | | | | | |
| | |
(REIT), 4.625%, 8/1/2029 | | | 140,000 | | | | 144,200 | |
| | |
(REIT), 6.375%, 3/1/2024 | | | 170,000 | | | | 176,795 | |
| | |
Ryman Hospitality Properties, Inc., 144A, (REIT), 4.75%, 10/15/2027 | | | 5,000 | | | | 5,163 | |
| | |
VICI Properties LP, 144A (REIT), 4.625%, 12/1/2029 | | | 16,000 | | | | 16,680 | |
| | | | | | | | |
| | | | | | | 1,774,696 | |
|
| Utilities 6.0% | |
| | |
AES Corp., 4.875%, 5/15/2023 | | | 94,000 | | | | 95,410 | |
| | |
AmeriGas Partners LP: | | | | | | | | |
| | |
5.5%, 5/20/2025 | | | 205,000 | | | | 221,400 | |
| | |
5.75%, 5/20/2027 | | | 110,000 | | | | 120,725 | |
| | |
Calpine Corp.: | | | | | | | | |
| | |
144A, 4.5%, 2/15/2028 | | | 155,000 | | | | 156,375 | |
| | |
144A, 5.125%, 3/15/2028 | | | 160,000 | | | | 163,312 | |
| | |
144A, 5.25%, 6/1/2026 | | | 260,000 | | | | 270,725 | |
| | |
5.75%, 1/15/2025 | | | 125,000 | | | | 128,281 | |
| | |
Clearway Energy Operating LLC, 144A, 4.75%, 3/15/2028 | | | 165,000 | | | | 167,269 | |
| | |
NextEra Energy Operating Partners LP, 144A, 4.25%, 7/15/2024 | | | 210,000 | | | | 218,662 | |
| | | | | | | | |
| | | Principal
Amount ($)(a) | | | Value ($) | |
| | |
NRG Energy, Inc.: | | | | | | | | |
| | |
144A, 5.25%, 6/15/2029 | | | 157,000 | | | | 169,756 | |
| | |
5.75%, 1/15/2028 | | | 200,000 | | | | 217,000 | |
| | |
7.25%, 5/15/2026 | | | 75,000 | | | | 81,938 | |
| | |
Talen Energy Supply LLC, 144A, 7.25%, 5/15/2027 | | | 190,000 | | | | 199,918 | |
| | |
Vistra Energy Corp., 5.875%, 6/1/2023 | | | 70,000 | | | | 71,613 | |
| | |
Vistra Operations Co. LLC: | | | | | | | | |
| | |
144A, 5.0%, 7/31/2027 | | | 220,000 | | | | 229,896 | |
| | |
144A, 5.5%, 9/1/2026 | | | 315,000 | | | | 333,900 | |
| | |
144A, 5.625%, 2/15/2027 | | | 495,000 | | | | 521,606 | |
| | | | | | | | |
| | |
| | | | | | | | 3,367,786 | |
Total Corporate Bonds (Cost $51,007,698) | | | | 52,917,486 | |
|
| Loan Participations and Assignments 0.3% | |
| Senior Loan** | |
Endo Luxembourg Finance Company I S.a r.l., Term Loan B,1-month USD LIBOR + 4.250%, 6.063%, 4/29/2024 (Cost $166,021) | | | 179,540 | | | | 172,386 | |
| |
| Convertible Bonds 0.1% | | | | |
| Communication Services | |
DISH Network Corp., 2.375%, 3/15/2024 (Cost $36,925) | | | 35,000 | | | | 31,959 | |
| | |
| | | Shares | | | Value ($) | |
| Common Stocks 0.0% | | | | |
| Industrials | |
Quad Graphics, Inc. (Cost $0) | | | 287 | | | | 1,340 | |
| |
| Warrants 0.1% | | | | |
| Materials | |
Hercules Trust II, Expiration Date 3/31/2029* (d) (Cost $244,285) | | | 1,100 | | | | 42,051 | |
|
| Securities Lending Collateral 0.6% | |
DWS Government & Agency Securities Portfolio “DWS Government Cash Institutional Shares”, 1.50% (e) (f) (Cost $361,289) | | | 361,289 | | | | 361,289 | |
| |
| Cash Equivalents 3.9% | | | | |
DWS Central Cash Management Government Fund, 1.62% (e) (Cost $2,187,480) | | | 2,187,480 | | | | 2,187,480 | |
The accompanying notes are an integral part of the financial statements.
| | | | |
Deutsche DWS Variable Series II — DWS High Income VIP | | | | | 11 |
| | | | | | | | |
| | |
| | | % of Net
Assets | | | Value ($) | |
Total Investment Portfolio (Cost $54,003,698) | | | 99.4 | | | | 55,713,991 | |
| Other Assets and Liabilities, Net | | | 0.6 | | | | 321,555 | |
| Net Assets | | | 100.0 | | | | 56,035,546 | |
A summary of the Fund’s transactions with affiliated investments during the year ended December 31, 2019 are as follows:
| | | | | | | | | | | | | | | | | | | | | | | | | | | | | | | | |
Value ($) at
12/31/2018 | | Purchases
Cost ($) | | | Sales
Proceeds ($) | | | Net
Realized
Gain/
(Loss) ($) | | | Net Change in
Unrealized
Appreciation
(Depreciation) ($) | | | Income ($) | | | Capital Gain
Distributions ($) | | | Number
of Shares
at
12/31/2019 | | | Value ($)
at
12/31/2019 | |
Securities Lending Collateral 0.6% | |
DWS Government & Agency Securities Portfolio “DWS Government Cash Institutional Shares”, 1.50% (e) (f) | |
| 1,464,490 | | | — | | | | 1,103,201 | (g) | | | — | | | | — | | | | 6,051 | | | | — | | | | 361,289 | | | | 361,289 | |
Cash Equivalents 3.9% | |
DWS Central Cash Management Government Fund, 1.62% (e) | |
| 4,341,875 | | | 29,948,464 | | | | 32,102,859 | | | | — | | | | — | | | | 60,892 | | | | — | | | | 2,187,480 | | | | 2,187,480 | |
| 5,806,365 | | | 29,948,464 | | | | 33,206,060 | | | | — | | | | — | | | | 66,943 | | | | — | | | | 2,548,769 | | | | 2,548,769 | |
| * | Non-income producing security. |
| ** | Variable or floating rate security. These securities are shown at their current rate as of December 31, 2019. For securities based on a published reference rate and spread, the reference rate and spread are indicated within the description above. Certain variable rate securities are not based on a published reference rate and spread but adjust periodically based on current market conditions, prepayment of underlying positions and/or other variables. |
| (a) | Principal amount stated in U.S. dollars unless otherwise noted. |
| (b) | All or a portion of these securities were on loan. In addition, “Other Assets and Liabilities, Net” may include pending sales that are also on loan. The value of securities loaned at December 31, 2019 amounted to $350,511, which is 0.6% of net assets. |
| (c) | Perpetual, callable security with no stated maturity date. |
| (d) | Investment was valued using significant unobservable inputs. |
| (e) | Affiliated fund managed by DWS Investment Management Americas, Inc. The rate shown is the annualizedseven-day yield at period end. |
| (f) | Represents cash collateral held in connection with securities lending. Income earned by the Fund is net of borrower rebates. |
| (g) | Represents the net increase (purchase cost) or decrease (sales proceeds) in the amount invested in cash collateral for the year ended December 31, 2019. |
144A: Security exempt from registration under Rule 144A of the Securities Act of 1933. These securities may be resold in transactions exempt from registration, normally to qualified institutional buyers.
LIBOR: London Interbank Offered Rate
REG S: Securities sold under Regulation S may not be offered, sold or delivered within the United States or to, or for the account or benefit of, U.S. persons, except pursuant to an exemption from, or in a transaction not subject to, the registration requirements of the Securities Act of 1933.
REIT: Real Estate Investment Trust
As of December 31, 2019, the Fund had the following open forward foreign currency contracts:
| | | | | | | | | | | | | | | | | | | | | | |
| Contracts to Deliver | | | In Exchange For | | | Settlement
Date | | | Unrealized
Depreciation ($) | | | Counterparty |
| EUR | | | 791,230 | | | | USD | | | | 879,605 | | | | 1/31/2020 | | | | (9,627 | ) | | BNP Paribas SA |
Currency Abbreviations
For information on the Fund’s policy and additional disclosures regarding forward foreign currency contracts, please refer to the Derivatives section of Note B in the accompanying Notes to Financial Statements.
The accompanying notes are an integral part of the financial statements.
| | | | | | |
| | 12 | | | | | | Deutsche DWS Variable Series II — DWS High Income VIP |
Fair Value Measurements
Various inputs are used in determining the value of the Fund’s investments. These inputs are summarized in three broad levels. Level 1 includes quoted prices in active markets for identical securities. Level 2 includes other significant observable inputs (including quoted prices for similar securities, interest rates, prepayment speeds and credit risk). Level 3 includes significant unobservable inputs (including the Fund’s own assumptions in determining the fair value of investments). The level assigned to the securities valuations may not be an indication of the risk or liquidity associated with investing in those securities.
The following is a summary of the inputs used as of December 31, 2019 in valuing the Fund’s investments. For information on the Fund’s policy regarding the valuation of investments, please refer to the Security Valuation section of Note A in the accompanying Notes to Financial Statements.
| | | | | | | | | | | | | | | | |
| Assets | | Level 1 | | | Level 2 | | | Level 3 | | | Total | |
| Fixed Income Investments | | | | | | | | | | | | | | | | |
Corporate Bonds(h) | | $ | — | | | $ | 52,917,486 | | | $ | — | | | $ | 52,917,486 | |
Loan Participations and Assignments | | | — | | | | 172,386 | | | | — | | | | 172,386 | |
Convertible Bonds | | | — | | | | 31,959 | | | | — | | | | 31,959 | |
| Common Stocks | | | 1,340 | | | | — | | | | — | | | | 1,340 | |
| Warrants | | | — | | | | — | | | | 42,051 | | | | 42,051 | |
| Short-Term Investments (h) | | | 2,548,769 | | | | — | | | | — | | | | 2,548,769 | |
| Total | | $ | 2,550,109 | | | $ | 53,121,831 | | | $ | 42,051 | | | $ | 55,713,991 | |
| | | | |
| Liabilities | | Level 1 | | | Level 2 | | | Level 3 | | | Total | |
| Derivatives (i) | | | | | | | | | | | | | | | | |
Forward Foreign Currency Contracts | | $ | — | | | $ | (9,627 | ) | | $ | — | | | $ | (9,627 | ) |
| Total | | $ | — | | | $ | (9,627 | ) | | $ | — | | | $ | (9,627 | ) |
| (h) | See Investment Portfolio for additional detailed categorizations. |
| (i) | Derivatives include unrealized appreciation (depreciation) on open forward foreign currency contracts. |
Level 3 Reconciliation
The following is a reconciliation of the Fund’s Level 3 investments for which significant unobservable inputs were used in determining value:
| | | | | | | | | | | | | | | | |
| | | Convertible
Bond | | | Common
Stocks | | | Warrant | | | Total | |
Balance as of December 31, 2018 | | $ | 1,710,710 | | | $ | 116,277 | | | $ | 27,119 | | | $ | 1,854,106 | |
| Realized gains (loss) | | | — | | | | (30,915 | ) | | | — | | | | (30,915 | ) |
| Change in unrealized appreciation (depreciation) | | | (135,355 | ) | | | 386,695 | | | | 14,932 | | | | 266,272 | |
| Amortization of premium/accretion of discount | | | 174 | | | | — | | | | — | | | | 174 | |
| Purchases/PIK | | | 110,092 | | | | 1,781,183 | | | | — | | | | 1,891,275 | |
| (Sales) | | | (1,685,621 | ) | | | (2,253,240 | ) | | | — | | | | (3,938,861 | ) |
| Transfer into Level 3 | | | — | | | | — | | | | — | | | | — | |
| Transfer (out) of Level 3 | | | — | | | | — | | | | — | | | | — | |
| Balance as of December 31, 2019 | | $ | — | | | $ | — | | | $ | 42,051 | | | $ | 42,051 | |
| Net change in unrealized appreciation (depreciation) from investments still held as of December 31, 2019 | | $ | — | | | $ | — | | | $ | 14,932 | | | $ | 14,932 | |
The accompanying notes are an integral part of the financial statements.
| | | | |
Deutsche DWS Variable Series II — DWS High Income VIP | | | | | 13 |
Statement of Assets and Liabilities
| | | | |
| as of December 31, 2019 | | | | |
| |
| Assets | | | | |
| Investments innon-affiliated securities, at value (cost $51,454,929) — including $350,511 of securities loaned | | $ | 53,165,222 | |
| Investment in DWS Government & Agency Securities Portfolio (cost $361,289)* | | | 361,289 | |
| Investment in DWS Central Cash Management Government Fund (cost $2,187,480) | | | 2,187,480 | |
| Cash | | | 10,000 | |
| Foreign currency, at value (cost $124,910) | | | 124,902 | |
| Receivable for investments sold | | | 58,405 | |
| Receivable for Fund shares sold | | | 27,969 | |
| Interest receivable | | | 821,193 | |
| Other assets | | | 1,536 | |
| Total assets | | | 56,757,996 | |
| |
| Liabilities | | | | |
| Payable upon return of securities loaned | | | 361,289 | |
| Payable for investments purchased | | | 198,817 | |
| Payable for Fund shares redeemed | | | 11,056 | |
| Unrealized depreciation on forward foreign currency contracts | | | 9,627 | |
| Accrued management fee | | | 5,242 | |
| Accrued Trustees’ fees | | | 1,885 | |
| Other accrued expenses and payables | | | 134,534 | |
| Total liabilities | | | 722,450 | |
| Net assets, at value | | $ | 56,035,546 | |
| |
| Net Assets Consist of | | | | |
| Distributable earnings (loss) | | | (2,184,761 | ) |
| Paid-in capital | | | 58,220,307 | |
| Net assets, at value | | $ | 56,035,546 | |
| |
| Net Asset Value | | | | |
Class A | | | | |
| |
| Net Asset Value, offering and redemption price per share ($55,876,386 ÷ 8,976,023 outstanding shares of beneficial interest, no par value, unlimited number of shares authorized) | | $ | 6.23 | |
Class B | | | | |
| |
| Net Asset Value, offering and redemption price per share ($159,160 ÷ 25,470 outstanding shares of beneficial interest, no par value, unlimited number of shares authorized) | | $ | 6.25 | |
| * | Represents collateral on securities loaned. |
Statement of Operations
| | | | |
| for the year ended December 31, 2019 | |
| |
| Investment Income | | | | |
| Income: | | | | |
| |
| Interest | | $ | 3,129,488 | |
| Income distributions — DWS Central Cash Management Government Fund | | | 60,892 | |
| Securities lending income, net of borrower rebates | | | 6,051 | |
| Total income | | | 3,196,431 | |
| Expenses: | | | | |
| |
| Management fee | | | 277,093 | |
| Administration fee | | | 55,419 | |
| Services to Shareholders | | | 768 | |
| Record keeping fee (Class B) | | | 208 | |
| Distribution service fees (Class B) | | | 353 | |
| Custodian fee | | | 23,037 | |
| Professional fees | | | 93,081 | |
| Reports to shareholders | | | 37,370 | |
| Trustees’ fees and expenses | | | 4,840 | |
| Pricing service fee | | | 37,913 | |
| Other | | | 3,217 | |
| Total expenses before expense reductions | | | 533,299 | |
| Expense reductions | | | (156,003 | ) |
| Total expenses after expense reductions | | | 377,296 | |
| Net investment income | | | 2,819,135 | |
| |
| Realized and Unrealized Gain (Loss) | | | | |
| Net realized gain (loss) from: | | | | |
| Investments | | | (168,942 | ) |
| Forward foreign currency contracts | | | 52,518 | |
| Foreign currency | | | (2,137 | ) |
| | | | (118,561 | ) |
| Change in net unrealized appreciation (depreciation) on: | | | | |
| |
| Investments | | | 5,190,057 | |
| Forward foreign currency contracts | | | (8,191 | ) |
| Foreign currency | | | 40 | |
| | | | 5,181,906 | |
| Net gain (loss) | | | 5,063,345 | |
| Net increase (decrease) in net assets resulting from operations | | $ | 7,882,480 | |
The accompanying notes are an integral part of the financial statements.
| | | | | | |
| | 14 | | | | | | Deutsche DWS Variable Series II — DWS High Income VIP |
Statements of Changes in Net Assets
| | | | | | | | |
| | | Years Ended December 31, | |
| Increase (Decrease) in Net Assets | | 2019 | | | 2018 | |
| Operations: | | | | | | | | |
| Net investment income (loss) | | $ | 2,819,135 | | | $ | 3,142,998 | |
| Net realized gain (loss) | | | (118,561 | ) | | | (176,656 | ) |
| Change in net unrealized appreciation (depreciation) | | | 5,181,906 | | | | (4,256,326 | ) |
| Net increase (decrease) in net assets resulting from operations | | | 7,882,480 | | | | (1,289,984 | ) |
| Distributions to shareholders: | | | | | | | | |
Class A | | | (3,177,995 | ) | | | (4,670,013 | ) |
Class B | | | (7,539 | ) | | | (14,079 | ) |
| Total distributions | | | (3,185,534 | ) | | | (4,684,092 | ) |
| Fund share transactions: | | | | | | | | |
Class A | | | | | | | | |
| Proceeds from shares sold | | | 5,665,153 | | | | 4,796,087 | |
| Reinvestment of distributions | | | 3,177,995 | | | | 4,670,013 | |
| Payments for shares redeemed | | | (9,540,349 | ) | | | (12,180,108 | ) |
| Net increase (decrease) in net assets from Class A share transactions | | | (697,201 | ) | | | (2,714,008 | ) |
Class B | | | | | | | | |
| Proceeds from shares sold | | | 16,476 | | | | 63,056 | |
| Reinvestment of distributions | | | 7,539 | | | | 14,079 | |
| Payments for shares redeemed | | | (11,195 | ) | | | (64,199 | ) |
| Net increase (decrease) in net assets from Class B share transactions | | | 12,820 | | | | 12,936 | |
| Increase (decrease) in net assets | | | 4,012,565 | | | | (8,675,148 | ) |
| Net assets at beginning of period | | | 52,022,981 | | | | 60,698,129 | |
| | |
| Net assets at end of period | | $ | 56,035,546 | | | $ | 52,022,981 | |
| | |
| Other Information | | | | | | |
Class A | | | | | | | | |
| Shares outstanding at beginning of period | | | 9,081,584 | | | | 9,527,083 | |
| Shares sold | | | 944,540 | | | | 775,176 | |
| Shares issued to shareholders in reinvestment of distributions | | | 543,247 | | | | 803,789 | |
| Shares redeemed | | | (1,593,348 | ) | | | (2,024,464 | ) |
| Net increase (decrease) in Class A shares | | | (105,561 | ) | | | (445,499 | ) |
| | |
| Shares outstanding at end of period | | | 8,976,023 | | | | 9,081,584 | |
Class B | | | | | | | | |
| Shares outstanding at beginning of period | | | 23,418 | | | | 21,761 | |
| Shares sold | | | 2,669 | | | | 9,962 | |
| Shares issued to shareholders in reinvestment of distributions | | | 1,282 | | | | 2,411 | |
| Shares redeemed | | | (1,899 | ) | | | (10,716 | ) |
| Net increase (decrease) in Class B shares | | | 2,052 | | | | 1,657 | |
| | |
| Shares outstanding at end of period | | | 25,470 | | | | 23,418 | |
The accompanying notes are an integral part of the financial statements.
| | | | |
Deutsche DWS Variable Series II — DWS High Income VIP | | | | | 15 |
Financial Highlights
| | | | | | | | | | | | | | | | | | | | |
| | | Years Ended December 31, | |
| Class A | | 2019 | | | 2018 | | | 2017 | | | 2016 | | | 2015 | |
| | | | | |
| Selected Per Share Data | | | | | | | | | | | | | | | | | | | | |
| Net asset value, beginning of period | | $ | 5.71 | | | $ | 6.36 | | | $ | 6.28 | | | $ | 5.93 | | | $ | 6.60 | |
| Income (loss) from investment operations: | | | | | | | | | | | | | | | | | | | | |
| | | | | |
Net investment incomea | | | .31 | | | | .33 | | | | .31 | | | | .32 | | | | .32 | |
Net realized and unrealized gain (loss) | | | .56 | | | | (.48 | ) | | | .15 | | | | .41 | | | | (.58 | ) |
Total from investment operations | | | .87 | | | | (.15 | ) | | | .46 | | | | .73 | | | | (.26 | ) |
| Less distributions from: | | | | | | | | | | | | | | | | | | | | |
Net investment income | | | (.35 | ) | | | (.50 | ) | | | (.38 | ) | | | (.38 | ) | | | (.41 | ) |
| Net asset value, end of period | | $ | 6.23 | | | $ | 5.71 | | | $ | 6.36 | | | $ | 6.28 | | | $ | 5.93 | |
| Total Return (%)b | | | 15.69 | | | | (2.52 | ) | | | 7.51 | | | | 12.87 | | | | (4.44 | ) |
| | | | | |
| Ratios to Average Net Assets and Supplemental Data | | | | | | | | | | | | | | | | | | | | |
| Net assets, end of period ($ millions) | | | 56 | | | | 52 | | | | 61 | | | | 100 | | | | 101 | |
| Ratio of expenses before expense reductions (%)c | | | .96 | | | | .94 | | | | .78 | | | | .80 | | | | .75 | |
| Ratio of expenses after expense reductions (%)c | | | .68 | | | | .69 | | | | .72 | | | | .72 | | | | .72 | |
| Ratio of net investment income (%) | | | 5.09 | | | | 5.41 | | | | 4.98 | | | | 5.38 | | | | 5.09 | |
| Portfolio turnover rate (%) | | | 82 | | | | 62 | | | | 71 | | | | 77 | | | | 47 | |
| a | Based on average shares outstanding during the period. |
| b | Total return would have been lower had certain expenses not been reduced. |
| c | Expense ratio does not reflect charges and fees associated with the separate account that invests in the Fund or any variable life insurance policy or variable annuity contract for which the Fund is an investment option. |
| | | | | | | | | | | | | | | | | | | | |
| | | Years Ended December 31, | |
| Class B | | 2019 | | | 2018 | | | 2017 | | | 2016 | | | 2015 | |
| | | | | |
| Selected Per Share Data | | | | | | | | | | | | | | | | | | | | |
| Net asset value, beginning of period | | $ | 5.73 | | | $ | 6.38 | | | $ | 6.30 | | | $ | 5.94 | | | $ | 6.63 | |
| Income (loss) from investment operations: | | | | | | | | | | | | | | | | | | | | |
| | | | | |
Net investment incomea | | | .29 | | | | .31 | | | | .31 | | | | .31 | | | | .32 | |
Net realized and unrealized gain (loss) | | | .57 | | | | (.48 | ) | | | .13 | | | | .41 | | | | (.61 | ) |
Total from investment operations | | | .86 | | | | (.17 | ) | | | .44 | | | | .72 | | | | (.29 | ) |
| Less distributions from: | | | | | | | | | | | | | | | | | | | | |
Net investment income | | | (.34 | ) | | | (.48 | ) | | | (.36 | ) | | | (.36 | ) | | | (.40 | ) |
| Net asset value, end of period | | $ | 6.25 | | | $ | 5.73 | | | $ | 6.38 | | | $ | 6.30 | | | $ | 5.94 | |
| Total Return (%)b | | | 15.33 | | | | (2.76 | ) | | | 7.21 | | | | 12.67 | | | | (4.95 | ) |
| | | | | |
| Ratios to Average Net Assets and Supplemental Data | | | | | | | | | | | | | | | | | | | | |
| Net assets, end of period ($ millions) | | | .2 | | | | .1 | | | | .1 | | | | 2 | | | | 3 | |
| Ratio of expenses before expense reductions (%)c | | | 1.40 | | | | 1.34 | | | | 1.15 | | | | 1.21 | | | | 1.14 | |
| Ratio of expenses after expense reductions (%)c | | | .94 | | | | .96 | | | | .98 | | | | .98 | | | | 1.02 | |
| Ratio of net investment income (%) | | | 4.82 | | | | 5.14 | | | | 4.88 | | | | 5.15 | | | | 4.86 | |
| Portfolio turnover rate (%) | | | 82 | | | | 62 | | | | 71 | | | | 77 | | | | 47 | |
| a | Based on average shares outstanding during the period. |
| b | Total return would have been lower had certain expenses not been reduced. |
| c | Expense ratio does not reflect charges and fees associated with the separate account that invests in the Fund or any variable life insurance policy or variable annuity contract for which the Fund is an investment option. |
The accompanying notes are an integral part of the financial statements.
| | | | | | |
| | 16 | | | | | | Deutsche DWS Variable Series II — DWS High Income VIP |
| | |
| Notes to Financial Statements | | |
A. Organization and Significant Accounting Policies
DWS High Income VIP (the “Fund”) is a diversified series of Deutsche DWS Variable Series II (the “Trust”), which is registered under the Investment Company Act of 1940, as amended (the “1940 Act”), as an open-end management investment company organized as a Massachusetts business trust.
Multiple Classes of Shares of Beneficial Interest. The Fund offers two classes of shares (Class A shares and Class B shares). Sales of Class B shares are subject to recordkeeping fees up to 0.15% and Rule 12b-1 fees under the 1940 Act equal to an annual rate of 0.25% of the average daily net assets of the Class B shares of the Fund. Class A shares are not subject to such fees.
Investment income, realized and unrealized gains and losses, and certain fund-level expenses and expense reductions, if any, are borne pro rata on the basis of relative net assets by the holders of all classes of shares except that each class bears certain expenses unique to that class (including the applicable Rule 12b-1 fee and recordkeeping fees). Differences in class-level expenses may result in payment of different per share dividends by class. All shares have equal rights with respect to voting subject to class-specific arrangements.
The Fund’s financial statements are prepared in accordance with accounting principles generally accepted in the United States of America (“U.S. GAAP”) which require the use of management estimates. Actual results could differ from those estimates. The Fund qualifies as an investment company under Topic 946 of Accounting Standards Codification of U.S. GAAP. The policies described below are followed consistently by the Fund in the preparation of its financial statements.
Security Valuation. Investments are stated at value determined as of the close of regular trading on the New York Stock Exchange on each day the exchange is open for trading.
Various inputs are used in determining the value of the Fund’s investments. These inputs are summarized in three broad levels. Level 1 includes quoted prices in active markets for identical securities. Level 2 includes other significant observable inputs (including quoted prices for similar securities, interest rates, prepayment speeds and credit risk). Level 3 includes significant unobservable inputs (including the Fund’s own assumptions in determining the fair value of investments). The level assigned to the securities valuations may not be an indication of the risk or liquidity associated with investing in those securities.
Debt securities and loan participations and assignments are valued at prices supplied by independent pricing services approved by the Fund’s Board. Such services may use various pricing techniques which take into account appropriate factors such as yield, quality, coupon rate, maturity, type of issue, trading characteristics, prepayment speeds and other data, as well as broker quotes. If the pricing services are unable to provide valuations, debt securities are valued at the average of the most recent reliable bid quotations or evaluated prices, as applicable, obtained from broker-dealers and loan participations and assignments are valued at the mean of the most recent bid and ask quotations or evaluated prices, as applicable, obtained from broker-dealers. Certain securities may be valued on the basis of a price provided by a single source or broker-dealer. No active trading market may exist for some senior loans and they may be subject to restrictions on resale. The inability to dispose of senior loans in a timely fashion could result in losses. These securities are generally categorized as Level 2.
Equity securities are valued at the most recent sale price or official closing price reported on the exchange (U.S. or foreign) or over-the-counter market on which they trade. Securities for which no sales are reported are valued at the calculated mean between the most recent bid and asked quotations on the relevant market or, if a mean cannot be determined, at the most recent bid quotation. Equity securities are generally categorized as Level 1 securities.
Investments in open-end investment companies are valued at their net asset value each business day and are categorized as Level 1.
Forward currency contracts are valued at the prevailing forward exchange rate of the underlying currencies and are categorized as Level 2.
Securities and other assets for which market quotations are not readily available or for which the above valuation procedures are deemed not to reflect fair value are valued in a manner that is intended to reflect their fair value as determined in accordance with procedures approved by the Board and are generally categorized as Level 3. In accordance with the Fund’s valuation procedures, factors considered in determining value may include, but are not limited to, the type of the security; the size of the holding; the initial cost of the security; the existence of any contractual restrictions on the security’s disposition; the price
| | | | |
Deutsche DWS Variable Series II — DWS High Income VIP | | | | | 17 |
and extent of public trading in similar securities of the issuer or of comparable companies; quotations or evaluated prices from broker-dealers and/or pricing services; information obtained from the issuer, analysts and/or the appropriate stock exchange (for exchange-traded securities); an analysis of the company’s or issuer’s financial statements; an evaluation of the forces that influence the issuer and the market(s) in which the security is purchased and sold; and with respect to debt securities, the maturity, coupon, creditworthiness, currency denomination and the movement of the market in which the security is normally traded. The value determined under these procedures may differ from published values for the same securities.
Disclosure about the classification of fair value measurements is included in a table following the Fund’s Investment Portfolio.
Foreign Currency Translations. The books and records of the Fund are maintained in U.S. dollars. Investment securities and other assets and liabilities denominated in a foreign currency are translated into U.S. dollars at the prevailing exchange rates at period end. Purchases and sales of investment securities, income and expenses are translated into U.S. dollars at the prevailing exchange rates on the respective dates of the transactions.
Net realized and unrealized gains and losses on foreign currency transactions represent net gains and losses between trade and settlement dates on securities transactions, the acquisition and disposition of foreign currencies, and the difference between the amount of net investment income accrued and the U.S. dollar amount actually received. That portion of both realized and unrealized gains and losses on investments that results from fluctuations in foreign currency exchange rates is not separately disclosed but is included with net realized and unrealized gain/appreciation and loss/depreciation on investments.
Securities Lending. Deutsche Bank AG, as lending agent, lends securities of the Fund to certain financial institutions under the terms of its securities lending agreement. During the term of the loans, the Fund continues to receive interest and dividends generated by the securities and to participate in any changes in their market value. The Fund requires the borrowers of the securities to maintain collateral with the Fund consisting of either cash or liquid, unencumbered assets having a value at least equal to the value of the securities loaned. When the collateral falls below specified amounts, the lending agent will use its best effort to obtain additional collateral on the next business day to meet required amounts under the securities lending agreement. As of period end, any securities on loan were collateralized by cash. During the year ended December 31, 2019, the Fund invested the cash collateral into a joint trading account in DWS Government & Agency Securities Portfolio, an affiliated money market fund managed by DWS Investment Management Americas, Inc. DWS Investment Management Americas, Inc. receives a management/administration fee (0.12% annualized effective rate as of December 31, 2019) on the cash collateral invested in DWS Government & Agency Securities Portfolio. The Fund receives compensation for lending its securities either in the form of fees or by earning interest on invested cash collateral net of borrower rebates and fees paid to a lending agent. Either the Fund or the borrower may terminate the loan at any time, and the borrower, after notice, is required to return borrowed securities within a standard time period. There may be risks of delay and costs in recovery of securities or even loss of rights in the collateral should the borrower of the securities fail financially. If the Fund is not able to recover securities lent, the Fund may sell the collateral and purchase a replacement investment in the market, incurring the risk that the value of the replacement security is greater than the value of the collateral. The Fund is also subject to all investment risks associated with the reinvestment of any cash collateral received, including, but not limited to, interest rate, credit and liquidity risk associated with such investments.
As of December 31, 2019, the Fund had securities on loan, which were classified as corporate bonds in the Investment Portfolio. The value of the related collateral exceeded the value of the securities loaned at period end. As of period end, the remaining contractual maturity of the collateral agreements were overnight and continuous.
Taxes. The Fund’s policy is to comply with the requirements of the Internal Revenue Code, as amended, which are applicable to regulated investment companies and to distribute all of its taxable income to its shareholders.
At December 31, 2019, the Fund had a net tax basis capital loss carryforward of approximately $6,728,000, which may be applied against realized net taxable capital gains indefinitely, including short-term losses ($531,000) and long-term losses ($6,197,000).
The Fund has reviewed the tax positions for the open tax years as of December 31, 2019 and has determined that no provision for income tax and/or uncertain tax positions is required in the Fund’s financial statements. The Fund’s federal tax returns for the prior three fiscal years remain open subject to examination by the Internal Revenue Service.
| | | | | | |
| | 18 | | | | | | Deutsche DWS Variable Series II — DWS High Income VIP |
Distribution of Income and Gains. Distributions from net investment income of the Fund, if any, are declared and distributed to shareholders annually. Net realized gains from investment transactions, in excess of available capital loss carryforwards, would be taxable to the Fund if not distributed and, therefore, will be distributed to shareholders at least annually. The Fund may also make additional distributions for tax purposes if necessary.
The timing and characterization of certain income and capital gain distributions are determined annually in accordance with federal tax regulations which may differ from accounting principles generally accepted in the United States of America. These differences primarily relate to certain securities sold at a loss. As a result, net investment income (loss) and net realized gain (loss) on investment transactions for a reporting period may differ significantly from distributions during such period. Accordingly, the Fund may periodically make reclassifications among certain of its capital accounts without impacting the net asset value of the Fund.
At December 31, 2019, the Fund’s components of distributable earnings on a tax basis were as follows:
| | | | |
| Undistributed ordinary income* | | $ | 2,847,071 | |
| Capital loss carryforwards | | $ | (6,728,000 | ) |
| Net unrealized appreciation (depreciation) on investments | | $ | 1,696,201 | |
At December 31, 2019, the aggregate cost of investments for federal income tax purposes was $54,017,790. The net unrealized appreciation for all investments based on tax cost was $1,696,201. This consisted of aggregate gross unrealized appreciation for all investments in which there was an excess of value over tax cost of $2,174,743 and aggregate gross unrealized depreciation for all investments in which there was an excess of tax cost over value of $478,542.
In addition, the tax character of distributions paid by the Fund is summarized as follows:
| | | | | | | | |
| | | Years Ended December 31, | |
| | | 2019 | | | 2018 | |
| Distributions from ordinary income* | | $ | 3,185,534 | | | $ | 4,684,092 | |
| * | For tax purposes, short-term capital gain distributions are considered ordinary income distributions. |
Expenses. Expenses of the Trust arising in connection with a specific fund are allocated to that fund. Other Trust expenses which cannot be directly attributed to a fund are apportioned among the funds in the Trust based upon the relative net assets or other appropriate measures.
Contingencies. In the normal course of business, the Fund may enter into contracts with service providers that contain general indemnification clauses. The Fund’s maximum exposure under these arrangements is unknown, as this would involve future claims that may be made against the Fund that have not yet been made. However, based on experience, the Fund expects the risk of loss to be remote.
Other. Investment transactions are accounted for on a trade date plus one basis for daily net asset value calculations. However, for financial reporting purposes, investment transactions are reported on trade date. Interest income is recorded on the accrual basis. Dividend income is recorded on ex-dividend date. Realized gains and losses from investment transactions are recorded on an identified cost basis. Proceeds from litigation payments, if any, are included in net realized gain (loss) from investments. All discounts and premiums are accreted/amortized for both tax and financial reporting purposes for the Fund, with the exception of securities in default of principal.
B. Derivative Instruments
Forward Foreign Currency Exchange Contracts. A forward foreign currency exchange contract (“forward currency contract”) is a commitment to purchase or sell a foreign currency at the settlement date at a negotiated rate. For the year ended December 31, 2019, the Fund entered into forward currency contracts in order to hedge its exposure to changes in foreign currency exchange rates on its foreign currency denominated portfolio holdings and to facilitate transactions in foreign currency denominated securities.
Forward currency contracts are valued at the prevailing forward exchange rate of the underlying currencies and unrealized gain (loss) is recorded daily. On the settlement date of the forward currency contract, the Fund records a realized gain or loss equal to the difference between the value of the contract at the time it was opened and the value of the contract at the time it was closed. Certain risks may arise upon entering into forward currency contracts from the potential inability of counterparties to meet the terms of their contracts. The maximum counterparty credit risk to the Fund is measured by the unrealized gain on
| | | | |
Deutsche DWS Variable Series II — DWS High Income VIP | | | | | 19 |
appreciated contracts. Additionally, when utilizing forward currency contracts to hedge, the Fund gives up the opportunity to profit from favorable exchange rate movements during the term of the contract.
A summary of the open forward currency contracts as of December 31, 2019 is included in a table following the Fund’s Investment Portfolio. For the year ended December 31, 2019, the investment in forward currency contracts short vs. U.S. dollars had a total contract value generally indicative of a range from approximately $719,000 to $1,151,000.
The following table summarizes the value of the Fund’s derivative instruments held as of December 31, 2019 and the related location in the accompanying Statement of Assets and Liabilities, presented by primary underlying risk exposure:
| | | | |
| Liability Derivative | | Forward
Contract | |
| Foreign Exchange contracts (a) | | $ | (9,627 | ) |
The above derivative is located in the following Statement of Assets and Liabilities account:
| (a) | Unrealized depreciation on forward foreign currency contracts. |
Additionally, the amount of unrealized and realized gains and losses on derivative instruments recognized in Fund earnings during the year ended December 31, 2019 and the related location in the accompanying Statement of Operations is summarized in the following tables by primary underlying risk exposure:
| | | | |
| Realized Gain (Loss) | | Forward
Contract | |
| Foreign Exchange Contracts (b) | | $ | 52,518 | |
The above derivative is located in the following Statement of Operations accounts:
| (b) | Net realized gain (loss) from forward foreign currency contracts |
| | | | |
| Change in Net Unrealized Appreciation (Depreciation) | | Forward
Contract | |
| Foreign Exchange contracts (c) | | $ | (8,191 | ) |
The above derivative is located in the following Statement of Operations accounts:
| (c) | Change in net unrealized appreciation (depreciation) on forward foreign currency contracts |
As of December 31, 2019, the Fund has transactions subject to enforceable master netting agreements which govern the terms of certain transactions, and reduce the counterparty risk associated with such transactions. Master netting agreements allow a Fund to close out and net total exposure to a counterparty in the event of a deterioration in the credit quality or contractual default with respect to all of the transactions with a counterparty. As defined by the master netting agreement, the Fund may have collateral agreements with certain counterparties to mitigate risk. For financial reporting purposes the Statement of Assets and Liabilities generally shows derivatives assets and liabilities on a gross basis, which reflects the full risks and exposures prior to netting. A reconciliation of the gross amounts on the Statement of Assets and Liabilities to the net amounts by a counterparty, including any collateral exposure, is included in the following table:
| | | | | | | | | | | | | | | | |
| Counterparty | | Gross Amounts
of Liabilities
Presented in the
Statement of
Assets and
Liabilities | | | Financial
Instruments
and
Derivatives
Available
for Offset | | | Collateral
Pledged | | | Net Amount of
Derivative
Liabilities | |
| BNP Paribas SA | | $ | 9,627 | | | $ | — | | | $ | — | | | $ | 9,627 | |
C. Purchases and Sales of Securities
During the year ended December 31, 2019, purchases and sales of investment transactions (excluding short-term investments and U.S. Treasury securities) aggregated $45,069,571 and $42,800,355, respectively.
D. Related Parties
Management Agreement. Under the Investment Management Agreement with DWS Investment Management Americas, Inc. (“DIMA” or the “Advisor”), an indirect, wholly owned subsidiary of DWS Group GmbH & Co. KGaA (“DWS Group”), the Advisor directs the investments of the Fund in accordance with its investment objectives, policies and restrictions. The Advisor determines the securities, instruments and other contracts relating to investments to be purchased, sold or entered into by the Fund.
| | | | | | |
| | 20 | | | | | | Deutsche DWS Variable Series II — DWS High Income VIP |
Pursuant to the Investment Management Agreement with the Advisor, the Fund pays a monthly management fee based on the Fund’s average daily net assets, computed and accrued daily and payable monthly, at the following annual rates:
| | | | |
| First $250 million | | | .500 | % |
| Next $750 million | | | .470 | % |
| Next $1.5 billion | | | .450 | % |
| Next $2.5 billion | | | .430 | % |
| Next $2.5 billion | | | .400 | % |
| Next $2.5 billion | | | .380 | % |
| Next $2.5 billion | | | .360 | % |
| Over $12.5 billion | | | .340 | % |
Accordingly, for the year ended December 31, 2019, the fee pursuant to the Investment Management Agreement was equivalent to an annual rate (exclusive of any applicable waivers/reimbursements) of 0.50% of the Fund’s average daily net assets.
For the period from January 1, 2019 through April 30, 2020, the Advisor has contractually agreed to waive all or a portion of its fees and/or reimburse certain operating expenses of the Fund to the extent necessary to maintain the total annual operating expenses (excluding certain expenses such as extraordinary expenses, taxes, brokerage and interest expense) of each class as follows:
| | | | |
| Class A | | | .68 | % |
| Class B | | | .94 | % |
For the year ended December 31, 2019, fees waived and/or expenses reimbursed for each class were as follows:
| | | | |
| Class A | | $ | 155,358 | |
| Class B | | | 645 | |
| | | $ | 156,003 | |
Administration Fee. Pursuant to an Administrative Services Agreement, DIMA provides most administrative services to the Fund. For all services provided under the Administrative Services Agreement, the Fund pays DIMA an annual fee (“Administration Fee”) of 0.10% of the Fund’s average daily net assets, computed and accrued daily and payable monthly. For the year ended December 31, 2019, the Administration Fee was $55,419, of which $4,740 is unpaid.
Service Provider Fees. DWS Service Company (“DSC”), an affiliate of the Advisor, is the transfer agent, dividend-paying agent and shareholder service agent for the Fund. Pursuant to a sub-transfer agency agreement between DSC and DST Systems, Inc. (“DST”), DSC has delegated certain transfer agent, dividend-paying agent and shareholder service agent functions to DST. DSC compensates DST out of the shareholder servicing fee it receives from the Fund. For the year ended December 31, 2019, the amounts charged to the Fund by DSC were as follows:
| | | | | | | | |
| Services to Shareholders | | Total
Aggregated | | | Unpaid at
December 31, 2019 | |
| Class A | | $ | 257 | | | $ | 42 | |
| Class B | | | 54 | | | | 9 | |
| | | $ | 311 | | | $ | 51 | |
Distribution Service Agreement. Under the Fund’s Class B 12b-1 plan, DWS Distributors, Inc. (“DDI”) received a fee (“Distribution Service Fee”) of 0.25% of average daily net assets of Class B shares. For the year ended December 31, 2019, the Distribution Service Fee was $353, of which $32 is unpaid.
Typesetting and Filing Service Fees. Under an agreement with the Fund, DIMA is compensated for providing certain pre-press and regulatory filing services to the Fund. For the year ended December 31, 2019, the amount charged to the Fund by DIMA included in the Statement of Operations under “Reports to shareholders” aggregated $11,003, all of which $4,906 is unpaid.
| | | | |
Deutsche DWS Variable Series II — DWS High Income VIP | | | | | 21 |
Trustees’ Fees and Expenses. The Fund paid retainer fees to each Trustee not affiliated with the Advisor, plus specified amounts to the Board Chairperson and to each committee Chairperson.
Affiliated Cash Management Vehicles. The Fund may invest uninvested cash balances in DWS Central Cash Management Government Fund and DWS ESG Liquidity Fund, affiliated money market funds which are managed by the Advisor. Each affiliated money market fund is managed in accordance with Rule 2a-7 under the 1940 Act, which governs the quality, maturity, diversity and liquidity of instruments in which a money market fund may invest. DWS Central Cash Management Government Fund seeks to maintain a stable net asset value, and DWS ESG Liquidity Fund maintains a floating net asset value. The Fund indirectly bears its proportionate share of the expenses of each affiliated money market fund in which it invests. DWS Central Cash Management Government Fund does not pay the Advisor an investment management fee. To the extent that DWS ESG Liquidity Fund pays an investment management fee to the Advisor, the Advisor will waive an amount of the investment management fee payable to the Advisor by the Fund equal to the amount of the investment management fee payable on the Fund’s assets invested in DWS ESG Liquidity Fund.
Security Lending Fees. Deutsche Bank AG serves as lending agent for the Fund. For the year ended December 31, 2019, the Fund incurred lending agent fees to Deutsche Bank AG for the amount of $455.
E. Investing in High-Yield Debt Securities
High-yield debt securities or junk bonds are generally regarded as speculative with respect to the issuer’s continuing ability to meet principal and interest payments. The Fund’s performance could be hurt if an issuer of a debt security suffers an adverse change in financial condition that results in the issuer not making timely payments of interest or principal, a security downgrade or an inability to meet a financial obligation. High-yield debt securities’ total return and yield may generally be expected to fluctuate more than the total return and yield of investment-grade debt securities. A real or perceived economic downturn or an increase in market interest rates could cause a decline in the value of high-yield debt securities, result in increased redemptions and/or result in increased portfolio turnover, which could result in a decline in net asset value of the fund, reduce liquidity for certain investments and/or increase costs. High-yield debt securities are often thinly traded and can be more difficult to sell and value accurately than investment-grade debt securities as there may be no established secondary market. Investments in high yield debt securities could increase liquidity risk for the fund. In addition, the market for high-yield debt securities can experience sudden and sharp volatility which is generally associated more with investments in stocks.
F. Ownership of the Fund
At December 31, 2019, two participating insurance companies were owners of record of 10% or more of the total outstanding Class A shares of the Fund, each owning 71% and 20%. One participating insurance company was owner of record of 10% or more of the total outstanding Class B shares of the Fund, owning 85%.
G. Line of Credit
The Fund and other affiliated funds (the “Participants”) share in a $400 million revolving credit facility provided by a syndication of banks. The Fund may borrow for temporary or emergency purposes, including the meeting of redemption requests that otherwise might require the untimely disposition of securities. The Participants are charged an annual commitment fee which is allocated based on net assets, among each of the Participants. Interest is calculated at a rate per annum equal to the sum of the Federal Funds Rate plus 1.25 percent plus if the one-month LIBOR exceeds the Federal Funds Rate, the amount of such excess. The Fund may borrow up to a maximum of 33 percent of its net assets under the agreement. The Fund had no outstanding loans at December 31, 2019.
| | | | | | |
| | 22 | | | | | | Deutsche DWS Variable Series II — DWS High Income VIP |
Report of Independent Registered Public Accounting Firm
To the Board of Trustees of Deutsche DWS Variable Series II and Shareholders of DWS High Income VIP:
Opinion on the Financial Statements
We have audited the accompanying statement of assets and liabilities of DWS High Income VIP (the “Fund”) (one of the funds constituting Deutsche DWS Variable Series II) (the “Trust”), including the investment portfolio, as of December 31, 2019, and the related statement of operations for the year then ended, the statements of changes in net assets for each of the two years in the period then ended, the financial highlights for each of the five years in the period then ended and the related notes (collectively referred to as the “financial statements”). In our opinion, the financial statements present fairly, in all material respects, the financial position of the Fund (one of the funds constituting Deutsche DWS Variable Series II) at December 31, 2019, the results of its operations for the year then ended, the changes in its net assets for each of the two years in the period then ended and its financial highlights for each of the five years in the period then ended, in conformity with U.S. generally accepted accounting principles.
Basis for Opinion
These financial statements are the responsibility of the Trust’s management. Our responsibility is to express an opinion on the Fund’s financial statements based on our audits. We are a public accounting firm registered with the Public Company Accounting Oversight Board (United States) (“PCAOB”) and are required to be independent with respect to the Trust in accordance with the U.S. federal securities laws and the applicable rules and regulations of the Securities and Exchange Commission and the PCAOB.
We conducted our audits in accordance with the standards of the PCAOB. Those standards require that we plan and perform the audit to obtain reasonable assurance about whether the financial statements are free of material misstatement, whether due to error or fraud. The Trust is not required to have, nor were we engaged to perform, an audit of the Trust’s internal control over financial reporting. As part of our audits, we are required to obtain an understanding of internal control over financial reporting, but not for the purpose of expressing an opinion on the effectiveness of the Trust’s internal control over financial reporting. Accordingly, we express no such opinion.
Our audits included performing procedures to assess the risks of material misstatement of the financial statements, whether due to error or fraud, and performing procedures that respond to those risks. Such procedures included examining, on a test basis, evidence regarding the amounts and disclosures in the financial statements. Our procedures included confirmation of securities owned as of December 31, 2019, by correspondence with the custodian and others or by other appropriate auditing procedures where replies from others were not received. Our audits also included evaluating the accounting principles used and significant estimates made by management, as well as evaluating the overall presentation of the financial statements. We believe that our audits provide a reasonable basis for our opinion.

We have served as the auditor of one or more investment companies in the DWS family of funds since at least 1979, but we are unable to determine the specific year.
Boston, Massachusetts
February 14, 2020
| | | | |
Deutsche DWS Variable Series II — DWS High Income VIP | | | | | 23 |
| | |
| Information About Your Fund’s Expenses | | (Unaudited) |
As an investor of the Fund, you incur two types of costs: ongoing expenses and transaction costs. Ongoing expenses include management fees, distribution and service (12b-1) fees and other Fund expenses. Examples of transaction costs include contract charges, which are not shown in this section. The following tables are intended to help you understand your ongoing expenses (in dollars) of investing in the Fund and to help you compare these expenses with the ongoing expenses of investing in other mutual funds. In the most recent six-month period, the Fund limited these expenses; had it not done so, expenses would have been higher. The example in the table is based on an investment of $1,000 invested at the beginning of the six-month period and held for the entire period (July 1, 2019 to December 31, 2019).
The tables illustrate your Fund’s expenses in two ways:
| – | Actual Fund Return.This helps you estimate the actual dollar amount of ongoing expenses (but not transaction costs) paid on a $1,000 investment in the Fund using the Fund’s actual return during the period. To estimate the expenses you paid over the period, simply divide your account value by $1,000 (for example, an $8,600 account value divided by $1,000 = 8.6), then multiply the result by the number in the “Expenses Paid per $1,000” line under the share class you hold. |
| – | Hypothetical 5% Fund Return.This helps you to compare your Fund’s ongoing expenses (but not transaction costs) with those of other mutual funds using the Fund’s actual expense ratio and a hypothetical rate of return of 5% per year before expenses. Examples using a 5% hypothetical Fund return may be found in the shareholder reports of other mutual funds. The hypothetical account values and expenses may not be used to estimate the actual ending account balance or expenses you paid for the period. |
Please note that the expenses shown in these tables are meant to highlight your ongoing expenses only and do not reflect any transaction costs. The “Expenses Paid per $1,000” line of the tables is useful in comparing ongoing expenses only and will not help you determine the relative total expense of owning different funds. If these transaction costs had been included, your costs would have been higher.
| | | | | | | | |
| Expenses and Value of a $1,000 Investment for the six months ended December 31, 2019 | |
| | |
| Actual Fund Return | | Class A | | | Class B | |
| Beginning Account Value 7/1/19 | | $ | 1,000.00 | | | $ | 1,000.00 | |
| Ending Account Value 12/31/19 | | $ | 1,043.60 | | | $ | 1,041.70 | |
| Expenses Paid per $1,000* | | $ | 3.50 | | | $ | 4.84 | |
| | |
| Hypothetical 5% Fund Return | | Class A | | | Class B | |
| Beginning Account Value 7/1/19 | | $ | 1,000.00 | | | $ | 1,000.00 | |
| Ending Account Value 12/31/19 | | $ | 1,021.78 | | | $ | 1,020.47 | |
| Expenses Paid per $1,000* | | $ | 3.47 | | | $ | 4.79 | |
| * | Expenses are equal to the Fund’s annualized expense ratio for each share class, multiplied by the average account value over the period, multiplied by 184 (the number of days in the most recent six-month period), then divided by 365. |
| | | | | | | | |
| Annualized Expense Ratios | | Class A | | | Class B | |
| Deutsche DWS Variable Series II — DWS High Income VIP | | | .68 | % | | | .94 | % |
For more information, please refer to the Fund’s prospectus.
These tables do not reflect charges and fees (“contract charges”) associated with the separate account that invests in the Fund or any variable life insurance policy or variable annuity contract for which the Fund is an investment option.
For an analysis of the fees associated with an investment in the Fund or similar funds, please refer to the current and hypothetical expense calculators for Variable Insurance Products which can be found at dws.com/calculators.
| | | | | | |
| | 24 | | | | | | Deutsche DWS Variable Series II — DWS High Income VIP |
| | |
| Tax Information | | (Unaudited) |
Please consult a tax advisor if you have questions about federal or state income tax laws, or on how to prepare your tax returns. If you have specific questions about your account, please contact your insurance provider.
The Trust’s policies and procedures for voting proxies for portfolio securities and information about how the Trust voted proxies related to its portfolio securities during the most recent 12-month period ended June 30 are available on our Web site — dws.com/en-us/resources/proxy-voting — or on the SEC’s Web site — sec.gov. To obtain a written copy of the Trust’s policies and procedures without charge, upon request, call us toll free at (800) 728-3337.
| | | | |
Deutsche DWS Variable Series II — DWS High Income VIP | | | | | 25 |
Advisory Agreement Board Considerations and Fee Evaluation
The Board of Trustees (hereinafter referred to as the “Board” or “Trustees”) approved the renewal of DWS High Income VIP’s (the “Fund”) investment management agreement (the “Agreement”) with DWS Investment Management Americas, Inc. (“DIMA”) in September 2019.
In terms of the process that the Board followed prior to approving the Agreement, shareholders should know that:
| – | | During the entire process, all of the Fund’s Trustees were independent of DIMA and its affiliates (the “Independent Trustees”). |
| – | | The Board met frequently during the past year to discuss fund matters and dedicated a substantial amount of time to contract review matters. Over the course of several months, the Board’s Contract Committee reviewed extensive materials received from DIMA, independent third parties and independent counsel. These materials included an analysis of the Fund’s performance, fees and expenses, and profitability from a fee consultant retained by the Fund’s Independent Trustees (the “Fee Consultant”). Based on its evaluation of the information provided, the Contract Committee presented its findings and recommendations to the Board. The Board then reviewed the Contract Committee’s findings and recommendations. |
| – | | The Board also received extensive information throughout the year regarding performance of the Fund. |
| – | | The Independent Trustees regularly met privately with counsel to discuss contract review and other matters. In addition, the Independent Trustees were advised by the Fee Consultant in the course of their review of the Fund’s contractual arrangements and considered a comprehensive report prepared by the Fee Consultant in connection with their deliberations. |
| – | | In connection with reviewing the Agreement, the Board also reviewed the terms of the Fund’s Rule12b-1 plan, distribution agreement, administrative services agreement, transfer agency agreement and other material service agreements. |
In connection with the contract review process, the Contract Committee and the Board considered the factors discussed below, among others. The Board also considered that DIMA and its predecessors have managed the Fund since its inception, and the Board believes that a long-term relationship with a capable, conscientious advisor is in the best interests of the Fund. The Board considered, generally, that shareholders chose to invest or remain invested in the Fund knowing that DIMA managed the Fund. DIMA is part of DWS Group GmbH & Co. KGaA (“DWS Group”). DWS Group is a global asset management business that offers a wide range of investing expertise and resources, including research capabilities in many countries throughout the world. In 2018, approximately 20% of DWS Group’s shares were sold in an initial public offering, with Deutsche Bank AG owning the remaining shares.
As part of the contract review process, the Board carefully considered the fees and expenses of each DWS fund overseen by the Board in light of the fund’s performance. In many cases, this led to the negotiation and implementation of expense caps. As part of these negotiations, the Board indicated that it would consider relaxing these caps in future years following sustained improvements in performance, among other considerations.
While shareholders may focus primarily on fund performance and fees, the Fund’s Board considers these and many other factors, including the quality and integrity of DIMA’s personnel and administrative support services provided by DIMA, such as back-office operations, fund valuations, and compliance policies and procedures.
Nature, Quality and Extent of Services. The Board considered the terms of the Agreement, including the scope of advisory services provided under the Agreement. The Board noted that, under the Agreement, DIMA provides portfolio management services to the Fund and that, pursuant to a separate administrative services agreement, DIMA provides administrative services to the Fund. The Board considered the experience and skills of senior management and investment personnel and the resources made available to such personnel. The Board reviewed the Fund’s performance over short-term and long-term periods and compared those returns to various agreed-upon performance measures, including market index(es) and a peer universe compiled using information supplied by Morningstar Direct (“Morningstar”), an independent fund data service. The Board also noted that it has put into place a process of identifying “Funds in Review” (e.g., funds performing poorly relative to a peer universe), and receives additional reporting from DIMA regarding such funds and, where appropriate, DIMA’s plans to address underperformance. The Board
| | | | | | |
| | 26 | | | | | | Deutsche DWS Variable Series II — DWS High Income VIP |
believes this process is an effective manner of identifying and addressing underperforming funds. Based on the information provided, the Board noted that, for theone-, three- and five-year periods ended December 31, 2018, the Fund’s performance (Class A shares) was in the 2nd quartile, 3rd quartile and 4th quartile, respectively, of the applicable Morningstar universe (the 1st quartile being the best performers and the 4th quartile being the worst performers). The Board also observed that the Fund has underperformed its benchmark in theone-, three- and five-year periods ended December 31, 2018.
Fees and Expenses. The Board considered the Fund’s investment management fee schedule, operating expenses and total expense ratios, and comparative information provided by Broadridge Financial Solutions, Inc. (“Broadridge”) and the Fee Consultant regarding investment management fee rates paid to other investment advisors by similar funds (1st quartile being the most favorable and 4th quartile being the least favorable). With respect to management fees paid to other investment advisors by similar funds, the Board noted that the contractual fee rates paid by the Fund, which include a 0.10% fee paid to DIMA under the Fund’s administrative services agreement, were lower than the median (1st quartile) of the applicable Broadridge peer group (based on Broadridge data provided as of December 31, 2018). The Board noted that the Fund’s Class A shares total (net) operating expenses were expected to be higher than the median (3rd quartile) of the applicable Broadridge expense universe (based on Broadridge data provided as of December 31, 2018, and analyzing Broadridge expense universe Class A (net) expenses less any applicable12b-1 fees) (“Broadridge Universe Expenses”). The Board also reviewed data comparing each other operational share class’s total (net) operating expenses to the applicable Broadridge Universe Expenses. The Board noted that the expense limitations agreed to by DIMA were expected to help the Fund’s total (net) operating expenses remain competitive. The Board considered the Fund’s management fee rate as compared to fees charged by DIMA to comparable DWS U.S. registered funds (“DWS Funds”) and considered differences between the Fund and the comparable DWS Funds. The information requested by the Board as part of its review of fees and expenses also included information about institutional accounts (including anysub-advised funds and accounts) and funds offered primarily to European investors (“DWS Europe Funds”) managed by DWS Group. The Board noted that DIMA indicated that DWS Group does not manage any institutional accounts or DWS Europe Funds comparable to the Fund.
On the basis of the information provided, the Board concluded that management fees were reasonable and appropriate in light of the nature, quality and extent of services provided by DIMA.
Profitability. The Board reviewed detailed information regarding revenues received by DIMA under the Agreement. The Board considered the estimated costs to DIMA, andpre-tax profits realized by DIMA, from advising the DWS Funds, as well as estimates of thepre-tax profits attributable to managing the Fund in particular. The Board also received information regarding the estimated enterprise-wide profitability of DIMA and its affiliates with respect to all fund services in totality and by fund. The Board and the Fee Consultant reviewed DIMA’s methodology in allocating its costs to the management of the Fund. Based on the information provided, the Board concluded that thepre-tax profits realized by DIMA in connection with the management of the Fund were not unreasonable. The Board also reviewed certain publicly available information regarding the profitability of certain similar investment management firms. The Board noted that, while information regarding the profitability of such firms is limited (and in some cases is not necessarily prepared on a comparable basis), DIMA and its affiliates’ overall profitability with respect to the DWS Funds (after taking into account distribution and other services provided to the funds by DIMA and its affiliates) was lower than the overall profitability levels of most comparable firms for which such data was available.
Economies of Scale. The Board considered whether there are economies of scale with respect to the management of the Fund and whether the Fund benefits from any economies of scale. The Board noted that the Fund’s investment management fee schedule includes fee breakpoints. The Board concluded that the Fund’s fee schedule represents an appropriate sharing between the Fund and DIMA of such economies of scale as may exist in the management of the Fund at current asset levels.
Other Benefits to DIMA and Its Affiliates. The Board also considered the character and amount of other incidental or“fall-out” benefits received by DIMA and its affiliates, including any fees received by DIMA for administrative services provided to the Fund, any fees received by an affiliate of DIMA for transfer agency services provided to the Fund and any fees received by an affiliate of DIMA for distribution services. The Board also considered benefits to DIMA related to brokerage and soft-dollar allocations, including allocating brokerage to pay for research generated by parties other than the executing broker dealers, which pertain primarily to funds investing in equity securities. In addition, the Board considered the incidental public relations benefits to DIMA related to DWS Funds advertising and cross-selling opportunities among DIMA
| | | | |
Deutsche DWS Variable Series II — DWS High Income VIP | | | | | 27 |
products and services. The Board considered these benefits in reaching its conclusion that the Fund’s management fees were reasonable.
Compliance. The Board considered the significant attention and resources dedicated by DIMA to its compliance processes in recent years. The Board noted in particular (i) the experience, seniority and time commitment of the individuals serving as DIMA’s and the Fund’s chief compliance officers and (ii) the substantial commitment of resources by DIMA and its affiliates to compliance matters, including the retention of compliance personnel.
Based on all of the information considered and the conclusions reached, the Board determined that the continuation of the Agreement is in the best interests of the Fund. In making this determination, the Board did not give particular weight to any single factor identified above. The Board considered these factors over the course of numerous meetings, certain of which were in executive session with only the Independent Trustees and counsel present. It is possible that individual Independent Trustees may have weighed these factors differently in reaching their individual decisions to approve the continuation of the Agreement.
| | | | | | |
| | 28 | | | | | | Deutsche DWS Variable Series II — DWS High Income VIP |
Board Members and Officers
The following table presents certain information regarding the Board Members and Officers of the Trust/Corporation. Each Board Member’s year of birth is set forth in parentheses after his or her name. Unless otherwise noted, (i) each Board Member has engaged in the principal occupation(s) noted in the table for at least the most recent five years, although not necessarily in the same capacity; and (ii) the address of each Independent Board Member is Keith R. Fox, DWS Funds Board Chair, c/o Thomas R. Hiller, Ropes & Gray LLP, Prudential Tower, 800 Boylston Street, Boston, MA02199-3600. Except as otherwise noted below, the term of office for each Board Member is until the election and qualification of a successor, or until such Board Member sooner dies, resigns, is removed or as otherwise provided in the governing documents of the Trust/Corporation. Because the Fund does not hold an annual meeting of shareholders, each Board Member will hold office for an indeterminate period.
The Board Members may also serve in similar capacities with other funds in the fund complex. The number of funds in DWS fund complex shown in the table below includes all registered open- and closed-end funds (including all of their portfolios) advised by the Advisor and any registered funds that have an investment advisor that is an affiliated person of the Advisor.
| | | | | | | | |
| Independent Board Members | | | | | |
Name, Year of Birth,
Position with the Trust/
Corporation and
Length of Time Served1 | | Business Experience and Directorships During the Past Five Years | | Number of
Funds in
DWS Fund
Complex
Overseen | | | Other
Directorships
Held by Board
Member
|
Keith R. Fox, CFA (1954) Chairperson since 2017, and Board Member since 1996 | | Managing General Partner, Exeter Capital Partners (a series of private investment funds) (since 1986). Directorships: ICI Mutual Insurance Company; Progressive International Corporation (kitchen goods importer and distributor); former Chairman, National Association of Small Business Investment Companies; former Directorships: The Kennel Shop (retailer); BoxTop Media Inc. (advertising); Sun Capital Advisers Trust (mutual funds) (2011–2012) | | | 77 | | | — |
John W. Ballantine (1946) Board Member since 1999 | | Retired; formerly, Executive Vice President and Chief Risk Management Officer, First Chicago NBD Corporation/The First National Bank of Chicago (1996–1998); Executive Vice President and Head of International Banking (1995–1996); former Directorships: Director and Chairman of the Board, Healthways, Inc.2 (population well-being and wellness services) (2003–2014); Stockwell Capital Investments PLC (private equity); Enron Corporation; FNB Corporation; Tokheim Corporation; First Oak Brook Bancshares, Inc.; Oak Brook Bank; and Prisma Energy International. Not-for-Profit Director/Trustee: Palm Beach Civic Association; Window to the World Communications (public media); Life Director of Harris Theater for Music and Dance (Chicago); Life Director of Hubbard Street Dance Chicago; former Not-for-Profit Directorships: Public Radio International | | | 77 | | | Portland
General
Electric2
(utility
company)
(2003–
present) |
Dawn-Marie Driscoll (1946) Board Member since 1987 | | Emeritus Executive Fellow, Center for Business Ethics, Bentley University; formerly: Partner, Palmer & Dodge (law firm) (1988–1990); Vice President of Corporate Affairs and General Counsel, Filene’s (retail) (1978–1988). Directorships: Advisory Board, Center for Business Ethics, Bentley University; Trustee and former Chairman of the Board, Southwest Florida Community Foundation (charitable organization); former Directorships: ICI Mutual Insurance Company (2007–2015); Sun Capital Advisers Trust (mutual funds) (2007–2012), Investment Company Institute (audit, executive, nominating committees) and Independent Directors Council (governance, executive committees) | | | 77 | | | — |
Richard J. Herring (1946) Board Member since 1990 | | Jacob Safra Professor of International Banking and Professor of Finance, The Wharton School, University of Pennsylvania (since July 1972); Director, The Wharton Financial Institutions Center (since 1994); formerly: Vice Dean and Director, Wharton Undergraduate Division (1995–2000) and Director, The Lauder Institute of International Management Studies (2000–2006); Member FDIC Systemic Risk Advisory Committee since 2011, member Systemic Risk Council since 2012 and member of the Advisory Board at the Yale Program on Financial Stability since 2013; Formerly Co-Chair of the Shadow Financial Regulatory Committee (2003–2015), Executive Director of The Financial Economists Roundtable (2008–2015), Director of The Thai Capital Fund (2007–2013), Director of The Aberdeen Singapore Fund (2007–2018), and Nonexecutive Director of Barclays Bank DE (2010–2018) | | | 77 | | | Director,
Aberdeen
Japan Fund
(since 2007) |
| | | | |
Deutsche DWS Variable Series II — DWS High Income VIP | | | | | 29 |
| | | | | | | | |
Name, Year of Birth,
Position with the Trust/
Corporation and
Length of Time Served1 | | Business Experience and Directorships During the Past Five Years | | Number of
Funds in
DWS Fund
Complex
Overseen | | | Other
Directorships
Held by Board
Member
|
William McClayton (1944) Board Member since 2004 | | Private equity investor (since October 2009); previously, Managing Director, Diamond Management & Technology Consultants, Inc. (global consulting firm) (2001–2009); Directorship: Board of Managers, YMCA of Metropolitan Chicago; formerly: Senior Partner, Arthur Andersen LLP (accounting) (1966–2001); Trustee, Ravinia Festival | | | 77 | | | — |
Rebecca W. Rimel (1951) Board Member since 1995 | | President, Chief Executive Officer and Director, The Pew Charitable Trusts (charitable organization) (1994–present); formerly: Executive Vice President, The Glenmede Trust Company (investment trust and wealth management) (1983–2004); Board Member, Investor Education (charitable organization) (2004–2005); Trustee, Executive Committee, Philadelphia Chamber of Commerce (2001–2007); Director, Viasys Health Care2 (January 2007–June 2007); Trustee, Thomas Jefferson Foundation (charitable organization) (1994–2012) | | | 77 | | | Director,
Becton
Dickinson
and
Company2
(medical
technology
company)
(2012–
present);
Director,
BioTelemetry
Inc.2(health
care) (2009–
present) |
William N. Searcy, Jr. (1946) Board Member since 1993 | | Private investor since October 2003; formerly: Pension & Savings Trust Officer, Sprint Corporation2(telecommunications) (November 1989–September 2003); Trustee, Sun Capital Advisers Trust (mutual funds) (1998–2012) | | | 77 | | | — |
| | |
| Officers4 | | |
Name, Year of Birth,
Position with the Trust/
Corporation and
Length of Time Served5 | | Business Experience and Directorships During the Past Five Years |
Hepsen Uzcan6(1974) President and Chief Executive Officer, 2017–present | | Managing Director,3 DWS; Secretary, DWS USA Corporation (2018–present); Assistant Secretary, DWS Distributors, Inc. (2018–present); Director and Vice President, DWS Service Company (2018–present); Assistant Secretary, DWS Investment Management Americas, Inc. (2018–present); and Director and President, DB Investment Managers, Inc. (2018–present); formerly: Vice President for the Deutsche funds (2016–2017); Assistant Secretary for the DWS funds (2013–2019) |
John Millette7(1962) Vice President and Secretary, 1999–present | | Director,3DWS; Chief Legal Officer, DWS Investment Management Americas, Inc. (2015–present); Director and Vice President, DWS Trust Company (2016–present); and Assistant Secretary, DBX ETF Trust (2019–present); formerly: Secretary, Deutsche Investment Management Americas Inc. (2015–2017) |
Diane Kenneally7(1966) Chief Financial Officer and Treasurer, 2018–present | | Director,3 DWS; and Treasurer, Chief Financial Officer and Controller, DBX ETF Trust (2019–present); formerly: Assistant Treasurer for the DWS funds (2007–2018) |
Paul Antosca7(1957) Assistant Treasurer, 2007–present | | Director,3DWS; and Assistant Treasurer, DBX ETF Trust (2019–present) |
Sheila Cadogan7(1966) Assistant Treasurer, 2017–present | | Director,3DWS; Director and Vice President, DWS Trust Company (2018–present); and Assistant Treasurer, DBX ETF Trust (2019–present) |
Scott D. Hogan7(1970) Chief Compliance Officer, 2016–present | | Director,3DWS |
Caroline Pearson7(1962) Chief Legal Officer, 2010–present | | Managing Director,3DWS; formerly: Secretary, Deutsche AM Distributors, Inc. (2002–2017); and Secretary, Deutsche AM Service Company (2010–2017) |
Wayne Salit6(1967) Anti-Money Laundering Compliance Officer, 2014–present | | Director,3 Deutsche Bank; and AML Officer, DWS Trust Company; formerly: Managing Director, AML Compliance Officer at BNY Mellon (2011–2014); and Director, AML Compliance Officer at Deutsche Bank (2004–2011) |
Ciara Crawford8 (1984) Assistant Secretary, (2019–present) | | Associate, DWS (since 2015); previously, Legal Assistant at Accelerated Tax Solutions. |
| | | | | | |
| | 30 | | | | | | Deutsche DWS Variable Series II — DWS High Income VIP |
| 1 | The length of time served represents the year in which the Board Member joined the board of one or more DWS funds currently overseen by the Board. |
| 2 | A publicly held company with securities registered pursuant to Section 12 of the Securities Exchange Act of 1934. |
| 3 | Executive title, not a board directorship. |
| 4 | As a result of their respective positions held with the Advisor or its affiliates, these individuals are considered “interested persons” of the Advisor within the meaning of the 1940 Act. Interested persons receive no compensation from the Fund. |
| 5 | The length of time served represents the year in which the officer was first elected in such capacity for one or more DWS funds. |
| 6 | Address: 875 Third Avenue, New York, NY 10022. |
| 7 | Address: One International Place, Boston, MA 02110. |
| 8 | Address: 5022 Gate Parkway, Suite 400, Jacksonville, FL 32256. |
The Fund’s Statement of Additional Information (“SAI”) includes additional information about the Board Members. The SAI is available, without charge, upon request. If you would like to request a copy of the SAI, you may do so by calling the followingtoll-free number:(800) 728-3337.
| | | | |
Deutsche DWS Variable Series II — DWS High Income VIP | | | | | 31 |
|
|
VS2HI-2 (R-025832-9 2/20) |
December 31, 2019
Annual Report
Deutsche DWS Variable Series II
DWS International Growth VIP
Beginning on January 1, 2021, as permitted by regulations adopted by the Securities and Exchange Commission, you may not be receiving paper copies of the Fund’s shareholder reports from the insurance company that offers your contract unless you specifically request paper copies from your insurance company or from your financial intermediary. Instead, the shareholder reports will be made available on a Web site, and your insurance company will notify you by mail each time a report is posted and provide you with a Web site link to access the report. Instructions for requesting paper copies will be provided by your insurance company.
If you already elected to receive shareholder reports electronically, you will not be affected by this change and you need not take any action. You may elect to receive shareholder reports and other communications from your insurance company electronically by following the instructions provided by your insurance company.
You may elect to receive all future reports in paper free of charge from your insurance company. If your insurance company informs you that future reports will be delivered via Web access, you can inform your insurance company that you wish to continue receiving paper copies of your shareholder reports by following the instructions provided by your insurance company.

Contents
This report must be preceded or accompanied by a prospectus. To obtain an additional prospectus or summary prospectus, if available, call (800)728-3337 or your financial representative. We advise you to consider the Fund’s objectives, risks, charges and expenses carefully before investing. The summary prospectus and prospectus contain this and other important information about the Fund. Please read the prospectus carefully before you invest.
Stocks may decline in value. Smaller company stocks tend to be more volatile thanmedium-sized or large company stocks. Investing in foreign securities, particularly those of emerging markets, presents certain risks, such as currency fluctuations, political and economic changes, and market risks. Emerging markets tend to be more volatile and less liquid than the markets of more mature economies, and generally have less diverse and less mature economic structures and less stable political systems than those of developed countries. Investing in derivatives entails special risks relating to liquidity, leverage and credit that may reduce returns and/or increase volatility. The Fund may lend securities to approved institutions. Please read prospectus for details.
The brand DWS represents DWS Group GmbH & Co. KGaA and any of its subsidiaries such as DWS Distributors, Inc. which offers investment products or DWS Investment Management Americas, Inc. and RREEF America L.L.C. which offer advisory services.
DWS Distributors, Inc., 222 South Riverside Plaza, Chicago, IL 60606, (800)621-1148
NOT FDIC/NCUA INSURED NO BANK GUARANTEE MAY LOSE VALUE NOT A DEPOSIT
NOT INSURED BY ANY FEDERAL GOVERNMENT AGENCY
| | | | | | |
| | 2 | | | | | | Deutsche DWS Variable Series II — DWS International Growth VIP |
| | |
| Performance Summary | | December 31, 2019 (Unaudited) |
Fund performance shown is historical, assumes reinvestment of all dividend and capital gain distributions and does not guarantee future results. Investment return and principal value fluctuate with changing market conditions so that, when redeemed, shares may be worth more or less than their original cost. Current performance may be lower or higher than the performance data quoted. Please contact your participating insurance company for the Fund’s most recentmonth-end performance. Performance does not reflect charges and fees (“contract charges”) associated with the separate account that invests in the Fund or any variable life insurance policy or variable annuity contract for which the Fund is an investment option. These charges and fees will reduce returns. While all share classes have the same underlying portfolio, their performance will differ.
The gross expense ratios of the Fund, as stated in the fee table of the prospectus dated May 1, 2019 are 1.72% and 2.07% for Class A and Class B shares, respectively, and may differ from the expense ratios disclosed in the Financial Highlights tables in this report.
Generally accepted accounting principles require adjustments to be made to the net assets of the Fund at period end for financial reporting purposes only, and as such, the total return based on the unadjusted net asset value per share may differ from the total return reported in the financial highlights.
Growth of an Assumed $10,000 Investment
| | |
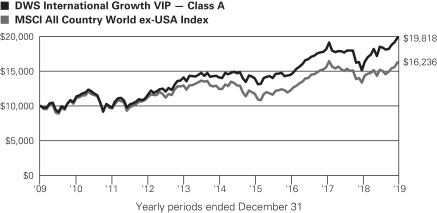
| | MSCI All Country World ex-USA Index is an unmanaged equity index which captures large and mid-capitalization representation across 22 of 23 developed markets countries excluding the U.S. and 26 emerging markets countries. It covers approximately 85% of the global equity opportunity set outside of the U.S. Index returns do not reflect any fees or expenses and it is not possible to invest directly into an index. |
| | | | | | | | | | |
| Comparative Results | | | | | | | | | | |
| | | | | |
| DWS International Growth VIP | | | | 1-Year | | 3-Year | | 5-Year | | 10-Year |
| Class A | | Growth of $10,000 | | $13,122 | | $13,717 | | $14,052 | | $19,818 |
| | | Average annual total return | | 31.22% | | 11.11% | | 7.04% | | 7.08% |
MSCI All Country World
ex-USA Index | | Growth of $10,000 | | $12,151 | | $13,261 | | $13,073 | | $16,236 |
| | Average annual total return | | 21.51% | | 9.87% | | 5.51% | | 4.97% |
| | | | | |
| DWS International Growth VIP | | | | 1-Year | | 3-Year | | 5-Year | | 10-Year |
| Class B | | Growth of $10,000 | | $13,084 | | $13,616 | | $13,858 | | $19,198 |
| | | Average annual total return | | 30.84% | | 10.84% | | 6.74% | | 6.74% |
MSCI All Country World
ex-USA Index | | Growth of $10,000 | | $12,151 | | $13,261 | | $13,073 | | $16,236 |
| | Average annual total return | | 21.51% | | 9.87% | | 5.51% | | 4.97% |
The growth of $10,000 is cumulative.
| | | | |
Deutsche DWS Variable Series II — DWS International Growth VIP | | | | | 3 |
| | |
| Management Summary | | December 31, 2019 (Unaudited) |
The Fund’s Class A shares returned 31.22% during the 12 months ended December 31, 2019 (unadjusted for contract charges), strongly outperforming the 21.51% return of the MSCIAll-Country Worldex-USA Index.
Our emphasis on growth stocks was a key factor driving performance in 2019. Stock selection also played a large role in the Fund’s strong showing. The Fund’s holdings outpaced the corresponding index components in ten of the eleven major sectors, led by financials, information technology, industrials, and health care. Energy was the only area in which the Fund lagged, but we made up for the shortfall by having an underweight allocation to this underperforming sector.
Brookfield Asset Management, Inc. (Canada), which reported steady growth, was the leading contributor in both the financial sector and the Fund as a whole. Globant SA, a software company based in Argentina, also rallied on the strength of better-than-expected earnings and forward guidance, as well as a generally favorable demand environment. New Oriental Education & Technology Group, Inc. (China), Agnico Eagle Mines Ltd. (Canada), and LVMH Moet Hennessy Louis Vuitton SE (France) were additional contributors of note.
Although we use abottom-up approach, sector allocations had a positive effect on performance. Most notably, the Fund was helped by having a meaningful overweight in information technology. The sector was the top performer for the year, with a gain nearly twice that of the broader index.
At a time of robust relative performance, few aspects of the Fund’s positioning stood out as negatives. The apparel designer SMCP SA (France) was the leading detractor. Protests in France disrupted sales in its home market, and uncertainty surrounding trade policy dampened enthusiasm for the company’s expansion in China. Shares of Canada Goose Holdings, Inc. (Canada) also lost ground due to weaker-than-expected results and soft forward guidance. A position in cash, while limited, further hurt results given the strength in the broader market.
The strong performance of the global markets led to a significant increase in valuations in 2019, resulting in a narrower set of investment opportunities. We therefore became increasingly selective in identifying investment candidates for the Fund. For example, we built positions in a number of companies that we believe are supported by the long-term tailwinds of secular change. In the emerging markets, this included Pagseguro Digital Ltd. (Brazil), Luckin Coffee, Inc. (China), and Magazine Luiza SA (Brazil). In the developed markets, we added companies such as TeamViewer AG (Germany), Shimadzu Corp. (Japan), and Orpea (France). We also invested in high-quality franchises with cyclical upside and reasonable valuations, including Cie de Saint-Gobain (France), BASF SE (Germany) and Evonik Industries AG (Germany). On the other hand, we either sold or reduced stocks with deteriorating fundamentals, including China Life Insurance Co., Ltd.* (China), Continental AG* (Germany), Komatsu Ltd.* (Japan), and Chr Hansen Holding AS* (Denmark).
We held a relatively neutral stance from a regional perspective, with the largest absolute weightings in Continental Europe, China/Hong Kong, Japan, and Canada. On a longer-term basis, we think the emerging markets offer the most compelling growth prospects — particularly in areas that are sensitive to domestic consumption trends. Japan has also captured our attention as a source of innovative companies that drive market-leading solutions and place a growing emphasis on shareholder return.
At the sector level, the Fund was overweight in technology, health care, industrials, and consumer discretionary. Conversely, it was underweight in energy, consumer staples, materials, financials, and communication services. These weightings are the result of ourbottom-up stock selection process, rather than atop-down view. The Fund ended the year with a cash weighting of about 1%, which we think provides us with flexibility to add to positions in our favored companies if macro-related headlines fuel additional market volatility in the months ahead. We would welcome such disruptions, as they can provide an opportunity to build positions in attractive, higher-growth stocks at more reasonable valuations.
Sebastian P. Werner, PhD, Director
Julia A. Merz, PhD, Assistant Vice President
Portfolio Managers
The views expressed reflect those of the portfolio management team only through the end of the period of the report as stated on the cover. The management team’s views are subject to change at any time based on market and other conditions and should not be construed as a recommendation. Past performance is no guarantee of future results. Current and future portfolio holdings are subject to risk.
| | | | | | |
| | 4 | | | | | | Deutsche DWS Variable Series II — DWS International Growth VIP |
Terms to Know
MSCI All Country World ex USA Indexis an unmanaged equity index which captures large andmid-capitalization representation across 22 of 23 developed markets countries excluding the U.S. and 26 emerging markets countries. It covers approximately 85% of the global equity opportunity set outside of the U.S.
Contribution anddetractionincorporate both a stock’s total return and its weighting in the fund.
Overweightmeans that a Fund holds a higher weighting in a given sector compared with its benchmark index. Underweightmeans that a Fund holds a lower weighting.
| * | Not held at December 31, 2019. |
| | | | |
Deutsche DWS Variable Series II — DWS International Growth VIP | | | | | 5 |
| | |
| Portfolio Summary | | (Unaudited) |
| | | | | | | | |
| Asset Allocation (As a % of Investment Portfolio excluding Securities Lending Collateral) | | 12/31/19 | | | 12/31/18 | |
| Common Stocks | | | 97% | | | | 99% | |
| Exchange-Traded Funds | | | 2% | | | | — | |
| Cash Equivalents | | | 1% | | | | 1% | |
| Preferred Stocks | | | 0% | | | | 0% | |
| Warrants | | | — | | | | 0% | |
| | | | 100% | | | | 100% | |
| | |
Sector Diversification (As a % of Investment Portfolio excluding Cash Equivalents, Securities Lending Collateral and
Exchange-Traded Funds) | | 12/31/19 | | | 12/31/18 | |
| Financials | | | 19% | | | | 20% | |
| Information Technology | | | 18% | | | | 14% | |
| Industrials | | | 15% | | | | 15% | |
| Health Care | | | 15% | | | | 14% | |
| Consumer Discretionary | | | 14% | | | | 15% | |
| Consumer Staples | | | 7% | | | | 7% | |
Communication Services | | | 5% | | | | 7% | |
Materials | | | 5% | | | | 6% | |
| Energy | | | 2% | | | | 2% | |
| | | | 100% | | | | 100% | |
| | |
Geographical Diversification (As a % of Investment Portfolio excluding Cash Equivalents, Securities Lending Collateral and
Exchange-Traded Funds) | | 12/31/19 | | | 12/31/18 | |
| France | | | 13% | | | | 11% | |
| Germany | | | 13% | | | | 13% | |
Japan | | | 10% | | | | 12% | |
Canada | | | 9% | | | | 10% | |
United States | | | 8% | | | | 7% | |
Switzerland | | | 9% | | | | 9% | |
China | | | 8% | | | | 8% | |
| Netherlands | | | 4% | | | | 4% | |
| United Kingdom | | | 4% | | | | 7% | |
| Ireland | | | 4% | | | | 1% | |
| Sweden | | | 3% | | | | 3% | |
| Singapore | | | 2% | | | | 2% | |
| Argentina | | | 2% | | | | 2% | |
| Brazil | | | 2% | | | | 0% | |
| Korea | | | 2% | | | | 2% | |
| Other | | | 7% | | | | 9% | |
| | | | 100% | | | | 100% | |
Portfolio holdings and characteristics are subject to change.
For more complete details about the Fund’s investment portfolio, see page 7.
Following the Fund’s fiscal first and thirdquarter-end, a complete portfolio holdings listing is filed with the SEC on Form N-PORT. The Fund’s Form N-PORT will be available on the SEC’s Web site at sec.gov. The Fund’s portfolio holdings are also posted on dws.com from time to time. Please read the Fund’s current prospectus for more information.
| | | | | | |
| | 6 | | | | | | Deutsche DWS Variable Series II — DWS International Growth VIP |
| | |
| Investment Portfolio | | as of December 31, 2019 |
| | | | | | | | |
| | | Shares | | | Value ($) | |
| Common Stocks 96.2% | | | | | | | | |
| Argentina 2.1% | |
| | |
Globant SA* (a) | | | 3,331 | | | | 353,253 | |
| | |
Grupo Supervielle SA (ADR) (b) | | | 3,968 | | | | 14,602 | |
| | | | | | | | |
(Cost $240,383) | | | | 367,855 | |
|
| Brazil 1.8% | |
| | |
Magazine Luiza SA | | | 12,960 | | | | 153,436 | |
| | |
Pagseguro Digital Ltd. “A”* (a) | | | 4,756 | | | | 162,465 | |
| | | | | | | | |
(Cost $271,746) | | | | 315,901 | |
|
| Canada 9.3% | |
| | |
Agnico Eagle Mines Ltd. | | | 5,048 | | | | 310,915 | |
| | |
Alimentation Couche-Tard, Inc. “B” | | | 5,580 | | | | 177,084 | |
| | |
Brookfield Asset Management, Inc. “A” | | | 9,774 | | | | 564,740 | |
| | |
Canada Goose Holdings, Inc.* (b) | | | 3,715 | | | | 134,490 | |
| | |
Canadian National Railway Co. | | | 2,610 | | | | 236,107 | |
| | |
Toronto-Dominion Bank | | | 3,902 | | | | 218,846 | |
| | | | | | | | |
(Cost $979,618) | | | | 1,642,182 | |
|
| China 8.2% | |
| | |
Alibaba Group Holding Ltd. (ADR)* | | | 1,560 | | | | 330,876 | |
| | |
Luckin Coffee, Inc. (ADR)* (b) | | | 2,265 | | | | 89,150 | |
| | |
Minth Group Ltd. | | | 16,870 | | | | 59,599 | |
| | |
Momo, Inc. (ADR) | | | 3,331 | | | | 111,589 | |
| | |
New Oriental Education & Technology Group, Inc. (ADR)* | | | 1,120 | | | | 135,800 | |
| | |
Ping An Healthcare and Technology Co., Ltd. 144A* | | | 2,100 | | | | 15,388 | |
| | |
Ping An Insurance (Group) Co. of China Ltd. “H” | | | 33,000 | | | | 391,713 | |
| | |
Tencent Holdings Ltd. | | | 6,400 | | | | 308,056 | |
| | | | | | | | |
(Cost $920,012) | | | | 1,442,171 | |
|
| Finland 0.3% | |
Sampo Oyj “A” (Cost $60,170) | | | 1,263 | | | | 55,145 | |
|
| France 13.0% | |
| | |
Airbus SE | | | 1,067 | | | | 156,415 | |
| | |
BNP Paribas SA | | | 1,857 | | | | 110,396 | |
| | |
Capgemini SE | | | 1,600 | | | | 195,492 | |
| | |
Cie de Saint-Gobain | | | 2,354 | | | | 96,463 | |
| | |
LVMH Moet Hennessy Louis Vuitton SE | | | 890 | | | | 414,413 | |
| | |
Orpea | | | 1,082 | | | | 138,840 | |
| | |
SMCP SA 144A* (b) | | | 8,225 | | | | 87,460 | |
| | |
Teleperformance | | | 1,222 | | | | 298,044 | |
| | |
Total SA | | | 6,004 | | | | 332,453 | |
| | |
VINCI SA | | | 2,736 | | | | 304,520 | |
| | |
Vivendi SA | | | 5,423 | | | | 157,003 | |
| | | | | | | | |
(Cost $1,952,004) | | | | 2,291,499 | |
|
| Germany 12.9% | |
| | |
adidas AG | | | 145 | | | | 47,360 | |
| | |
Allianz SE (Registered) | | | 1,308 | | | | 320,573 | |
| | |
BASF SE | | | 2,532 | | | | 192,050 | |
| | |
Deutsche Boerse AG | | | 2,802 | | | | 441,779 | |
| | |
Deutsche Post AG (Registered) | | | 2,693 | | | | 103,137 | |
| | |
Evonik Industries AG | | | 6,411 | | | | 197,249 | |
| | |
Fresenius Medical Care AG & Co. KGaA | | | 3,122 | | | | 231,813 | |
| | | | | | | | |
| | | Shares | | | Value ($) | |
| | |
LANXESS AG | | | 2,236 | | | | 150,931 | |
| | |
SAP SE | | | 1,685 | | | | 228,623 | |
| | |
Siemens AG (Registered) | | | 915 | | | | 119,901 | |
| | |
TeamViewer AG* | | | 6,933 | | | | 251,717 | |
| | | | | | | | |
(Cost $2,086,126) | | | | 2,285,133 | |
|
| Hong Kong 1.0% | |
Techtronic Industries Co., Ltd. (Cost $58,450) | | | 22,597 | | | | 185,060 | |
|
| Ireland 3.7% | |
| | |
Experian PLC | | | 11,889 | | | | 402,014 | |
| | |
Kerry Group PLC1 “A” | | | 2,035 | | | | 253,734 | |
| | | | | | | | |
(Cost $391,644) | | | | 655,748 | |
|
| Japan 9.5% | |
| | |
Daikin Industries Ltd. | | | 2,500 | | | | 352,507 | |
| | |
Fast Retailing Co., Ltd. | | | 500 | | | | 298,204 | |
| | |
Hoya Corp. | | | 2,600 | | | | 248,642 | |
| | |
Kao Corp. | | | 1,100 | | | | 90,799 | |
| | |
Keyence Corp. | | | 800 | | | | 281,666 | |
| | |
MISUMI Group, Inc. | | | 3,911 | | | | 96,919 | |
| | |
Mitsubishi UFJ Financial Group, Inc. | | | 10,300 | | | | 55,713 | |
| | |
Pigeon Corp. | | | 3,900 | | | | 143,283 | |
| | |
Shimadzu Corp. | | | 3,500 | | | | 109,918 | |
| | | | | | | | |
(Cost $1,331,458) | | | | 1,677,651 | |
|
| Korea 1.6% | |
Samsung Electronics Co., Ltd. (Cost $248,084) | | | 5,801 | | | | 279,195 | |
|
| Luxembourg 1.0% | |
Eurofins Scientific (Cost $75,208) | | | 332 | | | | 184,133 | |
|
| Macau 1.0% | |
Sands China Ltd. (Cost $169,235) | | | 32,000 | | | | 171,287 | |
|
| Malaysia 0.9% | |
IHH Healthcare Bhd.
(Cost $160,964) | | | 116,000 | | | | 155,147 | |
|
| Netherlands 3.9% | |
| | |
Adyen NV 144A* | | | 11 | | | | 9,025 | |
| | |
ASML Holding NV | | | 662 | | | | 196,897 | |
| | |
ING Groep NV | | | 16,397 | | | | 197,029 | |
| | |
Koninklijke Philips NV | | | 4,455 | | | | 217,865 | |
| | |
Prosus NV* | | | 1,047 | | | | 78,293 | |
| | | | | | | | |
(Cost $617,646) | | | | 699,109 | |
|
| Norway 0.6% | |
Mowi ASA (Cost $50,908) | | | 4,230 | | | | 109,814 | |
|
| Singapore 2.1% | |
DBS Group Holdings Ltd.
(Cost $310,391) | | | 19,400 | | | | 373,634 | |
|
| South Africa 1.0% | |
Naspers Ltd. “N” (Cost $238,774) | | | 1,047 | | | | 171,415 | |
|
| Sweden 2.4% | |
| | |
Assa Abloy AB “B” | | | 3,000 | | | | 70,116 | |
| | |
Hexagon AB “B” | | | 1,080 | | | | 60,467 | |
| | |
Nobina AB 144A | | | 22,904 | | | | 157,922 | |
| | |
Spotify Technology SA* (a) | | | 937 | | | | 140,128 | |
| | | | | | | | |
(Cost $380,388) | | | | 428,633 | |
The accompanying notes are an integral part of the financial statements.
| | | | |
Deutsche DWS Variable Series II — DWS International Growth VIP | | | | | 7 |
| | | | | | | | |
| | | Shares | | | Value ($) | |
|
| Switzerland 8.3% | |
| | |
Alcon, Inc.* | | | 640 | | | | 36,204 | |
| | |
Julius Baer Group Ltd.* | | | 1,404 | | | | 72,437 | |
| | |
Lonza Group AG (Registered)* | | | 1,307 | | | | 476,920 | |
| | |
Nestle SA (Registered) | | | 3,312 | | | | 358,535 | |
| | |
Novartis AG (Registered) | | | 2,716 | | | | 257,627 | |
| | |
Roche Holding AG (Genusschein) | | | 815 | | | | 264,468 | |
| | | | | | | | |
(Cost $906,510) | | | | 1,466,191 | |
|
| Taiwan 1.3% | |
Taiwan Semiconductor Manufacturing Co., Ltd.
(Cost $127,110) | | | 21,000 | | | | 233,139 | |
|
| United Kingdom 3.8% | |
| | |
Clinigen Healthcare Ltd.* | | | 9,466 | | | | 115,886 | |
| | |
Compass Group PLC | | | 7,068 | | | | 177,345 | |
| | |
Farfetch Ltd. “A”* (a) | | | 4,029 | | | | 41,700 | |
| | |
Halma PLC | | | 4,945 | | | | 139,391 | |
| | |
Prudential PLC | | | 10,000 | | | | 192,454 | |
| | | | | | | | |
(Cost $556,388) | | | | 666,776 | |
|
| United States 6.5% | |
| | |
Activision Blizzard, Inc. | | | 2,582 | | | | 153,423 | |
| | |
EPAM Systems, Inc.* | | | 1,363 | | | | 289,174 | |
| | |
Marsh & McLennan Companies, Inc. | | | 1,696 | | | | 188,951 | |
| | |
MasterCard, Inc. “A” | | | 631 | | | | 188,410 | |
| | |
NVIDIA Corp. | | | 332 | | | | 78,120 | |
| | |
Schlumberger Ltd. | | | 2,602 | | | | 104,600 | |
| | |
Thermo Fisher Scientific, Inc. | | | 446 | | | | 144,892 | |
| | | | | | | | |
| |
(Cost $610,622) | | | | 1,147,570 | |
Total Common Stocks (Cost $12,743,839) | | | | 17,004,388 | |
| | | | | | | | |
| | | Shares | | | Value ($) | |
|
| Convertible Preferred Stocks 0.1% | |
| United States | |
Providence Service Corp. (c)
(Cost $13,600) | | | 136 | | | | 20,182 | |
|
| Exchange-Traded Funds 1.9% | |
| United States | |
iShares MSCI Japan ETF (Cost $341,111) | | | 5,700 | | | | 337,668 | |
|
| Securities Lending Collateral 1.7% | |
DWS Government & Agency Securities Portfolio “DWS Government Cash Institutional Shares”, 1.50% (d) (e)
(Cost $290,624) | | | 290,624 | | | | 290,624 | |
|
| Cash Equivalents 1.4% | |
DWS Central Cash Management Government Fund, 1.62% (d) (Cost $241,211) | | | 241,211 | | | | 241,211 | |
| | |
| | | % of Net
Assets | | | Value ($) | |
Total Investment Portfolio
(Cost $13,630,385) | | | 101.3 | | | | 17,894,073 | |
| Other Assets and Liabilities, Net | | | (1.3 | ) | | | (222,976 | ) |
| Net Assets | | | 100.0 | | | | 17,671,097 | |
A summary of the Fund’s transactions with affiliated investments during the year ended December 31, 2019 are as follows:
| | | | | | | | | | | | | | | | | | | | | | | | | | | | | | | | |
Value ($) at
12/31/2018 | | Purchases
Cost ($) | | | Sales
Proceeds ($) | | | Net
Realized
Gain/
(Loss) ($) | | | Net Change in
Unrealized
Appreciation
(Depreciation) ($) | | | Income ($) | | | Capital Gain
Distributions ($) | | | Number
of Shares
at
12/31/2019 | | | Value ($)
at
12/31/2019 | |
Securities Lending Collateral 1.7% | | | | | | | | | | | | | | | | | |
DWS Government & Agency Securities Portfolio “DWS Government Cash Institutional Shares”, 1.50% (d) (e) | |
| 156,436 | | | 134,188 | (f) | | | — | | | | — | | | | — | | | | 11,826 | | | | — | | | | 290,624 | | | | 290,624 | |
Cash Equivalents 1.4% | |
DWS Central Cash Management Government Fund, 1.62% (d) | |
| 148,953 | | | 4,160,183 | | | | 4,067,925 | | | | — | | | | — | | | | 8,243 | | | | — | | | | 241,211 | | | | 241,211 | |
| 305,389 | | | 4,294,371 | | | | 4,067,925 | | | | — | | | | — | | | | 20,069 | | | | — | | | | 531,835 | | | | 531,835 | |
| * | Non-income producing security. |
| (a) | Listed on the New York Stock Exchange. |
| (b) | All or a portion of these securities were on loan. In addition, “Other Assets and Liabilities, Net” may include pending sales that are also on loan. The value of securities loaned at December 31, 2019 amounted to $283,155, which is 1.6% of net assets. |
| (c) | Investment was valued using significant unobservable inputs. |
| (d) | Affiliated fund managed by DWS Investment Management Americas, Inc. The rate shown is the annualizedseven-day yield at period end. |
| (e) | Represents cash collateral held in connection with securities lending. Income earned by the Fund is net of borrower rebates. |
| (f) | Represents the net increase (purchase cost) or decrease (sales proceeds) in the amount invested in cash collateral for the year ended December 31, 2019. |
144A: Security exempt from registration under Rule 144A of the Securities Act of 1933. These securities may be resold in transactions exempt from registration, normally to qualified institutional buyers.
ADR: American Depositary Receipt
MSCI: Morgan Stanley Capital International
The accompanying notes are an integral part of the financial statements.
| | | | | | |
| | 8 | | | | | | Deutsche DWS Variable Series II — DWS International Growth VIP |
Fair Value Measurements
Various inputs are used in determining the value of the Fund’s investments. These inputs are summarized in three broad levels. Level 1 includes quoted prices in active markets for identical securities. Level 2 includes other significant observable inputs (including quoted prices for similar securities, interest rates, prepayment speeds and credit risk). Level 3 includes significant unobservable inputs (including the Fund’s own assumptions in determining the fair value of investments). The level assigned to the securities valuations may not be an indication of the risk or liquidity associated with investing in those securities.
The following is a summary of the inputs used as of December 31, 2019 in valuing the Fund’s investments. For information on the Fund’s policy regarding the valuation of investments, please refer to the Security Valuation section of Note A in the accompanying Notes to Financial Statements.
| | | | | | | | | | | | | | | | |
| Assets | | Level 1 | | | Level 2 | | | Level 3 | | | Total | |
Common Stocks | | | | | | | | | | | | | | | | |
Argentina | | $ | 367,855 | | | $ | — | | | $ | — | | | $ | 367,855 | |
Brazil | | | 162,465 | | | | 153,436 | | | | — | | | | 315,901 | |
Canada | | | 1,642,182 | | | | — | | | | — | | | | 1,642,182 | |
China | | | 667,415 | | | | 774,756 | | | | — | | | | 1,442,171 | |
Finland | | | — | | | | 55,145 | | | | — | | | | 55,145 | |
France | | | — | | | | 2,291,499 | | | | — | | | | 2,291,499 | |
Germany | | | — | | | | 2,285,133 | | | | — | | | | 2,285,133 | |
Hong Kong | | | — | | | | 185,060 | | | | — | | | | 185,060 | |
Ireland | | | — | | | | 655,748 | | | | — | | | | 655,748 | |
Japan | | | — | | | | 1,677,651 | | | | — | | | | 1,677,651 | |
Korea | | | — | | | | 279,195 | | | | — | | | | 279,195 | |
Luxembourg | | | — | | | | 184,133 | | | | — | | | | 184,133 | |
Macau | | | — | | | | 171,287 | | | | — | | | | 171,287 | |
Malaysia | | | — | | | | 155,147 | | | | — | | | | 155,147 | |
Netherlands | | | — | | | | 699,109 | | | | — | | | | 699,109 | |
Norway | | | — | | | | 109,814 | | | | — | | | | 109,814 | |
Singapore | | | — | | | | 373,634 | | | | — | | | | 373,634 | |
South Africa | | | — | | | | 171,415 | | | | — | | | | 171,415 | |
Sweden | | | 140,128 | | | | 288,505 | | | | — | | | | 428,633 | |
Switzerland | | | — | | | | 1,466,191 | | | | — | | | | 1,466,191 | |
Taiwan | | | — | | | | 233,139 | | | | — | | | | 233,139 | |
United Kingdom | | | 41,700 | | | | 625,076 | | | | — | | | | 666,776 | |
United States | | | 1,147,570 | | | | — | | | | — | | | | 1,147,570 | |
| Convertible Preferred Stocks | | | — | | | | — | | | | 20,182 | | | | 20,182 | |
| Exchange-Traded Funds | | | 337,668 | | | | — | | | | — | | | | 337,668 | |
| Short-Term Investments (g) | | | 531,835 | | | | — | | | | — | | | | 531,835 | |
| Total | | $ | 5,038,818 | | | $ | 12,835,073 | | | $ | 20,182 | | | $ | 17,894,073 | |
| (g) | See Investment Portfolio for additional detailed categorizations. |
The accompanying notes are an integral part of the financial statements.
| | | | |
Deutsche DWS Variable Series II — DWS International Growth VIP | | | | | 9 |
Statement of Assets and Liabilities
| | | | |
| as of December 31, 2019 | | | | |
| |
| Assets | | | | |
| Investments innon-affiliated securities, at value (cost $13,098,550) — including $283,155 of securities loaned | | $ | 17,362,238 | |
| Investment in DWS Government & Agency Securities Portfolio (cost $290,624)* | | | 290,624 | |
| Investment in DWS Central Cash Management Government Fund (cost $241,211) | | | 241,211 | |
| Foreign currency, at value (cost $145,600) | | | 144,789 | |
| Receivable for Fund shares sold | | | 51 | |
| Dividends receivable | | | 4,819 | |
| Interest receivable | | | 779 | |
| Foreign taxes recoverable | | | 24,608 | |
| Due from Advisor | | | 3,892 | |
| Other assets | | | 569 | |
| Total assets | | | 18,073,580 | |
| |
| Liabilities | | | | |
| Payable upon return of securities loaned | | | 290,624 | |
| Payable for Fund shares redeemed | | | 13,589 | |
| Accrued Trustees’ fees | | | 1,131 | |
| Other accrued expenses and payables | | | 97,139 | |
| Total liabilities | | | 402,483 | |
| Net assets, at value | | $ | 17,671,097 | |
| |
| Net Assets Consist of | | | | |
| Distributable earnings (loss) | | | 4,442,285 | |
| Paid-in capital | | | 13,228,812 | |
| Net assets, at value | | $ | 17,671,097 | |
| |
| Net Asset Value | | | | |
Class A | | | | |
| |
| Net Asset Value, offering and redemption price per share ($17,513,656 ÷ 1,196,084 outstanding shares of beneficial interest, no par value, unlimited number of shares authorized) | | $ | 14.64 | |
Class B | | | | |
| |
| Net Asset Value, offering and redemption price per share ($157,441 ÷ 10,737 outstanding shares of beneficial interest, no par value, unlimited number of shares authorized) | | $ | 14.66 | |
| * | Represents collateral on securities loaned. |
Statement of Operations
| | | | |
| for the year ended December 31, 2019 | |
| |
| Investment Income | | | | |
| Income: | | | | |
Dividends (net of foreign taxes withheld
of $37,203) | | $ | 385,021 | |
| Income distributions — DWS Central Cash Management Government Fund | | | 8,243 | |
| Securities lending income, net of borrower rebates | | | 11,826 | |
| Total income | | | 405,090 | |
| Expenses: | | | | |
| Management fee | | | 100,737 | |
| Administration fee | | | 16,248 | |
| Services to Shareholders | | | 906 | |
| Record keeping fee (Class B) | | | 34 | |
| Distribution service fee (Class B) | | | 334 | |
| Custodian fee | | | 24,728 | |
| Professional fees | | | 81,624 | |
| Reports to shareholders | | | 24,063 | |
| Trustees’ fees and expenses | | | 2,264 | |
| Other | | | 15,335 | |
| Total expenses before expense reductions | | | 266,273 | |
| Expense reductions | | | (126,215 | ) |
| Total expenses after expense reductions | | | 140,058 | |
| Net investment income (loss) | | | 265,032 | |
| |
| Realized and Unrealized Gain (Loss) | | | | |
| Net realized gain (loss) from: | | | | |
| Investments | | | (34,791 | ) |
| Foreign currency | | | (4,204 | ) |
| | | | (38,995 | ) |
| Change in net unrealized appreciation (depreciation) on: | | | | |
| Investments | | | 4,098,050 | |
| Foreign currency | | | 2,754 | |
| | | | 4,100,804 | |
| Net gain (loss) | | | 4,061,809 | |
| Net increase (decrease) in net assets resulting from operations | | $ | 4,326,841 | |
The accompanying notes are an integral part of the financial statements.
| | | | | | |
| | 10 | | | | | | Deutsche DWS Variable Series II — DWS International Growth VIP |
Statements of Changes in Net Assets
| | | | | | | | |
| | | Years Ended December 31, | |
| Increase (Decrease) in Net Assets | | 2019 | | | 2018 | |
| Operations: | | | | | | | | |
| Net investment income (loss) | | $ | 265,032 | | | $ | 210,075 | |
| Net realized gain (loss) | | | (38,995 | ) | | | 228,637 | |
| Change in net unrealized appreciation (depreciation) | | | 4,100,804 | | | | (3,352,382 | ) |
| Net increase (decrease) in net assets resulting from operations | | | 4,326,841 | | | | (2,913,670 | ) |
| Distributions to shareholders: | | | | | | | | |
Class A | | | (445,123 | ) | | | (169,762 | ) |
Class B | | | (3,307 | ) | | | (1,806 | ) |
| Total distributions | | | (448,430 | ) | | | (171,568 | ) |
| Fund share transactions: | | | | | | | | |
Class A | | | | | | | | |
| Proceeds from shares sold | | | 1,652,668 | | | | 1,452,220 | |
| Reinvestment of distributions | | | 445,123 | | | | 169,762 | |
| Payments for shares redeemed | | | (2,520,782 | ) | | | (3,127,727 | ) |
| Net increase (decrease) in net assets from Class A share transactions | | | (422,991 | ) | | | (1,505,745 | ) |
Class B | | | | | | | | |
| Proceeds from shares sold | | | 16,855 | | | | 82,846 | |
| Reinvestment of distributions | | | 3,307 | | | | 1,806 | |
| Payments for shares redeemed | | | (112,320 | ) | | | (28,351 | ) |
| Net increase (decrease) in net assets from Class B share transactions | | | (92,158 | ) | | | 56,301 | |
| Increase (decrease) in net assets | | | 3,363,262 | | | | (4,534,682 | ) |
| Net assets at beginning of period | | | 14,307,835 | | | | 18,842,517 | |
| | |
| Net assets at end of period | | $ | 17,671,097 | | | $ | 14,307,835 | |
| | |
| Other Information | | | | | | | | |
Class A | | | | | | | | |
| Shares outstanding at beginning of period | | | 1,228,635 | | | | 1,340,522 | |
| Shares sold | | | 122,990 | | | | 108,093 | |
| Shares issued to shareholders in reinvestment of distributions | | | 33,594 | | | | 12,631 | |
| Shares redeemed | | | (189,135 | ) | | | (232,611 | ) |
| Net increase (decrease) in Class A shares | | | (32,551 | ) | | | (111,887 | ) |
| | |
| Shares outstanding at end of period | | | 1,196,084 | | | | 1,228,635 | |
Class B | | | | | | | | |
| Shares outstanding at beginning of period | | | 19,045 | | | | 14,862 | |
| Shares sold | | | 1,204 | | | | 6,136 | |
| Shares issued to shareholders in reinvestment of distributions | | | 249 | | | | 134 | |
| Shares redeemed | | | (9,761 | ) | | | (2,087 | ) |
| Net increase (decrease) in Class B shares | | | (8,308 | ) | | | 4,183 | |
| | |
| Shares outstanding at end of period | | | 10,737 | | | | 19,045 | |
The accompanying notes are an integral part of the financial statements.
| | | | |
Deutsche DWS Variable Series II — DWS International Growth VIP | | | | | 11 |
Financial Highlights
| | | | | | | | | | | | | | | | | | | | |
| | | Years Ended December 31, | |
| Class A | | 2019 | | | 2018 | | | 2017 | | | 2016 | | | 2015 | |
| | | | | |
| Selected Per Share Data | | | | | | | | | | | | | | | | | | | | |
| Net asset value, beginning of period | | $ | 11.47 | | | $ | 13.90 | | | $ | 11.12 | | | $ | 10.81 | | | $ | 11.04 | |
| Income (loss) from investment operations: | | | | | | | | | | | | | | | | | | | | |
Net investment incomea | | | .22 | | | | .16 | | | | .08 | | | | .06 | | | | .07 | |
Net realized and unrealized gain (loss) | | | 3.32 | | | | (2.46 | ) | | | 2.75 | | | | .34 | | | | (.21 | ) |
Total from investment operations | | | 3.54 | | | | (2.30 | ) | | | 2.83 | | | | .40 | | | | (.14 | ) |
| Less distribution from: | | | | | | | | | | | | | | | | | | | | |
Net investment income | | | (.17 | ) | | | (.13 | ) | | | (.05 | ) | | | (.09 | ) | | | (.09 | ) |
Net realized gain | | | (.20 | ) | | | — | | | | — | | | | — | | | | — | |
Total distributions | | | (.37 | ) | | | (.13 | ) | | | (.05 | ) | | | (.09 | ) | | | (.09 | ) |
| Net asset value, end of period | | $ | 14.64 | | | $ | 11.47 | | | $ | 13.90 | | | $ | 11.12 | | | $ | 10.81 | |
| Total Return (%)b | | | 31.22 | | | | (16.69 | ) | | | 25.47 | | | | 3.72 | | | | (1.32 | ) |
| | |
| Ratios to Average Net Assets and Supplemental Data | | | | | | | | | |
| Net assets, end of period ($ millions) | | | 18 | | | | 14 | | | | 19 | | | | 27 | | | | 34 | |
| Ratio of expenses before expense reductions (%)c | | | 1.64 | | | | 1.72 | | | | 1.56 | | | | 1.66 | | | | 1.44 | |
| Ratio of expenses after expense reductions (%)c | | | .86 | | | | .81 | | | | .92 | | | | .95 | | | | .90 | |
| Ratio of net investment income (%) | | | 1.63 | | | | 1.21 | | | | .61 | | | | .51 | | | | .65 | |
| Portfolio turnover rate (%) | | | 16 | | | | 38 | | | | 62 | | | | 70 | | | | 64 | |
| a | Based on average shares outstanding during the period. |
| b | Total return would have been lower had certain expenses not been reduced. |
| c | Expense ratio does not reflect charges and fees associated with the separate account that invests in the Fund or any variable life insurance policy or variable annuity contract for which the Fund is an investment option. |
| | | | | | | | | | | | | | | | | | | | |
| | | | | | Years Ended December 31, | |
| Class B | | 2019 | | | 2018 | | | 2017 | | | 2016 | | | 2015 | |
| | | | | |
| Selected Per Share Data | | | | | | | | | | | | | | | | | | | | |
| Net asset value, beginning of period | | $ | 11.49 | | | $ | 13.93 | | | $ | 11.13 | | | $ | 10.82 | | | $ | 11.05 | |
| Income (loss) from investment operations: | | | | | | | | | | | | | | | | | | | | |
Net investment incomea | | | .18 | | | | .12 | | | | .02 | | | | .02 | | | | .05 | |
Net realized and unrealized gain (loss) | | | 3.33 | | | | (2.46 | ) | | | 2.79 | | | | .35 | | | | (.23 | ) |
Total from investment operations | | | 3.51 | | | | (2.34 | ) | | | 2.81 | | | | .37 | | | | (.18 | ) |
| Less distribution from: | | | | | | | | | | | | | | | | | | | | |
Net investment income | | | (.14 | ) | | | (.10 | ) | | | (.01 | ) | | | (.06 | ) | | | (.05 | ) |
Net realized gain | | | (.20 | ) | | | — | | | | — | | | | — | | | | — | |
Total distributions | | | (.34 | ) | | | (.10 | ) | | | (.01 | ) | | | (.06 | ) | | | (.05 | ) |
| Net asset value, end of period | | $ | 14.66 | | | $ | 11.49 | | | $ | 13.93 | | | $ | 11.13 | | | $ | 10.82 | |
| Total Return (%)b | | | 30.84 | | | | (16.92 | ) | | | 25.26 | | | | 3.38 | | | | (1.64 | ) |
| |
Ratios to Average Net Assets and Supplemental Data | | | | | |
| Net assets, end of period ($ millions) | | | .2 | | | | .2 | | | | .2 | | | | .07 | | | | .1 | |
| Ratio of expenses before expense reductions (%)c | | | 1.95 | | | | 2.07 | | | | 1.90 | | | | 1.98 | | | | 1.76 | |
| Ratio of expenses after expense reductions (%)c | | | 1.16 | | | | 1.06 | | | | 1.15 | | | | 1.24 | | | | 1.22 | |
| Ratio of net investment income (%) | | | 1.31 | | | | .92 | | | | .12 | | | | .17 | | | | .40 | |
| Portfolio turnover rate (%) | | | 16 | | | | 38 | | | | 62 | | | | 70 | | | | 64 | |
| a | Based on average shares outstanding during the period. |
| b | Total return would have been lower had certain expenses not been reduced. |
| c | Expense ratio does not reflect charges and fees associated with the separate account that invests in the Fund or any variable life insurance policy or variable annuity contract for which the Fund is an investment option. |
The accompanying notes are an integral part of the financial statements.
| | | | | | |
| | 12 | | | | | | Deutsche DWS Variable Series II — DWS International Growth VIP |
| | |
| Notes to Financial Statements | | |
A. Organization and Significant Accounting Policies
DWS International Growth VIP (the “Fund”) is a diversified series of Deutsche DWS Variable Series II (the “Trust”), which is registered under the Investment Company Act of 1940, as amended (the “1940 Act”), as anopen-end management investment company organized as a Massachusetts business trust.
Multiple Classes of Shares of Beneficial Interest. The Fund offers two classes of shares (Class A shares and Class B shares). Sales of Class B shares are subject to recordkeeping fees up to 0.15% and Rule12b-1 fees under the 1940 Act equal to an annual rate of 0.25% of the average daily net assets for Class B shares of the Fund. Class A shares are not subject to such fees.
Investment income, realized and unrealized gains and losses, and certainfund-level expenses and expense reductions, if any, are borne pro rata on the basis of relative net assets by the holders of all classes of shares except that each class bears certain expenses unique to that class (including the applicable Rule12b-1 fee and recordkeeping fees). Differences inclass-level expenses may result in payment of different per share dividends by class. All shares have equal rights with respect to voting subject toclass-specific arrangements.
The Fund’s financial statements are prepared in accordance with accounting principles generally accepted in the United States of America (“U.S. GAAP”) which require the use of management estimates. Actual results could differ from those estimates. The Fund qualifies as an investment company under Topic 946 of Accounting Standards Codification of U.S. GAAP. The policies described below are followed consistently by the Fund in the preparation of its financial statements.
Security Valuation. Investments are stated at value determined as of the close of regular trading on the New York Stock Exchange on each day the exchange is open for trading.
Various inputs are used in determining the value of the Fund’s investments. These inputs are summarized in three broad levels. Level 1 includes quoted prices in active markets for identical securities. Level 2 includes other significant observable inputs (including quoted prices for similar securities, interest rates, prepayment speeds and credit risk). Level 3 includes significant unobservable inputs (including the Fund’s own assumptions in determining the fair value of investments). The level assigned to the securities valuations may not be an indication of the risk or liquidity associated with investing in those securities.
Equity securities and Exchange-Traded Funds (“ETFs”) are valued at the most recent sale price or official closing price reported on the exchange (U.S. or foreign) orover-the-counter market on which they trade. Equity securities or ETFs for which no sales are reported are valued at the calculated mean between the most recent bid and asked quotations on the relevant market or, if a mean cannot be determined, at the most recent bid quotation. Equity securities and ETFs are generally categorized as Level 1. For certain international equity securities, in order to adjust for events which may occur between the close of the foreign exchanges and the close of the New York Stock Exchange, a fair valuation model may be used. This fair valuation model takes into account comparisons to the valuation of American Depository Receipts (ADRs),exchange-traded funds, futures contracts and certain indices and these securities are categorized as Level 2.
Investments inopen-end investment companies are valued at their net asset value each business day and are categorized as Level 1.
Securities and other assets for which market quotations are not readily available or for which the above valuation procedures are deemed not to reflect fair value are valued in a manner that is intended to reflect their fair value as determined in accordance with procedures approved by the Board and are generally categorized as Level 3. In accordance with the Fund’s valuation procedures, factors considered in determining value may include, but are not limited to, the type of the security; the size of the holding; the initial cost of the security; the existence of any contractual restrictions on the security’s disposition; the price and extent of public trading in similar securities of the issuer or of comparable companies; quotations or evaluated prices frombroker-dealers and/or pricing services; information obtained from the issuer, analysts, and/or the appropriate stock exchange (forexchange-traded securities); an analysis of the company’s or issuer’s financial statements; an evaluation of the forces that influence the issuer and the market(s) in which the security is purchased and sold; and with respect to debt securities, the maturity, coupon, creditworthiness, currency denomination and the movement of the market in which the security is normally traded. The value determined under these procedures may differ from published values for the same securities.
Disclosure about the classification of fair value measurements is included in a table following the Fund’s Investment Portfolio.
| | | | |
Deutsche DWS Variable Series II — DWS International Growth VIP | | | | | 13 |
Foreign Currency Translations. The books and records of the Fund are maintained in U.S. dollars. Investment securities and other assets and liabilities denominated in a foreign currency are translated into U.S. dollars at the prevailing exchange rates at period end. Purchases and sales of investment securities, income and expenses are translated into U.S. dollars at the prevailing exchange rates on the respective dates of the transactions.
Net realized and unrealized gains and losses on foreign currency transactions represent net gains and losses between trade and settlement dates on securities transactions, the acquisition and disposition of foreign currencies, and the difference between the amount of net investment income accrued and the U.S. dollar amount actually received. The portion of both realized and unrealized gains and losses on investments that results from fluctuations in foreign currency exchange rates is not separately disclosed but is included with net realized and unrealized gain/appreciation and loss/depreciation on investments.
Securities Lending. Brown Brothers Harriman & Co., as lending agent, lends securities of the Fund to certain financial institutions under the terms of its securities lending agreement. During the term of the loans, the Fund continues to receive interest and dividends generated by the securities and to participate in any changes in their market value. The Fund requires the borrowers of the securities to maintain collateral with the Fund consisting of either cash and/or U.S. Treasury Securities having a value at least equal to the value of the securities loaned. When the collateral falls below specified amounts, the lending agent will use its best effort to obtain additional collateral on the next business day to meet required amounts under the securities lending agreement. During the year ended December 31, 2019, the Fund invested the cash collateral into a joint trading account in DWS Government & Agency Securities Portfolio, an affiliated money market fund managed by DWS Investment Management Americas, Inc. DWS Investment Management Americas, Inc. receives a management/administration fee (0.12% annualized effective rate as of December 31, 2019) on the cash collateral invested in DWS Government & Agency Securities Portfolio. The Fund receives compensation for lending its securities either in the form of fees or by earning interest on invested cash collateral net of borrower rebates and fees paid to a lending agent. Either the Fund or the borrower may terminate the loan at any time, and the borrower, after notice, is required to return borrowed securities within a standard time period. There may be risks of delay and costs in recovery of securities or even loss of rights in the collateral should the borrower of the securities fail financially. If the Fund is not able to recover securities lent, the Fund may sell the collateral and purchase a replacement investment in the market, incurring the risk that the value of the replacement security is greater than the value of the collateral. The Fund is also subject to all investment risks associated with the reinvestment of any cash collateral received, including, but not limited to, interest rate, credit and liquidity risk associated with such investments.
As of December 31, 2019, the Fund had securities on loan, which were classified as common stocks in the Investment Portfolio. The value of the related collateral exceeded the value of the securities loaned at period end. As of period end, the remaining contractual maturity of the collateral agreements was overnight and continuous.
Taxes. The Fund’s policy is to comply with the requirements of the Internal Revenue Code, as amended, which are applicable to regulated investment companies and to distribute all of its taxable income to its shareholders.
Additionally, the Fund may be subject to taxes imposed by the governments of countries in which it invests and are generally based on income and/or capital gains earned or repatriated, a portion of which may be recoverable. Based upon the current interpretation of the tax rules and regulations, estimated tax liabilities and recoveries on certain foreign securities are recorded on an accrual basis and are reflected as components of interest income or net change in unrealized gain/loss on investments. Tax liabilities realized as a result of security sales are reflected as a component of net realized gain/loss on investments.
At December 31, 2019, the Fund had a net tax basis capital loss carryforward of approximately $30,000 of long-term losses, which may be applied against realized net taxable capital gains indefinitely.
The Fund has reviewed the tax positions for the open tax years as of December 31, 2019 and has determined that no provision for income tax and/or uncertain tax positions is required in the Fund’s financial statements. The Fund’s federal tax returns for the prior three fiscal years remain open subject to examination by the Internal Revenue Service.
Distribution of Income and Gains. Distributions from net investment income of the Fund, if any, are declared and distributed to shareholders annually. Net realized gains from investment transactions, in excess of available capital loss carryforwards, would be taxable to the Fund if not distributed and, therefore, will be distributed to shareholders at least annually. The Fund may also make additional distributions for tax purposes if necessary.
The timing and characterization of certain income and capital gain distributions are determined annually in accordance with federal tax regulations which may differ from accounting principles generally accepted in the
| | | | | | |
| | 14 | | | | | | Deutsche DWS Variable Series II — DWS International Growth VIP |
United States of America. These differences primarily relate to investments in foreign denominated investments and certain securities sold at a loss. As a result, net investment income (loss) and net realized gain (loss) on investment transactions for a reporting period may differ significantly from distributions during such period. Accordingly, the Fund may periodically make reclassifications among certain of its capital accounts without impacting the net asset value of the Fund.
At December 31, 2019, the Fund’s components of distributable earnings on a tax basis were as follows:
| | | | |
| Undistributed ordinary income* | | $ | 246,272 | |
| Capital loss carryforward | | $ | (30,000 | ) |
| Net unrealized appreciation (depreciation) on investments | | $ | 4,226,416 | |
At December 31, 2019, the aggregate cost of investments for federal income tax purposes was $13,667,657. The net unrealized appreciation for all investments based on tax cost was $4,226,416. This consisted of aggregate gross unrealized appreciation for all investments in which there was an excess of value over tax cost of $4,878,811 aggregate gross unrealized depreciation for all investments in which was an excess of tax cost over value of $652,395.
In addition, the tax character of distributions paid by the Fund is summarized as follows:
| | | | | | | | |
| | | Years Ended December 31, | |
| | | 2019 | | | 2018 | |
| Distributions from ordinary income* | | $ | 213,752 | | | $ | 171,568 | |
| Distributions from long-term capital gains | | $ | 234,678 | | | $ | — | |
| * | For tax purposes, short-term capital gain distributions are considered ordinary income distributions. |
Expenses. Expenses of the Trust arising in connection with a specific fund are allocated to that fund. Other Trust expenses which cannot be directly attributed to a fund are apportioned among the funds in the Trust based upon the relative net assets or other appropriate measures.
Contingencies. In the normal course of business, the Fund may enter into contracts with service providers that contain general indemnification clauses. The Fund’s maximum exposure under these arrangements is unknown, as this would involve future claims that may be made against the Fund that have not yet been made. However, based on experience, the Fund expects the risk of loss to be remote.
Other. Investment transactions are accounted for on a trade date plus one basis for daily net asset value calculations. However, for financial reporting purposes, investment transactions are reported on trade date. Interest income is recorded on the accrual basis. Dividend income is recorded on theex-dividend date net of foreign withholding taxes. Realized gains and losses from investment transactions are recorded on an identified cost basis. Proceeds from litigation payments, if any, are included in net realized gain (loss) from investments.
B. Purchases and Sales of Securities
During the year ended December 31, 2019, purchases and sales of investment transactions (excludingshort-term investments) aggregated $2,478,337 and $3,164,488, respectively.
C. Related Parties
Management Agreement. Under the Investment Management Agreement with DWS Investment Management Americas, Inc. (“DIMA” or the “Advisor”), an indirect, wholly owned subsidiary of DWS Group GmbH & Co. KGaA (“DWS Group”), the Advisor directs the investments of the Fund in accordance with its investment objectives, policies and restrictions. The Advisor determines the securities, instruments and other contracts relating to investments to be purchased, sold or entered into by the Fund.
Pursuant to the Investment Management Agreement with the Advisor, the Fund pays the Advisor an annual fee based on its average daily net assets, computed and accrued daily and payable monthly at the annual rate (exclusive of any applicable waivers/reimbursements) of 0.62%.
For the period from January 1, 2019 through April 30, 2019, the Advisor had contractually agreed to waive its fees and/or reimburse certain operating expenses to the extent necessary to maintain the total annual operating expenses (excluding certain expenses such as extraordinary expenses, taxes, brokerage and interest expense) of each class as follows:
| | | | |
| Class A | | | .81 | % |
| Class B | | | 1.06 | % |
| | | | |
Deutsche DWS Variable Series II — DWS International Growth VIP | | | | | 15 |
For the period from May 1, 2019 through September 30, 2019, the Advisor had contractually agreed to waive its fees and/or reimburse certain operating expenses to the extent necessary to maintain the total annual operating expenses (excluding certain expenses such as extraordinary expenses, taxes, brokerage and interest expense) of each class as follows:
| | | | |
| Class A | | | .89 | % |
| Class B | | | 1.21 | % |
Effective October 1, 2019 through September 30, 2020, the Advisor has contractually agreed to waive its fees and/or reimburse certain operating expenses to the extent necessary to maintain the total annual operating expenses (excluding certain expenses such as extraordinary expenses, taxes, brokerage and interest expense) of each class as follows:
| | | | |
| Class A | | | .87 | % |
| Class B | | | 1.19 | % |
For the year ended December 31, 2019, fees waived and/or expenses reimbursed for each class are as follows:
| | | | |
| Class A | | $ | 125,158 | |
| Class B | | | 1,057 | |
| | | $ | 126,215 | |
Administration Fee. Pursuant to an Administrative Services Agreement, DIMA provides most administrative services to the Fund. For all services provided under the Administrative Services Agreement, the Fund pays DIMA an annual fee (“Administration Fee”) of 0.10% of the Fund’s average daily net assets, computed and accrued daily and payable monthly. For the year ended December 31, 2019, the Administration Fee was $16,248, of which $1,485 is unpaid.
Service Provider Fees. DWS Service Company (“DSC”), an affiliate of the Advisor, is the transfer agent,dividend-paying agent and shareholder service agent for the Fund. Pursuant to asub-transfer agency agreement between DSC and DST Systems, Inc. (“DST”), DSC has delegated certain transfer agent,dividend-paying agent and shareholder service agent functions to DST. DSC compensates DST out of the shareholder servicing fee it receives from the Fund. For the year ended December 31, 2019, the amounts charged to the Fund by DSC were as follows:
| | | | | | | | |
| Services to Shareholders | | Total
Aggregated | | | Unpaid at
December 31, 2019 | |
| Class A | | $ | 214 | | | $ | 35 | |
| Class B | | | 53 | | | | 9 | |
| | | $ | 267 | | | $ | 44 | |
Distribution Service Agreement. Under the Fund’s Class B12b-1 plan, DWS Distributors, Inc. (“DDI”) received a fee (“Distribution Service Fee”) of 0.25% of average daily net assets of Class B shares. For the year ended December 31, 2019, the Distribution Service Fee aggregated $334, of which $33 is unpaid.
Typesetting and Filing Service Fees. Under an agreement with the Fund, DIMA is compensated for providing certainpre-press and regulatory filing services to the Fund. For the year ended December 31, 2019, the amount charged to the Fund by DIMA included in the Statement of Operations under “Reports to shareholders” aggregated $8,891, of which $3,563 is unpaid.
Trustees’ Fees and Expenses. The Fund paid retainer fees to each Trustee not affiliated with the Advisor, plus specified amounts to the Board Chairperson and to each committee Chairperson.
Affiliated Cash Management Vehicles. The Fund may invest uninvested cash balances in DWS Central Cash Management Government Fund and DWS ESG Liquidity Fund, affiliated money market funds which are managed by the Advisor. Each affiliated money market fund is managed in accordance with Rule2a-7 under the 1940 Act, which governs the quality, maturity, diversity and liquidity of instruments in which a money market fund may invest. DWS Central Cash Management Government Fund seeks to maintain a stable net asset value, and DWS ESG Liquidity Fund maintains a floating net asset value. The Fund indirectly bears its proportionate share of the expenses of each affiliated money market fund in which it invests. DWS Central Cash Management Government Fund does not pay the Advisor an investment management fee. To the extent that DWS ESG Liquidity Fund pays an investment management fee to the Advisor, the Advisor will waive an
| | | | | | |
| | 16 | | | | | | Deutsche DWS Variable Series II — DWS International Growth VIP |
amount of the investment management fee payable to the Advisor by the Fund equal to the amount of the investment management fee payable on the Fund’s assets invested in DWS ESG Liquidity Fund.
D. Ownership of the Fund
At December 31, 2019, one participating insurance company was owner of record of 10% or more of the total outstanding Class A shares of the Fund, owning 85%. Three participating insurance companies were owners of record of 10% or more of the total outstanding Class B shares of the Fund, owning 47%, 43%, and 10%.
E. Line of Credit
The Fund and other affiliated funds (the “Participants”) share in a $400 million revolving credit facility provided by a syndication of banks. The Fund may borrow for temporary or emergency purposes, including the meeting of redemption requests that otherwise might require the untimely disposition of securities. The Participants are charged an annual commitment fee, which is allocated based on net assets, among each of the Participants. Interest is calculated at a rate per annum equal to the sum of the Federal Funds Rate plus 1.25 percent plus if theone-month LIBOR exceeds the Federal Funds Rate, the amount of such excess. The Fund may borrow up to a maximum of 33 percent of its net assets under the agreement. The Fund had no outstanding loans at December 31, 2019.
| | | | |
Deutsche DWS Variable Series II — DWS International Growth VIP | | | | | 17 |
Report of Independent Registered Public Accounting Firm
To the Board of Trustees of Deutsche DWS Variable Series II and Shareholders of DWS International Growth VIP:
Opinion on the Financial Statements
We have audited the accompanying statement of assets and liabilities of DWS International Growth VIP (the “Fund”) (one of the funds constituting Deutsche DWS Variable Series II) (the “Trust”), including the investment portfolio, as of December 31, 2019, and the related statement of operations for the year then ended, the statements of changes in net assets for each of the two years in the period then ended, the financial highlights for each of the five years in the period then ended and the related notes (collectively referred to as the “financial statements”). In our opinion, the financial statements present fairly, in all material respects, the financial position of the Fund (one of the funds constituting Deutsche DWS Variable Series II) at December 31, 2019, the results of its operations for the year then ended, the changes in its net assets for each of the two years in the period then ended and its financial highlights for each of the five years in the period then ended, in conformity with U.S. generally accepted accounting principles.
Basis for Opinion
These financial statements are the responsibility of the Trust’s management. Our responsibility is to express an opinion on the Fund’s financial statements based on our audit. We are a public accounting firm registered with the Public Company Accounting Oversight Board (United States) (“PCAOB”) and are required to be independent with respect to the Trust in accordance with the U.S. federal securities laws and the applicable rules and regulations of the Securities and Exchange Commission and the PCAOB.
We conducted our audit in accordance with the standards of the PCAOB. Those standards require that we plan and perform the audit to obtain reasonable assurance about whether the financial statements are free of material misstatement, whether due to error or fraud. The Trust is not required to have, nor were we engaged to perform, an audit of the Trust’s internal control over financial reporting. As part of our audit, we are required to obtain an understanding of internal control over financial reporting, but not for the purpose of expressing an opinion on the effectiveness of the Trust’s internal control over financial reporting. Accordingly, we express no such opinion.
Our audits included performing procedures to assess the risks of material misstatement of the financial statements, whether due to error or fraud, and performing procedures that respond to those risks. Such procedures included examining, on a test basis, evidence regarding the amounts and disclosures in the financial statements. Our procedures included confirmation of securities owned as of December 31, 2019, by correspondence with the custodian and others. Our audit also included evaluating the accounting principles used and significant estimates made by management, as well as evaluating the overall presentation of the financial statements. We believe that our audit provides a reasonable basis for our opinion.

We have served as the auditor of one or more investment companies in the DWS family of funds since at least 1979, but we are unable to determine the specific year.
Boston, Massachusetts
February 14, 2020
| | | | | | |
| | 18 | | | | | | Deutsche DWS Variable Series II — DWS International Growth VIP |
| | |
| Information About Your Fund’s Expenses | | (Unaudited) |
As an investor of the Fund, you incur two types of costs: ongoing expenses and transaction costs. Ongoing expenses include management fees, distribution and service(12b-1) fees and other Fund expenses. Examples of transaction costs include contract charges, which are not shown in this section. The following tables are intended to help you understand your ongoing expenses (in dollars) of investing in the Fund and to help you compare these expenses with the ongoing expenses of investing in other mutual funds. In the most recentsix-month period, the Fund limited these expenses; had it not done so, expenses would have been higher. The example in the table is based on an investment of $1,000 invested at the beginning of thesix-month period and held for the entire period (July 1, 2019 to December 31, 2019).
The tables illustrate your Fund’s expenses in two ways:
| – | | Actual Fund Return. This helps you estimate the actual dollar amount of ongoing expenses (but not transaction costs) paid on a $1,000 investment in the Fund using the Fund’s actual return during the period. To estimate the expenses you paid over the period, simply divide your account value by $1,000 (for example, an $8,600 account value divided by $1,000 = 8.6), then multiply the result by the number in the “Expenses Paid per $1,000” line under the share class you hold. |
| – | | Hypothetical 5% Fund Return. This helps you to compare your Fund’s ongoing expenses (but not transaction costs) with those of other mutual funds using the Fund’s actual expense ratio and a hypothetical rate of return of 5% per year before expenses. Examples using a 5% hypothetical Fund return may be found in the shareholder reports of other mutual funds. The hypothetical account values and expenses may not be used to estimate the actual ending account balance or expenses you paid for the period. |
Please note that the expenses shown in these tables are meant to highlight your ongoing expenses only and do not reflect any transaction costs. The “Expenses Paid per $1,000” line of the tables is useful in comparing ongoing expenses only and will not help you determine the relative total expense of owning different funds. If these transaction costs had been included, your costs would have been higher.
| | | | | | | | |
| Expenses and Value of a $1,000 Investment for the six months ended December 31, 2019 | | | | |
| | |
| Actual Fund Return | | | Class A | | | | Class B | |
| Beginning Account Value 7/1/19 | | $ | 1,000.00 | | | $ | 1,000.00 | |
| Ending Account Value 12/31/19 | | $ | 1,071.00 | | | $ | 1,069.30 | |
| Expenses Paid per $1,000* | | $ | 4.59 | | | $ | 6.26 | |
| | |
| Hypothetical 5% Fund Return | | | | | | | | |
| Beginning Account Value 7/1/19 | | $ | 1,000.00 | | | $ | 1,000.00 | |
| Ending Account Value 12/31/19 | | $ | 1,020.77 | | | $ | 1,019.16 | |
| Expenses Paid per $1,000* | | $ | 4.48 | | | $ | 6.11 | |
| * | Expenses are equal to the Fund’s annualized expense ratio for each share class, multiplied by the average account value over the period, multiplied by 184 (the number of days in the most recentsix-month period), then divided by 365. |
| | | | | | | | |
| Annualized Expense Ratios | | Class A | | | Class B | |
| Deutsche DWS Variable Series II — DWS International Growth VIP | | | .88 | % | | | 1.20 | % |
For more information, please refer to the Fund’s prospectus.
These tables do not reflect charges and fees (“contract charges”) associated with the separate account that invests in the Fund or any variable life insurance policy or variable annuity contract for which the Fund is an investment option.
For an analysis of the fees associated with an investment in the Fund or similar funds, please refer to the current and hypothetical expense calculators for Variable Insurance Products which can be found at dws.com/calculators.
| | | | |
Deutsche DWS Variable Series II — DWS International Growth VIP | | | | | 19 |
| | |
Tax Information | | (Unaudited) |
The Fund paid distributions of $0.20 per share from net long-term capital gains during its year ended December 31, 2019.
For corporate shareholders, 4% of the ordinary dividends (i.e., income dividends plus short-term capital gains) paid during the Fund’s fiscal year ended December 31, 2019, qualified for the dividends received deduction.
The Fund paid foreign taxes of $30,998 and earned $252,697 of foreign source income during the year ended December 31, 2019. Pursuant to Section 853 of the Internal Revenue Code, the Fund designates $0.03 per share as foreign taxes paid and $0.21 per share as income earned from foreign sources for the year ended December 31, 2019.
Please consult a tax advisor if you have questions about federal or state income tax laws, or on how to prepare your tax returns. If you have specific questions about your account, please contact your insurance provider.
Proxy Voting
The Trust’s policies and procedures for voting proxies for portfolio securities and information about how the Trust voted proxies related to its portfolio securities during the most recent12-month period ended June 30 are available on our Web site — dws.com/en-us/resources/proxy-voting — or on the SEC’s Web site — sec.gov. To obtain a written copy of the Trust’s policies and procedures without charge, upon request, call us toll free at(800) 728-3337.
| | | | | | |
| | 20 | | | | | | Deutsche DWS Variable Series II — DWS International Growth VIP |
Advisory Agreement Board Considerations and Fee Evaluation
The Board of Trustees (hereinafter referred to as the “Board” or “Trustees”) approved the renewal of DWS International Growth VIP’s (the “Fund”) investment management agreement (the “Agreement”) with DWS Investment Management Americas, Inc. (“DIMA”) in September 2019.
In terms of the process that the Board followed prior to approving the Agreement, shareholders should know that:
| – | | During the entire process, all of the Fund’s Trustees were independent of DIMA and its affiliates (the “Independent Trustees”). |
| – | | The Board met frequently during the past year to discuss fund matters and dedicated a substantial amount of time to contract review matters. Over the course of several months, the Board’s Contract Committee reviewed extensive materials received from DIMA, independent third parties and independent counsel. These materials included an analysis of the Fund’s performance, fees and expenses, and profitability from a fee consultant retained by the Fund’s Independent Trustees (the “Fee Consultant”). Based on its evaluation of the information provided, the Contract Committee presented its findings and recommendations to the Board. The Board then reviewed the Contract Committee’s findings and recommendations. |
| – | | The Board also received extensive information throughout the year regarding performance of the Fund. |
| – | | The Independent Trustees regularly met privately with counsel to discuss contract review and other matters. In addition, the Independent Trustees were advised by the Fee Consultant in the course of their review of the Fund’s contractual arrangements and considered a comprehensive report prepared by the Fee Consultant in connection with their deliberations. |
| – | | In connection with reviewing the Agreement, the Board also reviewed the terms of the Fund’s Rule12b-1 plan, distribution agreement, administrative services agreement, transfer agency agreement and other material service agreements. |
In connection with the contract review process, the Contract Committee and the Board considered the factors discussed below, among others. The Board also considered that DIMA and its predecessors have managed the Fund since its inception, and the Board believes that a long-term relationship with a capable, conscientious advisor is in the best interests of the Fund. The Board considered, generally, that shareholders chose to invest or remain invested in the Fund knowing that DIMA managed the Fund. DIMA is part of DWS Group GmbH & Co. KGaA (“DWS Group”). DWS Group is a global asset management business that offers a wide range of investing expertise and resources, including research capabilities in many countries throughout the world. In 2018, approximately 20% of DWS Group’s shares were sold in an initial public offering, with Deutsche Bank AG owning the remaining shares.
As part of the contract review process, the Board carefully considered the fees and expenses of each DWS fund overseen by the Board in light of the fund’s performance. In many cases, this led to the negotiation and implementation of expense caps. As part of these negotiations, the Board indicated that it would consider relaxing these caps in future years following sustained improvements in performance, among other considerations.
While shareholders may focus primarily on fund performance and fees, the Fund’s Board considers these and many other factors, including the quality and integrity of DIMA’s personnel and administrative support services provided by DIMA, such as back-office operations, fund valuations, and compliance policies and procedures.
Nature, Quality and Extent of Services. The Board considered the terms of the Agreement, including the scope of advisory services provided under the Agreement. The Board noted that, under the Agreement, DIMA provides portfolio management services to the Fund and that, pursuant to a separate administrative services agreement, DIMA provides administrative services to the Fund. The Board considered the experience and skills of senior management and investment personnel and the resources made available to such personnel. The Board reviewed the Fund’s performance over short-term and long-term periods and compared those returns to various agreed-upon performance measures, including market index(es) and a peer universe compiled using information supplied by Morningstar Direct (“Morningstar”), an independent fund data service. The Board also noted that it has put into place a process of identifying “Funds in Review” (e.g., funds performing poorly relative to a peer universe), and receives additional reporting from DIMA regarding such funds and, where appropriate, DIMA’s plans to address underperformance. The Board
| | | | |
Deutsche DWS Variable Series II — DWS International Growth VIP | | | | | 21 |
believes this process is an effective manner of identifying and addressing underperforming funds. Based on the information provided, the Board noted that, for theone-, three- and five-year periods ended December 31, 2018, the Fund’s performance (Class A shares) was in the 4th quartile of the applicable Morningstar universe (the 1st quartile being the best performers and the 4th quartile being the worst performers). The Board also observed that the Fund has outperformed its benchmark in the five-year period and underperformed its benchmark in theone- and three-year periods ended December 31, 2018. The Board noted the disappointing investment performance of the Fund in recent periods and continued to discuss with senior management of DIMA the factors contributing to such underperformance and actions being taken to improve performance. The Board considered that, effective October 3, 2016, the Fund’s investment strategy and certain members of the portfolio management team were changed, and that, effective October 1, 2017, the Fund further changed its investment strategy. The Board observed that the Fund had experienced improved relative performance during the first eight months of 2019. The Board recognized the efforts by DIMA in recent years to enhance its investment platform and improve long-term performance across the DWS fund complex.
Fees and Expenses. The Board considered the Fund’s investment management fee schedule, operating expenses and total expense ratios, and comparative information provided by Broadridge Financial Solutions, Inc. (“Broadridge”) and the Fee Consultant regarding investment management fee rates paid to other investment advisors by similar funds (1st quartile being the most favorable and 4th quartile being the least favorable). With respect to management fees paid to other investment advisors by similar funds, the Board noted that the contractual fee rates paid by the Fund, which include a 0.10% fee paid to DIMA under the Fund’s administrative services agreement, were lower than the median (1st quartile) of the applicable Broadridge peer group (based on Broadridge data provided as of December 31, 2018). The Board noted that, effective October 1, 2017, DIMA agreed to reduce the Fund’s contractual management fee rate to an annual rate of 0.62% in connection with changes to the Fund’s investment strategy. The Board noted that the Fund’s Class A shares total (net) operating expenses were expected to be lower than the median (2nd quartile) of the applicable Broadridge expense universe (based on Broadridge data provided as of December 31, 2018, and analyzing Broadridge expense universe Class A (net) expenses less any applicable12b-1 fees) (“Broadridge Universe Expenses”). The Board also reviewed data comparing each other operational share class’s total (net) operating expenses to the applicable Broadridge Universe Expenses. The Board noted that the expense limitations agreed to by DIMA were expected to help the Fund’s total (net) operating expenses remain competitive. The Board considered the Fund’s management fee rate as compared to fees charged by DIMA to a comparable DWS U.S. registered fund (“DWS Funds”) and considered differences between the Fund and the comparable DWS Fund. The information requested by the Board as part of its review of fees and expenses also included information about institutional accounts (including anysub-advised funds and accounts) and funds offered primarily to European investors (“DWS Europe Funds”) managed by DWS Group. The Board noted that DIMA indicated that DWS Group does not manage any institutional accounts or DWS Europe Funds comparable to the Fund.
On the basis of the information provided, the Board concluded that management fees were reasonable and appropriate in light of the nature, quality and extent of services provided by DIMA.
Profitability. The Board reviewed detailed information regarding revenues received by DIMA under the Agreement. The Board considered the estimated costs to DIMA, andpre-tax profits realized by DIMA, from advising the DWS Funds, as well as estimates of thepre-tax profits attributable to managing the Fund in particular. The Board also received information regarding the estimated enterprise-wide profitability of DIMA and its affiliates with respect to all fund services in totality and by fund. The Board and the Fee Consultant reviewed DIMA’s methodology in allocating its costs to the management of the Fund. Based on the information provided, the Board concluded that thepre-tax profits realized by DIMA in connection with the management of the Fund were not unreasonable. The Board also reviewed certain publicly available information regarding the profitability of certain similar investment management firms. The Board noted that, while information regarding the profitability of such firms is limited (and in some cases is not necessarily prepared on a comparable basis), DIMA and its affiliates’ overall profitability with respect to the DWS Funds (after taking into account distribution and other services provided to the funds by DIMA and its affiliates) was lower than the overall profitability levels of most comparable firms for which such data was available.
Economies of Scale. The Board considered whether there are economies of scale with respect to the management of the Fund and whether the Fund benefits from any economies of scale. In this regard, the Board observed that while the Fund’s current investment management fee schedule does not include breakpoints, the Fund’s fee schedule represents an appropriate sharing between the Fund and DIMA of such economies of scale as may exist in the management of the Fund at current asset levels.
| | | | | | |
| | 22 | | | | | | Deutsche DWS Variable Series II — DWS International Growth VIP |
Other Benefits to DIMA and Its Affiliates. The Board also considered the character and amount of other incidental or“fall-out” benefits received by DIMA and its affiliates, including any fees received by DIMA for administrative services provided to the Fund, any fees received by an affiliate of DIMA for transfer agency services provided to the Fund and any fees received by an affiliate of DIMA for distribution services. The Board also considered benefits to DIMA related to brokerage and soft-dollar allocations, including allocating brokerage to pay for research generated by parties other than the executing broker dealers, which pertain primarily to funds investing in equity securities. In addition, the Board considered the incidental public relations benefits to DIMA related to DWS Funds advertising and cross-selling opportunities among DIMA products and services. The Board considered these benefits in reaching its conclusion that the Fund’s management fees were reasonable.
Compliance. The Board considered the significant attention and resources dedicated by DIMA to its compliance processes in recent years. The Board noted in particular (i) the experience, seniority and time commitment of the individuals serving as DIMA’s and the Fund’s chief compliance officers and (ii) the substantial commitment of resources by DIMA and its affiliates to compliance matters, including the retention of compliance personnel.
Based on all of the information considered and the conclusions reached, the Board determined that the continuation of the Agreement is in the best interests of the Fund. In making this determination, the Board did not give particular weight to any single factor identified above. The Board considered these factors over the course of numerous meetings, certain of which were in executive session with only the Independent Trustees and counsel present. It is possible that individual Independent Trustees may have weighed these factors differently in reaching their individual decisions to approve the continuation of the Agreement.
| | | | |
Deutsche DWS Variable Series II — DWS International Growth VIP | | | | | 23 |
Board Members and Officers
The following table presents certain information regarding the Board Members and Officers of the Trust/Corporation. Each Board Member’s year of birth is set forth in parentheses after his or her name. Unless otherwise noted, (i) each Board Member has engaged in the principal occupation(s) noted in the table for at least the most recent five years, although not necessarily in the same capacity; and (ii) the address of each Independent Board Member is Keith R. Fox, DWS Funds Board Chair, c/o Thomas R. Hiller, Ropes & Gray LLP, Prudential Tower, 800 Boylston Street, Boston, MA02199-3600. Except as otherwise noted below, the term of office for each Board Member is until the election and qualification of a successor, or until such Board Member sooner dies, resigns, is removed or as otherwise provided in the governing documents of the Trust/Corporation. Because the Fund does not hold an annual meeting of shareholders, each Board Member will hold office for an indeterminate period.
The Board Members may also serve in similar capacities with other funds in the fund complex. The number of funds in DWS fund complex shown in the table below includes all registered open- and closed-end funds (including all of their portfolios) advised by the Advisor and any registered funds that have an investment advisor that is an affiliated person of the Advisor.
| | | | | | | | |
| Independent Board Members | | | | | |
Name, Year of Birth,
Position with the Trust/
Corporation and
Length of Time Served1 | | Business Experience and Directorships During the Past Five Years | | Number of
Funds in
DWS Fund
Complex
Overseen | | | Other
Directorships
Held by Board
Member
|
Keith R. Fox, CFA (1954) Chairperson since 2017, and Board Member since 1996 | | Managing General Partner, Exeter Capital Partners (a series of private investment funds) (since 1986). Directorships: ICI Mutual Insurance Company; Progressive International Corporation (kitchen goods importer and distributor); former Chairman, National Association of Small Business Investment Companies; former Directorships: The Kennel Shop (retailer); BoxTop Media Inc. (advertising); Sun Capital Advisers Trust (mutual funds) (2011–2012) | | | 77 | | | — |
John W. Ballantine (1946) Board Member since 1999 | | Retired; formerly, Executive Vice President and Chief Risk Management Officer, First Chicago NBD Corporation/The First National Bank of Chicago (1996–1998); Executive Vice President and Head of International Banking (1995–1996); former Directorships: Director and Chairman of the Board, Healthways, Inc.2 (population well-being and wellness services) (2003–2014); Stockwell Capital Investments PLC (private equity); Enron Corporation; FNB Corporation; Tokheim Corporation; First Oak Brook Bancshares, Inc.; Oak Brook Bank; and Prisma Energy International. Not-for-Profit Director/Trustee: Palm Beach Civic Association; Window to the World Communications (public media); Life Director of Harris Theater for Music and Dance (Chicago); Life Director of Hubbard Street Dance Chicago; former Not-for-Profit Directorships: Public Radio International | | | 77 | | | Portland
General
Electric2
(utility
company)
(2003–
present) |
Dawn-Marie Driscoll (1946) Board Member since 1987 | | Emeritus Executive Fellow, Center for Business Ethics, Bentley University; formerly: Partner, Palmer & Dodge (law firm) (1988–1990); Vice President of Corporate Affairs and General Counsel, Filene’s (retail) (1978–1988). Directorships: Advisory Board, Center for Business Ethics, Bentley University; Trustee and former Chairman of the Board, Southwest Florida Community Foundation (charitable organization); former Directorships: ICI Mutual Insurance Company (2007–2015); Sun Capital Advisers Trust (mutual funds) (2007–2012), Investment Company Institute (audit, executive, nominating committees) and Independent Directors Council (governance, executive committees) | | | 77 | | | — |
Richard J. Herring (1946) Board Member since 1990 | | Jacob Safra Professor of International Banking and Professor of Finance, The Wharton School, University of Pennsylvania (since July 1972); Director, The Wharton Financial Institutions Center (since 1994); formerly: Vice Dean and Director, Wharton Undergraduate Division (1995–2000) and Director, The Lauder Institute of International Management Studies (2000–2006); Member FDIC Systemic Risk Advisory Committee since 2011, member Systemic Risk Council since 2012 and member of the Advisory Board at the Yale Program on Financial Stability since 2013; Formerly Co-Chair of the Shadow Financial Regulatory Committee (2003–2015), Executive Director of The Financial Economists Roundtable (2008–2015), Director of The Thai Capital Fund (2007–2013), Director of The Aberdeen Singapore Fund (2007–2018), and Nonexecutive Director of Barclays Bank DE (2010–2018) | | | 77 | | | Director,
Aberdeen
Japan Fund
(since 2007) |
| | | | | | |
| | 24 | | | | | | Deutsche DWS Variable Series II — DWS International Growth VIP |
| | | | | | | | |
Name, Year of Birth,
Position with the Trust/
Corporation and
Length of Time Served1 | | Business Experience and Directorships During the Past Five Years | | Number of
Funds in
DWS Fund
Complex
Overseen | | | Other
Directorships
Held by Board
Member
|
William McClayton (1944) Board Member since 2004 | | Private equity investor (since October 2009); previously, Managing Director, Diamond Management & Technology Consultants, Inc. (global consulting firm) (2001–2009); Directorship: Board of Managers, YMCA of Metropolitan Chicago; formerly: Senior Partner, Arthur Andersen LLP (accounting) (1966–2001); Trustee, Ravinia Festival | | | 77 | | | — |
Rebecca W. Rimel (1951) Board Member since 1995 | | President, Chief Executive Officer and Director, The Pew Charitable Trusts (charitable organization) (1994–present); formerly: Executive Vice President, The Glenmede Trust Company (investment trust and wealth management) (1983–2004); Board Member, Investor Education (charitable organization) (2004–2005); Trustee, Executive Committee, Philadelphia Chamber of Commerce (2001–2007); Director, Viasys Health Care2 (January 2007–June 2007); Trustee, Thomas Jefferson Foundation (charitable organization) (1994–2012) | | | 77 | | | Director,
Becton
Dickinson
and
Company2
(medical
technology
company)
(2012–
present);
Director,
BioTelemetry
Inc.2(health
care) (2009–
present) |
William N. Searcy, Jr. (1946) Board Member since 1993 | | Private investor since October 2003; formerly: Pension & Savings Trust Officer, Sprint Corporation2(telecommunications) (November 1989–September 2003); Trustee, Sun Capital Advisers Trust (mutual funds) (1998–2012) | | | 77 | | | — |
| | |
| Officers4 | | |
Name, Year of Birth,
Position with the Trust/
Corporation and
Length of Time Served5 | | Business Experience and Directorships During the Past Five Years |
Hepsen Uzcan6(1974) President and Chief Executive Officer, 2017–present | | Managing Director,3 DWS; Secretary, DWS USA Corporation (2018–present); Assistant Secretary, DWS Distributors, Inc. (2018–present); Director and Vice President, DWS Service Company (2018–present); Assistant Secretary, DWS Investment Management Americas, Inc. (2018–present); and Director and President, DB Investment Managers, Inc. (2018–present); formerly: Vice President for the Deutsche funds (2016–2017); Assistant Secretary for the DWS funds (2013–2019) |
John Millette7(1962) Vice President and Secretary, 1999–present | | Director,3DWS; Chief Legal Officer, DWS Investment Management Americas, Inc. (2015–present); Director and Vice President, DWS Trust Company (2016–present); and Assistant Secretary, DBX ETF Trust (2019–present); formerly: Secretary, Deutsche Investment Management Americas Inc. (2015–2017) |
Diane Kenneally7(1966) Chief Financial Officer and Treasurer, 2018–present | | Director,3 DWS; and Treasurer, Chief Financial Officer and Controller, DBX ETF Trust (2019–present); formerly: Assistant Treasurer for the DWS funds (2007–2018) |
Paul Antosca7(1957) Assistant Treasurer, 2007–present | | Director,3DWS; and Assistant Treasurer, DBX ETF Trust (2019–present) |
Sheila Cadogan7(1966) Assistant Treasurer, 2017–present | | Director,3DWS; Director and Vice President, DWS Trust Company (2018–present); and Assistant Treasurer, DBX ETF Trust (2019–present) |
Scott D. Hogan7(1970) Chief Compliance Officer, 2016–present | | Director,3DWS |
Caroline Pearson7(1962) Chief Legal Officer, 2010–present | | Managing Director,3DWS; formerly: Secretary, Deutsche AM Distributors, Inc. (2002–2017); and Secretary, Deutsche AM Service Company (2010–2017) |
Wayne Salit6(1967) Anti-Money Laundering Compliance Officer, 2014–present | | Director,3 Deutsche Bank; and AML Officer, DWS Trust Company; formerly: Managing Director, AML Compliance Officer at BNY Mellon (2011–2014); and Director, AML Compliance Officer at Deutsche Bank (2004–2011) |
Ciara Crawford8 (1984) Assistant Secretary, (2019–present) | | Associate, DWS (since 2015); previously, Legal Assistant at Accelerated Tax Solutions. |
| | | | |
Deutsche DWS Variable Series II — DWS International Growth VIP | | | | | 25 |
| 1 | The length of time served represents the year in which the Board Member joined the board of one or more DWS funds currently overseen by the Board. |
| 2 | A publicly held company with securities registered pursuant to Section 12 of the Securities Exchange Act of 1934. |
| 3 | Executive title, not a board directorship. |
| 4 | As a result of their respective positions held with the Advisor or its affiliates, these individuals are considered “interested persons” of the Advisor within the meaning of the 1940 Act. Interested persons receive no compensation from the Fund. |
| 5 | The length of time served represents the year in which the officer was first elected in such capacity for one or more DWS funds. |
| 6 | Address: 875 Third Avenue, New York, NY 10022. |
| 7 | Address: One International Place, Boston, MA 02110. |
| 8 | Address: 5022 Gate Parkway, Suite 400, Jacksonville, FL 32256. |
The Fund’s Statement of Additional Information (“SAI”) includes additional information about the Board Members. The SAI is available, without charge, upon request. If you would like to request a copy of the SAI, you may do so by calling the followingtoll-free number:(800) 728-3337.
| | | | | | |
| | 26 | | | | | | Deutsche DWS Variable Series II — DWS International Growth VIP |
Notes
| | |
| | |
VS2IG-2 (R-025830-10 2/20) | | |
December 31, 2019
Annual Report
Deutsche DWS Variable Series II
DWS Multisector Income VIP
Beginning on January 1, 2021, as permitted by regulations adopted by the Securities and Exchange Commission, you may not be receiving paper copies of the Fund’s shareholder reports from the insurance company that offers your contract unless you specifically request paper copies from your insurance company or from your financial intermediary. Instead, the shareholder reports will be made available on a Web site, and your insurance company will notify you by mail each time a report is posted and provide you with a Web site link to access the report. Instructions for requesting paper copies will be provided by your insurance company.
If you already elected to receive shareholder reports electronically, you will not be affected by this change and you need not take any action. You may elect to receive shareholder reports and other communications from your insurance company electronically by following the instructions provided by your insurance company.
You may elect to receive all future reports in paper free of charge from your insurance company. If your insurance company informs you that future reports will be delivered via Web access, you can inform your insurance company that you wish to continue receiving paper copies of your shareholder reports by following the instructions provided by your insurance company.

Contents
This report must be preceded or accompanied by a prospectus. To obtain an additional prospectus or summary prospectus, if available, call (800)728-3337 or your financial representative. We advise you to consider the Fund’s objectives, risks, charges and expenses carefully before investing. The summary prospectus and prospectus contain this and other important information about the Fund. Please read the prospectus carefully before you invest.
Bond investments are subject tointerest-rate, credit, liquidity and market risks to varying degrees. When interest rates rise, bond prices generally fall. Credit risk refers to the ability of an issuer to make timely payments of principal and interest. Investments inlower-quality (“junk bonds”) andnon-rated securities present greater risk of loss than investments inhigher-quality securities. Investing in foreign securities, particularly those of emerging markets, presents certain risks, such as currency fluctuations, political and economic changes, and market risks. Emerging markets tend to be more volatile and less liquid than the markets of more mature economies, and generally have less diverse and less mature economic structures and less stable political systems than those of developed countries. Investing in derivatives entails special risks relating to liquidity, leverage and credit that may reduce returns and/or increase volatility. The Fund may lend securities to approved institutions. See the prospectus for details.
The brand DWS represents DWS Group GmbH & Co. KGaA and any of its subsidiaries such as DWS Distributors, Inc. which offers investment products or DWS Investment Management Americas, Inc. and RREEF America L.L.C. which offer advisory services.
DWS Distributors, Inc., 222 South Riverside Plaza, Chicago, IL 60606, (800)621-1148
NOT FDIC/NCUA INSURED NO BANK GUARANTEE MAY LOSE VALUE NOT A DEPOSIT NOT INSURED BY ANY FEDERAL GOVERNMENT AGENCY
| | | | | | |
| | 2 | | | | | | Deutsche DWS Variable Series II — DWS Multisector Income VIP |
| | |
| Performance Summary | | December 31, 2019 (Unaudited) |
Fund performance shown is historical, assumes reinvestment of all dividend and capital gain distributions and does not guarantee future results. Investment return and principal value fluctuate with changing market conditions so that, when redeemed, shares may be worth more or less than their original cost. Current performance may be lower or higher than the performance data quoted. Please contact your participating insurance company for the Fund’s most recentmonth-end performance. Performance does not reflect charges and fees (“contract charges”) associated with the separate account that invests in the Fund or any variable life insurance policy or variable annuity contract for which the Fund is an investment option. These charges and fees will reduce returns.
The gross expense ratio of the Fund, as stated in the fee table of the prospectus dated May 1, 2019 is 2.19% for Class A shares and may differ from the expense ratio disclosed in the Financial Highlights table in this report.
Generally accepted accounting principles require adjustments to be made to the net assets of the Fund at period end for financial reporting purposes only, and as such, the total return based on the unadjusted net asset value per share may differ from the total return reported in the financial highlights.
Growth of an Assumed $10,000 Investment
| | |
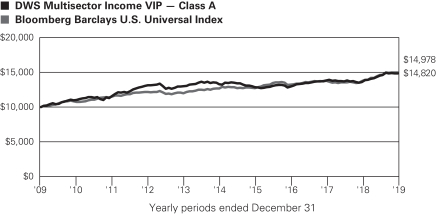
| | The unmanaged Bloomberg Barclays U.S. Universal Index represents the union of the U.S. Aggregate Index, the U.S.High-Yield Corporate Index, the 144A Index, the Eurodollar Index, the Emerging Markets Index and thenon-ERISA portion of the CMBS Index. Index returns do not reflect any fees or expenses and it is not possible to invest directly into an index. |
| | | | | | | | | | |
| Comparative Results | | | | | | | | | | |
| | | | | |
| DWS Multisector Income VIP | | | | 1-Year | | 3-Year | | 5-Year | | 10-Year |
| Class A | | Growth of $10,000 | | $10,922 | | $11,470 | | $11,179 | | $14,820 |
| | | Average annual total return | | 9.22% | | 4.68% | | 2.25% | | 4.01% |
| Bloomberg Barclays U.S. Universal Index | | Growth of $10,000 | | $10,929 | | $11,347 | | $11,842 | | $14,978 |
| | Average annual total return | | 9.29% | | 4.30% | | 3.44% | | 4.12% |
The growth of $10,000 is cumulative.
| | | | |
Deutsche DWS Variable Series II — DWS Multisector Income VIP | | | | | 3 |
| | |
| Management Summary | | December 31, 2019 (Unaudited) |
The Class A shares of the Fund returned 9.22% (unadjusted for contract charges) in the 12-month period ended December 31, 2019, slightly below the 9.29% gain of the Bloomberg Barclays U.S. Universal Index.
The world bond markets generated strong, broad-based returns in 2019. The U.S. Federal Reserve (Fed), after raising interest rates nine times in the 2015-2018 interval, moved to a more accommodative posture in the past year. In addition to enacting three quarter-point rate cuts, the Fed injected daily liquidity into the financial system frommid-September onward. In combination with the backdrop of low inflation and slow global growth, the shift in Fed policy fueled a rally in U.S. Treasuries and other rate-sensitive areas of the bond market. Investment-grade corporates, which benefited from steady corporate profit growth and investors’ thirst for yield, outperformed government issues. High-yield bonds and emerging-markets debt, which were boosted by robust investor sentiment and elevated demand for higher-risk assets, posted double-digit gains and outpaced investment-grade bonds.
Several aspects of the Fund’s positioning contributed to its strong relative performance in 2019. First, our decision to maintain a lower-quality tilt to the portfolio through the first nine months of the year helped the Fund capitalize on the“risk-on” market. This aspect of our positioning included overweight in high-yield and emerging-market bonds, as well as an underweight in U.S. Treasuries. The Fund’s performance was further aided by our preference for higher-yielding, lower-quality securities within each of the major categories. In the investment-grade corporate space, for instance, we emphasized BBB rated debt (the lowest credit tier in the category). Additionally, the Fund’s allocation to the emerging markets favored higher-yielding countries in the Middle East and Africa. Both regions outperformed the broader category by a wide margin in 2019, and the portfolio was well positioned to capitalize on this trend.
Our duration positioning was an additional contributor of note. The Fund’s duration (interest-rate sensitivity) was above that of the benchmark untilmid-way through the third quarter, augmenting the effect of falling yields.
Few aspects of the Fund’s positioning stood out as meaningful detractors. We lost some ground from foreign-currency positioning and an underweight in investment-grade corporate issues, as well as from a position in Mexico in the emerging-market portfolio.
We used derivatives to shift the Fund’s weightings in specific asset classes, adjust foreign-currency exposure, and manage duration. In the aggregate, our use of derivatives was a small net contributor. Derivatives are used to achieve the Fund’s risk and return objectives and should therefore be evaluated within the context of the entire portfolio rather than as a standalone strategy.
We began to reposition the portfolio in the autumn, with a focus on reducing overall risk exposure. While an emphasis on lower-quality issues served the Fund well through the first half of the year and into the third quarter, we believed the rally had made the credit sectors more vulnerable to issues such as trade policy, geopolitical uncertainty, and instability in the repurchase agreement market. We therefore sought tode-risk the portfolio by decreasing its weightings in high-yield bonds and lower-rated emerging-markets debt. In turn, we redeployed the proceeds into higher-quality investment-grade corporates and U.S. Treasuries. We also moved duration more closely in line with the benchmark, as we saw little additional benefit to maintaining a long duration with the10-year U.S. Treasury yield having fallen below 1.5% in late August. Although these moves caused the Fund to miss some of the continued rally in risk assets in the fourth quarter, we believed they were appropriate given the combination of lower total return potential and rising risks.
The Fund is scheduled to liquidate on or about February 27, 2020.
Thomas M. Farina, CFA, Managing Director
Kelly L. Beam, CFA, Director
Portfolio Managers
The views expressed reflect those of the portfolio management team only through the end of the period of the report as stated on the cover. The management team’s views are subject to change at any time based on market and other conditions and should not be construed as a recommendation. Past performance is no guarantee of future results. Current and future portfolio holdings are subject to risk.
| | | | | | |
| | 4 | | | | | | Deutsche DWS Variable Series II — DWS Multisector Income VIP |
Terms to Know
Bloomberg Barclays U.S. Universal Index represents the union of the U.S. Aggregate Index, the U.S. High-Yield Corporate Index, the 144A Index, the Eurodollar Index, the Emerging Markets Index and the non-ERISA portion of the CMBS Index.
Contribution anddetraction incorporate both a stock’s total return and its weighting in the index.
Credit quality is the ability of an issuer of fixed-income securities to repay interest and principal in a timely manner. Credit quality is measured using credit ratings, i.e., assessments of the creditworthiness of a borrower such as a corporation, a municipality or a sovereign country by a credit ratings agency. Letter grades of “BBB” and above indicate that the rated borrower is considered “investment grade” by a particular ratings agency.
Overweight means the fund holds a higher weighting in a given sector or security than the benchmark.Underweightmeans the fund holds a lower weighting.
Duration, which is expressed in years, measures the sensitivity of the price of a bond or bond fund to a change in interest rates.
Derivativesare contracts whose values can be based on a variety of instruments, including indices, currencies or securities. They can be utilized for a variety of reasons, including for hedging purposes, for risk management; fornon-hedging purposes to seek to enhance potential gains, or as a substitute for direct investment in a particular asset class or to keep cash on hand to meet shareholder redemptions. Investing in derivatives entails special risks relating to liquidity, leverage and credit that may reduce returns and/or increase volatility.
Repurchase Agreements (Repos) are an agreement between a seller and a buyer, usually of government securities, where the seller agrees to repurchase the securities at a given price and usually at a stated time. Repos are widely used money market instruments that serve as an interest-bearing, short-term “parking places” for large sums of money.
| | | | |
Deutsche DWS Variable Series II — DWS Multisector Income VIP | | | | | 5 |
| | | | |
| Portfolio Summary | | (Unaudited) | | |
| | | | | | | | |
| Asset Allocation (As a % of Investment Portfolio excluding Securities Lending Collateral) | | 12/31/19 | | | 12/31/18 | |
| Government & Agency Obligations | | | 40% | | | | 44% | |
| Corporate Bonds | | | 34% | | | | 11% | |
| Collateralized Mortgage Obligations | | | 12% | | | | 17% | |
| Commercial Mortgage-Backed Securities | | | 5% | | | | 5% | |
| Mortgage-Backed Securities Pass-Throughs | | | 5% | | | | 6% | |
| Short-Term U.S. Treasury Obligations | | | 2% | | | | 3% | |
| Cash Equivalents | | | 1% | | | | 5% | |
| Asset-Backed | | | 1% | | | | 2% | |
| Common Stocks | | | 0% | | | | 0% | |
| Warrants | | | 0% | | | | 0% | |
| Loan Participations and Assignments | | | — | | | | 5% | |
| Convertible Bonds | | | — | | | | 2% | |
| | | | 100% | | | | 100% | |
| | |
| Quality (Excludes Cash Equivalents and Securities Lending Collateral) | | 12/31/19 | | | 12/31/18 | |
| AAA | | | 50% | | | | 38% | |
| AA | | | 1% | | | | 0% | |
| A | | | 8% | | | | 8% | |
| BBB | | | 19% | | | | 12% | |
| BB | | | 11% | | | | 22% | |
| B | | | 7% | | | | 11% | |
| CCC or Below | | | 0% | | | | 2% | |
| Non Rated | | | 4% | | | | 7% | |
| | | | 100% | | | | 100% | |
| | |
| Interest Rate Sensitivity | | 12/31/19 | | | 12/31/18 | |
| Effective Maturity | | | 8.5 years | | | | 4.8 years | |
| Effective Duration | | | 5.9 years | | | | 3.6 years | |
The quality ratings represent the higher of Moody’s Investors Service, Inc. (“Moody’s”), Fitch Ratings, Inc. (“Fitch”) or Standard & Poor’s Corporation (“S&P”) credit ratings. The ratings of Moody’s, Fitch and S&P represent their opinions as to the quality of the securities they rate. Credit quality measures a bond issuer’s ability to repay interest and principal in a timely manner. Ratings are relative and subjective and are not absolute standards of quality. Credit quality does not remove market risk and is subject to change.
Effective maturity is the weighted average of the maturity date of bonds held by the Fund taking into consideration any available maturity shortening features.
Effective duration is an approximate measure of the Fund’s sensitivity to interest rate changes taking into consideration any maturity shortening features.
Portfolio holdings and characteristics are subject to change.
For more complete details about the Fund’s investment portfolio, see page 7.
Following the Fund’s fiscal first and thirdquarter-end, a complete portfolio holdings listing is filed with the SEC on Form N-PORT. The Fund’s Form N-PORT will be available on the SEC’s Web site at sec.gov. The Fund’s portfolio holdings are also posted on dws.com from time to time. Please read the Fund’s current prospectus for more information.
| | | | | | |
| | 6 | | | | | | Deutsche DWS Variable Series II — DWS Multisector Income VIP |
| | |
| Investment Portfolio | | as of December 31, 2019 |
| | | | | | | | |
| | | Principal
Amount ($)(a) | | | Value ($) | |
| Corporate Bonds 33.7% | |
| Communication Services 5.2% | |
| | |
AT&T, Inc., 4.35%, 3/1/2029 | | | 20,000 | | | | 22,250 | |
| | |
CCO Holdings LLC, 144A, 4.75%, 3/1/2030 | | | 20,000 | | | | 20,360 | |
|
Charter Communications Operating LLC: | |
| | |
4.8%, 3/1/2050 | | | 10,000 | | | | 10,545 | |
| | |
5.75%, 4/1/2048 | | | 30,000 | | | | 35,038 | |
|
Comcast Corp.: | |
| | |
2.65%, 2/1/2030 | | | 21,000 | | | | 21,090 | |
| | |
4.6%, 10/15/2038 | | | 20,000 | | | | 23,845 | |
| | |
4.95%, 10/15/2058 | | | 12,000 | | | | 15,639 | |
| | |
Discovery Communications LLC, 5.3%, 5/15/2049 | | | 10,000 | | | | 11,854 | |
|
Netflix, Inc.: | |
| | |
5.5%, 2/15/2022 | | | 60,000 | | | | 63,525 | |
| | |
5.875%, 11/15/2028 | | | 25,000 | | | | 27,714 | |
| | |
NortonLifeLock, Inc., 3.95%, 6/15/2022 | | | 50,000 | | | | 51,265 | |
|
VeriSign, Inc.: | |
| | |
4.625%, 5/1/2023 | | | 50,000 | | | | 50,800 | |
| | |
5.25%, 4/1/2025 | | | 50,000 | | | | 55,116 | |
|
Verizon Communications, Inc.: | |
| | |
4.016%, 12/3/2029 | | | 30,000 | | | | 33,442 | |
| | |
4.329%, 9/21/2028 | | | 20,000 | | | | 22,699 | |
| | | | | | | | |
| | | | | | | 465,182 | |
|
| Consumer Discretionary 5.5% | |
| | |
1011778 B.C. Unlimited Liability Co., 144A, 4.375%, 1/15/2028 | | | 45,000 | | | | 45,113 | |
| | |
Boyd Gaming Corp., 144A, 4.75%, 12/1/2027 | | | 10,000 | | | | 10,388 | |
| | |
Ford Motor Credit Co. LLC, 5.584%, 3/18/2024 | | | 200,000 | | | | 216,508 | |
| | |
General Motors Co., 5.95%, 4/1/2049 | | | 12,000 | | | | 13,303 | |
| | |
Hasbro, Inc., 3.55%, 11/19/2026 | | | 13,000 | | | | 13,091 | |
|
Las Vegas Sands Corp.: | |
| | |
3.5%, 8/18/2026 | | | 20,000 | | | | 20,576 | |
| | |
3.9%, 8/8/2029 | | | 9,000 | | | | 9,397 | |
|
Lowe’s Companies, Inc.: | |
| | |
2.5%, 4/15/2026 | | | 75,000 | | | | 75,506 | |
| | |
4.05%, 5/3/2047 | | | 10,000 | | | | 10,803 | |
| | |
NCL Corp. Ltd., 144A, 3.625%, 12/15/2024 | | | 40,000 | | | | 40,550 | |
| | |
Nordstrom, Inc., 4.375%, 4/1/2030 | | | 10,000 | | | | 10,199 | |
| | |
Starbucks Corp., 4.5%, 11/15/2048 | | | 18,000 | | | | 20,972 | |
| | | | | | | | |
| | | | | | | 486,406 | |
|
| Consumer Staples 1.3% | |
| | |
Altria Group, Inc., 5.95%, 2/14/2049 | | | 20,000 | | | | 24,249 | |
|
Anheuser-Busch InBev Worldwide, Inc.: | |
| | |
4.75%, 4/15/2058 | | | 10,000 | | | | 11,696 | |
| | |
5.45%, 1/23/2039 | | | 12,000 | | | | 15,101 | |
| | |
5.55%, 1/23/2049 | | | 20,000 | | | | 25,986 | |
|
Estee Lauder Companies, Inc.: | |
| | |
2.375%, 12/1/2029 | | | 7,000 | | | | 6,998 | |
| | |
3.125%, 12/1/2049 | | | 7,000 | | | | 7,005 | |
| | | | | | | | |
| | | Principal
Amount ($)(a) | | | Value ($) | |
| | |
Keurig Dr Pepper, Inc., 4.597%, 5/25/2028 | | | 11,000 | | | | 12,353 | |
| | |
PepsiCo, Inc., 3.375%, 7/29/2049 | | | 11,000 | | | | 11,539 | |
| | | | | | | | |
| | | | | | | 114,927 | |
|
| Energy 3.5% | |
|
Apache Corp.: | |
| | |
4.25%, 1/15/2030 | | | 34,000 | | | | 35,265 | |
| | |
4.75%, 4/15/2043 | | | 10,000 | | | | 9,662 | |
| | |
Cenovus Energy, Inc., 5.4%, 6/15/2047 | | | 10,000 | | | | 11,623 | |
| | |
Cheniere Energy Partners LP, 5.625%, 10/1/2026 | | | 100,000 | | | | 105,750 | |
| | |
Devon Energy Corp., 5.0%, 6/15/2045 | | | 15,000 | | | | 17,410 | |
| | |
Enterprise Products Operating LP, 4.2%, 1/31/2050 | | | 20,000 | | | | 21,469 | |
| | |
Hess Corp., 5.8%, 4/1/2047 | | | 20,000 | | | | 24,495 | |
| | |
Kinder Morgan, Inc., 5.2%, 3/1/2048 | | | 11,000 | | | | 12,774 | |
| | |
MPLX LP, 5.5%, 2/15/2049 | | | 30,000 | | | | 34,082 | |
|
Occidental Petroleum Corp.: | |
| | |
3.5%, 8/15/2029 | | | 17,000 | | | | 17,355 | |
| | |
4.2%, 3/15/2048 | | | 10,000 | | | | 9,934 | |
| | |
Plains All American Pipeline LP, 3.55%, 12/15/2029 | | | 10,000 | | | | 9,865 | |
| | | | | | | | |
| | | | | | | 309,684 | |
|
| Financials 6.0% | |
|
Bank of America Corp.: | |
| | |
2.884%, 10/22/2030 | | | 20,000 | | | | 20,176 | |
| | |
3.974%, 2/7/2030 | | | 40,000 | | | | 43,915 | |
| | |
Citigroup, Inc., 3.98%, 3/20/2030 | | | 58,000 | | | | 63,499 | |
| | |
Global Payments, Inc., 3.2%, 8/15/2029 | | | 30,000 | | | | 30,576 | |
| | |
Hartford Financial Services Group, Inc., 2.8%, 8/19/2029 | | | 10,000 | | | | 10,117 | |
|
JPMorgan Chase & Co.: | |
| | |
2.739%, 10/15/2030 | | | 20,000 | | | | 20,003 | |
| | |
3.782%, 2/1/2028 | | | 35,000 | | | | 37,743 | |
| | |
Morgan Stanley, 4.431%, 1/23/2030 | | | 60,000 | | | | 67,865 | |
| | |
Park Aerospace Holdings Ltd., 144A, 5.25%, 8/15/2022 | | | 60,000 | | | | 63,924 | |
|
PayPal Holdings, Inc.: | |
| | |
2.65%, 10/1/2026 | | | 25,000 | | | | 25,351 | |
| | |
2.85%, 10/1/2029 | | | 40,000 | | | | 40,372 | |
| | |
Synchrony Financial, 4.375%, 3/19/2024 | | | 20,000 | | | | 21,340 | |
| | |
The Allstate Corp., 3.85%, 8/10/2049 | | | 10,000 | | | | 11,076 | |
| | |
Truist Financial Corp., 4.8%, Perpetual (b) | | | 60,000 | | | | 61,950 | |
| | |
Wells Fargo & Co., 3.196%, 6/17/2027 | | | 20,000 | | | | 20,753 | |
| | | | | | | | |
| | | | | | | 538,660 | |
|
| Health Care 3.9% | |
|
AbbVie, Inc.: | |
| | |
144A, 3.2%, 11/21/2029 | | | 10,000 | | | | 10,174 | |
| | |
144A, 4.25%, 11/21/2049 | | | 10,000 | | | | 10,618 | |
| | |
4.875%, 11/14/2048 | | | 15,000 | | | | 17,330 | |
The accompanying notes are an integral part of the financial statements.
| | | | |
Deutsche DWS Variable Series II — DWS Multisector Income VIP | | | | | 7 |
| | | | | | | | |
| | | Principal
Amount ($)(a) | | | Value ($) | |
| | |
Amgen, Inc., 4.563%, 6/15/2048 | | | 10,000 | | | | 11,625 | |
| | |
Anthem, Inc., 2.875%, 9/15/2029 | | | 10,000 | | | | 9,962 | |
| | |
Bausch Health Companies, Inc., 144A, 5.25%, 1/30/2030 | | | 10,000 | | | | 10,370 | |
| | |
Bristol-Myers Squibb Co., 144A, 4.25%, 10/26/2049 | | | 40,000 | | | | 47,491 | |
|
Centene Corp.: | |
| | |
144A, 4.25%, 12/15/2027 | | | 15,000 | | | | 15,431 | |
| | |
144A, 4.625%, 12/15/2029 | | | 10,000 | | | | 10,513 | |
| | |
CVS Health Corp., 5.05%, 3/25/2048 | | | 20,000 | | | | 23,700 | |
| | |
Eli Lilly & Co., 4.15%, 3/15/2059 | | | 9,000 | | | | 10,630 | |
|
HCA, Inc.: | |
| | |
4.125%, 6/15/2029 | | | 20,000 | | | | 21,222 | |
| | |
7.5%, 2/15/2022 | | | 60,000 | | | | 66,300 | |
| | |
Select Medical Corp., 144A, 6.25%, 8/15/2026 | | | 30,000 | | | | 32,476 | |
| | |
Thermo Fisher Scientific, Inc., 2.6%, 10/1/2029 | | | 50,000 | | | | 49,462 | |
| | | | | | | | |
| | | | | | | 347,304 | |
|
| Industrials 1.7% | |
| | |
CSX Corp., 3.35%, 9/15/2049 | | | 10,000 | | | | 9,864 | |
| | |
FedEx Corp., 4.05%, 2/15/2048 | | | 10,000 | | | | 9,662 | |
| | |
Parker-Hannifin Corp., 3.25%, 6/14/2029 | | | 10,000 | | | | 10,448 | |
| | |
Prime Security Services Borrower LLC, 144A, 5.25%, 4/15/2024 | | | 50,000 | | | | 52,900 | |
| | |
Signature Aviation US Holdings Inc, 144A, 4.0%, 3/1/2028 | | | 35,000 | | | | 34,520 | |
| | |
United Technologies Corp., 4.625%, 11/16/2048 | | | 25,000 | | | | 31,329 | |
| | | | | | | | |
| | | | | | | 148,723 | |
|
| Information Technology 0.8% | |
| | |
Broadcom, Inc., 144A, 4.75%, 4/15/2029 | | | 11,000 | | | | 12,028 | |
| | |
Fiserv, Inc., 3.5%, 7/1/2029 | | | 30,000 | | | | 31,533 | |
| | |
MSCI, Inc., 144A, 4.0%, 11/15/2029 | | | 15,000 | | | | 15,206 | |
| | |
Oracle Corp., 4.0%, 11/15/2047 | | | 10,000 | | | | 11,188 | |
| | | | | | | | |
| | | | | | | 69,955 | |
|
| Real Estate 2.6% | |
| | |
American Tower Corp., (REIT), 3.8%, 8/15/2029 | | | 50,000 | | | | 53,456 | |
|
Equinix, Inc.: | |
| | |
(REIT), 2.625%, 11/18/2024 | | | 17,000 | | | | 17,032 | |
| | |
(REIT), 3.2%, 11/18/2029 | | | 16,000 | | | | 16,060 | |
|
Office Properties Income Trust: | |
| | |
(REIT), 4.0%, 7/15/2022 | | | 25,000 | | | | 25,592 | |
| | |
(REIT), 4.15%, 2/1/2022 | | | 30,000 | | | | 30,726 | |
| | |
(REIT), 4.25%, 5/15/2024 | | | 10,000 | | | | 10,394 | |
|
Omega Healthcare Investors, Inc.: | |
| | |
(REIT), 4.5%, 4/1/2027 | | | 15,000 | | | | 16,194 | |
| | |
(REIT), 4.75%, 1/15/2028 | | | 20,000 | | | | 21,784 | |
|
VICI Properties LP: | |
| | |
144A (REIT), 4.25%, 12/1/2026 | | | 10,000 | | | | 10,300 | |
| | |
144A (REIT), 4.625%, 12/1/2029 | | | 6,000 | | | | 6,255 | |
| | |
Welltower, Inc., (REIT), 3.1%, 1/15/2030 | | | 20,000 | | | | 20,254 | |
| | | | | | | | |
| | | | | | | 228,047 | |
| | | | | | | | |
| | | Principal
Amount ($)(a) | | | Value ($) | |
|
| Utilities 3.2% | |
|
American Electric Power Co., Inc.: | |
| | |
3.2%, 11/13/2027 | | | 10,000 | | | | 10,320 | |
| | |
4.3%, 12/1/2028 | | | 5,000 | | | | 5,565 | |
|
Calpine Corp.: | |
| | |
144A, 4.5%, 2/15/2028 | | | 40,000 | | | | 40,355 | |
| | |
144A, 5.125%, 3/15/2028 | | | 20,000 | | | | 20,414 | |
|
Duke Energy Corp.: | |
| | |
3.4%, 6/15/2029 | | | 10,000 | | | | 10,453 | |
| | |
4.2%, 6/15/2049 | | | 10,000 | | | | 11,057 | |
| | |
Edison International, 5.75%, 6/15/2027 | | | 90,000 | | | | 101,052 | |
|
NextEra Energy Operating Partners LP: | |
| | |
144A, 3.875%, 10/15/2026 | | | 30,000 | | | | 30,112 | |
| | |
144A, 4.25%, 7/15/2024 | | | 45,000 | | | | 46,856 | |
| | |
Southern California Edison Co., 4.875%, 3/1/2049 | | | 10,000 | | | | 11,864 | |
| | | | | | | | |
| | | | | | | | 288,048 | |
Total Corporate Bonds (Cost $2,894,111) | | | | 2,996,936 | |
|
Mortgage-Backed Securities
Pass-Throughs 5.1% | |
Federal National Mortgage Association, 4.0%, 9/1/2048 (Cost $430,134) | | | 429,933 | | | | 454,750 | |
|
| Asset-Backed 0.6% | |
| Home Equity Loans 0.1% | |
CIT Home Equity Loan Trust, “AF6”, Series2002-1, 6.2%, 2/25/2030 | | | 10,165 | | | | 10,252 | |
| | |
| Miscellaneous 0.5% | | | | | | | | |
| | |
Hilton Grand Vacations Trust, “B”, Series2014-AA, 144A, 2.07%, 11/25/2026 | | | 39,237 | | | | 39,073 | |
Total Asset-Backed (Cost $49,158) | | | | 49,325 | |
|
| Commercial Mortgage-Backed Securities 5.4% | |
| | |
GMAC Commercial Mortgage Securities, Inc., “G”,Series 2004-C1, 144A, 5.455%, 3/10/2038 | | | 394,448 | | | | 376,387 | |
| | |
Morgan Stanley Capital I Trust, “A4” Series2019-L3, 3.127%, 11/15/2029 | | | 100,000 | | | | 103,197 | |
Total Commercial Mortgage-Backed Securities (Cost $499,908) | | | | 479,584 | |
|
| Collateralized Mortgage Obligations 12.3% | |
| | |
Banc of America Mortgage Trust, “2A2”, Series2004-A, 4.781%**, 2/25/2034 | | | 19,612 | | | | 19,817 | |
| | |
Bear Stearns Adjustable Rate Mortgage Trust, “2A1”,Series 2005-11, 5.111%**, 12/25/2035 | | | 22,496 | | | | 23,194 | |
The accompanying notes are an integral part of the financial statements.
| | | | | | |
| | 8 | | | | | | Deutsche DWS Variable Series II — DWS Multisector Income VIP |
| | | | | | | | |
| | | Principal
Amount ($)(a) | | | Value ($) | |
| | |
CHL Mortgage Pass Through Trust, “2A5”, Series2004-13, 5.75%, 8/25/2034 | | | 22,774 | | | | 22,862 | |
| | |
Fannie Mae Connecticut Avenue Securities: | | | | | | | | |
| | |
“1M2”, Series2018-C06,1-monthUSD-LIBOR + 2.000%, 3.792%**, 3/25/2031 | | | 59,315 | | | | 59,564 | |
| | |
“1M2”, Series2018-C01,1-monthUSD-LIBOR + 2.250%, 4.042%**, 7/25/2030 | | | 250,000 | | | | 253,288 | |
| | |
“1M2”, Series2019-R02, 144A,1-monthUSD-LIBOR + 2.300%, 4.092%**, 8/25/2031 | | | 70,000 | | | | 70,646 | |
| | |
“1M2”, Series2018-C05,1-monthUSD-LIBOR + 2.350%, 4.142%**, 1/25/2031 | | | 100,000 | | | | 101,425 | |
| | |
Federal Home Loan Mortgage Corp.: | | | | | | | | |
| | |
“PI”, Series 3843, Interest Only, 4.5%, 5/15/2038 | | | 54,448 | | | | 1,616 | |
| | |
“C31”, Series 303, Interest Only, 4.5%, 12/15/2042 | | | 342,381 | | | | 55,136 | |
| | |
Federal National Mortgage Association, “4”, Series 406, Interest Only, 4.0%, 9/25/2040 | | | 79,326 | | | | 12,452 | |
| | |
Freddie Mac Structured Agency Credit Risk Debt Notes, “M2”, Series 2019-DNA2, 144A,1-monthUSD-LIBOR + 2.450%, 4.242%**, 3/25/2049 | | | 106,003 | | | | 106,934 | |
| | |
Government National Mortgage Association: | | | | | | | | |
| | |
“GI”, Series2014-146, Interest Only, 3.5%, 9/20/2029 | | | 656,463 | | | | 62,714 | |
| | |
“PI”, Series2015-40, Interest Only, 4.0%, 4/20/2044 | | | 81,471 | | | | 5,856 | |
| | |
“HI”, Series2015-77, Interest Only, 4.0%, 5/20/2045 | | | 184,318 | | | | 34,716 | |
| | |
“IN”, Series2009-69, Interest Only, 5.5%, 8/20/2039 | | | 95,908 | | | | 16,555 | |
| | |
“IV”, Series2009-69, Interest Only, 5.5%, 8/20/2039 | | | 92,163 | | | | 15,901 | |
| | |
“IJ”, Series2009-75, Interest Only, 6.0%, 8/16/2039 | | | 80,167 | | | | 13,808 | |
| | |
JPMorgan Mortgage Trust, “2A1”, Series2006-A2, 4.187%**, 4/25/2036 | | | 90,569 | | | | 88,778 | |
| | |
Merrill Lynch Mortgage Investors Trust, “2A”, Series2003-A6, 4.16%**, 10/25/2033 | | | 20,520 | | | | 20,797 | |
| | |
STACR Trust, “M2”, Series 2018-DNA3, 144A,1-monthUSD-LIBOR + 2.100%, 3.892%**, 9/25/2048 | | | 108,108 | | | | 108,971 | |
Total Collateralized Mortgage Obligations (Cost $878,066) | | | | 1,095,030 | |
| | | | | | | | |
| | | Principal
Amount ($)(a) | | | Value ($) | |
|
| Government & Agency Obligations 40.3% | |
| Sovereign Bonds 1.3% | |
| | |
Republic of Argentina-Inflation Linked Bond, 5.83%, 12/31/2033 | | | ARS 476 | | | | 69 | |
| | |
Republic of Slovenia, 144A, 5.5%, 10/26/2022 | | | 100,000 | | | | 109,693 | |
| | | | | | | | |
| | | | | | | 109,762 | |
|
| U.S. Treasury Obligations 39.0% | |
| | |
U.S. Treasury Bond, 2.25%, 8/15/2049 | | | 543,000 | | | | 528,237 | |
| | |
U.S. Treasury Inflation Indexed Note, 0.625%, 4/15/2023 | | | 284,892 | | | | 289,301 | |
| | |
U.S. Treasury Notes: | | | | | | | | |
| | |
1.5%, 10/31/2024 | | | 171,000 | | | | 169,577 | |
| | |
1.75%, 11/15/2029 | | | 1,625,000 | | | | 1,601,768 | |
| | |
2.125%, 5/31/2026 | | | 272,000 | | | | 277,493 | |
| | |
2.625%, 8/31/2020 | | | 600,000 | | | | 603,844 | |
| | | | | | | | |
| | | | | | | | 3,470,220 | |
Total Government & Agency Obligations (Cost $3,582,030) | | | | 3,579,982 | |
|
| Short-Term U.S. Treasury Obligations 2.2% | |
| | |
U.S. Treasury Bills: | | | | | | | | |
| | |
1.595%***, 9/10/2020 | | | 20,000 | | | | 19,787 | |
| | |
1.763%***, 7/16/2020 | | | 180,000 | | | | 178,495 | |
Total Short-Term U.S. Treasury Obligations (Cost $198,040) | | | | 198,282 | |
| | |
| | | Shares | | | Value ($) | |
| Common Stocks 0.0% | |
| Industrials | | | | | | | | |
Quad Graphics, Inc. (Cost $0) | | | 4 | | | | 19 | |
|
| Warrants 0.0% | |
| Materials | |
Hercules Trust II, Expiration Date 3/31/2029* (c) (Cost $17,432) | | | 85 | | | | 3,249 | |
| | |
| Cash Equivalents 0.7% | | | | | | | | |
DWS Central Cash Management Government Fund, 1.62% (d) (Cost $62,647) | | | 62,647 | | | | 62,647 | |
| | |
| | | % of Net
Assets | | | Value ($) | |
Total Investment Portfolio (Cost $8,611,526) | | | 100.3 | | | | 8,919,804 | |
| Other Assets and Liabilities, Net | | | (0.3 | ) | | | (28,746 | ) |
| Net Assets | | | 100.0 | | | | 8,891,058 | |
The accompanying notes are an integral part of the financial statements.
| | | | |
Deutsche DWS Variable Series II — DWS Multisector Income VIP | | | | | 9 |
A summary of the Fund’s transactions with affiliated investments during the year ended December 31, 2019 are as follows:
| | | | | | | | | | | | | | | | | | | | | | | | | | | | | | | | |
Value ($) at
12/31/2018 | | Purchases
Cost ($) | | | Sales
Proceeds ($) | | | Net
Realized
Gain/
(Loss) ($) | | | Net Change in
Unrealized
Appreciation
(Depreciation) ($) | | | Income ($) | | | Capital Gain
Distributions ($) | | | Number
of Shares
at
12/31/2019 | | | Value ($)
at
12/31/2019 | |
Securities Lending Collateral 0.0% | |
DWS Government & Agency Securities Portfolio “DWS Government Cash Institutional Shares”, 1.50% (d) (e) | |
| 302,310 | | | — | | | | 302,310 | (f) | | | — | | | | — | | | | 3,514 | | | | — | | | | — | | | | — | |
Cash Equivalents 0.7% | |
DWS Central Cash Management Government Fund, 1.62% (d) | |
| 395,710 | | | 6,671,477 | | | | 7,004,540 | | | | — | | | | — | | | | 14,939 | | | | — | | | | 62,647 | | | | 62,647 | |
| 698,020 | | | 6,671,477 | | | | 7,306,850 | | | | — | | | | — | | | | 18,453 | | | | — | | | | 62,647 | | | | 62,647 | |
| * | Non-income producing security. |
| ** | Variable or floating rate security. These securities are shown at their current rate as of December 31, 2019. For securities based on a published reference rate and spread, the reference rate and spread are indicated within the description above. Certain variable rate securities are not based on a published reference rate and spread but adjust periodically based on current market conditions, prepayment of underlying positions and/or other variables. |
| *** | Annualized yield at time of purchase; not a coupon rate. |
| (a) | Principal amount stated in U.S. dollars unless otherwise noted. |
| (b) | Perpetual, callable security with no stated maturity date. |
| (c) | Investment was valued using significant unobservable inputs. |
| (d) | Affiliated fund managed by DWS Investment Management Americas, Inc. The rate shown is the annualizedseven-day yield at period end. |
| (e) | Represents cash collateral held in connection with securities lending. Income earned by the Fund is net of borrower rebates. |
| (f) | Represents the net increase (purchase cost) or decrease (sales proceeds) in the amount invested in cash collateral for the year ended December 31, 2019. |
144A: Security exempt from registration under Rule 144A of the Securities Act of 1933. These securities may be resold in transactions exempt from registration, normally to qualified institutional buyers.
Interest Only: Interest Only (IO) bonds represent the “interest only” portion of payments on a pool of underlying mortgages or mortgage-backed securities. IO securities are subject to prepayment risk of the pool of underlying mortgages.
LIBOR: London Interbank Offered Rate
PIK: Denotes that all or a portion of the income is paid in-kind in the form of additional principal.
REIT: Real Estate Investment Trust
Included in the portfolio are investments in mortgage or asset-backed securities which are interests in separate pools of mortgages or assets. Effective maturities of these investments may be shorter than stated maturities due to prepayments.
Currency Abbreviations
Fair Value Measurements
Various inputs are used in determining the value of the Fund’s investments. These inputs are summarized in three broad levels. Level 1 includes quoted prices in active markets for identical securities. Level 2 includes other significant observable inputs (including quoted prices for similar securities, interest rates, prepayment speeds and credit risk). Level 3 includes significant unobservable inputs (including the Fund’s own assumptions in determining the fair value of investments). The level assigned to the securities valuations may not be an indication of the risk or liquidity associated with investing in those securities.
The following is a summary of the inputs used as of December 31, 2019 in valuing the Fund’s investments. For information on the Fund’s policy regarding the valuation of investments, please refer to the Security Valuation section of Note A in the accompanying Notes to Financial Statements.
| | | | | | | | | | | | | | | | |
| Assets | | Level 1 | | | Level 2 | | | Level 3 | | | Total | |
| Fixed Income Investments (g) | | | | | | | | | | | | | | | | |
Corporate Bonds | | $ | — | | | $ | 2,996,936 | | | $ | — | | | $ | 2,996,936 | |
Mortgage-Backed Securities Pass-Throughs | | | — | | | | 454,750 | | | | — | | | | 454,750 | |
Asset-Backed | | | — | | | | 49,325 | | | | — | | | | 49,325 | |
Commercial Mortgage-Backed Securities | | | — | | | | 479,584 | | | | — | | | | 479,584 | |
Collateralized Mortgage Obligations | | | — | | | | 1,095,030 | | | | — | | | | 1,095,030 | |
Government & Agency Obligations | | | — | | | | 3,579,982 | | | | — | | | | 3,579,982 | |
Short-Term U.S. Treasury Obligations | | | — | | | | 198,282 | | | | — | | | | 198,282 | |
| Common Stocks | | | 19 | | | | — | | | | — | | | | 19 | |
| Warrants | | | — | | | | — | | | | 3,249 | | | | 3,249 | |
| Short-Term Investments | | | 62,647 | | | | — | | | | — | | | | 62,647 | |
| Total | | $ | 62,666 | | | $ | 8,853,889 | | | $ | 3,249 | | | $ | 8,919,804 | |
| (g) | See Investment Portfolio for additional detailed categorizations. |
The accompanying notes are an integral part of the financial statements.
| | | | | | |
| | 10 | | | | | | Deutsche DWS Variable Series II — DWS Multisector Income VIP |
Level 3 Reconciliation
The following is a reconciliation of the Fund’s Level 3 investments for which significant unobservable inputs were used in determining value:
| | | | | | | | | | | | | | | | | | | | |
| | | Bank
Loans | | | Convertible
Bond | | | Common
Stocks | | | Warrants | | | Total | |
Balance as of December 31, 2018 | | $ | 56,865 | | | $ | 158,403 | | | $ | 10,724 | | | $ | 2,096 | | | $ | 228,088 | |
| Realized gains (loss) | | | (6 | ) | | | — | | | | 4,080 | | | | — | | | | 4,074 | |
| Change in unrealized appreciation (depreciation) | | | 328 | | | | (12,457 | ) | | | 28,732 | | | | 1,153 | | | | 17,756 | |
| Amortization premium/discount | | | 0 | | | | 15 | | | | — | | | | — | | | | 15 | |
| Purchases/PIK | | | — | | | | 10,194 | | | | 165,000 | | | | — | | | | 175,194 | |
| (Sales) | | | (57,187 | ) | | | (156,155 | ) | | | (208,536 | ) | | | — | | | | (421,878 | ) |
| Transfers into Level 3 | | | — | | | | — | | | | — | | | | — | | | | — | |
| Transfers (out) of Level 3 | | | — | | | | — | | | | — | | | | — | | | | — | |
| Balance as of December 31, 2019 | | $ | — | | | $ | — | | | $ | — | | | $ | 3,249 | | | $ | 3,249 | |
| Net change in unrealized appreciation (depreciation) from investments still held as of December 31, 2019 | | $ | — | | | $ | — | | | $ | — | | | $ | 1,153 | | | $ | 1,153 | |
The accompanying notes are an integral part of the financial statements.
| | | | |
Deutsche DWS Variable Series II — DWS Multisector Income VIP | | | | | 11 |
Statement of Assets and Liabilities
| | | | |
| as of December 31, 2019 | | | | |
| |
| Assets | | | | |
Investments innon-affiliated securities, at value
(cost $8,548,879) | | $ | 8,857,157 | |
| Investment in DWS Central Cash Management Government Fund (cost $62,647) | | | 62,647 | |
| Cash | | | 10,000 | |
| Receivable for Fund shares sold | | | 13,344 | |
| Interest receivable | | | 59,751 | |
| Foreign taxes recoverable | | | 617 | |
| Due from Advisor | | | 9,171 | |
| Other assets | | | 871 | |
| Total assets | | | 9,013,558 | |
| |
| Liabilities | | | | |
| Foreign cash overdraft, at value | | | 3 | |
| Payable for investments purchased | | | 21,577 | |
| Payable for Fund shares redeemed | | | 16 | |
| Accrued Audit fees | | | 72,769 | |
| Accrued Trustees’ fees | | | 989 | |
| Other accrued expenses and payables | | | 27,146 | |
| Total liabilities | | | 122,500 | |
| Net assets, at value | | $ | 8,891,058 | |
| |
| Net Assets Consist of | | | | |
| Distributable earnings (loss) | | | (3,987,930 | ) |
| Paid-in capital | | | 12,878,988 | |
| Net assets, at value | | $ | 8,891,058 | |
| |
| Net Asset Value | | | | |
Class A | | | | |
| |
| Net asset value, offering and redemption price per share ($8,891,058 ÷ 908,826 outstanding shares of beneficial interest, no par value, unlimited number of shares authorized) | | $ | 9.78 | |
Statement of Operations
| | | | |
| for the year ended December 31, 2019 | |
| |
| Investment Income | | | | |
| Income: | | | | |
| Interest | | $ | 308,797 | |
| Income distributions — DWS Central Cash Management Government Fund | | | 14,939 | |
| Securities lending income, net of borrower rebates | | | 2,507 | |
| Total income | | | 326,243 | |
| Expenses: | | | | |
| Management fee | | | 47,793 | |
| Administration fee | | | 8,690 | |
| Services to Shareholders | | | 267 | |
| Custodian fee | | | 14,060 | |
| Professional fees | | | 91,513 | |
| Reports to shareholders | | | 30,165 | |
| Trustees’ fees and expenses | | | 2,652 | |
| Pricing service fee | | | 10,968 | |
| Other | | | 2,413 | |
| Total expenses before expense reductions | | | 208,521 | |
| Expense reductions | | | (151,444 | ) |
| Total expenses after expense reductions | | | 57,077 | |
| Net investment income | | | 269,166 | |
| |
| Realized and Unrealized Gain (Loss) | | | | |
| Net realized gain (loss) from: | | | | |
| Investments | | | 4,139 | |
| Swap contracts | | | (25,964 | ) |
| Futures | | | 150,877 | |
| Forward foreign currency contracts | | | 2,307 | |
| Foreign currency | | | 354 | |
| | | | 131,713 | |
| Change in net unrealized appreciation (depreciation) on: | | | | |
| Investments | | | 410,275 | |
| Futures | | | (40,004 | ) |
| Forward foreign currency contracts | | | (9,774 | ) |
| Foreign currency | | | 450 | |
| | | | 360,947 | |
| Net gain (loss) | | | 492,660 | |
| Net increase (decrease) in net assets resulting from operations | | $ | 761,826 | |
The accompanying notes are an integral part of the financial statements.
| | | | | | |
| | 12 | | | | | | Deutsche DWS Variable Series II — DWS Multisector Income VIP |
Statements of Changes in Net Assets
| | | | | | | | |
| | | Years Ended December 31, | |
| Increase (Decrease) in Net Assets | | 2019 | | | 2018 | |
| Operations: | | | | | | | | |
| Net investment income | | $ | 269,166 | | | $ | 309,384 | |
| Net realized gain (loss) | | | 131,713 | | | | (106,781 | ) |
| Change in net unrealized appreciation (depreciation) | | | 360,947 | | | | (345,745 | ) |
| Net increase (decrease) in net assets resulting from operations | | | 761,826 | | | | (143,142 | ) |
| Distributions to shareholders: | | | | | | | | |
Class A | | | (339,978 | ) | | | (641,992 | ) |
| Fund share transactions: | | | | | | | | |
Class A | | | | | | | | |
| Proceeds from shares sold | | | 846,845 | | | | 612,918 | |
| Reinvestment of distributions | | | 339,978 | | | | 641,992 | |
| Payments for shares redeemed | | | (1,009,448 | ) | | | (1,895,400 | ) |
| Net increase (decrease) in net assets from Class A share transactions | | | 177,375 | | | | (640,490 | ) |
| Increase (decrease) in net assets | | | 599,223 | | | | (1,425,624 | ) |
| Net assets at beginning of period | | | 8,291,835 | | | | 9,717,459 | |
| | |
| Net assets at end of period | | $ | 8,891,058 | | | $ | 8,291,835 | |
| | |
| Other Information | | | | | | | | |
Class A | | | | | | | | |
| Shares outstanding at beginning of period | | | 888,694 | | | | 951,249 | |
| Shares sold | | | 89,042 | | | | 64,660 | |
| Shares issued to shareholders in reinvestment of distributions | | | 36,596 | | | | 68,080 | |
| Shares redeemed | | | (105,506 | ) | | | (195,295 | ) |
| Net increase (decrease) in Class A shares | | | 20,132 | | | | (62,555 | ) |
| | |
| Shares outstanding at end of period | | | 908,826 | | | | 888,694 | |
The accompanying notes are an integral part of the financial statements.
| | | | |
Deutsche DWS Variable Series II — DWS Multisector Income VIP | | | | | 13 |
Financial Highlights
| | | | | | | | | | | | | | | | | | | | |
| | | Years Ended December 31, | |
| Class A | | 2019 | | | 2018 | | | 2017 | | | 2016 | | | 2015 | |
| | | | | |
| Selected Per Share Data | | | | | | | | | | | | | | | | | | | | |
| Net asset value, beginning of period | | $ | 9.33 | | | $ | 10.22 | | | $ | 9.65 | | | $ | 10.43 | | | $ | 11.20 | |
| Income (loss) from investment operations: | | | | | | | | | | | | | | | | | | | | |
Net investment incomea | | | .30 | | | | .34 | | | | .28 | | | | .22 | | | | .40 | |
Net realized and unrealized gain (loss) | | | .54 | | | | (.50 | ) | | | .37 | | | | (.17 | ) | | | (.72 | ) |
Total from investment operations | | | .84 | | | | (.16 | ) | | | .65 | | | | .05 | | | | (.32 | ) |
| Less distributions from: | | | | | | | | | | | | | | | | | | | | |
Net investment income | | | (.39 | ) | | | (.73 | ) | | | (.08 | ) | | | (.83 | ) | | | (.45 | ) |
| Net asset value, end of period | | $ | 9.78 | | | $ | 9.33 | | | $ | 10.22 | | | $ | 9.65 | | | $ | 10.43 | |
| Total Return (%)b | | | 9.22 | | | | (1.65 | ) | | | 6.78 | | | | .50 | | | | (3.02 | ) |
| | | | | |
| Ratios to Average Net Assets and Supplemental Data | | | | | | | | | | | | | | | | | | | | |
| Net assets, end of period ($ millions) | | | 9 | | | | 8 | | | | 10 | | | | 25 | | | | 33 | |
| Ratio of expenses before expense reductions (%)c | | | 2.40 | | | | 2.19 | | | | 1.37 | | | | 1.31 | | | | 1.15 | |
| Ratio of expenses after expense reductions (%)c | | | .66 | | | | .65 | | | | .67 | | | | .68 | | | | .70 | |
| Ratio of net investment income (%) | | | 3.10 | | | | 3.50 | | | | 2.81 | | | | 2.19 | | | | 3.67 | |
| Portfolio turnover rate (%) | | | 199 | | | | 85 | | | | 96 | | | | 159 | | | | 185 | |
| a | Based on average shares outstanding during the period. |
| b | Total return would have been lower had certain expenses not been reduced. |
| c | Expense ratio does not reflect charges and fees associated with the separate account that invests in the Fund or any variable life insurance policy or variable annuity contract for which the Fund is an investment option. |
The accompanying notes are an integral part of the financial statements.
| | | | | | |
| | 14 | | | | | | Deutsche DWS Variable Series II — DWS Multisector Income VIP |
| | |
| Notes to Financial Statements | | |
A. Organization and Significant Accounting Policies
DWS Multisector Income VIP (the “Fund”) is a diversified series of Deutsche DWS Variable Series II (the “Trust”), which is registered under the Investment Company Act of 1940, as amended (the “1940 Act”), as anopen-end management investment company organized as a Massachusetts business trust.
The Fund’s financial statements are prepared in accordance with accounting principles generally accepted in the United States of America (“U.S. GAAP”) which require the use of management estimates. Actual results could differ from those estimates. The Fund qualifies as an investment company under Topic 946 of Accounting Standards Codification of U.S. GAAP. The policies described below are followed consistently by the Fund in the preparation of its financial statements.
Security Valuation. Investments are stated at value determined as of the close of regular trading on the New York Stock Exchange on each day the exchange is open for trading.
Various inputs are used in determining the value of the Fund’s investments. These inputs are summarized in three broad levels. Level 1 includes quoted prices in active markets for identical securities. Level 2 includes other significant observable inputs (including quoted prices for similar securities, interest rates, prepayment speeds and credit risk). Level 3 includes significant unobservable inputs (including the Fund’s own assumptions in determining the fair value of investments). The level assigned to the securities valuations may not be an indication of the risk or liquidity associated with investing in those securities.
Debt securities and loan participations and assignments are valued at prices supplied by independent pricing services approved by the Fund’s Board. Such services may use various pricing techniques which take into account appropriate factors such as yield, quality, coupon rate, maturity, type of issue, trading characteristics, prepayment speeds and other data, as well as broker quotes. If the pricing services are unable to provide valuations, debt securities are valued at the average of the most recent reliable bid quotations or evaluated prices, as applicable, obtained frombroker-dealers and loan participations and assignments are valued at the mean of the most recent bid and ask quotations or evaluated prices, as applicable, obtained from one or morebroker-dealers. Certain securities may be valued on the basis of a price provided by a single source orbroker-dealer. No active trading market may exist for some senior loans and they may be subject to restrictions on resale. The inability to dispose of senior loans in a timely fashion could result in losses. These securities are generally categorized as Level 2. Certain securities may be valued on the basis of a price provided by a single source or broker-dealer. No active trading market may exist for some senior loans and they may be subject to restrictions on resale. The inability to dispose of senior loans in a timely fashion could result in losses. These securities are generally categorized as Level 3.
Equity securities are valued at the most recent sale price or official closing price reported on the exchange (U.S. or foreign) or over-the-counter market on which they trade. Securities for which no sales are reported are valued at the calculated mean between the most recent bid and asked quotations on the relevant market or, if a mean cannot be determined, at the most recent bid quotation. Equity securities are generally categorized as Level 1.
Futures contracts are generally valued at the settlement prices established each day on the exchange on which they are traded and are categorized as Level 1.
Forward currency contracts are valued at the prevailing forward exchange rate of the underlying currencies and are categorized as Level 2.
Swap contracts are valued daily based upon prices supplied by a Board approved pricing vendor, if available, and otherwise are valued at the price provided by the broker-dealer. Swap contracts are generally categorized as Level 2.
Securities and other assets for which market quotations are not readily available or for which the above valuation procedures are deemed not to reflect fair value are valued in a manner that is intended to reflect their fair value as determined in accordance with procedures approved by the Board and are generally categorized as Level 3. In accordance with the Fund’s valuation procedures, factors considered in determining value may include, but are not limited to, the type of the security; the size of the holding; the initial cost of the security; the existence of any contractual restrictions on the security’s disposition; the price and extent of public trading in similar securities of the issuer or of comparable companies; quotations or evaluated prices frombroker-dealers and/or pricing services; information obtained from the issuer, analysts, and/or the appropriate stock exchange (forexchange-traded securities); an analysis of the company’s or issuer’s financial statements; an evaluation of the forces that influence the issuer and the market(s) in which the security is purchased and sold; and with
| | | | |
Deutsche DWS Variable Series II — DWS Multisector Income VIP | | | | | 15 |
respect to debt securities, the maturity, coupon, creditworthiness, currency denomination and the movement of the market in which the security is normally traded. The value determined under these procedures may differ from published values for the same securities.
Disclosure about the classification of fair value measurements is included in a table following the Fund’s Investment Portfolio.
Foreign Currency Translations. The books and records of the Fund are maintained in U.S. dollars. Investment securities and other assets and liabilities denominated in a foreign currency are translated into U.S. dollars at the prevailing exchange rates at period end. Purchases and sales of investment securities, income and expenses are translated into U.S. dollars at the prevailing exchange rates on the respective dates of the transactions.
Net realized and unrealized gains and losses on foreign currency transactions represent net gains and losses between trade and settlement dates on securities transactions, the acquisition and disposition of foreign currencies, and the difference between the amount of net investment income accrued and the U.S. dollar amount actually received. The portion of both realized and unrealized gains and losses on investments that results from fluctuations in foreign currency exchange rates is not separately disclosed but is included with net realized and unrealized gain/appreciation and loss/depreciation on investments.
Securities Lending. Deutsche Bank AG, as lending agent, lends securities of the Fund to certain financial institutions under the terms of its securities lending agreement. During the term of the loans, the Fund continues to receive interest and dividends generated by the securities and to participate in any changes in their market value. The Fund requires the borrowers of the securities to maintain collateral with the Fund consisting of either cash or liquid, unencumbered assets having a value at least equal to the value of the securities loaned. When the collateral falls below specified amounts, the lending agent will use its best effort to obtain additional collateral on the next business day to meet required amounts under the securities lending agreement. As of period end, any securities on loan were collateralized by cash. During the year ended December 31, 2019, the Fund invested the cash collateral into a joint trading account in DWS Government & Agency Securities Portfolio, an affiliated money market fund managed by DWS Investment Management Americas, Inc. DWS Investment Management Americas, Inc. receives a management/administration fee (0.12% annualized effective rate as of December 31, 2019) on the cash collateral invested in DWS Government & Agency Securities Portfolio. The Fund receives compensation for lending its securities either in the form of fees or by earning interest on invested cash collateral net of borrower rebates and fees paid to a lending agent. Either the Fund or the borrower may terminate the loan at any time, and the borrower, after notice, is required to return borrowed securities within a standard time period. There may be risks of delay and costs in recovery of securities or even loss of rights in the collateral should the borrower of the securities fail financially. If the Fund is not able to recover securities lent, the Fund may sell the collateral and purchase a replacement investment in the market, incurring the risk that the value of the replacement security is greater than the value of the collateral. The Fund is also subject to all investment risks associated with the reinvestment of any cash collateral received, including, but not limited to, interest rate, credit and liquidity risk associated with such investments.
As of December 31, 2019, the Fund had no securities on loan.
Loan Participations and Assignments. Loan Participations and Assignments are portions of loans originated by banks and sold in pieces to investors. Thesefloating-rate loans (“Loans”) in which the Fund invests are arranged between the borrower and one or more financial institutions (“Lenders”). These Loans may take the form of Senior Loans, which are corporate obligations often issued in connection with recapitalizations, acquisitions, leveraged buy outs and refinancing. The Fund invests in such Loans in the form of participations in Loans (“Participations”) or assignments of all or a portion of Loans from third parties (“Assignments”). Participations typically result in the Fund having a contractual relationship with only the Lender, not with the borrower. The Fund has the right to receive payments of principal, interest and any fees to which it is entitled from the Lender selling the Participation and only upon receipt by the Lender of the payments from the borrower. In connection with purchasing Participations, the Fund generally has no right to enforce compliance by the borrower with the terms of the loan agreement relating to the Loan, or any rights of set off against the borrower, and the Fund will not benefit directly from any collateral supporting the Loan in which it has purchased the Participation. As a result, the Fund assumes the credit risk of both the borrower and the Lender that is selling the Participation. Assignments typically result in the Fund having a direct contractual relationship with the borrower, and the Fund may enforce compliance by the borrower with the terms of the loan agreement. Loans held by the Fund are generally in the form of Assignments, but the Fund may also invest in Participations. If affiliates of the Advisor participate in the primary and secondary
| | | | | | |
| | 16 | | | | | | Deutsche DWS Variable Series II — DWS Multisector Income VIP |
market for senior loans, legal limitations may restrict the Fund’s ability to participate in restructuring or acquiring some senior loans. All Loans involve interest rate risk, liquidity risk and credit risk, including the potential default or insolvency of the borrower.
Taxes. The Fund’s policy is to comply with the requirements of the Internal Revenue Code, as amended, which are applicable to regulated investment companies and to distribute all of its taxable income to its shareholders.
Additionally, the Fund may be subject to taxes imposed by the governments of countries in which it invests and are generally based on income and/or capital gains earned or repatriated, a portion of which may be recoverable. Based upon the current interpretation of the tax rules and regulations, estimated tax liabilities and recoveries on certain foreign securities are recorded on an accrual basis and are reflected as components of interest income or net change in unrealized gain/loss on investments. Tax liabilities realized as a result of security sales are reflected as a component of net realized gain/loss on investments.
At December 31, 2019, the Fund had net tax basis capital loss carryforwards of approximately $4,509,000, which may be applied against realized net taxable capital gains indefinitely, includingshort-term losses ($1,825,000) andlong-term losses ($2,684,000).
The Fund has reviewed the tax positions for the open tax years as of December 31, 2019 and has determined that no provision for income tax and/or uncertain tax provisions is required in the Fund’s financial statements. The Fund’s federal tax returns for the prior three fiscal years remain open subject to examination by the Internal Revenue Service.
Distribution of Income and Gains. Distributions from net investment income of the Fund, if any, are declared and distributed to shareholders annually. Net realized gains from investment transactions, in excess of available capital loss carryforwards, would be taxable to the Fund if not distributed and, therefore, will be distributed to shareholders at least annually. The Fund may also make additional distributions for tax purposes if necessary.
The timing and characterization of certain income and capital gain distributions are determined annually in accordance with federal tax regulations which may differ from accounting principles generally accepted in the United States of America. These differences primarily relate to investments in foreign denominated currencies, futures contracts and certain securities sold at a loss. As a result, net investment income (loss) and net realized gain (loss) on investment transactions for a reporting period may differ significantly from distributions during such period. Accordingly, the Fund may periodically make reclassifications among certain of its capital accounts without impacting the net asset value of the Fund.
At December 31, 2019, the Fund’s components of distributable earnings on a tax basis were as follows:
| | | | |
| Undistributed ordinary income* | | $ | 212,315 | |
| Capital loss carryforwards | | $ | (4,509,000 | ) |
| Net unrealized appreciation (depreciation) on investments | | $ | 308,818 | |
At December 31, 2019, the aggregate cost of investments for federal income tax purposes was $8,610,986. The net unrealized appreciation for all investments based on tax cost was $308,818. This consisted of aggregate gross unrealized appreciation for all investments in which there was an excess of value over tax cost of $369,046 and aggregate gross unrealized depreciation for all investments in which there was an excess of tax cost over value of $60,228.
In addition, the tax character of distributions paid by the Fund is summarized as follows:
| | | | | | | | |
| | | Years Ended December 31, | |
| | | 2019 | | | 2018 | |
| Distributions from ordinary income* | | $ | 339,978 | | | $ | 641,992 | |
| * | For tax purposes, short-term capital gain distributions are considered ordinary income distributions. |
Expenses. Expenses of the Trust arising in connection with a specific fund are allocated to that fund. Other Trust expenses which cannot be directly attributed to a fund are apportioned among the funds in the Trust based upon the relative net assets or other appropriate measures.
Contingencies. In the normal course of business, the Fund may enter into contracts with service providers that contain general indemnification clauses. The Fund’s maximum exposure under these arrangements is unknown, as this would involve future claims that may be made against the Fund that have not yet been made. However, based on experience, the Fund expects the risk of loss to be remote.
| | | | |
Deutsche DWS Variable Series II — DWS Multisector Income VIP | | | | | 17 |
Other. Investment transactions are accounted for on a trade date plus one basis for daily net asset value calculations. However, for financial reporting purposes, investment transactions are reported on trade date. Interest income is recorded on the accrual basis. Dividend income is recorded on theex-dividend date net of foreign withholding taxes. Realized gains and losses from investment transactions are recorded on an identified cost basis. Proceeds from litigation payments, if any, are included in net realized gain (loss) from investments. All discounts and premiums are accreted/amortized for both tax and financial reporting purposes for the Fund, with the exception of securities in default of principal.
B. Derivative Instruments
Futures Contracts. A futures contract is an agreement between a buyer or seller and an established futures exchange or its clearinghouse in which the buyer or seller agrees to take or make a delivery of a specific amount of a financial instrument at a specified price on a specific date (settlement date). For the year ended December 31, 2019, the Fund entered into interest rate futures to gain exposure to different parts of the yield curve while managing overall duration and fornon-hedging purposes to seek to enhance potential gains.
Upon entering into a futures contract, the Fund is required to deposit with a financial intermediary cash or securities (“initial margin”) in an amount equal to a certain percentage of the face value indicated in the futures contract. Subsequent payments (“variation margin”) are made or received by the Fund dependent upon the daily fluctuations in the value and are recorded for financial reporting purposes as unrealized gains or losses by the Fund. Gains or losses are realized when the contract expires or is closed. Since all futures contracts areexchange-traded, counterparty risk is minimized as the exchange’s clearinghouse acts as the counterparty, and guarantees the futures against default.
Certain risks may arise upon entering into futures contracts, including the risk that an illiquid market will limit the Fund’s ability to close out a futures contract prior to the settlement date and the risk that the futures contract is not well correlated with the security, index or currency to which it relates. Risk of loss may exceed amounts disclosed in the Statement of Assets and Liabilities.
There were no open futures contracts as of December 31, 2019. For the year ended December 31, 2019, the investment in futures contracts purchased had a total notional value generally indicative of a range from $0 to approximately $3,769,000, and the investment in futures contracts sold had a total notional value generally indicative of a range from $0 to approximately $1,301,000.
Forward Foreign Currency Contracts. A forward foreign currency contract (“forward currency contract”) is a commitment to purchase or sell a foreign currency at the settlement date at a negotiated rate. For the year ended December 31, 2019, the Fund entered into forward currency contracts in order to hedge against anticipated currency market changes and fornon-hedging purposes to seek to enhance potential gains.
Forward currency contracts are valued at the prevailing forward exchange rate of the underlying currencies and unrealized gain (loss) is recorded daily. On the settlement date of the forward currency contract, the Fund records a realized gain or loss equal to the difference between the value of the contract at the time it was opened and the value of the contract at the time it was closed. Certain risks may arise upon entering into forward currency contracts from the potential inability of counterparties to meet the terms of their contracts. The maximum counterparty credit risk to the Fund is measured by the unrealized gain on appreciated contracts. Additionally, when utilizing forward currency contracts to hedge, the Fund gives up the opportunity to profit from favorable exchange rate movements during the term of the contract.
There were no open forward currency contracts as of December 31, 2019. For the year ended December 31, 2019, the investment in forward currency contracts short vs. U.S. dollars had a total contract value generally indicative of a range from $0 to approximately $785,000, and the investment in forward currency contracts long vs. U.S. dollars had a total contract value generally indicative of a range from $0 to approximately $212,000. The investment in forward currency contracts long vs. other foreign currencies sold had a total contract value generally indicative of a range from $0 to approximately $342,000.
Swaps. A swap is a contract between two parties to exchange future cash flows at periodic intervals based on the notional amount of the swap. A bilateral swap is a transaction between the fund and a counterparty where cash flows are exchanged between the two parties. A centrally cleared swap is a transaction executed between the fund and a counterparty, then cleared by a clearing member through a central clearinghouse. The central clearinghouse serves as the counterparty, with whom the fund exchanges cash flows.
The value of a swap is adjusted daily, and the change in value, if any, is recorded as unrealized appreciation or depreciation in the Statement of Assets and Liabilities. Gains or losses are realized when the swap expires
| | | | | | |
| | 18 | | | | | | Deutsche DWS Variable Series II — DWS Multisector Income VIP |
or is closed. Certain risks may arise when entering into swap transactions including counterparty default; liquidity; or unfavorable changes in interest rates or the value of the underlying reference security, commodity or index. In connection with bilateral swaps, securities and/or cash may be identified as collateral in accordance with the terms of the swap agreement to provide assets of value and recourse in the event of default. The maximum counterparty credit risk is the net present value of the cash flows to be received from or paid to the counterparty over the term of the swap, to the extent that this amount is beneficial to the Fund, in addition to any related collateral posted to the counterparty by the Fund. This risk may be partially reduced by a master netting arrangement between the Fund and the counterparty. Upon entering into a centrally cleared swap, the Fund is required to deposit with a financial intermediary cash or securities (“initial margin”) in an amount equal to a certain percentage of the notional amount of the swap. Subsequent payments (“variation margin”) are made or received by the Fund dependent upon the daily fluctuations in the value of the swap. In a cleared swap transaction, counterparty risk is minimized as the central clearinghouse acts as the counterparty.
An upfront payment, if any, made by the Fund is recorded as an asset in the Statement of Assets and Liabilities. An upfront payment, if any, received by the Fund is recorded as a liability in the Statement of Assets and Liabilities. Payments received or made at the end of the measurement period are recorded as realized gain or loss in the Statement of Operations.
Credit default swaps are agreements between a buyer and a seller of protection against predefined credit events for the reference entity. The Fund may enter into credit default swaps to gain exposure to an underlying issuer’s credit quality characteristics without directly investing in that issuer or to hedge against the risk of a credit event on debt securities. As a seller of a credit default swap, the Fund is required to pay the par (or other agreed-upon) value of the referenced entity to the counterparty with the occurrence of a credit event by a third party, such as a U.S. or foreign corporate issuer, on the reference entity, which would likely result in a loss to the Fund. In return, the Fund receives from the counterparty a periodic stream of payments over the term of the swap provided that no credit event has occurred. If no credit event occurs, the Fund keeps the stream of payments with no payment obligations. The Fund may also buy credit default swaps, in which case the Fund functions as the counterparty referenced above. This involves the risk that the swap may expire worthless. It also involves counterparty risk that the seller may fail to satisfy its payment obligations to the Fund with the occurrence of a credit event. When the Fund sells a credit default swap, it will cover its commitment. This may be achieved by, among other methods, maintaining cash or liquid assets equal to the aggregate notional value of the reference entities for all outstanding credit default swaps sold by the Fund. For the year ended December 31, 2018, the Fund entered into credit default swap agreements to gain exposure to the underlying issuer’s credit quality characteristics and to hedge the risk of default or other specified credit events on portfolio assets.
Under the terms of a credit default swap, the Fund receives or makes periodic payments based on a specified interest rate on a fixed notional amount. These payments are recorded as a realized gain or loss in the Statement of Operations. Payments received or made as a result of a credit event or termination of the swap are recognized, net of a proportional amount of the upfront payment, as realized gains or losses in the Statement of Operations.
There were no open credit default swap contracts as of December 31, 2019. For the year ended December 31, 2019, the investment in credit default swap contracts purchased had a total notional amount generally indicative of a range from $0 to approximately $921,000.
The amount of unrealized and realized gains and losses on derivative instruments recognized in Fund earnings during the year ended December 31, 2019 and the related location in the accompanying Statement of Operations is summarized in the following tables by primary underlying risk exposure:
| | | | | | | | | | | | | | | | |
| Realized Gain (Loss) | | Forward
Contracts | | | Futures
Contracts | | | Swap
Contracts | | | Total | |
| Interest Rate Contracts (a) | | $ | — | | | $ | 150,877 | | | $ | — | | | $ | 150,877 | |
| Foreign Exchange Contracts (b) | | | 2,307 | | | | — | | | | — | | | | 2,307 | |
| Credit Contracts (c) | | | — | | | | — | | | | (25,964 | ) | | | (25,964 | ) |
| | | $ | 2,307 | | | $ | 150,877 | | | $ | (25,964 | ) | | $ | 127,220 | |
Each of the above derivatives is located in the following Statement of Operations accounts:
| (a) | Net realized gain (loss) from futures contracts |
| (b) | Net realized gain (loss) from forward foreign currency contracts |
| (c) | Net realized gain (loss) from swap contracts |
| | | | |
Deutsche DWS Variable Series II — DWS Multisector Income VIP | | | | | 19 |
| | | | | | | | | | | | |
| Change in Net Unrealized Appreciation (Depreciation) | | Forward
Contracts | | | Futures
Contracts | | | Total | |
| Interest Rate Contracts (d) | | $ | — | | | $ | (40,004 | ) | | $ | (40,004 | ) |
| Foreign Exchange Contracts (e) | | | (9,774 | ) | | | — | | | | (9,774 | ) |
| | | $ | (9,774 | ) | | $ | (40,004 | ) | | $ | (49,778 | ) |
Each of the above derivatives is located in the following Statement of Operations accounts:
| (d) | Change in net unrealized appreciation (depreciation) on futures |
| (e) | Change in net unrealized appreciation (depreciation) on forward foreign currency contracts |
C. Purchases and Sales of Securities
During the year ended December 31, 2019, purchases and sales of investment securities, excluding short-term investments, were as follows:
| | | | | | | | |
| | | Purchases | | | Sales | |
| Non-U.S. Treasury Obligations | | $ | 9,524,448 | | | $ | 10,259,927 | |
| U.S. Treasury Obligations | | $ | 7,066,631 | | | $ | 5,474,215 | |
D. Related Parties
Management Agreement. Under the Investment Management Agreement with DWS Investment Management Americas, Inc. (“DIMA” or the “Advisor”), an indirect, wholly owned subsidiary of DWS Group GmbH & Co. KGaA (“DWS Group”), the Advisor directs the investments of the Fund in accordance with its investment objectives, policies and restrictions. The Advisor determines the securities, instruments and other contracts relating to investments to be purchased, sold or entered into by the Fund or delegates such responsibility to the Fund’s subadvisor.
Effective May 16, 2019, DWS Alternatives Global Limited, also an indirect, wholly owned subsidiary of DWS Group, no longer serves as subadvisor for the Fund. DWS Alternatives Global Limited provided portfolio manager services to the Fund and pursuant to a sub-advisory agreement between DIMA and DWS Alternatives Global Limited, DIMA, not the Fund, compensated DWS Alternatives Global Limited for the services it provided to the Fund.
Pursuant to the Investment Management Agreement with the Advisor, the Fund pays a monthly management fee based on the Fund’s average daily net assets, computed and accrued daily and payable monthly, at the following annual rates:
| | | | |
| First $250 million | | | .550 | % |
| Next $750 million | | | .520 | % |
| Next $1.5 billion | | | .500 | % |
| Next $2.5 billion | | | .480 | % |
| Next $2.5 billion | | | .450 | % |
| Next $2.5 billion | | | .430 | % |
| Next $2.5 billion | | | .410 | % |
| Over $12.5 billion | | | .390 | % |
Accordingly, for the year ended December 31, 2019, the fee pursuant to the Investment Management Agreement was equivalent to an annual rate (exclusive of any applicable waivers/reimbursements) of 0.55% of the Fund’s average daily net assets.
For the period from January 1, 2019 through April 30, 2019, the Advisor had contractually agreed to waive its fee and/or reimburse certain operating expenses to the extent necessary to maintain the total annual operating expenses (excluding certain expenses such as extraordinary expenses, taxes, brokerage and interest expense) at 0.65%.
Effective May 1, 2019 through February 27, 2020 (See Note I), the Advisor has contractually agreed to waive its fee and/or reimburse certain operating expenses to the extent necessary to maintain the total annual operating expenses (excluding certain expenses such as extraordinary expenses, taxes, brokerage and interest expense) at 0.66%.
For the year ended December 31, 2019, fees waived and/or expenses reimbursed amounted to $151,444.
| | | | | | |
| | 20 | | | | | | Deutsche DWS Variable Series II — DWS Multisector Income VIP |
Administration Fee. Pursuant to an Administrative Services Agreement, DIMA provides most administrative services to the Fund. For all services provided under the Administrative Services Agreement, the Fund pays DIMA an annual fee (“Administration Fee”) of 0.10% of the Fund’s average daily net assets, computed and accrued daily and payable monthly. For the year ended December 31, 2019, the Administration Fee was $8,690, of which $754 is unpaid.
Service Provider Fees. DWS Service Company (“DSC”), an affiliate of the Advisor, is the transfer agent,dividend-paying agent and shareholder service agent for the Fund. Pursuant to asub-transfer agency agreement between DSC and DST Systems, Inc. (“DST”), DSC has delegated certain transfer agent,dividend-paying agent and shareholder service agent functions to DST. DSC compensates DST out of the shareholder servicing fee it receives from the Fund. For the year ended December 31, 2019, the amounts charged to the Fund by DSC aggregated $111, of which $18 is unpaid.
Typesetting and Filing Service Fees. Under an agreement with the Fund, DIMA is compensated for providing typesetting and certain regulatory filing services to the Fund. For the year ended December 31, 2019, the amount charged to the Fund by DIMA included in the Statement of Operations under “Reports to shareholders” aggregated $9,590, of which $4,433 is unpaid.
Trustees’ Fees and Expenses. The Fund paid retainer fees to each Trustee not affiliated with the Advisor, plus specified amounts to the Board Chairperson and to each committee Chairperson.
Affiliated Cash Management Vehicles. The Fund may invest uninvested cash balances in DWS Central Cash Management Government Fund and DWS ESG Liquidity Fund, affiliated money market funds which are managed by the Advisor. Each affiliated money market fund is managed in accordance withRule 2a-7 under the 1940 Act, which governs the quality, maturity, diversity and liquidity of instruments in which a money market fund may invest. DWS Central Cash Management Government Fund seeks to maintain a stable net asset value, and DWS ESG Liquidity Fund maintains a floating net asset value. The Fund indirectly bears its proportionate share of the expenses of each affiliated money market fund in which it invests. DWS Central Cash Management Government Fund does not pay the Advisor an investment management fee. To the extent that DWS ESG Liquidity Fund pays an investment management fee to the Advisor, the Advisor will waive an amount of the investment management fee payable to the Advisor by the Fund equal to the amount of the investment management fee payable on the Fund’s assets invested in DWS ESG Liquidity Fund.
Security Lending Fees. Deutsche Bank AG serves as securities lending agent for the Fund. For the year ended December 31, 2019, the Fund incurred securities lending agent fees to Deutsche Bank AG in the amount of $189.
E. Line of Credit
The Fund and other affiliated funds (the “Participants”) share in a $400 million revolving credit facility provided by a syndication of banks. The Fund may borrow for temporary or emergency purposes, including the meeting of redemption requests that otherwise might require the untimely disposition of securities. The Participants are charged an annual commitment fee which is allocated based on net assets, among each of the Participants. Interest is calculated at a rate per annum equal to the sum of the Federal Funds Rate plus 1.25 percent plus if theone-month LIBOR exceeds the Federal Funds Rate, the amount of such excess. The Fund may borrow up to a maximum of 33 percent of its net assets under the agreement. The Fund had no outstanding loans at December 31, 2019.
F. Investing inHigh-Yield Securities
High-yield debt securities or junk bonds are generally regarded as speculative with respect to the issuer’s continuing ability to meet principal and interest payments. The Fund’s performance could be hurt if an issuer of a debt security suffers an adverse change in financial condition that results in the issuer not making timely payments of interest or principal, a security downgrade or an inability to meet a financial obligation.High-yield debt securities’ total return and yield may generally be expected to fluctuate more than the total return and yield ofinvestment-grade debt securities. A real or perceived economic downturn or an increase in market interest rates could cause a decline in the value ofhigh-yield debt securities, result in increased redemptions and/or result in increased portfolio turnover, which could result in a decline in net asset value of the Fund, reduce liquidity for certain investments and/or increase costs.High-yield debt securities are often thinly traded and can be more difficult to sell and value accurately thaninvestment-grade debt securities as there may be no established secondary market. Investments in high yield debt securities could increase liquidity
| | | | |
Deutsche DWS Variable Series II — DWS Multisector Income VIP | | | | | 21 |
risk for the Fund. In addition, the market forhigh-yield debt securities can experience sudden and sharp volatility which is generally associated more with investments in stocks.
G. Investing in Emerging Markets
Investing in emerging markets may involve special risks and considerations not typically associated with investing in developed markets. These risks include revaluation of currencies, high rates of inflation or deflation, repatriation restrictions on income and capital, and future adverse political, social and economic developments. Moreover, securities issued in these markets may be less liquid, subject to government ownership controls or delayed settlements, and may have prices that are more volatile or less easily assessed than those of comparable securities of issuers in developed markets.
H. Ownership of the Fund
At December 31, 2019, one participating insurance company was the owner of record of 10% or more of the total outstanding Class A shares of the Fund, owning 97%.
I. Fund Liquidation
Upon the recommendation of the Advisor, the Fund’s Board of Trustees has authorized the Fund’s termination and liquidation, effective on or about February 27, 2020 (the “Liquidation Date”). Accordingly, the Fund will involuntarily redeem the shares of any shareholder (i.e. participating insurance company that offers the Fund) outstanding on the Liquidation Date. Existing participating insurance company investors that currently offer the Fund as an investment option may continue to offer it to their contract owners until the Liquidation Date.
| | | | | | |
| | 22 | | | | | | Deutsche DWS Variable Series II — DWS Multisector Income VIP |
Report of Independent Registered Public Accounting Firm
To the Board of Trustees of Deutsche DWS Variable Series II and Shareholders of DWS Multisector Income VIP:
Opinion on the Financial Statements
We have audited the accompanying statement of assets and liabilities of DWS Multisector Income VIP (the “Fund”) (one of the funds constituting Deutsche DWS Variable Series II) (the “Trust”), including the investment portfolio, as of December 31, 2019, and the related statement of operations for the year then ended, the statements of changes in net assets for each of the two years in the period then ended, the financial highlights for each of the five years in the period then ended and the related notes (collectively referred to as the “financial statements”). In our opinion, the financial statements present fairly, in all material respects, the financial position of the Fund (one of the funds constituting Deutsche DWS Variable Series II) at December 31, 2019, the results of its operations for the year then ended, the changes in its net assets for each of the two years in the period then ended and its financial highlights for each of the five years in the period then ended, in conformity with U.S. generally accepted accounting principles.
Basis for Opinion
These financial statements are the responsibility of the Trust’s management. Our responsibility is to express an opinion on the Fund’s financial statements based on our audits. We are a public accounting firm registered with the Public Company Accounting Oversight Board (United States) (“PCAOB”) and are required to be independent with respect to the Trust in accordance with the U.S. federal securities laws and the applicable rules and regulations of the Securities and Exchange Commission and the PCAOB.
We conducted our audits in accordance with the standards of the PCAOB. Those standards require that we plan and perform the audit to obtain reasonable assurance about whether the financial statements are free of material misstatement, whether due to error or fraud. The Trust is not required to have, nor were we engaged to perform, an audit of the Trust’s internal control over financial reporting. As part of our audits, we are required to obtain an understanding of internal control over financial reporting, but not for the purpose of expressing an opinion on the effectiveness of the Trust’s internal control over financial reporting. Accordingly, we express no such opinion.
Our audits included performing procedures to assess the risks of material misstatement of the financial statements, whether due to error or fraud, and performing procedures that respond to those risks. Such procedures included examining, on a test basis, evidence regarding the amounts and disclosures in the financial statements. Our procedures included confirmation of securities owned as of December 31, 2019, by correspondence with the custodian and others or by other appropriate auditing procedures where replies from others were not received. Our audits also included evaluating the accounting principles used and significant estimates made by management, as well as evaluating the overall presentation of the financial statements. We believe that our audits provide a reasonable basis for our opinion.

We have served as the auditor of one or more investment companies in the DWS family of funds since at least 1979, but we are unable to determine the specific year.
Boston, Massachusetts
February 14, 2020
| | | | |
Deutsche DWS Variable Series II — DWS Multisector Income VIP | | | | | 23 |
| | |
| Information About Your Fund’s Expenses | | (Unaudited) |
As an investor of the Fund, you incur two types of costs: ongoing expenses and transaction costs. Ongoing expenses include management fees and other Fund expenses. Examples of transaction costs include contract charges, which are not shown in this section. The following tables are intended to help you understand your ongoing expenses (in dollars) of investing in the Fund and to help you compare these expenses with the ongoing expenses of investing in other mutual funds. In the most recentsix-month period, the Fund limited these expenses; had it not done so, expenses would have been higher. The example in the table is based on an investment of $1,000 invested at the beginning of thesix-month period and held for the entire period (July 1, 2019 to December 31, 2019).
The tables illustrate your Fund’s expenses in two ways:
| – | | Actual Fund Return. This helps you estimate the actual dollar amount of ongoing expenses (but not transaction costs) paid on a $1,000 investment in the Fund using the Fund’s actual return during the period. To estimate the expenses you paid over the period, simply divide your account value by $1,000 (for example, an $8,600 account value divided by $1,000 = 8.6), then multiply the result by the number in the “Expenses Paid per $1,000” line under the share class you hold. |
| – | | Hypothetical 5% Fund Return. This helps you to compare your Fund’s ongoing expenses (but not transaction costs) with those of other mutual funds using the Fund’s actual expense ratio and a hypothetical rate of return of 5% per year before expenses. Examples using a 5% hypothetical Fund return may be found in the shareholder reports of other mutual funds. The hypothetical account values and expenses may not be used to estimate the actual ending account balance or expenses you paid for the period. |
Please note that the expenses shown in these tables are meant to highlight your ongoing expenses only and do not reflect any transaction costs. The “Expenses Paid per $1,000” line of the tables is useful in comparing ongoing expenses only and will not help you determine the relative total expense of owning different funds. If these transaction costs had been included, your costs would have been higher.
| | | | |
| Expenses and Value of a $1,000 Investmentfor the six months ended December 31, 2019 | | | |
| |
| Actual Fund Return | | | Class A | |
| Beginning Account Value 7/1/19 | | $ | 1,000.00 | |
| Ending Account Value 12/31/19 | | $ | 1,020.90 | |
| Expenses Paid per $1,000* | | $ | 3.36 | |
| |
| Hypothetical 5% Fund Return | | | Class A | |
| Beginning Account Value 7/1/19 | | $ | 1,000.00 | |
| Ending Account Value 12/31/19 | | $ | 1,021.88 | |
| Expenses Paid per $1,000* | | $ | 3.36 | |
| * | Expenses are equal to the Fund’s annualized expense ratio, multiplied by the average account value over the period, multiplied by 184 (the number of days in the most recentsix-month period), then divided by 365. |
| | | | |
| Annualized Expense Ratio | | Class A | |
| Deutsche DWS Variable Series II — DWS Multisector Income VIP | | | .66 | % |
For more information, please refer to the Fund’s prospectus.
These tables do not reflect charges and fees (“contract charges”) associated with the separate account that invests in the Fund or any variable life insurance policy or variable annuity contract for which the Fund is an investment option.
For an analysis of the fees associated with an investment in the Fund or similar funds, please refer to the current and hypothetical expense calculators for Variable Insurance Products which can be found at dws.com/calculators.
| | | | | | |
| | 24 | | | | | | Deutsche DWS Variable Series II — DWS Multisector Income VIP |
| | |
| Tax Information | | (Unaudited) |
Please consult a tax advisor if you have questions about federal or state income tax laws, or on how to prepare your tax returns. If you have specific questions about your account, please contact your insurance provider.
Proxy Voting
The Trust’s policies and procedures for voting proxies for portfolio securities and information about how the Trust voted proxies related to its portfolio securities during the most recent12-month period ended June 30 are available on our Web site — dws.com/en-us/resources/proxy-voting — or on the SEC’s Web site — sec.gov. To obtain a written copy of the Trust’s policies and procedures without charge, upon request, call us toll free at (800)728-3337.
| | | | |
Deutsche DWS Variable Series II — DWS Multisector Income VIP | | | | | 25 |
Advisory Agreement Board Considerations and Fee Evaluation
The Board of Trustees (hereinafter referred to as the “Board” or “Trustees”) approved the renewal of DWS Multisector Income VIP’s (the “Fund”) investment management agreement (the “Agreement”) with DWS Investment Management Americas, Inc. (“DIMA”) in September 2019.
In terms of the process that the Board followed prior to approving the Agreement, shareholders should know that:
| – | | During the entire process, all of the Fund’s Trustees were independent of DIMA and its affiliates (the “Independent Trustees”). |
| – | | The Board met frequently during the past year to discuss fund matters and dedicated a substantial amount of time to contract review matters. Over the course of several months, the Board’s Contract Committee reviewed extensive materials received from DIMA, independent third parties and independent counsel. These materials included an analysis of the Fund’s performance, fees and expenses, and profitability from a fee consultant retained by the Fund’s Independent Trustees (the “Fee Consultant”). Based on its evaluation of the information provided, the Contract Committee presented its findings and recommendations to the Board. The Board then reviewed the Contract Committee’s findings and recommendations. |
| – | | The Board also received extensive information throughout the year regarding performance of the Fund. |
| – | | The Independent Trustees regularly met privately with counsel to discuss contract review and other matters. In addition, the Independent Trustees were advised by the Fee Consultant in the course of their review of the Fund’s contractual arrangements and considered a comprehensive report prepared by the Fee Consultant in connection with their deliberations. |
| – | | In connection with reviewing the Agreement, the Board also reviewed the terms of the Fund’s distribution agreement, administrative services agreement, transfer agency agreement and other material service agreements. |
In connection with the contract review process, the Contract Committee and the Board considered the factors discussed below, among others. The Board also considered that DIMA and its predecessors have managed the Fund since its inception, and the Board believes that a long-term relationship with a capable, conscientious advisor is in the best interests of the Fund. The Board considered, generally, that shareholders chose to invest or remain invested in the Fund knowing that DIMA managed the Fund. DIMA is part of DWS Group GmbH & Co. KGaA (“DWS Group”). DWS Group is a global asset management business that offers a wide range of investing expertise and resources, including research capabilities in many countries throughout the world. In 2018, approximately 20% of DWS Group’s shares were sold in an initial public offering, with Deutsche Bank AG owning the remaining shares.
As part of the contract review process, the Board carefully considered the fees and expenses of each DWS fund overseen by the Board in light of the fund’s performance. In many cases, this led to the negotiation and implementation of expense caps. As part of these negotiations, the Board indicated that it would consider relaxing these caps in future years following sustained improvements in performance, among other considerations.
While shareholders may focus primarily on fund performance and fees, the Fund’s Board considers these and many other factors, including the quality and integrity of DIMA’s personnel and administrative support services provided by DIMA, such as back-office operations, fund valuations, and compliance policies and procedures.
Nature, Quality and Extent of Services. The Board considered the terms of the Agreement, including the scope of advisory services provided under the Agreement. The Board noted that, under the Agreement, DIMA provides portfolio management services to the Fund and that, pursuant to a separate administrative services agreement, DIMA provides administrative services to the Fund. The Board considered the experience and skills of senior management and investment personnel and the resources made available to such personnel. The Board reviewed the Fund’s performance over short-term and long-term periods and compared those returns to various agreed-upon performance measures, including market index(es) and a peer universe compiled using information supplied by Morningstar Direct (“Morningstar”), an independent fund data service. The Board also noted that it has put into place a process of identifying “Funds in Review” (e.g., funds performing poorly relative to a peer universe), and receives additional reporting from DIMA regarding such funds and, where appropriate, DIMA’s plans to address underperformance. The Board
| | | | | | |
| | 26 | | | | | | Deutsche DWS Variable Series II — DWS Multisector Income VIP |
believes this process is an effective manner of identifying and addressing underperforming funds. Based on the information provided, the Board noted that, for the one-, three- and five-year periods ended December 31, 2018, the Fund’s performance (Class A shares) was in the 3rd quartile, 3rd quartile and 4th quartile, respectively, of the applicable Morningstar universe (the 1st quartile being the best performers and the 4th quartile being the worst performers). The Board also observed that the Fund has underperformed its benchmark in the one-, three- and five-year periods ended December 31, 2018.
Fees and Expenses. The Board considered the Fund’s investment management fee schedule, operating expenses and total expense ratios, and comparative information provided by Broadridge Financial Solutions, Inc. (“Broadridge”) and the Fee Consultant regarding investment management fee rates paid to other investment advisors by similar funds (1st quartile being the most favorable and 4th quartile being the least favorable). With respect to management fees paid to other investment advisors by similar funds, the Board noted that the contractual fee rates paid by the Fund, which include a 0.10% fee paid to DIMA under the Fund’s administrative services agreement, were higher than the median (3rd quartile) of the applicable Broadridge peer group (based on Broadridge data provided as of December 31, 2018). The Board noted that the Fund’s Class A shares total (net) operating expenses were expected to be higher than the median (3rd quartile) of the applicable Broadridge expense universe (based on Broadridge data provided as of December 31, 2018, and analyzing Broadridge expense universe Class A (net) expenses less any applicable 12b-1 fees) (“Broadridge Universe Expenses”). The Board noted that the expense limitation agreed to by DIMA was expected to help the Fund’s total (net) operating expenses remain competitive. The Board considered the Fund’s management fee rate as compared to fees charged by DIMA to a comparable DWS U.S. registered fund (“DWS Funds”) and considered differences between the Fund and the comparable DWS Fund. The information requested by the Board as part of its review of fees and expenses also included information about institutional accounts (including any sub-advised funds and accounts) and funds offered primarily to European investors (“DWS Europe Funds”) managed by DWS Group. The Board noted that DIMA indicated that DWS Group does not manage any institutional accounts or DWS Europe Funds comparable to the Fund.
On the basis of the information provided, the Board concluded that management fees were reasonable and appropriate in light of the nature, quality and extent of services provided by DIMA.
Profitability. The Board reviewed detailed information regarding revenues received by DIMA under the Agreement. The Board considered the estimated costs to DIMA, and pre-tax profits realized by DIMA, from advising the DWS Funds, as well as estimates of the pre-tax profits attributable to managing the Fund in particular. The Board also received information regarding the estimated enterprise-wide profitability of DIMA and its affiliates with respect to all fund services in totality and by fund. The Board and the Fee Consultant reviewed DIMA’s methodology in allocating its costs to the management of the Fund. Based on the information provided, the Board concluded that the pre-tax profits realized by DIMA in connection with the management of the Fund were not unreasonable. The Board also reviewed certain publicly available information regarding the profitability of certain similar investment management firms. The Board noted that, while information regarding the profitability of such firms is limited (and in some cases is not necessarily prepared on a comparable basis), DIMA and its affiliates’ overall profitability with respect to the DWS Funds (after taking into account distribution and other services provided to the funds by DIMA and its affiliates) was lower than the overall profitability levels of most comparable firms for which such data was available.
Economies of Scale. The Board considered whether there are economies of scale with respect to the management of the Fund and whether the Fund benefits from any economies of scale. The Board noted that the Fund’s investment management fee schedule includes fee breakpoints. The Board concluded that the Fund’s fee schedule represents an appropriate sharing between the Fund and DIMA of such economies of scale as may exist in the management of the Fund at current asset levels.
Other Benefits to DIMA and Its Affiliates. The Board also considered the character and amount of other incidental or “fall-out” benefits received by DIMA and its affiliates, including any fees received by DIMA for administrative services provided to the Fund and any fees received by an affiliate of DIMA for transfer agency services provided to the Fund. The Board also considered benefits to DIMA related to brokerage and soft-dollar allocations, including allocating brokerage to pay for research generated by parties other than the executing broker dealers, which pertain primarily to funds investing in equity securities. In addition, the Board considered the incidental public relations benefits to DIMA related to DWS Funds advertising and cross-selling opportunities among DIMA products and services. The Board considered these benefits in reaching its conclusion that the Fund’s management fees were reasonable.
| | | | |
Deutsche DWS Variable Series II — DWS Multisector Income VIP | | | | | 27 |
Compliance. The Board considered the significant attention and resources dedicated by DIMA to its compliance processes in recent years. The Board noted in particular (i) the experience, seniority and time commitment of the individuals serving as DIMA’s and the Fund’s chief compliance officers and (ii) the substantial commitment of resources by DIMA and its affiliates to compliance matters, including the retention of compliance personnel.
Based on all of the information considered and the conclusions reached, the Board determined that the continuation of the Agreement is in the best interests of the Fund. In making this determination, the Board did not give particular weight to any single factor identified above. The Board considered these factors over the course of numerous meetings, certain of which were in executive session with only the Independent Trustees and counsel present. It is possible that individual Independent Trustees may have weighed these factors differently in reaching their individual decisions to approve the continuation of the Agreement.
| | | | | | |
| | 28 | | | | | | Deutsche DWS Variable Series II — DWS Multisector Income VIP |
Board Members and Officers
The following table presents certain information regarding the Board Members and Officers of the Trust/Corporation. Each Board Member’s year of birth is set forth in parentheses after his or her name. Unless otherwise noted, (i) each Board Member has engaged in the principal occupation(s) noted in the table for at least the most recent five years, although not necessarily in the same capacity; and (ii) the address of each Independent Board Member is Keith R. Fox, DWS Funds Board Chair, c/o Thomas R. Hiller, Ropes & Gray LLP, Prudential Tower, 800 Boylston Street, Boston, MA02199-3600. Except as otherwise noted below, the term of office for each Board Member is until the election and qualification of a successor, or until such Board Member sooner dies, resigns, is removed or as otherwise provided in the governing documents of the Trust/Corporation. Because the Fund does not hold an annual meeting of shareholders, each Board Member will hold office for an indeterminate period.
The Board Members may also serve in similar capacities with other funds in the fund complex. The number of funds in DWS fund complex shown in the table below includes all registered open- and closed-end funds (including all of their portfolios) advised by the Advisor and any registered funds that have an investment advisor that is an affiliated person of the Advisor.
| | | | | | | | |
| Independent Board Members | | | | | |
Name, Year of Birth,
Position with the Trust/
Corporation and
Length of Time Served1 | | Business Experience and Directorships During the Past Five Years | | Number of
Funds in
DWS Fund
Complex
Overseen | | | Other
Directorships
Held by Board
Member
|
Keith R. Fox, CFA (1954) Chairperson since 2017, and Board Member since 1996 | | Managing General Partner, Exeter Capital Partners (a series of private investment funds) (since 1986). Directorships: ICI Mutual Insurance Company; Progressive International Corporation (kitchen goods importer and distributor); former Chairman, National Association of Small Business Investment Companies; former Directorships: The Kennel Shop (retailer); BoxTop Media Inc. (advertising); Sun Capital Advisers Trust (mutual funds) (2011–2012) | | | 77 | | | — |
John W. Ballantine (1946) Board Member since 1999 | | Retired; formerly, Executive Vice President and Chief Risk Management Officer, First Chicago NBD Corporation/The First National Bank of Chicago (1996–1998); Executive Vice President and Head of International Banking (1995–1996); former Directorships: Director and Chairman of the Board, Healthways, Inc.2 (population well-being and wellness services) (2003–2014); Stockwell Capital Investments PLC (private equity); Enron Corporation; FNB Corporation; Tokheim Corporation; First Oak Brook Bancshares, Inc.; Oak Brook Bank; and Prisma Energy International. Not-for-Profit Director/Trustee: Palm Beach Civic Association; Window to the World Communications (public media); Life Director of Harris Theater for Music and Dance (Chicago); Life Director of Hubbard Street Dance Chicago; former Not-for-Profit Directorships: Public Radio International | | | 77 | | | Portland
General
Electric2
(utility
company)
(2003–
present) |
Dawn-Marie Driscoll (1946) Board Member since 1987 | | Emeritus Executive Fellow, Center for Business Ethics, Bentley University; formerly: Partner, Palmer & Dodge (law firm) (1988–1990); Vice President of Corporate Affairs and General Counsel, Filene’s (retail) (1978–1988). Directorships: Advisory Board, Center for Business Ethics, Bentley University; Trustee and former Chairman of the Board, Southwest Florida Community Foundation (charitable organization); former Directorships: ICI Mutual Insurance Company (2007–2015); Sun Capital Advisers Trust (mutual funds) (2007–2012), Investment Company Institute (audit, executive, nominating committees) and Independent Directors Council (governance, executive committees) | | | 77 | | | — |
Richard J. Herring (1946) Board Member since 1990 | | Jacob Safra Professor of International Banking and Professor of Finance, The Wharton School, University of Pennsylvania (since July 1972); Director, The Wharton Financial Institutions Center (since 1994); formerly: Vice Dean and Director, Wharton Undergraduate Division (1995–2000) and Director, The Lauder Institute of International Management Studies (2000–2006); Member FDIC Systemic Risk Advisory Committee since 2011, member Systemic Risk Council since 2012 and member of the Advisory Board at the Yale Program on Financial Stability since 2013; Formerly Co-Chair of the Shadow Financial Regulatory Committee (2003–2015), Executive Director of The Financial Economists Roundtable (2008–2015), Director of The Thai Capital Fund (2007–2013), Director of The Aberdeen Singapore Fund (2007–2018), and Nonexecutive Director of Barclays Bank DE (2010–2018) | | | 77 | | | Director,
Aberdeen
Japan Fund
(since 2007) |
| | | | |
Deutsche DWS Variable Series II — DWS Multisector Income VIP | | | | | 29 |
| | | | | | | | |
Name, Year of Birth,
Position with the Trust/
Corporation and
Length of Time Served1 | | Business Experience and Directorships During the Past Five Years | | Number of
Funds in
DWS Fund
Complex
Overseen | | | Other
Directorships
Held by Board
Member
|
William McClayton (1944) Board Member since 2004 | | Private equity investor (since October 2009); previously, Managing Director, Diamond Management & Technology Consultants, Inc. (global consulting firm) (2001–2009); Directorship: Board of Managers, YMCA of Metropolitan Chicago; formerly: Senior Partner, Arthur Andersen LLP (accounting) (1966–2001); Trustee, Ravinia Festival | | | 77 | | | — |
Rebecca W. Rimel (1951) Board Member since 1995 | | President, Chief Executive Officer and Director, The Pew Charitable Trusts (charitable organization) (1994–present); formerly: Executive Vice President, The Glenmede Trust Company (investment trust and wealth management) (1983–2004); Board Member, Investor Education (charitable organization) (2004–2005); Trustee, Executive Committee, Philadelphia Chamber of Commerce (2001–2007); Director, Viasys Health Care2 (January 2007–June 2007); Trustee, Thomas Jefferson Foundation (charitable organization) (1994–2012) | | | 77 | | | Director,
Becton
Dickinson
and
Company2
(medical
technology
company)
(2012–
present);
Director,
BioTelemetry
Inc.2(health
care) (2009–
present) |
William N. Searcy, Jr. (1946) Board Member since 1993 | | Private investor since October 2003; formerly: Pension & Savings Trust Officer, Sprint Corporation2(telecommunications) (November 1989–September 2003); Trustee, Sun Capital Advisers Trust (mutual funds) (1998–2012) | | | 77 | | | — |
| | |
| Officers4 | | |
Name, Year of Birth,
Position with the Trust/
Corporation and
Length of Time Served5 | | Business Experience and Directorships During the Past Five Years |
Hepsen Uzcan6(1974) President and Chief Executive Officer, 2017–present | | Managing Director,3 DWS; Secretary, DWS USA Corporation (2018–present); Assistant Secretary, DWS Distributors, Inc. (2018–present); Director and Vice President, DWS Service Company (2018–present); Assistant Secretary, DWS Investment Management Americas, Inc. (2018–present); and Director and President, DB Investment Managers, Inc. (2018–present); formerly: Vice President for the Deutsche funds (2016–2017); Assistant Secretary for the DWS funds (2013–2019) |
John Millette7(1962) Vice President and Secretary, 1999–present | | Director,3DWS; Chief Legal Officer, DWS Investment Management Americas, Inc. (2015–present); Director and Vice President, DWS Trust Company (2016–present); and Assistant Secretary, DBX ETF Trust (2019–present); formerly: Secretary, Deutsche Investment Management Americas Inc. (2015–2017) |
Diane Kenneally7(1966) Chief Financial Officer and Treasurer, 2018–present | | Director,3 DWS; and Treasurer, Chief Financial Officer and Controller, DBX ETF Trust (2019–present); formerly: Assistant Treasurer for the DWS funds (2007–2018) |
Paul Antosca7(1957) Assistant Treasurer, 2007–present | | Director,3DWS; and Assistant Treasurer, DBX ETF Trust (2019–present) |
Sheila Cadogan7(1966) Assistant Treasurer, 2017–present | | Director,3DWS; Director and Vice President, DWS Trust Company (2018–present); and Assistant Treasurer, DBX ETF Trust (2019–present) |
Scott D. Hogan7(1970) Chief Compliance Officer, 2016–present | | Director,3DWS |
Caroline Pearson7(1962) Chief Legal Officer, 2010–present | | Managing Director,3DWS; formerly: Secretary, Deutsche AM Distributors, Inc. (2002–2017); and Secretary, Deutsche AM Service Company (2010–2017) |
Wayne Salit6(1967) Anti-Money Laundering Compliance Officer, 2014–present | | Director,3 Deutsche Bank; and AML Officer, DWS Trust Company; formerly: Managing Director, AML Compliance Officer at BNY Mellon (2011–2014); and Director, AML Compliance Officer at Deutsche Bank (2004–2011) |
Ciara Crawford8 (1984) Assistant Secretary, (2019–present) | | Associate, DWS (since 2015); previously, Legal Assistant at Accelerated Tax Solutions. |
| | | | | | |
| | 30 | | | | | | Deutsche DWS Variable Series II — DWS Multisector Income VIP |
| 1 | The length of time served represents the year in which the Board Member joined the board of one or more DWS funds currently overseen by the Board. |
| 2 | A publicly held company with securities registered pursuant to Section 12 of the Securities Exchange Act of 1934. |
| 3 | Executive title, not a board directorship. |
| 4 | As a result of their respective positions held with the Advisor or its affiliates, these individuals are considered “interested persons” of the Advisor within the meaning of the 1940 Act. Interested persons receive no compensation from the Fund. |
| 5 | The length of time served represents the year in which the officer was first elected in such capacity for one or more DWS funds. |
| 6 | Address: 875 Third Avenue, New York, NY 10022. |
| 7 | Address: One International Place, Boston, MA 02110. |
| 8 | Address: 5022 Gate Parkway, Suite 400, Jacksonville, FL 32256. |
The Fund’s Statement of Additional Information (“SAI”) includes additional information about the Board Members. The SAI is available, without charge, upon request. If you would like to request a copy of the SAI, you may do so by calling the followingtoll-free number:(800) 728-3337.
| | | | |
Deutsche DWS Variable Series II — DWS Multisector Income VIP | | | | | 31 |
| | |
| | |
VS2MSI-2 (R-025836-9 2/20) | | |
December 31, 2019
Annual Report
Deutsche DWS Variable Series II
DWS Small Mid Cap Growth VIP
Beginning on January 1, 2021, as permitted by regulations adopted by the Securities and Exchange Commission, you may not be receiving paper copies of the Fund’s shareholder reports from the insurance company that offers your contract unless you specifically request paper copies from your insurance company or from your financial intermediary. Instead, the shareholder reports will be made available on a Web site, and your insurance company will notify you by mail each time a report is posted and provide you with a Web site link to access the report. Instructions for requesting paper copies will be provided by your insurance company.
If you already elected to receive shareholder reports electronically, you will not be affected by this change and you need not take any action. You may elect to receive shareholder reports and other communications from your insurance company electronically by following the instructions provided by your insurance company.
You may elect to receive all future reports in paper free of charge from your insurance company. If your insurance company informs you that future reports will be delivered via Web access, you can inform your insurance company that you wish to continue receiving paper copies of your shareholder reports by following the instructions provided by your insurance company.

Contents
This report must be preceded or accompanied by a prospectus. To obtain an additional prospectus or summary prospectus, if available, call (800)728-3337 or your financial representative. We advise you to consider the Fund’s objectives, risks, charges and expenses carefully before investing. The summary prospectus and prospectus contain this and other important information about the Fund. Please read the prospectus carefully before you invest.
Stocks may decline in value. Smaller and medium company stocks tend to be more volatile than large company stocks. Any fund that focuses in a particular segment of the market or region of the world will generally be more volatile than a fund that invests more broadly. The fund may lend securities to approved institutions. Please read the prospectus for details.
The brand DWS represents DWS Group GmbH & Co. KGaA and any of its subsidiaries such as DWS Distributors, Inc. which offers investment products or DWS Investment Management Americas, Inc. and RREEF America L.L.C. which offer advisory services.
DWS Distributors, Inc., 222 South Riverside Plaza, Chicago, IL 60606, (800)621-1148
NOT FDIC/NCUA INSURED NO BANK GUARANTEE MAY LOSE VALUE NOT A DEPOSIT
NOT INSURED BY ANY FEDERAL GOVERNMENT AGENCY
| | | | | | |
| | 2 | | | | | | Deutsche DWS Variable Series II — DWS Small Mid Cap Growth VIP |
| | |
| Performance Summary | | December 31, 2019 (Unaudited) |
Fund performance shown is historical, assumes reinvestment of all dividend and capital gain distributions and does not guarantee future results. Investment return and principal value fluctuate with changing market conditions so that, when redeemed, shares may be worth more or less than their original cost. Current performance may be lower or higher than the performance data quoted. Please contact your participating insurance company for the Fund’s most recentmonth-end performance. Performance does not reflect charges and fees (“contract charges”) associated with the separate account that invests in the Fund or any variable life insurance policy or variable annuity contract for which the Fund is an investment option. These charges and fees will reduce returns.
The gross expense ratio of the Fund, as stated in the fee table of the prospectus dated May 1, 2019 is 0.81% for Class A shares and may differ from the expense ratio disclosed in the Financial Highlights table in this report.
Generally accepted accounting principles require adjustments to be made to the net assets of the Fund at period end for financial reporting purposes only, and as such, the total return based on the unadjusted net asset value per share may differ from the total return reported in the financial highlights.
Growth of an Assumed $10,000 Investment
| | |
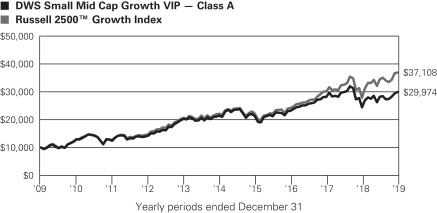
| | The Russell 2500TM Growth Index is an unmanaged index that measures the performance of the small- to mid-cap growth segment of the U.S. equity universe. It includes those Russell 2500 companies with higher price-to-book ratios and higher forecasted growth values. Index returns do not reflect any fees or expenses and it is not possible to invest directly into an index. |
| | | | | | | | | | |
| Comparative Results | | | | | | | | | | |
| | | | |
| DWS Small Mid Cap Growth VIP | | 1-Year | | 3-Year | | 5-Year | | 10-Year |
| Class A | | Growth of $10,000 | | $12,241 | | $12,918 | | $13,964 | | $29,974 |
| | | Average annual total return | | 22.41% | | 8.91% | | 6.91% | | 11.60% |
| Russell 2500 Growth Index | | Growth of $10,000 | | $13,265 | | $15,277 | | $16,732 | | $37,108 |
| | | Average annual total return | | 32.65% | | 15.17% | | 10.84% | | 14.01% |
The growth of $10,000 is cumulative.
| | | | |
Deutsche DWS Variable Series II — DWS Small Mid Cap Growth VIP | | | | | 3 |
| | |
| Management Summary | | December 31, 2019 (Unaudited) |
For the12-month period ended December 31, 2019, the Fund returned 22.41% (Class A shares, unadjusted for contract charges), compared with the 32.65% return of the Russell 2500™ Growth Index.
Global equities performed very well in 2019, reflecting the shift by the U.S. Federal Reserve and other major central banks toward more accommodative policies. In combination with a slow but positive economic expansion and continued growth in corporate earnings, the move to a lower interest-rate regime boosted investors’ appetite for risk assets including stocks.
The portfolio’s underperformance derived in part from sector allocation, as an underweight in information technology and a slight overweight within energy detracted from returns. In addition, stock selection within health care, consumer discretionary and financials weighed on performance. Stock selection within industrials, consumer staples, information technology and energy was positive. The top individual contributors to performance were outpatient diagnostic imaging company Radnet, Inc., homebuilding products and insulation installer TopBuild Corp. and enterprise software company Tyler Technologies, Inc. Radnet’s favorable results demonstrated that patients are moving from higher cost hospital imaging to Radnet’s lower cost outpatient centers, resulting in strong performance. TopBuild, a commercial and residential distributor and installer of insulation products, reported financial results that were consistently higher than expected, as low interest rates aided housing starts and strong pricing power boosted margins. Tyler Technologies, which provides software services to municipal and county governments, contributed positively as the company’s pipeline of new business continued to be strong, leading to better bookings and higher subscription revenue growth. Stock selection within health care, consumer discretionary and financials was negative. The Fund struggled within the biotechnology industry, as stock selection there was negative amid an active merger & acquisition environment, and with drug approvals and product failures receiving outsized reactions by investors. The largest individual detractors from performance were Retrophin, Inc., iRobot Corp. and Green Dot Corp. The Fund’s cash position also detracted amid a strong equity market environment. The biopharmaceutical company Retrophin was the most notable detractor as one of the company’s key drugs failed to meet expectations, causing the stock to fall sharply inmid-August. In addition, iRobot’s shares were negatively impacted after the company reported its first revenue disappointment in several years, higher product prices due to tariffs, and uncertainty regarding new competition. The financial sector also proved to be a challenging area for the Fund during the12-month period, due in part to its position in the U.S firm Green Dot Corp. The company’s shares fell after Green Dot announced that additional capital expenditures were required to stave off new competition in its core reloadable debit-card business, and for new product launches.
We continue to position the Fund for sustained economic recovery and remain focused on ourbottom-up stock selection process. We maintain a long-term perspective, investing in quality small- andmid-cap growth companies whose shares trade at attractive valuations, with strong management teams that align shareholders’ interests with their own. The past year brought outperformance for fast-growing and momentum-oriented equities on one hand, and defensive stocks on the other. This environment worked against the Fund, as the steady growth companies that we emphasize lagged during the rally.
Peter Barsa, Director
Michael A. Sesser, CFA, Director
Portfolio Managers
The views expressed reflect those of the portfolio management team only through the end of the period of the report as stated on the cover. The management team’s views are subject to change at any time based on market and other conditions and should not be construed as a recommendation. Past performance is no guarantee of future results. Current and future portfolio holdings are subject to risk.
Terms to Know
The Russell 2500 Growth Indexis an unmanaged index that measures the performance of the small- to mid-cap growth segment of the U.S. equity universe. It includes those Russell 2500 companies with higherprice-to-book ratios and higher forecasted growth values. Index returns do not reflect any fees or expenses and it is not possible to invest directly into an index.
Overweightmeans that the Fund holds a higher weighting in a given sector or security than the benchmark.Underweightmeans that the Fund holds a lower weighting.
Contribution anddetractionincorporate both a stock’s total return and its weighting in the Fund.
| | | | | | |
| | 4 | | | | | | Deutsche DWS Variable Series II — DWS Small Mid Cap Growth VIP |
| | |
| Portfolio Summary | | (Unaudited) |
| | | | | | | | |
| Asset Allocation (As a % of Investment Portfolio excluding Securities Lending Collateral) | | 12/31/19 | | | 12/31/18 | |
| Common Stocks | | | 98% | | | | 93% | |
| Cash Equivalents | | | 1% | | | | 6% | |
| Convertible Preferred Stock | | | 1% | | | | 1% | |
| | | | 100% | | | | 100% | |
| | |
Sector Diversification
(As a % of Investment Portfolio excluding Cash Equivalents and Securities Lending Collateral) | | 12/31/19 | | | 12/31/18 | |
Information Technology | | | 24% | | | | 22% | |
Health Care | | | 24% | | | | 25% | |
Industrials | | | 20% | | | | 18% | |
Consumer Discretionary | | | 15% | | | | 16% | |
Financials | | | 6% | | | | 7% | |
Real Estate | | | 4% | | | | 3% | |
Materials | | | 3% | | | | 4% | |
Consumer Staples | | | 2% | | | | 2% | |
Communication Services | | | 1% | | | | 1% | |
Energy | | | 1% | | | | 2% | |
| | | | 100% | | | | 100% | |
Portfolio holdings and characteristics are subject to change.
For more complete details about the Fund’s investment portfolio, see page 6.
Following the Fund’s fiscal first and thirdquarter-end, a complete portfolio holdings listing is filed with the SEC on Form N-PORT. The Fund’s Form N-PORT will be available on the SEC’s Web site at sec.gov. The Fund’s portfolio holdings are also posted on dws.com from time to time. Please read the Fund’s current prospectus for more information.
| | | | |
Deutsche DWS Variable Series II — DWS Small Mid Cap Growth VIP | | | | | 5 |
| | |
| Investment Portfolio | | as of December 31, 2019 |
| | | | | | | | |
| | | Shares | | | Value ($) | |
| Common Stocks 98.0% | | | | |
| Communication Services 1.1% | |
Entertainment | |
| | |
Cinemark Holdings, Inc. | | | 12,290 | | | | 416,016 | |
| | |
Take-Two Interactive Software, Inc.* | | | 2,174 | | | | 266,163 | |
| | | | | | | | |
| | | | 682,179 | |
|
| Consumer Discretionary 14.3% | |
Auto Components 0.9% | |
| | |
Gentherm, Inc.* | | | 7,364 | | | | 326,888 | |
| | |
Tenneco, Inc. “A” | | | 18,953 | | | | 248,284 | |
| | | | | | | | |
| | | | 575,172 | |
|
Diversified Consumer Services 2.2% | |
| | |
Bright Horizons Family Solutions, Inc.* | | | 7,023 | | | | 1,055,487 | |
| | |
ServiceMaster Global Holdings, Inc.* | | | 9,448 | | | | 365,260 | |
| | | | | | | | |
| | | | 1,420,747 | |
|
Hotels, Restaurants & Leisure 1.7% | |
| | |
Hilton Grand Vacations, Inc.* | | | 14,583 | | | | 501,509 | |
| | |
Jack in the Box, Inc. | | | 7,892 | | | | 615,813 | |
| | | | | | | | |
| | | | 1,117,322 | |
|
Household Durables 3.7% | |
| | |
Helen of Troy Ltd.* | | | 6,092 | | | | 1,095,281 | |
| | |
iRobot Corp.* (a) | | | 10,403 | | | | 526,704 | |
| | |
TopBuild Corp.* | | | 7,103 | | | | 732,177 | |
| | | | | | | | |
| | | | 2,354,162 | |
|
Internet & Direct Marketing Retail 0.3% | |
Grubhub, Inc.* | | | 3,663 | | | | 178,168 | |
|
Leisure Products 0.9% | |
YETI Holdings, Inc.* (a) | | | 16,312 | | | | 567,332 | |
|
Specialty Retail 3.6% | |
| | |
Burlington Stores, Inc.* | | | 5,895 | | | | 1,344,237 | |
| | |
Camping World Holdings, Inc. “A” | | | 36,664 | | | | 540,427 | |
| | |
The Children’s Place, Inc. (a) | | | 7,128 | | | | 445,643 | |
| | | | | | | | |
| | | | 2,330,307 | |
|
Textiles, Apparel & Luxury Goods 1.0% | |
Carter’s, Inc. | | | 5,951 | | | | 650,682 | |
|
| Consumer Staples 2.0% | |
Food & Staples Retailing 1.3% | |
Casey’s General Stores, Inc. | | | 5,089 | | | | 809,100 | |
|
Household Products 0.7% | |
Spectrum Brands Holdings, Inc. | | | 6,982 | | | | 448,873 | |
|
| Energy 0.9% | |
Energy Equipment & Services 0.4% | |
Dril-Quip, Inc.* | | | 5,773 | | | | 270,811 | |
|
Oil, Gas & Consumable Fuels 0.5% | |
| | |
California Resources Corp.* (a) | | | 20,788 | | | | 187,716 | |
| | |
Contango Oil & Gas Co.* | | | 39,242 | | | | 144,018 | |
| | | | | | | | |
| | | | 331,734 | |
|
| Financials 6.0% | |
Banks 4.5% | |
| | |
Eagle Bancorp., Inc. | | | 4,767 | | | | 231,819 | |
| | |
Pinnacle Financial Partners, Inc. | | | 7,304 | | | | 467,456 | |
| | | | | | | | |
| | | Shares | | | Value ($) | |
| | |
South State Corp. | | | 8,024 | | | | 696,082 | |
| | |
SVB Financial Group* | | | 2,996 | | | | 752,116 | |
| | |
Synovus Financial Corp. | | | 17,695 | | | | 693,644 | |
| | | | | | | | |
| | | | 2,841,117 | |
|
Capital Markets 1.3% | |
| | |
Lazard Ltd. “A” | | | 13,717 | | | | 548,131 | |
| | |
Moelis & Co. “A” | | | 9,136 | | | | 291,621 | |
| | | | | | | | |
| | | | 839,752 | |
|
Consumer Finance 0.2% | |
Green Dot Corp. “A”* | | | 6,162 | | | | 143,575 | |
|
| Health Care 22.9% | |
Biotechnology 7.9% | |
| | |
Acceleron Pharma, Inc.* | | | 3,899 | | | | 206,725 | |
| | |
Alkermes PLC* | | | 10,757 | | | | 219,443 | |
| | |
Amicus Therapeutics, Inc.* | | | 17,294 | | | | 168,444 | |
| | |
Arena Pharmaceuticals, Inc.* | | | 7,158 | | | | 325,116 | |
| | |
Biohaven Pharmaceutical Holding Co., Ltd.* | | | 6,937 | | | | 377,650 | |
| | |
Bluebird Bio, Inc.* | | | 2,317 | | | | 203,317 | |
| | |
Blueprint Medicines Corp.* | | | 4,684 | | | | 375,235 | |
| | |
Emergent BioSolutions, Inc.* | | | 11,619 | | | | 626,845 | |
| | |
Global Blood Therapeutics, Inc.* | | | 3,700 | | | | 294,113 | |
| | |
Heron Therapeutics, Inc.* | | | 22,719 | | | | 533,896 | |
| | |
Ligand Pharmaceuticals, Inc.* | | | 3,112 | | | | 324,550 | |
| | |
Neurocrine Biosciences, Inc.* | | | 10,195 | | | | 1,095,861 | |
| | |
Retrophin, Inc.* | | | 23,478 | | | | 333,388 | |
| | | | | | | | |
| | | | 5,084,583 | |
|
Health Care Equipment & Supplies 4.1% | |
| | |
Cardiovascular Systems, Inc.* | | | 11,951 | | | | 580,699 | |
| | |
Globus Medical, Inc. “A”* | | | 6,168 | | | | 363,172 | |
| | |
iRhythm Technologies, Inc.* | | | 3,325 | | | | 226,399 | |
| | |
Masimo Corp.* | | | 5,052 | | | | 798,519 | |
| | |
Natus Medical, Inc.* | | | 12,922 | | | | 426,297 | |
| | |
Tandem Diabetes Care, Inc.* | | | 4,219 | | | | 251,494 | |
| | | | | | | | |
| | | | 2,646,580 | |
|
Health Care Providers & Services 8.0% | |
| | |
AMN Healthcare Services, Inc.* | | | 15,169 | | | | 945,180 | |
| | |
HealthEquity, Inc.* | | | 1,929 | | | | 142,881 | |
| | |
Molina Healthcare, Inc.* | | | 7,851 | | | | 1,065,302 | |
| | |
Option Care Health, Inc.* | | | 197,723 | | | | 737,507 | |
| | |
Providence Service Corp.* | | | 13,693 | | | | 810,352 | |
| | |
RadNet, Inc.* | | | 55,477 | | | | 1,126,183 | |
| | |
Tivity Health, Inc.* | | | 13,396 | | | | 272,542 | |
| | | | | | | | |
| | | | 5,099,947 | |
|
Health Care Technology 1.0% | |
HMS Holdings Corp.* | | | 21,178 | | | | 626,869 | |
|
Pharmaceuticals 1.9% | |
| | |
ANI Pharmaceuticals, Inc.* | | | 8,521 | | | | 525,490 | |
| | |
Avadel Pharmaceuticals PLC (ADR)* (a) | | | 23,243 | | | | 175,485 | |
| | |
Pacira BioSciences, Inc.* | | | 11,807 | | | | 534,857 | |
| | | | | | | | |
| | | | 1,235,832 | |
|
| Industrials 19.2% | |
Aerospace & Defense 1.1% | |
HEICO Corp. | | | 6,086 | | | | 694,717 | |
The accompanying notes are an integral part of the financial statements.
| | | | | | |
| | 6 | | | | | | Deutsche DWS Variable Series II — DWS Small Mid Cap Growth VIP |
| | | | | | | | |
| | | Shares | | | Value ($) | |
Building Products 4.7% | |
| | |
A.O. Smith Corp. | | | 11,719 | | | | 558,293 | |
| | |
Allegion PLC | | | 9,959 | | | | 1,240,294 | |
| | |
Fortune Brands Home & Security, Inc. | | | 11,751 | | | | 767,810 | |
| | |
Masonite International Corp.* | | | 6,705 | | | | 484,168 | |
| | | | | | | | |
| | | | 3,050,565 | |
|
Commercial Services & Supplies 2.5% | |
| | |
MSA Safety, Inc. | | | 3,599 | | | | 454,770 | |
| | |
The Brink’s Co. | | | 12,428 | | | | 1,126,971 | |
| | | | | | | | |
| | | | 1,581,741 | |
|
Construction & Engineering 0.9% | |
MasTec, Inc.* | | | 8,966 | | | | 575,258 | |
|
Electrical Equipment 1.9% | |
| | |
Generac Holdings, Inc.* | | | 1,993 | | | | 200,476 | |
| | |
Thermon Group Holdings, Inc.* | | | 39,309 | | | | 1,053,481 | |
| | | | | | | | |
| | | | 1,253,957 | |
|
Machinery 2.1% | |
| | |
Chart Industries, Inc.* | | | 8,727 | | | | 588,985 | |
| | |
Hillenbrand, Inc. | | | 10,483 | | | | 349,189 | |
| | |
IDEX Corp. | | | 2,502 | | | | 430,344 | |
| | | | | | | | |
| | | | 1,368,518 | |
|
Professional Services 1.6% | |
| | |
Kforce, Inc. | | | 22,466 | | | | 891,900 | |
| | |
Mistras Group, Inc.* | | | 7,831 | | | | 111,749 | |
| | | | | | | | |
| | | | 1,003,649 | |
|
Trading Companies & Distributors 4.4% | |
| | |
H&E Equipment Services, Inc. | | | 22,784 | | | | 761,669 | |
| | |
Rush Enterprises, Inc. “A” | | | 32,955 | | | | 1,532,408 | |
| | |
Titan Machinery, Inc.* | | | 36,290 | | | | 536,366 | |
| | | | | | | | |
| | | | 2,830,443 | |
|
| Information Technology 23.9% | |
Communications Equipment 1.1% | |
Lumentum Holdings, Inc.* | | | 8,768 | | | | 695,302 | |
|
Electronic Equipment, Instruments & Components 1.1% | |
| | |
Cognex Corp. | | | 7,873 | | | | 441,203 | |
| | |
IPG Photonics Corp.* | | | 1,883 | | | | 272,884 | |
| | | | | | | | |
| | | | 714,087 | |
|
IT Services 5.0% | |
| | |
Broadridge Financial Solutions, Inc. | | | 6,371 | | | | 787,073 | |
| | |
MAXIMUS, Inc. | | | 8,556 | | | | 636,481 | |
| | |
WEX, Inc.* | | | 4,266 | | | | 893,557 | |
| | |
WNS Holdings Ltd. (ADR)* | | | 13,113 | | | | 867,425 | |
| | | | | | | | |
| | | | 3,184,536 | |
|
Semiconductors & Semiconductor Equipment 3.5% | |
| | |
Advanced Energy Industries, Inc.* | | | 12,629 | | | | 899,185 | |
| | |
Advanced Micro Devices, Inc.* | | | 11,189 | | | | 513,127 | |
| | |
Cabot Microelectronics Corp. | | | 3,131 | | | | 451,866 | |
| | |
Entegris, Inc. | | | 8,229 | | | | 412,191 | |
| | | | | | | | |
| | | | 2,276,369 | |
|
Software 13.2% | |
| | |
Aspen Technology, Inc.* | | | 9,895 | | | | 1,196,602 | |
| | |
Bill.Com Holdings, Inc.* | | | 624 | | | | 23,743 | |
| | |
Cornerstone OnDemand, Inc.* | | | 11,656 | | | | 682,459 | |
| | |
Envestnet, Inc.* | | | 9,852 | | | | 685,995 | |
| | | | | | | | |
| | | Shares | | | Value ($) | |
| | |
Five9, Inc.* | | | 18,703 | | | | 1,226,543 | |
| | |
New Relic, Inc.* | | | 1,634 | | | | 107,370 | |
| | |
Proofpoint, Inc.* | | | 7,005 | | | | 804,034 | |
| | |
QAD, Inc. “A” | | | 15,977 | | | | 813,708 | |
| | |
Tyler Technologies, Inc.* | | | 5,381 | | | | 1,614,408 | |
| | |
Varonis Systems, Inc.* | | | 16,810 | | | | 1,306,305 | |
| | | | | | | | |
| | | | 8,461,167 | |
|
| Materials 3.4% | |
Chemicals 0.3% | |
Trinseo SA | | | 5,309 | | | | 197,548 | |
|
Construction Materials 1.3% | |
Eagle Materials, Inc. | | | 9,476 | | | | 859,094 | |
|
Containers & Packaging 0.6% | |
Berry Global Group, Inc.* | | | 7,728 | | | | 367,003 | |
|
Metals & Mining 1.2% | |
| | |
Cleveland-Cliffs, Inc. (a) | | | 67,277 | | | | 565,127 | |
| | |
First Quantum Minerals Ltd. | | | 17,207 | | | | 174,515 | |
| | | | | | | | |
| | | | 739,642 | |
|
| Real Estate 4.3% | |
Equity Real Estate Investment Trusts (REITs) | |
| | |
Americold Realty Trust | | | 12,475 | | | | 437,373 | |
| | |
EastGroup Properties, Inc. | | | 2,708 | | | | 359,270 | |
| | |
Essential Properties Realty Trust, Inc. | | | 23,274 | | | | 577,428 | |
| | |
Four Corners Property Trust, Inc. | | | 13,954 | | | | 393,363 | |
| | |
National Storage Affiliates Trust | | | 19,930 | | | | 670,047 | |
| | |
QTS Realty Trust, Inc. “A” | | | 6,380 | | | | 346,243 | |
| | | | | | | | |
| | | | | 2,783,724 | |
| Total Common Stocks(Cost $41,899,845) | | | | 62,892,164 | |
|
| Convertible Preferred Stocks 0.7% | |
| Health Care | |
Providence Service Corp., 5.5% (b) (Cost $283,300) | | | 2,833 | | | | 420,404 | |
|
| Securities Lending Collateral 3.2% | |
DWS Government & Agency Securities Portfolio “DWS Government Cash Institutional Shares”, 1.50% (c) (d)
(Cost $2,086,238) | | | 2,086,238 | | | | 2,086,238 | |
|
| Cash Equivalents 1.5% | |
DWS Central Cash Management Government Fund, 1.62% (c) (Cost $955,515) | | | 955,515 | | | | 955,515 | |
| | |
| | | % of Net
Assets | | | Value ($) | |
Total Investment Portfolio
(Cost $45,224,898) | | | 103.4 | | | | 66,354,321 | |
| Other Assets and Liabilities, Net | | | (3.4 | ) | | | (2,153,463 | ) |
| Net Assets | | | 100.0 | | | | 64,200,858 | |
The accompanying notes are an integral part of the financial statements.
| | | | |
Deutsche DWS Variable Series II — DWS Small Mid Cap Growth VIP | | | | | 7 |
A summary of the Fund’s transactions with affiliated investments during the year ended December 31, 2019 are as follows:
| | | | | | | | | | | | | | | | | | | | | | | | | | | | | | | | |
Value ($) at
12/31/2018 | | Purchases
Cost ($) | | | Sales
Proceeds ($) | | | Net
Realized
Gain/
(Loss) ($) | | | Net Change in
Unrealized
Appreciation
(Depreciation) ($) | | | Income ($) | | | Capital Gain
Distributions ($) | | | Number
of Shares
at
12/31/2019 | | | Value ($)
at
12/31/2019 | |
Securities Lending Collateral 3.2% | | | | | | | | | | | | | | | | | |
DWS Government & Agency Securities Portfolio “DWS Government Cash Institutional Shares”, 1.50% (c) (d) | |
| 2,032,950 | | | 53,288 | (e) | | | — | | | | — | | | | — | | | | 57,317 | | | | — | | | | 2,086,238 | | | | 2,086,238 | |
Cash Equivalents 1.5% | | | | | | | | | | | | | | | | | |
DWS Central Cash Management Government Fund, 1.62% (c) | |
| 3,874,651 | | | 10,857,060 | | | | 13,776,196 | | | | — | | | | — | | | | 57,797 | | | | — | | | | 955,515 | | | | 955,515 | |
| 5,907,601 | | | 10,910,348 | | | | 13,776,196 | | | | — | | | | — | | | | 115,114 | | | | — | | | | 3,041,753 | | | | 3,041,753 | |
| * | Non-income producing security. |
| (a) | All or a portion of these securities were on loan. In addition, “Other Assets and Liabilities, Net” may include pending sales that are also on loan. The value of securities loaned at December 31, 2019 amounted to $2,049,043, which is 3.2% of net assets. |
| (b) | Investment was valued using significant unobservable inputs. |
| (c) | Affiliated fund managed by DWS Investment Management Americas, Inc. The rate shown is the annualizedseven-day yield at period end. |
| (d) | Represents cash collateral held in connection with securities lending. Income earned by the Fund is net of borrower rebates. |
| (e) | Represents the net increase (purchase cost) or decrease (sales proceeds) in the amount invested in cash collateral for the year ended December 31, 2019. |
ADR: American Depositary Receipt
Fair Value Measurements
Various inputs are used in determining the value of the Fund’s investments. These inputs are summarized in three broad levels. Level 1 includes quoted prices in active markets for identical securities. Level 2 includes other significant observable inputs (including quoted prices for similar securities, interest rates, prepayment speeds and credit risk). Level 3 includes significant unobservable inputs (including the Fund’s own assumptions in determining the fair value of investments). The level assigned to the securities valuations may not be an indication of the risk or liquidity associated with investing in those securities.
The following is a summary of the inputs used as of December 31, 2019 in valuing the Fund’s investments. For information on the Fund’s policy regarding the valuation of investments, please refer to the Security Valuation section of Note A in the accompanying Notes to Financial Statements.
| | | | | | | | | | | | | | | | |
| Assets | | Level 1 | | | Level 2 | | | Level 3 | | | Total | |
| Common Stocks (f) | | $ | 62,892,164 | | | $ | — | | | $ | — | | | $ | 62,892,164 | |
| Convertible Preferred Stocks | | | — | | | | — | | | | 420,404 | | | | 420,404 | |
| Short-Term Investments (f) | | | 3,041,753 | | | | — | | | | — | | | | 3,041,753 | |
| Total | | $ | 65,933,917 | | | $ | — | | | $ | 420,404 | | | $ | 66,354,321 | |
| (f) | See Investment Portfolio for additional detailed categorizations. |
The accompanying notes are an integral part of the financial statements.
| | | | | | |
| | 8 | | | | | | Deutsche DWS Variable Series II — DWS Small Mid Cap Growth VIP |
Statement of Assets and Liabilities
| | | | |
| as of December 31, 2019 | | | | |
| |
| Assets | | | | |
| Investments in non-affiliated securities, at value (cost $42,183,145) — including $2,049,043 of securities loaned | | $ | 63,312,568 | |
| Investment in DWS Government & Agency Securities Portfolio (cost $2,086,238)* | | | 2,086,238 | |
| Investment in DWS Central Cash Management Government Fund (cost $955,515) | | | 955,515 | |
Receivable for investments sold | | | 5,310 | |
| Receivable for Fund shares sold | | | 29,409 | |
| Dividends receivable | | | 24,848 | |
| Interest receivable | | | 7,003 | |
| Other assets | | | 1,489 | |
| Total assets | | | 66,422,380 | |
| |
| Liabilities | | | | |
| Payable upon return of securities loaned | | | 2,086,238 | |
| Payable for Fund shares redeemed | | | 30,095 | |
| Accrued management fee | | | 24,715 | |
| Accrued Trustees’ fees | | | 1,514 | |
| Other accrued expenses and payables | | | 78,960 | |
| Total liabilities | | | 2,221,522 | |
| Net assets, at value | | $ | 64,200,858 | |
| |
| Net Assets Consist of | | | | |
| Distributable earnings (loss) | | | 21,970,327 | |
| Paid-in capital | | | 42,230,531 | |
| Net assets, at value | | $ | 64,200,858 | |
| |
| Net Asset Value | | | | |
| |
| Net Asset Value, offering and redemption price per share ($64,200,858 ÷ 4,698,629 outstanding shares of beneficial interest, no par value, unlimited number of shares authorized) | | $ | 13.66 | |
| * | Represents collateral on securities loaned. |
Statement of Operations
| | | | |
| for the year ended December 31, 2019 | |
| |
| Investment Income | | | | |
| Income: | | | | |
| Dividends (net of foreign taxes withheld of $25) | | $ | 500,825 | |
| Income distributions — DWS Central Cash Management Government Fund | | | 57,797 | |
| Securities lending income, net of borrower rebates | | | 57,317 | |
| Total income | | | 615,939 | |
| Expenses: | | | | |
| Management fee | | | 369,908 | |
| Administration fee | | | 67,256 | |
| Services to Shareholders | | | 770 | |
| Custodian fee | | | 3,782 | |
| Professional fees | | | 61,252 | |
| Reports to shareholders | | | 34,094 | |
| Trustees’ fees and expenses | | | 5,424 | |
| Other | | | 7,315 | |
| Total expenses before expense reductions | | | 549,801 | |
| Expense reductions | | | (5,027 | ) |
| Total expenses after expense reductions | | | 544,774 | |
| Net investment income (loss) | | | 71,165 | |
| |
| Realized and Unrealized Gain (Loss) | | | | |
| Net realized gain (loss) from: | | | | |
| Investments | | | 1,091,843 | |
| Foreign currency | | | 319 | |
| | | | 1,092,162 | |
| Change in net unrealized appreciation (depreciation) on: | | | | |
| Investments | | | 12,312,196 | |
| Foreign currency | | | 4 | |
| | | | 12,312,200 | |
| Net gain (loss) | | | 13,404,362 | |
| Net increase (decrease) in net assets resulting from operations | | $ | 13,475,527 | |
The accompanying notes are an integral part of the financial statements.
| | | | |
Deutsche DWS Variable Series II — DWS Small Mid Cap Growth VIP | | | | | 9 |
Statements of Changes in Net Assets
| | | | | | | | |
| | | Years Ended December 31, | |
| Increase (Decrease) in Net Assets | | 2019 | | | 2018 | |
| Operations: | | | | | | | | |
| Net investment income (loss) | | $
| 71,165
|
| | $ | (48,368 | ) |
| Net realized gain (loss) | | | 1,092,162 | | | | 8,989,403 | |
| Change in net unrealized appreciation (depreciation) | | | 12,312,200 | | | | (19,054,040 | ) |
| Net increase (decrease) in net assets resulting from operations | | | 13,475,527 | | | | (10,113,005 | ) |
| Distributions to shareholders: | | | | | | | | |
Class A | | | (8,788,523 | ) | | | (25,334,744 | ) |
| Fund share transactions: | | | | | | | | |
Class A | | | | | | | | |
| Proceeds from shares sold | |
| 2,374,360
|
| | | 6,446,792 | |
| Reinvestment of distributions | | | 8,788,523 | | | | 25,334,744 | |
| Payments for shares redeemed | | | (16,023,146 | ) | | | (9,303,196 | ) |
| Net increase (decrease) in net assets from Class A share transactions | | | (4,860,263 | ) | | | 22,478,340 | |
| Increase (decrease) in net assets | | | (173,259 | ) | | | (12,969,409 | ) |
| Net assets at beginning of period | | | 64,374,117 | | | | 77,343,526 | |
| | |
| Net assets at end of period | | $ | 64,200,858 | | | $ | 64,374,117 | |
| | |
| Other Information | | | | | | | | |
Class A | | | | | | | | |
| Shares outstanding at beginning of period | | | 5,077,014 | | | | 3,525,232 | |
| Shares sold | | | 179,399 | | | | 381,309 | |
| Shares issued to shareholders in reinvestment of distributions | | | 680,753 | | | | 1,711,807 | |
| Shares redeemed | | | (1,238,537 | ) | | | (541,334 | ) |
| Net increase (decrease) in Class A shares | | | (378,385 | ) | | | 1,551,782 | |
| Shares outstanding at end of period | | | 4,698,629 | | | | 5,077,014 | |
The accompanying notes are an integral part of the financial statements.
| | | | | | |
| | 10 | | | | | | Deutsche DWS Variable Series II — DWS Small Mid Cap Growth VIP |
Financial Highlights
| | | | | | | | | | | | | | | | | | | | |
| | | Years Ended December 31, | |
| Class A | | 2019 | | | 2018 | | | 2017 | | | 2016 | | | 2015 | |
| | | | | |
| Selected Per Share Data | | | | | | | | | | | | | | | | | | | | |
| Net asset value, beginning of period | | $ | 12.68 | | | $ | 21.94 | | | $ | 18.96 | | | $ | 20.90 | | | $ | 22.83 | |
| Income (loss) from investment operations: | | | | | | | | | | | | | | | | | | | | |
| | | | | |
Net investment income (loss)a | | | .01 | | | | (.01 | ) | | | (.02 | ) | | | .02 | | | | (.04 | ) |
Net realized and unrealized gain (loss) | | | 2.73 | | | | (1.92 | ) | | | 4.08 | | | | 1.64 | | | | (.00 | ) |
Total from investment operations | | | 2.74 | | | | (1.93 | ) | | | 4.06 | | | | 1.66 | | | | (.04 | ) |
| Less distributions from: | | | | | | | | | | | | | | | | | | | | |
| | | | | |
Net investment income | | | — | | | | — | | | | (.02 | ) | | | — | | | | — | |
Net realized gains | | | (1.76 | ) | | | (7.33 | ) | | | (1.06 | ) | | | (3.60 | ) | | | (1.89 | ) |
Total distributions | | | (1.76 | ) | | | (7.33 | ) | | | (1.08 | ) | | | (3.60 | ) | | | (1.89 | ) |
| Net asset value, end of period | | $ | 13.66 | | | $ | 12.68 | | | $ | 21.94 | | | $ | 18.96 | | | $ | 20.90 | |
| Total Return (%) | | | 22.41 | b | | | (13.59 | )b | | | 22.12 | | | | 9.08 | | | | (.90 | ) |
| | | | | |
| Ratios to Average Net Assets and Supplemental Data | | | | | | | | | | | | | | | | | | | | |
| Net assets, end of period ($ millions) | | | 64 | | | | 64 | | | | 77 | | | | 118 | | | | 135 | |
| Ratio of expenses before expense reductions (%)c | | | .82 | | | | .81 | | | | .75 | | | | .75 | | | | .72 | |
| Ratio of expenses after expense reductions (%)c | | | .81 | | | | .80 | | | | .75 | | | | .75 | | | | .72 | |
| Ratio of net investment income (loss) (%) | | | .11 | | | | (.06 | ) | | | (.08 | ) | | | .11 | | | | (.19 | ) |
| Portfolio turnover rate (%) | | | 10 | | | | 32 | | | | 32 | | | | 28 | | | | 42 | |
| a | Based on average shares outstanding during the period. |
| b | Total return would have been lower had certain expenses not been reduced. |
| c | Expense ratio does not reflect charges and fees associated with the separate account that invests in the Fund or any variable life insurance policy or variable annuity contract for which the Fund is an investment option. |
The accompanying notes are an integral part of the financial statements.
| | | | |
Deutsche DWS Variable Series II — DWS Small Mid Cap Growth VIP | | | | | 11 |
| | |
| Notes to Financial Statements | | |
A. Organization and Significant Accounting Policies
DWS Small Mid Cap Growth VIP (the “Fund”) is a diversified series of Deutsche DWS Variable Series II (the “Trust”), which is registered under the Investment Company Act of 1940, as amended (the “1940 Act”), as anopen-end management investment company organized as a Massachusetts business trust.
The Fund’s financial statements are prepared in accordance with accounting principles generally accepted in the United States of America (“U.S. GAAP”) which require the use of management estimates. Actual results could differ from those estimates. The Fund qualifies as an investment company under Topic 946 of Accounting Standards Codification of U.S. GAAP. The policies described below are followed consistently by the Fund in the preparation of its financial statements.
Security Valuation. Investments are stated at value determined as of the close of regular trading on the New York Stock Exchange on each day the exchange is open for trading.
Various inputs are used in determining the value of the Fund’s investments. These inputs are summarized in three broad levels. Level 1 includes quoted prices in active markets for identical securities. Level 2 includes other significant observable inputs (including quoted prices for similar securities, interest rates, prepayment speeds and credit risk). Level 3 includes significant unobservable inputs (including the Fund’s own assumptions in determining the fair value of investments). The level assigned to the securities valuations may not be an indication of the risk or liquidity associated with investing in those securities.
Equity securities are valued at the most recent sale price or official closing price reported on the exchange (U.S. or foreign) orover-the-counter market on which they trade. Securities for which no sales are reported are valued at the calculated mean between the most recent bid and asked quotations on the relevant market or, if a mean cannot be determined, at the most recent bid quotation. Equity securities are generally categorized as Level 1.
Investments inopen-end investment companies are valued at their net asset value each business day and are categorized as Level 1.
Securities and other assets for which market quotations are not readily available or for which the above valuation procedures are deemed not to reflect fair value are valued in a manner that is intended to reflect their fair value as determined in accordance with procedures approved by the Board and are generally categorized as Level 3. In accordance with the Fund’s valuation procedures, factors considered in determining value may include, but are not limited to, the type of the security; the size of the holding; the initial cost of the security; the existence of any contractual restrictions on the security’s disposition; the price and extent of public trading in similar securities of the issuer or of comparable companies; quotations or evaluated prices frombroker-dealers and/or pricing services; information obtained from the issuer, analysts, and/or the appropriate stock exchange (forexchange-traded securities); an analysis of the company’s or issuer’s financial statements; an evaluation of the forces that influence the issuer and the market(s) in which the security is purchased and sold; and with respect to debt securities, the maturity, coupon, creditworthiness, currency denomination and the movement of the market in which the security is normally traded. The value determined under these procedures may differ from published values for the same securities.
Disclosure about the classification of fair value measurements is included in a table following the Fund’s Investment Portfolio.
Foreign Currency Translations. The books and records of the Fund are maintained in U.S. dollars. Investment securities and other assets and liabilities denominated in a foreign currency are translated into U.S. dollars at the prevailing exchange rates at period end. Purchases and sales of investment securities, income and expenses are translated into U.S. dollars at the prevailing exchange rates on the respective dates of the transactions.
Net realized and unrealized gains and losses on foreign currency transactions represent net gains and losses between trade and settlement dates on securities transactions, the acquisition and disposition of foreign currencies, and the difference between the amount of net investment income accrued and the U.S. dollar amount actually received. The portion of both realized and unrealized gains and losses on investments that results from fluctuations in foreign currency exchange rates is not separately disclosed but is included with net realized and unrealized gain/appreciation and loss/depreciation on investments.
Securities Lending. Deutsche Bank AG, as lending agent, lends securities of the Fund to certain financial institutions under the terms of its securities lending agreement. During the term of the loans, the Fund continues to receive interest and dividends generated by the securities and to participate in any changes in
| | | | | | |
| | 12 | | | | | | Deutsche DWS Variable Series II — DWS Small Mid Cap Growth VIP |
their market value. The Fund requires the borrowers of the securities to maintain collateral with the Fund consisting of either cash or liquid, unencumbered assets having a value at least equal to the value of the securities loaned. When the collateral falls below specified amounts, the lending agent will use its best effort to obtain additional collateral on the next business day to meet required amounts under the securities lending agreement. As of period end, any securities on loan were collateralized by cash. During the year ended December 31, 2019, the Fund invested the cash collateral into a joint trading account in DWS Government & Agency Securities Portfolio, an affiliated money market fund managed by DWS Investment Management Americas, Inc. DWS Investment Management Americas, Inc. receives a management/administration fee (0.12% annualized effective rate as of December 31, 2019) on the cash collateral invested in DWS Government & Agency Securities Portfolio. The Fund receives compensation for lending its securities either in the form of fees or by earning interest on invested cash collateral net of borrower rebates and fees paid to a lending agent. Either the Fund or the borrower may terminate the loan at any time, and the borrower, after notice, is required to return borrowed securities within a standard time period. There may be risks of delay and costs in recovery of securities or even loss of rights in the collateral should the borrower of the securities fail financially. If the Fund is not able to recover securities lent, the Fund may sell the collateral and purchase a replacement investment in the market, incurring the risk that the value of the replacement security is greater than the value of the collateral. The Fund is also subject to all investment risks associated with the reinvestment of any cash collateral received, including, but not limited to, interest rate, credit and liquidity risk associated with such investments.
As of December 31, 2019, the Fund had securities on loan, which were classified as common stocks in the Investment Portfolio. The value of the related collateral exceeded the value of the securities loaned at period end. As of period end, the remaining contractual maturity of the collateral agreements were overnight and continuous.
Federal Income Taxes. The Fund’s policy is to comply with the requirements of the Internal Revenue Code, as amended, which are applicable to regulated investment companies, and to distribute all of its taxable income to its shareholders.
The Fund has reviewed the tax positions for the open tax years as of December 31, 2019 and has determined that no provision for income tax and/or uncertain tax positions is required in the Fund’s financial statements. The Fund’s federal tax returns for the prior three fiscal years remain open subject to examination by the Internal Revenue Service.
Distribution of Income and Gains. Distributions from net investment income of the Fund, if any, are declared and distributed to shareholders annually. Net realized gains from investment transactions, in excess of available capital loss carryforwards, would be taxable to the Fund if not distributed and, therefore, will be distributed to shareholders at least annually. The Fund may also make additional distributions for tax purposes if necessary.
The timing and characterization of certain income and capital gain distributions are determined annually in accordance with federal tax regulations which may differ from accounting principles generally accepted in the United States of America. These differences primarily relate to certain securities sold at a loss. As a result, net investment income (loss) and net realized gain (loss) on investment transactions for a reporting period may differ significantly from distributions during such period. Accordingly, the Fund may periodically make reclassifications among certain of its capital accounts without impacting the net asset value of the Fund.
At December 31, 2019, the Fund’s components of distributable earnings on a tax basis were as follows:
| | | | |
| Undistributed ordinary income* | | $ | 31,323 | |
| Undistributed long-term capital gainzs | | $ | 914,739 | |
| Net unrealized appreciation (depreciation) on investments | | $ | 21,017,336 | |
At December 31, 2019, the aggregate cost of investments for federal income tax purposes was $45,336,985. The net unrealized appreciation for all investments based on tax cost was $21,017,336. This consisted of aggregate gross unrealized appreciation for all investments in which there was an excess of value over tax cost of $24,291,092 aggregate gross unrealized depreciation for all investments in which was an excess of tax cost over value of $3,273,756.
In addition, the tax character of distributions paid by the Fund is summarized as follows:
| | | | | | | | |
| | | Years Ended December 31, | |
| | | 2019 | | | 2018 | |
| Distributions from ordinary income* | | $ | — | | | $ | 1,616,576 | |
| Distributions from long-term capital gains | | $ | 8,788,523 | | | $ | 23,718,168 | |
| * | For tax purposes, short-term capital gain distributions are considered ordinary income distributions. |
| | | | |
Deutsche DWS Variable Series II — DWS Small Mid Cap Growth VIP | | | | | 13 |
Expenses. Expenses of the Trust arising in connection with a specific fund are allocated to that fund. Other Trust expenses which cannot be directly attributed to a fund are apportioned among the funds in the Trust based upon the relative net assets or other appropriate measures.
Contingencies. In the normal course of business, the Fund may enter into contracts with service providers that contain general indemnification clauses. The Fund’s maximum exposure under these arrangements is unknown, as this would involve future claims that may be made against the Fund that have not yet been made. However, based on experience, the Fund expects the risk of loss to be remote.
Other. Investment transactions are accounted for on a trade date plus one basis for daily net asset value calculations. However, for financial reporting purposes, investment transactions are reported on trade date. Interest income is recorded on the accrual basis. Dividend income is recorded on theex-dividend date net of foreign withholding taxes. Realized gains and losses from investment transactions are recorded on an identified cost basis. Proceeds from litigation payments, if any, are included in net realized gain (loss) from investments.
B. Purchases and Sales of Securities
During the year ended December 31, 2019, purchases and sales of investment transactions (excludingshort-term investments) aggregated $6,601,955 and $17,143,395, respectively.
C. Related Parties
Management Agreement. Under the Investment Management Agreement with DWS Investment Management Americas, Inc. (“DIMA” or the “Advisor”), an indirect, wholly owned subsidiary of DWS Group GmbH & Co. KGaA (“DWS Group”), the Advisor directs the investments of the Fund in accordance with its investment objectives, policies and restrictions. The Advisor determines the securities, instruments and other contracts relating to investments to be purchased, sold or entered into by the Fund.
Pursuant to the Investment Management Agreement with the Advisor, the Fund pays a monthly management fee based on the Fund’s average daily net assets, computed and accrued daily and payable monthly, at the following annual rates:
| | | | |
| First $250 million | | | .550 | % |
| Next $750 million | | | .525 | % |
| Over $1 billion | | | .500 | % |
Accordingly, for the year ended December 31, 2019, the fee pursuant to the Investment Management Agreement was equivalent to an annual rate (exclusive of any applicable waivers/reimbursements) of 0.55% of the Fund’s average daily net assets.
For the period from January 1, 2019 through September 30, 2020, the Advisor has contractually agreed to waive its fees and/or reimburse certain operating expenses to the extent necessary to maintain the total annual operating expenses (excluding certain expenses such as extraordinary expenses, taxes, brokerage and interest expense) of Class A at 0.81%.
For the year ended December 31, 2019, fees waived and/or expenses reimbursed were $5,027.
Administration Fee. Pursuant to an Administrative Services Agreement, DIMA provides most administrative services to the Fund. For all services provided under the Administrative Services Agreement, the Fund pays DIMA an annual fee (“Administration Fee”) of 0.10% of the Fund’s average daily net assets, computed and accrued daily and payable monthly. For the year ended December 31, 2019, the Administration Fee was $67,256, of which $5,408 is unpaid.
Service Provider Fees. DWS Service Company (“DSC”), an affiliate of the Advisor, is the transfer agent,dividend-paying agent and shareholder service agent for the Fund. Pursuant to asub-transfer agency agreement between DSC and DST Systems, Inc. (“DST”), DSC has delegated certain transfer agent,dividend-paying agent and shareholder service agent functions to DST. DSC compensates DST out of the shareholder servicing fee it receives from the Fund. For the year ended December 31, 2019, the amounts charged to the Fund by DSC aggregated $396, of which $66 is unpaid.
Typesetting and Filing Service Fees. Under an agreement with the Fund, DIMA is compensated for providing certainpre-press and regulatory filing services to the Fund. For the year ended December 31, 2019, the amount charged to the Fund by DIMA included in the Statement of Operations under “Reports to shareholders” aggregated $8,464, of which $3,174 is unpaid.
| | | | | | |
| | 14 | | | | | | Deutsche DWS Variable Series II — DWS Small Mid Cap Growth VIP |
Trustees’ Fees and Expenses. The Fund paid retainer fees to each Trustee not affiliated with the Advisor, plus specified amounts to the Board Chairperson and to each committee Chairperson.
Affiliated Cash Management Vehicles. The Fund may invest uninvested cash balances in DWS Central Cash Management Government Fund and DWS ESG Liquidity Fund, affiliated money market funds which are managed by the Advisor. Each affiliated money market fund is managed in accordance withRule 2a-7 under the 1940 Act, which governs the quality, maturity, diversity and liquidity of instruments in which a money market fund may invest. DWS Central Cash Management Government Fund seeks to maintain a stable net asset value, and DWS ESG Liquidity Fund maintains a floating net asset value. The Fund indirectly bears its proportionate share of the expenses of each affiliated money market fund in which it invests. DWS Central Cash Management Government Fund does not pay the Advisor an investment management fee. To the extent that DWS ESG Liquidity Fund pays an investment management fee to the Advisor, the Advisor will waive an amount of the investment management fee payable to the Advisor by the Fund equal to the amount of the investment management fee payable on the Fund’s assets invested in DWS ESG Liquidity Fund.
Securities Lending Agent Fees. Deutsche Bank AG serves as securities lending agent for the Fund. For the year ended December 31, 2019, the Fund incurred securities lending agent fees to Deutsche Bank AG in the amount of $4,313.
D. Ownership of the Fund
At December 31, 2019, one participating insurance company was owner of record of 10% or more of the total outstanding Class A shares of the Fund, owning 90%.
E. Line of Credit
The Fund and other affiliated funds (the “Participants”) share in a $400 million revolving credit facility provided by a syndication of banks. The Fund may borrow for temporary or emergency purposes, including the meeting of redemption requests that otherwise might require the untimely disposition of securities. The Participants are charged an annual commitment fee, which is allocated based on net assets, among each of the Participants. Interest is calculated at a rate per annum equal to the sum of the Federal Funds Rate plus 1.25 percent plus if theone-month LIBOR exceeds the Federal Funds Rate the amount of such excess. The Fund may borrow up to a maximum of 33 percent of its net assets under the agreement. The Fund had no outstanding loans at December 31, 2019.
| | | | |
Deutsche DWS Variable Series II — DWS Small Mid Cap Growth VIP | | | | | 15 |
Report of Independent Registered Public Accounting Firm
To the Board of Trustees of Deutsche DWS Variable Series II and Shareholders of DWS Small Mid Cap Growth VIP:
Opinion on the Financial Statements
We have audited the accompanying statement of assets and liabilities of DWS Small Mid Cap Growth VIP (the “Fund”) (one of the funds constituting Deutsche DWS Variable Series II) (the “Trust”), including the investment portfolio, as of December 31, 2019, and the related statement of operations for the year then ended, the statements of changes in net assets for each of the two years in the period then ended, the financial highlights for each of the five years in the period then ended and the related notes (collectively referred to as the “financial statements”). In our opinion, the financial statements present fairly, in all material respects, the financial position of the Fund (one of the funds constituting Deutsche DWS Variable Series II) at December 31, 2019, the results of its operations for the year then ended, the changes in its net assets for each of the two years in the period then ended and its financial highlights for each of the five years in the period then ended, in conformity with U.S. generally accepted accounting principles.
Basis for Opinion
These financial statements are the responsibility of the Trust’s management. Our responsibility is to express an opinion on the Fund’s financial statements based on our audit. We are a public accounting firm registered with the Public Company Accounting Oversight Board (United States) (“PCAOB”) and are required to be independent with respect to the Trust in accordance with the U.S. federal securities laws and the applicable rules and regulations of the Securities and Exchange Commission and the PCAOB.
We conducted our audit in accordance with the standards of the PCAOB. Those standards require that we plan and perform the audit to obtain reasonable assurance about whether the financial statements are free of material misstatement, whether due to error or fraud. The Trust is not required to have, nor were we engaged to perform, an audit of the Trust’s internal control over financial reporting. As part of our audit, we are required to obtain an understanding of internal control over financial reporting, but not for the purpose of expressing an opinion on the effectiveness of the Trust’s internal control over financial reporting. Accordingly, we express no such opinion.
Our audit included performing procedures to assess the risks of material misstatement of the financial statements, whether due to error or fraud, and performing procedures that respond to those risks. Such procedures included examining, on a test basis, evidence regarding the amounts and disclosures in the financial statements. Our procedures included confirmation of securities owned as of December 31, 2019, by correspondence with the custodian and others. Our audit also included evaluating the accounting principles used and significant estimates made by management, as well as evaluating the overall presentation of the financial statements. We believe that our audit provides a reasonable basis for our opinion.

We have served as the auditor of one or more investment companies in the DWS family of funds since at least 1979, but we are unable to determine the specific year.
Boston, Massachusetts
February 14, 2020
| | | | | | |
| | 16 | | | | | | Deutsche DWS Variable Series II — DWS Small Mid Cap Growth VIP |
| | |
| Information About Your Fund’s Expenses | | (Unaudited) |
As an investor of the Fund, you incur two types of costs: ongoing expenses and transaction costs. Ongoing expenses include management fees and other Fund expenses. Examples of transaction costs include contract charges, which are not shown in this section. The following tables are intended to help you understand your ongoing expenses (in dollars) of investing in the Fund and to help you compare these expenses with the ongoing expenses of investing in other mutual funds. In the most recent six-month period, the Fund limited these expenses; had it not done so, expenses would have been higher. The example in the table is based on an investment of $1,000 invested at the beginning of thesix-month period and held for the entire period (July 1, 2019 to December 31, 2019).
The tables illustrate your Fund’s expenses in two ways:
| – | Actual Fund Return. This helps you estimate the actual dollar amount of ongoing expenses (but not transaction costs) paid on a $1,000 investment in the Fund using the Fund’s actual return during the period. To estimate the expenses you paid over the period, simply divide your account value by $1,000 (for example, an $8,600 account value divided by $1,000 = 8.6), then multiply the result by the number in the “Expenses Paid per $1,000” line under the share class you hold. |
| – | Hypothetical 5% Fund Return. This helps you to compare your Fund’s ongoing expenses (but not transaction costs) with those of other mutual funds using the Fund’s actual expense ratio and a hypothetical rate of return of 5% per year before expenses. Examples using a 5% hypothetical Fund return may be found in the shareholder reports of other mutual funds. The hypothetical account values and expenses may not be used to estimate the actual ending account balance or expenses you paid for the period. |
Please note that the expenses shown in these tables are meant to highlight your ongoing expenses only and do not reflect any transaction costs. The “Expenses Paid per $1,000” line of the tables is useful in comparing ongoing expenses only and will not help you determine the relative total expense of owning different funds. If these transaction costs had been included, your costs would have been higher.
| | | | |
| Expenses and Value of a $1,000 Investment for the six months ended December 31, 2019 | | | |
| |
| Actual Fund Return | | Class A | |
| Beginning Account Value 7/1/19 | | $ | 1,000.00 | |
| Ending Account Value 12/31/19 | | $ | 1,058.10 | |
| Expenses Paid per $1,000* | | $ | 4.20 | |
| |
| Hypothetical 5% Fund Return | | Class A | |
| Beginning Account Value 7/1/19 | | $ | 1,000.00 | |
| Ending Account Value 12/31/19 | | $ | 1,021.12 | |
| Expenses Paid per $1,000* | | $ | 4.13 | |
| * | Expenses are equal to the Fund’s annualized expense ratio, multiplied by the average account value over the period, multiplied by 184 (the number of days in the most recentsix-month period), then divided by 365. |
| | | | |
| Annualized Expense Ratio | | Class A | |
| Deutsche DWS Variable Series II — DWS Small Mid Cap Growth VIP | | | .81 | % |
For more information, please refer to the Fund’s prospectus.
These tables do not reflect charges and fees (“contract charges”) associated with the separate account that invests in the Fund or any variable life insurance policy or variable annuity contract for which the Fund is an investment option.
For an analysis of the fees associated with an investment in the Fund or similar funds, please refer to the current and hypothetical expense calculators for Variable Insurance Products which can be found at dws.com/calculators.
| | | | |
Deutsche DWS Variable Series II — DWS Small Mid Cap Growth VIP | | | | | 17 |
| | |
| Tax Information | | (Unaudited) |
The Fund paid distributions of $1.76 per share from net long-term capital gains during its year ended December 31, 2019.
Pursuant to Section 852 of the Internal Revenue Code, the Fund designates $1,050,000 as capital gain dividends for its year ended December 31, 2019.
Please consult a tax advisor if you have questions about federal or state income tax laws, or on how to prepare your tax returns. If you have specific questions about your account, please contact your insurance provider.
The Trust’s policies and procedures for voting proxies for portfolio securities and information about how the Trust voted proxies related to its portfolio securities during the most recent12-month period ended June 30 are available on our Web site — dws.com/en-us/resources/proxy-voting — or on the SEC’s Web site — sec.gov. To obtain a written copy of the Trust’s policies and procedures without charge, upon request, call us toll free at (800)728-3337.
| | | | | | |
| | 18 | | | | | | Deutsche DWS Variable Series II — DWS Small Mid Cap Growth VIP |
Advisory Agreement Board Considerations and Fee Evaluation
The Board of Trustees (hereinafter referred to as the “Board” or “Trustees”) approved the renewal of DWS Small Mid Cap Growth VIP’s (the “Fund”) investment management agreement (the “Agreement”) with DWS Investment Management Americas, Inc. (“DIMA”) in September 2019.
In terms of the process that the Board followed prior to approving the Agreement, shareholders should know that:
| – | | During the entire process, all of the Fund’s Trustees were independent of DIMA and its affiliates (the “Independent Trustees”). |
| – | | The Board met frequently during the past year to discuss fund matters and dedicated a substantial amount of time to contract review matters. Over the course of several months, the Board’s Contract Committee reviewed extensive materials received from DIMA, independent third parties and independent counsel. These materials included an analysis of the Fund’s performance, fees and expenses, and profitability from a fee consultant retained by the Fund’s Independent Trustees (the “Fee Consultant”). Based on its evaluation of the information provided, the Contract Committee presented its findings and recommendations to the Board. The Board then reviewed the Contract Committee’s findings and recommendations. |
| – | | The Board also received extensive information throughout the year regarding performance of the Fund. |
| – | | The Independent Trustees regularly met privately with counsel to discuss contract review and other matters. In addition, the Independent Trustees were advised by the Fee Consultant in the course of their review of the Fund’s contractual arrangements and considered a comprehensive report prepared by the Fee Consultant in connection with their deliberations. |
| – | | In connection with reviewing the Agreement, the Board also reviewed the terms of the Fund’s distribution agreement, administrative services agreement, transfer agency agreement and other material service agreements. |
In connection with the contract review process, the Contract Committee and the Board considered the factors discussed below, among others. The Board also considered that DIMA and its predecessors have managed the Fund since its inception, and the Board believes that a long-term relationship with a capable, conscientious advisor is in the best interests of the Fund. The Board considered, generally, that shareholders chose to invest or remain invested in the Fund knowing that DIMA managed the Fund. DIMA is part of DWS Group GmbH & Co. KGaA (“DWS Group”). DWS Group is a global asset management business that offers a wide range of investing expertise and resources, including research capabilities in many countries throughout the world. In 2018, approximately 20% of DWS Group’s shares were sold in an initial public offering, with Deutsche Bank AG owning the remaining shares.
As part of the contract review process, the Board carefully considered the fees and expenses of each DWS fund overseen by the Board in light of the fund’s performance. In many cases, this led to the negotiation and implementation of expense caps. As part of these negotiations, the Board indicated that it would consider relaxing these caps in future years following sustained improvements in performance, among other considerations.
While shareholders may focus primarily on fund performance and fees, the Fund’s Board considers these and many other factors, including the quality and integrity of DIMA’s personnel and administrative support services provided by DIMA, such as back-office operations, fund valuations, and compliance policies and procedures.
Nature, Quality and Extent of Services.The Board considered the terms of the Agreement, including the scope of advisory services provided under the Agreement. The Board noted that, under the Agreement, DIMA provides portfolio management services to the Fund and that, pursuant to a separate administrative services agreement, DIMA provides administrative services to the Fund. The Board considered the experience and skills of senior management and investment personnel and the resources made available to such personnel. The Board reviewed the Fund’s performance over short-term and long-term periods and compared those returns to various agreed-upon performance measures, including market index(es) and a peer universe compiled using information supplied by Morningstar Direct (“Morningstar”), an independent fund data service. The Board also noted that it has put into place a process of identifying “Funds in Review” (e.g., funds performing poorly relative to a peer universe), and receives additional reporting from DIMA regarding such funds and, where appropriate, DIMA’s plans to address underperformance. The Board
| | | | |
Deutsche DWS Variable Series II — DWS Small Mid Cap Growth VIP | | | | | 19 |
believes this process is an effective manner of identifying and addressing underperforming funds. Based on the information provided, the Board noted that, for theone-, three- and five-year periods ended December 31, 2018, the Fund’s performance (Class A shares) was in the 4th quartile of the applicable Morningstar universe (the 1st quartile being the best performers and the 4th quartile being the worst performers). The Board also observed that the Fund has underperformed its benchmark in theone-, three- and five-year periods ended December 31, 2018. The Board noted the disappointing investment performance of the Fund in recent periods and continued to discuss with senior management of DIMA the factors contributing to such underperformance and actions being taken to improve performance. The Board noted changes in the portfolio management team, effective April 19, 2018. The Board recognized the efforts by DIMA in recent years to enhance its investment platform and improve long-term performance across the DWS fund complex.
Fees and Expenses. The Board considered the Fund’s investment management fee schedule, operating expenses and total expense ratios, and comparative information provided by Broadridge Financial Solutions, Inc. (“Broadridge”) and the Fee Consultant regarding investment management fee rates paid to other investment advisors by similar funds (1st quartile being the most favorable and 4th quartile being the least favorable). With respect to management fees paid to other investment advisors by similar funds, the Board noted that the contractual fee rates paid by the Fund, which include a 0.10% fee paid to DIMA under the Fund’s administrative services agreement, were lower than the median (1st quartile) of the applicable Broadridge peer group (based on Broadridge data provided as of December 31, 2018). The Board noted that the Fund’s Class A shares total (net) operating expenses were expected to be lower than the median (2nd quartile) of the applicable Broadridge expense universe (based on Broadridge data provided as of December 31, 2018, and analyzing Broadridge expense universe Class A (net) expenses less any applicable12b-1 fees) (“Broadridge Universe Expenses”). The Board noted that the expense limitation agreed to by DIMA was expected to help the Fund’s total (net) operating expenses remain competitive. The Board considered the Fund’s management fee rate as compared to fees charged by DIMA to comparable DWS U.S. registered funds (“DWS Funds”), noting that DIMA indicated that it does not provide services to any other comparable DWS Funds. The information requested by the Board as part of its review of fees and expenses also included information about institutional accounts (including anysub-advised funds and accounts) and funds offered primarily to European investors (“DWS Europe Funds”) managed by DWS Group. The Board noted that DIMA indicated that DWS Group does not manage any institutional accounts or DWS Europe Funds comparable to the Fund.
On the basis of the information provided, the Board concluded that management fees were reasonable and appropriate in light of the nature, quality and extent of services provided by DIMA.
Profitability. The Board reviewed detailed information regarding revenues received by DIMA under the Agreement. The Board considered the estimated costs to DIMA, andpre-tax profits realized by DIMA, from advising the DWS Funds, as well as estimates of thepre-tax profits attributable to managing the Fund in particular. The Board also received information regarding the estimated enterprise-wide profitability of DIMA and its affiliates with respect to all fund services in totality and by fund. The Board and the Fee Consultant reviewed DIMA’s methodology in allocating its costs to the management of the Fund. Based on the information provided, the Board concluded that thepre-tax profits realized by DIMA in connection with the management of the Fund were not unreasonable. The Board also reviewed certain publicly available information regarding the profitability of certain similar investment management firms. The Board noted that, while information regarding the profitability of such firms is limited (and in some cases is not necessarily prepared on a comparable basis), DIMA and its affiliates’ overall profitability with respect to the DWS Funds (after taking into account distribution and other services provided to the funds by DIMA and its affiliates) was lower than the overall profitability levels of most comparable firms for which such data was available.
Economies of Scale. The Board considered whether there are economies of scale with respect to the management of the Fund and whether the Fund benefits from any economies of scale. The Board noted that the Fund’s investment management fee schedule includes fee breakpoints. The Board concluded that the Fund’s fee schedule represents an appropriate sharing between the Fund and DIMA of such economies of scale as may exist in the management of the Fund at current asset levels.
Other Benefits to DIMA and Its Affiliates. The Board also considered the character and amount of other incidental or “fall-out”benefits received by DIMA and its affiliates, including any fees received by DIMA for administrative services provided to the Fund and any fees received by an affiliate of DIMA for transfer agency services provided to the Fund. The Board also considered benefits to DIMA related to brokerage and soft-dollar allocations, including allocating brokerage to pay for research generated by parties other than the
| | | | | | |
| | 20 | | | | | | Deutsche DWS Variable Series II — DWS Small Mid Cap Growth VIP |
executing broker dealers, which pertain primarily to funds investing in equity securities. In addition, the Board considered the incidental public relations benefits to DIMA related to DWS Funds advertising and cross-selling opportunities among DIMA products and services. The Board considered these benefits in reaching its conclusion that the Fund’s management fees were reasonable.
Compliance. The Board considered the significant attention and resources dedicated by DIMA to its compliance processes in recent years. The Board noted in particular (i) the experience, seniority and time commitment of the individuals serving as DIMA’s and the Fund’s chief compliance officers and (ii) the substantial commitment of resources by DIMA and its affiliates to compliance matters, including the retention of compliance personnel.
Based on all of the information considered and the conclusions reached, the Board determined that the continuation of the Agreement is in the best interests of the Fund. In making this determination, the Board did not give particular weight to any single factor identified above. The Board considered these factors over the course of numerous meetings, certain of which were in executive session with only the Independent Trustees and counsel present. It is possible that individual Independent Trustees may have weighed these factors differently in reaching their individual decisions to approve the continuation of the Agreement.
| | | | |
Deutsche DWS Variable Series II — DWS Small Mid Cap Growth VIP | | | | | 21 |
Board Members and Officers
The following table presents certain information regarding the Board Members and Officers of the Trust/Corporation. Each Board Member’s year of birth is set forth in parentheses after his or her name. Unless otherwise noted, (i) each Board Member has engaged in the principal occupation(s) noted in the table for at least the most recent five years, although not necessarily in the same capacity; and (ii) the address of each Independent Board Member is Keith R. Fox, DWS Funds Board Chair, c/o Thomas R. Hiller, Ropes & Gray LLP, Prudential Tower, 800 Boylston Street, Boston, MA02199-3600. Except as otherwise noted below, the term of office for each Board Member is until the election and qualification of a successor, or until such Board Member sooner dies, resigns, is removed or as otherwise provided in the governing documents of the Trust/Corporation. Because the Fund does not hold an annual meeting of shareholders, each Board Member will hold office for an indeterminate period.
The Board Members may also serve in similar capacities with other funds in the fund complex. The number of funds in DWS fund complex shown in the table below includes all registered open- and closed-end funds (including all of their portfolios) advised by the Advisor and any registered funds that have an investment advisor that is an affiliated person of the Advisor.
| | | | | | | | |
| Independent Board Members | | | | | |
Name, Year of Birth,
Position with the Trust/
Corporation and
Length of Time Served1 | | Business Experience and Directorships During the Past Five Years | | Number of
Funds in
DWS Fund
Complex
Overseen | | | Other
Directorships
Held by Board
Member
|
Keith R. Fox, CFA (1954) Chairperson since 2017, and Board Member since 1996 | | Managing General Partner, Exeter Capital Partners (a series of private investment funds) (since 1986). Directorships: ICI Mutual Insurance Company; Progressive International Corporation (kitchen goods importer and distributor); former Chairman, National Association of Small Business Investment Companies; former Directorships: The Kennel Shop (retailer); BoxTop Media Inc. (advertising); Sun Capital Advisers Trust (mutual funds) (2011–2012) | | | 77 | | | — |
John W. Ballantine (1946) Board Member since 1999 | | Retired; formerly, Executive Vice President and Chief Risk Management Officer, First Chicago NBD Corporation/The First National Bank of Chicago (1996–1998); Executive Vice President and Head of International Banking (1995–1996); former Directorships: Director and Chairman of the Board, Healthways, Inc.2 (population well-being and wellness services) (2003–2014); Stockwell Capital Investments PLC (private equity); Enron Corporation; FNB Corporation; Tokheim Corporation; First Oak Brook Bancshares, Inc.; Oak Brook Bank; and Prisma Energy International. Not-for-Profit Director/Trustee: Palm Beach Civic Association; Window to the World Communications (public media); Life Director of Harris Theater for Music and Dance (Chicago); Life Director of Hubbard Street Dance Chicago; former Not-for-Profit Directorships: Public Radio International | | | 77 | | | Portland
General
Electric2
(utility
company)
(2003–
present) |
Dawn-Marie Driscoll (1946) Board Member since 1987 | | Emeritus Executive Fellow, Center for Business Ethics, Bentley University; formerly: Partner, Palmer & Dodge (law firm) (1988–1990); Vice President of Corporate Affairs and General Counsel, Filene’s (retail) (1978–1988). Directorships: Advisory Board, Center for Business Ethics, Bentley University; Trustee and former Chairman of the Board, Southwest Florida Community Foundation (charitable organization); former Directorships: ICI Mutual Insurance Company (2007–2015); Sun Capital Advisers Trust (mutual funds) (2007–2012), Investment Company Institute (audit, executive, nominating committees) and Independent Directors Council (governance, executive committees) | | | 77 | | | — |
Richard J. Herring (1946) Board Member since 1990 | | Jacob Safra Professor of International Banking and Professor of Finance, The Wharton School, University of Pennsylvania (since July 1972); Director, The Wharton Financial Institutions Center (since 1994); formerly: Vice Dean and Director, Wharton Undergraduate Division (1995–2000) and Director, The Lauder Institute of International Management Studies (2000–2006); Member FDIC Systemic Risk Advisory Committee since 2011, member Systemic Risk Council since 2012 and member of the Advisory Board at the Yale Program on Financial Stability since 2013; Formerly Co-Chair of the Shadow Financial Regulatory Committee (2003–2015), Executive Director of The Financial Economists Roundtable (2008–2015), Director of The Thai Capital Fund (2007–2013), Director of The Aberdeen Singapore Fund (2007–2018), and Nonexecutive Director of Barclays Bank DE (2010–2018) | | | 77 | | | Director,
Aberdeen
Japan Fund
(since 2007) |
| | | | | | |
| | 22 | | | | | | Deutsche DWS Variable Series II — DWS Small Mid Cap Growth VIP |
| | | | | | | | |
Name, Year of Birth,
Position with the Trust/
Corporation and
Length of Time Served1 | | Business Experience and Directorships During the Past Five Years | | Number of
Funds in
DWS Fund
Complex
Overseen | | | Other
Directorships
Held by Board
Member
|
William McClayton (1944) Board Member since 2004 | | Private equity investor (since October 2009); previously, Managing Director, Diamond Management & Technology Consultants, Inc. (global consulting firm) (2001–2009); Directorship: Board of Managers, YMCA of Metropolitan Chicago; formerly: Senior Partner, Arthur Andersen LLP (accounting) (1966–2001); Trustee, Ravinia Festival | | | 77 | | | — |
Rebecca W. Rimel (1951) Board Member since 1995 | | President, Chief Executive Officer and Director, The Pew Charitable Trusts (charitable organization) (1994–present); formerly: Executive Vice President, The Glenmede Trust Company (investment trust and wealth management) (1983–2004); Board Member, Investor Education (charitable organization) (2004–2005); Trustee, Executive Committee, Philadelphia Chamber of Commerce (2001–2007); Director, Viasys Health Care2 (January 2007–June 2007); Trustee, Thomas Jefferson Foundation (charitable organization) (1994–2012) | | | 77 | | | Director,
Becton
Dickinson
and
Company2
(medical
technology
company)
(2012–
present);
Director,
BioTelemetry
Inc.2(health
care) (2009–
present) |
William N. Searcy, Jr. (1946) Board Member since 1993 | | Private investor since October 2003; formerly: Pension & Savings Trust Officer, Sprint Corporation2(telecommunications) (November 1989–September 2003); Trustee, Sun Capital Advisers Trust (mutual funds) (1998–2012) | | | 77 | | | — |
| | |
| Officers4 | | |
Name, Year of Birth,
Position with the Trust/
Corporation and
Length of Time Served5 | | Business Experience and Directorships During the Past Five Years |
Hepsen Uzcan6(1974) President and Chief Executive Officer, 2017–present | | Managing Director,3 DWS; Secretary, DWS USA Corporation (2018–present); Assistant Secretary, DWS Distributors, Inc. (2018–present); Director and Vice President, DWS Service Company (2018–present); Assistant Secretary, DWS Investment Management Americas, Inc. (2018–present); and Director and President, DB Investment Managers, Inc. (2018–present); formerly: Vice President for the Deutsche funds (2016–2017); Assistant Secretary for the DWS funds (2013–2019) |
John Millette7(1962) Vice President and Secretary, 1999–present | | Director,3DWS; Chief Legal Officer, DWS Investment Management Americas, Inc. (2015–present); Director and Vice President, DWS Trust Company (2016–present); and Assistant Secretary, DBX ETF Trust (2019–present); formerly: Secretary, Deutsche Investment Management Americas Inc. (2015–2017) |
Diane Kenneally7(1966) Chief Financial Officer and Treasurer, 2018–present | | Director,3 DWS; and Treasurer, Chief Financial Officer and Controller, DBX ETF Trust (2019–present); formerly: Assistant Treasurer for the DWS funds (2007–2018) |
Paul Antosca7(1957) Assistant Treasurer, 2007–present | | Director,3DWS; and Assistant Treasurer, DBX ETF Trust (2019–present) |
Sheila Cadogan7(1966) Assistant Treasurer, 2017–present | | Director,3DWS; Director and Vice President, DWS Trust Company (2018–present); and Assistant Treasurer, DBX ETF Trust (2019–present) |
Scott D. Hogan7(1970) Chief Compliance Officer, 2016–present | | Director,3DWS |
Caroline Pearson7(1962) Chief Legal Officer, 2010–present | | Managing Director,3DWS; formerly: Secretary, Deutsche AM Distributors, Inc. (2002–2017); and Secretary, Deutsche AM Service Company (2010–2017) |
Wayne Salit6(1967) Anti-Money Laundering Compliance Officer, 2014–present | | Director,3 Deutsche Bank; and AML Officer, DWS Trust Company; formerly: Managing Director, AML Compliance Officer at BNY Mellon (2011–2014); and Director, AML Compliance Officer at Deutsche Bank (2004–2011) |
Ciara Crawford8 (1984) Assistant Secretary, (2019–present) | | Associate, DWS (since 2015); previously, Legal Assistant at Accelerated Tax Solutions. |
| | | | |
Deutsche DWS Variable Series II — DWS Small Mid Cap Growth VIP | | | | | 23 |
| 1 | The length of time served represents the year in which the Board Member joined the board of one or more DWS funds currently overseen by the Board. |
| 2 | A publicly held company with securities registered pursuant to Section 12 of the Securities Exchange Act of 1934. |
| 3 | Executive title, not a board directorship. |
| 4 | As a result of their respective positions held with the Advisor or its affiliates, these individuals are considered “interested persons” of the Advisor within the meaning of the 1940 Act. Interested persons receive no compensation from the Fund. |
| 5 | The length of time served represents the year in which the officer was first elected in such capacity for one or more DWS funds. |
| 6 | Address: 875 Third Avenue, New York, NY 10022. |
| 7 | Address: One International Place, Boston, MA 02110. |
| 8 | Address: 5022 Gate Parkway, Suite 400, Jacksonville, FL 32256. |
The Fund’s Statement of Additional Information (“SAI”) includes additional information about the Board Members. The SAI is available, without charge, upon request. If you would like to request a copy of the SAI, you may do so by calling the followingtoll-free number:(800) 728-3337.
| | | | | | |
| | 24 | | | | | | Deutsche DWS Variable Series II — DWS Small Mid Cap Growth VIP |
Notes
Notes
Notes
| | |
| | |
VS2SMCG-2 (R-025835-9 2/20) | | |
December 31, 2019
Annual Report
Deutsche DWS Variable Series II
DWS Small Mid Cap Value VIP
Beginning on January 1, 2021, as permitted by regulations adopted by the Securities and Exchange Commission, you may not be receiving paper copies of the Fund’s shareholder reports from the insurance company that offers your contract unless you specifically request paper copies from your insurance company or from your financial intermediary. Instead, the shareholder reports will be made available on a Web site, and your insurance company will notify you by mail each time a report is posted and provide you with a Web site link to access the report. Instructions for requesting paper copies will be provided by your insurance company.
If you already elected to receive shareholder reports electronically, you will not be affected by this change and you need not take any action. You may elect to receive shareholder reports and other communications from your insurance company electronically by following the instructions provided by your insurance company.
You may elect to receive all future reports in paper free of charge from your insurance company. If your insurance company informs you that future reports will be delivered via Web access, you can inform your insurance company that you wish to continue receiving paper copies of your shareholder reports by following the instructions provided by your insurance company.

Contents
This report must be preceded or accompanied by a prospectus. To obtain an additional prospectus or summary prospectus, if available, call (800)728-3337 or your financial representative. We advise you to consider the Fund’s objectives, risks, charges and expenses carefully before investing. The summary prospectus and prospectus contain this and other important information about the Fund. Please read the prospectus carefully before you invest.
Stocks may decline in value. Smaller and medium company stocks tend to be more volatile than large company stocks. Any fund that focuses in a particular segment of the market or region of the world will generally be more volatile than a fund that invests more broadly. The Fund may lend securities to approved institutions. Please read the prospectus for details.
The brand DWS represents DWS Group GmbH & Co. KGaA and any of its subsidiaries such as DWS Distributors, Inc. which offers investment products or DWS Investment Management Americas, Inc. and RREEF America L.L.C. which offer advisory services.
DWS Distributors, Inc., 222 South Riverside Plaza, Chicago, IL 60606, (800)621-1148
NOT FDIC/NCUA INSURED NO BANK GUARANTEE MAY LOSE VALUE NOT A DEPOSIT
NOT INSURED BY ANY FEDERAL GOVERNMENT AGENCY
| | | | | | |
| | 2 | | | | | | Deutsche DWS Variable Series II — DWS Small Mid Cap Value VIP |
| | |
| Performance Summary | | December 31, 2019 (Unaudited) |
Fund performance shown is historical, assumes reinvestment of all dividend and capital gain distributions and does not guarantee future results. Investment return and principal value fluctuate with changing market conditions so that, when redeemed, shares may be worth more or less than their original cost. Current performance may be lower or higher than the performance data quoted. Please contact your participating insurance company for the Fund’s most recentmonth-end performance. Performance does not reflect charges and fees (“contract charges”) associated with the separate account that invests in the Fund or any variable life insurance policy or variable annuity contract for which the Fund is an investment option. These charges and fees will reduce returns. While all share classes have the same underlying portfolio, their performance will differ.
The gross expense ratios of the Fund, as stated in the fee table of the prospectus dated May 1, 2019 are 0.87% and 1.24% for Class A and Class B shares, respectively, and may differ from the expense ratios disclosed in the Financial Highlights tables in this report.
Generally accepted accounting principles require adjustments to be made to the net assets of the Fund at period end for financial reporting purposes only, and as such, the total return based on the unadjusted net asset value per share may differ from the total return reported in the financial highlights.
Growth of an Assumed $10,000 Investment
| | |
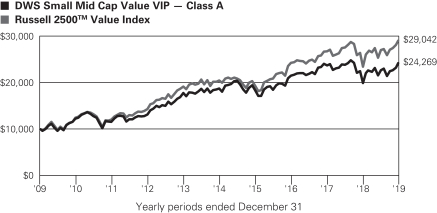
| | Russell 2500™ Value Index is an unmanaged index measuring the small to mid-cap U.S. equity value market. Index returns do not reflect any fees or expenses and it is not possible to invest directly into an index. |
| | | | | | | | | | |
| Comparative Results | | | | | | | | |
| | | | |
| DWS Small Mid Cap Value VIP | | 1-Year | | 3-Year | | 5-Year | | 10-Year |
| Class A | | Growth of $10,000 | | $12,151 | | $11,279 | | $12,932 | | $24,269 |
| | | Average annual total return | | 21.51% | | 4.09% | | 5.28% | | 9.27% |
| Russell 2500 Value Index | | Growth of $10,000 | | $12,356 | | $11,951 | | $14,142 | | $29,042 |
| | | Average annual total return | | 23.56% | | 6.12% | | 7.18% | | 11.25% |
| | | | |
| DWS Small Mid Cap Value VIP | | 1-Year | | 3-Year | | 5-Year | | 10-Year |
| Class B | | Growth of $10,000 | | $12,099 | | $11,150 | | $12,699 | | $23,417 |
| | | Average annual total return | | 20.99% | | 3.69% | | 4.89% | | 8.88% |
| Russell 2500 Value Index | | Growth of $10,000 | | $12,356 | | $11,951 | | $14,142 | | $29,042 |
| | | Average annual total return | | 23.56% | | 6.12% | | 7.18% | | 11.25% |
The growth of $10,000 is cumulative.
| | | | |
Deutsche DWS Variable Series II — DWS Small Mid Cap Value VIP | | | | | 3 |
| | |
| Management Summary | | December 31, 2019 (Unaudited) |
Class A shares of DWS Small Mid Cap Value VIP returned 21.51% in 2019 (unadjusted for contract charges) and underperformed the 23.56% return of the Russell 2500™ Value Index.
Small- andmid-cap U.S. equities performed very well in the12-month period, thanks in large part to the increasingly accommodative monetary policy of the U.S. Federal Reserve (Fed). The Fed cut rates three times from August to October 2019, and it began to inject liquidity into the markets on a daily basis in the fourth quarter. These actions, together with steady economic conditions and continued corporate earnings growth, boosted investors’ appetite for risk and led to a strong gain for domestic equities. The value style underperformed the broader market, however, as investors displayed a clear preference companies with the ability to deliver above-average profit growth despite the sluggish global economy.
The Fund’s management team changed in February 2019, leading to the adoption of a new stock-picking methodology. As a result, our primary portfolio activity involved shifting the Fund’s holdings to be consistent with the new strategy. We accomplished this changeover in a gradual fashion as the year progressed. Consistent with ourbottom-up approach, we shifted the portfolio so its sector weightings are very close to those of the benchmark. Allocation therefore had a minimal impact on performance in the second half of the year.
Stock selection, which incorporated the results of two management teams, was a net detractor from performance. Much of the weakness in occurred in communications services, where the Fund’s investments posted a loss even as the broader sector delivered a double-digit gain. The movie theatre operator AMC Entertainment Holdings, Inc. was the largest individual detractor, followed by the Indian movie-production company Eros International Media, Ltd.* The industrials sector was also an area of weakness, due largely to positions in the conglomerate Hillenbrand, Inc. and the battery producer EnerSys. A position in cash, while limited, further detracted from results given the robust return for the index.
On the plus side, we added value through the outperformance of our stock picks in the consumer discretionary space. Winnebago Industries, Inc. was the top contributor in both the sector and the Fund as a whole. The stock produced a triple-digit gain due to a healthy third quarter earnings report and the market’s rotation to cyclical stocks in the late summer/early fall period. WW International, Inc. (formerly Weight Watchers International), also advanced as a better-than-expected earnings report in August set the stage for a rally in the second half of the year. Real estate was an additional area of strength, led by holdings in Community Healthcare Trust, Inc.* and Easterly Government Properties, Inc.
The outlook for economic growth, trade, and global central bank policy remained murky at year end, but equities nonetheless closed out 2019 on a high note behind continued ebullience in investor sentiment. For our part, we choose to look beyond the headlines to focus on selecting the best individual stocks for the Fund by using a quantitative strategy.
Pankaj Bhatnagar, PhD, Managing Director
Arno V. Puskar, Director
Portfolio Managers
The views expressed reflect those of the portfolio management team only through the end of the period of the report as stated on the cover. The management team’s views are subject to change at any time based on market and other conditions and should not be construed as a recommendation. Past performance is no guarantee of future results. Current and future portfolio holdings are subject to risk.
Terms to Know
Russell 2500 Value Index is an unmanaged index measuring the small- tomid-cap U.S. equity value market.
Contribution anddetraction incorporate both a stock’s total return and its weighting in the fund.
| * | Not held at December 31, 2019. |
| | | | | | |
| | 4 | | | | | | Deutsche DWS Variable Series II — DWS Small Mid Cap Value VIP |
| | |
| Portfolio Summary | | (Unaudited) |
| | | | | | | | |
| Asset Allocation (As a % of Investment Portfolio excluding Securities Lending Collateral) | | 12/31/19 | | | 12/31/18 | |
| Common Stocks | | | 99% | | | | 97% | |
| Cash Equivalents | | | 1% | | | | 3% | |
| | | | 100% | | | | 100% | |
| | |
Sector Diversification
(As a % of Investment Portfolio excluding Cash Equivalents and Securities Lending Collateral) | | 12/31/19 | | | 12/31/18 | |
| Financials | | | 23% | | | | 22% | |
| Real Estate | | | 14% | | | | 13% | |
| Industrials | | | 14% | | | | 16% | |
| Consumer Discretionary | | | 10% | | | | 12% | |
| Information Technology | | | 9% | | | | 11% | |
| Materials | | | 7% | | | | 5% | |
| Utilities | | | 6% | | | | 6% | |
| Health Care | | | 6% | | | | 6% | |
| Energy | | | 5% | | | | 4% | |
| Consumer Staples | | | 3% | | | | 3% | |
| Communication Services | | | 3% | | | | 2% | |
| | | | 100% | | | | 100% | |
Portfolio holdings and characteristics are subject to change.
For more complete details about the Fund’s investment portfolio, see page 6.
Following the Fund’s fiscal first and thirdquarter-end, a complete portfolio holdings listing is filed with the SEC on Form N-PORT. The Fund’s Form N-PORT will be available on the SEC’s Web site at sec.gov. The Fund’s portfolio holdings are also posted on dws.com from time to time. Please read the Fund’s current prospectus for more information.
| | | | |
Deutsche DWS Variable Series II — DWS Small Mid Cap Value VIP | | | | | 5 |
| | |
| Investment Portfolio | | as of December 31, 2019 |
| | | | | | | | |
| | | Shares | | | Value ($) | |
| Common Stocks 98.5% | |
| Communication Services 2.8% | |
Entertainment 0.4% | |
AMC Entertainment Holdings, Inc. “A” (a) | | | 55,055 | | | | 398,598 | |
|
Media 1.9% | |
Interpublic Group of Companies, Inc. | | | 78,123 | | | | 1,804,641 | |
|
Wireless Telecommunication Services 0.5% | |
Telephone & Data Systems, Inc. | | | 19,087 | | | | 485,383 | |
|
| Consumer Discretionary 9.5% | |
Automobiles 0.9% | |
Winnebago Industries, Inc. | | | 16,677 | | | | 883,547 | |
|
Diversified Consumer Services 2.3% | |
| | |
Regis Corp.* | | | 74,377 | | | | 1,329,117 | |
| | |
WW International, Inc.* | | | 21,998 | | | | 840,544 | |
| | | | | | | | |
| | | | 2,169,661 | |
|
Hotels, Restaurants & Leisure 1.9% | |
Aramark | | | 42,196 | | | | 1,831,306 | |
|
Household Durables 0.5% | |
PulteGroup, Inc. | | | 12,282 | | | | 476,542 | |
|
Leisure Products 0.9% | |
Brunswick Corp. | | | 14,307 | | | | 858,134 | |
|
Multiline Retail 0.4% | |
Kohl’s Corp. | | | 8,100 | | | | 412,695 | |
|
Specialty Retail 0.8% | |
The Michaels Companies, Inc.* | | | 98,280 | | | | 795,085 | |
|
Textiles, Apparel & Luxury Goods 1.8% | |
Columbia Sportswear Co. | | | 17,354 | | | | 1,738,697 | |
|
| Consumer Staples 3.0% | |
Food Products 0.6% | |
Conagra Brands, Inc. | | | 17,736 | | | | 607,281 | |
|
Household Products 1.9% | |
Central Garden & Pet Co.* | | | 58,597 | | | | 1,820,609 | |
|
Tobacco 0.5% | |
Vector Group Ltd. | | | 35,608 | | | | 476,791 | |
|
| Energy 4.6% | |
Energy Equipment & Services 1.1% | |
| | |
NexTier Oilfield Solutions, Inc.* | | | 70,248 | | | | 470,662 | |
| | |
Patterson-UTI Energy, Inc. | | | 54,471 | | | | 571,945 | |
| | | | | | | | |
| | | | 1,042,607 | |
|
Oil, Gas & Consumable Fuels 3.5% | |
| | |
Equitrans Midstream Corp. | | | 38,708 | | | | 517,139 | |
| | |
Gulfport Energy Corp.* | | | 177,539 | | | | 539,719 | |
| | |
HollyFrontier Corp. | | | 8,348 | | | | 423,327 | |
| | |
Murphy Oil Corp. | | | 15,131 | | | | 405,511 | |
| | |
Peabody Energy Corp. | | | 60,187 | | | | 548,905 | |
| | |
Targa Resources Corp. | | | 22,695 | | | | 926,637 | |
| | | | | | | | |
| | | | 3,361,238 | |
|
| Financials 22.5% | |
Banks 9.7% | |
| | |
Bank of America Corp. | | | 12,884 | | | | 453,775 | |
| | |
BankUnited, Inc. | | | 12,677 | | | | 463,471 | |
| | | | | | | | |
| | | Shares | | | Value ($) | |
| | |
Eagle Bancorp., Inc. | | | 23,396 | | | | 1,137,748 | |
| | |
Hancock Whitney Corp. | | | 46,301 | | | | 2,031,688 | |
| | |
Hilltop Holdings, Inc. | | | 18,694 | | | | 466,041 | |
| | |
JPMorgan Chase & Co. | | | 3,495 | | | | 487,203 | |
| | |
Pacific Premier Bancorp., Inc. | | | 33,715 | | | | 1,099,278 | |
| | |
Simmons First National Corp. “A” | | | 17,474 | | | | 468,128 | |
| | |
Sterling Bancorp. | | | 66,324 | | | | 1,398,110 | |
| | |
UMB Financial Corp. | | | 18,452 | | | | 1,266,545 | |
| | | | | | | | |
| | | | 9,271,987 | |
|
Consumer Finance 1.0% | |
| | |
Credit Acceptance Corp.* | | | 947 | | | | 418,887 | |
| | |
EZCORP, Inc. “A”* | | | 84,871 | | | | 578,820 | |
| | | | | | | | |
| | | | 997,707 | |
|
Insurance 7.3% | |
| | |
American Equity Investment Life Holding Co. | | | 15,529 | | | | 464,783 | |
| | |
American Financial Group, Inc. | | | 5,290 | | | | 580,048 | |
| | |
Assurant, Inc. | | | 9,527 | | | | 1,248,799 | |
| | |
Brown & Brown, Inc. | | | 50,612 | | | | 1,998,162 | |
| | |
Everest Re Group Ltd. | | | 2,634 | | | | 729,196 | |
| | |
Globe Life, Inc. | | | 9,200 | | | | 968,300 | |
| | |
MBIA, Inc.* | | | 99,772 | | | | 927,880 | |
| | | | | | | | |
| | | | 6,917,168 | |
|
Mortgage Real Estate Investment Trusts (REITs) 2.5% | |
| | |
Blackstone Mortgage Trust, Inc. ,“A” | | | 24,538 | | | | 913,304 | |
| | |
Ellington Financial, Inc. | | | 25,520 | | | | 467,782 | |
| | |
PennyMac Mortgage Investment Trust | | | 41,713 | | | | 929,783 | |
| | | | | | | | |
| | | | 2,310,869 | |
|
Thrifts & Mortgage Finance 2.0% | |
Walker & Dunlop, Inc. | | | 29,822 | | | | 1,928,887 | |
|
| Health Care 6.1% | |
Health Care Equipment & Supplies 1.0% | |
Invacare Corp. | | | 109,769 | | | | 990,117 | |
|
Health Care Providers & Services 1.1% | |
Premier, Inc. “A”* | | | 26,798 | | | | 1,015,108 | |
|
Life Sciences Tools & Services 3.6% | |
| | |
Bruker Corp. | | | 42,574 | | | | 2,169,997 | |
| | |
PerkinElmer, Inc. | | | 12,605 | | �� | | 1,223,945 | |
| | | | | | | | |
| | | | 3,393,942 | |
|
Pharmaceuticals 0.4% | |
Mallinckrodt PLC* (a) | | | 113,663 | | | | 396,684 | |
|
| Industrials 13.4% | |
Aerospace & Defense 1.9% | |
Teledyne Technologies, Inc.* | | | 5,099 | | | | 1,767,007 | |
|
Building Products 1.2% | |
Simpson Manufacturing Co., Inc. | | | 14,345 | | | | 1,150,899 | |
|
Commercial Services & Supplies 1.3% | |
| | |
IAA, Inc.* | | | 9,289 | | | | 437,141 | |
| | |
Interface, Inc. | | | 47,907 | | | | 794,777 | |
| | | | | | | | |
| | | | 1,231,918 | |
The accompanying notes are an integral part of the financial statements.
| | | | | | |
| | 6 | | | | | | Deutsche DWS Variable Series II — DWS Small Mid Cap Value VIP |
| | | | | | | | |
| | | Shares | | | Value ($) | |
Construction & Engineering 1.5% | |
| | |
Great Lakes Dredge & Dock Corp.* | | | 45,105 | | | | 511,040 | |
| | |
Jacobs Engineering Group, Inc. | | | 9,994 | | | | 897,761 | |
| | | | | | | | |
| | | | 1,408,801 | |
|
Electrical Equipment 2.1% | |
EnerSys | | | 26,151 | | | | 1,956,879 | |
|
Industrial Conglomerates 0.5% | |
Carlisle Companies, Inc. | | | 3,124 | | | | 505,588 | |
|
Machinery 3.2% | |
| | |
Federal Signal Corp. | | | 57,319 | | | | 1,848,538 | |
| | |
Hillenbrand, Inc. | | | 34,641 | | | | 1,153,891 | |
| | | | | | | | |
| | | | 3,002,429 | |
|
Professional Services 0.8% | |
ICF International, Inc. | | | 8,417 | | | | 771,166 | |
|
Road & Rail 0.9% | |
Hertz Global Holdings, Inc.* | | | 55,813 | | | | 879,055 | |
|
| Information Technology 9.3% | |
Communications Equipment 1.0% | |
CommScope Holding Co., Inc.* | | | 67,304 | | | | 955,044 | |
|
Electronic Equipment, Instruments & Components 2.2% | |
Insight Enterprises, Inc.* | | | 29,427 | | | | 2,068,424 | |
|
IT Services 2.0% | |
| | |
Alliance Data Systems Corp. | | | 3,213 | | | | 360,498 | |
| | |
Leidos Holdings, Inc. | | | 15,800 | | | | 1,546,662 | |
| | | | | | | | |
| | | | 1,907,160 | |
|
Semiconductors & Semiconductor Equipment 2.1% | |
| | |
Cirrus Logic, Inc.* | | | 5,821 | | | | 479,709 | |
| | |
Marvell Technology Group Ltd. | | | 36,100 | | | | 958,816 | |
| | |
ON Semiconductor Corp.* | | | 24,024 | | | | 585,705 | |
| | | | | | | | |
| | | | 2,024,230 | |
|
Software 2.0% | |
Verint Systems, Inc.* | | | 34,980 | | | | 1,936,493 | |
|
| Materials 6.9% | |
Chemicals 0.6% | |
Kraton Corp.* | | | 24,688 | | | | 625,100 | |
|
Metals & Mining 6.3% | |
| | |
Cleveland-Cliffs, Inc. (a) | | | 142,611 | | | | 1,197,932 | |
| | |
Coeur Mining, Inc.* | | | 134,562 | | | | 1,087,261 | |
| | |
Steel Dynamics, Inc. | | | 62,445 | | | | 2,125,628 | |
| | |
SunCoke Energy, Inc. | | | 87,242 | | | | 543,518 | |
| | |
Warrior Met Coal, Inc. | | | 45,896 | | | | 969,782 | |
| | | | | | | | |
| | | | 5,924,121 | |
|
| Real Estate 14.1% | |
Equity Real Estate Investment Trusts (REITs) | |
| | |
Agree Realty Corp. | | | 18,341 | | | | 1,286,988 | |
| | |
Alexander & Baldwin, Inc.* | | | 19,251 | | | | 403,501 | |
| | | | | | | | |
| | | Shares | | | Value ($) | |
| | |
Colony Capital, Inc. | | | 82,585 | | | | 392,279 | |
| | |
Duke Realty Corp. | | | 35,999 | | | | 1,248,085 | |
| | |
Easterly Government Properties, Inc. | | | 71,737 | | | | 1,702,319 | |
| | |
Gaming and Leisure Properties, Inc. | | | 28,066 | | | | 1,208,241 | |
| | |
Highwoods Properties, Inc. | | | 28,870 | | | | 1,412,032 | |
| | |
Lexington Realty Trust | | | 44,373 | | | | 471,241 | |
| | |
Pebblebrook Hotel Trust | | | 39,087 | | | | 1,047,923 | |
| | |
SITE Centers Corp. | | | 71,120 | | | | 997,102 | |
| | |
STAG Industrial, Inc. | | | 43,423 | | | | 1,370,864 | |
| | |
Urban Edge Properties | | | 24,690 | | | | 473,554 | |
| | |
WP Carey, Inc. | | | 15,846 | | | | 1,268,314 | |
| | | | | | | | |
| | | | 13,282,443 | |
|
| Utilities 6.3% | |
Electric Utilities 4.0% | |
| | |
Alliant Energy Corp. | | | 12,910 | | | | 706,435 | |
| | |
IDACORP, Inc. | | | 18,329 | | | | 1,957,537 | |
| | |
Pinnacle West Capital Corp. | | | 12,092 | | | | 1,087,434 | |
| | | | | | | | |
| | | | 3,751,406 | |
|
Gas Utilities 2.3% | |
| | |
ONE Gas, Inc. | | | 18,958 | | | | 1,773,900 | |
| | |
UGI Corp. | | | 9,057 | | | | 409,014 | |
| | | | | | | | |
| | | | | 2,182,914 | |
| Total Common Stocks(Cost $84,136,295) | | | | 93,716,361 | |
|
| Securities Lending Collateral 2.1% | |
DWS Government & Agency Securities Portfolio “DWS Government Cash Institutional Shares”, 1.50% (b) (c) (Cost $1,984,280) | | | 1,984,280 | | | | 1,984,280 | |
|
| Cash Equivalents 0.5% | |
DWS Central Cash Management Government Fund, 1.62% (b) (Cost $487,000) | | | 487,000 | | | | 487,000 | |
| | |
| | | % of Net
Assets | | | Value ($) | |
Total Investment Portfolio (Cost $86,607,575) | | | 101.1 | | | | 96,187,641 | |
| Other Assets and Liabilities, Net | | | (1.1 | ) | | | (1,019,827 | ) |
| Net Assets | | | 100.0 | | | | 95,167,814 | |
The accompanying notes are an integral part of the financial statements.
| | | | |
Deutsche DWS Variable Series II — DWS Small Mid Cap Value VIP | | | | | 7 |
A summary of the Fund’s transactions with affiliated investments during the year ended December 31, 2019 are as follows:
| | | | | | | | | | | | | | | | | | | | | | | | | | | | | | | | |
Value ($) at
12/31/2018 | | Purchases
Cost ($) | | | Sales
Proceeds ($) | | | Net
Realized
Gain/
(Loss) ($) | | | Net Change in
Unrealized
Appreciation
(Depreciation) ($) | | | Income ($) | | | Capital Gain
Distributions ($) | | | Number
of Shares
at
12/31/2019 | | | Value ($)
at
12/31/2019 | |
Securities Lending Collateral 2.1% | |
DWS Government & Agency Securities Portfolio “DWS Government Cash Institutional Shares”, 1.50% (b) (c) | |
| — | | | 1,984,280 | (d) | | | — | | | | — | | | | — | | | | 33,113 | | | | — | | | | 1,984,280 | | | | 1,984,280 | |
Cash Equivalents 0.5% | |
DWS Central Cash Management Government Fund, 1.62% (b) | |
| 2,497,809 | | | 12,067,941 | | | | 14,078,750 | | | | — | | | | — | | | | 34,862 | | | | — | | | | 487,000 | | | | 487,000 | |
| 2,497,809 | | | 14,052,221 | | | | 14,078,750 | | | | — | | | | — | | | | 67,975 | | | | — | | | | 2,471,280 | | | | 2,471,280 | |
| * | Non-income producing security. |
| (a) | All or a portion of these securities were on loan. In addition, “Other Assets and Liabilities, Net” may include pending sales that are also on loan. The value of securities loaned at December 31, 2019 amounted to $1,955,693, which is 2.1% of net assets. |
| (b) | Affiliated fund managed by DWS Investment Management Americas, Inc. The rate shown is the annualizedseven-day yield at period end. |
| (c) | Represents cash collateral held in connection with securities lending. Income earned by the Fund is net of borrower rebates. |
| (d) | Represents the net increase (purchase cost) or decrease (sales proceeds) in the amount invested in cash collateral for the year ended December 31, 2019. |
Fair Value Measurements
Various inputs are used in determining the value of the Fund’s investments. These inputs are summarized in three broad levels. Level 1 includes quoted prices in active markets for identical securities. Level 2 includes other significant observable inputs (including quoted prices for similar securities, interest rates, prepayment speeds and credit risk). Level 3 includes significant unobservable inputs (including the Fund’s own assumptions in determining the fair value of investments). The level assigned to the securities valuations may not be an indication of the risk or liquidity associated with investing in those securities.
The following is a summary of the inputs used as of December 31, 2019 in valuing the Fund’s investments. For information on the Fund’s policy regarding the valuation of investments, please refer to the Security Valuation section of Note A in the accompanying Notes to Financial Statements.
| | | | | | | | | | | | | | | | |
| Assets | | Level 1 | | | Level 2 | | | Level 3 | | | Total | |
| Common Stocks (e) | | $ | 93,716,361 | | | $ | — | | | $ | — | | | $ | 93,716,361 | |
| Short-Term Investments (e) | | | 2,471,280 | | | | — | | | | — | | | | 2,471,280 | |
| Total | | $ | 96,187,641 | | | $ | — | | | $ | — | | | $ | 96,187,641 | |
| (e) | See Investment Portfolio for additional detailed categorizations. |
The accompanying notes are an integral part of the financial statements.
| | | | | | |
| | 8 | | | | | | Deutsche DWS Variable Series II — DWS Small Mid Cap Value VIP |
Statement of Assets and Liabilities
| | | | |
| as of December 31, 2019 | | | | |
| |
| Assets | | | | |
| Investments innon-affiliated securities, at value (cost $84,136,295) — including $1,955,693 of securities loaned | | $ | 93,716,361 | |
| Investment in DWS Government & Agency Securities Portfolio (cost $1,984,280)* | | | 1,984,280 | |
| Investment in DWS Central Cash Management Government Fund (cost $487,000) | | | 487,000 | |
| Receivable for Fund shares sold | | | 8,194 | |
| Dividends receivable | | | 148,287 | |
| Interest receivable | | | 5,907 | |
| Other assets | | | 991,803 | |
| Total assets | | | 97,341,832 | |
| |
| Liabilities | | | | |
| Payable upon return of securities loaned | | | 1,984,280 | |
| Payable for Fund shares redeemed | | | 39,673 | |
| Accrued management fee | | | 59,930 | |
| Accrued Trustees’ fees | | | 2,618 | |
| Other accrued expenses and payables | | | 87,517 | |
| Total liabilities | | | 2,174,018 | |
| Net assets, at value | | $ | 95,167,814 | |
| |
| Net Assets Consist of | | | | |
| Distributable earnings (loss) | | | 16,879,530 | |
| Paid-in capital | | | 78,288,284 | |
| Net assets, at value | | $ | 95,167,814 | |
| |
| Net Asset Value | | | | |
Class A | | | | |
| |
Net Asset Value, offering and redemption price per share ($78,356,454 ÷ 5,666,170 outstanding
shares of beneficial interest, no par value, unlimited number of shares authorized) | | $ | 13.83 | |
Class B | | | | |
| |
Net Asset Value, offering and redemption price per share ($16,811,360 ÷ 1,216,620 outstanding
shares of beneficial interest, no par value, unlimited number of shares authorized) | | $ | 13.82 | |
| * | Represents collateral on securities loaned. |
Statement of Operations
| | | | |
| for the year ended December 31, 2019 | |
| |
| Investment Income | | | | |
| Income: | | | | |
| Dividends | | $ | 1,941,948 | |
| Income distributions — DWS Cash Management Government Fund | | | 34,862 | |
| Securities lending income, net of borrower rebates | | | 33,113 | |
| Total income | | | 2,009,923 | |
| Expenses: | | | | |
| Management fee | | | 598,567 | |
| Administration fee | | | 92,087 | |
| Services to Shareholders | | | 2,286 | |
| Record keeping fee (Class B) | | | 19,966 | |
| Distribution service fees (Class B) | | | 40,665 | |
| Custodian fee | | | 3,724 | |
| Professional fees | | | 57,901 | |
| Reports to shareholders | | | 40,904 | |
| Trustees’ fees and expenses | | | 6,999 | |
| Other | | | 7,409 | |
| Total expenses before expense reductions | | | 870,508 | |
| Expense reductions | | | (48,588 | ) |
| Total expenses after expense reductions | | | 821,920 | |
| Net investment income | | | 1,188,003 | |
| |
| Realized and Unrealized gain (loss) | | | | |
| Net realized gain (loss) from investments | | | 6,244,068 | |
| Change in net unrealized appreciation (depreciation) on investments | | | 11,215,454 | |
| Net gain (loss) | | | 17,459,522 | |
| Net increase (decrease) in net assets resulting from operations | | $ | 18,647,525 | |
The accompanying notes are an integral part of the financial statements.
| | | | |
Deutsche DWS Variable Series II — DWS Small Mid Cap Value VIP | | | | | 9 |
Statements of Changes in Net Assets
| | | | | | | | |
| | | Years Ended December 31, | |
| Increase (Decrease) in Net Assets | | 2019 | | | 2018 | |
| Operations: | | | | | | | | |
| Net investment income (loss) | | $ | 1,188,003 | | | $ | 620,637 | |
| Net realized gain (loss) | | | 6,244,068 | | | | 6,571,650 | |
| Change in net unrealized appreciation (depreciation) | | | 11,215,454 | | | | (23,519,638 | ) |
| Net increase (decrease) in net assets resulting from operations | | | 18,647,525 | | | | (16,327,351 | ) |
| Distributions to shareholders: | | | | | | | | |
Class A | | | (6,073,443 | ) | | | (17,037,935 | ) |
Class B | | | (1,252,920 | ) | | | (3,363,724 | ) |
| Total distributions | | | (7,326,363 | ) | | | (20,401,659 | ) |
| Fund share transactions: | | | | | | | | |
Class A | | | | | | | | |
| Proceeds from shares sold | | | 3,385,798 | | | | 4,320,688 | |
| Reinvestment of distributions | | | 6,073,443 | | | | 17,037,935 | |
| Payments for shares redeemed | | | (10,531,345 | ) | | | (16,960,024 | ) |
| Net increase (decrease) in net assets from Class A share transactions | | | (1,072,104 | ) | | | 4,398,599 | |
Class B | | | | | | | | |
| Proceeds from shares sold | | | 1,581,613 | | | | 2,796,123 | |
| Reinvestment of distributions | | | 1,252,920 | | | | 3,363,724 | |
| Payments for shares redeemed | | | (3,209,519 | ) | | | (3,194,564 | ) |
| Net increase (decrease) in net assets from Class B share transactions | | | (374,986 | ) | | | 2,965,283 | |
| Increase (decrease) in net assets | | | 9,874,072 | | | | (29,365,128 | ) |
| Net assets at beginning of period | | | 85,293,742 | | | | 114,658,870 | |
| | |
| Net assets at end of period | | $ | 95,167,814 | | | $ | 85,293,742 | |
| | |
| Other Information | | | | | | |
Class A | | | | | | | | |
| Shares outstanding at beginning of period | | | 5,742,711 | | | | 5,375,574 | |
| Shares sold | | | 261,390 | | | | 286,538 | |
| Shares issued to shareholders in reinvestment of distributions | | | 468,268 | | | | 1,188,970 | |
| Shares redeemed | | | (806,199 | ) | | | (1,108,371 | ) |
| Net increase (decrease) in Class A shares | | | (76,541 | ) | | | 367,137 | |
| | |
| Shares outstanding at end of period | | | 5,666,170 | | | | 5,742,711 | |
Class B | | | | | | | | |
| Shares outstanding at beginning of period | | | 1,243,269 | | | | 1,037,183 | |
| Shares sold | | | 121,577 | | | | 183,198 | |
| Shares issued to shareholders in reinvestment of distributions | | | 96,453 | | | | 234,243 | |
| Shares redeemed | | | (244,679 | ) | | | (211,355 | ) |
| Net increase (decrease) in Class B shares | | | (26,649 | ) | | | 206,086 | |
| | |
| Shares outstanding at end of period | | | 1,216,620 | | | | 1,243,269 | |
The accompanying notes are an integral part of the financial statements.
| | | | | | |
| | 10 | | | | | | Deutsche DWS Variable Series II — DWS Small Mid Cap Value VIP |
Financial Highlights
| | | | | | | | | | | | | | | | | | | | |
| | | Years Ended December 31, | |
| Class A | | 2019 | | | 2018 | | | 2017 | | | 2016 | | | 2015 | |
| | | | | |
| Selected Per Share Data | | | | | | | | | | | | | | | | | | | | |
| Net asset value, beginning of period | | | $12.21 | | | | $17.88 | | | | $16.65 | | | | $15.97 | | | | $17.79 | |
| Income (loss) from investment operations: | | | | | | | | | | | | | | | | | | | | |
| | | | | |
Net investment incomea | | | .18 | | | | .10 | | | | .17 | | | | .15 | | | | .09 | |
Net realized and unrealized gain (loss) | | | 2.53 | d | | | (2.47 | ) | | | 1.55 | | | | 2.34 | | | | (.31 | ) |
Total from investment operations | | | 2.71 | | | | (2.37 | ) | | | 1.72 | | | | 2.49 | | | | (.22 | ) |
| Less distributions from: | | | | | | | | | | | | | | | | | | | | |
| | | | | |
Net investment income | | | (.10 | ) | | | (.24 | ) | | | (.12 | ) | | | (.10 | ) | | | (.05 | ) |
Net realized gains | | | (.99 | ) | | | (3.06 | ) | | | (.37 | ) | | | (1.71 | ) | | | (1.55 | ) |
Total distributions | | | (1.09 | ) | | | (3.30 | ) | | | (.49 | ) | | | (1.81 | ) | | | (1.60 | ) |
| Net asset value, end of period | | | $13.83 | | | | $12.21 | | | | $17.88 | | | | $16.65 | | | | $15.97 | |
| Total Return (%) | | | 22.76 | b,d | | | (16.01 | )b | | | 10.52 | b | | | 16.89 | b | | | (1.91 | ) |
| | | | | |
| Ratios to Average Net Assets and Supplemental Data | | | | | | | | | | | | | | | | | | | | |
| Net assets, end of period ($ millions) | | | 78 | | | | 70 | | | | 96 | | | | 153 | | | | 161 | |
| Ratio of expenses before expense reductions (%)c | | | .88 | | | | .87 | | | | .83 | | | | .83 | | | | .80 | |
| Ratio of expenses after expense reductions (%)c | | | .83 | | | | .81 | | | | .83 | | | | .82 | | | | .80 | |
| Ratio of net investment income (%) | | | 1.35 | | | | .65 | | | | .98 | | | | .99 | | | | .51 | |
| Portfolio turnover rate (%) | | | 55 | | | | 64 | | | | 35 | | | | 53 | | | | 25 | |
| a | Based on average shares outstanding during the period. |
| b | Total return would have been lower had certain expenses not been reduced. |
| c | Expense ratio does not reflect charges and fees associated with the separate account that invests in the Fund or any variable life insurance policy or variable annuity contract for which the Fund is an investment option. |
| d | Includes proceeds from a non-recurring litigation payment amounting to $0.14 per share and 1.07% of average daily net assets, for the year ended December 31, 2019. |
| | | | | | | | | | | | | | | | | | | | |
| | | Years Ended December 31, | |
| Class B | | 2019 | | | 2018 | | | 2017 | | | 2016 | | | 2015 | |
| | | | | |
| Selected Per Share Data | | | | | | | | | | | | | | | | | | | | |
| Net asset value, beginning of period | | | $12.20 | | | | $17.86 | | | | $16.63 | | | | $15.95 | | | | $17.77 | |
| Income (loss) from investment operations: | | | | | | | | | | | | | | | | | | | | |
| | | | | |
Net investment incomea | | | .13 | | | | .05 | | | | .11 | | | | .09 | | | | .02 | |
Net realized and unrealized gain (loss) | | | 2.53 | d | | | (2.48 | ) | | | 1.55 | | | | 2.34 | | | | (.29 | ) |
Total from investment operations | | | 2.66 | | | | (2.43 | ) | | | 1.66 | | | | 2.43 | | | | (.27 | ) |
| Less distributions from: | | | | | | | | | | | | | | | | | | | | |
| | | | | |
Net investment income | | | (.05 | ) | | | (.17 | ) | | | (.06 | ) | | | (.04 | ) | | | — | |
Net realized gains | | | (.99 | ) | | | (3.06 | ) | | | (.37 | ) | | | (1.71 | ) | | | (1.55 | ) |
Total distributions | | | (1.04 | ) | | | (3.23 | ) | | | (.43 | ) | | | (1.75 | ) | | | (1.55 | ) |
| Net asset value, end of period | | | $13.82 | | | | $12.20 | | | | $17.86 | | | | $16.63 | | | | $15.95 | |
| Total Return (%) | | | 22.32 | b,d | | | (16.32 | )b | | | 10.13 | b | | | 16.47 | b | | | (2.21 | ) |
| | | | | |
| Ratios to Average Net Assets and Supplemental Data | | | | | | | | | | | | | | | | | | | | |
| Net assets, end of period ($ millions) | | | 17 | | | | 15 | | | | 19 | | | | 15 | | | | 14 | |
| Ratio of expenses before expense reductions (%)c | | | 1.25 | | | | 1.24 | | | | 1.19 | | | | 1.19 | | | | 1.16 | |
| Ratio of expenses after expense reductions (%)c | | | 1.19 | | | | 1.16 | | | | 1.19 | | | | 1.18 | | | | 1.16 | |
| Ratio of net investment income (loss) (%) | | | .99 | | | | .30 | | | | .65 | | | | .57 | | | | .14 | |
| Portfolio turnover rate (%) | | | 55 | | | | 64 | | | | 35 | | | | 53 | | | | 25 | |
| a | Based on average shares outstanding during the period. |
| b | Total return would have been lower had certain expenses not been reduced. |
| c | Expense ratio does not reflect charges and fees associated with the separate account that invests in the Fund or any variable life insurance policy or variable annuity contract for which the Fund is an investment option. |
| d | Includes proceeds from a non-recurring litigation payment amounting to $0.14 per share and 1.07% of average daily net assets, for the year ended December 31, 2019. |
The accompanying notes are an integral part of the financial statements.
| | | | |
Deutsche DWS Variable Series II — DWS Small Mid Cap Value VIP | | | | | 11 |
| | |
| Notes to Financial Statements | | |
A. Organization and Significant Accounting Policies
DWS Small Mid Cap Value VIP (the “Fund”) is a diversified series of Deutsche DWS Variable Series II (the “Trust”), which is registered under the Investment Company Act of 1940, as amended (the “1940 Act”), as anopen-end management investment company organized as a Massachusetts business trust.
Multiple Classes of Shares of Beneficial Interest. The Fund offers two classes of shares (Class A shares and Class B shares). Sales of Class B shares are subject to recordkeeping fees up to 0.15% and Rule12b-1 fees under the 1940 Act equal to an annual rate of 0.25% of the average daily net assets of the Class B shares of the Fund. Class A shares are not subject to such fees.
Investment income, realized and unrealized gains and losses, and certainfund-level expenses and expense reductions, if any, are borne pro rata on the basis of relative net assets by the holders of all classes of shares except that each class bears certain expenses unique to that class (including the applicable Rule12b-1 fee and recordkeeping fees). Differences inclass-level expenses may result in payment of different per share dividends by class. All shares have equal rights with respect to voting subject toclass-specific arrangements.
The Fund’s financial statements are prepared in accordance with accounting principles generally accepted in the United States of America (“U.S. GAAP”) which require the use of management estimates. Actual results could differ from those estimates. The Fund qualifies as an investment company under Topic 946 of Accounting Standards Codification of U.S. GAAP. The policies described below are followed consistently by the Fund in the preparation of its financial statements.
Security Valuation. Investments are stated at value determined as of the close of regular trading on the New York Stock Exchange on each day the exchange is open for trading.
Various inputs are used in determining the value of the Fund’s investments. These inputs are summarized in three broad levels. Level 1 includes quoted prices in active markets for identical securities. Level 2 includes other significant observable inputs (including quoted prices for similar securities, interest rates, prepayment speeds and credit risk). Level 3 includes significant unobservable inputs (including the Fund’s own assumptions in determining the fair value of investments). The level assigned to the securities valuations may not be an indication of the risk or liquidity associated with investing in those securities.
Equity securities are valued at the most recent sale price or official closing price reported on the exchange (U.S. or foreign) orover-the-counter market on which they trade. Securities for which no sales are reported are valued at the calculated mean between the most recent bid and asked quotations on the relevant market or, if a mean cannot be determined, at the most recent bid quotation. Equity securities are generally categorized as Level 1.
Investments inopen-end investment companies are valued at their net asset value each business day and are categorized as Level 1.
Securities and other assets for which market quotations are not readily available or for which the above valuation procedures are deemed not to reflect fair value are valued in a manner that is intended to reflect their fair value as determined in accordance with procedures approved by the Board and are generally categorized as Level 3. In accordance with the Fund’s valuation procedures, factors considered in determining value may include, but are not limited to, the type of the security; the size of the holding; the initial cost of the security; the existence of any contractual restrictions on the security’s disposition; the price and extent of public trading in similar securities of the issuer or of comparable companies; quotations or evaluated prices frombroker-dealers and/or pricing services; information obtained from the issuer, analysts, and/or the appropriate stock exchange (forexchange-traded securities); an analysis of the company’s or issuer’s financial statements; an evaluation of the forces that influence the issuer and the market(s) in which the security is purchased and sold; and with respect to debt securities, the maturity, coupon, creditworthiness, currency denomination and the movement of the market in which the security is normally traded. The value determined under these procedures may differ from published values for the same securities.
Disclosure about the classification of fair value measurements is included in a table following the Fund’s Investment Portfolio.
Foreign Currency Translations. The books and records of the Fund are maintained in U.S. dollars. Investment securities and other assets and liabilities denominated in a foreign currency are translated into U.S. dollars at the prevailing exchange rates at period end. Purchases and sales of investment securities, income and expenses are translated into U.S. dollars at the prevailing exchange rates on the respective dates of the transactions.
| | | | | | |
| | 12 | | | | | | Deutsche DWS Variable Series II — DWS Small Mid Cap Value VIP |
Net realized and unrealized gains and losses on foreign currency transactions represent net gains and losses between trade and settlement dates on securities transactions, the acquisition and disposition of foreign currencies, and the difference between the amount of net investment income accrued and the U.S. dollar amount actually received. The portion of both realized and unrealized gains and losses on investments that results from fluctuations in foreign currency exchange rates is not separately disclosed but is included with net realized and unrealized gain/appreciation and loss/depreciation on investments.
Securities Lending. Brown Brothers Harriman & Co., as lending agent, lends securities of the Fund to certain financial institutions under the terms of its securities lending agreement. During the term of the loans, the Fund continues to receive interest and dividends generated by the securities and to participate in any changes in their market value. The Fund requires the borrowers of the securities to maintain collateral with the Fund consisting of either cash and/or U.S. Treasury Securities having a value at least equal to the value of the securities loaned. When the collateral falls below specified amounts, the lending agent will use its best effort to obtain additional collateral on the next business day to meet required amounts under the securities lending agreement. During the year ended December 31, 2019, the Fund invested the cash collateral into a joint trading account in DWS Government & Agency Securities Portfolio, an affiliated money market fund managed by DWS Investment Management Americas, Inc. DWS Investment Management Americas Inc. receives a management/administration fee (0.12% annualized effective rate as of December 31, 2019) on the cash collateral invested in DWS Government & Agency Securities Portfolio. The Fund receives compensation for lending its securities either in the form of fees or by earning interest on invested cash collateral net of borrower rebates and fees paid to a lending agent. Either the Fund or the borrower may terminate the loan at any time, and the borrower, after notice, is required to return borrowed securities within a standard time period There may be risks of delay and costs in recovery of securities or even loss of rights in the collateral should the borrower of the securities fail financially. If the Fund is not able to recover securities lent, the Fund may sell the collateral and purchase a replacement investment in the market, incurring the risk that the value of the replacement security is greater than the value of the collateral. The Fund is also subject to all investment risks associated with the reinvestment of any cash collateral received, including, but not limited to, interest rate, credit and liquidity risk associated with such investments.
As of December 31, 2019, the Fund had securities on loan, which were classified as common stocks in the Investment Portfolio. The value of the related collateral exceeded the value of the securities loaned at period end. As of period end, the remaining contractual maturity of the collateral agreements was overnight and continuous.
Taxes. The Fund’s policy is to comply with the requirements of the Internal Revenue Code, as amended, which are applicable to regulated investment companies and to distribute all of its taxable income to its shareholders.
The Fund has reviewed the tax positions for the open tax years as of December 31, 2019 and has determined that no provision for income tax and/or uncertain tax positions is required in the Fund’s financial statements. The Fund’s federal tax returns for the prior three fiscal years remain open subject to examination by the Internal Revenue Service.
Distribution of Income and Gains. Distributions from net investment income of the Fund, if any, are declared and distributed to shareholders annually. Net realized gains from investment transactions, in excess of available capital loss carryforwards, would be taxable to the Fund if not distributed and, therefore, will be distributed to shareholders at least annually. The Fund may also make additional distributions for tax purposes if necessary.
The timing and characterization of certain income and capital gain distributions are determined annually in accordance with federal tax regulations which may differ from accounting principles generally accepted in the United States of America. These differences primarily relate to certain securities sold at a loss. As a result, net investment income (loss) and net realized gain (loss) on investment transactions for a reporting period may differ significantly from distributions during such period. Accordingly, the Fund may periodically make reclassifications among certain of its capital accounts without impacting the net asset value of the Fund.
At December 31, 2019, the Fund’s components of distributable earnings on a tax basis were as follows:
| | | | |
| Undistributed ordinary income* | | $ | 1,257,590 | |
| Undistributed long-term capital gains | | $ | 6,075,704 | |
| Unrealized appreciation (depreciation) on investments | | $ | 9,463,122 | |
| | | | |
Deutsche DWS Variable Series II — DWS Small Mid Cap Value VIP | | | | | 13 |
At December 31, 2019, the aggregate cost of investments for federal income tax purposes was $86,724,519. The net unrealized appreciation for all investments based on tax cost was $9,463,122. This consisted of aggregate gross unrealized appreciation for all investments in which there was an excess of value over tax cost of $15,256,045 aggregate gross unrealized depreciation for all investments in which was an excess of tax cost over value of $5,792,923.
In addition, the tax character of distributions paid by the Fund is summarized as follows:
| | | | | | | | |
| | | Years Ended December 31, | |
| | | 2019 | | | 2018 | |
| Distributions from ordinary income* | | $ | 615,525 | | | $ | 1,404,457 | |
| Distributions from long-term capital gains | | $ | 6,710,838 | | | $ | 18,997,202 | |
| * | For tax purposes, short-term capital gain distributions are considered ordinary income distributions. |
Expenses. Expenses of the Trust arising in connection with a specific fund are allocated to that fund. Other Trust expenses which cannot be directly attributed to a fund are apportioned among the funds in the Trust based upon the relative net assets or other appropriate measures.
Contingencies. In the normal course of business, the Fund may enter into contracts with service providers that contain general indemnification clauses. The Fund’s maximum exposure under these arrangements is unknown, as this would involve future claims that may be made against the Fund that have not yet been made. However, based on experience, the Fund expects the risk of loss to be remote.
Real Estate Investment Trusts.The Fund at its fiscal year end recharacterizes distributions received from a Real Estate Investment Trust (“REIT”) investment based on information provided by the REIT into the following categories: ordinary income,long-term andshort-term capital gains, and return of capital. If information is not available timely from a REIT, the recharacterization will be estimated for financial reporting purposes and a recharacterization will be made to the accounting records in the following year when such information becomes available. Distributions received from REITs in excess of income are recorded as either a reduction of cost of investments or realized gains.
Other. Investment transactions are accounted for on a trade date plus one basis for daily net asset value calculations. However, for financial reporting purposes, investment transactions are reported on trade date. Interest income is recorded on the accrual basis. Dividend income is recorded on theex-dividend date net of foreign withholding taxes. Realized gains and losses from investment transactions are recorded on an identified cost basis. Proceeds from litigation payments, if any, are included in net realized gain (loss) from investments.
B. Purchases and Sales of Securities
During the year ended December 31, 2019, purchases and sales of investment transactions (excludingshort-term investments) aggregated $49,564,762 and $54,887,640, respectively.
C. Related Parties
Management Agreement. Under the Investment Management Agreement with DWS Investment Management Americas, Inc. (“DIMA” or the “Advisor”), an indirect, wholly owned subsidiary of DWS Group GmbH & Co. KGaA (“DWS Group”), the Advisor directs the investments of the Fund in accordance with its investment objectives, policies and restrictions. The Advisor determines the securities, instruments and other contracts relating to investments to be purchased, sold or entered into by the Fund.
Pursuant to the Investment Management Agreement with the Advisor, the Fund pays a monthly management fee based on the Fund’s average daily net assets, computed and accrued daily and payable monthly, at the following annual rates:
| | | | |
| First $250 million | | | .650 | % |
| Next $750 million | | | .620 | % |
| Next $1.5 billion | | | .600 | % |
| Next $2.5 billion | | | .580 | % |
| Next $2.5 billion | | | .550 | % |
| Next $2.5 billion | | | .540 | % |
| Next $2.5 billion | | | .530 | % |
| Over $12.5 billion | | | .520 | % |
| | | | | | |
| | 14 | | | | | | Deutsche DWS Variable Series II — DWS Small Mid Cap Value VIP |
Accordingly, for the year ended December 31, 2019, the fee pursuant to the Investment Management Agreement was equivalent to an annual rate (exclusive of any applicable waivers/reimbursements) of 0.65% of the Fund’s average daily net assets.
For the period from January 1, 2019 through April 30, 2019, the Advisor had contractually agreed to waive its fees and/or reimburse certain operating expenses to the extent necessary to maintain the total annual operating expenses (excluding certain expenses such as extraordinary expenses, taxes, brokerage and interest expense) of each class as follows:
| | | | |
| Class A | | | .81 | % |
| Class B | | | 1.16 | % |
For the period from May 1, 2019 through September 30, 2019, the Advisor had contractually agreed to waive all or a portion of its fees and/or reimburse certain operating expenses of the Fund to the extent necessary to maintain the total annual operating expenses (excluding certain expenses such as extraordinary expenses, taxes, brokerage and interest) of certain classes as follows:
| | | | |
| Class A | | | .85 | % |
| Class B | | | 1.21 | % |
Effective October 1, 2019 through September 30, 2020, the Advisor has contractually agreed to waive all or a portion of its fees and/or reimburse certain operating expenses of the Fund to the extent necessary to maintain the total annual operating expenses (excluding certain expenses such as extraordinary expenses, taxes, brokerage and interest) of certain classes as follows:
| | | | |
| Class A | | | .82 | % |
| Class B | | | 1.19 | % |
For the year ended December 31, 2019, fees waived and/or expenses reimbursed for each class were as follows:
| | | | |
| Class A | | $ | 37,897 | |
| Class B | | | 10,691 | |
| | | $ | 48,588 | |
Administration Fee. Pursuant to an Administrative Services Agreement, DIMA provides most administrative services to the Fund. For all services provided under the Administrative Services Agreement, the Fund pays DIMA an annual fee (“Administration Fee”) of 0.10% of the Fund’s average daily net assets, computed and accrued daily and payable monthly. For the year ended December 31, 2019, the Administration Fee was $92,087, of which $7,882 is unpaid.
Service Provider Fees. DWS Service Company (“DSC”), an affiliate of the Advisor, is the transfer agent,dividend-paying agent and shareholder service agent for the Fund. Pursuant to asub-transfer agency agreement between DSC and DST Systems, Inc. (“DST”), DSC has delegated certain transfer agent,dividend-paying agent and shareholder service agent functions to DST. DSC compensates DST out of the shareholder servicing fee it receives from the Fund. For the year ended December 31, 2019, the amounts charged to the Fund by DSC were as follows:
| | | | | | | | |
| Service to Shareholders | | Total
Aggregated | | | Unpaid at
December 31, 2019 | |
| Class A | | $ | 654 | | | $ | 108 | |
| Class B | | | 476 | | | | 83 | |
| | | $ | 1,130 | | | $ | 191 | |
Distribution Service Agreement. Under the Fund’s Class B12b-1 plan, DWS Distributors, Inc. (“DDI”) received a fee (“Distribution Service Fee”) of 0.25% of average daily net assets of Class B shares. For the year ended December 31, 2019, the Distribution Service Fee aggregated $40,665, of which $3,484 is unpaid.
Typesetting and Filing Service Fees. Under an agreement with the Fund, DIMA is compensated for providing certainpre-press and regulatory filing services to the Fund. For the year ended December 31, 2019, the amount charged to the Fund by DIMA included in the Statement of Operations under “Reports to shareholders” aggregated $9,216, of which $3,343 is unpaid.
Trustees’ Fees and Expenses. The Fund paid retainer fees to each Trustee not affiliated with the Advisor, plus specified amounts to the Board Chairperson and to each committee Chairperson.
| | | | |
Deutsche DWS Variable Series II — DWS Small Mid Cap Value VIP | | | | | 15 |
Affiliated Cash Management Vehicles. The Fund may invest uninvested cash balances in DWS Central Cash Management Government Fund and DWS ESG Liquidity Fund, affiliated money market funds which are managed by the Advisor. Each affiliated money market fund is managed in accordance withRule 2a-7 under the 1940 Act, which governs the quality, maturity, diversity and liquidity of instruments in which a money market fund may invest. DWS Central Cash Management Government Fund seeks to maintain a stable net asset value, and DWS ESG Liquidity Fund maintains a floating net asset value. The Fund indirectly bears its proportionate share of the expenses of each affiliated money market fund in which it invests. DWS Central Cash Management Government Fund does not pay the Advisor an investment management fee. To the extent that DWS ESG Liquidity Fund pays an investment management fee to the Advisor, the Advisor will waive an amount of the investment management fee payable to the Advisor by the Fund equal to the amount of the investment management fee payable on the Fund’s assets invested in DWS ESG Liquidity Fund.
D. Ownership of the Fund
At December 31, 2019, one participating insurance company was owner of record of 10% or more of the total outstanding Class A shares of the Fund, owning 69%. Three participating insurance companies were owners of record of 10% or more of the total outstanding Class B shares of the Fund, each owning 32%, 21% and 18%.
E. Line of Credit
The Fund and other affiliated funds (the “Participants”) share in a $400 million revolving credit facility provided by a syndication of banks. The Fund may borrow for temporary or emergency purposes, including the meeting of redemption requests that otherwise might require the untimely disposition of securities. The Participants are charged an annual commitment fee, which is allocated based on net assets, among each of the Participants. Interest is calculated at a rate per annum equal to the sum of the Federal Funds Rate plus 1.25 percent plus if theone-month LIBOR exceeds the Federal Funds Rate, the amount of such excess. The Fund may borrow up to a maximum of 33 percent of its net assets under the agreement. The Fund had no outstanding loans at December 31, 2019.
| | | | | | |
| | 16 | | | | | | Deutsche DWS Variable Series II — DWS Small Mid Cap Value VIP |
Report of Independent Registered Public Accounting Firm
To the Board of Trustees of Deutsche DWS Variable Series II and Shareholders of DWS Small Mid Cap Value VIP:
Opinion on the Financial Statements
We have audited the accompanying statement of assets and liabilities of DWS Small Mid Cap Value VIP (the “Fund”) (one of the funds constituting Deutsche DWS Variable Series II) (the “Trust”), including the investment portfolio, as of December 31, 2019, and the related statement of operations for the year then ended, the statements of changes in net assets for each of the two years in the period then ended, the financial highlights for each of the five years in the period then ended and the related notes (collectively referred to as the “financial statements”). In our opinion, the financial statements present fairly, in all material respects, the financial position of the Fund (one of the funds constituting Deutsche DWS Variable Series II) at December 31, 2019, the results of its operations for the year then ended, the changes in its net assets for each of the two years in the period then ended and its financial highlights for each of the five years in the period then ended, in conformity with U.S. generally accepted accounting principles.
Basis for Opinion
These financial statements are the responsibility of the Trust’s management. Our responsibility is to express an opinion on the Fund’s financial statements based on our audit. We are a public accounting firm registered with the Public Company Accounting Oversight Board (United States) (“PCAOB”) and are required to be independent with respect to the Trust in accordance with the U.S. federal securities laws and the applicable rules and regulations of the Securities and Exchange Commission and the PCAOB.
We conducted our audit in accordance with the standards of the PCAOB. Those standards require that we plan and perform the audit to obtain reasonable assurance about whether the financial statements are free of material misstatement, whether due to error or fraud. The Trust is not required to have, nor were we engaged to perform, an audit of the Trust’s internal control over financial reporting. As part of our audit, we are required to obtain an understanding of internal control over financial reporting, but not for the purpose of expressing an opinion on the effectiveness of the Trust’s internal control over financial reporting. Accordingly, we express no such opinion.
Our audit included performing procedures to assess the risks of material misstatement of the financial statements, whether due to error or fraud, and performing procedures that respond to those risks. Such procedures included examining, on a test basis, evidence regarding the amounts and disclosures in the financial statements. Our procedures included confirmation of securities owned as of December 31, 2019, by correspondence with the custodian and others. Our audit also included evaluating the accounting principles used and significant estimates made by management, as well as evaluating the overall presentation of the financial statements. We believe that our audit provides a reasonable basis for our opinion.

We have served as the auditor of one or more investment companies in the DWS family of funds since at least 1979, but we are unable to determine the specific year.
Boston, Massachusetts
February 14, 2020
| | | | |
Deutsche DWS Variable Series II — DWS Small Mid Cap Value VIP | | | | | 17 |
| | |
| Information About Your Fund’s Expenses | | (Unaudited) |
As an investor of the Fund, you incur two types of costs: ongoing expenses and transaction costs. Ongoing expenses include management fees, distribution and service(12b-1) fees and other Fund expenses. Examples of transaction costs include contract charges, which are not shown in this section. The following tables are intended to help you understand your ongoing expenses (in dollars) of investing in the Fund and to help you compare these expenses with the ongoing expenses of investing in other mutual funds. In the most recent six-month period, the Fund limited these expenses; had it not done so, expenses would have been higher. The example in the table is based on an investment of $1,000 invested at the beginning of thesix-month period and held for the entire period (July 1, 2019 to December 31, 2019).
The tables illustrate your Fund’s expenses in two ways:
| – | | Actual Fund Return. This helps you estimate the actual dollar amount of ongoing expenses (but not transaction costs) paid on a $1,000 investment in the Fund using the Fund’s actual return during the period. To estimate the expenses you paid over the period, simply divide your account value by $1,000 (for example, an $8,600 account value divided by $1,000 = 8.6), then multiply the result by the number in the “Expenses Paid per $1,000” line under the share class you hold. |
| – | | Hypothetical 5% Fund Return.This helps you to compare your Fund’s ongoing expenses (but not transaction costs) with those of other mutual funds using the Fund’s actual expense ratio and a hypothetical rate of return of 5% per year before expenses. Examples using a 5% hypothetical Fund return may be found in the shareholder reports of other mutual funds. The hypothetical account values and expenses may not be used to estimate the actual ending account balance or expenses you paid for the period. |
Please note that the expenses shown in these tables are meant to highlight your ongoing expenses only and do not reflect any transaction costs. The “Expenses Paid per $1,000” line of the tables is useful in comparing ongoing expenses only and will not help you determine the relative total expense of owning different funds. If these transaction costs had been included, your costs would have been higher.
| | | | | | | | |
| Expenses and Value of a $1,000 Investment for the six months ended December 31, 2019 | |
| | |
| Actual Fund Return | | | Class A | | | | Class B | |
| Beginning Account Value 7/1/19 | | $ | 1,000.00 | | | $ | 1,000.00 | |
| Ending Account Value 12/31/19 | | $ | 1,067.00 | | | $ | 1,064.60 | |
| Expenses Paid per $1,000* | | $ | 4.32 | | | $ | 6.24 | |
| | |
| Hypothetical 5% Fund Return | | | Class A | | | | Class B | |
| Beginning Account Value 7/1/19 | | $ | 1,000.00 | | | $ | 1,000.00 | |
| Ending Account Value 12/31/19 | | $ | 1,021.02 | | | $ | 1,019.16 | |
| Expenses Paid per $1,000* | | $ | 4.23 | | | $ | 6.11 | |
| * | Expenses are equal to the Fund’s annualized expense ratio for each share class, multiplied by the average account value over the period, multiplied by 184 (the number of days in the most recentsix-month period), then divided by 365. |
| | | | | | | | |
| Annualized Expense Ratios | | Class A | | | Class B | |
| Deutsche DWS Variable Series II — DWS Small Mid Cap Value VIP | | | .83 | % | | | 1.20 | % |
For more information, please refer to the Fund’s prospectus.
These tables do not reflect charges and fees (“contract charges”) associated with the separate account that invests in the Fund or any variable life insurance policy or variable annuity contract for which the Fund is an investment option.
For an analysis of the fees associated with an investment in the Fund or similar funds, please refer to the current and hypothetical expense calculators for Variable Insurance Products which can be found at dws.com/calculators.
| | | | | | |
| | 18 | | | | | | Deutsche DWS Variable Series II — DWS Small Mid Cap Value VIP |
| | |
| Tax Information | | (Unaudited) |
The Fund paid distributions of $0.99 per share from net long-term capital gains during its year ended December 31, 2019.
Pursuant to Section 852 of the Internal Revenue Code, the Fund designates $6,737,000 as capital gain dividends for its year ended December 31, 2019.
For corporate shareholders, 100% of the ordinary dividends (i.e., income dividends plus short-term capital gains) paid during the Fund’s fiscal year ended December 31, 2019, qualified for the dividends received deduction.
Please consult a tax advisor if you have questions about federal or state income tax laws, or on how to prepare your tax returns. If you have specific questions about your account, please contact your insurance provider.
The Trust’s policies and procedures for voting proxies for portfolio securities and information about how the Trust voted proxies related to its portfolio securities during the most recent12-month period ended June 30 are available on our Web site — dws.com/en-us/resources/proxy-voting — or on the SEC’s Web site — sec.gov. To obtain a written copy of the Trust’s policies and procedures without charge, upon request, call us toll free at (800)728-3337.
| | | | |
Deutsche DWS Variable Series II — DWS Small Mid Cap Value VIP | | | | | 19 |
Advisory Agreement Board Considerations and Fee Evaluation
The Board of Trustees (hereinafter referred to as the “Board” or “Trustees”) approved the renewal of DWS Small Mid Cap Value VIP’s (the “Fund”) investment management agreement (the “Agreement”) with DWS Investment Management Americas, Inc. (“DIMA”) in September 2019.
In terms of the process that the Board followed prior to approving the Agreement, shareholders should know that:
| – | | During the entire process, all of the Fund’s Trustees were independent of DIMA and its affiliates (the “Independent Trustees”). |
| – | | The Board met frequently during the past year to discuss fund matters and dedicated a substantial amount of time to contract review matters. Over the course of several months, the Board’s Contract Committee reviewed extensive materials received from DIMA, independent third parties and independent counsel. These materials included an analysis of the Fund’s performance, fees and expenses, and profitability from a fee consultant retained by the Fund’s Independent Trustees (the “Fee Consultant”). Based on its evaluation of the information provided, the Contract Committee presented its findings and recommendations to the Board. The Board then reviewed the Contract Committee’s findings and recommendations. |
| – | | The Board also received extensive information throughout the year regarding performance of the Fund. |
| – | | The Independent Trustees regularly met privately with counsel to discuss contract review and other matters. In addition, the Independent Trustees were advised by the Fee Consultant in the course of their review of the Fund’s contractual arrangements and considered a comprehensive report prepared by the Fee Consultant in connection with their deliberations. |
| – | | In connection with reviewing the Agreement, the Board also reviewed the terms of the Fund’s Rule12b-1 plan, distribution agreement, administrative services agreement, transfer agency agreement and other material service agreements. |
In connection with the contract review process, the Contract Committee and the Board considered the factors discussed below, among others. The Board also considered that DIMA and its predecessors have managed the Fund since its inception, and the Board believes that a long-term relationship with a capable, conscientious advisor is in the best interests of the Fund. The Board considered, generally, that shareholders chose to invest or remain invested in the Fund knowing that DIMA managed the Fund. DIMA is part of DWS Group GmbH & Co. KGaA (“DWS Group”). DWS Group is a global asset management business that offers a wide range of investing expertise and resources, including research capabilities in many countries throughout the world. In 2018, approximately 20% of DWS Group’s shares were sold in an initial public offering, with Deutsche Bank AG owning the remaining shares.
As part of the contract review process, the Board carefully considered the fees and expenses of each DWS fund overseen by the Board in light of the fund’s performance. In many cases, this led to the negotiation and implementation of expense caps. As part of these negotiations, the Board indicated that it would consider relaxing these caps in future years following sustained improvements in performance, among other considerations.
While shareholders may focus primarily on fund performance and fees, the Fund’s Board considers these and many other factors, including the quality and integrity of DIMA’s personnel and administrative support services provided by DIMA, such as back-office operations, fund valuations, and compliance policies and procedures.
Nature, Quality and Extent of Services.The Board considered the terms of the Agreement, including the scope of advisory services provided under the Agreement. The Board noted that, under the Agreement, DIMA provides portfolio management services to the Fund and that, pursuant to a separate administrative services agreement, DIMA provides administrative services to the Fund. The Board considered the experience and skills of senior management and investment personnel and the resources made available to such personnel. The Board reviewed the Fund’s performance over short-term and long-term periods and compared those returns to various agreed-upon performance measures, including market index(es) and a peer universe compiled using information supplied by Morningstar Direct (“Morningstar”), an independent fund data service. The Board also noted that it has put into place a process of identifying “Funds in Review” (e.g., funds performing poorly relative to a peer universe), and receives additional reporting from DIMA regarding such funds and, where appropriate, DIMA’s plans to address underperformance. The Board believes this process is an effective manner of identifying and addressing underperforming funds. Based on
| | | | | | |
| | 20 | | | | | | Deutsche DWS Variable Series II — DWS Small Mid Cap Value VIP |
the information provided, the Board noted that, for theone-, three- and five-year periods ended December 31, 2018, the Fund’s performance (Class A shares) was in the 4th quartile, of the applicable Morningstar universe (the 1st quartile being the best performers and the 4th quartile being the worst performers). The Board also observed that the Fund has underperformed its benchmark in theone-, three- and five-year periods ended December 31, 2018. The Board noted the disappointing investment performance of the Fund in recent periods and continued to discuss with senior management of DIMA the factors contributing to such underperformance and actions being taken to improve performance. The Board noted certain changes in the Fund’s portfolio management team that were made effective February 14, 2019. The Board recognized the efforts by DIMA in recent years to enhance its investment platform and improve long-term performance across the DWS fund complex.
Fees and Expenses. The Board considered the Fund’s investment management fee schedule, operating expenses and total expense ratios, and comparative information provided by Broadridge Financial Solutions, Inc. (“Broadridge”) and the Fee Consultant regarding investment management fee rates paid to other investment advisors by similar funds (1st quartile being the most favorable and 4th quartile being the least favorable). With respect to management fees paid to other investment advisors by similar funds, the Board noted that the contractual fee rates paid by the Fund, which include a 0.10% fee paid to DIMA under the Fund’s administrative services agreement, were lower than the median (1st quartile) of the applicable Broadridge peer group (based on Broadridge data provided as of December 31, 2018). The Board noted that the Fund’s Class A shares total (net) operating expenses were expected to be lower than the median (2nd quartile) of the applicable Broadridge expense universe (based on Broadridge data provided as of December 31, 2018, and analyzing Broadridge expense universe Class A (net) expenses less any applicable12b-1 fees) (“Broadridge Universe Expenses”). The Board also reviewed data comparing each other operational share class’s total (net) operating expenses to the applicable Broadridge Universe Expenses. The Board noted that the expense limitations agreed to by DIMA were expected to help the Fund’s total (net) operating expenses remain competitive. The Board considered the Fund’s management fee rate as compared to fees charged by DIMA to a comparable DWS U.S. registered fund (“DWS Funds”) and considered differences between the Fund and the comparable DWS Fund. The information requested by the Board as part of its review of fees and expenses also included information about institutional accounts (including anysub-advised funds and accounts) and funds offered primarily to European investors (“DWS Europe Funds”) managed by DWS Group. The Board noted that DIMA indicated that DWS Group does not manage any institutional accounts or DWS Europe Funds comparable to the Fund.
On the basis of the information provided, the Board concluded that management fees were reasonable and appropriate in light of the nature, quality and extent of services provided by DIMA.
Profitability. The Board reviewed detailed information regarding revenues received by DIMA under the Agreement. The Board considered the estimated costs to DIMA, andpre-tax profits realized by DIMA, from advising the DWS Funds, as well as estimates of thepre-tax profits attributable to managing the Fund in particular. The Board also received information regarding the estimated enterprise-wide profitability of DIMA and its affiliates with respect to all fund services in totality and by fund. The Board and the Fee Consultant reviewed DIMA’s methodology in allocating its costs to the management of the Fund. Based on the information provided, the Board concluded that thepre-tax profits realized by DIMA in connection with the management of the Fund were not unreasonable. The Board also reviewed certain publicly available information regarding the profitability of certain similar investment management firms. The Board noted that, while information regarding the profitability of such firms is limited (and in some cases is not necessarily prepared on a comparable basis), DIMA and its affiliates’ overall profitability with respect to the DWS Funds (after taking into account distribution and other services provided to the funds by DIMA and its affiliates) was lower than the overall profitability levels of most comparable firms for which such data was available.
Economies of Scale. The Board considered whether there are economies of scale with respect to the management of the Fund and whether the Fund benefits from any economies of scale. The Board noted that the Fund’s investment management fee schedule includes fee breakpoints. The Board concluded that the Fund’s fee schedule represents an appropriate sharing between the Fund and DIMA of such economies of scale as may exist in the management of the Fund at current asset levels.
Other Benefits to DIMA and Its Affiliates. The Board also considered the character and amount of other incidental or“fall-out” benefits received by DIMA and its affiliates, including any fees received by DIMA for administrative services provided to the Fund, any fees received by an affiliate of DIMA for transfer agency services provided to the Fund and any fees received by an affiliate of DIMA for distribution services. The Board also considered benefits to DIMA related to brokerage and soft-dollar allocations, including allocating
| | | | |
Deutsche DWS Variable Series II — DWS Small Mid Cap Value VIP | | | | | 21 |
brokerage to pay for research generated by parties other than the executing broker dealers, which pertain primarily to funds investing in equity securities. In addition, the Board considered the incidental public relations benefits to DIMA related to DWS Funds advertising and cross-selling opportunities among DIMA products and services. The Board considered these benefits in reaching its conclusion that the Fund’s management fees were reasonable.
Compliance. The Board considered the significant attention and resources dedicated by DIMA to its compliance processes in recent years. The Board noted in particular (i) the experience, seniority and time commitment of the individuals serving as DIMA’s and the Fund’s chief compliance officers and (ii) the substantial commitment of resources by DIMA and its affiliates to compliance matters, including the retention of compliance personnel.
Based on all of the information considered and the conclusions reached, the Board determined that the continuation of the Agreement is in the best interests of the Fund. In making this determination, the Board did not give particular weight to any single factor identified above. The Board considered these factors over the course of numerous meetings, certain of which were in executive session with only the Independent Trustees and counsel present. It is possible that individual Independent Trustees may have weighed these factors differently in reaching their individual decisions to approve the continuation of the Agreement.
| | | | | | |
| | 22 | | | | | | Deutsche DWS Variable Series II — DWS Small Mid Cap Value VIP |
Board Members and Officers
The following table presents certain information regarding the Board Members and Officers of the Trust/Corporation. Each Board Member’s year of birth is set forth in parentheses after his or her name. Unless otherwise noted, (i) each Board Member has engaged in the principal occupation(s) noted in the table for at least the most recent five years, although not necessarily in the same capacity; and (ii) the address of each Independent Board Member is Keith R. Fox, DWS Funds Board Chair, c/o Thomas R. Hiller, Ropes & Gray LLP, Prudential Tower, 800 Boylston Street, Boston, MA02199-3600. Except as otherwise noted below, the term of office for each Board Member is until the election and qualification of a successor, or until such Board Member sooner dies, resigns, is removed or as otherwise provided in the governing documents of the Trust/Corporation. Because the Fund does not hold an annual meeting of shareholders, each Board Member will hold office for an indeterminate period.
The Board Members may also serve in similar capacities with other funds in the fund complex. The number of funds in DWS fund complex shown in the table below includes all registered open- and closed-end funds (including all of their portfolios) advised by the Advisor and any registered funds that have an investment advisor that is an affiliated person of the Advisor.
| | | | | | | | |
| Independent Board Members | | | | | |
Name, Year of Birth,
Position with the Trust/
Corporation and
Length of Time Served1 | | Business Experience and Directorships During the Past Five Years | | Number of
Funds in
DWS Fund
Complex
Overseen | | | Other
Directorships
Held by Board
Member
|
Keith R. Fox, CFA (1954) Chairperson since 2017, and Board Member since 1996 | | Managing General Partner, Exeter Capital Partners (a series of private investment funds) (since 1986). Directorships: ICI Mutual Insurance Company; Progressive International Corporation (kitchen goods importer and distributor); former Chairman, National Association of Small Business Investment Companies; former Directorships: The Kennel Shop (retailer); BoxTop Media Inc. (advertising); Sun Capital Advisers Trust (mutual funds) (2011–2012) | | | 77 | | | — |
John W. Ballantine (1946) Board Member since 1999 | | Retired; formerly, Executive Vice President and Chief Risk Management Officer, First Chicago NBD Corporation/The First National Bank of Chicago (1996–1998); Executive Vice President and Head of International Banking (1995–1996); former Directorships: Director and Chairman of the Board, Healthways, Inc.2 (population well-being and wellness services) (2003–2014); Stockwell Capital Investments PLC (private equity); Enron Corporation; FNB Corporation; Tokheim Corporation; First Oak Brook Bancshares, Inc.; Oak Brook Bank; and Prisma Energy International. Not-for-Profit Director/Trustee: Palm Beach Civic Association; Window to the World Communications (public media); Life Director of Harris Theater for Music and Dance (Chicago); Life Director of Hubbard Street Dance Chicago; former Not-for-Profit Directorships: Public Radio International | | | 77 | | | Portland
General
Electric2
(utility
company)
(2003–
present) |
Dawn-Marie Driscoll (1946) Board Member since 1987 | | Emeritus Executive Fellow, Center for Business Ethics, Bentley University; formerly: Partner, Palmer & Dodge (law firm) (1988–1990); Vice President of Corporate Affairs and General Counsel, Filene’s (retail) (1978–1988). Directorships: Advisory Board, Center for Business Ethics, Bentley University; Trustee and former Chairman of the Board, Southwest Florida Community Foundation (charitable organization); former Directorships: ICI Mutual Insurance Company (2007–2015); Sun Capital Advisers Trust (mutual funds) (2007–2012), Investment Company Institute (audit, executive, nominating committees) and Independent Directors Council (governance, executive committees) | | | 77 | | | — |
Richard J. Herring (1946) Board Member since 1990 | | Jacob Safra Professor of International Banking and Professor of Finance, The Wharton School, University of Pennsylvania (since July 1972); Director, The Wharton Financial Institutions Center (since 1994); formerly: Vice Dean and Director, Wharton Undergraduate Division (1995–2000) and Director, The Lauder Institute of International Management Studies (2000–2006); Member FDIC Systemic Risk Advisory Committee since 2011, member Systemic Risk Council since 2012 and member of the Advisory Board at the Yale Program on Financial Stability since 2013; Formerly Co-Chair of the Shadow Financial Regulatory Committee (2003–2015), Executive Director of The Financial Economists Roundtable (2008–2015), Director of The Thai Capital Fund (2007–2013), Director of The Aberdeen Singapore Fund (2007–2018), and Nonexecutive Director of Barclays Bank DE (2010–2018) | | | 77 | | | Director,
Aberdeen
Japan Fund
(since 2007) |
| | | | |
Deutsche DWS Variable Series II — DWS Small Mid Cap Value VIP | | | | | 23 |
| | | | | | | | |
Name, Year of Birth,
Position with the Trust/
Corporation and
Length of Time Served1 | | Business Experience and Directorships During the Past Five Years | | Number of
Funds in
DWS Fund
Complex
Overseen | | | Other
Directorships
Held by Board
Member
|
William McClayton (1944) Board Member since 2004 | | Private equity investor (since October 2009); previously, Managing Director, Diamond Management & Technology Consultants, Inc. (global consulting firm) (2001–2009); Directorship: Board of Managers, YMCA of Metropolitan Chicago; formerly: Senior Partner, Arthur Andersen LLP (accounting) (1966–2001); Trustee, Ravinia Festival | | | 77 | | | — |
Rebecca W. Rimel (1951) Board Member since 1995 | | President, Chief Executive Officer and Director, The Pew Charitable Trusts (charitable organization) (1994–present); formerly: Executive Vice President, The Glenmede Trust Company (investment trust and wealth management) (1983–2004); Board Member, Investor Education (charitable organization) (2004–2005); Trustee, Executive Committee, Philadelphia Chamber of Commerce (2001–2007); Director, Viasys Health Care2 (January 2007–June 2007); Trustee, Thomas Jefferson Foundation (charitable organization) (1994–2012) | | | 77 | | | Director,
Becton
Dickinson
and
Company2
(medical
technology
company)
(2012–
present);
Director,
BioTelemetry
Inc.2(health
care) (2009–
present) |
William N. Searcy, Jr. (1946) Board Member since 1993 | | Private investor since October 2003; formerly: Pension & Savings Trust Officer, Sprint Corporation2(telecommunications) (November 1989–September 2003); Trustee, Sun Capital Advisers Trust (mutual funds) (1998–2012) | | | 77 | | | — |
| | |
| Officers4 | | |
Name, Year of Birth,
Position with the Trust/
Corporation and
Length of Time Served5 | | Business Experience and Directorships During the Past Five Years |
Hepsen Uzcan6(1974) President and Chief Executive Officer, 2017–present | | Managing Director,3 DWS; Secretary, DWS USA Corporation (2018–present); Assistant Secretary, DWS Distributors, Inc. (2018–present); Director and Vice President, DWS Service Company (2018–present); Assistant Secretary, DWS Investment Management Americas, Inc. (2018–present); and Director and President, DB Investment Managers, Inc. (2018–present); formerly: Vice President for the Deutsche funds (2016–2017); Assistant Secretary for the DWS funds (2013–2019) |
John Millette7(1962) Vice President and Secretary, 1999–present | | Director,3DWS; Chief Legal Officer, DWS Investment Management Americas, Inc. (2015–present); Director and Vice President, DWS Trust Company (2016–present); and Assistant Secretary, DBX ETF Trust (2019–present); formerly: Secretary, Deutsche Investment Management Americas Inc. (2015–2017) |
Diane Kenneally7(1966) Chief Financial Officer and Treasurer, 2018–present | | Director,3 DWS; and Treasurer, Chief Financial Officer and Controller, DBX ETF Trust (2019–present); formerly: Assistant Treasurer for the DWS funds (2007–2018) |
Paul Antosca7(1957) Assistant Treasurer, 2007–present | | Director,3DWS; and Assistant Treasurer, DBX ETF Trust (2019–present) |
Sheila Cadogan7(1966) Assistant Treasurer, 2017–present | | Director,3DWS; Director and Vice President, DWS Trust Company (2018–present); and Assistant Treasurer, DBX ETF Trust (2019–present) |
Scott D. Hogan7(1970) Chief Compliance Officer, 2016–present | | Director,3DWS |
Caroline Pearson7(1962) Chief Legal Officer, 2010–present | | Managing Director,3DWS; formerly: Secretary, Deutsche AM Distributors, Inc. (2002–2017); and Secretary, Deutsche AM Service Company (2010–2017) |
Wayne Salit6(1967) Anti-Money Laundering Compliance Officer, 2014–present | | Director,3 Deutsche Bank; and AML Officer, DWS Trust Company; formerly: Managing Director, AML Compliance Officer at BNY Mellon (2011–2014); and Director, AML Compliance Officer at Deutsche Bank (2004–2011) |
Ciara Crawford8 (1984) Assistant Secretary, (2019–present) | | Associate, DWS (since 2015); previously, Legal Assistant at Accelerated Tax Solutions. |
| | | | | | |
| | 24 | | | | | | Deutsche DWS Variable Series II — DWS Small Mid Cap Value VIP |
| 1 | The length of time served represents the year in which the Board Member joined the board of one or more DWS funds currently overseen by the Board. |
| 2 | A publicly held company with securities registered pursuant to Section 12 of the Securities Exchange Act of 1934. |
| 3 | Executive title, not a board directorship. |
| 4 | As a result of their respective positions held with the Advisor or its affiliates, these individuals are considered “interested persons” of the Advisor within the meaning of the 1940 Act. Interested persons receive no compensation from the Fund. |
| 5 | The length of time served represents the year in which the officer was first elected in such capacity for one or more DWS funds. |
| 6 | Address: 875 Third Avenue, New York, NY 10022. |
| 7 | Address: One International Place, Boston, MA 02110. |
| 8 | Address: 5022 Gate Parkway, Suite 400, Jacksonville, FL 32256. |
The Fund’s Statement of Additional Information (“SAI”) includes additional information about the Board Members. The SAI is available, without charge, upon request. If you would like to request a copy of the SAI, you may do so by calling the followingtoll-free number:(800) 728-3337.
| | | | |
Deutsche DWS Variable Series II — DWS Small Mid Cap Value VIP | | | | | 25 |
Notes
Notes
| | |
| | |
VS2SMCV-2 (R-025829-9 2/20) | | |
| | |
| ITEM 2. | CODE OF ETHICS |
| | |
| | As of the end of the period covered by this report, the registrant has adopted a code of ethics, as defined in Item 2 of Form N-CSR that applies to its Principal Executive Officer and Principal Financial Officer. There have been no amendments to, or waivers from, a provision of the code of ethics during the period covered by this report that would require disclosure under Item 2. A copy of the code of ethics is filed as an exhibit to this Form N-CSR. |
| | |
| ITEM 3. | AUDIT COMMITTEE FINANCIAL EXPERT |
| | |
| | The fund’s audit committee is comprised solely of trustees who are "independent" (as such term has been defined by the Securities and Exchange Commission ("SEC") in regulations implementing Section 407 of the Sarbanes-Oxley Act (the "Regulations")). The fund’s Board of Trustees has determined that there are several "audit committee financial experts" (as such term has been defined by the Regulations) serving on the fund’s audit committee including Mr. William McClayton, the chair of the fund’s audit committee. An “audit committee financial expert” is not an “expert” for any purpose, including for purposes of Section 11 of the Securities Act of 1933 and the designation or identification of a person as an “audit committee financial expert” does not impose on such person any duties, obligations or liability that are greater than the duties, obligations and liability imposed on such person as a member of the audit committee and board of directors in the absence of such designation or identification. |
| | |
| ITEM 4. | PRINCIPAL ACCOUNTANT FEES AND SERVICES |
| | |
Deutsche DWS variable series II
form n-csr disclosure re: AUDIT FEES
The following table shows the amount of fees that Ernst & Young LLP (“EY”), the Fund’s Independent Registered Public Accounting Firm, billed to the Fund during the Fund’s last two fiscal years. The Audit Committee approved in advance all audit services and non-audit services that EY provided to the Fund.
Services that the Fund’s Independent Registered Public Accounting Firm Billed to the Fund
Fiscal Year
Ended
December 31, | Audit Fees Billed to Fund | Audit-Related
Fees Billed to Fund | Tax Fees Billed to Fund | All
Other Fees Billed to Fund |
| 2019 | $554,948 | $0 | $92,483 | $0 |
| 2018 | $631,694 | $0 | $71,823 | $1,639 |
The above “Tax Fees” were billed for professional services rendered for tax return preparation. “All Other Fees Billed to the Fund” were billed for services associated with foreign tax filings.
Services that the Fund’s Independent Registered Public Accounting Firm Billed to the Adviser and Affiliated Fund Service Providers
The following table shows the amount of fees billed by EY to DWS Investment Management Americas, Inc. (“DIMA” or the “Adviser”), and any entity controlling, controlled by or under common control with DIMA (“Control Affiliate”) that provides ongoing services to the Fund (“Affiliated Fund Service Provider”), for engagements directly related to the Fund’s operations and financial reporting, during the Fund’s last two fiscal years.
Fiscal Year
Ended
December 31, | Audit-Related
Fees Billed to Adviser and Affiliated Fund Service Providers | Tax Fees Billed to Adviser and Affiliated Fund Service Providers | All
Other Fees Billed to Adviser and Affiliated Fund Service Providers |
| 2019 | $0 | $740,482 | $0 |
| 2018 | $0 | $470,936 | $0 |
The above “Tax Fees” were billed in connection with tax compliance services and agreed upon procedures.
Non-Audit Services
The following table shows the amount of fees that EY billed during the Fund’s last two fiscal years for non-audit services. The Audit Committee pre-approved all non-audit services that EY provided to the Adviser and any Affiliated Fund Service Provider that related directly to the Fund’s operations and financial reporting. The Audit Committee requested and received information from EY about any non-audit services that EY rendered during the Fund’s last fiscal year to the Adviser and any Affiliated Fund Service Provider. The Committee considered this information in evaluating EY’s independence.
Fiscal Year
Ended
December 31, | Total
Non-Audit Fees Billed to Fund (A) | Total Non-Audit Fees billed to Adviser and Affiliated Fund Service Providers (engagements related directly to the operations and financial reporting of the Fund) (B) | Total Non-Audit Fees billed to Adviser and Affiliated Fund Service Providers (all other engagements) (C) | Total of (A), (B)
and (C) |
| 2019 | $92,483 | $740,482 | $0 | $832,965 |
| 2018 | $73,462 | $470,936 | $513,130 | $1,057,528 |
All other engagement fees were billed for services in connection with agreed upon procedures and tax compliance for DIMA and other related entities.
Audit Committee Pre-Approval Policies and Procedures. Generally, each Fund’s Audit Committee must pre approve (i) all services to be performed for a Fund by a Fund’s Independent Registered Public Accounting Firm and (ii) all non-audit services to be performed by a Fund’s Independent Registered Public Accounting Firm for the DIMA Entities with respect to operations and financial reporting of the Fund, except that the Chairperson or Vice Chairperson of each Fund’s Audit Committee may grant the pre-approval for non-audit services described in items (i) and (ii) above for non-prohibited services for engagements of less than $100,000. All such delegated pre approvals shall be presented to each Fund’s Audit Committee no later than the next Audit Committee meeting.
There were no amounts that were approved by the Audit Committee pursuant to the de minimis exception under Rule 2-01 of Regulation S-X.
According to the registrant’s principal Independent Registered Public Accounting Firm, substantially all of the principal Independent Registered Public Accounting Firm's hours spent on auditing the registrant's financial statements were attributed to work performed by full-time permanent employees of the principal Independent Registered Public Accounting Firm.
***
In connection with the audit of the 2018 and 2019 financial statements, the Fund entered into an engagement letter with EY. The terms of the engagement letter required by EY, and agreed to by the Audit Committee, include a provision mandating the use of mediation and arbitration to resolve any controversy or claim between the parties arising out of or relating to the engagement letter or services provided thereunder.
***
Pursuant to PCAOB Rule 3526, EY is required to describe in writing to the Fund’s Audit Committee, on at least an annual basis, all relationships between EY, or any of its affiliates, and the DWS Funds, including the Fund, or persons in financial reporting oversight roles at the DWS Funds that, as of the date of the communication, may reasonably be thought to bear on EY’s independence. Pursuant to PCAOB Rule 3526, EY has reported the matters set forth below that may reasonably be thought to bear on EY’s independence. With respect to each reported matter, individually and in the aggregate, EY advised the Audit Committee that, after careful consideration of the facts and circumstances and the applicable independence rules, it concluded that the matters do not and will not impair EY’s ability to exercise objective and impartial judgement in connection with the audits of the financial statements for the Fund and a reasonable investor with knowledge of all relevant facts and circumstances would conclude that EY has been and is capable of exercising objective and impartial judgment on all issues encompassed within EY’s audit engagements. EY also confirmed to the Audit Committee that it can continue act as the Independent Registered Public Accounting Firm for the Fund.
| · | EY advised the Fund’s Audit Committee that various covered persons within EY’s affiliates held investments in, or had other financial relationships with, entities within the DWS Funds “investment company complex” (as defined in Regulation S-X) (the “DWS Funds Complex”). EY informed the Audit Committee that these investments and financial relationships were inconsistent with Rule 2-01(c)(1) of Regulation S-X. EY reported that all breaches have been resolved and that none of the breaches involved any investments in the Fund or any professionals who were part of the audit engagement team for the Fund or in a position to influence the audit engagement team. In addition, EY noted that the independence breaches did not (i) create a mutual or conflicting interest with the Fund, (ii) place EY in the position of auditing its own work, (iii) result in EY acting as management or an employee of the Fund, or (iv) place EY in a position of being an advocate of the Fund. |
EY stated its belief that, in each lending relationship, the lender is or was not able to impact the impartiality of EY or assert any influence over the investment companies in the DWS Funds Complex whose shares the lender owns or owned, or the applicable investment company’s investment adviser. In addition, on June 20, 2016, the SEC Staff issued a “no-action” letter to another mutual fund complex, Fidelity Management & Research Company et al., SEC Staff No-Action Letter (June 20, 2016) (the “Fidelity Letter”), related to similar Loan Rule issues as those described above. In the Fidelity Letter, the SEC Staff confirmed that it would not recommend enforcement action against an investment company that relied on the audit services performed by an audit firm that was not in compliance with the Loan Rule in certain specified circumstances. With respect to each lending relationship identified by EY, the circumstances described in the Fidelity Letter appear to be substantially similar to the circumstances that affected EY’s independence under the Loan Rule with respect to the Fund, and, in each case, EY confirmed to the Audit Committee that it meets the conditions of the Fidelity Letter.
| | |
| ITEM 5. | AUDIT COMMITTEE OF LISTED REGISTRANTS |
| | |
| | Not applicable |
| | |
| ITEM 6. | SCHEDULE OF INVESTMENTS |
| | |
| | Not applicable |
| | |
| ITEM 7. | DISCLOSURE OF PROXY VOTING POLICIES AND PROCEDURES FOR CLOSED-END MANAGEMENT INVESTMENT COMPANIES |
| | |
| | Not applicable |
| | |
| ITEM 8. | PORTFOLIO MANAGERS OF CLOSED-END MANAGEMENT INVESTMENT COMPANIES |
| | |
| | Not applicable |
| | |
| ITEM 9. | PURCHASES OF EQUITY SECURITIES BY CLOSED-END MANAGEMENT INVESTMENT COMPANY AND AFFILIATED PURCHASERS |
| | |
| | Not applicable |
| | |
| ITEM 10. | SUBMISSION OF MATTERS TO A VOTE OF SECURITY HOLDERS |
| | |
| | There were no material changes to the procedures by which shareholders may recommend nominees to the Fund’s Board. The primary function of the Nominating and Governance Committee is to identify and recommend individuals for membership on the Board and oversee the administration of the Board Governance Guidelines. Shareholders may recommend candidates for Board positions by forwarding their correspondence by U.S. mail or courier service to Keith R. Fox, DWS Funds Board Chair, c/o Thomas R. Hiller, Ropes & Gray LLP, Prudential Tower, 800 Boylston Street, Boston, MA 02199-3600. |
| | |
| ITEM 11. | CONTROLS AND PROCEDURES |
| | |
| | (a) | The Chief Executive and Financial Officers concluded that the Registrant’s Disclosure Controls and Procedures are effective based on the evaluation of the Disclosure Controls and Procedures as of a date within 90 days of the filing date of this report. |
| | |
| | (b) | There have been no changes in the registrant’s internal control over financial reporting that occurred during the period covered by this report that has materially affected, or is reasonably likely to materially affect, the registrant’s internal controls over financial reporting. |
| | |
| ITEM 12. | Disclosure of Securities Lending Activities for Closed-End Management Investment Companies |
| | |
| | Not applicable |
| | |
| ITEM 13. | EXHIBITS |
| | |
| | (a)(1) | Code of Ethics pursuant to Item 2 of Form N-CSR is filed and attached hereto as EX-99.CODE ETH. |
| | |
| | (a)(2) | Certification pursuant to Rule 30a-2(a) under the Investment Company Act of 1940 (17 CFR 270.30a-2(a)) is filed and attached hereto as Exhibit 99.CERT. |
| | |
| | (b) | Certification pursuant to Rule 30a-2(b) under the Investment Company Act of 1940 (17 CFR 270.30a-2(b)) is furnished and attached hereto as Exhibit 99.906CERT. |
SIGNATURES
Pursuant to the requirements of the Securities Exchange Act of 1934 and the Investment Company Act of 1940, the registrant has duly caused this report to be signed on its behalf by the undersigned, thereunto duly authorized.
| Registrant: | Deutsche DWS Variable Series II |
| | |
| | |
| By: | /s/Hepsen Uzcan Hepsen Uzcan President |
| | |
| Date: | 2/14/2020 |
Pursuant to the requirements of the Securities Exchange Act of 1934 and the Investment Company Act of 1940, this report has been signed below by the following persons on behalf of the registrant and in the capacities and on the dates indicated.
| By: | /s/Hepsen Uzcan Hepsen Uzcan President |
| | |
| Date: | 2/14/2020 |
| | |
| | |
| | |
| By: | /s/Diane Kenneally Diane Kenneally Chief Financial Officer and Treasurer |
| | |
| Date: | 2/14/2020 |
| | |