UNITED STATES
SECURITIES AND EXCHANGE COMMISSION
WASHINGTON, D. C. 20549
FORM N-CSR
Investment Company Act file number: 811-05002
DWS Variable Series II
(Exact Name of Registrant as Specified in Charter)
345 Park Avenue
New York, NY 10154-0004
(Address of Principal Executive Offices) (Zip Code)
Registrant’s Telephone Number, including Area Code: (212) 250-3220
Paul Schubert
60 Wall Street
New York, NY 10005
(Name and Address of Agent for Service)
| Date of fiscal year end: | 12/31 |
| Date of reporting period: | 12/31/2013 |
| ITEM 1. | REPORT TO STOCKHOLDERS |

December 31, 2013
Annual Report
DWS Variable Series II
DWS Alternative Asset Allocation VIP
Contents
3 Performance Summary 4 Management Summary 5 Portfolio Summary 6 Investment Portfolio 7 Statement of Assets and Liabilities 8 Statement of Operations 8 Statement of Changes in Net Assets 10 Financial Highlights 11 Notes to Financial Statements 15 Report of Independent Registered Public Accounting Firm 16 Information About Your Fund's Expenses 17 Tax Information 17 Proxy Voting 18 Advisory Agreement Board Considerations and Fee Evaluation 21 Board Members and Officers |
This report must be preceded or accompanied by a prospectus. To obtain an additional prospectus or summary prospectus, if available, call (800) 728-3337 or your financial representative. We advise you to consider the Fund's objectives, risks, charges and expenses carefully before investing. The summary prospectus and prospectus contain this and other important information about the Fund. Please read the prospectus carefully before you invest.
Although allocation among different asset categories generally limits risk, Fund management may favor an asset category that underperforms other assets or markets as a whole. The Fund expects to invest in underlying funds that emphasize alternatives or non-traditional asset categories or investment strategies, and as a result, it is subject to the risk factors of those underlying funds. Some of those risks include stock market risk, credit and interest rate risk, volatility in commodity prices and high-yield debt securities, short sales risk and the political, general economic, liquidity and currency risks of foreign investments, which may be particularly significant for emerging markets. Because Exchange Traded Funds (ETFs) trade on a securities exchange, their shares may trade at a premium or discount to their net asset value. ETFs also incur fees and expenses so they may not fully match the performance of the indexes they are designed to track. Short sales — which involve selling borrowed securities in anticipation of a price decline, then returning an equal number of the securities at some point in the future — could magnify losses and increase volatility. The Fund may use derivatives, including as part of its currency and interest-rate strategies. Investing in derivatives entails special risks relating to liquidity, leverage and credit that may reduce returns and/or increase volatility. The success of the Fund's currency and interest-rate strategies are dependent, in part, on the effectiveness and implementation of portfolio management's proprietary models. As part of these strategies, the Fund's exposure to foreign currencies could cause lower returns or even losses because foreign currency rates may fluctuate significantly over short periods of time for a number of reasons. The risk of loss is heightened during periods of rapid rises in interest rates. In addition, the notional amount of the Fund's aggregate currency and interest-rate exposure resulting from these strategies may significantly exceed the net assets of the Fund. See the prospectus for additional risks and specific details regarding the Fund's risk profile.
Deutsche Asset & Wealth Management represents the asset management and wealth management activities conducted by Deutsche Bank AG or any of its subsidiaries, including the Advisor and DWS Investments Distributors, Inc.
NOT FDIC/NCUA INSURED NO BANK GUARANTEE MAY LOSE VALUE NOT A DEPOSIT
NOT INSURED BY ANY FEDERAL GOVERNMENT AGENCY
Fund performance shown is historical, assumes reinvestment of all dividend and capital gain distributions and does not guarantee future results. Investment return and principal value fluctuate with changing market conditions so that, when redeemed, shares may be worth more or less than their original cost. Current performance may be lower or higher than the performance data quoted. Please contact your participating insurance company for the Fund's most recent month-end performance. Performance doesn't reflect charges and fees ("contract charges") associated with the separate account that invests in the Fund or any variable life insurance policy or variable annuity contract for which the Fund is an investment option. These charges and fees will reduce returns. While all share classes have the same underlying portfolio, their performance will differ.
The gross expense ratios of the Fund, as stated in the fee table of the prospectus dated July 12, 2013 are 1.91% and 2.16% for Class A and Class B shares, respectively, and may differ from the expense ratios disclosed in the Financial Highlights tables in this report. These expense ratios include net expenses of the underlying funds in which the Fund invests.
| Growth of an Assumed $10,000 Investment in DWS Alternative Asset Allocation VIP from 2/2/09 to 12/31/13 | |
 | The Morgan Stanley Capital International (MSCI) World Index is a free float-adjusted market capitalization weighted index that is designed to measure the equity market performance of developed markets. The index consists of 24 developed market country indices. The index is calculated using closing local market prices and translates into U.S. dollars using the London close foreign exchange rates. The Barclays U.S. Aggregate Bond Index is an unmanaged index representing domestic taxable investment-grade bonds, with index components for government and corporate securities, mortgage pass-through securities, and asset-backed securities with an average maturity of one year or more. The Blended Index is calculated using the performance of two unmanaged indices, representative of stocks (the MSCI World Index (70%)) and bonds (the Barclays U.S. Aggregate Bond Index (30%)). These results are summed to produce the aggregate benchmark. Index returns do not reflect any fees or expenses and it is not possible to invest directly into an index. |
 | |
| Comparative Results | |||||||||||||
| DWS Alternative Asset Allocation VIP | 1-Year | 3-Year | Life of Fund* | ||||||||||
| Class A | Growth of $10,000 | $ | 10,093 | $ | 10,757 | $ | 15,280 | ||||||
| Average annual total return | 0.93 | % | 2.46 | % | 9.00 | % | |||||||
| MSCI World Index | Growth of $10,000 | $ | 12,668 | $ | 13,860 | $ | 22,068 | ||||||
| Average annual total return | 26.68 | % | 11.48 | % | 17.46 | % | |||||||
| Barclays U.S. Aggregate Bond Index | Growth of $10,000 | $ | 9,798 | $ | 11,011 | $ | 12,538 | ||||||
| Average annual total return | –2.02 | % | 3.26 | % | 4.71 | % | |||||||
| Blended Index | Growth of $10,000 | $ | 11,742 | $ | 13,055 | $ | 18,914 | ||||||
| Average annual total return | 17.42 | % | 9.29 | % | 13.84 | % | |||||||
The growth of $10,000 is cumulative.
* The Fund commenced offering Class A shares on February 2, 2009. The performance shown for each index is for the time period of January 31, 2009 through December 31, 2013, which is based on the performance period of the life of the Fund.
| Comparative Results | |||||||||||||
| DWS Alternative Asset Allocation VIP | 1-Year | 3-Year | Life of Class** | ||||||||||
| Class B | Growth of $10,000 | $ | 10,075 | $ | 10,675 | $ | 13,888 | ||||||
| Average annual total return | 0.75 | % | 2.20 | % | 7.37 | % | |||||||
| MSCI World Index | Growth of $10,000 | $ | 12,668 | $ | 13,860 | $ | 18,847 | ||||||
| Average annual total return | 26.68 | % | 11.48 | % | 14.81 | % | |||||||
| Barclays U.S. Aggregate Bond Index | Growth of $10,000 | $ | 9,798 | $ | 11,011 | $ | 12,265 | ||||||
| Average annual total return | –2.02 | % | 3.26 | % | 4.55 | % | |||||||
| Blended Index | Growth of $10,000 | $ | 11,742 | $ | 13,055 | $ | 16,770 | ||||||
| Average annual total return | 17.42 | % | 9.29 | % | 11.94 | % | |||||||
The growth of $10,000 is cumulative.
** The Fund commenced offering Class B shares on May 18, 2009. The performance shown for each index is for the time period of May 31, 2009 through December 31, 2013, which is based on the performance period of the life of Class B.
DWS Alternative Asset Allocation VIP invests in a broadly diversified portfolio of mutual funds and exchange- traded funds (ETFs) that together provide diversified exposure to alternative asset classes.1 The Fund seeks to be a complement to traditional equity and fixed-income portfolios by investing in asset classes that tend to have a low correlation to the broader global equity markets over the long term.2
The Fund returned 0.93% (Class A shares, unadjusted for contract charges) during 2013, while its blended benchmark returned 17.42%.3 The largest contributors to the Fund's 2013 performance were its positions in DWS RREEF Global Infrastructure Fund and SPDR Barclays Capital Convertible Securities ETF, while the largest detractors were its allocations to DWS Global Inflation Fund and DWS Enhanced Commodity Strategy Fund.
Our team took over the Fund's management duties in July 2013. During the third quarter of 2013, we started to shift the portfolio from its previous positioning to reflect our views on the broader economy and markets. Based on our belief that an increasingly positive macroeconomic backdrop would continue to drive equity markets higher, we tactically increased the Fund's weighting to equity-like asset classes such as global infrastructure and convertible bonds.
At the same time, our expectation for gradually rising long-term bond yields led us to reduce the Fund's duration exposure (or interest-rate sensitivity). We decided to lighten the Fund's allocation to emerging-markets bonds — a longer-duration asset class that proved extremely sensitive to rising U.S. bond yields during the May to June 2013 sell-off — by selling the Fund's position in the WisdomTree Emerging Markets Local Debt ETF and reducing our allocation to DWS Enhanced Emerging Markets Fixed Income Fund. We replaced these positions by increasing our allocation to DWS Floating Rate Fund and initiating a new position in the SPDR Barclays Short Term High Yield Bond ETF. Both offer the favorable combination of below-average interest-rate risk and above-average yields.
We also moved to an underweight position in commodities.4 While commodities have a relatively large strategic weighting in the Fund due to their low long-term correlation to equities, we believe the supply for many commodities has finally caught up with demand.
We believe that a gradual "return to normalcy" — in contrast to an environment in which the U.S. Federal Reserve Board's (the Fed's) policy is the primary driver of asset-class performance — will increase the importance of selectivity and active management in the years ahead. We believe diversifying across the various alternative asset classes should help mitigate the heightened volatility that may be experienced by portfolios invested entirely in stocks and bonds.
Diversification neither assures a profit nor guarantees against loss.
Pankaj Bhatnagar, PhD
Benjamin Pace
Darwei Kung
Portfolio Managers
The views expressed reflect those of the portfolio management team only through the end of the period of the report as stated on the cover. The management team's views are subject to change at any time based on market and other conditions and should not be construed as a recommendation. Past performance is no guarantee of future results. Current and future portfolio holdings are subject to risk.
1 An exchange-traded fund (ETF) is a security that tracks an index or asset like an index fund, but trades like a stock on an exchange.
2 Correlation is a measure of the way securities or asset classes perform in relation to each other and/or the market. Lowly correlated asset classes move in opposite directions to each other. Highly correlated asset classes move in the same direction.
3 The Blended Index is calculated using the performance of two unmanaged indices, representative of stocks (the Morgan Stanley Capital International (MSCI) World Index (70%) and bonds (the Barclays U.S. Aggregate Bond Index (30%). These results are summed to produce the aggregate benchmark. Index returns do not reflect fees or expenses and it is not possible to invest directly into an index.
4 "Underweight" means the Fund holds a lower weighting in a given sector or security than the benchmark. "Overweight" means it holds a higher weighting.
Asset Allocation* (As a % of Investment Portfolio excluding Cash Equivalents) | 12/31/13 | 12/31/12 |
| Commodities | 13% | 19% |
| DWS Enhanced Commodity Strategy Fund | 13% | 13% |
| DWS Gold & Precious Metals Fund | — | 1% |
| Market Vectors Agribusiness Fund | — | 4% |
| iShares S&P Global Timber & Forestry Index Fund | — | 1% |
| Real Return | 29% | 32% |
| DWS RREEF Global Infrastructure Fund | 16% | 11% |
| DWS Global Inflation Fund | 6% | 12% |
| DWS RREEF Global Real Estate Securities Fund | 3% | 9% |
| SPDR Barclays Short Term High Yield Bond ETF | 4% | — |
| Hedge Strategy | 16% | 15% |
| DWS Diversified Market Neutral Fund | 16% | 15% |
| Currency | 13% | 14% |
| DWS Enhanced Emerging Markets Fixed Income Fund | 11% | 8% |
| PowerShares DB U.S. Dollar Index Bullish ETF | 2% | — |
| WisdomTree Emerging Markets Local Debt Fund | — | 4% |
| SPDR Barclays International Treasury Bond ETF | — | 2% |
| Opportunistic | 29% | 20% |
| DWS Floating Rate Fund | 16% | 13% |
| SPDR Barclays Convertible Securities ETF | 13% | 3% |
| iShares S&P U.S. Preferred Stock Index Fund | — | 4% |
| iShares S&P International Preferred Stock Index Fund | — | — |
| 100% | 100% | |
* Investment strategies will fall into the following categories: Commodities, Real-Return, Hedge Strategy, Currency and Opportunistic. Commodities investments seek to provide exposure to hard assets. Real-Return investments seek to provide a measure of inflation protection. Hedge Strategy investments seek to generate returns independent of the broader markets. Currency investments seek to offer exposure to foreign investments, many of which are not denominated in U.S. dollars. Opportunistic investments seek to offer exposure to categories generally not included in investors' allocations.
Portfolio holdings and characteristics are subject to change.
For more complete details about the Fund's investment portfolio, see page 6.
Following the Fund's fiscal first and third quarter-end, a complete portfolio holdings listing is filed with the SEC on Form N-Q. The form will be available on the SEC's Web site at sec.gov, and it also may be reviewed and copied at the SEC's Public Reference Room in Washington, D.C. Information on the operation of the SEC's Public Reference Room may be obtained by calling (800) SEC-0330. The Fund's portfolio holdings are also posted on dws-investments.com from time to time. Please see the Fund's current prospectus for more information.
| Shares | Value ($) | |||||||
| Mutual Funds 80.1% | ||||||||
| DWS Diversified Market Neutral Fund "Institutional" (a) | 1,719,815 | 15,082,780 | ||||||
| DWS Enhanced Commodity Strategy Fund "Institutional" (a) | 844,453 | 12,886,360 | ||||||
| DWS Enhanced Emerging Markets Fixed Income Fund "Institutional" (a) | 1,035,752 | 10,792,537 | ||||||
| DWS Floating Rate Fund "Institutional" (a) | 1,641,271 | 15,542,833 | ||||||
| DWS Global Inflation Fund "Institutional" (a) | 628,959 | 6,138,642 | ||||||
| DWS RREEF Global Infrastructure Fund "Institutional" (a) | 1,173,170 | 15,685,285 | ||||||
| DWS RREEF Global Real Estate Securities Fund "Institutional" (a) | 370,653 | 2,972,636 | ||||||
Total Mutual Funds (Cost $78,917,660) | 79,101,073 | |||||||
| Shares | Value ($) | |||||||
| Exchange-Traded Funds 18.5% | ||||||||
| PowerShares DB U.S. Dollar Index Bullish* (b) | 90,677 | 1,951,369 | ||||||
| SPDR Barclays Convertible Securities | 276,358 | 12,914,209 | ||||||
| SPDR Barclays Short Term High Yield Bond | 110,988 | 3,425,090 | ||||||
Total Exchange-Traded Funds (Cost $17,467,503) | 18,290,668 | |||||||
| Cash Equivalents 1.0% | ||||||||
| Central Cash Management Fund, 0.05% (a) (c) (Cost $978,747) | 978,747 | 978,747 | ||||||
| % of Net Assets | Value ($) | |||||||
Total Investment Portfolio (Cost $97,363,910)† | 99.6 | 98,370,488 | ||||||
| Other Assets and Liabilities, Net | 0.4 | 391,293 | ||||||
| Net Assets | 100.0 | 98,761,781 | ||||||
* Non-income producing security.
† The cost for federal income tax purposes was $98,540,612. At December 31, 2013, net unrealized depreciation for all securities based on tax cost was $170,124. This consisted of aggregate gross unrealized appreciation for all securities in which there was an excess of value over tax cost of $4,002,519 and aggregate gross unrealized depreciation for all securities in which there was an excess of tax cost over value of $4,172,643.
(a) Affiliated fund managed by Deutsche Investment Management Americas Inc.
(b) Affiliated fund managed by DB Commodity Services LLC, a subsidiary of Deutsche Bank AG.
(c) The rate shown is the annualized seven-day yield at period end.
SPDR: Standard & Poor's Depositary Receipt
Fair Value Measurements
Various inputs are used in determining the value of the Fund's investments. These inputs are summarized in three broad levels. Level 1 includes quoted prices in active markets for identical securities. Level 2 includes other significant observable inputs (including quoted prices for similar securities, interest rates, prepayment speeds and credit risk). Level 3 includes significant unobservable inputs (including the Fund's own assumptions in determining the fair value of investments). The level assigned to the securities valuations may not be an indication of the risk or liquidity associated with investing in those securities.
The following is a summary of the inputs used as of December 31, 2013 in valuing the Fund's investments. For information on the Fund's policy regarding the valuation of investments, please refer to the Security Valuation section of Note A in the accompanying Notes to Financial Statements.
| Assets | Level 1 | Level 2 | Level 3 | Total | ||||||||||||
| Mutual Funds | $ | 79,101,073 | $ | — | $ | — | $ | 79,101,073 | ||||||||
| Exchange-Traded Funds | 18,290,668 | — | — | 18,290,668 | ||||||||||||
| Short-Term Investments | 978,747 | — | — | 978,747 | ||||||||||||
| Total | $ | 98,370,488 | $ | — | $ | — | $ | 98,370,488 | ||||||||
There have been no transfers between fair value measurement levels during the year ended December 31, 2013.
The accompanying notes are an integral part of the financial statements.
| as of December 31, 2013 | ||||
| Assets | ||||
Investments: Investments in affiliated Underlying Funds, at value (cost $81,898,111) | $ | 82,031,189 | ||
| Investments in non-affiliated securities, at value (cost $15,465,799) | 16,339,299 | |||
| Total investments in securities, at value (cost $97,363,910) | 98,370,488 | |||
| Cash | 127,821 | |||
| Receivable for Fund shares sold | 136,298 | |||
| Dividends receivable | 147,774 | |||
| Due from Advisor | 23,982 | |||
| Other assets | 1,794 | |||
| Total assets | 98,808,157 | |||
| Liabilities | ||||
| Payable for Fund shares redeemed | 76 | |||
| Accrued Trustees' fees | 1,161 | |||
| Accrued record keeping fees | 17,707 | |||
| Accrued reports to shareholders | 17,128 | |||
| Other accrued expenses and payables | 10,304 | |||
| Total liabilities | 46,376 | |||
| Net assets, at value | $ | 98,761,781 | ||
| Net Assets Consist of | ||||
| Undistributed net investment income | 1,652,423 | |||
| Net unrealized appreciation (depreciation) on investments | 1,006,578 | |||
| Accumulated net realized gain (loss) | (544,060 | ) | ||
| Paid-in capital | 96,646,840 | |||
| Net assets, at value | $ | 98,761,781 | ||
Class A Net Asset Value, offering and redemption price per share ($14,742,201 ÷ 1,072,115 outstanding shares of beneficial interest, no par value, unlimited number of shares authorized) | $ | 13.75 | ||
Class B Net Asset Value, offering and redemption price per share ($84,019,580 ÷ 6,114,865 outstanding shares of beneficial interest, no par value, unlimited number of shares authorized) | $ | 13.74 | ||
The accompanying notes are an integral part of the financial statements.
Statement of Operations
| for the year ended December 31, 2013 | ||||
| Investment Income | ||||
Income: Income distributions from affiliated Underlying Funds | $ | 1,265,125 | ||
| Dividends | 540,186 | |||
| Total income | 1,805,311 | |||
Expenses: Management fee | 314,244 | |||
| Administration fee | 86,121 | |||
| Services to shareholders | 2,247 | |||
| Record keeping fees (Class B) | 28,600 | |||
| Distribution service fee (Class B) | 186,097 | |||
| Custodian fee | 15,839 | |||
| Audit and tax fees | 52,085 | |||
| Legal fees | 18,437 | |||
| Reports to shareholders | 52,851 | |||
| Trustees' fees and expenses | 4,320 | |||
| Other | 2,361 | |||
| Total expenses before expense reductions | 763,202 | |||
| Expense reductions | (345,204 | ) | ||
| Total expenses after expense reductions | 417,998 | |||
| Net investment income (loss) | 1,387,313 | |||
| Realized and Unrealized Gain (Loss) | ||||
Net realized gain (loss) from: Sale of affiliated Underlying Funds | (589,593 | ) | ||
| Sale of non-affiliated Underlying Funds | (441,781 | ) | ||
| Capital gain distributions from affiliated Underlying Funds | 2,024,400 | |||
| 993,026 | ||||
| Change in net unrealized appreciation (depreciation) on investments | (1,638,087 | ) | ||
| Net gain (loss) | (645,061 | ) | ||
| Net increase (decrease) in net assets resulting from operations | $ | 742,252 | ||
The accompanying notes are an integral part of the financial statements.
| Years Ended December 31, | ||||||||
| Increase (Decrease) in Net Assets | 2013 | 2012 | ||||||
Operations: Net investment income | $ | 1,387,313 | $ | 1,351,274 | ||||
| Net realized gain (loss) | 993,026 | (417,287 | ) | |||||
| Change in net unrealized appreciation (depreciation) | (1,638,087 | ) | 4,248,342 | |||||
| Net increase (decrease) in net assets resulting from operations | 742,252 | 5,182,329 | ||||||
Distributions to shareholders from: Net investment income: Class A | (218,625 | ) | (277,485 | ) | ||||
| Class B | (1,281,892 | ) | (1,538,242 | ) | ||||
Net realized gains: Class A | — | (65,328 | ) | |||||
| Class B | — | (390,800 | ) | |||||
| Total distributions | (1,500,517 | ) | (2,271,855 | ) | ||||
Fund share transactions: Class A Proceeds from shares sold | 6,694,957 | 3,873,528 | ||||||
| Reinvestment of distributions | 218,625 | 342,813 | ||||||
| Payments for shares redeemed | (2,104,739 | ) | (1,854,054 | ) | ||||
| Net increase (decrease) in net assets from Class A share transactions | 4,808,843 | 2,362,287 | ||||||
Class B Proceeds from shares sold | 31,914,829 | 21,887,200 | ||||||
| Reinvestment of distributions | 1,281,892 | 1,929,042 | ||||||
| Payments for shares redeemed | (10,503,907 | ) | (5,211,663 | ) | ||||
| Net increase (decrease) in net assets from Class B share transactions | 22,692,814 | 18,604,579 | ||||||
| Increase (decrease) in net assets | 26,743,392 | 23,877,340 | ||||||
| Net assets at beginning of period | 72,018,389 | 48,141,049 | ||||||
| Net assets at end of period (including undistributed net investment income of $1,652,423 and $1,464,704, respectively) | $ | 98,761,781 | $ | 72,018,389 | ||||
| Other Information | ||||||||
Class A Shares outstanding at beginning of period | 720,220 | 545,891 | ||||||
| Shares sold | 490,282 | 284,613 | ||||||
| Shares issued to shareholders in reinvestment of distributions | 15,638 | 25,795 | ||||||
| Shares redeemed | (154,025 | ) | (136,079 | ) | ||||
| Net increase (decrease) in Class A shares | 351,895 | 174,329 | ||||||
| Shares outstanding at end of period | 1,072,115 | 720,220 | ||||||
Class B Shares outstanding at beginning of period | 4,466,071 | 3,093,124 | ||||||
| Shares sold | 2,327,269 | 1,611,987 | ||||||
| Shares issued to shareholders in reinvestment of distributions | 91,629 | 145,041 | ||||||
| Shares redeemed | (770,104 | ) | (384,081 | ) | ||||
| Net increase (decrease) in Class B shares | 1,648,794 | 1,372,947 | ||||||
| Shares outstanding at end of period | 6,114,865 | 4,466,071 | ||||||
The accompanying notes are an integral part of the financial statements.
| Years Ended December 31, | |||||||||||||||||||||
| Class A | 2013 | 2012 | 2011 | 2010 | Period Ended 12/31/09a | ||||||||||||||||
| Selected Per Share Data | |||||||||||||||||||||
| Net asset value, beginning of period | $ | 13.90 | $ | 13.24 | $ | 13.85 | $ | 12.63 | $ | 10.00 | |||||||||||
Income (loss) from investment operations: Net investment incomeb | .26 | .33 | .64 | .46 | .57 | ||||||||||||||||
| Net realized and unrealized gain (loss) | (.13 | ) | .93 | (1.02 | ) | 1.09 | 2.06 | ||||||||||||||
| Total from investment operations | .13 | 1.26 | (.38 | ) | 1.55 | 2.63 | |||||||||||||||
Less distributions from: Net investment income | (.28 | ) | (.49 | ) | (.19 | ) | (.18 | ) | — | ||||||||||||
| Net realized gains | — | (.11 | ) | (.04 | ) | (.15 | ) | — | |||||||||||||
| Total distributions | (.28 | ) | (.60 | ) | (.23 | ) | (.33 | ) | — | ||||||||||||
| Net asset value, end of period | $ | 13.75 | $ | 13.90 | $ | 13.24 | $ | 13.85 | $ | 12.63 | |||||||||||
Total Return (%)c,d | .93 | 9.72 | (2.87 | ) | 12.46 | 26.30 | |||||||||||||||
| Ratios to Average Net Assets and Supplemental Data | |||||||||||||||||||||
| Net assets, end of period ($ millions) | 15 | 10 | 7 | 5 | 1 | ||||||||||||||||
Ratio of expenses before expense reductions (%)e | .64 | .63 | .61 | .94 | 11.67 | ||||||||||||||||
Ratio of expenses after expense reductions (%)e | .27 | .30 | .30 | .21 | .21 | ||||||||||||||||
| Ratio of net investment income (%) | 1.86 | 2.46 | 4.72 | 3.51 | 5.39 | ||||||||||||||||
| Portfolio turnover rate (%) | 40 | 22 | 39 | 6 | 155 | ||||||||||||||||
a For the period from February 2, 2009 (commencement of operations of Class A shares) to December 31, 2009. b Based on average shares outstanding during the period. c Total return would have been lower had certain expenses not been reduced. d Total return would have been lower if the Advisor had not reduced some Underlying DWS Funds' expenses. e The Fund invests in other Funds and indirectly bears its proportionate share of fees and expenses incurred by the Underlying Funds in which the Fund is invested. This ratio does not include these indirect fees and expenses. | |||||||||||||||||||||
| Years Ended December 31, | |||||||||||||||||||||
| Class B | 2013 | 2012 | 2011 | 2010 | Period Ended 12/31/09a | ||||||||||||||||
| Selected Per Share Data | |||||||||||||||||||||
| Net asset value, beginning of period | $ | 13.88 | $ | 13.23 | $ | 13.84 | $ | 12.61 | $ | 10.87 | |||||||||||
Income (loss) from investment operations: Net investment incomeb | .22 | .30 | .61 | .42 | .35 | ||||||||||||||||
| Net realized and unrealized gain (loss) | (.11 | ) | .91 | (1.03 | ) | 1.09 | 1.39 | ||||||||||||||
| Total from investment operations | .11 | 1.21 | (.42 | ) | 1.51 | 1.74 | |||||||||||||||
Less distributions from: Net investment income | (.25 | ) | (.45 | ) | (.15 | ) | (.13 | ) | — | ||||||||||||
| Net realized gains | — | (.11 | ) | (.04 | ) | (.15 | ) | — | |||||||||||||
| Total distributions | (.25 | ) | (.56 | ) | (.19 | ) | (.28 | ) | — | ||||||||||||
| Net asset value, end of period | $ | 13.74 | $ | 13.88 | $ | 13.23 | $ | 13.84 | $ | 12.61 | |||||||||||
Total Return (%)c,d | .75 | 9.36 | (3.12 | ) | 12.15 | 16.01 | |||||||||||||||
| Ratios to Average Net Assets and Supplemental Data | |||||||||||||||||||||
| Net assets, end of period ($ millions) | 84 | 62 | 41 | 23 | 3 | ||||||||||||||||
Ratio of expenses before expense reductions (%)e | .93 | .88 | .86 | 1.19 | 5.37 | ||||||||||||||||
Ratio of expenses after expense reductions (%)e | .52 | .55 | .55 | .46 | .61 | ||||||||||||||||
| Ratio of net investment income (%) | 1.57 | 2.25 | 4.47 | 3.26 | 4.66 | ||||||||||||||||
| Portfolio turnover rate (%) | 40 | 22 | 39 | 6 | 155 | ||||||||||||||||
a For the period from May 18, 2009 (commencement of operations of Class B shares) to December 31, 2009. b Based on average shares outstanding during the period. c Total return would have been lower had certain expenses not been reduced. d Total return would have been lower if the Advisor had not reduced some Underlying DWS Funds' expenses. e The Fund invests in other Funds and indirectly bears its proportionate share of fees and expenses incurred by the Underlying Funds in which the Fund is invested. This ratio does not include these indirect fees and expenses. | |||||||||||||||||||||
A. Organization and Significant Accounting Policies
DWS Alternative Asset Allocation VIP (the "Fund") is a diversified series of DWS Variable Series II (the "Trust"), which is registered under the Investment Company Act of 1940, as amended (the "1940 Act"), as an open-end management investment company organized as a Massachusetts business trust. The Fund mainly invests in other affiliated DWS funds (i.e. mutual funds, exchange-traded funds and other pooled investment vehicles managed by Deutsche Investment Management Americas Inc. or one of its affiliates, together the "Underlying DWS Funds"), non-affiliated exchange-traded funds ("Non-affiliated ETFs") or directly into securities and derivative investments in which such underlying DWS Funds could invest. Non-affiliated ETFs and Underlying DWS Funds are collectively referred to as "Underlying Funds." During the year ended December 31, 2013, the Fund primarily invested in underlying DWS Funds and non-affiliated ETFs. Each Underlying DWS Fund's accounting policies and investment holdings are outlined in the Underlying DWS Funds' financial statements and are available upon request.
Multiple Classes of Shares of Beneficial Interest. The Fund offers two classes of shares (Class A shares and Class B shares). Sales of Class B shares are subject to recordkeeping fees up to 0.15% and Rule 12b-1 fees under the 1940 Act equal to an annual rate of 0.25% of the average daily net assets of the Class B shares of the Fund. Class A shares are not subject to such fees.
Investment income, realized and unrealized gains and losses, and certain fund-level expenses and expense reductions, if any, are borne pro rata on the basis of relative net assets by the holders of all classes of shares except that each class bears certain expenses unique to that class (including the applicable Rule 12b-1 fee). Differences in class-level expenses may result in payment of different per share dividends by class. All shares have equal rights with respect to voting subject to class-specific arrangements.
The Fund's financial statements are prepared in accordance with accounting principles generally accepted in the United States of America which require the use of management estimates. Actual results could differ from those estimates. The policies described below are followed consistently by the Fund in the preparation of its financial statements.
Security Valuation. Investments are stated at value determined as of the close of regular trading on the New York Stock Exchange on each day the exchange is open for trading.
Various inputs are used in determining the value of the Fund's investments. These inputs are summarized in three broad levels. Level 1 includes quoted prices in active markets for identical securities. Level 2 includes other significant observable inputs (including quoted prices for similar securities, interest rates, prepayment speeds and credit risk). Level 3 includes significant unobservable inputs (including the Fund's own assumptions in determining the fair value of investments). The level assigned to the securities valuations may not be an indication of the risk or liquidity associated with investing in those securities.
Investments in mutual funds are valued at the net asset value per share of each class of the Underlying DWS Funds and are categorized as Level 1.
ETFs are valued at the most recent sale price or official closing price reported on the exchange (U.S. or foreign) or over-the-counter market on which they trade. ETFs for which no sales are reported are valued at the calculated mean between the most recent bid and asked quotations on the relevant market or, if a mean cannot be determined, at the most recent bid quotation. Equity securities are categorized as Level 1 securities.
Disclosure about the classification of fair value measurements is included in a table following the Fund's Investment Portfolio.
Federal Income Taxes. The Fund's policy is to comply with the requirements of the Internal Revenue Code, as amended, which are applicable to regulated investment companies and to distribute all of its taxable income to its shareholders.
The Fund has reviewed the tax positions for the open tax years as of December 31, 2013 and has determined that no provision for income tax is required in the Fund's financial statements. The Fund's federal tax returns for the prior three fiscal years remain open subject to examination by the Internal Revenue Service.
Distribution of Income and Gains. Distributions from net investment income of the Fund, if any, are declared and distributed to shareholders annually. Net realized gains from investment transactions, in excess of available capital loss carryforwards, would be taxable to the Fund if not distributed and, therefore, will be distributed to shareholders at least annually. The Fund may also make additional distributions for tax purposes if necessary.
The timing and characterization of certain income and capital gain distributions are determined annually in accordance with federal tax regulations which may differ from accounting principles generally accepted in the United States of America. These differences primarily relate to certain securities sold at a loss. As a result, net investment income (loss) and net realized gain (loss) on investment transactions for a reporting period may differ significantly from distributions during such period. Accordingly, the Fund may periodically make reclassifications among certain of its capital accounts without impacting the net asset value of the Fund.
At December 31, 2013, the Fund's components of distributable earnings on a tax basis were as follows:
| Undistributed ordinary income* | $ | 1,652,423 | ||
| Undistributed long-term capital gains | $ | 617,541 | ||
| Unrealized appreciation (depreciation) on investments | $ | (170,124 | ) |
In addition, the tax character of distributions paid by the Fund is summarized as follows:
| Years Ended December 31, | ||||||||
| 2013 | 2012 | |||||||
| Distributions from ordinary income* | $ | 1,500,517 | $ | 1,819,179 | ||||
| Distributions from long-term capital gains | $ | — | $ | 452,676 | ||||
* For tax purposes, short-term capital gain distributions are considered ordinary income distributions.
Expenses. Expenses of the Trust arising in connection with a specific fund are allocated to that fund. Other Trust expenses which cannot be directly attributed to a fund are apportioned among the funds in the Trust based upon the relative net assets or other appropriate measures.
Contingencies. In the normal course of business, the Fund may enter into contracts with service providers that contain general indemnification clauses. The Fund's maximum exposure under these arrangements is unknown as this would involve future claims that may be made against the Fund that have not yet been made. However, based on experience, the Fund expects the risk of loss to be remote.
Other. Investment transactions are accounted for on a trade date plus one basis for daily net asset value calculations. However, for financial reporting purposes, investment transactions are reported on trade date. Interest income is recorded on the accrual basis. Dividend Income is recorded on the ex-dividend date. Distributions of income and capital gains from the Underlying Funds are recorded on the ex-dividend date. Realized gains and losses from investment transactions are recorded on an identified cost basis.
B. Purchases and Sales of Securities
During the year ended December 31, 2013, purchases and sales of affiliated Underlying Funds (excluding money market funds) aggregated $44,167,218 and $19,102,285, respectively. Purchases and sales of Non-affiliated ETFs aggregated $19,062,446 and $15,134,575, respectively.
C. Related Parties
Management Agreement. Under the Investment Management Agreement with Deutsche Investment Management Americas Inc. ("DIMA" or the "Advisor"), an indirect, wholly owned subsidiary of Deutsche Bank AG, the Advisor directs the investments of the Fund in accordance with its investment objectives, policies and restrictions. The Advisor determines the securities, instruments and other contracts relating to investments in Underlying Funds to be purchased, sold or entered into by the Fund or delegates such responsibility to the Fund's subadvisors.
Proir to July 12, 2013, QS Investors, LLC ("QS Investors") served as subadvisor to the Fund. As subadvisor, QS Investors rendered strategic allocation services to the Fund. QS Investors was paid by the Advisor for the services QS Investors provided to the Fund. Effective July 12, 2013, QS Investors no longer acts as subadvisor to the Fund and day-to-day portfolio management of the Fund transitioned to DIMA.
RREEF America L.L.C. ("RREEF") acts as an investment subadvisor to the Fund. As an investment subadvisor to the Fund, RREEF provides investment management services to the portions of the Fund's portfolio allocated to direct investments in global real estate and global infrastructure securities. RREEF is paid by the Advisor for the services RREEF provides to the Fund. As of the date of this report, the Fund obtained its exposure to global real estate and global infrastructure securities indirectly through investments in other Underlying DWS Funds.
The Fund does not invest in the Underlying DWS Funds for the purpose of exercising management or control; however, investments within the set limits may represent 5% or more of an Underlying DWS Fund's outstanding shares. For the year ended December 31, 2013, the Fund held 5% of DWS Global Inflation Fund.
Pursuant to the Investment Management Agreement with the Advisor, the Fund pays a monthly management fee based on the Fund's average daily net assets, computed and accrued daily and payable monthly, at the following annual rates:
| On assets invested in other DWS Funds | .20% |
| On assets invested in all other assets not considered DWS Funds | 1.20% |
In addition, the Advisor will receive management fees from managing the Underlying DWS Funds in which the Fund invests.
For the period from January 1, 2013 through September 30, 2013, the Advisor had contractually agreed to waive its fee and/or reimburse certain operating expenses to the extent necessary to maintain the operating expenses (excluding certain expenses such as extraordinary expenses, taxes, brokerage, interest expense and indirect expenses of Underlying Funds) of each class as follows:
| Class A | .25% |
| Class B | .50% |
For the period from October 1, 2013 through July 11, 2014, the Advisor has contractually agreed to waive its fee and/or reimburse certain operating expenses to the extent necessary to maintain the operating expenses (excluding certain expenses such as extraordinary expenses, taxes, brokerage, interest expense and Underlying Funds) of each class as follows:
| Class A | .32% |
| Class B | .57% |
For the year ended December 31, 2013, the Advisor agreed to waive 0.15% of the monthly management fee based on average daily net assets for the Fund.
Accordingly, for the year ended December 31, 2013, the fee pursuant to the Investment Management Agreement aggregating $314,244, all of which was waived, resulting in an annual effective rate of 0.00% of the Fund's average daily net assets.
The Fund indirectly bears its proportionate share of fees and expenses incurred by the Underlying Funds in which it is invested.
Administration Fee. Pursuant to an Administrative Services Agreement, DIMA provides most administrative services to the Fund. For all services provided under the Administrative Services Agreement, the Fund pays DIMA an annual fee ("Administration Fee") of 0.10% of the Fund's average daily net assets, computed and accrued daily and payable monthly. For the year ended December 31, 2013, the Administration Fee was $86,121, of which $2,560 was waived and $5,655 is unpaid.
Service Provider Fees. DWS Investments Service Company ("DISC"), an affiliate of the Advisor, is the transfer agent, dividend-paying agent and shareholder service agent for the Fund. Pursuant to a sub-transfer agency agreement between DISC and DST Systems, Inc. ("DST"), DISC has delegated certain transfer agent, dividend-paying agent and shareholder service agent functions to DST. DISC compensates DST out of the shareholder servicing fee it receives from the Fund. For the year ended December 31, 2013, the amounts charged to the Fund by DISC were as follows:
| Services to Shareholders | Total Aggregated | Waived | ||||||
| Class A | $ | 87 | $ | 87 | ||||
| Class B | 114 | 114 | ||||||
| $ | 201 | $ | 201 | |||||
In addition, for the year ended December 31, 2013, the Advisor reimbursed $28,199 of non-affiliated recordkeeping fees.
Distribution Service Agreement. Under the Fund's Class B 12b-1 plans, DWS Investments Distributors, Inc. ("DIDI") received a fee ("Distribution Service Fee") of 0.25% of average daily net assets of Class B shares. For the year ended December 31, 2013, the Distribution Service Fee aggregated $186,097, of which $18,092 is unpaid.
Typesetting and Filing Service Fees. Under an agreement with DIMA, DIMA is compensated for providing typesetting and certain regulatory filing services to the Fund. For the year ended December 31, 2013, the amount charged to the Fund by DIMA included in the Statement of Operations under "reports to shareholders" aggregated $27,370, of which $4,097 is unpaid.
Trustees' Fees and Expenses. The Fund paid retainer fees to each Trustee not affiliated with the Advisor, plus specified amounts to the Board Chairperson and Vice Chairperson and to each committee Chairperson.
Affiliated Cash Management Vehicles. The Fund may invest uninvested cash balances in Central Cash Management Fund and DWS Variable NAV Money Fund, affiliated money market funds which are managed by the Advisor. Each affiliated money market fund seeks to provide a high level of current income consistent with liquidity and the preservation of capital. Each affiliated money market fund is managed in accordance with Rule 2a-7 under the Investment Company Act of 1940, which governs the quality, maturity, diversity and liquidity of instruments in which a money market fund may invest. Central Cash Management Fund seeks to maintain a stable net asset value, and DWS Variable NAV Money Fund maintains a floating net asset value. The Fund indirectly bears its proportionate share of the expenses of each affiliated money market fund in which it invests. Central Cash Management Fund does not pay the Advisor an investment management fee. To the extent that DWS Variable NAV Money Fund pays an investment management fee to the Advisor, the Advisor will waive an amount of the investment management fee payable to the Advisor by the Fund equal to the amount of the investment management fee payable on the Fund's assets invested in DWS Variable NAV Money Fund.
D. Ownership of the Fund
At December 31, 2013, one participating insurance company was the owner of record of 10% or more of the total outstanding Class A shares of the Fund, owning 98%. Two participating insurance companies were the owner of record of 10% or more of the total outstanding Class B shares of the Fund, owning 65% and 30%, respectively.
E. Transactions with Affiliates
The Fund mainly invest in Underlying DWS Funds and Non-affiliated ETFs. The Underlying DWS Funds in which the Fund invests are considered to be affiliated investments. A summary of the Fund's transactions with affiliated Underlying DWS Funds during the year ended December 31, 2013 is as follows:
| Affiliate | Value ($) at 12/31/2012 | Purchases Cost ($) | Sales Cost ($) | Realized Gain/ (Loss) ($) | Income Distributions ($) | Capital Gain Distributions ($) | Value ($) at 12/31/2013 | |||||||||||||||||||||
| DWS Diversified Market Neutral Fund | 10,861,175 | 6,850,860 | 1,362,000 | (3,683 | ) | — | 1,652,860 | 15,082,780 | ||||||||||||||||||||
| DWS Enhanced Commodity Strategy Fund | 9,764,605 | 4,706,016 | 713,000 | (230,704 | ) | — | — | 12,886,360 | ||||||||||||||||||||
| DWS Enhanced Emerging Markets Fixed Income Fund | 5,788,784 | 7,905,851 | 2,266,000 | (175,684 | ) | 336,851 | — | 10,792,537 | ||||||||||||||||||||
| DWS Floating Rate Fund | 8,973,006 | 7,949,388 | 2,127,045 | (9,514 | ) | 508,388 | — | 15,542,833 | ||||||||||||||||||||
| DWS Global Inflation Fund | 8,483,420 | 3,187,302 | 4,392,000 | (536,545 | ) | 84,302 | — | 6,138,642 | ||||||||||||||||||||
| DWS Gold & Precious Metals Fund | 693,385 | 120,000 | — | (150,315 | ) | — | — | — | ||||||||||||||||||||
| DWS RREEF Global Infrastructure Fund | 7,644,550 | 8,344,106 | 1,653,000 | 14,439 | 210,565 | 371,540 | 15,685,285 | |||||||||||||||||||||
| DWS RREEF Global Real Estate Securities Fund | 6,354,589 | 2,239,919 | 5,775,000 | 550,247 | 123,919 | — | 2,972,636 | |||||||||||||||||||||
| PowerShares DB G10 Currency Harvest ETF | — | 862,073 | 814,240 | (47,834 | ) | — | — | — | ||||||||||||||||||||
| PowerShares DB US Dollar Index Bullish ETF | — | 2,001,703 | — | — | — | — | 1,951,369 | |||||||||||||||||||||
| Central Cash Management Fund | 772,008 | 34,621,875 | 34,415,136 | — | 1,100 | — | 978,747 | |||||||||||||||||||||
| Total | 59,335,522 | 78,789,093 | 53,517,421 | (589,593 | ) | 1,265,125 | 2,024,400 | 82,031,189 | ||||||||||||||||||||
To the Board of Trustees of DWS Variable Series II and Shareholders of DWS Alternative Asset Allocation VIP:
We have audited the accompanying statement of assets and liabilities, including the investment portfolio, of DWS Alternative Asset Allocation VIP (the "Fund") (one of the funds constituting DWS Variable Series II), as of December 31, 2013, and the related statement of operations for the year then ended, the statements of changes in net assets for each of the two years in the period then ended, and the financial highlights for each of the periods indicated therein. These financial statements and financial highlights are the responsibility of the Fund's management. Our responsibility is to express an opinion on these financial statements and financial highlights based on our audits.
We conducted our audits in accordance with the standards of the Public Company Accounting Oversight Board (United States). Those standards require that we plan and perform the audit to obtain reasonable assurance about whether the financial statements and financial highlights are free of material misstatement. We were not engaged to perform an audit of the Fund's internal control over financial reporting. Our audits included consideration of internal control over financial reporting as a basis for designing audit procedures that are appropriate in the circumstances, but not for the purpose of expressing an opinion on the effectiveness of the Fund's internal control over financial reporting. Accordingly, we express no such opinion. An audit also includes examining, on a test basis, evidence supporting the amounts and disclosures in the financial statements and financial highlights, assessing the accounting principles used and significant estimates made by management, and evaluating the overall financial statement presentation. Our procedures included confirmation of securities owned as of December 31, 2013, by correspondence with the custodian and brokers. We believe that our audits provide a reasonable basis for our opinion.
In our opinion, the financial statements and financial highlights referred to above present fairly, in all material respects, the financial position of DWS Alternative Asset Allocation VIP (one of the funds constituting DWS Variable Series II) at December 31, 2013, the results of its operations for the year then ended, the changes in its net assets for each of the two years in the period then ended, and the financial highlights for each of the periods indicated therein, in conformity with U.S. generally accepted accounting principles.
 | ||
Boston, Massachusetts February 14, 2014 |
As an investor of the Fund, you incur two types of costs: ongoing expenses and transaction costs. Ongoing expenses include management fees, distribution and service (12b-1) fees and other Fund expenses. Examples of transaction costs include contract charges and account maintenance fees, which are not shown in this section. The following tables are intended to help you understand your ongoing expenses (in dollars) of investing in the Fund and to help you compare these expenses with the ongoing expenses of investing in other mutual funds. In addition to the ongoing expenses which the Fund bears directly, the Fund's shareholders indirectly bear the expense of the Underlying Funds in which the Fund invests. These expenses are not included in the Fund's annualized expense ratios used to calculate the expense estimate in the tables. In the most recent six-month period, the Fund limited the ongoing expenses the Fund bears directly; had it not done so, expenses would have been higher. The examples in the table are based on an investment of $1,000 invested at the beginning of the six-month period and held for the entire period (July 1, 2013 to December 31, 2013).
The tables illustrate your Fund's expenses in two ways:
—Actual Fund Return. This helps you estimate the actual dollar amount of ongoing expenses (but not transaction costs) paid on a $1,000 investment in the Fund using the Fund's actual return during the period. To estimate the expenses you paid over the period, simply divide your account value by $1,000 (for example, an $8,600 account value divided by $1,000 = 8.6), then multiply the result by the number in the "Expenses Paid per $1,000" line under the share class you hold.
— Hypothetical 5% Fund Return. This helps you to compare your Fund's ongoing expenses (but not transaction costs) with those of other mutual funds using the Fund's actual expense ratio and a hypothetical rate of return of 5% per year before expenses. Examples using a 5% hypothetical Fund return may be found in the shareholder reports of other mutual funds. The hypothetical account values and expenses may not be used to estimate the actual ending account balance or expenses you paid for the period.
Please note that the expenses shown in these tables are meant to highlight your ongoing expenses only and do not reflect any transaction costs. The "Expenses Paid per $1,000" line of the tables is useful in comparing ongoing expenses only and will not help you determine the relative total expense of owning different funds. If these transaction costs had been included, your costs would have been higher.
Expenses and Value of a $1,000 Investment for the six months ended December 31, 2013 | ||||||||
| Actual Fund Return | Class A | Class B | ||||||
| Beginning Account Value 7/1/13 | $ | 1,000.00 | $ | 1,000.00 | ||||
| Ending Account Value 12/31/13 | $ | 1,030.00 | $ | 1,028.40 | ||||
| Expenses Paid per $1,000* | $ | 1.48 | $ | 2.76 | ||||
| Hypothetical 5% Fund Return | Class A | Class B | ||||||
| Beginning Account Value 7/1/13 | $ | 1,000.00 | $ | 1,000.00 | ||||
| Ending Account Value 12/31/13 | $ | 1,023.74 | $ | 1,022.48 | ||||
| Expenses Paid per $1,000* | $ | 1.48 | $ | 2.75 | ||||
* Expenses are equal to the Fund's annualized expense ratio for each share class, multiplied by the average account value over the period, multiplied by 184 (the number of days in the most recent six-month period), then divided by 365.
| Annualized Expense Ratios** | Class A | Class B | |||
| DWS Variable Series II — DWS Alternative Asset Allocation VIP | .29% | .54% |
** The Fund invests in other funds and indirectly bears its proportionate share of fees and expenses incurred by the Underlying Funds in which the Fund is invested. These ratios do not include these indirect fees and expenses.
For more information, please refer to the Fund's prospectus.
These tables do not reflect charges and fees ("contract charges") associated with the separate account that invests in the Fund or any variable life insurance policy or variable annuity contract for which the Fund is an investment option.
For an analysis of the fees associated with an investment in the fund or similar funds, please refer to the current and hypothetical expense calculators for Variable Insurance Products which can be found at dws-investments.com/EN/resources/calculators.jsp.
Pursuant to Section 852 of the Internal Revenue Code, the Fund designates $680,000 as capital gain dividends for its year ended December 31, 2013.
For corporate shareholders, 8% of income dividends paid during the Fund's fiscal year ended December 31, 2013 qualified for the dividends received deduction.
Please consult a tax advisor if you have questions about federal or state income tax laws, or on how to prepare your tax returns. If you have specific questions about your account, please contact your insurance provider.
The Trust's policies and procedures for voting proxies for portfolio securities and information about how the Trust voted proxies related to its portfolio securities during the 12-month period ended June 30 are available on our Web site — dws-investments.com (click on "proxy voting" at the bottom of the page) — or on the SEC's Web site — sec.gov. To obtain a written copy of the Trust's policies and procedures without charge, upon request, call us toll free at (800) 728-3337.
The Board of Trustees approved the renewal of DWS Alternative Asset Allocation VIP's investment management agreement (the "Agreement") with Deutsche Investment Management Americas Inc. ("DIMA") and sub-advisory agreement (the "Sub-Advisory Agreement" and together with the Agreement, the "Agreements") between DIMA and RREEF America L.L.C. ("RREEF"), an affiliate of DIMA, in September 2013.
In terms of the process that the Board followed prior to approving the Agreements, shareholders should know that:
— In September 2013, all but one of the Fund's Trustees were independent of DIMA and its affiliates.
— The Trustees met frequently during the past year to discuss fund matters and dedicated a substantial amount of time to contract review matters. Over the course of several months, the Board's Contract Committee, in coordination with the Board's Fixed Income and Asset Allocation Oversight Committee, reviewed comprehensive materials received from DIMA, independent third parties and independent counsel. These materials included an analysis of the Fund's performance, fees and expenses, and profitability compiled by a fee consultant retained by the Fund's Independent Trustees (the "Fee Consultant"). The Board also received extensive information throughout the year regarding performance of the Fund.
— The Independent Trustees regularly meet privately with their independent counsel to discuss contract review and other matters. In addition, the Independent Trustees were also advised by the Fee Consultant in the course of their review of the Fund's contractual arrangements and considered a comprehensive report prepared by the Fee Consultant in connection with their deliberations.
— In connection with reviewing the Agreements, the Board also reviewed the terms of the Fund's Rule 12b-1 plan, distribution agreement, administrative services agreement, transfer agency agreement and other material service agreements.
— Based on its evaluation of the information provided, the Contract Committee presented its findings and recommendations to the Board. The Board then reviewed the Contract Committee's findings and recommendations.
In connection with the contract review process, the Contract Committee and the Board considered the factors discussed below, among others. The Board also considered that DIMA and its predecessors have managed the Fund since its inception, and the Board believes that a long-term relationship with a capable, conscientious advisor is in the best interests of the Fund. The Board considered, generally, that shareholders chose to invest or remain invested in the Fund knowing that DIMA managed the Fund. DIMA and RREEF are part of Deutsche Bank AG, a major global banking institution that is engaged in a wide range of financial services. The Board believes that there are advantages to being part of a global asset management business that offers a wide range of investing expertise and resources, including hundreds of portfolio managers and analysts with research capabilities in many countries throughout the world.
As part of the contract review process, the Board carefully considered the fees and expenses of each DWS fund overseen by the Board in light of the fund's performance. In many cases, this led to a negotiation with DIMA of lower expense caps as part of the 2012 and 2013 contract review processes than had previously been in place. As part of these negotiations, the Board indicated that it would consider relaxing these new lower caps in future years following sustained improvements in performance, among other considerations.
In June 2012, Deutsche Bank AG ("DB"), DIMA's parent company, announced that DB would combine its Asset Management (of which DIMA was a part) and Wealth Management divisions. DB has advised the Independent Trustees that the U.S. asset management business is a critical and integral part of DB, and that it has, and will continue to, reinvest a significant portion of the substantial savings it expects to realize by combining its Asset Management and Wealth Management divisions into the new Asset and Wealth Management ("AWM") division, including ongoing enhancements to its investment capabilities. DB also has confirmed its commitment to maintaining strong legal and compliance groups within the AWM division.
While shareholders may focus primarily on fund performance and fees, the Fund's Board considers these and many other factors, including the quality and integrity of DIMA's and RREEF's personnel and such other issues as back-office operations, fund valuations, and compliance policies and procedures.
Nature, Quality and Extent of Services. The Board considered the terms of the Agreements, including the scope of advisory services provided under the Agreements. The Board noted that, under the Agreements, DIMA and RREEF provide portfolio management services to the Fund and that, pursuant to a separate administrative services agreement, DIMA provides administrative services to the Fund. The Board considered the experience and skills of senior management and investment personnel, the resources made available to such personnel, the ability of DIMA to attract and retain high-quality personnel, and the organizational depth and stability of DIMA. The Board reviewed the Fund's performance over short-term and long-term periods and compared those returns to various agreed-upon performance measures, including market indices and a peer universe compiled by the Fee Consultant using information supplied by Morningstar Direct ("Morningstar"), an independent fund data service. The Board also noted that it has put into place a process of identifying "Focus Funds" (e.g., funds performing poorly relative to their benchmark or a peer universe compiled by an independent fund data service), and receives more frequent reporting and information from DIMA regarding such funds, along with DIMA's remedial plans to address underperformance. The Board believes this process is an effective manner of identifying and addressing underperforming funds. Based on the information provided, the Board noted that for the one- and three-year periods ended December 31, 2012, the Fund's performance (Class A shares) was in the 1st quartile of the applicable Morningstar universe (the 1st quartile being the best performers and the 4th quartile being the worst performers). The Board also observed that the Fund has underperformed its benchmark in the one- and three-year periods ended December 31, 2012.
Fees and Expenses. The Board considered the Fund's investment management fee schedule, sub-advisory fee schedule, operating expenses and total expense ratios, and comparative information provided by Lipper Inc. ("Lipper") and the Fee Consultant regarding investment management fee rates paid to other investment advisors by similar funds (1st quartile being the most favorable and 4th quartile being the least favorable). With respect to management fees paid to other investment advisors by similar funds, the Board noted that the contractual fee rates paid by the Fund, which include a 0.10% fee paid to DIMA under the Fund's administrative services agreement, were equal to the median (2nd quartile) of the applicable Lipper peer group (based on Lipper data provided as of December 31, 2012). With respect to the sub-advisory fee paid to RREEF, the Board noted that the fee is paid by DIMA out of its fee and not directly by the Fund. The Board noted that the Fund's Class A shares total (net) operating expenses were expected to be lower than the median (1st quartile) of the applicable Lipper expense universe (based on Lipper data provided as of December 31, 2012, and analyzing Lipper expense universe Class A (net) expenses less any applicable 12b-1 fees) ("Lipper Universe Expenses"). The Board also reviewed data comparing each share class's total (net) operating expenses to the applicable Lipper Universe Expenses. The Board considered the Fund's management fee rate as compared to fees charged by DIMA to comparable funds and considered differences between the Fund and the comparable funds. The Board also considered how the Fund's total (net) operating expenses compared to the total (net) operating expenses of a more customized peer group selected by Lipper (based on such factors as asset size). The Board also noted that the expense limitations agreed to by DIMA helped to ensure that the Fund's total (net) operating expenses would remain competitive.
The information considered by the Board as part of its review of management fees included information regarding fees charged by DIMA and its affiliates to similar institutional accounts and to similar funds offered primarily to European investors ("DWS Europe funds"), in each case as applicable. The Board observed that advisory fee rates for institutional accounts generally were lower than the management fees charged by similarly managed DWS U.S. mutual funds ("DWS Funds"), but also took note of the differences in services provided to DWS Funds as compared to institutional accounts. In the case of DWS Europe funds, the Board observed that fee rates for DWS Europe funds generally were higher than for similarly managed DWS Funds, but noted that differences in the types of services provided to DWS Funds relative to DWS Europe funds made it difficult to compare such fees.
On the basis of the information provided, the Board concluded that management fees were reasonable and appropriate in light of the nature, quality and extent of services provided by DIMA and RREEF.
Profitability. The Board reviewed detailed information regarding revenues received by DIMA from advising the DWS Funds along with the estimated costs and pre-tax profits realized by DIMA from advising the DWS Funds. The Board also received information regarding the estimated enterprise-wide profitability of DWS and its affiliates with respect to all fund services in totality. The Board did not receive profitability information with respect to the Fund, but did receive such information with respect to the funds in which the Fund invests. The Board also reviewed information regarding the profitability of certain similar investment management firms. The Board noted that while information regarding the profitability of such firms is limited (and in some cases is not necessarily prepared on a comparable basis), DIMA and its affiliates' overall profitability with respect to the DWS fund complex (after taking into account distribution and other services provided to the funds by DIMA and its affiliates) was lower than the overall profitability levels of many comparable firms for which such data was available.
Economies of Scale. The Board considered whether there are economies of scale with respect to the management of the Fund and whether the Fund benefits from any economies of scale. In this regard, the Board noted that while the Fund's current investment management fee schedule does not include breakpoints, the Board intends to consider implementation of one or more breakpoints once the Fund reaches an efficient operating size. The Board concluded that the Fund's fee schedule represents an appropriate sharing between the Fund and DIMA of such economies of scale as may exist in the management of the Fund at current asset levels.
Other Benefits to DIMA and Its Affiliates. The Board also considered the character and amount of other incidental benefits received by DIMA and its affiliates, including any fees received by DIMA for administrative services provided to the Fund and any fees received by an affiliate of DIMA for distribution services. The Board also considered benefits to DIMA related to brokerage and soft-dollar allocations, including allocating brokerage to pay for research generated by parties other than the executing broker dealers, which pertain primarily to funds investing in equity securities, along with the incidental public relations benefits to DIMA related to DWS Funds advertising and cross-selling opportunities among DIMA products and services. The Board concluded that management fees were reasonable in light of these fallout benefits.
Compliance. The Board considered the significant attention and resources dedicated by DIMA to documenting and enhancing its compliance processes in recent years. The Board noted in particular (i) the experience and seniority of both DIMA's chief compliance officer and the Fund's chief compliance officer; (ii) the large number of DIMA compliance personnel; and (iii) the substantial commitment of resources by DIMA and its affiliates to compliance matters.
Based on all of the information considered and the conclusions reached, the Board unanimously determined that the continuation of the Agreements is in the best interests of the Fund. In making this determination, the Board did not give particular weight to any single factor identified above. The Board considered these factors over the course of numerous meetings, certain of which were in executive session with only the Independent Trustees and their independent counsel present. It is possible that individual Trustees may have weighed these factors differently in reaching their individual decisions to approve the continuation of the Agreements.
The following table presents certain information regarding the Board Members and Officers of the fund. Each Board Member's year of birth is set forth in parentheses after his or her name. Unless otherwise noted, (i) each Board Member has engaged in the principal occupation(s) noted in the table for at least the most recent five years, although not necessarily in the same capacity; and (ii) the address of each Independent Board Member is c/o Kenneth C. Froewiss, Chairman, DWS Mutual Funds, P.O. Box 78, Short Hills, NJ 07078. Except as otherwise noted below, the term of office for each Board Member is until the election and qualification of a successor, or until such Board Member sooner dies, resigns, is removed or as otherwise provided in the governing documents of the fund. Because the fund does not hold an annual meeting of shareholders, each Board Member will hold office for an indeterminate period. The Board Members may also serve in similar capacities with other funds in the fund complex.
| Independent Board Members | ||||
Name, Year of Birth, Position with the Fund and Length of Time Served1 | Business Experience and Directorships During the Past Five Years | Number of Funds in DWS Fund Complex Overseen | Other Directorships Held by Board Member | |
Kenneth C. Froewiss (1945) Chairperson since 2013, and Board Member since 2001 | Adjunct Professor of Finance, NYU Stern School of Business (September 2009–present; Clinical Professor from 1997–September 2009); Member, Finance Committee, Association for Asian Studies (2002–present); Director, Mitsui Sumitomo Insurance Group (US) (2004–present); prior thereto, Managing Director, J.P. Morgan (investment banking firm) (until 1996) | 103 | — | |
William McClayton (1944) Vice Chairperson since 2013, and Board Member since 2004 | Private equity investor (since October 2009); previously, Managing Director, Diamond Management & Technology Consultants, Inc. (global consulting firm) (2001–2009); Directorship: Board of Managers, YMCA of Metropolitan Chicago; formerly: Senior Partner, Arthur Andersen LLP (accounting) (1966–2001); Trustee, Ravinia Festival | 103 | — | |
John W. Ballantine (1946) Board Member since 1999 | Retired; formerly, Executive Vice President and Chief Risk Management Officer, First Chicago NBD Corporation/The First National Bank of Chicago (1996–1998); Executive Vice President and Head of International Banking (1995–1996); former Directorships: Stockwell Capital Investments PLC (private equity); First Oak Brook Bancshares, Inc. and Oak Brook Bank; Prisma Energy International | 103 | Chairman of the Board, Healthways, Inc.2 (provider of disease and care management services) (2003– present); Portland General Electric2 (utility company) (2003– present) | |
Henry P. Becton, Jr. (1943) Board Member since 1990 | Vice Chair and former President, WGBH Educational Foundation. Directorships: Public Radio International; Public Radio Exchange (PRX); North Bennett Street School (Boston); former Directorships: The PBS Foundation; Association of Public Television Stations; Boston Museum of Science; American Public Television; Concord Academy; New England Aquarium; Mass. Corporation for Educational Telecommunications; Committee for Economic Development; Public Broadcasting Service; Connecticut College | 103 | Lead Director, Becton Dickinson and Company2 (medical technology company); Lead Director, Belo Corporation2 (media company) | |
Dawn-Marie Driscoll (1946) Board Member since 1987 | President, Driscoll Associates (consulting firm); Emeritus Executive Fellow, Center for Business Ethics, Bentley University; formerly, Partner, Palmer & Dodge (1988–1990); Vice President of Corporate Affairs and General Counsel, Filene's (1978–1988). Directorships: Director of ICI Mutual Insurance Company (since 2007); Advisory Board, Center for Business Ethics, Bentley University; Chairman of the Board of Trustees, Southwest Florida Community Foundation (charitable organization); former Directorships: Sun Capital Advisers Trust (mutual funds) (2007–2012), Investment Company Institute (audit, executive, nominating committees) and Independent Directors Council (governance, executive committees) | 103 | — | |
Keith R. Fox, CFA (1954) Board Member since 1996 | Managing General Partner, Exeter Capital Partners (a series of private investment funds) (since 1986). Directorships: Progressive International Corporation (kitchen goods importer and distributor); The Kennel Shop (retailer); former Chairman, National Association of Small Business Investment Companies; former Directorships: BoxTop Media Inc. (advertising); Sun Capital Advisers Trust (mutual funds) (2011–2012) | 103 | — | |
Paul K. Freeman (1950) Board Member since 1993 | Consultant, World Bank/Inter-American Development Bank; Executive and Governing Council of the Independent Directors Council (Chairman of Education Committee); formerly: Project Leader, International Institute for Applied Systems Analysis (1998–2001); Chief Executive Officer, The Eric Group, Inc. (environmental insurance) (1986–1998); Directorships: Denver Zoo Foundation (December 2012–present); former Directorships: Prisma Energy International | 103 | — | |
Richard J. Herring (1946) Board Member since 1990 | Jacob Safra Professor of International Banking and Professor, Finance Department, The Wharton School, University of Pennsylvania (since July 1972); Co-Director, Wharton Financial Institutions Center (since July 2000); Co-Chair, U.S. Shadow Financial Regulatory Committee; Executive Director, Financial Economists Roundtable; formerly: Vice Dean and Director, Wharton Undergraduate Division (July 1995–June 2000); Director, Lauder Institute of International Management Studies (July 2000–June 2006) | 103 | Director, Japan Equity Fund, Inc. (since September 2007), Thai Capital Fund, Inc. (since 2007), Singapore Fund, Inc. (since September 2007), Independent Director of Barclays Bank Delaware (since September 2010) | |
Rebecca W. Rimel (1951) Board Member since 1995 | President and Chief Executive Officer, The Pew Charitable Trusts (charitable organization) (1994 to present); formerly: Executive Vice President, The Glenmede Trust Company (investment trust and wealth management) (1983–2004); Board Member, Investor Education (charitable organization) (2004–2005); Trustee, Executive Committee, Philadelphia Chamber of Commerce (2001–2007); Director, Viasys Health Care2 (January 2007–June 2007); Trustee, Thomas Jefferson Foundation (charitable organization) (1994–2012) | 103 | Director, Becton Dickinson and Company2 (medical technology company) (2012– present); Director, CardioNet, Inc.2 (health care) (2009– present) | |
William N. Searcy, Jr. (1946) Board Member since 1993 | Private investor since October 2003; formerly: Pension & Savings Trust Officer, Sprint Corporation2 (telecommunications) (November 1989–September 2003); Trustee, Sun Capital Advisers Trust (mutual funds) (1998–2012) | 103 | — | |
Jean Gleason Stromberg (1943) Board Member since 1997 | Retired. Formerly, Consultant (1997–2001); Director, Financial Markets U.S. Government Accountability Office (1996–1997); Partner, Fulbright & Jaworski, L.L.P. (law firm) (1978–1996). Directorships: The William and Flora Hewlett Foundation; former Directorships: Service Source, Inc., Mutual Fund Directors Forum (2002–2004), American Bar Retirement Association (funding vehicle for retirement plans) (1987–1990 and 1994–1996) | 103 | — | |
Robert H. Wadsworth (1940) Board Member since 1999 | President, Robert H. Wadsworth & Associates, Inc. (consulting firm) (1983 to present); Director, National Horizon, Inc. (non-profit organization); Director and Treasurer, The Phoenix Boys Choir Association | 106 | — | |
Officers4 | ||
Name, Year of Birth, Position with the Fund and Length of Time Served5 | Business Experience and Directorships During the Past Five Years | |
Brian E. Binder8,9 (1972) President and Chief Executive Officer, 2013–present | Managing Director3 and Head of Fund Administration, Deutsche Asset & Wealth Management (2013–present); formerly: Head of Business Management and Consulting at Invesco, Ltd. (2010–2012); Chief Administrative Officer, Van Kampen Funds Inc. (2008–2010); and Chief Administrative Officer, Morgan Stanley Investment Management Americas Distribution (2003–2008) | |
John Millette7 (1962) Vice President and Secretary, 1999–present | Director,3 Deutsche Asset & Wealth Management | |
Paul H. Schubert6 (1963) Chief Financial Officer, 2004–present Treasurer, 2005–present | Managing Director,3 Deutsche Asset & Wealth Management (since July 2004); formerly: Executive Director, Head of Mutual Fund Services and Treasurer for UBS Family of Funds (1998–2004); Vice President and Director of Mutual Fund Finance at UBS Global Asset Management (1994–1998) | |
Caroline Pearson7 (1962) Chief Legal Officer, 2010–present | Managing Director,3 Deutsche Asset & Wealth Management; formerly: Assistant Secretary for DWS family of funds (1997–2010) | |
Melinda Morrow6 (1970) Vice President, 2012–present | Director,3 Deutsche Asset & Wealth Management | |
Hepsen Uzcan7 (1974) Assistant Secretary, 2013–present | Vice President, Deutsche Asset & Wealth Management | |
Paul Antosca7 (1957) Assistant Treasurer, 2007–present | Director,3 Deutsche Asset & Wealth Management | |
Jack Clark7 (1967) Assistant Treasurer, 2007–present | Director,3 Deutsche Asset & Wealth Management | |
Diane Kenneally7 (1966) Assistant Treasurer, 2007–present | Director,3 Deutsche Asset & Wealth Management | |
John Caruso6 (1965) Anti-Money Laundering Compliance Officer, 2010–present | Managing Director,3 Deutsche Asset & Wealth Management | |
Robert Kloby6 (1962) Chief Compliance Officer, 2006–present | Managing Director,3 Deutsche Asset & Wealth Management | |
1 The length of time served represents the year in which the Board Member joined the board of one or more DWS funds currently overseen by the Board.
2 A publicly held company with securities registered pursuant to Section 12 of the Securities Exchange Act of 1934.
3 Executive title, not a board directorship.
4 As a result of their respective positions held with the Advisor, these individuals are considered "interested persons" of the Advisor within the meaning of the 1940 Act. Interested persons receive no compensation from the fund.
5 The length of time served represents the year in which the officer was first elected in such capacity for one or more DWS funds.
6 Address: 60 Wall Street, New York, NY 10005.
7 Address: One Beacon Street, Boston, MA 02108.
8 Address: 222 South Riverside Plaza, Chicago, IL 60606.
9 Effective as of December 1, 2013.
The fund's Statement of Additional Information ("SAI") includes additional information about the Board Members. The SAI is available, without charge, upon request. If you would like to request a copy of the SAI, you may do so by calling the following toll-free number: (800) 728-3337.
Notes

DWS Investments Distributors, Inc.
222 South Riverside Plaza
Chicago, IL 60606
(800) 621-1148
VS2AAA-2 (R-025824-3 2/14)
December 31, 2013
Annual Report
DWS Variable Series II
DWS Global Equity VIP
(formerly DWS Diversified International Equity VIP)
Contents
3 Performance Summary 4 Management Summary 5 Portfolio Summary 6 Investment Portfolio 9 Statement of Assets and Liabilities 10 Statement of Operations 10 Statement of Changes in Net Assets 12 Financial Highlights 13 Notes to Financial Statements 18 Report of Independent Registered Public Accounting Firm 19 Information About Your Fund's Expenses 20 Tax Information 20 Proxy Voting 21 Advisory Agreement Board Considerations and Fee Evaluation 24 Board Members and Officers |
This report must be preceded or accompanied by a prospectus. To obtain an additional prospectus or summary prospectus, if available, call (800) 728-3337 or your financial representative. We advise you to consider the Fund's objectives, risks, charges and expenses carefully before investing. The summary prospectus and prospectus contain this and other important information about the Fund. Please read the prospectus carefully before you invest.
Investing in derivatives entails special risks relating to liquidity, leverage and credit that may reduce returns and/or increase volatility. Investing in foreign securities, particularly those of emerging markets, presents certain risks, such as currency fluctuations, political and economic changes, and market risks. The Fund may lend securities to approved institutions. Stocks may decline in value. See the prospectus for details.
Deutsche Asset & Wealth Management represents the asset management and wealth management activities conducted by Deutsche Bank AG or any of its subsidiaries, including the Advisor and DWS Investments Distributors, Inc.
NOT FDIC/NCUA INSURED NO BANK GUARANTEE MAY LOSE VALUE NOT A DEPOSIT
NOT INSURED BY ANY FEDERAL GOVERNMENT AGENCY
Fund performance shown is historical, assumes reinvestment of all dividend and capital gain distributions and does not guarantee future results. Investment return and principal value fluctuate with changing market conditions so that, when redeemed, shares may be worth more or less than their original cost. Current performance may be lower or higher than the performance data quoted. Please contact your participating insurance company for the Fund's most recent month-end performance. Performance doesn't reflect charges and fees ("contract charges") associated with the separate account that invests in the Fund or any variable life insurance policy or variable annuity contract for which the Fund is an investment option. These charges and fees will reduce returns.
The gross expense ratio of the Fund, as stated in the fee table of the prospectus dated July 12, 2013 is 1.06% for Class A shares and may differ from the expense ratio disclosed in the Financial Highlights table in this report.
| Growth of an Assumed $10,000 Investment in DWS Global Equity VIP | ||
 | The MSCI All Country World Index is a free float-adjusted market capitalization weighted index that is designed to measure the equity market performance of developed and emerging markets. The index consists of 45 country indices comprising 24 developed and 21 emerging market country indices. On July 12, 2013 the MSCI All Country World Index replaced the MSCI EAFE Index as the fund's benchmark index because the Advisor believes that it more accurately reflects the fund's current investment strategy. The MSCI EAFE Index is an unmanaged index that tracks international stock performance in the 22 developed markets of Europe, Australasia and the Far East. Returns reflect reinvestment of dividends net of withholding taxes. The index is calculated using closing local market prices and translates into U.S. dollars using the London close foreign exchange rates. Index returns do not reflect any fees or expenses and it is not possible to invest directly into an index. | |
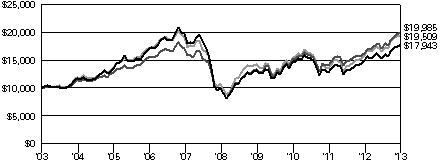 | ||
| Yearly periods ended December 31 | ||
| Comparative Results | |||||||||||||||||
| DWS Global Equity VIP | 1-Year | 3-Year | 5-Year | 10-Year | |||||||||||||
| Class A | Growth of $10,000 | $ | 11,931 | $ | 12,310 | $ | 17,665 | $ | 17,943 | ||||||||
| Average annual total return | 19.31 | % | 7.17 | % | 12.05 | % | 6.02 | % | |||||||||
| MSCI All Country World Index | Growth of $10,000 | $ | 12,280 | $ | 13,213 | $ | 20,042 | $ | 19,985 | ||||||||
| Average annual total return | 22.80 | % | 9.73 | % | 14.92 | % | 7.17 | % | |||||||||
| MSCI EAFE Index | Growth of $10,000 | $ | 12,278 | $ | 12,655 | $ | 17,969 | $ | 19,509 | ||||||||
| Average annual total return | 22.78 | % | 8.17 | % | 12.44 | % | 6.91 | % | |||||||||
The growth of $10,000 is cumulative.
Global equities delivered strong performance during 2013, as gauged by the 22.80% return of the Fund's benchmark, the MSCI All Country World Index.1 Class A shares of the Fund returned 19.31% (unadjusted for contract charges).
On July 12, 2013, the Fund's name changed from DWS Diversified International Equity VIP to DWS Global Equity VIP, reflecting a change in its strategy and management team. The Fund's benchmark switched from the MSCI EAFE Index to the MSCI All Country World Index at that time.2
Prior to the change in management, the Fund slightly underperformed the MSCI EAFE Index. The primary source of this shortfall was the Fund's position in two exchange-traded funds (ETFs) linked to the performance of the emerging markets: Vanguard FTSE Emerging Markets ETF and iShares MSCI Emerging Markets ETF.3 We sold both from the portfolio in July 2013.
After taking over the Fund, we modestly outperformed due to our strong stock selection in the consumer discretionary, health care and industrials sectors.4 The leading individual contributors in this interval were DNO International ASA and MasterCard, Inc., while the largest detractors were PT Indofood CBP Sukses Makmur Tbk and Swedish Match AB.
Our philosophy is that the stocks of companies with superior revenue and profit growth should outperform in an environment of sluggish global economic activity. Accordingly, our bottom-up strategy is geared toward identifying companies with sustainable, above-average growth that we believe can succeed irrespective of economic and market "noise."
Our global approach means that we have an extensive universe from which to select such growth companies. The emerging markets, and particularly the smaller markets within the emerging world, are home to a wealth of stocks with the growth characteristics we seek. Nevertheless, most of the portfolio is invested in companies domiciled in the developed markets. The majority of this allocation is invested in the United States and Europe, where we are identifying the best bottom-up opportunities. Conversely, we are finding fewer options in Japan. On a sector basis, our bottom-up approach has led us to establish overweight positions in the industrials, health care, consumer staples and information technology sectors, along with underweights in slower-growing areas such as utilities, telecommunication services, financials and energy.5,6
Overall, we believe our approach to companies with above-average earnings prospects provides an attractive option in an environment of anticipated sluggish growth for the world's developed economies.
Nils E. Ernst, PhD
Martin Berberich, CFA
Sebastian P. Werner, PhD
Portfolio Managers,
The views expressed reflect those of the portfolio management team only through the end of the period of the report as stated on the cover. The management team's views are subject to change at any time based on market and other conditions and should not be construed as a recommendation. Past performance is no guarantee of future results. Current and future portfolio holdings are subject to risk.
1 The MSCI All Country World Index tracks the performance of stocks in select developed markets around the world, including the United States.
2 The MSCI EAFE Index is an unmanaged, free-float-adjusted, market-capitalization index that tracks international stock performance in the 21 developed markets of Europe, Australasia and the Far East. The index is calculated using closing local market prices and translates into U.S. dollars using the London close foreign exchange rates.
Index returns do not reflect fees or expenses and it is not possible to invest directly into an index.
3 An exchange-traded fund (ETF) is a security that tracks an index or asset like an index fund, but trades like a stock on an exchange. The Vanguard FTSE Emerging Markets ETF invests in stocks of companies located in emerging markets around the world, such as Brazil, Russia, China, Korea and Taiwan. The fund seeks to track the return of the MSCI Emerging Markets Index over the long term. The iShares MSCI Emerging Markets ETF seeks to provide investment results that correspond generally to the price and yield performance, before fees and expenses, of publicly traded securities in emerging markets, as represented by the MSCI Emerging Markets Index.
4The consumer discretionary sector represents industries that produce goods and services that are not necessities in everyday life.
5 "Underweight" means the Fund holds a lower weighting in a given sector or security than the benchmark. "Overweight" means it holds a higher weighting.
6 Consumer staples are the industries that manufacture and sell products such as food and beverages, prescription drugs and household products.
Asset Allocation (As a % of Investment Portfolio excluding Securities Lending Collateral) | 12/31/13 | 12/31/12 |
| Common Stocks | 96% | 88% |
| Cash Equivalents | 3% | 2% |
| Participatory Notes | 1% | — |
| Exchange-Traded Funds | — | 10% |
| Preferred Stocks | — | 0% |
| 100% | 100% |
Sector Diversification (As a % of Common Stocks, Preferred Stocks and Participatory Notes) | 12/31/13 | 12/31/12 |
| Telecommunication Services | 13% | 15% |
| Health Care | 13% | 12% |
| Financials | 12% | 13% |
| Consumer Staples | 10% | 12% |
| Materials | 9% | 9% |
| Consumer Discretionary | 9% | 7% |
| Utilities | 9% | 8% |
| Information Technology | 9% | 12% |
| Industrials | 9% | 8% |
| Energy | 7% | 4% |
| 100% | 100% |
Geographical Diversification
(As a % of Investment Portfolio excluding Cash Equivalents and Securities Lending Collateral) | 12/31/13 | 12/31/12 |
| United States | 46% | — |
| Continental Europe | 32% | 54% |
| United Kingdom | 6% | 7% |
| Canada | 6% | 7% |
| Asia (excluding Japan) | 5% | 6% |
| Latin America | 1% | — |
| Japan | — | 12% |
| Emerging Markets | — | 10% |
| Australia | — | 4% |
| Other | 4% | — |
| 100% | 100% |
Portfolio holdings and characteristics are subject to change.
For more complete details about the Fund's investment portfolio, see page 6.
Following the Fund's fiscal first and third quarter-end, a complete portfolio holdings listing is filed with the SEC on Form N-Q. The form will be available on the SEC's Web site at sec.gov, and it also may be reviewed and copied at the SEC's Public Reference Room in Washington, D.C. Information on the operation of the SEC's Public Reference Room may be obtained by calling (800) SEC-0330. The Fund's portfolio holdings are also posted on dws-investments.com from time to time. Please see the Fund's current prospectus for more information.
| Shares | Value ($) | |||||||
| Common Stocks 95.0% | ||||||||
| Belgium 1.9% | ||||||||
| Anheuser-Busch InBev NV (Cost $963,260) | 13,000 | 1,386,112 | ||||||
| Canada 5.7% | ||||||||
| Agnico Eagle Mines Ltd. | 15,000 | 395,700 | ||||||
| Brookfield Asset Management, Inc. "A" | 39,000 | 1,513,372 | ||||||
| Canadian Oil Sands Ltd. | 35,000 | 658,320 | ||||||
| Canadian Pacific Railway Ltd. | 10,500 | 1,587,974 | ||||||
| (Cost $3,881,223) | 4,155,366 | |||||||
| Denmark 2.9% | ||||||||
| Coloplast AS "B" | 14,000 | 928,657 | ||||||
| DS Norden AS | 9,200 | 484,902 | ||||||
| William Demant Holding AS* | 7,400 | 719,481 | ||||||
| (Cost $1,853,352) | 2,133,040 | |||||||
| France 2.8% | ||||||||
| Edenred | 18,000 | 603,855 | ||||||
| LVMH Moet Hennessy Louis Vuitton SA | 2,000 | 366,122 | ||||||
| Pernod Ricard SA | 9,300 | 1,061,865 | ||||||
| (Cost $1,884,123) | 2,031,842 | |||||||
| Germany 3.1% | ||||||||
| BASF SE | 8,000 | 853,078 | ||||||
| Fresenius Medical Care AG & Co. KGaA | 16,400 | 1,167,188 | ||||||
| Stada Arzneimittel AG | 5,000 | 247,715 | ||||||
| (Cost $1,949,100) | 2,267,981 | |||||||
| Hong Kong 1.0% | ||||||||
| SA SA International Holdings Ltd. (Cost $665,277) | 610,000 | 716,400 | ||||||
| India 1.2% | ||||||||
| ICICI Bank Ltd. (ADR) (Cost $774,628) | 24,000 | 892,080 | ||||||
| Indonesia 0.9% | ||||||||
| PT Indofood CBP Sukses Makmur Tbk (Cost $865,926) | 770,000 | 646,177 | ||||||
| Ireland 3.8% | ||||||||
| Accenture PLC "A" (a) | 13,000 | 1,068,860 | ||||||
| Alkermes PLC* (b) | 6,500 | 264,290 | ||||||
| Experian PLC | 42,000 | 775,161 | ||||||
| Shire PLC | 14,000 | 659,704 | ||||||
| (Cost $2,345,519) | 2,768,015 | |||||||
| Italy 4.1% | ||||||||
| Moncler SpA* | 17,545 | 381,359 | ||||||
| Prada SpA | 73,000 | 648,553 | ||||||
| Sorin SpA* | 132,000 | 376,703 | ||||||
| Unipol Gruppo Finanziario SpA | 200,000 | 1,200,447 | ||||||
| World Duty Free SpA* | 28,400 | 357,696 | ||||||
| (Cost $2,371,116) | 2,964,758 | |||||||
| Luxembourg 1.0% | ||||||||
| Eurofins Scientific (Cost $654,124) | 2,800 | 758,264 | ||||||
| Shares | Value ($) | |||||||
| Malaysia 0.9% | ||||||||
| IHH Healthcare Bhd.* (Cost $729,173) | 560,000 | 660,416 | ||||||
| Mexico 1.3% | ||||||||
| Fomento Economico Mexicano SAB de CV (ADR) (Cost $959,587) | 9,500 | 929,765 | ||||||
| Netherlands 1.4% | ||||||||
| ASML Holding NV (Cost $510,738) | 11,000 | 1,032,956 | ||||||
| Norway 2.0% | ||||||||
| DNO International ASA* | 247,000 | 990,314 | ||||||
| Norsk Hydro ASA | 105,000 | 469,386 | ||||||
| (Cost $950,024) | 1,459,700 | |||||||
| Philippines 2.1% | ||||||||
| Metropolitan Bank & Trust Co. | 520,000 | 887,648 | ||||||
| Puregold Price Club, Inc. | 730,000 | 625,625 | ||||||
| (Cost $1,754,673) | 1,513,273 | |||||||
| Spain 0.7% | ||||||||
| Atresmedia Corp. de Medios de Comunicaion SA* (Cost $495,833) | 33,000 | 546,055 | ||||||
| Sweden 5.3% | ||||||||
| Atlas Copco AB "A" | 25,000 | 697,253 | ||||||
| Meda AB "A" | 33,000 | 419,586 | ||||||
| Svenska Cellulosa AB "B" | 32,000 | 988,670 | ||||||
| Swedish Match AB | 30,000 | 964,651 | ||||||
| Telefonaktiebolaget LM Ericsson "B" | 63,000 | 771,478 | ||||||
| (Cost $3,481,286) | 3,841,638 | |||||||
| Switzerland 3.8% | ||||||||
| DKSH Holding AG | 6,000 | 466,912 | ||||||
| Nestle SA (Registered) | 12,515 | 918,700 | ||||||
| Novartis AG (Registered) | 5,500 | 440,168 | ||||||
| Pentair Ltd. (Registered) (a) | 12,000 | 932,040 | ||||||
| (Cost $1,848,594) | 2,757,820 | |||||||
| Taiwan 0.7% | ||||||||
| Ginko International Co., Ltd. (Cost $502,623) | 27,000 | 510,556 | ||||||
| United Kingdom 5.0% | ||||||||
| Aberdeen Asset Management PLC | 123,000 | 1,024,322 | ||||||
| Aveva Group PLC | 22,000 | 790,150 | ||||||
| British American Tobacco PLC | 17,500 | 938,945 | ||||||
| Intertek Group PLC | 18,000 | 939,101 | ||||||
| (Cost $3,429,948) | 3,692,518 | |||||||
| United States 43.4% | ||||||||
| Actavis PLC* | 2,400 | 403,200 | ||||||
| ADT Corp. (c) | 9,000 | 364,230 | ||||||
| Aegerion Pharmaceuticals, Inc.* | 3,100 | 219,976 | ||||||
| Allergan, Inc. | 8,100 | 899,748 | ||||||
| Alliance Data Systems Corp.* (c) | 6,600 | 1,735,338 | ||||||
| Amgen, Inc. | 6,500 | 742,040 | ||||||
| Amphenol Corp. "A" | 17,000 | 1,516,060 | ||||||
| Beam, Inc. | 18,600 | 1,265,916 | ||||||
| Bristol-Myers Squibb Co. | 14,000 | 744,100 | ||||||
| Shares | Value ($) | |||||||
| CBRE Group, Inc. "A"* | 39,000 | 1,025,700 | ||||||
| Cerner Corp.* | 16,000 | 891,840 | ||||||
| Cheniere Energy Partners LP Holdings LLC* | 5,155 | 96,656 | ||||||
| Colfax Corp.* | 18,000 | 1,146,420 | ||||||
| Cynosure, Inc. "A"* | 14,000 | 373,520 | ||||||
| Danaher Corp. | 11,500 | 887,800 | ||||||
| Deckers Outdoor Corp.* (c) | 4,000 | 337,840 | ||||||
| DIRECTV* | 12,200 | 842,898 | ||||||
| Dynavax Technologies Corp.* (c) | 70,000 | 137,200 | ||||||
| eBay, Inc.* | 7,000 | 384,230 | ||||||
| Exxon Mobil Corp. | 8,000 | 809,600 | ||||||
| Google, Inc. "A"* | 700 | 784,497 | ||||||
| JPMorgan Chase & Co. | 27,000 | 1,578,960 | ||||||
| L Brands, Inc. | 13,000 | 804,050 | ||||||
| Las Vegas Sands Corp. | 16,000 | 1,261,920 | ||||||
| MasterCard, Inc. "A" | 2,100 | 1,754,466 | ||||||
| McDonald's Corp. | 9,000 | 873,270 | ||||||
| National Oilwell Varco, Inc. | 11,000 | 874,830 | ||||||
| Noble Energy, Inc. | 15,000 | 1,021,650 | ||||||
| NPS Pharmaceuticals, Inc.* | 6,800 | 206,448 | ||||||
| Orexigen Therapeutics, Inc.* (c) | 24,500 | 137,935 | ||||||
| Pall Corp. | 12,000 | 1,024,200 | ||||||
| Praxair, Inc. | 11,000 | 1,430,330 | ||||||
| Precision Castparts Corp. | 5,500 | 1,481,150 | ||||||
| Schlumberger Ltd. | 8,500 | 765,935 | ||||||
| Tractor Supply Co. | 10,000 | 775,800 | ||||||
| Trimble Navigation Ltd.* | 28,400 | 985,480 | ||||||
| United Technologies Corp. | 9,500 | 1,081,100 | ||||||
| (Cost $27,565,401) | 31,666,333 | |||||||
Total Common Stocks (Cost $60,435,528) | 69,331,065 | |||||||
| Shares | Value ($) | |||||||
| Participatory Note 1.4% | ||||||||
| Nigeria | ||||||||
| Zenith Bank PLC (issuer Merrill Lynch International) Expiration Date 8/21/2015 (Cost $811,200) | 6,000,000 | 1,027,824 | ||||||
| Securities Lending Collateral 3.6% | ||||||||
| Daily Assets Fund Institutional, 0.08% (d) (e) (Cost $2,611,010) | 2,611,010 | 2,611,010 | ||||||
| Cash Equivalents 3.4% | ||||||||
| Central Cash Management Fund, 0.05% (d) (Cost $2,485,024) | 2,485,024 | 2,485,024 | ||||||
| % of Net Assets | Value ($) | |||||||
Total Investment Portfolio (Cost $66,342,762)† | 103.4 | 75,454,923 | ||||||
| Other Assets and Liabilities, Net | (3.4 | ) | (2,467,448 | ) | ||||
| Net Assets | 100.0 | 72,987,475 | ||||||
* Non-income producing security.
† The cost for federal income tax purposes was $66,342,796. At December 31, 2013, net unrealized appreciation for all securities based on tax cost was $9,112,127. This consisted of aggregate gross unrealized appreciation for all securities in which there was an excess of value over tax cost of $10,159,863 and aggregate gross unrealized depreciation for all securities in which there was an excess of tax cost over value of $1,047,736.
(a) Listed on the New York Stock Exchange.
(b) Listed on the NASDAQ Stock Market, Inc.
(c) All or a portion of these securities were on loan. In addition, "Other Assets and Liabilities, Net" may include pending sales that are also on loan. The value of securities loaned at December 31, 2013 amounted to $2,553,543, which is 3.5% of net assets.
(d) Affiliated fund managed by Deutsche Investment Management Americas Inc. The rate shown is the annualized seven-day yield at period end.
(e) Represents collateral held in connection with securities lending. Income earned by the Fund is net of borrower rebates.
ADR: American Depositary Receipt
Fair Value Measurements
Various inputs are used in determining the value of the Fund's investments. These inputs are summarized in three broad levels. Level 1 includes quoted prices in active markets for identical securities. Level 2 includes other significant observable inputs (including quoted prices for similar securities, interest rates, prepayment speeds and credit risk). Level 3 includes significant unobservable inputs (including the Fund's own assumptions in determining the fair value of investments). The level assigned to the securities valuations may not be an indication of the risk or liquidity associated with investing in those securities.
The following is a summary of the inputs used as of December 31, 2013 in valuing the Fund's investments. For information on the Fund's policy regarding the valuation of investments, please refer to the Security Valuation section of Note A in the accompanying Notes to Financial Statements.
| Assets | Level 1 | Level 2 | Level 3 | Total | ||||||||||||
| Common Stocks (f) | ||||||||||||||||
| Belgium | $ | — | $ | 1,386,112 | $ | — | $ | 1,386,112 | ||||||||
| Canada | 4,155,366 | — | — | 4,155,366 | ||||||||||||
| Denmark | — | 2,133,040 | — | 2,133,040 | ||||||||||||
| France | — | 2,031,842 | — | 2,031,842 | ||||||||||||
| Germany | — | 2,267,981 | — | 2,267,981 | ||||||||||||
| Hong Kong | — | 716,400 | — | 716,400 | ||||||||||||
| India | 892,080 | — | — | 892,080 | ||||||||||||
| Indonesia | — | 646,177 | — | 646,177 | ||||||||||||
| Ireland | 1,333,150 | 1,434,865 | — | 2,768,015 | ||||||||||||
| Italy | — | 2,964,758 | — | 2,964,758 | ||||||||||||
| Luxembourg | — | 758,264 | — | 758,264 | ||||||||||||
| Malaysia | — | 660,416 | — | 660,416 | ||||||||||||
| Mexico | 929,765 | — | — | 929,765 | ||||||||||||
| Netherlands | — | 1,032,956 | — | 1,032,956 | ||||||||||||
| Norway | — | 1,459,700 | — | 1,459,700 | ||||||||||||
| Philippines | — | 1,513,273 | — | 1,513,273 | ||||||||||||
| Spain | — | 546,055 | — | 546,055 | ||||||||||||
| Sweden | — | 3,841,638 | — | 3,841,638 | ||||||||||||
| Switzerland | 932,040 | 1,825,780 | — | 2,757,820 | ||||||||||||
| Taiwan | — | 510,556 | — | 510,556 | ||||||||||||
| United Kingdom | — | 3,692,518 | — | 3,692,518 | ||||||||||||
| United States | 31,666,333 | — | — | 31,666,333 | ||||||||||||
| Participatory Notes | — | 1,027,824 | — | 1,027,824 | ||||||||||||
| Short-Term Investments (f) | 5,096,034 | — | — | 5,096,034 | ||||||||||||
| Total | $ | 45,004,768 | $ | 30,450,155 | $ | — | $ | 75,454,923 | ||||||||
There have been no transfers between fair value measurement levels during the year ended December 31, 2013.
(f) See Investment Portfolio for additional detailed categorizations.
The accompanying notes are an integral part of the financial statements.
| as of December 31, 2013 | ||||
| Assets | ||||
Investments: Investments in non-affiliated securities, at value (cost $61,246,728) — including $2,553,543 of securities loaned | $ | 70,358,889 | ||
| Investment in Daily Assets Fund Institutional (cost $2,611,010)* | 2,611,010 | |||
| Investment in Central Cash Management Fund (cost $2,485,024) | 2,485,024 | |||
| Total investments in securities, at value (cost $66,342,762) | 75,454,923 | |||
| Foreign currency, at value (cost $129,901) | 126,571 | |||
| Receivable for Fund shares sold | 27 | |||
| Dividends receivable | 65,911 | |||
| Interest receivable | 1,136 | |||
| Foreign taxes recoverable | 65,968 | |||
| Other assets | 1,379 | |||
| Total assets | 75,715,915 | |||
| Liabilities | ||||
| Cash overdraft | 289 | |||
| Payable upon return of securities loaned | 2,611,010 | |||
| Payable for Fund shares redeemed | 36,642 | |||
| Accrued management fee | 33,422 | |||
| Accrued Trustees' fees | 1,483 | |||
| Other accrued expenses and payables | 45,594 | |||
| Total liabilities | 2,728,440 | |||
| Net assets, at value | $ | 72,987,475 | ||
| Net Assets Consist of | ||||
| Undistributed net investment income | 1,217,770 | |||
Net unrealized appreciation (depreciation) on: Investments | 9,112,161 | |||
| Foreign currency | (578 | ) | ||
| Accumulated net realized gain (loss) | (47,522,922 | ) | ||
| Paid-in capital | 110,181,044 | |||
| Net assets, at value | $ | 72,987,475 | ||
Class A Net Asset Value, offering and redemption price per share ($72,987,475 ÷ 7,869,570 outstanding shares of beneficial interest, no par value, unlimited number of shares authorized) | $ | 9.27 | ||
* Represents collateral on securities loaned.
The accompanying notes are an integral part of the financial statements.
Statement of Operations
| for the year ended December 31, 2013 | ||||
| Investment Income | ||||
Income: Dividends (net of foreign taxes withheld of $178,600) | $ | 1,801,122 | ||
| Interest | 414 | |||
| Income distributions — Central Cash Management Fund | 1,203 | |||
| Securities lending income, including income from Daily Assets Fund Institutional, net of borrower rebates | 60,811 | |||
| Total income | 1,863,550 | |||
Expenses: Management fee | 450,754 | |||
| Administration fee | 69,347 | |||
| Services to shareholders | 945 | |||
| Custodian fee | 59,468 | |||
| Audit and tax fees | 60,102 | |||
| Legal fees | 15,351 | |||
| Reports to shareholders | 38,871 | |||
| Trustees' fees and expenses | 4,674 | |||
| Other | 32,744 | |||
| Total expenses before expense reductions | 732,256 | |||
| Expense reductions | (43,599 | ) | ||
| Total expenses after expense reductions | 688,657 | |||
| Net investment income | 1,174,893 | |||
| Realized and Unrealized Gain (Loss) | ||||
Net realized gain (loss) from: Investments | 17,284,356 | |||
| Futures | 81,726 | |||
| Foreign currency | (13,289 | ) | ||
| 17,352,793 | ||||
Change in net unrealized appreciation (depreciation) on: Investments | (6,257,752 | ) | ||
| Futures | (4,080 | ) | ||
| Foreign currency | (606 | ) | ||
| (6,262,438 | ) | |||
| Net gain (loss) | 11,090,355 | |||
| Net increase (decrease) in net assets resulting from operations | $ | 12,265,248 | ||
The accompanying notes are an integral part of the financial statements.
| Years Ended December 31, | ||||||||
| Increase (Decrease) in Net Assets | 2013 | 2012 | ||||||
Operations: Net investment income | $ | 1,174,893 | $ | 1,605,589 | ||||
| Net realized gain (loss) | 17,352,793 | 337,693 | ||||||
| Change in net unrealized appreciation (depreciation) | (6,262,438 | ) | 8,562,569 | |||||
| Net increase (decrease) in net assets resulting from operations | 12,265,248 | 10,505,851 | ||||||
Distributions to shareholders from: Net investment income: Class A | (1,676,904 | ) | (1,885,705 | ) | ||||
| Total distributions | (1,676,904 | ) | (1,885,705 | ) | ||||
Fund share transactions: Class A Proceeds from shares sold | 3,395,869 | 2,442,886 | ||||||
| Reinvestment of distributions | 1,676,904 | 1,885,705 | ||||||
| Payments for shares redeemed | (9,660,444 | ) | (10,767,707 | ) | ||||
| Net increase (decrease) in net assets from Class A share transactions | (4,587,671 | ) | (6,439,116 | ) | ||||
| Increase (decrease) in net assets | 6,000,673 | 2,181,030 | ||||||
| Net assets at beginning of period | 66,986,802 | 64,805,772 | ||||||
| Net assets at end of period (including undistributed net investment income of $1,217,770 and $1,530,737, respectively) | $ | 72,987,475 | $ | 66,986,802 | ||||
| Other Information | ||||||||
Class A Shares outstanding at beginning of period | 8,411,945 | 9,288,789 | ||||||
| Shares sold | 404,553 | 334,743 | ||||||
| Shares issued to shareholders in reinvestment of distributions | 202,770 | 258,316 | ||||||
| Shares redeemed | (1,149,698 | ) | (1,469,903 | ) | ||||
| Net increase (decrease) in Class A shares | (542,375 | ) | (876,844 | ) | ||||
| Shares outstanding at end of period | 7,869,570 | 8,411,945 | ||||||
The accompanying notes are an integral part of the financial statements.
| Years Ended December 31, | |||||||||||||||||||||
| Class A | 2013 | 2012 | 2011 | 2010 | 2009 | ||||||||||||||||
| Selected Per Share Data | |||||||||||||||||||||
| Net asset value, beginning of period | $ | 7.96 | $ | 6.98 | $ | 8.08 | $ | 7.45 | $ | 6.22 | |||||||||||
Income (loss) from investment operations: Net investment incomea | .14 | .18 | .19 | .14 | .12 | ||||||||||||||||
| Net realized and unrealized gain (loss) | 1.37 | 1.01 | (1.14 | ) | .66 | 1.51 | |||||||||||||||
| Total from investment operations | 1.51 | 1.19 | (.95 | ) | .80 | 1.63 | |||||||||||||||
Less distributions from: Net investment income | (.20 | ) | (.21 | ) | (.15 | ) | (.17 | ) | (.40 | ) | |||||||||||
| Total distributions | (.20 | ) | (.21 | ) | (.15 | ) | (.17 | ) | (.40 | ) | |||||||||||
| Net asset value, end of period | $ | 9.27 | $ | 7.96 | $ | 6.98 | $ | 8.08 | $ | 7.45 | |||||||||||
| Total Return (%) | 19.31 | b | 17.34 | (12.07 | ) | 10.93 | 29.36 | ||||||||||||||
| Ratios to Average Net Assets and Supplemental Data | |||||||||||||||||||||
| Net assets, end of period ($ millions) | 73 | 67 | 65 | 83 | 86 | ||||||||||||||||
| Ratio of expenses before expense reductions (%) | 1.06 | 1.02 | 1.03 | .99 | .94 | ||||||||||||||||
| Ratio of expenses after expense reductions (%) | .99 | 1.02 | 1.03 | .99 | .94 | ||||||||||||||||
| Ratio of net investment income (%) | 1.69 | 2.46 | 2.44 | 1.90 | 1.89 | ||||||||||||||||
| Portfolio turnover rate (%) | 139 | 18 | 26 | 14 | 139 | ||||||||||||||||
a Based on average shares outstanding during the period. b Total return would have been lower had certain expenses not been reimbursed. | |||||||||||||||||||||
A. Organization and Significant Accounting Policies
DWS Global Equity VIP (formerly DWS Diversified International Equity VIP) (the "Fund") is a diversified series of DWS Variable Series II (the "Trust"), which is registered under the Investment Company Act of 1940, as amended (the "1940 Act"), as an open-end management investment company organized as a Massachusetts business trust.
The Fund's financial statements are prepared in accordance with accounting principles generally accepted in the United States of America which require the use of management estimates. Actual results could differ from those estimates. The policies described below are followed consistently by the Fund in the preparation of its financial statements.
Security Valuation. Investments are stated at value determined as of the close of regular trading on the New York Stock Exchange on each day the exchange is open for trading.
Various inputs are used in determining the value of the Fund's investments. These inputs are summarized in three broad levels. Level 1 includes quoted prices in active markets for identical securities. Level 2 includes other significant observable inputs (including quoted prices for similar securities, interest rates, prepayment speeds and credit risk). Level 3 includes significant unobservable inputs (including the Fund's own assumptions in determining the fair value of investments). The level assigned to the securities valuations may not be an indication of the risk or liquidity associated with investing in those securities.
Equity securities are valued at the most recent sale price or official closing price reported on the exchange (U.S. or foreign) or over-the-counter market on which they trade. Securities for which no sales are reported are valued at the calculated mean between the most recent bid and asked quotations on the relevant market or, if a mean cannot be determined, at the most recent bid quotation. Equity securities are generally categorized as Level 1. For certain international equity securities, in order to adjust for events which may occur between the close of the foreign exchanges and the close of the New York Stock Exchange, a fair valuation model may be used. This fair valuation model takes into account comparisons to the valuation of American Depository Receipts (ADRs), futures contracts and certain indices and these securities are categorized as Level 2.
Futures contracts are generally valued at the settlement prices established each day on the exchange on which they are traded and are categorized as Level 1.
Investments in open-end investment companies are valued at their net asset value each business day and are categorized as Level 1.
Securities and other assets for which market quotations are not readily available or for which the above valuation procedures are deemed not to reflect fair value are valued in a manner that is intended to reflect their fair value as determined in accordance with procedures approved by the Board and are generally categorized as Level 3. In accordance with the Fund's valuation procedures, factors used in determining value may include, but are not limited to, the type of the security; the size of the holding; the initial cost of the security; the existence of any contractual restrictions on the security's disposition; the price and extent of public trading in similar securities of the issuer or of comparable companies; quotations or evaluated prices from broker-dealers and/or pricing services; information obtained from the issuer, analysts, and/or the appropriate stock exchange (for exchange-traded securities); an analysis of the company's or issuer's financial statements; an evaluation of the forces that influence the issuer and the market(s) in which the security is purchased and sold; and with respect to debt securities, the maturity, coupon, creditworthiness, currency denomination and the movement of the market in which the security is normally traded. The value determined under these procedures may differ from published values for the same securities.
Disclosure about the classification of fair value measurements is included in a table following the Fund's Investment Portfolio.
Participatory Notes. The Fund invests in Participatory Notes (P-Notes). P-Notes are promissory notes designed to offer a return linked to the performance of a particular underlying equity security or market. P-Notes are issued by banks or broker-dealers and allow the Fund to gain exposure to local shares in foreign markets. Investments in P-Notes involve the same risks associated with a direct investment in the underlying foreign companies or foreign markets that they seek to replicate. Although each participation note is structured with a defined maturity date, early redemption may be possible. Risks associated with participation notes include the possible failure of a counterparty to perform in accordance with the terms of the agreement and potential delays or an inability to redeem before maturity under certain market conditions.
Securities Lending. Deutsche Bank AG, as lending agent, lends securities of the Fund to certain financial institutions under the terms of the Security Lending Agreement. The Fund retains the benefits of owning the securities it has loaned and continues to receive interest and dividends generated by the securities and to participate in any changes in their market value. The Fund requires the borrowers of the securities to maintain collateral with the Fund consisting of either cash or liquid, unencumbered assets having a value at least equal to the value of the securities loaned. When the collateral falls below specified amounts, the lending agent will use its best effort to obtain additional collateral on the next business day to meet required amounts under the security lending agreement. The Fund may invest the cash collateral into a joint trading account in an affiliated money market fund pursuant to Exemptive Orders issued by the SEC. The Fund receives compensation for lending its securities either in the form of fees or by earning interest on invested cash collateral net of borrower rebates and fees paid to a lending agent. Either the Fund or the borrower may terminate the loan. There may be risks of delay and costs in recovery of securities or even loss of rights in the collateral should the borrower of the securities fail financially. If the Fund is not able to recover securities lent, the Fund may sell the collateral and purchase a replacement investment in the market, incurring the risk that the value of the replacement security is greater than the value of the collateral. The Fund is also subject to all investment risks associated with the reinvestment of any cash collateral received, including, but not limited to, interest rate, credit and liquidity risk associated with such investments.
As of December 31, 2013, the Fund had securities on loan. The value of the related collateral exceeded the value of the securities loaned at period end.
Foreign Currency Translations. The books and records of the Fund are maintained in U.S. dollars. Investment securities and other assets and liabilities denominated in a foreign currency are translated into U.S. dollars at the prevailing exchange rates at period end. Purchases and sales of investment securities, income and expenses are translated into U.S. dollars at the prevailing exchange rates on the respective dates of the transactions.
Net realized and unrealized gains and losses on foreign currency transactions represent net gains and losses between trade and settlement dates on securities transactions, the acquisition and disposition of foreign currencies, and the difference between the amount of net investment income accrued and the U.S. dollar amount actually received. That portion of both realized and unrealized gains and losses on investments that results from fluctuations in foreign currency exchange rates is not separately disclosed but is included with net realized and unrealized gain/appreciation and loss/depreciation on investments.
Taxes. The Fund's policy is to comply with the requirements of the Internal Revenue Code, as amended, which are applicable to regulated investment companies, and to distribute all of its taxable income to its shareholders.
Additionally, the Fund may be subject to taxes imposed by the governments of countries in which it invests and are generally based on income and/or capital gains earned or repatriated. Estimated tax liabilities on certain foreign securities are recorded on an accrual basis and are reflected as components of interest income or net change in unrealized gain/loss on investments. Tax liabilities realized as a result of security sales are reflected as a component of net realized gain/loss on investments.
Under the Regulated Investment Company Modernization Act of 2010, net capital losses incurred post-enactment may be carried forward indefinitely, and their character is retained as short-term and/or long-term. Previously, net capital losses were carried forward for eight years and treated as short-term losses. As a transition rule, the Act requires that post-enactment net capital losses be used before pre-enactment net capital losses.
At December 31, 2013, the Fund had a net tax basis capital loss carryforward of approximately $47,342,000 of pre-enactment losses, which may be applied against any realized net taxable capital gains of each succeeding year until fully utilized or until December 31, 2016 ($8,178,000) and December 31, 2017 ($39,164,000), the respective expiration dates, whichever occurs first.
In addition, from November 1, 2013 through December 31, 2013, the Fund elected to defer qualified late year losses of approximately $36,000 of net long-term realized capital losses and $145,000 of net short-term capital losses and treat them as arising in the fiscal year ending December 31, 2014.
The Fund has reviewed the tax positions for the open tax years as of December 31, 2013 and has determined that no provision for income tax is required in the Fund's financial statements. The Fund's federal tax returns for the prior three fiscal years remain open subject to examination by the Internal Revenue Service.
Distribution of Income and Gains. Distributions from net investment income of the Fund, if any, are declared and distributed to shareholders annually. Net realized gains from investment transactions, in excess of available capital loss carryforwards, would be taxable to the Fund if not distributed and, therefore, will be distributed to shareholders at least annually. The Fund may also make additional distributions for tax purposes if necessary.
The timing and characterization of certain income and capital gain distributions are determined annually in accordance with federal tax regulations which may differ from accounting principles generally accepted in the United States of America. These differences primarily relate to investments in foreign denominated investments, investments in futures contracts, income received from passive foreign investment companies and and certain securities sold at a loss. As a result, net investment income (loss) and net realized gain (loss) on investment transactions for a reporting period may differ significantly from distributions during such period. Accordingly, the Fund may periodically make reclassifications among certain of its capital accounts without impacting the net asset value of the Fund.
At December 31, 2013, the Fund's components of distributable earnings on a tax basis were as follows:
| Undistributed ordinary income* | $ | 1,217,770 | ||
| Capital loss carryforwards | $ | (47,342,000 | ) | |
| Unrealized appreciation (depreciation) on investments | $ | 9,112,127 |
In addition, the tax character of distributions paid by the Fund is summarized as follows:
| Years Ended December 31, | ||||||||
| 2013 | 2012 | |||||||
| Distributions from ordinary income* | $ | 1,676,904 | $ | 1,885,705 | ||||
* For tax purposes, short-term capital gain distributions are considered ordinary income distributions.
Expenses. Expenses of the Trust arising in connection with a specific fund are allocated to that fund. Other Trust expenses which cannot be directly attributed to a fund are apportioned among the funds in the Trust based upon the relative net assets or other appropriate measures.
Contingencies. In the normal course of business, the Fund may enter into contracts with service providers that contain general indemnification clauses. The Fund's maximum exposure under these arrangements is unknown as this would involve future claims that may be made against the Fund that have not yet been made. However, based on experience, the Fund expects the risk of loss to be remote.
Other. Investment transactions are accounted for on a trade date plus one basis for daily net asset value calculations. However, for financial reporting purposes, investment transactions are reported on trade date. Interest income is recorded on the accrual basis. Dividend income is recorded on the ex-dividend date net of foreign withholding taxes. Certain dividends from foreign securities may be recorded subsequent to the ex-dividend date as soon as the Fund is informed of such dividends. Realized gains and losses from investment transactions are recorded on an identified cost basis. Proceeds from litigation payments, if any, are included in net realized gain (loss) from investments.
B. Derivative Instruments
Futures Contracts. A futures contract is an agreement between a buyer or seller and an established futures exchange or its clearinghouse in which the buyer or seller agrees to take or make a delivery of a specific amount of a financial instrument at a specified price on a specific date (settlement date). For the year ended December 31, 2013, the Fund entered into futures contracts as a means of gaining exposure to a particular asset class or to keep cash on hand to meet shareholder redemptions or other needs while maintaining exposure to the market.
Upon entering into a futures contract, the Fund is required to deposit with a financial intermediary cash or securities ("initial margin") in an amount equal to a certain percentage of the face value indicated in the futures contract. Subsequent payments ("variation margin") are made or received by the Fund dependent upon the daily fluctuations in the value and are recorded for financial reporting purposes as unrealized gains or losses by the Fund. Gains or losses are realized when the contract expires or is closed. Since all futures contracts are exchange-traded, counterparty risk is minimized as the exchange's clearinghouse acts as the counterparty, and guarantees the futures against default.
Certain risks may arise upon entering into futures contracts, including the risk that an illiquid market will limit the Fund's ability to close out a futures contract prior to the settlement date and the risk that the futures contract is not well correlated with the security, index or currency to which it relates. Risk of loss may exceed amounts disclosed in the Statement of Assets and Liabilities.
There are no open futures contracts as of December 31, 2013. For the year ended December 31, 2013, the investment in futures contracts purchased had a total notional value generally indicative of a range from $0 to approximately $1,699,000.
The amount of unrealized and realized gains and losses on derivative instruments recognized in Fund earnings during the year ended December 31, 2013 and the related location in the accompanying Statement of Operations is summarized in the following tables by primary underlying risk exposure:
| Realized Gain (Loss) | Futures Contracts | |||
| Equity Contracts (a) | $ | 81,726 | ||
The above derivative is located in the following Statement of Operations account: (a) Net realized gain (loss) from futures | ||||
| Change in Net Unrealized Appreciation (Depreciation) | Futures Contracts | |||
| Equity Contracts (a) | $ | (4,080 | ) | |
The above derivative is located in the following Statement of Operations account: (a) Change in net unrealized appreciation (depreciation) on futures | ||||
C. Purchases and Sales of Securities
During the year ended December 31, 2013, purchases and sales of investment transactions (excluding short-term investments) aggregated $93,354,290 and $98,812,848, respectively.
D. Related Parties
Management Agreement. Under the Investment Management Agreement with Deutsche Investment Management Americas Inc. ("DIMA" or the "Advisor"), an indirect, wholly owned subsidiary of Deutsche Bank AG, the Advisor directs the investments of the Fund in accordance with its investment objectives, policies and restrictions. The Advisor determines the securities, instruments and other contracts relating to investments to be purchased, sold or entered into by the Fund or delegates such responsibility to the Fund's subadvisor.
Prior to July 12, 2013, QS Investors, LLC ("QS Investors") acted as an investment subadvisor to the Fund. As an investment subadvisor, QS Investors rendered strategic asset allocation services and managed the portion of assets allocated from time to time to the Fund's global tactical asset allocation overlay strategy. QS Investors was paid by the Advisor for the services QS Investors provided to the Fund. Effective July 12, 2013, QS Investors no longer acted as subadvisor to the Fund and day-to-day portfolio management of the Fund transitioned to DIMA.
Pursuant to the Investment Management Agreement with the Advisor, the Fund pays a monthly management fee based on the Fund's average daily net assets, computed and accrued daily and payable monthly, at the following annual rates:
| First $1.5 billion | .650 | % | ||
| Next $1.75 billion | .635 | % | ||
| Next $1.75 billion | .620 | % | ||
| Over $5 billion | .605 | % |
For the period from January 1, 2013 through September 30, 2013, the Advisor had contractually agreed to waive its fees and/or reimburse certain operating expenses to the extent necessary to maintain the operating expenses (excluding certain expenses such as extraordinary expenses, taxes, brokerage and interest expense) of Class A shares at 0.99%.
Effective October 1, 2013 through September 30, 2014, the Advisor has contractually agreed to waive its fee and/or reimburse certain operating expenses to the extent necessary to maintain the operating expenses (excluding certain expenses such as extraordinary expenses, taxes, brokerage and interest expense) of Class A shares at 1.00%.
Accordingly, for the year ended December 31, 2013, the Advisor waived a portion of its management fee pursuant to the Investment Management Agreement aggregating $43,488, and the amount charged aggregated $407,266, which was equivalent to an annual effective rate of 0.59% of the Fund's average daily net assets.
Administration Fee. Pursuant to an Administrative Services Agreement, DIMA provides most administrative services to the Fund. For all services provided under the Administrative Services Agreement, the Fund pays DIMA an annual fee ("Administration Fee") of 0.10% of the Fund's average daily net assets, computed and accrued daily and payable monthly. For the year ended December 31, 2013, the Administration Fee was $69,347, of which $6,032 is unpaid.
Service Provider Fees. DWS Investments Service Company ("DISC"), an affiliate of the Advisor, is the transfer agent, dividend-paying agent and shareholder service agent for the Fund. Pursuant to a sub-transfer agency agreement between DISC and DST Systems, Inc. ("DST"), DISC has delegated certain transfer agent, dividend-paying agent and shareholder service agent functions to DST. DISC compensates DST out of the shareholder servicing fee it receives from the Fund. For the year ended December 31, 2013, the amounts charged to the Fund by DISC aggregated $111, all of which was waived.
Typesetting and Filing Service Fees. Under an agreement with DIMA, DIMA is compensated for providing typesetting and certain regulatory filing services to the Fund. For the year ended December 31, 2013, the amount charged to the Fund by DIMA included in the Statement of Operations under "reports to shareholders" aggregated $20,577, of which $5,348 is unpaid.
Trustees' Fees and Expenses. The Fund paid retainer fees to each Trustee not affiliated with the Advisor, plus specified amounts to the Board Chairperson and Vice Chairperson and to each committee Chairperson.
Affiliated Cash Management Vehicles. The Fund may invest uninvested cash balances in Central Cash Management Fund and DWS Variable NAV Money Fund, affiliated money market funds which are managed by the Advisor. Each affiliated money market fund seeks to provide a high level of current income consistent with liquidity and the preservation of capital. Each affiliated money market fund is managed in accordance with Rule 2a-7 under the Investment Company Act of 1940, which governs the quality, maturity, diversity and liquidity of instruments in which a money market fund may invest. Central Cash Management Fund seeks to maintain a stable net asset value, and DWS Variable NAV Money Fund maintains a floating net asset value. The Fund indirectly bears its proportionate share of the expenses of each affiliated money market fund in which it invests. Central Cash Management Fund does not pay the Advisor an investment management fee. To the extent that DWS Variable NAV Money Fund pays an investment management fee to the Advisor, the Advisor will waive an amount of the investment management fee payable to the Advisor by the Fund equal to the amount of the investment management fee payable on the Fund's assets invested in DWS Variable NAV Money Fund.
Securities Lending Fees. Effective February 7, 2013, Deutsche Bank AG serves as lending agent for the Fund. For the period from February 7, 2013 through December 31, 2013, the Fund incurred lending agent fees to Deutsche Bank AG in the amount of $6,571.
E. Ownership of the Fund
At December 31, 2013, three participating insurance companies were owners of record of 10% or more of the total outstanding Class A shares of the Fund, each owning 48%, 28% and 24%.
F. Line of Credit
The Fund and other affiliated funds (the "Participants") share in a $375 million revolving credit facility provided by a syndication of banks. The Fund may borrow for temporary or emergency purposes, including the meeting of redemption requests that otherwise might require the untimely disposition of securities. The Participants are charged an annual commitment fee which is allocated based on net assets, among each of the Participants. Interest is calculated at a rate per annum equal to the sum of the Federal Funds Rate plus 1.25 percent plus if LIBOR exceeds the Federal Funds Rate the amount of such excess. The Fund may borrow up to a maximum of 33 percent of its net assets under the agreement. The Fund had no outstanding loans at December 31, 2013.
To the Board of Trustees of DWS Variable Series II and Shareholders of DWS Global Equity VIP:
We have audited the accompanying statement of assets and liabilities, including the investment portfolio of DWS Global Equity VIP (formerly, DWS Diversified International Equity VIP) (the "Fund") (one of the funds constituting DWS Variable Series II), as of December 31, 2013, and the related statement of operations for the year then ended, the statements of changes in net assets for each of the two years in the period then ended, and the financial highlights for each of the five years in the period then ended. These financial statements and financial highlights are the responsibility of the Fund's management. Our responsibility is to express an opinion on these financial statements and financial highlights based on our audits.
We conducted our audits in accordance with the standards of the Public Company Accounting Oversight Board (United States). Those standards require that we plan and perform the audit to obtain reasonable assurance about whether the financial statements and financial highlights are free of material misstatement. We were not engaged to perform an audit of the Fund's internal control over financial reporting. Our audits included consideration of internal control over financial reporting as a basis for designing audit procedures that are appropriate in the circumstances, but not for the purpose of expressing an opinion on the effectiveness of the Fund's internal control over financial reporting. Accordingly, we express no such opinion. An audit also includes examining, on a test basis, evidence supporting the amounts and disclosures in the financial statements and financial highlights, assessing the accounting principles used and significant estimates made by management, and evaluating the overall financial statement presentation. Our procedures included confirmation of securities owned as of December 31, 2013, by correspondence with the custodian and brokers. We believe that our audits provide a reasonable basis for our opinion.
In our opinion, the financial statements and financial highlights referred to above present fairly, in all material respects, the financial position of DWS Global Equity VIP (formerly, DWS Diversified International Equity VIP) (one of funds constituting DWS Variable Series II) at December 31, 2013, the results of its operations for the year then ended, the changes in its net assets for each of the two years in the period then ended, and the financial highlights for each of the five years in the period then ended, in conformity with U.S. generally accepted accounting principles.
| ||
Boston, Massachusetts February 14, 2014 |
As an investor of the Fund, you incur two types of costs: ongoing expenses and transaction costs. Ongoing expenses include management fees and other Fund expenses. Examples of transaction costs include contract charges and account maintenance fees, which are not shown in this section. The following tables are intended to help you understand your ongoing expenses (in dollars) of investing in the Fund and to help you compare these expenses with the ongoing expenses of investing in other mutual funds. In the most recent six-month period, the Fund limited these expenses, had it not done so, expenses would have ben higher. The example in the table is based on an investment of $1,000 invested at the beginning of the six-month period and held for the entire period (July 1, 2013 to December 31, 2013).
The tables illustrate your Fund's expenses in two ways:
—Actual Fund Return. This helps you estimate the actual dollar amount of ongoing expenses (but not transaction costs) paid on a $1,000 investment in the Fund using the Fund's actual return during the period. To estimate the expenses you paid over the period, simply divide your account value by $1,000 (for example, an $8,600 account value divided by $1,000 = 8.6), then multiply the result by the number in the "Expenses Paid per $1,000" line under the share class you hold.
— Hypothetical 5% Fund Return. This helps you to compare your Fund's ongoing expenses (but not transaction costs) with those of other mutual funds using the Fund's actual expense ratio and a hypothetical rate of return of 5% per year before expenses. Examples using a 5% hypothetical Fund return may be found in the shareholder reports of other mutual funds. The hypothetical account values and expenses may not be used to estimate the actual ending account balance or expenses you paid for the period.
Please note that the expenses shown in these tables are meant to highlight your ongoing expenses only and do not reflect any transaction costs. The "Expenses Paid per $1,000" line of the tables is useful in comparing ongoing expenses only and will not help you determine the relative total expense of owning different funds. If these transaction costs had been included, your costs would have been higher.
Expenses and Value of a $1,000 Investment for the six months ended December 31, 2013 | ||||
| Actual Fund Return | Class A | |||
| Beginning Account Value 7/1/13 | $ | 1,000.00 | ||
| Ending Account Value 12/31/13 | $ | 1,164.60 | ||
| Expenses Paid per $1,000* | $ | 5.46 | ||
| Hypothetical 5% Fund Return | Class A | |||
| Beginning Account Value 7/1/13 | $ | 1,000.00 | ||
| Ending Account Value 12/31/13 | $ | 1,020.16 | ||
| Expenses Paid per $1,000* | $ | 5.09 | ||
* Expenses are equal to the Fund's annualized expense ratio, multiplied by the average account value over the period, multiplied by 184 (the number of days in the most recent six-month period), then divided by 365.
| Annualized Expense Ratio | Class A | |
| DWS Variable Series II — DWS Global Equity VIP | 1.00% |
For more information, please refer to the Fund's prospectus.
These tables do not reflect charges and fees ("contract charges") associated with the separate account that invests in the Fund or any variable life insurance policy or variable annuity contract for which the Fund is an investment option.
For an analysis of the fees associated with an investment in the fund or similar funds, please refer to the current and hypothetical expense calculators for Variable Insurance Products which can be found at dws-investments.com/EN/resources/calculators.jsp.
The Fund paid foreign taxes of $151,000 and earned $1,127,000 of foreign source income year during the year ended December 31, 2013. Pursuant to Section 853 of the Internal Revenue Code, the Fund designates $0.02 per share as foreign taxes paid and $0.14 per share as income earned from foreign sources for the year ended December 31, 2013.
Please consult a tax advisor if you have questions about federal or state income tax laws, or on how to prepare your tax returns. If you have specific questions about your account, please contact your insurance provider.
The Trust's policies and procedures for voting proxies for portfolio securities and information about how the Trust voted proxies related to its portfolio securities during the 12-month period ended June 30 are available on our Web site — dws-investments.com (click on "proxy voting" at the bottom of the page) — or on the SEC's Web site — sec.gov. To obtain a written copy of the Trust's policies and procedures without charge, upon request, call us toll free at (800) 728-3337.
The Board of Trustees approved the renewal of DWS Global Equity VIP's investment management agreement (the "Agreement") with Deutsche Investment Management Americas Inc. ("DIMA") in September 2013.
In terms of the process that the Board followed prior to approving the Agreement, shareholders should know that:
— In September 2013, all but one of the Fund's Trustees were independent of DIMA and its affiliates.
— The Trustees met frequently during the past year to discuss fund matters and dedicated a substantial amount of time to contract review matters. Over the course of several months, the Board's Contract Committee, in coordination with the Board's Fixed Income and Asset Allocation Oversight Committee, reviewed comprehensive materials received from DIMA, independent third parties and independent counsel. These materials included an analysis of the Fund's performance, fees and expenses, and profitability compiled by a fee consultant retained by the Fund's Independent Trustees (the "Fee Consultant"). The Board also received extensive information throughout the year regarding performance of the Fund.
— The Independent Trustees regularly meet privately with their independent counsel to discuss contract review and other matters. In addition, the Independent Trustees were also advised by the Fee Consultant in the course of their review of the Fund's contractual arrangements and considered a comprehensive report prepared by the Fee Consultant in connection with their deliberations.
— In connection with reviewing the Agreement, the Board also reviewed the terms of the Fund's distribution agreement, administrative services agreement, transfer agency agreement and other material service agreements.
— Based on its evaluation of the information provided, the Contract Committee presented its findings and recommendations to the Board. The Board then reviewed the Contract Committee's findings and recommendations.
In connection with the contract review process, the Contract Committee and the Board considered the factors discussed below, among others. The Board also considered that DIMA and its predecessors have managed the Fund since its inception, and the Board believes that a long-term relationship with a capable, conscientious advisor is in the best interests of the Fund. The Board considered, generally, that shareholders chose to invest or remain invested in the Fund knowing that DIMA managed the Fund, and that the Agreement was approved by the Fund's shareholders. DIMA is part of Deutsche Bank AG, a major global banking institution that is engaged in a wide range of financial services. The Board believes that there are advantages to being part of a global asset management business that offers a wide range of investing expertise and resources, including hundreds of portfolio managers and analysts with research capabilities in many countries throughout the world.
As part of the contract review process, the Board carefully considered the fees and expenses of each DWS fund overseen by the Board in light of the fund's performance. In many cases, this led to a negotiation with DIMA of lower expense caps as part of the 2012 and 2013 contract review processes than had previously been in place. As part of these negotiations, the Board indicated that it would consider relaxing these new lower caps in future years following sustained improvements in performance, among other considerations.
In June 2012, Deutsche Bank AG ("DB"), DIMA's parent company, announced that DB would combine its Asset Management (of which DIMA was a part) and Wealth Management divisions. DB has advised the Independent Trustees that the U.S. asset management business is a critical and integral part of DB, and that it has, and will continue to, reinvest a significant portion of the substantial savings it expects to realize by combining its Asset Management and Wealth Management divisions into the new Asset and Wealth Management ("AWM") division, including ongoing enhancements to its investment capabilities. DB also has confirmed its commitment to maintaining strong legal and compliance groups within the AWM division.
While shareholders may focus primarily on fund performance and fees, the Fund's Board considers these and many other factors, including the quality and integrity of DIMA's personnel and such other issues as back-office operations, fund valuations, and compliance policies and procedures.
Nature, Quality and Extent of Services. The Board considered the terms of the Agreement, including the scope of advisory services provided under the Agreement. The Board noted that, under the Agreement, DIMA provides portfolio management services to the Fund and that, pursuant to a separate administrative services agreement, DIMA provides administrative services to the Fund. The Board considered the experience and skills of senior management and investment personnel, the resources made available to such personnel, the ability of DIMA to attract and retain high-quality personnel, and the organizational depth and stability of DIMA. The Board reviewed the Fund's performance over short-term and long-term periods and compared those returns to various agreed-upon performance measures, including market indices and a peer universe compiled by the Fee Consultant using information supplied by Morningstar Direct ("Morningstar"), an independent fund data service. The Board also noted that it has put into place a process of identifying "Focus Funds" (e.g., funds performing poorly relative to their benchmark or a peer universe compiled by an independent fund data service), and receives more frequent reporting and information from DIMA regarding such funds, along with DIMA's remedial plans to address underperformance. The Board believes this process is an effective manner of identifying and addressing underperforming funds. Based on the information provided, the Board noted that for the one-, three- and five-year periods ended December 31, 2012, the Fund's performance (Class A shares) was in the 3rd quartile, 2nd quartile and 4th quartile, respectively, of the applicable Morningstar universe (the 1st quartile being the best performers and the 4th quartile being the worst performers). The Board also observed that the Fund has outperformed its benchmark in the one- and three-year periods and has underperformed its benchmark in the five-year period ended December 31, 2012.
Fees and Expenses. The Board considered the Fund's investment management fee schedule, operating expenses and total expense ratios, and comparative information provided by Lipper Inc. ("Lipper") and the Fee Consultant regarding investment management fee rates paid to other investment advisors by similar funds (1st quartile being the most favorable and 4th quartile being the least favorable). With respect to management fees paid to other investment advisors by similar funds, the Board noted that the contractual fee rates paid by the Fund, which include a 0.10% fee paid to DIMA under the Fund's administrative services agreement, were lower than the median (1st quartile) of the applicable Lipper peer group (based on Lipper data provided as of December 31, 2012). The Board noted that the Fund's Class A shares total (net) operating expenses were expected to be higher than the median (3rd quartile) of the applicable Lipper expense universe (based on Lipper data provided as of December 31, 2012, and analyzing Lipper expense universe Class A (net) expenses less any applicable 12b-1 fees) ("Lipper Universe Expenses"). The Board considered the Fund's management fee rate as compared to fees charged by DIMA to comparable funds and considered differences between the Fund and the comparable funds. The Board also considered how the Fund's total (net) operating expenses compared to the total (net) operating expenses of a more customized peer group selected by Lipper (based on such factors as asset size). The Board also noted that the expense limitation agreed to by DIMA helped to ensure that the Fund's total (net) operating expenses would remain competitive.
The information considered by the Board as part of its review of management fees included information regarding fees charged by DIMA and its affiliates to similar institutional accounts and to similar funds offered primarily to European investors ("DWS Europe funds"), in each case as applicable. The Board observed that advisory fee rates for institutional accounts generally were lower than the management fees charged by similarly managed DWS U.S. mutual funds ("DWS Funds"), but also took note of the differences in services provided to DWS Funds as compared to institutional accounts. In the case of DWS Europe funds, the Board observed that fee rates for DWS Europe funds generally were higher than for similarly managed DWS Funds, but noted that differences in the types of services provided to DWS Funds relative to DWS Europe funds made it difficult to compare such fees.
On the basis of the information provided, the Board concluded that management fees were reasonable and appropriate in light of the nature, quality and extent of services provided by DIMA.
Profitability. The Board reviewed detailed information regarding revenues received by DIMA under the Agreement. The Board considered the estimated costs and pre-tax profits realized by DIMA from advising the DWS Funds, as well as estimates of the pre-tax profits attributable to managing the Fund in particular. The Board also received information regarding the estimated enterprise-wide profitability of DWS and its affiliates with respect to all fund services in totality and by fund. The Board and the Fee Consultant reviewed DIMA's methodology in allocating its costs to the management of the Fund. Based on the information provided, the Board concluded that the pre-tax profits realized by DIMA in connection with the management of the Fund were not unreasonable. The Board also reviewed information regarding the profitability of certain similar investment management firms. The Board noted that while information regarding the profitability of such firms is limited (and in some cases is not necessarily prepared on a comparable basis), DIMA and its affiliates' overall profitability with respect to the DWS fund complex (after taking into account distribution and other services provided to the funds by DIMA and its affiliates) was lower than the overall profitability levels of many comparable firms for which such data was available.
Economies of Scale. The Board considered whether there are economies of scale with respect to the management of the Fund and whether the Fund benefits from any economies of scale. The Board noted that the Fund's management fee schedule includes fee breakpoints. The Board concluded that the Fund's fee schedule represents an appropriate sharing between the Fund and DIMA of such economies of scale as may exist in the management of the Fund at current asset levels.
Other Benefits to DIMA and Its Affiliates. The Board also considered the character and amount of other incidental benefits received by DIMA and its affiliates, including any fees received by DIMA for administrative services provided to the Fund and any fees received by an affiliate of DIMA for distribution services. The Board also considered benefits to DIMA related to brokerage and soft-dollar allocations, including allocating brokerage to pay for research generated by parties other than the executing broker dealers, which pertain primarily to funds investing in equity securities, along with the incidental public relations benefits to DIMA related to DWS Funds advertising and cross-selling opportunities among DIMA products and services. The Board concluded that management fees were reasonable in light of these fallout benefits.
Compliance. The Board considered the significant attention and resources dedicated by DIMA to documenting and enhancing its compliance processes in recent years. The Board noted in particular (i) the experience and seniority of both DIMA's chief compliance officer and the Fund's chief compliance officer; (ii) the large number of DIMA compliance personnel; and (iii) the substantial commitment of resources by DIMA and its affiliates to compliance matters.
Based on all of the information considered and the conclusions reached, the Board unanimously determined that the continuation of the Agreement is in the best interests of the Fund. In making this determination, the Board did not give particular weight to any single factor identified above. The Board considered these factors over the course of numerous meetings, certain of which were in executive session with only the Independent Trustees and their independent counsel present. It is possible that individual Trustees may have weighed these factors differently in reaching their individual decisions to approve the continuation of the Agreement.
The following table presents certain information regarding the Board Members and Officers of the fund. Each Board Member's year of birth is set forth in parentheses after his or her name. Unless otherwise noted, (i) each Board Member has engaged in the principal occupation(s) noted in the table for at least the most recent five years, although not necessarily in the same capacity; and (ii) the address of each Independent Board Member is c/o Kenneth C. Froewiss, Chairman, DWS Mutual Funds, P.O. Box 78, Short Hills, NJ 07078. Except as otherwise noted below, the term of office for each Board Member is until the election and qualification of a successor, or until such Board Member sooner dies, resigns, is removed or as otherwise provided in the governing documents of the fund. Because the fund does not hold an annual meeting of shareholders, each Board Member will hold office for an indeterminate period. The Board Members may also serve in similar capacities with other funds in the fund complex.
| Independent Board Members | ||||
Name, Year of Birth, Position with the Fund and Length of Time Served1 | Business Experience and Directorships During the Past Five Years | Number of Funds in DWS Fund Complex Overseen | Other Directorships Held by Board Member | |
Kenneth C. Froewiss (1945) Chairperson since 2013, and Board Member since 2001 | Adjunct Professor of Finance, NYU Stern School of Business (September 2009–present; Clinical Professor from 1997–September 2009); Member, Finance Committee, Association for Asian Studies (2002–present); Director, Mitsui Sumitomo Insurance Group (US) (2004–present); prior thereto, Managing Director, J.P. Morgan (investment banking firm) (until 1996) | 103 | — | |
William McClayton (1944) Vice Chairperson since 2013, and Board Member since 2004 | Private equity investor (since October 2009); previously, Managing Director, Diamond Management & Technology Consultants, Inc. (global consulting firm) (2001–2009); Directorship: Board of Managers, YMCA of Metropolitan Chicago; formerly: Senior Partner, Arthur Andersen LLP (accounting) (1966–2001); Trustee, Ravinia Festival | 103 | — | |
John W. Ballantine (1946) Board Member since 1999 | Retired; formerly, Executive Vice President and Chief Risk Management Officer, First Chicago NBD Corporation/The First National Bank of Chicago (1996–1998); Executive Vice President and Head of International Banking (1995–1996); former Directorships: Stockwell Capital Investments PLC (private equity); First Oak Brook Bancshares, Inc. and Oak Brook Bank; Prisma Energy International | 103 | Chairman of the Board, Healthways, Inc.2 (provider of disease and care management services) (2003– present); Portland General Electric2 (utility company) (2003– present) | |
Henry P. Becton, Jr. (1943) Board Member since 1990 | Vice Chair and former President, WGBH Educational Foundation. Directorships: Public Radio International; Public Radio Exchange (PRX); North Bennett Street School (Boston); former Directorships: The PBS Foundation; Association of Public Television Stations; Boston Museum of Science; American Public Television; Concord Academy; New England Aquarium; Mass. Corporation for Educational Telecommunications; Committee for Economic Development; Public Broadcasting Service; Connecticut College | 103 | Lead Director, Becton Dickinson and Company2 (medical technology company); Lead Director, Belo Corporation2 (media company) | |
Dawn-Marie Driscoll (1946) Board Member since 1987 | President, Driscoll Associates (consulting firm); Emeritus Executive Fellow, Center for Business Ethics, Bentley University; formerly, Partner, Palmer & Dodge (1988–1990); Vice President of Corporate Affairs and General Counsel, Filene's (1978–1988). Directorships: Director of ICI Mutual Insurance Company (since 2007); Advisory Board, Center for Business Ethics, Bentley University; Chairman of the Board of Trustees, Southwest Florida Community Foundation (charitable organization); former Directorships: Sun Capital Advisers Trust (mutual funds) (2007–2012), Investment Company Institute (audit, executive, nominating committees) and Independent Directors Council (governance, executive committees) | 103 | — | |
Keith R. Fox, CFA (1954) Board Member since 1996 | Managing General Partner, Exeter Capital Partners (a series of private investment funds) (since 1986). Directorships: Progressive International Corporation (kitchen goods importer and distributor); The Kennel Shop (retailer); former Chairman, National Association of Small Business Investment Companies; former Directorships: BoxTop Media Inc. (advertising); Sun Capital Advisers Trust (mutual funds) (2011–2012) | 103 | — | |
Paul K. Freeman (1950) Board Member since 1993 | Consultant, World Bank/Inter-American Development Bank; Executive and Governing Council of the Independent Directors Council (Chairman of Education Committee); formerly: Project Leader, International Institute for Applied Systems Analysis (1998–2001); Chief Executive Officer, The Eric Group, Inc. (environmental insurance) (1986–1998); Directorships: Denver Zoo Foundation (December 2012–present); former Directorships: Prisma Energy International | 103 | — | |
Richard J. Herring (1946) Board Member since 1990 | Jacob Safra Professor of International Banking and Professor, Finance Department, The Wharton School, University of Pennsylvania (since July 1972); Co-Director, Wharton Financial Institutions Center (since July 2000); Co-Chair, U.S. Shadow Financial Regulatory Committee; Executive Director, Financial Economists Roundtable; formerly: Vice Dean and Director, Wharton Undergraduate Division (July 1995–June 2000); Director, Lauder Institute of International Management Studies (July 2000–June 2006) | 103 | Director, Japan Equity Fund, Inc. (since September 2007), Thai Capital Fund, Inc. (since 2007), Singapore Fund, Inc. (since September 2007), Independent Director of Barclays Bank Delaware (since September 2010) | |
Rebecca W. Rimel (1951) Board Member since 1995 | President and Chief Executive Officer, The Pew Charitable Trusts (charitable organization) (1994 to present); formerly: Executive Vice President, The Glenmede Trust Company (investment trust and wealth management) (1983–2004); Board Member, Investor Education (charitable organization) (2004–2005); Trustee, Executive Committee, Philadelphia Chamber of Commerce (2001–2007); Director, Viasys Health Care2 (January 2007–June 2007); Trustee, Thomas Jefferson Foundation (charitable organization) (1994–2012) | 103 | Director, Becton Dickinson and Company2 (medical technology company) (2012– present); Director, CardioNet, Inc.2 (health care) (2009– present) | |
William N. Searcy, Jr. (1946) Board Member since 1993 | Private investor since October 2003; formerly: Pension & Savings Trust Officer, Sprint Corporation2 (telecommunications) (November 1989–September 2003); Trustee, Sun Capital Advisers Trust (mutual funds) (1998–2012) | 103 | — | |
Jean Gleason Stromberg (1943) Board Member since 1997 | Retired. Formerly, Consultant (1997–2001); Director, Financial Markets U.S. Government Accountability Office (1996–1997); Partner, Fulbright & Jaworski, L.L.P. (law firm) (1978–1996). Directorships: The William and Flora Hewlett Foundation; former Directorships: Service Source, Inc., Mutual Fund Directors Forum (2002–2004), American Bar Retirement Association (funding vehicle for retirement plans) (1987–1990 and 1994–1996) | 103 | — | |
Robert H. Wadsworth (1940) Board Member since 1999 | President, Robert H. Wadsworth & Associates, Inc. (consulting firm) (1983 to present); Director, National Horizon, Inc. (non-profit organization); Director and Treasurer, The Phoenix Boys Choir Association | 106 | — | |
Officers4 | ||
Name, Year of Birth, Position with the Fund and Length of Time Served5 | Business Experience and Directorships During the Past Five Years | |
Brian E. Binder8,9 (1972) President and Chief Executive Officer, 2013–present | Managing Director3 and Head of Fund Administration, Deutsche Asset & Wealth Management (2013–present); formerly: Head of Business Management and Consulting at Invesco, Ltd. (2010–2012); Chief Administrative Officer, Van Kampen Funds Inc. (2008–2010); and Chief Administrative Officer, Morgan Stanley Investment Management Americas Distribution (2003–2008) | |
John Millette7 (1962) Vice President and Secretary, 1999–present | Director,3 Deutsche Asset & Wealth Management | |
Paul H. Schubert6 (1963) Chief Financial Officer, 2004–present Treasurer, 2005–present | Managing Director,3 Deutsche Asset & Wealth Management (since July 2004); formerly: Executive Director, Head of Mutual Fund Services and Treasurer for UBS Family of Funds (1998–2004); Vice President and Director of Mutual Fund Finance at UBS Global Asset Management (1994–1998) | |
Caroline Pearson7 (1962) Chief Legal Officer, 2010–present | Managing Director,3 Deutsche Asset & Wealth Management; formerly: Assistant Secretary for DWS family of funds (1997–2010) | |
Melinda Morrow6 (1970) Vice President, 2012–present | Director,3 Deutsche Asset & Wealth Management | |
Hepsen Uzcan7 (1974) Assistant Secretary, 2013–present | Vice President, Deutsche Asset & Wealth Management | |
Paul Antosca7 (1957) Assistant Treasurer, 2007–present | Director,3 Deutsche Asset & Wealth Management | |
Jack Clark7 (1967) Assistant Treasurer, 2007–present | Director,3 Deutsche Asset & Wealth Management | |
Diane Kenneally7 (1966) Assistant Treasurer, 2007–present | Director,3 Deutsche Asset & Wealth Management | |
John Caruso6 (1965) Anti-Money Laundering Compliance Officer, 2010–present | Managing Director,3 Deutsche Asset & Wealth Management | |
Robert Kloby6 (1962) Chief Compliance Officer, 2006–present | Managing Director,3 Deutsche Asset & Wealth Management | |
1 The length of time served represents the year in which the Board Member joined the board of one or more DWS funds currently overseen by the Board.
2 A publicly held company with securities registered pursuant to Section 12 of the Securities Exchange Act of 1934.
3 Executive title, not a board directorship.
4 As a result of their respective positions held with the Advisor, these individuals are considered "interested persons" of the Advisor within the meaning of the 1940 Act. Interested persons receive no compensation from the fund.
5 The length of time served represents the year in which the officer was first elected in such capacity for one or more DWS funds.
6 Address: 60 Wall Street, New York, NY 10005.
7 Address: One Beacon Street, Boston, MA 02108.
8 Address: 222 South Riverside Plaza, Chicago, IL 60606.
9 Effective as of December 1, 2013.
The fund's Statement of Additional Information ("SAI") includes additional information about the Board Members. The SAI is available, without charge, upon request. If you would like to request a copy of the SAI, you may do so by calling the following toll-free number: (800) 728-3337.
DWS Investments Distributors, Inc.
222 South Riverside Plaza
Chicago, IL 60606
(800) 621-1148
VS2GE-2 (R-025828-3 2/14)
December 31, 2013
Annual Report
DWS Variable Series II
DWS Global Growth VIP
(formerly DWS Global Thematic VIP)
Contents
3 Performance Summary 4 Management Summary 5 Portfolio Summary 7 Investment Portfolio 11 Statement of Assets and Liabilities 12 Statement of Operations 13 Statement of Changes in Net Assets 14 Financial Highlights 15 Notes to Financial Statements 20 Report of Independent Registered Public Accounting Firm 21 Information About Your Fund's Expenses 22 Tax Information 23 Proxy Voting 24 Advisory Agreement Board Considerations and Fee Evaluation 27 Board Members and Officers |
This report must be preceded or accompanied by a prospectus. To obtain an additional prospectus or summary prospectus, if available, call (800) 728-3337 or your financial representative. We advise you to consider the Fund's objectives, risks, charges and expenses carefully before investing. The summary prospectus and prospectus contain this and other important information about the Fund. Please read the prospectus carefully before you invest.
Investing in derivatives entails special risks relating to liquidity, leverage and credit that may reduce returns and/or increase volatility. Investing in foreign securities, particularly those of emerging markets, presents certain risks, such as currency fluctuations, political and economic changes, and market risks. The fund may lend securities to approved institutions. Smaller company stocks tend to be more volatile than medium-sized or large company stocks. Stocks may decline in value. See the prospectus for details.
Deutsche Asset & Wealth Management represents the asset management and wealth management activities conducted by Deutsche Bank AG or any of its subsidiaries, including the Advisor and DWS Investments Distributors, Inc.
NOT FDIC/NCUA INSURED NO BANK GUARANTEE MAY LOSE VALUE NOT A DEPOSIT
NOT INSURED BY ANY FEDERAL GOVERNMENT AGENCY
Fund performance shown is historical, assumes reinvestment of all dividend and capital gain distributions and does not guarantee future results. Investment return and principal value fluctuate with changing market conditions so that, when redeemed, shares may be worth more or less than their original cost. Current performance may be lower or higher than the performance data quoted. Please contact your participating insurance company for the Fund's most recent month-end performance. Performance doesn't reflect charges and fees ("contract charges") associated with the separate account that invests in the Fund or any variable life insurance policy or variable annuity contract for which the Fund is an investment option. These charges and fees will reduce returns. While all share classes have the same underlying portfolio, their performance will differ.
The gross expense ratios of the Fund, as stated in the fee table of the prospectus dated May 1, 2013 are 1.42% and 1.76% for Class A and Class B shares, respectively, and may differ from the expense ratios disclosed in the Financial Highlights tables in this report.
Effective May 1, 2013, the Fund's investment strategies changed and the Fund seeks to achieve its objective by allocating its assets among a global growth sleeve and a small cap growth sleeve. The Fund's past performance may have been different if the Fund had been managed using the current investment strategies.
| Growth of an Assumed $10,000 Investment in DWS Global Growth VIP | ||
 | The Morgan Stanley Capital International (MSCI) World Index is a free float-adjusted market capitalization weighted index that is designed to measure the equity market performance of developed markets. The index consists of 24 developed market country indices. The index is calculated using closing local market prices and translates into U.S. dollars using the London close foreign exchange rates. Index returns do not reflect any fees or expenses and it is not possible to invest directly into an index. | |
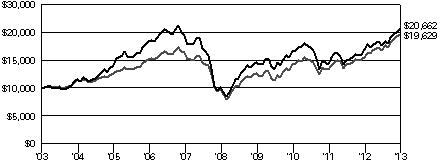 | ||
| Yearly periods ended December 31 | ||
| Comparative Results | |||||||||||||||||
| DWS Global Growth VIP | 1-Year | 3-Year | 5-Year | 10-Year | |||||||||||||
| Class A | Growth of $10,000 | $ | 12,208 | $ | 12,395 | $ | 20,261 | $ | 20,662 | ||||||||
| Average annual total return | 22.08 | % | 7.42 | % | 15.17 | % | 7.53 | % | |||||||||
| MSCI World Index | Growth of $10,000 | $ | 12,668 | $ | 13,860 | $ | 20,135 | $ | 19,629 | ||||||||
| Average annual total return | 26.68 | % | 11.48 | % | 15.02 | % | 6.97 | % | |||||||||
| DWS Global Growth VIP | 1-Year | 3-Year | 5-Year | 10-Year | |||||||||||||
| Class B | Growth of $10,000 | $ | 12,162 | $ | 12,263 | $ | 19,891 | $ | 19,927 | ||||||||
| Average annual total return | 21.62 | % | 7.04 | % | 14.74 | % | 7.14 | % | |||||||||
| MSCI World Index | Growth of $10,000 | $ | 12,668 | $ | 13,860 | $ | 20,135 | $ | 19,629 | ||||||||
| Average annual total return | 26.68 | % | 11.48 | % | 15.02 | % | 6.97 | % | |||||||||
The growth of $10,000 is cumulative.
The Fund's Class A shares returned 22.08% during 2013, underperforming the 26.68% return of the MSCI World Index.1 Our team took over the Fund's management duties on May 1, 2013 at which point the Fund — formerly DWS Global Thematic VIP — was renamed DWS Global Growth VIP.
We allocate the Fund's assets among a global growth sleeve and a global small-cap growth sleeve. Since we took over the Fund on May 1, 2013, the small-cap sleeve has been the better performer of the two, delivering positive returns both an absolute basis and relative to the index.
The leading cause of the Fund's underperformance was its stock selection in the financial and consumer staples sectors.2 In the former, the largest detractors were the Metropolitan Bank and Trust Co., ICICI Bank Ltd. and Turkiye Halk Bankasi AS, which are based in the Philippines, India and Turkey, respectively. The story was similar in consumer staples, where the most notable detractors from performance included PT Indofood and Tbk PT Gudang Garam of Indonesia and Fomento Economico Mexicano SAB de CV. The underperformance of these positions underscores a broader trend that was in place during 2013: the broader shortfall in emerging-markets stocks. We held a sizeable allocation to the emerging markets throughout the past year ending December 31, 2013, whereas the benchmark is invested entirely in the developed markets. While this led to short-term underperformance for the Fund, we believe our holdings in this area provide the opportunity to invest in fast-growing companies at compelling valuations.
On the plus side, our stock picks performed very well in information technology. Among our many outperformers in this sector were the U.S. stocks Alliance Data Systems Corp. and MasterCard Inc. We also added value in the challenging materials sector via our positions in Praxair, Inc. and Stora Enso Oyj.
In the four months before we took over the Fund's management duties, the Fund underperformed its benchmark due largely to adverse stock selection in the financial, consumer staples and telecommunications sectors.
In terms of positioning, the Fund closed the year with overweight positions in information technology and industrial companies, and it was underweight in the financial, consumer discretionary and telecommunication services sectors.3,4 While the Fund is constructed from the bottom up, we continue to seek to find the best combination of growth and value in the financial, consumer discretionary and telecommunication services sectors. Overall, we seek to remain fully invested and own world-class businesses with large barriers to entry, strong growth, pricing power and conservative balance sheets.
Joseph Axtell, CFA
Lead Portfolio Manager
Rafaelina M. Lee
Reid Galas, CFA
Nils E. Ernst, PhD
Martin Berberich, CFA
Sebastien P. Werner, PhD
Portfolio Managers
The views expressed reflect those of the portfolio management team only through the end of the period of the report as stated on the cover. The management team's views are subject to change at any time based on market and other conditions and should not be construed as a recommendation. Past performance is no guarantee of future results. Current and future portfolio holdings are subject to risk.
1 The MSCI World Index tracks the performance of stocks in select developed markets around the world, including the United States. Index returns do not reflect fees or expenses and it is not possible to invest directly into an index.
2 Consumer staples are the industries that manufacture and sell products such as food and beverages, prescription drugs, and household products.
3 The consumer discretionary sector represents industries that produce goods and services that are not necessities in everyday life.
4 "Underweight" means the Fund holds a lower weighting in a given sector or security than the benchmark. "Overweight" means it holds a higher weighting.
Asset Allocation (As a % of Investment Portfolio excluding Securities Lending Collateral) | 12/31/13 | 12/31/12 |
| Common Stocks | 96% | 97% |
| Cash Equivalents | 3% | 1% |
| Participatory Notes | 1% | 0% |
| Preferred Stock | — | 2% |
| 100% | 100% |
Sector Diversification
(As a % of Investment Portfolio excluding Cash Equivalents and Securities Lending Collateral) | 12/31/13 | 12/31/12 |
| Industrials | 20% | 13% |
| Financials | 15% | 14% |
| Health Care | 14% | 12% |
| Information Technology | 14% | 15% |
| Consumer Discretionary | 14% | 10% |
| Consumer Staples | 12% | 8% |
| Energy | 7% | 8% |
| Materials | 4% | 13% |
| Telecommunication Services | — | 4% |
| Utilities | — | 3% |
| 100% | 100% |
Geographical Diversification
(As a % of Investment Portfolio excluding Cash Equivalents and Securities Lending Collateral) | 12/31/13 | 12/31/12 |
| United States | 45% | 37% |
| Europe | 30% | 31% |
| United Kingdom | 9% | 2% |
| Asia (excluding Japan) | 6% | 10% |
| Canada | 6% | 6% |
| Japan | 2% | 3% |
| Latin America | 1% | 6% |
| Nigeria | 1% | 0% |
| Africa | — | 2% |
| Middle East | — | 2% |
| Bermuda | — | 1% |
| 100% | 100% |
Portfolio holdings and characteristics are subject to change.
For more complete details about the Fund's investment portfolio, see page 7.
Following the Fund's fiscal first and third quarter-end, a complete portfolio holdings listing is filed with the SEC on Form N-Q. The form will be available on the SEC's Web site at sec.gov, and it also may be reviewed and copied at the SEC's Public Reference Room in Washington, D.C. Information on the operation of the SEC's Public Reference Room may be obtained by calling (800) SEC-0330. The Fund's portfolio holdings are also posted on dws-investments.com from time to time. Please see the Fund's current prospectus for more information.
| Shares | Value ($) | |||||||
| Common Stocks 95.4% | ||||||||
| Belgium 1.6% | ||||||||
| Anheuser-Busch InBev NV (Cost $778,194) | 8,200 | 874,317 | ||||||
| Bermuda 0.2% | ||||||||
| Lazard Ltd. "A" (Cost $71,779) | 3,026 | 137,138 | ||||||
| Brazil 0.4% | ||||||||
| CCR SA (Cost $218,874) | 29,000 | 218,858 | ||||||
| Canada 5.1% | ||||||||
| Agnico Eagle Mines Ltd. | 9,000 | 237,420 | ||||||
| Brookfield Asset Management, Inc. "A" | 21,000 | 814,893 | ||||||
| Canadian Oil Sands Ltd. | 20,000 | 376,183 | ||||||
| Canadian Pacific Railway Ltd. | 6,000 | 907,413 | ||||||
| Goldcorp, Inc. | 13,000 | 281,710 | ||||||
| Quebecor, Inc. "B" | 1,134 | 28,226 | ||||||
| SunOpta, Inc.* | 12,874 | 128,869 | ||||||
| (Cost $2,821,768) | 2,774,714 | |||||||
| China 0.3% | ||||||||
| Minth Group Ltd. (Cost $117,228) | 66,933 | 139,392 | ||||||
| Cyprus 0.2% | ||||||||
| Prosafe SE | 13,190 | 101,779 | ||||||
| Songa Offshore* | 6,733 | 3,451 | ||||||
| (Cost $129,991) | 105,230 | |||||||
| Denmark 2.1% | ||||||||
| Coloplast AS "B" | 4,200 | 278,597 | ||||||
| DS Norden AS | 5,500 | 289,887 | ||||||
| GN Store Nord AS | 5,755 | 141,850 | ||||||
| William Demant Holding AS* | 4,300 | 418,077 | ||||||
| (Cost $984,089) | 1,128,411 | |||||||
| Finland 0.1% | ||||||||
| Cramo Oyj (Cost $56,616) | 2,588 | 54,827 | ||||||
| France 2.5% | ||||||||
| Edenred | 11,000 | 369,023 | ||||||
| JC Decaux SA | 3,496 | 144,380 | ||||||
| LVMH Moet Hennessy Louis Vuitton SA | 1,500 | 274,592 | ||||||
| Pernod Ricard SA | 4,800 | 548,059 | ||||||
| (Cost $1,270,108) | 1,336,054 | |||||||
| Germany 3.0% | ||||||||
| BASF SE | 5,250 | 559,833 | ||||||
| Fresenius Medical Care AG & Co. KGaA | 12,000 | 854,040 | ||||||
| United Internet AG (Registered) | 5,091 | 216,884 | ||||||
| (Cost $1,468,791) | 1,630,757 | |||||||
| Hong Kong 1.1% | ||||||||
| Hong Kong Television Network Ltd. | 96,393 | 44,013 | ||||||
| K Wah International Holdings Ltd. | 262,818 | 159,610 | ||||||
| Playmates Toys Ltd.* | 171,462 | 80,349 | ||||||
| REXLot Holdings Ltd. (a) | 1,473,180 | 199,785 | ||||||
| Techtronic Industries Co. | 41,941 | 119,438 | ||||||
| (Cost $489,008) | 603,195 | |||||||
| Shares | Value ($) | |||||||
| India 0.8% | ||||||||
| ICICI Bank Ltd. (ADR) (Cost $529,151) | 11,500 | 427,455 | ||||||
| Indonesia 0.8% | ||||||||
| PT Arwana Citramulia Tbk | 1,138,391 | 76,749 | ||||||
| PT Indofood CBP Sukses Makmur Tbk | 450,000 | 377,636 | ||||||
| (Cost $641,566) | 454,385 | |||||||
| Ireland 3.5% | ||||||||
| Accenture PLC "A" (b) | 8,100 | 665,982 | ||||||
| C&C Group PLC | 12,334 | 72,148 | ||||||
| Experian PLC | 21,300 | 393,117 | ||||||
| Paddy Power PLC | 1,602 | 136,920 | ||||||
| Ryanair Holdings PLC (ADR)* | 2,845 | 133,516 | ||||||
| Shire PLC | 10,000 | 471,217 | ||||||
| (Cost $1,633,092) | 1,872,900 | |||||||
| Italy 2.5% | ||||||||
| Prada SpA | 42,700 | 379,359 | ||||||
| Prysmian SpA | 4,822 | 124,330 | ||||||
| Sorin SpA* | 76,000 | 216,890 | ||||||
| Unipol Gruppo Finanziario SpA | 102,000 | 612,228 | ||||||
| (Cost $1,101,496) | 1,332,807 | |||||||
| Japan 1.6% | ||||||||
| Ai Holdings Corp. | 5,880 | 73,409 | ||||||
| Avex Group Holdings, Inc. | 5,838 | 125,551 | ||||||
| Iida Group Holdings Co., Ltd.* | 4,527 | 90,360 | ||||||
| Kusuri No Aoki Co., Ltd. | 1,448 | 80,902 | ||||||
| MISUMI Group, Inc. | 2,278 | 71,697 | ||||||
| Nippon Seiki Co., Ltd. | 8,059 | 155,952 | ||||||
| United Arrows Ltd. | 2,783 | 104,241 | ||||||
| Universal Entertainment Corp. | 4,998 | 92,288 | ||||||
| Yumeshin Holdings Co., Ltd. | 7,248 | 78,678 | ||||||
| (Cost $885,397) | 873,078 | |||||||
| Luxembourg 0.9% | ||||||||
| Eurofins Scientific (Cost $419,564) | 1,800 | 487,455 | ||||||
| Malaysia 1.1% | ||||||||
| Hartalega Holdings Bhd. | 60,611 | 133,777 | ||||||
| IHH Healthcare Bhd.* | 350,000 | 412,760 | ||||||
| Tune Ins Holdings Bhd.* | 112,278 | 66,878 | ||||||
| (Cost $658,501) | 613,415 | |||||||
| Mexico 0.8% | ||||||||
| Fomento Economico Mexicano SAB de CV (ADR) (Cost $491,474) | 4,300 | 420,841 | ||||||
| Netherlands 2.8% | ||||||||
| ASML Holding NV | 6,000 | 563,431 | ||||||
| Brunel International NV | 2,065 | 126,798 | ||||||
| Chicago Bridge & Iron Co. NV (b) | 1,433 | 119,139 | ||||||
| ING Groep NV (CVA)* | 32,000 | 447,477 | ||||||
| Koninklijke Vopak NV | 1,604 | 93,978 | ||||||
| SBM Offshore NV* | 7,323 | 149,647 | ||||||
| (Cost $1,236,227) | 1,500,470 | |||||||
| Shares | Value ($) | |||||||
| Norway 1.5% | ||||||||
| DNO International ASA* | 125,000 | 501,171 | ||||||
| Norsk Hydro ASA | 70,000 | 312,924 | ||||||
| (Cost $521,769) | 814,095 | |||||||
| Panama 0.2% | ||||||||
| Banco Latinoamericano de Comercio Exterior SA "E" (Cost $92,557) | 4,132 | 115,779 | ||||||
| Philippines 1.3% | ||||||||
| Alliance Global Group, Inc. | 184,682 | 107,721 | ||||||
| Century Properties Group, Inc. | 818,014 | 24,444 | ||||||
| Emperador, Inc.* | 164,472 | 39,701 | ||||||
| House of Investments, Inc. | 65,595 | 9,122 | ||||||
| Metropolitan Bank & Trust Co. | 310,000 | 529,175 | ||||||
| (Cost $883,689) | 710,163 | |||||||
| Singapore 0.3% | ||||||||
| Lian Beng Group Ltd. | 266,639 | 114,206 | ||||||
| UE E&C Ltd. | 54,057 | 44,623 | ||||||
| Yongnam Holdings Ltd. | 69,256 | 13,501 | ||||||
| (Cost $165,754) | 172,330 | |||||||
| Spain 0.6% | ||||||||
| Mediaset Espana Communication SA* (Cost $323,477) | 28,000 | 323,984 | ||||||
| Sweden 4.5% | ||||||||
| Atlas Copco AB "A" | 19,000 | 529,912 | ||||||
| Meda AB "A" | 16,500 | 209,793 | ||||||
| Svenska Cellulosa AB "B" | 20,000 | 617,919 | ||||||
| Swedish Match AB | 18,000 | 578,791 | ||||||
| Telefonaktiebolaget LM Ericsson "B" | 40,200 | 492,276 | ||||||
| (Cost $2,224,535) | 2,428,691 | |||||||
| Switzerland 4.7% | ||||||||
| DKSH Holding AG | 3,500 | 272,365 | ||||||
| Dufry AG (Registered)* | 691 | 121,642 | ||||||
| Nestle SA (Registered) | 10,000 | 734,080 | ||||||
| Novartis AG (Registered) | 5,300 | 424,161 | ||||||
| Pentair Ltd. (Registered) (b) | 7,000 | 543,690 | ||||||
| Swatch Group AG (Bearer) | 630 | 418,029 | ||||||
| (Cost $2,267,370) | 2,513,967 | |||||||
| Thailand 0.1% | ||||||||
| Malee Sampran PCL (Foreign Registered) (Cost $83,742) | 46,269 | 42,242 | ||||||
| United Kingdom 7.4% | ||||||||
| Aberdeen Asset Management PLC | 67,000 | 557,964 | ||||||
| Arrow Global Group PLC* | 17,550 | 77,727 | ||||||
| Aveva Group PLC | 13,000 | 466,907 | ||||||
| Babcock International Group PLC | 8,392 | 188,363 | ||||||
| British American Tobacco PLC | 7,500 | 402,405 | ||||||
| Burberry Group PLC | 3,534 | 88,788 | ||||||
| Clinigen Healthcare Ltd. | 8,084 | 80,477 | ||||||
| Crest Nicholson Holdings PLC* | 19,924 | 120,772 | ||||||
| Domino's Pizza Group PLC | 9,577 | 81,384 | ||||||
| Essentra PLC | 7,465 | 106,512 | ||||||
| Hargreaves Lansdown PLC | 5,347 | 120,234 | ||||||
| HellermannTyton Group PLC | 22,616 | 113,273 | ||||||
| IG Group Holdings PLC | 8,899 | 91,030 | ||||||
| Intertek Group PLC | 11,000 | 573,895 | ||||||
| Shares | Value ($) | |||||||
| Jardine Lloyd Thompson Group PLC | 4,265 | 72,076 | ||||||
| John Wood Group PLC | 7,785 | 88,808 | ||||||
| Monitise PLC* | 60,507 | 67,536 | ||||||
| Reckitt Benckiser Group PLC | 5,500 | 437,892 | ||||||
| Rotork PLC | 2,294 | 109,506 | ||||||
| Spirax-Sarco Engineering PLC | 2,563 | 127,256 | ||||||
| (Cost $3,575,637) | 3,972,805 | |||||||
| United States 43.4% | ||||||||
| Actavis PLC* | 1,400 | 235,200 | ||||||
| ADT Corp. (a) | 5,000 | 202,350 | ||||||
| Advance Auto Parts, Inc. | 962 | 106,474 | ||||||
| AECOM Technology Corp.* | 800 | 23,544 | ||||||
| Affiliated Managers Group, Inc.* | 584 | 126,658 | ||||||
| Agilent Technologies, Inc. | 5,000 | 285,950 | ||||||
| Allergan, Inc. | 4,500 | 499,860 | ||||||
| Alliance Data Systems Corp.* (a) | 4,000 | 1,051,720 | ||||||
| Altra Industrial Motion Corp. | 2,046 | 70,014 | ||||||
| Amgen, Inc. | 3,700 | 422,392 | ||||||
| Amphenol Corp. "A" (a) | 10,000 | 891,800 | ||||||
| BE Aerospace, Inc.* | 1,588 | 138,204 | ||||||
| Beam, Inc. | 9,700 | 660,182 | ||||||
| Biogen Idec, Inc.* | 700 | 195,825 | ||||||
| BorgWarner, Inc. | 2,648 | 148,050 | ||||||
| Bristol-Myers Squibb Co. | 10,000 | 531,500 | ||||||
| Cardtronics, Inc.* | 2,720 | 118,184 | ||||||
| Catamaran Corp.* | 1,896 | 90,022 | ||||||
| CBRE Group, Inc. "A"* | 17,500 | 460,250 | ||||||
| Cerner Corp.* (a) | 9,000 | 501,660 | ||||||
| Chart Industries, Inc.* | 842 | 80,529 | ||||||
| Colfax Corp.* | 10,000 | 636,900 | ||||||
| Danaher Corp. | 7,500 | 579,000 | ||||||
| Deckers Outdoor Corp.* (a) | 2,300 | 194,258 | ||||||
| DFC Global Corp.* | 7,296 | 83,539 | ||||||
| DIRECTV* | 9,000 | 621,810 | ||||||
| Dresser-Rand Group, Inc.* | 1,644 | 98,032 | ||||||
| Dril-Quip, Inc.* | 916 | 100,696 | ||||||
| Encore Capital Group, Inc.* (a) | 2,638 | 132,586 | ||||||
| Exxon Mobil Corp. | 4,000 | 404,800 | ||||||
| Google, Inc. "A"* | 550 | 616,391 | ||||||
| Hain Celestial Group, Inc.* | 946 | 85,878 | ||||||
| HeartWare International, Inc.* (a) | 1,091 | 102,510 | ||||||
| Jack in the Box, Inc.* | 1,392 | 69,628 | ||||||
| Jarden Corp.* | 2,001 | 122,761 | ||||||
| JPMorgan Chase & Co. | 16,500 | 964,920 | ||||||
| Kindred Healthcare, Inc. | 3,775 | 74,519 | ||||||
| L Brands, Inc. | 7,200 | 445,320 | ||||||
| Las Vegas Sands Corp. | 9,000 | 709,830 | ||||||
| Leucadia National Corp. | 3,872 | 109,732 | ||||||
| Manitowoc Co., Inc. | 5,873 | 136,958 | ||||||
| MasterCard, Inc. "A" | 1,200 | 1,002,552 | ||||||
| McDonald's Corp. | 5,600 | 543,368 | ||||||
| MICROS Systems, Inc.* | 1,642 | 94,202 | ||||||
| Middleby Corp.* (a) | 499 | 119,745 | ||||||
| National Oilwell Varco, Inc. | 6,000 | 477,180 | ||||||
| Noble Energy, Inc. | 11,000 | 749,210 | ||||||
| Oaktree Capital Group LLC | 2,482 | 146,041 | ||||||
| Oasis Petroleum, Inc.* | 1,734 | 81,446 | ||||||
| Ocwen Financial Corp.* | 2,954 | 163,799 | ||||||
| Oil States International, Inc.* | 641 | 65,203 | ||||||
| Pacira Pharmaceuticals, Inc.* (a) | 4,041 | 232,317 | ||||||
| Pall Corp. (a) | 7,500 | 640,125 | ||||||
| Polaris Industries, Inc. | 1,085 | 158,019 | ||||||
| Shares | Value ($) | |||||||
| Praxair, Inc. | 6,300 | 819,189 | ||||||
| Precision Castparts Corp. | 3,600 | 969,480 | ||||||
| PTC, Inc.* | 2,093 | 74,071 | ||||||
| Roadrunner Transportation Systems, Inc.* | 3,382 | 91,145 | ||||||
| Rosetta Resources, Inc.* | 929 | 44,629 | ||||||
| Schlumberger Ltd. | 5,500 | 495,605 | ||||||
| Sears Hometown & Outlet Stores, Inc.* | 2,077 | 52,964 | ||||||
| Sinclair Broadcast Group, Inc. "A" | 2,954 | 105,546 | ||||||
| Springleaf Holdings, Inc.* (a) | 5,127 | 129,611 | ||||||
| Synta Pharmaceuticals Corp.* | 8,754 | 45,871 | ||||||
| Tenneco, Inc.* | 2,007 | 113,536 | ||||||
| The Bancorp., Inc.* | 3,319 | 59,443 | ||||||
| Thermon Group Holdings, Inc.* | 3,879 | 106,013 | ||||||
| Thoratec Corp.* | 2,722 | 99,625 | ||||||
| TIBCO Software, Inc.* | 3,265 | 73,397 | ||||||
| TiVo, Inc.* | 5,154 | 67,620 | ||||||
| Tractor Supply Co. (a) | 6,200 | 480,996 | ||||||
| Trimble Navigation Ltd.* | 16,500 | 572,550 | ||||||
| Tristate Capital Holdings, Inc.* | 5,077 | 60,213 | ||||||
| United Rentals, Inc.* | 1,865 | 145,377 | ||||||
| United Technologies Corp. | 4,700 | 534,860 | ||||||
| Urban Outfitters, Inc.* | 2,092 | 77,613 | ||||||
| VeriFone Systems, Inc.* | 2,234 | 59,916 | ||||||
| WABCO Holdings, Inc.* | 1,293 | 120,779 | ||||||
| Shares | Value ($) | |||||||
| Waddell & Reed Financial, Inc. "A" (a) | 2,418 | 157,460 | ||||||
| Western Digital Corp. | 2,835 | 237,857 | ||||||
| (Cost $19,294,032) | 23,399,009 | |||||||
Total Common Stocks (Cost $45,435,476) | 51,478,764 | |||||||
| Participatory Note 1.3% | ||||||||
| Nigeria | ||||||||
| Zenith Bank PLC (issuer Merrill Lynch International), Expiration Date 8/21/2015 (Cost $533,000) | 4,100,000 | 702,346 | ||||||
| Securities Lending Collateral 8.9% | ||||||||
| Daily Assets Fund Institutional, 0.08% (c) (d) (Cost $4,778,217) | 4,778,217 | 4,778,217 | ||||||
| Cash Equivalents 3.0% | ||||||||
| Central Cash Management Fund, 0.05% (c) (Cost $1,623,148) | 1,623,148 | 1,623,148 | ||||||
| % of Net Assets | Value ($) | |||||||
Total Investment Portfolio (Cost $52,369,841)† | 108.6 | 58,582,475 | ||||||
| Other Assets and Liabilities, Net | (8.6 | ) | (4,628,204 | ) | ||||
| Net Assets | 100.0 | 53,954,271 | ||||||
* Non-income producing security.
† The cost for federal income tax purposes was $52,480,940. At December 31, 2013, net unrealized appreciation for all securities based on tax cost was $6,101,535. This consisted of aggregate gross unrealized appreciation for all securities in which there was an excess of value over tax cost of $7,583,184 and aggregate gross unrealized depreciation for all securities in which there was an excess of tax cost over value of $1,481,649.
(a) All or a portion of these securities were on loan. In addition, "Other Assets and Liabilities, Net" may include pending sales that are also on loan. The value of securities loaned at December 31, 2013 amounted to $4,692,985, which is 8.7% of net assets.
(b) Listed on the New York Stock Exchange.
(c) Affiliated fund managed by Deutsche Investment Management Americas Inc. The rate shown is the annualized seven-day yield at period end.
(d) Represents collateral held in connection with securities lending. Income earned by the Fund is net of borrower rebates.
ADR: American Depositary Receipt
CVA: Certificaten Van Aandelen (Certificate of Stock)
Fair Value Measurements
Various inputs are used in determining the value of the Fund's investments. These inputs are summarized in three broad levels. Level 1 includes quoted prices in active markets for identical securities. Level 2 includes other significant observable inputs (including quoted prices for similar securities, interest rates, prepayment speeds and credit risk). Level 3 includes significant unobservable inputs (including the Fund's own assumptions in determining the fair value of investments). The level assigned to the securities valuations may not be an indication of the risk or liquidity associated with investing in those securities.
The following is a summary of the inputs used as of December 31, 2013 in valuing the Fund's investments. For information on the Fund's policy regarding the valuation of investments, please refer to the Security Valuation section of Note A in the accompanying Notes to Financial Statements.
| Assets | Level 1 | Level 2 | Level 3 | Total | ||||||||||||
| Common Stocks | ||||||||||||||||
| Belgium | $ | — | $ | 874,317 | $ | — | $ | 874,317 | ||||||||
| Bermuda | 137,138 | — | — | 137,138 | ||||||||||||
| Brazil | 218,858 | — | — | 218,858 | ||||||||||||
| Canada | 2,774,714 | — | — | 2,774,714 | ||||||||||||
| China | — | 139,392 | — | 139,392 | ||||||||||||
| Cyprus | — | 105,230 | — | 105,230 | ||||||||||||
| Denmark | — | 1,128,411 | — | 1,128,411 | ||||||||||||
| Finland | — | 54,827 | — | 54,827 | ||||||||||||
| France | — | 1,336,054 | — | 1,336,054 | ||||||||||||
| Germany | — | 1,630,757 | — | 1,630,757 | ||||||||||||
| Hong Kong | — | 603,195 | — | 603,195 | ||||||||||||
| India | 427,455 | — | — | 427,455 | ||||||||||||
| Indonesia | — | 454,385 | — | 454,385 | ||||||||||||
| Ireland | 799,498 | 1,073,402 | — | 1,872,900 | ||||||||||||
| Italy | — | 1,332,807 | — | 1,332,807 | ||||||||||||
| Japan | — | 873,078 | — | 873,078 | ||||||||||||
| Luxembourg | — | 487,455 | — | 487,455 | ||||||||||||
| Malaysia | — | 613,415 | — | 613,415 | ||||||||||||
| Mexico | 420,841 | — | — | 420,841 | ||||||||||||
| Netherlands | 119,139 | 1,381,331 | — | 1,500,470 | ||||||||||||
| Norway | — | 814,095 | — | 814,095 | ||||||||||||
| Panama | 115,779 | — | — | 115,779 | ||||||||||||
| Philippines | — | 710,163 | — | 710,163 | ||||||||||||
| Singapore | — | 172,330 | — | 172,330 | ||||||||||||
| Spain | — | 323,984 | — | 323,984 | ||||||||||||
| Sweden | — | 2,428,691 | — | 2,428,691 | ||||||||||||
| Switzerland | 543,690 | 1,970,277 | — | 2,513,967 | ||||||||||||
| Thailand | — | 42,242 | — | 42,242 | ||||||||||||
| United Kingdom | — | 3,972,805 | — | 3,972,805 | ||||||||||||
| United States | 23,399,009 | — | — | 23,399,009 | ||||||||||||
| Participatory Note | — | 702,346 | — | 702,346 | ||||||||||||
| Short-Term Investments (e) | 6,401,365 | — | — | 6,401,365 | ||||||||||||
| Total | $ | 35,357,486 | $ | 23,224,989 | $ | — | $ | 58,582,475 | ||||||||
There have been no transfers between fair value measurement levels during the year ended December 31, 2013.
(e) See Investment Portfolio for additional detailed categorizations.
The accompanying notes are an integral part of the financial statements.
| as of December 31, 2013 | ||||
| Assets | ||||
Investments: Investments in non-affiliated securities, at value (cost $45,968,476) — including $4,697,054 of securities loaned | 52,181,110 | |||
| Investment in Daily Assets Fund Institutional (cost $4,778,217)* | 4,778,217 | |||
| Investment in Central Cash Management Fund (cost $1,623,148) | 1,623,148 | |||
| Total investments in securities, at value (cost $52,369,841) | 58,582,475 | |||
| Cash | 12 | |||
| Foreign currency, at value (cost $133,005) | 129,805 | |||
| Receivable for investments sold | 67,225 | |||
| Receivable for Fund shares sold | 26 | |||
| Dividends receivable | 27,842 | |||
| Interest receivable | 68 | |||
| Foreign taxes recoverable | 25,891 | |||
| Due from Advisor | 10,657 | |||
| Other assets | 1,067 | |||
| Total assets | 58,845,068 | |||
| Liabilities | ||||
| Payable upon return of securities loaned | 4,778,217 | |||
| Payable for investments purchased | 35,919 | |||
| Payable for Fund shares redeemed | 38,836 | |||
| Accrued Trustees' fees | 922 | |||
| Other accrued expenses and payables | 36,903 | |||
| Total liabilities | 4,890,797 | |||
| Net assets, at value | 53,954,271 | |||
| Net Assets Consist of | ||||
| Undistributed net investment income | 478,685 | |||
Net unrealized appreciation (depreciation) on: Investments | 6,212,634 | |||
| Foreign currency | (2,661 | ) | ||
| Accumulated net realized gain (loss) | (44,269,489 | ) | ||
| Paid-in capital | 91,535,102 | |||
| Net assets, at value | 53,954,271 | |||
Class A Net Asset Value, offering and redemption price per share ($51,207,041 ÷ 4,601,327 outstanding shares of beneficial interest, no par value, unlimited number of shares authorized) | $ | 11.13 | ||
Class B Net Asset Value, offering and redemption price per share ($2,747,230 ÷ 246,555 outstanding shares of beneficial interest, no par value, unlimited number of shares authorized) | $ | 11.14 | ||
* Represents collateral on securities loaned.
The accompanying notes are an integral part of the financial statements.
Statement of Operations
| for the year ended December 31, 2013 | ||||
| Investment Income | ||||
Income: Dividends (net of foreign taxes withheld of $63,811) | $ | 966,040 | ||
| Income distributions — Central Cash Management Fund | 842 | |||
| Securities lending income, including income from Daily Assets Fund Institutional, net of borrower rebates | 23,222 | |||
| Total income | 990,104 | |||
Expenses: Management fee | 481,790 | |||
| Administration fee | 52,655 | |||
| Services to shareholders | 1,464 | |||
| Record keeping fees (Class B) | 2,995 | |||
| Distribution service fee (Class B) | 6,995 | |||
| Custodian fee | 75,614 | |||
| Audit and tax fees | 65,235 | |||
| Legal fees | 10,969 | |||
| Reports to shareholders | 34,980 | |||
| Trustees' fees and expenses | 3,622 | |||
| Other | 38,311 | |||
| Total expenses before expense reductions | 774,630 | |||
| Expense reductions | (302,929 | ) | ||
| Total expenses after expense reductions | 471,701 | |||
| Net investment income (loss) | 518,403 | |||
| Realized and Unrealized Gain (Loss) | ||||
Net realized gain (loss) from: Investments | 9,034,848 | |||
| Foreign currency | (30,900 | ) | ||
| 9,003,948 | ||||
Change in net unrealized appreciation (depreciation) on: Investments | 1,092,224 | |||
| Foreign currency | (2,244 | ) | ||
| 1,089,980 | ||||
| Net gain (loss) | 10,093,928 | |||
| Net increase (decrease) in net assets resulting from operations | $ | 10,612,331 | ||
The accompanying notes are an integral part of the financial statements.
| Years Ended December 31, | ||||||||
| Increase (Decrease) in Net Assets | 2013 | 2012 | ||||||
Operations: Net investment income (loss) | $ | 518,403 | $ | 758,059 | ||||
| Net realized gain (loss) | 9,003,948 | 97,908 | ||||||
| Change in net unrealized appreciation (depreciation) | 1,089,980 | 8,394,806 | ||||||
| Net increase (decrease) in net assets resulting from operations | 10,612,331 | 9,250,773 | ||||||
Distributions to shareholders from: Net investment income: Class A | (689,482 | ) | (741,039 | ) | ||||
| Class B | (27,740 | ) | (31,068 | ) | ||||
| Total distributions | (717,222 | ) | (772,107 | ) | ||||
Fund share transactions: Class A Proceeds from shares sold | 4,242,450 | 7,619,915 | ||||||
| Reinvestment of distributions | 689,482 | 741,039 | ||||||
| Payments for shares redeemed | (16,663,817 | ) | (12,066,736 | ) | ||||
| Net increase (decrease) in net assets from Class A share transactions | (11,731,885 | ) | (3,705,782 | ) | ||||
Class B Proceeds from shares sold | 147,425 | 80,402 | ||||||
| Reinvestment of distributions | 27,740 | 31,068 | ||||||
| Payments for shares redeemed | (823,023 | ) | (823,480 | ) | ||||
| Net increase (decrease) in net assets from Class B share transactions | (647,858 | ) | (712,010 | ) | ||||
| Increase (decrease) in net assets | (2,484,634 | ) | 4,060,874 | |||||
| Net assets at beginning of period | 56,438,905 | 52,378,031 | ||||||
Net assets at end of period (including undistributed net investment income of $478,685 and $696,736, respectively) | $ | 53,954,271 | $ | 56,438,905 | ||||
| Other Information | ||||||||
Class A Shares outstanding at beginning of period | 5,793,732 | 6,234,878 | ||||||
| Shares sold | 422,826 | 882,663 | ||||||
| Shares issued to shareholders in reinvestment of distributions | 71,746 | 85,967 | ||||||
| Shares redeemed | (1,686,977 | ) | (1,409,776 | ) | ||||
| Net increase (decrease) in Class A shares | (1,192,405 | ) | (441,146 | ) | ||||
| Shares outstanding at end of period | 4,601,327 | 5,793,732 | ||||||
Class B Shares outstanding at beginning of period | 311,300 | 393,322 | ||||||
| Shares sold | 14,554 | 9,525 | ||||||
| Shares issued to shareholders in reinvestment of distributions | 2,878 | 3,592 | ||||||
| Shares redeemed | (82,177 | ) | (95,139 | ) | ||||
| Net increase (decrease) in Class B shares | (64,745 | ) | (82,022 | ) | ||||
| Shares outstanding at end of period | 246,555 | 311,300 | ||||||
The accompanying notes are an integral part of the financial statements.
| Years Ended December 31, | |||||||||||||||||||||
| Class A | 2013 | 2012 | 2011 | 2010 | 2009 | ||||||||||||||||
| Selected Per Share Data | |||||||||||||||||||||
| Net asset value, beginning of period | $ | 9.24 | $ | 7.90 | $ | 9.28 | $ | 8.24 | $ | 5.84 | |||||||||||
Income (loss) from investment operations: Net investment incomea | .10 | .12 | .11 | .06 | .08 | ||||||||||||||||
| Net realized and unrealized gain (loss) | 1.92 | 1.34 | (1.43 | ) | 1.06 | 2.42 | |||||||||||||||
| Total from investment operations | 2.02 | 1.46 | (1.32 | ) | 1.12 | 2.50 | |||||||||||||||
Less distributions from: Net investment income | (.13 | ) | (.12 | ) | (.06 | ) | (.08 | ) | (.10 | ) | |||||||||||
| Total distributions | (.13 | ) | (.12 | ) | (.06 | ) | (.08 | ) | (.10 | ) | |||||||||||
| Net asset value, end of period | $ | 11.13 | $ | 9.24 | $ | 7.90 | $ | 9.28 | $ | 8.24 | |||||||||||
Total Return (%)b | 22.08 | 18.60 | (14.39 | ) | 13.65 | 43.82 | |||||||||||||||
| Ratios to Average Net Assets and Supplemental Data | |||||||||||||||||||||
| Net assets, end of period ($ millions) | 51 | 54 | 49 | 68 | 66 | ||||||||||||||||
| Ratio of expenses before expense reductions (%) | 1.45 | 1.42 | 1.37 | 1.41 | 1.38 | ||||||||||||||||
| Ratio of expenses after expense reductions (%) | .88 | .99 | 1.03 | 1.05 | 1.04 | ||||||||||||||||
| Ratio of net investment income (%) | 1.00 | 1.40 | 1.24 | .77 | 1.23 | ||||||||||||||||
| Portfolio turnover rate (%) | 171 | 107 | 127 | 165 | 190 | ||||||||||||||||
a Based on average shares outstanding during the period. b Total return would have been lower had certain expenses not been reduced. | |||||||||||||||||||||
| Years Ended December 31, | |||||||||||||||||||||
| Class B | 2013 | 2012 | 2011 | 2010 | 2009 | ||||||||||||||||
| Selected Per Share Data | |||||||||||||||||||||
| Net asset value, beginning of period | $ | 9.25 | $ | 7.91 | $ | 9.29 | $ | 8.25 | $ | 5.85 | |||||||||||
Income (loss) from investment operations: Net investment incomea | .07 | .09 | .08 | .04 | .06 | ||||||||||||||||
| Net realized and unrealized gain (loss) | 1.92 | 1.34 | (1.44 | ) | 1.05 | 2.42 | |||||||||||||||
| Total from investment operations | 1.99 | 1.43 | (1.36 | ) | 1.09 | 2.48 | |||||||||||||||
Less distributions from: Net investment income | (.10 | ) | (.09 | ) | (.02 | ) | (.05 | ) | (.08 | ) | |||||||||||
| Total distributions | (.10 | ) | (.09 | ) | (.02 | ) | (.05 | ) | (.08 | ) | |||||||||||
| Net asset value, end of period | $ | 11.14 | $ | 9.25 | $ | 7.91 | $ | 9.29 | $ | 8.25 | |||||||||||
Total Return (%)b | 21.62 | 18.16 | (14.67 | ) | 13.24 | 43.23 | |||||||||||||||
| Ratios to Average Net Assets and Supplemental Data | |||||||||||||||||||||
| Net assets, end of period ($ millions) | 3 | 3 | 3 | 5 | 5 | ||||||||||||||||
| Ratio of expenses before expense reductions (%) | 1.81 | 1.76 | 1.72 | 1.76 | 1.73 | ||||||||||||||||
| Ratio of expenses after expense reductions (%) | 1.23 | 1.34 | 1.38 | 1.40 | 1.39 | ||||||||||||||||
| Ratio of net investment income (%) | .66 | 1.04 | .88 | .42 | .88 | ||||||||||||||||
| Portfolio turnover rate (%) | 171 | 107 | 127 | 165 | 190 | ||||||||||||||||
a Based on average shares outstanding during the period. b Total return would have been lower had certain expenses not been reduced. | |||||||||||||||||||||
A. Organization and Significant Accounting Policies
DWS Global Growth VIP (formerly DWS Global Thematic VIP) (the "Fund") is a diversified series of DWS Variable Series II (the "Trust"), which is registered under the Investment Company Act of 1940, as amended (the "1940 Act"), as an open-end management investment company organized as a Massachusetts business trust.
Multiple Classes of Shares of Beneficial Interest. The Fund offers two classes of shares (Class A shares and Class B shares). Sales of Class B shares are subject to recordkeeping fees up to 0.15% and Rule 12b-1 fees under the 1940 Act equal to an annual rate of 0.25% of the average daily net assets for Class B shares of the Fund. Class A shares are not subject to such fees.
Investment income, realized and unrealized gains and losses, and certain fund-level expenses and expense reductions, if any, are borne pro rata on the basis of relative net assets by the holders of all classes of shares except that each class bears certain expenses unique to that class (including the applicable Rule 12b-1 fee and recordkeeping fees). Differences in class-level expenses may result in payment of different per share dividends by class. All shares have equal rights with respect to voting subject to class-specific arrangements.
The Fund's financial statements are prepared in accordance with accounting principles generally accepted in the United States of America which require the use of management estimates. Actual results could differ from those estimates. The policies described below are followed consistently by the Fund in the preparation of its financial statements.
Security Valuation. Investments are stated at value determined as of the close of regular trading on the New York Stock Exchange on each day the exchange is open for trading.
Various inputs are used in determining the value of the Fund's investments. These inputs are summarized in three broad levels. Level 1 includes quoted prices in active markets for identical securities. Level 2 includes other significant observable inputs (including quoted prices for similar securities, interest rates, prepayment speeds and credit risk). Level 3 includes significant unobservable inputs (including the Fund's own assumptions in determining the fair value of investments). The level assigned to the securities valuations may not be an indication of the risk or liquidity associated with investing in those securities.
Equity securities are valued at the most recent sale price or official closing price reported on the exchange (U.S. or foreign) or over-the-counter market on which they trade and are categorized as Level 1 securities. Securities for which no sales are reported are valued at the calculated mean between the most recent bid and asked quotations on the relevant market or, if a mean cannot be determined, at the most recent bid quotation. For certain international equity securities, in order to adjust for events which may occur between the close of the foreign exchanges and the close of the New York Stock Exchange, a fair valuation model may be used. This fair valuation model takes into account comparisons to the valuation of American Depository Receipts (ADRs), exchange-traded funds, futures contracts and certain indices and these securities are categorized as Level 2.
Investments in open-end investment companies are valued at their net asset value each business day and are categorized as Level 1.
Securities and other assets for which market quotations are not readily available or for which the above valuation procedures are deemed not to reflect fair value are valued in a manner that is intended to reflect their fair value as determined in accordance with procedures approved by the Board and are generally categorized as Level 3. In accordance with the Fund's valuation procedures, factors used in determining value may include, but are not limited to, the type of the security; the size of the holding; the initial cost of the security; the existence of any contractual restrictions on the security's disposition; the price and extent of public trading in similar securities of the issuer or of comparable companies; quotations or evaluated prices from broker-dealers and/or pricing services; information obtained from the issuer, analysts, and/or the appropriate stock exchange (for exchange-traded securities); an analysis of the company's or issuer's financial statements; an evaluation of the forces that influence the issuer and the market(s) in which the security is purchased and sold; and with respect to debt securities, the maturity, coupon, creditworthiness, currency denomination and the movement of the market in which the security is normally traded. The value determined under these procedures may differ from published values for the same securities.
Disclosure about the classification of fair value measurements is included in a table following the Fund's Investment Portfolio.
Foreign Currency Translations. The books and records of the Fund are maintained in U.S. dollars. Investment securities and other assets and liabilities denominated in a foreign currency are translated into U.S. dollars at the prevailing exchange rates at period end. Purchases and sales of investment securities, income and expenses are translated into U.S. dollars at the prevailing exchange rates on the respective dates of the transactions.
Net realized and unrealized gains and losses on foreign currency transactions represent net gains and losses between trade and settlement dates on securities transactions, the acquisition and disposition of foreign currencies, and the difference between the amount of net investment income accrued and the U.S. dollar amount actually received. That portion of both realized and unrealized gains and losses on investments that results from fluctuations in foreign currency exchange rates is not separately disclosed but is included with net realized and unrealized gain/appreciation and loss/depreciation on investments.
Securities Lending. Brown Brothers Harriman & Co., as lending agent, lends securities of the Fund to certain financial institutions under the terms of the Security Lending Agreement. The Fund retains the benefits of owning the securities it has loaned and continues to receive interest and dividends generated by the securities and to participate in any changes in their market value. The Fund requires the borrowers of the securities to maintain collateral with the Fund consisting of either cash or liquid, unencumbered assets having a value at least equal to the value of the securities loaned. When the collateral falls below specified amounts, the lending agent will use its best effort to obtain additional collateral on the next business day to meet required amounts under the security lending agreement. The Fund may invest the cash collateral into a joint trading account in an affiliated money market fund pursuant to Exemptive Orders issued by the SEC. The Fund receives compensation for lending its securities either in the form of fees or by earning interest on invested cash collateral net of borrower rebates and fees paid to a lending agent. Either the Fund or the borrower may terminate the loan. There may be risks of delay and costs in recovery of securities or even loss of rights in the collateral should the borrower of the securities fail financially. If the Fund is not able to recover securities lent, the Fund may sell the collateral and purchase a replacement investment in the market, incurring the risk that the value of the replacement security is greater than the value of the collateral. The Fund is also subject to all investment risks associated with the reinvestment of any cash collateral received, including, but not limited to, interest rate, credit and liquidity risk associated with such investments.
As of December 31, 2013, the Fund had securities on loan. The value of the related collateral exceeded the value of the securities loaned at period end.
Participatory Notes. The Fund invests in Participatory Notes (P-Notes). P-Notes are promissory notes designed to offer a return linked to the performance of a particular underlying equity security or market. P-Notes are issued by banks or broker-dealers and allow the Fund to gain exposure to local shares in foreign markets. Investments in P-Notes involve the same risks associated with a direct investment in the underlying foreign companies or foreign markets that they seek to replicate. Although each participation note is structured with a defined maturity date, early redemption may be possible. Risks associated with participation notes include the possible failure of a counterparty to perform in accordance with the terms of the agreement and potential delays or an inability to redeem before maturity under certain market conditions.
Taxes. The Fund's policy is to comply with the requirements of the Internal Revenue Code, as amended, which are applicable to regulated investment companies and to distribute all of its taxable income to its shareholders.
Additionally, the Fund may be subject to taxes imposed by the governments of countries in which it invests and are generally based on income and/or capital gains earned or repatriated. Estimated tax liabilities on certain foreign securities are recorded on an accrual basis and are reflected as components of interest income or net change in unrealized gain/loss on investments. Tax liabilities realized as a result of security sales are reflected as a component of net realized gain/loss on investments.
Under the Regulated Investment Company Modernization Act of 2010, net capital losses incurred post-enactment may be carried forward indefinitely, and their character is retained as short-term and/or long-term. Previously, net capital losses were carried forward for eight years and treated as short-term. As a transition rule, the Act requires that post-enactment net capital losses be used before pre-enactment net capital losses.
At December 31, 2013, the Fund had a net tax basis capital loss carryforward of approximately $44,211,000 of pre-enactment losses, which may be applied against any realized net taxable capital gains of each succeeding year until fully utilized or until December 31, 2016 ($26,421,000) and December 31, 2017 ($17,790,000), the respective expiration dates, whichever occurs first.
The Fund has reviewed the tax positions for the open tax years as of December 31, 2013 and has determined that no provision for income tax is required in the Fund's financial statements. The Fund's federal tax returns for the prior three fiscal years remain open subject to examination by the Internal Revenue Service.
Distribution of Income and Gains. Distributions from net investment income of the Fund, if any, are declared and distributed to shareholders annually. Net realized gains from investment transactions, in excess of available capital loss carryforwards, would be taxable to the Fund if not distributed and, therefore, will be distributed to shareholders at least annually. The Fund may also make additional distributions for tax purposes if necessary.
The timing and characterization of certain income and capital gain distributions are determined annually in accordance with federal tax regulations which may differ from accounting principles generally accepted in the United States of America. These differences primarily relate to investments in foreign denominated investments, income received from Passive Foreign Investment Companies and certain securities sold at a loss. As a result, net investment income (loss) and net realized gain (loss) on investment transactions for a reporting period may differ significantly from distributions during such period. Accordingly, the Fund may periodically make reclassifications among certain of its capital accounts without impacting the net asset value of the Fund.
At December 31, 2013, the Fund's components of distributable earnings on a tax basis were as follows:
| Undistributed ordinary income* | $ | 530,306 | ||
| Capital loss carryforwards | $ | (44,211,000 | ) | |
| Unrealized appreciation (depreciation) on investments | $ | 6,101,535 |
In addition, the tax character of distributions paid by the Fund is summarized as follows:
| Years Ended December 31, | ||||||||
| 2013 | 2012 | |||||||
| Distributions from ordinary income* | $ | 717,222 | $ | 772,107 | ||||
* For tax purposes, short-term capital gain distributions are considered ordinary income distributions.
Expenses. Expenses of the Trust arising in connection with a specific fund are allocated to that fund. Other Trust expenses which cannot be directly attributed to a fund are apportioned among the funds in the Trust based upon the relative net assets or other appropriate measures.
Contingencies. In the normal course of business, the Fund may enter into contracts with service providers that contain general indemnification clauses. The Fund's maximum exposure under these arrangements is unknown as this would involve future claims that may be made against the Fund that have not yet been made. However, based on experience, the Fund expects the risk of loss to be remote.
Other. Investment transactions are accounted for on a trade date plus one basis for daily net asset value calculations. However, for financial reporting purposes, investment transactions are reported on trade date. Interest income is recorded on the accrual basis. Dividend income is recorded on the ex-dividend date net of foreign withholding taxes. Certain dividends from foreign securities may be recorded subsequent to the ex-dividend date as soon as the Fund is informed of such dividends. Realized gains and losses from investment transactions are recorded on an identified cost basis. Proceeds from litigation payments, if any, are included in net realized gain (loss) from investments.
B. Purchases and Sales of Securities
During the year ended December 31, 2013, purchases and sales of investment transactions (excluding short-term investments) aggregated $88,360,238 and $102,273,315, respectively.
C. Related Parties
Management Agreement. Under the Investment Management Agreement with Deutsche Investment Management Americas Inc. ("DIMA" or the "Advisor"), an indirect, wholly owned subsidiary of Deutsche Bank AG, the Advisor directs the investments of the Fund in accordance with its investment objectives, policies and restrictions. The Advisor determines the securities, instruments and other contracts relating to investments to be purchased, sold or entered into by the Fund or delegates such responsibility to the Fund's subadvisor.
Global Thematic Partners, LLC ("GTP") served as subadvisor to the Fund through April 30, 2013. GTP or the "Subadvisor" was paid by the Advisor for the service GTP provided to the Fund. Effective as of the close of business on April 30, 2013, the sub-advisory agreement with GTP was terminated and day-to-day portfolio management of the Fund transitioned to DIMA. At that time, the Fund's name changed from "DWS Global Thematic VIP" to "DWS Global Growth VIP."
Pursuant to the Investment Management Agreement with the Advisor, the Fund pays a monthly management fee based on the Fund's average daily net assets, computed and accrued daily and payable monthly, at the following annual rates:
| First $250 million | .915 | % | ||
| Next $500 million | .865 | % | ||
| Next $750 million | .815 | % | ||
| Next $1.5 billion | .765 | % | ||
| Over $3 billion | .715 | % |
For the period from January 1, 2013 through September 30, 2013, the Advisor had contractually agreed to waive its fee and/or reimburse certain operating expenses to the extent necessary to maintain the operating expenses (excluding certain expenses such as extraordinary expenses, taxes, brokerage and interest expense) of each class as follows:
| Class A | .90% |
| Class B | 1.25% |
Effective October 1, 2013 through September 30, 2014, the Advisor has contractually agreed to waive its fee and/or reimburse certain operating expenses to the extent necessary to maintain the operating expenses (excluding certain expenses such as extraordinary expenses, taxes, brokerage and interest expense) of each class as follows:
| Class A | .80% |
| Class B | 1.15% |
Accordingly, for the year ended December 31, 2013, the Advisor waived a portion of its management fee pursuant to the Investment Management Agreement aggregating $302,436, and the amount charged aggregated $179,354, which was equivalent to an annual effective rate of 0.34% of the Fund's average daily net assets.
Administration Fee. Pursuant to an Administrative Services Agreement, DIMA provides most administrative services to the Fund. For all services provided under the Administrative Services Agreement, the Fund pays DIMA an annual fee ("Administration Fee") of 0.10% of the Fund's average daily net assets, computed and accrued daily and payable monthly. For the year ended December 31, 2013, the Administration Fee was $52,655, of which $4,436 is unpaid.
Service Provider Fees. DWS Investments Service Company ("DISC"), an affiliate of the Advisor, is the transfer agent, dividend-paying agent and shareholder service agent for the Fund. Pursuant to a sub-transfer agency agreement between DISC and DST Systems, Inc. ("DST"), DISC has delegated certain transfer agent, dividend-paying agent and shareholder service agent functions to DST. DISC compensates DST out of the shareholder servicing fee it receives from the Fund. For the year ended December 31, 2013, the amounts charged to the Fund by DISC were as follows:
| Services to Shareholders | Total Aggregated | Waived | ||||||
| Class A | $ | 285 | $ | 285 | ||||
| Class B | 71 | 71 | ||||||
| $ | 356 | $ | 356 | |||||
In addition, for the year ended December 31, 2013, the Advisor reimbursed the Fund $137 of recordkeeping fees for Class B shares.
Distribution Service Agreement. Under the Fund's Class B 12b-1 plans, DWS Investments Distributors, Inc. ("DIDI") received a fee ("Distribution Service Fee") of 0.25% of average daily net assets of Class B shares. For the year ended December 31, 2013, the Distribution Service Fee aggregated $6,995, of which $568 is unpaid.
Typesetting and Filing Service Fees. Under an agreement with DIMA, DIMA is compensated for providing typesetting and certain regulatory filing services to the Fund. For the year ended December 31, 2013, the amount charged to the Fund by DIMA included in the Statement of Operations under "reports to shareholders" aggregated $19,139, of which $4,496 is unpaid.
Trustees' Fees and Expenses. The Fund paid retainer fees to each Trustee not affiliated with the Advisor, plus specified amounts to the Board Chairperson and Vice Chairperson and to each committee Chairperson.
Affiliated Cash Management Vehicles. The Fund may invest uninvested cash balances in Central Cash Management Fund and DWS Variable NAV Money Fund, affiliated money market funds which are managed by the Advisor. Each affiliated money market fund seeks to provide a high level of current income consistent with liquidity and the preservation of capital. Each affiliated money market fund is managed in accordance with Rule 2a-7 under the Investment Company Act of 1940, which governs the quality, maturity, diversity and liquidity of instruments in which a money market fund may invest. Central Cash Management Fund seeks to maintain a stable net asset value, and DWS Variable NAV Money Fund maintains a floating net asset value. The Fund indirectly bears its proportionate share of the expenses of each affiliated money market fund in which it invests. Central Cash Management Fund does not pay the Advisor an investment management fee. To the extent that DWS Variable NAV Money Fund pays an investment management fee to the Advisor, the Advisor will waive an amount of the investment management fee payable to the Advisor by the Fund equal to the amount of the investment management fee payable on the Fund's assets invested in DWS Variable NAV Money Fund.
D. Investing in Emerging Markets
Investing in emerging markets may involve special risks and considerations not typically associated with investing in developed markets. These risks include revaluation of currencies, high rates of inflation or deflation, repatriation restrictions on income and capital, and future adverse political, social and economic developments. Moreover, securities issued in these markets may be less liquid, subject to government ownership controls or delayed settlements, and may have prices that are more volatile or less easily assessed than those of comparable securities of issuers in developed markets.
E. Ownership of the Fund
At December 31, 2013, two participating insurance companies were owners of record of 10% or more of the total outstanding Class A shares of the Fund, each owning 71% and 24%. One participating insurance company was the owner of record of 10% or more of the total outstanding Class B shares of the Fund, owning 96%.
F. Line of Credit
The Fund and other affiliated funds (the "Participants") share in a $375 million revolving credit facility provided by a syndication of banks. The Fund may borrow for temporary or emergency purposes, including the meeting of redemption requests that otherwise might require the untimely disposition of securities. The Participants are charged an annual commitment fee which is allocated based on net assets, among each of the Participants. Interest is calculated at a rate per annum equal to the sum of the Federal Funds Rate plus 1.25 percent plus if LIBOR exceeds the Federal Funds Rate the amount of such excess. The Fund may borrow up to a maximum of 33 percent of its net assets under the agreement. The Fund had no outstanding loans at December 31, 2013.
To the Board of Trustees of DWS Variable Series II and Shareholders of DWS Global Growth VIP:
We have audited the accompanying statement of assets and liabilities, including the investment portfolio, of DWS Global Growth VIP (formerly, DWS Global Thematic VIP) (the "Fund") (one of the funds constituting DWS Variable Series II), as of December 31, 2013, and the related statement of operations for the year then ended, the statements of changes in net assets for each of the two years in the period then ended, and the financial highlights for each of the five years in the period then ended. These financial statements and financial highlights are the responsibility of the Fund's management. Our responsibility is to express an opinion on these financial statements and financial highlights based on our audits.
We conducted our audits in accordance with the standards of the Public Company Accounting Oversight Board (United States). Those standards require that we plan and perform the audit to obtain reasonable assurance about whether the financial statements and financial highlights are free of material misstatement. We were not engaged to perform an audit of the Fund's internal control over financial reporting. Our audits included consideration of internal control over financial reporting as a basis for designing audit procedures that are appropriate in the circumstances, but not for the purpose of expressing an opinion on the effectiveness of the Fund's internal control over financial reporting. Accordingly, we express no such opinion. An audit also includes examining, on a test basis, evidence supporting the amounts and disclosures in the financial statements and financial highlights, assessing the accounting principles used and significant estimates made by management, and evaluating the overall financial statement presentation. Our procedures included confirmation of securities owned as of December 31, 2013, by correspondence with the custodian and brokers, or by other appropriate auditing procedures where replies from brokers were not received. We believe that our audits provide a reasonable basis for our opinion.
In our opinion, the financial statements and financial highlights referred to above present fairly, in all material respects, the financial position of DWS Global Growth VIP (formerly, DWS Global Thematic VIP) (one of the funds constituting DWS Variable Series II) at December 31, 2013, the results of its operations for the year then ended, the changes in its net assets for each of the two years in the period then ended, and the financial highlights for each of the five years in the period then ended, in conformity with U.S. generally accepted accounting principles.
| ||
Boston, Massachusetts February 14, 2014 |
As an investor of the Fund, you incur two types of costs: ongoing expenses and transaction costs. Ongoing expenses include management fees, distribution and service (12b-1) fees and other Fund expenses. Examples of transaction costs include contract charges, redemption fees and account maintenance fees, which are not shown in this section. The following tables are intended to help you understand your ongoing expenses (in dollars) of investing in the Fund and to help you compare these expenses with the ongoing expenses of investing in other mutual funds. In the most recent six-month period, the Fund limited these expenses; had it not done so, expenses would have been higher. The example in the table is based on an investment of $1,000 invested at the beginning of the six-month period and held for the entire period (July 1, 2013 to December 31, 2013).
The tables illustrate your Fund's expenses in two ways:
—Actual Fund Return. This helps you estimate the actual dollar amount of ongoing expenses (but not transaction costs) paid on a $1,000 investment in the Fund using the Fund's actual return during the period. To estimate the expenses you paid over the period, simply divide your account value by $1,000 (for example, an $8,600 account value divided by $1,000 = 8.6), then multiply the result by the number in the "Expenses Paid per $1,000" line under the share class you hold.
— Hypothetical 5% Fund Return. This helps you to compare your Fund's ongoing expenses (but not transaction costs) with those of other mutual funds using the Fund's actual expense ratio and a hypothetical rate of return of 5% per year before expenses. Examples using a 5% hypothetical Fund return may be found in the shareholder reports of other mutual funds. The hypothetical account values and expenses may not be used to estimate the actual ending account balance or expenses you paid for the period.
Please note that the expenses shown in these tables are meant to highlight your ongoing expenses only and do not reflect any transaction costs. The "Expenses Paid per $1,000" line of the tables is useful in comparing ongoing expenses only and will not help you determine the relative total expense of owning different funds. If these transaction costs had been included, your costs would have been higher.
Expenses and Value of a $1,000 Investment for the six months ended December 31, 2013 | ||||||||
| Actual Fund Return | Class A | Class B | ||||||
| Beginning Account Value 7/1/13 | $ | 1,000.00 | $ | 1,000.00 | ||||
| Ending Account Value 12/31/13 | $ | 1,166.70 | $ | 1,164.10 | ||||
| Expenses Paid per $1,000* | $ | 4.64 | $ | 6.55 | ||||
| Hypothetical 5% Fund Return | Class A | Class B | ||||||
| Beginning Account Value 7/1/13 | $ | 1,000.00 | $ | 1,000.00 | ||||
| Ending Account Value 12/31/13 | $ | 1,020.92 | $ | 1,019.16 | ||||
| Expenses Paid per $1,000* | $ | 4.33 | $ | 6.11 | ||||
* Expenses are equal to the Fund's annualized expense ratio for each share class, multiplied by the average account value over the period, multiplied by 184 (the number of days in the most recent six-month period), then divided by 365.
| Annualized Expense Ratios | Class A | Class B | ||
| DWS Variable Series II — DWS Global Growth VIP | .85% | 1.20% |
For more information, please refer to the Fund's prospectus.
These tables do not reflect charges and fees ("contract charges") associated with the separate account that invests in the Fund or any variable life insurance policy or variable annuity contract for which the Fund is an investment option.
For an analysis of the fees associated with an investment in the fund or similar funds, please refer to the current and hypothetical expense calculators for Variable Insurance Products which can be found at dws-investments.com/EN/resources/calculators.jsp.
For corporate shareholders, 22% of the ordinary dividends (i.e., income dividends plus short-term capital gains) paid during the Fund's fiscal year ended December 31, 2013, qualified for the dividends received deduction.
Please consult a tax advisor if you have questions about federal or state income tax laws, or on how to prepare your tax returns. If you have specific questions about your account, please contact your insurance provider.
The Trust's policies and procedures for voting proxies for portfolio securities and information about how the Trust voted proxies related to its portfolio securities during the 12-month period ended June 30 are available on our Web site — dws-investments.com (click on "proxy voting" at the bottom of the page) — or on the SEC's Web site — sec.gov. To obtain a written copy of the Trust's policies and procedures without charge, upon request, call us toll free at (800) 728-3337.
The Board of Trustees approved the renewal of DWS Global Growth VIP's investment management agreement (the "Agreement") with Deutsche Investment Management Americas Inc. ("DIMA") in September 2013.
In terms of the process that the Board followed prior to approving the Agreement, shareholders should know that:
— In September 2013, all but one of the Fund's Trustees were independent of DIMA and its affiliates.
— The Trustees met frequently during the past year to discuss fund matters and dedicated a substantial amount of time to contract review matters. Over the course of several months, the Board's Contract Committee, in coordination with the Board's Equity Oversight Committee, reviewed comprehensive materials received from DIMA, independent third parties and independent counsel. These materials included an analysis of the Fund's performance, fees and expenses, and profitability compiled by a fee consultant retained by the Fund's Independent Trustees (the "Fee Consultant"). The Board also received extensive information throughout the year regarding performance of the Fund.
— The Independent Trustees regularly meet privately with their independent counsel to discuss contract review and other matters. In addition, the Independent Trustees were also advised by the Fee Consultant in the course of their review of the Fund's contractual arrangements and considered a comprehensive report prepared by the Fee Consultant in connection with their deliberations.
— In connection with reviewing the Agreement, the Board also reviewed the terms of the Fund's Rule 12b-1 plan, distribution agreement, administrative services agreement, transfer agency agreement and other material service agreements.
— Based on its evaluation of the information provided, the Contract Committee presented its findings and recommendations to the Board. The Board then reviewed the Contract Committee's findings and recommendations.
In connection with the contract review process, the Contract Committee and the Board considered the factors discussed below, among others. The Board also considered that DIMA and its predecessors have managed the Fund since its inception, and the Board believes that a long-term relationship with a capable, conscientious advisor is in the best interests of the Fund. The Board considered, generally, that shareholders chose to invest or remain invested in the Fund knowing that DIMA managed the Fund, and that the Agreement was approved by the Fund's shareholders. DIMA is part of Deutsche Bank AG, a major global banking institution that is engaged in a wide range of financial services. The Board believes that there are advantages to being part of a global asset management business that offers a wide range of investing expertise and resources, including hundreds of portfolio managers and analysts with research capabilities in many countries throughout the world.
As part of the contract review process, the Board carefully considered the fees and expenses of each DWS fund overseen by the Board in light of the fund's performance. In many cases, this led to a negotiation with DIMA of lower expense caps as part of the 2012 and 2013 contract review processes than had previously been in place. As part of these negotiations, the Board indicated that it would consider relaxing these new lower caps in future years following sustained improvements in performance, among other considerations.
In June 2012, Deutsche Bank AG ("DB"), DIMA's parent company, announced that DB would combine its Asset Management (of which DIMA was a part) and Wealth Management divisions. DB has advised the Independent Trustees that the U.S. asset management business is a critical and integral part of DB, and that it has, and will continue to, reinvest a significant portion of the substantial savings it expects to realize by combining its Asset Management and Wealth Management divisions into the new Asset and Wealth Management ("AWM") division, including ongoing enhancements to its investment capabilities. DB also has confirmed its commitment to maintaining strong legal and compliance groups within the AWM division.
While shareholders may focus primarily on fund performance and fees, the Fund's Board considers these and many other factors, including the quality and integrity of DIMA's personnel and such other issues as back-office operations, fund valuations, and compliance policies and procedures.
Nature, Quality and Extent of Services. The Board considered the terms of the Agreement, including the scope of advisory services provided under the Agreement. The Board noted that, under the Agreement, DIMA provides portfolio management services to the Fund and that, pursuant to a separate administrative services agreement, DIMA provides administrative services to the Fund. The Board considered the experience and skills of senior management and investment personnel, the resources made available to such personnel, the ability of DIMA to attract and retain high-quality personnel, and the organizational depth and stability of DIMA. The Board reviewed the Fund's performance over short-term and long-term periods and compared those returns to various agreed-upon performance measures, including market indices and a peer universe compiled by the Fee Consultant using information supplied by Morningstar Direct ("Morningstar"), an independent fund data service. The Board also noted that it has put into place a process of identifying "Focus Funds" (e.g., funds performing poorly relative to their benchmark or a peer universe compiled by an independent fund data service), and receives more frequent reporting and information from DIMA regarding such funds, along with DIMA's remedial plans to address underperformance. The Board believes this process is an effective manner of identifying and addressing underperforming funds. Based on the information provided, the Board noted that for the one-, three- and five-year periods ended December 31, 2012, the Fund's performance (Class A shares) was in the 3rd quartile, 4th quartile and 4th quartile, respectively, of the applicable Morningstar universe (the 1st quartile being the best performers and the 4th quartile being the worst performers). The Board also observed that the Fund has outperformed its benchmark in the one-year period and has underperformed its benchmark in the three- and five-year periods ended December 31, 2012. The Board noted the disappointing investment performance of the Fund in recent periods and continued to discuss with senior management of DIMA the factors contributing to such underperformance and actions being taken to improve performance. The Board recognized that DIMA has made changes to its investment personnel and processes in recent years in an effort to enhance its investment platform and improve long-term performance across the DWS fund complex.
Fees and Expenses. The Board considered the Fund's investment management fee schedule, operating expenses and total expense ratios, and comparative information provided by Lipper Inc. ("Lipper") and the Fee Consultant regarding investment management fee rates paid to other investment advisors by similar funds (1st quartile being the most favorable and 4th quartile being the least favorable). With respect to management fees paid to other investment advisors by similar funds, the Board noted that the contractual fee rates paid by the Fund, which include a 0.10% fee paid to DIMA under the Fund's administrative services agreement, were higher than the median (4th quartile) of the applicable Lipper peer group (based on Lipper data provided as of December 31, 2012). The Board noted that the Fund's Class A shares total (net) operating expenses were expected to be lower than the median (2nd quartile) of the applicable Lipper expense universe (based on Lipper data provided as of December 31, 2012, and analyzing Lipper expense universe Class A (net) expenses less any applicable 12b-1 fees) ("Lipper Universe Expenses"). The Board also reviewed data comparing each share class's total (net) operating expenses to the applicable Lipper Universe Expenses. The Board considered the Fund's management fee rate as compared to fees charged by DIMA to comparable funds and considered differences between the Fund and the comparable funds. The Board also considered how the Fund's total (net) operating expenses compared to the total (net) operating expenses of a more customized peer group selected by Lipper (based on such factors as asset size). The Board also noted that the expense limitations agreed to by DIMA helped to ensure that the Fund's total (net) operating expenses would remain competitive.
The information considered by the Board as part of its review of management fees included information regarding fees charged by DIMA and its affiliates to similar institutional accounts and to similar funds offered primarily to European investors ("DWS Europe funds"), in each case as applicable. The Board observed that advisory fee rates for institutional accounts generally were lower than the management fees charged by similarly managed DWS U.S. mutual funds ("DWS Funds"), but also took note of the differences in services provided to DWS Funds as compared to institutional accounts. In the case of DWS Europe funds, the Board observed that fee rates for DWS Europe funds generally were higher than for similarly managed DWS Funds, but noted that differences in the types of services provided to DWS Funds relative to DWS Europe funds made it difficult to compare such fees.
On the basis of the information provided, the Board concluded that management fees were reasonable and appropriate in light of the nature, quality and extent of services provided by DIMA.
Profitability. The Board reviewed detailed information regarding revenues received by DIMA under the Agreement. The Board considered the estimated costs and pre-tax profits realized by DIMA from advising the DWS Funds, as well as estimates of the pre-tax profits attributable to managing the Fund in particular. The Board also received information regarding the estimated enterprise-wide profitability of DWS and its affiliates with respect to all fund services in totality and by fund. The Board and the Fee Consultant reviewed DIMA's methodology in allocating its costs to the management of the Fund. Based on the information provided, the Board concluded that the pre-tax profits realized by DIMA in connection with the management of the Fund were not unreasonable. The Board also reviewed information regarding the profitability of certain similar investment management firms. The Board noted that while information regarding the profitability of such firms is limited (and in some cases is not necessarily prepared on a comparable basis), DIMA and its affiliates' overall profitability with respect to the DWS fund complex (after taking into account distribution and other services provided to the funds by DIMA and its affiliates) was lower than the overall profitability levels of many comparable firms for which such data was available.
Economies of Scale. The Board considered whether there are economies of scale with respect to the management of the Fund and whether the Fund benefits from any economies of scale. The Board noted that the Fund's management fee schedule includes fee breakpoints. The Board concluded that the Fund's fee schedule represents an appropriate sharing between the Fund and DIMA of such economies of scale as may exist in the management of the Fund at current asset levels.
Other Benefits to DIMA and Its Affiliates. The Board also considered the character and amount of other incidental benefits received by DIMA and its affiliates, including any fees received by DIMA for administrative services provided to the Fund and any fees received by an affiliate of DIMA for distribution services. The Board also considered benefits to DIMA related to brokerage and soft-dollar allocations, including allocating brokerage to pay for research generated by parties other than the executing broker dealers, which pertain primarily to funds investing in equity securities, along with the incidental public relations benefits to DIMA related to DWS Funds advertising and cross-selling opportunities among DIMA products and services. The Board concluded that management fees were reasonable in light of these fallout benefits.
Compliance. The Board considered the significant attention and resources dedicated by DIMA to documenting and enhancing its compliance processes in recent years. The Board noted in particular (i) the experience and seniority of both DIMA's chief compliance officer and the Fund's chief compliance officer; (ii) the large number of DIMA compliance personnel; and (iii) the substantial commitment of resources by DIMA and its affiliates to compliance matters.
Based on all of the information considered and the conclusions reached, the Board unanimously determined that the continuation of the Agreement is in the best interests of the Fund. In making this determination, the Board did not give particular weight to any single factor identified above. The Board considered these factors over the course of numerous meetings, certain of which were in executive session with only the Independent Trustees and their independent counsel present. It is possible that individual Trustees may have weighed these factors differently in reaching their individual decisions to approve the continuation of the Agreement.
The following table presents certain information regarding the Board Members and Officers of the fund. Each Board Member's year of birth is set forth in parentheses after his or her name. Unless otherwise noted, (i) each Board Member has engaged in the principal occupation(s) noted in the table for at least the most recent five years, although not necessarily in the same capacity; and (ii) the address of each Independent Board Member is c/o Kenneth C. Froewiss, Chairman, DWS Mutual Funds, P.O. Box 78, Short Hills, NJ 07078. Except as otherwise noted below, the term of office for each Board Member is until the election and qualification of a successor, or until such Board Member sooner dies, resigns, is removed or as otherwise provided in the governing documents of the fund. Because the fund does not hold an annual meeting of shareholders, each Board Member will hold office for an indeterminate period. The Board Members may also serve in similar capacities with other funds in the fund complex.
| Independent Board Members | ||||
Name, Year of Birth, Position with the Fund and Length of Time Served1 | Business Experience and Directorships During the Past Five Years | Number of Funds in DWS Fund Complex Overseen | Other Directorships Held by Board Member | |
Kenneth C. Froewiss (1945) Chairperson since 2013, and Board Member since 2001 | Adjunct Professor of Finance, NYU Stern School of Business (September 2009–present; Clinical Professor from 1997–September 2009); Member, Finance Committee, Association for Asian Studies (2002–present); Director, Mitsui Sumitomo Insurance Group (US) (2004–present); prior thereto, Managing Director, J.P. Morgan (investment banking firm) (until 1996) | 103 | — | |
William McClayton (1944) Vice Chairperson since 2013, and Board Member since 2004 | Private equity investor (since October 2009); previously, Managing Director, Diamond Management & Technology Consultants, Inc. (global consulting firm) (2001–2009); Directorship: Board of Managers, YMCA of Metropolitan Chicago; formerly: Senior Partner, Arthur Andersen LLP (accounting) (1966–2001); Trustee, Ravinia Festival | 103 | — | |
John W. Ballantine (1946) Board Member since 1999 | Retired; formerly, Executive Vice President and Chief Risk Management Officer, First Chicago NBD Corporation/The First National Bank of Chicago (1996–1998); Executive Vice President and Head of International Banking (1995–1996); former Directorships: Stockwell Capital Investments PLC (private equity); First Oak Brook Bancshares, Inc. and Oak Brook Bank; Prisma Energy International | 103 | Chairman of the Board, Healthways, Inc.2 (provider of disease and care management services) (2003– present); Portland General Electric2 (utility company) (2003– present) | |
Henry P. Becton, Jr. (1943) Board Member since 1990 | Vice Chair and former President, WGBH Educational Foundation. Directorships: Public Radio International; Public Radio Exchange (PRX); North Bennett Street School (Boston); former Directorships: The PBS Foundation; Association of Public Television Stations; Boston Museum of Science; American Public Television; Concord Academy; New England Aquarium; Mass. Corporation for Educational Telecommunications; Committee for Economic Development; Public Broadcasting Service; Connecticut College | 103 | Lead Director, Becton Dickinson and Company2 (medical technology company); Lead Director, Belo Corporation2 (media company) | |
Dawn-Marie Driscoll (1946) Board Member since 1987 | President, Driscoll Associates (consulting firm); Emeritus Executive Fellow, Center for Business Ethics, Bentley University; formerly, Partner, Palmer & Dodge (1988–1990); Vice President of Corporate Affairs and General Counsel, Filene's (1978–1988). Directorships: Director of ICI Mutual Insurance Company (since 2007); Advisory Board, Center for Business Ethics, Bentley University; Chairman of the Board of Trustees, Southwest Florida Community Foundation (charitable organization); former Directorships: Sun Capital Advisers Trust (mutual funds) (2007–2012), Investment Company Institute (audit, executive, nominating committees) and Independent Directors Council (governance, executive committees) | 103 | — | |
Keith R. Fox, CFA (1954) Board Member since 1996 | Managing General Partner, Exeter Capital Partners (a series of private investment funds) (since 1986). Directorships: Progressive International Corporation (kitchen goods importer and distributor); The Kennel Shop (retailer); former Chairman, National Association of Small Business Investment Companies; former Directorships: BoxTop Media Inc. (advertising); Sun Capital Advisers Trust (mutual funds) (2011–2012) | 103 | — | |
Paul K. Freeman (1950) Board Member since 1993 | Consultant, World Bank/Inter-American Development Bank; Executive and Governing Council of the Independent Directors Council (Chairman of Education Committee); formerly: Project Leader, International Institute for Applied Systems Analysis (1998–2001); Chief Executive Officer, The Eric Group, Inc. (environmental insurance) (1986–1998); Directorships: Denver Zoo Foundation (December 2012–present); former Directorships: Prisma Energy International | 103 | — | |
Richard J. Herring (1946) Board Member since 1990 | Jacob Safra Professor of International Banking and Professor, Finance Department, The Wharton School, University of Pennsylvania (since July 1972); Co-Director, Wharton Financial Institutions Center (since July 2000); Co-Chair, U.S. Shadow Financial Regulatory Committee; Executive Director, Financial Economists Roundtable; formerly: Vice Dean and Director, Wharton Undergraduate Division (July 1995–June 2000); Director, Lauder Institute of International Management Studies (July 2000–June 2006) | 103 | Director, Japan Equity Fund, Inc. (since September 2007), Thai Capital Fund, Inc. (since 2007), Singapore Fund, Inc. (since September 2007), Independent Director of Barclays Bank Delaware (since September 2010) | |
Rebecca W. Rimel (1951) Board Member since 1995 | President and Chief Executive Officer, The Pew Charitable Trusts (charitable organization) (1994 to present); formerly: Executive Vice President, The Glenmede Trust Company (investment trust and wealth management) (1983–2004); Board Member, Investor Education (charitable organization) (2004–2005); Trustee, Executive Committee, Philadelphia Chamber of Commerce (2001–2007); Director, Viasys Health Care2 (January 2007–June 2007); Trustee, Thomas Jefferson Foundation (charitable organization) (1994–2012) | 103 | Director, Becton Dickinson and Company2 (medical technology company) (2012– present); Director, CardioNet, Inc.2 (health care) (2009– present) | |
William N. Searcy, Jr. (1946) Board Member since 1993 | Private investor since October 2003; formerly: Pension & Savings Trust Officer, Sprint Corporation2 (telecommunications) (November 1989–September 2003); Trustee, Sun Capital Advisers Trust (mutual funds) (1998–2012) | 103 | — | |
Jean Gleason Stromberg (1943) Board Member since 1997 | Retired. Formerly, Consultant (1997–2001); Director, Financial Markets U.S. Government Accountability Office (1996–1997); Partner, Fulbright & Jaworski, L.L.P. (law firm) (1978–1996). Directorships: The William and Flora Hewlett Foundation; former Directorships: Service Source, Inc., Mutual Fund Directors Forum (2002–2004), American Bar Retirement Association (funding vehicle for retirement plans) (1987–1990 and 1994–1996) | 103 | — | |
Robert H. Wadsworth (1940) Board Member since 1999 | President, Robert H. Wadsworth & Associates, Inc. (consulting firm) (1983 to present); Director, National Horizon, Inc. (non-profit organization); Director and Treasurer, The Phoenix Boys Choir Association | 106 | — | |
Officers4 | ||
Name, Year of Birth, Position with the Fund and Length of Time Served5 | Business Experience and Directorships During the Past Five Years | |
Brian E. Binder8,9 (1972) President and Chief Executive Officer, 2013–present | Managing Director3 and Head of Fund Administration, Deutsche Asset & Wealth Management (2013–present); formerly: Head of Business Management and Consulting at Invesco, Ltd. (2010–2012); Chief Administrative Officer, Van Kampen Funds Inc. (2008–2010); and Chief Administrative Officer, Morgan Stanley Investment Management Americas Distribution (2003–2008) | |
John Millette7 (1962) Vice President and Secretary, 1999–present | Director,3 Deutsche Asset & Wealth Management | |
Paul H. Schubert6 (1963) Chief Financial Officer, 2004–present Treasurer, 2005–present | Managing Director,3 Deutsche Asset & Wealth Management (since July 2004); formerly: Executive Director, Head of Mutual Fund Services and Treasurer for UBS Family of Funds (1998–2004); Vice President and Director of Mutual Fund Finance at UBS Global Asset Management (1994–1998) | |
Caroline Pearson7 (1962) Chief Legal Officer, 2010–present | Managing Director,3 Deutsche Asset & Wealth Management; formerly: Assistant Secretary for DWS family of funds (1997–2010) | |
Melinda Morrow6 (1970) Vice President, 2012–present | Director,3 Deutsche Asset & Wealth Management | |
Hepsen Uzcan7 (1974) Assistant Secretary, 2013–present | Vice President, Deutsche Asset & Wealth Management | |
Paul Antosca7 (1957) Assistant Treasurer, 2007–present | Director,3 Deutsche Asset & Wealth Management | |
Jack Clark7 (1967) Assistant Treasurer, 2007–present | Director,3 Deutsche Asset & Wealth Management | |
Diane Kenneally7 (1966) Assistant Treasurer, 2007–present | Director,3 Deutsche Asset & Wealth Management | |
John Caruso6 (1965) Anti-Money Laundering Compliance Officer, 2010–present | Managing Director,3 Deutsche Asset & Wealth Management | |
Robert Kloby6 (1962) Chief Compliance Officer, 2006–present | Managing Director,3 Deutsche Asset & Wealth Management | |
1 The length of time served represents the year in which the Board Member joined the board of one or more DWS funds currently overseen by the Board.
2 A publicly held company with securities registered pursuant to Section 12 of the Securities Exchange Act of 1934.
3 Executive title, not a board directorship.
4 As a result of their respective positions held with the Advisor, these individuals are considered "interested persons" of the Advisor within the meaning of the 1940 Act. Interested persons receive no compensation from the fund.
5 The length of time served represents the year in which the officer was first elected in such capacity for one or more DWS funds.
6 Address: 60 Wall Street, New York, NY 10005.
7 Address: One Beacon Street, Boston, MA 02108.
8 Address: 222 South Riverside Plaza, Chicago, IL 60606.
9 Effective as of December 1, 2013.
The fund's Statement of Additional Information ("SAI") includes additional information about the Board Members. The SAI is available, without charge, upon request. If you would like to request a copy of the SAI, you may do so by calling the following toll-free number: (800) 728-3337.
Notes
DWS Investments Distributors, Inc.
222 South Riverside Plaza
Chicago, IL 60606
(800) 621-1148
VS2GG-2 (R-025830-4 2/14)
December 31, 2013
Annual Report
DWS Variable Series II
DWS Global Income Builder VIP
Contents
3 Performance Summary 4 Management Summary 5 Portfolio Summary 6 Investment Portfolio 29 Statement of Assets and Liabilities 30 Statement of Operations 31 Statement of Changes in Net Assets 32 Financial Highlights 33 Notes to Financial Statements 42 Report of Independent Registered Public Accounting Firm 43 Information About Your Fund's Expenses 44 Tax Information 44 Proxy Voting 45 Advisory Agreement Board Considerations and Fee Evaluation 48 Board Members and Officers |
This report must be preceded or accompanied by a prospectus. To obtain an additional prospectus or summary prospectus, if available, call (800) 728-3337 or your financial representative. We advise you to consider the Fund's objectives, risks, charges and expenses carefully before investing. The summary prospectus and prospectus contain this and other important information about the Fund. Please read the prospectus carefully before you invest.
Although allocation among different asset categories generally limits risk, Fund management may favor an asset category that underperforms other assets or markets as a whole. Bond investments are subject to interest-rate and credit risks. When interest rates rise, bond prices generally fall. Credit risk refers to the ability of an issuer to make timely payments of principal and interest. Investing in derivatives entails special risks relating to liquidity, leverage and credit that may reduce returns and/or increase volatility. Dividends are not guaranteed. If the dividend-paying stocks held by the Fund reduce or stop paying dividends, the Fund's ability to generate income may be adversely affected. Preferred stocks, a type of dividend-paying stock, present certain additional risks. Because Exchange Traded Funds (ETFs) trade on a securities exchange, their shares may trade at a premium or discount to their net asset value. ETFs also incur fees and expenses so they may not fully match the performance of the indexes they are designed to track. Investing in foreign securities, particularly those of emerging markets, presents certain risks, such as currency fluctuations, political and economic changes, and market risks. The Fund may lend securities to approved institutions. Stocks may decline in value. See the prospectus for details.
Deutsche Asset & Wealth Management represents the asset management and wealth management activities conducted by Deutsche Bank AG or any of its subsidiaries, including the Advisor and DWS Investments Distributors, Inc.
NOT FDIC/NCUA INSURED NO BANK GUARANTEE MAY LOSE VALUE NOT A DEPOSIT
NOT INSURED BY ANY FEDERAL GOVERNMENT AGENCY
Fund performance shown is historical, assumes reinvestment of all dividend and capital gain distributions and does not guarantee future results. Investment return and principal value fluctuate with changing market conditions so that, when redeemed, shares may be worth more or less than their original cost. Current performance may be lower or higher than the performance data quoted. Please contact your participating insurance company for the Fund's most recent month-end performance. Performance doesn't reflect charges and fees ("contract charges") associated with the separate account that invests in the Fund or any variable life insurance policy or variable annuity contract for which the Fund is an investment option. These charges and fees will reduce returns.
The gross expense ratio of the Fund, as stated in the fee table of the prospectus dated May 1, 2013 is 0.60% for Class A shares and may differ from the expense ratio disclosed in the Financial Highlights table in this report.
| Growth of an Assumed $10,000 Investment in DWS Global Income Builder VIP | ||
 | The Russell 1000® Index is an unmanaged index that measures the performance of the 1,000 largest companies in the Russell 3000® Index, which represents approximately 92% of the total market capitalization of the Russell 3000® Index. The Barclays U.S. Aggregate Bond Index is an unmanaged index representing domestic taxable investment-grade bonds, with index components for government and corporate securities, mortgage pass-through securities, and asset-backed securities with an average maturity of one year or more. The S&P® Target Risk Moderate Index is designed to measure the performance of S&P's proprietary moderate target risk allocation model. The S&P® Target Risk Moderate Index seeks to provide significant exposure to fixed income, while also allocating a smaller portion of exposure to equities in order to seek current income, some capital preservation, and an opportunity for moderate to low capital appreciation. Index returns do not reflect any fees or expenses and it is not possible to invest directly into an index. | |
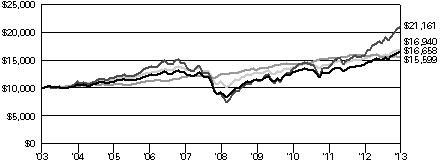 | ||
| Yearly periods ended December 31 | ||
| Comparative Results | |||||||||||||||||
| DWS Global Income Builder VIP | 1-Year | 3-Year | 5-Year | 10-Year | |||||||||||||
| Class A | Growth of $10,000 | $ | 11,663 | $ | 12,989 | $ | 17,832 | $ | 16,658 | ||||||||
| Average annual total return | 16.63 | % | 9.11 | % | 12.26 | % | 5.24 | % | |||||||||
Russell 1000® Index | Growth of $10,000 | $ | 13,311 | $ | 15,730 | $ | 23,454 | $ | 21,161 | ||||||||
| Average annual total return | 33.11 | % | 16.30 | % | 18.59 | % | 7.78 | % | |||||||||
| Barclays U.S. Aggregate Bond Index | Growth of $10,000 | $ | 9,798 | $ | 11,011 | $ | 12,427 | $ | 15,599 | ||||||||
| Average annual total return | –2.02 | % | 3.26 | % | 4.44 | % | 4.55 | % | |||||||||
S&P® Target Risk Moderate Index | Growth of $10,000 | $ | 11,047 | $ | 12,267 | $ | 15,108 | $ | 16,940 | ||||||||
| Average annual total return | 10.47 | % | 7.05 | % | 8.60 | % | 5.41 | % | |||||||||
The growth of $10,000 is cumulative.
The Fund returned 16.63% during the 12 months ended December 31, 2013 (Class A shares, unadjusted for contract charges) and outperformed the 10.47% return of S&P® Target Risk Moderate Index. Its two other benchmarks — the Barclays U.S. Aggregate Bond Index, which represents domestic taxable investment-grade bonds, and the Russell 1000® Index, which tracks the performance of the 1,000 largest stocks in the Russell 3000® Index — returned –2.02% and 33.11%, respectively.1,2,3
As of December 31, 2013, 63% of the portfolio was allocated to global dividend-paying stocks and 33% was allocated to bonds, with the remainder in cash.
Our equity allocation made the largest contribution to absolute returns, reflecting stocks' strength vs. bonds. The leading contributions came from an overweight in the technology sector and stock selection within the financial, utilities and consumer staples sectors.4,5 The most significant detractor was our stock selection in industrials.
The Fund's bond portfolio finished with a flat return, but performed well relative to the benchmark due to its allocation to high-yield bonds, which outperformed, as well as strong security selection within its corporate bond segment. The largest detractor was the Fund's above-benchmark duration (or interest-rate sensitivity) in the first half of the year ending December 31, 2013, which caused the Fund to underperform during the second-quarter sell-off. The Fund's bond portfolio closed the year with a duration that was about equal to that of the benchmark.
We hold a positive outlook for global equities in 2014, but we expect that the backdrop will remain somewhat challenging for dividend-paying stocks. The high-dividend segment is generally populated by slower, more stable growers, and it has a lower representation of the economically sensitive stocks that typically outperform in periods of improving growth. In this environment, our approach is to continue emphasizing our top ideas within the portfolio. We believe this should position the equity portfolio so its performance is more a function of our stock selection than of the broader performance trends for dividend stocks. As of the close of the year ending December 31, 2013, the equity portion of the Fund held its largest sector overweight in consumer staples, and its largest underweights were in the health care and telecommunications sectors.
With regard to the bond market, we expect that strengthening economic growth will continue to pressure long-term Treasuries but provide support for the investment-grade corporate and high-yield sectors. We remain focused on adding value through individual security selection, portfolio allocation and our "go anywhere" strategy. We believe this approach — and not one that seeks to make interest-rate "bets" — is the prudent course in a potentially challenging environment.
Owen Fitzpatrick, CFA
William Chepolis, CFA
Philip G. Condon
Gary Russell, CFA
John D. Ryan
Darwei Kung
Louis Cucciniello
Portfolio Managers
The views expressed reflect those of the portfolio management team only through the end of the period of the report as stated on the cover. The management team's views are subject to change at any time based on market and other conditions and should not be construed as a recommendation. Past performance is no guarantee of future results. Current and future portfolio holdings are subject to risk.
1 The S&P Target Risk Moderate Index is designed to measure the performance of S&P's proprietary moderate target risk allocation model. The S&P® Target Risk Moderate Index seeks to provide significant exposure to fixed income, while also allocating a smaller portion of exposure to equities in order to seek current income, some capital preservation, and an opportunity for moderate to low capital appreciation.
2 The Barclays U.S. Aggregate Bond Index is an unmanaged index representing domestic taxable investment-grade bonds, with index components for government and corporate securities, mortgage pass-through securities, and asset-backed securities with an average maturity of one year or more.
3 The Russell 1000 Index is an unmanaged index that measures the performance of the 1,000 largest companies in the Russell 3000® Index, which represents approximately 92% of the total market capitalization of the Russell 3000 Index.
Index returns do not reflect any fees or expenses and it is not possible to invest directly into an index.
4 "Underweight" means the Fund holds a lower weighting in a given sector or security than the benchmark. "Overweight" means the Fund holds a higher weighting.
5 The consumer staples sector represents companies that produce essential items such as food, beverages and household items.
Asset Allocation (As a % of Investment Portfolio excluding Securities Lending Collateral) | 12/31/13 | 12/31/12 |
| Equity | 63% | 55% |
| Common Stocks | 63% | 55% |
| Fixed Income | 33% | 44% |
| Corporate Bonds | 23% | 28% |
| Government & Agency Obligations | 5% | 6% |
| Collateralized Mortgage Obligations | 2% | 2% |
| Municipal Bonds and Notes | 1% | 0% |
| Mortgage-Backed Securities Pass-Throughs | 1% | 3% |
| Commercial Mortgage-Backed Securities | 1% | 1% |
| Asset-Backed | 0% | 1% |
| Loan Participations and Assignments | 0% | 3% |
| Cash Equivalents | 4% | 1% |
| 100% | 100% |
Sector Diversification (As a % of Equities, Corporate Bonds, Loan Participations and Assignments, Preferred Securities, Convertible Bonds and Other Investments) | 12/31/13 | 12/31/12 |
| Financials | 22% | 19% |
| Consumer Discretionary | 13% | 8% |
| Information Technology | 12% | 8% |
| Industrials | 11% | 6% |
| Telecommunication Services | 9% | 7% |
| Energy | 9% | 13% |
| Consumer Staples | 7% | 13% |
| Health Care | 6% | 11% |
| Utilities | 6% | 7% |
| Materials | 5% | 8% |
| 100% | 100% |
Portfolio holdings and characteristics are subject to change.
For more complete details about the Fund's investment portfolio, see page 6.
Following the Fund's fiscal first and third quarter-end, a complete portfolio holdings listing is filed with the SEC on Form N-Q. The form will be available on the SEC's Web site at sec.gov, and it also may be reviewed and copied at the SEC's Public Reference Room in Washington, D.C. Information on the operation of the SEC's Public Reference Room may be obtained by calling (800) SEC-0330. The Fund's portfolio holdings are also posted on dws-investments.com from time to time. Please see the Fund's current prospectus for more information.
| Shares | Value ($) | |||||||
| Common Stocks 63.1% | ||||||||
| Consumer Discretionary 7.7% | ||||||||
| Auto Components 0.4% | ||||||||
| Aisin Seiki Co., Ltd. | 3,100 | 126,148 | ||||||
| Bridgestone Corp. | 4,600 | 174,388 | ||||||
| Cie Generale des Etablissements Michelin | 267 | 28,493 | ||||||
| Delphi Automotive PLC | 3,000 | 180,390 | ||||||
| Denso Corp. | 1,700 | 89,884 | ||||||
| Johnson Controls, Inc. | 700 | 35,910 | ||||||
| Magna International, Inc. | 2,500 | 204,990 | ||||||
| Sumitomo Rubber Industries Ltd. | 7,200 | 102,527 | ||||||
| Toyota Industries Corp. | 2,000 | 90,395 | ||||||
| TRW Automotive Holdings Corp.* | 1,400 | 104,146 | ||||||
| Yokohama Rubber Co., Ltd. | 4,466 | 44,000 | ||||||
| 1,181,271 | ||||||||
| Automobiles 1.3% | ||||||||
| Bayerische Motoren Werke (BMW) AG | 1,501 | 176,028 | ||||||
| Daihatsu Motor Co., Ltd. | 6,500 | 110,261 | ||||||
| Daimler AG (Registered) | 3,206 | 277,514 | ||||||
| Ford Motor Co. | 23,200 | 357,976 | ||||||
| Fuji Heavy Industries Ltd. | 4,900 | 140,757 | ||||||
| General Motors Co.* | 13,200 | 539,484 | ||||||
| Honda Motor Co., Ltd. | 4,600 | 189,717 | ||||||
| Isuzu Motors Ltd. | 9,000 | 56,114 | ||||||
| Nissan Motor Co., Ltd. | 51,800 | 436,072 | ||||||
| Renault SA | 5,413 | 437,032 | ||||||
| Toyota Motor Corp. | 6,400 | 389,456 | ||||||
| Volkswagen AG | 1,495 | 405,112 | ||||||
| 3,515,523 | ||||||||
| Diversified Consumer Services 0.1% | ||||||||
| Benesse Holdings, Inc. | 1,600 | 64,268 | ||||||
| H&R Block, Inc. | 4,000 | 116,160 | ||||||
| 180,428 | ||||||||
| Hotels, Restaurants & Leisure 1.4% | ||||||||
| Carnival Corp. | 8,300 | 333,411 | ||||||
| Chipotle Mexican Grill, Inc.* | 200 | 106,556 | ||||||
| Compass Group PLC | 11,746 | 188,333 | ||||||
| Crown Resorts Ltd. | 11,826 | 177,992 | ||||||
| Darden Restaurants, Inc. | 2,400 | 130,488 | ||||||
| Dawn Holdings, Inc.* (a) | 1 | 1,875 | ||||||
| Flight Centre Travel Group Ltd. | 2,068 | 87,827 | ||||||
| Galaxy Entertainment Group Ltd.* | 14,000 | 125,711 | ||||||
| International Game Technology | 5,300 | 96,248 | ||||||
| Las Vegas Sands Corp. | 2,200 | 173,514 | ||||||
| Marriott International, Inc. "A" | 500 | 24,680 | ||||||
| McDonald's Corp. | 4,800 | 465,744 | ||||||
| Oriental Land Co., Ltd. | 600 | 86,519 | ||||||
| Royal Caribbean Cruises Ltd. | 6,000 | 284,520 | ||||||
| Sands China Ltd. | 22,400 | 184,076 | ||||||
| SJM Holdings Ltd. | 6,929 | 23,370 | ||||||
| Starbucks Corp. | 3,600 | 282,204 | ||||||
| Tatts Group Ltd. | 34,755 | 96,388 | ||||||
| Trump Entertainment Resorts, Inc.* | 2 | 0 | ||||||
| TUI Travel PLC | 31,387 | 214,884 | ||||||
| Whitbread PLC | 1,485 | 92,298 | ||||||
| William Hill PLC | 22,422 | 149,258 | ||||||
| Wyndham Worldwide Corp. | 2,100 | 154,749 | ||||||
| Shares | Value ($) | |||||||
| Yum! Brands, Inc. | 2,500 | 189,025 | ||||||
| 3,669,670 | ||||||||
| Household Durables 0.7% | ||||||||
| Electrolux AB "B" | 1,842 | 48,493 | ||||||
| Garmin Ltd. (b) | 1,700 | 78,574 | ||||||
| Leggett & Platt, Inc. (b) | 2,500 | 77,350 | ||||||
| Mohawk Industries, Inc.* | 1,600 | 238,240 | ||||||
| Newell Rubbermaid, Inc. | 5,700 | 184,737 | ||||||
| Persimmon PLC* | 8,450 | 173,594 | ||||||
| PulteGroup, Inc. | 11,600 | 236,292 | ||||||
| Sekisui Chemical Co., Ltd. | 7,000 | 86,050 | ||||||
| Sekisui House Ltd. | 17,172 | 240,443 | ||||||
| Sony Corp. | 4,700 | 81,178 | ||||||
| Toll Brothers, Inc.* | 1,300 | 48,100 | ||||||
| Whirlpool Corp. | 2,000 | 313,720 | ||||||
| 1,806,771 | ||||||||
| Internet & Catalog Retail 0.0% | ||||||||
| Amazon.com, Inc.* | 100 | 39,879 | ||||||
| Leisure Equipment & Products 0.2% | ||||||||
| Hasbro, Inc. | 2,000 | 110,020 | ||||||
| Mattel, Inc. | 4,600 | 218,868 | ||||||
| Namco Bandai Holdings, Inc. | 7,000 | 155,504 | ||||||
| 484,392 | ||||||||
| Media 2.2% | ||||||||
| British Sky Broadcasting Group PLC | 13,443 | 188,040 | ||||||
| CBS Corp. "B" | 1,500 | 95,610 | ||||||
| Comcast Corp. "A" | 11,700 | 583,596 | ||||||
| Comcast Corp. "A" | 12,000 | 623,580 | ||||||
| DIRECTV* | 5,800 | 400,722 | ||||||
| Discovery Communications, Inc. "A"* | 400 | 36,168 | ||||||
| Discovery Communications, Inc. "C"* | 1,300 | 109,018 | ||||||
| Lagardere SCA | 5,335 | 198,347 | ||||||
| Liberty Global PLC "A"* | 3,800 | 338,162 | ||||||
| Liberty Global PLC "C"* | 4,600 | 387,872 | ||||||
| Liberty Media Corp. "A"* | 1,100 | 161,095 | ||||||
| News Corp. "A"* | 8,000 | 144,160 | ||||||
| Omnicom Group, Inc. | 800 | 59,496 | ||||||
| Pearson PLC | 3,218 | 71,477 | ||||||
| Reed Elsevier PLC | 6,016 | 89,671 | ||||||
| Scripps Networks Interactive, Inc. "A" | 2,800 | 241,948 | ||||||
| SES SA | 5,037 | 163,095 | ||||||
| Shaw Communications, Inc. "B" | 4,900 | 119,242 | ||||||
| Thomson Reuters Corp. | 3,100 | 117,230 | ||||||
| Time Warner Cable, Inc. | 1,600 | 216,800 | ||||||
| Time Warner, Inc. | 6,800 | 474,096 | ||||||
| Twenty-First Century Fox, Inc. "A" | 3,900 | 137,202 | ||||||
| Twenty-First Century Fox, Inc. "B" | 5,900 | 204,140 | ||||||
| Vertis Holdings, Inc.* | 111 | 0 | ||||||
| Viacom, Inc. "B" | 3,400 | 296,956 | ||||||
| Walt Disney Co. | 4,700 | 359,080 | ||||||
| WPP PLC | 5,791 | 132,891 | ||||||
| 5,949,694 | ||||||||
| Multiline Retail 0.3% | ||||||||
| Canadian Tire Corp., Ltd. "A" | 200 | 18,732 | ||||||
| Dollar General Corp.* | 2,500 | 150,800 | ||||||
| Family Dollar Stores, Inc. | 600 | 38,982 | ||||||
| Shares | Value ($) | |||||||
| Kohl's Corp. | 4,200 | 238,350 | ||||||
| Macy's, Inc. | 2,800 | 149,520 | ||||||
| Target Corp. | 4,700 | 297,369 | ||||||
| 893,753 | ||||||||
| Specialty Retail 0.4% | ||||||||
| AutoZone, Inc.* | 400 | 191,176 | ||||||
| Bed Bath & Beyond, Inc.* | 1,200 | 96,360 | ||||||
| GameStop Corp. "A" (b) | 2,400 | 118,224 | ||||||
| Home Depot, Inc. | 2,600 | 214,084 | ||||||
| Lowe's Companies, Inc. | 3,400 | 168,470 | ||||||
| O'Reilly Automotive, Inc.* | 400 | 51,484 | ||||||
| PetSmart, Inc. | 200 | 14,550 | ||||||
| Staples, Inc. | 4,649 | 73,873 | ||||||
| The Gap, Inc. | 1,100 | 42,988 | ||||||
| TJX Companies, Inc. | 2,000 | 127,460 | ||||||
| 1,098,669 | ||||||||
| Textiles, Apparel & Luxury Goods 0.7% | ||||||||
| Christian Dior SA | 1,190 | 225,288 | ||||||
| Cie Financiere Richemont SA (Registered) | 1,957 | 195,835 | ||||||
| Coach, Inc. | 1,200 | 67,356 | ||||||
| Gildan Activewear, Inc. | 1,100 | 58,622 | ||||||
| Kering | 407 | 86,073 | ||||||
| LVMH Moet Hennessy Louis Vuitton SA | 477 | 87,320 | ||||||
| Michael Kors Holdings Ltd.* | 1,100 | 89,309 | ||||||
| NIKE, Inc. "B" | 3,400 | 267,376 | ||||||
| Swatch Group AG (Bearer) | 261 | 173,183 | ||||||
| Swatch Group AG (Registered) | 2,200 | 248,675 | ||||||
| VF Corp. | 3,372 | 210,210 | ||||||
| Yue Yuen Industrial (Holdings) Ltd. | 38,500 | 128,815 | ||||||
| 1,838,062 | ||||||||
| Consumer Staples 4.0% | ||||||||
| Beverages 0.5% | ||||||||
| Anheuser-Busch InBev NV | 574 | 61,202 | ||||||
| Carlsberg AS "B" | 596 | 66,211 | ||||||
| Coca-Cola Co. | 5,800 | 239,598 | ||||||
| Diageo PLC | 3,600 | 118,913 | ||||||
| Dr. Pepper Snapple Group, Inc. | 3,300 | 160,776 | ||||||
| Heineken Holding NV | 2,229 | 141,357 | ||||||
| Heineken NV | 452 | 30,606 | ||||||
| Molson Coors Brewing Co. "B" | 3,700 | 207,755 | ||||||
| PepsiCo, Inc. | 4,552 | 377,543 | ||||||
| 1,403,961 | ||||||||
| Food & Staples Retailing 1.4% | ||||||||
| Aeon Co., Ltd. | 9,900 | 134,259 | ||||||
| Alimentation Couche-Tard, Inc. "B" | 1,300 | 97,759 | ||||||
| Casino Guichard-Perrachon SA | 1,417 | 163,793 | ||||||
| Costco Wholesale Corp. | 600 | 71,406 | ||||||
| CVS Caremark Corp. | 6,000 | 429,420 | ||||||
| Empire Co., Ltd. "A" | 2,100 | 143,486 | ||||||
| George Weston Ltd. | 1,100 | 80,254 | ||||||
| J Sainsbury PLC | 52,135 | 315,811 | ||||||
| Kesko Oyj "B" | 4,436 | 163,617 | ||||||
| Koninklijke Ahold NV | 1,309 | 23,504 | ||||||
| Kroger Co. | 4,900 | 193,697 | ||||||
| Loblaw Companies Ltd. | 1,800 | 71,814 | ||||||
| Metro, Inc. | 300 | 18,329 | ||||||
| Safeway, Inc. | 1,100 | 35,827 | ||||||
| Sysco Corp. | 2,400 | 86,640 | ||||||
| Tesco PLC | 74,635 | 413,346 | ||||||
| Wal-Mart Stores, Inc. | 5,800 | 456,402 | ||||||
| Shares | Value ($) | |||||||
| Walgreen Co. | 3,900 | 224,016 | ||||||
| Wesfarmers Ltd. | 4,338 | 170,836 | ||||||
| WM Morrison Supermarkets PLC | 85,433 | 369,993 | ||||||
| Woolworths Ltd. | 5,420 | 163,862 | ||||||
| 3,828,071 | ||||||||
| Food Products 1.0% | ||||||||
| Archer-Daniels-Midland Co. | 6,800 | 295,120 | ||||||
| Aryzta AG* | 1,635 | 125,687 | ||||||
| Bunge Ltd. | 4,100 | 336,651 | ||||||
| Campbell Soup Co. (b) | 1,700 | 73,576 | ||||||
| ConAgra Foods, Inc. | 5,700 | 192,090 | ||||||
| General Mills, Inc. | 3,800 | 189,658 | ||||||
| Hormel Foods Corp. | 700 | 31,619 | ||||||
| Kellogg Co. | 2,100 | 128,247 | ||||||
| Kerry Group PLC "A" | 1,139 | 79,146 | ||||||
| Kraft Foods Group, Inc. | 1,100 | 59,312 | ||||||
| Lindt & Spruengli AG | 10 | 45,074 | ||||||
| Mondelez International, Inc. "A" | 7,300 | 257,690 | ||||||
| Nestle SA (Registered) | 5,015 | 368,141 | ||||||
| Suedzucker AG | 8,323 | 224,666 | ||||||
| Tate & Lyle PLC | 524 | 7,026 | ||||||
| The JM Smucker Co. | 1,100 | 113,982 | ||||||
| Tyson Foods, Inc. "A" | 5,700 | 190,722 | ||||||
| Wilmar International Ltd. | 13,000 | 35,286 | ||||||
| 2,753,693 | ||||||||
| Household Products 0.3% | ||||||||
| Church & Dwight Co., Inc. | 300 | 19,884 | ||||||
| Colgate-Palmolive Co. | 1,700 | 110,857 | ||||||
| Energizer Holdings, Inc. (b) | 800 | 86,592 | ||||||
| Kimberly-Clark Corp. | 1,800 | 188,028 | ||||||
| Procter & Gamble Co. | 4,727 | 384,825 | ||||||
| Reckitt Benckiser Group PLC | 1,168 | 92,992 | ||||||
| 883,178 | ||||||||
| Tobacco 0.8% | ||||||||
| Altria Group, Inc. | 8,051 | 309,078 | ||||||
| British American Tobacco PLC | 4,198 | 225,240 | ||||||
| Imperial Tobacco Group PLC | 9,779 | 379,514 | ||||||
| Japan Tobacco, Inc. | 4,700 | 152,924 | ||||||
| Lorillard, Inc. | 5,600 | 283,808 | ||||||
| Philip Morris International, Inc. | 5,000 | 435,650 | ||||||
| Reynolds American, Inc. | 4,200 | 209,958 | ||||||
| 1,996,172 | ||||||||
| Energy 5.7% | ||||||||
| Energy Equipment & Services 0.8% | ||||||||
| Baker Hughes, Inc. | 3,000 | 165,780 | ||||||
| Diamond Offshore Drilling, Inc. | 1,500 | 85,380 | ||||||
| Ensco PLC "A" | 8,700 | 497,466 | ||||||
| Halliburton Co. | 3,200 | 162,400 | ||||||
| National Oilwell Varco, Inc. | 1,600 | 127,248 | ||||||
| Noble Corp. PLC | 9,000 | 337,230 | ||||||
| Rowan Companies PLC "A"* | 8,600 | 304,096 | ||||||
| Schlumberger Ltd. | 2,900 | 261,319 | ||||||
| Transocean Ltd. | 2,936 | 143,717 | ||||||
| 2,084,636 | ||||||||
| Oil, Gas & Consumable Fuels 4.9% | ||||||||
| Anadarko Petroleum Corp. | 800 | 63,456 | ||||||
| Apache Corp. | 2,000 | 171,880 | ||||||
| BG Group PLC | 8,799 | 189,621 | ||||||
| BP PLC | 97,214 | 787,508 | ||||||
| Canadian Natural Resources Ltd. | 5,200 | 175,936 | ||||||
| Chesapeake Energy Corp. (b) | 13,800 | 374,532 | ||||||
| Chevron Corp. | 6,100 | 761,951 | ||||||
| Shares | Value ($) | |||||||
| ConocoPhillips | 6,786 | 479,431 | ||||||
| Cosmo Oil Co., Ltd.* | 38,310 | 73,238 | ||||||
| Devon Energy Corp. | 4,700 | 290,789 | ||||||
| Enbridge, Inc. (b) | 500 | 21,845 | ||||||
| Eni SpA | 8,225 | 198,877 | ||||||
| EOG Resources, Inc. | 600 | 100,704 | ||||||
| Exxon Mobil Corp. | 6,000 | 607,200 | ||||||
| Hess Corp. | 3,000 | 249,000 | ||||||
| Husky Energy, Inc. | 7,700 | 244,283 | ||||||
| Idemitsu Kosan Co., Ltd. | 22,800 | 519,137 | ||||||
| Imperial Oil Ltd. | 4,400 | 194,847 | ||||||
| Japan Petroleum Exploration Co. | 4,200 | 159,174 | ||||||
| JX Holdings, Inc. | 133,400 | 686,837 | ||||||
| Kinder Morgan, Inc. | 10,000 | 360,000 | ||||||
| Marathon Oil Corp. | 5,800 | 204,740 | ||||||
| Marathon Petroleum Corp. | 2,600 | 238,498 | ||||||
| Murphy Oil Corp. | 5,400 | 350,352 | ||||||
| Neste Oil Oyj | 16,380 | 325,757 | ||||||
| Occidental Petroleum Corp. | 3,400 | 323,340 | ||||||
| OMV AG | 6,363 | 304,756 | ||||||
| Origin Energy Ltd. | 6,983 | 87,767 | ||||||
| Pacific Rubiales Energy Corp. | 4,800 | 82,873 | ||||||
| Phillips 66 | 3,200 | 246,816 | ||||||
| Repsol SA | 2,873 | 72,590 | ||||||
| Royal Dutch Shell PLC "A" | 23,835 | 856,018 | ||||||
| Royal Dutch Shell PLC "B" | 21,361 | 803,869 | ||||||
| Showa Shell Sekiyu KK (b) | 26,400 | 268,405 | ||||||
| Spectra Energy Corp. | 4,400 | 156,728 | ||||||
| Statoil ASA | 14,632 | 355,410 | ||||||
| Suncor Energy, Inc. | 6,100 | 213,852 | ||||||
| Tesoro Corp. | 2,500 | 146,250 | ||||||
| TonenGeneral Sekiyu KK (b) | 19,223 | 176,418 | ||||||
| Total SA | 9,591 | 587,920 | ||||||
| TransCanada Corp. (b) | 2,900 | 132,517 | ||||||
| Valero Energy Corp. | 7,000 | 352,800 | ||||||
| Woodside Petroleum Ltd. | 3,325 | 115,527 | ||||||
| 13,113,449 | ||||||||
| Financials 14.8% | ||||||||
| Capital Markets 0.7% | ||||||||
| 3i Group PLC | 69,601 | 444,047 | ||||||
| Ameriprise Financial, Inc. | 1,500 | 172,575 | ||||||
| Bank of New York Mellon Corp. | 4,300 | 150,242 | ||||||
| BlackRock, Inc. | 400 | 126,588 | ||||||
| Credit Suisse Group AG (Registered) | 11,423 | 350,707 | ||||||
| Morgan Stanley (b) | 4,200 | 131,712 | ||||||
| State Street Corp. | 2,200 | 161,458 | ||||||
| The Goldman Sachs Group, Inc. | 1,400 | 248,164 | ||||||
| UBS AG (Registered)* | 5,403 | 102,929 | ||||||
| 1,888,422 | ||||||||
| Commercial Banks 6.2% | ||||||||
| Aozora Bank Ltd. | 193,412 | 548,043 | ||||||
| Australia & New Zealand Banking Group Ltd. | 10,511 | 302,590 | ||||||
| Banco Bilbao Vizcaya Argentaria SA | 12,357 | 153,108 | ||||||
| Bank Hapoalim BM | 63,279 | 354,990 | ||||||
| Bank Leumi Le-Israel BM* | 97,420 | 398,271 | ||||||
| Bank of Montreal (b) | 5,500 | 366,632 | ||||||
| Bank of Nova Scotia (b) | 7,206 | 450,642 | ||||||
| Barclays PLC | 77,404 | 350,222 | ||||||
| BB&T Corp. | 10,100 | 376,932 | ||||||
| Bendigo & Adelaide Bank Ltd. | 7,105 | 74,571 | ||||||
| Shares | Value ($) | |||||||
| BNP Paribas SA | 4,183 | 327,540 | ||||||
| BOC Hong Kong (Holdings) Ltd. | 81,000 | 260,523 | ||||||
| Canadian Imperial Bank of Commerce (b) | 4,200 | 358,695 | ||||||
| CIT Group, Inc. | 4,200 | 218,946 | ||||||
| Comerica, Inc. | 1,400 | 66,556 | ||||||
| Commonwealth Bank of Australia | 3,824 | 266,447 | ||||||
| Credit Agricole SA* | 25,583 | 328,832 | ||||||
| Danske Bank AS* | 14,243 | 327,926 | ||||||
| DBS Group Holdings Ltd. | 20,000 | 271,838 | ||||||
| Fifth Third Bancorp. | 18,000 | 378,540 | ||||||
| Fukuoka Financial Group, Inc. | 8,709 | 38,257 | ||||||
| Hang Seng Bank Ltd. | 13,500 | 219,511 | ||||||
| HSBC Holdings PLC | 52,026 | 570,616 | ||||||
| KeyCorp | 15,700 | 210,694 | ||||||
| Lloyds Banking Group PLC* | 273,277 | 357,193 | ||||||
| M&T Bank Corp. | 2,500 | 291,050 | ||||||
| Mitsubishi UFJ Financial Group, Inc. | 46,400 | 306,800 | ||||||
| Mizrahi Tefahot Bank Ltd. | 12,289 | 160,961 | ||||||
| Mizuho Financial Group, Inc. | 207,500 | 449,403 | ||||||
| National Australia Bank Ltd. | 8,766 | 273,656 | ||||||
| National Bank of Canada (b) | 4,200 | 349,483 | ||||||
| Natixis | 67,199 | 396,834 | ||||||
| Nishi-Nippon City Bank Ltd. | 26,000 | 70,087 | ||||||
| Nordea Bank AB | 27,911 | 377,944 | ||||||
| Oversea-Chinese Banking Corp., Ltd. | 33,000 | 267,141 | ||||||
| PNC Financial Services Group, Inc. | 7,100 | 550,818 | ||||||
| Raiffeisen Bank International AG | 5,905 | 208,452 | ||||||
| Regions Financial Corp. | 23,100 | 228,459 | ||||||
| Resona Holdings, Inc. | 54,300 | 276,960 | ||||||
| Royal Bank of Canada | 6,200 | 416,796 | ||||||
| Royal Bank of Scotland Group PLC* | 27,347 | 153,952 | ||||||
| Skandinaviska Enskilda Banken AB "A" | 15,777 | 208,728 | ||||||
| Societe Generale SA | 6,521 | 380,810 | ||||||
| Standard Chartered PLC | 14,906 | 335,859 | ||||||
| Sumitomo Mitsui Financial Group, Inc. | 6,900 | 356,327 | ||||||
| SunTrust Banks, Inc. | 7,500 | 276,075 | ||||||
| Svenska Handelsbanken AB "A" | 1,899 | 93,805 | ||||||
| Swedbank AB "A" | 6,893 | 194,454 | ||||||
| The Bank of Yokohama Ltd. | 33,411 | 186,551 | ||||||
| The Chugoku Bank Ltd. | 3,000 | 38,097 | ||||||
| The Gunma Bank Ltd. | 3,082 | 17,240 | ||||||
| The Hachijuni Bank Ltd. | 9,000 | 52,547 | ||||||
| The Toronto-Dominion Bank | 4,351 | 410,053 | ||||||
| U.S. Bancorp. | 10,300 | 416,120 | ||||||
| United Overseas Bank Ltd. | 17,000 | 286,617 | ||||||
| Wells Fargo & Co. | 14,000 | 635,600 | ||||||
| Westpac Banking Corp. | 8,235 | 239,153 | ||||||
| Yamaguchi Financial Group, Inc. | 13,000 | 120,558 | ||||||
| 16,605,505 | ||||||||
| Consumer Finance 0.4% | ||||||||
| American Express Co. | 1,600 | 145,168 | ||||||
| Capital One Financial Corp. | 6,000 | 459,660 | ||||||
| Discover Financial Services | 4,100 | 229,395 | ||||||
| SLM Corp. | 6,600 | 173,448 | ||||||
| 1,007,671 | ||||||||
| Diversified Financial Services 1.2% | ||||||||
| Bank of America Corp. | 31,600 | 492,012 | ||||||
| Berkshire Hathaway, Inc. "B"* | 4,000 | 474,240 | ||||||
| Shares | Value ($) | |||||||
| Citigroup, Inc. | 10,400 | 541,944 | ||||||
| CME Group, Inc. | 1,500 | 117,690 | ||||||
| Exor SpA | 2,284 | 91,057 | ||||||
| Industrivarden AB "C" | 6,658 | 126,950 | ||||||
| ING Groep NV (CVA)* | 16,483 | 230,493 | ||||||
| Investor AB "B" | 10,415 | 359,370 | ||||||
| JPMorgan Chase & Co. | 8,400 | 491,232 | ||||||
| Leucadia National Corp. | 800 | 22,672 | ||||||
| Pohjola Bank PLC "A" | 7,572 | 152,509 | ||||||
| The NASDAQ OMX Group, Inc. | 1,500 | 59,700 | ||||||
| 3,159,869 | ||||||||
| Insurance 5.3% | ||||||||
| ACE Ltd. | 3,600 | 372,708 | ||||||
| Admiral Group PLC | 4,051 | 87,932 | ||||||
| Aegon NV | 21,867 | 206,444 | ||||||
| Aflac, Inc. | 3,800 | 253,840 | ||||||
| Alleghany Corp.* | 400 | 159,984 | ||||||
| Allianz SE (Registered) | 2,154 | 386,371 | ||||||
| Allstate Corp. | 8,400 | 458,136 | ||||||
| American International Group, Inc. | 9,400 | 479,870 | ||||||
| Aon PLC | 600 | 50,334 | ||||||
| Arch Capital Group Ltd.* | 1,800 | 107,442 | ||||||
| Assurant, Inc. | 4,000 | 265,480 | ||||||
| AXA SA | 10,918 | 304,538 | ||||||
| Axis Capital Holdings Ltd. | 8,200 | 390,074 | ||||||
| Baloise Holding AG (Registered) | 3,007 | 384,177 | ||||||
| Chubb Corp. | 3,200 | 309,216 | ||||||
| CNP Assurances | 15,957 | 327,185 | ||||||
| Direct Line Insurance Group PLC | 84,165 | 348,446 | ||||||
| Everest Re Group Ltd. (b) | 3,300 | 514,371 | ||||||
| Great-West Lifeco, Inc. | 5,700 | 175,735 | ||||||
| Hannover Rueck SE | 3,820 | 329,920 | ||||||
| Hartford Financial Services Group, Inc. | 4,500 | 163,035 | ||||||
| Insurance Australia Group Ltd. | 3,213 | 16,702 | ||||||
| Intact Financial Corp. | 2,600 | 169,792 | ||||||
| Legal & General Group PLC | 25,261 | 93,210 | ||||||
| Lincoln National Corp. | 3,000 | 154,860 | ||||||
| Loews Corp. | 5,300 | 255,672 | ||||||
| Mapfre SA | 9,918 | 42,572 | ||||||
| Marsh & McLennan Companies, Inc. | 1,400 | 67,704 | ||||||
| MetLife, Inc. | 7,900 | 425,968 | ||||||
| Muenchener Rueckversicherungs AG (Registered) | 1,661 | 366,075 | ||||||
| Old Mutual PLC | 85,111 | 266,701 | ||||||
| PartnerRe Ltd. | 2,829 | 298,261 | ||||||
| Power Corp. of Canada | 3,100 | 93,241 | ||||||
| Power Financial Corp. (b) | 5,200 | 176,230 | ||||||
| Principal Financial Group, Inc. | 1,400 | 69,034 | ||||||
| Progressive Corp. | 2,700 | 73,629 | ||||||
| Prudential Financial, Inc. | 3,900 | 359,658 | ||||||
| RenaissanceRe Holdings Ltd. | 3,600 | 350,424 | ||||||
| Resolution Ltd. | 42,118 | 247,720 | ||||||
| RSA Insurance Group PLC | 185,053 | 280,243 | ||||||
| Sampo Oyj "A" | 4,452 | 219,727 | ||||||
| SCOR SE | 11,294 | 412,864 | ||||||
| Suncorp Group Ltd. | 29,276 | 343,895 | ||||||
| Swiss Life Holding AG (Registered)* | 3,144 | 654,360 | ||||||
| Swiss Re AG.* | 6,702 | 619,495 | ||||||
| The Travelers Companies, Inc. | 5,000 | 452,700 | ||||||
| Torchmark Corp. | 1,300 | 101,595 | ||||||
| Unum Group | 7,400 | 259,592 | ||||||
| Shares | Value ($) | |||||||
| W.R. Berkley Corp. | 4,400 | 190,916 | ||||||
| XL Group PLC | 11,500 | 366,160 | ||||||
| Zurich Insurance Group AG* | 2,199 | 639,463 | ||||||
| 14,143,701 | ||||||||
| Real Estate Investment Trusts 0.4% | ||||||||
| CFS Retail Property Trust (REIT) | 30,867 | 53,743 | ||||||
| Cole Real Estate Investment, Inc. (REIT) | 13,400 | 188,136 | ||||||
| Dexus Property Group (REIT) | 99,301 | 89,141 | ||||||
| Federation Centres Ltd. (REIT) | 56,236 | 117,538 | ||||||
| GPT Group (REIT) | 25,473 | 77,540 | ||||||
| H&R Real Estate Investment Trust (REIT) (Units) | 6,100 | 122,890 | ||||||
| HCP, Inc. (REIT) | 2,500 | 90,800 | ||||||
| RioCan Real Estate Investment Trust (REIT) | 6,200 | 144,574 | ||||||
| Stockland (REIT) | 34,178 | 110,500 | ||||||
| Westfield Group (REIT) | 13,202 | 118,989 | ||||||
| Westfield Retail Trust (REIT) | 29,121 | 77,251 | ||||||
| 1,191,102 | ||||||||
| Real Estate Management & Development 0.4% | ||||||||
| Cheung Kong (Holdings) Ltd. | 14,000 | 221,933 | ||||||
| First Capital Realty, Inc. | 2,900 | 48,349 | ||||||
| Henderson Land Development Co., Ltd. | 17,142 | 98,008 | ||||||
| Lend Lease Group | 6,467 | 64,361 | ||||||
| New World Development Co., Ltd. | 60,000 | 76,122 | ||||||
| Sun Hung Kai Properties Ltd. | 9,000 | 114,728 | ||||||
| Swire Pacific Ltd. "A" | 9,500 | 111,872 | ||||||
| Swiss Prime Site AG (Registered)* | 3,373 | 261,694 | ||||||
| UOL Group Ltd. | 2,000 | 9,823 | ||||||
| Wharf Holdings Ltd. | 10,000 | 76,432 | ||||||
| Wheelock & Co., Ltd. | 18,000 | 82,963 | ||||||
| 1,166,285 | ||||||||
| Thrifts & Mortgage Finance 0.2% | ||||||||
| New York Community Bancorp., Inc. (b) | 13,400 | 225,790 | ||||||
| Ocwen Financial Corp.* | 3,200 | 177,440 | ||||||
| People's United Financial, Inc. (b) | 12,400 | 187,488 | ||||||
| 590,718 | ||||||||
| Health Care 4.2% | ||||||||
| Biotechnology 0.8% | ||||||||
| Actelion Ltd. (Registered)* | 1,372 | 116,306 | ||||||
| Alexion Pharmaceuticals, Inc.* | 800 | 106,448 | ||||||
| Amgen, Inc. | 4,700 | 536,552 | ||||||
| Biogen Idec, Inc.* | 800 | 223,800 | ||||||
| Celgene Corp.* | 1,800 | 304,128 | ||||||
| CSL Ltd. | 5,674 | 350,243 | ||||||
| Gilead Sciences, Inc.* | 5,200 | 390,780 | ||||||
| Novozymes AS "B" | 355 | 15,018 | ||||||
| Regeneron Pharmaceuticals, Inc.* | 300 | 82,572 | ||||||
| 2,125,847 | ||||||||
| Health Care Equipment & Supplies 0.4% | ||||||||
| Abbott Laboratories | 5,000 | 191,650 | ||||||
| Baxter International, Inc. | 2,200 | 153,010 | ||||||
| Becton, Dickinson & Co. (b) | 1,100 | 121,539 | ||||||
| CareFusion Corp.* | 2,700 | 107,514 | ||||||
| Covidien PLC | 1,700 | 115,770 | ||||||
| Medtronic, Inc. | 4,700 | 269,733 | ||||||
| Stryker Corp. | 418 | 31,409 | ||||||
| Zimmer Holdings, Inc. | 700 | 65,233 | ||||||
| 1,055,858 | ||||||||
| Shares | Value ($) | |||||||
| Health Care Providers & Services 1.1% | ||||||||
| Aetna, Inc. | 5,000 | 342,950 | ||||||
| AmerisourceBergen Corp. | 1,800 | 126,558 | ||||||
| Cardinal Health, Inc. | 2,500 | 167,025 | ||||||
| Cigna Corp. | 3,200 | 279,936 | ||||||
| Express Scripts Holding Co.* | 2,800 | 196,672 | ||||||
| HCA Holdings, Inc.* | 4,100 | 195,611 | ||||||
| Humana, Inc. | 1,900 | 196,118 | ||||||
| Laboratory Corp. of America Holdings* (b) | 1,100 | 100,507 | ||||||
| McKesson Corp. | 1,300 | 209,820 | ||||||
| Omnicare, Inc. | 1,200 | 72,432 | ||||||
| Quest Diagnostics, Inc. (b) | 3,800 | 203,452 | ||||||
| UnitedHealth Group, Inc. | 6,000 | 451,800 | ||||||
| WellPoint, Inc. | 5,300 | 489,667 | ||||||
| 3,032,548 | ||||||||
| Life Sciences Tools & Services 0.1% | ||||||||
| Life Technologies Corp.* | 1,500 | 113,700 | ||||||
| Lonza Group AG (Registered)* | 48 | 4,569 | ||||||
| Thermo Fisher Scientific, Inc. | 1,500 | 167,025 | ||||||
| 285,294 | ||||||||
| Pharmaceuticals 1.8% | ||||||||
| AbbVie, Inc. | 3,900 | 205,959 | ||||||
| Actavis PLC* | 1,300 | 218,400 | ||||||
| Allergan, Inc. | 100 | 11,108 | ||||||
| AstraZeneca PLC | 5,458 | 323,747 | ||||||
| Bristol-Myers Squibb Co. | 2,700 | 143,505 | ||||||
| Eli Lilly & Co. | 4,100 | 209,100 | ||||||
| Forest Laboratories, Inc.* | 1,000 | 60,030 | ||||||
| GlaxoSmithKline PLC | 11,325 | 302,057 | ||||||
| Johnson & Johnson | 4,600 | 421,314 | ||||||
| Merck & Co., Inc. | 8,200 | 410,410 | ||||||
| Mylan, Inc.* | 1,500 | 65,100 | ||||||
| Novartis AG (Registered) | 6,109 | 488,906 | ||||||
| Novo Nordisk AS "B" | 593 | 109,249 | ||||||
| Otsuka Holdings Co., Ltd. | 5,200 | 150,177 | ||||||
| Pfizer, Inc. | 13,500 | 413,505 | ||||||
| Roche Holding AG (Genusschein) | 1,419 | 397,770 | ||||||
| Sanofi | 1,953 | 207,889 | ||||||
| Teva Pharmaceutical Industries Ltd. | 11,593 | 464,712 | ||||||
| Valeant Pharmaceuticals International, Inc.* | 1,200 | 140,780 | ||||||
| 4,743,718 | ||||||||
| Industrials 8.0% | ||||||||
| Aerospace & Defense 1.4% | ||||||||
| BAE Systems PLC | 54,787 | 395,944 | ||||||
| Boeing Co. | 1,900 | 259,331 | ||||||
| Cobham PLC | 19,835 | 90,203 | ||||||
| European Aeronautic Defence & Space Co. | 4,888 | 376,757 | ||||||
| General Dynamics Corp. | 2,800 | 267,540 | ||||||
| Honeywell International, Inc. | 2,700 | 246,699 | ||||||
| L-3 Communications Holdings, Inc. | 3,200 | 341,952 | ||||||
| Lockheed Martin Corp. | 2,000 | 297,320 | ||||||
| Meggitt PLC | 10,474 | 91,745 | ||||||
| Northrop Grumman Corp. | 2,600 | 297,986 | ||||||
| Precision Castparts Corp. | 800 | 215,440 | ||||||
| Raytheon Co. | 3,400 | 308,380 | ||||||
| Rockwell Collins, Inc. | 800 | 59,136 | ||||||
| Rolls-Royce Holdings PLC* | 4,868 | 103,102 | ||||||
| Safran SA | 2,864 | 199,166 | ||||||
| Thales SA | 645 | 41,581 | ||||||
| Shares | Value ($) | |||||||
| United Technologies Corp. | 3,300 | 375,540 | ||||||
| 3,967,822 | ||||||||
| Air Freight & Logistics 0.1% | ||||||||
| FedEx Corp. | 1,000 | 143,770 | ||||||
| United Parcel Service, Inc. "B" | 700 | 73,556 | ||||||
| 217,326 | ||||||||
| Airlines 0.5% | ||||||||
| Delta Air Lines, Inc. | 11,200 | 307,664 | ||||||
| Deutsche Lufthansa AG (Registered)* | 4,321 | 91,690 | ||||||
| easyJet PLC | 1,126 | 28,668 | ||||||
| Japan Airlines Co., Ltd. | 6,800 | 335,495 | ||||||
| Singapore Airlines Ltd. | 5,000 | 41,349 | ||||||
| Southwest Airlines Co. | 21,200 | 399,408 | ||||||
| United Continental Holdings, Inc.* | 2,600 | 98,358 | ||||||
| 1,302,632 | ||||||||
| Building Products 0.1% | ||||||||
| Allegion PLC* | 400 | 17,676 | ||||||
| Compagnie de Saint-Gobain | 2,073 | 114,578 | ||||||
| Congoleum Corp.* | 3,800 | 0 | ||||||
| Geberit AG (Registered) | 20 | 6,118 | ||||||
| LIXIL Group Corp. | 1,700 | 46,687 | ||||||
| 185,059 | ||||||||
| Commercial Services & Supplies 0.6% | ||||||||
| ADT Corp. (b) | 3,300 | 133,551 | ||||||
| Babcock International Group PLC | 6,729 | 151,036 | ||||||
| Brambles Ltd. | 17,748 | 145,058 | ||||||
| Cintas Corp. | 2,000 | 119,180 | ||||||
| G4S PLC | 33,563 | 146,002 | ||||||
| Republic Services, Inc. | 10,100 | 335,320 | ||||||
| Secom Co., Ltd. | 300 | 18,117 | ||||||
| Securitas AB "B" | 21,644 | 230,630 | ||||||
| Tyco International Ltd. | 5,700 | 233,928 | ||||||
| Waste Management, Inc. | 5,100 | 228,837 | ||||||
| 1,741,659 | ||||||||
| Construction & Engineering 0.4% | ||||||||
| ACS, Actividades de Construccion y Servicios SA | 9,020 | 312,676 | ||||||
| Bouygues SA | 6,594 | 250,041 | ||||||
| Chicago Bridge & Iron Co. NV | 1,400 | 116,396 | ||||||
| Jacobs Engineering Group, Inc.* | 700 | 44,093 | ||||||
| Quanta Services, Inc.* | 4,000 | 126,240 | ||||||
| Skanska AB "B" | 6,822 | 140,073 | ||||||
| Vinci SA | 1,191 | 78,480 | ||||||
| 1,067,999 | ||||||||
| Electrical Equipment 0.5% | ||||||||
| ABB Ltd. (Registered)* | 11,024 | 291,248 | ||||||
| Alstom SA | 3,389 | 123,817 | ||||||
| AMETEK, Inc. | 1,700 | 89,539 | ||||||
| Eaton Corp. PLC | 3,500 | 266,420 | ||||||
| Emerson Electric Co. | 2,900 | 203,522 | ||||||
| Rockwell Automation, Inc. | 1,000 | 118,160 | ||||||
| Roper Industries, Inc. | 500 | 69,340 | ||||||
| Sumitomo Electric Industries Ltd. | 9,800 | 163,769 | ||||||
| 1,325,815 | ||||||||
| Industrial Conglomerates 0.9% | ||||||||
| 3M Co. | 2,200 | 308,550 | ||||||
| Danaher Corp. | 3,400 | 262,480 | ||||||
| General Electric Co. | 18,300 | 512,949 | ||||||
| Hopewell Holdings Ltd. | 54,000 | 183,294 | ||||||
| Hutchison Whampoa Ltd. | 23,000 | 314,479 | ||||||
| Keppel Corp., Ltd. | 5,000 | 44,452 | ||||||
| Shares | Value ($) | |||||||
| Koninklijke Philips NV | 6,041 | 222,690 | ||||||
| NWS Holdings Ltd. | 54,000 | 82,310 | ||||||
| Sembcorp Industries Ltd. | 28,000 | 121,978 | ||||||
| Siemens AG (Registered) | 1,592 | 217,521 | ||||||
| Smiths Group PLC | 3,801 | 93,467 | ||||||
| Toshiba Corp. | 21,802 | 91,748 | ||||||
| 2,455,918 | ||||||||
| Machinery 0.9% | ||||||||
| AGCO Corp. | 4,800 | 284,112 | ||||||
| Caterpillar, Inc. | 2,900 | 263,349 | ||||||
| Cummins, Inc. | 500 | 70,485 | ||||||
| Deere & Co. | 3,900 | 356,187 | ||||||
| Dover Corp. | 2,900 | 279,966 | ||||||
| Hino Motors Ltd. | 1,000 | 15,760 | ||||||
| Illinois Tool Works, Inc. | 4,100 | 344,728 | ||||||
| Ingersoll-Rand PLC | 1,200 | 73,920 | ||||||
| PACCAR, Inc. | 3,000 | 177,510 | ||||||
| Parker Hannifin Corp. | 800 | 102,912 | ||||||
| Pentair Ltd. (Registered) | 400 | 31,068 | ||||||
| Schindler Holding AG (Registered) | 86 | 12,687 | ||||||
| SKF AB "B" | 3,191 | 83,743 | ||||||
| Stanley Black & Decker, Inc. | 600 | 48,414 | ||||||
| Sulzer AG (Registered) | 273 | 44,162 | ||||||
| Yangzijiang Shipbuilding Holdings Ltd. | 180,102 | 169,766 | ||||||
| 2,358,769 | ||||||||
| Marine 0.4% | ||||||||
| A P Moller-Maersk AS "A" | 46 | 474,348 | ||||||
| A P Moller-Maersk AS "B" | 37 | 403,539 | ||||||
| Nippon Yusen KK | 28,000 | 89,617 | ||||||
| Orient Overseas International Ltd. | 17,500 | 88,114 | ||||||
| 1,055,618 | ||||||||
| Professional Services 0.3% | ||||||||
| Adecco SA (Registered)* | 1,913 | 151,931 | ||||||
| Dun & Bradstreet Corp. | 700 | 85,925 | ||||||
| Equifax, Inc. | 1,800 | 124,362 | ||||||
| Nielsen Holdings NV | 3,900 | 178,971 | ||||||
| SGS SA (Registered) | 58 | 133,952 | ||||||
| Towers Watson & Co. "A" | 800 | 102,088 | ||||||
| 777,229 | ||||||||
| Road & Rail 0.3% | ||||||||
| Canadian National Railway Co. | 300 | 17,104 | ||||||
| Central Japan Railway Co. | 1,800 | 212,301 | ||||||
| CSX Corp. | 4,900 | 140,973 | ||||||
| East Japan Railway Co. | 300 | 23,942 | ||||||
| MTR Corp., Ltd. | 1,500 | 5,691 | ||||||
| Norfolk Southern Corp. | 1,100 | 102,113 | ||||||
| Union Pacific Corp. | 1,400 | 235,200 | ||||||
| West Japan Railway Co. | 2,600 | 112,837 | ||||||
| 850,161 | ||||||||
| Trading Companies & Distributors 1.6% | ||||||||
| Bunzl PLC | 3,990 | 95,882 | ||||||
| ITOCHU Corp. | 46,700 | 577,981 | ||||||
| Marubeni Corp. | 100,000 | 719,616 | ||||||
| Mitsubishi Corp. | 31,500 | 604,573 | ||||||
| Mitsui & Co., Ltd. | 53,100 | 740,444 | ||||||
| Rexel SA | 3,447 | 90,791 | ||||||
| Sojitz Corp. | 271,400 | 483,306 | ||||||
| Sumitomo Corp. | 57,200 | 719,480 | ||||||
| Toyota Tsusho Corp. | 4,300 | 106,786 | ||||||
| W.W. Grainger, Inc. | 500 | 127,710 | ||||||
| 4,266,569 | ||||||||
| Shares | Value ($) | |||||||
| Information Technology 9.0% | ||||||||
| Communications Equipment 1.1% | ||||||||
| AAC Technologies Holdings, Inc. | 30,000 | 145,948 | ||||||
| Cisco Systems, Inc. | 35,100 | 787,995 | ||||||
| Harris Corp. | 4,300 | 300,183 | ||||||
| Juniper Networks, Inc.* | 6,400 | 144,448 | ||||||
| Motorola Solutions, Inc. | 6,600 | 445,500 | ||||||
| QUALCOMM, Inc. | 9,100 | 675,675 | ||||||
| Telefonaktiebolaget LM Ericsson "B" | 30,698 | 375,917 | ||||||
| 2,875,666 | ||||||||
| Computers & Peripherals 1.1% | ||||||||
| Apple, Inc. | 1,600 | 897,776 | ||||||
| EMC Corp. (b) | 15,900 | 399,885 | ||||||
| Hewlett-Packard Co. | 16,600 | 464,468 | ||||||
| NetApp, Inc. | 3,200 | 131,648 | ||||||
| SanDisk Corp. | 4,000 | 282,160 | ||||||
| Seagate Technology PLC | 5,800 | 325,728 | ||||||
| Western Digital Corp. | 3,500 | 293,650 | ||||||
| 2,795,315 | ||||||||
| Electronic Equipment, Instruments & Components 0.8% | ||||||||
| Arrow Electronics, Inc.* | 6,800 | 368,900 | ||||||
| Avnet, Inc. | 8,500 | 374,935 | ||||||
| Corning, Inc. | 21,700 | 386,694 | ||||||
| Flextronics International Ltd.* | 48,100 | 373,737 | ||||||
| FUJIFILM Holdings Corp. | 3,600 | 102,228 | ||||||
| Hitachi Ltd. | 24,000 | 181,962 | ||||||
| Kyocera Corp. | 3,100 | 155,061 | ||||||
| TE Connectivity Ltd. | 5,600 | 308,616 | ||||||
| 2,252,133 | ||||||||
| Internet Software & Services 0.9% | ||||||||
| Dena Co., Ltd. (b) | 11,600 | 244,252 | ||||||
| eBay, Inc.* | 7,200 | 395,208 | ||||||
| Facebook, Inc. "A"* | 5,600 | 306,096 | ||||||
| Google, Inc. "A"* | 600 | 672,426 | ||||||
| Gree, Inc. (b) | 19,900 | 196,691 | ||||||
| LinkedIn Corp. "A"* | 800 | 173,464 | ||||||
| VeriSign, Inc.* (b) | 2,200 | 131,516 | ||||||
| Yahoo!, Inc.* | 8,100 | 327,564 | ||||||
| 2,447,217 | ||||||||
| IT Services 2.1% | ||||||||
| Accenture PLC "A" | 5,200 | 427,544 | ||||||
| Alliance Data Systems Corp.* (b) | 700 | 184,051 | ||||||
| AtoS | 2,140 | 194,311 | ||||||
| Automatic Data Processing, Inc. | 3,024 | 244,369 | ||||||
| Cap Gemini SA | 1,434 | 97,239 | ||||||
| CGI Group, Inc. "A"* | 6,000 | 200,744 | ||||||
| Cognizant Technology Solutions Corp. "A"* | 2,100 | 212,058 | ||||||
| Computer Sciences Corp. | 6,300 | 352,044 | ||||||
| Fidelity National Information Services, Inc. | 7,400 | 397,232 | ||||||
| Fiserv, Inc.* | 4,800 | 283,440 | ||||||
| FleetCor Technologies, Inc.* | 1,000 | 117,170 | ||||||
| Fujitsu Ltd.* | 18,000 | 93,191 | ||||||
| International Business Machines Corp. | 3,900 | 731,523 | ||||||
| Itochu Techno-Solutions Corp. | 800 | 32,462 | ||||||
| Leidos Holdings, Inc. (b) | 7,025 | 326,592 | ||||||
| MasterCard, Inc. "A" | 400 | 334,184 | ||||||
| Nomura Research Institute Ltd. | 1,600 | 50,458 | ||||||
| Otsuka Corp. | 700 | 89,348 | ||||||
| Shares | Value ($) | |||||||
| Paychex, Inc. (b) | 3,900 | 177,567 | ||||||
| Recall Holdings Ltd.* | 225 | 816 | ||||||
| Total System Services, Inc. | 6,700 | 222,976 | ||||||
| Vantiv, Inc. "A"* | 4,300 | 140,223 | ||||||
| Visa, Inc. "A" | 2,500 | 556,700 | ||||||
| Western Union Co. (b) | 15,900 | 274,275 | ||||||
| 5,740,517 | ||||||||
| Office Electronics 0.3% | ||||||||
| Canon, Inc. (b) | 8,900 | 283,291 | ||||||
| Konica Minolta, Inc. | 2,500 | 25,061 | ||||||
| Ricoh Co., Ltd. | 14,776 | 157,673 | ||||||
| Xerox Corp. | 33,600 | 408,912 | ||||||
| 874,937 | ||||||||
| Semiconductors & Semiconductor Equipment 1.3% | ||||||||
| Altera Corp. | 900 | 29,277 | ||||||
| Analog Devices, Inc. | 3,300 | 168,069 | ||||||
| Applied Materials, Inc. | 4,300 | 76,067 | ||||||
| ASML Holding NV | 960 | 90,149 | ||||||
| Avago Technologies Ltd. | 4,900 | 259,161 | ||||||
| Broadcom Corp. "A" | 9,200 | 272,780 | ||||||
| Intel Corp. | 27,406 | 711,460 | ||||||
| KLA-Tencor Corp. | 3,900 | 251,394 | ||||||
| Lam Research Corp.* | 5,400 | 294,030 | ||||||
| Linear Technology Corp. | 800 | 36,440 | ||||||
| LSI Corp. | 26,600 | 293,132 | ||||||
| Maxim Integrated Products, Inc. | 4,900 | 136,759 | ||||||
| Microchip Technology, Inc. | 4,200 | 187,950 | ||||||
| Micron Technology, Inc.* | 11,300 | 245,888 | ||||||
| NVIDIA Corp. | 2,900 | 46,458 | ||||||
| Texas Instruments, Inc. (b) | 6,600 | 289,806 | ||||||
| Xilinx, Inc. | 1,900 | 87,248 | ||||||
| 3,476,068 | ||||||||
| Software 1.4% | ||||||||
| Activision Blizzard, Inc. | 20,200 | 360,166 | ||||||
| Adobe Systems, Inc.* | 700 | 41,916 | ||||||
| CA, Inc. | 13,500 | 454,275 | ||||||
| Electronic Arts, Inc.* | 3,800 | 87,172 | ||||||
| GungHo Online Entertainment, Inc.* (b) | 11,400 | 82,265 | ||||||
| Intuit, Inc. | 4,000 | 305,280 | ||||||
| Microsoft Corp. | 18,086 | 676,959 | ||||||
| Nexon Co., Ltd. | 22,200 | 204,973 | ||||||
| Nuance Communications, Inc.* (b) | 5,300 | 80,560 | ||||||
| Open Text Corp. | 100 | 9,198 | ||||||
| Oracle Corp. | 17,300 | 661,898 | ||||||
| SAP AG | 1,974 | 169,251 | ||||||
| Symantec Corp. | 12,600 | 297,108 | ||||||
| Synopsys, Inc.* | 4,800 | 194,736 | ||||||
| The Sage Group PLC | 14,718 | 98,699 | ||||||
| VMware, Inc. "A"* | 1,000 | 89,710 | ||||||
| 3,814,166 | ||||||||
| Materials 1.8% | ||||||||
| Chemicals 0.7% | ||||||||
| Agrium, Inc. | 600 | 54,886 | ||||||
| Air Products & Chemicals, Inc. | 800 | 89,424 | ||||||
| Asahi Kasei Corp. | 24,529 | 192,255 | ||||||
| BASF SE | 822 | 87,654 | ||||||
| CF Industries Holdings, Inc. | 700 | 163,128 | ||||||
| Dow Chemical Co. | 3,700 | 164,280 | ||||||
| E.I. du Pont de Nemours & Co. | 1,900 | 123,443 | ||||||
| Eastman Chemical Co. | 1,100 | 88,770 | ||||||
| Ecolab, Inc. | 500 | 52,135 | ||||||
| Shares | Value ($) | |||||||
| Givaudan SA (Registered)* | 2 | 2,865 | ||||||
| LyondellBasell Industries NV "A" | 4,500 | 361,260 | ||||||
| Mitsubishi Chemical Holdings Corp. | 48,000 | 222,091 | ||||||
| Monsanto Co. | 1,300 | 151,515 | ||||||
| Praxair, Inc. | 700 | 91,021 | ||||||
| Syngenta AG (Registered) | 390 | 155,468 | ||||||
| 2,000,195 | ||||||||
| Construction Materials 0.1% | ||||||||
| Fletcher Building Ltd. | 22,389 | 155,924 | ||||||
| Holcim Ltd. (Registered)* | 2,596 | 195,176 | ||||||
| Wolverine Tube, Inc.* | 366 | 11,803 | ||||||
| 362,903 | ||||||||
| Containers & Packaging 0.1% | ||||||||
| Rock-Tenn Co. "A" | 1,800 | 189,018 | ||||||
| Metals & Mining 0.8% | ||||||||
| Anglo American PLC | 7,424 | 163,152 | ||||||
| Barrick Gold Corp. | 25,100 | 442,100 | ||||||
| BHP Billiton Ltd. | 5,062 | 172,149 | ||||||
| BHP Billiton PLC | 4,225 | 130,999 | ||||||
| Fortescue Metals Group Ltd. | 32,908 | 171,724 | ||||||
| Freeport-McMoRan Copper & Gold, Inc. | 6,600 | 249,084 | ||||||
| Goldcorp, Inc. | 3,200 | 69,407 | ||||||
| Mitsubishi Materials Corp. | 24,000 | 88,711 | ||||||
| Newmont Mining Corp. | 8,200 | 188,846 | ||||||
| Rio Tinto PLC | 4,429 | 249,926 | ||||||
| Sumitomo Metal Mining Co., Ltd. | 7,000 | 91,785 | ||||||
| Yamana Gold, Inc. | 11,400 | 98,305 | ||||||
| 2,116,188 | ||||||||
| Paper & Forest Products 0.1% | ||||||||
| International Paper Co. | 3,800 | 186,314 | ||||||
| UPM-Kymmene Oyj | 6,585 | 111,410 | ||||||
| 297,724 | ||||||||
| Telecommunication Services 3.7% | ||||||||
| Diversified Telecommunication Services 3.1% | ||||||||
| AT&T, Inc. | 17,300 | 608,268 | ||||||
| BCE, Inc. | 6,200 | 268,487 | ||||||
| Bell Aliant, Inc. | 1,500 | 37,745 | ||||||
| BT Group PLC | 60,534 | 381,144 | ||||||
| CenturyLink, Inc. (b) | 16,300 | 519,155 | ||||||
| Deutsche Telekom AG (Registered) | 23,726 | 405,790 | ||||||
| Elisa Oyj | 6,796 | 180,231 | ||||||
| HKT Trust & HKT Ltd. | 247,000 | 244,460 | ||||||
| Iliad SA | 41 | 8,400 | ||||||
| Nippon Telegraph & Telephone Corp. | 14,400 | 775,100 | ||||||
| Orange SA | 29,858 | 371,115 | ||||||
| PCCW Ltd. | 316,000 | 141,452 | ||||||
| Singapore Telecommunications Ltd. | 64,060 | 185,282 | ||||||
| Swisscom AG (Registered) | 721 | 381,271 | ||||||
| TDC AS | 25,255 | 245,022 | ||||||
| Telecom Corp. of New Zealand Ltd. | 144,644 | 274,325 | ||||||
| Telecom Italia SpA | 105,086 | 104,572 | ||||||
| Telecom Italia SpA (RSP) | 598,241 | 469,791 | ||||||
| Telefonica Deutschland Holding AG | 43,762 | 361,814 | ||||||
| Telefonica SA | 8,812 | 143,852 | ||||||
| Telenor ASA | 7,679 | 183,373 | ||||||
| TeliaSonera AB | 55,954 | 466,665 | ||||||
| Telstra Corp., Ltd. | 84,550 | 396,430 | ||||||
| TELUS Corp. | 9,300 | 320,083 | ||||||
| Verizon Communications, Inc. | 9,900 | 486,486 | ||||||
| Shares | Value ($) | |||||||
| Vivendi SA | 8,611 | 227,796 | ||||||
| Ziggo NV | 3,720 | 170,249 | ||||||
| 8,358,358 | ||||||||
| Wireless Telecommunication Services 0.6% | ||||||||
| Crown Castle International Corp.* | 1,500 | 110,145 | ||||||
| KDDI Corp. | 4,300 | 265,201 | ||||||
| Millicom International Cellular SA (SDR) | 184 | 18,334 | ||||||
| NTT DoCoMo, Inc. | 28,200 | 463,330 | ||||||
| Rogers Communications, Inc. "B" | 3,800 | 171,961 | ||||||
| SoftBank Corp. | 600 | 52,598 | ||||||
| Vodafone Group PLC | 114,096 | 448,520 | ||||||
| 1,530,089 | ||||||||
| Utilities 4.2% | ||||||||
| Electric Utilities 2.5% | ||||||||
| American Electric Power Co., Inc. | 7,600 | 355,224 | ||||||
| Cheung Kong Infrastructure Holdings Ltd. | 40,000 | 253,545 | ||||||
| CLP Holdings Ltd. | 13,500 | 106,967 | ||||||
| Contact Energy Ltd. | 20,471 | 86,357 | ||||||
| Duke Energy Corp. | 6,400 | 441,664 | ||||||
| E.ON SE | 7,139 | 131,561 | ||||||
| Edison International | 8,300 | 384,290 | ||||||
| EDP — Energias de Portugal SA | 117,598 | 431,976 | ||||||
| Electricite de France SA | 3,321 | 117,605 | ||||||
| Enel SpA | 36,382 | 159,391 | ||||||
| Entergy Corp. | 6,100 | 385,947 | ||||||
| Exelon Corp. | 11,500 | 314,985 | ||||||
| FirstEnergy Corp. | 10,100 | 333,098 | ||||||
| Fortum Oyj | 12,723 | 291,272 | ||||||
| Iberdrola SA | 23,862 | 152,618 | ||||||
| NextEra Energy, Inc. | 4,100 | 351,042 | ||||||
| Northeast Utilities | 7,700 | 326,403 | ||||||
| OGE Energy Corp. | 2,200 | 74,580 | ||||||
| Pepco Holdings, Inc. | 8,000 | 153,040 | ||||||
| Pinnacle West Capital Corp. | 3,100 | 164,052 | ||||||
| Power Assets Holdings Ltd. | 11,000 | 87,707 | ||||||
| PPL Corp. | 13,400 | 403,206 | ||||||
| Southern Co. | 8,200 | 337,102 | ||||||
| SSE PLC | 17,833 | 405,532 | ||||||
| Tokyo Electric Power Co., Inc.* | 16,400 | 80,646 | ||||||
| Xcel Energy, Inc. | 12,700 | 354,838 | ||||||
| 6,684,648 | ||||||||
| Gas Utilities 0.1% | ||||||||
| Enagas SA | 3,266 | 85,500 | ||||||
| Osaka Gas Co., Ltd. | 33,000 | 129,688 | ||||||
| Tokyo Gas Co., Ltd. | 33,000 | 162,608 | ||||||
| 377,796 | ||||||||
| Independent Power Producers & Energy Traders 0.1% | ||||||||
| AES Corp. | 10,900 | 158,159 | ||||||
| Electric Power Development Co., Ltd. | 6,700 | 195,396 | ||||||
| 353,555 | ||||||||
| Multi-Utilities 1.4% | ||||||||
| AGL Energy Ltd. | 17,237 | 231,399 | ||||||
| Alliant Energy Corp. | 2,900 | 149,640 | ||||||
| Ameren Corp. | 4,600 | 166,336 | ||||||
| Centrica PLC | 49,959 | 287,716 | ||||||
| CMS Energy Corp. | 7,300 | 195,421 | ||||||
| Consolidated Edison, Inc. | 5,200 | 287,456 | ||||||
| Dominion Resources, Inc. | 2,100 | 135,849 | ||||||
| DTE Energy Co. | 4,500 | 298,755 | ||||||
| Shares | Value ($) | |||||||
| Integrys Energy Group, Inc. (b) | 4,300 | 233,963 | ||||||
| MDU Resources Group, Inc. | 2,900 | 88,595 | ||||||
| National Grid PLC | 18,227 | 238,161 | ||||||
| NiSource, Inc. | 2,700 | 88,776 | ||||||
| PG&E Corp. | 8,100 | 326,268 | ||||||
| Public Service Enterprise Group, Inc. | 10,000 | 320,400 | ||||||
| RWE AG | 2,127 | 77,782 | ||||||
| SCANA Corp. (b) | 4,600 | 215,878 | ||||||
| Sempra Energy | 2,400 | 215,424 | ||||||
| Veolia Environnement SA | 5,553 | 90,738 | ||||||
| Wisconsin Energy Corp. | 3,800 | 157,092 | ||||||
| 3,805,649 | ||||||||
| Water Utilities 0.1% | ||||||||
| American Water Works Co., Inc. | 3,800 | 160,587 | ||||||
Total Common Stocks (Cost $157,178,161) | 169,803,115 | |||||||
| Preferred Stocks 0.5% | ||||||||
| Consumer Discretionary 0.4% | ||||||||
| Bayerische Motoren Werke (BMW) AG | 3,428 | 292,868 | ||||||
| Porsche Automobil Holding SE | 5,582 | 582,579 | ||||||
| Volkswagen AG | 1,130 | 317,475 | ||||||
| 1,192,922 | ||||||||
| Financials 0.0% | ||||||||
| Ally Financial, Inc. Series G, 144A, 7.0% | 75 | 72,007 | ||||||
| Utilities 0.1% | ||||||||
| RWE AG | 3,799 | 121,517 | ||||||
Total Preferred Stocks (Cost $1,211,893) | 1,386,446 | |||||||
| Rights 0.0% | ||||||||
| Energy | ||||||||
| Repsol SA, Expiration Date 1/9/2014* (Cost $1,875) | 2,873 | 1,960 | ||||||
| Warrants 0.0% | ||||||||
| Consumer Discretionary 0.0% | ||||||||
| Reader's Digest Association, Inc., Expiration Date 2/19/2014* | 80 | 0 | ||||||
| Materials 0.0% | ||||||||
| GEO Specialty Chemicals, Inc., Expiration Date 3/31/2015* | 19,324 | 14,227 | ||||||
| Hercules Trust II, Expiration Date 3/31/2029* | 170 | 1,796 | ||||||
| 16,023 | ||||||||
Total Warrants (Cost $30,283) | 16,023 | |||||||
| Principal Amount ($)(c) | Value ($) | ||||||||
| Corporate Bonds 22.4% | |||||||||
| Consumer Discretionary 3.3% | |||||||||
| 21st Century Fox America, Inc., 144A, 4.0%, 10/1/2023 | 30,000 | 29,651 | |||||||
| AMC Entertainment, Inc., 8.75%, 6/1/2019 | 405,000 | 432,844 | |||||||
| Principal Amount ($)(c) | Value ($) | ||||||||
| AmeriGas Finance LLC: | |||||||||
| 6.75%, 5/20/2020 | 110,000 | 120,175 | |||||||
| 7.0%, 5/20/2022 | 80,000 | 86,800 | |||||||
| APX Group, Inc., 6.375%, 12/1/2019 | 50,000 | 50,750 | |||||||
| Asbury Automotive Group, Inc., 8.375%, 11/15/2020 | 15,000 | 16,856 | |||||||
| Ashtead Capital, Inc., 144A, 6.5%, 7/15/2022 | 80,000 | 85,300 | |||||||
| Ashton Woods U.S.A. LLC, 144A, 6.875%, 2/15/2021 | 80,000 | 79,000 | |||||||
| Avis Budget Car Rental LLC: | |||||||||
| 5.5%, 4/1/2023 | 50,000 | 48,438 | |||||||
| 8.25%, 1/15/2019 | 15,000 | 16,350 | |||||||
| BC Mountain LLC, 144A, 7.0%, 2/1/2021 | 50,000 | 50,500 | |||||||
| Block Communications, Inc., 144A, 7.25%, 2/1/2020 | 20,000 | 21,200 | |||||||
| Boyd Gaming Corp., 9.0%, 7/1/2020 (b) | 40,000 | 43,800 | |||||||
| British Sky Broadcasting Group PLC, 144A, 3.125%, 11/26/2022 | 90,000 | 83,793 | |||||||
| Caesar's Entertainment Operating Co., Inc.: | |||||||||
| 8.5%, 2/15/2020 | 210,000 | 202,125 | |||||||
| 9.0%, 2/15/2020 | 65,000 | 63,212 | |||||||
| CCO Holdings LLC: | |||||||||
| 6.5%, 4/30/2021 | 420,000 | 431,550 | |||||||
| 6.625%, 1/31/2022 | 705,000 | 726,150 | |||||||
| 7.375%, 6/1/2020 | 10,000 | 10,825 | |||||||
| CDR DB Sub, Inc., 144A, 7.75%, 10/15/2020 | 55,000 | 54,725 | |||||||
| Cequel Communications Holdings I LLC: | |||||||||
| 144A, 5.125%, 12/15/2021 | 80,000 | 75,000 | |||||||
| 144A, 6.375%, 9/15/2020 | 285,000 | 292,125 | |||||||
| Clear Channel Communications, Inc., 11.25%, 3/1/2021 | 70,000 | 75,250 | |||||||
| Clear Channel Worldwide Holdings, Inc.: | |||||||||
| Series A, 6.5%, 11/15/2022 | 65,000 | 65,894 | |||||||
| Series B, 6.5%, 11/15/2022 | 90,000 | 91,912 | |||||||
| Series A, 7.625%, 3/15/2020 | 10,000 | 10,400 | |||||||
| Series B, 7.625%, 3/15/2020 | 255,000 | 268,069 | |||||||
| Cogeco Cable, Inc., 144A, 4.875%, 5/1/2020 | 5,000 | 4,825 | |||||||
| Columbus International, Inc., 144A, 11.5%, 11/20/2014 | 100,000 | 107,750 | |||||||
| Cox Communications, Inc., 144A, 3.25%, 12/15/2022 | 80,000 | 72,391 | |||||||
| Cumulus Media Holdings, Inc., 7.75%, 5/1/2019 | 50,000 | 52,750 | |||||||
| Delphi Corp., 5.0%, 2/15/2023 | 70,000 | 72,012 | |||||||
| DISH DBS Corp.: | |||||||||
| 4.25%, 4/1/2018 | 70,000 | 71,400 | |||||||
| 5.0%, 3/15/2023 | 95,000 | 88,587 | |||||||
| 7.875%, 9/1/2019 | 270,000 | 309,150 | |||||||
| Griffey Intermediate, Inc., 144A, 7.0%, 10/15/2020 | 95,000 | 75,287 | |||||||
| Harron Communications LP, 144A, 9.125%, 4/1/2020 | 45,000 | 49,838 | |||||||
| Hertz Corp.: | |||||||||
| 4.25%, 4/1/2018 | 45,000 | 46,125 | |||||||
| 6.75%, 4/15/2019 | 280,000 | 301,700 | |||||||
| Hot Topic, Inc., 144A, 9.25%, 6/15/2021 | 40,000 | 41,900 | |||||||
| Principal Amount ($)(c) | Value ($) | ||||||||
| Jo-Ann Stores Holdings, Inc., 144A, 9.75%, 10/15/2019 (PIK) | 120,000 | 125,550 | |||||||
| Libbey Glass, Inc., 6.875%, 5/15/2020 | 27,000 | 29,160 | |||||||
| Live Nation Entertainment, Inc., 144A, 7.0%, 9/1/2020 | 90,000 | 97,650 | |||||||
| Marriott International, Inc., 3.375%, 10/15/2020 | 90,000 | 89,127 | |||||||
| MDC Partners, Inc., 144A, 6.75%, 4/1/2020 | 40,000 | 41,850 | |||||||
| Mediacom Broadband LLC, 6.375%, 4/1/2023 | 35,000 | 35,788 | |||||||
| MGM Resorts International: | |||||||||
| 6.625%, 12/15/2021 (b) | 150,000 | 158,625 | |||||||
| 6.75%, 10/1/2020 (b) | 40,000 | 42,800 | |||||||
| 8.625%, 2/1/2019 | 400,000 | 469,000 | |||||||
| Midcontinent Communications & Midcontinent Finance Corp., 144A, 6.25%, 8/1/2021 | 50,000 | 50,375 | |||||||
| Myriad International Holdings BV, 144A, 6.0%, 7/18/2020 | 200,000 | 214,000 | |||||||
| PNK Finance Corp., 144A, 6.375%, 8/1/2021 | 70,000 | 71,575 | |||||||
| Quebecor Media, Inc., 5.75%, 1/15/2023 | 50,000 | 48,375 | |||||||
| RCI Banque SA, 144A, 3.5%, 4/3/2018 | 100,000 | 101,913 | |||||||
| Rent-A-Center, Inc., 4.75%, 5/1/2021 | 40,000 | 37,550 | |||||||
| Schaeffler Finance BV, 144A, 7.75%, 2/15/2017 | 845,000 | 959,075 | |||||||
| Seminole Hard Rock Entertainment, Inc., 144A, 5.875%, 5/15/2021 | 35,000 | 34,388 | |||||||
| Serta Simmons Holdings LLC, 144A, 8.125%, 10/1/2020 (b) | 55,000 | 59,813 | |||||||
| Sirius XM Holdings, Inc., 144A, 5.875%, 10/1/2020 | 60,000 | 61,200 | |||||||
| SIWF Merger Sub, Inc., 144A, 6.25%, 6/1/2021 | 85,000 | 85,744 | |||||||
| Starz LLC, 5.0%, 9/15/2019 | 40,000 | 40,900 | |||||||
| Taylor Morrison Communities, Inc., 144A, 5.25%, 4/15/2021 | 65,000 | 63,212 | |||||||
| Travelport LLC, 144A, 6.364%**, 3/1/2016 | 11,680 | 11,738 | |||||||
| Unitymedia Hessen GmbH & Co., KG: | |||||||||
| 144A, 5.5%, 1/15/2023 | 200,000 | 194,000 | |||||||
| 144A, 7.5%, 3/15/2019 | EUR | 400,000 | 598,462 | ||||||
| Unitymedia KabelBW GmbH, 144A, 9.625%, 12/1/2019 | EUR | 110,000 | 167,595 | ||||||
| Univision Communications, Inc., 144A, 6.875%, 5/15/2019 | 25,000 | 26,719 | |||||||
| Viking Cruises Ltd., 144A, 8.5%, 10/15/2022 | 50,000 | 56,500 | |||||||
| 8,799,093 | |||||||||
| Consumer Staples 1.7% | |||||||||
| Agrokor DD, 144A, 8.875%, 2/1/2020 | 500,000 | 535,025 | |||||||
| B&G Foods, Inc., 4.625%, 6/1/2021 | 70,000 | 67,200 | |||||||
| Cencosud SA, 144A, 4.875%, 1/20/2023 | 200,000 | 186,635 | |||||||
| Principal Amount ($)(c) | Value ($) | ||||||||
| Chiquita Brands International, Inc., 144A, 7.875%, 2/1/2021 | 45,000 | 48,713 | |||||||
| Controladora Mabe SA de CV, 144A, 7.875%, 10/28/2019 | 100,000 | 111,500 | |||||||
| Del Monte Corp., 7.625%, 2/15/2019 | 95,000 | 98,681 | |||||||
| ESAL GmbH, 144A, 6.25%, 2/5/2023 | 250,000 | 224,375 | |||||||
| Hawk Acquisition Sub, Inc., 144A, 4.25%, 10/15/2020 | 155,000 | 149,962 | |||||||
| JBS U.S.A. LLC: | |||||||||
| 144A, 7.25%, 6/1/2021 | 145,000 | 150,800 | |||||||
| 144A, 8.25%, 2/1/2020 | 370,000 | 401,450 | |||||||
| Marfrig Holding Europe BV, 144A, 11.25%, 9/20/2021 | 200,000 | 191,000 | |||||||
| MHP SA, 144A, 8.25%, 4/2/2020 | 200,000 | 177,540 | |||||||
| Minerva Luxembourg SA, 144A, 12.25%, 2/10/2022 | 250,000 | 287,500 | |||||||
| Mriya Agro Holding PLC, 144A, 9.45%, 4/19/2018 | 200,000 | 171,000 | |||||||
| Pilgrim's Pride Corp., 7.875%, 12/15/2018 | 430,000 | 468,700 | |||||||
| Reynolds Group Issuer, Inc.: | |||||||||
| 5.75%, 10/15/2020 | 95,000 | 96,900 | |||||||
| 7.125%, 4/15/2019 | 1,015,000 | 1,080,975 | |||||||
| Smithfield Foods, Inc., 6.625%, 8/15/2022 | 90,000 | 95,400 | |||||||
| Sun Products Corp., 144A, 7.75%, 3/15/2021 | 90,000 | 79,200 | |||||||
| 4,622,556 | |||||||||
| Energy 2.2% | |||||||||
| Access Midstream Partners LP: | |||||||||
| 4.875%, 5/15/2023 | 90,000 | 86,850 | |||||||
| 6.125%, 7/15/2022 | 15,000 | 16,050 | |||||||
| Afren PLC, 144A, 10.25%, 4/8/2019 | 140,000 | 161,700 | |||||||
| Berry Petroleum Co.: | |||||||||
| 6.375%, 9/15/2022 | 50,000 | 50,875 | |||||||
| 6.75%, 11/1/2020 | 50,000 | 51,875 | |||||||
| BreitBurn Energy Partners LP, 7.875%, 4/15/2022 | 50,000 | 52,000 | |||||||
| Chaparral Energy, Inc., 7.625%, 11/15/2022 | 85,000 | 90,950 | |||||||
| Crosstex Energy LP, 7.125%, 6/1/2022 | 25,000 | 28,438 | |||||||
| DCP Midstream LLC, 144A, 9.75%, 3/15/2019 | 200,000 | 248,847 | |||||||
| Denbury Resources, Inc., 4.625%, 7/15/2023 | 45,000 | 40,613 | |||||||
| Endeavor Energy Resources LP, 144A, 7.0%, 8/15/2021 | 85,000 | 85,850 | |||||||
| Energy Transfer Partners LP, 4.15%, 10/1/2020 | 70,000 | 71,021 | |||||||
| EP Energy LLC: | |||||||||
| 6.875%, 5/1/2019 | 15,000 | 16,144 | |||||||
| 7.75%, 9/1/2022 | 80,000 | 89,600 | |||||||
| EPE Holdings LLC, 144A, 8.875%, 12/15/2017 (PIK) | 119,807 | 123,102 | |||||||
| EV Energy Partners LP, 8.0%, 4/15/2019 | 35,000 | 35,175 | |||||||
| FMC Technologies, Inc., 3.45%, 10/1/2022 | 200,000 | 184,185 | |||||||
| Halcon Resources Corp.: | |||||||||
| 8.875%, 5/15/2021 | 135,000 | 136,350 | |||||||
| 9.75%, 7/15/2020 | 65,000 | 67,763 | |||||||
| Holly Energy Partners LP, 6.5%, 3/1/2020 | 10,000 | 10,450 | |||||||
| Principal Amount ($)(c) | Value ($) | ||||||||
| Kodiak Oil & Gas Corp., 5.5%, 1/15/2021 | 100,000 | 99,750 | |||||||
| Linn Energy LLC: | |||||||||
| 6.5%, 5/15/2019 | 25,000 | 25,500 | |||||||
| 144A, 7.0%, 11/1/2019 | 540,000 | 545,400 | |||||||
| MEG Energy Corp., 144A, 7.0%, 3/31/2024 | 145,000 | 146,812 | |||||||
| Midstates Petroleum Co., Inc.: | |||||||||
| 9.25%, 6/1/2021 | 135,000 | 141,075 | |||||||
| 10.75%, 10/1/2020 | 150,000 | 163,125 | |||||||
| Murphy Oil U.S.A., Inc., 144A, 6.0%, 8/15/2023 | 85,000 | 85,425 | |||||||
| Murray Energy Corp., 144A, 8.625%, 6/15/2021 | 15,000 | 15,525 | |||||||
| Northern Oil & Gas, Inc., 8.0%, 6/1/2020 | 140,000 | 146,650 | |||||||
| Oasis Petroleum, Inc.: | |||||||||
| 6.5%, 11/1/2021 | 225,000 | 240,750 | |||||||
| 144A, 6.875%, 3/15/2022 | 115,000 | 121,900 | |||||||
| 6.875%, 1/15/2023 | 35,000 | 37,275 | |||||||
| 7.25%, 2/1/2019 | 60,000 | 64,500 | |||||||
| Offshore Drilling Holding SA, 144A, 8.375%, 9/20/2020 | 200,000 | 213,000 | |||||||
| Offshore Group Investment Ltd.: | |||||||||
| 7.125%, 4/1/2023 | 100,000 | 102,000 | |||||||
| 7.5%, 11/1/2019 | 140,000 | 152,250 | |||||||
| ONEOK Partners LP, 6.15%, 10/1/2016 | 201,000 | 225,717 | |||||||
| Pacific Drilling SA, 144A, 5.375%, 6/1/2020 | 70,000 | 70,350 | |||||||
| Pertamina Persero PT, 144A, 5.625%, 5/20/2043 | 200,000 | 158,500 | |||||||
| Petroleos de Venezuela SA, 144A, 8.5%, 11/2/2017 | 250,000 | 208,125 | |||||||
| Reliance Holdings U.S.A., Inc., 144A, 5.4%, 2/14/2022 | 250,000 | 252,835 | |||||||
| Sabine Pass Liquefaction LLC, 144A, 5.625%, 2/1/2021 | 175,000 | 171,062 | |||||||
| SandRidge Energy, Inc., 7.5%, 3/15/2021 | 190,000 | 199,025 | |||||||
| SESI LLC, 7.125%, 12/15/2021 | 30,000 | 33,450 | |||||||
| Talisman Energy, Inc., 3.75%, 2/1/2021 | 120,000 | 116,179 | |||||||
| Talos Production LLC, 144A, 9.75%, 2/15/2018 | 95,000 | 97,137 | |||||||
| Tesoro Corp., 5.375%, 10/1/2022 (b) | 35,000 | 35,438 | |||||||
| Transocean, Inc., 3.8%, 10/15/2022 | 370,000 | 350,696 | |||||||
| Whiting Petroleum Corp., 5.0%, 3/15/2019 | 75,000 | 76,687 | |||||||
| 5,943,976 | |||||||||
| Financials 3.7% | |||||||||
| Ally Financial, Inc.: | |||||||||
| 5.5%, 2/15/2017 | 15,000 | 16,238 | |||||||
| 6.25%, 12/1/2017 | 560,000 | 624,400 | |||||||
| American International Group, Inc., 4.875%, 6/1/2022 | 200,000 | 214,965 | |||||||
| American Tower Corp., (REIT), 3.5%, 1/31/2023 | 90,000 | 82,057 | |||||||
| Banco de Credito del Peru, 144A, 4.25%, 4/1/2023 | 200,000 | 184,750 | |||||||
| Banco Santander Brasil SA, 144A, 8.0%, 3/18/2016 | BRL | 300,000 | 117,622 | ||||||
| Bank of America Corp., 3.3%, 1/11/2023 | 105,000 | 99,358 | |||||||
| Barclays Bank PLC, 7.625%, 11/21/2022 (b) | 250,000 | 266,250 | |||||||
| Principal Amount ($)(c) | Value ($) | ||||||||
| BBVA Bancomer SA, 144A, 6.5%, 3/10/2021 | 200,000 | 211,000 | |||||||
| BNP Paribas SA, 5.0%, 1/15/2021 | 470,000 | 515,584 | |||||||
| CIT Group, Inc.: | |||||||||
| 4.25%, 8/15/2017 | 495,000 | 515,419 | |||||||
| 5.0%, 5/15/2017 | 935,000 | 998,112 | |||||||
| 5.25%, 3/15/2018 | 10,000 | 10,725 | |||||||
| Cooperatieve Centrale Raiffeisen-Boerenleenbank BA, 3.95%, 11/9/2022 | 260,000 | 251,937 | |||||||
| Development Bank of Kazakhstan JSC, Series 3, 6.5%, 6/3/2020 | 500,000 | 527,600 | |||||||
| E*TRADE Financial Corp.: | |||||||||
| 6.375%, 11/15/2019 | 140,000 | 150,325 | |||||||
| 6.75%, 6/1/2016 | 745,000 | 808,325 | |||||||
| Hartford Financial Services Group, Inc., 6.0%, 1/15/2019 | 117,000 | 134,189 | |||||||
| Health Care REIT, Inc., (REIT), 4.5%, 1/15/2024 | 105,000 | 103,672 | |||||||
| ING Bank NV, 144A, 5.8%, 9/25/2023 | 230,000 | 240,487 | |||||||
| International Lease Finance Corp.: | |||||||||
| 3.875%, 4/15/2018 | 100,000 | 100,250 | |||||||
| 6.25%, 5/15/2019 | 410,000 | 443,825 | |||||||
| 8.625%, 1/15/2022 | 10,000 | 11,818 | |||||||
| 8.75%, 3/15/2017 | 40,000 | 47,100 | |||||||
| Intesa Sanpaolo SpA, 3.875%, 1/16/2018 | 200,000 | 204,796 | |||||||
| Itau Unibanco Holding SA, 144A, 5.5%, 8/6/2022 | 200,000 | 190,500 | |||||||
| Jefferies Group LLC, 5.125%, 1/20/2023 | 60,000 | 60,688 | |||||||
| Macquarie Bank Ltd., 144A, 3.45%, 7/27/2015 | 130,000 | 134,439 | |||||||
| Morgan Stanley: | |||||||||
| 3.75%, 2/25/2023 | 125,000 | 121,633 | |||||||
| 4.1%, 5/22/2023 | 85,000 | 82,259 | |||||||
| MPT Operating Partnership LP, (REIT), 6.375%, 2/15/2022 | 40,000 | 41,400 | |||||||
| Neuberger Berman Group LLC, 144A, 5.625%, 3/15/2020 | 10,000 | 10,500 | |||||||
| Nordea Bank AB, 144A, 4.25%, 9/21/2022 | 375,000 | 370,789 | |||||||
| OPB Finance Trust, Series C, 2.9%, 5/24/2023 | CAD | 330,000 | 289,136 | ||||||
| PNC Bank NA, 6.875%, 4/1/2018 | 300,000 | 354,704 | |||||||
| ProLogis LP, (REIT), 4.25%, 8/15/2023 | 90,000 | 88,907 | |||||||
| PSP Capital, Inc., 3.03%, 10/22/2020 | CAD | 258,000 | 243,575 | ||||||
| Royal Bank of Scotland Group PLC, 6.1%, 6/10/2023 | 100,000 | 100,810 | |||||||
| SLM Corp., 5.5%, 1/25/2023 | 125,000 | 118,076 | |||||||
| The Goldman Sachs Group, Inc., 3.625%, 1/22/2023 | 165,000 | 159,778 | |||||||
| Turkiye Is Bankasi: | |||||||||
| 144A, 3.875%, 11/7/2017 | 250,000 | 240,300 | |||||||
| 144A, 6.0%, 10/24/2022 | 250,000 | 224,250 | |||||||
| Turkiye Vakiflar Bankasi Tao, 144A, 3.75%, 4/15/2018 | 250,000 | 234,125 | |||||||
| Ventas Realty LP, (REIT), 2.7%, 4/1/2020 | 90,000 | 86,058 | |||||||
| Wells Fargo & Co., 5.375%, 11/2/2043 | 70,000 | 71,680 | |||||||
| 10,104,411 | |||||||||
| Principal Amount ($)(c) | Value ($) | ||||||||
| Health Care 1.3% | |||||||||
| Agilent Technologies, Inc., 3.2%, 10/1/2022 (b) | 200,000 | 183,057 | |||||||
| Aviv Healthcare Properties LP, 7.75%, 2/15/2019 | 10,000 | 10,750 | |||||||
| Biomet, Inc.: | |||||||||
| 6.5%, 8/1/2020 | 85,000 | 89,250 | |||||||
| 6.5%, 10/1/2020 | 25,000 | 25,750 | |||||||
| Community Health Systems, Inc.: | |||||||||
| 5.125%, 8/15/2018 | 290,000 | 299,425 | |||||||
| 7.125%, 7/15/2020 | 170,000 | 176,375 | |||||||
| Fresenius Medical Care U.S. Finance II, Inc., 144A, 5.625%, 7/31/2019 | 10,000 | 10,800 | |||||||
| Fresenius Medical Care U.S. Finance, Inc., 144A, 6.5%, 9/15/2018 | 10,000 | 11,300 | |||||||
| HCA, Inc.: | |||||||||
| 6.5%, 2/15/2020 | 880,000 | 966,900 | |||||||
| 7.5%, 2/15/2022 | 725,000 | 795,687 | |||||||
| Hologic, Inc., 6.25%, 8/1/2020 | 40,000 | 42,200 | |||||||
| IMS Health, Inc., 144A, 6.0%, 11/1/2020 | 60,000 | 63,750 | |||||||
| Laboratory Corp. of America Holdings, 3.75%, 8/23/2022 | 140,000 | 135,610 | |||||||
| Mallinckrodt International Finance SA, 144A, 4.75%, 4/15/2023 | 110,000 | 101,523 | |||||||
| Par Pharmaceutical Companies, Inc., 7.375%, 10/15/2020 | 90,000 | 93,038 | |||||||
| Physio-Control International, Inc., 144A, 9.875%, 1/15/2019 | 14,000 | 15,680 | |||||||
| Tenet Healthcare Corp.: | |||||||||
| 4.375%, 10/1/2021 | 110,000 | 103,400 | |||||||
| 4.5%, 4/1/2021 | 10,000 | 9,475 | |||||||
| 6.25%, 11/1/2018 | 230,000 | 254,725 | |||||||
| 3,388,695 | |||||||||
| Industrials 1.7% | |||||||||
| Accuride Corp., 9.5%, 8/1/2018 | 10,000 | 9,775 | |||||||
| ADT Corp., 144A, 6.25%, 10/15/2021 | 45,000 | 47,250 | |||||||
| Aeropuertos Dominicanos Siglo XXI SA, 144A, 9.25%, 11/13/2019 (b) | 250,000 | 246,250 | |||||||
| Alphabet Holding Co., Inc., 7.75%, 11/1/2017 (PIK) | 50,000 | 51,563 | |||||||
| Artesyn Escrow, Inc., 144A, 9.75%, 10/15/2020 | 70,000 | 73,500 | |||||||
| BE Aerospace, Inc., 6.875%, 10/1/2020 | 185,000 | 203,037 | |||||||
| Belden, Inc., 144A, 5.5%, 9/1/2022 | 85,000 | 83,300 | |||||||
| Bombardier, Inc., 144A, 5.75%, 3/15/2022 | 328,000 | 325,540 | |||||||
| Cemex Finance LLC, 144A, 9.375%, 10/12/2022 | 200,000 | 225,500 | |||||||
| Clean Harbors, Inc., 5.125%, 6/1/2021 | 65,000 | 65,650 | |||||||
| DigitalGlobe, Inc., 144A, 5.25%, 2/1/2021 | 35,000 | 34,125 | |||||||
| Ferreycorp SAA, 144A, 4.875%, 4/26/2020 | 200,000 | 187,000 | |||||||
| FTI Consulting, Inc., 6.0%, 11/15/2022 | 50,000 | 50,625 | |||||||
| GenCorp, Inc., 7.125%, 3/15/2021 | 185,000 | 197,950 | |||||||
| Georgian Railway JSC, 144A, 7.75%, 7/11/2022 | 250,000 | 259,675 | |||||||
| Principal Amount ($)(c) | Value ($) | ||||||||
| Grupo KUO SAB de CV, 144A, 6.25%, 12/4/2022 | 400,000 | 400,000 | |||||||
| Huntington Ingalls Industries, Inc., 6.875%, 3/15/2018 | 560,000 | 604,800 | |||||||
| Ingersoll-Rand Global Holding Co., Ltd., 144A, 2.875%, 1/15/2019 | 20,000 | 19,713 | |||||||
| Kenan Advantage Group, Inc., 144A, 8.375%, 12/15/2018 | 100,000 | 105,250 | |||||||
| Meritor, Inc., 6.75%, 6/15/2021 | 55,000 | 56,100 | |||||||
| Navios South American Logistics, Inc., 9.25%, 4/15/2019 | 15,000 | 16,181 | |||||||
| Nortek, Inc., 8.5%, 4/15/2021 | 155,000 | 171,662 | |||||||
| Odebrecht Offshore Drilling Finance Ltd., 144A, 6.75%, 10/1/2022 | 196,920 | 201,548 | |||||||
| Owens Corning, Inc., 4.2%, 12/15/2022 | 60,000 | 57,296 | |||||||
| Ply Gem Industries, Inc., 9.375%, 4/15/2017 | 24,000 | 25,920 | |||||||
| Titan International, Inc., 144A, 6.875%, 10/1/2020 | 170,000 | 177,225 | |||||||
| Total System Services, Inc., 3.75%, 6/1/2023 | 80,000 | 73,950 | |||||||
| TransDigm, Inc.: | |||||||||
| 7.5%, 7/15/2021 | 100,000 | 107,500 | |||||||
| 7.75%, 12/15/2018 | 80,000 | 85,800 | |||||||
| United Rentals North America, Inc.: | |||||||||
| 6.125%, 6/15/2023 | 10,000 | 10,150 | |||||||
| 7.375%, 5/15/2020 | 25,000 | 27,719 | |||||||
| 7.625%, 4/15/2022 | 270,000 | 300,037 | |||||||
| Watco Companies LLC, 144A, 6.375%, 4/1/2023 | 40,000 | 39,600 | |||||||
| 4,541,191 | |||||||||
| Information Technology 1.1% | |||||||||
| ACI Worldwide, Inc., 144A, 6.375%, 8/15/2020 | 30,000 | 31,350 | |||||||
| Alliance Data Systems Corp., 144A, 5.25%, 12/1/2017 | 60,000 | 62,250 | |||||||
| BMC Software Finance, Inc., 144A, 8.125%, 7/15/2021 | 100,000 | 103,000 | |||||||
| CDW LLC, 8.5%, 4/1/2019 | 610,000 | 674,050 | |||||||
| CyrusOne LP, 6.375%, 11/15/2022 | 25,000 | 25,875 | |||||||
| EarthLink, Inc., 7.375%, 6/1/2020 | 70,000 | 69,825 | |||||||
| Equinix, Inc., 5.375%, 4/1/2023 | 175,000 | 171,063 | |||||||
| First Data Corp.: | |||||||||
| 144A, 6.75%, 11/1/2020 | 365,000 | 379,600 | |||||||
| 144A, 7.375%, 6/15/2019 | 725,000 | 773,937 | |||||||
| Fiserv, Inc., 3.5%, 10/1/2022 | 250,000 | 232,152 | |||||||
| Healthcare Technology Intermediate, Inc., 144A, 7.375%, 9/1/2018 (PIK) | 20,000 | 20,800 | |||||||
| Hewlett-Packard Co., 3.3%, 12/9/2016 | 200,000 | 209,325 | |||||||
| Hughes Satellite Systems Corp.: | |||||||||
| 6.5%, 6/15/2019 | 60,000 | 64,950 | |||||||
| 7.625%, 6/15/2021 | 190,000 | 211,850 | |||||||
| IAC/InterActiveCorp., 4.75%, 12/15/2022 | 50,000 | 46,625 | |||||||
| 3,076,652 | |||||||||
| Materials 2.0% | |||||||||
| ALROSA Finance SA, 144A, 7.75%, 11/3/2020 | 200,000 | 221,700 | |||||||
| Anglo American Capital PLC, 144A, 4.125%, 9/27/2022 | 500,000 | 470,133 | |||||||
| BOE Intermediate Holding Corp., 144A, 9.0%, 11/1/2017 (PIK) | 83,640 | 87,195 | |||||||
| Principal Amount ($)(c) | Value ($) | ||||||||
| BOE Merger Corp., 144A, 9.5%, 11/1/2017 (PIK) | 100,000 | 106,250 | |||||||
| Cia Minera Milpo SAA, 144A, 4.625%, 3/28/2023 | 200,000 | 181,000 | |||||||
| CSN Resources SA, 144A, 6.5%, 7/21/2020 | 200,000 | 202,250 | |||||||
| FMG Resources (August 2006) Pty Ltd.: | |||||||||
| 144A, 6.0%, 4/1/2017 (b) | 195,000 | 207,187 | |||||||
| 144A, 6.375%, 2/1/2016 (b) | 250,000 | 258,750 | |||||||
| 144A, 6.875%, 4/1/2022 (b) | 290,000 | 316,100 | |||||||
| FQM Akubra, Inc.: | |||||||||
| 144A, 7.5%, 6/1/2021 | 145,000 | 151,525 | |||||||
| 144A, 8.75%, 6/1/2020 | 85,000 | 92,225 | |||||||
| Freeport-McMoRan Copper & Gold, Inc., 3.55%, 3/1/2022 | 220,000 | 209,088 | |||||||
| Glencore Funding LLC, 144A, 4.125%, 5/30/2023 | 50,000 | 46,726 | |||||||
| Hexion U.S. Finance Corp.: | |||||||||
| 6.625%, 4/15/2020 | 280,000 | 287,000 | |||||||
| 8.875%, 2/1/2018 | 155,000 | 161,006 | |||||||
| IAMGOLD Corp., 144A, 6.75%, 10/1/2020 | 75,000 | 64,500 | |||||||
| Kaiser Aluminum Corp., 8.25%, 6/1/2020 | 40,000 | 45,200 | |||||||
| Metalloinvest Finance Ltd., 144A, 6.5%, 7/21/2016 | 200,000 | 211,750 | |||||||
| Novelis, Inc., 8.75%, 12/15/2020 | 955,000 | 1,062,437 | |||||||
| Plastipak Holdings, Inc., 144A, 6.5%, 10/1/2021 | 70,000 | 72,450 | |||||||
| Polymer Group, Inc., 7.75%, 2/1/2019 | 255,000 | 271,894 | |||||||
| PolyOne Corp., 5.25%, 3/15/2023 | 55,000 | 53,625 | |||||||
| Polyus Gold International Ltd., 144A, 5.625%, 4/29/2020 | 200,000 | 192,750 | |||||||
| Samarco Mineracao SA, 144A, 5.75%, 10/24/2023 | 200,000 | 198,000 | |||||||
| Sealed Air Corp.: | |||||||||
| 144A, 8.125%, 9/15/2019 | 10,000 | 11,225 | |||||||
| 144A, 8.375%, 9/15/2021 | 10,000 | 11,350 | |||||||
| The Mosaic Co., 4.25%, 11/15/2023 | 100,000 | 98,760 | |||||||
| Turkiye Sise ve Cam Fabrikalari AS, 144A, 4.25%, 5/9/2020 | 200,000 | 175,980 | |||||||
| 5,468,056 | |||||||||
| Telecommunication Services 4.5% | |||||||||
| CC Holdings GS V LLC, 3.849%, 4/15/2023 | 120,000 | 112,332 | |||||||
| CenturyLink, Inc., Series V, 5.625%, 4/1/2020 | 25,000 | 25,438 | |||||||
| Cincinnati Bell, Inc.: | |||||||||
| 8.375%, 10/15/2020 | 775,000 | 838,937 | |||||||
| 8.75%, 3/15/2018 (b) | 430,000 | 451,500 | |||||||
| Cricket Communications, Inc., 7.75%, 10/15/2020 | 615,000 | 701,100 | |||||||
| Digicel Group Ltd.: | |||||||||
| 144A, 8.25%, 9/30/2020 | 200,000 | 207,250 | |||||||
| 144A, 10.5%, 4/15/2018 | 200,000 | 214,000 | |||||||
| Digicel Ltd., 144A, 8.25%, 9/1/2017 | 850,000 | 884,000 | |||||||
| ERC Ireland Preferred Equity Ltd., 144A, 7.69%**, 2/15/2017 (PIK)* | EUR | 120,439 | 0 | ||||||
Frontier Communications Corp.: | |||||||||
| 7.125%, 1/15/2023 | 390,000 | 385,125 | |||||||
| 8.5%, 4/15/2020 (b) | 810,000 | 907,200 | |||||||
| Principal Amount ($)(c) | Value ($) | ||||||||
| Intelsat Jackson Holdings SA: | |||||||||
| 144A, 5.5%, 8/1/2023 | 125,000 | 118,906 | |||||||
| 7.25%, 10/15/2020 | 690,000 | 754,687 | |||||||
| 7.5%, 4/1/2021 | 340,000 | 374,850 | |||||||
| Intelsat Luxembourg SA: | |||||||||
| 144A, 7.75%, 6/1/2021 | 165,000 | 176,962 | |||||||
| 144A, 8.125%, 6/1/2023 | 25,000 | 26,813 | |||||||
| Level 3 Communications, Inc., 8.875%, 6/1/2019 | 205,000 | 223,962 | |||||||
| Level 3 Financing, Inc.: | |||||||||
| 7.0%, 6/1/2020 | 185,000 | 196,100 | |||||||
| 8.625%, 7/15/2020 | 450,000 | 504,000 | |||||||
| MetroPCS Wireless, Inc.: | |||||||||
| 6.625%, 11/15/2020 | 655,000 | 694,300 | |||||||
| 144A, 6.625%, 4/1/2023 (b) | 70,000 | 72,275 | |||||||
| Millicom International Cellular SA, 144A, 4.75%, 5/22/2020 | 200,000 | 192,000 | |||||||
| Oi SA, 144A, 5.75%, 2/10/2022 | 200,000 | 184,000 | |||||||
| SBA Communications Corp., 5.625%, 10/1/2019 | 50,000 | 51,500 | |||||||
| Sprint Communications, Inc.: | |||||||||
| 6.0%, 12/1/2016 | 820,000 | 894,825 | |||||||
| 6.0%, 11/15/2022 | 85,000 | 82,875 | |||||||
| 8.375%, 8/15/2017 | 210,000 | 243,075 | |||||||
| 9.125%, 3/1/2017 | 15,000 | 17,625 | |||||||
| tw telecom holdings, Inc.: | |||||||||
| 5.375%, 10/1/2022 | 75,000 | 73,688 | |||||||
| 144A, 5.375%, 10/1/2022 | 15,000 | 14,738 | |||||||
| 144A, 6.375%, 9/1/2023 | 70,000 | 72,800 | |||||||
| UPCB Finance III Ltd., 144A, 6.625%, 7/1/2020 | 370,000 | 393,125 | |||||||
| Verizon Communications, Inc., 6.55%, 9/15/2043 | 250,000 | 292,490 | |||||||
| Wind Acquisition Finance SA, 144A, 6.5%, 4/30/2020 | 50,000 | 53,250 | |||||||
| Windstream Corp.: | |||||||||
| 6.375%, 8/1/2023 | 60,000 | 56,100 | |||||||
| 7.5%, 4/1/2023 | 20,000 | 20,100 | |||||||
| 7.75%, 10/15/2020 (b) | 1,075,000 | 1,140,844 | |||||||
| 7.75%, 10/1/2021 | 185,000 | 196,100 | |||||||
| 7.875%, 11/1/2017 | 130,000 | 148,525 | |||||||
| 11,997,397 | |||||||||
| Utilities 0.9% | |||||||||
| AES Corp.: | |||||||||
| 8.0%, 10/15/2017 | 45,000 | 52,875 | |||||||
| 8.0%, 6/1/2020 | 30,000 | 35,100 | |||||||
| American Electric Power Co., Inc., Series F, 2.95%, 12/15/2022 | 200,000 | 184,960 | |||||||
| Calpine Corp.: | |||||||||
| 144A, 7.5%, 2/15/2021 | 676,000 | 737,685 | |||||||
| 144A, 7.875%, 7/31/2020 | 36,000 | 39,420 | |||||||
| DTE Energy Co., 7.625%, 5/15/2014 | 81,000 | 83,055 | |||||||
| Dubai Electricity & Water Authority, 144A, 8.5%, 4/22/2015 | 250,000 | 271,625 | |||||||
| Electricite de France SA, 144A, 5.25%, 1/29/2049 | 100,000 | 99,450 | |||||||
| Energy Future Intermediate Holding Co., LLC, 10.0%, 12/1/2020 (b) | 150,000 | 159,375 | |||||||
| Instituto Costarricense de Electricidad, 144A, 6.95%, 11/10/2021 | 200,000 | 205,250 | |||||||
| Mexico Generadora de Energia S de RL, 144A, 5.5%, 12/6/2032 | 250,000 | 238,750 | |||||||
| Principal Amount ($)(c) | Value ($) | ||||||||
| PPL Energy Supply LLC, 4.6%, 12/15/2021 (b) | 250,000 | 240,236 | |||||||
| 2,347,781 | |||||||||
Total Corporate Bonds (Cost $59,241,648) | 60,289,808 | ||||||||
| Asset-Backed 0.3% | |||||||||
| Automobile Receivables 0.2% | |||||||||
| AmeriCredit Automobile Receivables Trust, "E", Series 2011-2, 144A, 5.48%, 9/10/2018 | 528,181 | 555,889 | |||||||
| Miscellaneous 0.1% | |||||||||
| ARES CLO Ltd., "D", Series 2012-3A, 144A, 4.894%**, 1/17/2024 | 250,000 | 251,019 | |||||||
Total Asset-Backed (Cost $797,896) | 806,908 | ||||||||
| Mortgage-Backed Securities Pass-Throughs 0.9% | |||||||||
| Federal Home Loan Mortgage Corp., 6.0%, 3/1/2038 | 12,198 | 13,454 | |||||||
Federal National Mortgage Association: | |||||||||
| 4.0%, 5/1/2041 (d) | 1,000,000 | 1,030,469 | |||||||
| 4.5%, 9/1/2035 | 26,501 | 28,142 | |||||||
| 5.5%, 8/1/2037 | 900,823 | 990,448 | |||||||
| 6.0%, 1/1/2024 | 35,926 | 39,443 | |||||||
| 6.5%, with various maturities from 5/1/2017 until 1/1/2038 | 10,285 | 11,017 | |||||||
| 8.0%, 9/1/2015 | 9,955 | 10,304 | |||||||
| Government National Mortgage Association, 5.5%, 9/20/2040 | 184,436 | 203,240 | |||||||
Total Mortgage-Backed Securities Pass-Throughs (Cost $2,320,605) | 2,326,517 | ||||||||
| Commercial Mortgage-Backed Securities 0.7% | |||||||||
| Bear Stearns Commercial Mortgage Securities, Inc., "A4", Series 2007- PW16, 5.706%**, 6/11/2040 | 66,000 | 74,014 | |||||||
| Del Coronado Trust, "M", Series 2013-HDMZ, 144A, 5.167%**, 3/15/2018 | 120,000 | 120,420 | |||||||
JPMorgan Chase Commercial Mortgage Securities Corp.: | |||||||||
| "C", Series 2012-HSBC, 144A, 4.021%, 7/5/2032 | 380,000 | 366,471 | |||||||
| "A4", Series 2007-C1, 5.716%, 2/15/2051 | 225,000 | 246,923 | |||||||
| LB-UBS Commercial Mortgage Trust, "A4", Series 2007-C6, 5.858%, 7/15/2040 | 258,838 | 281,372 | |||||||
| WFRBS Commercial Mortgage Trust, "A5", Series 2013-C14, 3.337%, 6/15/2046 | 750,000 | 720,610 | |||||||
Total Commercial Mortgage-Backed Securities (Cost $1,868,489) | 1,809,810 | ||||||||
| Collateralized Mortgage Obligations 1.4% | |||||||||
| Federal Home Loan Mortgage Corp.: | |||||||||
| "HI", Series 3979, Interest Only, 3.0%, 12/15/2026 | 719,341 | 79,331 | |||||||
| "IK", Series 4048, Interest Only, 3.0%, 5/15/2027 | 801,231 | 104,822 | |||||||
| Principal Amount ($)(c) | Value ($) | ||||||||
| "ZB", Series 4183, 3.0%, 3/15/2043 | 1,020,748 | 825,720 | |||||||
| "ZG", Series 4213, 3.5%, 6/15/2043 | 114,845 | 107,789 | |||||||
| "LI", Series 3720, Interest Only, 4.5%, 9/15/2025 | 1,460,097 | 226,003 | |||||||
| "PI", Series 3843, Interest Only, 4.5%, 5/15/2038 | 751,401 | 110,975 | |||||||
| "H", Series 2278, 6.5%, 1/15/2031 | 144 | 159 | |||||||
Federal National Mortgage Association: | |||||||||
| "WO", Series 2013-27, Principal Only, Zero Coupon, 12/25/2042 | 220,000 | 84,764 | |||||||
| "I", Series 2003-84, Interest Only, 6.0%, 9/25/2033 | 272,120 | 83,554 | |||||||
| "PI", Series 2006-20, Interest Only, 6.515%***, 11/25/2030 | 466,906 | 78,656 | |||||||
Government National Mortgage Association: | |||||||||
| "ZJ", Series 2013-106, 3.5%, 7/20/2043 | 190,981 | 158,128 | |||||||
| "QI", Series 2011-112, Interest Only, 4.0%, 5/16/2026 | 883,281 | 101,846 | |||||||
| "NI", Series 2011-80, Interest Only, 4.5%, 5/16/2038 | 1,237,605 | 136,681 | |||||||
| "GP", Series 2010-67, 4.5%, 3/20/2039 | 250,000 | 264,448 | |||||||
| "BI", Series 2010-30, Interest Only, 4.5%, 7/20/2039 | 143,998 | 25,553 | |||||||
| "ND", Series 2010-130, 4.5%, 8/16/2039 | 600,000 | 631,701 | |||||||
| "MI", Series 2009-76, Interest Only, 5.0%, 3/20/2035 | 122,850 | 1,601 | |||||||
| "IQ", Series 2011-18, Interest Only, 5.5%, 1/16/2039 | 400,443 | 50,208 | |||||||
| "IV", Series 2009-69, Interest Only, 5.5%, 8/20/2039 | 680,738 | 122,779 | |||||||
| "IN", Series 2009-69, Interest Only, 5.5%, 8/20/2039 | 687,977 | 122,047 | |||||||
| "IJ", Series 2009-75, Interest Only, 6.0%, 8/16/2039 | 503,456 | 102,024 | |||||||
| "AI", Series 2007-38, Interest Only, 6.293%***, 6/16/2037 | 117,819 | 16,901 | |||||||
| Residential Funding Mortgage Securities I, Inc., "M1", Series 2003-S17, 5.5%, 9/25/2033 | 518,474 | 488,384 | |||||||
Total Collateralized Mortgage Obligations (Cost $3,725,977) | 3,924,074 | ||||||||
| Government & Agency Obligations 4.8% | |||||||||
| Other Government Related (e) 1.5% | |||||||||
| Bank of Moscow, 144A, 6.699%, 3/11/2015 | 250,000 | 262,500 | |||||||
| European Investment Bank: | |||||||||
| 144A, 4.6%, 1/30/2037 | CAD | 1,000,000 | 926,637 | ||||||
| 6.0%, 8/6/2020 | AUD | 500,000 | 477,811 | ||||||
| Gazprom Neft OAO, 144A, 4.375%, 9/19/2022 | 250,000 | 229,062 | |||||||
| KFW, 1.875%, 6/13/2018 | CAD | 577,000 | 533,578 | ||||||
| National JSC Naftogaz of Ukraine, 9.5%, 9/30/2014 | 250,000 | 249,025 | |||||||
| Queensland Treasury Corp., Series 23, 4.25%, 7/21/2023 | AUD | 1,060,000 | 907,053 | ||||||
| Vimpel Communications, 144A, 7.748%, 2/2/2021 | 200,000 | 217,250 | |||||||
| Principal Amount ($)(c) | Value ($) | ||||||||
| VTB Bank OJSC, 144A, 6.0%, 4/12/2017 | 250,000 | 265,625 | |||||||
| 4,068,541 | |||||||||
| Sovereign Bonds 1.0% | |||||||||
| Norway Government Bond, Series 475, 2.0%, 5/24/2023 | NOK | 5,719,000 | 866,765 | ||||||
| Republic of Belarus, REG S, 8.75%, 8/3/2015 | 100,000 | 101,000 | |||||||
| Republic of Croatia, 144A, 6.0%, 1/26/2024 | 200,000 | 198,500 | |||||||
| Republic of Singapore, 3.375%, 9/1/2033 | SGD | 1,177,000 | 978,129 | ||||||
| Russian Federation: | |||||||||
| Series 6204, 7.5%, 3/15/2018 | RUB | 2,900,000 | 90,277 | ||||||
| Series 6207, 8.15%, 2/3/2027 | RUB | 5,800,000 | 182,071 | ||||||
| United Mexican States, Series M, 7.75%, 5/29/2031 | MXN | 2,280,000 | 182,809 | ||||||
| 2,599,551 | |||||||||
| U.S. Government Sponsored Agency 0.3% | |||||||||
| Federal National Mortgage Association, 3.0%, 11/15/2027 | 1,000,000 | 875,148 | |||||||
| U.S. Treasury Obligations 2.0% | |||||||||
| U.S. Treasury Bills: | |||||||||
| 0.02%****, 2/13/2014 (f) | 209,000 | 208,997 | |||||||
| 0.035%****, 2/13/2014 (f) | 955,000 | 954,985 | |||||||
| U.S. Treasury Notes: | |||||||||
| 0.75%, 6/15/2014 (g) | 1,000,000 | 1,002,891 | |||||||
| 1.0%, 8/31/2016 | 3,000,000 | 3,028,125 | |||||||
| 1.75%, 5/15/2023 | 100,000 | 90,133 | |||||||
| 5,285,131 | |||||||||
Total Government & Agency Obligations (Cost $13,417,773) | 12,828,371 | ||||||||
| Loan Participations and Assignments 0.0% | |||||||||
| Senior Loan** | |||||||||
| Chesapeake Energy Corp., Term Loan, 5.75%, 12/1/2017 (Cost $93,488) | 95,000 | 97,131 | |||||||
| Municipal Bonds and Notes 1.4% | |||||||||
| Atlanta, GA, Water & Wastewater Revenue, Series B, 5.25%, 11/1/2030 | 525,000 | 571,651 | |||||||
| Kentucky, Asset/Liability Commission, General Fund Revenue, 3.165%, 4/1/2018 | 413,253 | 426,031 | |||||||
| New Jersey, State Transportation Trust Fund Authority, Transportation Program, Series AA, 5.25%, 6/15/2030 | 780,000 | 836,433 | |||||||
| New York, Triborough Bridge & Tunnel Authority Revenues, Series A, 5.0%, 11/15/2028 | 785,000 | 846,458 | |||||||
| Pennsylvania, State Turnpike Commission Revenue, Series C, 5.5%, 12/1/2030 | 390,000 | 426,130 | |||||||
Texas, Dallas-Fort Worth International Airport Revenue: | |||||||||
| Series F, 5.25%, 11/1/2028 | 120,000 | 128,957 | |||||||
| Series F, 5.25%, 11/1/2029 | 100,000 | 106,885 | |||||||
| Principal Amount ($)(c) | Value ($) | ||||||||
| Series F, 5.25%, 11/1/2030 | 390,000 | 413,965 | |||||||
Total Municipal Bonds and Notes (Cost $3,636,263) | 3,756,510 | ||||||||
| Convertible Bonds 0.2% | |||||||||
| Financials 0.0% | |||||||||
| Swiss Life Holding AG, Zero Coupon, 12/2/2020 | CHF | 55,000 | 64,251 | ||||||
| Materials 0.2% | |||||||||
| GEO Specialty Chemicals, Inc., 7.5%, 3/31/2015 (PIK) | 209,283 | 405,423 | |||||||
Total Convertible Bonds (Cost $267,161) | 469,674 | ||||||||
| Preferred Security 0.0% | |||||||||
| Materials | |||||||||
| Hercules, Inc., 6.5%, 6/30/2029 (Cost $20,233) | 40,000 | 34,800 | |||||||
| Shares | Value ($) | |||||||
| Securities Lending Collateral 4.2% | ||||||||
| Daily Assets Fund Institutional, 0.08% (h) (i) (Cost $11,360,240) | 11,360,240 | 11,360,240 | ||||||
| Cash Equivalents 3.9% | ||||||||
| Central Cash Management Fund, 0.05% (h) (Cost $10,471,131) | 10,471,131 | 10,471,131 | ||||||
| % of Net Assets | Value ($) | |||||||
Total Investment Portfolio (Cost $265,643,116)† | 103.8 | 279,382,518 | ||||||
| Other Assets and Liabilities, Net | (3.8 | ) | (10,299,744 | ) | ||||
| Net Assets | 100.0 | 269,082,774 | ||||||
The following table represents bonds that are in default:
| Security | Coupon | Maturity Date | Principal Amount | Cost ($) | Value ($) | |||||||||||||
| ERC Ireland Preferred Equity Ltd.* | 7.69 | % | 2/15/2017 | EUR | 120,439 | 165,016 | 0 | |||||||||||
* Non-income producing security.
** Floating rate securities' yields vary with a designated market index or market rate, such as the coupon-equivalent of the U.S. Treasury Bill rate. These securities are shown at their current rate as of December 31, 2013.
*** These securities are shown at their current rate as of December 31, 2013.
****Annualized yield at time of purchase; not a coupon rate.
† The cost for federal income tax purposes was $265,977,869. At December 31, 2013, net unrealized appreciation for all securities based on tax cost was $13,404,649. This consisted of aggregate gross unrealized appreciation for all securities in which there was an excess of value over tax cost of $17,587,673 and aggregate gross unrealized depreciation for all securities in which there was an excess of tax cost over value of $4,183,024.
(a) The Fund may purchase securities that are subject to legal or contractual restrictions on resale ("restricted securities"). Restricted securities are securities which have not been registered with the Securities and Exchange Commission under the Securities Act of 1933. The Fund may be unable to sell a restricted security and it may be more difficult to determine a market value for a restricted security. Moreover, if adverse market conditions were to develop during the period between the Fund's decision to sell a restricted security and the point at which the Fund is permitted or able to sell such security, the Fund might obtain a price less favorable than the price that prevailed when it decided to sell. This investment practice, therefore, could have the effect of increasing the level of illiquidity of the Fund. The future value of these securities is uncertain and there may be changes in the estimated value of these securities.
| Schedule of Restricted Securities | Acquisition Date | Cost ($) | Value ($) | Value as % of Net Assets | |||||||||
| Dawn Holdings, Inc.* | August 2013 | 2,342 | 1,875 | 0.00 | |||||||||
(b) All or a portion of these securities were on loan. In addition, "Other Assets and Liabilities, Net" may include pending sales that are also on loan. The value of securities loaned at December 31, 2013 amounted to $10,980,853, which is 4.1% of net assets.
(c) Principal amount stated in U.S. dollars unless otherwise noted.
(d) When-issued or delayed delivery security included.
(e) Government-backed debt issued by financial companies or government sponsored enterprises.
(f) At December 31, 2013, this security has been pledged, in whole or in part, to cover initial margin requirements for open futures contracts.
(g) At December 31, 2013, this security has been pledged, in whole or in part, as collateral for open bilateral interest rate swap contracts and initial margin for centrally cleared swap contracts.
(h) Affiliated fund managed by Deutsche Investment Management Americas Inc. The rate shown is the annualized seven-day yield at period end.
(i) Represents collateral held in connection with securities lending. Income earned by the Fund is net of borrower rebates.
144A: Security exempt from registration under Rule 144A of the Securities Act of 1933. These securities may be resold in transactions exempt from registration, normally to qualified institutional buyers.
CLO: Collateralized Loan Obligation
CVA: Certificaten Van Aandelen (Certificate of Stock)
Interest Only: Interest Only (IO) bonds represent the "interest only" portion of payments on a pool of underlying mortgages or mortgage-backed securities. IO securities are subject to prepayment risk of the pool of underlying mortgages.
PIK: Denotes that all or a portion of the income is paid in-kind in the form of additional principal.
Principal Only: Principal Only (PO) bonds represent the "principal only" portion of payments on a pool of underlying mortgages or mortgage-backed securities.
REG S: Securities sold under Regulation S may not be offered, sold or delivered within the United States or to, or for the account or benefit of, U.S. persons, except pursuant to an exemption from, or in a transaction not subject to, the registration requirements of the Securities Act of 1933.
REIT: Real Estate Investment Trust
RSP: Risparmio (Convertible Savings Shares)
SDR: Swedish Depositary Receipt
Included in the portfolio are investments in mortgage- or asset-backed securities which are interests in separate pools of mortgages or assets. Effective maturities of these investments may be shorter than stated maturities due to prepayments. Some separate investments in the Federal National Mortgage Association issues which have similar coupon rates have been aggregated for presentation purposes in this investment portfolio.
At December 31, 2013, open futures contracts purchased were as follows:
| Futures | Currency | Expiration Date | Contracts | Notional Value ($) | Unrealized Depreciation ($) | |||||||||
| 5 Year U.S. Treasury Note | USD | 3/31/2014 | 67 | 7,993,938 | (51,117 | ) | ||||||||
At December 31, 2013, open futures contracts sold were as follows:
| Futures | Currency | Expiration Date | Contracts | Notional Value ($) | Unrealized Appreciation ($) | |||||||||
| 10 Year Japanese Government Bond | JPY | 3/11/2014 | 2 | 2,721,869 | 15,820 | |||||||||
| 10 Year U.S. Treasury Note | USD | 3/20/2014 | 422 | 51,925,781 | 999,800 | |||||||||
| U.S. Treasury Long Bond | USD | 3/20/2014 | 5 | 641,563 | 11,240 | |||||||||
| Ultra Long U.S. Treasury Bond | USD | 3/20/2014 | 16 | 2,180,000 | 17,149 | |||||||||
| Total unrealized appreciation | 1,044,009 | |||||||||||||
At December 31, 2013, open written options contracts were as follows:
| Options on Interest Rate Swap Contracts | Swap Effective/ Expiration Date | Contract Amount | Option Expiration Date | Premiums Received ($) | Value ($) (j) | |||||||||
Call Options Receive Fixed — 4.064% – Pay Floating — LIBOR | 5/13/2014 5/13/2044 | 2,100,000 | 1 | 5/9/2014 | 15,487 | (48,872 | ) | |||||||
| Receive Fixed — 5.132% – Pay Floating — LIBOR | 3/17/2016 3/17/2026 | 2,100,000 | 1 | 3/15/2016 | 15,173 | (40,183 | ) | |||||||
| Receive Fixed — 5.132% – Pay Floating — LIBOR | 3/17/2016 3/17/2026 | 2,100,000 | 2 | 3/15/2016 | 24,780 | (40,183 | ) | |||||||
| Total Call Options | 55,440 | (129,238 | ) | |||||||||||
Put Options Pay Fixed — 1.132% – Receive Floating — LIBOR | 3/17/2016 3/17/2026 | 2,100,000 | 1 | 3/15/2016 | 15,172 | (732 | ) | |||||||
| Pay Fixed — 1.132% – Receive Floating — LIBOR | 3/17/2016 3/17/2026 | 2,100,000 | 2 | 3/15/2016 | 5,355 | (732 | ) | |||||||
| Pay Fixed — 2.064% – Receive Floating — LIBOR | 5/13/2014 5/13/2044 | 2,100,000 | 1 | 5/9/2014 | 15,488 | (2 | ) | |||||||
| Pay Fixed — 2.385% – Receive Floating — LIBOR | 3/31/2014 3/31/2044 | 2,100,000 | 3 | 3/27/2014 | 28,665 | (1 | ) | |||||||
| Pay Fixed — 2.423% – Receive Floating — LIBOR | 3/20/2014 3/20/2044 | 2,100,000 | 4 | 3/18/2014 | 30,240 | (1 | ) | |||||||
| Pay Fixed — 3.033% – Receive Floating — LIBOR | 10/24/2014 10/24/2044 | 4,900,000 | 5 | 10/22/2014 | 62,230 | (15,250 | ) | |||||||
| Pay Fixed — 3.093% – Receive Floating — LIBOR | 10/21/2014 10/21/2044 | 4,900,000 | 2 | 10/17/2014 | 67,620 | (17,867 | ) | |||||||
| Total Put Options | 224,770 | (34,585 | ) | |||||||||||
| Total | 280,210 | (163,823 | ) | |||||||||||
(j) Unrealized appreciation on written options on interest rate swap contracts at December 31, 2013 was $116,387.
As of December 31, 2013, open credit default swap contracts sold were as follows:
Effective/ Expiration Dates | Notional Amount ($) (k) | Fixed Cash Flows Received | Underlying Debt Obligation/ Quality Rating (l) | Value ($) | Upfront Payments Paid/ (Received) ($) | Unrealized Appreciation ($) | |||||||||||||||
9/20/2012 12/20/2017 | 125,000 | 6 | 5.0 | % | General Motors Corp., 3.3%, 12/20/2017, BB+ | 18,381 | 7,374 | 11,007 | |||||||||||||
(k) The maximum potential amount of future undiscounted payments that the Fund could be required to make under a credit default swap contract would be the notional amount of the contract. These potential amounts would be partially offset by any recovery values of the referenced debt obligation or net amounts received from the settlement of buy protection credit default swap contracts entered into by the Fund for the same referenced debt obligation, if any.
(l) The quality ratings represent the higher of Moody's Investors Service, Inc. ("Moody's") or Standard & Poor's Corporation ("S&P") credit ratings and are unaudited.
At December 31, 2013, open interest rate swap contracts sold were as follows:
| Centrally Cleared Swaps | ||||||||||||||
Effective/ Expiration Dates | Notional Amount ($) | Cash Flows Paid by the Fund | Cash Flows Received by the Fund | Value ($) | Unrealized Appreciation/ (Depreciation) ($) | |||||||||
12/30/2014 12/30/2016 | 2,100,000 | Fixed — 1.173% | Floating — LIBOR | 1,057 | 1,391 | |||||||||
12/30/2014 12/30/2019 | 100,000 | Floating — LIBOR | Fixed — 2.522% | (72 | ) | 21 | ||||||||
12/30/2014 12/30/2024 | 3,800,000 | Fixed — 3.524% | Floating — LIBOR | 8,504 | 8,896 | |||||||||
5/13/2014 5/13/2044 | 2,100,000 | Fixed — 4.064% | Floating — LIBOR | (24,342 | ) | 235 | ||||||||
12/30/2014 12/30/2044 | 300,000 | Floating — LIBOR | Fixed — 4.081% | (2,656 | ) | (2,278 | ) | |||||||
| Total net unrealized appreciation | 8,265 | |||||||||||||
| Bilateral Swap | ||||||||||||||||||
Effective/ Expiration Dates | Notional Amount ($) | Cash Flows Paid by the Fund | Cash Flows Received by the Fund | Value ($) | Upfront Payment Paid/(Received) ($) | Unrealized Depreciation ($) | ||||||||||||
6/3/2013 6/3/2025 | 2,100,000 | 1 | Floating — LIBOR | Fixed — 3.0% | (95,048 | ) | — | (95,048 | ) | |||||||||
Counterparties:
1 Nomura International PLC
2 BNP Paribas
3 Barclays Bank PLC
4 JPMorgan Chase Securities, Inc.
5 Citigroup, Inc.
6 UBS AG
LIBOR: London Interbank Offered Rate
As of December 31, 2013, the Fund had the following open forward foreign currency exchange contracts:
| Contracts to Deliver | In Exchange For | Settlement Date | Unrealized Appreciation ($) | Counterparty | |||||||||||
| JPY | 190,000,000 | USD | 1,840,408 | 1/6/2014 | 36,210 | Citigroup. Inc. | |||||||||
| CAD | 2,445,981 | NZD | 2,800,000 | 1/6/2014 | 298 | Australia & New Zealand Banking Group Ltd. | |||||||||
| ZAR | 14,000,000 | USD | 1,352,626 | 1/17/2014 | 20,688 | UBS AG | |||||||||
| NOK | 5,430,000 | USD | 913,670 | 1/23/2014 | 19,083 | UBS AG | |||||||||
| CAD | 1,659,544 | USD | 1,607,229 | 1/23/2014 | 45,719 | Barclays Bank PLC | |||||||||
| SGD | 1,169,490 | USD | 945,094 | 1/23/2014 | 18,367 | JPMorgan Chase Securities, Inc. | |||||||||
| USD | 1,324,740 | AUD | 1,500,000 | 1/23/2014 | 12,857 | Commonwealth Bank of Australia | |||||||||
| AUD | 1,621,800 | USD | 1,564,393 | 1/23/2014 | 118,183 | UBS | |||||||||
| AUD | 1,500,000 | USD | 1,338,112 | 1/23/2014 | 515 | Nomura International PLC | |||||||||
| KRW | 1,109,000,000 | USD | 1,048,056 | 2/18/2014 | 433 | JPMorgan Chase Securities, Inc. | |||||||||
| Total unrealized appreciation | 272,353 | ||||||||||||||
| Contracts to Deliver | In Exchange For | Settlement Date | Unrealized Depreciation ($) | Counterparty | |||||||||||
| USD | 1,847,095 | JPY | 190,000,000 | 1/6/2014 | (42,898 | ) | Nomura International PLC | ||||||||
| EUR | 555,000 | USD | 762,177 | 1/15/2014 | (1,332 | ) | Citigroup. Inc. | ||||||||
| USD | 955,447 | SGD | 1,200,000 | 2/18/2014 | (4,530 | ) | Commonwealth Bank of Australia | ||||||||
| Total unrealized depreciation | (48,760 | ) | |||||||||||||
| Currency Abbreviations |
AUD Australian Dollar BRL Brazilian Real CAD Canadian Dollar CHF Swiss Franc EUR Euro JPY Japanese Yen KRW South Korean Won MXN Mexican Peso NOK Norwegian Krone NZD New Zealand Dollar RUB Russian Ruble SGD Singapore Dollar USD United States Dollar ZAR South African Rand |
For information on the Fund's policy and additional disclosures regarding futures contracts, credit default swap contracts, interest rate swap contracts, forward foreign currency exchange contracts and written options contracts, please refer to Note B in the accompanying Notes to Financial Statements.
Fair Value Measurements
Various inputs are used in determining the value of the Fund's investments. These inputs are summarized in three broad levels. Level 1 includes quoted prices in active markets for identical securities. Level 2 includes other significant observable inputs (including quoted prices for similar securities, interest rates, prepayment speeds and credit risk). Level 3 includes significant unobservable inputs (including the Fund's own assumptions in determining the fair value of investments). The level assigned to the securities valuations may not be an indication of the risk or liquidity associated with investing in those securities.
The following is a summary of the inputs used as of December 31, 2013 in valuing the Fund's investments. For information on the Fund's policy regarding the valuation of investments, please refer to the Security Valuation section of Note A in the accompanying Notes to Financial Statements.
| Assets | Level 1 | Level 2 | Level 3 | Total | ||||||||||||
| Common Stocks | ||||||||||||||||
| Consumer Discretionary | $ | 13,117,443 | $ | 7,538,794 | $ | 1,875 | $ | 20,658,112 | ||||||||
| Consumer Staples | 6,792,069 | 4,073,006 | — | 10,865,075 | ||||||||||||
| Energy | 8,485,539 | 6,712,546 | — | 15,198,085 | ||||||||||||
| Financials | 18,951,119 | 20,802,154 | — | 39,753,273 | ||||||||||||
| Health Care | 8,312,622 | 2,930,643 | — | 11,243,265 | ||||||||||||
| Industrials | 10,025,358 | 11,547,218 | — | 21,572,576 | ||||||||||||
| Information Technology | 21,204,773 | 3,071,246 | — | 24,276,019 | ||||||||||||
| Materials | 2,762,936 | 2,191,289 | 11,803 | 4,966,028 | ||||||||||||
| Telecommunication Services | 2,522,330 | 7,366,117 | — | 9,888,447 | ||||||||||||
| Utilities | 7,578,070 | 3,804,165 | — | 11,382,235 | ||||||||||||
| Preferred Stocks (m) | — | 1,386,446 | — | 1,386,446 | ||||||||||||
| Rights | 1,960 | — | — | 1,960 | ||||||||||||
| Warrants (m) | — | — | 16,023 | 16,023 | ||||||||||||
| Fixed Income Investments (m) | ||||||||||||||||
| Corporate Bonds | — | 60,289,808 | — | 60,289,808 | ||||||||||||
| Asset Backed | — | 806,908 | — | 806,908 | ||||||||||||
| Mortgage-Backed Securities Pass-Throughs | — | 2,326,517 | — | 2,326,517 | ||||||||||||
| Commercial Mortgage-Backed Securities | — | 1,809,810 | — | 1,809,810 | ||||||||||||
| Collateralized Mortgage Obligations | — | 3,924,074 | — | 3,924,074 | ||||||||||||
| Government & Agency Obligations | — | 12,828,371 | — | 12,828,371 | ||||||||||||
| Loan Participations and Assignments | — | 97,131 | — | 97,131 | ||||||||||||
| Municipal Bonds and Notes | — | 3,756,510 | — | 3,756,510 | ||||||||||||
| Convertible Bonds | — | 64,251 | 405,423 | 469,674 | ||||||||||||
| Preferred Securities | — | 34,800 | — | 34,800 | ||||||||||||
| Short-Term Investments (m) | 21,831,371 | — | — | 21,831,371 | ||||||||||||
| Derivatives (n) | ||||||||||||||||
| Futures Contracts | 1,044,009 | — | — | 1,044,009 | ||||||||||||
| Credit Default Swap Contracts | — | 11,007 | — | 11,007 | ||||||||||||
| Interest Rate Swap Contracts | — | 10,543 | — | 10,543 | ||||||||||||
| Forward Foreign Currency Exchange Contracts | — | 272,353 | — | 272,353 | ||||||||||||
| Total | $ | 122,629,599 | $ | 157,655,707 | $ | 435,124 | $ | 280,720,430 | ||||||||
| Liabilities | Level 1 | Level 2 | Level 3 | Total | ||||||||||||
| Derivatives (n) | ||||||||||||||||
| Futures Contracts | $ | (51,117 | ) | $ | — | $ | — | $ | (51,117 | ) | ||||||
| Written Options | — | (163,823 | ) | — | (163,823 | ) | ||||||||||
| Interest Rate Swap Contracts | — | (97,326 | ) | — | (97,326 | ) | ||||||||||
| Forward Foreign Currency Exchange Contracts | — | (48,760 | ) | — | (48,760 | ) | ||||||||||
| Total | $ | (51,117 | ) | $ | (309,909 | ) | $ | — | $ | (361,026 | ) | |||||
During the year ended December 31, 2013, the amount of transfers between Level 2 and Level 3 was $48. Investments were transferred from Level 2 to Level 3 because of the lack of observable market data due to a decrease in market activity.
Transfers between price levels are recognized at the beginning of the reporting period.
(m) See Investment Portfolio for additional detailed categorizations.
(n) Derivatives include value of unrealized appreciation (depreciation) on open futures contracts, credit default swap contracts, interest rate swap contracts and forward foreign currency exchange contracts, and written options, at value.
The accompanying notes are an integral part of the financial statements.
| as of December 31, 2013 | ||||
| Assets | ||||
Investments: Investments in non-affiliated securities, at value (cost $243,811,745) — including $10,980,853 of securities loaned | $ | 257,551,147 | ||
| Investment in Daily Assets Fund Institutional (cost $11,360,240)* | 11,360,240 | |||
| Investment in Central Cash Management Fund (cost $10,471,131) | 10,471,131 | |||
| Total investments in securities, at value (cost $265,643,116) | 279,382,518 | |||
| Cash | 12,378 | |||
| Foreign currency, at value (cost $262,436) | 262,571 | |||
| Receivable for investments sold | 509,276 | |||
| Receivable for Fund shares sold | 5,283 | |||
| Dividends receivable | 212,669 | |||
| Interest receivable | 1,166,017 | |||
| Receivable for variation margin on futures contracts | 91,291 | |||
| Receivable for variation margin on centrally cleared swaps | 33,875 | |||
| Net receivable for pending swap contracts | 334 | |||
| Unrealized appreciation on swap contracts | 11,007 | |||
| Unrealized appreciation on forward foreign currency exchange contracts | 272,353 | |||
| Upfront payments paid on swap contracts | 7,374 | |||
| Foreign taxes recoverable | 100,215 | |||
| Other assets | 4,732 | |||
| Total assets | 282,071,893 | |||
| Liabilities | ||||
| Payable upon return of securities loaned | 11,360,240 | |||
| Payable for investments purchased — when-issued/delayed delivery securities | 1,034,684 | |||
| Payable for Fund shares redeemed | 106,177 | |||
| Options written, at value (premium received $280,210) | 163,823 | |||
| Unrealized depreciation on swap contracts | 95,048 | |||
| Unrealized depreciation on forward foreign currency exchange contracts | 48,760 | |||
| Accrued management fee | 83,081 | |||
| Accrued Trustees' fees | 2,830 | |||
| Other accrued expenses and payables | 94,476 | |||
| Total liabilities | 12,989,119 | |||
| Net assets, at value | $ | 269,082,774 | ||
| Net Assets Consist of | ||||
| Undistributed net investment income | 7,643,314 | |||
Net unrealized appreciation (depreciation) on: Investments | 13,739,402 | |||
| Swap contracts | (75,776 | ) | ||
| Futures | 992,892 | |||
| Foreign currency | 226,466 | |||
| Written options | 116,387 | |||
| Accumulated net realized gain (loss) | 25,328,250 | |||
| Paid-in capital | 221,111,839 | |||
| Net assets, at value | $ | 269,082,774 | ||
Class A Net Asset Value, offering and redemption price per share ($269,082,774 ÷ 9,857,478 outstanding shares of beneficial interest, no par value, unlimited number of shares authorized) | $ | 27.30 | ||
* Represents collateral on securities loaned.
The accompanying notes are an integral part of the financial statements.
| for the year ended December 31, 2013 | ||||
| Investment Income | ||||
Income: Dividends (net of foreign taxes withheld of $324,375) | $ | 4,879,762 | ||
| Interest (net of foreign taxes withheld of $1,589) | 4,668,423 | |||
| Income distributions — Central Cash Management Fund | 6,876 | |||
| Securities lending income, including income from Daily Assets Fund Institutional, net of borrower rebates | 147,087 | |||
| Total income | 9,702,148 | |||
Expenses: Management fee | 973,969 | |||
| Administration fee | 264,194 | |||
| Services to shareholders | 1,305 | |||
| Custodian fee | 106,222 | |||
| Audit and tax fees | 82,698 | |||
| Legal fees | 13,187 | |||
| Reports to shareholders | 75,676 | |||
| Trustees' fees and expenses | 11,523 | |||
| Other | 66,385 | |||
| Total expenses | 1,595,159 | |||
| Net investment income | 8,106,989 | |||
| Realized and Unrealized Gain (Loss) | ||||
Net realized gain (loss) from: Investments | 30,148,469 | |||
| Swap contracts | 372,084 | |||
| Futures | 558,948 | |||
| Written options | 127,540 | |||
| Foreign currency | (556,512 | ) | ||
| 30,650,529 | ||||
Change in net unrealized appreciation (depreciation) on: Investments | 750,963 | |||
| Swap contracts | (103,285 | ) | ||
| Futures | 1,015,166 | |||
| Written options | 9,146 | |||
| Foreign currency | 250,711 | |||
| 1,922,701 | ||||
| Net gain (loss) | 32,573,230 | |||
| Net increase (decrease) in net assets resulting from operations | $ | 40,680,219 | ||
The accompanying notes are an integral part of the financial statements.
| Years Ended December 31, | ||||||||
| Increase (Decrease) in Net Assets | 2013 | 2012 | ||||||
Operations: Net investment income (loss) | $ | 8,106,989 | $ | 6,577,137 | ||||
| Net realized gain (loss) | 30,650,529 | 37,219,792 | ||||||
| Change in net unrealized appreciation (depreciation) | 1,922,701 | (11,355,694 | ) | |||||
| Net increase (decrease) in net assets resulting from operations | 40,680,219 | 32,441,235 | ||||||
Distributions to shareholders from: Net investment income: Class A | (5,498,634 | ) | (4,191,340 | ) | ||||
| Total distributions | (5,498,634 | ) | (4,191,340 | ) | ||||
Fund share transactions: Class A Proceeds from shares sold | 7,161,669 | 5,666,347 | ||||||
| Shares issued to shareholders in reinvestment of distributions | 5,498,634 | 4,191,340 | ||||||
| Payments for shares redeemed | (39,157,373 | ) | (41,768,743 | ) | ||||
| Net increase (decrease) in net assets from Class A share transactions | (26,497,070 | ) | (31,911,056 | ) | ||||
| Increase (decrease) in net assets | 8,684,515 | (3,661,161 | ) | |||||
| Net assets at beginning of period | 260,398,259 | 264,059,420 | ||||||
| Net assets at end of period (including undistributed net investment income of $7,643,314 and $5,395,441, respectively) | $ | 269,082,774 | $ | 260,398,259 | ||||
| Other Information | ||||||||
Class A Shares outstanding at beginning of period | 10,896,924 | 12,288,136 | ||||||
| Shares sold | 284,532 | 246,623 | ||||||
| Shares issued to shareholders in reinvestment of distributions | 220,917 | 186,116 | ||||||
| Shares redeemed | (1,544,895 | ) | (1,823,951 | ) | ||||
| Net increase (decrease) in Class A shares | (1,039,446 | ) | (1,391,212 | ) | ||||
| Shares outstanding at end of period | 9,857,478 | 10,896,924 | ||||||
The accompanying notes are an integral part of the financial statements.
| Years Ended December 31, | |||||||||||||||||||||
| Class A | 2013 | 2012 | 2011 | 2010 | 2009 | ||||||||||||||||
| Selected Per Share Data | |||||||||||||||||||||
| Net asset value, beginning of period | $ | 23.90 | $ | 21.49 | $ | 22.13 | $ | 20.52 | $ | 17.35 | |||||||||||
Income (loss) from investment operations: Net investment incomea | .78 | .57 | .46 | .39 | .44 | ||||||||||||||||
| Net realized and unrealized gain (loss) | 3.14 | 2.20 | (.75 | ) | 1.88 | 3.43 | |||||||||||||||
| Total from investment operations | 3.92 | 2.77 | (.29 | ) | 2.27 | 3.87 | |||||||||||||||
Less distributions from: Net investment income | (.52 | ) | (.36 | ) | (.35 | ) | (.66 | ) | (.70 | ) | |||||||||||
| Net asset value, end of period | $ | 27.30 | $ | 23.90 | $ | 21.49 | $ | 22.13 | $ | 20.52 | |||||||||||
| Total Return (%) | 16.63 | 12.98 | (1.42 | ) | 11.22 | 23.43 | |||||||||||||||
| Ratios to Average Net Assets and Supplemental Data | |||||||||||||||||||||
| Net assets, end of period ($ millions) | 269 | 260 | 264 | 308 | 319 | ||||||||||||||||
| Ratio of expenses (%) | .60 | .59 | .58 | .65 | .60 | ||||||||||||||||
| Ratio of net investment income (%) | 3.07 | 2.48 | 2.09 | 1.89 | 2.40 | ||||||||||||||||
| Portfolio turnover rate (%) | 182 | 188 | 109 | 203 | 207 | ||||||||||||||||
a Based on average shares outstanding during the period. | |||||||||||||||||||||
A. Organization and Significant Accounting Policies
DWS Global Income Builder VIP (the "Fund") is a diversified series of DWS Variable Series II (the "Trust"), which is registered under the Investment Company Act of 1940, as amended (the "1940 Act"), as an open-end management investment company organized as a Massachusetts business trust.
The Fund's financial statements are prepared in accordance with accounting principles generally accepted in the United States of America which require the use of management estimates. Actual results could differ from those estimates. The policies described below are followed consistently by the Fund in the preparation of its financial statements.
Security Valuation. Investments are stated at value determined as of the close of regular trading on the New York Stock Exchange on each day the exchange is open for trading.
Various inputs are used in determining the value of the Fund's investments. These inputs are summarized in three broad levels. Level 1 includes quoted prices in active markets for identical securities. Level 2 includes other significant observable inputs (including quoted prices for similar securities, interest rates, prepayment speeds and credit risk). Level 3 includes significant unobservable inputs (including the Fund's own assumptions in determining the fair value of investments). The level assigned to the securities valuations may not be an indication of the risk or liquidity associated with investing in those securities.
Equity securities are valued at the most recent sale price or official closing price reported on the exchange (U.S. or foreign) or over-the-counter market on which they trade. Securities for which no sales are reported are valued at the calculated mean between the most recent bid and asked quotations on the relevant market or, if a mean cannot be determined, at the most recent bid quotation. Equity securities are generally categorized as Level 1. For certain international equity securities, in order to adjust for events which may occur between the close of the foreign exchanges and the close of the New York Stock Exchange, a fair valuation model may be used. This fair valuation model takes into account comparisons to the valuation of American Depository Receipts (ADRs), exchange-traded funds, futures contracts and certain indices and these securities are categorized as Level 2.
Debt securities and loan participations and assignments are valued at prices supplied by independent pricing services approved by the Fund's Board. Such services may use various pricing techniques which take into account appropriate factors such as yield, quality, coupon rate, maturity, type of issue, trading characteristics, prepayment speeds and other data, as well as broker quotes. If the pricing services are unable to provide valuations, debt securities are valued at the average of the most recent reliable bid quotations or evaluated prices, as applicable, obtained from broker-dealers and loan participations and assignments are valued at the mean of the most recent bid and ask quotations or evaluated prices, as applicable, obtained from broker-dealers. These securities are generally categorized as Level 2.
Money market instruments purchased with an original or remaining maturity of sixty days or less, maturing at par, are valued at amortized cost, which approximates value, and are categorized as Level 2. Investments in open-end investment companies are valued at their net asset value each business day and are categorized as Level 1.
Futures contracts are generally valued at the settlement prices established each day on the exchange on which they are traded and are categorized as Level 1.
Forward currency contracts are valued at the prevailing forward exchange rate of the underlying currencies and are categorized as Level 2.
Swap contracts are valued daily based upon prices supplied by a Board approved pricing vendor, if available, and otherwise are valued at the price provided by the broker-dealer. Swap contracts are generally categorized as Level 2.
Exchange-traded options are valued at the last sale price or, in the absence of a sale, the mean between the closing bid and asked prices or at the most recent asked price (bid for purchased options) if no bid or asked price are available. Exchange-traded options are categorized as Level 1. Over-the-counter written or purchased options are valued at prices supplied by a Board approved pricing vendor, if available, and otherwise are valued at the price provided by the broker-dealer with which the option was traded. Over-the-counter written or purchased options are generally categorized as Level 2.
Securities and other assets for which market quotations are not readily available or for which the above valuation procedures are deemed not to reflect fair value are valued in a manner that is intended to reflect their fair value as determined in accordance with procedures approved by the Board and are generally categorized as Level 3. In accordance with the Fund's valuation procedures, factors used in determining value may include, but are not limited to, the type of the security; the size of the holding; the initial cost of the security; the existence of any contractual restrictions on the security's disposition; the price and extent of public trading in similar securities of the issuer or of comparable companies; quotations or evaluated prices from broker-dealers and/or pricing services; information obtained from the issuer, analysts, and/or the appropriate stock exchange (for exchange-traded securities); an analysis of the company's or issuer's financial statements; an evaluation of the forces that influence the issuer and the market(s) in which the security is purchased and sold; and with respect to debt securities, the maturity, coupon, creditworthiness, currency denomination and the movement of the market in which the security is normally traded. The value determined under these procedures may differ from published values for the same securities.
Disclosure about the classification of fair value measurements is included in a table following the Fund's Investment Portfolio.
Foreign Currency Translations. The books and records of the Fund are maintained in U.S. dollars. Investment securities and other assets and liabilities denominated in a foreign currency are translated into U.S. dollars at the prevailing exchange rates at period end. Purchases and sales of investment securities, income and expenses are translated into U.S. dollars at the prevailing exchange rates on the respective dates of the transactions.
Net realized and unrealized gains and losses on foreign currency transactions represent net gains and losses between trade and settlement dates on securities transactions, the acquisition and disposition of foreign currencies, and the difference between the amount of net investment income accrued and the U.S. dollar amount actually received. That portion of both realized and unrealized gains and losses on investments that results from fluctuations in foreign currency exchange rates is not separately disclosed but is included with net realized and unrealized gain/appreciation and loss/depreciation on investments.
Securities Lending. Deutsche Bank AG, as lending agent, lends securities of the Fund to certain financial institutions under the terms of the Security Lending Agreement. The Fund retains the benefits of owning the securities it has loaned and continues to receive interest and dividends generated by the securities and to participate in any changes in their market value. The Fund requires the borrowers of the securities to maintain collateral with the Fund consisting of either cash or liquid, unencumbered assets having a value at least equal to the value of the securities loaned. When the collateral falls below specified amounts, the lending agent will use its best effort to obtain additional collateral on the next business day to meet required amounts under the security lending agreement. The Fund may invest the cash collateral into a joint trading account in an affiliated money market fund pursuant to Exemptive Orders issued by the SEC. The Fund receives compensation for lending its securities either in the form of fees or by earning interest on invested cash collateral net of borrower rebates and fees paid to a lending agent. Either the Fund or the borrower may terminate the loan. There may be risks of delay and costs in recovery of securities or even loss of rights in the collateral should the borrower of the securities fail financially. If the Fund is not able to recover securities lent, the Fund may sell the collateral and purchase a replacement investment in the market, incurring the risk that the value of the replacement security is greater than the value of the collateral. The Fund is also subject to all investment risks associated with the reinvestment of any cash collateral received, including, but not limited to, interest rate, credit and liquidity risk associated with such investments.
As of December 31, 2013, the Fund had securities on loan. The value of the related collateral exceeded the value of the securities loaned at period end.
Loan Participations and Assignments. Loan Participations and Assignments are portions of loans originated by banks and sold in pieces to investors. These fixed- and floating-rate loans ("Loans") in which the Fund invests are arranged between the borrower and one or more financial institutions ("Lenders"). These Loans may take the form of Senior Loans, which are corporate obligations often issued in connection with recapitalizations, acquisitions, leveraged buy outs and refinancing. The Fund invests in such Loans in the form of participations in Loans ("Participations") or assignments of all or a portion of Loans from third parties ("Assignments"). Participations typically result in the Fund having a contractual relationship with only the Lender, not with the borrower. The Fund has the right to receive payments of principal, interest and any fees to which it is entitled from the Lender selling the Participation and only upon receipt by the Lender of the payments from the borrower. In connection with purchasing Participations, the Fund generally has no right to enforce compliance by the borrower with the terms of the loan agreement relating to the Loan, or any rights of set off against the borrower, and the Fund will not benefit directly from any collateral supporting the Loan in which it has purchased the Participation. As a result, the Fund assumes the credit risk of both the borrower and the Lender that is selling the Participation. Assignments typically result in the Fund having a direct contractual relationship with the borrower, and the Fund may enforce compliance by the borrower with the terms of the loan agreement. Loans held by the Fund are generally in the form of Assignments, but the Fund may also invest in Participations. All Loans involve interest rate risk, liquidity risk and credit risk, including the potential default or insolvency of the borrower.
When-Issued/Delayed Delivery Securities. The Fund may purchase or sell securities with delivery or payment to occur at a later date beyond the normal settlement period. At the time the Fund enters into a commitment to purchase or sell a security, the transaction is recorded and the value of the transaction is reflected in the net asset value. The price of such security and the date when the security will be delivered and paid for are fixed at the time the transaction is negotiated. The value of the security may vary with market fluctuations. At the time the Fund enters into a purchase transaction it is required to segregate cash or other liquid assets at least equal to the amount of the commitment.
Certain risks may arise upon entering into when-issued or delayed delivery transactions from the potential inability of counterparties to meet the terms of their contracts or if the issuer does not issue the securities due to political, economic, or other factors. Additionally, losses may arise due to changes in the value of the underlying securities.
Taxes. The Fund's policy is to comply with the requirements of the Internal Revenue Code, as amended, which are applicable to regulated investment companies and to distribute all of its taxable income to its shareholders.
Additionally, the Fund may be subject to taxes imposed by the governments of countries in which it invests and are generally based on income and/or capital gains earned or repatriated. Estimated tax liabilities on certain foreign securities are recorded on an accrual basis and are reflected as components of interest income or net change in unrealized gain/loss on investments. Tax liabilities realized as a result of security sales are reflected as a component of net realized gain/loss on investments.
The Fund has reviewed the tax positions for the open tax years as of December 31, 2013 and has determined that no provision for income tax is required in the Fund's financial statements. The Fund's federal tax returns for the prior three fiscal years remain open subject to examination by the Internal Revenue Service.
Distribution of Income and Gains. Distributions from net investment income of the Fund, if any, are declared and distributed to shareholders annually. Net realized gains from investment transactions, in excess of available capital loss carryforwards, would be taxable to the Fund if not distributed and, therefore, will be distributed to shareholders at least annually. The Fund may also make additional distributions for tax purposes if necessary.
The timing and characterization of certain income and capital gain distributions are determined annually in accordance with federal tax regulations which may differ from accounting principles generally accepted in the United States of America. These differences primarily relate to investments in foreign denominated investments, forward currency contracts, futures contracts, swap contracts and certain securities sold at a loss. As a result, net investment income (loss) and net realized gain (loss) on investment transactions for a reporting period may differ significantly from distributions during such period. Accordingly, the Fund may periodically make reclassifications among certain of its capital accounts without impacting the net asset value of the Fund.
At December 31, 2013, the Fund's components of distributable earnings on a tax basis were as follows:
| Undistributed ordinary income* | $ | 12,343,378 | ||
| Undistributed net long-term capital gains | $ | 22,165,270 | ||
| Unrealized appreciation (depreciation) on investments | $ | 13,404,649 |
In addition, the tax character of distributions paid by the Fund is summarized as follows:
| Years Ended December 31, | ||||||||
| 2013 | 2012 | |||||||
| Distributions from ordinary income* | $ | 5,498,634 | $ | 4,191,340 | ||||
* For tax purposes, short-term capital gain distributions are considered ordinary income distributions.
Expenses. Expenses of the Trust arising in connection with a specific fund are allocated to that fund. Other Trust expenses which cannot be directly attributed to a fund are apportioned among the funds in the Trust based upon the relative net assets or other appropriate measures.
Contingencies. In the normal course of business, the Fund may enter into contracts with service providers that contain general indemnification clauses. The Fund's maximum exposure under these arrangements is unknown as this would involve future claims that may be made against the Fund that have not yet been made. However, based on experience, the Fund expects the risk of loss to be remote.
Other. Investment transactions are accounted for on a trade date plus one basis for daily net asset value calculations. However, for financial reporting purposes, investment transactions are reported on trade date. Interest income is recorded on the accrual basis. Dividend income is recorded on the ex-dividend date net of foreign withholding taxes. Certain dividends from foreign securities may be recorded subsequent to the ex-dividend date as soon as the Fund is informed of such dividends. Realized gains and losses from investment transactions are recorded on an identified cost basis. Proceeds from litigation payments, if any, are included in net realized gain (loss) from investments. All discounts and premiums are accreted/amortized for both tax and financial reporting purposes, with the exception of securities in default of principal.
B. Derivative Instruments
Swaps. A swap is a contract between two parties to exchange future cash flows at periodic intervals based on the notional amount of the swap. A bilateral swap is a transaction between the fund and a counterparty where cash flows are exchanged between the two parties. A centrally cleared swap is a transaction executed between the fund and a counterparty, then cleared by a clearing member through a central clearinghouse. The central clearinghouse serves as the counterparty, with whom the fund exchanges cash flows.
The value of a swap is adjusted daily, and the change in value, if any, is recorded as unrealized appreciation or depreciation in the Statement of Assets and Liabilities. Gains or losses are realized when the swap expires or is closed. Certain risks may arise when entering into swap transactions including counterparty default; liquidity; or unfavorable changes in interest rates or the value of the underlying reference security, commodity or index. In connection with bilateral swaps, securities and/or cash may be identified as collateral in accordance with the terms of the swap agreement to provide assets of value and recourse in the event of default. The maximum counterparty credit risk is the net present value of the cash flows to be received from or paid to the counterparty over the term of the swap, to the extent that this amount is beneficial to the Fund, in addition to any related collateral posted to the counterparty by the Fund. This risk may be partially reduced by a master netting arrangement between the Fund and the counterparty. Upon entering into a centrally cleared swap, the Fund is required to deposit with a financial intermediary cash or securities ("initial margin") in an amount equal to a certain percentage of the notional amount of the swap. Subsequent payments ("variation margin") are made or received by the Fund dependent upon the daily fluctuations in the value of the swap. In a cleared swap transaction, counterparty risk is minimized as the central clearinghouse acts as the counterparty.
An upfront payment, if any, made by the Fund is recorded as an asset in the Statement of Assets and Liabilities. An upfront payment, if any, received by the Fund is recorded as a liability in the Statement of Assets and Liabilities. Payments received or made at the end of the measurement period are recorded as realized gain or loss in the Statement of Operations.
Interest Rate Swaps. Interest rate swaps are agreements in which the Fund agrees to pay to the counterparty a fixed rate payment in exchange for the counterparty agreeing to pay to the Fund a variable rate payment, or the Fund agrees to receive from the counterparty a fixed rate payment in exchange for the counterparty agreeing to receive from the Fund a variable rate payment. The payment obligations are based on the notional amount of the swap. For the year ended December 31, 2013, the Fund entered into interest rate swap agreements to gain exposure to different parts of the yield curve while managing overall duration.
A summary of the open interest rate swap contracts as of December 31, 2013 is included in a table following the Fund's Investment Portfolio. For the year ended December 31, 2013, the investment in interest rate swap contracts had a total notional amount generally indicative of a range from $6,100,000 to $22,800,000.
Credit Default Swaps. Credit default swaps are agreements between a buyer and a seller of protection against predefined credit events for the reference entity. The Fund may enter into credit default swaps to gain exposure to an underlying issuer's credit quality characteristics without directly investing in that issuer or to hedge against the risk of a credit event on debt securities. As a seller of a credit default swap, the Fund is required to pay the par (or other agreed-upon) value of the referenced entity to the counterparty with the occurrence of a credit event by a third party, such as a U.S. or foreign corporate issuer, on the reference entity, which would likely result in a loss to the Fund. In return, the Fund receives from the counterparty a periodic stream of payments over the term of the swap provided that no credit event has occurred. If no credit event occurs, the Fund keeps the stream of payments with no payment obligations. The Fund may also buy credit default swaps, in which case the Fund functions as the counterparty referenced above. This involves the risk that the swap may expire worthless. It also involves counterparty risk that the seller may fail to satisfy its payment obligations to the Fund with the occurrence of a credit event. When the Fund sells a credit default swap, it will cover its commitment. This may be achieved by, among other methods, maintaining cash or liquid assets equal to the aggregate notional value of the reference entities for all outstanding credit default swaps sold by the Fund. For the year ended December 31, 2013, the Fund entered into credit default swap agreements to gain exposure to the underlying issuer's credit quality characteristics.
Under the terms of a credit default swap, the Fund receives or makes periodic payments based on a specified interest rate on a fixed notional amount. These payments are recorded as a realized gain or loss in the Statement of Operations. Payments received or made as a result of a credit event or termination of the swap are recognized, net of a proportional amount of the upfront payment, as realized gains or losses in the Statement of Operations.
A summary of the open credit default swap contracts as of December 31, 2013 is included in a table following the Fund's Investment Portfolio. For the year ended December 31, 2013, the investment in credit default swap contracts sold had a total notional value generally indicative of a range from $125,000 to $1,925,000.
Futures Contracts. A futures contract is an agreement between a buyer or seller and an established futures exchange or its clearinghouse in which the buyer or seller agrees to take or make a delivery of a specific amount of a financial instrument at a specified price on a specific date (settlement date). For the year ended December 31, 2013, the Fund entered into interest rate futures to gain exposure to different parts of the yield curve while managing overall duration. The Fund also entered into interest rate futures contracts for non-hedging purposes to seek to enhance potential gains.
Upon entering into a futures contract, the Fund is required to deposit with a financial intermediary cash or securities ("initial margin") in an amount equal to a certain percentage of the face value indicated in the futures contract. Subsequent payments ("variation margin") are made or received by the Fund dependent upon the daily fluctuations in the value and are recorded for financial reporting purposes as unrealized gains or losses by the Fund. Gains or losses are realized when the contract expires or is closed. Since all futures contracts are exchange-traded, counterparty risk is minimized as the exchange's clearinghouse acts as the counterparty, and guarantees the futures against default.
Certain risks may arise upon entering into futures contracts, including the risk that an illiquid market will limit the Fund's ability to close out a futures contract prior to the settlement date and the risk that the futures contract is not well correlated with the security, index or currency to which it relates. Risk of loss may exceed amounts disclosed in the Statement of Assets and Liabilities.
A summary of the open futures contracts as of December 31, 2013 is included in a table following the Fund's Investment Portfolio. For the year ended December 31, 2013, the investment in futures contracts purchased had a total notional value generally indicative of a range from approximately $1,012,000 to $7,994,000, and the investment in futures contracts sold had a total notional value generally indicative of a range from approximately $4,480,000 to $76,652,000.
Options. An option contract is a contract in which the writer (seller) of the option grants the buyer of the option, upon payment of a premium, the right to purchase from (call option), or sell to (put option), the writer a designated instrument at a specified price within a specified period of time. The Fund may write or purchase interest rate swaption agreements which are options to enter into a pre-defined swap agreement. The interest rate swaption agreement will specify whether the buyer of the swaption will be a fixed-rate receiver or a fixed-rate payer upon exercise. Certain options, including options on indices and interest rate options, will require cash settlement by the Fund if exercised. For the year ended December 31, 2013, the Fund entered into options on interest rate futures and on interest rate swaps in order to hedge against potential adverse interest rate movements of portfolio assets.
If the Fund writes a covered call option, the Fund foregoes, in exchange for the premium, the opportunity to profit during the option period from an increase in the market value of the underlying security above the exercise price. If the Fund writes a put option it accepts the risk of a decline in the value of the underlying security below the exercise price. Over-the-counter options have the risk of the potential inability of counterparties to meet the terms of their contracts. For exchange traded contracts, the counterparty risk is minimized as the exchange's clearinghouse acts as the counterparty, and guarantees the futures against default. The Fund's maximum exposure to purchased options is limited to the premium initially paid. In addition, certain risks may arise upon entering into option contracts including the risk that an illiquid secondary market will limit the Fund's ability to close out an option contract prior to the expiration date and that a change in the value of the option contract may not correlate exactly with changes in the value of the securities or currencies hedged.
There are no open purchased option contracts as of December 31, 2013. A summary of open written option contracts is included in a table following the Fund's Investment Portfolio. For the year ended December 31, 2013, the investment in written option contracts had a total value generally indicative of a range from approximately $74,000 to $434,000, and purchased option contracts had a total value generally indicative of a range from $0 to approximately $147,000.
Forward Foreign Currency Exchange Contracts. A forward foreign currency exchange contract ("forward currency contract") is a commitment to purchase or sell a foreign currency at the settlement date at a negotiated rate. For the year ended December 31, 2013, the Fund entered into forward currency contracts in order to hedge its exposure to changes in foreign currency exchange rates on its foreign currency denominated portfolio holdings, to facilitate transactions in foreign currency denominated securities and to enhance total returns.
Forward currency contracts are valued at the prevailing forward exchange rate of the underlying currencies and unrealized gain (loss) is recorded daily. On the settlement date of the forward currency contract, the Fund records a realized gain or loss equal to the difference between the value of the contract at the time it was opened and the value of the contract at the time it was closed. Certain risks may arise upon entering into forward currency contracts from the potential inability of counterparties to meet the terms of their contracts. The maximum counterparty credit risk to the Fund is measured by the unrealized gain on appreciated contracts. Additionally, when utilizing forward currency contracts to hedge, the Fund gives up the opportunity to profit from favorable exchange rate movements during the term of the contract.
A summary of the open forward currency contracts as of December 31, 2013 is included in a table following the Fund's Investment Portfolio. For the year ended December 31, 2013, the investment in forward currency contracts short vs. U.S. dollars had a total contract value generally indicative of a range from approximately $6,931,000 to $23,982,000, and the investment in forward currency contracts long vs. U.S. dollars had a total contract value generally indicative of a range from approximately $3,551,000 to $20,433,000. The investment in forward currency contracts long vs. other foreign currencies sold had a total contract value generally indicative of a range from $0 to approximately $6,419,000.
The following tables summarize the value of the Fund's derivative instruments held as of December 31, 2013 and the related location in the accompanying Statement of Assets and Liabilities, presented by primary underlying risk exposure:
| Asset Derivatives | Forward Contracts | Swap Contracts | Futures Contracts | Total | ||||||||||||
| Interest Rate Contracts (a) | $ | — | $ | 10,543 | $ | 1,044,009 | $ | 1,054,552 | ||||||||
| Credit Contracts (b) | — | 11,007 | — | 11,007 | ||||||||||||
| Foreign Exchange Contracts (b) | 272,353 | — | — | 272,353 | ||||||||||||
| $ | 272,353 | $ | 21,550 | $ | 1,044,009 | $ | 1,337,912 | |||||||||
Each of the above derivatives is located in the following Statement of Assets and Liabilities accounts: (a) Includes cumulative appreciation of futures and centrally cleared swap contracts as disclosed in the Investment Portfolio. Unsettled variation margin is disclosed separately within the Statement of Assets and Liabilities. (b) Unrealized appreciation on swap contracts and forward foreign currency exchange contracts | ||||||||||||||||
| Liability Derivatives | Written Options | Forward Contracts | Swap Contracts | Futures Contracts | Total | |||||||||||||||
| Interest Rate Contracts (a) (b) | $ | (163,823 | ) | $ | — | $ | (97,326 | ) | $ | (51,117 | ) | $ | (312,266 | ) | ||||||
| Foreign Exchange Contracts (c) | — | (48,760 | ) | — | — | (48,760 | ) | |||||||||||||
| $ | (163,823 | ) | $ | (48,760 | ) | $ | (97,326 | ) | $ | (51,117 | ) | $ | (361,026 | ) | ||||||
Each of the above derivatives is located in the following Statement of Assets and Liabilities accounts: (a) Includes cumulative depreciation of futures and centrally cleared swap contracts as disclosed in the Investment Portfolio. Unsettled variation margin is disclosed separately within the Statement of Assets and Liabilities. (b) Options written, at value and unrealized depreciation on swap contracts, respectively (c) Unrealized depreciation on forward foreign currency exchange contracts | ||||||||||||||||||||
Additionally, the amount of unrealized and realized gains and losses on derivative instruments recognized in Fund earnings during the year ended December 31, 2013 and the related location in the accompanying Statement of Operations is summarized in the following tables by primary underlying risk exposure:
| Realized Gain (Loss) | Purchased Options | Written Options | Forward Contracts | Swap Contracts | Futures Contracts | Total | ||||||||||||||||||
| Interest Rate Contracts (a) | $ | (13,141 | ) | $ | 127,540 | $ | — | $ | 281,040 | $ | 558,948 | $ | 954,387 | |||||||||||
| Credit Contracts (a) | — | — | — | 91,044 | — | 91,044 | ||||||||||||||||||
| Foreign Exchange Contracts (b) | — | — | (412,862 | ) | — | — | (412,862 | ) | ||||||||||||||||
| $ | (13,141 | ) | $ | 127,540 | $ | (412,862 | ) | $ | 372,084 | $ | 558,948 | $ | 632,569 | |||||||||||
Each of the above derivatives is located in the following Statement of Operations accounts: (a) Net realized gain (loss) from investments (includes purchased options), written options, swap contracts and futures, respectively (b) Net realized gain (loss) from foreign currency (Statement of Operations includes both forward currency contracts and foreign currency transactions) | ||||||||||||||||||||||||
| Change in Net Unrealized Appreciation (Depreciation) | Purchased Options | Written Options | Forward Contracts | Swap Contracts | Futures Contracts | Total | ||||||||||||||||||
| Interest Rate Contracts (a) | $ | 37,464 | $ | 9,146 | $ | — | $ | (49,766 | ) | $ | 1,015,166 | $ | 1,012,010 | |||||||||||
| Credit Contracts (a) | — | — | — | (53,519 | ) | — | (53,519 | ) | ||||||||||||||||
| Foreign Exchange Contracts (b) | — | — | 247,346 | — | — | 247,346 | ||||||||||||||||||
| $ | 37,464 | $ | 9,146 | $ | 247,346 | $ | (103,285 | ) | $ | 1,015,166 | $ | 1,205,837 | ||||||||||||
Each of the above derivatives is located in the following Statement of Operations accounts: (a) Change in net unrealized appreciation (depreciation) on investments (includes purchased options), written options, swap contracts and futures, respectively (b) Change in net unrealized appreciation (depreciation) on foreign currency (Statement of Operations includes both forward currency contracts and foreign currency transactions) | ||||||||||||||||||||||||
As of December 31, 2013, the Fund has transactions subject to enforceable master netting agreements. A reconciliation of the gross amounts on the Statement of Assets and Liabilities to the net amounts by derivative type, including any collateral exposure, is included in the following tables:
| Counterparty | Gross Amounts of Assets Presented in the Statement of Assets and Liabilities (a) | Financial Instruments and Derivatives Available for Offset | Collateral Received | Net Amount of Derivative Assets | ||||||||||||
| Australia & New Zealand Banking Group Ltd. | $ | 298 | $ | — | $ | — | $ | 298 | ||||||||
| Barclays Bank PLC | 45,719 | (1 | ) | — | 45,718 | |||||||||||
| Citigroup, Inc. | 36,210 | (16,582 | ) | — | 19,628 | |||||||||||
| Commonwealth Bank of Australia | 12,857 | (4,530 | ) | — | 8,327 | |||||||||||
| JPMorgan Chase Securities, Inc. | 18,800 | (1 | ) | — | 18,799 | |||||||||||
| Nomura International PLC | 515 | (515 | ) | — | — | |||||||||||
| UBS AG | 168,961 | — | — | 168,961 | ||||||||||||
| Exchange Traded Futures and Swaps (b) | 1,054,552 | — | — | 1,054,552 | ||||||||||||
| $ | 1,337,912 | $ | (21,629 | ) | $ | — | $ | 1,316,283 | ||||||||
| Counterparty | Gross Amounts of Liabilities Presented in the Statement of Assets and Liabilities (a) | Financial Instruments and Derivatives Available for Offset | Non-Cash Collateral Pledged (c) | Net Amount of Derivative Liabilities | ||||||||||||
| Barclays Bank PLC | $ | 1 | $ | (1 | ) | $ | — | $ | — | |||||||
| BNP Paribas | 58,782 | — | — | 58,782 | ||||||||||||
| Citigroup, Inc. | 16,582 | (16,582 | ) | — | — | |||||||||||
| Commonwealth Bank of Australia | 4,530 | (4,530 | ) | — | — | |||||||||||
| JPMorgan Chase Securities, Inc. | 1 | (1 | ) | — | — | |||||||||||
| Nomura International PLC | 227,735 | (515 | ) | (227,220 | ) | — | ||||||||||
| Exchange Traded Futures and Swaps (b) | 53,395 | — | — | 53,395 | ||||||||||||
| $ | 361,026 | $ | (21,629 | ) | $ | (227,220 | ) | $ | 112,177 | |||||||
(a) Forward foreign currency exchange contracts, bilateral swap contracts and written options are netted.
(b) Includes financial instruments (futures or centrally cleared swaps) which are not subject to a master netting arrangement, or another similar arrangement.
(c) The actual collateral received and/or pledged may be more than the amount shown.
C. Purchases and Sales of Securities
During the year ended December 31, 2013, purchases and sales of investment transactions (excluding short-term investments and U.S. Treasury obligations) aggregated $466,561,771 and $497,226,145, respectively. Purchases and sales of U.S. Treasury obligations aggregated $4,122,917 and $9,998,463, respectively.
For the year ended December 31, 2013, transactions for written options on interest rate swap contracts and futures contracts were as follows:
| Contracts/ Contract Amount | Premium | |||||||
| Outstanding, beginning of period | 8,200,020 | $ | 181,719 | |||||
| Options written | 31,500,114 | 387,211 | ||||||
| Options closed | (13,100,066 | ) | (240,195 | ) | ||||
| Options expired | (68 | ) | (48,525 | ) | ||||
| Outstanding, end of period | 26,600,000 | $ | 280,210 | |||||
D. Related Parties
Management Agreement. Under the Investment Management Agreement with Deutsche Investment Management Americas Inc. ("DIMA" or the "Advisor"), an indirect, wholly owned subsidiary of Deutsche Bank AG, the Advisor directs the investments of the Fund in accordance with its investment objectives, policies and restrictions. The Advisor determines the securities, instruments and other contracts relating to investments to be purchased, sold or entered into by the Fund.
Under the Investment Management Agreement, the Fund pays a monthly management fee based on the Fund's average daily net assets, computed and accrued daily and payable monthly, at the following annual rates:
| First $250 million | .370 | % | ||
| Next $750 million | .345 | % | ||
| Over $1 billion | .310 | % |
Accordingly, for the year ended December 31, 2013, the fee pursuant to the Investment Management Agreement was equivalent to an annual effective rate of 0.37% of the Fund's average daily net assets.
For the period from January 1, 2013 through September 30, 2013, the Advisor had contractually agreed to waive its fees and/or reimburse certain operating expenses to the extent necessary to maintain the operating expenses (excluding certain expenses such as extraordinary expenses, taxes, brokerage and interest expense) of Class A shares at 0.68%.
Effective October 1, 2013 through September 30, 2014, the Advisor has contractually agreed to waive its fee and/or reimburse certain operating expenses to the extent necessary to maintain the operating expenses (excluding certain expenses such as extraordinary expenses, taxes, brokerage and interest expense) of class A shares at 0.71%.
Administration Fee. Pursuant to an Administrative Services Agreement, DIMA provides most administrative services to the Fund. For all services provided under the Administrative Services Agreement, the Fund pays DIMA an annual fee ("Administration Fee") of 0.10% of the Fund's average daily net assets, computed and accrued daily and payable monthly. For the year ended December 31, 2013, the Administration Fee was $264,194, of which $22,543 is unpaid.
Service Provider Fees. DWS Investments Service Company ("DISC"), an affiliate of the Advisor, is the transfer agent, dividend-paying agent and shareholder service agent for the Fund. Pursuant to a sub-transfer agency agreement between DISC and DST Systems, Inc. ("DST"), DISC has delegated certain transfer agent, dividend-paying agent and shareholder service agent functions to DST. DISC compensates DST out of the shareholder servicing fee it receives from the Fund. For the year ended December 31, 2013, the amounts charged to the Fund by DISC aggregated $396, of which $66 is unpaid.
Typesetting and Filing Service Fees. Under an agreement with DIMA, DIMA is compensated for providing typesetting and certain regulatory filing services to the Fund. For the year ended December 31, 2013, the amount charged to the Fund by DIMA included in the Statement of Operations under "reports to shareholders" aggregated $21,063, of which $6,528 is unpaid.
Trustees' Fees and Expenses. The Fund paid retainer fees to each Trustee not affiliated with the Advisor, plus specified amounts to the Board Chairperson and Vice Chairperson and to each committee Chairperson.
Affiliated Cash Management Vehicles. The Fund may invest uninvested cash balances in Central Cash Management Fund and DWS Variable NAV Money Fund, affiliated money market funds which are managed by the Advisor. Each affiliated money market fund seeks to provide a high level of current income consistent with liquidity and the preservation of capital. Each affiliated money market fund is managed in accordance with Rule 2a-7 under the Investment Company Act of 1940, which governs the quality, maturity, diversity and liquidity of instruments in which a money market fund may invest. Central Cash Management Fund seeks to maintain a stable net asset value, and DWS Variable NAV Money Fund maintains a floating net asset value. The Fund indirectly bears its proportionate share of the expenses of each affiliated money market fund in which it invests. Central Cash Management Fund does not pay the Advisor an investment management fee. To the extent that DWS Variable NAV Money Fund pays an investment management fee to the Advisor, the Advisor will waive an amount of the investment management fee payable to the Advisor by the Fund equal to the amount of the investment management fee payable on the Fund's assets invested in DWS Variable NAV Money Fund.
Securities Lending Agent Fees. Deutsche Bank AG serves as securities lending agent for the Fund. For the year ended December 31, 2013, the Fund incurred securities lending agent fees to Deutsche Bank AG in the amount of $16,343.
E. Ownership of the Fund
At December 31, 2013, three participating insurance companies were owners of record of 10% or more of the total outstanding shares of the Fund, each owning 44%, 20% and 16%.
F. Line of Credit
The Fund and other affiliated funds (the "Participants") share in a $375 million revolving credit facility provided by a syndication of banks. The Fund may borrow for temporary or emergency purposes, including the meeting of redemption requests that otherwise might require the untimely disposition of securities. The Participants are charged an annual commitment fee which is allocated based on net assets, among each of the Participants. Interest is calculated at a rate per annum equal to the sum of the Federal Funds Rate plus 1.25 percent plus if LIBOR exceeds the Federal Funds Rate the amount of such excess. The Fund may borrow up to a maximum of 33 percent of its net assets under the agreement. The Fund had no outstanding loans at December 31, 2013.
To the Board of Trustees of DWS Variable Series II and Shareholders of DWS Global Income Builder VIP:
We have audited the accompanying statement of assets and liabilities, including the investment portfolio, of DWS Global Income Builder VIP (the "Fund") (one of the funds constituting DWS Variable Series II), as of December 31, 2013, and the related statement of operations for the year then ended, the statements of changes in net assets for each of the two years in the period then ended, and the financial highlights for each of the five years in the period then ended. These financial statements and financial highlights are the responsibility of the Fund's management. Our responsibility is to express an opinion on these financial statements and financial highlights based on our audits.
We conducted our audits in accordance with the standards of the Public Company Accounting Oversight Board (United States). Those standards require that we plan and perform the audit to obtain reasonable assurance about whether the financial statements and financial highlights are free of material misstatement. We were not engaged to perform an audit of the Fund's internal control over financial reporting. Our audits included consideration of internal control over financial reporting as a basis for designing audit procedures that are appropriate in the circumstances, but not for the purpose of expressing an opinion on the effectiveness of the Fund's internal control over financial reporting. Accordingly, we express no such opinion. An audit also includes examining, on a test basis, evidence supporting the amounts and disclosures in the financial statements and financial highlights, assessing the accounting principles used and significant estimates made by management, and evaluating the overall financial statement presentation. Our procedures included confirmation of securities owned as of December 31, 2013, by correspondence with the custodian and brokers, or by other appropriate auditing procedures where replies from brokers were not received. We believe that our audits provide a reasonable basis for our opinion.
In our opinion, the financial statements and financial highlights referred to above present fairly, in all material respects, the financial position of DWS Global Income Builder VIP (one of the funds constituting DWS Variable Series II) at December 31, 2013, the results of its operations for the year then ended, the changes in its net assets for each of the two years in the period then ended, and the financial highlights for each of the five years in the period then ended, in conformity with U.S. generally accepted accounting principles.
| ||
Boston, Massachusetts February 14, 2014 |
As an investor of the Fund, you incur two types of costs: ongoing expenses and transaction costs. Ongoing expenses include management fees and other Fund expenses. Examples of transaction costs include contract charges, redemption fees and account maintenance fees, which are not shown in this section. The following tables are intended to help you understand your ongoing expenses (in dollars) of investing in the Fund and to help you compare these expenses with the ongoing expenses of investing in other mutual funds. The example in the table is based on an investment of $1,000 invested at the beginning of the six-month period and held for the entire period (July 1, 2013 to December 31, 2013).
The tables illustrate your Fund's expenses in two ways:
—Actual Fund Return. This helps you estimate the actual dollar amount of ongoing expenses (but not transaction costs) paid on a $1,000 investment in the Fund using the Fund's actual return during the period. To estimate the expenses you paid over the period, simply divide your account value by $1,000 (for example, an $8,600 account value divided by $1,000 = 8.6), then multiply the result by the number in the "Expenses Paid per $1,000" line under the share class you hold.
— Hypothetical 5% Fund Return. This helps you to compare your Fund's ongoing expenses (but not transaction costs) with those of other mutual funds using the Fund's actual expense ratio and a hypothetical rate of return of 5% per year before expenses. Examples using a 5% hypothetical Fund return may be found in the shareholder reports of other mutual funds. The hypothetical account values and expenses may not be used to estimate the actual ending account balance or expenses you paid for the period.
Please note that the expenses shown in these tables are meant to highlight your ongoing expenses only and do not reflect any transaction costs. The "Expenses Paid per $1,000" line of the tables is useful in comparing ongoing expenses only and will not help you determine the relative total expense of owning different funds. If these transaction costs had been included, your costs would have been higher.
Expenses and Value of a $1,000 Investment for the six months ended December 31, 2013 | ||||
| Actual Fund Return | Class A | |||
| Beginning Account Value 7/1/13 | $ | 1,000.00 | ||
| Ending Account Value 12/31/13 | $ | 1,112.50 | ||
| Expenses Paid per $1,000* | $ | 3.35 | ||
| Hypothetical 5% Fund Return | Class A | |||
| Beginning Account Value 7/1/13 | $ | 1,000.00 | ||
| Ending Account Value 12/31/13 | $ | 1,022.03 | ||
| Expenses Paid per $1,000* | $ | 3.21 | ||
* Expenses are equal to the Fund's annualized expense ratio, multiplied by the average account value over the period, multiplied by 184 (the number of days in the most recent six-month period), then divided by 365.
| Annualized Expense Ratio | Class A | |
| DWS Variable Series II — DWS Global Income Builder VIP | .63% |
For more information, please refer to the Fund's prospectus.
These tables do not reflect charges and fees ("contract charges") associated with the separate account that invests in the Fund or any variable life insurance policy or variable annuity contract for which the Fund is an investment option.
For an analysis of the fees associated with an investment in the fund or similar funds, please refer to the current and hypothetical expense calculators for Variable Insurance Products which can be found at dws-investments.com/EN/resources/calculators.jsp.
For corporate shareholders, 27% of the ordinary dividends (i.e., income dividends plus short-term capital gains) paid during the Fund's fiscal year ended December 31, 2013 qualified for the dividends received deduction.
Please consult a tax advisor if you have questions about federal or state income tax laws, or on how to prepare your tax returns. If you have specific questions about your account, please contact your insurance provider.
The Trust's policies and procedures for voting proxies for portfolio securities and information about how the Trust voted proxies related to its portfolio securities during the 12-month period ended June 30 are available on our Web site — dws-investments.com (click on "proxy voting" at the bottom of the page) — or on the SEC's Web site — sec.gov. To obtain a written copy of the Trust's policies and procedures without charge, upon request, call us toll free at (800) 728-3337.
The Board of Trustees approved the renewal of DWS Global Income Builder VIP's investment management agreement (the "Agreement") with Deutsche Investment Management Americas Inc. ("DIMA") in September 2013.
In terms of the process that the Board followed prior to approving the Agreement, shareholders should know that:
— In September 2013, all but one of the Fund's Trustees were independent of DIMA and its affiliates.
— The Trustees met frequently during the past year to discuss fund matters and dedicated a substantial amount of time to contract review matters. Over the course of several months, the Board's Contract Committee, in coordination with the Board's Fixed Income and Asset Allocation Oversight Committee, reviewed comprehensive materials received from DIMA, independent third parties and independent counsel. These materials included an analysis of the Fund's performance, fees and expenses, and profitability compiled by a fee consultant retained by the Fund's Independent Trustees (the "Fee Consultant"). The Board also received extensive information throughout the year regarding performance of the Fund.
— The Independent Trustees regularly meet privately with their independent counsel to discuss contract review and other matters. In addition, the Independent Trustees were also advised by the Fee Consultant in the course of their review of the Fund's contractual arrangements and considered a comprehensive report prepared by the Fee Consultant in connection with their deliberations.
— In connection with reviewing the Agreement, the Board also reviewed the terms of the Fund's distribution agreement, administrative services agreement, transfer agency agreement and other material service agreements.
— Based on its evaluation of the information provided, the Contract Committee presented its findings and recommendations to the Board. The Board then reviewed the Contract Committee's findings and recommendations.
In connection with the contract review process, the Contract Committee and the Board considered the factors discussed below, among others. The Board also considered that DIMA and its predecessors have managed the Fund since its inception, and the Board believes that a long-term relationship with a capable, conscientious advisor is in the best interests of the Fund. The Board considered, generally, that shareholders chose to invest or remain invested in the Fund knowing that DIMA managed the Fund, and that the Agreement was approved by the Fund's shareholders. DIMA is part of Deutsche Bank AG, a major global banking institution that is engaged in a wide range of financial services. The Board believes that there are advantages to being part of a global asset management business that offers a wide range of investing expertise and resources, including hundreds of portfolio managers and analysts with research capabilities in many countries throughout the world.
As part of the contract review process, the Board carefully considered the fees and expenses of each DWS fund overseen by the Board in light of the fund's performance. In many cases, this led to a negotiation with DIMA of lower expense caps as part of the 2012 and 2013 contract review processes than had previously been in place. As part of these negotiations, the Board indicated that it would consider relaxing these new lower caps in future years following sustained improvements in performance, among other considerations.
In June 2012, Deutsche Bank AG ("DB"), DIMA's parent company, announced that DB would combine its Asset Management (of which DIMA was a part) and Wealth Management divisions. DB has advised the Independent Trustees that the U.S. asset management business is a critical and integral part of DB, and that it has, and will continue to, reinvest a significant portion of the substantial savings it expects to realize by combining its Asset Management and Wealth Management divisions into the new Asset and Wealth Management ("AWM") division, including ongoing enhancements to its investment capabilities. DB also has confirmed its commitment to maintaining strong legal and compliance groups within the AWM division.
While shareholders may focus primarily on fund performance and fees, the Fund's Board considers these and many other factors, including the quality and integrity of DIMA's personnel and such other issues as back-office operations, fund valuations, and compliance policies and procedures.
Nature, Quality and Extent of Services. The Board considered the terms of the Agreement, including the scope of advisory services provided under the Agreement. The Board noted that, under the Agreement, DIMA provides portfolio management services to the Fund and that, pursuant to a separate administrative services agreement, DIMA provides administrative services to the Fund. The Board considered the experience and skills of senior management and investment personnel, the resources made available to such personnel, the ability of DIMA to attract and retain high-quality personnel, and the organizational depth and stability of DIMA. The Board reviewed the Fund's performance over short-term and long-term periods and compared those returns to various agreed-upon performance measures, including market indices and a peer universe compiled by the Fee Consultant using information supplied by Morningstar Direct ("Morningstar"), an independent fund data service. The Board also noted that it has put into place a process of identifying "Focus Funds" (e.g., funds performing poorly relative to their benchmark or a peer universe compiled by an independent fund data service), and receives more frequent reporting and information from DIMA regarding such funds, along with DIMA's remedial plans to address underperformance. The Board believes this process is an effective manner of identifying and addressing underperforming funds. Based on the information provided, the Board noted that for the one-, three- and five-year periods ended December 31, 2012, the Fund's performance (Class A shares) was in the 2nd quartile, 2nd quartile and 3rd quartile, respectively, of the applicable Morningstar universe (the 1st quartile being the best performers and the 4th quartile being the worst performers). The Board also observed that the Fund has outperformed its benchmark in the one- and three-year periods and has underperformed its benchmark in the five-year period ended December 31, 2012.
Fees and Expenses. The Board considered the Fund's investment management fee schedule, operating expenses and total expense ratios, and comparative information provided by Lipper Inc. ("Lipper") and the Fee Consultant regarding investment management fee rates paid to other investment advisors by similar funds (1st quartile being the most favorable and 4th quartile being the least favorable). With respect to management fees paid to other investment advisors by similar funds, the Board noted that the contractual fee rates paid by the Fund, which include a 0.10% fee paid to DIMA under the Fund's administrative services agreement, were lower than the median (1st quartile) of the applicable Lipper peer group (based on Lipper data provided as of December 31, 2012). The Board noted that the Fund's Class A shares total (net) operating expenses were expected to be lower than the median (1st quartile) of the applicable Lipper expense universe (based on Lipper data provided as of December 31, 2012, and analyzing Lipper expense universe Class A (net) expenses less any applicable 12b-1 fees) ("Lipper Universe Expenses"). The Board considered the Fund's management fee rate as compared to fees charged by DIMA to a comparable fund and considered differences between the Fund and the comparable fund. The Board also considered how the Fund's total (net) operating expenses compared to the total (net) operating expenses of a more customized peer group selected by Lipper (based on such factors as asset size). The Board also noted that the expense limitation agreed to by DIMA helped to ensure that the Fund's total (net) operating expenses would remain competitive.
The information considered by the Board as part of its review of management fees included information regarding fees charged by DIMA and its affiliates to similar institutional accounts and to similar funds offered primarily to European investors ("DWS Europe funds"), in each case as applicable. The Board observed that advisory fee rates for institutional accounts generally were lower than the management fees charged by similarly managed DWS U.S. mutual funds ("DWS Funds"), but also took note of the differences in services provided to DWS Funds as compared to institutional accounts. In the case of DWS Europe funds, the Board observed that fee rates for DWS Europe funds generally were higher than for similarly managed DWS Funds, but noted that differences in the types of services provided to DWS Funds relative to DWS Europe funds made it difficult to compare such fees.
On the basis of the information provided, the Board concluded that management fees were reasonable and appropriate in light of the nature, quality and extent of services provided by DIMA.
Profitability. The Board reviewed detailed information regarding revenues received by DIMA under the Agreement. The Board considered the estimated costs and pre-tax profits realized by DIMA from advising the DWS Funds, as well as estimates of the pre-tax profits attributable to managing the Fund in particular. The Board also received information regarding the estimated enterprise-wide profitability of DWS and its affiliates with respect to all fund services in totality and by fund. The Board and the Fee Consultant reviewed DIMA's methodology in allocating its costs to the management of the Fund. Based on the information provided, the Board concluded that the pre-tax profits realized by DIMA in connection with the management of the Fund were not unreasonable. The Board also reviewed information regarding the profitability of certain similar investment management firms. The Board noted that while information regarding the profitability of such firms is limited (and in some cases is not necessarily prepared on a comparable basis), DIMA and its affiliates' overall profitability with respect to the DWS fund complex (after taking into account distribution and other services provided to the funds by DIMA and its affiliates) was lower than the overall profitability levels of many comparable firms for which such data was available.
Economies of Scale. The Board considered whether there are economies of scale with respect to the management of the Fund and whether the Fund benefits from any economies of scale. The Board noted that the Fund's management fee schedule includes fee breakpoints. The Board concluded that the Fund's fee schedule represents an appropriate sharing between the Fund and DIMA of such economies of scale as may exist in the management of the Fund at current asset levels.
Other Benefits to DIMA and Its Affiliates. The Board also considered the character and amount of other incidental benefits received by DIMA and its affiliates, including any fees received by DIMA for administrative services provided to the Fund and any fees received by an affiliate of DIMA for distribution services. The Board also considered benefits to DIMA related to brokerage and soft-dollar allocations, including allocating brokerage to pay for research generated by parties other than the executing broker dealers, which pertain primarily to funds investing in equity securities, along with the incidental public relations benefits to DIMA related to DWS Funds advertising and cross-selling opportunities among DIMA products and services. The Board concluded that management fees were reasonable in light of these fallout benefits.
Compliance. The Board considered the significant attention and resources dedicated by DIMA to documenting and enhancing its compliance processes in recent years. The Board noted in particular (i) the experience and seniority of both DIMA's chief compliance officer and the Fund's chief compliance officer; (ii) the large number of DIMA compliance personnel; and (iii) the substantial commitment of resources by DIMA and its affiliates to compliance matters.
Based on all of the information considered and the conclusions reached, the Board unanimously determined that the continuation of the Agreement is in the best interests of the Fund. In making this determination, the Board did not give particular weight to any single factor identified above. The Board considered these factors over the course of numerous meetings, certain of which were in executive session with only the Independent Trustees and their independent counsel present. It is possible that individual Trustees may have weighed these factors differently in reaching their individual decisions to approve the continuation of the Agreement.
The following table presents certain information regarding the Board Members and Officers of the fund. Each Board Member's year of birth is set forth in parentheses after his or her name. Unless otherwise noted, (i) each Board Member has engaged in the principal occupation(s) noted in the table for at least the most recent five years, although not necessarily in the same capacity; and (ii) the address of each Independent Board Member is c/o Kenneth C. Froewiss, Chairman, DWS Mutual Funds, P.O. Box 78, Short Hills, NJ 07078. Except as otherwise noted below, the term of office for each Board Member is until the election and qualification of a successor, or until such Board Member sooner dies, resigns, is removed or as otherwise provided in the governing documents of the fund. Because the fund does not hold an annual meeting of shareholders, each Board Member will hold office for an indeterminate period. The Board Members may also serve in similar capacities with other funds in the fund complex.
| Independent Board Members | ||||
Name, Year of Birth, Position with the Fund and Length of Time Served1 | Business Experience and Directorships During the Past Five Years | Number of Funds in DWS Fund Complex Overseen | Other Directorships Held by Board Member | |
Kenneth C. Froewiss (1945) Chairperson since 2013, and Board Member since 2001 | Adjunct Professor of Finance, NYU Stern School of Business (September 2009–present; Clinical Professor from 1997–September 2009); Member, Finance Committee, Association for Asian Studies (2002–present); Director, Mitsui Sumitomo Insurance Group (US) (2004–present); prior thereto, Managing Director, J.P. Morgan (investment banking firm) (until 1996) | 103 | — | |
William McClayton (1944) Vice Chairperson since 2013, and Board Member since 2004 | Private equity investor (since October 2009); previously, Managing Director, Diamond Management & Technology Consultants, Inc. (global consulting firm) (2001–2009); Directorship: Board of Managers, YMCA of Metropolitan Chicago; formerly: Senior Partner, Arthur Andersen LLP (accounting) (1966–2001); Trustee, Ravinia Festival | 103 | — | |
John W. Ballantine (1946) Board Member since 1999 | Retired; formerly, Executive Vice President and Chief Risk Management Officer, First Chicago NBD Corporation/The First National Bank of Chicago (1996–1998); Executive Vice President and Head of International Banking (1995–1996); former Directorships: Stockwell Capital Investments PLC (private equity); First Oak Brook Bancshares, Inc. and Oak Brook Bank; Prisma Energy International | 103 | Chairman of the Board, Healthways, Inc.2 (provider of disease and care management services) (2003– present); Portland General Electric2 (utility company) (2003– present) | |
Henry P. Becton, Jr. (1943) Board Member since 1990 | Vice Chair and former President, WGBH Educational Foundation. Directorships: Public Radio International; Public Radio Exchange (PRX); North Bennett Street School (Boston); former Directorships: The PBS Foundation; Association of Public Television Stations; Boston Museum of Science; American Public Television; Concord Academy; New England Aquarium; Mass. Corporation for Educational Telecommunications; Committee for Economic Development; Public Broadcasting Service; Connecticut College | 103 | Lead Director, Becton Dickinson and Company2 (medical technology company); Lead Director, Belo Corporation2 (media company) | |
Dawn-Marie Driscoll (1946) Board Member since 1987 | President, Driscoll Associates (consulting firm); Emeritus Executive Fellow, Center for Business Ethics, Bentley University; formerly, Partner, Palmer & Dodge (1988–1990); Vice President of Corporate Affairs and General Counsel, Filene's (1978–1988). Directorships: Director of ICI Mutual Insurance Company (since 2007); Advisory Board, Center for Business Ethics, Bentley University; Chairman of the Board of Trustees, Southwest Florida Community Foundation (charitable organization); former Directorships: Sun Capital Advisers Trust (mutual funds) (2007–2012), Investment Company Institute (audit, executive, nominating committees) and Independent Directors Council (governance, executive committees) | 103 | — | |
Keith R. Fox, CFA (1954) Board Member since 1996 | Managing General Partner, Exeter Capital Partners (a series of private investment funds) (since 1986). Directorships: Progressive International Corporation (kitchen goods importer and distributor); The Kennel Shop (retailer); former Chairman, National Association of Small Business Investment Companies; former Directorships: BoxTop Media Inc. (advertising); Sun Capital Advisers Trust (mutual funds) (2011–2012) | 103 | — | |
Paul K. Freeman (1950) Board Member since 1993 | Consultant, World Bank/Inter-American Development Bank; Executive and Governing Council of the Independent Directors Council (Chairman of Education Committee); formerly: Project Leader, International Institute for Applied Systems Analysis (1998–2001); Chief Executive Officer, The Eric Group, Inc. (environmental insurance) (1986–1998); Directorships: Denver Zoo Foundation (December 2012–present); former Directorships: Prisma Energy International | 103 | — | |
Richard J. Herring (1946) Board Member since 1990 | Jacob Safra Professor of International Banking and Professor, Finance Department, The Wharton School, University of Pennsylvania (since July 1972); Co-Director, Wharton Financial Institutions Center (since July 2000); Co-Chair, U.S. Shadow Financial Regulatory Committee; Executive Director, Financial Economists Roundtable; formerly: Vice Dean and Director, Wharton Undergraduate Division (July 1995–June 2000); Director, Lauder Institute of International Management Studies (July 2000–June 2006) | 103 | Director, Japan Equity Fund, Inc. (since September 2007), Thai Capital Fund, Inc. (since 2007), Singapore Fund, Inc. (since September 2007), Independent Director of Barclays Bank Delaware (since September 2010) | |
Rebecca W. Rimel (1951) Board Member since 1995 | President and Chief Executive Officer, The Pew Charitable Trusts (charitable organization) (1994 to present); formerly: Executive Vice President, The Glenmede Trust Company (investment trust and wealth management) (1983–2004); Board Member, Investor Education (charitable organization) (2004–2005); Trustee, Executive Committee, Philadelphia Chamber of Commerce (2001–2007); Director, Viasys Health Care2 (January 2007–June 2007); Trustee, Thomas Jefferson Foundation (charitable organization) (1994–2012) | 103 | Director, Becton Dickinson and Company2 (medical technology company) (2012– present); Director, CardioNet, Inc.2 (health care) (2009– present) | |
William N. Searcy, Jr. (1946) Board Member since 1993 | Private investor since October 2003; formerly: Pension & Savings Trust Officer, Sprint Corporation2 (telecommunications) (November 1989–September 2003); Trustee, Sun Capital Advisers Trust (mutual funds) (1998–2012) | 103 | — | |
Jean Gleason Stromberg (1943) Board Member since 1997 | Retired. Formerly, Consultant (1997–2001); Director, Financial Markets U.S. Government Accountability Office (1996–1997); Partner, Fulbright & Jaworski, L.L.P. (law firm) (1978–1996). Directorships: The William and Flora Hewlett Foundation; former Directorships: Service Source, Inc., Mutual Fund Directors Forum (2002–2004), American Bar Retirement Association (funding vehicle for retirement plans) (1987–1990 and 1994–1996) | 103 | — | |
Robert H. Wadsworth (1940) Board Member since 1999 | President, Robert H. Wadsworth & Associates, Inc. (consulting firm) (1983 to present); Director, National Horizon, Inc. (non-profit organization); Director and Treasurer, The Phoenix Boys Choir Association | 106 | — | |
Officers4 | ||
Name, Year of Birth, Position with the Fund and Length of Time Served5 | Business Experience and Directorships During the Past Five Years | |
Brian E. Binder8,9 (1972) President and Chief Executive Officer, 2013–present | Managing Director3 and Head of Fund Administration, Deutsche Asset & Wealth Management (2013–present); formerly: Head of Business Management and Consulting at Invesco, Ltd. (2010–2012); Chief Administrative Officer, Van Kampen Funds Inc. (2008–2010); and Chief Administrative Officer, Morgan Stanley Investment Management Americas Distribution (2003–2008) | |
John Millette7 (1962) Vice President and Secretary, 1999–present | Director,3 Deutsche Asset & Wealth Management | |
Paul H. Schubert6 (1963) Chief Financial Officer, 2004–present Treasurer, 2005–present | Managing Director,3 Deutsche Asset & Wealth Management (since July 2004); formerly: Executive Director, Head of Mutual Fund Services and Treasurer for UBS Family of Funds (1998–2004); Vice President and Director of Mutual Fund Finance at UBS Global Asset Management (1994–1998) | |
Caroline Pearson7 (1962) Chief Legal Officer, 2010–present | Managing Director,3 Deutsche Asset & Wealth Management; formerly: Assistant Secretary for DWS family of funds (1997–2010) | |
Melinda Morrow6 (1970) Vice President, 2012–present | Director,3 Deutsche Asset & Wealth Management | |
Hepsen Uzcan7 (1974) Assistant Secretary, 2013–present | Vice President, Deutsche Asset & Wealth Management | |
Paul Antosca7 (1957) Assistant Treasurer, 2007–present | Director,3 Deutsche Asset & Wealth Management | |
Jack Clark7 (1967) Assistant Treasurer, 2007–present | Director,3 Deutsche Asset & Wealth Management | |
Diane Kenneally7 (1966) Assistant Treasurer, 2007–present | Director,3 Deutsche Asset & Wealth Management | |
John Caruso6 (1965) Anti-Money Laundering Compliance Officer, 2010–present | Managing Director,3 Deutsche Asset & Wealth Management | |
Robert Kloby6 (1962) Chief Compliance Officer, 2006–present | Managing Director,3 Deutsche Asset & Wealth Management | |
1 The length of time served represents the year in which the Board Member joined the board of one or more DWS funds currently overseen by the Board.
2 A publicly held company with securities registered pursuant to Section 12 of the Securities Exchange Act of 1934.
3 Executive title, not a board directorship.
4 As a result of their respective positions held with the Advisor, these individuals are considered "interested persons" of the Advisor within the meaning of the 1940 Act. Interested persons receive no compensation from the fund.
5 The length of time served represents the year in which the officer was first elected in such capacity for one or more DWS funds.
6 Address: 60 Wall Street, New York, NY 10005.
7 Address: One Beacon Street, Boston, MA 02108.
8 Address: 222 South Riverside Plaza, Chicago, IL 60606.
9 Effective as of December 1, 2013.
The fund's Statement of Additional Information ("SAI") includes additional information about the Board Members. The SAI is available, without charge, upon request. If you would like to request a copy of the SAI, you may do so by calling the following toll-free number: (800) 728-3337.
DWS Investments Distributors, Inc.
222 South Riverside Plaza
Chicago, IL 60606
(800) 621-1148
VS2GIB-2 (R-025825-3 2/14)
December 31, 2013
Annual Report
DWS Variable Series II
DWS Government & Agency Securities VIP
Contents
3 Performance Summary 4 Management Summary 5 Portfolio Summary 6 Investment Portfolio 11 Statement of Assets and Liabilities 12 Statement of Operations 12 Statement of Changes in Net Assets 14 Financial Highlights 15 Notes to Financial Statements 23 Report of Independent Registered Public Accounting Firm 24 Information About Your Fund's Expenses 25 Tax Information 25 Proxy Voting 26 Advisory Agreement Board Considerations and Fee Evaluation 29 Board Members and Officers |
This report must be preceded or accompanied by a prospectus. To obtain an additional prospectus or summary prospectus, if available, call (800) 728-3337 or your financial representative. We advise you to consider the Fund's objectives, risks, charges and expenses carefully before investing. The summary prospectus and prospectus contain this and other important information about the Fund. Please read the prospectus carefully before you invest.
Bond investments are subject to interest-rate and credit risks. When interest rates rise, bond prices generally fall. Credit risk refers to the ability of an issuer to make timely payments of principal and interest. Investing in derivatives entails special risks relating to liquidity, leverage and credit that may reduce returns and/or increase volatility. The Fund may lend securities to approved institutions. The "full faith and credit" guarantee of the U.S. government applies to the timely repayment of interest, and does not eliminate market risk. Because of the rising U.S. government debt burden, it is possible that the U.S. government may not be able to meet its financial obligations or that securities issued by the U.S. government may experience credit downgrades. See the prospectus for details.
DWS Investments is part of the Deutsche Asset & Wealth Management division of Deutsche Bank AG.
NOT FDIC/NCUA INSURED NO BANK GUARANTEE MAY LOSE VALUE NOT A DEPOSIT
NOT INSURED BY ANY FEDERAL GOVERNMENT AGENCY
Fund performance shown is historical, assumes reinvestment of all dividend and capital gain distributions and does not guarantee future results. Investment return and principal value fluctuate with changing market conditions so that, when redeemed, shares may be worth more or less than their original cost. Current performance may be lower or higher than the performance data quoted. Please contact your participating insurance company for the Fund's most recent month-end performance. Performance doesn't reflect charges and fees ("contract charges") associated with the separate account that invests in the Fund or any variable life insurance policy or variable annuity contract for which the Fund is an investment option. These charges and fees will reduce returns. While all share classes have the same underlying portfolio, their performance will differ.
The gross expense ratios of the Fund, as stated in the fee table of the prospectus dated May 1, 2013 are 0.68% and 1.03% for Class A and Class B shares, respectively, and may differ from the expense ratios disclosed in the Financial Highlights tables in this report.
| Growth of an Assumed $10,000 Investment in DWS Government & Agency Securities VIP | ||
 | The Barclays GNMA Index is an unmanaged, market-value-weighted measure of all fixed-rate securities backed by mortgage pools of the Government National Mortgage Association. Index returns do not reflect any fees or expenses and it is not possible to invest directly into an index. | |
 | ||
| Yearly periods ended December 31 | ||
| Comparative Results | |||||||||||||||||
| DWS Government & Agency Securities VIP | 1-Year | 3-Year | 5-Year | 10-Year | |||||||||||||
| Class A | Growth of $10,000 | $ | 9,696 | $ | 10,724 | $ | 12,357 | $ | 15,230 | ||||||||
| Average annual total return | –3.04 | % | 2.36 | % | 4.32 | % | 4.30 | % | |||||||||
| Barclays GNMA Index | Growth of $10,000 | $ | 9,788 | $ | 10,817 | $ | 12,159 | $ | 15,807 | ||||||||
| Average annual total return | –2.12 | % | 2.65 | % | 3.99 | % | 4.69 | % | |||||||||
| DWS Government & Agency Securities VIP | 1-Year | 3-Year | 5-Year | 10-Year | |||||||||||||
| Class B | Growth of $10,000 | $ | 9,675 | $ | 10,624 | $ | 12,156 | $ | 14,697 | ||||||||
| Average annual total return | –3.25 | % | 2.04 | % | 3.98 | % | 3.93 | % | |||||||||
| Barclays GNMA Index | Growth of $10,000 | $ | 9,788 | $ | 10,817 | $ | 12,159 | $ | 15,807 | ||||||||
| Average annual total return | –2.12 | % | 2.65 | % | 3.99 | % | 4.69 | % | |||||||||
The growth of $10,000 is cumulative.
During the 12-month period ended December 31, 2013, the Fund provided a total return of –3.04% (Class A shares, unadjusted for contract charges) compared with the –2.12% return of its benchmark, the Barclays GNMA Index.1
During the period, the U.S. Federal Reserve Board (the Fed) continued to maintain its benchmark short-term rate at or near zero levels and to engage in bond purchases designed to lower longer-term interest rates as it sought to stimulate economic growth. Longer-term U.S. Treasury yields stayed within a fairly narrow range for the first few months of 2013 as investors attempted to assess mixed economic data. As the period progressed, economic data strengthened and there was increasing speculation that a reduction in Fed bond purchases was imminent. As a result, interest rates mostly drifted higher from May through December 2013. The year finished on a note of optimism for the economy, as third-quarter GDP growth was revised upward to a robust 4.1% and a bipartisan deal was reached on the U.S. budget. GNMAs were negatively impacted by rising rates and modestly lagged comparable-maturity U.S. Treasuries for the period.
The Fund continued to have significant exposure to higher-coupon mortgage pools. While price performance on these holdings was mixed, our focus on seasoned and low-balance mortgage pools with characteristics that defend against increasing prepayments helped maintain the Fund's income stream. We had a meaningful position in interest-only securities in the belief that voluntary prepayments, will remain manageable. Interest-only securities are particularly vulnerable to rising prepayments, as the investor is threatened with the loss of an income stream without receiving any return of principal. This allocation worked well as interest rates rose and prepayment fears eased. The Fund was positioned with an overall duration and corresponding interest-rate sensitivity above that of the benchmark for much of the period, which held back returns as rates rose. With inflation remaining below-target, there would not appear to be any substantive reason for the Fed to initiate a rapid reversal in policy. Nonetheless, given market jitters about the direction of the economy and Fed policy, we expect there will be opportunities to add value in security selection on volatility. With mortgage rates likely to be range-bound over the near term, we are comfortable with our focus on maximizing current income in the Fund. At the same time, we are keeping enough liquidity in the Fund to reposition fairly quickly should higher current mortgage rates become a durable trend.
William Chepolis, CFA
Portfolio Manager
The views expressed reflect those of the portfolio management team only through the end of the period of the report as stated on the cover. The management team's views are subject to change at any time based on market and other conditions and should not be construed as a recommendation. Past performance is no guarantee of future results. Current and future portfolio holdings are subject to risk.
1 The Barclays GNMA Index is an unmanaged, market-value-weighted measure of all fixed-rate securities backed by mortgage pools of the Government National Mortgage Association. Index returns do not reflect fees or expenses and it is not possible to invest directly into an index.
Asset Allocation (As a % of Investment Portfolio) | 12/31/13 | 12/31/12 |
| Mortgage-Backed Securities Pass-Throughs | 66% | 67% |
| Government & Agency Obligations | 15% | 17% |
| Collateralized Mortgage Obligations | 11% | 15% |
| Cash Equivalents | 8% | 1% |
| 100% | 100% |
| Coupons* | 12/31/13 | 12/31/12 |
| Less than 4.5% | 32% | 35% |
| 4.5%–5.49% | 43% | 37% |
| 5.5%–6.49% | 21% | 24% |
| 6.5%–7.49% | 3% | 3% |
| 7.5% and Greater | 1% | 1% |
| 100% | 100% |
| Interest Rate Sensitivity | 12/31/13 | 12/31/12 |
| Effective Maturity | 10.0 years | 7.0 years |
| Effective Duration | 6.3 years | 5.5 years |
* Excludes Cash Equivalents, U.S. Treasury Bills and Options Purchased.
Effective maturity is the weighted average of the maturity date of bonds held by the Fund taking into consideration any available maturity shortening features.
Effective duration is an approximate measure of the Fund's sensitivity to interest rate changes taking into consideration any maturity shortening features.
Portfolio holdings and characteristics are subject to change.
For more complete details about the Fund's investment portfolio, see page 6.
Following the Fund's fiscal first and third quarter-end, a complete portfolio holdings listing is filed with the SEC on Form N-Q. The form will be available on the SEC's Web site at sec.gov, and it also may be reviewed and copied at the SEC's Public Reference Room in Washington, D.C. Information on the operation of the SEC's Public Reference Room may be obtained by calling (800) SEC-0330. The Fund's portfolio holdings are also posted on dws-investments.com from time to time. Please see the Fund's current prospectus for more information.
| Principal Amount ($) | Value ($) | |||||||
| Mortgage-Backed Securities Pass-Throughs 89.4% | ||||||||
| Federal Home Loan Mortgage Corp., 3.5%, 3/1/2042 (a) | 11,000,000 | 10,910,625 | ||||||
| Federal National Mortgage Association, 3.5%, 3/1/2042 (a) | 10,000,000 | 9,942,188 | ||||||
| Government National Mortgage Association: | ||||||||
| 3.5%, with various maturities from 2/15/2043 until 3/20/2043 | 4,797,911 | 4,847,819 | ||||||
| 4.0%, with various maturities from 7/1/2040 until 6/20/2043 (a) | 3,112,797 | 3,242,575 | ||||||
| 4.5%, with various maturities from 6/20/2033 until 2/20/2043 (a) | 19,373,750 | 20,718,511 | ||||||
| 4.55%, 1/15/2041 | 419,228 | 449,252 | ||||||
| 4.625%, 5/15/2041 | 195,870 | 211,172 | ||||||
| 5.0%, with various maturities from 11/20/2032 until 4/15/2042 | 14,869,090 | 16,203,049 | ||||||
| 5.5%, with various maturities from 10/15/2032 until 7/20/2040 | 9,091,373 | 10,028,379 | ||||||
| 6.0%, with various maturities from 7/15/2014 until 5/15/2040 | 8,752,098 | 9,730,954 | ||||||
| 6.5%, with various maturities from 4/15/2031 until 2/15/2039 | 1,776,993 | 2,006,338 | ||||||
| 7.0%, with various maturities from 2/20/2027 until 11/15/2038 | 283,751 | 328,900 | ||||||
| 7.5%, 10/20/2031 | 7,672 | 9,114 | ||||||
Total Mortgage-Backed Securities Pass-Throughs (Cost $88,194,940) | 88,628,876 | |||||||
| Collateralized Mortgage Obligations 14.8% | ||||||||
| Federal Home Loan Mortgage Corp.: | ||||||||
| "OA", Series 3179, Principal Only, Zero Coupon, 7/15/2036 | 242,600 | 211,312 | ||||||
| "KO", Series 4180, Principal Only, Zero Coupon, 1/15/2043 | 1,429,793 | 790,678 | ||||||
| "KB", Series 4144, 2.5%, 12/15/2042 | 214,837 | 161,780 | ||||||
| "YI", Series 3936, Interest Only, 3.0%, 6/15/2025 | 120,845 | 9,803 | ||||||
| "AI", Series 4016, Interest Only, 3.0%, 9/15/2025 | 1,306,090 | 124,019 | ||||||
| "WI", Series 3939, Interest Only, 3.0%, 10/15/2025 | 477,818 | 42,647 | ||||||
| "EI", Series 3953, Interest Only, 3.0%, 11/15/2025 | 674,578 | 64,652 | ||||||
| "IO", Series 3974, Interest Only, 3.0%, 12/15/2025 | 210,025 | 21,335 | ||||||
| "DI", Series 4010, Interest Only, 3.0%, 2/15/2027 | 171,020 | 19,388 | ||||||
| "IP", Series 4046, Interest Only, 3.0%, 5/15/2027 | 475,634 | 59,081 | ||||||
| "IK", Series 4048, Interest Only, 3.0%, 5/15/2027 | 1,602,461 | 209,644 | ||||||
| "IA", Series 3800, Interest Only, 3.5%, 12/15/2022 | 185,689 | 949 | ||||||
| "IK", Series 3754, Interest Only, 3.5%, 6/15/2025 | 1,023,970 | 96,906 | ||||||
| Principal Amount ($) | Value ($) | |||||||
| "DZ", Series 4199, 3.5%, 5/15/2043 | 238,673 | 194,011 | ||||||
| "ZG", Series 4213, 3.5%, 6/15/2043 | 382,817 | 359,297 | ||||||
| "NI", Series 3657, Interest Only, 4.5%, 8/15/2027 | 384,238 | 11,373 | ||||||
| "22", Series 243, Interest Only, 4.571%*, 6/15/2021 | 630,540 | 43,505 | ||||||
| "PI", Series 2535, Interest Only, 6.0%, 9/15/2032 | 158,119 | 5,766 | ||||||
| "MI", Series 3871, Interest Only, 6.0%, 4/15/2040 | 164,772 | 29,319 | ||||||
| "A", Series 172, Interest Only, 6.5%, 1/1/2024 | 22,895 | 3,770 | ||||||
| "DS", Series 3199, Interest Only, 6.983%*, 8/15/2036 | 2,236,041 | 414,659 | ||||||
| "S", Series 2416, Interest Only, 7.933%*, 2/15/2032 | 306,916 | 64,780 | ||||||
| "ST", Series 2411, Interest Only, 8.583%*, 6/15/2021 | 900,913 | 97,312 | ||||||
| "KS", Series 2064, Interest Only, 9.983%*, 5/15/2022 | 309,694 | 63,049 | ||||||
| Federal National Mortgage Association: | ||||||||
| "DI", Series 2011-136, Interest Only, 3.0%, 1/25/2026 | 198,516 | 18,544 | ||||||
| "LZ", Series 2013-45, 3.0%, 5/25/2043 | 1,020,176 | 757,530 | ||||||
| "HI", Series 2010-123, Interest Only, 3.5%, 3/25/2024 | 386,292 | 27,175 | ||||||
| "KI", Series 2011-72, Interest Only, 3.5%, 3/25/2025 | 1,131,401 | 82,400 | ||||||
| ''IO", Series 2012-146, Interest Only, 3.5%, 1/25/2043 | 2,133,625 | 540,584 | ||||||
| "KZ", Series 2013-66, 3.5%, 7/25/2043 | 924,550 | 807,289 | ||||||
| "ZB", Series 2010-136, 4.0%, 12/25/2040 | 392,003 | 378,306 | ||||||
| "25", Series 351, Interest Only, 4.5%, 5/1/2019 | 176,467 | 14,993 | ||||||
| "HI", Series 2009-77, Interest Only, 4.5%, 9/25/2027 | 117,112 | 1,605 | ||||||
| "IN", Series 2003-49, Interest Only, 4.75%, 3/25/2018 | 997,742 | 41,222 | ||||||
| "21", Series 334, Interest Only, 5.0%, 3/1/2018 | 80,310 | 5,634 | ||||||
| "20", Series 334, Interest Only, 5.0%, 3/1/2018 | 122,855 | 8,846 | ||||||
| ''23", Series 339, Interest Only, 5.0%, 7/1/2018 | 176,411 | 11,798 | ||||||
| "26", Series 381, Interest Only, 5.0%, 12/25/2020 | 56,445 | 4,602 | ||||||
| "ZA", Series 2008-24, 5.0%, 4/25/2038 | 699,461 | 755,424 | ||||||
| "30", Series 381, Interest Only, 5.5%, 11/25/2019 | 318,814 | 30,228 | ||||||
| "PI", Series 2009-14, Interest Only, 5.5%, 3/25/2024 | 542,094 | 67,347 | ||||||
| "PJ", Series 2004-46, Interest Only, 5.835%*, 3/25/2034 | 395,207 | 54,483 | ||||||
| "WI", Series 2011-59, Interest Only, 6.0%, 5/25/2040 | 356,288 | 33,949 | ||||||
| "101", Series 383, Interest Only, 6.5%, 9/1/2022 | 1,075,638 | 152,375 | ||||||
| "SJ", Series 2007-36, Interest Only, 6.605%*, 4/25/2037 | 222,701 | 31,890 | ||||||
| "KI", Series 2005-65, Interest Only, 6.835%*, 8/25/2035 | 104,757 | 19,503 | ||||||
| Principal Amount ($) | Value ($) | |||||||
| "ES", Series 2003-17, Interest Only, 6.885%*, 9/25/2022 | 168,505 | 1,058 | ||||||
| "SA", Series G92-57, IOette, 83.283%*, 10/25/2022 | 38,803 | 73,121 | ||||||
| Government National Mortgage Association: | ||||||||
| "IE", Series 2011-128, Interest Only, 3.5%, 9/20/2026 | 947,893 | 122,468 | ||||||
| "JY", Series 2010-20, 4.0%, 12/20/2033 | 2,013,839 | 2,092,873 | ||||||
| "LI", Series 2009-104, Interest Only, 4.5%, 12/16/2018 | 229,151 | 17,479 | ||||||
| "NI", Series 2010-44, Interest Only, 4.5%, 10/20/2037 | 600,193 | 62,818 | ||||||
| "CI", Series 2010-87, Interest Only, 4.5%, 11/20/2038 | 1,251,588 | 331,327 | ||||||
| "MI", Series 2010-169, Interest Only, 4.5%, 8/20/2040 | 805,185 | 151,710 | ||||||
| "AI", Series 2012-15, Interest Only, 4.5%, 9/20/2040 | 594,593 | 158,588 | ||||||
| "GZ", Series 2005-24, 5.0%, 3/20/2035 | 518,387 | 541,715 | ||||||
| "MI", Series 2009-76, Interest Only, 5.0%, 3/20/2035 | 307,124 | 4,001 | ||||||
| "ZA", Series 2005-75, 5.0%, 10/16/2035 | 583,177 | 618,242 | ||||||
| "MZ", Series 2009-98, 5.0%, 10/16/2039 | 1,046,427 | 1,111,377 | ||||||
| "Z", Series 2009-112, 5.0%, 11/20/2039 | 1,225,982 | 1,336,323 | ||||||
| "AI", Series 2008-51, Interest Only, 5.5%, 5/16/2023 | 458,452 | 38,040 | ||||||
| "AI", Series 2008-46, Interest Only, 5.5%, 5/16/2023 | 239,946 | 21,173 | ||||||
| "GI", Series 2003-19, Interest Only, 5.5%, 3/16/2033 | 833,289 | 166,321 | ||||||
| "IB", Series 2010-130, Interest Only, 5.5%, 2/20/2038 | 269,221 | 49,832 | ||||||
| "BS", Series 2011-93, Interest Only, 5.933%*, 7/16/2041 | 1,260,521 | 184,536 | ||||||
| "DI", Series 2009-10, Interest Only, 6.0%, 4/16/2038 | 329,398 | 64,832 | ||||||
| "SA", Series 2012-84, Interest Only, 6.133%*, 12/20/2038 | 1,472,581 | 248,546 | ||||||
| "QA", Series 2007-57, Interest Only, 6.333%*, 10/20/2037 | 337,473 | 50,405 | ||||||
| "IP", Series 2009-118, Interest Only, 6.5%, 12/16/2039 | 103,015 | 23,379 | ||||||
| "IC", Series 1997-4, Interest Only, 7.5%, 3/16/2027 | 587,952 | 150,723 | ||||||
| "SK", Series 2003-11, Interest Only, 7.533%*, 2/16/2033 | 511,987 | 100,586 | ||||||
Total Collateralized Mortgage Obligations (Cost $14,113,577) | 14,666,235 | |||||||
| Principal Amount ($) | Value ($) | |||||||
| Government & Agency Obligations 20.9% | ||||||||
| U.S. Government Sponsored Agency 10.1% | ||||||||
| Federal Home Loan Bank, 1.0%, 6/21/2017 | 10,000,000 | 9,979,029 | ||||||
| U.S. Treasury Obligations 10.8% | ||||||||
| U.S. Treasury Bill, 0.02%**, 2/13/2014 (b) | 1,045,000 | 1,044,984 | ||||||
| U.S. Treasury Bond, 2.875%, 5/15/2043 | 4,500,000 | 3,647,111 | ||||||
| U.S. Treasury Notes: | ||||||||
| 0.75%, 6/15/2014 (c) | 550,000 | 551,590 | ||||||
| 1.0%, 8/31/2016 | 3,450,000 | 3,482,344 | ||||||
| 2.75%, 11/15/2023 | 2,000,000 | 1,956,562 | ||||||
| 10,682,591 | ||||||||
Total Government & Agency Obligations (Cost $20,977,515) | 20,661,620 | |||||||
| Contract Amount | Value ($) | |||||||
| Call Options Purchased 0.5% | ||||||||
| Options on Interest Rate Swap Contracts | ||||||||
Pay Fixed Rate — 3.72% – Receive Floating — LIBOR, Swap Expiration Date 4/22/2026, Option Expiration Date 4/20/20161 | 2,600,000 | 172,036 | ||||||
Pay Fixed Rate — 4.32% – Receive Floating — LIBOR, Swap Expiration Date 2/3/2027, Option Expiration Date 2/1/20172 | 6,000,000 | 347,112 | ||||||
Total Call Options Purchased (Cost $390,446) | 519,148 | |||||||
| Put Options Purchased 0.0% | ||||||||
| Options on Interest Rate Swap Contracts | ||||||||
Receive Fixed Rate — 2.32% – Pay Floating — LIBOR, Swap Expiration Date 2/3/2027, Option Expiration Date 2/1/20172 (Cost $203,884) | 6,000,000 | 32,291 | ||||||
| Shares | Value ($) | |||||||
| Cash Equivalents 11.2% | ||||||||
| Central Cash Management Fund, 0.05% (d) (Cost $11,122,156) | 11,122,156 | 11,122,156 | ||||||
| % of Net Assets | Value ($) | |||||||
Total Investment Portfolio (Cost $135,002,518)† | 136.8 | 135,630,326 | ||||||
| Other Assets and Liabilities, Net | (36.8 | ) | (36,459,231 | ) | ||||
| Net Assets | 100.0 | 99,171,095 | ||||||
* These securities are shown at their current rate as of December 31, 2013.
** Annualized yield at time of purchase; not a coupon rate.
† The cost for federal income tax purposes was $135,065,809. At December 31, 2013, net unrealized appreciation for all securities based on tax cost was $564,517. This consisted of aggregate gross unrealized appreciation for all securities in which there was an excess of value over tax cost of $3,440,975 and aggregate gross unrealized depreciation for all securities in which there was an excess of tax cost over value of $2,876,458.
(a) When-issued or delayed delivery securities included.
(b) At December 31, 2013, this security has been pledged, in whole or in part, to cover initial margin requirements for open futures contracts.
(c) At December 31, 2013, this security has been pledged, in whole or in part, as collateral for open swap contracts.
(d) Affiliated fund managed by Deutsche Investment Management Americas Inc. The rate shown is the annualized seven-day yield at period end.
Interest Only: Interest Only (IO) bonds represent the "interest only" portion of payments on a pool of underlying mortgages or mortgage-backed securities. IO securities are subject to prepayment risk of the pool of underlying mortgages.
IOettes: These securities represent the right to receive interest payments on an underlying pool of mortgages with similar features as those associated with IO securities. Unlike IO's, a nominal amount of principal is assigned to an IOette which is small in relation to the interest flow that constitutes almost all of the IOette cash flow. The effective yield of this security is lower than the stated interest rate.
LIBOR: London Interbank Offered Rate
Principal Only: Principal Only (PO) bonds represent the "principal only" portion of payments on a pool of underlying mortgages or mortgage-backed securities.
Included in the portfolio are investments in mortgage- or asset-backed securities which are interests in separate pools of mortgages or assets. Effective maturities of these investments may be shorter than stated maturities due to prepayments. Some separate investments in the Government National Mortgage Association issues which have similar coupon rates have been aggregated for presentation purposes in this investment portfolio.
At December 31, 2013, open futures contracts purchased were as follows:
| Futures | Currency | Expiration Date | Contracts | Notional Value ($) | Unrealized Depreciation ($) | |||||||||
| 10 Year Interest Rate Swap | USD | 3/17/2014 | 35 | 3,526,250 | (2,258 | ) | ||||||||
| 10 Year U.S. Treasury Note | USD | 3/20/2014 | 125 | 15,380,859 | (217,588 | ) | ||||||||
| Ultra Long U.S. Treasury Bond | USD | 3/20/2014 | 25 | 3,406,250 | (53,175 | ) | ||||||||
| Total unrealized depreciation | (273,021 | ) | ||||||||||||
At December 31, 2013, open futures contracts sold were as follows:
| Futures | Currency | Expiration Date | Contracts | Notional Value ($) | Unrealized Appreciation ($) | |||||||||
| 5 Year U.S. Treasury Note | USD | 3/31/2014 | 47 | 5,607,688 | 9,443 | |||||||||
| Currency Abbreviation |
| USD United States Dollar |
At December 31, 2013, open written options contracts were as follows:
| Options on Interest Rate Swap Contracts | Swap Effective/ Expiration Date | Contract Amount | Option Expiration Date | Premiums Received ($) | Value ($) (e) | |||||||||
Call Options Receive Fixed — 3.32% – Pay Floating — LIBOR | 2/3/2017 2/3/2027 | 3,000,000 | 2 | 2/1/2017 | 216,991 | (317,919 | ) | |||||||
| Receive Fixed — 4.064% – Pay Floating — LIBOR | 5/13/2014 5/13/2044 | 2,400,000 | 1 | 5/9/2014 | 17,700 | (55,854 | ) | |||||||
| Receive Fixed — 4.22% – Pay Floating — LIBOR | 4/22/2016 4/22/2026 | 2,600,000 | 1 | 4/20/2016 | 92,690 | (118,030 | ) | |||||||
| Receive Fixed — 5.132% – Pay Floating — LIBOR | 3/17/2016 3/17/2026 | 2,400,000 | 1 | 3/15/2016 | 17,340 | (45,923 | ) | |||||||
| Receive Fixed — 5.132% – Pay Floating — LIBOR | 3/17/2016 3/17/2026 | 2,400,000 | 2 | 3/15/2016 | 28,320 | (45,923 | ) | |||||||
| Total Call Options | 373,041 | (583,649 | ) | |||||||||||
Put Options Pay Fixed — 1.132% – Receive Floating — LIBOR | 3/17/2016 3/17/2026 | 2,400,000 | 1 | 3/15/2016 | 17,340 | (837 | ) | |||||||
| Pay Fixed — 1.132% – Receive Floating — LIBOR | 3/17/2016 3/17/2026 | 2,400,000 | 2 | 3/15/2016 | 6,120 | (837 | ) | |||||||
| Pay Fixed — 2.064% – Receive Floating — LIBOR | 5/13/2014 5/13/2044 | 2,400,000 | 1 | 5/9/2014 | 17,700 | (2 | ) | |||||||
| Pay Fixed — 2.385% – Receive Floating — LIBOR | 3/31/2014 3/31/2044 | 2,400,000 | 3 | 3/27/2014 | 32,760 | (1 | ) | |||||||
| Pay Fixed — 2.423% – Receive Floating — LIBOR | 3/20/2014 3/20/2044 | 2,400,000 | 4 | 3/18/2014 | 34,560 | (1 | ) | |||||||
| Pay Fixed — 3.033% – Receive Floating — LIBOR | 10/24/2014 10/24/2044 | 1,900,000 | 5 | 10/22/2014 | 24,130 | (5,913 | ) | |||||||
| Pay Fixed — 3.093% – Receive Floating — LIBOR | 10/21/2014 10/21/2044 | 1,900,000 | 2 | 10/17/2014 | 26,220 | (6,928 | ) | |||||||
| Pay Fixed — 3.32% – Receive Floating — LIBOR | 2/3/2017 2/3/2027 | 3,000,000 | 2 | 2/1/2017 | 216,990 | (57,429 | ) | |||||||
| Total Put Options | 375,820 | (71,948 | ) | |||||||||||
| Total | 748,861 | (655,597 | ) | |||||||||||
(e) Unrealized appreciation on written options on interest rate swap contracts at December 31, 2013 was $93,264.
At December 31, 2013, open interest rate swap contracts were as follows:
| Centrally Cleared Swaps | ||||||||||||||
Effective/ Expiration Dates | Notional Amount ($) | Cash Flows Paid by the Fund | Cash Flows Received by the Fund | Value ($) | Unrealized Appreciation/ (Depreciation) ($) | |||||||||
12/30/2014 12/30/2016 | 23,200,000 | Fixed — 1.173% | Floating — LIBOR | (12,108 | ) | (15,005 | ) | |||||||
12/30/2014 12/30/2019 | 400,000 | Fixed — 2.522% | Floating — LIBOR | 290 | (83 | ) | ||||||||
12/30/2014 12/30/2030 | 1,400,000 | Fixed — 4.081% | Floating — LIBOR | 12,534 | (12,466 | ) | ||||||||
12/30/2014 12/30/2034 | 1,600,000 | Fixed — 4.01% | Floating — LIBOR | 10,422 | 9,935 | |||||||||
5/13/2014 5/13/2044 | 2,400,000 | Fixed — 4.064% | Floating — LIBOR | (27,819 | ) | 269 | ||||||||
| Total net unrealized depreciation | (17,350 | ) | ||||||||||||
| Bilateral Swaps | ||||||||||||||||||
Effective/ Expiration Dates | Notional Amount ($) | Cash Flows Paid by the Fund | Cash Flows Received by the Fund | Value ($) | Upfront Payments Paid/ (Received) ($) | Unrealized Depreciation ($) | ||||||||||||
6/3/2013 6/3/2025 | 2,300,000 | 1 | Floating — LIBOR | Fixed — 3.0% | (104,100 | ) | — | (104,100 | ) | |||||||||
Counterparties:
1 Nomura International PLC
2 BNP Paribas
3 Barclays Bank PLC
4 JPMorgan Chase Securities, Inc.
5 Citigroup, Inc.
For information on the Fund's policy and additional disclosures regarding futures contracts, purchased and written options contracts, and interest rate swap contracts, please refer to the Derivatives section of Note B in the accompanying Notes to Financial Statements.
Fair Value Measurements
Various inputs are used in determining the value of the Fund's investments. These inputs are summarized in three broad levels. Level 1 includes quoted prices in active markets for identical securities. Level 2 includes other significant observable inputs (including quoted prices for similar securities, interest rates, prepayment speeds and credit risk). Level 3 includes significant unobservable inputs (including the Fund's own assumptions in determining the fair value of investments). The level assigned to the securities valuations may not be an indication of the risk or liquidity associated with investing in those securities.
The following is a summary of the inputs used as of December 31, 2013 in valuing the Fund's investments. For information on the Fund's policy regarding the valuation of investments, please refer to the Security Valuation section of Note A in the accompanying Notes to Financial Statements.
| Assets | Level 1 | Level 2 | Level 3 | Total | ||||||||||||
| Fixed-Income Investments (f) | ||||||||||||||||
| Mortgage-Backed Securities Pass-Throughs | $ | — | $ | 88,628,876 | $ | — | $ | 88,628,876 | ||||||||
| Collateralized Mortgage Obligations | — | 14,666,235 | — | 14,666,235 | ||||||||||||
| Government & Agency Obligations | — | 20,661,620 | — | 20,661,620 | ||||||||||||
| Short-Term Investments | 11,122,156 | — | — | 11,122,156 | ||||||||||||
| Derivatives (g) | ||||||||||||||||
| Purchased Options | — | 551,439 | — | 551,439 | ||||||||||||
| Futures Contracts | 9,443 | — | — | 9,443 | ||||||||||||
| Interest Rate Swap Contracts | — | 10,204 | — | 10,204 | ||||||||||||
| Total | $ | 11,131,599 | $ | 124,518,374 | $ | — | $ | 135,649,973 | ||||||||
| Liabilities | Level 1 | Level 2 | Level 3 | Total | ||||||||||||
Derivatives (g) | ||||||||||||||||
| Futures Contracts | $ | (273,021 | ) | $ | — | $ | — | $ | (273,021 | ) | ||||||
| Written Options | — | (655,597 | ) | — | (655,597 | ) | ||||||||||
| Interest Rate Swap Contracts | — | (131,654 | ) | — | (131,654 | ) | ||||||||||
| Total | $ | (273,021 | ) | $ | (787,251 | ) | $ | — | $ | (1,060,272 | ) | |||||
There have been no transfers between fair value measurement levels during the year ended December 31, 2013.
(f) See Investment Portfolio for additional detailed categorizations.
(g) Derivatives include value of purchased options, unrealized appreciation (depreciation) on open futures contracts and interest rate swap contracts, and written options, at value.
The accompanying notes are an integral part of the financial statements.
| as of December 31, 2013 | ||||
| Assets | ||||
Investments Investments in non-affiliated securities, at value (cost $123,880,362) | $ | 124,508,170 | ||
| Investment in Central Cash Management Fund (cost $11,122,156) | 11,122,156 | |||
| Total investments in securities, at value (cost $135,002,518) | 135,630,326 | |||
| Receivable for investments sold — when-issued/delayed delivery securities | 50,401,598 | |||
| Receivable for Fund shares sold | 175,090 | |||
| Interest receivable | 455,797 | |||
| Receivable for variation margin on centrally cleared swaps | 42,045 | |||
| Other assets | 3,820 | |||
| Total assets | 186,708,676 | |||
| Liabilities | ||||
| Cash overdraft | 23,354 | |||
| Payable for investments purchased | 1,966,051 | |||
| Payable for investments purchased — when-issued/delayed delivery securities | 84,643,669 | |||
| Payable for Fund shares redeemed | 5,279 | |||
| Payable for variation margin on futures contracts | 49,276 | |||
| Options written, at value (premium received $748,861) | 655,597 | |||
| Unrealized depreciation on bilateral swap contracts | 104,100 | |||
| Accrued management fee | 38,387 | |||
| Net payable for pending swap contracts | 15,104 | |||
| Accrued Trustees' fees | 2,053 | |||
| Other accrued expenses and payables | 34,711 | |||
| Total liabilities | 87,537,581 | |||
| Net assets, at value | $ | 99,171,095 | ||
| Net Assets Consist of | ||||
| Undistributed net investment income | 2,192,301 | |||
Unrealized appreciation (depreciation) on: Investments | 627,808 | |||
| Swap contracts | (121,450 | ) | ||
| Futures | (263,578 | ) | ||
| Written options | 93,264 | |||
| Accumulated net realized gain (loss) | (109,916 | ) | ||
| Paid-in capital | 96,752,666 | |||
| Net assets, at value | $ | 99,171,095 | ||
Class A Net Asset Value, offering and redemption price per share ($95,537,931 ÷ 8,328,640 outstanding shares of beneficial interest, no par value, unlimited number of shares authorized) | $ | 11.47 | ||
Class B Net Asset Value, offering and redemption price per share ($3,633,164 ÷ 317,145 outstanding shares of beneficial interest, no par value, unlimited number of shares authorized) | $ | 11.46 | ||
The accompanying notes are an integral part of the financial statements.
Statement of Operations
| for the year ended December 31, 2013 | ||||
| Investment Income | ||||
Income: Interest | $ | 3,054,500 | ||
| Income distributions — Central Cash Management Fund | 3,745 | |||
| Securities lending income, including income from Daily Assets Fund Institutional, net of borrower rebates | 105 | |||
| Total income | 3,058,350 | |||
Expenses: Management fee | 505,764 | |||
| Administration fee | 112,392 | |||
| Services to shareholders | 1,402 | |||
| Distribution service fees (Class B) | 11,046 | |||
| Record keeping fees (Class B) | 4,368 | |||
| Custodian fee | 36,775 | |||
| Audit and tax fees | 70,340 | |||
| Legal fees | 9,881 | |||
| Reports to shareholders | 35,041 | |||
| Trustees' fees and expenses | 5,725 | |||
| Other | 16,334 | |||
| Total expenses before expense reductions | 809,068 | |||
| Expense reductions | (44,510 | ) | ||
| Total expenses after expense reductions | 764,558 | |||
| Net investment income | 2,293,792 | |||
| Realized and Unrealized Gain (Loss) | ||||
Net realized gain (loss) from: Investments | (203,996 | ) | ||
| Swap contracts | 626,170 | |||
| Futures | (719,550 | ) | ||
| Written options | 177,488 | |||
| (119,888 | ) | |||
Change in net unrealized appreciation (depreciation) on: Investments | (5,313,133 | ) | ||
| Swap contracts | 221,465 | |||
| Securities sold short | (129,707 | ) | ||
| Futures | (241,740 | ) | ||
| Written options | (232,998 | ) | ||
| (5,696,113 | ) | |||
| Net gain (loss) | (5,816,001 | ) | ||
| Net increase (decrease) in net assets resulting from operations | $ | (3,522,209 | ) | |
The accompanying notes are an integral part of the financial statements.
| Years Ended December 31, | ||||||||
| Increase (Decrease) in Net Assets | 2013 | 2012 | ||||||
Operations: Net investment income | $ | 2,293,792 | $ | 3,586,409 | ||||
| Net realized gain (loss) | (119,888 | ) | 4,527,418 | |||||
| Change in net unrealized appreciation (depreciation) | (5,696,113 | ) | (4,180,279 | ) | ||||
| Net increase (decrease) in net assets resulting from operations | (3,522,209 | ) | 3,933,548 | |||||
Distributions to shareholders from: Net investment income: Class A | (3,325,537 | ) | (5,435,920 | ) | ||||
| Class B | (119,146 | ) | (209,154 | ) | ||||
Net realized gain: Class A | (4,523,083 | ) | (2,952,755 | ) | ||||
| Class B | (185,024 | ) | (124,749 | ) | ||||
| Total distributions | (8,152,790 | ) | (8,722,578 | ) | ||||
Fund share transactions: Class A Proceeds from shares sold | 9,306,924 | 18,065,811 | ||||||
| Reinvestment of distributions | 7,848,620 | 8,388,675 | ||||||
| Payments for shares redeemed | (31,059,765 | ) | (47,401,824 | ) | ||||
| Net increase (decrease) in net assets from Class A share transactions | (13,904,221 | ) | (20,947,338 | ) | ||||
Class B Proceeds from shares sold | 311,619 | 919,743 | ||||||
| Reinvestment of distributions | 304,170 | 333,903 | ||||||
| Payments for shares redeemed | (1,961,191 | ) | (2,329,903 | ) | ||||
| Net increase (decrease) in net assets from Class B share transactions | (1,345,402 | ) | (1,076,257 | ) | ||||
| Increase (decrease) in net assets | (26,924,622 | ) | (26,812,625 | ) | ||||
| Net assets at beginning of period | 126,095,717 | 152,908,342 | ||||||
| Net assets at end of period (including undistributed net investment income of $2,192,301 and $3,422,413, respectively) | $ | 99,171,095 | $ | 126,095,717 | ||||
| Other Information | ||||||||
Class A Shares outstanding at beginning of period | 9,511,241 | 11,145,622 | ||||||
| Shares sold | 782,217 | 1,389,466 | ||||||
| Shares issued to shareholders in reinvestment of distributions | 660,658 | 672,169 | ||||||
| Shares redeemed | (2,625,476 | ) | (3,696,016 | ) | ||||
| Net increase (decrease) in Class A shares | (1,182,601 | ) | (1,634,381 | ) | ||||
| Shares outstanding at end of period | 8,328,640 | 9,511,241 | ||||||
Class B Shares outstanding at beginning of period | 428,962 | 511,071 | ||||||
| Shares sold | 26,355 | 72,277 | ||||||
| Shares issued to shareholders in reinvestment of distributions | 25,582 | 26,755 | ||||||
| Shares redeemed | (163,754 | ) | (181,141 | ) | ||||
| Net increase (decrease) in Class B shares | (111,817 | ) | (82,109 | ) | ||||
| Shares outstanding at end of period | 317,145 | 428,962 | ||||||
The accompanying notes are an integral part of the financial statements.
| Years Ended December 31, | |||||||||||||||||||||
| Class A | 2013 | 2012 | 2011 | 2010 | 2009 | ||||||||||||||||
| Selected Per Share Data | |||||||||||||||||||||
| Net asset value, beginning of period | $ | 12.69 | $ | 13.12 | $ | 12.98 | $ | 12.78 | $ | 12.40 | |||||||||||
Income (loss) from investment operations: Net investment incomea | .24 | .34 | .48 | .50 | .52 | ||||||||||||||||
| Net realized and unrealized gain (loss) | (.59 | ) | .03 | .45 | .32 | .45 | |||||||||||||||
| Total from investment operations | (.35 | ) | .37 | .93 | .82 | .97 | |||||||||||||||
Less distributions from: Net investment income | (.37 | ) | (.52 | ) | (.57 | ) | (.62 | ) | (.59 | ) | |||||||||||
| Net realized gains | (.50 | ) | (.28 | ) | (.22 | ) | — | — | |||||||||||||
| Total distributions | (.87 | ) | (.80 | ) | (.79 | ) | (.62 | ) | (.59 | ) | |||||||||||
| Net asset value, end of period | $ | 11.47 | $ | 12.69 | $ | 13.12 | $ | 12.98 | $ | 12.78 | |||||||||||
| Total Return (%) | (3.04 | )b | 2.93 | b | 7.46 | 6.61 | 8.08 | ||||||||||||||
| Ratios to Average Net Assets and Supplemental Data | |||||||||||||||||||||
| Net assets, end of period ($ millions) | 96 | 121 | 146 | 157 | 169 | ||||||||||||||||
| Ratio of expenses before expense reductions (%) | .71 | .68 | .67 | .64 | .58 | ||||||||||||||||
| Ratio of expenses after expense reductions (%) | .67 | .66 | .67 | .64 | .58 | ||||||||||||||||
| Ratio of net investment income (%) | 2.05 | 2.65 | 3.68 | 3.86 | 4.16 | ||||||||||||||||
| Portfolio turnover rate (%) | 794 | 796 | 673 | 423 | 390 | ||||||||||||||||
a Based on average shares outstanding during the period. b Total return would have been lower had certain expenses not been reduced. | |||||||||||||||||||||
| Class B | Years Ended December 31, | ||||||||||||||||||||
| 2013 | 2012 | 2011 | 2010 | 2009 | |||||||||||||||||
| Selected Per Share Data | |||||||||||||||||||||
| Net asset value, beginning of period | $ | 12.67 | $ | 13.10 | $ | 12.95 | $ | 12.75 | $ | 12.37 | |||||||||||
Income (loss) from investment operations: Net investment incomea | .20 | .29 | .43 | .46 | .48 | ||||||||||||||||
| Net realized and unrealized gain (loss) | (.59 | ) | .03 | .46 | .31 | .45 | |||||||||||||||
| Total from investment operations | (.39 | ) | .32 | .89 | .77 | .93 | |||||||||||||||
Less distributions from: Net investment income | (.32 | ) | (.47 | ) | (.52 | ) | (.57 | ) | (.55 | ) | |||||||||||
| Net realized gains | (.50 | ) | (.28 | ) | (.22 | ) | — | — | |||||||||||||
| Total distributions | (.82 | ) | (.75 | ) | (.74 | ) | (.57 | ) | (.55 | ) | |||||||||||
| Net asset value, end of period | $ | 11.46 | $ | 12.67 | $ | 13.10 | $ | 12.95 | $ | 12.75 | |||||||||||
| Total Return (%) | (3.25 | )b | 2.48 | b | 7.15 | 6.24 | 7.70 | ||||||||||||||
| Ratios to Average Net Assets and Supplemental Data | |||||||||||||||||||||
| Net assets, end of period ($ millions) | 4 | 5 | 7 | 6 | 7 | ||||||||||||||||
| Ratio of expenses before expense reductions (%) | 1.06 | 1.03 | 1.01 | .99 | .92 | ||||||||||||||||
| Ratio of expenses after expense reductions (%) | .99 | 1.01 | 1.01 | .99 | .92 | ||||||||||||||||
| Ratio of net investment income (%) | 1.71 | 2.29 | 3.34 | 3.51 | 3.81 | ||||||||||||||||
| Portfolio turnover rate (%) | 794 | 796 | 673 | 423 | 390 | ||||||||||||||||
a Based on average shares outstanding during the period. b Total return would have been lower had certain expenses not been reduced. | |||||||||||||||||||||
A. Organization and Significant Accounting Policies
DWS Government & Agency Securities VIP (the "Fund") is a diversified series of DWS Variable Series II (the "Trust"), which is registered under the Investment Company Act of 1940, as amended (the "1940 Act"), as an open-end management investment company organized as a Massachusetts business trust.
Multiple Classes of Shares of Beneficial Interest. The Fund offers two classes of shares (Class A shares and Class B shares). Sales of Class B shares are subject to recordkeeping fees up to 0.15% and Rule 12b-1 fees under the 1940 Act equal to an annual rate of 0.25% of the average daily net assets of the Class B shares of the Fund. Class A shares are not subject to such fees.
Investment income, realized and unrealized gains and losses, and certain fund-level expenses and expense reductions, if any, are borne pro rata on the basis of relative net assets by the holders of all classes of shares except that each class bears certain expenses unique to that class (including the applicable Rule 12b-1 fee and recordkeeping fees). Differences in class-level expenses may result in payment of different per share dividends by class. All shares have equal rights with respect to voting subject to class-specific arrangements.
The Fund's financial statements are prepared in accordance with accounting principles generally accepted in the United States of America which require the use of management estimates. Actual results could differ from those estimates. The policies described below are followed consistently by the Fund in the preparation of its financial statements.
Security Valuation. Investments are stated at value determined as of the close of regular trading on the New York Stock Exchange on each day the exchange is open for trading.
Various inputs are used in determining the value of the Fund's investments. These inputs are summarized in three broad levels. Level 1 includes quoted prices in active markets for identical securities. Level 2 includes other significant observable inputs (including quoted prices for similar securities, interest rates, prepayment speeds and credit risk). Level 3 includes significant unobservable inputs (including the Fund's own assumptions in determining the fair value of investments). The level assigned to the securities valuations may not be an indication of the risk or liquidity associated with investing in those securities.
Debt securities are valued at prices supplied by independent pricing services approved by the Fund's Board. If the pricing services are unable to provide valuations, securities are valued at the average of the most recent reliable bid quotation or evaluated price, as applicable, obtained from broker-dealers. Such services may use various pricing techniques which take into account appropriate factors such as yield, quality, coupon rate, maturity, type of issue, trading characteristics and other data, as well as broker quotes. These securities are generally categorized as Level 2.
Money market instruments purchased with an original or remaining maturity of sixty days or less, maturing at par, are valued at amortized cost, which approximates value, and are categorized as Level 2. Investments in open-end investment companies are valued at their net asset value each business day and are categorized as Level 1.
Futures contracts are generally valued at the settlement prices established each day on the exchange on which they are traded and are categorized as Level 1.
Swap contracts are valued daily based upon prices supplied by a Board approved pricing vendor, if available, and otherwise are valued at the price provided by the broker-dealer. Swap contracts are generally categorized as Level 2.
Exchange-traded options are valued at the last sale price or, in the absence of a sale, the mean between the closing bid and asked prices or at the most recent asked price (bid for purchased options) if no bid or asked price are available. Exchange-traded options are categorized as Level 1. Over-the-counter written or purchased options are valued at prices supplied by a Board approved pricing vendor, if available, and otherwise are valued at the price provided by the broker-dealer with which the option was traded. Over-the-counter written or purchased options are generally categorized as Level 2.
Securities and other assets for which market quotations are not readily available or for which the above valuation procedures are deemed not to reflect fair value are valued in a manner that is intended to reflect their fair value as determined in accordance with procedures approved by the Board and are generally categorized as Level 3. In accordance with the Fund's valuation procedures, factors used in determining value may include, but are not limited to, the type of the security; the size of the holding; the initial cost of the security; the existence of any contractual restrictions on the security's disposition; the price and extent of public trading in similar securities of the issuer or of comparable companies; quotations or evaluated prices from broker-dealers and/or pricing services; information obtained from the issuer, analysts, and/or the appropriate stock exchange (for exchange-traded securities); an analysis of the company's or issuer's financial statements; an evaluation of the forces that influence the issuer and the market(s) in which the security is purchased and sold; and with respect to debt securities, the maturity, coupon, creditworthiness, currency denomination and the movement of the market in which the security is normally traded. The value determined under these procedures may differ from published values for the same securities.
Disclosure about the classification of fair value measurements is included in a table following the Fund's Investment Portfolio.
Securities Lending. Deutsche Bank AG, as lending agent, lends securities of the Fund to certain financial institutions under the terms of the Security Lending Agreement. The Fund retains the benefits of owning the securities it has loaned and continues to receive interest and dividends generated by the securities and to participate in any changes in their market value. The Fund requires the borrowers of the securities to maintain collateral with the Fund consisting of either cash or liquid, unencumbered assets having a value at least equal to the value of the securities loaned. When the collateral falls below specified amounts, the lending agent will use its best effort to obtain additional collateral on the next business day to meet required amounts under the security lending agreement. The Fund may invest the cash collateral into a joint trading account in an affiliated money market fund pursuant to Exemptive Orders issued by the SEC. The Fund receives compensation for lending its securities either in the form of fees or by earning interest on invested cash collateral net of borrower rebates and fees paid to a lending agent. Either the Fund or the borrower may terminate the loan. There may be risks of delay and costs in recovery of securities or even loss of rights in the collateral should the borrower of the securities fail financially. If the Fund is not able to recover securities lent, the Fund may sell the collateral and purchase a replacement investment in the market, incurring the risk that the value of the replacement security is greater than the value of the collateral. The Fund is also subject to all investment risks associated with the reinvestment of any cash collateral received, including, but not limited to, interest rate, credit and liquidity risk associated with such investments. The Fund had no securities on loan at December 31, 2013.
Mortgage Dollar Rolls. The Fund may enter into mortgage dollar rolls in which the Fund sells to a bank or broker/dealer (the "counterparty") mortgage-backed securities for delivery in the current month and simultaneously contracts to repurchase similar, but not identical, securities on a fixed date. The counterparty receives all principal and interest payments, including prepayments, made on the security while it is the holder. The Fund receives compensation as consideration for entering into the commitment to repurchase. The compensation is paid in the form of a lower price for the security upon its repurchase, or alternatively, a fee. Mortgage dollar rolls may be renewed with a new sale and repurchase price and a cash settlement made at each renewal without physical delivery of the securities subject to the contract.
Certain risks may arise upon entering into mortgage dollar rolls from the potential inability of counterparties to meet the terms of their commitments. Additionally, the value of such securities may change adversely before the Fund is able to repurchase them. There can be no assurance that the Fund's use of the cash that it receives from a mortgage dollar roll will provide a return that exceeds its costs.
When-Issued/Delayed Delivery Securities. The Fund may purchase or sell securities with delivery or payment to occur at a later date beyond the normal settlement period. At the time the Fund enters into a commitment to purchase or sell a security, the transaction is recorded and the value of the transaction is reflected in the net asset value. The price of such security and the date when the security will be delivered and paid for are fixed at the time the transaction is negotiated. The value of the security may vary with market fluctuations. At the time the Fund enters into a purchase transaction it is required to segregate cash or other liquid assets at least equal to the amount of the commitment.
Certain risks may arise upon entering into when-issued or delayed delivery transactions from the potential inability of counterparties to meet the terms of their contracts or if the issuer does not issue the securities due to political, economic, or other factors. Additionally, losses may arise due to changes in the value of the underlying securities.
Federal Income Taxes. The Fund's policy is to comply with the requirements of the Internal Revenue Code, as amended, which are applicable to regulated investment companies and to distribute all of its taxable income to its shareholders.
At December 31, 2013, the Fund had a net tax basis capital loss carryforward of $310,000 of short-term losses, which may be applied against any realized net taxable capital gains indefinitely.
The Fund has reviewed the tax positions for the open tax years as of December 31, 2013 and has determined that no provision for income tax is required in the Fund's financial statements. The Fund's federal tax returns for the prior three fiscal years remain open subject to examination by the Internal Revenue Service.
Distribution of Income and Gains. Distributions from net investment income of the Fund, if any, are declared and distributed to shareholders annually. Net realized gains from investment transactions, in excess of available capital loss carryforwards, would be taxable to the Fund if not distributed and, therefore, will be distributed to shareholders at least annually. The Fund may also make additional distributions for tax purposes if necessary.
The timing and characterization of certain income and capital gain distributions are determined annually in accordance with federal tax regulations which may differ from accounting principles generally accepted in the United States of America. These differences primarily relate to investments in futures contracts, investments in swap contracts and certain securities sold at a loss. As a result, net investment income (loss) and net realized gain (loss) on investment transactions for a reporting period may differ significantly from distributions during such period. Accordingly, the Fund may periodically make reclassifications among certain of its capital accounts without impacting the net asset value of the Fund.
At December 31, 2013, the Fund's components of distributable earnings on a tax basis were as follows:
| Undistributed ordinary income* | $ | 2,196,608 | ||
| Capital loss carryforward | $ | (310,000 | ) | |
| Unrealized appreciation (depreciation) on investments | $ | 564,517 |
In addition, the tax character of distributions paid by the Fund is summarized as follows:
| Years Ended December 31, | ||||||||
| 2013 | 2012 | |||||||
| Distributions from ordinary income* | $ | 5,193,028 | $ | 6,020,886 | ||||
| Distributions from long-term capital gains | $ | 2,959,762 | $ | 2,701,692 | ||||
* For tax purposes, short-term capital gain distributions are considered ordinary income distributions.
Expenses. Expenses of the Trust arising in connection with a specific fund are allocated to that fund. Other Trust expenses which cannot be directly attributed to a fund are apportioned among the funds in the Trust based upon the relative net assets or other appropriate measures.
Contingencies. In the normal course of business, the Fund may enter into contracts with service providers that contain general indemnification clauses. The Fund's maximum exposure under these arrangements is unknown as this would involve future claims that may be made against the Fund that have not yet been made. However, based on experience, the Fund expects the risk of loss to be remote.
Other. Investment transactions are accounted for on a trade date plus one basis for daily net asset value calculations. However, for financial reporting purposes, investment transactions are reported on trade date. Interest income is recorded on the accrual basis. Realized gains and losses from investment transactions are recorded on an identified cost basis. All discounts and premiums are accreted/amortized for both tax and financial reporting purposes for the Fund.
B. Derivative Instruments
Swaps. A swap is a contract between two parties to exchange future cash flows at periodic intervals based on the notional amount of the swap. A bilateral swap is a transaction between the fund and a counterparty where cash flows are exchanged between the two parties. A centrally cleared swap is a transaction executed between the fund and a counterparty, then cleared by a clearing member through a central clearinghouse. The central clearinghouse serves as the counterparty, with whom the fund exchanges cash flows.
The value of a swap is adjusted daily, and the change in value, if any, is recorded as unrealized appreciation or depreciation in the Statement of Assets and Liabilities. Gains or losses are realized when the swap expires or is closed. Certain risks may arise when entering into swap transactions including counterparty default; liquidity; or unfavorable changes in interest rates or the value of the underlying reference security, commodity or index. In connection with bilateral swaps, securities and/or cash may be identified as collateral in accordance with the terms of the swap agreement to provide assets of value and recourse in the event of default. The maximum counterparty credit risk is the net present value of the cash flows to be received from or paid to the counterparty over the term of the swap, to the extent that this amount is beneficial to the Fund, in addition to any related collateral posted to the counterparty by the Fund. This risk may be partially reduced by a master netting arrangement between the Fund and the counterparty. Upon entering into a centrally cleared swap, the Fund is required to deposit with a financial intermediary cash or securities ("initial margin") in an amount equal to a certain percentage of the notional amount of the swap. Subsequent payments ("variation margin") are made or received by the Fund dependent upon the daily fluctuations in the value of the swap. In a cleared swap transaction, counterparty risk is minimized as the central clearinghouse acts as the counterparty.
An upfront payment, if any, made by the Fund is recorded as an asset in the Statement of Assets and Liabilities. An upfront payment, if any, received by the Fund is recorded as a liability in the Statement of Assets and Liabilities. Payments received or made at the end of the measurement period are recorded as realized gain or loss in the Statement of Operations.
Interest Rate Swaps. Interest rate swaps are agreements in which the Fund agrees to pay to the counterparty a fixed rate payment in exchange for the counterparty agreeing to pay to the Fund a variable rate payment, or the Fund agrees to receive from the counterparty a fixed rate payment in exchange for the counterparty agreeing to receive from the Fund a variable rate payment. The payment obligations are based on the notional amount of the swap. For the year ended December 31, 2013, the Fund entered into interest rate swap agreements to gain exposure to different parts of the yield curve while managing overall duration.
For the year ended December 31, 2013, the investment in interest rate swap contracts had a total notional amount generally indicative of a range from $31,300,000 to $48,700,000.
Options. An option contract is a contract in which the writer (seller) of the option grants the buyer of the option, upon payment of a premium, the right to purchase from (call option), or sell to (put option), the writer a designated instrument at a specified price within a specified period of time. The Fund may write or purchase interest rate swaption agreements which are options to enter into a pre-defined swap agreement. The interest rate swaption agreement will specify whether the buyer of the swaption will be a fixed-rate receiver or a fixed-rate payer upon exercise. Certain options, including options on indices and interest rate options, will require cash settlement by the Fund if exercised. For the year ended December 31, 2013, the Fund entered into options on interest rate futures and on interest rate swap contracts in order to hedge against potential adverse interest rate movements of portfolio assets.
If the Fund writes a covered call option, the Fund foregoes, in exchange for the premium, the opportunity to profit during the option period from an increase in the market value of the underlying security above the exercise price. If the Fund writes a put option it accepts the risk of a decline in the value of the underlying security below the exercise price. Over-the-counter options have the risk of the potential inability of counterparties to meet the terms of their contracts. For exchange-traded contracts, the counterparty risk is minimized as the exchange's clearinghouse acts as the counterparty, and guarantees the futures against default. The Fund's maximum exposure to purchased options is limited to the premium initially paid. In addition, certain risks may arise upon entering into option contracts, including the risk that an illiquid secondary market will limit the Fund's ability to close out an option contract prior to the expiration date and that a change in the value of the option contract may not correlate exactly with changes in the value of the securities or currencies hedged.
A summary of the open purchased option contracts as of December 31, 2013 is included in the Fund's Investment Portfolio. A summary of open written option contracts is included in a table following the Fund's Investment Portfolio. For the year ended December 31, 2013, the investment in written option contracts had a total value generally indicative of a range from approximately $590,000 to $1,248,000, and purchased option contracts had a total value generally indicative of a range from approximately $505,000 to $842,000.
Futures Contracts. A futures contract is an agreement between a buyer or seller and an established futures exchange or its clearinghouse in which the buyer or seller agrees to take or make a delivery of a specific amount of a financial instrument at a specified price on a specific date (settlement date). For the year ended December 31, 2013, the Fund entered into interest rate futures to gain exposure to different parts of the yield curve while managing overall duration.
Upon entering into a futures contract, the Fund is required to deposit with a financial intermediary cash or securities ("initial margin") in an amount equal to a certain percentage of the face value indicated in the futures contract. Subsequent payments ("variation margin") are made or received by the Fund dependent upon the daily fluctuations in the value and are recorded for financial reporting purposes as unrealized gains or losses by the Fund. Gains or losses are realized when the contract expires or is closed. Since all futures contracts are exchange-traded, counterparty risk is minimized as the exchange's clearinghouse acts as the counterparty, and guarantees the futures against default.
Certain risks may arise upon entering into futures contracts, including the risk that an illiquid market will limit the Fund's ability to close out a futures contract prior to the settlement date and the risk that the futures contract is not well correlated with the security, index or currency to which it relates. Risk of loss may exceed amounts disclosed in the Statement of Assets and Liabilities.
A summary of the open futures contracts as of December 31, 2013, is included in a table following the Fund's Investment Portfolio. For the period ended December 31, 2013, the investment in futures contracts purchased had a total notional value generally indicative of a range from approximately $2,652,000 to $22,313,000, and the investment in futures contracts sold had a total notional value generally indicative of a range from $0 to approximately $13,922,000.
The following tables summarize the value of the Fund's derivative instruments held as of December 31, 2013 and the related location in the accompanying Statement of Assets and Liabilities, presented by primary underlying risk exposure:
| Asset Derivatives | Purchased Options | Swap Contracts | Futures Contracts | Total | ||||||||||||
| Interest Rate Contracts (a) (b) | $ | 551,439 | $ | 10,204 | $ | 9,443 | $ | 571,086 | ||||||||
Each of the above derivatives is located in the following Statement of Assets and Liabilities accounts: (a) Investments in securities, at value (includes purchased options) and unrealized appreciation on swap contracts. Unsettled variation margin for centrally cleared swaps is disclosed separately within the Statement of Assets and Liabilities. (b) Includes cumulative appreciation of futures contracts as disclosed in the Investment Portfolio. Unsettled variation margin is disclosed separately within the Statement of Assets and Liabilities. | ||||||||||||||||
| Liability Derivatives | Written Options | Swap Contracts | Futures Contracts | Total | ||||||||||||
| Interest Rate Contracts (a) (b) | $ | (655,597 | ) | $ | (131,654 | ) | $ | (273,021 | ) | $ | (1,060,272 | ) | ||||
Each of the above derivatives is located in the following Statement of Assets and Liabilities accounts: (a) Options written, at value and unrealized depreciation on swap contracts. Unsettled variation margin for centrally cleared swaps is disclosed separately within the Statement of Assets and Liabilities. (b) Includes cumulative depreciation of futures contracts as disclosed in the Investment Portfolio. Unsettled variation margin is disclosed separately within the Statement of Assets and Liabilities. | ||||||||||||||||
Additionally, the amount of unrealized and realized gains and losses on derivative instruments recognized in Fund earnings during the year ended December 31, 2013 and the related location in the accompanying Statement of Operations is summarized in the following tables by primary underlying risk exposure:
| Realized Gain (Loss) | Purchased Options | Written Options | Swap Contracts | Futures Contracts | Total | |||||||||||||||
| Interest Rate Contracts (a) | $ | 84,738 | $ | 177,488 | $ | 626,170 | $ | (719,550 | ) | $ | 168,846 | |||||||||
Each of the above derivatives is located in the following Statement of Operations accounts: (a) Net realized gain (loss) from investments (includes purchased options), written options, swap contracts and futures, respectively | ||||||||||||||||||||
| Change in Net Unrealized Appreciation (Depreciation) | Purchased Options | Written Options | Swap Contracts | Futures Contracts | Total | |||||||||||||||
| Interest Rate Contracts (a) | $ | 250,165 | $ | (232,998 | ) | $ | 221,465 | $ | (241,740 | ) | $ | (3,108 | ) | |||||||
Each of the above derivatives is located in the following Statement of Operations accounts: (a) Change in net unrealized appreciation (depreciation) from investments (includes purchased options), written options, swap contracts and futures, respectively | ||||||||||||||||||||
As of December 31, 2013, the Fund has transactions subject to enforceable master netting agreements. A reconciliation of the gross amounts on the Statement of Assets and Liabilities to the net amounts by derivative type, including any collateral exposure, is included in the following tables:
| Counterparty | Gross Amounts of Assets Presented in the Statement of Assets and Liabilities (a) | Financial Instruments and Derivatives Available for Offset | Collateral Received | Net Amount of Derivative Assets | ||||||||||||
| BNP Paribas | $ | 379,403 | $ | (379,403 | ) | $ | — | $ | — | |||||||
| Nomura International PLC | 172,036 | (172,036 | ) | — | — | |||||||||||
| Exchange Traded Futures and Swaps (b) | 19,647 | — | — | 19,647 | ||||||||||||
| $ | 571,086 | $ | (551,439 | ) | $ | — | $ | 19,647 | ||||||||
| Counterparty | Gross Amounts of Liabilities Presented in the Statement of Assets and Liabilities (a) | Financial Instruments and Derivatives Available for Offset | Non-Cash Collateral Pledged (c) | Net Amount of Derivative Liabilities | ||||||||||||
| Barclays Bank PLC | $ | 1 | $ | — | $ | — | $ | 1 | ||||||||
| BNP Paribas | 429,036 | (379,403 | ) | — | 49,633 | |||||||||||
| Citigroup, Inc. | 5,913 | — | — | 5,913 | ||||||||||||
| JPMorgan Chase Securities, Inc. | 1 | — | — | 1 | ||||||||||||
| Nomura International PLC | 324,746 | (172,036 | ) | (152,710 | ) | — | ||||||||||
| Exchange Traded Futures and Swaps (b) | 300,575 | — | — | 300,575 | ||||||||||||
| $ | 1,060,272 | $ | (551,439 | ) | $ | (152,710 | ) | $ | 356,123 | |||||||
(a) Bilateral swap contracts and over-the-counter purchased and written options are netted.
(b) Includes financial instruments (futures or centrally cleared swaps) which are not subject to a master netting arrangement, or another similar arrangement.
(c) The actual collateral received and/or pledged may be more than the amount shown.
C. Purchases and Sales of Securities
During the year ended December 31, 2013, purchases and sales of investment securities (excluding short-term investments and U.S. Treasury securities) aggregated $1,069,609,917 and $1,090,179,740, respectively. Purchases and sales of U.S. Treasury securities aggregated $26,318,172 and $25,433,181, respectively.
For the year ended December 31, 2013, transactions for written options on futures and interest rate swap contracts were as follows:
Contracts/ Contract Amount | Premiums | |||||||
| Outstanding, beginning of period | 25,600,030 | $ | 916,248 | |||||
| Options written | 24,900,128 | 334,799 | ||||||
| Options closed | (18,900,027 | ) | (404,031 | ) | ||||
| Options expired | (131 | ) | (98,155 | ) | ||||
| Outstanding, end of period | 31,600,000 | $ | 748,861 | |||||
D. Related Parties
Management Agreement. Under the Investment Management Agreement with Deutsche Investment Management Americas Inc. ("DIMA" or the "Advisor"), an indirect, wholly owned subsidiary of Deutsche Bank AG, the Advisor directs the investments of the Fund in accordance with its investment objectives, policies and restrictions. The Advisor determines the securities, instruments and other contracts relating to investments to be purchased, sold or entered into by the Fund.
Pursuant to the Investment Management Agreement with the Advisor, the Fund pays a monthly management fee based on the Fund's average daily net assets, computed and accrued daily and payable monthly, at the following annual rates:
| First $250 million | .450 | % | ||
| Next $750 million | .430 | % | ||
| Next $1.5 billion | .410 | % | ||
| Next $2.5 billion | .400 | % | ||
| Next $2.5 billion | .380 | % | ||
| Next $2.5 billion | .360 | % | ||
| Next $2.5 billion | .340 | % | ||
| Over $12.5 billion | .320 | % |
For the period from January 1, 2013 through April 30, 2013, the Advisor had contractually agreed to waive its fees and/or reimburse certain operating expenses to the extent necessary to maintain the operating expenses (excluding certain expenses such as extraordinary expenses, taxes, brokerage and interest expense) of Class A at 0.66%.
For the period from May 1, 2013 through April 30, 2014, the Advisor has contractually agreed to waive its fees and/or reimburse certain operating expenses to the extent necessary to maintain the operating expenses (excluding certain expenses such as extraordinary expenses, taxes, brokerage and interest expense) of Class A at 0.67%.
For the period from January 1, 2013 through April 30, 2014, the Advisor has contractually agreed to waive its fees and/or reimburse certain operating expenses to the extent necessary to maintain the operating expenses (excluding certain expenses such as extraordinary expenses, taxes, brokerage and interest expense) of Class B at 0.99%.
Accordingly, for the year ended December 31, 2013, the Advisor waived a portion of its management fee pursuant to the Investment Management Agreement aggregating $43,084, and the amount charged aggregated $462,680, which was equivalent to an annual effective rate of 0.41% of the Fund's average daily net assets.
Administration Fee. Pursuant to an Administrative Services Agreement, DIMA provides most administrative services to the Fund. For all services provided under the Administrative Services Agreement, the Fund pays DIMA an annual fee ("Administration Fee") of 0.10% of the Fund's average daily net assets, computed and accrued daily and payable monthly. For the year ended December 31, 2013, the Administration Fee was $112,392, of which $8,500 is unpaid.
Service Provider Fees. DWS Investments Service Company ("DISC"), an affiliate of the Advisor, is the transfer agent, dividend-paying agent and shareholder service agent for the Fund. Pursuant to a sub-transfer agency agreement between DISC and DST Systems, Inc. ("DST"), DISC has delegated certain transfer agent, dividend-paying agent and shareholder service agent functions to DST. DISC compensates DST out of the shareholder servicing fee it receives from the Fund. For the year ended December 31, 2013, the amounts charged to the Fund by DISC were as follows:
| Total Aggregated | Amount Waived | |||||||
| Class A | $ | 287 | $ | 287 | ||||
| Class B | 71 | 71 | ||||||
| $ | 358 | $ | 358 | |||||
In addition, for the year ended December 31, 2013, the Advisor reimbursed $1,068 of recordkeeping fees for Class B shares.
Distribution Service Agreement. Under the Fund's Class B 12b-1 plans, DWS Investments Distributors, Inc. ("DIDI") received a fee ("Distribution Service Fee") of 0.25% of average daily net assets of Class B shares. For the year ended December 31, 2013, the Distribution Service Fee aggregated $11,046, of which $853 is unpaid.
Typesetting and Filing Service Fees. Under an agreement with DIMA, DIMA is compensated for providing typesetting and certain regulatory filing services to the Fund. For the year ended December 31, 2013, the amount charged to the Fund by DIMA included in the Statement of Operations under "reports to shareholders" aggregated $18,807, of which $5,186 is unpaid.
Trustees' Fees and Expenses. The Fund paid retainer fees to each Trustee not affiliated with the Advisor, plus specified amounts to the Board Chairperson and Vice Chairperson and to each committee Chairperson.
Affiliated Cash Management Vehicles. The Fund may invest uninvested cash balances in Central Cash Management Fund and DWS Variable NAV Money Fund, affiliated money market funds which are managed by the Advisor. Each affiliated money market fund seeks to provide a high level of current income consistent with liquidity and the preservation of capital. Each affiliated money market fund is managed in accordance with Rule 2a-7 under the Investment Company Act of 1940, which governs the quality, maturity, diversity and liquidity of instruments in which a money market fund may invest. Central Cash Management Fund seeks to maintain a stable net asset value, and DWS Variable NAV Money Fund maintains a floating net asset value. The Fund indirectly bears its proportionate share of the expenses of each affiliated money market fund in which it invests. Central Cash Management Fund does not pay the Advisor an investment management fee. To the extent that DWS Variable NAV Money Fund pays an investment management fee to the Advisor, the Advisor will waive an amount of the investment management fee payable to the Advisor by the Fund equal to the amount of the investment management fee payable on the Fund's assets invested in DWS Variable NAV Money Fund.
Securities Lending Agent Fees. Deutsche Bank AG serves as securities lending agent for the Fund. For the year ended December 31, 2013, the Fund incurred securities lending agent fees to Deutsche Bank AG in the amount of $11.
E. Ownership of the Fund
At December 31, 2013, three participating insurance companies were owners of record of 10% or more of the total outstanding Class A shares of the Fund, each owning 42%, 34% and 17%. One participating insurance company was the owner of record of 10% or more of the total outstanding Class B shares of the Fund, owning 94%.
F. Line of Credit
The Fund and other affiliated funds (the "Participants") share in a $375 million revolving credit facility provided by a syndication of banks. The Fund may borrow for temporary or emergency purposes, including the meeting of redemption requests that otherwise might require the untimely disposition of securities. The Participants are charged an annual commitment fee which is allocated based on net assets, among each of the Participants. Interest is calculated at a rate per annum equal to the sum of the Federal Funds Rate plus 1.25 percent plus if LIBOR exceeds the Federal Funds Rate the amount of such excess. The Fund may borrow up to a maximum of 33 percent of its net assets under the agreement. The Fund had no outstanding loans at December 31, 2013.
To the Board of Trustees of DWS Variable Series II and Shareholders of DWS Government & Agency Securities VIP:
We have audited the accompanying statement of assets and liabilities, including the investment portfolio, of DWS Government & Agency Securities VIP (the "Fund") (one of the funds constituting DWS Variable Series II), as of December 31, 2013, and the related statement of operations for the year then ended, the statements of changes in net assets for each of the two years in the period then ended, and the financial highlights for each of the five years in the period then ended. These financial statements and financial highlights are the responsibility of the Fund's management. Our responsibility is to express an opinion on these financial statements and financial highlights based on our audits.
We conducted our audits in accordance with the standards of the Public Company Accounting Oversight Board (United States). Those standards require that we plan and perform the audit to obtain reasonable assurance about whether the financial statements and financial highlights are free of material misstatement. We were not engaged to perform an audit of the Fund's internal control over financial reporting. Our audits included consideration of internal control over financial reporting as a basis for designing audit procedures that are appropriate in the circumstances, but not for the purpose of expressing an opinion on the effectiveness of the Fund's internal control over financial reporting. Accordingly, we express no such opinion. An audit also includes examining, on a test basis, evidence supporting the amounts and disclosures in the financial statements and financial highlights, assessing the accounting principles used and significant estimates made by management, and evaluating the overall financial statement presentation. Our procedures included confirmation of securities owned as of December 31, 2013, by correspondence with the custodian and brokers or by other appropriate auditing procedures where replies from brokers were not received. We believe that our audits provide a reasonable basis for our opinion.
In our opinion, the financial statements and financial highlights referred to above present fairly, in all material respects, the financial position of DWS Government & Agency Securities VIP (one of the funds constituting DWS Variable Series II) at December 31, 2013, the results of its operations for the year then ended, the changes in its net assets for each of the two years in the period then ended, and the financial highlights for each of the five years in the period then ended, in conformity with U.S. generally accepted accounting principles.
| ||
Boston, Massachusetts February 14, 2014 |
As an investor of the Fund, you incur two types of costs: ongoing expenses and transaction costs. Ongoing expenses include management fees, distribution and service (12b-1) fees and other Fund expenses. Examples of transaction costs include contract charges, redemption fees and account maintenance fees, which are not shown in this section. The following tables are intended to help you understand your ongoing expenses (in dollars) of investing in the Fund and to help you compare these expenses with the ongoing expenses of investing in other mutual funds. In the most recent six-month period, the Fund limited these expenses; had it not done so, expenses would have been higher. The example in the table is based on an investment of $1,000 invested at the beginning of the six-month period and held for the entire period (July 1, 2013 to December 31, 2013).
The tables illustrate your Fund's expenses in two ways:
—Actual Fund Return. This helps you estimate the actual dollar amount of ongoing expenses (but not transaction costs) paid on a $1,000 investment in the Fund using the Fund's actual return during the period. To estimate the expenses you paid over the period, simply divide your account value by $1,000 (for example, an $8,600 account value divided by $1,000 = 8.6), then multiply the result by the number in the "Expenses Paid per $1,000" line under the share class you hold.
— Hypothetical 5% Fund Return. This helps you to compare your Fund's ongoing expenses (but not transaction costs) with those of other mutual funds using the Fund's actual expense ratio and a hypothetical rate of return of 5% per year before expenses. Examples using a 5% hypothetical Fund return may be found in the shareholder reports of other mutual funds. The hypothetical account values and expenses may not be used to estimate the actual ending account balance or expenses you paid for the period.
Please note that the expenses shown in these tables are meant to highlight your ongoing expenses only and do not reflect any transaction costs. The "Expenses Paid per $1,000" line of the tables is useful in comparing ongoing expenses only and will not help you determine the relative total expense of owning different funds. If these transaction costs had been included, your costs would have been higher.
Expenses and Value of a $1,000 Investment for the six months ended December 31, 2013 | ||||||||
| Actual Fund Return | Class A | Class B | ||||||
| Beginning Account Value 7/1/13 | $ | 1,000.00 | $ | 1,000.00 | ||||
| Ending Account Value 12/31/13 | $ | 969.60 | $ | 967.50 | ||||
| Expenses Paid per $1,000* | $ | 3.33 | $ | 4.91 | ||||
| Hypothetical 5% Fund Return | Class A | Class B | ||||||
| Beginning Account Value 7/1/13 | $ | 1,000.00 | $ | 1,000.00 | ||||
| Ending Account Value 12/31/13 | $ | 1,021.83 | $ | 1,020.21 | ||||
| Expenses Paid per $1,000* | $ | 3.41 | $ | 5.04 | ||||
* Expenses are equal to the Fund's annualized expense ratio for each share class, multiplied by the average account value over the period, multiplied by 184 (the number of days in the most recent six-month period), then divided by 365.
| Annualized Expense Ratios | Class A | Class B | ||
| DWS Variable Series II — DWS Government & Agency Securities VIP | .67% | .99% |
For more information, please refer to the Fund's prospectus.
These tables do not reflect charges and fees ("contract charges") associated with the separate account that invests in the Fund or any variable life insurance policy or variable annuity contract for which the Fund is an investment option.
For an analysis of the fees associated with an investment in the fund or similar funds, please refer to the current and hypothetical expense calculators for Variable Insurance Products which can be found at dws-investments.com/EN/resources/calculators.jsp.
The Fund paid distributions of $0.32 per share from net long-term capital gains during its year ended December 31, 2013.
Please consult a tax advisor if you have questions about federal or state income tax laws, or on how to prepare your tax returns. If you have specific questions about your account, please contact your insurance provider.
The Trust's policies and procedures for voting proxies for portfolio securities and information about how the Trust voted proxies related to its portfolio securities during the 12-month period ended June 30 are available on our Web site — dws-investments.com (click on "proxy voting" at the bottom of the page) — or on the SEC's Web site — sec.gov. To obtain a written copy of the Trust's policies and procedures without charge, upon request, call us toll free at (800) 728-3337.
The Board of Trustees approved the renewal of DWS Government & Agency Securities VIP's investment management agreement (the "Agreement") with Deutsche Investment Management Americas Inc. ("DIMA") in September 2013.
In terms of the process that the Board followed prior to approving the Agreement, shareholders should know that:
— In September 2013, all but one of the Fund's Trustees were independent of DIMA and its affiliates.
— The Trustees met frequently during the past year to discuss fund matters and dedicated a substantial amount of time to contract review matters. Over the course of several months, the Board's Contract Committee, in coordination with the Board's Fixed Income and Asset Allocation Oversight Committee, reviewed comprehensive materials received from DIMA, independent third parties and independent counsel. These materials included an analysis of the Fund's performance, fees and expenses, and profitability compiled by a fee consultant retained by the Fund's Independent Trustees (the "Fee Consultant"). The Board also received extensive information throughout the year regarding performance of the Fund.
— The Independent Trustees regularly meet privately with their independent counsel to discuss contract review and other matters. In addition, the Independent Trustees were also advised by the Fee Consultant in the course of their review of the Fund's contractual arrangements and considered a comprehensive report prepared by the Fee Consultant in connection with their deliberations.
— In connection with reviewing the Agreement, the Board also reviewed the terms of the Fund's Rule 12b-1 plan, distribution agreement, administrative services agreement, transfer agency agreement and other material service agreements.
— Based on its evaluation of the information provided, the Contract Committee presented its findings and recommendations to the Board. The Board then reviewed the Contract Committee's findings and recommendations.
In connection with the contract review process, the Contract Committee and the Board considered the factors discussed below, among others. The Board also considered that DIMA and its predecessors have managed the Fund since its inception, and the Board believes that a long-term relationship with a capable, conscientious advisor is in the best interests of the Fund. The Board considered, generally, that shareholders chose to invest or remain invested in the Fund knowing that DIMA managed the Fund, and that the Agreement was approved by the Fund's shareholders. DIMA is part of Deutsche Bank AG, a major global banking institution that is engaged in a wide range of financial services. The Board believes that there are advantages to being part of a global asset management business that offers a wide range of investing expertise and resources, including hundreds of portfolio managers and analysts with research capabilities in many countries throughout the world.
As part of the contract review process, the Board carefully considered the fees and expenses of each DWS fund overseen by the Board in light of the fund's performance. In many cases, this led to a negotiation with DIMA of lower expense caps as part of the 2012 and 2013 contract review processes than had previously been in place. As part of these negotiations, the Board indicated that it would consider relaxing these new lower caps in future years following sustained improvements in performance, among other considerations.
In June 2012, Deutsche Bank AG ("DB"), DIMA's parent company, announced that DB would combine its Asset Management (of which DIMA was a part) and Wealth Management divisions. DB has advised the Independent Trustees that the U.S. asset management business is a critical and integral part of DB, and that it has, and will continue to, reinvest a significant portion of the substantial savings it expects to realize by combining its Asset Management and Wealth Management divisions into the new Asset and Wealth Management ("AWM") division, including ongoing enhancements to its investment capabilities. DB also has confirmed its commitment to maintaining strong legal and compliance groups within the AWM division.
While shareholders may focus primarily on fund performance and fees, the Fund's Board considers these and many other factors, including the quality and integrity of DIMA's personnel and such other issues as back-office operations, fund valuations, and compliance policies and procedures.
Nature, Quality and Extent of Services. The Board considered the terms of the Agreement, including the scope of advisory services provided under the Agreement. The Board noted that, under the Agreement, DIMA provides portfolio management services to the Fund and that, pursuant to a separate administrative services agreement, DIMA provides administrative services to the Fund. The Board considered the experience and skills of senior management and investment personnel, the resources made available to such personnel, the ability of DIMA to attract and retain high-quality personnel, and the organizational depth and stability of DIMA. The Board reviewed the Fund's performance over short-term and long-term periods and compared those returns to various agreed-upon performance measures, including market indices and a peer universe compiled by the Fee Consultant using information supplied by Morningstar Direct ("Morningstar"), an independent fund data service. The Board also noted that it has put into place a process of identifying "Focus Funds" (e.g., funds performing poorly relative to their benchmark or a peer universe compiled by an independent fund data service), and receives more frequent reporting and information from DIMA regarding such funds, along with DIMA's remedial plans to address underperformance. The Board believes this process is an effective manner of identifying and addressing underperforming funds. Based on the information provided, the Board noted that for the one-, three- and five-year periods ended December 31, 2012, the Fund's performance (Class A shares) was in the 3rd quartile, 1st quartile and 1st quartile, respectively, of the applicable Morningstar universe (the 1st quartile being the best performers and the 4th quartile being the worst performers). The Board also observed that the Fund has outperformed its benchmark in the one- and three-year periods and has underperformed its benchmark in the five-year period ended December 31, 2012.
Fees and Expenses. The Board considered the Fund's investment management fee schedule, operating expenses and total expense ratios, and comparative information provided by Lipper Inc. ("Lipper") and the Fee Consultant regarding investment management fee rates paid to other investment advisors by similar funds (1st quartile being the most favorable and 4th quartile being the least favorable). With respect to management fees paid to other investment advisors by similar funds, the Board noted that the contractual fee rates paid by the Fund, which include a 0.10% fee paid to DIMA under the Fund's administrative services agreement, were higher than the median (3rd quartile) of the applicable Lipper peer group (based on Lipper data provided as of December 31, 2012). The Board noted that the Fund's Class A shares total (net) operating expenses were expected to be equal to the median of the applicable Lipper expense universe (based on Lipper data provided as of December 31, 2012, and analyzing Lipper expense universe Class A (net) expenses less any applicable 12b-1 fees) ("Lipper Universe Expenses"). The Board also reviewed data comparing each share class's total (net) operating expenses to the applicable Lipper Universe Expenses. The Board considered the Fund's management fee rate as compared to fees charged by DIMA to a comparable fund and considered differences between the Fund and the comparable fund. The Board also considered how the Fund's total (net) operating expenses compared to the total (net) operating expenses of a more customized peer group selected by Lipper (based on such factors as asset size). The Board also noted that the expense limitations agreed to by DIMA helped to ensure that the Fund's total (net) operating expenses would remain competitive.
The information considered by the Board as part of its review of management fees included information regarding fees charged by DIMA and its affiliates to similar institutional accounts and to similar funds offered primarily to European investors ("DWS Europe funds"), in each case as applicable. The Board observed that advisory fee rates for institutional accounts generally were lower than the management fees charged by similarly managed DWS U.S. mutual funds ("DWS Funds"), but also took note of the differences in services provided to DWS Funds as compared to institutional accounts. In the case of DWS Europe funds, the Board observed that fee rates for DWS Europe funds generally were higher than for similarly managed DWS Funds, but noted that differences in the types of services provided to DWS Funds relative to DWS Europe funds made it difficult to compare such fees.
On the basis of the information provided, the Board concluded that management fees were reasonable and appropriate in light of the nature, quality and extent of services provided by DIMA.
Profitability. The Board reviewed detailed information regarding revenues received by DIMA under the Agreement. The Board considered the estimated costs and pre-tax profits realized by DIMA from advising the DWS Funds, as well as estimates of the pre-tax profits attributable to managing the Fund in particular. The Board also received information regarding the estimated enterprise-wide profitability of DWS and its affiliates with respect to all fund services in totality and by fund. The Board and the Fee Consultant reviewed DIMA's methodology in allocating its costs to the management of the Fund. Based on the information provided, the Board concluded that the pre-tax profits realized by DIMA in connection with the management of the Fund were not unreasonable. The Board also reviewed information regarding the profitability of certain similar investment management firms. The Board noted that while information regarding the profitability of such firms is limited (and in some cases is not necessarily prepared on a comparable basis), DIMA and its affiliates' overall profitability with respect to the DWS fund complex (after taking into account distribution and other services provided to the funds by DIMA and its affiliates) was lower than the overall profitability levels of many comparable firms for which such data was available.
Economies of Scale. The Board considered whether there are economies of scale with respect to the management of the Fund and whether the Fund benefits from any economies of scale. The Board noted that the Fund's management fee schedule includes fee breakpoints. The Board concluded that the Fund's fee schedule represents an appropriate sharing between the Fund and DIMA of such economies of scale as may exist in the management of the Fund at current asset levels.
Other Benefits to DIMA and Its Affiliates. The Board also considered the character and amount of other incidental benefits received by DIMA and its affiliates, including any fees received by DIMA for administrative services provided to the Fund and any fees received by an affiliate of DIMA for distribution services. The Board also considered benefits to DIMA related to brokerage and soft-dollar allocations, including allocating brokerage to pay for research generated by parties other than the executing broker dealers, which pertain primarily to funds investing in equity securities, along with the incidental public relations benefits to DIMA related to DWS Funds advertising and cross-selling opportunities among DIMA products and services. The Board concluded that management fees were reasonable in light of these fallout benefits.
Compliance. The Board considered the significant attention and resources dedicated by DIMA to documenting and enhancing its compliance processes in recent years. The Board noted in particular (i) the experience and seniority of both DIMA's chief compliance officer and the Fund's chief compliance officer; (ii) the large number of DIMA compliance personnel; and (iii) the substantial commitment of resources by DIMA and its affiliates to compliance matters.
Based on all of the information considered and the conclusions reached, the Board unanimously determined that the continuation of the Agreement is in the best interests of the Fund. In making this determination, the Board did not give particular weight to any single factor identified above. The Board considered these factors over the course of numerous meetings, certain of which were in executive session with only the Independent Trustees and their independent counsel present. It is possible that individual Trustees may have weighed these factors differently in reaching their individual decisions to approve the continuation of the Agreement.
The following table presents certain information regarding the Board Members and Officers of the fund. Each Board Member's year of birth is set forth in parentheses after his or her name. Unless otherwise noted, (i) each Board Member has engaged in the principal occupation(s) noted in the table for at least the most recent five years, although not necessarily in the same capacity; and (ii) the address of each Independent Board Member is c/o Kenneth C. Froewiss, Chairman, DWS Mutual Funds, P.O. Box 78, Short Hills, NJ 07078. Except as otherwise noted below, the term of office for each Board Member is until the election and qualification of a successor, or until such Board Member sooner dies, resigns, is removed or as otherwise provided in the governing documents of the fund. Because the fund does not hold an annual meeting of shareholders, each Board Member will hold office for an indeterminate period. The Board Members may also serve in similar capacities with other funds in the fund complex.
| Independent Board Members | ||||
Name, Year of Birth, Position with the Fund and Length of Time Served1 | Business Experience and Directorships During the Past Five Years | Number of Funds in DWS Fund Complex Overseen | Other Directorships Held by Board Member | |
Kenneth C. Froewiss (1945) Chairperson since 2013, and Board Member since 2001 | Adjunct Professor of Finance, NYU Stern School of Business (September 2009–present; Clinical Professor from 1997–September 2009); Member, Finance Committee, Association for Asian Studies (2002–present); Director, Mitsui Sumitomo Insurance Group (US) (2004–present); prior thereto, Managing Director, J.P. Morgan (investment banking firm) (until 1996) | 103 | — | |
William McClayton (1944) Vice Chairperson since 2013, and Board Member since 2004 | Private equity investor (since October 2009); previously, Managing Director, Diamond Management & Technology Consultants, Inc. (global consulting firm) (2001–2009); Directorship: Board of Managers, YMCA of Metropolitan Chicago; formerly: Senior Partner, Arthur Andersen LLP (accounting) (1966–2001); Trustee, Ravinia Festival | 103 | — | |
John W. Ballantine (1946) Board Member since 1999 | Retired; formerly, Executive Vice President and Chief Risk Management Officer, First Chicago NBD Corporation/The First National Bank of Chicago (1996–1998); Executive Vice President and Head of International Banking (1995–1996); former Directorships: Stockwell Capital Investments PLC (private equity); First Oak Brook Bancshares, Inc. and Oak Brook Bank; Prisma Energy International | 103 | Chairman of the Board, Healthways, Inc.2 (provider of disease and care management services) (2003– present); Portland General Electric2 (utility company) (2003– present) | |
Henry P. Becton, Jr. (1943) Board Member since 1990 | Vice Chair and former President, WGBH Educational Foundation. Directorships: Public Radio International; Public Radio Exchange (PRX); North Bennett Street School (Boston); former Directorships: The PBS Foundation; Association of Public Television Stations; Boston Museum of Science; American Public Television; Concord Academy; New England Aquarium; Mass. Corporation for Educational Telecommunications; Committee for Economic Development; Public Broadcasting Service; Connecticut College | 103 | Lead Director, Becton Dickinson and Company2 (medical technology company); Lead Director, Belo Corporation2 (media company) | |
Dawn-Marie Driscoll (1946) Board Member since 1987 | President, Driscoll Associates (consulting firm); Emeritus Executive Fellow, Center for Business Ethics, Bentley University; formerly, Partner, Palmer & Dodge (1988–1990); Vice President of Corporate Affairs and General Counsel, Filene's (1978–1988). Directorships: Director of ICI Mutual Insurance Company (since 2007); Advisory Board, Center for Business Ethics, Bentley University; Chairman of the Board of Trustees, Southwest Florida Community Foundation (charitable organization); former Directorships: Sun Capital Advisers Trust (mutual funds) (2007–2012), Investment Company Institute (audit, executive, nominating committees) and Independent Directors Council (governance, executive committees) | 103 | — | |
Keith R. Fox, CFA (1954) Board Member since 1996 | Managing General Partner, Exeter Capital Partners (a series of private investment funds) (since 1986). Directorships: Progressive International Corporation (kitchen goods importer and distributor); The Kennel Shop (retailer); former Chairman, National Association of Small Business Investment Companies; former Directorships: BoxTop Media Inc. (advertising); Sun Capital Advisers Trust (mutual funds) (2011–2012) | 103 | — | |
Paul K. Freeman (1950) Board Member since 1993 | Consultant, World Bank/Inter-American Development Bank; Executive and Governing Council of the Independent Directors Council (Chairman of Education Committee); formerly: Project Leader, International Institute for Applied Systems Analysis (1998–2001); Chief Executive Officer, The Eric Group, Inc. (environmental insurance) (1986–1998); Directorships: Denver Zoo Foundation (December 2012–present); former Directorships: Prisma Energy International | 103 | — | |
Richard J. Herring (1946) Board Member since 1990 | Jacob Safra Professor of International Banking and Professor, Finance Department, The Wharton School, University of Pennsylvania (since July 1972); Co-Director, Wharton Financial Institutions Center (since July 2000); Co-Chair, U.S. Shadow Financial Regulatory Committee; Executive Director, Financial Economists Roundtable; formerly: Vice Dean and Director, Wharton Undergraduate Division (July 1995–June 2000); Director, Lauder Institute of International Management Studies (July 2000–June 2006) | 103 | Director, Japan Equity Fund, Inc. (since September 2007), Thai Capital Fund, Inc. (since 2007), Singapore Fund, Inc. (since September 2007), Independent Director of Barclays Bank Delaware (since September 2010) | |
Rebecca W. Rimel (1951) Board Member since 1995 | President and Chief Executive Officer, The Pew Charitable Trusts (charitable organization) (1994 to present); formerly: Executive Vice President, The Glenmede Trust Company (investment trust and wealth management) (1983–2004); Board Member, Investor Education (charitable organization) (2004–2005); Trustee, Executive Committee, Philadelphia Chamber of Commerce (2001–2007); Director, Viasys Health Care2 (January 2007–June 2007); Trustee, Thomas Jefferson Foundation (charitable organization) (1994–2012) | 103 | Director, Becton Dickinson and Company2 (medical technology company) (2012– present); Director, CardioNet, Inc.2 (health care) (2009– present) | |
William N. Searcy, Jr. (1946) Board Member since 1993 | Private investor since October 2003; formerly: Pension & Savings Trust Officer, Sprint Corporation2 (telecommunications) (November 1989–September 2003); Trustee, Sun Capital Advisers Trust (mutual funds) (1998–2012) | 103 | — | |
Jean Gleason Stromberg (1943) Board Member since 1997 | Retired. Formerly, Consultant (1997–2001); Director, Financial Markets U.S. Government Accountability Office (1996–1997); Partner, Fulbright & Jaworski, L.L.P. (law firm) (1978–1996). Directorships: The William and Flora Hewlett Foundation; former Directorships: Service Source, Inc., Mutual Fund Directors Forum (2002–2004), American Bar Retirement Association (funding vehicle for retirement plans) (1987–1990 and 1994–1996) | 103 | — | |
Robert H. Wadsworth (1940) Board Member since 1999 | President, Robert H. Wadsworth & Associates, Inc. (consulting firm) (1983 to present); Director, National Horizon, Inc. (non-profit organization); Director and Treasurer, The Phoenix Boys Choir Association | 106 | — | |
Officers4 | ||
Name, Year of Birth, Position with the Fund and Length of Time Served5 | Business Experience and Directorships During the Past Five Years | |
Brian E. Binder8,9 (1972) President and Chief Executive Officer, 2013–present | Managing Director3 and Head of Fund Administration, Deutsche Asset & Wealth Management (2013–present); formerly: Head of Business Management and Consulting at Invesco, Ltd. (2010–2012); Chief Administrative Officer, Van Kampen Funds Inc. (2008–2010); and Chief Administrative Officer, Morgan Stanley Investment Management Americas Distribution (2003–2008) | |
John Millette7 (1962) Vice President and Secretary, 1999–present | Director,3 Deutsche Asset & Wealth Management | |
Paul H. Schubert6 (1963) Chief Financial Officer, 2004–present Treasurer, 2005–present | Managing Director,3 Deutsche Asset & Wealth Management (since July 2004); formerly: Executive Director, Head of Mutual Fund Services and Treasurer for UBS Family of Funds (1998–2004); Vice President and Director of Mutual Fund Finance at UBS Global Asset Management (1994–1998) | |
Caroline Pearson7 (1962) Chief Legal Officer, 2010–present | Managing Director,3 Deutsche Asset & Wealth Management; formerly: Assistant Secretary for DWS family of funds (1997–2010) | |
Melinda Morrow6 (1970) Vice President, 2012–present | Director,3 Deutsche Asset & Wealth Management | |
Hepsen Uzcan7 (1974) Assistant Secretary, 2013–present | Vice President, Deutsche Asset & Wealth Management | |
Paul Antosca7 (1957) Assistant Treasurer, 2007–present | Director,3 Deutsche Asset & Wealth Management | |
Jack Clark7 (1967) Assistant Treasurer, 2007–present | Director,3 Deutsche Asset & Wealth Management | |
Diane Kenneally7 (1966) Assistant Treasurer, 2007–present | Director,3 Deutsche Asset & Wealth Management | |
John Caruso6 (1965) Anti-Money Laundering Compliance Officer, 2010–present | Managing Director,3 Deutsche Asset & Wealth Management | |
Robert Kloby6 (1962) Chief Compliance Officer, 2006–present | Managing Director,3 Deutsche Asset & Wealth Management | |
1 The length of time served represents the year in which the Board Member joined the board of one or more DWS funds currently overseen by the Board.
2 A publicly held company with securities registered pursuant to Section 12 of the Securities Exchange Act of 1934.
3 Executive title, not a board directorship.
4 As a result of their respective positions held with the Advisor, these individuals are considered "interested persons" of the Advisor within the meaning of the 1940 Act. Interested persons receive no compensation from the fund.
5 The length of time served represents the year in which the officer was first elected in such capacity for one or more DWS funds.
6 Address: 60 Wall Street, New York, NY 10005.
7 Address: One Beacon Street, Boston, MA 02108.
8 Address: 222 South Riverside Plaza, Chicago, IL 60606.
9 Effective as of December 1, 2013.
The fund's Statement of Additional Information ("SAI") includes additional information about the Board Members. The SAI is available, without charge, upon request. If you would like to request a copy of the SAI, you may do so by calling the following toll-free number: (800) 728-3337.
DWS Investments Distributors, Inc.
222 South Riverside Plaza
Chicago, IL 60606
(800) 621-1148
VS2GAS-2 (R-025831-3 2/14)
December 31, 2013
Annual Report
DWS Variable Series II
DWS High Income VIP
Contents
3 Performance Summary 4 Management Summary 5 Portfolio Summary 6 Investment Portfolio 17 Statement of Assets and Liabilities 18 Statement of Operations 19 Statement of Changes in Net Assets 20 Financial Highlights 21 Notes to Financial Statements 28 Report of Independent Registered Public Accounting Firm 29 Information About Your Fund's Expenses 30 Tax Information 30 Proxy Voting 31 Advisory Agreement Board Considerations and Fee Evaluation 34 Board Members and Officers |
This report must be preceded or accompanied by a prospectus. To obtain an additional prospectus or summary prospectus, if available, call (800) 728-3337 or your financial representative. We advise you to consider the Fund's objectives, risks, charges and expenses carefully before investing. The summary prospectus and prospectus contain this and other important information about the Fund. Please read the prospectus carefully before you invest.
Bond investments are subject to interest-rate and credit risks. When interest rates rise, bond prices generally fall. Credit risk refers to the ability of an issuer to make timely payments of principal and interest. Investments in lower-quality ("junk bonds") and non-rated securities present greater risk of loss than investments in higher-quality securities. Investing in derivatives entails special risks relating to liquidity, leverage and credit that may reduce returns and/or increase volatility. The Fund may lend securities to approved institutions. See the prospectus for details.
Deutsche Asset & Wealth Management represents the asset management and wealth management activities conducted by Deutsche Bank AG or any of its subsidiaries, including the Advisor and DWS Investments Distributors, Inc.
NOT FDIC/NCUA INSURED NO BANK GUARANTEE MAY LOSE VALUE NOT A DEPOSIT
NOT INSURED BY ANY FEDERAL GOVERNMENT AGENCY
Fund performance shown is historical, assumes reinvestment of all dividend and capital gain distributions and does not guarantee future results. Investment return and principal value fluctuate with changing market conditions so that, when redeemed, shares may be worth more or less than their original cost. Current performance may be lower or higher than the performance data quoted. Please contact your participating insurance company for the Fund's most recent month-end performance. Performance doesn't reflect charges and fees ("contract charges") associated with the separate account that invests in the Fund or any variable life insurance policy or variable annuity contract for which the Fund is an investment option. These charges and fees will reduce returns. While all share classes have the same underlying portfolio, their performance will differ.
The gross expense ratios of the Fund, as stated in the fee table of the prospectus dated May 1, 2013 are 0.72% and 0.99% for Class A and Class B shares, respectively, and may differ from the expense ratios disclosed in the Financial Highlights tables in this report.
| Growth of an Assumed $10,000 Investment in DWS High Income VIP | ||
 | The Credit Suisse High Yield Index tracks the performance of the global high-yield debt market. Index returns do not reflect any fees or expenses and it is not possible to invest directly into an index. | |
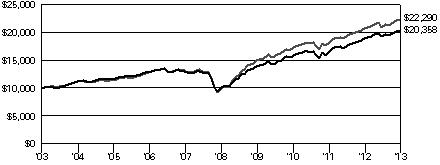 | ||
| Yearly periods ended December 31 | ||
| Comparative Results | |||||||||||||||||
| DWS High Income VIP | 1-Year | 3-Year | 5-Year | 10-Year | |||||||||||||
| Class A | Growth of $10,000 | $ | 10,791 | $ | 12,877 | $ | 20,549 | $ | 20,358 | ||||||||
| Average annual total return | 7.91 | % | 8.79 | % | 15.49 | % | 7.37 | % | |||||||||
| Credit Suisse High Yield Index | Growth of $10,000 | $ | 10,753 | $ | 13,010 | $ | 22,957 | $ | 22,290 | ||||||||
| Average annual total return | 7.53 | % | 9.17 | % | 18.08 | % | 8.35 | % | |||||||||
| DWS High Income VIP | 1-Year | 3-Year | 5-Year | 10-Year | |||||||||||||
| Class B | Growth of $10,000 | $ | 10,744 | $ | 12,763 | $ | 20,253 | $ | 19,717 | ||||||||
| Average annual total return | 7.44 | % | 8.47 | % | 15.16 | % | 7.02 | % | |||||||||
| Credit Suisse High Yield Index | Growth of $10,000 | $ | 10,753 | $ | 13,010 | $ | 22,957 | $ | 22,290 | ||||||||
| Average annual total return | 7.53 | % | 9.17 | % | 18.08 | % | 8.35 | % | |||||||||
The growth of $10,000 is cumulative.
High-yield bonds performed very well in 2013, as gauged by the 7.53% return of the Fund's benchmark, the Credit Suisse High Yield Index.1 The Class A shares of the Fund returned 7.91% (unadjusted for contract charges) during 2013, outperforming the benchmark. The asset class soundly outperformed investment-grade bonds, as measured by the –2.02% return of the Barclays U.S. Aggregate Bond Index.2
The year was generally positive for high-yield bonds, as signs of improving economic growth helped fuel a recovery in investors' appetite for higher-risk assets. In addition, the default rate for high-yield issuers remained very low on a historical basis. Double-digit returns for the stock market, along with investors' general preference for higher-yielding asset classes, also contributed to the healthy performance results.
The positive backdrop was reflected in a decline in the yield spread between high-yield bonds and U.S. Treasuries of comparable maturity during the period.3 The BofA Merrill Lynch U.S. High Yield Master II Option-Adjusted Spread closed the year at 4.00 percentage points, down from 5.34 one year ago.4
Consistent with our bottom-up approach, individual security selection was the primary driver of the Fund's outperformance. The leading contributors to performance were Leap Wireless, Fage Dairy Industry SA and DynCorp International, Inc., while the largest detractors were our positions in Getty Images, Inc. and Windstream Corp.
In terms of portfolio structure, at the end of the year, the Fund was overweight vs. the benchmark in securities rated B. This position represents our belief that this credit tier tends to have a low correlation with U.S. Treasuries, which we believe was a potentially positive attribute in an environment similar to what we saw during the year.5 The Fund was also underweight in BB-rated issues and neutral in bonds rated CCC, but we were selectively taking advantage of opportunities in the CCC tier where the risk-reward trade-off was attractive during the year.6
We retain a positive outlook on high-yield bonds based on our expectation for low defaults and satisfactory economic growth, together with their attractive yields relative to government bonds. We continue to focus on using credit research to identify the most compelling investment opportunities for the Fund. We manage the portfolio from a long-term perspective. When seeking to meet its objective of high current income, we do not take on excessive risk for the sake of short-term returns. Instead, we strive to generate outperformance over a multiyear period by achieving an appropriate trade-off of risk and return.
Gary Russell, CFA
Portfolio Manager
The views expressed reflect those of the portfolio management team only through the end of the period of the report as stated on the cover. The management team's views are subject to change at any time based on market and other conditions and should not be construed as a recommendation. Past performance is no guarantee of future results. Current and future portfolio holdings are subject to risk.
1 The Credit Suisse High Yield Index tracks the performance of the global high-yield debt market.
2 The Barclays U.S. Aggregate Bond Index is an unmanaged index representing domestic taxable investment-grade bonds, with index components for government and corporate securities, mortgage pass-through securities, and asset-backed securities with an average maturity of one year or more.
Index returns do not reflect fees or expenses and it is not possible to invest directly into an index.
3 "Spread" refers to the excess yield various bond sectors offer over financial instruments with similar maturities. When spreads widen, yield differences are increasing between bonds in the two sectors being compared. When spreads narrow, the opposite is true
4 The BofA Merrill Lynch Option-Adjusted Spreads (OASs) are the calculated spreads between a computed OAS index of all bonds in a given rating category and a spot Treasury curve. An OAS index is constructed using each constituent bond's OAS, weighted by market capitalization. The BofA Merrill Lynch U.S. High Yield Master II Option-Adjusted Spread (OAS) uses an index of bonds that are below investment grade (those rated BB or below).
5 "Overweight" means the Fund holds a higher weighting in a given sector or security than the benchmark. "Underweight" means it holds a lower weighting.
6 Credit quality measures a bond issuer's ability to repay interest and principal in a timely manner. Rating agencies assign letter designations, such as AAA, AA and so forth. The lower the rating, the higher the probability of default. Credit quality does not remove market risk and is subject to change.
Asset Allocation (As a % of Investment Portfolio excluding Securities Lending Collateral) | 12/31/13 | 12/31/12 |
| Corporate Bonds | 82% | 86% |
| Cash Equivalents | 10% | 11% |
| Government & Agency Obligations | 4% | — |
| Convertible Bonds | 2% | 1% |
| Preferred Securities | 1% | 1% |
| Preferred Stocks | 1% | 1% |
| 100% | 100% |
Sector Diversification (As a % of Investment Portfolio excluding Government & Agency Obligations, Cash Equivalents and Securities Lending Collateral) | 12/31/13 | 12/31/12 |
| Telecommunication Services | 20% | 16% |
| Consumer Discretionary | 19% | 23% |
| Energy | 15% | 13% |
| Industrials | 10% | 9% |
| Materials | 10% | 11% |
| Consumer Staples | 7% | 4% |
| Financials | 6% | 10% |
| Information Technology | 6% | 5% |
| Health Care | 5% | 6% |
| Utilities | 2% | 3% |
| 100% | 100% |
Quality (As a % of Investment Portfolio excluding Cash Equivalents and Securities Lending Collateral) | 12/31/13 | 12/31/12 |
| AAA | 4% | — |
| BBB | 2% | 2% |
| BB | 36% | 29% |
| B | 44% | 57% |
| CCC | 12% | 10% |
| CC | — | 1% |
| Not Rated | 2% | 1% |
| 100% | 100% |
The quality ratings represent the higher of Moody's Investors Service, Inc. ("Moody's") or Standard & Poor's Corporation ("S&P") credit ratings. The ratings of Moody's and S&P represent their opinions as to the quality of the securities they rate. Credit quality measures a bond issuer's ability to repay interest and principal in a timely manner. Ratings are relative and subjective and are not absolute standards of quality. Credit quality does not remove market risk and is subject to change.
Portfolio holdings and characteristics are subject to change.
For more complete details about the Fund's investment portfolio, see page 6.
Following the Fund's fiscal first and third quarter-end, a complete portfolio holdings listing is filed with the SEC on Form N-Q. The form will be available on the SEC's Web site at sec.gov, and it also may be reviewed and copied at the SEC's Public Reference Room in Washington, D.C. Information on the operation of the SEC's Public Reference Room may be obtained by calling (800) SEC-0330. The Fund's portfolio holdings are also posted on dws-investments.com from time to time. Please see the Fund's current prospectus for more information.
| Principal Amount ($)(a) | Value ($) | |||
| Corporate Bonds 81.3% | ||||
| Consumer Discretionary 15.5% | ||||
| AMC Entertainment, Inc., 8.75%, 6/1/2019 | 170,000 | 181,688 | ||
| AMC Networks, Inc., 7.75%, 7/15/2021 | 80,000 | 90,000 | ||
| AmeriGas Finance LLC: | ||||
| 6.75%, 5/20/2020 | 460,000 | 502,550 | ||
| 7.0%, 5/20/2022 | 350,000 | 379,750 | ||
| APX Group, Inc.: | ||||
| 6.375%, 12/1/2019 | 205,000 | 208,075 | ||
| 144A, 8.75%, 12/1/2020 | 25,000 | 25,438 | ||
| Asbury Automotive Group, Inc., 8.375%, 11/15/2020 | 505,000 | 567,494 | ||
| Ashtead Capital, Inc., 144A, 6.5%, 7/15/2022 | 330,000 | 351,862 | ||
| Ashton Woods U.S.A. LLC, 144A, 6.875%, 2/15/2021 | 350,000 | 345,625 | ||
| Avis Budget Car Rental LLC: | ||||
| 5.5%, 4/1/2023 (b) | 205,000 | 198,594 | ||
| 8.25%, 1/15/2019 | 535,000 | 583,150 | ||
| BC Mountain LLC, 144A, 7.0%, 2/1/2021 | 210,000 | 212,100 | ||
| Block Communications, Inc., 144A, 7.25%, 2/1/2020 | 375,000 | 397,500 | ||
| Boyd Gaming Corp., 9.0%, 7/1/2020 (b) | 155,000 | 169,725 | ||
| Cablevision Systems Corp., 8.0%, 4/15/2020 (b) | 65,000 | 72,638 | ||
| Caesar's Entertainment Operating Co., Inc.: | ||||
| 8.5%, 2/15/2020 | 760,000 | 731,500 | ||
| 9.0%, 2/15/2020 (b) | 245,000 | 238,263 | ||
| Carlson Wagonlit BV, 144A, 6.875%, 6/15/2019 | 215,000 | 223,063 | ||
| CCO Holdings LLC: | ||||
| 6.5%, 4/30/2021 | 655,000 | 673,012 | ||
| 6.625%, 1/31/2022 | 450,000 | 463,500 | ||
| 7.0%, 1/15/2019 (b) | 120,000 | 126,450 | ||
| 7.375%, 6/1/2020 | 50,000 | 54,125 | ||
| 8.125%, 4/30/2020 | 150,000 | 162,750 | ||
| CDR DB Sub, Inc., 144A, 7.75%, 10/15/2020 | 230,000 | 228,850 | ||
| Cequel Communications Holdings I LLC: | ||||
| 144A, 5.125%, 12/15/2021 | 355,000 | 332,812 | ||
| 144A, 6.375%, 9/15/2020 | 1,215,000 | 1,245,375 | ||
| Chester Downs & Marina LLC, 144A, 9.25%, 2/1/2020 (b) | 145,000 | 145,363 | ||
| Clear Channel Communications, Inc., 11.25%, 3/1/2021 | 280,000 | 301,000 | ||
| Clear Channel Worldwide Holdings, Inc.: | ||||
| Series A, 6.5%, 11/15/2022 | 250,000 | 253,437 | ||
| Series B, 6.5%, 11/15/2022 | 365,000 | 372,756 | ||
| Series A, 7.625%, 3/15/2020 | 110,000 | 114,400 | ||
| Series B, 7.625%, 3/15/2020 (b) | 1,115,000 | 1,172,144 | ||
| Cogeco Cable, Inc., 144A, 4.875%, 5/1/2020 | 20,000 | 19,300 | ||
| Cumulus Media Holdings, Inc., 7.75%, 5/1/2019 (b) | 375,000 | 395,625 | ||
| Principal Amount ($)(a) | Value ($) | |||
| DISH DBS Corp.: | ||||
| 4.25%, 4/1/2018 | 270,000 | 275,400 | ||
| 5.0%, 3/15/2023 | 325,000 | 303,062 | ||
| 6.75%, 6/1/2021 | 50,000 | 53,000 | ||
| 7.875%, 9/1/2019 | 270,000 | 309,150 | ||
| GLP Capital LP, 144A, 4.375%, 11/1/2018 | 95,000 | 97,138 | ||
| Griffey Intermediate, Inc., 144A, 7.0%, 10/15/2020 (b) | 405,000 | 320,962 | ||
| Harron Communications LP, 144A, 9.125%, 4/1/2020 | 395,000 | 437,462 | ||
| Hertz Corp., 6.75%, 4/15/2019 | 305,000 | 328,637 | ||
| Hertz Holdings Netherlands BV, 144A, 4.375%, 1/15/2019 | EUR | 580,000 | 798,903 | |
| Hot Topic, Inc., 144A, 9.25%, 6/15/2021 | 140,000 | 146,650 | ||
| Jo-Ann Stores Holdings, Inc., 144A, 9.75%, 10/15/2019 (PIK) | 475,000 | 496,969 | ||
| Libbey Glass, Inc., 6.875%, 5/15/2020 | 117,000 | 126,360 | ||
| Live Nation Entertainment, Inc., 144A, 7.0%, 9/1/2020 | 345,000 | 374,325 | ||
| MDC Partners, Inc., 144A, 6.75%, 4/1/2020 | 240,000 | 251,100 | ||
| Mediacom Broadband LLC, 6.375%, 4/1/2023 | 425,000 | 434,562 | ||
| Mediacom LLC, 7.25%, 2/15/2022 | 110,000 | 116,600 | ||
| MGM Resorts International: | ||||
| 6.625%, 12/15/2021 (b) | 590,000 | 623,925 | ||
| 6.75%, 10/1/2020 (b) | 170,000 | 181,900 | ||
| 8.625%, 2/1/2019 | 840,000 | 984,900 | ||
| 10.0%, 11/1/2016 | 225,000 | 270,000 | ||
| Midcontinent Communications & Midcontinent Finance Corp., 144A, 6.25%, 8/1/2021 | 200,000 | 201,500 | ||
| Petco Animal Supplies, Inc., 144A, 9.25%, 12/1/2018 | 315,000 | 337,837 | ||
| PNK Finance Corp., 144A, 6.375%, 8/1/2021 | 245,000 | 250,513 | ||
| Quebecor Media, Inc., 5.75%, 1/15/2023 | 205,000 | 198,338 | ||
| Rent-A-Center, Inc., 4.75%, 5/1/2021 | 145,000 | 136,119 | ||
| Schaeffler Finance BV, 144A, 7.75%, 2/15/2017 | 420,000 | 476,700 | ||
| Seminole Hard Rock Entertainment, Inc., 144A, 5.875%, 5/15/2021 | 125,000 | 122,813 | ||
| Seminole Indian Tribe of Florida, Inc., 144A, 7.804%, 10/1/2020 | 345,000 | 377,775 | ||
| Serta Simmons Holdings LLC, 144A, 8.125%, 10/1/2020 (b) | 230,000 | 250,125 | ||
| Sirius XM Holdings, Inc., 144A, 5.875%, 10/1/2020 (b) | 195,000 | 198,900 | ||
| SIWF Merger Sub, Inc., 144A, 6.25%, 6/1/2021 (b) | 295,000 | 297,581 | ||
| Starz LLC, 5.0%, 9/15/2019 | 175,000 | 178,938 | ||
| Taylor Morrison Communities, Inc., 144A, 5.25%, 4/15/2021 (b) | 250,000 | 243,125 | ||
| Principal Amount ($)(a) | Value ($) | |||
| Travelport LLC: | ||||
| 144A, 6.364%**, 3/1/2016 | 227,786 | 228,925 | ||
| 144A, 13.875%, 3/1/2016 (PIK) | 51,208 | 54,280 | ||
| UCI International, Inc., 8.625%, 2/15/2019 | 310,000 | 310,000 | ||
| Unitymedia Hessen GmbH & Co., KG: | ||||
| 144A, 5.5%, 1/15/2023 | 945,000 | 916,650 | ||
| 144A, 7.5%, 3/15/2019 | 435,000 | 473,062 | ||
| Unitymedia KabelBW GmbH, 144A, 9.625%, 12/1/2019 | EUR | 550,000 | 837,973 | |
| Univision Communications, Inc.: | ||||
| 144A, 6.875%, 5/15/2019 | 60,000 | 64,125 | ||
| 144A, 7.875%, 11/1/2020 | 140,000 | 153,825 | ||
| Viking Cruises Ltd., 144A, 8.5%, 10/15/2022 | 205,000 | 231,650 | ||
| Visant Corp., 10.0%, 10/1/2017 | 460,000 | 446,200 | ||
| Visteon Corp., 6.75%, 4/15/2019 | 152,000 | 161,500 | ||
| 25,619,373 | ||||
| Consumer Staples 5.6% | ||||
| B&G Foods, Inc., 4.625%, 6/1/2021 | 245,000 | 235,200 | ||
| Chiquita Brands International, Inc., 144A, 7.875%, 2/1/2021 | 200,000 | 216,500 | ||
| Del Monte Corp., 7.625%, 2/15/2019 | 410,000 | 425,887 | ||
| FAGE Dairy Industry SA, 144A, 9.875%, 2/1/2020 (b) | 810,000 | 846,450 | ||
| Hawk Acquisition Sub, Inc., 144A, 4.25%, 10/15/2020 | 860,000 | 832,050 | ||
| JBS Investments GmbH, 144A, 7.75%, 10/28/2020 | 405,000 | 409,050 | ||
| JBS U.S.A. LLC: | ||||
| 144A, 7.25%, 6/1/2021 | 485,000 | 504,400 | ||
| 144A, 8.25%, 2/1/2020 | 160,000 | 173,600 | ||
| Pilgrim's Pride Corp., 7.875%, 12/15/2018 | 290,000 | 316,100 | ||
| Reynolds Group Issuer, Inc.: | ||||
| 5.75%, 10/15/2020 | 405,000 | 413,100 | ||
| 6.875%, 2/15/2021 | 540,000 | 581,850 | ||
| 7.125%, 4/15/2019 | 415,000 | 441,975 | ||
| 8.25%, 2/15/2021 (b) | 225,000 | 240,188 | ||
| Roundy's Supermarkets, Inc., 144A, 10.25%, 12/15/2020 | 220,000 | 224,400 | ||
| Smithfield Foods, Inc.: | ||||
| 6.625%, 8/15/2022 | 190,000 | 201,400 | ||
| 7.75%, 7/1/2017 | 1,180,000 | 1,383,550 | ||
| Sun Products Corp., 144A, 7.75%, 3/15/2021 | 360,000 | 316,800 | ||
| U.S. Foods, Inc., 8.5%, 6/30/2019 | 400,000 | 438,000 | ||
| Viskase Companies, Inc., 144A, 9.875%, 1/15/2018 | 940,000 | 988,128 | ||
| 9,188,628 | ||||
| Energy 12.6% | ||||
| Access Midstream Partners LP: | ||||
| 4.875%, 5/15/2023 | 375,000 | 361,875 | ||
| 6.125%, 7/15/2022 | 325,000 | 347,750 | ||
| Antero Resources Finance Corp.: | ||||
| 144A, 5.375%, 11/1/2021 | 220,000 | 222,200 | ||
| 7.25%, 8/1/2019 | 185,000 | 198,875 | ||
| Principal Amount ($)(a) | Value ($) | |||
| Berry Petroleum Co.: | ||||
| 6.375%, 9/15/2022 | 205,000 | 208,588 | ||
| 6.75%, 11/1/2020 | 680,000 | 705,500 | ||
| BreitBurn Energy Partners LP: | ||||
| 7.875%, 4/15/2022 | 700,000 | 728,000 | ||
| 8.625%, 10/15/2020 | 225,000 | 241,875 | ||
| Chaparral Energy, Inc.: | ||||
| 7.625%, 11/15/2022 | 465,000 | 497,550 | ||
| 8.25%, 9/1/2021 | 300,000 | 325,500 | ||
| Chesapeake Oilfield Operating LLC, 6.625%, 11/15/2019 | 150,000 | 157,125 | ||
| Crestwood Midstream Partners LP: | ||||
| 144A, 6.125%, 3/1/2022 | 165,000 | 169,125 | ||
| 7.75%, 4/1/2019 | 325,000 | 352,625 | ||
| Crosstex Energy LP, 7.125%, 6/1/2022 (b) | 105,000 | 119,438 | ||
| Denbury Resources, Inc., 4.625%, 7/15/2023 | 215,000 | 194,038 | ||
| Dresser-Rand Group, Inc., 6.5%, 5/1/2021 | 420,000 | 447,300 | ||
| Endeavor Energy Resources LP, 144A, 7.0%, 8/15/2021 | 295,000 | 297,950 | ||
| EP Energy LLC: | ||||
| 6.875%, 5/1/2019 | 330,000 | 355,162 | ||
| 7.75%, 9/1/2022 | 175,000 | 196,000 | ||
| 9.375%, 5/1/2020 | 150,000 | 173,063 | ||
| EPE Holdings LLC, 144A, 8.875%, 12/15/2017 (PIK) | 517,356 | 531,583 | ||
| EV Energy Partners LP, 8.0%, 4/15/2019 | 835,000 | 839,175 | ||
| Frontier Oil Corp., 6.875%, 11/15/2018 | 315,000 | 339,806 | ||
| Halcon Resources Corp.: | ||||
| 8.875%, 5/15/2021 | 585,000 | 590,850 | ||
| 9.75%, 7/15/2020 | 280,000 | 291,900 | ||
| 144A, 9.75%, 7/15/2020 | 220,000 | 229,075 | ||
| Holly Energy Partners LP: | ||||
| 6.5%, 3/1/2020 | 105,000 | 109,725 | ||
| 8.25%, 3/15/2018 | 330,000 | 348,150 | ||
| Kodiak Oil & Gas Corp., 5.5%, 1/15/2021 (b) | 400,000 | 399,000 | ||
| Linn Energy LLC: | ||||
| 6.5%, 5/15/2019 | 115,000 | 117,300 | ||
| 144A, 7.0%, 11/1/2019 | 595,000 | 600,950 | ||
| MEG Energy Corp.: | ||||
| 144A, 6.5%, 3/15/2021 | 235,000 | 247,338 | ||
| 144A, 7.0%, 3/31/2024 | 470,000 | 475,875 | ||
| Midstates Petroleum Co., Inc.: | ||||
| 9.25%, 6/1/2021 | 485,000 | 506,825 | ||
| 10.75%, 10/1/2020 | 585,000 | 636,187 | ||
| Murphy Oil U.S.A., Inc., 144A, 6.0%, 8/15/2023 | 290,000 | 291,450 | ||
| Murray Energy Corp., 144A, 8.625%, 6/15/2021 | 50,000 | 51,750 | ||
| Northern Oil & Gas, Inc., 8.0%, 6/1/2020 | 595,000 | 623,262 | ||
| Oasis Petroleum, Inc.: | ||||
| 6.5%, 11/1/2021 | 175,000 | 187,250 | ||
| 144A, 6.875%, 3/15/2022 | 385,000 | 408,100 | ||
| 6.875%, 1/15/2023 | 130,000 | 138,450 | ||
| 7.25%, 2/1/2019 | 665,000 | 714,875 | ||
| Offshore Group Investment Ltd.: | ||||
| 7.125%, 4/1/2023 | 410,000 | 418,200 | ||
| 7.5%, 11/1/2019 (b) | 745,000 | 810,187 | ||
| Pacific Drilling SA, 144A, 5.375%, 6/1/2020 | 245,000 | 246,225 | ||
| Principal Amount ($)(a) | Value ($) | |||
| QEP Resources, Inc., 5.25%, 5/1/2023 | 80,000 | 75,000 | ||
| Sabine Pass Liquefaction LLC: | ||||
| 144A, 5.625%, 2/1/2021 | 690,000 | 674,475 | ||
| 144A, 5.625%, 4/15/2023 | 155,000 | 144,925 | ||
| SandRidge Energy, Inc., 7.5%, 3/15/2021 | 515,000 | 539,462 | ||
| SESI LLC, 6.375%, 5/1/2019 | 235,000 | 250,863 | ||
| Swift Energy Co., 7.875%, 3/1/2022 | 290,000 | 287,100 | ||
| Talos Production LLC, 144A, 9.75%, 2/15/2018 | 410,000 | 419,225 | ||
| Tesoro Corp., 5.375%, 10/1/2022 (b) | 150,000 | 151,875 | ||
| Ultra Petroleum Corp., 144A, 5.75%, 12/15/2018 | 90,000 | 92,475 | ||
| Venoco, Inc., 8.875%, 2/15/2019 | 590,000 | 581,150 | ||
| Welltec AS, 144A, 8.0%, 2/1/2019 | 400,000 | 424,000 | ||
| Whiting Petroleum Corp., 5.0%, 3/15/2019 | 240,000 | 245,400 | ||
| WPX Energy, Inc., 5.25%, 1/15/2017 | 510,000 | 544,425 | ||
| 20,883,402 | ||||
| Financials 4.5% | ||||
| AerCap Aviation Solutions BV, 6.375%, 5/30/2017 | 470,000 | 508,775 | ||
| Ally Financial, Inc., 5.5%, 2/15/2017 | 385,000 | 416,762 | ||
| CIT Group, Inc.: | ||||
| 5.0%, 8/1/2023 | 1,610,000 | 1,549,625 | ||
| 5.25%, 3/15/2018 | 540,000 | 579,150 | ||
| E*TRADE Financial Corp.: | ||||
| 6.375%, 11/15/2019 | 585,000 | 628,144 | ||
| 6.75%, 6/1/2016 | 710,000 | 770,350 | ||
| Hellas Telecommunications Finance, 144A, 8.227%**, 7/15/2015 (PIK)* | EUR | 322,107 | 0 | |
| International Lease Finance Corp.: | ||||
| 3.875%, 4/15/2018 | 385,000 | 385,962 | ||
| 6.25%, 5/15/2019 | 320,000 | 346,400 | ||
| 8.625%, 1/15/2022 | 310,000 | 366,343 | ||
| 8.75%, 3/15/2017 | 245,000 | 288,488 | ||
| MPT Operating Partnership LP: | ||||
| (REIT), 6.375%, 2/15/2022 | 290,000 | 300,150 | ||
| (REIT), 6.875%, 5/1/2021 | 295,000 | 315,650 | ||
| Neuberger Berman Group LLC, 144A, 5.625%, 3/15/2020 | 160,000 | 168,000 | ||
| Societe Generale SA, 144A, 7.875%, 12/31/2049 | 825,000 | 830,775 | ||
| 7,454,574 | ||||
| Health Care 4.5% | ||||
| Aviv Healthcare Properties LP: | ||||
| 144A, 6.0%, 10/15/2021 | 100,000 | 101,750 | ||
| 7.75%, 2/15/2019 | 500,000 | 537,500 | ||
| Biomet, Inc.: | ||||
| 6.5%, 8/1/2020 | 355,000 | 372,750 | ||
| 6.5%, 10/1/2020 | 100,000 | 103,000 | ||
| Community Health Systems, Inc.: | ||||
| 5.125%, 8/15/2018 | 1,155,000 | 1,192,537 | ||
| 7.125%, 7/15/2020 (b) | 635,000 | 658,812 | ||
| Endo Finance Co., 144A, 5.75%, 1/15/2022 | 220,000 | 221,100 | ||
| Principal Amount ($)(a) | Value ($) | |||
| Fresenius Medical Care U.S. Finance II, Inc., 144A, 5.625%, 7/31/2019 | 220,000 | 237,600 | ||
| Fresenius U.S. Finance II, Inc., 144A, 9.0%, 7/15/2015 | 420,000 | 464,100 | ||
| HCA, Inc.: | ||||
| 5.875%, 3/15/2022 | 275,000 | 283,938 | ||
| 6.5%, 2/15/2020 | 890,000 | 977,887 | ||
| 7.5%, 2/15/2022 | 305,000 | 334,738 | ||
| Hologic, Inc., 6.25%, 8/1/2020 (b) | 200,000 | 211,000 | ||
| IMS Health, Inc., 144A, 6.0%, 11/1/2020 | 250,000 | 265,625 | ||
| LifePoint Hospitals, Inc., 144A, 5.5%, 12/1/2021 | 275,000 | 276,031 | ||
| Par Pharmaceutical Companies, Inc., 7.375%, 10/15/2020 | 345,000 | 356,644 | ||
| Physio-Control International, Inc., 144A, 9.875%, 1/15/2019 | 299,000 | 334,880 | ||
| Salix Pharmaceuticals Ltd., 144A, 6.0%, 1/15/2021 | 165,000 | 169,125 | ||
| Tenet Healthcare Corp.: | ||||
| 4.375%, 10/1/2021 | 390,000 | 366,600 | ||
| 4.5%, 4/1/2021 | 55,000 | 52,113 | ||
| 7,517,730 | ||||
| Industrials 8.6% | ||||
| Accuride Corp., 9.5%, 8/1/2018 | 345,000 | 337,237 | ||
| ADT Corp., 144A, 6.25%, 10/15/2021 | 145,000 | 152,250 | ||
| Aguila 3 SA, 144A, 7.875%, 1/31/2018 | 480,000 | 508,800 | ||
| Alphabet Holding Co., Inc.: | ||||
| 7.75%, 11/1/2017 (PIK) | 205,000 | 211,406 | ||
| 144A, 7.75%, 11/1/2017 (PIK) | 275,000 | 283,594 | ||
| Armored Autogroup, Inc., 9.25%, 11/1/2018 (b) | 610,000 | 587,125 | ||
| Artesyn Escrow, Inc., 144A, 9.75%, 10/15/2020 | 245,000 | 257,250 | ||
| AWAS Aviation Capital Ltd., 144A, 7.0%, 10/17/2016 | 366,680 | 379,514 | ||
| BakerCorp International, Inc., 8.25%, 6/1/2019 | 335,000 | 334,163 | ||
| BE Aerospace, Inc., 6.875%, 10/1/2020 | 180,000 | 197,550 | ||
| Belden, Inc., 144A, 5.5%, 9/1/2022 | 355,000 | 347,900 | ||
| Bombardier, Inc., 144A, 5.75%, 3/15/2022 | 225,000 | 223,313 | ||
| Casella Waste Systems, Inc., 7.75%, 2/15/2019 | 415,000 | 425,375 | ||
| Clean Harbors, Inc., 5.125%, 6/1/2021 | 240,000 | 242,400 | ||
| CTP Transportation Products LLC, 144A, 8.25%, 12/15/2019 | 275,000 | 286,688 | ||
| Darling Escrow Corp., 144A, 5.375%, 1/15/2022 (c) | 220,000 | 221,650 | ||
| DigitalGlobe, Inc., 144A, 5.25%, 2/1/2021 | 160,000 | 156,000 | ||
| Ducommun, Inc., 9.75%, 7/15/2018 | 305,000 | 339,312 | ||
| DynCorp International, Inc., 10.375%, 7/1/2017 | 490,000 | 501,025 | ||
| Florida East Coast Railway Corp., 8.125%, 2/1/2017 | 225,000 | 234,844 | ||
| FTI Consulting, Inc., 6.0%, 11/15/2022 | 205,000 | 207,563 | ||
| Garda World Security Corp., 144A, 7.25%, 11/15/2021 | 290,000 | 292,175 | ||
| GenCorp, Inc., 7.125%, 3/15/2021 | 790,000 | 845,300 | ||
| Principal Amount ($)(a) | Value ($) | |||
| Huntington Ingalls Industries, Inc.: | ||||
| 6.875%, 3/15/2018 | 280,000 | 302,400 | ||
| 7.125%, 3/15/2021 | 60,000 | 65,850 | ||
| Kenan Advantage Group, Inc., 144A, 8.375%, 12/15/2018 | 575,000 | 605,187 | ||
| Meritor, Inc., 6.75%, 6/15/2021 | 195,000 | 198,900 | ||
| Navios Maritime Holdings, Inc.: | ||||
| 144A, 7.375%, 1/15/2022 | 830,000 | 834,150 | ||
| 8.125%, 2/15/2019 | 410,000 | 421,275 | ||
| Navios South American Logistics, Inc., 9.25%, 4/15/2019 | 350,000 | 377,562 | ||
| Nortek, Inc., 8.5%, 4/15/2021 | 440,000 | 487,300 | ||
| Ply Gem Industries, Inc., 9.375%, 4/15/2017 | 102,000 | 110,160 | ||
| Spirit AeroSystems, Inc.: | ||||
| 6.75%, 12/15/2020 | 205,000 | 220,631 | ||
| 7.5%, 10/1/2017 | 215,000 | 223,600 | ||
| Titan International, Inc., 144A, 6.875%, 10/1/2020 | 590,000 | 615,075 | ||
| TransDigm, Inc., 7.5%, 7/15/2021 | 320,000 | 344,000 | ||
| United Rentals North America, Inc.: | ||||
| 5.75%, 7/15/2018 | 365,000 | 390,094 | ||
| 6.125%, 6/15/2023 | 25,000 | 25,375 | ||
| 7.375%, 5/15/2020 | 595,000 | 659,706 | ||
| 7.625%, 4/15/2022 | 595,000 | 661,194 | ||
| Watco Companies LLC, 144A, 6.375%, 4/1/2023 | 155,000 | 153,450 | ||
| 14,268,343 | ||||
| Information Technology 4.8% | ||||
| ACI Worldwide, Inc., 144A, 6.375%, 8/15/2020 | 105,000 | 109,725 | ||
| Activision Blizzard, Inc., 144A, 5.625%, 9/15/2021 | 695,000 | 719,325 | ||
| Alliance Data Systems Corp., 144A, 5.25%, 12/1/2017 | 255,000 | 264,562 | ||
| Audatex North America, Inc., 144A, 6.0%, 6/15/2021 | 155,000 | 162,363 | ||
| BMC Software Finance, Inc., 144A, 8.125%, 7/15/2021 | 340,000 | 350,200 | ||
| CDW LLC, 8.5%, 4/1/2019 | 1,180,000 | 1,303,900 | ||
| CyrusOne LP, 6.375%, 11/15/2022 | 105,000 | 108,675 | ||
| eAccess Ltd., 144A, 8.25%, 4/1/2018 | 335,000 | 365,987 | ||
| EarthLink, Inc., 7.375%, 6/1/2020 | 245,000 | 244,388 | ||
| Equinix, Inc.: | ||||
| 5.375%, 4/1/2023 | 725,000 | 708,687 | ||
| 7.0%, 7/15/2021 | 215,000 | 234,888 | ||
| First Data Corp.: | ||||
| 144A, 6.75%, 11/1/2020 | 940,000 | 977,600 | ||
| 144A, 7.375%, 6/15/2019 | 250,000 | 266,875 | ||
| 144A, 8.875%, 8/15/2020 | 495,000 | 547,594 | ||
| Freescale Semiconductor, Inc., 144A, 6.0%, 1/15/2022 | 275,000 | 278,437 | ||
| Healthcare Technology Intermediate, Inc., 144A, 7.375%, 9/1/2018 (PIK) | 75,000 | 78,000 | ||
| Hughes Satellite Systems Corp.: | ||||
| 6.5%, 6/15/2019 | 445,000 | 481,712 | ||
| 7.625%, 6/15/2021 | 230,000 | 256,450 | ||
| IAC/InterActiveCorp., 4.75%, 12/15/2022 | 215,000 | 200,488 | ||
| NCR Escrow Corp.: | ||||
| 144A, 5.875%, 12/15/2021 | 55,000 | 56,031 | ||
| 144A, 6.375%, 12/15/2023 | 135,000 | 137,869 | ||
| 7,853,756 | ||||
| Principal Amount ($)(a) | Value ($) | |||
| Materials 6.5% | ||||
| APERAM: | ||||
| 144A, 7.375%, 4/1/2016 | 215,000 | 220,913 | ||
| 144A, 7.75%, 4/1/2018 | 260,000 | 266,500 | ||
| Berry Plastics Corp.: | ||||
| 9.5%, 5/15/2018 (b) | 390,000 | 418,275 | ||
| 9.75%, 1/15/2021 | 460,000 | 532,450 | ||
| BOE Intermediate Holding Corp., 144A, 9.0%, 11/1/2017 (PIK) | 303,195 | 316,081 | ||
| BOE Merger Corp., 144A, 9.5%, 11/1/2017 (PIK) | 410,000 | 435,625 | ||
| Clearwater Paper Corp., 7.125%, 11/1/2018 | 390,000 | 416,325 | ||
| Crown Americas LLC, 6.25%, 2/1/2021 | 50,000 | 54,250 | ||
| Essar Steel Algoma, Inc.: | ||||
| 144A, 9.375%, 3/15/2015 | 1,290,000 | 1,219,050 | ||
| 144A, 9.875%, 6/15/2015 | 195,000 | 118,950 | ||
| Exopack Holding Corp., 144A, 10.0%, 6/1/2018 | 230,000 | 249,550 | ||
| Exopack Holdings SA, 144A, 7.875%, 11/1/2019 | 275,000 | 280,500 | ||
| FMG Resources (August 2006) Pty Ltd.: | ||||
| 144A, 6.0%, 4/1/2017 (b) | 315,000 | 334,688 | ||
| 144A, 6.875%, 4/1/2022 (b) | 270,000 | 294,300 | ||
| 144A, 7.0%, 11/1/2015 (b) | 358,000 | 371,425 | ||
| 144A, 8.25%, 11/1/2019 (b) | 270,000 | 303,075 | ||
| FQM Akubra, Inc.: | ||||
| 144A, 7.5%, 6/1/2021 | 610,000 | 637,450 | ||
| 144A, 8.75%, 6/1/2020 | 360,000 | 390,600 | ||
| Hexion U.S. Finance Corp.: | ||||
| 6.625%, 4/15/2020 | 95,000 | 97,375 | ||
| 8.875%, 2/1/2018 | 530,000 | 550,537 | ||
| IAMGOLD Corp., 144A, 6.75%, 10/1/2020 | 310,000 | 266,600 | ||
| Kaiser Aluminum Corp., 8.25%, 6/1/2020 | 260,000 | 293,800 | ||
| Packaging Dynamics Corp., 144A, 8.75%, 2/1/2016 | 535,000 | 549,712 | ||
| Perstorp Holding AB, 144A, 8.75%, 5/15/2017 | 455,000 | 489,125 | ||
| Plastipak Holdings, Inc., 144A, 6.5%, 10/1/2021 | 250,000 | 258,750 | ||
| Polymer Group, Inc., 7.75%, 2/1/2019 | 300,000 | 319,875 | ||
| PolyOne Corp., 5.25%, 3/15/2023 | 250,000 | 243,750 | ||
| Rain CII Carbon LLC: | ||||
| 144A, 8.0%, 12/1/2018 | 270,000 | 279,450 | ||
| 144A, 8.25%, 1/15/2021 | 200,000 | 204,000 | ||
| Sealed Air Corp.: | ||||
| 144A, 8.125%, 9/15/2019 | 150,000 | 168,375 | ||
| 144A, 8.375%, 9/15/2021 | 150,000 | 170,250 | ||
| 10,751,606 | ||||
| Telecommunication Services 16.6% | ||||
| Altice Financing SA: | ||||
| 144A, 6.5%, 1/15/2022 | 200,000 | 202,000 | ||
| 144A, 7.875%, 12/15/2019 | 235,000 | 255,562 | ||
| Altice Finco SA, 144A, 9.875%, 12/15/2020 | 235,000 | 264,375 | ||
| CenturyLink, Inc.: | ||||
| Series V, 5.625%, 4/1/2020 | 105,000 | 106,838 | ||
| Series W, 6.75%, 12/1/2023 | 445,000 | 450,562 | ||
| Cincinnati Bell, Inc.: | ||||
| 8.375%, 10/15/2020 | 1,340,000 | 1,450,550 | ||
| 8.75%, 3/15/2018 (b) | 640,000 | 672,000 | ||
| Principal Amount ($)(a) | Value ($) | |||
| CPI International, Inc., 8.0%, 2/15/2018 | 260,000 | 271,700 | ||
| Cricket Communications, Inc., 7.75%, 10/15/2020 | 1,360,000 | 1,550,400 | ||
| Digicel Group Ltd.: | ||||
| 144A, 8.25%, 9/30/2020 | 1,560,000 | 1,616,550 | ||
| 144A, 10.5%, 4/15/2018 | 495,000 | 529,650 | ||
| Digicel Ltd.: | ||||
| 144A, 7.0%, 2/15/2020 | 200,000 | 202,000 | ||
| 144A, 8.25%, 9/1/2017 | 1,090,000 | 1,133,600 | ||
| ERC Ireland Preferred Equity Ltd., 144A, 7.69%**, 2/15/2017 (PIK)* | EUR | 709,137 | 0 | |
| Frontier Communications Corp.: | ||||
| 7.125%, 1/15/2023 (b) | 1,370,000 | 1,352,875 | ||
| 7.625%, 4/15/2024 | 110,000 | 109,725 | ||
| 8.25%, 4/15/2017 | 348,000 | 403,680 | ||
| 8.5%, 4/15/2020 | 490,000 | 548,800 | ||
| 8.75%, 4/15/2022 | 670,000 | 743,700 | ||
| Intelsat Jackson Holdings SA: | ||||
| 144A, 5.5%, 8/1/2023 | 465,000 | 442,331 | ||
| 7.25%, 10/15/2020 | 1,230,000 | 1,345,312 | ||
| 7.5%, 4/1/2021 | 1,270,000 | 1,400,175 | ||
| 8.5%, 11/1/2019 | 580,000 | 632,925 | ||
| Intelsat Luxembourg SA: | ||||
| 144A, 7.75%, 6/1/2021 | 670,000 | 718,575 | ||
| 144A, 8.125%, 6/1/2023 | 105,000 | 112,613 | ||
| Level 3 Communications, Inc., 8.875%, 6/1/2019 | 55,000 | 60,088 | ||
| Level 3 Financing, Inc.: | ||||
| 144A, 6.125%, 1/15/2021 | 165,000 | 166,650 | ||
| 7.0%, 6/1/2020 | 1,260,000 | 1,335,600 | ||
| 8.125%, 7/1/2019 | 670,000 | 733,650 | ||
| 8.625%, 7/15/2020 | 510,000 | 571,200 | ||
| MetroPCS Wireless, Inc.: | ||||
| 6.625%, 11/15/2020 | 705,000 | 747,300 | ||
| 144A, 6.625%, 4/1/2023 (b) | 245,000 | 252,963 | ||
| 7.875%, 9/1/2018 | 420,000 | 450,975 | ||
| Millicom International Cellular SA, 144A, 4.75%, 5/22/2020 | 720,000 | 691,200 | ||
| NII Capital Corp., 7.625%, 4/1/2021 | 305,000 | 125,050 | ||
| Pacnet Ltd.: | ||||
| 144A, 9.0%, 12/12/2018 | 200,000 | 203,750 | ||
| 144A, 9.25%, 11/9/2015 | 434,000 | 452,987 | ||
| SBA Communications Corp., 5.625%, 10/1/2019 | 200,000 | 206,000 | ||
| Sprint Communications, Inc., 9.125%, 3/1/2017 | 310,000 | 364,250 | ||
| Sprint Corp., 144A, 7.125%, 6/15/2024 | 275,000 | 279,125 | ||
| T-Mobile U.S.A., Inc.: | ||||
| 6.125%, 1/15/2022 | 110,000 | 111,925 | ||
| 6.5%, 1/15/2024 | 110,000 | 111,375 | ||
| tw telecom holdings, Inc.: | ||||
| 5.375%, 10/1/2022 | 280,000 | 275,100 | ||
| 144A, 5.375%, 10/1/2022 | 50,000 | 49,125 | ||
| 144A, 6.375%, 9/1/2023 | 245,000 | 254,800 | ||
| UPCB Finance III Ltd., 144A, 6.625%, 7/1/2020 | 185,000 | 196,563 | ||
| UPCB Finance V Ltd., 144A, 7.25%, 11/15/2021 | 230,000 | 249,550 | ||
| UPCB Finance VI Ltd., 144A, 6.875%, 1/15/2022 | 300,000 | 318,750 | ||
| Principal Amount ($)(a) | Value ($) | |||
| Wind Acquisition Finance SA: | ||||
| 144A, 6.5%, 4/30/2020 | 195,000 | 207,675 | ||
| 144A, 7.25%, 2/15/2018 | 410,000 | 431,525 | ||
| Windstream Corp.: | ||||
| 6.375%, 8/1/2023 | 265,000 | 247,775 | ||
| 7.5%, 4/1/2023 | 420,000 | 422,100 | ||
| 7.75%, 10/15/2020 | 80,000 | 84,900 | ||
| 7.75%, 10/1/2021 | 675,000 | 715,500 | ||
| 7.875%, 11/1/2017 | 495,000 | 565,537 | ||
| 27,399,486 | ||||
| Utilities 2.1% | ||||
| AES Corp.: | ||||
| 8.0%, 10/15/2017 | 415,000 | 487,625 | ||
| 8.0%, 6/1/2020 | 525,000 | 614,250 | ||
| Calpine Corp.: | ||||
| 144A, 7.5%, 2/15/2021 | 387,000 | 422,314 | ||
| 144A, 7.875%, 7/31/2020 | 428,000 | 468,660 | ||
| Enel SpA, 144A, 8.75%**, 9/24/2073 | 360,000 | 391,452 | ||
| Energy Future Holdings Corp., Series Q, 6.5%, 11/15/2024 | 550,000 | 192,500 | ||
| Energy Future Intermediate Holding Co., LLC, 10.0%, 12/1/2020 (b) | 615,000 | 653,437 | ||
| NRG Energy, Inc., 7.625%, 1/15/2018 | 200,000 | 228,000 | ||
| 3,458,238 | ||||
Total Corporate Bonds (Cost $130,565,792) | 134,395,136 | |||
| Government & Agency Obligation 3.5% | ||||
| U.S. Treasury Obligation | ||||
| U.S. Treasury Note, 0.75%, 6/15/2014 (d) (Cost $5,847,045) | 5,830,000 | 5,846,855 | ||
| Loan Participations and Assignments 0.0% | ||||
| Senior Loans** | ||||
| Alliance Mortgage Cycle Loan, Term Loan A, 9.5%, 6/15/2010* | 700,000 | 0 | ||
| Travelport LLC, Second Lien Term Loan, 9.5%, 1/29/2016 | 36,284 | 37,656 | ||
Total Loan Participations and Assignments (Cost $735,300) | 37,656 | |||
| Convertible Bond 1.5% | ||||
| Materials | ||||
| GEO Specialty Chemicals, Inc., 144A, 7.5%, 3/31/2015 (PIK) (Cost $1,282,903) | 1,297,793 | 2,514,085 | ||
| Preferred Security 0.6% | ||||
| Materials | ||||
| Hercules, Inc., 6.5%, 6/30/2029 (Cost $761,657) | 1,135,000 | 987,450 | ||
| Shares | Value ($) | |||||||
| Common Stocks 0.2% | ||||||||
| Consumer Discretionary 0.0% | ||||||||
| Dawn Holdings, Inc.* (e) | 15 | 42,688 | ||||||
| Trump Entertainment Resorts, Inc.* | 45 | 0 | ||||||
| Vertis Holdings, Inc.* | 676 | 0 | ||||||
| 42,688 | ||||||||
| Shares | Value ($) | |||||||
| Industrials 0.0% | ||||||||
| Congoleum Corp.* | 24,000 | 0 | ||||||
| Materials 0.2% | ||||||||
| GEO Specialty Chemicals, Inc.* | 24,225 | 18,016 | ||||||
| GEO Specialty Chemicals, Inc. 144A* | 2,206 | 1,641 | ||||||
| Wolverine Tube, Inc.* | 7,045 | 227,201 | ||||||
| 246,858 | ||||||||
Total Common Stocks (Cost $527,543) | 289,546 | |||||||
| Preferred Stock 0.5% | ||||||||
| Financials | ||||||||
| Ally Financial, Inc. Series G, 7.0% (Cost $841,212) | 915 | 878,486 | ||||||
| Warrants 0.1% | ||||||||
| Consumer Discretionary 0.0% | ||||||||
| Reader's Digest Association, Inc., Expiration Date 2/19/2014* | 1,115 | 0 | ||||||
| Shares | Value ($) | |||||||
| Materials 0.1% | ||||||||
| GEO Specialty Chemicals, Inc., Expiration Date 3/31/2015* | 119,802 | 88,198 | ||||||
| Hercules Trust II, Expiration Date 3/31/2029* | 1,100 | 11,623 | ||||||
| 99,821 | ||||||||
Total Warrants (Cost $244,285) | 99,821 | |||||||
| Securities Lending Collateral 6.0% | ||||||||
| Daily Assets Fund Institutional, 0.08% (f) (g) (Cost $9,856,472) | 9,856,472 | 9,856,472 | ||||||
| Cash Equivalents 10.4% | ||||||||
| Central Cash Management Fund, 0.05% (f) (Cost $17,209,127) | 17,209,127 | 17,209,127 | ||||||
| % of Net Assets | Value ($) | |||||||
Total Investment Portfolio (Cost $167,871,336)† | 104.1 | 172,114,634 | ||||||
| Other Assets and Liabilities, Net | (4.1 | ) | (6,762,626 | ) | ||||
| Net Assets | 100.0 | 165,352,008 | ||||||
The following table represents bonds and senior loans that are in default:
| Security | Coupon | Maturity Date | Principal Amount | Cost ($) | Value ($) | |||||||||||||
| Alliance Mortgage Cycle Loan* | 9.5 | % | 6/15/2010 | USD | 700,000 | 700,000 | 0 | |||||||||||
| ERC Ireland Preferred Equity Ltd.* | 7.69 | % | 2/15/2017 | EUR | 709,137 | 965,174 | 0 | |||||||||||
| Hellas Telecommunications Finance* | 8.227 | % | 7/15/2015 | EUR | 322,107 | 92,199 | 0 | |||||||||||
| 1,757,373 | 0 | |||||||||||||||||
* Non-income producing security.
** Floating rate securities' yields vary with a designated market index or market rate, such as the coupon-equivalent of the U.S. Treasury Bill rate. These securities are shown at their current rate as of December 31, 2013.
† The cost for federal income tax purposes was $167,871,336. At December 31, 2013, net unrealized appreciation for all securities based on tax cost was $4,243,298. This consisted of aggregate gross unrealized appreciation for all securities in which there was an excess of value over tax cost of $7,773,005 and aggregate gross unrealized depreciation for all securities in which there was an excess of tax cost over value of $3,529,707.
(a) Principal amount stated in U.S. dollars unless otherwise noted.
(b) All or a portion of these securities were on loan. In addition, "Other Assets and Liabilities, Net" may include pending sales that are also on loan. The value of securities loaned at December 31, 2013 amounted to $9,469,663, which is 5.7% of net assets.
(c) When-issued security.
(d) At December 31, 2013, this security has been pledged, in whole or in part, as collateral for open swap contracts.
(e) The Fund may purchase securities that are subject to legal or contractual restrictions on resale ("restricted securities"). Restricted securities are securities which have not been registered with the Securities and Exchange Commission under the Securities Act of 1933. The Fund may be unable to sell a restricted security and it may be more difficult to determine a market value for a restricted security. Moreover, if adverse market conditions were to develop during the period between the Fund's decision to sell a restricted security and the point at which the Fund is permitted or able to sell such security, the Fund might obtain a price less favorable than the price that prevailed when it decided to sell. This investment practice, therefore, could have the effect of increasing the level of illiquidity of the Fund. The future value of these securities is uncertain and there may be changes in the estimated value of these securities.
| Schedule of Restricted Securities | Acquisition Date | Cost ($) | Value ($) | Value as % of Net Assets | |||||||||
| Dawn Holdings, Inc. | August 2013 | 53,353 | 42,688 | 0.03 | |||||||||
(f) Affiliated fund managed by Deutsche Investment Management Americas Inc. The rate shown is the annualized seven-day yield at period end.
(g) Represents collateral held in connection with securities lending. Income earned by the Fund is net of borrower rebates.
144A: Security exempt from registration under Rule 144A of the Securities Act of 1933. These securities may be resold in transactions exempt from registration, normally to qualified institutional buyers.
PIK: Denotes that all or a portion of the income is paid in-kind in the form of additional principal.
REIT: Real Estate Investment Trust
At December 31, 2013, open credit default swap contracts sold were as follows:
| Centrally Cleared Swaps | |||||||||||||||||
Effective/ Expiration Dates | Notional Amount ($) (h) | Fixed Cash Flows Received | Underlying Debt Obligation | Value ($) | Unrealized Appreciation ($) | ||||||||||||
3/20/2013 6/20/2018 | 6,000,000 | 5.0 | % | Markit Dow Jones CDX North America High Yield Index | 576,303 | 232,972 | |||||||||||
10/19/2013 12/20/2018 | 12,000,000 | 5.0 | % | Markit Dow Jones CDX North America High Yield Index | 1,039,940 | 223,929 | |||||||||||
| Total unrealized appreciation | 456,901 | ||||||||||||||||
| Bilateral Swaps | |||||||||||||||||||||
Effective/ Expiration Dates | Notional Amount ($) (h) | Fixed Cash Flows Received | Underlying Debt Obligation/ Quality Rating (i) | Value ($) | Upfront Payments Paid/ (Received) ($) | Unrealized Appreciation ($) | |||||||||||||||
12/20/2011 3/20/2017 | 370,000 | 1 | 5.0 | % | CIT Group, Inc., 5.5%, 2/15/2019, BB– | 44,612 | 10,034 | 34,578 | |||||||||||||
6/20/2013 9/20/2018 | 245,000 | 1 | 5.0 | % | DISH DBS Corp., 6.75%, 6/1/2021, BB– | 33,715 | 20,654 | 13,061 | |||||||||||||
6/21/2010 9/20/2015 | 175,000 | 3 | 5.0 | % | Ford Motor Co., 6.5%, 8/1/2018, BBB– | 14,187 | (16,626 | ) | 30,813 | ||||||||||||
6/21/2010 9/21/2015 | 320,000 | 1 | 5.0 | % | Ford Motor Co., 6.5%, 8/1/2018, BBB– | 25,941 | (27,750 | ) | 53,691 | ||||||||||||
6/21/2010 9/20/2015 | 100,000 | 4 | 5.0 | % | Ford Motor Co., 6.5%, 8/1/2018, BBB– | 8,107 | (6,896 | ) | 15,003 | ||||||||||||
6/21/2010 9/20/2015 | 560,000 | 2 | 5.0 | % | Ford Motor Co., 6.5%, 8/1/2018, BBB– | 45,397 | (9,983 | ) | 55,380 | ||||||||||||
6/20/2011 9/20/2016 | 575,000 | 2 | 5.0 | % | Ford Motor Co., 6.5%, 8/1/2018, BBB– | 69,594 | 28,911 | 40,683 | |||||||||||||
3/21/2011 6/20/2016 | 1,085,000 | 5 | 5.0 | % | Ford Motor Credit Co., LLC, 5.0%, 5/15/2018, BBB– | 119,643 | 64,195 | 55,448 | |||||||||||||
6/20/2011 9/20/2016 | 440,000 | 5 | 5.0 | % | Forest Oil Corp., 7.25%, 6/15/2019, B– | 14,983 | 8,918 | 6,065 | |||||||||||||
9/20/2012 12/20/2017 | 485,000 | 6 | 5.0 | % | General Motors Corp., 3.3%, 12/20/2017, BB+ | 71,323 | 28,613 | 42,710 | |||||||||||||
6/20/2011 9/20/2015 | 1,145,000 | 4 | 5.0 | % | HCA, Inc., 6.375%, 1/15/2015, B– | 87,032 | 25,052 | 61,980 | |||||||||||||
3/21/2011 6/20/2016 | 610,000 | 3 | 5.0 | % | HCA, Inc., 6.375%, 1/15/2015, B– | 61,206 | 11,269 | 49,937 | |||||||||||||
6/20/2013 9/20/2018 | 470,000 | 4 | 5.0 | % | HCA, Inc., 8.0%, 10/1/2018, B– | 61,612 | 35,452 | 26,160 | |||||||||||||
6/20/2013 9/20/2018 | 730,000 | 2 | 5.0 | % | Sprint Communications, Inc., 6.0%, 12/1/2016, BB– | 83,241 | 40,923 | 42,318 | |||||||||||||
9/20/2013 12/20/2018 | 300,000 | 5 | 5.0 | % | CSC Holdings LLC, 7.625%, 7/15/2018, BB+ | 36,644 | 28,065 | 8,579 | |||||||||||||
9/20/2013 12/20/2018 | 1,125,000 | 3 | 5.0 | % | CSC Holdings LLC, 7.625%, 7/15/2018, BB+ | 132,978 | 111,154 | 21,824 | |||||||||||||
| Total unrealized appreciation | 558,230 | ||||||||||||||||||||
(h) The maximum potential amount of future undiscounted payments that the Fund could be required to make under a credit default swap contract would be the notional amount of the contract. These potential amounts would be partially offset by any recovery values of the referenced debt obligation or net amounts received from the settlement of buy protection credit default swap contracts entered into by the Fund for the same referenced debt obligation, if any.
(i) The quality ratings represent the higher of Moody's Investors Service, Inc. ("Moody's") or Standard & Poor's Corporation ("S&P") credit ratings and are unaudited.
Counterparties:
1 Credit Suisse
2 Bank of America
3 JPMorgan Chase Securities, Inc.
4 The Goldman Sachs & Co.
5 Barclays Bank PLC
6 UBS AG
At December 31, 2013, the Fund had the following open forward foreign currency exchange contracts:
| Contracts to Deliver | In Exchange For | Settlement Date | Unrealized Depreciation ($) | Counterparty | |||||||||||
| EUR | 1,190,000 | USD | 1,634,217 | 1/15/2014 | (2,853 | ) | Citigroup, Inc. | ||||||||
| Currency Abbreviations |
EUR Euro USD United States Dollar |
For information on the Fund's policy and additional disclosures regarding credit default swap contracts and forward foreign currency exchange contracts, please refer to Note B in the accompanying Notes to Financial Statements.
Fair Value Measurements
Various inputs are used in determining the value of the Fund's investments. These inputs are summarized in three broad levels. Level 1 includes quoted prices in active markets for identical securities. Level 2 includes other significant observable inputs (including quoted prices for similar securities, interest rates, prepayment speeds and credit risk). Level 3 includes significant unobservable inputs (including the Fund's own assumptions in determining the fair value of investments). The level assigned to the securities valuations may not be an indication of the risk or liquidity associated with investing in those securities.
The following is a summary of the inputs used as of December 31, 2013 in valuing the Fund's investments. For information on the Fund's policy regarding the valuation of investments, please refer to the Security Valuation section of Note A in the accompanying Notes to Financial Statements.
| Assets | Level 1 | Level 2 | Level 3 | Total | ||||||||||||
Fixed Income Investments (j) | ||||||||||||||||
| Corporate Bonds | $ | — | $ | 134,395,136 | $ | 0 | $ | 134,395,136 | ||||||||
| Government & Agency Obligation | — | 5,846,855 | — | 5,846,855 | ||||||||||||
| Loan Participations and Assignments | — | 37,656 | 0 | 37,656 | ||||||||||||
| Convertible Bonds | — | — | 2,514,085 | 2,514,085 | ||||||||||||
| Preferred Security | — | 987,450 | — | 987,450 | ||||||||||||
| Common Stocks | — | — | 289,546 | 289,546 | ||||||||||||
| Preferred Stock | — | 878,486 | — | 878,486 | ||||||||||||
| Warrants (j) | — | — | 99,821 | 99,821 | ||||||||||||
| Short-Term Investments (j) | 27,065,599 | — | — | 27,065,599 | ||||||||||||
| Derivatives (k) | ||||||||||||||||
| Credit Default Swap Contracts | — | 1,015,131 | — | 1,015,131 | ||||||||||||
| Total | $ | 27,065,599 | $ | 143,160,714 | $ | 2,903,452 | $ | 173,129,765 | ||||||||
| Liabilities | Level 1 | Level 2 | Level 3 | Total | ||||||||||||
| Derivatives (k) | ||||||||||||||||
| Forward Foreign Currency Exchange Contracts | $ | — | $ | (2,853 | ) | $ | — | $ | (2,853 | ) | ||||||
| Total | $ | — | $ | (2,853 | ) | $ | — | $ | (2,853 | ) | ||||||
During the year ended December 31, 2013, the amount of transfers between Level 2 and Level 3 was $281. Investments were transferred from Level 2 to Level 3 because of the lack of observable market data due to a decrease in market activity.
Transfers between price levels are recognized at the beginning of the reporting period.
(j) See Investment Portfolio for additional detailed categorizations.
(k) Derivatives include unrealized appreciation (depreciation) on credit default swap contracts and forward foreign currency exchange contracts.
Level 3 Reconciliation
The following is a reconciliation of the Fund's Level 3 investments for which significant unobservable inputs were used in determining value:
| Corporate Bonds | Loan Participations and Assignments | Convertible Bonds | Other Investments | Common Stocks | Warrants | Total | ||||||||||||||||||||||
| Balance as of December 31, 2012 | $ | 155,602 | $ | 0 | $ | 1,538,014 | $ | 107,806 | $ | 139,682 | $ | 63,227 | $ | 2,004,331 | ||||||||||||||
| Realized gains (loss) | 6,235 | — | — | 298,987 | (4 | ) | — | 305,218 | ||||||||||||||||||||
| Change in unrealized appreciation (depreciation) | (5,404 | ) | — | 964,874 | (76,806 | ) | 96,512 | 36,594 | 1,015,770 | |||||||||||||||||||
| Amortization of premium/accretion of discount | 2,226 | — | 11,197 | — | — | — | 13,423 | |||||||||||||||||||||
| Purchases | 4,768 | — | — | — | 53,356 | — | 58,124 | |||||||||||||||||||||
| (Sales) | (163,708 | ) | — | — | (329,987 | ) | — | — | (493,695 | ) | ||||||||||||||||||
| Transfers into Level 3 | 281 | — | — | — | — | — | 281 | |||||||||||||||||||||
| Balance as of December 31, 2013 | $ | 0 | $ | 0 | $ | 2,514,085 | $ | — | $ | 289,546 | $ | 99,821 | $ | 2,903,452 | ||||||||||||||
| Net change in unrealized appreciation (depreciation) from investments still held as of December 31, 2013 | $ | (281 | ) | $ | 0 | $ | 964,874 | $ | — | $ | 96,512 | $ | 36,594 | $ | 1,097,699 | |||||||||||||
| Quantitative Disclosure About Significant Unobservable Inputs | ||||||||||
| Asset Class | Fair Value at 12/31/13 | Valuation Technique(s) | Unobservable Input | Range (Weighted Average) | ||||||
| Common Stocks | ||||||||||
| Consumer Discretionary | $ | 42,688 | Acquisition Value | Acquisition Value | $3,628.47 per share | |||||
| Discount for Lack of Marketability | 20 | % | ||||||||
| $ | 0 | Asset Valuation | Book Value of Equity | 0 | ||||||
| $ | 0 | Asset Valuation | Book Value of Equity | 0 | ||||||
| Industrials | $ | 0 | Asset Valuation | Book Value of Equity | 0 | |||||
| Materials | $ | 227,201 | Acquisition Value | Acquisition Value | $32.25 per share | |||||
| $ | 19,657 | Market Approach | EV/EBITDA Multiple | 6.08 | ||||||
| Discount to Public Comparables | 20 | % | ||||||||
| Discount for Lack of Marketability | 25 | % | ||||||||
| Warrants | ||||||||||
| Consumer Discretionary | $ | 0 | Asset Valuation | Book Value of Equity | 0 | |||||
| Materials | $ | 11,623 | Black Scholes Option Pricing Model | Implied Volatility | 32 | % | ||||
| Discount for Lack of Marketability | 20 | % | ||||||||
| $ | 88,198 | Market Approach | EV/EBITDA Multiple | 6.08 | ||||||
| Discount to Public Comparables | 20 | % | ||||||||
| Discount for Lack of Marketability | 25 | % | ||||||||
| Loan Participations & Assignments | ||||||||||
| Senior Loans | $ | 0 | Market Approach | Evaluated by Management | 0 | |||||
| Corporate Bonds | ||||||||||
| Telecommunication Services | $ | 0 | Asset Valuation | Book Value of Equity | 0 | |||||
| Financials | $ | 0 | Asset Valuation | Book Value of Equity | 0 | |||||
| Convertible Bonds | ||||||||||
| Materials | $ | 2,514,085 | Convertible Bond Methodology | EV/EBITDA Multiple | 6.08 | |||||
| Discount to Public Comparable | 20 | % | ||||||||
| Discount for Lack of Marketability | 25 | % | ||||||||
Qualitative Disclosure About Unobservable Inputs
Significant unobservable inputs developed by the Pricing Committee and used in the fair value measurement of the Fund's equity investments include enterprise value (EV) to earnings before interest, taxes, depreciation and amortization (EBITDA) ratio with a discount for lack of marketability. A significant change in the EV to EBITDA ratio may result in a significant change in the fair value measurement, while a significant change in the discount for lack of marketability is unlikely to result in a materially higher or lower fair value measurement.
Significant unobservable inputs developed by the Pricing Committee and used in the fair value measurement of the Fund's fixed income investments include the convertible bond methodology. A significant change in the EV to EBITDA ratio could have a material change on the fair value measurement, while a significant change in the discount for lack of marketability is unlikely to result in a materially higher or lower fair value measurement.
The accompanying notes are an integral part of the financial statements.
| as of December 31, 2013 | ||||
| Assets | ||||
Investments: Investments in non-affiliated securities, at value (cost $140,805,737) — including $9,469,663 of securities loaned | $ | 145,049,035 | ||
| Investment in Daily Assets Fund Institutional (cost $9,856,472)* | 9,856,472 | |||
| Investment in Central Cash Management Fund (cost $17,209,127) | 17,209,127 | |||
| Total investments in securities, at value (cost $167,871,336) | 172,114,634 | |||
| Cash | 61,059 | |||
| Foreign currency, at value (cost $12) | 12 | |||
| Receivable for investments sold | 37,620 | |||
| Receivable for investments sold — when-issued/delayed delivery security | 61,284 | |||
| Receivable for Fund shares sold | 31,416 | |||
| Receivable for variation margin on centrally cleared swaps contracts | 318 | |||
| Interest receivable | 2,436,423 | |||
| Unrealized appreciation on swap contracts | 558,230 | |||
| Upfront payments paid on swap contracts | 413,240 | |||
| Due from Advisor | 61 | |||
| Other assets | 2,718 | |||
| Total assets | 175,717,015 | |||
| Liabilities | ||||
| Payable upon return of securities loaned | 9,856,472 | |||
| Payable for investments purchased | 1,416 | |||
| Payable for investments purchased — when-issued/delayed delivery security | 280,802 | |||
| Payable for Fund shares redeemed | 46,159 | |||
| Unrealized depreciation on forward foreign currency exchange contracts | 2,853 | |||
| Upfront payments received on swap contracts | 61,255 | |||
| Accrued management fee | 57,071 | |||
| Accrued Trustees' fees | 1,975 | |||
| Other accrued expenses and payables | 57,004 | |||
| Total liabilities | 10,365,007 | |||
| Net assets, at value | $ | 165,352,008 | ||
| Net Assets Consist of | ||||
| Undistributed net investment income | 9,541,574 | |||
Net unrealized appreciation (depreciation) on: Investments | 4,243,298 | |||
| Swap contracts | 1,015,131 | |||
| Foreign currency | (2,792 | ) | ||
| Accumulated net realized gain (loss) | (41,156,447 | ) | ||
| Paid-in capital | 191,711,244 | |||
| Net assets, at value | $ | 165,352,008 | ||
Class A Net Asset Value, offering and redemption price per share ($165,028,087 ÷ 23,727,813 outstanding shares of beneficial interest, no par value, unlimited number of shares authorized) | $ | 6.96 | ||
Class B Net Asset Value, offering and redemption price per share ($323,921 ÷ 46,339 outstanding shares of beneficial interest, no par value, unlimited number of shares authorized) | $ | 6.99 | ||
* Represents collateral on securities loaned.
The accompanying notes are an integral part of the financial statements.
| for the year ended December 31, 2013 | ||||
| Investment Income | ||||
| Interest | $ | 10,598,302 | ||
| Dividends | 62,213 | |||
| Income distributions — Central Cash Management Fund | 11,309 | |||
| Securities lending income, including income from Daily Assets Fund Institutional, net of borrower rebates | 32,808 | |||
| Total income | 10,704,632 | |||
Expenses: Management fee | 834,670 | |||
| Administration fee | 166,934 | |||
| Distribution service fee (Class B) | 413 | |||
| Recordkeeping fees (Class B) | 162 | |||
| Services to shareholders | 1,637 | |||
| Custodian fee | 32,166 | |||
| Audit and tax fees | 78,540 | |||
| Legal fees | 13,604 | |||
| Reports to shareholders | 46,783 | |||
| Trustees' fees and expenses | 7,620 | |||
| Other | 43,900 | |||
| Total expenses before expense reductions | 1,226,429 | |||
| Expense reductions | (21,902 | ) | ||
| Total expenses after expense reductions | 1,204,527 | |||
| Net investment income (loss) | 9,500,105 | |||
| Realized and Unrealized Gain (Loss) | ||||
Net realized gain (loss) from: Investments | 2,754,139 | |||
| Swap contracts | 1,192,415 | |||
| Foreign currency | (29,485 | ) | ||
| 3,917,069 | ||||
Change in net unrealized appreciation (depreciation) on: Investments | (1,268,186 | ) | ||
| Swap contracts | 479,634 | |||
| Foreign currency | (16,103 | ) | ||
| (804,655 | ) | |||
| Net gain (loss) | 3,112,414 | |||
| Net increase (decrease) in net assets resulting from operations | $ | 12,612,519 | ||
The accompanying notes are an integral part of the financial statements.
| Years Ended December 31, | ||||||||
| Increase (Decrease) in Net Assets | 2013 | 2012 | ||||||
Operations: Net investment income | $ | 9,500,105 | $ | 11,527,855 | ||||
| Net realized gain (loss) | 3,917,069 | 1,543,250 | ||||||
| Change in net unrealized appreciation (depreciation) | (804,655 | ) | 10,498,123 | |||||
| Net increase (decrease) in net assets resulting from operations | 12,612,519 | 23,569,228 | ||||||
Distributions to shareholders from: Net investment income: Class A | (12,380,542 | ) | (13,517,771 | ) | ||||
| Class B | (6,491 | ) | (7,507 | ) | ||||
| Total distributions | (12,387,033 | ) | (13,525,278 | ) | ||||
Fund share transactions: Class A Proceeds from shares sold | 37,136,318 | 49,009,407 | ||||||
| Reinvestment of distributions | 12,380,542 | 13,517,771 | ||||||
| Payments for shares redeemed | (63,021,014 | ) | (63,694,430 | ) | ||||
| Net increase (decrease) in net assets from Class A share transactions | (13,504,154 | ) | (1,167,252 | ) | ||||
Class B Proceeds from shares sold | 674,207 | 8,301 | ||||||
| Reinvestment of distributions | 6,491 | 7,507 | ||||||
| Payments for shares redeemed | (452,620 | ) | (13,053 | ) | ||||
| Net increase (decrease) in net assets from Class B share transactions | 228,078 | 2,755 | ||||||
| Increase (decrease) in net assets | (13,050,590 | ) | 8,879,453 | |||||
| Net assets at beginning of period | 178,402,598 | 169,523,145 | ||||||
| Net assets at end of period (including undistributed net investment income of $9,541,574 and $11,701,062, respectively) | $ | 165,352,008 | $ | 178,402,598 | ||||
| Other Information | ||||||||
Class A Shares outstanding at beginning of period | 25,717,511 | 25,818,935 | ||||||
| Shares sold | 5,481,259 | 7,431,954 | ||||||
| Shares issued to shareholders in reinvestment of distributions | 1,834,154 | 2,118,773 | ||||||
| Shares redeemed | (9,305,111 | ) | (9,652,151 | ) | ||||
| Net increase (decrease) in Class A shares | (1,989,698 | ) | (101,424 | ) | ||||
| Shares outstanding at end of period | 23,727,813 | 25,717,511 | ||||||
Class B Shares outstanding at beginning of period | 13,214 | 12,847 | ||||||
| Shares sold | 98,852 | 1,197 | ||||||
| Shares issued to shareholders in reinvestment of distributions | 955 | 1,168 | ||||||
| Shares redeemed | (66,682 | ) | (1,998 | ) | ||||
| Net increase (decrease) in Class B shares | 33,125 | 367 | ||||||
| Shares outstanding at end of period | 46,339 | 13,214 | ||||||
The accompanying notes are an integral part of the financial statements.
| Years Ended December 31, | |||||||||||||||||||||
| Class A | 2013 | 2012 | 2011 | 2010 | 2009 | ||||||||||||||||
| Selected Per Share Data | |||||||||||||||||||||
| Net asset value, beginning of period | $ | 6.93 | $ | 6.56 | $ | 6.90 | $ | 6.55 | $ | 5.30 | |||||||||||
Income (loss) from investment operations: Net investment incomea | .39 | .45 | .51 | .52 | .51 | ||||||||||||||||
| Net realized and unrealized gain (loss) | .14 | .48 | (.24 | ) | .36 | 1.40 | |||||||||||||||
| Total from investment operations | .53 | .93 | .27 | .88 | 1.91 | ||||||||||||||||
Less distributions from: Net investment income | (.50 | ) | (.56 | ) | (.61 | ) | (.53 | ) | (.66 | ) | |||||||||||
| Net asset value, end of period | $ | 6.96 | $ | 6.93 | $ | 6.56 | $ | 6.90 | $ | 6.55 | |||||||||||
| Total Return (%) | 7.91 | b | 14.91 | 3.84 | 14.00 | 39.99 | |||||||||||||||
| Ratios to Average Net Assets and Supplemental Data | |||||||||||||||||||||
| Net assets, end of period ($ millions) | 165 | 178 | 169 | 195 | 197 | ||||||||||||||||
| Ratio of expenses before expense reductions (%) | .73 | .72 | .72 | .72 | .67 | ||||||||||||||||
| Ratio of expenses after expense reductions (%) | .72 | .72 | .72 | .72 | .67 | ||||||||||||||||
| Ratio of net investment income (%) | 5.69 | 6.68 | 7.59 | 7.90 | 8.81 | ||||||||||||||||
| Portfolio turnover rate (%) | 58 | 58 | 59 | 93 | 66 | ||||||||||||||||
a Based on average shares outstanding during the period. b Total return would have been lower had certain expenses not been reduced. | |||||||||||||||||||||
| Years Ended December 31, | |||||||||||||||||||||
| Class B | 2013 | 2012 | 2011 | 2010 | 2009 | ||||||||||||||||
| Selected Per Share Data | |||||||||||||||||||||
| Net asset value, beginning of period | $ | 6.97 | $ | 6.59 | $ | 6.93 | $ | 6.58 | $ | 5.31 | |||||||||||
Income (loss) from investment operations: Net investment incomea | .36 | .43 | .49 | .50 | .49 | ||||||||||||||||
| Net realized and unrealized gain (loss) | .15 | .49 | (.24 | ) | .36 | 1.42 | |||||||||||||||
| Total from investment operations | .51 | .92 | .25 | .86 | 1.91 | ||||||||||||||||
Less distributions from: Net investment income | (.49 | ) | (.54 | ) | (.59 | ) | (.51 | ) | (.64 | ) | |||||||||||
| Net asset value, end of period | $ | 6.99 | $ | 6.97 | $ | 6.59 | $ | 6.93 | $ | 6.58 | |||||||||||
| Total Return (%) | 7.44 | b | 14.70 | b | 3.57 | 13.64 | 39.64 | ||||||||||||||
| Ratios to Average Net Assets and Supplemental Data | |||||||||||||||||||||
| Net assets, end of period ($ millions) | .3 | .1 | .1 | .1 | .2 | ||||||||||||||||
| Ratio of expenses before expense reductions (%) | 1.10 | .99 | .99 | .99 | .94 | ||||||||||||||||
| Ratio of expenses after expense reductions (%) | .97 | .99 | .99 | .99 | .94 | ||||||||||||||||
| Ratio of net investment income (%) | 5.29 | 6.42 | 7.33 | 7.63 | 8.54 | ||||||||||||||||
| Portfolio turnover rate (%) | 58 | 58 | 59 | 93 | 66 | ||||||||||||||||
a Based on average shares outstanding during the period. b Total return would have been lower had certain expenses not been reduced. | |||||||||||||||||||||
A. Organization and Significant Accounting Policies
DWS High Income VIP (the "Fund") is a diversified series of DWS Variable Series II (the "Trust"), which is registered under the Investment Company Act of 1940, as amended (the "1940 Act"), as an open-end management investment company organized as a Massachusetts business trust.
Multiple Classes of Shares of Beneficial Interest. The Fund offers two classes of shares (Class A shares and Class B shares). Sales of Class B shares are subject to recordkeeping fees up to 0.15% and Rule 12b-1 fees under the 1940 Act equal to an annual rate of 0.25% of the average daily net assets of the Class B shares of the Fund. Class A shares are not subject to such fees.
Investment income, realized and unrealized gains and losses, and certain fund-level expenses and expense reductions, if any, are borne pro rata on the basis of relative net assets by the holders of all classes of shares except that each class bears certain expenses unique to that class (including the applicable Rule 12b-1 fee and recordkeeping fees). Differences in class-level expenses may result in payment of different per share dividends by class. All shares have equal rights with respect to voting subject to class-specific arrangements.
The Fund's financial statements are prepared in accordance with accounting principles generally accepted in the United States of America which require the use of management estimates. Actual results could differ from those estimates. The policies described below are followed consistently by the Fund in the preparation of its financial statements.
Security Valuation. Investments are stated at value determined as of the close of regular trading on the New York Stock Exchange on each day the exchange is open for trading.
Various inputs are used in determining the value of the Fund's investments. These inputs are summarized in three broad levels. Level 1 includes quoted prices in active markets for identical securities. Level 2 includes other significant observable inputs (including quoted prices for similar securities, interest rates, prepayment speeds and credit risk). Level 3 includes significant unobservable inputs (including the Fund's own assumptions in determining the fair value of investments). The level assigned to the securities valuations may not be an indication of the risk or liquidity associated with investing in those securities.
Debt securities and loan participations and assignments are valued at prices supplied by independent pricing services approved by the Fund's Board. If the pricing services are unable to provide valuations, debt securities are valued at the average of most recent reliable bid quotation or evaluated price, as applicable, obtained from broker-dealers and loan the participations and assignments are valued at the mean of the most recent bid and ask quotations or evaluated prices, as applicable, obtained from one or more broker-dealers. Such services may use various pricing techniques which take into account appropriate factors such as yield, quality, coupon rate, maturity, type of issue, trading characteristics and other data, as well as broker quotes. These securities are generally categorized as Level 2.
Equity securities are valued at the most recent sale price or official closing price reported on the exchange (U.S. or foreign) or over-the-counter market on which they trade. Securities for which no sales are reported are valued at the calculated mean between the most recent bid and asked quotations on the relevant market or, if a mean cannot be determined, at the most recent bid quotation. Equity securities are categorized as Level 1 securities.
Investments in open-end investment companies are valued at their net asset value each business day and are categorized as Level 1.
Forward currency contracts are valued at the prevailing forward exchange rate of the underlying currencies and are categorized as Level 2.
Swap contracts are valued daily based upon prices supplied by a Board approved pricing vendor, if available, and otherwise are valued at the price provided by the broker-dealer. Swap contracts are generally categorized as Level 2.
Securities and other assets for which market quotations are not readily available or for which the above valuation procedures are deemed not to reflect fair value are valued in a manner that is intended to reflect their fair value as determined in accordance with procedures approved by the Board and are generally categorized as Level 3. In accordance with the Fund's valuation procedures, factors used in determining value may include, but are not limited to, the type of the security; the size of the holding; the initial cost of the security; the existence of any contractual restrictions on the security's disposition; the price and extent of public trading in similar securities of the issuer or of comparable companies; quotations or evaluated prices from broker-dealers and/or pricing services; information obtained from the issuer, analysts, and/or the appropriate stock exchange (for exchange-traded securities); an analysis of the company's or issuer's financial statements; an evaluation of the forces that influence the issuer and the market(s) in which the security is purchased and sold; and with respect to debt securities, the maturity, coupon, creditworthiness, currency denomination and the movement of the market in which the security is normally traded. The value determined under these procedures may differ from published values for the same securities.
Disclosure about the classification of fair value measurements is included in a table following the Fund's Investment Portfolio.
Foreign Currency Translations. The books and records of the Fund are maintained in U.S. dollars. Investment securities and other assets and liabilities denominated in a foreign currency are translated into U.S. dollars at the prevailing exchange rates at period end. Purchases and sales of investment securities, income and expenses are translated into U.S. dollars at the prevailing exchange rates on the respective dates of the transactions.
Net realized and unrealized gains and losses on foreign currency transactions represent net gains and losses between trade and settlement dates on securities transactions, the acquisition and disposition of foreign currencies, and the difference between the amount of net investment income accrued and the U.S. dollar amount actually received. That portion of both realized and unrealized gains and losses on investments that results from fluctuations in foreign currency exchange rates is not separately disclosed but is included with net realized and unrealized gain/appreciation and loss/depreciation on investments.
Securities Lending. Deutsche Bank AG, as lending agent, lends securities of the Fund to certain financial institutions under the terms of the Security Lending Agreement. The Fund retains the benefits of owning the securities it has loaned and continues to receive interest and dividends generated by the securities and to participate in any changes in their market value. The Fund requires the borrowers of the securities to maintain collateral with the Fund consisting of either cash or liquid, unencumbered assets having a value at least equal to the value of the securities loaned. When the collateral falls below specified amounts, the lending agent will use its best effort to obtain additional collateral on the next business day to meet required amounts under the security lending agreement. The Fund may invest the cash collateral into a joint trading account in an affiliated money market fund pursuant to Exemptive Orders issued by the SEC. The Fund receives compensation for lending its securities either in the form of fees or by earning interest on invested cash collateral net of borrower rebates and fees paid to a lending agent. Either the Fund or the borrower may terminate the loan. There may be risks of delay and costs in recovery of securities or even loss of rights in the collateral should the borrower of the securities fail financially. If the Fund is not able to recover securities lent, the Fund may sell the collateral and purchase a replacement investment in the market, incurring the risk that the value of the replacement security is greater than the value of the collateral. The Fund is also subject to all investment risks associated with the reinvestment of any cash collateral received, including, but not limited to, interest rate, credit and liquidity risk associated with such investments.
As of December 31, 2013, the Fund had securities on loan. The value of the related collateral exceeded the value of the securities loaned at period end.
Loan Participations and Assignments. Loan Participations and Assignments are portions of loans originated by banks and sold in pieces to investors. These fixed- and floating-rate loans ("Loans") in which the Fund invests are arranged between the borrower and one or more financial institutions ("Lenders"). These Loans may take the form of Senior Loans, which are corporate obligations often issued in connection with recapitalizations, acquisitions, leveraged buy outs and refinancing. The Fund invests in such Loans in the form of participations in Loans ("Participations") or assignments of all or a portion of Loans from third parties ("Assignments"). Participations typically result in the Fund having a contractual relationship with only the Lender, not with the borrower. The Fund has the right to receive payments of principal, interest and any fees to which it is entitled from the Lender selling the Participation and only upon receipt by the Lender of the payments from the borrower. In connection with purchasing Participations, the Fund generally has no right to enforce compliance by the borrower with the terms of the loan agreement relating to the Loan, or any rights of set off against the borrower, and the Fund will not benefit directly from any collateral supporting the Loan in which it has purchased the Participation. As a result, the Fund assumes the credit risk of both the borrower and the Lender that is selling the Participation. Assignments typically result in the Fund having a direct contractual relationship with the borrower, and the Fund may enforce compliance by the borrower with the terms of the loan agreement. Loans held by the Fund are generally in the form of Assignments, but the Fund may also invest in Participations. All Loans involve interest rate risk, liquidity risk and credit risk, including the potential default or insolvency of the borrower.
When-Issued/Delayed Delivery Securities. The Fund may purchase securities with delivery or payment to occur at a later date beyond the normal settlement period. At the time the Fund enters into a commitment to purchase a security, the transaction is recorded and the value of the transaction is reflected in the net asset value. The price of such security and the date when the security will be delivered and paid for are fixed at the time the transaction is negotiated. The value of the security may vary with market fluctuations. At the time the Fund enters into a purchase transaction it is required to segregate cash or other liquid assets at least equal to the amount of the commitment.
Certain risks may arise upon entering into when-issued or delayed delivery transaction from the potential inability of counterparties to meet the terms of their contracts or if the issuer does not issue the securities due to political, economic, or other factors. Additionally, losses may arise due to changes in the value of the underlying securities.
Taxes. The Fund's policy is to comply with the requirements of the Internal Revenue Code, as amended, which are applicable to regulated investment companies and to distribute all of its taxable income to its shareholders.
Under the Regulated Investment Company Modernization Act of 2010, net capital losses incurred post-enactment may be carried forward indefinitely, and their character is retained as short-term and/or long-term. Previously, net capital losses were carried forward for eight years and treated as short-term losses. As a transition rule, the Act requires that post-enactment net capital losses be used before pre-enactment net capital losses.
At December 31, 2013, the Fund had a net tax basis capital loss carryforward of approximately $41,157,000, including $39,235,000 of pre-enactment losses, which may be applied against any realized net taxable capital gains of each succeeding year until fully utilized or until December 31, 2014 ($3,844,000), December 31, 2015 ($858,000), December 31, 2016 ($17,301,000) and December 31, 2017 ($17,232,000), the respective expiration dates, whichever occurs first; and approximately $1,922,000 of post-enactment long-term losses, which may be applied against realized net taxable capital gains indefinitely.
The Fund has reviewed the tax positions for the open tax years as of December 31, 2013 and has determined that no provision for income tax is required in the Fund's financial statements. The Fund's federal tax returns for the prior three fiscal years remain open subject to examination by the Internal Revenue Service.
Distribution of Income and Gains. Distributions from net investment income of the Fund, if any, are declared and distributed to shareholders annually. Net realized gains from investment transactions, in excess of available capital loss carryforwards, would be taxable to the Fund if not distributed and, therefore, will be distributed to shareholders at least annually. The Fund may also make additional distributions for tax purposes if necessary.
The timing and characterization of certain income and capital gain distributions are determined annually in accordance with federal tax regulations which may differ from accounting principles generally accepted in the United States of America. These differences primarily relate to investments in foreign denominated investments, investments in forward currency contracts, investments in swap contracts and certain securities sold at a loss. As a result, net investment income (loss) and net realized gain (loss) on investment transactions for a reporting period may differ significantly from distributions during such period. Accordingly, the Fund may periodically make reclassifications among certain of its capital accounts without impacting the net asset value of the Fund.
At December 31, 2013, the Fund's components of distributable earnings on a tax basis were as follows:
| Undistributed ordinary income* | $ | 10,553,853 | ||
| Capital loss carryforwards | $ | (41,157,000 | ) | |
| Unrealized appreciation (depreciation) on investments | $ | 4,243,298 |
In addition, the tax character of distributions paid by the Fund is summarized as follows:
| Years Ended December 31, | ||||||||
| 2013 | 2012 | |||||||
| Distributions from ordinary income* | $ | 12,387,033 | $ | 13,525,278 | ||||
* For tax purposes, short-term capital gain distributions are considered ordinary income distributions.
Expenses. Expenses of the Trust arising in connection with a specific fund are allocated to that fund. Other Trust expenses which cannot be directly attributed to a fund are apportioned among the funds in the Trust based upon the relative net assets or other appropriate measures.
Contingencies. In the normal course of business, the Fund may enter into contracts with service providers that contain general indemnification clauses. The Fund's maximum exposure under these arrangements is unknown as this would involve future claims that may be made against the Fund that have not yet been made. However, based on experience, the Fund expects the risk of loss to be remote.
Other. Investment transactions are accounted for on a trade date plus one basis for daily net asset value calculations. However, for financial reporting purposes, investment transactions are reported on trade date. Interest income is recorded on the accrual basis. Dividend income is recorded on ex-dividend date. Realized gains and losses from investment transactions are recorded on an identified cost basis. Proceeds from litigation payments, if any, are included in net realized gain (loss) from investments. All discounts and premiums are accreted/amortized for both tax and financial reporting purposes for the Fund, with the exception of securities in default of principal.
B. Derivative Instruments
Swaps. A swap is a contract between two parties to exchange future cash flows at periodic intervals based on the notional amount of the swap. A bilateral swap is a transaction between the fund and a counterparty where cash flows are exchanged between the two parties. A centrally cleared swap is a transaction executed between the fund and a counterparty, then cleared by a clearing member through a central clearinghouse. The central clearinghouse serves as the counterparty, with whom the fund exchanges cash flows.
The value of a swap is adjusted daily, and the change in value, if any, is recorded as unrealized appreciation or depreciation in the Statement of Assets and Liabilities. Gains or losses are realized when the swap expires or is closed. Certain risks may arise when entering into swap transactions including counterparty default; liquidity; or unfavorable changes in interest rates or the value of the underlying reference security, commodity or index. In connection with bilateral swaps, securities and/or cash may be identified as collateral in accordance with the terms of the swap agreement to provide assets of value and recourse in the event of default. The maximum counterparty credit risk is the net present value of the cash flows to be received from or paid to the counterparty over the term of the swap, to the extent that this amount is beneficial to the Fund, in addition to any related collateral posted to the counterparty by the Fund. This risk may be partially reduced by a master netting arrangement between the Fund and the counterparty. Upon entering into a centrally cleared swap, the Fund is required to deposit with a financial intermediary cash or securities ("initial margin") in an amount equal to a certain percentage of the notional amount of the swap. Subsequent payments ("variation margin") are made or received by the Fund dependent upon the daily fluctuations in the value of the swap. In a cleared swap transaction, counterparty risk is minimized as the central clearinghouse acts as the counterparty.
An upfront payment, if any, made by the Fund is recorded as an asset in the Statement of Assets and Liabilities. An upfront payment, if any, received by the Fund is recorded as a liability in the Statement of Assets and Liabilities. Payments received or made at the end of the measurement period are recorded as realized gain or loss in the Statement of Operations.
Credit Default Swaps. Credit default swaps are agreements between a buyer and a seller of protection against predefined credit events for the reference entity. The Fund may enter into credit default swaps to gain exposure to an underlying issuer's credit quality characteristics without directly investing in that issuer or to hedge against the risk of a credit event on debt securities. As a seller of a credit default swap, the Fund is required to pay the par (or other agreed-upon) value of the referenced entity to the counterparty with the occurrence of a credit event by a third party, such as a U.S. or foreign corporate issuer, on the reference entity, which would likely result in a loss to the Fund. In return, the Fund receives from the counterparty a periodic stream of payments over the term of the swap provided that no credit event has occurred. If no credit event occurs, the Fund keeps the stream of payments with no payment obligations. The Fund may also buy credit default swaps, in which case the Fund functions as the counterparty referenced above. This involves the risk that the swap may expire worthless. It also involves counterparty risk that the seller may fail to satisfy its payment obligations to the Fund with the occurrence of a credit event. When the Fund sells a credit default swap, it will cover its commitment. This may be achieved by, among other methods, maintaining cash or liquid assets equal to the aggregate notional value of the reference entities for all outstanding credit default swaps sold by the Fund. For the year ended December 31, 2013, the Fund entered into credit default swap agreements to gain exposure to the underlying issuer's credit quality characteristics.
Under the terms of a credit default swap, the Fund receives or makes periodic payments based on a specified interest rate on a fixed notional amount. These payments are recorded as a realized gain or loss in the Statement of Operations. Payments received or made as a result of a credit event or termination of the swap are recognized, net of a proportional amount of the upfront payment, as realized gains or losses in the Statement of Operations.
A summary of the open credit default swap contracts as of December 31, 2013 is included in a table following the Fund's Investment Portfolio. For the year ended December 31, 2013, the Fund's investment in credit default swap contracts sold had a total notional value generally indicative of a range from $7,890,000 to $26,735,000.
Forward Foreign Currency Exchange Contracts. A forward foreign currency exchange contract ("forward currency contract") is a commitment to purchase or sell a foreign currency at the settlement date at a negotiated rate. For the year ended December 31, 2013, the Fund entered into forward currency contracts in order to hedge its exposure to changes in foreign currency exchange rates on its foreign currency denominated portfolio holdings and to facilitate transactions in foreign currency denominated securities.
Forward currency contracts are valued at the prevailing forward exchange rate of the underlying currencies and unrealized gain (loss) is recorded daily. On the settlement date of the forward currency contract, the Fund records a realized gain or loss equal to the difference between the value of the contract at the time it was opened and the value of the contract at the time it was closed. Certain risks may arise upon entering into forward currency contracts from the potential inability of counterparties to meet the terms of their contracts. The maximum counterparty credit risk to the Fund is measured by the unrealized gain on appreciated contracts. Additionally, when utilizing forward currency contracts to hedge, the Fund gives up the opportunity to profit from favorable exchange rate movements during the term of the contract.
A summary of the open forward currency contracts as of December 31, 2013 is included in a table following the Fund's Investment Portfolio. For the year ended December 31, 2013, the Fund's investment in forward currency contracts short vs. U.S. dollars had a total contract value generally indicative of a range from approximately $810,000 to $3,344,000, and the investment in forward currency contracts long vs. U.S. dollars had a total contract value generally indicative of a range from $0 to approximately $2,000.
The following tables summarize the value of the Fund's derivative instruments held as of December 31, 2013 and the related location in the accompanying Statement of Assets and Liabilities, presented by primary underlying risk exposure:
| Asset Derivative | Swap Contracts | |||
| Credit Contract (a) | $ | 1,015,131 | ||
The above derivative is located in the following Statement of Assets and Liabilities account: (a) Unrealized appreciation on swap contracts. Unsettled variation margin for centrally cleared swap is disclosed separately within the Statement of Assets and Liabilities. | ||||
| Liability Derivative | Forward Contracts | |||
| Foreign Exchange Contracts (a) | $ | (2,853 | ) | |
The above derivative is located in the following Statement of Assets and Liabilities account: (a) Unrealized appreciation on forward foreign currency exchange contracts | ||||
Additionally, the amount of unrealized and realized gains and losses on derivative instruments recognized in Fund earnings during the year ended December 31, 2013 and the related location in the accompanying Statement of Operations is summarized in the following tables by primary underlying risk exposure:
| Realized Gain (Loss) | Forward Contracts | Swap Contracts | Total | |||||||||
| Credit Contracts (a) | $ | — | $ | 1,192,415 | $ | 1,192,415 | ||||||
| Foreign Exchange Contracts (b) | (46,095 | ) | — | (46,095 | ) | |||||||
| $ | (46,095 | ) | $ | 1,192,415 | $ | 1,146,320 | ||||||
Each of the above derivatives is located in the following Statement of Operations accounts: (a) Net realized gain (loss) from swap contracts (b) Net realized gain (loss) from foreign currency (Statement of Operations includes both forward currency contracts and foreign currency transactions) | ||||||||||||
| Change in Net Unrealized Appreciation (Depreciation) | Forward Contracts | Swap Contracts | Total | |||||||||
| Credit Contracts (a) | $ | — | $ | 479,634 | $ | 479,634 | ||||||
| Foreign Exchange Contracts (b) | (14,439 | ) | — | (14,439 | ) | |||||||
| $ | (14,439 | ) | $ | 479,634 | $ | 465,195 | ||||||
Each of the above derivatives is located in the following Statement of Operations accounts: (a) Change in net unrealized appreciation (depreciation) on swap contracts (b) Change in net unrealized appreciation (depreciation) on foreign currency (Statement of Operations includes both forward currency contracts and foreign currency transactions) | ||||||||||||
As of December 31, 2013, the Fund has transactions subject to enforceable master netting agreements. A reconciliation of the gross amounts on the Statement of Assets and Liabilities to the net amounts by derivative type, including any collateral exposure, is included in the following tables:
| Counterparty | Gross Amounts of Assets Presented in the Statement of Assets and Liabilities | Financial Instruments and Derivatives Available for Offset | Collateral Received | Net Amount of Derivative Assets | ||||||||||||
| Bank of America | $ | 138,381 | $ | — | $ | — | $ | 138,381 | ||||||||
| Barclays Bank PLC | 70,092 | — | — | 70,092 | ||||||||||||
| Credit Suisse | 101,330 | — | — | 101,330 | ||||||||||||
| The Goldman Sachs & Co. | 103,143 | — | — | 103,143 | ||||||||||||
| JPMorgan Chase Securities, Inc. | 102,574 | — | — | 102,574 | ||||||||||||
| UBS AG | 42,710 | — | — | 42,710 | ||||||||||||
| Exchange Trade Swaps (a) | 456,901 | — | — | 456,901 | ||||||||||||
| $ | 1,015,131 | $ | — | $ | — | $ | 1,015,131 | |||||||||
| Counterparty | Gross Amounts of Liabilities Presented in the Statement of Assets and Liabilities | Financial Instruments and Derivatives Available for Offset | Collateral Pledged | Net Amount of Derivative Liabilities | ||||||||||||
| Citigroup, Inc. | $ | 2,853 | $ | — | $ | — | $ | 2,853 | ||||||||
(a) Includes financial instruments (centrally cleared swaps), which are not subject to a master netting arrangement or another similar arrangement.
C. Purchases and Sales of Securities
During the year ended December 31, 2013, purchases and sales of investment transactions (excluding short-term investments and U.S. Treasury securities) aggregated $82,479,636 and $101,570,850, respectively. Purchases of U.S. Treasury obligations aggregated $5,855,167.
D. Related Parties
Management Agreement. Under the Investment Management Agreement with Deutsche Investment Management Americas Inc. ("DIMA" or the "Advisor"), an indirect, wholly owned subsidiary of Deutsche Bank AG, the Advisor directs the investments of the Fund in accordance with its investment objectives, policies and restrictions. The Advisor determines the securities, instruments and other contracts relating to investments to be purchased, sold or entered into by the Fund.
Pursuant to the Investment Management Agreement with the Advisor, the Fund pays a monthly management fee based on the Fund's average daily net assets, computed and accrued daily and payable monthly, at the following annual rates:
| First $250 million | .500 | % | ||
| Next $750 million | .470 | % | ||
| Next $1.5 billion | .450 | % | ||
| Next $2.5 billion | .430 | % | ||
| Next $2.5 billion | .400 | % | ||
| Next $2.5 billion | .380 | % | ||
| Next $2.5 billion | .360 | % | ||
| Over $12.5 billion | .340 | % |
For the period from January 1, 2013 through September 30, 2014, the Advisor has contractually agreed to waive all or a portion of its fees and/or reimburse certain operating expenses of the Fund to the extent necessary to maintain the operating expenses (excluding certain expenses such as extraordinary expenses, taxes, brokerage and interest) of each class as follows:
| Class A | .72% |
| Class B | .97% |
Accordingly, for the year ended December 31, 2013, the Advisor waived a portion of its management fee pursuant to the Investment Management Agreement aggregating $21,419, and the amount charged aggregated $813,251, which was equivalent to an annual effective rate of 0.49% of the Fund's average daily net assets.
Administration Fee. Pursuant to an Administrative Services Agreement, DIMA provides most administrative services to the Fund. For all services provided under the Administrative Services Agreement, the Fund pays DIMA an annual fee ("Administration Fee") of 0.10% of the Fund's average daily net assets, computed and accrued daily and payable monthly. For the year ended December 31, 2013, the Administration Fee was $166,934, of which $14,093 is unpaid.
Service Provider Fees. DWS Investments Service Company ("DISC"), an affiliate of the Advisor, is the transfer agent, dividend-paying agent and shareholder service agent for the Fund. Pursuant to a sub-transfer agency agreement between DISC and DST Systems, Inc. ("DST"), DISC has delegated certain transfer agent, dividend-paying agent and shareholder service agent functions to DST. DISC compensates DST out of the shareholder servicing fee it receives from the Fund. For the year ended December 31, 2013, the amounts charged to the Fund by DISC were as follows:
| Services to Shareholders | Total Aggregated | Waived | ||||||
| Class A | $ | 285 | $ | 285 | ||||
| Class B | 33 | 33 | ||||||
| $ | 318 | $ | 318 | |||||
In addition, for the year ended December 31, 2013, the Advisor reimbursed $162 of non-affiliated recordkeeping fees.
Distribution Service Agreement. Under the Fund's Class B 12b-1 plans, DWS Investments Distributors, Inc. ("DIDI") received a fee ("Distribution Service Fee") of 0.25% of average daily net assets of Class B shares. For the year ended December 31, 2013, the Distribution Service Fee was $413, of which $3 was waived and $78 is unpaid.
Typesetting and Filing Service Fees. Under an agreement with DIMA, DIMA is compensated for providing typesetting and certain regulatory filing services to the Fund. For the year ended December 31, 2013, the amount charged to the Fund by DIMA included in the Statement of Operations under "reports to shareholders" aggregated $21,463, of which $6,136 is unpaid.
Trustees' Fees and Expenses. The Fund paid retainer fees to each Trustee not affiliated with the Advisor, plus specified amounts to the Board Chairperson and Vice Chairperson and to each committee Chairperson.
Affiliated Cash Management Vehicles. The Fund may invest uninvested cash balances in Central Cash Management Fund and DWS Variable NAV Money Fund, affiliated money market funds which are managed by the Advisor. Each affiliated money market fund seeks to provide a high level of current income consistent with liquidity and the preservation of capital. Each affiliated money market fund is managed in accordance with Rule 2a-7 under the Investment Company Act of 1940, which governs the quality, maturity, diversity and liquidity of instruments in which a money market fund may invest. Central Cash Management Fund seeks to maintain a stable net asset value, and DWS Variable NAV Money Fund maintains a floating net asset value. The Fund indirectly bears its proportionate share of the expenses of each affiliated money market fund in which it invests. Central Cash Management Fund does not pay the Advisor an investment management fee. To the extent that DWS Variable NAV Money Fund pays an investment management fee to the Advisor, the Advisor will waive an amount of the investment management fee payable to the Advisor by the Fund equal to the amount of the investment management fee payable on the Fund's assets invested in DWS Variable NAV Money Fund.
Security Lending Fees. Deutsche Bank AG serves as lending agent for the Fund. For the year ended December 31, 2013, the Fund incurred lending agent fees to Deutsche Bank AG for the amount of $3,645.
E. Investing in High-Yield Securities
The Fund's performance could be hurt if a security declines in credit quality or goes into default, or if an issuer does not make timely payments of interest or principal. Because the issuers of high-yield debt securities or junk bonds (debt securities rated below the fourth-highest category) may be in uncertain financial health, the risk of loss from default by the issuer is significantly greater. Prices and yields of high-yield securities will fluctuate over time and, during periods of economic uncertainty, volatility of high-yield securities may adversely affect a fund's net asset value. Because the Fund may invest in securities not paying current interest or in securities already in default, these risks may be more pronounced.
F. Ownership of the Fund
At December 31, 2013, three participating insurance companies were owners of record of 10% or more of the total outstanding Class A shares of the Fund, each owning 34%, 28% and 28%. Two participating insurance companies were owners of record of 10% or more of the total outstanding Class B shares of the Fund, each owning 88% and 12%.
G. Line of Credit
The Fund and other affiliated funds (the "Participants") share in a $375 million revolving credit facility provided by a syndication of banks. The Fund may borrow for temporary or emergency purposes, including the meeting of redemption requests that otherwise might require the untimely disposition of securities. The Participants are charged an annual commitment fee which is allocated based on net assets, among each of the Participants. Interest is calculated at a rate per annum equal to the sum of the Federal Funds Rate plus 1.25 percent plus if LIBOR exceeds the Federal Funds Rate the amount of such excess. The Fund may borrow up to a maximum of 33 percent of its net assets under the agreement. The Fund had no outstanding loans at December 31, 2013.
To the Board of Trustees of DWS Variable Series II and Shareholders of DWS High Income VIP:
We have audited the accompanying statement of assets and liabilities, including the investment portfolio, of DWS High Income VIP (the "Fund") (one of the funds constituting DWS Variable Series II), as of December 31, 2013, and the related statement of operations for the year then ended, the statements of changes in net assets for each of the two years in the period then ended, and the financial highlights for each of the five years in the period then ended. These financial statements and financial highlights are the responsibility of the Fund's management. Our responsibility is to express an opinion on these financial statements and financial highlights based on our audits.
We conducted our audits in accordance with the standards of the Public Company Accounting Oversight Board (United States). Those standards require that we plan and perform the audit to obtain reasonable assurance about whether the financial statements and financial highlights are free of material misstatement. We were not engaged to perform an audit of the Fund's internal control over financial reporting. Our audits included consideration of internal control over financial reporting as a basis for designing audit procedures that are appropriate in the circumstances, but not for the purpose of expressing an opinion on the effectiveness of the Fund's internal control over financial reporting. Accordingly, we express no such opinion. An audit also includes examining, on a test basis, evidence supporting the amounts and disclosures in the financial statements and financial highlights, assessing the accounting principles used and significant estimates made by management, and evaluating the overall financial statement presentation. Our procedures included confirmation of securities owned as of December 31, 2013, by correspondence with the custodian and brokers, or by other appropriate auditing procedures where replies from brokers were not received. We believe that our audits provide a reasonable basis for our opinion.
In our opinion, the financial statements and financial highlights referred to above present fairly, in all material respects, the financial position of DWS High Income VIP (one of the funds constituting DWS Variable Series II) at December 31, 2013, the results of its operations for the year then ended, the changes in its net assets for each of the two years in the period then ended, and the financial highlights for each of the five years in the period then ended, in conformity with U.S. generally accepted accounting principles.
| ||
Boston, Massachusetts February 14, 2014 |
As an investor of the Fund, you incur two types of costs: ongoing expenses and transaction costs. Ongoing expenses include management fees, distribution and service (12b-1) fees and other Fund expenses. Examples of transaction costs include contract charges, redemption fees and account maintenance fees, which are not shown in this section. The following tables are intended to help you understand your ongoing expenses (in dollars) of investing in the Fund and to help you compare these expenses with the ongoing expenses of investing in other mutual funds. In the most recent six-month period, the Fund limited these expenses; had it not done so, expenses would have been higher. The example in the table is based on an investment of $1,000 invested at the beginning of the six-month period and held for the entire period (July 1, 2013 to December 31, 2013).
The tables illustrate your Fund's expenses in two ways:
—Actual Fund Return. This helps you estimate the actual dollar amount of ongoing expenses (but not transaction costs) paid on a $1,000 investment in the Fund using the Fund's actual return during the period. To estimate the expenses you paid over the period, simply divide your account value by $1,000 (for example, an $8,600 account value divided by $1,000 = 8.6), then multiply the result by the number in the "Expenses Paid per $1,000" line under the share class you hold.
— Hypothetical 5% Fund Return. This helps you to compare your Fund's ongoing expenses (but not transaction costs) with those of other mutual funds using the Fund's actual expense ratio and a hypothetical rate of return of 5% per year before expenses. Examples using a 5% hypothetical Fund return may be found in the shareholder reports of other mutual funds. The hypothetical account values and expenses may not be used to estimate the actual ending account balance or expenses you paid for the period.
Please note that the expenses shown in these tables are meant to highlight your ongoing expenses only and do not reflect any transaction costs. The "Expenses Paid per $1,000" line of the tables is useful in comparing ongoing expenses only and will not help you determine the relative total expense of owning different funds. If these transaction costs had been included, your costs would have been higher.
Expenses and Value of a $1,000 Investment for the six months ended December 31, 2013 | ||||||||
| Actual Fund Return | Class A | Class B | ||||||
| Beginning Account Value 7/1/13 | $ | 1,000.00 | $ | 1,000.00 | ||||
| Ending Account Value 12/31/13 | $ | 1,059.40 | $ | 1,055.90 | ||||
| Expenses Paid per $1,000* | $ | 3.74 | $ | 5.03 | ||||
| Hypothetical 5% Fund Return | Class A | Class B | ||||||
| Beginning Account Value 7/1/13 | $ | 1,000.00 | $ | 1,000.00 | ||||
| Ending Account Value 12/31/13 | $ | 1,021.58 | $ | 1,020.32 | ||||
| Expenses Paid per $1,000* | $ | 3.67 | $ | 4.94 | ||||
* Expenses are equal to the Fund's annualized expense ratio for each share class, multiplied by the average account value over the period, multiplied by 184 (the number of days in the most recent six-month period), then divided by 365.
| Annualized Expense Ratios | Class A | Class B | ||
| DWS Variable Series II — DWS High Income VIP | .72% | .97% |
For more information, please refer to the Fund's prospectus.
These tables do not reflect charges and fees ("contract charges") associated with the separate account that invests in the Fund or any variable life insurance policy or variable annuity contract for which the Fund is an investment option.
For an analysis of the fees associated with an investment in the fund or similar funds, please refer to the current and hypothetical expense calculators for Variable Insurance Products which can be found at dws-investments.com/EN/resources/calculators.jsp.
Please consult a tax advisor if you have questions about federal or state income tax laws, or on how to prepare your tax returns. If you have specific questions about your account, please contact your insurance provider.
The Trust's policies and procedures for voting proxies for portfolio securities and information about how the Trust voted proxies related to its portfolio securities during the 12-month period ended June 30 are available on our Web site — dws-investments.com (click on "proxy voting" at the bottom of the page) — or on the SEC's Web site — sec.gov. To obtain a written copy of the Trust's policies and procedures without charge, upon request, call us toll free at (800) 728-3337.
The Board of Trustees approved the renewal of DWS High Income VIP's investment management agreement (the "Agreement") with Deutsche Investment Management Americas Inc. ("DIMA") in September 2013.
In terms of the process that the Board followed prior to approving the Agreement, shareholders should know that:
— In September 2013, all but one of the Fund's Trustees were independent of DIMA and its affiliates.
— The Trustees met frequently during the past year to discuss fund matters and dedicated a substantial amount of time to contract review matters. Over the course of several months, the Board's Contract Committee, in coordination with the Board's Fixed Income and Asset Allocation Oversight Committee, reviewed comprehensive materials received from DIMA, independent third parties and independent counsel. These materials included an analysis of the Fund's performance, fees and expenses, and profitability compiled by a fee consultant retained by the Fund's Independent Trustees (the "Fee Consultant"). The Board also received extensive information throughout the year regarding performance of the Fund.
—The Independent Trustees regularly meet privately with their independent counsel to discuss contract review and other matters. In addition, the Independent Trustees were also advised by the Fee Consultant in the course of their review of the Fund's contractual arrangements and considered a comprehensive report prepared by the Fee Consultant in connection with their deliberations.
— In connection with reviewing the Agreement, the Board also reviewed the terms of the Fund's Rule 12b-1 plan, distribution agreement, administrative services agreement, transfer agency agreement and other material service agreements.
— Based on its evaluation of the information provided, the Contract Committee presented its findings and recommendations to the Board. The Board then reviewed the Contract Committee's findings and recommendations.
In connection with the contract review process, the Contract Committee and the Board considered the factors discussed below, among others. The Board also considered that DIMA and its predecessors have managed the Fund since its inception, and the Board believes that a long-term relationship with a capable, conscientious advisor is in the best interests of the Fund. The Board considered, generally, that shareholders chose to invest or remain invested in the Fund knowing that DIMA managed the Fund, and that the Agreement was approved by the Fund's shareholders. DIMA is part of Deutsche Bank AG, a major global banking institution that is engaged in a wide range of financial services. The Board believes that there are advantages to being part of a global asset management business that offers a wide range of investing expertise and resources, including hundreds of portfolio managers and analysts with research capabilities in many countries throughout the world.
As part of the contract review process, the Board carefully considered the fees and expenses of each DWS fund overseen by the Board in light of the fund's performance. In many cases, this led to a negotiation with DIMA of lower expense caps as part of the 2012 and 2013 contract review processes than had previously been in place. As part of these negotiations, the Board indicated that it would consider relaxing these new lower caps in future years following sustained improvements in performance, among other considerations.
In June 2012, Deutsche Bank AG ("DB"), DIMA's parent company, announced that DB would combine its Asset Management (of which DIMA was a part) and Wealth Management divisions. DB has advised the Independent Trustees that the U.S. asset management business is a critical and integral part of DB, and that it has, and will continue to, reinvest a significant portion of the substantial savings it expects to realize by combining its Asset Management and Wealth Management divisions into the new Asset and Wealth Management ("AWM") division, including ongoing enhancements to its investment capabilities. DB also has confirmed its commitment to maintaining strong legal and compliance groups within the AWM division.
While shareholders may focus primarily on fund performance and fees, the Fund's Board considers these and many other factors, including the quality and integrity of DIMA's personnel and such other issues as back-office operations, fund valuations, and compliance policies and procedures.
Nature, Quality and Extent of Services. The Board considered the terms of the Agreement, including the scope of advisory services provided under the Agreement. The Board noted that, under the Agreement, DIMA provides portfolio management services to the Fund and that, pursuant to a separate administrative services agreement, DIMA provides administrative services to the Fund. The Board considered the experience and skills of senior management and investment personnel, the resources made available to such personnel, the ability of DIMA to attract and retain high-quality personnel, and the organizational depth and stability of DIMA. The Board reviewed the Fund's performance over short-term and long-term periods and compared those returns to various agreed-upon performance measures, including market indices and a peer universe compiled by the Fee Consultant using information supplied by Morningstar Direct ("Morningstar"), an independent fund data service. The Board also noted that it has put into place a process of identifying "Focus Funds" (e.g., funds performing poorly relative to their benchmark or a peer universe compiled by an independent fund data service), and receives more frequent reporting and information from DIMA regarding such funds, along with DIMA's remedial plans to address underperformance. The Board believes this process is an effective manner of identifying and addressing underperforming funds. Based on the information provided, the Board noted that for the one-, three- and five-year periods ended December 31, 2012, the Fund's performance (Class A shares) was in the 2nd quartile, 3rd quartile and 3rd quartile, respectively, of the applicable Morningstar universe (the 1st quartile being the best performers and the 4th quartile being the worst performers). The Board also observed that the Fund has outperformed its benchmark in the one-year period and has underperformed its benchmark in the three- and five-year periods ended December 31, 2012.
Fees and Expenses. The Board considered the Fund's investment management fee schedule, operating expenses and total expense ratios, and comparative information provided by Lipper Inc. ("Lipper") and the Fee Consultant regarding investment management fee rates paid to other investment advisors by similar funds (1st quartile being the most favorable and 4th quartile being the least favorable). With respect to management fees paid to other investment advisors by similar funds, the Board noted that the contractual fee rates paid by the Fund, which include a 0.10% fee paid to DIMA under the Fund's administrative services agreement, were lower than the median (1st quartile) of the applicable Lipper peer group (based on Lipper data provided as of December 31, 2012). The Board noted that the Fund's Class A shares total (net) operating expenses were expected to be equal to the median of the applicable Lipper expense universe (based on Lipper data provided as of December 31, 2012, and analyzing Lipper expense universe Class A (net) expenses less any applicable 12b-1 fees) ("Lipper Universe Expenses"). The Board also reviewed data comparing each share class's total (net) operating expenses to the applicable Lipper Universe Expenses. The Board considered the Fund's management fee rate as compared to fees charged by DIMA to comparable funds and considered differences between the Fund and the comparable funds. The Board also considered how the Fund's total (net) operating expenses compared to the total (net) operating expenses of a more customized peer group selected by Lipper (based on such factors as asset size). The Board also noted that the expense limitations agreed to by DIMA helped to ensure that the Fund's total (net) operating expenses would remain competitive.
The information considered by the Board as part of its review of management fees included information regarding fees charged by DIMA and its affiliates to similar institutional accounts and to similar funds offered primarily to European investors ("DWS Europe funds"), in each case as applicable. The Board observed that advisory fee rates for institutional accounts generally were lower than the management fees charged by similarly managed DWS U.S. mutual funds ("DWS Funds"), but also took note of the differences in services provided to DWS Funds as compared to institutional accounts. In the case of DWS Europe funds, the Board observed that fee rates for DWS Europe funds generally were higher than for similarly managed DWS Funds, but noted that differences in the types of services provided to DWS Funds relative to DWS Europe funds made it difficult to compare such fees.
On the basis of the information provided, the Board concluded that management fees were reasonable and appropriate in light of the nature, quality and extent of services provided by DIMA.
Profitability. The Board reviewed detailed information regarding revenues received by DIMA under the Agreement. The Board considered the estimated costs and pre-tax profits realized by DIMA from advising the DWS Funds, as well as estimates of the pre-tax profits attributable to managing the Fund in particular. The Board also received information regarding the estimated enterprise-wide profitability of DWS and its affiliates with respect to all fund services in totality and by fund. The Board and the Fee Consultant reviewed DIMA's methodology in allocating its costs to the management of the Fund. Based on the information provided, the Board concluded that the pre-tax profits realized by DIMA in connection with the management of the Fund were not unreasonable. The Board also reviewed information regarding the profitability of certain similar investment management firms. The Board noted that while information regarding the profitability of such firms is limited (and in some cases is not necessarily prepared on a comparable basis), DIMA and its affiliates' overall profitability with respect to the DWS fund complex (after taking into account distribution and other services provided to the funds by DIMA and its affiliates) was lower than the overall profitability levels of many comparable firms for which such data was available.
Economies of Scale. The Board considered whether there are economies of scale with respect to the management of the Fund and whether the Fund benefits from any economies of scale. The Board noted that the Fund's management fee schedule includes fee breakpoints. The Board concluded that the Fund's fee schedule represents an appropriate sharing between the Fund and DIMA of such economies of scale as may exist in the management of the Fund at current asset levels.
Other Benefits to DIMA and Its Affiliates. The Board also considered the character and amount of other incidental benefits received by DIMA and its affiliates, including any fees received by DIMA for administrative services provided to the Fund and any fees received by an affiliate of DIMA for distribution services. The Board also considered benefits to DIMA related to brokerage and soft-dollar allocations, including allocating brokerage to pay for research generated by parties other than the executing broker dealers, which pertain primarily to funds investing in equity securities, along with the incidental public relations benefits to DIMA related to DWS Funds advertising and cross-selling opportunities among DIMA products and services. The Board concluded that management fees were reasonable in light of these fallout benefits.
Compliance. The Board considered the significant attention and resources dedicated by DIMA to documenting and enhancing its compliance processes in recent years. The Board noted in particular (i) the experience and seniority of both DIMA's chief compliance officer and the Fund's chief compliance officer; (ii) the large number of DIMA compliance personnel; and (iii) the substantial commitment of resources by DIMA and its affiliates to compliance matters.
Based on all of the information considered and the conclusions reached, the Board unanimously determined that the continuation of the Agreement is in the best interests of the Fund. In making this determination, the Board did not give particular weight to any single factor identified above. The Board considered these factors over the course of numerous meetings, certain of which were in executive session with only the Independent Trustees and their independent counsel present. It is possible that individual Trustees may have weighed these factors differently in reaching their individual decisions to approve the continuation of the Agreement.
The following table presents certain information regarding the Board Members and Officers of the fund. Each Board Member's year of birth is set forth in parentheses after his or her name. Unless otherwise noted, (i) each Board Member has engaged in the principal occupation(s) noted in the table for at least the most recent five years, although not necessarily in the same capacity; and (ii) the address of each Independent Board Member is c/o Kenneth C. Froewiss, Chairman, DWS Mutual Funds, P.O. Box 78, Short Hills, NJ 07078. Except as otherwise noted below, the term of office for each Board Member is until the election and qualification of a successor, or until such Board Member sooner dies, resigns, is removed or as otherwise provided in the governing documents of the fund. Because the fund does not hold an annual meeting of shareholders, each Board Member will hold office for an indeterminate period. The Board Members may also serve in similar capacities with other funds in the fund complex.
| Independent Board Members | ||||
Name, Year of Birth, Position with the Fund and Length of Time Served1 | Business Experience and Directorships During the Past Five Years | Number of Funds in DWS Fund Complex Overseen | Other Directorships Held by Board Member | |
Kenneth C. Froewiss (1945) Chairperson since 2013, and Board Member since 2001 | Adjunct Professor of Finance, NYU Stern School of Business (September 2009–present; Clinical Professor from 1997–September 2009); Member, Finance Committee, Association for Asian Studies (2002–present); Director, Mitsui Sumitomo Insurance Group (US) (2004–present); prior thereto, Managing Director, J.P. Morgan (investment banking firm) (until 1996) | 103 | — | |
William McClayton (1944) Vice Chairperson since 2013, and Board Member since 2004 | Private equity investor (since October 2009); previously, Managing Director, Diamond Management & Technology Consultants, Inc. (global consulting firm) (2001–2009); Directorship: Board of Managers, YMCA of Metropolitan Chicago; formerly: Senior Partner, Arthur Andersen LLP (accounting) (1966–2001); Trustee, Ravinia Festival | 103 | — | |
John W. Ballantine (1946) Board Member since 1999 | Retired; formerly, Executive Vice President and Chief Risk Management Officer, First Chicago NBD Corporation/The First National Bank of Chicago (1996–1998); Executive Vice President and Head of International Banking (1995–1996); former Directorships: Stockwell Capital Investments PLC (private equity); First Oak Brook Bancshares, Inc. and Oak Brook Bank; Prisma Energy International | 103 | Chairman of the Board, Healthways, Inc.2 (provider of disease and care management services) (2003– present); Portland General Electric2 (utility company) (2003– present) | |
Henry P. Becton, Jr. (1943) Board Member since 1990 | Vice Chair and former President, WGBH Educational Foundation. Directorships: Public Radio International; Public Radio Exchange (PRX); North Bennett Street School (Boston); former Directorships: The PBS Foundation; Association of Public Television Stations; Boston Museum of Science; American Public Television; Concord Academy; New England Aquarium; Mass. Corporation for Educational Telecommunications; Committee for Economic Development; Public Broadcasting Service; Connecticut College | 103 | Lead Director, Becton Dickinson and Company2 (medical technology company); Lead Director, Belo Corporation2 (media company) | |
Dawn-Marie Driscoll (1946) Board Member since 1987 | President, Driscoll Associates (consulting firm); Emeritus Executive Fellow, Center for Business Ethics, Bentley University; formerly, Partner, Palmer & Dodge (1988–1990); Vice President of Corporate Affairs and General Counsel, Filene's (1978–1988). Directorships: Director of ICI Mutual Insurance Company (since 2007); Advisory Board, Center for Business Ethics, Bentley University; Chairman of the Board of Trustees, Southwest Florida Community Foundation (charitable organization); former Directorships: Sun Capital Advisers Trust (mutual funds) (2007–2012), Investment Company Institute (audit, executive, nominating committees) and Independent Directors Council (governance, executive committees) | 103 | — | |
Keith R. Fox, CFA (1954) Board Member since 1996 | Managing General Partner, Exeter Capital Partners (a series of private investment funds) (since 1986). Directorships: Progressive International Corporation (kitchen goods importer and distributor); The Kennel Shop (retailer); former Chairman, National Association of Small Business Investment Companies; former Directorships: BoxTop Media Inc. (advertising); Sun Capital Advisers Trust (mutual funds) (2011–2012) | 103 | — | |
Paul K. Freeman (1950) Board Member since 1993 | Consultant, World Bank/Inter-American Development Bank; Executive and Governing Council of the Independent Directors Council (Chairman of Education Committee); formerly: Project Leader, International Institute for Applied Systems Analysis (1998–2001); Chief Executive Officer, The Eric Group, Inc. (environmental insurance) (1986–1998); Directorships: Denver Zoo Foundation (December 2012–present); former Directorships: Prisma Energy International | 103 | — | |
Richard J. Herring (1946) Board Member since 1990 | Jacob Safra Professor of International Banking and Professor, Finance Department, The Wharton School, University of Pennsylvania (since July 1972); Co-Director, Wharton Financial Institutions Center (since July 2000); Co-Chair, U.S. Shadow Financial Regulatory Committee; Executive Director, Financial Economists Roundtable; formerly: Vice Dean and Director, Wharton Undergraduate Division (July 1995–June 2000); Director, Lauder Institute of International Management Studies (July 2000–June 2006) | 103 | Director, Japan Equity Fund, Inc. (since September 2007), Thai Capital Fund, Inc. (since 2007), Singapore Fund, Inc. (since September 2007), Independent Director of Barclays Bank Delaware (since September 2010) | |
Rebecca W. Rimel (1951) Board Member since 1995 | President and Chief Executive Officer, The Pew Charitable Trusts (charitable organization) (1994 to present); formerly: Executive Vice President, The Glenmede Trust Company (investment trust and wealth management) (1983–2004); Board Member, Investor Education (charitable organization) (2004–2005); Trustee, Executive Committee, Philadelphia Chamber of Commerce (2001–2007); Director, Viasys Health Care2 (January 2007–June 2007); Trustee, Thomas Jefferson Foundation (charitable organization) (1994–2012) | 103 | Director, Becton Dickinson and Company2 (medical technology company) (2012– present); Director, CardioNet, Inc.2 (health care) (2009– present) | |
William N. Searcy, Jr. (1946) Board Member since 1993 | Private investor since October 2003; formerly: Pension & Savings Trust Officer, Sprint Corporation2 (telecommunications) (November 1989–September 2003); Trustee, Sun Capital Advisers Trust (mutual funds) (1998–2012) | 103 | — | |
Jean Gleason Stromberg (1943) Board Member since 1997 | Retired. Formerly, Consultant (1997–2001); Director, Financial Markets U.S. Government Accountability Office (1996–1997); Partner, Fulbright & Jaworski, L.L.P. (law firm) (1978–1996). Directorships: The William and Flora Hewlett Foundation; former Directorships: Service Source, Inc., Mutual Fund Directors Forum (2002–2004), American Bar Retirement Association (funding vehicle for retirement plans) (1987–1990 and 1994–1996) | 103 | — | |
Robert H. Wadsworth (1940) Board Member since 1999 | President, Robert H. Wadsworth & Associates, Inc. (consulting firm) (1983 to present); Director, National Horizon, Inc. (non-profit organization); Director and Treasurer, The Phoenix Boys Choir Association | 106 | — | |
Officers4 | ||
Name, Year of Birth, Position with the Fund and Length of Time Served5 | Business Experience and Directorships During the Past Five Years | |
Brian E. Binder8,9 (1972) President and Chief Executive Officer, 2013–present | Managing Director3 and Head of Fund Administration, Deutsche Asset & Wealth Management (2013–present); formerly: Head of Business Management and Consulting at Invesco, Ltd. (2010–2012); Chief Administrative Officer, Van Kampen Funds Inc. (2008–2010); and Chief Administrative Officer, Morgan Stanley Investment Management Americas Distribution (2003–2008) | |
John Millette7 (1962) Vice President and Secretary, 1999–present | Director,3 Deutsche Asset & Wealth Management | |
Paul H. Schubert6 (1963) Chief Financial Officer, 2004–present Treasurer, 2005–present | Managing Director,3 Deutsche Asset & Wealth Management (since July 2004); formerly: Executive Director, Head of Mutual Fund Services and Treasurer for UBS Family of Funds (1998–2004); Vice President and Director of Mutual Fund Finance at UBS Global Asset Management (1994–1998) | |
Caroline Pearson7 (1962) Chief Legal Officer, 2010–present | Managing Director,3 Deutsche Asset & Wealth Management; formerly: Assistant Secretary for DWS family of funds (1997–2010) | |
Melinda Morrow6 (1970) Vice President, 2012–present | Director,3 Deutsche Asset & Wealth Management | |
Hepsen Uzcan7 (1974) Assistant Secretary, 2013–present | Vice President, Deutsche Asset & Wealth Management | |
Paul Antosca7 (1957) Assistant Treasurer, 2007–present | Director,3 Deutsche Asset & Wealth Management | |
Jack Clark7 (1967) Assistant Treasurer, 2007–present | Director,3 Deutsche Asset & Wealth Management | |
Diane Kenneally7 (1966) Assistant Treasurer, 2007–present | Director,3 Deutsche Asset & Wealth Management | |
John Caruso6 (1965) Anti-Money Laundering Compliance Officer, 2010–present | Managing Director,3 Deutsche Asset & Wealth Management | |
Robert Kloby6 (1962) Chief Compliance Officer, 2006–present | Managing Director,3 Deutsche Asset & Wealth Management | |
1 The length of time served represents the year in which the Board Member joined the board of one or more DWS funds currently overseen by the Board.
2 A publicly held company with securities registered pursuant to Section 12 of the Securities Exchange Act of 1934.
3 Executive title, not a board directorship.
4 As a result of their respective positions held with the Advisor, these individuals are considered "interested persons" of the Advisor within the meaning of the 1940 Act. Interested persons receive no compensation from the fund.
5 The length of time served represents the year in which the officer was first elected in such capacity for one or more DWS funds.
6 Address: 60 Wall Street, New York, NY 10005.
7 Address: One Beacon Street, Boston, MA 02108.
8 Address: 222 South Riverside Plaza, Chicago, IL 60606.
9 Effective as of December 1, 2013.
The fund's Statement of Additional Information ("SAI") includes additional information about the Board Members. The SAI is available, without charge, upon request. If you would like to request a copy of the SAI, you may do so by calling the following toll-free number: (800) 728-3337.
DWS Investments Distributors, Inc.
222 South Riverside Plaza
Chicago, IL 60606
(800) 621-1148
VS2HI-2 (R-025832-3 2/14)
December 31, 2013
Annual Report
DWS Variable Series II
DWS Large Cap Value VIP
Contents
3 Performance Summary 4 Management Summary 5 Portfolio Summary 6 Investment Portfolio 9 Statement of Assets and Liabilities 10 Statement of Operations 10 Statement of Changes in Net Assets 12 Financial Highlights 13 Notes to Financial Statements 18 Report of Independent Registered Public Accounting Firm 19 Information About Your Fund's Expenses 20 Tax Information 20 Proxy Voting 21 Advisory Agreement Board Considerations and Fee Evaluation 24 Board Members and Officers |
This report must be preceded or accompanied by a prospectus. To obtain an additional prospectus or summary prospectus, if available, call (800) 728-3337 or your financial representative. We advise you to consider the Fund's objectives, risks, charges and expenses carefully before investing. The summary prospectus and prospectus contain this and other important information about the Fund. Please read the prospectus carefully before you invest.
Investing in derivatives entails special risks relating to liquidity, leverage and credit that may reduce returns and/or increase volatility. The Fund may lend securities to approved institutions. Stocks may decline in value. See the prospectus for details.
Deutsche Asset & Wealth Management represents the asset management and wealth management activities conducted by Deutsche Bank AG or any of its subsidiaries, including the Advisor and DWS Investments Distributors, Inc.
NOT FDIC/NCUA INSURED NO BANK GUARANTEE MAY LOSE VALUE NOT A DEPOSIT
NOT INSURED BY ANY FEDERAL GOVERNMENT AGENCY
Fund performance shown is historical, assumes reinvestment of all dividend and capital gain distributions and does not guarantee future results. Investment return and principal value fluctuate with changing market conditions so that, when redeemed, shares may be worth more or less than their original cost. Current performance may be lower or higher than the performance data quoted. Please contact your participating insurance company for the Fund's most recent month-end performance. Performance doesn't reflect charges and fees ("contract charges") associated with the separate account that invests in the Fund or any variable life insurance policy or variable annuity contract for which the Fund is an investment option. These charges and fees will reduce returns. While all share classes have the same underlying portfolio, their performance will differ.
The gross expense ratios of the Fund, as stated in the fee table of the prospectus dated May 1, 2013 are 0.78% and 1.09% for Class A and Class B shares, respectively, and may differ from the expense ratios disclosed in the Financial Highlights tables in this report.
| Growth of an Assumed $10,000 Investment in DWS Large Cap Value VIP | ||
 | The Russell 1000® Value Index is an unmanaged index that consists of those stocks in the Russell 1000® Index with less-than-average growth orientation. The Russell 1000® Index is an unmanaged price-only index of the 1,000 largest capitalized companies that are domiciled in the U.S. and whose common stocks are traded. Index returns do not reflect any fees or expenses and it is not possible to invest directly into an index. | |
 | ||
| Yearly periods ended December 31 | ||
| Comparative Results | |||||||||||||||||
| DWS Large Cap Value VIP | 1-Year | 3-Year | 5-Year | 10-Year | |||||||||||||
| Class A | Growth of $10,000 | $ | 13,089 | $ | 14,360 | $ | 19,943 | $ | 18,590 | ||||||||
| Average annual total return | 30.89 | % | 12.82 | % | 14.80 | % | 6.40 | % | |||||||||
Russell 1000® Value Index | Growth of $10,000 | $ | 13,253 | $ | 15,634 | $ | 21,614 | $ | 20,773 | ||||||||
| Average annual total return | 32.53 | % | 16.06 | % | 16.67 | % | 7.58 | % | |||||||||
| DWS Large Cap Value VIP | 1-Year | 3-Year | 5-Year | 10-Year | |||||||||||||
| Class B | Growth of $10,000 | $ | 13,054 | $ | 14,234 | $ | 19,645 | $ | 17,970 | ||||||||
| Average annual total return | 30.54 | % | 12.49 | % | 14.46 | % | 6.04 | % | |||||||||
Russell 1000® Value Index | Growth of $10,000 | $ | 13,253 | $ | 15,634 | $ | 21,614 | $ | 20,773 | ||||||||
| Average annual total return | 32.53 | % | 16.06 | % | 16.67 | % | 7.58 | % | |||||||||
The growth of $10,000 is cumulative.
DWS Large Cap Value VIP returned 30.89% in 2013 (Class A shares, unadjusted for contract charges), slightly below the 32.53% return of its benchmark, the Russell 1000® Value Index.1
The largest positive contribution to our 2013 results came from our stock selection in the financial sector. Many of our holdings in the sector moved closer to their fair value after trading at a discount throughout the post-financial- crisis era. Our top contributors within financials were Ameriprise Financial, Inc., The NASDAQ OMX Group, Inc. and Lincoln National Corp. We also added value via stock selection in the consumer discretionary sector, where our largest contributor was H&R Block, Inc.2
On the negative side, our stock selection in the information technology and consumer staples sectors detracted from the Fund's return.3 The Fund's relative performance was also pressured by our positions in the types of defensive, high-dividend stocks that lagged during this time of elevated investor risk appetites, such as FirstEnergy Corp., AT&T, Inc. and Kellogg Co.
We enter 2014 with a relatively cautious view on the markets. After a year of such strong gains — which itself followed a four-year bull market in equities — broader-market valuations have become increasingly rich. One reason for this is that much of the past year's rally was driven by an expansion of price-to-earnings ratios rather than an improvement in bottom-line earnings.4 With valuations having become more extended, we see greater potential for negative surprises to disrupt market performance in the year ahead.
In this environment, our approach has been to take profits on stocks that reach our price targets and rotate into those with less expensive valuations. For instance, we have identified opportunities in certain areas that lagged in 2013, such as the consumer staples and information technology sectors. Both groups feature an abundance of companies with stable free-cash-flow yields, above-average dividend yields and attractive valuations. On the other end of the spectrum, we hold the largest underweights in the financial and industrials sectors.5 We believe this "flexible value" approach has helped refresh the portfolio and has ensured that it maintains an attractive valuation relative to the broader market.
Overall, we believe our defensive strategy and continued emphasis on undervalued, fundamentally sound large-cap companies remains the most prudent approach at this stage of the market cycle.
Thomas Schuessler, PhD
Lead Portfolio Manager
Peter Steffen, CFA
Oliver Pfeil, PhD
Portfolio Managers
The views expressed reflect those of the portfolio management team only through the end of the period of the report as stated on the cover. The management team's views are subject to change at any time based on market and other conditions and should not be construed as a recommendation. Past performance is no guarantee of future results. Current and future portfolio holdings are subject to risk.
1 The Russell 1000 Value Index is an unmanaged index that consists of those stocks in the Russell 1000® Index with less-than-average growth orientation. The Russell 1000 Index is an unmanaged price-only index of the 1,000 largest capitalized companies that are domiciled in the U.S. and whose common stocks are traded. Index returns do not reflect fees or expenses and it is not possible to invest directly into an index.
2 The consumer discretionary sector represents industries that produce goods and services that are not necessities in everyday life.
3 Consumer staples are the industries that manufacture and sell products such as food and beverages, prescription drugs, and household products.
4 Price-to-earnings ratio (P/E) ratio compares a company's current share price to its per-share earnings.
5 "Underweight" means the Fund holds a lower weighting in a given sector or security than the benchmark. "Overweight" means the Fund holds a higher weighting.
Asset Allocation (As a % of Investment Portfolio excluding Securities Lending Collateral) | 12/31/13 | 12/31/12 |
| Common Stocks | 99% | 98% |
| Cash Equivalents | 1% | 1% |
| Exchange-Traded Fund | — | 1% |
| 100% | 100% |
Sector Diversification (As a % of Common Stocks) | 12/31/13 | 12/31/12 |
| Financials | 24% | 24% |
| Health Care | 14% | 14% |
| Energy | 14% | 17% |
| Information Technology | 11% | 6% |
| Consumer Staples | 11% | 8% |
| Consumer Discretionary | 8% | 9% |
| Industrials | 7% | 10% |
| Utilities | 5% | 4% |
| Materials | 4% | 5% |
| Telecommunication Services | 2% | 3% |
| 100% | 100% |
Portfolio holdings and characteristics are subject to change.
For more complete details about the Fund's investment portfolio, see page 6.
Following the Fund's fiscal first and third quarter-end, a complete portfolio holdings listing is filed with the SEC on Form N-Q. The form will be available on the SEC's Web site at sec.gov, and it also may be reviewed and copied at the SEC's Public Reference Room in Washington, D.C. Information on the operation of the SEC's Public Reference Room may be obtained by calling (800) SEC-0330. The Fund's portfolio holdings are also posted on dws-investments.com from time to time. Please see the Fund's current prospectus for more information.
| Shares | Value ($) | |||||||
| Common Stocks 98.8% | ||||||||
| Consumer Discretionary 8.5% | ||||||||
| Automobiles 1.1% | ||||||||
| Ford Motor Co. | 325,000 | 5,014,750 | ||||||
| Diversified Consumer Services 0.8% | ||||||||
| DeVry Education Group, Inc. (a) | 50,000 | 1,775,000 | ||||||
| H&R Block, Inc. | 55,000 | 1,597,200 | ||||||
| 3,372,200 | ||||||||
| Hotels, Restaurants & Leisure 0.9% | ||||||||
| Carnival Corp. | 47,500 | 1,908,075 | ||||||
| McDonald's Corp. | 20,000 | 1,940,600 | ||||||
| 3,848,675 | ||||||||
| Household Durables 0.8% | ||||||||
| Jarden Corp.* | 30,000 | 1,840,500 | ||||||
| MDC Holdings, Inc. | 50,000 | 1,612,000 | ||||||
| 3,452,500 | ||||||||
| Leisure Equipment & Products 0.4% | ||||||||
| Hasbro, Inc. (a) | 32,500 | 1,787,825 | ||||||
| Media 3.7% | ||||||||
| Comcast Corp. "A" | 135,000 | 7,015,275 | ||||||
| News Corp. "A"* | 100,000 | 1,802,000 | ||||||
| Time Warner, Inc. | 40,000 | 2,788,800 | ||||||
| Twenty-First Century Fox, Inc. "A" | 50,000 | 1,759,000 | ||||||
| Walt Disney Co. | 40,000 | 3,056,000 | ||||||
| 16,421,075 | ||||||||
| Specialty Retail 0.8% | ||||||||
| Advance Auto Parts, Inc. | 17,500 | 1,936,900 | ||||||
| Staples, Inc. (a) | 90,000 | 1,430,100 | ||||||
| 3,367,000 | ||||||||
| Consumer Staples 10.7% | ||||||||
| Beverages 2.1% | ||||||||
| Beam, Inc. | 25,000 | 1,701,500 | ||||||
| Molson Coors Brewing Co. "B" | 40,000 | 2,246,000 | ||||||
| PepsiCo, Inc. | 60,000 | 4,976,400 | ||||||
| 8,923,900 | ||||||||
| Food & Staples Retailing 2.8% | ||||||||
| CVS Caremark Corp. | 70,000 | 5,009,900 | ||||||
| Sysco Corp. (a) | 50,000 | 1,805,000 | ||||||
| Wal-Mart Stores, Inc. | 40,000 | 3,147,600 | ||||||
| Walgreen Co. | 40,000 | 2,297,600 | ||||||
| 12,260,100 | ||||||||
| Food Products 1.4% | ||||||||
| Ingredion, Inc. | 25,000 | 1,711,500 | ||||||
| Kellogg Co. | 50,000 | 3,053,500 | ||||||
| Tyson Foods, Inc. "A" | 40,000 | 1,338,400 | ||||||
| 6,103,400 | ||||||||
| Household Products 2.7% | ||||||||
| Energizer Holdings, Inc. | 20,000 | 2,164,800 | ||||||
| Procter & Gamble Co. | 120,000 | 9,769,200 | ||||||
| 11,934,000 | ||||||||
| Tobacco 1.7% | ||||||||
| Altria Group, Inc. | 100,000 | 3,839,000 | ||||||
| Philip Morris International, Inc. | 40,000 | 3,485,200 | ||||||
| 7,324,200 | ||||||||
| Shares | Value ($) | |||||||
| Energy 13.6% | ||||||||
| Energy Equipment & Services 2.1% | ||||||||
| Halliburton Co. | 45,000 | 2,283,750 | ||||||
| Helmerich & Payne, Inc. (a) | 32,500 | 2,732,600 | ||||||
| National Oilwell Varco, Inc. | 25,000 | 1,988,250 | ||||||
| Transocean Ltd. (a) | 40,000 | 1,976,800 | ||||||
| 8,981,400 | ||||||||
| Oil, Gas & Consumable Fuels 11.5% | ||||||||
| Anadarko Petroleum Corp. | 25,000 | 1,983,000 | ||||||
| Apache Corp. | 37,250 | 3,201,265 | ||||||
| Canadian Oil Sands Ltd. | 125,000 | 2,351,141 | ||||||
| Chevron Corp. | 80,000 | 9,992,800 | ||||||
| ConocoPhillips | 50,000 | 3,532,500 | ||||||
| Devon Energy Corp. | 40,000 | 2,474,800 | ||||||
| Exxon Mobil Corp. | 135,000 | 13,662,000 | ||||||
| Hess Corp. | 25,000 | 2,075,000 | ||||||
| Marathon Oil Corp. | 65,000 | 2,294,500 | ||||||
| Occidental Petroleum Corp. | 34,750 | 3,304,725 | ||||||
| Phillips 66 | 40,000 | 3,085,200 | ||||||
| Suncor Energy, Inc. | 65,000 | 2,278,250 | ||||||
| 50,235,181 | ||||||||
| Financials 23.4% | ||||||||
| Capital Markets 4.1% | ||||||||
| Ameriprise Financial, Inc. | 20,000 | 2,301,000 | ||||||
| Apollo Global Management LLC "A" | 45,000 | 1,422,450 | ||||||
| Bank of New York Mellon Corp. | 70,000 | 2,445,800 | ||||||
| BlackRock, Inc. | 7,000 | 2,215,290 | ||||||
| Legg Mason, Inc. (a) | 45,000 | 1,956,600 | ||||||
| Oaktree Capital Group LLC | 35,000 | 2,059,400 | ||||||
| The Goldman Sachs Group, Inc. | 30,000 | 5,317,800 | ||||||
| 17,718,340 | ||||||||
| Commercial Banks 3.8% | ||||||||
| PNC Financial Services Group, Inc. | 90,000 | 6,982,200 | ||||||
| U.S. Bancorp. | 85,000 | 3,434,000 | ||||||
| Wells Fargo & Co. | 135,000 | 6,129,000 | ||||||
| 16,545,200 | ||||||||
| Consumer Finance 1.3% | ||||||||
| Capital One Financial Corp. | 75,000 | 5,745,750 | ||||||
| Diversified Financial Services 6.6% | ||||||||
| Bank of America Corp. | 525,000 | 8,174,250 | ||||||
| Citigroup, Inc. | 90,000 | 4,689,900 | ||||||
| JPMorgan Chase & Co. | 200,000 | 11,696,000 | ||||||
| Leucadia National Corp. | 60,000 | 1,700,400 | ||||||
| The NASDAQ OMX Group, Inc. | 67,500 | 2,686,500 | ||||||
| 28,947,050 | ||||||||
| Insurance 6.7% | ||||||||
| ACE Ltd. | 20,000 | 2,070,600 | ||||||
| Alleghany Corp.* | 5,000 | 1,999,800 | ||||||
| Allstate Corp. | 40,000 | 2,181,600 | ||||||
| Aon PLC | 25,000 | 2,097,250 | ||||||
| Chubb Corp. | 25,000 | 2,415,750 | ||||||
| CNA Financial Corp. | 50,000 | 2,144,500 | ||||||
| Fidelity National Financial, Inc. "A" (a) | 95,000 | 3,082,750 | ||||||
| PartnerRe Ltd. | 25,000 | 2,635,750 | ||||||
| Principal Financial Group, Inc. | 45,000 | 2,218,950 | ||||||
| Prudential Financial, Inc. | 27,500 | 2,536,050 | ||||||
| Shares | Value ($) | |||||||
| The Travelers Companies, Inc. | 25,000 | 2,263,500 | ||||||
| Unum Group | 50,000 | 1,754,000 | ||||||
| Validus Holdings Ltd. | 50,000 | 2,014,500 | ||||||
| 29,415,000 | ||||||||
| Thrifts & Mortgage Finance 0.9% | ||||||||
| Home Loan Servicing Solutions Ltd. | 20,000 | 459,400 | ||||||
| Nationstar Mortgage Holdings, Inc.* (a) | 45,000 | 1,663,200 | ||||||
| New York Community Bancorp., Inc. (a) | 102,500 | 1,727,125 | ||||||
| 3,849,725 | ||||||||
| Health Care 13.7% | ||||||||
| Biotechnology 0.3% | ||||||||
| Amgen, Inc. | 12,500 | 1,427,000 | ||||||
| Health Care Equipment & Supplies 2.1% | ||||||||
| Becton, Dickinson & Co. (a) | 17,500 | 1,933,575 | ||||||
| C.R. Bard, Inc. | 15,000 | 2,009,100 | ||||||
| Medtronic, Inc. | 50,000 | 2,869,500 | ||||||
| St. Jude Medical, Inc. | 37,500 | 2,323,125 | ||||||
| 9,135,300 | ||||||||
| Health Care Providers & Services 3.2% | ||||||||
| Aetna, Inc. | 27,500 | 1,886,225 | ||||||
| HCA Holdings, Inc.* | 32,500 | 1,550,575 | ||||||
| McKesson Corp. | 15,000 | 2,421,000 | ||||||
| Owens & Minor, Inc. (a) | 40,000 | 1,462,400 | ||||||
| Select Medical Holdings Corp. | 150,000 | 1,741,500 | ||||||
| UnitedHealth Group, Inc. | 35,000 | 2,635,500 | ||||||
| WellPoint, Inc. | 25,000 | 2,309,750 | ||||||
| 14,006,950 | ||||||||
| Life Sciences Tools & Services 0.5% | ||||||||
| Agilent Technologies, Inc. | 40,000 | 2,287,600 | ||||||
| Pharmaceuticals 7.6% | ||||||||
| Bristol-Myers Squibb Co. | 50,000 | 2,657,500 | ||||||
| Eli Lilly & Co. | 37,500 | 1,912,500 | ||||||
| Hospira, Inc.* | 30,000 | 1,238,400 | ||||||
| Johnson & Johnson | 82,500 | 7,556,175 | ||||||
| Mallinckrodt PLC* | 37,500 | 1,959,750 | ||||||
| Merck & Co., Inc. | 157,500 | 7,882,875 | ||||||
| Pfizer, Inc. | 325,000 | 9,954,750 | ||||||
| 33,161,950 | ||||||||
| Industrials 7.0% | ||||||||
| Aerospace & Defense 2.2% | ||||||||
| Exelis, Inc. | 100,000 | 1,906,000 | ||||||
| Northrop Grumman Corp. | 25,000 | 2,865,250 | ||||||
| Raytheon Co. (a) | 55,000 | 4,988,500 | ||||||
| 9,759,750 | ||||||||
| Airlines 0.2% | ||||||||
| Southwest Airlines Co. | 50,000 | 942,000 | ||||||
| Commercial Services & Supplies 0.9% | ||||||||
| ABM Industries, Inc. | 62,500 | 1,786,875 | ||||||
| Republic Services, Inc. | 65,000 | 2,158,000 | ||||||
| 3,944,875 | ||||||||
| Industrial Conglomerates 2.7% | ||||||||
| Danaher Corp. | 25,000 | 1,930,000 | ||||||
| General Electric Co. | 350,000 | 9,810,500 | ||||||
| 11,740,500 | ||||||||
| Machinery 0.5% | ||||||||
| AGCO Corp. | 35,000 | 2,071,650 | ||||||
| Shares | Value ($) | |||||||
| Road & Rail 0.5% | ||||||||
| Norfolk Southern Corp. | 25,000 | 2,320,750 | ||||||
| Information Technology 11.2% | ||||||||
| Communications Equipment 1.5% | ||||||||
| Brocade Communications Systems, Inc.* | 225,000 | 1,995,750 | ||||||
| Cisco Systems, Inc. | 200,000 | 4,490,000 | ||||||
| 6,485,750 | ||||||||
| Computers & Peripherals 2.8% | ||||||||
| Apple, Inc. | 7,000 | 3,927,770 | ||||||
| EMC Corp. (a) | 75,000 | 1,886,250 | ||||||
| Hewlett-Packard Co. | 75,000 | 2,098,500 | ||||||
| SanDisk Corp. | 19,500 | 1,375,530 | ||||||
| Western Digital Corp. | 37,500 | 3,146,250 | ||||||
| 12,434,300 | ||||||||
| Electronic Equipment, Instruments & Components 0.4% | ||||||||
| Corning, Inc. | 95,000 | 1,692,900 | ||||||
| Internet Software & Services 0.4% | ||||||||
| IAC/InterActiveCorp. | 25,000 | 1,717,250 | ||||||
| IT Services 1.2% | ||||||||
| Booz Allen Hamilton Holding Corp. (a) | 65,000 | 1,244,750 | ||||||
| International Business Machines Corp. | 12,500 | 2,344,625 | ||||||
| Total System Services, Inc. | 50,000 | 1,664,000 | ||||||
| 5,253,375 | ||||||||
| Office Electronics 0.4% | ||||||||
| Xerox Corp. | 125,000 | 1,521,250 | ||||||
| Semiconductors & Semiconductor Equipment 2.1% | ||||||||
| Broadcom Corp. "A" | 50,000 | 1,482,500 | ||||||
| Intel Corp. | 100,000 | 2,596,000 | ||||||
| Marvell Technology Group Ltd. | 125,000 | 1,797,500 | ||||||
| NVIDIA Corp. | 100,000 | 1,602,000 | ||||||
| Texas Instruments, Inc. | 40,000 | 1,756,400 | ||||||
| 9,234,400 | ||||||||
| Software 2.4% | ||||||||
| CA, Inc. | 50,000 | 1,682,500 | ||||||
| Microsoft Corp. | 95,000 | 3,555,850 | ||||||
| Oracle Corp. | 90,000 | 3,443,400 | ||||||
| Symantec Corp. | 75,000 | 1,768,500 | ||||||
| 10,450,250 | ||||||||
| Materials 3.7% | ||||||||
| Chemicals 1.6% | ||||||||
| Celanese Corp. "A" | 30,000 | 1,659,300 | ||||||
| CF Industries Holdings, Inc. | 7,500 | 1,747,800 | ||||||
| LyondellBasell Industries NV "A" | 25,000 | 2,007,000 | ||||||
| Praxair, Inc. | 12,500 | 1,625,375 | ||||||
| 7,039,475 | ||||||||
| Containers & Packaging 0.4% | ||||||||
| Sonoco Products Co. | 45,000 | 1,877,400 | ||||||
| Metals & Mining 1.0% | ||||||||
| Constellium NV "A"* | 100,000 | 2,327,000 | ||||||
| Reliance Steel & Aluminum Co. | 28,000 | 2,123,520 | ||||||
| 4,450,520 | ||||||||
| Paper & Forest Products 0.7% | ||||||||
| International Paper Co. | 35,000 | 1,716,050 | ||||||
| Schweitzer-Mauduit International, Inc. | 25,000 | 1,286,750 | ||||||
| 3,002,800 | ||||||||
| Shares | Value ($) | |||||||
| Telecommunication Services 2.3% | ||||||||
| Diversified Telecommunication Services | ||||||||
| AT&T, Inc. | 237,500 | 8,350,500 | ||||||
| CenturyLink, Inc. (a) | 50,000 | 1,592,500 | ||||||
| 9,943,000 | ||||||||
| Utilities 4.7% | ||||||||
| Electric Utilities 2.9% | ||||||||
| American Electric Power Co., Inc. | 50,000 | 2,337,000 | ||||||
| Duke Energy Corp. | 35,000 | 2,415,350 | ||||||
| NextEra Energy, Inc. | 27,000 | 2,311,740 | ||||||
| Pinnacle West Capital Corp. | 30,000 | 1,587,600 | ||||||
| PPL Corp. | 62,500 | 1,880,625 | ||||||
| Southern Co. | 55,000 | 2,261,050 | ||||||
| 12,793,365 | ||||||||
| Gas Utilities 0.5% | ||||||||
| UGI Corp. | 50,000 | 2,073,000 | ||||||
| Independent Power Producers & Energy Traders 0.4% | ||||||||
| AES Corp. | 125,000 | 1,813,750 | ||||||
| Shares | Value ($) | |||||||
| Multi-Utilities 0.9% | ||||||||
| Public Service Enterprise Group, Inc. | 60,000 | 1,922,400 | ||||||
| Wisconsin Energy Corp. | 50,000 | 2,067,001 | ||||||
| 3,989,401 | ||||||||
Total Common Stocks (Cost $316,336,429) | 431,817,782 | |||||||
| Securities Lending Collateral 6.7% | ||||||||
| Daily Assets Fund Institutional, 0.08% (b) (c) (Cost $29,485,760) | 29,485,760 | 29,485,760 | ||||||
| Cash Equivalents 1.2% | ||||||||
| Central Cash Management Fund, 0.05% (b) (Cost $5,055,388) | 5,055,388 | 5,055,388 | ||||||
| % of Net Assets | Value ($) | |||||||
Total Investment Portfolio (Cost $350,877,577)† | 106.7 | 466,358,930 | ||||||
| Other Assets and Liabilities, Net | (6.7 | ) | (29,295,991 | ) | ||||
| Net Assets | 100.0 | 437,062,939 | ||||||
* Non-income producing security.
† The cost for federal income tax purposes was $352,040,216. At December 31, 2013, net unrealized appreciation for all securities based on tax cost was $114,318,714. This consisted of aggregate gross unrealized appreciation for all securities in which there was an excess of value over tax cost of $117,789,408 and aggregate gross unrealized depreciation for all securities in which there was an excess of tax cost over value of $3,470,694.
(a) All or a portion of these securities were on loan. In addition, "Other Assets and Liabilities, Net" may include pending sales that are also on loan. The value of securities loaned at December 31, 2013 amounted to $28,906,063, which is 6.6% of net assets.
(b) Affiliated fund managed by Deutsche Investment Management Americas Inc. The rate shown is the annualized seven-day yield at period end.
(c) Represents collateral held in connection with securities lending. Income earned by the Fund is net of borrower rebates.
Fair Value Measurements
Various inputs are used in determining the value of the Fund's investments. These inputs are summarized in three broad levels. Level 1 includes quoted prices in active markets for identical securities. Level 2 includes other significant observable inputs (including quoted prices for similar securities, interest rates, prepayment speeds and credit risk). Level 3 includes significant unobservable inputs (including the Fund's own assumptions in determining the fair value of investments). The level assigned to the securities valuations may not be an indication of the risk or liquidity associated with investing in those securities.
The following is a summary of the inputs used as of December 31, 2013 in valuing the Fund's investments. For information on the Fund's policy regarding the valuation of investments, please refer to the Security Valuation section of Note A in the accompanying Notes to Financial Statements.
| Assets | Level 1 | Level 2 | Level 3 | Total | ||||||||||||
| Common Stocks (d) | $ | 431,817,782 | $ | — | $ | — | $ | 431,817,782 | ||||||||
| Short-Term Investments (d) | 34,541,148 | — | — | 34,541,148 | ||||||||||||
| Total | $ | 466,358,930 | $ | — | $ | — | $ | 466,358,930 | ||||||||
There have been no transfers between fair value measurement levels during the year ended December 31, 2013.
(d) See Investment Portfolio for additional detailed categorizations.
The accompanying notes are an integral part of the financial statements.
| as of December 31, 2013 | ||||
| Assets | ||||
Investments: Investments in non-affiliated securities, at value (cost $316,336,429) — including $28,906,063 of securities loaned | $ | 431,817,782 | ||
| Investment in Daily Assets Fund Institutional (cost $29,485,760)* | 29,485,760 | |||
| Investment in Central Cash Management Fund (cost $5,055,388) | 5,055,388 | |||
| Total investments in securities, at value (cost $350,877,577) | 466,358,930 | |||
| Foreign currency, at value (cost $82,098) | 82,815 | |||
| Receivable for Fund shares sold | 733 | |||
| Dividends receivable | 656,434 | |||
| Interest receivable | 14,464 | |||
| Other assets | 6,719 | |||
| Total assets | 467,120,095 | |||
| Liabilities | ||||
| Payable upon return of securities loaned | 29,485,760 | |||
| Payable for Fund shares redeemed | 288,715 | |||
| Accrued management fee | 214,296 | |||
| Accrued Trustees' fees | 5,833 | |||
| Other accrued expenses and payables | 62,552 | |||
| Total liabilities | 30,057,156 | |||
| Net assets, at value | $ | 437,062,939 | ||
| Net Assets Consist of | ||||
| Undistributed net investment income | 7,303,655 | |||
Net unrealized appreciation (depreciation) on: Investments | 115,481,353 | |||
| Foreign currency | 717 | |||
| Accumulated net realized gain (loss) | (97,890,039 | ) | ||
| Paid-in capital | 412,167,253 | |||
| Net assets, at value | $ | 437,062,939 | ||
Class A Net Asset Value, offering and redemption price per share ($432,431,007 ÷ 27,072,074 outstanding shares of beneficial interest, no par value, unlimited number of shares authorized) | $ | 15.97 | ||
Class B Net Asset Value, offering and redemption price per share ($4,631,932 ÷ 289,672 outstanding shares of beneficial interest, no par value, unlimited number of shares authorized) | $ | 15.99 | ||
* Represents collateral on securities loaned.
The accompanying notes are an integral part of the financial statements.
Statement of Operations
| for the year ended December 31, 2013 | ||||
| Investment Income | ||||
Income: Dividends (net of foreign taxes withheld of $33,314) | $ | 10,529,716 | ||
| Income distributions — Central Cash Management Fund | 3,401 | |||
| Securities lending income, including income from Daily Assets Fund Institutional, net of borrower rebates | 43,358 | |||
| Total income | 10,576,475 | |||
Expenses: Management fee | 2,639,680 | |||
| Administration fee | 412,349 | |||
| Services to shareholders | 6,674 | |||
| Record keeping fees (Class B) | 2,279 | |||
| Distribution and service fee (Class B) | 10,257 | |||
| Custodian fee | 16,031 | |||
| Professional fees | 71,180 | |||
| Reports to shareholders | 38,373 | |||
| Trustees' fees and expenses | 18,216 | |||
| Other | 16,007 | |||
| Total expenses before expense reductions | 3,231,046 | |||
| Expense reductions | (146,952 | ) | ||
| Total expenses after expense reductions | 3,084,094 | |||
| Net investment income | $ | 7,492,381 | ||
| Realized and Unrealized Gain (Loss) | ||||
Net realized gain (loss) from: Investments | 42,916,615 | |||
| Futures | 226,766 | |||
| Foreign currency | (1,368 | ) | ||
| 43,142,013 | ||||
Change in net unrealized appreciation (depreciation) on: Investments | 59,916,192 | |||
| Foreign currency | (1,303 | ) | ||
| 59,914,889 | ||||
| Net gain (loss) | 103,056,902 | |||
| Net increase (decrease) in net assets resulting from operations | 110,549,283 | |||
The accompanying notes are an integral part of the financial statements.
| Years Ended December 31, | ||||||||
| Increase (Decrease) in Net Assets | 2013 | 2012 | ||||||
Operations: Net investment income | $ | 7,492,381 | $ | 8,087,256 | ||||
| Net realized gain (loss) | 43,142,013 | 9,766,336 | ||||||
| Change in net unrealized appreciation (depreciation) | 59,914,889 | 19,604,246 | ||||||
| Net increase (decrease) in net assets resulting from operations | 110,549,283 | 37,457,838 | ||||||
Distributions to shareholders from: Net investment income: Class A | (8,048,782 | ) | (7,645,527 | ) | ||||
| Class B | (66,664 | ) | (54,663 | ) | ||||
| Total distributions | (8,115,446 | ) | (7,700,190 | ) | ||||
Fund share transactions: Class A Proceeds from shares sold | 7,515,770 | 10,324,918 | ||||||
| Reinvestment of distributions | 8,048,782 | 7,645,527 | ||||||
| Payments for shares redeemed | (61,510,110 | ) | (66,665,475 | ) | ||||
| Net increase (decrease) in net assets from Class A share transactions | (45,945,558 | ) | (48,695,030 | ) | ||||
Class B Proceeds from shares sold | 822,748 | 728,624 | ||||||
| Reinvestment of distributions | 66,664 | 54,663 | ||||||
| Payments for shares redeemed | (844,581 | ) | (918,486 | ) | ||||
| Net increase (decrease) in net assets from Class B share transactions | 44,831 | (135,199 | ) | |||||
| Increase (decrease) in net assets | 56,533,110 | (19,072,581 | ) | |||||
| Net assets at beginning of period | 380,529,829 | 399,602,410 | ||||||
| Net assets at end of period (including undistributed net investment income of $7,303,655 and $7,947,397, respectively) | $ | 437,062,939 | $ | 380,529,829 | ||||
| Other Information | ||||||||
Class A Shares outstanding at beginning of period | 30,284,545 | 34,282,579 | ||||||
| Shares sold | 520,949 | 851,162 | ||||||
| Shares issued to shareholders in reinvestment of distributions | 590,520 | 631,340 | ||||||
| Shares redeemed | (4,323,940 | ) | (5,480,536 | ) | ||||
| Net increase (decrease) in Class A shares | (3,212,471 | ) | (3,998,034 | ) | ||||
| Shares outstanding at end of period | 27,072,074 | 30,284,545 | ||||||
Class B Shares outstanding at beginning of period | 286,965 | 298,416 | ||||||
| Shares sold | 55,598 | 59,337 | ||||||
| Shares issued to shareholders in reinvestment of distributions | 4,877 | 4,499 | ||||||
| Shares redeemed | (57,768 | ) | (75,287 | ) | ||||
| Net increase (decrease) in Class B shares | 2,707 | (11,451 | ) | |||||
| Shares outstanding at end of period | 289,672 | 286,965 | ||||||
The accompanying notes are an integral part of the financial statements.
| Years Ended December 31, | |||||||||||||||||||||
| Class A | 2013 | 2012 | 2011 | 2010 | 2009 | ||||||||||||||||
| Selected Per Share Data | |||||||||||||||||||||
| Net asset value, beginning of period | $ | 12.45 | $ | 11.56 | $ | 11.80 | $ | 10.86 | $ | 8.92 | |||||||||||
Income (loss) from investment operations: Net investment income (loss)a | .26 | .25 | .25 | .23 | .21 | ||||||||||||||||
| Net realized and unrealized gain (loss) | 3.54 | .87 | (.24 | ) | .93 | 1.97 | |||||||||||||||
| Total from investment operations | 3.80 | 1.12 | .01 | 1.16 | 2.18 | ||||||||||||||||
Less distributions from: Net investment income | (.28 | ) | (.23 | ) | (.25 | ) | (.22 | ) | (.24 | ) | |||||||||||
| Total distributions | (.28 | ) | (.23 | ) | (.25 | ) | (.22 | ) | (.24 | ) | |||||||||||
| Net asset value, end of period | $ | 15.97 | $ | 12.45 | $ | 11.56 | $ | 11.80 | $ | 10.86 | |||||||||||
| Total Return (%) | 30.89 | b | 9.79 | b | (.07 | ) | 10.77 | 25.37 | |||||||||||||
| Ratios to Average Net Assets and Supplemental Data | |||||||||||||||||||||
| Net assets, end of period ($ millions) | 432 | 377 | 396 | 206 | 214 | ||||||||||||||||
| Ratio of expenses before expense reductions (%) | .78 | .78 | .79 | .82 | .76 | ||||||||||||||||
| Ratio of expenses after expense reductions (%) | .74 | .77 | .79 | .82 | .76 | ||||||||||||||||
| Ratio of net investment income (loss) (%) | 1.82 | 2.04 | 2.15 | 2.13 | 2.22 | ||||||||||||||||
| Portfolio turnover rate (%) | 54 | 63 | 28 | 32 | 76 | ||||||||||||||||
a Based on average shares outstanding during the period. b Total return would have been lower had certain expenses not been reduced. | |||||||||||||||||||||
| Years Ended December 31, | |||||||||||||||||||||
| Class B | 2013 | 2012 | 2011 | 2010 | 2009 | ||||||||||||||||
| Selected Per Share Data | |||||||||||||||||||||
| Net asset value, beginning of period | $ | 12.46 | $ | 11.57 | $ | 11.81 | $ | 10.86 | $ | 8.92 | |||||||||||
Income (loss) from investment operations: Net investment income (loss)a | .22 | .21 | .22 | .20 | .19 | ||||||||||||||||
| Net realized and unrealized gain (loss) | 3.55 | .88 | (.25 | ) | .93 | 1.96 | |||||||||||||||
| Total from investment operations | 3.77 | 1.09 | (.03 | ) | 1.13 | 2.15 | |||||||||||||||
Less distributions from: Net investment income | (.24 | ) | (.20 | ) | (.21 | ) | (.18 | ) | (.21 | ) | |||||||||||
| Total distributions | (.24 | ) | (.20 | ) | (.21 | ) | (.18 | ) | (.21 | ) | |||||||||||
| Net asset value, end of period | $ | 15.99 | $ | 12.46 | $ | 11.57 | $ | 11.81 | $ | 10.86 | |||||||||||
| Total Return (%) | 30.54 | b | 9.44 | b | (.36 | ) | 10.53 | 24.86 | |||||||||||||
| Ratios to Average Net Assets and Supplemental Data | |||||||||||||||||||||
| Net assets, end of period ($ millions) | 5 | 4 | 3 | 1 | 1 | ||||||||||||||||
| Ratio of expenses before expense reductions (%) | 1.09 | 1.09 | 1.10 | 1.11 | 1.06 | ||||||||||||||||
| Ratio of expenses after expense reductions (%) | 1.05 | 1.08 | 1.10 | 1.11 | 1.06 | ||||||||||||||||
| Ratio of net investment income (loss) (%) | 1.52 | 1.73 | 1.84 | 1.84 | 1.92 | ||||||||||||||||
| Portfolio turnover rate (%) | 54 | 63 | 28 | 32 | 76 | ||||||||||||||||
a Based on average shares outstanding during the period. b Total return would have been lower had certain expenses not been reduced. | |||||||||||||||||||||
A. Organization and Significant Accounting Policies
DWS Large Cap Value VIP (the "Fund") is a diversified series of DWS Variable Series II (the "Trust"), which is registered under the Investment Company Act of 1940, as amended (the "1940 Act"), as an open-end management investment company organized as a Massachusetts business trust.
Multiple Classes of Shares of Beneficial Interest. The Fund offers two classes of shares (Class A shares and Class B shares). Sales of Class B shares are subject to recordkeeping fees up to 0.15% and Rule 12b-1 fees under the 1940 Act equal to an annual rate of 0.25% of the average daily net assets of the Class B shares of the Fund. Class A shares are not subject to such fees.
Investment income, realized and unrealized gains and losses, and certain fund-level expenses and expense reductions, if any, are borne pro rata on the basis of relative net assets by the holders of all classes of shares except that each class bears certain expenses unique to that class (including the applicable Rule 12b-1 fee and recordkeeping fees). Differences in class-level expenses may result in payment of different per share dividends by class. All shares have equal rights with respect to voting subject to class-specific arrangements.
The Fund's financial statements are prepared in accordance with accounting principles generally accepted in the United States of America which require the use of management estimates. Actual results could differ from those estimates. The policies described below are followed consistently by the Fund in the preparation of its financial statements.
Security Valuation. Investments are stated at value determined as of the close of regular trading on the New York Stock Exchange on each day the exchange is open for trading.
Various inputs are used in determining the value of the Fund's investments. These inputs are summarized in three broad levels. Level 1 includes quoted prices in active markets for identical securities. Level 2 includes other significant observable inputs (including quoted prices for similar securities, interest rates, prepayment speeds and credit risk). Level 3 includes significant unobservable inputs (including the Fund's own assumptions in determining the fair value of investments). The level assigned to the securities valuations may not be an indication of the risk or liquidity associated with investing in those securities.
Equity securities and exchange traded funds ("ETFs") are valued at the most recent sale price or official closing price reported on the exchange (U.S. or foreign) or over-the-counter market on which they trade. Securities for which no sales are reported are valued at the calculated mean between the most recent bid and asked quotations on the relevant market or, if a mean cannot be determined, at the most recent bid quotation. Equity securities are generally categorized as Level 1.
Investments in open-end investment companies are valued at their net asset value each business day and are categorized as Level 1.
Securities and other assets for which market quotations are not readily available or for which the above valuation procedures are deemed not to reflect fair value are valued in a manner that is intended to reflect their fair value as determined in accordance with procedures approved by the Board and are generally categorized as Level 3. In accordance with the Fund's valuation procedures, factors used in determining value may include, but are not limited to, the type of the security; the size of the holding; the initial cost of the security; the existence of any contractual restrictions on the security's disposition; the price and extent of public trading in similar securities of the issuer or of comparable companies; quotations or evaluated prices from broker-dealers and/or pricing services; information obtained from the issuer, analysts, and/or the appropriate stock exchange (for exchange-traded securities); an analysis of the company's or issuer's financial statements; an evaluation of the forces that influence the issuer and the market(s) in which the security is purchased and sold; and with respect to debt securities, the maturity, coupon, creditworthiness, currency denomination and the movement of the market in which the security is normally traded. The value determined under these procedures may differ from published values for the same securities.
Disclosure about the classification of fair value measurements is included in a table following the Fund's Investment Portfolio.
Foreign Currency Translations. The books and records of the Fund are maintained in U.S. dollars. Investment securities and other assets and liabilities denominated in a foreign currency are translated into U.S. dollars at the prevailing exchange rates at period end. Purchases and sales of investment securities, income and expenses are translated into U.S. dollars at the prevailing exchange rates on the respective dates of the transactions.
Net realized and unrealized gains and losses on foreign currency transactions represent net gains and losses between trade and settlement dates on securities transactions, the acquisition and disposition of foreign currencies, and the difference between the amount of net investment income accrued and the U.S. dollar amount actually received. That portion of both realized and unrealized gains and losses on investments that results from fluctuations in foreign currency exchange rates is not separately disclosed but is included with net realized and unrealized gain/appreciation and loss/depreciation on investments.
Securities Lending. Deutsche Bank AG, as lending agent, lends securities of the Fund to certain financial institutions under the terms of the Security Lending Agreement. The Fund retains the benefits of owning securities it has loaned and continues to receive interest and dividends generated by the securities and to participate in any changes in their market value. The Fund requires the borrowers of the securities to maintain collateral with the Fund consisting of either cash or liquid, unencumbered assets having a value at least equal to the value of the securities loaned. When the collateral falls below specified amounts, the lending agent will use its best effort to obtain additional collateral on the next business day to meet required amounts under the security lending agreement. The Fund may invest the cash collateral into a joint trading account in an affiliated money market fund pursuant to Exemptive Orders issued by the SEC. The Fund receives compensation for lending its securities either in the form of fees or by earning interest on invested cash collateral net of borrower rebates and fees paid to a lending agent. Either the Fund or the borrower may terminate the loan. There may be risks of delay and costs in recovery of securities or even loss of rights in the collateral should the borrower of the securities fail financially. If the Fund is not able to recover securities lent, the Fund may sell the collateral and purchase a replacement investment in the market, incurring the risk that the value of the replacement security is greater than the value of the collateral. The Fund is also subject to all investment risks associated with the reinvestment of any cash collateral received, including, but not limited to, interest rate, credit and liquidity risk associated with such investments.
As of December 31, 2013, the Fund had securities on loan. The value of the related collateral exceeded the value of the securities loaned at period end.
Federal Income Taxes. The Fund's policy is to comply with the requirements of the Internal Revenue Code, as amended, which are applicable to regulated investment companies and to distribute all of its taxable income to its shareholders.
Under the Regulated Investment Company Modernization Act of 2010, net capital losses incurred post-enactment may be carried forward indefinitely, and their character is retained as short-term and/or long-term. Previously, net capital losses were carried forward for eight years and treated as short-term losses. As a transition rule, the Act requires that post-enactment net capital losses be used before pre-enactment net capital losses.
At December 31, 2013, the Fund had a net tax basis capital loss carryforward of approximately $96,728,000 of pre-enactment losses, including approximately $88,212,000 inherited from its merger with an affiliated fund in previous years, which may be applied against any realized net taxable capital gains of each succeeding year until fully utilized or until December 31, 2016 ($88,418,000) and December 31, 2017 ($8,310,000), the respective expiration dates, whichever occurs first, and which may be subject to certain limitations under Section 382–384 of Internal Revenue Code.
The Fund has reviewed the tax positions for the open tax years as of December 31, 2013 and has determined that no provision for income tax is required in the Fund's financial statements. The Fund's federal tax returns for the prior three fiscal years remain open subject to examination by the Internal Revenue Service.
Distribution of Income and Gains. Distributions from net investment income of the Fund, if any, is declared and distributed to shareholders annually. Net realized gains from investment transactions, in excess of available capital loss carryforwards, would be taxable to the Fund if not distributed and, therefore, will be distributed to shareholders at least annually. The Fund may also make additional distributions for tax purposes if necessary.
The timing and characterization of certain income and capital gain distributions are determined annually in accordance with federal tax regulations which may differ from accounting principles generally accepted in the United States of America. These differences primarily relate to certain securities sold at a loss. As a result, net investment income (loss) and net realized gain (loss) on investment transactions for a reporting period may differ significantly from distributions during such period. Accordingly, the Fund may periodically make reclassifications among certain of its capital accounts without impacting the net asset value of the Fund.
At December 31, 2013, the Fund's components of distributable earnings on a tax basis were as follows:
| Undistributed ordinary income* | $ | 7,303,655 | ||
| Capital loss carryforwards | $ | (96,728,000 | ) | |
| Unrealized appreciation (depreciation) on investments | $ | 114,318,714 |
In addition, the tax character of distributions paid by the Fund is summarized as follows:
| Years Ended December 31, | ||||||||
| 2013 | 2012 | |||||||
| Distributions from ordinary income* | $ | 8,115,446 | $ | 7,700,190 | ||||
* For tax purposes, short-term capital gain distributions are considered ordinary income distributions.
Expenses. Expenses of the Trust arising in connection with a specific fund are allocated to that fund. Other Trust expenses which cannot be directly attributed to a fund are apportioned among the funds in the Trust based upon the relative net assets or other appropriate measures.
Contingencies. In the normal course of business, the Fund may enter into contracts with service providers that contain general indemnification clauses. The Fund's maximum exposure under these arrangements is unknown as this would involve future claims that may be made against the Fund that have not yet been made. However, based on experience, the Fund expects the risk of loss to be remote.
Other. Investment transactions are accounted for on a trade date plus one basis for daily net asset value calculations. However, for financial reporting purposes, investment transactions are reported on trade date. Interest income is recorded on the accrual basis. Dividend income is recorded on the ex-dividend date net of foreign withholding taxes. Realized gains and losses from investment transactions are recorded on an identified cost basis. Proceeds from litigation payments, if any, are included in net realized gain (loss) from investments.
B. Derivative Instruments
Futures Contracts. A futures contract is an agreement between a buyer or seller and an established futures exchange or its clearinghouse in which the buyer or seller agrees to take or make a delivery of a specific amount of a financial instrument at a specified price on a specific date (settlement date). For the year ended December 31, 2013, the Fund used futures for hedging purposes.
Upon entering into a futures contract, the Fund is required to deposit with a financial intermediary cash or securities ("initial margin") in an amount equal to a certain percentage of the face value indicated in the futures contract. Subsequent payments ("variation margin") are made or received by the Fund dependent upon the daily fluctuations in the value and are recorded for financial reporting purposes as unrealized gains or losses by the Fund. Gains or losses are realized when the contract expires or is closed. Since all futures contracts are exchange-traded, counterparty risk is minimized as the exchange's clearinghouse acts as the counterparty, and guarantees the futures against default.
Certain risks may arise upon entering into futures contracts, including the risk that an illiquid market will limit the Fund's ability to close out a futures contract prior to the settlement date and the risk that the futures contract is not well correlated with the security, index or currency to which it relates. Risk of loss may exceed amounts disclosed in the Statement of Assets and Liabilities.
There was no open futures contract as of December 31, 2013. For the year ended December 31, 2013, the investment in futures contracts sold had a total notional value generally indicative of a range from $0 to approximately $10,521,000.
The following table summarizes the amount of realized gains and losses on derivative instruments recognized in Fund earnings during the year ended December 31, 2013 and the related location in the accompanying Statement of Operations is summarized in the following table and by primary underlying risk exposure:
| Realized Gain (Loss) | Futures Contracts | |||
| Credit Contracts (a) | $ | 226,766 | ||
The above derivative is located in the following Statement of Operations account: (a) Net realized gain (loss) from futures | ||||
C. Purchases and Sales of Securities
During the year ended December 31, 2013, purchases and sales of investment transactions (excluding short-term investments) aggregated $220,424,426 and $267,045,161, respectively.
D. Related Parties
Management Agreement. Under the Investment Management Agreement with Deutsche Investment Management Americas Inc. ("DIMA" or the "Advisor"), an indirect, wholly owned subsidiary of Deutsche Bank AG, the Advisor directs the investments of the Fund in accordance with its investment objectives, policies and restrictions. The Advisor determines the securities, instruments and other contracts relating to investments to be purchased, sold or entered into by the Fund.
Under the Investment Management Agreement with the Advisor, the Fund pays a monthly management fee based on the Fund's average daily net assets, computed and accrued daily and payable monthly, at the following annual rates:
| First $250 million | .650 | % | ||
| Next $750 million | .625 | % | ||
| Next $1.5 billion | .600 | % | ||
| Next $2.5 billion | .575 | % | ||
| Next $2.5 billion | .550 | % | ||
| Next $2.5 billion | .525 | % | ||
| Next $2.5 billion | .500 | % | ||
| Over $12.5 billion | .475 | % |
For the period from January 1, 2013 through September 30, 2013, the Advisor had contractually agreed to waive all or a portion of its fees and/or reimburse certain operating expenses of the Fund to the extent necessary to maintain the operating expenses (excluding certain expenses such as extraordinary expenses, taxes, brokerage and interest) of each class as follows:
| Class A | .75% |
| Class B | 1.05% |
Effective October 1, 2013 through September 30, 2014, the Advisor had contractually agreed to waive all or a portion of its fees and/or reimburse certain operating expenses of the Fund to the extent necessary to maintain the operating expenses (excluding certain expenses such as extraordinary expenses, taxes, brokerage and interest) of each class as follows:
| Class A | .73% |
| Class B | 1.04% |
Accordingly, for the year ended December 31, 2013, the Advisor waived a portion of its management fee pursuant to the Investment Management Agreement aggregating $146,226, and the amount charged aggregated $2,493,454, which was equivalent to an annual effective rate of 0.60% of the Fund's average daily net assets.
Administration Fee. Pursuant to an Administrative Services Agreement, DIMA provides most administrative services to the Fund. For all services provided under the Administrative Services Agreement, the Fund pays DIMA an annual fee ("Administration Fee") of 0.10% of the Fund's average daily net assets, computed and accrued daily and payable monthly. For the year ended December 31, 2013, the Administration Fee was $412,349, of which $36,492 is unpaid.
Service Provider Fees. DWS Investments Service Company ("DISC"), an affiliate of the Advisor, is the transfer agent, dividend-paying agent and shareholder service agent for the Fund. Pursuant to a sub-transfer agency agreement between DISC and DST Systems, Inc. ("DST"), DISC has delegated certain transfer agent, dividend-paying agent and shareholder service agent functions to DST. DISC compensates DST out of the shareholder servicing fee it receives from the Fund. For the year ended December 31, 2013, the amounts charged to the Fund by DISC were as follows:
| Services to Shareholders | Total Aggregated | Waived | ||||||
| Class A | $ | 371 | $ | 371 | ||||
| Class B | 212 | 212 | ||||||
| $ | 583 | $ | 583 | |||||
In addition, for the year ended December 31, 2013, the Advisor reimbursed the Fund $143 of record keeping fees for Class B shares.
Distribution Service Agreement. Under the Fund's Class B 12b-1 plans, DWS Investments Distributors, Inc. ("DIDI") received a fee ("Distribution Service Fee") of 0.25% of average daily net assets of Class B shares. For the year ended December 31, 2013, the Distribution Service Fee aggregated $10,257, of which $964 is unpaid.
Typesetting and Filing Service Fees. Under an agreement with DIMA, DIMA is compensated for providing typesetting and certain regulatory filing services to the Fund. For the year ended December 31, 2013, the amount charged to the Fund by DIMA included in the Statement of Operations under "reports to shareholders" aggregated $17,213, of which $4,299 is unpaid.
Trustees' Fees and Expenses. The Fund paid retainer fees to each Trustee not affiliated with the Advisor, plus specified amounts to the Board Chairperson and Vice Chairperson and to each committee Chairperson.
Affiliated Cash Management Vehicles. The Fund may invest uninvested cash balances in Central Cash Management Fund and DWS Variable NAV Money Fund, affiliated money market funds which are managed by the Advisor. Each affiliated money market fund seeks to provide a high level of current income consistent with liquidity and the preservation of capital. Each affiliated money market fund is managed in accordance with Rule 2a-7 under the Investment Company Act of 1940, which governs the quality, maturity, diversity and liquidity of instruments in which a money market fund may invest. Central Cash Management Fund seeks to maintain a stable net asset value, and DWS Variable NAV Money Fund maintains a floating net asset value. The Fund indirectly bears its proportionate share of the expenses of each affiliated money market fund in which it invests. Central Cash Management Fund does not pay the Advisor an investment management fee. To the extent that DWS Variable NAV Money Fund pays an investment management fee to the Advisor, the Advisor will waive an amount of the investment management fee payable to the Advisor by the Fund equal to the amount of the investment management fee payable on the Fund's assets invested in DWS Variable NAV Money Fund.
Securities Lending Agent Fees. Deutsche Bank AG serves as securities lending agent for the Fund. For the year ended December 31, 2013, the Fund incurred securities lending agent fees to Deutsche Bank AG in the amount of $4,817.
E. Ownership of the Fund
At December 31, 2013, two participating insurance companies were owners of record of 10% or more of the total outstanding Class A shares of the Fund, each owning 55% and 26%. One participating insurance company was owner of record of 10% or more of the total outstanding Class B shares of the Fund, owning 63%.
F. Line of Credit
The Fund and other affiliated funds (the "Participants") share in a $375 million revolving credit facility provided by a syndication of banks. The Fund may borrow for temporary or emergency purposes, including the meeting of redemption requests that otherwise might require the untimely disposition of securities. The Participants are charged an annual commitment fee which is allocated based on net assets, among each of the Participants. Interest is calculated at a rate per annum equal to the sum of the Federal Funds Rate plus 1.25 percent plus if LIBOR exceeds the Federal Funds Rate the amount of such excess. The Fund may borrow up to a maximum of 33 percent of its net assets under the agreement. The Fund had no outstanding loans at December 31, 2013.
To the Board of Trustees of DWS Variable Series II and Shareholders of DWS Large Cap Value VIP:
We have audited the accompanying statement of assets and liabilities, including the investment portfolio of DWS Large Cap Value VIP (the "Fund") (one of the funds constituting DWS Variable Series II), as of December 31, 2013, and the related statement of operations for the year then ended, the statements of changes in net assets for each of the two years in the period then ended, and the financial highlights for each of the five years in the period then ended. These financial statements and financial highlights are the responsibility of the Fund's management. Our responsibility is to express an opinion on these financial statements and financial highlights based on our audits.
We conducted our audits in accordance with the standards of the Public Company Accounting Oversight Board (United States). Those standards require that we plan and perform the audit to obtain reasonable assurance about whether the financial statements and financial highlights are free of material misstatement. We were not engaged to perform an audit of the Fund's internal control over financial reporting. Our audits included consideration of internal control over financial reporting as a basis for designing audit procedures that are appropriate in the circumstances, but not for the purpose of expressing an opinion on the effectiveness of the Fund's internal control over financial reporting. Accordingly, we express no such opinion. An audit also includes examining, on a test basis, evidence supporting the amounts and disclosures in the financial statements and financial highlights, assessing the accounting principles used and significant estimates made by management, and evaluating the overall financial statement presentation. Our procedures included confirmation of securities owned as of December 31, 2013, by correspondence with the custodian and brokers. We believe that our audits provide a reasonable basis for our opinion.
In our opinion, the financial statements and financial highlights referred to above present fairly, in all material respects, the financial position of DWS Large Cap Value VIP (one of the funds constituting DWS Variable Series II) at December 31, 2013, the results of its operations for the year then ended, the changes in its net assets for each of the two years in the period then ended, and the financial highlights for each of the five years in the period then ended, in conformity with U.S. generally accepted accounting principles.
| ||
Boston, Massachusetts February 14, 2014 |
The tables illustrate your Fund's expenses in two ways:
As an investor of the Fund, you incur two types of costs: ongoing expenses and transaction costs. Ongoing expenses include management fees, distribution and service (12b-1) fees and other Fund expenses. Examples of transaction costs include contract charges and account maintenance fees, which are not shown in this section. The following tables are intended to help you understand your ongoing expenses (in dollars) of investing in the Fund and to help you compare these expenses with the ongoing expenses of investing in other mutual funds. In the most recent six-month period, the Fund limited these expenses; had it not done so, expenses would have been higher. The example in the table is based on an investment of $1,000 invested at the beginning of the six-month period and held for the entire period (July 1, 2013 to December 31, 2013).
—Actual Fund Return. This helps you estimate the actual dollar amount of ongoing expenses (but not transaction costs) paid on a $1,000 investment in the Fund using the Fund's actual return during the period. To estimate the expenses you paid over the period, simply divide your account value by $1,000 (for example, an $8,600 account value divided by $1,000 = 8.6), then multiply the result by the number in the "Expenses Paid per $1,000" line under the share class you hold.
— Hypothetical 5% Fund Return. This helps you to compare your Fund's ongoing expenses (but not transaction costs) with those of other mutual funds using the Fund's actual expense ratio and a hypothetical rate of return of 5% per year before expenses. Examples using a 5% hypothetical Fund return may be found in the shareholder reports of other mutual funds. The hypothetical account values and expenses may not be used to estimate the actual ending account balance or expenses you paid for the period.
Please note that the expenses shown in these tables are meant to highlight your ongoing expenses only and do not reflect any transaction costs. The "Expenses Paid per $1,000" line of the tables is useful in comparing ongoing expenses only and will not help you determine the relative total expense of owning different funds. If these transaction costs had been included, your costs would have been higher.
Expenses and Value of a $1,000 Investment for the six months ended December 31, 2013 | ||||||||
| Actual Fund Return | Class A | Class B | ||||||
| Beginning Account Value 7/1/13 | $ | 1,000.00 | $ | 1,000.00 | ||||
| Ending Account Value 12/31/13 | $ | 1,143.20 | $ | 1,142.10 | ||||
| Expenses Paid per $1,000* | $ | 4.00 | $ | 5.62 | ||||
| Hypothetical 5% Fund Return | Class A | Class B | ||||||
| Beginning Account Value 7/1/13 | $ | 1,000.00 | $ | 1,000.00 | ||||
| Ending Account Value 12/31/13 | $ | 1,021.48 | $ | 1,019.96 | ||||
| Expenses Paid per $1,000* | $ | 3.77 | $ | 5.30 | ||||
* Expenses are equal to the Fund's annualized expense ratio for each share class, multiplied by the average account value over the period, multiplied by 184 (the number of days in the most recent six-month period), then divided by 365.
| Annualized Expense Ratios | Class A | Class B | ||
| DWS Variable Series II — DWS Large Cap Value VIP | .74% | 1.04% |
For more information, please refer to the Fund's prospectus.
These tables do not reflect charges and fees ("contract charges") associated with the separate account that invests in the Fund or any variable life insurance policy or variable annuity contract for which the Fund is an investment option.
For an analysis of the fees associated with an investment in the fund or similar funds, please refer to the current and hypothetical expense calculators for Variable Insurance Products which can be found at dws-investments.com/EN/resources/calculators.jsp.
For corporate shareholders, 100% of the ordinary dividends (i.e., income dividends plus short-term capital gains) paid during the Fund's fiscal year ended December 31, 2013, qualified for the dividends received deduction.
Please consult a tax advisor if you have questions about federal or state income tax laws, or on how to prepare your tax returns. If you have specific questions about your account, please contact your insurance provider.
The Trust's policies and procedures for voting proxies for portfolio securities and information about how the Trust voted proxies related to its portfolio securities during the 12-month period ended June 30 are available on our Web site — dws-investments.com (click on "proxy voting" at the bottom of the page) — or on the SEC's Web site — sec.gov. To obtain a written copy of the Trust's policies and procedures without charge, upon request, call us toll free at (800) 728-3337.
The Board of Trustees approved the renewal of DWS Large Cap Value VIP's investment management agreement (the "Agreement") with Deutsche Investment Management Americas Inc. ("DIMA") in September 2013.
In terms of the process that the Board followed prior to approving the Agreement, shareholders should know that:
— In September 2013, all but one of the Fund's Trustees were independent of DIMA and its affiliates.
— The Trustees met frequently during the past year to discuss fund matters and dedicated a substantial amount of time to contract review matters. Over the course of several months, the Board's Contract Committee, in coordination with the Board's Equity Oversight Committee, reviewed comprehensive materials received from DIMA, independent third parties and independent counsel. These materials included an analysis of the Fund's performance, fees and expenses, and profitability compiled by a fee consultant retained by the Fund's Independent Trustees (the "Fee Consultant"). The Board also received extensive information throughout the year regarding performance of the Fund.
— The Independent Trustees regularly meet privately with their independent counsel to discuss contract review and other matters. In addition, the Independent Trustees were also advised by the Fee Consultant in the course of their review of the Fund's contractual arrangements and considered a comprehensive report prepared by the Fee Consultant in connection with their deliberations.
— In connection with reviewing the Agreement, the Board also reviewed the terms of the Fund's Rule 12b-1 plan, distribution agreement, administrative services agreement, transfer agency agreement and other material service agreements.
— Based on its evaluation of the information provided, the Contract Committee presented its findings and recommendations to the Board. The Board then reviewed the Contract Committee's findings and recommendations.
In connection with the contract review process, the Contract Committee and the Board considered the factors discussed below, among others. The Board also considered that DIMA and its predecessors have managed the Fund since its inception, and the Board believes that a long-term relationship with a capable, conscientious advisor is in the best interests of the Fund. The Board considered, generally, that shareholders chose to invest or remain invested in the Fund knowing that DIMA managed the Fund, and that the Agreement was approved by the Fund's shareholders. DIMA is part of Deutsche Bank AG, a major global banking institution that is engaged in a wide range of financial services. The Board believes that there are advantages to being part of a global asset management business that offers a wide range of investing expertise and resources, including hundreds of portfolio managers and analysts with research capabilities in many countries throughout the world.
As part of the contract review process, the Board carefully considered the fees and expenses of each DWS fund overseen by the Board in light of the fund's performance. In many cases, this led to a negotiation with DIMA of lower expense caps as part of the 2012 and 2013 contract review processes than had previously been in place. As part of these negotiations, the Board indicated that it would consider relaxing these new lower caps in future years following sustained improvements in performance, among other considerations.
In June 2012, Deutsche Bank AG ("DB"), DIMA's parent company, announced that DB would combine its Asset Management (of which DIMA was a part) and Wealth Management divisions. DB has advised the Independent Trustees that the U.S. asset management business is a critical and integral part of DB, and that it has, and will continue to, reinvest a significant portion of the substantial savings it expects to realize by combining its Asset Management and Wealth Management divisions into the new Asset and Wealth Management ("AWM") division, including ongoing enhancements to its investment capabilities. DB also has confirmed its commitment to maintaining strong legal and compliance groups within the AWM division.
While shareholders may focus primarily on fund performance and fees, the Fund's Board considers these and many other factors, including the quality and integrity of DIMA's personnel and such other issues as back-office operations, fund valuations, and compliance policies and procedures.
Nature, Quality and Extent of Services. The Board considered the terms of the Agreement, including the scope of advisory services provided under the Agreement. The Board noted that, under the Agreement, DIMA provides portfolio management services to the Fund and that, pursuant to a separate administrative services agreement, DIMA provides administrative services to the Fund. The Board considered the experience and skills of senior management and investment personnel, the resources made available to such personnel, the ability of DIMA to attract and retain high-quality personnel, and the organizational depth and stability of DIMA. The Board reviewed the Fund's performance over short-term and long-term periods and compared those returns to various agreed-upon performance measures, including market indices and a peer universe compiled by the Fee Consultant using information supplied by Morningstar Direct ("Morningstar"), an independent fund data service. The Board also noted that it has put into place a process of identifying "Focus Funds" (e.g., funds performing poorly relative to their benchmark or a peer universe compiled by an independent fund data service), and receives more frequent reporting and information from DIMA regarding such funds, along with DIMA's remedial plans to address underperformance. The Board believes this process is an effective manner of identifying and addressing underperforming funds. Based on the information provided, the Board noted that for the one-, three- and five-year periods ended December 31, 2012, the Fund's performance (Class A shares) was in the 4th quartile of the applicable Morningstar universe (the 1st quartile being the best performers and the 4th quartile being the worst performers). The Board also observed that the Fund has underperformed its benchmark in the one-, three- and five-year periods ended December 31, 2012. The Board noted the disappointing investment performance of the Fund in recent periods and continued to discuss with senior management of DIMA the factors contributing to such underperformance and actions being taken to improve performance. The Board recognized that DIMA has made changes to its investment personnel and processes in recent years in an effort to enhance its investment platform and improve long-term performance across the DWS fund complex.
Fees and Expenses. The Board considered the Fund's investment management fee schedule, operating expenses and total expense ratios, and comparative information provided by Lipper Inc. ("Lipper") and the Fee Consultant regarding investment management fee rates paid to other investment advisors by similar funds (1st quartile being the most favorable and 4th quartile being the least favorable). With respect to management fees paid to other investment advisors by similar funds, the Board noted that the contractual fee rates paid by the Fund, which include a 0.10% fee paid to DIMA under the Fund's administrative services agreement, were higher than the median (3rd quartile) of the applicable Lipper peer group (based on Lipper data provided as of December 31, 2012). The Board noted that the Fund's Class A shares total (net) operating expenses were expected to be lower than the median (2nd quartile) of the applicable Lipper expense universe (based on Lipper data provided as of December 31, 2012, and analyzing Lipper expense universe Class A (net) expenses less any applicable 12b-1 fees) ("Lipper Universe Expenses"). The Board also reviewed data comparing each share class's total (net) operating expenses to the applicable Lipper Universe Expenses. The Board considered the Fund's management fee rate as compared to fees charged by DIMA to comparable funds and considered differences between the Fund and the comparable funds. The Board also considered how the Fund's total (net) operating expenses compared to the total (net) operating expenses of a more customized peer group selected by Lipper (based on such factors as asset size). The Board also noted that the expense limitations agreed to by DIMA helped to ensure that the Fund's total (net) operating expenses would remain competitive.
The information considered by the Board as part of its review of management fees included information regarding fees charged by DIMA and its affiliates to similar institutional accounts and to similar funds offered primarily to European investors ("DWS Europe funds"), in each case as applicable. The Board observed that advisory fee rates for institutional accounts generally were lower than the management fees charged by similarly managed DWS U.S. mutual funds ("DWS Funds"), but also took note of the differences in services provided to DWS Funds as compared to institutional accounts. In the case of DWS Europe funds, the Board observed that fee rates for DWS Europe funds generally were higher than for similarly managed DWS Funds, but noted that differences in the types of services provided to DWS Funds relative to DWS Europe funds made it difficult to compare such fees.
On the basis of the information provided, the Board concluded that management fees were reasonable and appropriate in light of the nature, quality and extent of services provided by DIMA.
Profitability. The Board reviewed detailed information regarding revenues received by DIMA under the Agreement. The Board considered the estimated costs and pre-tax profits realized by DIMA from advising the DWS Funds, as well as estimates of the pre-tax profits attributable to managing the Fund in particular. The Board also received information regarding the estimated enterprise-wide profitability of DWS and its affiliates with respect to all fund services in totality and by fund. The Board and the Fee Consultant reviewed DIMA's methodology in allocating its costs to the management of the Fund. Based on the information provided, the Board concluded that the pre-tax profits realized by DIMA in connection with the management of the Fund were not unreasonable. The Board also reviewed information regarding the profitability of certain similar investment management firms. The Board noted that while information regarding the profitability of such firms is limited (and in some cases is not necessarily prepared on a comparable basis), DIMA and its affiliates' overall profitability with respect to the DWS fund complex (after taking into account distribution and other services provided to the funds by DIMA and its affiliates) was lower than the overall profitability levels of many comparable firms for which such data was available.
Economies of Scale. The Board considered whether there are economies of scale with respect to the management of the Fund and whether the Fund benefits from any economies of scale. The Board noted that the Fund's management fee schedule includes fee breakpoints. The Board concluded that the Fund's fee schedule represents an appropriate sharing between the Fund and DIMA of such economies of scale as may exist in the management of the Fund at current asset levels.
Other Benefits to DIMA and Its Affiliates. The Board also considered the character and amount of other incidental benefits received by DIMA and its affiliates, including any fees received by DIMA for administrative services provided to the Fund and any fees received by an affiliate of DIMA for distribution services. The Board also considered benefits to DIMA related to brokerage and soft-dollar allocations, including allocating brokerage to pay for research generated by parties other than the executing broker dealers, which pertain primarily to funds investing in equity securities, along with the incidental public relations benefits to DIMA related to DWS Funds advertising and cross-selling opportunities among DIMA products and services. The Board concluded that management fees were reasonable in light of these fallout benefits.
Compliance. The Board considered the significant attention and resources dedicated by DIMA to documenting and enhancing its compliance processes in recent years. The Board noted in particular (i) the experience and seniority of both DIMA's chief compliance officer and the Fund's chief compliance officer; (ii) the large number of DIMA compliance personnel; and (iii) the substantial commitment of resources by DIMA and its affiliates to compliance matters.
Based on all of the information considered and the conclusions reached, the Board unanimously determined that the continuation of the Agreement is in the best interests of the Fund. In making this determination, the Board did not give particular weight to any single factor identified above. The Board considered these factors over the course of numerous meetings, certain of which were in executive session with only the Independent Trustees and their independent counsel present. It is possible that individual Trustees may have weighed these factors differently in reaching their individual decisions to approve the continuation of the Agreement.
The following table presents certain information regarding the Board Members and Officers of the fund. Each Board Member's year of birth is set forth in parentheses after his or her name. Unless otherwise noted, (i) each Board Member has engaged in the principal occupation(s) noted in the table for at least the most recent five years, although not necessarily in the same capacity; and (ii) the address of each Independent Board Member is c/o Kenneth C. Froewiss, Chairman, DWS Mutual Funds, P.O. Box 78, Short Hills, NJ 07078. Except as otherwise noted below, the term of office for each Board Member is until the election and qualification of a successor, or until such Board Member sooner dies, resigns, is removed or as otherwise provided in the governing documents of the fund. Because the fund does not hold an annual meeting of shareholders, each Board Member will hold office for an indeterminate period. The Board Members may also serve in similar capacities with other funds in the fund complex.
| Independent Board Members | ||||
Name, Year of Birth, Position with the Fund and Length of Time Served1 | Business Experience and Directorships During the Past Five Years | Number of Funds in DWS Fund Complex Overseen | Other Directorships Held by Board Member | |
Kenneth C. Froewiss (1945) Chairperson since 2013, and Board Member since 2001 | Adjunct Professor of Finance, NYU Stern School of Business (September 2009–present; Clinical Professor from 1997–September 2009); Member, Finance Committee, Association for Asian Studies (2002–present); Director, Mitsui Sumitomo Insurance Group (US) (2004–present); prior thereto, Managing Director, J.P. Morgan (investment banking firm) (until 1996) | 103 | — | |
William McClayton (1944) Vice Chairperson since 2013, and Board Member since 2004 | Private equity investor (since October 2009); previously, Managing Director, Diamond Management & Technology Consultants, Inc. (global consulting firm) (2001–2009); Directorship: Board of Managers, YMCA of Metropolitan Chicago; formerly: Senior Partner, Arthur Andersen LLP (accounting) (1966–2001); Trustee, Ravinia Festival | 103 | — | |
John W. Ballantine (1946) Board Member since 1999 | Retired; formerly, Executive Vice President and Chief Risk Management Officer, First Chicago NBD Corporation/The First National Bank of Chicago (1996–1998); Executive Vice President and Head of International Banking (1995–1996); former Directorships: Stockwell Capital Investments PLC (private equity); First Oak Brook Bancshares, Inc. and Oak Brook Bank; Prisma Energy International | 103 | Chairman of the Board, Healthways, Inc.2 (provider of disease and care management services) (2003– present); Portland General Electric2 (utility company) (2003– present) | |
Henry P. Becton, Jr. (1943) Board Member since 1990 | Vice Chair and former President, WGBH Educational Foundation. Directorships: Public Radio International; Public Radio Exchange (PRX); North Bennett Street School (Boston); former Directorships: The PBS Foundation; Association of Public Television Stations; Boston Museum of Science; American Public Television; Concord Academy; New England Aquarium; Mass. Corporation for Educational Telecommunications; Committee for Economic Development; Public Broadcasting Service; Connecticut College | 103 | Lead Director, Becton Dickinson and Company2 (medical technology company); Lead Director, Belo Corporation2 (media company) | |
Dawn-Marie Driscoll (1946) Board Member since 1987 | President, Driscoll Associates (consulting firm); Emeritus Executive Fellow, Center for Business Ethics, Bentley University; formerly, Partner, Palmer & Dodge (1988–1990); Vice President of Corporate Affairs and General Counsel, Filene's (1978–1988). Directorships: Director of ICI Mutual Insurance Company (since 2007); Advisory Board, Center for Business Ethics, Bentley University; Chairman of the Board of Trustees, Southwest Florida Community Foundation (charitable organization); former Directorships: Sun Capital Advisers Trust (mutual funds) (2007–2012), Investment Company Institute (audit, executive, nominating committees) and Independent Directors Council (governance, executive committees) | 103 | — | |
Keith R. Fox, CFA (1954) Board Member since 1996 | Managing General Partner, Exeter Capital Partners (a series of private investment funds) (since 1986). Directorships: Progressive International Corporation (kitchen goods importer and distributor); The Kennel Shop (retailer); former Chairman, National Association of Small Business Investment Companies; former Directorships: BoxTop Media Inc. (advertising); Sun Capital Advisers Trust (mutual funds) (2011–2012) | 103 | — | |
Paul K. Freeman (1950) Board Member since 1993 | Consultant, World Bank/Inter-American Development Bank; Executive and Governing Council of the Independent Directors Council (Chairman of Education Committee); formerly: Project Leader, International Institute for Applied Systems Analysis (1998–2001); Chief Executive Officer, The Eric Group, Inc. (environmental insurance) (1986–1998); Directorships: Denver Zoo Foundation (December 2012–present); former Directorships: Prisma Energy International | 103 | — | |
Richard J. Herring (1946) Board Member since 1990 | Jacob Safra Professor of International Banking and Professor, Finance Department, The Wharton School, University of Pennsylvania (since July 1972); Co-Director, Wharton Financial Institutions Center (since July 2000); Co-Chair, U.S. Shadow Financial Regulatory Committee; Executive Director, Financial Economists Roundtable; formerly: Vice Dean and Director, Wharton Undergraduate Division (July 1995–June 2000); Director, Lauder Institute of International Management Studies (July 2000–June 2006) | 103 | Director, Japan Equity Fund, Inc. (since September 2007), Thai Capital Fund, Inc. (since 2007), Singapore Fund, Inc. (since September 2007), Independent Director of Barclays Bank Delaware (since September 2010) | |
Rebecca W. Rimel (1951) Board Member since 1995 | President and Chief Executive Officer, The Pew Charitable Trusts (charitable organization) (1994 to present); formerly: Executive Vice President, The Glenmede Trust Company (investment trust and wealth management) (1983–2004); Board Member, Investor Education (charitable organization) (2004–2005); Trustee, Executive Committee, Philadelphia Chamber of Commerce (2001–2007); Director, Viasys Health Care2 (January 2007–June 2007); Trustee, Thomas Jefferson Foundation (charitable organization) (1994–2012) | 103 | Director, Becton Dickinson and Company2 (medical technology company) (2012– present); Director, CardioNet, Inc.2 (health care) (2009– present) | |
William N. Searcy, Jr. (1946) Board Member since 1993 | Private investor since October 2003; formerly: Pension & Savings Trust Officer, Sprint Corporation2 (telecommunications) (November 1989–September 2003); Trustee, Sun Capital Advisers Trust (mutual funds) (1998–2012) | 103 | — | |
Jean Gleason Stromberg (1943) Board Member since 1997 | Retired. Formerly, Consultant (1997–2001); Director, Financial Markets U.S. Government Accountability Office (1996–1997); Partner, Fulbright & Jaworski, L.L.P. (law firm) (1978–1996). Directorships: The William and Flora Hewlett Foundation; former Directorships: Service Source, Inc., Mutual Fund Directors Forum (2002–2004), American Bar Retirement Association (funding vehicle for retirement plans) (1987–1990 and 1994–1996) | 103 | — | |
Robert H. Wadsworth (1940) Board Member since 1999 | President, Robert H. Wadsworth & Associates, Inc. (consulting firm) (1983 to present); Director, National Horizon, Inc. (non-profit organization); Director and Treasurer, The Phoenix Boys Choir Association | 106 | — | |
Officers4 | ||
Name, Year of Birth, Position with the Fund and Length of Time Served5 | Business Experience and Directorships During the Past Five Years | |
Brian E. Binder8,9 (1972) President and Chief Executive Officer, 2013–present | Managing Director3 and Head of Fund Administration, Deutsche Asset & Wealth Management (2013–present); formerly: Head of Business Management and Consulting at Invesco, Ltd. (2010–2012); Chief Administrative Officer, Van Kampen Funds Inc. (2008–2010); and Chief Administrative Officer, Morgan Stanley Investment Management Americas Distribution (2003–2008) | |
John Millette7 (1962) Vice President and Secretary, 1999–present | Director,3 Deutsche Asset & Wealth Management | |
Paul H. Schubert6 (1963) Chief Financial Officer, 2004–present Treasurer, 2005–present | Managing Director,3 Deutsche Asset & Wealth Management (since July 2004); formerly: Executive Director, Head of Mutual Fund Services and Treasurer for UBS Family of Funds (1998–2004); Vice President and Director of Mutual Fund Finance at UBS Global Asset Management (1994–1998) | |
Caroline Pearson7 (1962) Chief Legal Officer, 2010–present | Managing Director,3 Deutsche Asset & Wealth Management; formerly: Assistant Secretary for DWS family of funds (1997–2010) | |
Melinda Morrow6 (1970) Vice President, 2012–present | Director,3 Deutsche Asset & Wealth Management | |
Hepsen Uzcan7 (1974) Assistant Secretary, 2013–present | Vice President, Deutsche Asset & Wealth Management | |
Paul Antosca7 (1957) Assistant Treasurer, 2007–present | Director,3 Deutsche Asset & Wealth Management | |
Jack Clark7 (1967) Assistant Treasurer, 2007–present | Director,3 Deutsche Asset & Wealth Management | |
Diane Kenneally7 (1966) Assistant Treasurer, 2007–present | Director,3 Deutsche Asset & Wealth Management | |
John Caruso6 (1965) Anti-Money Laundering Compliance Officer, 2010–present | Managing Director,3 Deutsche Asset & Wealth Management | |
Robert Kloby6 (1962) Chief Compliance Officer, 2006–present | Managing Director,3 Deutsche Asset & Wealth Management | |
1 The length of time served represents the year in which the Board Member joined the board of one or more DWS funds currently overseen by the Board.
2 A publicly held company with securities registered pursuant to Section 12 of the Securities Exchange Act of 1934.
3 Executive title, not a board directorship.
4 As a result of their respective positions held with the Advisor, these individuals are considered "interested persons" of the Advisor within the meaning of the 1940 Act. Interested persons receive no compensation from the fund.
5 The length of time served represents the year in which the officer was first elected in such capacity for one or more DWS funds.
6 Address: 60 Wall Street, New York, NY 10005.
7 Address: One Beacon Street, Boston, MA 02108.
8 Address: 222 South Riverside Plaza, Chicago, IL 60606.
9 Effective as of December 1, 2013.
The fund's Statement of Additional Information ("SAI") includes additional information about the Board Members. The SAI is available, without charge, upon request. If you would like to request a copy of the SAI, you may do so by calling the following toll-free number: (800) 728-3337.
DWS Investments Distributors, Inc.
222 South Riverside Plaza
Chicago, IL 60606
(800) 621-1148
VS2LCV-2 (R-025833-3 2/14)
December 31, 2013
Annual Report
DWS Variable Series II
DWS Money Market VIP
Contents
3 Performance Summary 4 Management Summary 5 Portfolio Summary 7 Investment Portfolio 11 Statement of Assets and Liabilities 12 Statement of Operations 13 Statement of Changes in Net Assets 14 Financial Highlights 15 Notes to Financial Statements 18 Report of Independent Registered Public Accounting Firm 19 Information About Your Fund's Expenses 20 Tax Information 21 Other Information 22 Advisory Agreement Board Considerations and Fee Evaluation 25 Board Members and Officers |
This report must be preceded or accompanied by a prospectus. To obtain an additional prospectus or summary prospectus, if available, call (800) 728-3337 or your financial representative. We advise you to consider the Fund's objectives, risks, charges and expenses carefully before investing. The summary prospectus and prospectus contain this and other important information about the Fund. Please read the prospectus carefully before you invest.
An investment in this Fund is not insured or guaranteed by the Federal Deposit Insurance Corporation (FDIC) or by any other government agency. Although the Fund seeks to preserve the value of your investment at $1.00 per share, it is possible to lose money by investing in the Fund. The share price of money market funds can fall below the $1.00 share price. You should not rely on or expect the Advisor to enter into support agreements or take other actions to maintain the Fund's $1.00 share price. The credit quality of the Fund's holdings can change rapidly in certain markets, and the default of a single holding could have an adverse impact on the Fund's share price. The Fund's share price can also be negatively affected during periods of high redemption pressures and/or illiquid markets. The actions of a few large investors in the Fund may have a significant adverse effect on the share price of the Fund. See the prospectus for specific details regarding the Fund's risk profile.
Deutsche Asset & Wealth Management represents the asset management and wealth management activities conducted by Deutsche Bank AG or any of its subsidiaries, including the Advisor and DWS Investments Distributors, Inc.
NOT FDIC/NCUA INSURED NO BANK GUARANTEE MAY LOSE VALUE NOT A DEPOSIT
NOT INSURED BY ANY FEDERAL GOVERNMENT AGENCY
DWS Money Market VIP
All performance shown is historical, assumes reinvestment of all dividend and capital gain distributions and does not guarantee future results. Investment return and principal value fluctuate with changing market conditions so that, when redeemed, shares may be worth more or less than their original cost. Current performance may be lower or higher than the performance data quoted. Please contact your participating insurance company for the Fund's most recent month-end performance. Performance doesn't reflect charges and fees ("contract charges") associated with the separate account that invests in the Fund or any variable life insurance policy or variable annuity contract for which the Fund is an investment option. These charges and fees will reduce returns. The yield quotation more closely reflects the current earnings of the Fund than the total return quotation.
An investment in this Fund is not insured or guaranteed by the Federal Deposit Insurance Corporation (FDIC) or by any other government agency. Although the Fund seeks to preserve the value of your investment at $1.00 per share, it is possible to lose money by investing in the Fund. The share price of money market funds can fall below the $1.00 share price.
| 7-Day Current Yield | |
| December 31, 2013 | 0.01%* |
| December 31, 2012 | 0.01%* |
* The investment advisor has agreed to waive fees/reimburse expenses. Without such fee waivers/expense reimbursements, the 7-day current yield would have been lower.
Yields are historical, will fluctuate and do not guarantee future performance. The 7-day current yield refers to the income paid by the Fund over a 7-day period expressed as an annual percentage rate of the Fund's shares outstanding.
During the 12-month period ended December 31, 2013, the Fund provided a total return of 0.01% (Class A shares, unadjusted for contract charges). All performance is historical and does not guarantee future results. Yields fluctuate and are not guaranteed.
Over the Fund's most recent fiscal year ended December 31, 2013, the U.S. economy began to benefit from gradually increasing housing prices and steady, if unspectacular, employment gains. In late May 2013, equity and longer-term fixed-income investors were temporarily rattled by hints from the U.S. Federal Reserve Board (the Fed) that it could begin to taper its monthly asset purchases toward the end of 2013. By November 2013, U.S. job creation had picked up considerably, and speculation that the Fed would begin to taper in January or March 2014 started to build. When the Fed made its December 18 announcement that it would begin tapering in January 2014, financial markets took the news very much in stride. This was because a stream of more favorable economic data had increased overall investor confidence that the U.S. recovery is sustainable.
We were able to maintain a competitive yield for the Fund during the period. Yields fluctuate and are not guaranteed. During the past 12 months ending December 31, 2013, we continued to hold a large percentage of portfolio assets in short-maturity instruments for yield, high credit quality and liquidity purposes. We also maintained a conservative average maturity, with fund assets broadly diversified among a number of sectors, including banks, asset-backed commercial paper, corporate issues, and sovereign and U.S. government debt. In addition, we focused on favorable geographical areas for money market investment, such as Canada, Australia, Scandinavia, the United States and Japan. Based on benign credit conditions and our belief that short-term rates will remain very low for a long period, we extended the Fund's weighted average maturity moderately during the fourth quarter.1
A group of investment professionals is responsible for the day-to-day management of the Fund. These investment professionals have a broad range of experience managing money market funds.
The views expressed reflect those of the portfolio management team only through the end of the period of the report as stated on the cover. The management team's views are subject to change at any time based on market and other conditions and should not be construed as a recommendation. Past performance is no guarantee of future results. Current and future portfolio holdings are subject to risk.
1 Weighted average maturity — the average maturity of all the securities that make up a fund portfolio, expressed in days or years.
Asset Allocation (As a % of Investment Portfolio) | 12/31/13 | 12/31/12 |
| Commercial Paper | 50% | 38% |
| Short-Term Notes | 16% | 13% |
| Certificates of Deposit and Bank Notes | 15% | 12% |
| Government & Agency Obligations | 8% | 10% |
| Repurchase Agreements | 7% | 23% |
| Time Deposit | 4% | 2% |
| Municipal Bonds and Notes | — | 2% |
| 100% | 100% |
| Weighted Average Maturity* | 12/31/13 | 12/31/12 |
| DWS Variable Series II — DWS Money Market VIP | 43 days | 48 days |
| First Tier Retail Money Fund Average | 43 days | 43 days |
* The Fund is compared to its respective iMoneyNet Category: First Tier Retail Money Fund Average — Category includes a widely recognized composite of money market funds that invest in only first tier (highest rating) securities. Portfolio Holdings of First Tier funds include U.S. Treasury, U.S. Other, Repos, Time Deposits, Domestic Bank Obligations, Foreign Bank Obligations, First Tier Commercial Paper, Floating Rate Notes and Asset Backed Commercial Paper.
Weighted average maturity, also known as effective maturity, is the weighted average of the maturity date of bonds held by the Fund taking into consideration any available maturity shortening features.
Portfolio holdings and characteristics are subject to change.
For more complete details about the Fund's investment portfolio, see page 7.
Following the Fund's fiscal first and third quarter-end, a complete portfolio holdings listing is filed with the SEC on Form N-Q. In addition, each month, information about the Fund and its portfolio holdings is filed with the SEC on Form N-MFP. The SEC delays the public availability of the information filed on Form N-MFP for 60 days after the end of the reporting period included in the filing. These forms will be available on the SEC's Web site at sec.gov, and they may also be reviewed and copied at the SEC's Public Reference Room in Washington, D.C. Information on the operation of the SEC's Public Reference Room may be obtained by calling (800) SEC-0330. The Fund's portfolio holdings are also posted on dws-investments.com from time to time. Please see the Fund's current prospectus for more information.
| Principal Amount ($) | Value ($) | |||||||
| Certificates of Deposit and Bank Notes 13.1% | ||||||||
| Banco del Estado de Chile, 0.26%, 5/14/2014 | 1,700,000 | 1,700,000 | ||||||
| China Construction Bank Corp., 0.4%, 1/30/2014 | 3,000,000 | 3,000,000 | ||||||
| DNB Bank ASA, 0.17%, 4/4/2014 | 1,000,000 | 1,000,000 | ||||||
| Industrial & Commercial Bank of China Ltd., 0.4%, 1/21/2014 | 1,500,000 | 1,500,000 | ||||||
| International Business Machines Corp., 1.25%, 5/12/2014 | 500,000 | 501,751 | ||||||
| Kreditanstalt Fuer Wiederaufbau, 0.22%, 4/11/2014 | 1,000,000 | 999,898 | ||||||
| Mitsubishi UFJ Trust & Banking Corp., 0.21%, 1/28/2014 | 1,000,000 | 1,000,000 | ||||||
| Mizuho Bank Ltd.: | ||||||||
| 0.21%, 4/1/2014 | 2,000,000 | 2,000,000 | ||||||
| 0.22%, 2/26/2014 | 1,500,000 | 1,500,000 | ||||||
| Nordea Bank Finland PLC, 0.25%, 1/6/2014 | 1,500,000 | 1,500,000 | ||||||
| Norinchukin Bank, 0.22%, 2/14/2014 | 1,000,000 | 1,000,000 | ||||||
| Rabobank Nederland NV, 0.405%, 1/8/2014 | 1,000,000 | 1,000,026 | ||||||
| Sumitomo Mitsui Banking Corp.: | ||||||||
| 0.11%, 1/6/2014 | 3,000,000 | 3,000,000 | ||||||
| 0.21%, 2/18/2014 | 2,000,000 | 2,000,000 | ||||||
| Wells Fargo Bank NA, 0.2%, 5/27/2014 | 1,000,000 | 1,000,000 | ||||||
Total Certificates of Deposit and Bank Notes (Cost $22,701,675) | 22,701,675 | |||||||
| Commercial Paper 44.4% | ||||||||
| Issued at Discount** 37.2% | ||||||||
| Albion Capital Corp. SA: | ||||||||
| 0.19%, 1/27/2014 | 1,750,000 | 1,749,760 | ||||||
| 0.21%, 2/21/2014 | 1,800,000 | 1,799,464 | ||||||
| Antalis U.S. Funding Corp., 144A, 0.14%, 1/3/2014 | 5,000,000 | 4,999,961 | ||||||
| ASB Finance Ltd., 0.22%, 4/3/2014 | 1,800,000 | 1,798,988 | ||||||
| Bank Nederlandse Gemeenten, 0.22%, 6/17/2014 | 1,000,000 | 998,979 | ||||||
| Barclays Bank PLC, 0.15%, 1/7/2014 | 1,000,000 | 999,975 | ||||||
| Bedford Row Funding Corp.: | ||||||||
| 144A, 0.3%, 4/22/2014 | 500,000 | 499,538 | ||||||
| 144A, 0.31%, 10/27/2014 | 750,000 | 748,069 | ||||||
| 144A, 0.42%, 1/3/2014 | 400,000 | 399,991 | ||||||
| BNZ International Funding Ltd., 144A, 0.17%, 3/5/2014 | 1,500,000 | 1,499,554 | ||||||
| Caisse Centrale Desjardins, 0.175%, 2/19/2014 | 1,000,000 | 999,762 | ||||||
| Collateralized Commercial Paper Co., LLC: | ||||||||
| 0.22%, 3/17/2014 | 1,500,000 | 1,499,313 | ||||||
| 0.22%, 4/15/2014 | 1,500,000 | 1,499,047 | ||||||
| Collateralized Commercial Paper II Co., LLC: | ||||||||
| 144A, 0.22%, 2/5/2014 | 2,000,000 | 1,999,572 | ||||||
| 144A, 0.22%, 3/18/2014 | 1,000,000 | 999,536 | ||||||
| DBS Bank Ltd., 144A, 0.235%, 3/11/2014 | 1,000,000 | 999,550 | ||||||
| Dexia Credit Local, 0.33%, 8/18/2014 | 1,000,000 | 997,901 | ||||||
| Principal Amount ($) | Value ($) | |||||||
| DNB Bank ASA: | ||||||||
| 0.22%, 5/7/2014 | 1,500,000 | 1,498,845 | ||||||
| 0.24%, 3/5/2014 | 800,000 | 799,664 | ||||||
| General Electric Capital Corp.: | ||||||||
| 0.23%, 3/4/2014 | 1,500,000 | 1,499,406 | ||||||
| 0.24%, 1/8/2014 | 800,000 | 799,963 | ||||||
| 0.24%, 1/14/2014 | 1,000,000 | 999,913 | ||||||
| Hannover Funding Co., LLC: | ||||||||
| 0.2%, 1/31/2014 | 3,000,000 | 2,999,500 | ||||||
| 0.22%, 1/22/2014 | 1,000,000 | 999,872 | ||||||
| Kells Funding LLC, 144A, 0.23%, 2/19/2014 | 500,000 | 499,843 | ||||||
| LMA Americas LLC, 144A, 0.17%, 1/10/2014 | 2,500,000 | 2,499,894 | ||||||
| Manhattan Asset Funding Co., LLC, 144A, 0.17%, 1/8/2014 | 2,000,000 | 1,999,934 | ||||||
| MetLife Short Term Funding LLC: | ||||||||
| 144A, 0.24%, 2/27/2014 | 500,000 | 499,810 | ||||||
| 144A, 0.25%, 2/3/2014 | 600,000 | 599,863 | ||||||
| Nordea Bank AB, 0.18%, 3/25/2014 | 2,500,000 | 2,498,962 | ||||||
| Old Line Funding LLC, 144A, 0.23%, 6/5/2014 | 1,000,000 | 999,010 | ||||||
| Oversea-Chinese Banking Corp., Ltd., 0.25%, 3/5/2014 | 1,000,000 | 999,571 | ||||||
| PSP Capital, Inc., 0.1%, 1/3/2014 | 1,750,000 | 1,749,990 | ||||||
| Regency Markets No. 1 LLC, 144A, 0.13%, 1/3/2014 | 4,500,000 | 4,499,967 | ||||||
| Skandinaviska Enskilda Banken AB, 0.28%, 5/8/2014 | 1,000,000 | 999,012 | ||||||
| Standard Chartered Bank: | ||||||||
| 0.26%, 2/4/2014 | 1,000,000 | 999,754 | ||||||
| 0.27%, 5/19/2014 | 2,500,000 | 2,497,412 | ||||||
| 0.29%, 5/1/2014 | 1,500,000 | 1,498,550 | ||||||
| Swedbank AB: | ||||||||
| 0.24%, 5/8/2014 | 1,500,000 | 1,498,730 | ||||||
| 0.255%, 5/7/2014 | 1,800,000 | 1,798,393 | ||||||
| UOB Funding LLC, 0.24%, 4/10/2014 | 1,400,000 | 1,399,076 | ||||||
| Victory Receivables Corp., 144A, 0.18%, 2/3/2014 | 1,800,000 | 1,799,703 | ||||||
| Working Capital Management Co., 144A, 0.19%, 1/7/2014 | 1,200,000 | 1,199,962 | ||||||
| 64,623,559 | ||||||||
| Issued at Par* 7.2% | ||||||||
| Alpine Securitzation, 144A, 0.2%, 2/7/2014 | 1,750,000 | 1,750,000 | ||||||
| ASB Finance Ltd.: | ||||||||
| 144A, 0.26%, 6/11/2014 | 1,000,000 | 1,000,000 | ||||||
| 144A, 0.278%, 10/9/2014 | 1,250,000 | 1,249,932 | ||||||
| Atlantic Asset Securitization LLC: | ||||||||
| 144A, 0.194%, 2/27/2014 | 500,000 | 500,000 | ||||||
| 144A, 0.2%, 2/11/2014 | 1,000,000 | 999,991 | ||||||
| Australia and New Zealand Banking Group Ltd., 144A, 0.157%, 4/7/2014 | 2,000,000 | 1,999,734 | ||||||
| Kells Funding LLC: | ||||||||
| 144A, 0.198%, 2/3/2014 | 1,500,000 | 1,500,000 | ||||||
| 144A, 0.238%, 10/28/2014 | 1,200,000 | 1,200,000 | ||||||
| Nederlandse Waterschapsbank NV, 144A, 0.278%, 8/15/2014 | 800,000 | 800,000 | ||||||
| PNC Bank NA, 0.25%, 4/23/2014 | 1,500,000 | 1,500,000 | ||||||
| 12,499,657 | ||||||||
Total Commercial Paper (Cost $77,123,216) | 77,123,216 | |||||||
| Principal Amount ($) | Value ($) | |||||||
| Short-Term Notes* 14.0% | ||||||||
| Australia & New Zealand Banking Group Ltd., 144A, 0.306%, 11/19/2014 | 800,000 | 800,000 | ||||||
| Bank of Nova Scotia: | ||||||||
| 0.25%, 1/10/2014 | 1,000,000 | 1,000,000 | ||||||
| 0.26%, 9/3/2014 | 1,000,000 | 1,000,000 | ||||||
| 0.304%, 7/24/2014 | 1,000,000 | 1,000,000 | ||||||
| Canadian Imperial Bank of Commerce, 0.28%, 5/16/2014 | 1,800,000 | 1,800,000 | ||||||
| Commonwealth Bank of Australia, 144A, 0.24%, 6/11/2014 | 1,000,000 | 1,000,000 | ||||||
| DNB Bank ASA, 0.464%, 4/4/2014 | 2,000,000 | 2,001,526 | ||||||
| JPMorgan Chase Bank NA, 0.32%, 4/22/2019 | 1,000,000 | 1,000,000 | ||||||
| Kommunalbanken AS, 144A, 0.15%, 2/26/2014 | 1,500,000 | 1,500,000 | ||||||
| Rabobank Nederland NV: | ||||||||
| 0.239%, 6/12/2014 | 1,500,000 | 1,500,000 | ||||||
| 0.273%, 5/8/2014 | 500,000 | 500,000 | ||||||
| 0.278%, 7/23/2014 | 1,000,000 | 1,000,000 | ||||||
| 0.308%, 1/27/2014 | 1,500,000 | 1,500,000 | ||||||
| 0.328%, 12/1/2014 | 1,500,000 | 1,500,000 | ||||||
| Royal Bank of Canada: | ||||||||
| 0.25%, 12/11/2014 | 1,000,000 | 1,000,000 | ||||||
| 0.3%, 2/28/2014 | 1,000,000 | 1,000,000 | ||||||
| Svensk Exportkredit AB, 144A, 0.17%, 6/17/2014 | 2,000,000 | 2,000,000 | ||||||
| Svenska Handelsbanken AB, 144A, 0.325%, 10/3/2014 | 1,500,000 | 1,500,000 | ||||||
| Wells Fargo Bank NA, 0.25%, 12/10/2014 | 1,000,000 | 1,000,000 | ||||||
| Westpac Banking Corp., 0.257%, 5/9/2014 | 750,000 | 750,000 | ||||||
Total Short-Term Notes (Cost $24,351,526) | 24,351,526 | |||||||
| Time Deposit 3.6% | ||||||||
| Credit Agricole Corporate & Investment Bank, 0.04%, 1/2/2014 (Cost $6,190,137) | 6,190,137 | 6,190,137 | ||||||
| Government & Agency Obligations 7.2% | ||||||||
| Other Government Related (a) 0.3% | ||||||||
| European Investment Bank, 3.0%, 4/8/2014 | 500,000 | 503,621 | ||||||
| Principal Amount ($) | Value ($) | |||||||
| U.S. Government Sponsored Agencies 4.6% | ||||||||
| Federal Farm Credit Bank: | ||||||||
| 0.144%*, 10/29/2014 | 500,000 | 500,063 | ||||||
| 0.147%*, 10/20/2014 | 1,000,000 | 1,000,046 | ||||||
| Federal Home Loan Bank: | ||||||||
| 0.125%, 3/27/2014 | 750,000 | 749,900 | ||||||
| 0.144%**, 4/9/2014 | 1,000,000 | 999,605 | ||||||
| 0.147%**, 2/18/2014 | 1,000,000 | 999,800 | ||||||
| 0.18%, 3/7/2014 | 500,000 | 499,996 | ||||||
| Federal Home Loan Mortgage Corp.: | ||||||||
| 0.106%**, 1/22/2014 | 1,500,000 | 1,499,904 | ||||||
| 0.109%**, 3/19/2014 | 1,000,000 | 999,765 | ||||||
| Federal National Mortgage Association, 0.139%**, 6/2/2014 | 800,000 | 799,527 | ||||||
| 8,048,606 | ||||||||
| U.S. Treasury Obligations 2.3% | ||||||||
| U.S. Treasury Notes: | ||||||||
| 0.5%, 8/15/2014 | 2,000,000 | 2,004,336 | ||||||
| 2.625%, 7/31/2014 | 1,000,000 | 1,014,264 | ||||||
| 4.0%, 2/15/2014 | 1,000,000 | 1,004,701 | ||||||
| 4,023,301 | ||||||||
Total Government & Agency Obligations (Cost $12,575,528) | 12,575,528 | |||||||
| Repurchase Agreements 5.8% | ||||||||
| BNP Paribas, 0.22%, dated 12/23/2013, to be repurchased at $1,500,348 on 1/30/2014 (b) | 1,500,000 | 1,500,000 | ||||||
| JPMorgan Securities, Inc., 0.4%, dated 3/18/2013, to be repurchased at $2,510,220 on 3/18/2014 (c) | 2,500,000 | 2,500,000 | ||||||
| Nomura Securities International, 0.2%, dated 12/31/2013, to be repurchased at $5,000,006 on 1/2/2014 (d) | 5,000,000 | 5,000,000 | ||||||
| The Toronto-Dominion Bank, 0.06%, dated 12/31/2013, to be repurchased at $1,000,003 on 1/2/2014 (e) | 1,000,000 | 1,000,000 | ||||||
Total Repurchase Agreements (Cost $10,000,000) | 10,000,000 | |||||||
| % of Net Assets | Value ($) | |||||||
Total Investment Portfolio (Cost $152,942,082)† | 88.1 | 152,942,082 | ||||||
| Other Assets and Liabilities, Net | 11.9 | 20,737,698 | ||||||
| Net Assets | 100.0 | 173,679,780 | ||||||
* Floating rate securities' yields vary with a designated market index or market rate, such as the coupon-equivalent of the U.S. Treasury Bill rate. These securities are shown at their current rate as of December 31, 2013.
** Annualized yield at time of purchase; not a coupon rate.
† The cost for federal income tax purposes was $152,942,082.
(a) Government-backed debt issued by financial companies or government sponsored enterprises.
(b) Collateralized by $1,124,739 Deutsche Telekom International Finance BV, 8.75%, maturing on 6/15/2030 with a value of $1,581,179.
(c) Collateralized by:
| Principal Amount ($) | Security | Rate (%) | Maturity Date | Collateral Value ($) | ||||||||
| 2,217,224 | Master Asset Backed Securities Trust | 0.465 | 5/25/2037 | 1,935,159 | ||||||||
| 831,139 | SLM Private Credit Student Loan Trust | 0.543 | 6/15/2039 | 666,198 | ||||||||
| Total Collateral Value | 2,601,357 | |||||||||||
(d) Collateralized by $5,016,176 Government National Mortgage Association, with various coupon rates from 3.0–5.0%, and the various maturity dates of 6/15/2028–8/15/2043 with a value of $5,115,098.
(e) Collateralized by:
| Principal Amount ($) | Security | Rate (%) | Maturity Date | Collateral Value ($) | ||||||||
| 131 | Australia & New Zealand Banking Group Ltd. | 2.4 | 11/23/2016 | 136 | ||||||||
| 328,313 | Bank of Nova Scotia | 2.15 | 8/3/2016 | 341,094 | ||||||||
| 665,606 | The Toronto-Dominion Bank | 2.2 | 7/29/2015 | 689,560 | ||||||||
| Total Collateral Value | 1,030,790 | |||||||||||
144A: Security exempt from registration under Rule 144A of the Securities Act of 1933. These securities may be resold in transactions exempt from registration, normally to qualified institutional buyers.
Fair Value Measurements
Various inputs are used in determining the value of the Fund's investments. These inputs are summarized in three broad levels. Level 1 includes quoted prices in active markets for identical securities. Level 2 includes other significant observable inputs (including quoted prices for similar securities, interest rates, prepayment speeds and credit risk). Level 3 includes significant unobservable inputs (including the Fund's own assumptions in determining the fair value of investments). The level assigned to the securities valuations may not be an indication of the risk or liquidity associated with investing in those securities. Securities held by the Fund are reflected as Level 2 because the securities are valued at amortized cost (which approximates fair value) and, accordingly, the inputs used to determine value are not quoted prices in an active market.
The following is a summary of the inputs used as of December 31, 2013 in valuing the Fund's investments. For information on the Fund's policy regarding the valuation of investments, please refer to the Security Valuation section of Note A in the accompanying Notes to Financial Statements.
| Assets | Level 1 | Level 2 | Level 3 | Total | ||||||||||||
| Investments in Securities (f) | $ | — | $ | 142,942,082 | $ | — | $ | 142,942,082 | ||||||||
| Repurchase Agreements | — | 10,000,000 | — | 10,000,000 | ||||||||||||
| Total | $ | — | $ | 152,942,082 | $ | — | $ | 152,942,082 | ||||||||
There have been no transfers between fair value measurement levels during the year ended December 31, 2013.
(f) See Investment Portfolio for additional detailed categorizations.
The accompanying notes are an integral part of the financial statements.
| as of December 31, 2013 | ||||
| Assets | ||||
| Investments in non-affiliated securities, valued at amortized cost | $ | 142,942,082 | ||
| Repurchase agreements, valued at amortized cost | 10,000,000 | |||
| Total investments, valued at amortized cost | 152,942,082 | |||
| Cash | 20,806,471 | |||
| Receivable for Fund shares sold | 192,492 | |||
| Interest receivable | 60,696 | |||
| Due from Advisor | 5,136 | |||
| Other assets | 3,577 | |||
| Total assets | 174,010,454 | |||
| Liabilities | ||||
| Payable for Fund shares redeemed | 279,739 | |||
| Distributions payable | 716 | |||
| Accrued Trustees' fees | 2,171 | |||
| Other accrued expenses and payables | 48,048 | |||
| Total liabilities | 330,674 | |||
| Net assets, at value | $ | 173,679,780 | ||
| Net Assets Consist of | ||||
| Undistributed net investment income | 712 | |||
| Paid-in capital | 173,679,068 | |||
| Net assets, at value | $ | 173,679,780 | ||
Class A Net Asset Value, offering and redemption price per share ($173,679,780 ÷ 173,762,783 outstanding shares of beneficial interest, no par value, unlimited number of shares authorized) | $ | 1.00 | ||
The accompanying notes are an integral part of the financial statements.
Statement of Operations
| for the year ended December 31, 2013 | ||||
| Investment Income | ||||
Income: Interest | $ | 400,800 | ||
Expenses: Management fee | 534,536 | |||
| Administration fee | 187,557 | |||
| Services to shareholders | 2,444 | |||
| Custodian fee | 24,649 | |||
| Professional fees | 52,748 | |||
| Reports to shareholders | 103,760 | |||
| Trustees' fee and expenses | 6,645 | |||
| Other | 9,444 | |||
| Total expenses before expense reductions | 921,783 | |||
| Expense reductions | (539,751 | ) | ||
| Total expenses after expense reductions | 382,032 | |||
| Net investment income | 18,768 | |||
| Net realized gain (loss) | 509 | |||
| Net increase (decrease) in net assets resulting from operations | $ | 19,277 | ||
The accompanying notes are an integral part of the financial statements.
| Years Ended December 31, | ||||||||
| Increase (Decrease) in Net Assets | 2013 | 2012 | ||||||
Operations: Net investment income | $ | 18,768 | $ | 20,513 | ||||
| Net realized gain (loss) | 509 | 863 | ||||||
| Net increase (decrease) in net assets resulting from operations | 19,277 | 21,376 | ||||||
Distributions to shareholders from: Net investment income Class A | (18,768 | ) | (20,513 | ) | ||||
| Total distributions | (18,768 | ) | (20,513 | ) | ||||
Fund share transactions: Class A Proceeds from shares sold | 93,469,677 | 76,110,395 | ||||||
| Reinvestment of distributions | 18,849 | 20,711 | ||||||
| Cost of shares redeemed | (115,953,059 | ) | (96,940,382 | ) | ||||
| Net increase (decrease) in net assets from Class A share transactions | (22,464,533 | ) | (20,809,276 | ) | ||||
| Increase (decrease) in net assets | (22,464,024 | ) | (20,808,413 | ) | ||||
| Net assets at beginning of period | 196,143,804 | 216,952,217 | ||||||
| Net assets at end of period (including undistributed net investment income of $712 and $204, respectively) | $ | 173,679,780 | $ | 196,143,804 | ||||
| Other Information | ||||||||
Class A Shares outstanding at beginning of period | 196,227,316 | 217,036,592 | ||||||
| Shares sold | 93,469,677 | 76,110,395 | ||||||
| Shares issued to shareholders in reinvestment of distributions | 18,849 | 20,711 | ||||||
| Shares redeemed | (115,953,059 | ) | (96,940,382 | ) | ||||
| Net increase (decrease) in Class A shares | (22,464,533 | ) | (20,809,276 | ) | ||||
| Shares outstanding at end of period | 173,762,783 | 196,227,316 | ||||||
The accompanying notes are an integral part of the financial statements.
| Years Ended December 31, | |||||||||||||||||||||
| Class A | 2013 | 2012 | 2011 | 2010 | 2009 | ||||||||||||||||
| Selected Per Share Data | |||||||||||||||||||||
| Net asset value, beginning of period | $ | 1.000 | $ | 1.000 | $ | 1.000 | $ | 1.000 | $ | 1.000 | |||||||||||
Income from investment operations: Net investment income | .000 | * | .000 | * | .000 | * | .000 | * | .003 | ||||||||||||
| Net realized gain (loss) | .000 | * | .000 | * | .000 | * | .000 | * | .000 | * | |||||||||||
| Total from investment operations | .000 | * | .000 | * | .000 | * | .000 | * | .003 | ||||||||||||
Less distributions from: Net investment income | (.000 | )* | (.000 | )* | (.000 | )* | (.000 | )* | (.003 | ) | |||||||||||
| Net asset value, end of period | $ | 1.000 | $ | 1.000 | $ | 1.000 | $ | 1.000 | $ | 1.000 | |||||||||||
| Total Return (%) | .01 | a | .01 | a | .01 | a | .01 | a | .34 | ||||||||||||
| Ratios to Average Net Assets and Supplemental Data | |||||||||||||||||||||
| Net assets, end of period ($ millions) | 174 | 196 | 217 | 220 | 270 | ||||||||||||||||
| Ratio of expenses before expense reductions (%) | .49 | .45 | .51 | .46 | .43 | ||||||||||||||||
| Ratio of expenses after expense reductions (%) | .20 | .31 | .25 | .34 | .43 | ||||||||||||||||
| Ratio of net investment income (%) | .01 | .01 | .01 | .01 | .37 | ||||||||||||||||
a Total return would have been lower had certain expenses not been reduced. * Amount is less than $.0005. | |||||||||||||||||||||
A. Organization and Significant Accounting Policies
DWS Money Market VIP (the "Fund") is a diversified series of DWS Variable Series II (the "Trust"), which is registered under the Investment Company Act of 1940, as amended (the "1940 Act"), as an open-end management investment company organized as a Massachusetts business trust.
The Fund's financial statements are prepared in accordance with accounting principles generally accepted in the United States of America which require the use of management estimates. Actual results could differ from those estimates. The policies described below are followed consistently by the Fund in the preparation of its financial statements.
Security Valuation. Various inputs are used in determining the value of the Fund's investments. These inputs are summarized in three broad levels. Level 1 includes quoted prices in active markets for identical securities. Level 2 includes other significant observable inputs (including quoted prices for similar securities, interest rates, prepayment speeds and credit risk). Level 3 includes significant unobservable inputs (including the Fund's own assumptions in determining the fair value of investments). The level assigned to the securities valuations may not be an indication of the risk or liquidity associated with investing in those securities.
The Fund values all securities utilizing the amortized cost method permitted in accordance with Rule 2a-7 under the 1940 Act and certain conditions therein. Under this method, which does not take into account unrealized capital gains or losses on securities, an instrument is initially valued at its cost and thereafter assumes a constant accretion/amortization rate to maturity of any discount or premium. Securities held by the Fund are reflected as Level 2 because the securities are valued at amortized cost (which approximates fair value) and, accordingly, the inputs used to determine value are not quoted prices in an active market.
Disclosure about the classification of fair value measurements is included in a table following the Fund's Investment Portfolio.
Repurchase Agreements. The Fund may enter into repurchase agreements, under the terms of a Master Repurchase Agreement, with certain banks and broker/dealers whereby the Fund, through its custodian or a sub-custodian bank, receives delivery of the underlying securities, the amount of which at the time of purchase and each subsequent business day is required to be maintained at such a level that the value is equal to at least the principal amount of the repurchase price plus accrued interest. The custodian bank or another designated sub-custodian holds the collateral in a separate account until the agreement matures. If the value of the securities falls below the principal amount of the repurchase agreement plus accrued interest, the financial institution deposits additional collateral by the following business day. If the financial institution either fails to deposit the required additional collateral or fails to repurchase the securities as agreed, the Fund has the right to sell the securities and recover any resulting loss from the financial institution. If the financial institution enters into bankruptcy, the Fund's claim on the collateral may be subject to legal proceedings.
As of December 31, 2013, the Fund had investments in repurchase agreements with a gross value of $10,000,000. The value of the related collateral exceeded the value of the repurchase agreements at period end. The detail of the related collateral is included in the footnotes following the Fund's Investment Portfolio.
Federal Income Taxes. The Fund's policy is to comply with the requirements of the Internal Revenue Code, as amended, which are applicable to regulated investment companies and to distribute all of its taxable income to its shareholders.
The Fund has reviewed the tax positions for the open tax years as of December 31, 2013 and has determined that no provision for income tax is required in the Fund's financial statements. The Fund's federal tax returns for the prior three fiscal years remain open subject to examination by the Internal Revenue Service.
Distribution of Income and Gains. Net investment income of the Fund is declared as a daily dividend and is distributed to shareholders monthly. The Fund may take into account capital gains and losses in its daily dividend declarations. The Fund may also make additional distributions for tax purposes if necessary.
Permanent book and tax differences relating to shareholder distributions will result in reclassifications to paid-in capital. Temporary book and tax differences will reverse in a subsequent period. There were no significant book to tax differences for the Fund.
At December 31, 2013, the Fund's components of distributable earnings on a tax basis were as follows:
| Undistributed ordinary income* | $ | 712 |
In addition, the tax character of distributions paid by the Fund is summarized as follows:
| Years Ended December 31, | ||||||||
| 2013 | 2012 | |||||||
| Distributions from ordinary income* | $ | 18,768 | $ | 20,513 | ||||
* For tax purposes, short-term capital gain distributions are considered ordinary income distributions.
Expenses. Expenses of the Trust arising in connection with a specific fund are allocated to that fund. Other Trust expenses which cannot be directly attributed to a fund are apportioned among the funds in the Trust based upon the relative net assets or other appropriate measures.
Contingencies. In the normal course of business, the Fund may enter into contracts with service providers that contain general indemnification clauses. The Fund's maximum exposure under these arrangements is unknown as this would involve future claims that may be made against the Fund that have not yet been made. However, based on experience, the Fund expects the risk of loss to be remote.
Other. Investment transactions are accounted for on a trade date. Interest income is recorded on the accrual basis. Realized gains and losses from investment transactions are recorded on an identified cost basis. All discounts and premiums are accreted/amortized for both tax and financial reporting purposes.
B. Related Parties
Management Agreement. Under the Investment Management Agreement with Deutsche Investment Management Americas Inc. ("DIMA" or the "Advisor"), an indirect, wholly owned subsidiary of Deutsche Bank AG, the Advisor directs the investments of the Fund in accordance with its investment objectives, policies and restrictions. The Advisor determines the securities, instruments and other contracts relating to investments to be purchased, sold or entered into by the Fund.
Pursuant to the Investment Management Agreement with the Advisor, the Fund pays a monthly management fee based on the Fund's average daily net assets, computed and accrued daily and payable monthly, at the following annual rates:
| First $500 million | .285 | % | ||
| Next $500 million | .270 | % | ||
| Next $1.0 billion | .255 | % | ||
| Over $2.0 billion | .240 | % |
For the period from January 1, 2013 through September 30, 2014, the Advisor has contractually agreed to waive its fee and/or reimburse certain operating expenses to the extent necessary to maintain the operating expenses (excluding certain expenses such as extraordinary expenses, taxes, brokerage and interest expense) at 0.51%.
In addition, the Advisor has agreed to voluntarily waive additional expenses for the Fund. The waiver may be changed or terminated at any time without notice. Under this arrangement, the Advisor waived certain expenses of the Fund.
Accordingly, for the year ended December 31, 2013, the fee pursuant to the Investment Management Agreement aggregated $534,536, all of which was waived, resulting in an annual effective rate of 0.00% of the Fund's average daily net assets.
Administration Fee. Pursuant to an Administrative Services Agreement, DIMA provides most administrative services to the Fund. For all services provided under the Administrative Services Agreement, the Fund pays DIMA an annual fee ("Administration Fee") of 0.10% of the Fund's average daily net assets, computed and accrued daily and payable monthly. For the year ended December 31, 2013, the Administration Fee was $187,557, of which $4,604 was waived and $10,241 is unpaid.
Service Provider Fees. DWS Investments Service Company ("DISC"), an affiliate of the Advisor, is the transfer agent, dividend-paying agent and shareholder service agent for the Fund. Pursuant to a sub-transfer agency agreement between DISC and DST Systems, Inc. ("DST"), DISC has delegated certain transfer agent, dividend-paying agent and shareholder service agent functions to DST. DISC compensates DST out of the shareholder servicing fee it receives from the Fund. For the year ended December 31, 2013, the amounts charged to the Fund by DISC aggregated $611, all of which was waived.
Typesetting and Filing Service Fees. Under an agreement with DIMA, DIMA is compensated for providing typesetting and certain regulatory filing services to the Fund. For the year ended December 31, 2013, the amount charged to the Fund by DIMA included in the Statement of Operations under "reports to shareholders" aggregated $13,670, of which $4,342 is unpaid.
Trustees' Fees and Expenses. The Fund paid retainer fees to each Trustee not affiliated with the Advisor, plus specified amounts to the Board Chairperson and Vice Chairperson and to each committee Chairperson.
C. Ownership of the Fund
At December 31, 2013, four participating insurance companies were owners of record of 10% or more of the total outstanding Class A shares of the Fund, each owning 35%, 20%, 11% and 10%.
D. Line of Credit
The Fund and other affiliated funds (the "Participants") share in a $375 million revolving credit facility provided by a syndication of banks. The Fund may borrow for temporary or emergency purposes, including the meeting of redemption requests that otherwise might require the untimely disposition of securities. The Participants are charged an annual commitment fee which is allocated based on net assets, among each of the Participants. Interest is calculated at a rate per annum equal to the sum of the Federal Funds Rate, plus 1.25 percent plus if LIBOR exceeds the Federal Funds Rate, the amount of such excess. The Fund may borrow up to a maximum of 33 percent of its net assets under the agreement: The Fund had no outstanding loans at December 31, 2013.
To the Board of Trustees of DWS Variable Series II and Shareholders of DWS Money Market VIP:
We have audited the accompanying statement of assets and liabilities, including the investment portfolio, of DWS Money Market VIP (the "Fund") (one of the funds constituting DWS Variable Series II), as of December 31, 2013, and the related statement of operations for the year then ended, the statements of changes in net assets for each of the two years in the period then ended, and the financial highlights for each of the five years in the period then ended. These financial statements and financial highlights are the responsibility of the Fund's management. Our responsibility is to express an opinion on these financial statements and financial highlights based on our audits.
We conducted our audits in accordance with the standards of the Public Company Accounting Oversight Board (United States). Those standards require that we plan and perform the audit to obtain reasonable assurance about whether the financial statements and financial highlights are free of material misstatement. We were not engaged to perform an audit of the Fund's internal control over financial reporting. Our audits included consideration of internal control over financial reporting as a basis for designing audit procedures that are appropriate in the circumstances, but not for the purpose of expressing an opinion on the effectiveness of the Fund's internal control over financial reporting. Accordingly, we express no such opinion. An audit also includes examining, on a test basis, evidence supporting the amounts and disclosures in the financial statements and financial highlights, assessing the accounting principles used and significant estimates made by management, and evaluating the overall financial statement presentation. Our procedures included confirmation of securities owned as of December 31, 2013, by correspondence with the custodian and brokers. We believe that our audits provide a reasonable basis for our opinion.
In our opinion, the financial statements and financial highlights referred to above present fairly, in all material respects, the financial position of DWS Money Market VIP (one of the funds constituting DWS Variable Series II) at December 31, 2013, the results of its operations for the year then ended, the changes in its net assets for each of the two years in the period then ended, and the financial highlights for each of the five years in the period then ended, in conformity with U.S. generally accepted accounting principles.
| ||
Boston, Massachusetts February 14, 2014 |
As an investor of the Fund, you incur two types of costs: ongoing expenses and transaction costs. Ongoing expenses include management fees and other Fund expenses. Examples of transaction costs include contract charges and account maintenance fees, which are not shown in this section. The following tables are intended to help you understand your ongoing expenses (in dollars) of investing in the Fund and to help you compare these expenses with the ongoing expenses of investing in other mutual funds. In the most recent six-month period the Fund limited these expenses; had it not done so, expenses would have been higher. The example in the table is based on an investment of $1,000 invested at the beginning of the six-month period and held for the entire period (July 1, 2013 to December 31, 2013).
The tables illustrate your Fund's expenses in two ways:
—Actual Fund Return. This helps you estimate the actual dollar amount of ongoing expenses (but not transaction costs) paid on a $1,000 investment in the Fund using the Fund's actual return during the period. To estimate the expenses you paid over the period, simply divide your account value by $1,000 (for example, an $8,600 account value divided by $1,000 = 8.6), then multiply the result by the number in the "Expenses Paid per $1,000" line under the share class you hold.
— Hypothetical 5% Fund Return. This helps you to compare your Fund's ongoing expenses (but not transaction costs) with those of other mutual funds using the Fund's actual expense ratio and a hypothetical rate of return of 5% per year before expenses. Examples using a 5% hypothetical Fund return may be found in the shareholder reports of other mutual funds. The hypothetical account values and expenses may not be used to estimate the actual ending account balance or expenses you paid for the period.
Please note that the expenses shown in these tables are meant to highlight your ongoing expenses only and do not reflect any transaction costs. The "Expenses Paid per $1,000" line of the tables is useful in comparing ongoing expenses only and will not help you determine the relative total expense of owning different funds. If these transaction costs had been included, your costs would have been higher.
Expenses and Value of a $1,000 Investment for the six months ended December 31, 2013 | ||||
| Actual Fund Return | Class A | |||
| Beginning Account Value 7/1/13 | $ | 1,000.00 | ||
| Ending Account Value 12/31/13 | $ | 1,000.05 | ||
| Expenses Paid per $1,000* | $ | .91 | ||
| Hypothetical 5% Fund Return | Class A | |||
| Beginning Account Value 7/1/13 | $ | 1,000.00 | ||
| Ending Account Value 12/31/13 | $ | 1,024.30 | ||
| Expenses Paid per $1,000* | $ | .92 | ||
* Expenses are equal to the Fund's annualized expense ratio, multiplied by the average account value over the period, multiplied by 184 (the number of days in the most recent six-month period), then divided by 365.
| Annualized Expense Ratio | Class A | |
| DWS Variable Series II — DWS Money Market VIP | .18% |
For more information, please refer to the Fund's prospectus.
These tables do not reflect charges and fees ("contract charges") associated with the separate account that invests in the Fund or any variable life insurance policy or variable annuity contract for which the Fund is an investment option.
For an analysis of the fees associated with an investment in the fund or similar funds, please refer to the current and hypothetical expense calculators for Variable Insurance Products which can be found at dws-investments.com/EN/resources/calculators.jsp.
Please consult a tax advisor if you have questions about federal or state income tax laws, or on how to prepare your tax returns. If you have specific questions about your account, please contact your insurance provider.
Proxy Voting
The Trust's policies and procedures for voting proxies for portfolio securities and information about how the Trust voted proxies related to its portfolio securities during the 12-month period ended June 30 are available on our Web site — dws-investments.com (click on "proxy voting" at the bottom of the page) — or on the SEC's Web site — sec.gov. To obtain a written copy of the Trust's policies and procedures without charge, upon request, call us toll free at (800) 728-3337.
Money Market Fund Reform
In June 2013, the SEC proposed money market fund reform intended to address perceived systemic risks associated with money market funds and to improve transparency for money market fund investors. The Financial Stability Oversight Council (FSOC), a board of U.S. regulators established by the Dodd-Frank Act, had also previously proposed similar recommendations for money market fund reform. If one or more of the SEC or FSOC proposals for money market fund reform were to be adopted in the future, such regulatory action may affect the fund's operations and/or return potential.
The Board of Trustees approved the renewal of DWS Money Market VIP's investment management agreement (the "Agreement") with Deutsche Investment Management Americas Inc. ("DIMA") in September 2013.
In terms of the process that the Board followed prior to approving the Agreement, shareholders should know that:
— In September 2013, all but one of the Fund's Trustees were independent of DIMA and its affiliates.
— The Trustees met frequently during the past year to discuss fund matters and dedicated a substantial amount of time to contract review matters. Over the course of several months, the Board's Contract Committee, in coordination with the Board's Fixed Income and Asset Allocation Oversight Committee, reviewed comprehensive materials received from DIMA, independent third parties and independent counsel. These materials included an analysis of the Fund's performance, fees and expenses, and profitability compiled by a fee consultant retained by the Fund's Independent Trustees (the "Fee Consultant"). The Board also received extensive information throughout the year regarding performance of the Fund.
— The Independent Trustees regularly meet privately with their independent counsel to discuss contract review and other matters. In addition, the Independent Trustees were also advised by the Fee Consultant in the course of their review of the Fund's contractual arrangements and considered a comprehensive report prepared by the Fee Consultant in connection with their deliberations.
— In connection with reviewing the Agreement, the Board also reviewed the terms of the Fund's distribution agreement, administrative services agreement, transfer agency agreement and other material service agreements.
— Based on its evaluation of the information provided, the Contract Committee presented its findings and recommendations to the Board. The Board then reviewed the Contract Committee's findings and recommendations.
In connection with the contract review process, the Contract Committee and the Board considered the factors discussed below, among others. The Board also considered that DIMA and its predecessors have managed the Fund since its inception, and the Board believes that a long-term relationship with a capable, conscientious advisor is in the best interests of the Fund. The Board considered, generally, that shareholders chose to invest or remain invested in the Fund knowing that DIMA managed the Fund, and that the Agreement was approved by the Fund's shareholders. DIMA is part of Deutsche Bank AG, a major global banking institution that is engaged in a wide range of financial services. The Board believes that there are advantages to being part of a global asset management business that offers a wide range of investing expertise and resources, including hundreds of portfolio managers and analysts with research capabilities in many countries throughout the world.
As part of the contract review process, the Board carefully considered the fees and expenses of each DWS fund overseen by the Board in light of the fund's performance. In many cases, this led to a negotiation with DIMA of lower expense caps as part of the 2012 and 2013 contract review processes than had previously been in place. As part of these negotiations, the Board indicated that it would consider relaxing these new lower caps in future years following sustained improvements in performance, among other considerations.
In June 2012, Deutsche Bank AG ("DB"), DIMA's parent company, announced that DB would combine its Asset Management (of which DIMA was a part) and Wealth Management divisions. DB has advised the Independent Trustees that the U.S. asset management business is a critical and integral part of DB, and that it has, and will continue to, reinvest a significant portion of the substantial savings it expects to realize by combining its Asset Management and Wealth Management divisions into the new Asset and Wealth Management ("AWM") division, including ongoing enhancements to its investment capabilities. DB also has confirmed its commitment to maintaining strong legal and compliance groups within the AWM division.
While shareholders may focus primarily on fund performance and fees, the Fund's Board considers these and many other factors, including the quality and integrity of DIMA's personnel and such other issues as back-office operations, fund valuations, and compliance policies and procedures.
Nature, Quality and Extent of Services. The Board considered the terms of the Agreement, including the scope of advisory services provided under the Agreement. The Board noted that, under the Agreement, DIMA provides portfolio management services to the Fund and that, pursuant to a separate administrative services agreement, DIMA provides administrative services to the Fund. The Board considered the experience and skills of senior management and investment personnel, the resources made available to such personnel, the ability of DIMA to attract and retain high-quality personnel, and the organizational depth and stability of DIMA. The Board reviewed the Fund's performance over short-term and long-term periods and compared those returns to various agreed-upon performance measures, including a peer universe compiled by the Fee Consultant using information supplied by iMoneyNet, an independent fund data service. The Board also noted that it has put into place a process of identifying "Focus Funds" (e.g., funds performing poorly relative to their benchmark or a peer universe compiled by an independent fund data service), and receives more frequent reporting and information from DIMA regarding such funds, along with DIMA's remedial plans to address underperformance. The Board believes this process is an effective manner of identifying and addressing underperforming funds. Based on the information provided, the Board noted that for the one- and three-year periods ended December 31, 2012, the Fund's gross performance (Class A shares) was in the 1st quartile and 2nd quartile, respectively, of the applicable iMoneyNet universe (the 1st quartile being the best performers and the 4th quartile being the worst performers).
Fees and Expenses. The Board considered the Fund's investment management fee schedule, operating expenses and total expense ratios, and comparative information provided by Lipper Inc. ("Lipper") and the Fee Consultant regarding investment management fee rates paid to other investment advisors by similar funds (1st quartile being the most favorable and 4th quartile being the least favorable). With respect to management fees paid to other investment advisors by similar funds, the Board noted that the contractual fee rates paid by the Fund, which include a 0.10% fee paid to DIMA under the Fund's administrative services agreement, were lower than the median (2nd quartile) of the applicable Lipper peer group (based on Lipper data provided as of December 31, 2012). The Board noted that the Fund's Class A shares total (net) operating expenses were higher than the median (4th quartile) of the applicable Lipper expense universe (based on Lipper data provided as of December 31, 2012). The Board considered the Fund's management fee rate as compared to fees charged by DIMA to comparable funds and considered differences between the Fund and the comparable funds. The Board also considered how the Fund's total (net) operating expenses compared to the total (net) operating expenses of a more customized peer group selected by Lipper (based on such factors as asset size). The Board noted the expense limitation agreed to by DIMA. The Board also noted the significant voluntary fee waivers implemented by DIMA to ensure the Fund maintained a positive yield.
The information considered by the Board as part of its review of management fees included information regarding fees charged by DIMA and its affiliates to similar institutional accounts and to similar funds offered primarily to European investors ("DWS Europe funds"), in each case as applicable. The Board observed that advisory fee rates for institutional accounts generally were lower than the management fees charged by similarly managed DWS U.S. mutual funds ("DWS Funds"), but also took note of the differences in services provided to DWS Funds as compared to institutional accounts. In the case of DWS Europe funds, the Board observed that fee rates for DWS Europe funds generally were higher than for similarly managed DWS Funds, but noted that differences in the types of services provided to DWS Funds relative to DWS Europe funds made it difficult to compare such fees.
On the basis of the information provided, the Board concluded that management fees were reasonable and appropriate in light of the nature, quality and extent of services provided by DIMA.
Profitability. The Board reviewed detailed information regarding revenues received by DIMA under the Agreement. The Board considered the estimated costs and pre-tax profits realized by DIMA from advising the DWS Funds, as well as estimates of the pre-tax profits attributable to managing the Fund in particular. The Board also received information regarding the estimated enterprise-wide profitability of DWS and its affiliates with respect to all fund services in totality and by fund. The Board and the Fee Consultant reviewed DIMA's methodology in allocating its costs to the management of the Fund. Based on the information provided, the Board concluded that the pre-tax profits realized by DIMA in connection with the management of the Fund were not unreasonable. The Board also reviewed information regarding the profitability of certain similar investment management firms. The Board noted that while information regarding the profitability of such firms is limited (and in some cases is not necessarily prepared on a comparable basis), DIMA and its affiliates' overall profitability with respect to the DWS fund complex (after taking into account distribution and other services provided to the funds by DIMA and its affiliates) was lower than the overall profitability levels of many comparable firms for which such data was available.
Economies of Scale. The Board considered whether there are economies of scale with respect to the management of the Fund and whether the Fund benefits from any economies of scale. The Board noted that the Fund's management fee schedule includes fee breakpoints. The Board concluded that the Fund's fee schedule represents an appropriate sharing between the Fund and DIMA of such economies of scale as may exist in the management of the Fund at current asset levels.
Other Benefits to DIMA and Its Affiliates. The Board also considered the character and amount of other incidental benefits received by DIMA and its affiliates, including any fees received by DIMA for administrative services provided to the Fund and any fees received by an affiliate of DIMA for distribution services. The Board also considered benefits to DIMA related to brokerage and soft-dollar allocations, including allocating brokerage to pay for research generated by parties other than the executing broker dealers, which pertain primarily to funds investing in equity securities, along with the incidental public relations benefits to DIMA related to DWS Funds advertising and cross-selling opportunities among DIMA products and services. The Board concluded that management fees were reasonable in light of these fallout benefits.
Compliance. The Board considered the significant attention and resources dedicated by DIMA to documenting and enhancing its compliance processes in recent years. The Board noted in particular (i) the experience and seniority of both DIMA's chief compliance officer and the Fund's chief compliance officer; (ii) the large number of DIMA compliance personnel; and (iii) the substantial commitment of resources by DIMA and its affiliates to compliance matters.
Based on all of the information considered and the conclusions reached, the Board unanimously determined that the continuation of the Agreement is in the best interests of the Fund. In making this determination, the Board did not give particular weight to any single factor identified above. The Board considered these factors over the course of numerous meetings, certain of which were in executive session with only the Independent Trustees and their independent counsel present. It is possible that individual Trustees may have weighed these factors differently in reaching their individual decisions to approve the continuation of the Agreement.
The following table presents certain information regarding the Board Members and Officers of the fund. Each Board Member's year of birth is set forth in parentheses after his or her name. Unless otherwise noted, (i) each Board Member has engaged in the principal occupation(s) noted in the table for at least the most recent five years, although not necessarily in the same capacity; and (ii) the address of each Independent Board Member is c/o Kenneth C. Froewiss, Chairman, DWS Mutual Funds, P.O. Box 78, Short Hills, NJ 07078. Except as otherwise noted below, the term of office for each Board Member is until the election and qualification of a successor, or until such Board Member sooner dies, resigns, is removed or as otherwise provided in the governing documents of the fund. Because the fund does not hold an annual meeting of shareholders, each Board Member will hold office for an indeterminate period. The Board Members may also serve in similar capacities with other funds in the fund complex.
| Independent Board Members | ||||
Name, Year of Birth, Position with the Fund and Length of Time Served1 | Business Experience and Directorships During the Past Five Years | Number of Funds in DWS Fund Complex Overseen | Other Directorships Held by Board Member | |
Kenneth C. Froewiss (1945) Chairperson since 2013, and Board Member since 2001 | Adjunct Professor of Finance, NYU Stern School of Business (September 2009–present; Clinical Professor from 1997–September 2009); Member, Finance Committee, Association for Asian Studies (2002–present); Director, Mitsui Sumitomo Insurance Group (US) (2004–present); prior thereto, Managing Director, J.P. Morgan (investment banking firm) (until 1996) | 103 | — | |
William McClayton (1944) Vice Chairperson since 2013, and Board Member since 2004 | Private equity investor (since October 2009); previously, Managing Director, Diamond Management & Technology Consultants, Inc. (global consulting firm) (2001–2009); Directorship: Board of Managers, YMCA of Metropolitan Chicago; formerly: Senior Partner, Arthur Andersen LLP (accounting) (1966–2001); Trustee, Ravinia Festival | 103 | — | |
John W. Ballantine (1946) Board Member since 1999 | Retired; formerly, Executive Vice President and Chief Risk Management Officer, First Chicago NBD Corporation/The First National Bank of Chicago (1996–1998); Executive Vice President and Head of International Banking (1995–1996); former Directorships: Stockwell Capital Investments PLC (private equity); First Oak Brook Bancshares, Inc. and Oak Brook Bank; Prisma Energy International | 103 | Chairman of the Board, Healthways, Inc.2 (provider of disease and care management services) (2003– present); Portland General Electric2 (utility company) (2003– present) | |
Henry P. Becton, Jr. (1943) Board Member since 1990 | Vice Chair and former President, WGBH Educational Foundation. Directorships: Public Radio International; Public Radio Exchange (PRX); North Bennett Street School (Boston); former Directorships: The PBS Foundation; Association of Public Television Stations; Boston Museum of Science; American Public Television; Concord Academy; New England Aquarium; Mass. Corporation for Educational Telecommunications; Committee for Economic Development; Public Broadcasting Service; Connecticut College | 103 | Lead Director, Becton Dickinson and Company2 (medical technology company); Lead Director, Belo Corporation2 (media company) | |
Dawn-Marie Driscoll (1946) Board Member since 1987 | President, Driscoll Associates (consulting firm); Emeritus Executive Fellow, Center for Business Ethics, Bentley University; formerly, Partner, Palmer & Dodge (1988–1990); Vice President of Corporate Affairs and General Counsel, Filene's (1978–1988). Directorships: Director of ICI Mutual Insurance Company (since 2007); Advisory Board, Center for Business Ethics, Bentley University; Chairman of the Board of Trustees, Southwest Florida Community Foundation (charitable organization); former Directorships: Sun Capital Advisers Trust (mutual funds) (2007–2012), Investment Company Institute (audit, executive, nominating committees) and Independent Directors Council (governance, executive committees) | 103 | — | |
Keith R. Fox, CFA (1954) Board Member since 1996 | Managing General Partner, Exeter Capital Partners (a series of private investment funds) (since 1986). Directorships: Progressive International Corporation (kitchen goods importer and distributor); The Kennel Shop (retailer); former Chairman, National Association of Small Business Investment Companies; former Directorships: BoxTop Media Inc. (advertising); Sun Capital Advisers Trust (mutual funds) (2011–2012) | 103 | — | |
Paul K. Freeman (1950) Board Member since 1993 | Consultant, World Bank/Inter-American Development Bank; Executive and Governing Council of the Independent Directors Council (Chairman of Education Committee); formerly: Project Leader, International Institute for Applied Systems Analysis (1998–2001); Chief Executive Officer, The Eric Group, Inc. (environmental insurance) (1986–1998); Directorships: Denver Zoo Foundation (December 2012–present); former Directorships: Prisma Energy International | 103 | — | |
Richard J. Herring (1946) Board Member since 1990 | Jacob Safra Professor of International Banking and Professor, Finance Department, The Wharton School, University of Pennsylvania (since July 1972); Co-Director, Wharton Financial Institutions Center (since July 2000); Co-Chair, U.S. Shadow Financial Regulatory Committee; Executive Director, Financial Economists Roundtable; formerly: Vice Dean and Director, Wharton Undergraduate Division (July 1995–June 2000); Director, Lauder Institute of International Management Studies (July 2000–June 2006) | 103 | Director, Japan Equity Fund, Inc. (since September 2007), Thai Capital Fund, Inc. (since 2007), Singapore Fund, Inc. (since September 2007), Independent Director of Barclays Bank Delaware (since September 2010) | |
Rebecca W. Rimel (1951) Board Member since 1995 | President and Chief Executive Officer, The Pew Charitable Trusts (charitable organization) (1994 to present); formerly: Executive Vice President, The Glenmede Trust Company (investment trust and wealth management) (1983–2004); Board Member, Investor Education (charitable organization) (2004–2005); Trustee, Executive Committee, Philadelphia Chamber of Commerce (2001–2007); Director, Viasys Health Care2 (January 2007–June 2007); Trustee, Thomas Jefferson Foundation (charitable organization) (1994–2012) | 103 | Director, Becton Dickinson and Company2 (medical technology company) (2012– present); Director, CardioNet, Inc.2 (health care) (2009– present) | |
William N. Searcy, Jr. (1946) Board Member since 1993 | Private investor since October 2003; formerly: Pension & Savings Trust Officer, Sprint Corporation2 (telecommunications) (November 1989–September 2003); Trustee, Sun Capital Advisers Trust (mutual funds) (1998–2012) | 103 | — | |
Jean Gleason Stromberg (1943) Board Member since 1997 | Retired. Formerly, Consultant (1997–2001); Director, Financial Markets U.S. Government Accountability Office (1996–1997); Partner, Fulbright & Jaworski, L.L.P. (law firm) (1978–1996). Directorships: The William and Flora Hewlett Foundation; former Directorships: Service Source, Inc., Mutual Fund Directors Forum (2002–2004), American Bar Retirement Association (funding vehicle for retirement plans) (1987–1990 and 1994–1996) | 103 | — | |
Robert H. Wadsworth (1940) Board Member since 1999 | President, Robert H. Wadsworth & Associates, Inc. (consulting firm) (1983 to present); Director, National Horizon, Inc. (non-profit organization); Director and Treasurer, The Phoenix Boys Choir Association | 106 | — | |
Officers4 | ||
Name, Year of Birth, Position with the Fund and Length of Time Served5 | Business Experience and Directorships During the Past Five Years | |
Brian E. Binder8,9 (1972) President and Chief Executive Officer, 2013–present | Managing Director3 and Head of Fund Administration, Deutsche Asset & Wealth Management (2013–present); formerly: Head of Business Management and Consulting at Invesco, Ltd. (2010–2012); Chief Administrative Officer, Van Kampen Funds Inc. (2008–2010); and Chief Administrative Officer, Morgan Stanley Investment Management Americas Distribution (2003–2008) | |
John Millette7 (1962) Vice President and Secretary, 1999–present | Director,3 Deutsche Asset & Wealth Management | |
Paul H. Schubert6 (1963) Chief Financial Officer, 2004–present Treasurer, 2005–present | Managing Director,3 Deutsche Asset & Wealth Management (since July 2004); formerly: Executive Director, Head of Mutual Fund Services and Treasurer for UBS Family of Funds (1998–2004); Vice President and Director of Mutual Fund Finance at UBS Global Asset Management (1994–1998) | |
Caroline Pearson7 (1962) Chief Legal Officer, 2010–present | Managing Director,3 Deutsche Asset & Wealth Management; formerly: Assistant Secretary for DWS family of funds (1997–2010) | |
Melinda Morrow6 (1970) Vice President, 2012–present | Director,3 Deutsche Asset & Wealth Management | |
Hepsen Uzcan7 (1974) Assistant Secretary, 2013–present | Vice President, Deutsche Asset & Wealth Management | |
Paul Antosca7 (1957) Assistant Treasurer, 2007–present | Director,3 Deutsche Asset & Wealth Management | |
Jack Clark7 (1967) Assistant Treasurer, 2007–present | Director,3 Deutsche Asset & Wealth Management | |
Diane Kenneally7 (1966) Assistant Treasurer, 2007–present | Director,3 Deutsche Asset & Wealth Management | |
John Caruso6 (1965) Anti-Money Laundering Compliance Officer, 2010–present | Managing Director,3 Deutsche Asset & Wealth Management | |
Robert Kloby6 (1962) Chief Compliance Officer, 2006–present | Managing Director,3 Deutsche Asset & Wealth Management | |
1 The length of time served represents the year in which the Board Member joined the board of one or more DWS funds currently overseen by the Board.
2 A publicly held company with securities registered pursuant to Section 12 of the Securities Exchange Act of 1934.
3 Executive title, not a board directorship.
4 As a result of their respective positions held with the Advisor, these individuals are considered "interested persons" of the Advisor within the meaning of the 1940 Act. Interested persons receive no compensation from the fund.
5 The length of time served represents the year in which the officer was first elected in such capacity for one or more DWS funds.
6 Address: 60 Wall Street, New York, NY 10005.
7 Address: One Beacon Street, Boston, MA 02108.
8 Address: 222 South Riverside Plaza, Chicago, IL 60606.
9 Effective as of December 1, 2013.
The fund's Statement of Additional Information ("SAI") includes additional information about the Board Members. The SAI is available, without charge, upon request. If you would like to request a copy of the SAI, you may do so by calling the following toll-free number: (800) 728-3337.
DWS Investments Distributors, Inc.
222 South Riverside Plaza
Chicago, IL 60606
(800) 621-1148
VS2MM-2 (R-025834-3 2/14)
December 31, 2013
Annual Report
DWS Variable Series II
DWS Small Mid Cap Growth VIP
Contents
3 Performance Summary 4 Management Summary 5 Portfolio Summary 7 Investment Portfolio 10 Statement of Assets and Liabilities 11 Statement of Operations 12 Statement of Changes in Net Assets 13 Financial Highlights 14 Notes to Financial Statements 18 Report of Independent Registered Public Accounting Firm 19 Information About Your Fund's Expenses 20 Tax Information 21 Proxy Voting 22 Advisory Agreement Board Considerations and Fee Evaluation 25 Board Members and Officers |
This report must be preceded or accompanied by a prospectus. To obtain an additional prospectus or summary prospectus, if available, call (800) 728-3337 or your financial representative. We advise you to consider the Fund's objectives, risks, charges and expenses carefully before investing. The summary prospectus and prospectus contain this and other important information about the Fund. Please read the prospectus carefully before you invest.
Investing in derivatives entails special risks relating to liquidity, leverage and credit that may reduce returns and/or increase volatility. Smaller and medium company stocks tend to be more volatile than large company stocks. The Fund may lend securities to approved institutions. Stocks may decline in value. See the prospectus for details.
Deutsche Asset & Wealth Management represents the asset management and wealth management activities conducted by Deutsche Bank AG or any of its subsidiaries, including the Advisor and DWS Investments Distributors, Inc.
NOT FDIC/NCUA INSURED NO BANK GUARANTEE MAY LOSE VALUE NOT A DEPOSIT
NOT INSURED BY ANY FEDERAL GOVERNMENT AGENCY
Fund performance shown is historical, assumes reinvestment of all dividend and capital gain distributions and does not guarantee future results. Investment return and principal value fluctuate with changing market conditions so that, when redeemed, shares may be worth more or less than their original cost. Current performance may be lower or higher than the performance data quoted. Please contact your participating insurance company for the Fund's most recent month-end performance. Performance doesn't reflect charges and fees ("contract charges") associated with the separate account that invests in the Fund or any variable life insurance policy or variable annuity contract for which the Fund is an investment option. These charges and fees will reduce returns.
The gross expense ratio of the Fund, as stated in the fee table of the prospectus dated May 1, 2013 is 0.74% for Class A shares and may differ from the expense ratio disclosed in the Financial Highlights table in this report.
| Growth of an Assumed $10,000 Investment in DWS Small Mid Cap Growth VIP | ||
 | The Russell 2500™ Growth Index is an unmanaged index that measures the performance of the small- to mid-cap growth segment of the U.S. equity universe. It includes those Russell 2500 companies with higher price-to-book ratios and higher forecasted growth values. Index returns do not reflect any fees or expenses and it is not possible to invest directly into an index. | |
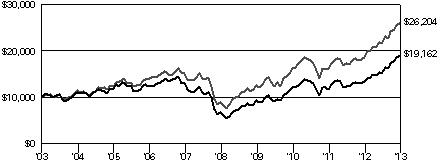 | ||
| Yearly periods ended December 31 | ||
| Comparative Results | |||||||||||||||||
| DWS Small Mid Cap Growth VIP | 1-Year | 3-Year | 5-Year | 10-Year | |||||||||||||
| Class A | Growth of $10,000 | $ | 14,278 | $ | 15,690 | $ | 28,555 | $ | 19,162 | ||||||||
| Average annual total return | 42.78 | % | 16.20 | % | 23.35 | % | 6.72 | % | |||||||||
| Russell 2500 Growth Index | Growth of $10,000 | $ | 14,065 | $ | 16,077 | $ | 29,347 | $ | 26,204 | ||||||||
| Average annual total return | 40.65 | % | 17.15 | % | 24.03 | % | 10.11 | % | |||||||||
The growth of $10,000 is cumulative.
For the 12-month period ended December 31, 2013, the Fund returned 42.78% (Class A shares, unadjusted for contract charges), outperforming the 40.65% return of the Russell 2500™ Growth Index.1
The past 12 months represented a robust period for small- and mid-cap stocks, as investor appetite for equities and strong mutual fund inflows provided tremendous momentum to the stock market. At the start of 2013, a last-minute congressional agreement to avert the "fiscal cliff" spurred a strong market rally through most of February. And despite worries regarding the effects of U.S. budget sequestration, the "risk-on" trade returned again in March, as improving macroeconomic data lifted investor confidence through most of the summer months. The rally then paused in August as investors grew worried that the U.S. Federal Reserve Board (the Fed) might begin to taper its quantitative easing (QE) program later in the year, and as the congressional debate regarding the budget and debt ceiling loomed in September.2 However, an end to the federal government shutdown in early October, additional clarity regarding the Fed's plans to taper quantitative easing and a favorable jobs report helped to ignite a sharp market rally into year end, with stocks closing 2013 at all-time highs.
The Fund's outperformance was derived primarily from strong stock selection in information technology, health care and financials. In contrast, Fund positions in consumer staples, energy and consumer discretionary detracted from returns.3 Overall sector allocation had a negative effect on performance, based on underweights to utilities and consumer discretionary and an overweight in energy.4 An overweight position in consumer staples and an underweight in materials contributed to performance. We continue to position the Fund for sustained economic recovery and remain focused on our bottom-up stock selection process. We maintain a long-term perspective, investing in quality small- and mid-cap growth stocks that trade at attractive valuations and which will also likely benefit from a strong merger and acquisition cycle.
Joseph Axtell, CFA
Rafaelina M. Lee
Portfolio Managers
The views expressed reflect those of the portfolio management team only through the end of the period of the report as stated on the cover. The management team's views are subject to change at any time based on market and other conditions and should not be construed as a recommendation. Past performance is no guarantee of future results. Current and future portfolio holdings are subject to risk.
1 The Russell 2500 Growth Index is an unmanaged, capitalization-weighted measure of the performance of the small- to mid-cap growth segment of the U.S. equity universe. It includes Russell 2500® Index companies with higher price-to-book ratios and higher forecasted growth values. Index returns do not reflect fees or expenses and it is not possible to invest directly in an index.
2 Quantitative easing entails the Fed's purchase of government and other securities from the market in an effort to increase money supply.
3 The consumer discretionary sector represents industries that produce goods and services that are not necessities in everyday life. Consumer staples are the industries that manufacture and sell products such as food and beverages, prescription drugs, and household products.
4 "Overweight" means that the Fund holds a higher weighting in a given sector or security than the benchmark. "Underweight" means that the Fund holds a lower weighting.
Asset Allocation (As a % of Investment Portfolio excluding Securities Lending Collateral) | 12/31/13 | 12/31/12 |
| Common Stocks | 97% | 96% |
| Cash Equivalents | 2% | 4% |
| Exchange-Traded Fund | 1% | 0% |
| 100% | 100% |
Sector Diversification (As a % of Common Stocks) | 12/31/13 | 12/31/12 |
| Information Technology | 23% | 16% |
| Consumer Discretionary | 20% | 17% |
| Industrials | 16% | 20% |
| Health Care | 16% | 16% |
| Financials | 10% | 8% |
| Energy | 5% | 9% |
| Consumer Staples | 5% | 6% |
| Materials | 4% | 7% |
| Telecommunication Services | 1% | 1% |
| 100% | 100% |
Portfolio holdings and characteristics are subject to change.
For more complete details about the Fund's investment portfolio, see page 7.
Following the Fund's fiscal first and third quarter-end, a complete portfolio holdings listing is filed with the SEC on Form N-Q. The form will be available on the SEC's Web site at sec.gov, and it also may be reviewed and copied at the SEC's Public Reference Room in Washington, D.C. Information on the operation of the SEC's Public Reference Room may be obtained by calling (800) SEC-0330. The Fund's portfolio holdings are also posted on dws-investments.com from time to time. Please see the Fund's current prospectus for more information.
| Shares | Value ($) | |||||||
| Common Stocks 97.9% | ||||||||
| Consumer Discretionary 19.3% | ||||||||
| Auto Components 1.8% | ||||||||
| American Axle & Manufacturing Holdings, Inc.* | 70,091 | 1,433,361 | ||||||
| Tenneco, Inc.* | 33,896 | 1,917,496 | ||||||
| 3,350,857 | ||||||||
| Hotels, Restaurants & Leisure 2.6% | ||||||||
| Jack in the Box, Inc.* | 32,954 | 1,648,359 | ||||||
| Life Time Fitness, Inc.* (a) | 23,969 | 1,126,543 | ||||||
| Panera Bread Co. "A"* | 12,169 | 2,150,141 | ||||||
| 4,925,043 | ||||||||
| Household Durables 2.7% | ||||||||
| Jarden Corp.* | 52,967 | 3,249,525 | ||||||
| Ryland Group, Inc. (a) | 42,009 | 1,823,611 | ||||||
| 5,073,136 | ||||||||
| Leisure Equipment & Products 1.3% | ||||||||
| Polaris Industries, Inc. (a) | 17,375 | 2,530,495 | ||||||
| Media 1.1% | ||||||||
| Cinemark Holdings, Inc. | 60,872 | 2,028,864 | ||||||
| Specialty Retail 7.5% | ||||||||
| Advance Auto Parts, Inc. | 12,708 | 1,406,522 | ||||||
| Ascena Retail Group, Inc.* | 77,063 | 1,630,653 | ||||||
| Children's Place Retail Stores, Inc.* | 25,492 | 1,452,279 | ||||||
| DSW, Inc. "A" | 43,784 | 1,870,890 | ||||||
| Outerwall, Inc.* (a) | 24,208 | 1,628,472 | ||||||
| Penske Automotive Group, Inc. | 28,323 | 1,335,713 | ||||||
| PetSmart, Inc. | 24,839 | 1,807,037 | ||||||
| Ulta Salon, Cosmetics & Fragrance, Inc.* | 19,652 | 1,896,811 | ||||||
| Urban Outfitters, Inc.* | 26,516 | 983,744 | ||||||
| 14,012,121 | ||||||||
| Textiles, Apparel & Luxury Goods 2.3% | ||||||||
| Carter's, Inc. | 18,475 | 1,326,320 | ||||||
| Hanesbrands, Inc. | 41,719 | 2,931,594 | ||||||
| 4,257,914 | ||||||||
| Consumer Staples 4.7% | ||||||||
| Food & Staples Retailing 2.6% | ||||||||
| Susser Holdings Corp.* (a) | 23,213 | 1,520,219 | ||||||
| The Fresh Market, Inc.* (a) | 28,724 | 1,163,322 | ||||||
| United Natural Foods, Inc.* | 29,191 | 2,200,710 | ||||||
| 4,884,251 | ||||||||
| Food Products 1.0% | ||||||||
| Hain Celestial Group, Inc.* (a) | 20,390 | 1,851,004 | ||||||
| Household Products 1.1% | ||||||||
| Church & Dwight Co., Inc. (a) | 30,129 | 1,996,950 | ||||||
| Energy 5.2% | ||||||||
| Energy Equipment & Services 2.2% | ||||||||
| Dresser-Rand Group, Inc.* | 23,982 | 1,430,047 | ||||||
| Dril-Quip, Inc.* | 15,588 | 1,713,589 | ||||||
| Helix Energy Solutions Group, Inc.* | 45,030 | 1,043,795 | ||||||
| 4,187,431 | ||||||||
| Oil, Gas & Consumable Fuels 3.0% | ||||||||
| Goodrich Petroleum Corp.* (a) | 76,228 | 1,297,401 | ||||||
| Oasis Petroleum, Inc.* (a) | 30,191 | 1,418,071 | ||||||
| Shares | Value ($) | |||||||
| Rosetta Resources, Inc.* | 28,045 | 1,347,282 | ||||||
| Western Refining, Inc. (a) | 34,028 | 1,443,127 | ||||||
| 5,505,881 | ||||||||
| Financials 9.8% | ||||||||
| Capital Markets 4.0% | ||||||||
| Affiliated Managers Group, Inc.* | 5,216 | 1,131,246 | ||||||
| Financial Engines, Inc. (a) | 34,556 | 2,400,951 | ||||||
| Lazard Ltd. "A" | 39,209 | 1,776,952 | ||||||
| Oaktree Capital Group LLC | 35,922 | 2,113,651 | ||||||
| 7,422,800 | ||||||||
| Commercial Banks 1.0% | ||||||||
| Signature Bank* | 17,496 | 1,879,420 | ||||||
| Consumer Finance 3.0% | ||||||||
| Encore Capital Group, Inc.* (a) | 34,670 | 1,742,514 | ||||||
| Portfolio Recovery Associates, Inc.* (a) | 32,049 | 1,693,469 | ||||||
| Springleaf Holdings, Inc.* | 83,119 | 2,101,249 | ||||||
| 5,537,232 | ||||||||
| Real Estate Management & Development 0.5% | ||||||||
| CBRE Group, Inc. "A"* | 38,774 | 1,019,756 | ||||||
| Thrifts & Mortgage Finance 1.3% | ||||||||
| Ocwen Financial Corp.* | 44,218 | 2,451,888 | ||||||
| Health Care 15.7% | ||||||||
| Biotechnology 3.6% | ||||||||
| Alkermes PLC* | 34,055 | 1,384,676 | ||||||
| Cubist Pharmaceuticals, Inc.* | 16,456 | 1,133,325 | ||||||
| Momenta Pharmaceuticals, Inc.* | 109,236 | 1,931,293 | ||||||
| Pharmacyclics, Inc.* | 5,966 | 631,083 | ||||||
| Spectrum Pharmaceuticals, Inc.* (a) | 113,912 | 1,008,121 | ||||||
| Synta Pharmaceuticals Corp.* | 127,517 | 668,189 | ||||||
| 6,756,687 | ||||||||
| Health Care Equipment & Supplies 6.1% | ||||||||
| Analogic Corp. | 19,993 | 1,770,580 | ||||||
| ArthroCare Corp.* | 47,099 | 1,895,264 | ||||||
| HeartWare International, Inc.* | 15,996 | 1,502,984 | ||||||
| SurModics, Inc.* | 69,874 | 1,704,227 | ||||||
| Thoratec Corp.* | 52,833 | 1,933,688 | ||||||
| Zeltiq Aesthetics, Inc.* (a) | 144,633 | 2,735,010 | ||||||
| 11,541,753 | ||||||||
| Health Care Providers & Services 3.4% | ||||||||
| Catamaran Corp.* | 34,646 | 1,644,992 | ||||||
| Centene Corp.* | 31,769 | 1,872,783 | ||||||
| ExamWorks Group, Inc.* (a) | 52,900 | 1,580,123 | ||||||
| Kindred Healthcare, Inc. | 62,125 | 1,226,347 | ||||||
| 6,324,245 | ||||||||
| Pharmaceuticals 2.6% | ||||||||
| Pacira Pharmaceuticals, Inc.* | 65,566 | 3,769,389 | ||||||
| Questcor Pharmaceuticals, Inc. (a) | 20,412 | 1,111,434 | ||||||
| 4,880,823 | ||||||||
| Industrials 15.9% | ||||||||
| Aerospace & Defense 1.4% | ||||||||
| BE Aerospace, Inc.* | 30,948 | 2,693,404 | ||||||
| Building Products 1.1% | ||||||||
| Fortune Brands Home & Security, Inc. | 44,949 | 2,054,169 | ||||||
| Shares | Value ($) | |||||||
| Commercial Services & Supplies 2.1% | ||||||||
| Interface, Inc. (a) | 97,577 | 2,142,791 | ||||||
| Team, Inc.* | 41,586 | 1,760,751 | ||||||
| 3,903,542 | ||||||||
| Electrical Equipment 2.5% | ||||||||
| AZZ, Inc. | 46,104 | 2,252,641 | ||||||
| Thermon Group Holdings, Inc.* | 87,017 | 2,378,175 | ||||||
| 4,630,816 | ||||||||
| Machinery 5.9% | ||||||||
| Altra Industrial Motion Corp. | 43,378 | 1,484,395 | ||||||
| Chart Industries, Inc.* (a) | 20,595 | 1,969,706 | ||||||
| Joy Global, Inc. (a) | 15,425 | 902,208 | ||||||
| Manitowoc Co., Inc. | 113,795 | 2,653,700 | ||||||
| Valmont Industries, Inc. | 8,819 | 1,315,089 | ||||||
| WABCO Holdings, Inc.* | 28,265 | 2,640,234 | ||||||
| 10,965,332 | ||||||||
| Road & Rail 1.2% | ||||||||
| Swift Transportation Co.* (a) | 104,742 | 2,326,320 | ||||||
| Trading Companies & Distributors 1.7% | ||||||||
| United Rentals, Inc.* (a) | 40,625 | 3,166,719 | ||||||
| Information Technology 22.2% | ||||||||
| Communications Equipment 1.1% | ||||||||
| Harris Corp. | 29,358 | 2,049,482 | ||||||
| Computers & Peripherals 1.4% | ||||||||
| Western Digital Corp. | 30,452 | 2,554,923 | ||||||
| Electronic Equipment, Instruments & Components 2.2% | ||||||||
| Cognex Corp. | 52,092 | 1,988,873 | ||||||
| IPG Photonics Corp.* (a) | 27,794 | 2,157,092 | ||||||
| 4,145,965 | ||||||||
| Internet Software & Services 1.2% | ||||||||
| CoStar Group, Inc.* | 12,522 | 2,311,311 | ||||||
| IT Services 4.3% | ||||||||
| Cardtronics, Inc.* | 56,952 | 2,474,564 | ||||||
| MAXIMUS, Inc. | 46,798 | 2,058,644 | ||||||
| VeriFone Systems, Inc.* | 84,391 | 2,263,367 | ||||||
| Virtusa Corp.* | 31,080 | 1,183,837 | ||||||
| 7,980,412 | ||||||||
| Semiconductors & Semiconductor Equipment 1.6% | ||||||||
| Advanced Energy Industries, Inc.* | 105,675 | 2,415,731 | ||||||
| RF Micro Devices, Inc.* | 129,858 | 670,067 | ||||||
| 3,085,798 | ||||||||
| Software 10.4% | ||||||||
| Aspen Technology, Inc.* | 47,703 | 1,993,985 | ||||||
| Bottomline Technologies de, Inc.* (a) | 58,425 | 2,112,648 | ||||||
| Concur Technologies, Inc.* (a) | 12,895 | 1,330,506 | ||||||
| FireEye, Inc.* (a) | 41,154 | 1,794,726 | ||||||
| Shares | Value ($) | |||||||
| Imperva, Inc.* | 42,572 | 2,048,990 | ||||||
| MICROS Systems, Inc.* (a) | 26,681 | 1,530,689 | ||||||
| PTC, Inc.* | 57,732 | 2,043,135 | ||||||
| Qlik Technologies, Inc.* | 55,026 | 1,465,342 | ||||||
| Seachange International, Inc.* | 64,735 | 787,178 | ||||||
| Tyler Technologies, Inc.* | 23,014 | 2,350,420 | ||||||
| Ultimate Software Group, Inc.* | 13,435 | 2,058,511 | ||||||
| 19,516,130 | ||||||||
| Materials 3.5% | ||||||||
| Chemicals 0.8% | ||||||||
| A. Schulman, Inc. | 13,376 | 471,638 | ||||||
| Minerals Technologies, Inc. | 15,488 | 930,364 | ||||||
| 1,402,002 | ||||||||
| Construction Materials 1.1% | ||||||||
| Eagle Materials, Inc. | 27,169 | 2,103,695 | ||||||
| Containers & Packaging 1.1% | ||||||||
| Crown Holdings, Inc.* | 44,499 | 1,983,320 | ||||||
| Metals & Mining 0.5% | ||||||||
| Haynes International, Inc. | 17,894 | 988,465 | ||||||
| Telecommunication Services 1.6% | ||||||||
| Diversified Telecommunication Services 0.6% | ||||||||
| inContact, Inc.* | 154,651 | 1,207,824 | ||||||
| Wireless Telecommunication Services 1.0% | ||||||||
| SBA Communications Corp. "A"* (a) | 20,223 | 1,816,835 | ||||||
Total Common Stocks (Cost $122,618,575) | 183,305,015 | |||||||
| Exchange-Traded Fund 0.5% | ||||||||
| SPDR S&P Biotech (a) (Cost $728,339) | 7,865 | 1,024,023 | ||||||
| Securities Lending Collateral 21.9% | ||||||||
| Daily Assets Fund Institutional, 0.08% (b) (c) (Cost $40,943,661) | 40,943,661 | 40,943,661 | ||||||
| Cash Equivalents 1.8% | ||||||||
| Central Cash Management Fund, 0.05% (b) (Cost $3,470,538) | 3,470,538 | 3,470,538 | ||||||
| % of Net Assets | Value ($) | |||||||
Total Investment Portfolio (Cost $167,761,113)† | 122.1 | 228,743,237 | ||||||
| Other Assets and Liabilities, Net | (22.1 | ) | (41,465,830 | ) | ||||
| Net Assets | 100.0 | 187,277,407 | ||||||
* Non-income producing security.
† The cost for federal income tax purposes was $168,016,119. At December 31, 2013, net unrealized appreciation for all securities based on tax cost was $60,727,118. This consisted of aggregate gross unrealized appreciation for all securities in which there was an excess of value over tax cost of $62,821,094 and aggregate gross unrealized depreciation for all securities in which there was an excess of tax cost over value of $2,093,976.
(a) All or a portion of these securities were on loan. In addition, "Other Assets and Liabilities, Net" may include pending sales that are also on loan. The value of securities loaned at December 31, 2013 amounted to $40,302,801, which is 21.5% of net assets.
(b) Affiliated fund managed by Deutsche Investment Management Americas Inc. The rate shown is the annualized seven-day yield at period end.
(c) Represents collateral held in connection with securities lending. Income earned by the Fund is net of borrower rebates.
S&P: Standard & Poor's
SPDR: Standard & Poor's Depositary Receipt
Fair Value Measurements
Various inputs are used in determining the value of the Fund's investments. These inputs are summarized in three broad levels. Level 1 includes quoted prices in active markets for identical securities. Level 2 includes other significant observable inputs (including quoted prices for similar securities, interest rates, prepayment speeds and credit risk). Level 3 includes significant unobservable inputs (including the Fund's own assumptions in determining the fair value of investments). The level assigned to the securities valuations may not be an indication of the risk or liquidity associated with investing in those securities.
The following is a summary of the inputs used as of December 31, 2013 in valuing the Fund's investments. For information on the Fund's policy regarding the valuation of investments, please refer to the Security Valuation section of Note A in the accompanying Notes to Financial Statements.
| Assets | Level 1 | Level 2 | Level 3 | Total | ||||||||||||
| Common Stocks (d) | $ | 183,305,015 | $ | — | $ | — | $ | 183,305,015 | ||||||||
| Exchange-Traded Fund | 1,024,023 | — | — | 1,024,023 | ||||||||||||
| Short-Term Investments (d) | 44,414,199 | — | — | 44,414,199 | ||||||||||||
| Total | $ | 228,743,237 | $ | — | $ | — | $ | 228,743,237 | ||||||||
There have been no transfers between fair value measurement levels during the year ended December 31, 2013.
(d) See Investment Portfolio for additional detailed categorizations.
The accompanying notes are an integral part of the financial statements.
| as of December 31, 2013 | ||||
| Assets | ||||
Investments: Investments in non-affiliated securities, at value (cost $123,346,914) — including $40,302,801 of securities loaned | $ | 184,329,038 | ||
| Investment in Daily Assets Fund Institutional (cost $40,943,661)* | 40,943,661 | |||
| Investment in Central Cash Management Fund (cost $3,470,538) | 3,470,538 | |||
| Total investments in securities, at value (cost $167,761,113) | 228,743,237 | |||
| Receivable for investments sold | 646,901 | |||
| Receivable for Fund shares sold | 17,010 | |||
| Dividends receivable | 20,753 | |||
| Interest receivable | 29,101 | |||
| Other assets | 2,945 | |||
| Total assets | 229,459,947 | |||
| Liabilities | ||||
| Payable upon return of securities loaned | 40,943,661 | |||
| Payable for investments purchased | 843,637 | |||
| Payable for Fund shares redeemed | 264,712 | |||
| Accrued management fee | 85,435 | |||
| Accrued Trustees' fees | 2,643 | |||
| Other accrued expenses and payables | 42,452 | |||
| Total liabilities | 42,182,540 | |||
| Net assets, at value | $ | 187,277,407 | ||
| Net Assets Consist of | ||||
| Net unrealized appreciation (depreciation) on investments | 60,982,124 | |||
| Accumulated net realized gain (loss) | (7,826,190 | ) | ||
| Paid-in capital | 134,121,473 | |||
| Net assets, at value | $ | 187,277,407 | ||
Class A Net Asset Value, offering and redemption price per share ($187,277,407 ÷ 8,676,171 outstanding shares of beneficial interest, no par value, unlimited number of shares authorized) | $ | 21.59 | ||
* Represents collateral on securities loaned.
The accompanying notes are an integral part of the financial statements.
Statement of Operations
| for the year ended December 31, 2013 | ||||
| Investment Income | ||||
Income: Dividends (net of foreign taxes withheld of $1,301) | $ | 600,315 | ||
| Income distributions — Central Cash Management Fund | 3,828 | |||
| Securities lending income, including income from Daily Assets Fund Institutional, net of borrower rebates | 215,138 | |||
| Total income | 819,281 | |||
Expenses: Management fee | 906,903 | |||
| Administration fee | 164,891 | |||
| Services to shareholders | 2,811 | |||
| Custodian fee | 11,489 | |||
| Audit and tax fees | 61,686 | |||
| Legal fees | 10,276 | |||
| Reports to shareholders | 17,802 | |||
| Trustees' fees and expenses | 6,819 | |||
| Total expenses | 1,182,677 | |||
| Net investment income (loss) | (363,396 | ) | ||
| Realized and Unrealized Gain (Loss) | ||||
Net realized gain (loss) from: Investments | 23,260,876 | |||
| Foreign currency | 256 | |||
| 23,261,132 | ||||
Change in net unrealized appreciation (depreciation) on: Investments | 35,857,114 | |||
| Foreign currency | (9 | ) | ||
| 35,857,105 | ||||
| Net gain (loss) | 59,118,237 | |||
| Net increase (decrease) in net assets resulting from operations | $ | 58,754,841 | ||
The accompanying notes are an integral part of the financial statements.
| Years Ended December 31, | ||||||||
| Increase (Decrease) in Net Assets | 2013 | 2012 | ||||||
Operations: Net investment income (loss) | $ | (363,396 | ) | $ | 160,586 | |||
| Net realized gain (loss) | 23,261,132 | 3,935,183 | ||||||
| Change in net unrealized appreciation (depreciation) | 35,857,105 | 16,236,973 | ||||||
| Net increase (decrease) in net assets resulting from operations | 58,754,841 | 20,332,742 | ||||||
Distributions to shareholders from: Net investment income: Class A | (194,886 | ) | — | |||||
| Total distributions | (194,886 | ) | — | |||||
Fund share transactions: Class A Proceeds from shares sold | 5,697,979 | 4,543,991 | ||||||
| Reinvestment of distributions | 194,886 | — | ||||||
| Cost of shares redeemed | (22,634,498 | ) | (26,306,762 | ) | ||||
| Net increase (decrease) in net assets from Class A share transactions | (16,741,633 | ) | (21,762,771 | ) | ||||
| Increase (decrease) in net assets | 41,818,322 | (1,430,029 | ) | |||||
| Net assets at beginning of period | 145,459,085 | 146,889,114 | ||||||
| Net assets at end of period (including undistributed net investment income of $0 and $114,625, respectively) | $ | 187,277,407 | $ | 145,459,085 | ||||
| Other Information | ||||||||
Class A Shares outstanding at beginning of period | 9,604,576 | 11,094,343 | ||||||
| Shares sold | 313,223 | 306,987 | ||||||
| Shares issued to shareholders in reinvestment of distributions | 11,761 | — | ||||||
| Shares redeemed | (1,253,389 | ) | (1,796,754 | ) | ||||
| Net increase (decrease) in Class A shares | (928,405 | ) | (1,489,767 | ) | ||||
| Shares outstanding at end of period | 8,676,171 | 9,604,576 | ||||||
The accompanying notes are an integral part of the financial statements.
| Years Ended December 31, | |||||||||||||||||||||
| Class A | 2013 | 2012 | 2011 | 2010 | 2009 | ||||||||||||||||
| Selected Per Share Data | |||||||||||||||||||||
| Net asset value, beginning of period | $ | 15.14 | $ | 13.24 | $ | 13.85 | $ | 10.70 | $ | 7.61 | |||||||||||
Income (loss) from investment operations: Net investment income (loss)a | (.04 | ) | .02 | (.03 | ) | (.01 | ) | (.02 | ) | ||||||||||||
| Net realized and unrealized gain (loss) | 6.51 | 1.88 | (.50 | ) | 3.16 | 3.11 | |||||||||||||||
| Total from investment operations | 6.47 | 1.90 | (.53 | ) | 3.15 | 3.09 | |||||||||||||||
Less distributions from: Net investment income | (.02 | ) | — | (.08 | ) | — | — | ||||||||||||||
| Net asset value, end of period | $ | 21.59 | $ | 15.14 | $ | 13.24 | $ | 13.85 | $ | 10.70 | |||||||||||
| Total Return (%) | 42.78 | 14.35 | (3.91 | ) | 29.44 | 40.60 | |||||||||||||||
| Ratios to Average Net Assets and Supplemental Data | |||||||||||||||||||||
| Net assets, end of period ($ millions) | 187 | 145 | 147 | 88 | 80 | ||||||||||||||||
| Ratio of expenses (%) | .72 | .74 | .73 | .78 | .77 | ||||||||||||||||
| Ratio of net investment income (loss) (%) | (.22 | ) | .11 | (.23 | ) | (.12 | ) | (.22 | ) | ||||||||||||
| Portfolio turnover rate (%) | 56 | 57 | 84 | 64 | 93 | ||||||||||||||||
a Based on average shares outstanding during the period. | |||||||||||||||||||||
A. Organization and Significant Accounting Policies
DWS Small Mid Cap Growth VIP (the "Fund") is a diversified series of DWS Variable Series II (the "Trust"), which is registered under the Investment Company Act of 1940, as amended (the "1940 Act"), as an open-end management investment company organized as a Massachusetts business trust.
The Fund's financial statements are prepared in accordance with accounting principles generally accepted in the United States of America which require the use of management estimates. Actual results could differ from those estimates. The policies described below are followed consistently by the Fund in the preparation of its financial statements.
Security Valuation. Investments are stated at value determined as of the close of regular trading on the New York Stock Exchange on each day the exchange is open for trading.
Various inputs are used in determining the value of the Fund's investments. These inputs are summarized in three broad levels. Level 1 includes quoted prices in active markets for identical securities. Level 2 includes other significant observable inputs (including quoted prices for similar securities, interest rates, prepayment speeds and credit risk). Level 3 includes significant unobservable inputs (including the Fund's own assumptions in determining the fair value of investments). The level assigned to the securities valuations may not be an indication of the risk or liquidity associated with investing in those securities.
Equity securities and exchange-traded funds ("ETFs") are valued at the most recent sale price or official closing price reported on the exchange (U.S. or foreign) or over-the-counter market on which they trade. Securities or ETFs for which no sales are reported are valued at the calculated mean between the most recent bid and asked quotations on the relevant market or, if a mean cannot be determined, at the most recent bid quotation. Equity securities are generally categorized as Level 1.
Investments in open-end investment companies are valued at their net asset value each business day and are categorized as Level 1.
Securities and other assets for which market quotations are not readily available or for which the above valuation procedures are deemed not to reflect fair value are valued in a manner that is intended to reflect their fair value as determined in accordance with procedures approved by the Board and are generally categorized as Level 3. In accordance with the Fund's valuation procedures, factors used in determining value may include, but are not limited to, the type of the security; the size of the holding; the initial cost of the security; the existence of any contractual restrictions on the security's disposition; the price and extent of public trading in similar securities of the issuer or of comparable companies; quotations or evaluated prices from broker-dealers and/or pricing services; information obtained from the issuer, analysts, and/or the appropriate stock exchange (for exchange-traded securities); an analysis of the company's or issuer's financial statements; an evaluation of the forces that influence the issuer and the market(s) in which the security is purchased and sold; and with respect to debt securities, the maturity, coupon, creditworthiness, currency denomination and the movement of the market in which the security is normally traded. The value determined under these procedures may differ from published values for the same securities.
Disclosure about the classification of fair value measurements is included in a table following the Fund's Investment Portfolio.
Securities Lending. Deutsche Bank AG, as lending agent, lends securities of the Fund to certain financial institutions under the terms of the Security Lending Agreement. The Fund retains the benefits of owning the securities it has loaned and continues to receive interest and dividends generated by the securities and to participate in any changes in their market value. The Fund requires the borrowers of the securities to maintain collateral with the Fund consisting of either cash or liquid, unencumbered assets having a value at least equal to the value of the securities loaned. When the collateral falls below specified amounts, the lending agent will use its best effort to obtain additional collateral on the next business day to meet required amounts under the security lending agreement. The Fund may invest the cash collateral into a joint trading account in an affiliated money market fund pursuant to Exemptive Orders issued by the SEC. The Fund receives compensation for lending its securities either in the form of fees or by earning interest on invested cash collateral net of borrower rebates and fees paid to a lending agent. Either the Fund or the borrower may terminate the loan. There may be risks of delay and costs in recovery of securities or even loss of rights in the collateral should the borrower of the securities fail financially. If the Fund is not able to recover securities lent, the Fund may sell the collateral and purchase a replacement investment in the market, incurring the risk that the value of the replacement security is greater than the value of the collateral. The Fund is also subject to all investment risks associated with the reinvestment of any cash collateral received, including, but not limited to, interest rate, credit and liquidity risk associated with such investments.
As of December 31, 2013, the Fund had securities on loan. The value of the related collateral exceeded the value of the securities loaned at period end.
Federal Income Taxes. The Fund's policy is to comply with the requirements of the Internal Revenue Code, as amended, which are applicable to regulated investment companies, and to distribute all of its taxable income to its shareholders.
Under the Regulated Investment Company Modernization Act of 2010, net capital losses incurred post-enactment may be carried forward indefinitely, and their character is retained as short-term and/or long-term. Previously, net capital losses were carried forward for eight years and treated as short-term losses. As a transition rule, the Act requires that post-enactment net capital losses be used before pre-enactment net capital losses.
At December 31, 2013, the Fund had a net tax basis capital loss carryforward of approximately $7,570,000 of pre-enactment losses, including approximately $2,020,000 inherited from its mergers with affiliated funds in previous years, which may be applied against any realized net taxable capital gains of each succeeding year until fully utilized or until December 31, 2016 ($2,020,000) and December 31, 2017 ($5,550,000), the respective expiration dates, whichever occurs first, and which may be subject to certain limitations under Section 382–384 of Internal Revenue Code.
The Fund has reviewed the tax positions for the open tax years as of December 31, 2013 and has determined that no provision for income tax is required in the Fund's financial statements. The Fund's federal tax returns for the prior three fiscal years remain open subject to examination by the Internal Revenue Service.
Distribution of Income and Gains. Distributions from net investment income of the Fund, if any, are declared and distributed to shareholders annually. Net realized gains from investment transactions, in excess of available capital loss carryforwards, would be taxable to the Fund if not distributed and, therefore, will be distributed to shareholders at least annually. The Fund may also make additional distributions for tax purposes if necessary.
The timing and characterization of certain income and capital gain distributions are determined annually in accordance with federal tax regulations which may differ from accounting principles generally accepted in the United States of America. These differences primarily relate to net operating losses and certain securities sold at a loss. As a result, net investment income (loss) and net realized gain (loss) on investment transactions for a reporting period may differ significantly from distributions during such period. Accordingly, the Fund may periodically make reclassifications among certain of its capital accounts without impacting the net asset value of the Fund.
At December 31, 2013, the Fund's components of distributable earnings on a tax basis were as follows:
| Capital loss carryforwards | $ | (7,570,000 | ) | |
| Unrealized appreciation (depreciation) on investments | $ | 60,727,118 |
In addition, the tax character of distributions paid by the Fund is summarized as follows:
| Years Ended December 31, | ||||||||
| 2013 | 2012 | |||||||
| Distributions from ordinary income* | $ | 194,886 | $ | — | ||||
* For tax purposes, short-term capital gain distributions are considered ordinary income distributions.
Expenses. Expenses of the Trust arising in connection with a specific fund are allocated to that fund. Other Trust expenses which cannot be directly attributed to a fund are apportioned among the funds in the Trust based upon the relative net assets or other appropriate measures.
Contingencies. In the normal course of business, the Fund may enter into contracts with service providers that contain general indemnification clauses. The Fund's maximum exposure under these arrangements is unknown as this would involve future claims that may be made against the Fund that have not yet been made. However, based on experience, the Fund expects the risk of loss to be remote.
Other. Investment transactions are accounted for on a trade date plus one basis for daily net asset value calculations. However, for financial reporting purposes, investment transactions are reported on trade date. Interest income is recorded on the accrual basis. Dividend income is recorded on the ex-dividend date net of foreign withholding taxes. Realized gains and losses from investment transactions are recorded on an identified cost basis. Proceeds from litigation payments, if any, are included in net realized gain (loss) from investments.
B. Purchases and Sales of Securities
During the year ended December 31, 2013, purchases and sales of investment transactions (excluding short-term investments) aggregated $89,784,430 and $104,689,342, respectively.
C. Related Parties
Management Agreement. Under the Investment Management Agreement with Deutsche Investment Management Americas Inc. ("DIMA" or the "Advisor"), an indirect, wholly owned subsidiary of Deutsche Bank AG, the Advisor directs the investments of the Fund in accordance with its investment objectives, policies and restrictions. The Advisor determines the securities, instruments and other contracts relating to investments to be purchased, sold or entered into by the Fund.
Pursuant to the Investment Management Agreement with the Advisor, the Fund pays a monthly management fee based on the Fund's average daily net assets, computed and accrued daily and payable monthly, at the following annual rates:
| First $250 million | .550 | % | ||
| Next $750 million | .525 | % | ||
| Over $1 billion | .500 | % |
Accordingly, for the year ended December 31, 2013, the fee pursuant to the Investment Management Agreement was equivalent to an annual effective rate of 0.55% of the Fund's average daily net assets.
Effective October 1, 2013 through September 30, 2014, the Advisor has contractually agreed to waive its fees and/or reimburse certain operating expenses to the extent necessary to maintain the operating expenses (excluding certain expenses such as extraordinary expenses, taxes, brokerage and interest expense) of Class A at 0.89%.
Administration Fee. Pursuant to an Administrative Services Agreement, DIMA provides most administrative services to the Fund. For all services provided under the Administrative Services Agreement, the Fund pays DIMA an annual fee ("Administration Fee") of 0.10% of the Fund's average daily net assets, computed and accrued daily and payable monthly. For the year ended December 31, 2013, the Administration Fee was $164,891, of which $15,534 is unpaid.
Service Provider Fees. DWS Investments Service Company ("DISC"), an affiliate of the Advisor, is the transfer agent, dividend-paying agent and shareholder service agent for the Fund. Pursuant to a sub-transfer agency agreement between DISC and DST Systems, Inc. ("DST"), DISC has delegated certain transfer agent, dividend-paying agent and shareholder service agent functions to DST. DISC compensates DST out of the shareholder servicing fee it receives from the Fund. For the year ended December 31, 2013, the amounts charged to the Fund by DISC aggregated $350, of which $58 is unpaid.
Typesetting and Filing Service Fees. Under an agreement with DIMA, DIMA is compensated for providing typesetting and certain regulatory filing services to the Fund. For the year ended December 31, 2013, the amount charged to the Fund by DIMA included in the Statement of Operations under "reports to shareholders" aggregated $14,006, of which $4,326 is unpaid.
Trustees' Fees and Expenses. The Fund paid retainer fees to each Trustee not affiliated with the Advisor, plus specified amounts to the Board Chairperson and Vice Chairperson and to each committee Chairperson.
Affiliated Cash Management Vehicles. The Fund may invest uninvested cash balances in Central Cash Management Fund and DWS Variable NAV Money Fund, affiliated money market funds which are managed by the Advisor. Each affiliated money market fund seeks to provide a high level of current income consistent with liquidity and the preservation of capital. Each affiliated money market fund is managed in accordance with Rule 2a-7 under the Investment Company Act of 1940, which governs the quality, maturity, diversity and liquidity of instruments in which a money market fund may invest. Central Cash Management Fund seeks to maintain a stable net asset value, and DWS Variable NAV Money Fund maintains a floating net asset value. The Fund indirectly bears its proportionate share of the expenses of each affiliated money market fund in which it invests. Central Cash Management Fund does not pay the Advisor an investment management fee. To the extent that DWS Variable NAV Money Fund pays an investment management fee to the Advisor, the Advisor will waive an amount of the investment management fee payable to the Advisor by the Fund equal to the amount of the investment management fee payable on the Fund's assets invested in DWS Variable NAV Money Fund.
Securities Lending Agent Fees. Deutsche Bank AG serves as securities lending agent for the Fund. For the year ended December 31, 2013, the Fund incurred securities lending agent fees to Deutsche Bank AG in the amount of $23,903.
D. Ownership of the Fund
At December 31, 2013, three participating insurance companies were owners of record of 10% or more of the total outstanding Class A shares of the Fund, each owning 55%, 22% and 15%.
E. Line of Credit
The Fund and other affiliated funds (the "Participants") share in a $375 million revolving credit facility provided by a syndication of banks. The Fund may borrow for temporary or emergency purposes, including the meeting of redemption requests that otherwise might require the untimely disposition of securities. The Participants are charged an annual commitment fee which is allocated based on net assets, among each of the Participants. Interest is calculated at a rate per annum equal to the sum of the Federal Funds Rate plus 1.25 percent plus if LIBOR exceeds the Federal Funds Rate the amount of such excess. The Fund may borrow up to a maximum of 33 percent of its net assets under the agreement. The Fund had no outstanding loans at December 31, 2013.
To the Board of Trustees of DWS Variable Series II and Shareholders of DWS Small Mid Cap Growth VIP:
We have audited the accompanying statement of assets and liabilities, including the investment portfolio of DWS Small Mid Cap Growth VIP (the "Fund") (one of the funds constituting DWS Variable Series II), as of December 31, 2013, and the related statement of operations for the year then ended, the statements of changes in net assets for the two years in the period then ended, and the financial highlights for each of the five years in the period then ended. These financial statements and financial highlights are the responsibility of the Fund's management. Our responsibility is to express an opinion on these financial statements and financial highlights based on our audits.
We conducted our audits in accordance with the standards of the Public Company Accounting Oversight Board (United States). Those standards require that we plan and perform the audit to obtain reasonable assurance about whether the financial statements and financial highlights are free of material misstatement. We were not engaged to perform an audit of the Fund's internal control over financial reporting. Our audits included consideration of internal control over financial reporting as a basis for designing audit procedures that are appropriate in the circumstances, but not for the purpose of expressing an opinion on the effectiveness of the Fund's internal control over financial reporting. Accordingly, we express no such opinion. An audit also includes examining, on a test basis, evidence supporting the amounts and disclosures in the financial statements and financial highlights, assessing the accounting principles used and significant estimates made by management, and evaluating the overall financial statement presentation. Our procedures included confirmation of securities owned as of December 31, 2013, by correspondence with the custodian and brokers. We believe that our audits provide a reasonable basis for our opinion.
In our opinion, the financial statements and financial highlights referred to above present fairly, in all material respects, the financial position of DWS Small Mid Cap Growth VIP (one of the funds constituting DWS Variable Series II) at December 31, 2013, the results of its operations for the year then ended, the changes in its net assets for each of the two years in the period then ended, and the financial highlights for each of the five years in the period then ended, in conformity with U.S. generally accepted accounting principles.
| ||
Boston, Massachusetts February 14, 2014 |
As an investor of the Fund, you incur two types of costs: ongoing expenses and transaction costs. Ongoing expenses include management fees and other Fund expenses. Examples of transaction costs include contract charges and account maintenance fees, which are not shown in this section. The following tables are intended to help you understand your ongoing expenses (in dollars) of investing in the Fund and to help you compare these expenses with the ongoing expenses of investing in other mutual funds. The example in the table is based on an investment of $1,000 invested at the beginning of the six-month period and held for the entire period (July 1, 2013 to December 31, 2013).
The tables illustrate your Fund's expenses in two ways:
—Actual Fund Return. This helps you estimate the actual dollar amount of ongoing expenses (but not transaction costs) paid on a $1,000 investment in the Fund using the Fund's actual return during the period. To estimate the expenses you paid over the period, simply divide your account value by $1,000 (for example, an $8,600 account value divided by $1,000 = 8.6), then multiply the result by the number in the "Expenses Paid per $1,000" line under the share class you hold.
— Hypothetical 5% Fund Return. This helps you to compare your Fund's ongoing expenses (but not transaction costs) with those of other mutual funds using the Fund's actual expense ratio and a hypothetical rate of return of 5% per year before expenses. Examples using a 5% hypothetical Fund return may be found in the shareholder reports of other mutual funds. The hypothetical account values and expenses may not be used to estimate the actual ending account balance or expenses you paid for the period.
Please note that the expenses shown in these tables are meant to highlight your ongoing expenses only and do not reflect any transaction costs. The "Expenses Paid per $1,000" line of the tables is useful in comparing ongoing expenses only and will not help you determine the relative total expense of owning different funds. If these transaction costs had been included, your costs would have been higher.
Expenses and Value of a $1,000 Investment for the six months ended December 31, 2013 | ||||
| Actual Fund Return | Class A | |||
| Beginning Account Value 7/1/13 | $ | 1,000.00 | ||
| Ending Account Value 12/31/13 | $ | 1,256.00 | ||
| Expenses Paid per $1,000* | $ | 4.15 | ||
| Hypothetical 5% Fund Return | Class A | |||
| Beginning Account Value 7/1/13 | $ | 1,000.00 | ||
| Ending Account Value 12/31/13 | $ | 1,021.53 | ||
| Expenses Paid per $1,000* | $ | 3.72 | ||
* Expenses are equal to the Fund's annualized expense ratio, multiplied by the average account value over the period, multiplied by 184 (the number of days in the most recent six-month period), then divided by 365.
| Annualized Expense Ratio | Class A | |
| DWS Variable Series II — DWS Small Mid Cap Growth VIP | .73% |
For more information, please refer to the Fund's prospectus.
These tables do not reflect charges and fees ("contract charges") associated with the separate account that invests in the Fund or any variable life insurance policy or variable annuity contract for which the Fund is an investment option.
For an analysis of the fees associated with an investment in the fund or similar funds, please refer to the current and hypothetical expense calculators for Variable Insurance Products which can be found at dws-investments.com/EN/resources/calculators.jsp.
For corporate shareholders, 100% of ordinary dividends (i.e., income dividends plus short-term gains) paid during the Fund's fiscal year ended December 31, 2013, qualified for the dividends received deduction.
Please consult a tax advisor if you have questions about federal or state income tax laws, or on how to prepare your tax returns. If you have specific questions about your account, please contact your insurance provider.
The Trust's policies and procedures for voting proxies for portfolio securities and information about how the Trust voted proxies related to its portfolio securities during the 12-month period ended June 30 are available on our Web site — dws-investments.com (click on "proxy voting" at the bottom of the page) — or on the SEC's Web site — sec.gov. To obtain a written copy of the Trust's policies and procedures without charge, upon request, call us toll free at (800) 728-3337.
The Board of Trustees approved the renewal of DWS Small Mid Cap Growth VIP's investment management agreement (the "Agreement") with Deutsche Investment Management Americas Inc. ("DIMA") in September 2013.
In terms of the process that the Board followed prior to approving the Agreement, shareholders should know that:
— In September 2013, all but one of the Fund's Trustees were independent of DIMA and its affiliates.
— The Trustees met frequently during the past year to discuss fund matters and dedicated a substantial amount of time to contract review matters. Over the course of several months, the Board's Contract Committee, in coordination with the Board's Equity Oversight Committee, reviewed comprehensive materials received from DIMA, independent third parties and independent counsel. These materials included an analysis of the Fund's performance, fees and expenses, and profitability compiled by a fee consultant retained by the Fund's Independent Trustees (the "Fee Consultant"). The Board also received extensive information throughout the year regarding performance of the Fund.
— The Independent Trustees regularly meet privately with their independent counsel to discuss contract review and other matters. In addition, the Independent Trustees were also advised by the Fee Consultant in the course of their review of the Fund's contractual arrangements and considered a comprehensive report prepared by the Fee Consultant in connection with their deliberations.
— In connection with reviewing the Agreement, the Board also reviewed the terms of the Fund's distribution agreement, administrative services agreement, transfer agency agreement and other material service agreements.
— Based on its evaluation of the information provided, the Contract Committee presented its findings and recommendations to the Board. The Board then reviewed the Contract Committee's findings and recommendations.
In connection with the contract review process, the Contract Committee and the Board considered the factors discussed below, among others. The Board also considered that DIMA and its predecessors have managed the Fund since its inception, and the Board believes that a long-term relationship with a capable, conscientious advisor is in the best interests of the Fund. The Board considered, generally, that shareholders chose to invest or remain invested in the Fund knowing that DIMA managed the Fund, and that the Agreement was approved by the Fund's shareholders. DIMA is part of Deutsche Bank AG, a major global banking institution that is engaged in a wide range of financial services. The Board believes that there are advantages to being part of a global asset management business that offers a wide range of investing expertise and resources, including hundreds of portfolio managers and analysts with research capabilities in many countries throughout the world.
As part of the contract review process, the Board carefully considered the fees and expenses of each DWS fund overseen by the Board in light of the fund's performance. In many cases, this led to a negotiation with DIMA of lower expense caps as part of the 2012 and 2013 contract review processes than had previously been in place. As part of these negotiations, the Board indicated that it would consider relaxing these new lower caps in future years following sustained improvements in performance, among other considerations.
In June 2012, Deutsche Bank AG ("DB"), DIMA's parent company, announced that DB would combine its Asset Management (of which DIMA was a part) and Wealth Management divisions. DB has advised the Independent Trustees that the U.S. asset management business is a critical and integral part of DB, and that it has, and will continue to, reinvest a significant portion of the substantial savings it expects to realize by combining its Asset Management and Wealth Management divisions into the new Asset and Wealth Management ("AWM") division, including ongoing enhancements to its investment capabilities. DB also has confirmed its commitment to maintaining strong legal and compliance groups within the AWM division.
While shareholders may focus primarily on fund performance and fees, the Fund's Board considers these and many other factors, including the quality and integrity of DIMA's personnel and such other issues as back-office operations, fund valuations, and compliance policies and procedures.
Nature, Quality and Extent of Services. The Board considered the terms of the Agreement, including the scope of advisory services provided under the Agreement. The Board noted that, under the Agreement, DIMA provides portfolio management services to the Fund and that, pursuant to a separate administrative services agreement, DIMA provides administrative services to the Fund. The Board considered the experience and skills of senior management and investment personnel, the resources made available to such personnel, the ability of DIMA to attract and retain high-quality personnel, and the organizational depth and stability of DIMA. The Board reviewed the Fund's performance over short-term and long-term periods and compared those returns to various agreed-upon performance measures, including market indices and a peer universe compiled by the Fee Consultant using information supplied by Morningstar Direct ("Morningstar"), an independent fund data service. The Board also noted that it has put into place a process of identifying "Focus Funds" (e.g., funds performing poorly relative to their benchmark or a peer universe compiled by an independent fund data service), and receives more frequent reporting and information from DIMA regarding such funds, along with DIMA's remedial plans to address underperformance. The Board believes this process is an effective manner of identifying and addressing underperforming funds. Based on the information provided, the Board noted that for the one-, three- and five-year periods ended December 31, 2012, the Fund's performance (Class A shares) was in the 3rd quartile, 2nd quartile and 3rd quartile, respectively, of the applicable Morningstar universe (the 1st quartile being the best performers and the 4th quartile being the worst performers). The Board also observed that the Fund has underperformed its benchmark in the one-, three- and five-year periods ended December 31, 2012.
Fees and Expenses. The Board considered the Fund's investment management fee schedule, operating expenses and total expense ratios, and comparative information provided by Lipper Inc. ("Lipper") and the Fee Consultant regarding investment management fee rates paid to other investment advisors by similar funds (1st quartile being the most favorable and 4th quartile being the least favorable). With respect to management fees paid to other investment advisors by similar funds, the Board noted that the contractual fee rates paid by the Fund, which include a 0.10% fee paid to DIMA under the Fund's administrative services agreement, were lower than the median (1st quartile) of the applicable Lipper peer group (based on Lipper data provided as of December 31, 2012). The Board noted that the Fund's Class A shares total (net) operating expenses were expected to be lower than the median (1st quartile) of the applicable Lipper expense universe (based on Lipper data provided as of December 31, 2012, and analyzing Lipper expense universe Class A (net) expenses less any applicable 12b-1 fees) ("Lipper Universe Expenses"). The Board considered the Fund's management fee rate as compared to fees charged by DIMA to a comparable fund and considered differences between the Fund and the comparable fund. The Board also considered how the Fund's total (net) operating expenses compared to the total (net) operating expenses of a more customized peer group selected by Lipper (based on such factors as asset size). The Board also noted that the expense limitation agreed to by DIMA helped to ensure that the Fund's total (net) operating expenses would remain competitive.
The information considered by the Board as part of its review of management fees included information regarding fees charged by DIMA and its affiliates to similar institutional accounts and to similar funds offered primarily to European investors ("DWS Europe funds"), in each case as applicable. The Board observed that advisory fee rates for institutional accounts generally were lower than the management fees charged by similarly managed DWS U.S. mutual funds ("DWS Funds"), but also took note of the differences in services provided to DWS Funds as compared to institutional accounts. In the case of DWS Europe funds, the Board observed that fee rates for DWS Europe funds generally were higher than for similarly managed DWS Funds, but noted that differences in the types of services provided to DWS Funds relative to DWS Europe funds made it difficult to compare such fees.
On the basis of the information provided, the Board concluded that management fees were reasonable and appropriate in light of the nature, quality and extent of services provided by DIMA.
Profitability. The Board reviewed detailed information regarding revenues received by DIMA under the Agreement. The Board considered the estimated costs and pre-tax profits realized by DIMA from advising the DWS Funds, as well as estimates of the pre-tax profits attributable to managing the Fund in particular. The Board also received information regarding the estimated enterprise-wide profitability of DWS and its affiliates with respect to all fund services in totality and by fund. The Board and the Fee Consultant reviewed DIMA's methodology in allocating its costs to the management of the Fund. Based on the information provided, the Board concluded that the pre-tax profits realized by DIMA in connection with the management of the Fund were not unreasonable. The Board also reviewed information regarding the profitability of certain similar investment management firms. The Board noted that while information regarding the profitability of such firms is limited (and in some cases is not necessarily prepared on a comparable basis), DIMA and its affiliates' overall profitability with respect to the DWS fund complex (after taking into account distribution and other services provided to the funds by DIMA and its affiliates) was lower than the overall profitability levels of many comparable firms for which such data was available.
Economies of Scale. The Board considered whether there are economies of scale with respect to the management of the Fund and whether the Fund benefits from any economies of scale. The Board noted that the Fund's management fee schedule includes fee breakpoints. The Board concluded that the Fund's fee schedule represents an appropriate sharing between the Fund and DIMA of such economies of scale as may exist in the management of the Fund at current asset levels.
Other Benefits to DIMA and Its Affiliates. The Board also considered the character and amount of other incidental benefits received by DIMA and its affiliates, including any fees received by DIMA for administrative services provided to the Fund and any fees received by an affiliate of DIMA for distribution services. The Board also considered benefits to DIMA related to brokerage and soft-dollar allocations, including allocating brokerage to pay for research generated by parties other than the executing broker dealers, which pertain primarily to funds investing in equity securities, along with the incidental public relations benefits to DIMA related to DWS Funds advertising and cross-selling opportunities among DIMA products and services. The Board concluded that management fees were reasonable in light of these fallout benefits.
Compliance. The Board considered the significant attention and resources dedicated by DIMA to documenting and enhancing its compliance processes in recent years. The Board noted in particular (i) the experience and seniority of both DIMA's chief compliance officer and the Fund's chief compliance officer; (ii) the large number of DIMA compliance personnel; and (iii) the substantial commitment of resources by DIMA and its affiliates to compliance matters.
Based on all of the information considered and the conclusions reached, the Board unanimously determined that the continuation of the Agreement is in the best interests of the Fund. In making this determination, the Board did not give particular weight to any single factor identified above. The Board considered these factors over the course of numerous meetings, certain of which were in executive session with only the Independent Trustees and their independent counsel present. It is possible that individual Trustees may have weighed these factors differently in reaching their individual decisions to approve the continuation of the Agreement.
The following table presents certain information regarding the Board Members and Officers of the fund. Each Board Member's year of birth is set forth in parentheses after his or her name. Unless otherwise noted, (i) each Board Member has engaged in the principal occupation(s) noted in the table for at least the most recent five years, although not necessarily in the same capacity; and (ii) the address of each Independent Board Member is c/o Kenneth C. Froewiss, Chairman, DWS Mutual Funds, P.O. Box 78, Short Hills, NJ 07078. Except as otherwise noted below, the term of office for each Board Member is until the election and qualification of a successor, or until such Board Member sooner dies, resigns, is removed or as otherwise provided in the governing documents of the fund. Because the fund does not hold an annual meeting of shareholders, each Board Member will hold office for an indeterminate period. The Board Members may also serve in similar capacities with other funds in the fund complex.
| Independent Board Members | ||||
Name, Year of Birth, Position with the Fund and Length of Time Served1 | Business Experience and Directorships During the Past Five Years | Number of Funds in DWS Fund Complex Overseen | Other Directorships Held by Board Member | |
Kenneth C. Froewiss (1945) Chairperson since 2013, and Board Member since 2001 | Adjunct Professor of Finance, NYU Stern School of Business (September 2009–present; Clinical Professor from 1997–September 2009); Member, Finance Committee, Association for Asian Studies (2002–present); Director, Mitsui Sumitomo Insurance Group (US) (2004–present); prior thereto, Managing Director, J.P. Morgan (investment banking firm) (until 1996) | 103 | — | |
William McClayton (1944) Vice Chairperson since 2013, and Board Member since 2004 | Private equity investor (since October 2009); previously, Managing Director, Diamond Management & Technology Consultants, Inc. (global consulting firm) (2001–2009); Directorship: Board of Managers, YMCA of Metropolitan Chicago; formerly: Senior Partner, Arthur Andersen LLP (accounting) (1966–2001); Trustee, Ravinia Festival | 103 | — | |
John W. Ballantine (1946) Board Member since 1999 | Retired; formerly, Executive Vice President and Chief Risk Management Officer, First Chicago NBD Corporation/The First National Bank of Chicago (1996–1998); Executive Vice President and Head of International Banking (1995–1996); former Directorships: Stockwell Capital Investments PLC (private equity); First Oak Brook Bancshares, Inc. and Oak Brook Bank; Prisma Energy International | 103 | Chairman of the Board, Healthways, Inc.2 (provider of disease and care management services) (2003– present); Portland General Electric2 (utility company) (2003– present) | |
Henry P. Becton, Jr. (1943) Board Member since 1990 | Vice Chair and former President, WGBH Educational Foundation. Directorships: Public Radio International; Public Radio Exchange (PRX); North Bennett Street School (Boston); former Directorships: The PBS Foundation; Association of Public Television Stations; Boston Museum of Science; American Public Television; Concord Academy; New England Aquarium; Mass. Corporation for Educational Telecommunications; Committee for Economic Development; Public Broadcasting Service; Connecticut College | 103 | Lead Director, Becton Dickinson and Company2 (medical technology company); Lead Director, Belo Corporation2 (media company) | |
Dawn-Marie Driscoll (1946) Board Member since 1987 | President, Driscoll Associates (consulting firm); Emeritus Executive Fellow, Center for Business Ethics, Bentley University; formerly, Partner, Palmer & Dodge (1988–1990); Vice President of Corporate Affairs and General Counsel, Filene's (1978–1988). Directorships: Director of ICI Mutual Insurance Company (since 2007); Advisory Board, Center for Business Ethics, Bentley University; Chairman of the Board of Trustees, Southwest Florida Community Foundation (charitable organization); former Directorships: Sun Capital Advisers Trust (mutual funds) (2007–2012), Investment Company Institute (audit, executive, nominating committees) and Independent Directors Council (governance, executive committees) | 103 | — | |
Keith R. Fox, CFA (1954) Board Member since 1996 | Managing General Partner, Exeter Capital Partners (a series of private investment funds) (since 1986). Directorships: Progressive International Corporation (kitchen goods importer and distributor); The Kennel Shop (retailer); former Chairman, National Association of Small Business Investment Companies; former Directorships: BoxTop Media Inc. (advertising); Sun Capital Advisers Trust (mutual funds) (2011–2012) | 103 | — | |
Paul K. Freeman (1950) Board Member since 1993 | Consultant, World Bank/Inter-American Development Bank; Executive and Governing Council of the Independent Directors Council (Chairman of Education Committee); formerly: Project Leader, International Institute for Applied Systems Analysis (1998–2001); Chief Executive Officer, The Eric Group, Inc. (environmental insurance) (1986–1998); Directorships: Denver Zoo Foundation (December 2012–present); former Directorships: Prisma Energy International | 103 | — | |
Richard J. Herring (1946) Board Member since 1990 | Jacob Safra Professor of International Banking and Professor, Finance Department, The Wharton School, University of Pennsylvania (since July 1972); Co-Director, Wharton Financial Institutions Center (since July 2000); Co-Chair, U.S. Shadow Financial Regulatory Committee; Executive Director, Financial Economists Roundtable; formerly: Vice Dean and Director, Wharton Undergraduate Division (July 1995–June 2000); Director, Lauder Institute of International Management Studies (July 2000–June 2006) | 103 | Director, Japan Equity Fund, Inc. (since September 2007), Thai Capital Fund, Inc. (since 2007), Singapore Fund, Inc. (since September 2007), Independent Director of Barclays Bank Delaware (since September 2010) | |
Rebecca W. Rimel (1951) Board Member since 1995 | President and Chief Executive Officer, The Pew Charitable Trusts (charitable organization) (1994 to present); formerly: Executive Vice President, The Glenmede Trust Company (investment trust and wealth management) (1983–2004); Board Member, Investor Education (charitable organization) (2004–2005); Trustee, Executive Committee, Philadelphia Chamber of Commerce (2001–2007); Director, Viasys Health Care2 (January 2007–June 2007); Trustee, Thomas Jefferson Foundation (charitable organization) (1994–2012) | 103 | Director, Becton Dickinson and Company2 (medical technology company) (2012– present); Director, CardioNet, Inc.2 (health care) (2009– present) | |
William N. Searcy, Jr. (1946) Board Member since 1993 | Private investor since October 2003; formerly: Pension & Savings Trust Officer, Sprint Corporation2 (telecommunications) (November 1989–September 2003); Trustee, Sun Capital Advisers Trust (mutual funds) (1998–2012) | 103 | — | |
Jean Gleason Stromberg (1943) Board Member since 1997 | Retired. Formerly, Consultant (1997–2001); Director, Financial Markets U.S. Government Accountability Office (1996–1997); Partner, Fulbright & Jaworski, L.L.P. (law firm) (1978–1996). Directorships: The William and Flora Hewlett Foundation; former Directorships: Service Source, Inc., Mutual Fund Directors Forum (2002–2004), American Bar Retirement Association (funding vehicle for retirement plans) (1987–1990 and 1994–1996) | 103 | — | |
Robert H. Wadsworth (1940) Board Member since 1999 | President, Robert H. Wadsworth & Associates, Inc. (consulting firm) (1983 to present); Director, National Horizon, Inc. (non-profit organization); Director and Treasurer, The Phoenix Boys Choir Association | 106 | — | |
Officers4 | ||
Name, Year of Birth, Position with the Fund and Length of Time Served5 | Business Experience and Directorships During the Past Five Years | |
Brian E. Binder8,9 (1972) President and Chief Executive Officer, 2013–present | Managing Director3 and Head of Fund Administration, Deutsche Asset & Wealth Management (2013–present); formerly: Head of Business Management and Consulting at Invesco, Ltd. (2010–2012); Chief Administrative Officer, Van Kampen Funds Inc. (2008–2010); and Chief Administrative Officer, Morgan Stanley Investment Management Americas Distribution (2003–2008) | |
John Millette7 (1962) Vice President and Secretary, 1999–present | Director,3 Deutsche Asset & Wealth Management | |
Paul H. Schubert6 (1963) Chief Financial Officer, 2004–present Treasurer, 2005–present | Managing Director,3 Deutsche Asset & Wealth Management (since July 2004); formerly: Executive Director, Head of Mutual Fund Services and Treasurer for UBS Family of Funds (1998–2004); Vice President and Director of Mutual Fund Finance at UBS Global Asset Management (1994–1998) | |
Caroline Pearson7 (1962) Chief Legal Officer, 2010–present | Managing Director,3 Deutsche Asset & Wealth Management; formerly: Assistant Secretary for DWS family of funds (1997–2010) | |
Melinda Morrow6 (1970) Vice President, 2012–present | Director,3 Deutsche Asset & Wealth Management | |
Hepsen Uzcan7 (1974) Assistant Secretary, 2013–present | Vice President, Deutsche Asset & Wealth Management | |
Paul Antosca7 (1957) Assistant Treasurer, 2007–present | Director,3 Deutsche Asset & Wealth Management | |
Jack Clark7 (1967) Assistant Treasurer, 2007–present | Director,3 Deutsche Asset & Wealth Management | |
Diane Kenneally7 (1966) Assistant Treasurer, 2007–present | Director,3 Deutsche Asset & Wealth Management | |
John Caruso6 (1965) Anti-Money Laundering Compliance Officer, 2010–present | Managing Director,3 Deutsche Asset & Wealth Management | |
Robert Kloby6 (1962) Chief Compliance Officer, 2006–present | Managing Director,3 Deutsche Asset & Wealth Management | |
1 The length of time served represents the year in which the Board Member joined the board of one or more DWS funds currently overseen by the Board.
2 A publicly held company with securities registered pursuant to Section 12 of the Securities Exchange Act of 1934.
3 Executive title, not a board directorship.
4 As a result of their respective positions held with the Advisor, these individuals are considered "interested persons" of the Advisor within the meaning of the 1940 Act. Interested persons receive no compensation from the fund.
5 The length of time served represents the year in which the officer was first elected in such capacity for one or more DWS funds.
6 Address: 60 Wall Street, New York, NY 10005.
7 Address: One Beacon Street, Boston, MA 02108.
8 Address: 222 South Riverside Plaza, Chicago, IL 60606.
9 Effective as of December 1, 2013.
The fund's Statement of Additional Information ("SAI") includes additional information about the Board Members. The SAI is available, without charge, upon request. If you would like to request a copy of the SAI, you may do so by calling the following toll-free number: (800) 728-3337.
Notes
DWS Investments Distributors, Inc.
222 South Riverside Plaza
Chicago, IL 60606
(800) 621-1148
VS2SMCG-2 (R-025835-3 2/14)
December 31, 2013
Annual Report
DWS Variable Series II
DWS Small Mid Cap Value VIP
(formerly DWS Dreman Small Mid Cap Value VIP)
Contents
3 Performance Summary 4 Management Summary 5 Portfolio Summary 6 Investment Portfolio 8 Statement of Assets and Liabilities 9 Statement of Operations 9 Statement of Changes in Net Assets 11 Financial Highlights 12 Notes to Financial Statements 16 Report of Independent Registered Public Accounting Firm 17 Information About Your Fund's Expenses 18 Tax Information 18 Proxy Voting 19 Advisory Agreement Board Considerations and Fee Evaluation 22 Board Members and Officers |
This report must be preceded or accompanied by a prospectus. To obtain an additional prospectus or summary prospectus, if available, call (800) 728-3337 or your financial representative. We advise you to consider the Fund's objectives, risks, charges and expenses carefully before investing. The summary prospectus and prospectus contain this and other important information about the Fund. Please read the prospectus carefully before you invest.
Any fund that focuses in a particular segment of the market will generally be more volatile than a fund that invests more broadly. Smaller and medium company stocks tend to be more volatile than large company stocks. The fund may lend securities to approved institutions. Stocks may decline in value. See the prospectus for details.
Deutsche Asset & Wealth Management represents the asset management and wealth management activities conducted by Deutsche Bank AG or any of its subsidiaries, including the Advisor and DWS Investments Distributors, Inc.
NOT FDIC/NCUA INSURED NO BANK GUARANTEE MAY LOSE VALUE NOT A DEPOSIT
NOT INSURED BY ANY FEDERAL GOVERNMENT AGENCY
Fund performance shown is historical, assumes reinvestment of all dividend and capital gain distributions and does not guarantee future results. Investment return and principal value fluctuate with changing market conditions so that, when redeemed, shares may be worth more or less than their original cost. Current performance may be lower or higher than the performance data quoted. Please contact your participating insurance company for the Fund's most recent month-end performance. Performance doesn't reflect charges and fees ("contract charges") associated with the separate account that invests in the Fund or any variable life insurance policy or variable annuity contract for which the Fund is an investment option. These charges and fees will reduce returns. While all share classes have the same underlying portfolio, their performance will differ.
The gross expense ratios of the Fund, as stated in the fee table of the prospectus dated May 1, 2013 are 0.82% and 1.16% for Class A and Class B shares, respectively, and may differ from the expense ratios disclosed in the Financial Highlights tables in this report.
| Growth of an Assumed $10,000 Investment in DWS Small Mid Cap Value VIP | ||
 | The Russell 2500™ Value Index is an unmanaged Index of those securities in the Russell 3000® Index with lower price-to-book ratios and lower forecasted growth values. Index returns do not reflect any fees or expenses and it is not possible to invest directly into an index. | |
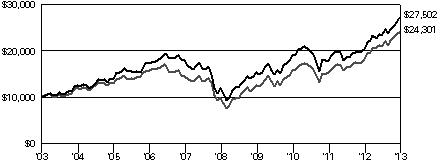 | ||
| Yearly periods ended December 31 | ||
| Comparative Results | |||||||||||||||||
| DWS Small Mid Cap Value VIP | 1-Year | 3-Year | 5-Year | 10-Year | |||||||||||||
| Class A | Growth of $10,000 | $ | 13,524 | $ | 14,450 | $ | 23,066 | $ | 27,502 | ||||||||
| Average annual total return | 35.24 | % | 13.06 | % | 18.19 | % | 10.65 | % | |||||||||
| Russell 2500 Value Index | Growth of $10,000 | $ | 13,332 | $ | 15,360 | $ | 24,479 | $ | 24,301 | ||||||||
| Average annual total return | 33.32 | % | 15.38 | % | 19.61 | % | 9.29 | % | |||||||||
| DWS Small Mid Cap Value VIP | �� | 1-Year | 3-Year | 5-Year | 10-Year | ||||||||||||
| Class B | Growth of $10,000 | $ | 13,470 | $ | 14,305 | $ | 22,685 | $ | 26,521 | ||||||||
| Average annual total return | 34.70 | % | 12.68 | % | 17.80 | % | 10.25 | % | |||||||||
| Russell 2500 Value Index | Growth of $10,000 | $ | 13,332 | $ | 15,360 | $ | 24,479 | $ | 24,301 | ||||||||
| Average annual total return | 33.32 | % | 15.38 | % | 19.61 | % | 9.29 | % | |||||||||
The growth of $10,000 is cumulative.
Class A shares DWS Small Mid Cap VIP returned 35.24% in 2013 (unadjusted for contract charges), outperforming the 33.32% return of the benchmark, the Russell 2500™ Value Index.1
On September 3, 2013, the Fund's portfolio management team changed. Consequently, the Fund's 12-month results ending December 31, 2013 incorporate the results of two management teams.
Prior to the change in management, the Fund outperformed its benchmark. The largest contribution to performance during this time came from stock selection in the financial sector.
The Fund also outperformed in the interval from the September 3, 2013 changeover through the end of the period ending December 31, 2013. The largest contributions came from stock selection in the industrials, information technology and financial sectors. Sector allocations also made a positive contribution to returns, led by an overweight in industrials and an underweight in financials.2
We employ a "classic value" approach founded in the belief that investor biases can cause quality small- and mid-cap companies to trade below their intrinsic values. In choosing stocks, we focus on individual security selection rather than industry selection. We use an active process that combines financial analysis with company visits to evaluate management and strategies. We also emphasize individual stock selection across all economic sectors, focusing on companies that we believe have strong management, identifiable catalysts such as acquisitions or new products, and valuations that offer an attractive risk/reward trade-off.
At the close of the period ending December 31, 2013, the Fund held its largest overweight positions in the industrial, health care and information technology sectors, while its largest underweights were in financials, energy and utilities. This doesn't reflect a top-down view, but rather our finding many of the most attractive individual stocks in these areas.
In terms of our outlook, we would describe the current U.S. economic environment as "fair." While we do not believe the economy is in danger of slipping into a recession, improvement in the U.S. growth outlook remains slow. Given this backdrop, the markets in general — and small- and mid-cap stocks in particular — have moved very far, very fast over the past year. Valuations aren't extreme in any sense, but new investment ideas have been more difficult to identify. Nevertheless, we remain optimistic on the outlooks for the individual companies we hold in the Fund based on their reasonable valuations and compelling long-term opportunities.
Richard Glass, CFA
Portfolio Manager, Deutsche Investment Management Americas Inc.
The views expressed reflect those of the portfolio management team only through the end of the period of the report as stated on the cover. The management team's views are subject to change at any time based on market and other conditions and should not be construed as a recommendation. Past performance is no guarantee of future results. Current and future portfolio holdings are subject to risk.
1 The Russell 2500 Value Index is an unmanaged index of those securities in the Russell 3000® Index with lower price-to-book ratios and lower forecasted growth values. Index returns do not reflect fees or expenses and it is not possible to invest directly into an index.
2 "Underweight" means the Fund holds a lower weighting in a given sector or security than the benchmark. "Overweight" means the Fund holds a higher weighting.
Asset Allocation (As a % of Investment Portfolio excluding Securities Lending Collateral) | 12/31/13 | 12/31/12 |
| Common Stocks | 96% | 98% |
| Cash Equivalents | 4% | 2% |
| 100% | 100% |
Sector Diversification (As a % of Common Stocks) | 12/31/13 | 12/31/12 |
| Industrials | 29% | 22% |
| Financials | 16% | 27% |
| Information Technology | 14% | 17% |
| Consumer Discretionary | 12% | 8% |
| Health Care | 10% | 7% |
| Materials | 7% | 7% |
| Utilities | 5% | 4% |
| Energy | 5% | 5% |
| Consumer Staples | 2% | 3% |
| 100% | 100% |
Portfolio holdings and characteristics are subject to change.
For more complete details about the Fund's investment portfolio, see page 6.
Following the Fund's fiscal first and third quarter-end, a complete portfolio holdings listing is filed with the SEC on Form N-Q. The form will be available on the SEC's Web site at sec.gov, and it also may be reviewed and copied at the SEC's Public Reference Room in Washington, D.C. Information on the operation of the SEC's Public Reference Room may be obtained by calling (800) SEC-0330. The Fund's portfolio holdings are also posted on dws-investments.com from time to time. Please see the Fund's current prospectus for more information.
| Shares | Value ($) | |||||||
| Common Stocks 95.8% | ||||||||
| Consumer Discretionary 11.8% | ||||||||
| Auto Components 2.4% | ||||||||
| Visteon Corp.* | 76,390 | 6,255,577 | ||||||
| Hotels, Restaurants & Leisure 1.4% | ||||||||
| The Wendy's Co. | 421,696 | 3,677,189 | ||||||
| Household Durables 3.1% | ||||||||
| Newell Rubbermaid, Inc. | 245,170 | 7,945,960 | ||||||
| Media 1.5% | ||||||||
| Scripps Networks Interactive, Inc. "A" | 44,420 | 3,838,332 | ||||||
| Specialty Retail 1.5% | ||||||||
| Ross Stores, Inc. | 52,295 | 3,918,464 | ||||||
| Textiles, Apparel & Luxury Goods 1.9% | ||||||||
| Hanesbrands, Inc. | 71,003 | 4,989,381 | ||||||
| Consumer Staples 2.2% | ||||||||
| Food Products | ||||||||
| Ingredion, Inc. | 85,280 | 5,838,269 | ||||||
| Energy 4.3% | ||||||||
| Energy Equipment & Services 1.3% | ||||||||
| Superior Energy Services, Inc.* | 124,276 | 3,306,985 | ||||||
| Oil, Gas & Consumable Fuels 3.0% | ||||||||
| Pioneer Natural Resources Co. | 19,540 | 3,596,728 | ||||||
| QEP Resources, Inc. | 140,350 | 4,301,727 | ||||||
| 7,898,455 | ||||||||
| Financials 15.2% | ||||||||
| Capital Markets 2.3% | ||||||||
| Lazard Ltd. "A" | 129,690 | 5,877,551 | ||||||
| Insurance 11.7% | ||||||||
| Arch Capital Group Ltd.* | 90,610 | 5,408,511 | ||||||
| Axis Capital Holdings Ltd. | 68,814 | 3,273,482 | ||||||
| CNO Financial Group, Inc. | 368,608 | 6,520,675 | ||||||
| PartnerRe Ltd. | 46,190 | 4,869,812 | ||||||
| Reinsurance Group of America, Inc. | 67,510 | 5,225,949 | ||||||
| Validus Holdings Ltd. | 128,724 | 5,186,290 | ||||||
| 30,484,719 | ||||||||
| Real Estate Investment Trusts 1.2% | ||||||||
| Plum Creek Timber Co., Inc. (REIT) | 65,730 | 3,057,102 | ||||||
| Health Care 9.8% | ||||||||
| Health Care Equipment & Supplies 1.6% | ||||||||
| CareFusion Corp.* | 104,820 | 4,173,932 | ||||||
| Health Care Providers & Services 4.9% | ||||||||
| HealthSouth Corp. | 186,540 | 6,215,513 | ||||||
| Omnicare, Inc. | 106,600 | 6,434,376 | ||||||
| 12,649,889 | ||||||||
| Life Sciences Tools & Services 1.8% | ||||||||
| PerkinElmer, Inc. | 110,992 | 4,576,200 | ||||||
| Pharmaceuticals 1.5% | ||||||||
| Actavis PLC* | 23,925 | 4,019,400 | ||||||
| Shares | Value ($) | |||||||
| Industrials 27.5% | ||||||||
| Aerospace & Defense 2.8% | ||||||||
| Curtiss-Wright Corp. | 53,300 | 3,316,859 | ||||||
| Triumph Group, Inc. | 53,300 | 4,054,531 | ||||||
| 7,371,390 | ||||||||
| Building Products 2.1% | ||||||||
| Owens Corning, Inc.* | 130,702 | 5,322,185 | ||||||
| Commercial Services & Supplies 5.2% | ||||||||
| ADT Corp. | 127,361 | 5,154,300 | ||||||
| Covanta Holding Corp. | 186,540 | 3,311,085 | ||||||
| The Brink's Co. | 148,442 | 5,067,810 | ||||||
| 13,533,195 | ||||||||
| Electrical Equipment 2.0% | ||||||||
| The Babcock & Wilcox Co. | 153,488 | 5,247,755 | ||||||
| Machinery 8.0% | ||||||||
| Harsco Corp. | 184,681 | 5,176,608 | ||||||
| ITT Corp. | 85,280 | 3,702,858 | ||||||
| Snap-on, Inc. | 39,090 | 4,281,137 | ||||||
| Stanley Black & Decker, Inc. | 39,090 | 3,154,172 | ||||||
| Xylem, Inc. | 129,281 | 4,473,122 | ||||||
| 20,787,897 | ||||||||
| Marine 3.1% | ||||||||
| Kirby Corp.* | 81,720 | 8,110,710 | ||||||
| Professional Services 1.5% | ||||||||
| Verisk Analytics, Inc. "A"* | 58,630 | 3,853,164 | ||||||
| Trading Companies & Distributors 2.8% | ||||||||
| AerCap Holdings NV* | 187,046 | 7,173,214 | ||||||
| Information Technology 13.3% | ||||||||
| Communications Equipment 1.0% | ||||||||
| Juniper Networks, Inc.* | 119,582 | 2,698,966 | ||||||
| Computers & Peripherals 0.9% | ||||||||
| NCR Corp.* | 67,507 | 2,299,288 | ||||||
| Electronic Equipment, Instruments & Components 4.0% | ||||||||
| Belden, Inc. | 89,008 | 6,270,614 | ||||||
| Dolby Laboratories, Inc. "A"* | 106,600 | 4,110,496 | ||||||
| 10,381,110 | ||||||||
| IT Services 4.9% | ||||||||
| Amdocs Ltd. | 96,752 | 3,990,052 | ||||||
| Global Payments, Inc. | 65,730 | 4,271,793 | ||||||
| NeuStar, Inc. "A"* | 88,932 | 4,434,150 | ||||||
| 12,695,995 | ||||||||
| Office Electronics 1.1% | ||||||||
| Zebra Technologies Corp. "A"* | 54,513 | 2,948,063 | ||||||
| Software 1.4% | ||||||||
| ACI Worldwide, Inc.* | 53,993 | 3,509,545 | ||||||
| Materials 6.7% | ||||||||
| Chemicals 4.3% | ||||||||
| Ashland, Inc. | 71,060 | 6,895,663 | ||||||
| Cytec Industries, Inc. | 46,465 | 4,328,679 | ||||||
| 11,224,342 | ||||||||
| Containers & Packaging 2.4% | ||||||||
| Sealed Air Corp. | 184,770 | 6,291,418 | ||||||
| Shares | Value ($) | |||||||
| Utilities 5.0% | ||||||||
| Electric Utilities 1.8% | ||||||||
| Northeast Utilities | 108,370 | 4,593,804 | ||||||
| Gas Utilities 1.9% | ||||||||
| UGI Corp. | 117,260 | 4,861,600 | ||||||
| Multi-Utilities 1.3% | ||||||||
| CMS Energy Corp. | 129,690 | 3,471,801 | ||||||
Total Common Stocks (Cost $212,791,265) | 248,882,847 | |||||||
| Shares | Value ($) | |||||||
| Cash Equivalents 4.3% | ||||||||
| Central Cash Management Fund, 0.05% (a) (Cost $11,169,066) | 11,169,066 | 11,169,066 | ||||||
| % of Net Assets | Value ($) | |||||||
Total Investment Portfolio (Cost $223,960,331)† | 100.1 | 260,051,913 | ||||||
| Other Assets and Liabilities, Net | (0.1 | ) | (353,581 | ) | ||||
| Net Assets | 100.0 | 259,698,332 | ||||||
* Non-income producing security.
† The cost for federal income tax purposes was $223,960,331. At December 31, 2013, net unrealized appreciation for all securities based on tax cost was $36,091,582. This consisted of aggregate gross unrealized appreciation for all securities in which there was an excess of value over tax cost of $37,124,380 and aggregate gross unrealized depreciation for all securities in which there was an excess of tax cost over value of $1,032,798.
(a) Affiliated fund managed by Deutsche Investment Management Americas Inc. The rate shown is the annualized seven-day yield at period end.
REIT: Real Estate Investment Trust
Fair Value Measurements
Various inputs are used in determining the value of the Fund's investments. These inputs are summarized in three broad levels. Level 1 includes quoted prices in active markets for identical securities. Level 2 includes other significant observable inputs (including quoted prices for similar securities, interest rates, prepayment speeds and credit risk). Level 3 includes significant unobservable inputs (including the Fund's own assumptions in determining the fair value of investments). The level assigned to the securities valuations may not be an indication of the risk or liquidity associated with investing in those securities.
The following is a summary of the inputs used as of December 31, 2013 in valuing the Fund's investments. For information on the Fund's policy regarding the valuation of investments, please refer to the Security Valuation section of Note A in the accompanying Notes to Financial Statements.
| Assets | Level 1 | Level 2 | Level 3 | Total | ||||||||||||
| Common Stocks (b) | $ | 248,882,847 | $ | — | $ | — | $ | 248,882,847 | ||||||||
| Short-Term Investments | 11,169,066 | — | — | 11,169,066 | ||||||||||||
| Total | $ | 260,051,913 | $ | — | $ | — | $ | 260,051,913 | ||||||||
There have been no transfers between fair value measurement levels during the year ended December 31, 2013.
(b) See Investment Portfolio for additional detailed categorizations.
The accompanying notes are an integral part of the financial statements.
| as of December 31, 2013 | ||||
| Assets | ||||
Investments: Investments in non-affiliated securities, at value (cost $212,791,265) | $ | 248,882,847 | ||
| Investment in Central Cash Management Fund (cost $11,169,066) | 11,169,066 | |||
| Total investments in securities, at value (cost $223,960,331) | 260,051,913 | |||
| Cash | 30,755 | |||
| Receivable for Fund shares sold | 66,438 | |||
| Dividends receivable | 168,908 | |||
| Interest receivable | 540 | |||
| Other assets | 4,102 | |||
| Total assets | 260,322,656 | |||
| Liabilities | ||||
| Payable for Fund shares redeemed | 412,438 | |||
| Accrued management fee | 138,765 | |||
| Accrued Trustees' fees | 3,617 | |||
| Other accrued expenses and payables | 69,504 | |||
| Total liabilities | 624,324 | |||
| Net assets, at value | $ | 259,698,332 | ||
| Net Assets Consist of | ||||
| Undistributed net investment income | 1,850,167 | |||
| Net unrealized appreciation (depreciation) on investments | 36,091,582 | |||
| Accumulated net realized gain (loss) | 1,033,527 | |||
| Paid-in capital | 220,723,056 | |||
| Net assets, at value | $ | 259,698,332 | ||
Class A Net Asset Value, offering and redemption price per share ($239,883,278 ÷ 14,042,897 outstanding shares of beneficial interest, no par value, unlimited number of shares authorized) | $ | 17.08 | ||
Class B Net Asset Value, offering and redemption price per share ($19,815,054 ÷ 1,160,889 outstanding shares of beneficial interest, no par value, unlimited number of shares authorized) | $ | 17.07 | ||
The accompanying notes are an integral part of the financial statements.
Statement of Operations
| for the year ended December 31, 2013 | ||||
| Investment Income | ||||
Income: Dividends | $ | 3,917,876 | ||
| Income distributions — Central Cash Management Fund | 4,464 | |||
| Securities lending income, including income from Daily Assets Fund Institutional, net of borrower rebates | 61,442 | |||
| Total income | 3,983,782 | |||
Expenses: Management fee | 1,592,789 | |||
| Administration fee | 245,067 | |||
| Services to shareholders | 7,077 | |||
| Record keeping fees (Class B) | 18,952 | |||
| Distribution service fee (Class B) | 46,270 | |||
| Custodian fee | 12,003 | |||
| Professional fees | 67,592 | |||
| Reports to shareholders | 57,633 | |||
| Trustees' fees and expenses | 10,661 | |||
| Other | 10,779 | |||
| Total expenses | 2,068,823 | |||
| Net investment income (loss) | 1,914,959 | |||
| Realized and Unrealized Gain (Loss) | ||||
| Net realized gain (loss) from investments | 72,681,616 | |||
| Change in net unrealized appreciation (depreciation) on investments | (601,679 | ) | ||
| Net gain (loss) | 72,079,937 | |||
| Net increase (decrease) in net assets resulting from operations | $ | 73,994,896 | ||
The accompanying notes are an integral part of the financial statements.
| Years Ended December 31, | ||||||||
| Increase (Decrease) in Net Assets | 2013 | 2012 | ||||||
Operations: Net investment income (loss) | $ | 1,914,959 | $ | 2,773,636 | ||||
| Net realized gain (loss) | 72,681,616 | 13,712,216 | ||||||
| Change in net unrealized appreciation (depreciation) | (601,679 | ) | 14,140,156 | |||||
| Net increase (decrease) in net assets resulting from operations | 73,994,896 | 30,626,008 | ||||||
Distributions to shareholders from: Net investment income: Class A | (2,660,096 | ) | (2,544,018 | ) | ||||
| Class B | (150,280 | ) | (170,068 | ) | ||||
| Total distributions | (2,810,376 | ) | (2,714,086 | ) | ||||
Fund share transactions: Class A Proceeds from shares sold | 17,897,526 | 15,242,621 | ||||||
| Reinvestment of distributions | 2,660,096 | 2,544,018 | ||||||
| Payments for shares redeemed | (65,359,482 | ) | (40,361,547 | ) | ||||
| Net increase (decrease) in net assets from Class A share transactions | (44,801,860 | ) | (22,574,908 | ) | ||||
Class B Proceeds from shares sold | 4,288,905 | 2,417,600 | ||||||
| Reinvestment of distributions | 150,280 | 170,068 | ||||||
| Payments for shares redeemed | (6,805,298 | ) | (8,165,016 | ) | ||||
| Net increase (decrease) in net assets from Class B share transactions | (2,366,113 | ) | (5,577,348 | ) | ||||
| Increase (decrease) in net assets | 24,016,547 | (240,334 | ) | |||||
| Net assets at beginning of period | 235,681,785 | 235,922,119 | ||||||
| Net assets at end of period (including undistributed net investment income of $1,850,167 and $2,783,776, respectively) | $ | 259,698,332 | $ | 235,681,785 | ||||
| Other Information | ||||||||
Class A Shares outstanding at beginning of period | 17,113,875 | 18,969,648 | ||||||
| Shares sold | 1,211,679 | 1,248,625 | ||||||
| Shares issued to shareholders in reinvestment of distributions | 190,143 | 207,168 | ||||||
| Shares redeemed | (4,472,800 | ) | (3,311,566 | ) | ||||
| Net increase (decrease) in Class A shares | (3,070,978 | ) | (1,855,773 | ) | ||||
| Shares outstanding at end of period | 14,042,897 | 17,113,875 | ||||||
Class B Shares outstanding at beginning of period | 1,321,925 | 1,796,701 | ||||||
| Shares sold | 288,710 | 195,502 | ||||||
| Shares issued to shareholders in reinvestment of distributions | 10,719 | 13,827 | ||||||
| Shares redeemed | (460,465 | ) | (684,105 | ) | ||||
| Net increase (decrease) in Class B shares | (161,036 | ) | (474,776 | ) | ||||
| Shares outstanding at end of period | 1,160,889 | 1,321,925 | ||||||
The accompanying notes are an integral part of the financial statements.
| Years Ended December 31, | |||||||||||||||||||||
| Class A | 2013 | 2012 | 2011 | 2010 | 2009 | ||||||||||||||||
| Selected Per Share Data | |||||||||||||||||||||
| Net asset value, beginning of period | $ | 12.78 | $ | 11.36 | $ | 12.21 | $ | 10.04 | $ | 7.93 | |||||||||||
Income (loss) from investment operations: Net investment incomea | .12 | .14 | .13 | .12 | .16 | ||||||||||||||||
| Net realized and unrealized gain (loss) | 4.35 | 1.42 | (.85 | ) | 2.19 | 2.11 | |||||||||||||||
| Total from investment operations | 4.47 | 1.56 | (.72 | ) | 2.31 | 2.27 | |||||||||||||||
Less distributions from: Net investment income | (.17 | ) | (.14 | ) | (.13 | ) | (.14 | ) | (.16 | ) | |||||||||||
| Total distributions | (.17 | ) | (.14 | ) | (.13 | ) | (.14 | ) | (.16 | ) | |||||||||||
| Net asset value, end of period | $ | 17.08 | $ | 12.78 | $ | 11.36 | $ | 12.21 | $ | 10.04 | |||||||||||
| Total Return (%) | 35.24 | 13.77 | (6.08 | ) | 23.07 | 29.70 | |||||||||||||||
| Ratios to Average Net Assets and Supplemental Data | |||||||||||||||||||||
| Net assets, end of period ($ millions) | 240 | 219 | 216 | 247 | 235 | ||||||||||||||||
| Ratio of expenses (%) | .82 | .82 | .81 | .82 | .79 | ||||||||||||||||
| Ratio of net investment income (%) | .81 | 1.18 | 1.08 | 1.14 | 1.92 | ||||||||||||||||
| Portfolio turnover rate (%) | 115 | 11 | 36 | 38 | 72 | ||||||||||||||||
a Based on average shares outstanding during the period. | |||||||||||||||||||||
| Years Ended December 31, | |||||||||||||||||||||
| Class B | 2013 | 2012 | 2011 | 2010 | 2009 | ||||||||||||||||
| Selected Per Share Data | |||||||||||||||||||||
| Net asset value, beginning of period | $ | 12.78 | $ | 11.36 | $ | 12.20 | $ | 10.03 | $ | 7.92 | |||||||||||
Income (loss) from investment operations: Net investment incomea | .07 | .10 | .09 | .08 | .13 | ||||||||||||||||
| Net realized and unrealized gain (loss) | 4.34 | 1.42 | (.85 | ) | 2.19 | 2.12 | |||||||||||||||
| Total from investment operations | 4.41 | 1.52 | (.76 | ) | 2.27 | 2.25 | |||||||||||||||
Less distributions from: Net investment income | (.12 | ) | (.10 | ) | (.08 | ) | (.10 | ) | (.14 | ) | |||||||||||
| Total distributions | (.12 | ) | (.10 | ) | (.08 | ) | (.10 | ) | (.14 | ) | |||||||||||
| Net asset value, end of period | $ | 17.07 | $ | 12.78 | $ | 11.36 | $ | 12.20 | $ | 10.03 | |||||||||||
| Total Return (%) | 34.70 | 13.38 | (6.33 | ) | 22.66 | 29.28 | |||||||||||||||
| Ratios to Average Net Assets and Supplemental Data | |||||||||||||||||||||
| Net assets, end of period ($ millions) | 20 | 17 | 20 | 26 | 23 | ||||||||||||||||
| Ratio of expenses (%) | 1.17 | 1.16 | 1.15 | 1.17 | 1.14 | ||||||||||||||||
| Ratio of net investment income (%) | .45 | .81 | .74 | .79 | 1.57 | ||||||||||||||||
| Portfolio turnover rate (%) | 115 | 11 | 36 | 38 | 72 | ||||||||||||||||
a Based on average shares outstanding during the period. | |||||||||||||||||||||
A. Organization and Significant Accounting Policies
DWS Small Mid Cap Value VIP (formerly DWS Dreman Small Mid Cap Value VIP) (the "Fund") is a diversified series of DWS Variable Series II (the "Trust"), which is registered under the Investment Company Act of 1940, as amended (the "1940 Act"), as an open-end management investment company organized as a Massachusetts business trust.
Multiple Classes of Shares of Beneficial Interest. The Fund offers two classes of shares (Class A shares and Class B shares). Sales of Class B shares are subject to recordkeeping fees up to 0.15% and Rule 12b-1 fees under the 1940 Act equal to an annual rate of 0.25% of the average daily net assets of the Class B shares of the Fund. Class A shares are not subject to such fees.
Investment income, realized and unrealized gains and losses, and certain fund-level expenses and expense reductions, if any, are borne pro rata on the basis of relative net assets by the holders of all classes of shares except that each class bears certain expenses unique to that class (including the applicable Rule 12b-1 fee and recordkeeping fees). Differences in class-level expenses may result in payment of different per share dividends by class. All shares have equal rights with respect to voting subject to class-specific arrangements.
The Fund's financial statements are prepared in accordance with accounting principles generally accepted in the United States of America which require the use of management estimates. Actual results could differ from those estimates. The policies described below are followed consistently by the Fund in the preparation of its financial statements.
Security Valuation. Investments are stated at value determined as of the close of regular trading on the New York Stock Exchange on each day the exchange is open for trading.
Various inputs are used in determining the value of the Fund's investments. These inputs are summarized in three broad levels. Level 1 includes quoted prices in active markets for identical securities. Level 2 includes other significant observable inputs (including quoted prices for similar securities, interest rates, prepayment speeds and credit risk). Level 3 includes significant unobservable inputs (including the Fund's own assumptions in determining the fair value of investments). The level assigned to the securities valuations may not be an indication of the risk or liquidity associated with investing in those securities.
Equity securities are valued at the most recent sale price or official closing price reported on the exchange (U.S. or foreign) or over-the-counter market on which they trade. Securities for which no sales are reported are valued at the calculated mean between the most recent bid and asked quotations on the relevant market or, if a mean cannot be determined, at the most recent bid quotation. Equity securities are generally categorized as Level 1.
Investments in open-end investment companies are valued at their net asset value each business day and are categorized as Level 1.
Securities and other assets for which market quotations are not readily available or for which the above valuation procedures are deemed not to reflect fair value are valued in a manner that is intended to reflect their fair value as determined in accordance with procedures approved by the Board and are generally categorized as Level 3. In accordance with the Fund's valuation procedures, factors used in determining value may include, but are not limited to, the type of the security; the size of the holding; the initial cost of the security; the existence of any contractual restrictions on the security's disposition; the price and extent of public trading in similar securities of the issuer or of comparable companies; quotations or evaluated prices from broker-dealers and/or pricing services; information obtained from the issuer, analysts, and/or the appropriate stock exchange (for exchange-traded securities); an analysis of the company's or issuer's financial statements; an evaluation of the forces that influence the issuer and the market(s) in which the security is purchased and sold; and with respect to debt securities, the maturity, coupon, creditworthiness, currency denomination and the movement of the market in which the security is normally traded. The value determined under these procedures may differ from published values for the same securities.
Disclosure about the classification of fair value measurements is included in a table following the Fund's Investment Portfolio.
Foreign Currency Translations. The books and records of the Fund are maintained in U.S. dollars. Investment securities and other assets and liabilities denominated in a foreign currency are translated into U.S. dollars at the prevailing exchange rates at period end. Purchases and sales of investment securities, income and expenses are translated into U.S. dollars at the prevailing exchange rates on the respective dates of the transactions.
Net realized and unrealized gains and losses on foreign currency transactions represent net gains and losses between trade and settlement dates on securities transactions, the acquisition and disposition of foreign currencies, and the difference between the amount of net investment income accrued and the U.S. dollar amount actually received. That portion of both realized and unrealized gains and losses on investments that results from fluctuations in foreign currency exchange rates is not separately disclosed but is included with net realized and unrealized gain/appreciation and loss/depreciation on investments.
Securities Lending. Brown Brothers Harriman & Co., as lending agent, lends securities of the Fund to certain financial institutions under the terms of the Security Lending Agreement. The Fund retains the benefits of owning the securities it has loaned and continues to receive interest and dividends generated by the securities and to participate in any changes in their market value. The Fund requires the borrowers of the securities to maintain collateral with the Fund consisting of either cash or liquid, unencumbered assets having a value at least equal to the value of the securities loaned. When the collateral falls below specified amounts, the lending agent will use its best effort to obtain additional collateral on the next business day to meet required amounts under the security lending agreement. The Fund may invest the cash collateral into a joint trading account in an affiliated money market fund pursuant to Exemptive Orders issued by the SEC. The Fund receives compensation for lending its securities either in the form of fees or by earning interest on invested cash collateral net of borrower rebates and fees paid to a lending agent. Either the Fund or the borrower may terminate the loan. There may be risks of delay and costs in recovery of securities or even loss of rights in the collateral should the borrower of the securities fail financially. If the Fund is not able to recover securities lent, the Fund may sell the collateral and purchase a replacement investment in the market, incurring the risk that the value of the replacement security is greater than the value of the collateral. The Fund is also subject to all investment risks associated with the reinvestment of any cash collateral received, including, but not limited to, interest rate, credit and liquidity risk associated with such investments. The Fund had no securities on loan at December 31, 2013.
Taxes. The Fund's policy is to comply with the requirements of the Internal Revenue Code, as amended, which are applicable to regulated investment companies and to distribute all of its taxable income to its shareholders.
The Fund has reviewed the tax positions for the open tax years as of December 31, 2013 and has determined that no provision for income tax is required in the Fund's financial statements. The Fund's federal tax returns for the prior three fiscal years remain open subject to examination by the Internal Revenue Service.
Distribution of Income and Gains. Distributions from net investment income of the Fund, if any, are declared and distributed to shareholders annually. Net realized gains from investment transactions, in excess of available capital loss carryforwards, would be taxable to the Fund if not distributed and, therefore, will be distributed to shareholders at least annually. The Fund may also make additional distributions for tax purposes if necessary.
The timing and characterization of certain income and capital gain distributions are determined annually in accordance with federal tax regulations which may differ from accounting principles generally accepted in the United States of America. These differences primarily relate to income received from Real Estate Investment Trusts and certain securities sold at a loss. As a result, net investment income (loss) and net realized gain (loss) on investment transactions for a reporting period may differ significantly from distributions during such period. Accordingly, the Fund may periodically make reclassifications among certain of its capital accounts without impacting the net asset value of the Fund.
At December 31, 2013, the Fund's components of distributable earnings on a tax basis were as follows:
| Undistributed ordinary income* | $ | 1,850,167 | ||
| Undistributed net long-term capital gains | $ | 1,033,527 | ||
| Unrealized appreciation (depreciation) on investments | $ | 36,091,582 |
In addition, the tax character of distributions paid by the Fund is summarized as follows:
| Years Ended December 31, | ||||||||
| 2013 | 2012 | |||||||
| Distributions from ordinary income* | $ | 2,810,376 | $ | 2,714,086 | ||||
* For tax purposes, short-term capital gain distributions are considered ordinary income distributions.
Expenses. Expenses of the Trust arising in connection with a specific fund are allocated to that fund. Other Trust expenses which cannot be directly attributed to a fund are apportioned among the funds in the Trust based upon the relative net assets or other appropriate measures.
Contingencies. In the normal course of business, the Fund may enter into contracts with service providers that contain general indemnification clauses. The Fund's maximum exposure under these arrangements is unknown as this would involve future claims that may be made against the Fund that have not yet been made. However, based on experience, the Fund expects the risk of loss to be remote.
Real Estate Investment Trusts. The Fund periodically recharacterizes distributions received from a Real Estate Investment Trust ("REIT") investment based on information provided by the REIT into the following categories: ordinary income, long-term and short-term capital gains, and return of capital. If information is not available timely from a REIT, the recharacterization will be estimated for financial reporting purposes and a recharacterization will be made to the accounting records in the following year when such information becomes available. Distributions received from REITs in excess of income are recorded as either a reduction of cost of investments or realized gains. The Fund distinguishes between dividends received on a tax basis and a financial reporting basis and only distributions in excess of tax basis earnings and profits are reported in the financial statements as a return of capital.
Other. Investment transactions are accounted for on a trade date plus one basis for daily net asset value calculations. However, for financial reporting purposes, investment transactions are reported on trade date. Interest income is recorded on the accrual basis. Dividend income is recorded on the ex-dividend date net of foreign withholding taxes. Realized gains and losses from investment transactions are recorded on an identified cost basis. Proceeds from litigation payments, if any, are included in net realized gain (loss) from investments.
B. Purchases and Sales of Securities
During the year ended December 31, 2013, purchases and sales of investment transactions (excluding short-term investments) aggregated $276,451,414 and $331,010,986, respectively.
C. Related Parties
Management Agreement. Under the Investment Management Agreement with Deutsche Investment Management Americas Inc. ("DIMA" or the "Advisor"), an indirect, wholly owned subsidiary of Deutsche Bank AG, the Advisor directs the investments of the Fund in accordance with its investment objectives, policies and restrictions. The Advisor determines the securities, instruments and other contracts relating to investments to be purchased, sold or entered into by the Fund or delegates such responsibility to the Fund's subadvisor.
Prior to September 3, 2013, Dreman Value Management, L.L.C. ("DVM") served as subadvisor to the Fund. As a subadvisor, DVM made investment decisions and bought and sold securities for the Fund. DVM was paid by the Advisor for the services DVM provided to the Fund. Effective September 3, 2013, DVM no longer acts as subadvisor to the Fund and day-to-day portfolio management of the Fund transitioned to DIMA.
Pursuant to the Investment Management Agreement with the Advisor, the Fund pays a monthly management fee based on the Fund's average daily net assets, computed and accrued daily and payable monthly, at the following annual rates:
| First $250 million | .650 | % | ||
| Next $750 million | .620 | % | ||
| Next $1.5 billion | .600 | % | ||
| Next $2.5 billion | .580 | % | ||
| Next $2.5 billion | .550 | % | ||
| Next $2.5 billion | .540 | % | ||
| Next $2.5 billion | .530 | % | ||
| Over $12.5 billion | .520 | % |
Accordingly, for the year ended December 31, 2013, the fee pursuant to the Investment Management Agreement was equivalent to an annual effective rate of 0.65% of the Fund's average daily net assets.
For the period from January 1, 2013 through September 30, 2013, the Advisor had contractually agreed to waive its fee and/or reimburse certain operating expenses to the extent necessary to maintain the operating expenses (excluding certain expenses such as extraordinary expenses, taxes, brokerage and interest expense) of each class as follows:
| Class A | .84% |
| Class B | 1.20% |
Effective October 1, 2013 through September 30, 2014, the Advisor has contractually agreed to waive its fee and/or reimburse certain operating expenses to the extent necessary to maintain the operating expenses (excluding certain expenses such as extraordinary expenses, taxes, brokerage and interest expense) of each class as follows:
| Class A | .83% |
| Class B | 1.19% |
Administration Fee. Pursuant to an Administrative Services Agreement, DIMA provides most administrative services to the Fund. For all services provided under the Administrative Services Agreement, the Fund pays DIMA an annual fee ("Administration Fee") of 0.10% of the Fund's average daily net assets, computed and accrued daily and payable monthly. For the year ended December 31, 2013, the Administration Fee was $245,067, of which $21,360 is unpaid.
Service Provider Fees. DWS Investments Service Company ("DISC"), an affiliate of the Advisor, is the transfer agent, dividend-paying agent and shareholder service agent for the Fund. Pursuant to a sub-transfer agency agreement between DISC and DST Systems, Inc. ("DST"), DISC has delegated certain transfer agent, dividend-paying agent and shareholder service agent functions to DST. DISC compensates DST out of the shareholder servicing fee it receives from the Fund. For the year ended December 31, 2013, the amounts charged to the Fund by DISC were as follows:
| Service to Shareholders | Total Aggregated | Unpaid at December 31, 2013 | ||||||
| Class A | $ | 580 | $ | 98 | ||||
| Class B | 538 | 91 | ||||||
| $ | 1,118 | $ | 189 | |||||
Distribution Service Agreement. Under the Fund's Class B 12b-1 plans, DWS Investments Distributors, Inc. ("DIDI") received a fee ("Distribution Service Fee") of 0.25% of average daily net assets of Class B shares. For the year ended December 31, 2013, the Distribution Service Fee aggregated $46,270, of which $4,104 is unpaid.
Typesetting and Filing Service Fees. Under an agreement with DIMA, DIMA is compensated for providing typesetting and certain regulatory filing services to the Fund. For the year ended December 31, 2013, the amount charged to the Fund by DIMA included in the Statement of Operations under "reports to shareholders" aggregated $16,701, of which $4,147 is unpaid.
Trustees' Fees and Expenses. The Fund paid retainer fees to each Trustee not affiliated with the Advisor, plus specified amounts to the Board Chairperson and Vice Chairperson and to each committee Chairperson.
Affiliated Cash Management Vehicles. The Fund may invest uninvested cash balances in Central Cash Management Fund and DWS Variable NAV Money Fund, affiliated money market funds which are managed by the Advisor. Each affiliated money market fund seeks to provide a high level of current income consistent with liquidity and the preservation of capital. Each affiliated money market fund is managed in accordance with Rule 2a-7 under the Investment Company Act of 1940, which governs the quality, maturity, diversity and liquidity of instruments in which a money market fund may invest. Central Cash Management Fund seeks to maintain a stable net asset value, and DWS Variable NAV Money Fund maintains a floating net asset value. The Fund indirectly bears its proportionate share of the expenses of each affiliated money market fund in which it invests. Central Cash Management Fund does not pay the Advisor an investment management fee. To the extent that DWS Variable NAV Money Fund pays an investment management fee to the Advisor, the Advisor will waive an amount of the investment management fee payable to the Advisor by the Fund equal to the amount of the investment management fee payable on the Fund's assets invested in DWS Variable NAV Money Fund.
D. Ownership of the Fund
At December 31, 2013, three participating insurance companies were owners of record of 10% or more of the total outstanding Class A shares of the Fund, each owning 41%, 20% and 14%. Three participating insurance companies were owners of record of 10% or more of the total outstanding Class B shares of the Fund, each owning 41%, 12% and 10%.
E. Line of Credit
The Fund and other affiliated funds (the "Participants") share in a $375 million revolving credit facility provided by a syndication of banks. The Fund may borrow for temporary or emergency purposes, including the meeting of redemption requests that otherwise might require the untimely disposition of securities. The Participants are charged an annual commitment fee which is allocated based on net assets, among each of the Participants. Interest is calculated at a rate per annum equal to the sum of the Federal Funds Rate plus 1.25 percent plus if LIBOR exceeds the Federal Funds Rate the amount of such excess. The Fund may borrow up to a maximum of 33 percent of its net assets under the agreement. The Fund had no outstanding loans at December 31, 2013.
To the Board of Trustees of DWS Variable Series II and Shareholders of DWS Small Mid Cap Value VIP:
We have audited the accompanying statement of assets and liabilities, including the investment portfolio of DWS Small Mid Cap Value VIP (formerly, DWS Dreman Small Mid Cap Value VIP) (the "Fund") (one of the funds constituting DWS Variable Series II), as of December 31, 2013, and the related statement of operations for the year then ended, the statements of changes in net assets for each of the two years in the period then ended, and the financial highlights for each of the five years in the period then ended. These financial statements and financial highlights are the responsibility of the Fund's management. Our responsibility is to express an opinion on these financial statements and financial highlights based on our audits.
We conducted our audits in accordance with the standards of the Public Company Accounting Oversight Board (United States). Those standards require that we plan and perform the audit to obtain reasonable assurance about whether the financial statements and financial highlights are free of material misstatement. We were not engaged to perform an audit of the Fund's internal control over financial reporting. Our audits included consideration of internal control over financial reporting as a basis for designing audit procedures that are appropriate in the circumstances, but not for the purpose of expressing an opinion on the effectiveness of the Fund's internal control over financial reporting. Accordingly, we express no such opinion. An audit also includes examining, on a test basis, evidence supporting the amounts and disclosures in the financial statements and financial highlights, assessing the accounting principles used and significant estimates made by management, and evaluating the overall financial statement presentation. Our procedures included confirmation of securities owned as of December 31, 2013, by correspondence with the custodian and brokers. We believe that our audits provide a reasonable basis for our opinion.
In our opinion, the financial statements and financial highlights referred to above present fairly, in all material respects, the financial position of DWS Small Mid Cap Value VIP (formerly, DWS Dreman Small Mid Cap Value VIP) (one of the funds constituting DWS Variable Series II) at December 31, 2013, the results of its operations for the year then ended, the changes in its net assets for each of the two years in the period then ended, and the financial highlights for each of the five years in the period then ended, in conformity with U.S. generally accepted accounting principles.
| ||
Boston, Massachusetts February 14, 2014 |
As an investor of the Fund, you incur two types of costs: ongoing expenses and transaction costs. Ongoing expenses include management fees, distribution and service (12b-1) fees and other Fund expenses. Examples of transaction costs include contract charges and account maintenance fees, which are not shown in this section. The following tables are intended to help you understand your ongoing expenses (in dollars) of investing in the Fund and to help you compare these expenses with the ongoing expenses of investing in other mutual funds. The example in the table is based on an investment of $1,000 invested at the beginning of the six-month period and held for the entire period (July 1, 2013 to December 31, 2013).
The tables illustrate your Fund's expenses in two ways:
—Actual Fund Return. This helps you estimate the actual dollar amount of ongoing expenses (but not transaction costs) paid on a $1,000 investment in the Fund using the Fund's actual return during the period. To estimate the expenses you paid over the period, simply divide your account value by $1,000 (for example, an $8,600 account value divided by $1,000 = 8.6), then multiply the result by the number in the "Expenses Paid per $1,000" line under the share class you hold.
— Hypothetical 5% Fund Return. This helps you to compare your Fund's ongoing expenses (but not transaction costs) with those of other mutual funds using the Fund's actual expense ratio and a hypothetical rate of return of 5% per year before expenses. Examples using a 5% hypothetical Fund return may be found in the shareholder reports of other mutual funds. The hypothetical account values and expenses may not be used to estimate the actual ending account balance or expenses you paid for the period.
Please note that the expenses shown in these tables are meant to highlight your ongoing expenses only and do not reflect any transaction costs. The "Expenses Paid per $1,000" line of the tables is useful in comparing ongoing expenses only and will not help you determine the relative total expense of owning different funds. If these transaction costs had been included, your costs would have been higher.
Expenses and Value of a $1,000 Investment for the six months ended December 31, 2013 | ||||||||
| Actual Fund Return | Class A | Class B | ||||||
| Beginning Account Value 7/1/13 | $ | 1,000.00 | $ | 1,000.00 | ||||
| Ending Account Value 12/31/13 | $ | 1,181.20 | $ | 1,178.90 | ||||
| Expenses Paid per $1,000* | $ | 4.51 | $ | 6.43 | ||||
| Hypothetical 5% Fund Return | Class A | Class B | ||||||
| Beginning Account Value 7/1/13 | $ | 1,000.00 | $ | 1,000.00 | ||||
| Ending Account Value 12/31/13 | $ | 1,021.07 | $ | 1,019.31 | ||||
| Expenses Paid per $1,000* | $ | 4.18 | $ | 5.96 | ||||
* Expenses are equal to the Fund's annualized expense ratio for each share class, multiplied by the average account value over the period, multiplied by 184 (the number of days in the most recent six-month period), then divided by 365.
| Annualized Expense Ratios | Class A | Class B | ||
| DWS Variable Series II — DWS Small Mid Cap Value VIP | .82% | 1.17% |
For more information, please refer to the Fund's prospectus.
These tables do not reflect charges and fees ("contract charges") associated with the separate account that invests in the Fund or any variable life insurance policy or variable annuity contract for which the Fund is an investment option.
For an analysis of the fees associated with an investment in the fund or similar funds, please refer to the current and hypothetical expense calculators for Variable Insurance Products which can be found at dws-investments.com/EN/resources/calculators.jsp.
Please consult a tax advisor if you have questions about federal or state income tax laws, or on how to prepare your tax returns. If you have specific questions about your account, please contact your insurance provider.
Pursuant to Section 852 of the Internal Revenue Code, the Fund designates $ 1,137,000 as capital gain dividends for its year ended December 31, 2013.
For corporate shareholders, 45% of the ordinary dividends (i.e., income dividends plus short-term capital gains) paid during the Fund's fiscal year ended December 31, 2013, qualified for the dividends received deduction.
The Trust's policies and procedures for voting proxies for portfolio securities and information about how the Trust voted proxies related to its portfolio securities during the 12-month period ended June 30 are available on our Web site — dws-investments.com (click on "proxy voting" at the bottom of the page) — or on the SEC's Web site — sec.gov. To obtain a written copy of the Trust's policies and procedures without charge, upon request, call us toll free at (800) 728-3337.
The Board of Trustees approved the renewal of DWS Small Mid Cap Value VIP's investment management agreement (the "Agreement") with Deutsche Investment Management Americas Inc. ("DIMA") in September 2013.
In terms of the process that the Board followed prior to approving the Agreement, shareholders should know that:
— In September 2013, all but one of the Fund's Trustees were independent of DIMA and its affiliates.
— The Trustees met frequently during the past year to discuss fund matters and dedicated a substantial amount of time to contract review matters. Over the course of several months, the Board's Contract Committee, in coordination with the Board's Equity Oversight Committee, reviewed comprehensive materials received from DIMA, independent third parties and independent counsel. These materials included an analysis of the Fund's performance, fees and expenses, and profitability compiled by a fee consultant retained by the Fund's Independent Trustees (the "Fee Consultant"). The Board also received extensive information throughout the year regarding performance of the Fund.
— The Independent Trustees regularly meet privately with their independent counsel to discuss contract review and other matters. In addition, the Independent Trustees were also advised by the Fee Consultant in the course of their review of the Fund's contractual arrangements and considered a comprehensive report prepared by the Fee Consultant in connection with their deliberations.
— In connection with reviewing the Agreement, the Board also reviewed the terms of the Fund's Rule 12b-1 plan, distribution agreement, administrative services agreement, transfer agency agreement and other material service agreements.
— Based on its evaluation of the information provided, the Contract Committee presented its findings and recommendations to the Board. The Board then reviewed the Contract Committee's findings and recommendations.
In connection with the contract review process, the Contract Committee and the Board considered the factors discussed below, among others. The Board also considered that DIMA and its predecessors have managed the Fund since its inception, and the Board believes that a long-term relationship with a capable, conscientious advisor is in the best interests of the Fund. The Board considered, generally, that shareholders chose to invest or remain invested in the Fund knowing that DIMA managed the Fund, and that the Agreement was approved by the Fund's shareholders. DIMA is part of Deutsche Bank AG, a major global banking institution that is engaged in a wide range of financial services. The Board believes that there are advantages to being part of a global asset management business that offers a wide range of investing expertise and resources, including hundreds of portfolio managers and analysts with research capabilities in many countries throughout the world.
As part of the contract review process, the Board carefully considered the fees and expenses of each DWS fund overseen by the Board in light of the fund's performance. In many cases, this led to a negotiation with DIMA of lower expense caps as part of the 2012 and 2013 contract review processes than had previously been in place. As part of these negotiations, the Board indicated that it would consider relaxing these new lower caps in future years following sustained improvements in performance, among other considerations.
In June 2012, Deutsche Bank AG ("DB"), DIMA's parent company, announced that DB would combine its Asset Management (of which DIMA was a part) and Wealth Management divisions. DB has advised the Independent Trustees that the U.S. asset management business is a critical and integral part of DB, and that it has, and will continue to, reinvest a significant portion of the substantial savings it expects to realize by combining its Asset Management and Wealth Management divisions into the new Asset and Wealth Management ("AWM") division, including ongoing enhancements to its investment capabilities. DB also has confirmed its commitment to maintaining strong legal and compliance groups within the AWM division.
While shareholders may focus primarily on fund performance and fees, the Fund's Board considers these and many other factors, including the quality and integrity of DIMA's personnel and such other issues as back-office operations, fund valuations, and compliance policies and procedures.
Nature, Quality and Extent of Services. The Board considered the terms of the Agreement, including the scope of advisory services provided under the Agreement. The Board noted that, under the Agreement, DIMA provides portfolio management services to the Fund and that, pursuant to a separate administrative services agreement, DIMA provides administrative services to the Fund. The Board considered the experience and skills of senior management and investment personnel, the resources made available to such personnel, the ability of DIMA to attract and retain high-quality personnel, and the organizational depth and stability of DIMA. The Board reviewed the Fund's performance over short-term and long-term periods and compared those returns to various agreed-upon performance measures, including market indices and a peer universe compiled by the Fee Consultant using information supplied by Morningstar Direct ("Morningstar"), an independent fund data service. The Board also noted that it has put into place a process of identifying "Focus Funds" (e.g., funds performing poorly relative to their benchmark or a peer universe compiled by an independent fund data service), and receives more frequent reporting and information from DIMA regarding such funds, along with DIMA's remedial plans to address underperformance. The Board believes this process is an effective manner of identifying and addressing underperforming funds. Based on the information provided, the Board noted that for the one-, three- and five-year periods ended December 31, 2012, the Fund's performance (Class A shares) was in the 4th quartile, 4th quartile and 3rd quartile, respectively, of the applicable Morningstar universe (the 1st quartile being the best performers and the 4th quartile being the worst performers). The Board also observed that the Fund has underperformed its benchmark in the one-, three- and five-year periods ended December 31, 2012. The Board noted the disappointing investment performance of the Fund in recent periods and continued to discuss with senior management of DIMA the factors contributing to such underperformance and actions being taken to improve performance. The Board recognized that DIMA has made changes to its investment personnel and processes in recent years in an effort to enhance its investment platform and improve long-term performance across the DWS fund complex.
Fees and Expenses. The Board considered the Fund's investment management fee schedule, operating expenses and total expense ratios, and comparative information provided by Lipper Inc. ("Lipper") and the Fee Consultant regarding investment management fee rates paid to other investment advisors by similar funds (1st quartile being the most favorable and 4th quartile being the least favorable). With respect to management fees paid to other investment advisors by similar funds, the Board noted that the contractual fee rates paid by the Fund, which include a 0.10% fee paid to DIMA under the Fund's administrative services agreement, were lower than the median (1st quartile) of the applicable Lipper peer group (based on Lipper data provided as of December 31, 2012). The Board noted that the Fund's Class A shares total (net) operating expenses were expected to be lower than the median (2nd quartile) of the applicable Lipper expense universe (based on Lipper data provided as of December 31, 2012, and analyzing Lipper expense universe Class A (net) expenses less any applicable 12b-1 fees) ("Lipper Universe Expenses"). The Board also reviewed data comparing each share class's total (net) operating expenses to the applicable Lipper Universe Expenses. The Board considered the Fund's management fee rate as compared to fees charged by DIMA to a comparable fund and considered differences between the Fund and the comparable fund. The Board also considered how the Fund's total (net) operating expenses compared to the total (net) operating expenses of a more customized peer group selected by Lipper (based on such factors as asset size). The Board also noted that the expense limitations agreed to by DIMA helped to ensure that the Fund's total (net) operating expenses would remain competitive.
The information considered by the Board as part of its review of management fees included information regarding fees charged by DIMA and its affiliates to similar institutional accounts and to similar funds offered primarily to European investors ("DWS Europe funds"), in each case as applicable. The Board observed that advisory fee rates for institutional accounts generally were lower than the management fees charged by similarly managed DWS U.S. mutual funds ("DWS Funds"), but also took note of the differences in services provided to DWS Funds as compared to institutional accounts. In the case of DWS Europe funds, the Board observed that fee rates for DWS Europe funds generally were higher than for similarly managed DWS Funds, but noted that differences in the types of services provided to DWS Funds relative to DWS Europe funds made it difficult to compare such fees.
On the basis of the information provided, the Board concluded that management fees were reasonable and appropriate in light of the nature, quality and extent of services provided by DIMA.
Profitability. The Board reviewed detailed information regarding revenues received by DIMA under the Agreement. The Board considered the estimated costs and pre-tax profits realized by DIMA from advising the DWS Funds, as well as estimates of the pre-tax profits attributable to managing the Fund in particular. The Board also received information regarding the estimated enterprise-wide profitability of DWS and its affiliates with respect to all fund services in totality and by fund. The Board and the Fee Consultant reviewed DIMA's methodology in allocating its costs to the management of the Fund. Based on the information provided, the Board concluded that the pre-tax profits realized by DIMA in connection with the management of the Fund were not unreasonable. The Board also reviewed information regarding the profitability of certain similar investment management firms. The Board noted that while information regarding the profitability of such firms is limited (and in some cases is not necessarily prepared on a comparable basis), DIMA and its affiliates' overall profitability with respect to the DWS fund complex (after taking into account distribution and other services provided to the funds by DIMA and its affiliates) was lower than the overall profitability levels of many comparable firms for which such data was available.
Economies of Scale. The Board considered whether there are economies of scale with respect to the management of the Fund and whether the Fund benefits from any economies of scale. The Board noted that the Fund's management fee schedule includes fee breakpoints. The Board concluded that the Fund's fee schedule represents an appropriate sharing between the Fund and DIMA of such economies of scale as may exist in the management of the Fund at current asset levels.
Other Benefits to DIMA and Its Affiliates. The Board also considered the character and amount of other incidental benefits received by DIMA and its affiliates, including any fees received by DIMA for administrative services provided to the Fund and any fees received by an affiliate of DIMA for distribution services. The Board also considered benefits to DIMA related to brokerage and soft-dollar allocations, including allocating brokerage to pay for research generated by parties other than the executing broker dealers, which pertain primarily to funds investing in equity securities, along with the incidental public relations benefits to DIMA related to DWS Funds advertising and cross-selling opportunities among DIMA products and services. The Board concluded that management fees were reasonable in light of these fallout benefits.
Compliance. The Board considered the significant attention and resources dedicated by DIMA to documenting and enhancing its compliance processes in recent years. The Board noted in particular (i) the experience and seniority of both DIMA's chief compliance officer and the Fund's chief compliance officer; (ii) the large number of DIMA compliance personnel; and (iii) the substantial commitment of resources by DIMA and its affiliates to compliance matters.
Based on all of the information considered and the conclusions reached, the Board unanimously determined that the continuation of the Agreement is in the best interests of the Fund. In making this determination, the Board did not give particular weight to any single factor identified above. The Board considered these factors over the course of numerous meetings, certain of which were in executive session with only the Independent Trustees and their independent counsel present. It is possible that individual Trustees may have weighed these factors differently in reaching their individual decisions to approve the continuation of the Agreement.
The following table presents certain information regarding the Board Members and Officers of the fund. Each Board Member's year of birth is set forth in parentheses after his or her name. Unless otherwise noted, (i) each Board Member has engaged in the principal occupation(s) noted in the table for at least the most recent five years, although not necessarily in the same capacity; and (ii) the address of each Independent Board Member is c/o Kenneth C. Froewiss, Chairman, DWS Mutual Funds, P.O. Box 78, Short Hills, NJ 07078. Except as otherwise noted below, the term of office for each Board Member is until the election and qualification of a successor, or until such Board Member sooner dies, resigns, is removed or as otherwise provided in the governing documents of the fund. Because the fund does not hold an annual meeting of shareholders, each Board Member will hold office for an indeterminate period. The Board Members may also serve in similar capacities with other funds in the fund complex.
| Independent Board Members | ||||
Name, Year of Birth, Position with the Fund and Length of Time Served1 | Business Experience and Directorships During the Past Five Years | Number of Funds in DWS Fund Complex Overseen | Other Directorships Held by Board Member | |
Kenneth C. Froewiss (1945) Chairperson since 2013, and Board Member since 2001 | Adjunct Professor of Finance, NYU Stern School of Business (September 2009–present; Clinical Professor from 1997–September 2009); Member, Finance Committee, Association for Asian Studies (2002–present); Director, Mitsui Sumitomo Insurance Group (US) (2004–present); prior thereto, Managing Director, J.P. Morgan (investment banking firm) (until 1996) | 103 | — | |
William McClayton (1944) Vice Chairperson since 2013, and Board Member since 2004 | Private equity investor (since October 2009); previously, Managing Director, Diamond Management & Technology Consultants, Inc. (global consulting firm) (2001–2009); Directorship: Board of Managers, YMCA of Metropolitan Chicago; formerly: Senior Partner, Arthur Andersen LLP (accounting) (1966–2001); Trustee, Ravinia Festival | 103 | — | |
John W. Ballantine (1946) Board Member since 1999 | Retired; formerly, Executive Vice President and Chief Risk Management Officer, First Chicago NBD Corporation/The First National Bank of Chicago (1996–1998); Executive Vice President and Head of International Banking (1995–1996); former Directorships: Stockwell Capital Investments PLC (private equity); First Oak Brook Bancshares, Inc. and Oak Brook Bank; Prisma Energy International | 103 | Chairman of the Board, Healthways, Inc.2 (provider of disease and care management services) (2003– present); Portland General Electric2 (utility company) (2003– present) | |
Henry P. Becton, Jr. (1943) Board Member since 1990 | Vice Chair and former President, WGBH Educational Foundation. Directorships: Public Radio International; Public Radio Exchange (PRX); North Bennett Street School (Boston); former Directorships: The PBS Foundation; Association of Public Television Stations; Boston Museum of Science; American Public Television; Concord Academy; New England Aquarium; Mass. Corporation for Educational Telecommunications; Committee for Economic Development; Public Broadcasting Service; Connecticut College | 103 | Lead Director, Becton Dickinson and Company2 (medical technology company); Lead Director, Belo Corporation2 (media company) | |
Dawn-Marie Driscoll (1946) Board Member since 1987 | President, Driscoll Associates (consulting firm); Emeritus Executive Fellow, Center for Business Ethics, Bentley University; formerly, Partner, Palmer & Dodge (1988–1990); Vice President of Corporate Affairs and General Counsel, Filene's (1978–1988). Directorships: Director of ICI Mutual Insurance Company (since 2007); Advisory Board, Center for Business Ethics, Bentley University; Chairman of the Board of Trustees, Southwest Florida Community Foundation (charitable organization); former Directorships: Sun Capital Advisers Trust (mutual funds) (2007–2012), Investment Company Institute (audit, executive, nominating committees) and Independent Directors Council (governance, executive committees) | 103 | — | |
Keith R. Fox, CFA (1954) Board Member since 1996 | Managing General Partner, Exeter Capital Partners (a series of private investment funds) (since 1986). Directorships: Progressive International Corporation (kitchen goods importer and distributor); The Kennel Shop (retailer); former Chairman, National Association of Small Business Investment Companies; former Directorships: BoxTop Media Inc. (advertising); Sun Capital Advisers Trust (mutual funds) (2011–2012) | 103 | — | |
Paul K. Freeman (1950) Board Member since 1993 | Consultant, World Bank/Inter-American Development Bank; Executive and Governing Council of the Independent Directors Council (Chairman of Education Committee); formerly: Project Leader, International Institute for Applied Systems Analysis (1998–2001); Chief Executive Officer, The Eric Group, Inc. (environmental insurance) (1986–1998); Directorships: Denver Zoo Foundation (December 2012–present); former Directorships: Prisma Energy International | 103 | — | |
Richard J. Herring (1946) Board Member since 1990 | Jacob Safra Professor of International Banking and Professor, Finance Department, The Wharton School, University of Pennsylvania (since July 1972); Co-Director, Wharton Financial Institutions Center (since July 2000); Co-Chair, U.S. Shadow Financial Regulatory Committee; Executive Director, Financial Economists Roundtable; formerly: Vice Dean and Director, Wharton Undergraduate Division (July 1995–June 2000); Director, Lauder Institute of International Management Studies (July 2000–June 2006) | 103 | Director, Japan Equity Fund, Inc. (since September 2007), Thai Capital Fund, Inc. (since 2007), Singapore Fund, Inc. (since September 2007), Independent Director of Barclays Bank Delaware (since September 2010) | |
Rebecca W. Rimel (1951) Board Member since 1995 | President and Chief Executive Officer, The Pew Charitable Trusts (charitable organization) (1994 to present); formerly: Executive Vice President, The Glenmede Trust Company (investment trust and wealth management) (1983–2004); Board Member, Investor Education (charitable organization) (2004–2005); Trustee, Executive Committee, Philadelphia Chamber of Commerce (2001–2007); Director, Viasys Health Care2 (January 2007–June 2007); Trustee, Thomas Jefferson Foundation (charitable organization) (1994–2012) | 103 | Director, Becton Dickinson and Company2 (medical technology company) (2012– present); Director, CardioNet, Inc.2 (health care) (2009– present) | |
William N. Searcy, Jr. (1946) Board Member since 1993 | Private investor since October 2003; formerly: Pension & Savings Trust Officer, Sprint Corporation2 (telecommunications) (November 1989–September 2003); Trustee, Sun Capital Advisers Trust (mutual funds) (1998–2012) | 103 | — | |
Jean Gleason Stromberg (1943) Board Member since 1997 | Retired. Formerly, Consultant (1997–2001); Director, Financial Markets U.S. Government Accountability Office (1996–1997); Partner, Fulbright & Jaworski, L.L.P. (law firm) (1978–1996). Directorships: The William and Flora Hewlett Foundation; former Directorships: Service Source, Inc., Mutual Fund Directors Forum (2002–2004), American Bar Retirement Association (funding vehicle for retirement plans) (1987–1990 and 1994–1996) | 103 | — | |
Robert H. Wadsworth (1940) Board Member since 1999 | President, Robert H. Wadsworth & Associates, Inc. (consulting firm) (1983 to present); Director, National Horizon, Inc. (non-profit organization); Director and Treasurer, The Phoenix Boys Choir Association | 106 | — | |
Officers4 | ||
Name, Year of Birth, Position with the Fund and Length of Time Served5 | Business Experience and Directorships During the Past Five Years | |
Brian E. Binder8,9 (1972) President and Chief Executive Officer, 2013–present | Managing Director3 and Head of Fund Administration, Deutsche Asset & Wealth Management (2013–present); formerly: Head of Business Management and Consulting at Invesco, Ltd. (2010–2012); Chief Administrative Officer, Van Kampen Funds Inc. (2008–2010); and Chief Administrative Officer, Morgan Stanley Investment Management Americas Distribution (2003–2008) | |
John Millette7 (1962) Vice President and Secretary, 1999–present | Director,3 Deutsche Asset & Wealth Management | |
Paul H. Schubert6 (1963) Chief Financial Officer, 2004–present Treasurer, 2005–present | Managing Director,3 Deutsche Asset & Wealth Management (since July 2004); formerly: Executive Director, Head of Mutual Fund Services and Treasurer for UBS Family of Funds (1998–2004); Vice President and Director of Mutual Fund Finance at UBS Global Asset Management (1994–1998) | |
Caroline Pearson7 (1962) Chief Legal Officer, 2010–present | Managing Director,3 Deutsche Asset & Wealth Management; formerly: Assistant Secretary for DWS family of funds (1997–2010) | |
Melinda Morrow6 (1970) Vice President, 2012–present | Director,3 Deutsche Asset & Wealth Management | |
Hepsen Uzcan7 (1974) Assistant Secretary, 2013–present | Vice President, Deutsche Asset & Wealth Management | |
Paul Antosca7 (1957) Assistant Treasurer, 2007–present | Director,3 Deutsche Asset & Wealth Management | |
Jack Clark7 (1967) Assistant Treasurer, 2007–present | Director,3 Deutsche Asset & Wealth Management | |
Diane Kenneally7 (1966) Assistant Treasurer, 2007–present | Director,3 Deutsche Asset & Wealth Management | |
John Caruso6 (1965) Anti-Money Laundering Compliance Officer, 2010–present | Managing Director,3 Deutsche Asset & Wealth Management | |
Robert Kloby6 (1962) Chief Compliance Officer, 2006–present | Managing Director,3 Deutsche Asset & Wealth Management | |
1 The length of time served represents the year in which the Board Member joined the board of one or more DWS funds currently overseen by the Board.
2 A publicly held company with securities registered pursuant to Section 12 of the Securities Exchange Act of 1934.
3 Executive title, not a board directorship.
4 As a result of their respective positions held with the Advisor, these individuals are considered "interested persons" of the Advisor within the meaning of the 1940 Act. Interested persons receive no compensation from the fund.
5 The length of time served represents the year in which the officer was first elected in such capacity for one or more DWS funds.
6 Address: 60 Wall Street, New York, NY 10005.
7 Address: One Beacon Street, Boston, MA 02108.
8 Address: 222 South Riverside Plaza, Chicago, IL 60606.
9 Effective as of December 1, 2013.
The fund's Statement of Additional Information ("SAI") includes additional information about the Board Members. The SAI is available, without charge, upon request. If you would like to request a copy of the SAI, you may do so by calling the following toll-free number: (800) 728-3337.
DWS Investments Distributors, Inc.
222 South Riverside Plaza
Chicago, IL 60606
(800) 621-1148
VS2SMCV-2 (R-025829-3 2/14)
December 31, 2013
Annual Report
DWS Variable Series II
DWS Unconstrained Income VIP
Contents
3 Performance Summary 4 Management Summary 5 Portfolio Summary 7 Investment Portfolio 24 Statement of Assets and Liabilities 25 Statement of Operations 26 Statement of Changes in Net Assets 27 Financial Highlights 28 Notes to Financial Statements 37 Report of Independent Registered Public Accounting Firm 38 Information About Your Fund's Expenses 39 Tax Information 40 Proxy Voting 41 Advisory Agreement Board Considerations and Fee Evaluation 44 Board Members and Officers |
This report must be preceded or accompanied by a prospectus. To obtain an additional prospectus or summary prospectus, if available, call (800) 728-3337 or your financial representative. We advise you to consider the Fund's objectives, risks, charges and expenses carefully before investing. The summary prospectus and prospectus contain this and other important information about the Fund. Please read the prospectus carefully before you invest.
Bond investments are subject to interest-rate and credit risks. When interest rates rise, bond prices generally fall. Credit risk refers to the ability of an issuer to make timely payments of principal and interest. Investments in lower-quality ("junk bonds") and non-rated securities present greater risk of loss than investments in higher-quality securities. Investing in derivatives entails special risks relating to liquidity, leverage and credit that may reduce returns and/or increase volatility. Investing in foreign securities, particularly those of emerging markets, presents certain risks, such as currency fluctuations, political and economic changes, and market risks. The Fund may lend securities to approved institutions. See the prospectus for details.
Deutsche Asset & Wealth Management represents the asset management and wealth management activities conducted by Deutsche Bank AG or any of its subsidiaries, including the Advisor and DWS Investments Distributors, Inc.
NOT FDIC/NCUA INSURED NO BANK GUARANTEE MAY LOSE VALUE NOT A DEPOSIT
NOT INSURED BY ANY FEDERAL GOVERNMENT AGENCY
Fund performance shown is historical, assumes reinvestment of all dividend and capital gain distributions and does not guarantee future results. Investment return and principal value fluctuate with changing market conditions so that, when redeemed, shares may be worth more or less than their original cost. Current performance may be lower or higher than the performance data quoted. Please contact your participating insurance company for the Fund's most recent month-end performance. Performance doesn't reflect charges and fees ("contract charges") associated with the separate account that invests in the Fund or any variable life insurance policy or variable annuity contract for which the Fund is an investment option. These charges and fees will reduce returns.
The gross expense ratio of the Fund, as stated in the fee table of the prospectus dated May 1, 2013 is 0.99% for Class A shares and may differ from the expense ratio disclosed in the Financial Highlights table in this report.
| Growth of an Assumed $10,000 Investment in DWS Unconstrained Income VIP | ||
 | The Barclays U.S. Universal Index represents the union of the U.S. Aggregate Index, the U.S. High-Yield Corporate Index, the 144A Index, the Eurodollar Index, the Emerging Markets Index and the non-ERISA portion of the CMBS Index. On May 1, 2013, the Barclays U.S. Universal Index replaced the Barclays U.S. Aggregate Bond Index as the fund's primary benchmark index because the Advisor believes that it more accurately reflects the fund's investment strategy. The Barclays U.S. Aggregate Bond Index is an unmanaged index representing domestic taxable investment-grade bonds, with index components for government and corporate securities, mortgage pass-through securities, and asset-backed securities with an average maturity of one year or more. Index returns do not reflect any fees or expenses and it is not possible to invest directly into an index. | |
 | ||
| Yearly periods ended December 31 | ||
| Comparative Results | |||||||||||||||||
| DWS Unconstrained Income VIP | 1-Year | 3-Year | 5-Year | 10-Year | |||||||||||||
| Class A | Growth of $10,000 | $ | 9,896 | $ | 11,783 | $ | 15,915 | $ | 18,757 | ||||||||
| Average annual total return | –1.04 | % | 5.62 | % | 9.74 | % | 6.49 | % | |||||||||
| Barclays U.S. Universal Index | Growth of $10,000 | $ | 9,865 | $ | 11,182 | $ | 13,014 | $ | 16,060 | ||||||||
| Average annual total return | –1.35 | % | 3.79 | % | 5.41 | % | 4.85 | % | |||||||||
| Barclays U.S. Aggregate Bond Index | Growth of $10,000 | $ | 9,798 | $ | 11,011 | $ | 12,427 | $ | 15,599 | ||||||||
| Average annual total return | –2.02 | % | 3.26 | % | 4.44 | % | 4.55 | % | |||||||||
The growth of $10,000 is cumulative.
The Class A shares of the Fund returned –1.04% (unadjusted for contract charges) during 2013, outperforming the –1.35% return of the Barclays U.S. Universal Index. The Fund has outpaced the benchmark in the three-, five- and 10-year periods ended December 31, 2013.1
The past year was a rather volatile time for the global bond market, as uncertainty regarding the timing of the U.S. Federal Reserve Board's (the Fed's) "tapering" of its quantitative easing policy led to weak performance for the most rate-sensitive segments of the market. We generated outperformance in this potentially challenging environment via three aspects of our positioning.
First, our substantial allocation to high-yield bonds provided the Fund with exposure to the best-performing segment of the bond market. In addition, the Fund's high-yield portfolio outperformed the broader high-yield market thanks to our strong individual security selection. We also held an allocation to senior loans, which feature low duration (interest-rate sensitivity) and floating rates — both of which contributed to their outperformance at a time of rising Treasury yields.2
Second, our holdings performed better than the overall market in the Fund's domestic investment-grade segment. Here, we added value by emphasizing corporate bonds and commercial mortgage-backed securities over U.S. Treasuries and other market segments sensitive to talk of Fed tapering. The third factor boosting performance was our positioning within the Fund's emerging-markets segment. During a time in which emerging-markets bonds suffered a negative absolute return, we added value by holding an underweight in longer-term government debt, which lagged, in favor of emerging-markets corporate bonds, which outperformed.
The most important detractor from performance was that we came into the June 2013 bond market sell-off with an above-benchmark duration, resulting in underperformance for the Fund when yields rose during the second quarter. The Fund closed the year with a duration that was about equal with that of the benchmark.
Looking ahead, we expect that strengthening economic growth will continue to pressure long-term Treasuries but provide support for the investment-grade corporate and high-yield sectors. We remain focused on adding value through individual security selection, portfolio allocation and our "go anywhere" strategy.
Gary Russell, CFA
William Chepolis, CFA
John D. Ryan
Philip G. Condon
Darwei Kung
Portfolio Managers
The views expressed reflect those of the portfolio management team only through the end of the period of the report as stated on the cover. The management team's views are subject to change at any time based on market and other conditions and should not be construed as a recommendation. Past performance is no guarantee of future results. Current and future portfolio holdings are subject to risk.
1 The Barclays U.S. Universal Index represents the union of the U.S. Aggregate Index, the U.S. High-Yield Corporate Index, the 144A Index, the Eurodollar Index, the Emerging Markets Index and the non-ERISA portion of the CMBS Index. Index returns do not reflect fees or expenses and it is not possible to invest directly in an index.
2 Duration, which is expressed in years, measures the sensitivity of the price of a bond or bond fund to a change in interest rates.
Asset Allocation (As a % of Investment Portfolio excluding Securities Lending Collateral) | 12/31/13 | 12/31/12 |
| Corporate Bonds | 60% | 56% |
| Government & Agency Obligations | 19% | 15% |
| Loan Participations and Assignments | 5% | 8% |
| Collateralized Mortgage Obligations | 5% | 4% |
| Commercial Mortgage-Backed Securities | 3% | 3% |
| Mortgage-Backed Securities Pass-Throughs | 2% | 6% |
| Cash Equivalents | 2% | 6% |
| Municipal Bonds and Notes | 2% | 1% |
| Exchange-Traded Fund | 1% | 0% |
| Asset-Backed | 1% | 1% |
| 100% | 100% |
Quality (Excludes Cash Equivalents and Securities Lending Collateral) | 12/31/13 | 12/31/12 |
| AAA | 20% | 21% |
| AA | 3% | 2% |
| A | 3% | 7% |
| BBB | 18% | 23% |
| BB | 25% | 18% |
| B | 19% | 24% |
| CCC | 4% | 2% |
| Not Rated | 8% | 3% |
| 100% | 100% |
| Interest Rate Sensitivity | 12/31/13 | 12/31/12 |
| Effective Maturity | 6.6 years | 7.4 years |
| Effective Duration | 4.3 years | 5.2 years |
The quality ratings represent the higher of Moody's Investors Service, Inc. ("Moody's") or Standard & Poor's Corporation ("S&P") credit ratings. The ratings of Moody's and S&P represent their opinions as to the quality of the securities they rate. Credit quality measures a bond issuer's ability to repay interest and principal in a timely manner. Ratings are relative and subjective and are not absolute standards of quality. Credit quality does not remove market risk and is subject to change.
Effective maturity is the weighted average of the maturity date of bonds held by the Fund taking into consideration any available maturity shortening features.
Effective duration is an approximate measure of the Fund's sensitivity to interest rate changes taking into consideration any maturity shortening features.
Portfolio holdings and characteristics are subject to change.
For more complete details about the Fund's investment portfolio, see page 7.
Following the Fund's fiscal first and third quarter-end, a complete portfolio holdings listing is filed with the SEC on Form N-Q. The form will be available on the SEC's Web site at sec.gov, and it also may be reviewed and copied at the SEC's Public Reference Room in Washington, D.C. Information on the operation of the SEC's Public Reference Room may be obtained by calling (800) SEC-0330. The Fund's portfolio holdings are also posted on dws-investments.com from time to time. Please see the Fund's current prospectus for more information.
| Principal Amount ($)(a) | Value ($) | ||||||||
| Corporate Bonds 59.5% | |||||||||
| Consumer Discretionary 8.0% | |||||||||
| 21st Century Fox America, Inc., 144A, 4.0%, 10/1/2023 | 30,000 | 29,651 | |||||||
| AMC Networks, Inc., 7.75%, 7/15/2021 | 15,000 | 16,875 | |||||||
| AmeriGas Finance LLC: | |||||||||
| 6.75%, 5/20/2020 | 70,000 | 76,475 | |||||||
| 7.0%, 5/20/2022 | 60,000 | 65,100 | |||||||
| APX Group, Inc., 144A, 8.75%, 12/1/2020 | 5,000 | 5,088 | |||||||
| Asbury Automotive Group, Inc., 8.375%, 11/15/2020 | 85,000 | 95,519 | |||||||
| Ashtead Capital, Inc., 144A, 6.5%, 7/15/2022 | 45,000 | 47,981 | |||||||
| Ashton Woods U.S.A. LLC, 144A, 6.875%, 2/15/2021 | 50,000 | 49,375 | |||||||
| Avis Budget Car Rental LLC: | |||||||||
| 5.5%, 4/1/2023 | 30,000 | 29,063 | |||||||
| 8.25%, 1/15/2019 | 95,000 | 103,550 | |||||||
| BC Mountain LLC, 144A, 7.0%, 2/1/2021 | 30,000 | 30,300 | |||||||
| Block Communications, Inc., 144A, 7.25%, 2/1/2020 | 65,000 | 68,900 | |||||||
| Boyd Gaming Corp., 9.0%, 7/1/2020 (b) | 25,000 | 27,375 | |||||||
| British Sky Broadcasting Group PLC, 144A, 3.125%, 11/26/2022 | 90,000 | 83,793 | |||||||
| Cablevision Systems Corp., 8.0%, 4/15/2020 (b) | 10,000 | 11,175 | |||||||
| Caesar's Entertainment Operating Co., Inc., 8.5%, 2/15/2020 | 120,000 | 115,500 | |||||||
| CCO Holdings LLC: | |||||||||
| 6.5%, 4/30/2021 | 120,000 | 123,300 | |||||||
| 6.625%, 1/31/2022 | 70,000 | 72,100 | |||||||
| 7.0%, 1/15/2019 (b) | 20,000 | 21,075 | |||||||
| 7.25%, 10/30/2017 | 90,000 | 95,287 | |||||||
| 7.375%, 6/1/2020 | 10,000 | 10,825 | |||||||
| 8.125%, 4/30/2020 | 25,000 | 27,125 | |||||||
| CDR DB Sub, Inc., 144A, 7.75%, 10/15/2020 | 35,000 | 34,825 | |||||||
| Cequel Communications Holdings I LLC: | |||||||||
| 144A, 5.125%, 12/15/2021 | 50,000 | 46,875 | |||||||
| 144A, 6.375%, 9/15/2020 | 160,000 | 164,000 | |||||||
| Chester Downs & Marina LLC, 144A, 9.25%, 2/1/2020 | 25,000 | 25,063 | |||||||
| Clear Channel Communications, Inc., 11.25%, 3/1/2021 | 40,000 | 43,000 | |||||||
| Clear Channel Worldwide Holdings, Inc.: | |||||||||
| Series A, 6.5%, 11/15/2022 | 15,000 | 15,206 | |||||||
| Series A, 7.625%, 3/15/2020 | 20,000 | 20,800 | |||||||
| Series B, 7.625%, 3/15/2020 | 185,000 | 194,481 | |||||||
| Cogeco Cable, Inc., 144A, 4.875%, 5/1/2020 | 5,000 | 4,825 | |||||||
| Columbus International, Inc., 144A, 11.5%, 11/20/2014 | 100,000 | 107,750 | |||||||
| Cox Communications, Inc., 144A, 3.25%, 12/15/2022 | 60,000 | 54,293 | |||||||
| Crown Media Holdings, Inc., 10.5%, 7/15/2019 | 55,000 | 62,425 | |||||||
| Cumulus Media Holdings, Inc., 7.75%, 5/1/2019 | 65,000 | 68,575 | |||||||
| Delphi Corp., 5.0%, 2/15/2023 | 40,000 | 41,150 | |||||||
| Principal Amount ($)(a) | Value ($) | ||||||||
| DISH DBS Corp.: | |||||||||
| 4.25%, 4/1/2018 | 40,000 | 40,800 | |||||||
| 5.0%, 3/15/2023 | 50,000 | 46,625 | |||||||
| 6.625%, 10/1/2014 | 65,000 | 67,600 | |||||||
| 6.75%, 6/1/2021 | 10,000 | 10,600 | |||||||
| 7.125%, 2/1/2016 | 155,000 | 171,662 | |||||||
| Ford Motor Credit Co., LLC, 3.984%, 6/15/2016 | 145,000 | 154,193 | |||||||
| General Motors Financial Co., Inc., 144A, 3.25%, 5/15/2018 | 15,000 | 15,000 | |||||||
| GLP Capital LP, 144A, 4.375%, 11/1/2018 | 15,000 | 15,338 | |||||||
| Griffey Intermediate, Inc., 144A, 7.0%, 10/15/2020 | 65,000 | 51,512 | |||||||
| Harron Communications LP, 144A, 9.125%, 4/1/2020 | 60,000 | 66,450 | |||||||
| Hertz Corp.: | |||||||||
| 4.25%, 4/1/2018 | 25,000 | 25,625 | |||||||
| 6.75%, 4/15/2019 | 50,000 | 53,875 | |||||||
| 7.5%, 10/15/2018 | 155,000 | 167,206 | |||||||
| Hertz Holdings Netherlands BV, 144A, 4.375%, 1/15/2019 | EUR | 105,000 | 144,629 | ||||||
| Hot Topic, Inc., 144A, 9.25%, 6/15/2021 | 20,000 | 20,950 | |||||||
| Jo-Ann Stores Holdings, Inc., 144A, 9.75%, 10/15/2019 (PIK) | 70,000 | 73,237 | |||||||
| L Brands, Inc., 7.0%, 5/1/2020 | 20,000 | 22,450 | |||||||
| Libbey Glass, Inc., 6.875%, 5/15/2020 | 18,000 | 19,440 | |||||||
| Live Nation Entertainment, Inc., 144A, 7.0%, 9/1/2020 | 50,000 | 54,250 | |||||||
| Marriott International, Inc., 3.375%, 10/15/2020 | 110,000 | 108,934 | |||||||
| Mattel, Inc., 5.45%, 11/1/2041 | 141,400 | 141,290 | |||||||
| MDC Partners, Inc., 144A, 6.75%, 4/1/2020 | 30,000 | 31,387 | |||||||
| Mediacom Broadband LLC, 6.375%, 4/1/2023 | 65,000 | 66,462 | |||||||
| Mediacom LLC, 7.25%, 2/15/2022 | 20,000 | 21,200 | |||||||
| MGM Resorts International: | |||||||||
| 6.75%, 10/1/2020 (b) | 25,000 | 26,750 | |||||||
| 8.625%, 2/1/2019 | 140,000 | 164,150 | |||||||
| Midcontinent Communications & Midcontinent Finance Corp., 144A, 6.25%, 8/1/2021 | 30,000 | 30,225 | |||||||
| Myriad International Holdings BV, 144A, 6.0%, 7/18/2020 | 200,000 | 214,000 | |||||||
| PNK Finance Corp., 144A, 6.375%, 8/1/2021 | 35,000 | 35,787 | |||||||
| Quebecor Media, Inc., 5.75%, 1/15/2023 | 30,000 | 29,025 | |||||||
| RCI Banque SA, 144A, 3.5%, 4/3/2018 | 200,000 | 203,827 | |||||||
| Regal Entertainment Group, 9.125%, 8/15/2018 | 21,000 | 22,785 | |||||||
| Rent-A-Center, Inc., 4.75%, 5/1/2021 | 20,000 | 18,775 | |||||||
| Sabre Holdings Corp., 8.35%, 3/15/2016 | 55,000 | 61,325 | |||||||
| Principal Amount ($)(a) | Value ($) | ||||||||
| Seminole Hard Rock Entertainment, Inc., 144A, 5.875%, 5/15/2021 | 15,000 | 14,738 | |||||||
| Seminole Tribe of Florida, Inc., 144A, 7.804%, 10/1/2020 | 70,000 | 76,650 | |||||||
| Serta Simmons Holdings LLC, 144A, 8.125%, 10/1/2020 (b) | 35,000 | 38,062 | |||||||
| Sirius XM Holdings, Inc., 144A, 5.875%, 10/1/2020 | 30,000 | 30,600 | |||||||
| SIWF Merger Sub, Inc., 144A, 6.25%, 6/1/2021 | 35,000 | 35,306 | |||||||
| Starz LLC, 5.0%, 9/15/2019 | 25,000 | 25,563 | |||||||
| Taylor Morrison Communities, Inc., 144A, 5.25%, 4/15/2021 | 40,000 | 38,900 | |||||||
| Travelport LLC, 144A, 13.875%, 3/1/2016 (PIK) | 6,827 | 7,237 | |||||||
| UCI International, Inc., 8.625%, 2/15/2019 | 20,000 | 20,000 | |||||||
| Univision Communications, Inc.: | |||||||||
| 144A, 6.875%, 5/15/2019 | 10,000 | 10,688 | |||||||
| 144A, 7.875%, 11/1/2020 | 25,000 | 27,469 | |||||||
| Viking Cruises Ltd., 144A, 8.5%, 10/15/2022 | 30,000 | 33,900 | |||||||
| Visteon Corp., 6.75%, 4/15/2019 | 25,000 | 26,563 | |||||||
| 4,871,740 | |||||||||
| Consumer Staples 3.9% | |||||||||
| Agrokor DD, 144A, 8.875%, 2/1/2020 | 250,000 | 267,512 | |||||||
| Altria Group, Inc., 9.95%, 11/10/2038 | 47,000 | 71,694 | |||||||
| B&G Foods, Inc., 4.625%, 6/1/2021 | 35,000 | 33,600 | |||||||
| Chiquita Brands International, Inc., 144A, 7.875%, 2/1/2021 | 25,000 | 27,063 | |||||||
| Controladora Mabe SA de CV, 144A, 7.875%, 10/28/2019 | 100,000 | 111,500 | |||||||
| Del Monte Corp., 7.625%, 2/15/2019 | 80,000 | 83,100 | |||||||
| Delhaize Group SA, 4.125%, 4/10/2019 | 140,000 | 143,926 | |||||||
| ESAL GmbH, 144A, 6.25%, 2/5/2023 | 200,000 | 179,500 | |||||||
| FAGE Dairy Industry SA, 144A, 9.875%, 2/1/2020 | 85,000 | 88,825 | |||||||
| JBS U.S.A. LLC: | |||||||||
| 144A, 7.25%, 6/1/2021 | 80,000 | 83,200 | |||||||
| 144A, 8.25%, 2/1/2020 | 25,000 | 27,125 | |||||||
| Marfrig Holding Europe BV, 144A, 11.25%, 9/20/2021 | 200,000 | 191,000 | |||||||
| MHP SA, 144A, 8.25%, 4/2/2020 | 200,000 | 177,540 | |||||||
| Mriya Agro Holding PLC, 144A, 9.45%, 4/19/2018 | 200,000 | 171,000 | |||||||
| Pilgrim's Pride Corp., 7.875%, 12/15/2018 | 45,000 | 49,050 | |||||||
| Reynolds Group Issuer, Inc.: | |||||||||
| 5.75%, 10/15/2020 | 65,000 | 66,300 | |||||||
| 6.875%, 2/15/2021 | 100,000 | 107,750 | |||||||
| 7.125%, 4/15/2019 | 100,000 | 106,500 | |||||||
| Roundy's Supermarkets, Inc., 144A, 10.25%, 12/15/2020 | 30,000 | 30,600 | |||||||
| Smithfield Foods, Inc.: | |||||||||
| 6.625%, 8/15/2022 | 30,000 | 31,800 | |||||||
| 7.75%, 7/1/2017 | 140,000 | 164,150 | |||||||
| Sun Products Corp., 144A, 7.75%, 3/15/2021 | 50,000 | 44,000 | |||||||
| Viskase Companies, Inc., 144A, 9.875%, 1/15/2018 | 145,000 | 152,424 | |||||||
| 2,409,159 | |||||||||
| Principal Amount ($)(a) | Value ($) | ||||||||
| Energy 8.4% | |||||||||
| Access Midstream Partners LP: | |||||||||
| 4.875%, 5/15/2023 | 15,000 | 14,475 | |||||||
| 6.125%, 7/15/2022 | 55,000 | 58,850 | |||||||
| Afren PLC, 144A, 10.25%, 4/8/2019 | 140,000 | 161,700 | |||||||
| Antero Resources Finance Corp.: | |||||||||
| 144A, 5.375%, 11/1/2021 | 30,000 | 30,300 | |||||||
| 7.25%, 8/1/2019 | 32,000 | 34,400 | |||||||
| Arch Coal, Inc., 7.0%, 6/15/2019 (b) | 20,000 | 15,900 | |||||||
| Berry Petroleum Co.: | |||||||||
| 6.375%, 9/15/2022 | 30,000 | 30,525 | |||||||
| 6.75%, 11/1/2020 | 140,000 | 145,250 | |||||||
| BreitBurn Energy Partners LP: | |||||||||
| 7.875%, 4/15/2022 | 95,000 | 98,800 | |||||||
| 8.625%, 10/15/2020 | 35,000 | 37,625 | |||||||
| Chaparral Energy, Inc., 7.625%, 11/15/2022 | 20,000 | 21,400 | |||||||
| Chesapeake Oilfield Operating LLC, 6.625%, 11/15/2019 | 25,000 | 26,188 | |||||||
| CITGO Petroleum Corp., 144A, 11.5%, 7/1/2017 | 105,000 | 114,975 | |||||||
| Crestwood Midstream Partners LP: | |||||||||
| 144A, 6.125%, 3/1/2022 | 20,000 | 20,500 | |||||||
| 7.75%, 4/1/2019 | 65,000 | 70,525 | |||||||
| Crosstex Energy LP: | |||||||||
| 7.125%, 6/1/2022 | 15,000 | 17,063 | |||||||
| 8.875%, 2/15/2018 | 55,000 | 57,819 | |||||||
| DCP Midstream Operating LP, 3.875%, 3/15/2023 | 100,000 | 92,086 | |||||||
| Denbury Resources, Inc., 4.625%, 7/15/2023 | 35,000 | 31,588 | |||||||
| Dresser-Rand Group, Inc., 6.5%, 5/1/2021 | 75,000 | 79,875 | |||||||
| EDC Finance Ltd., 144A, 4.875%, 4/17/2020 | 200,000 | 194,250 | |||||||
| El Paso LLC, 7.25%, 6/1/2018 | 55,000 | 62,790 | |||||||
| Endeavor Energy Resources LP, 144A, 7.0%, 8/15/2021 | 45,000 | 45,450 | |||||||
| Energy Transfer Partners LP, 4.15%, 10/1/2020 | 80,000 | 81,166 | |||||||
| EP Energy LLC: | |||||||||
| 6.875%, 5/1/2019 | 60,000 | 64,575 | |||||||
| 7.75%, 9/1/2022 | 25,000 | 28,000 | |||||||
| 9.375%, 5/1/2020 | 25,000 | 28,844 | |||||||
| EPE Holdings LLC, 144A, 8.875%, 12/15/2017 (PIK) | 59,903 | 61,550 | |||||||
| EV Energy Partners LP, 8.0%, 4/15/2019 | 140,000 | 140,700 | |||||||
| FMC Technologies, Inc., 3.45%, 10/1/2022 | 40,000 | 36,837 | |||||||
| Frontier Oil Corp., 6.875%, 11/15/2018 | 55,000 | 59,331 | |||||||
| Halcon Resources Corp.: | |||||||||
| 8.875%, 5/15/2021 | 85,000 | 85,850 | |||||||
| 9.75%, 7/15/2020 | 50,000 | 52,125 | |||||||
| 144A, 9.75%, 7/15/2020 | 30,000 | 31,238 | |||||||
| Holly Energy Partners LP: | |||||||||
| 6.5%, 3/1/2020 | 20,000 | 20,900 | |||||||
| 8.25%, 3/15/2018 | 55,000 | 58,025 | |||||||
| Kodiak Oil & Gas Corp., 5.5%, 1/15/2021 (b) | 60,000 | 59,850 | |||||||
| Linn Energy LLC: | |||||||||
| 6.5%, 5/15/2019 | 15,000 | 15,300 | |||||||
| 144A, 7.0%, 11/1/2019 | 110,000 | 111,100 | |||||||
| Principal Amount ($)(a) | Value ($) | ||||||||
| MEG Energy Corp.: | |||||||||
| 144A, 6.5%, 3/15/2021 | 40,000 | 42,100 | |||||||
| 144A, 7.0%, 3/31/2024 | 75,000 | 75,938 | |||||||
| Midstates Petroleum Co., Inc.: | |||||||||
| 9.25%, 6/1/2021 | 70,000 | 73,150 | |||||||
| 10.75%, 10/1/2020 | 85,000 | 92,437 | |||||||
| Murphy Oil U.S.A., Inc., 144A, 6.0%, 8/15/2023 | 40,000 | 40,200 | |||||||
| Murray Energy Corp., 144A, 8.625%, 6/15/2021 | 5,000 | 5,175 | |||||||
| Northern Oil & Gas, Inc., 8.0%, 6/1/2020 | 90,000 | 94,275 | |||||||
| Oasis Petroleum, Inc.: | |||||||||
| 6.5%, 11/1/2021 | 25,000 | 26,750 | |||||||
| 144A, 6.875%, 3/15/2022 | 60,000 | 63,600 | |||||||
| 6.875%, 1/15/2023 | 25,000 | 26,625 | |||||||
| 7.25%, 2/1/2019 | 40,000 | 43,000 | |||||||
| Offshore Drilling Holding SA, 144A, 8.375%, 9/20/2020 | 200,000 | 213,000 | |||||||
| Offshore Group Investment Ltd.: | |||||||||
| 7.125%, 4/1/2023 | 60,000 | 61,200 | |||||||
| 7.5%, 11/1/2019 | 20,000 | 21,750 | |||||||
| Pacific Drilling SA, 144A, 5.375%, 6/1/2020 | 35,000 | 35,175 | |||||||
| Pacific Rubiales Energy Corp., 144A, 7.25%, 12/12/2021 | 150,000 | 159,000 | |||||||
| Petroleos de Venezuela SA, 144A, 8.5%, 11/2/2017 | 300,000 | 249,750 | |||||||
| Pertamina Persero PT, 144A, 5.625%, 5/20/2043 | 200,000 | 158,500 | |||||||
| Reliance Holdings U.S.A., Inc., 144A, 5.4%, 2/14/2022 | 250,000 | 252,835 | |||||||
| Rosneft Finance SA, 144A, 6.625%, 3/20/2017 | 200,000 | 221,000 | |||||||
| Sabine Pass Liquefaction LLC, 144A, 5.625%, 2/1/2021 | 105,000 | 102,637 | |||||||
| SandRidge Energy, Inc., 7.5%, 3/15/2021 | 75,000 | 78,562 | |||||||
| SESI LLC: | |||||||||
| 6.375%, 5/1/2019 | 40,000 | 42,700 | |||||||
| 7.125%, 12/15/2021 | 115,000 | 128,225 | |||||||
| Swift Energy Co., 7.875%, 3/1/2022 | 55,000 | 54,450 | |||||||
| Talos Production LLC, 144A, 9.75%, 2/15/2018 | 60,000 | 61,350 | |||||||
| Tesoro Corp.: | |||||||||
| 4.25%, 10/1/2017 | 35,000 | 36,488 | |||||||
| 5.375%, 10/1/2022 (b) | 25,000 | 25,313 | |||||||
| Transocean, Inc., 3.8%, 10/15/2022 | 75,000 | 71,087 | |||||||
| Ultra Petroleum Corp., 144A, 5.75%, 12/15/2018 | 10,000 | 10,275 | |||||||
| Venoco, Inc., 8.875%, 2/15/2019 | 105,000 | 103,425 | |||||||
| Whiting Petroleum Corp., 5.0%, 3/15/2019 | 40,000 | 40,900 | |||||||
| WPX Energy, Inc., 5.25%, 1/15/2017 | 40,000 | 42,700 | |||||||
| 5,151,297 | |||||||||
| Financials 10.0% | |||||||||
| Ally Financial, Inc.: | |||||||||
| 5.5%, 2/15/2017 | 60,000 | 64,950 | |||||||
| 6.25%, 12/1/2017 | 95,000 | 105,925 | |||||||
| 8.3%, 2/12/2015 | 135,000 | 145,125 | |||||||
| American International Group, Inc., 3.8%, 3/22/2017 | 60,000 | 64,074 | |||||||
| American Tower Corp., (REIT), 3.5%, 1/31/2023 | 60,000 | 54,705 | |||||||
| Principal Amount ($)(a) | Value ($) | ||||||||
| Banco Santander Brasil SA, 144A, 8.0%, 3/18/2016 | BRL | 400,000 | 156,829 | ||||||
| Bank of America Corp., 3.3%, 1/11/2023 | 160,000 | 151,403 | |||||||
| Barclays Bank PLC, 7.625%, 11/21/2022 | 400,000 | 426,000 | |||||||
| BBVA Bancomer SA, 144A, 6.5%, 3/10/2021 | 200,000 | 211,000 | |||||||
| BNP Paribas SA, 5.0%, 1/15/2021 | 120,000 | 131,638 | |||||||
| CIT Group, Inc.: | |||||||||
| 5.0%, 5/15/2017 | 80,000 | 85,400 | |||||||
| 5.25%, 3/15/2018 | 90,000 | 96,525 | |||||||
| Development Bank of Kazakhstan JSC, Series 3, 6.5%, 6/3/2020 | 500,000 | 527,600 | |||||||
| E*TRADE Financial Corp., 6.75%, 6/1/2016 | 130,000 | 141,050 | |||||||
| Hartford Financial Services Group, Inc., 6.0%, 1/15/2019 | 117,000 | 134,189 | |||||||
| HCP, Inc., (REIT), 5.375%, 2/1/2021 | 143,000 | 155,667 | |||||||
| Health Care REIT, Inc., (REIT), 4.5%, 1/15/2024 | 125,000 | 123,418 | |||||||
| Hellas Telecommunications Finance, 144A, 8.227%**, 7/15/2015 (PIK)* | EUR | 109,187 | 0 | ||||||
| ING Bank NV: | |||||||||
| 144A, 2.0%, 9/25/2015 | 200,000 | 203,313 | |||||||
| 144A, 5.8%, 9/25/2023 | 230,000 | 240,487 | |||||||
| ING U.S., Inc., 5.7%, 7/15/2043 | 65,000 | 67,912 | |||||||
International Lease Finance Corp.: | |||||||||
| 3.875%, 4/15/2018 | 65,000 | 65,162 | |||||||
| 5.75%, 5/15/2016 | 20,000 | 21,425 | |||||||
| 6.25%, 5/15/2019 | 50,000 | 54,125 | |||||||
| 8.625%, 9/15/2015 | 40,000 | 44,400 | |||||||
| 8.625%, 1/15/2022 (b) | 45,000 | 53,179 | |||||||
| 8.75%, 3/15/2017 | 120,000 | 141,300 | |||||||
| Intesa Sanpaolo SpA, 3.875%, 1/16/2018 | 240,000 | 245,755 | |||||||
| Jefferies Group LLC, 5.125%, 1/20/2023 | 60,000 | 60,688 | |||||||
| Macquarie Bank Ltd., 144A, 3.45%, 7/27/2015 | 105,000 | 108,586 | |||||||
| Morgan Stanley: | |||||||||
| 3.75%, 2/25/2023 | 85,000 | 82,711 | |||||||
| 4.1%, 5/22/2023 | 85,000 | 82,259 | |||||||
MPT Operating Partnership LP: | |||||||||
| (REIT), 6.375%, 2/15/2022 | 45,000 | 46,575 | |||||||
| (REIT), 6.875%, 5/1/2021 | 50,000 | 53,500 | |||||||
Neuberger Berman Group LLC: | |||||||||
| 144A, 5.625%, 3/15/2020 | 25,000 | 26,250 | |||||||
| 144A, 5.875%, 3/15/2022 | 45,000 | 46,350 | |||||||
| OPB Finance Trust, Series C, 2.9%, 5/24/2023 | CAD | 238,000 | 208,528 | ||||||
| ProLogis LP, (REIT), 4.25%, 8/15/2023 | 90,000 | 88,907 | |||||||
| PSP Capital, Inc., 3.03%, 10/22/2020 | CAD | 184,000 | 173,713 | ||||||
| Royal Bank of Scotland Group PLC, 6.1%, 6/10/2023 | 100,000 | 100,810 | |||||||
| Principal Amount ($)(a) | Value ($) | ||||||||
| Santander U.S. Debt SAU, 144A, 3.724%, 1/20/2015 | 45,000 | 45,897 | |||||||
| SLM Corp., 5.5%, 1/25/2023 | 125,000 | 118,076 | |||||||
| Societe Generale SA, 144A, 7.875%, 12/29/2049 | 110,000 | 110,770 | |||||||
| The Goldman Sachs Group, Inc.: | |||||||||
| 3.625%, 1/22/2023 | 55,000 | 53,259 | |||||||
| 5.75%, 1/24/2022 | 160,000 | 180,110 | |||||||
| Turkiye Is Bankasi, 144A, 6.0%, 10/24/2022 | 250,000 | 224,250 | |||||||
| Turkiye Vakiflar Bankasi Tao, 144A, 3.75%, 4/15/2018 | 250,000 | 234,125 | |||||||
| Ventas Realty LP, (REIT), 2.7%, 4/1/2020 | 130,000 | 124,306 | |||||||
| 6,082,226 | |||||||||
| Health Care 3.3% | |||||||||
| Agilent Technologies, Inc., 3.2%, 10/1/2022 | 40,000 | 36,611 | |||||||
| Aviv Healthcare Properties LP: | |||||||||
| 144A, 6.0%, 10/15/2021 | 15,000 | 15,263 | |||||||
| 7.75%, 2/15/2019 | 85,000 | 91,375 | |||||||
| Biomet, Inc.: | |||||||||
| 6.5%, 8/1/2020 | 55,000 | 57,750 | |||||||
| 6.5%, 10/1/2020 | 15,000 | 15,450 | |||||||
| Community Health Systems, Inc.: | |||||||||
| 5.125%, 8/15/2018 | 185,000 | 191,013 | |||||||
| 7.125%, 7/15/2020 | 60,000 | 62,250 | |||||||
| Endo Finance Co., 144A, 5.75%, 1/15/2022 | 35,000 | 35,175 | |||||||
| Fresenius Medical Care U.S. Finance II, Inc., 144A, 5.625%, 7/31/2019 | 35,000 | 37,800 | |||||||
| Fresenius Medical Care U.S. Finance, Inc., 144A, 6.5%, 9/15/2018 | 20,000 | 22,600 | |||||||
| HCA, Inc.: | |||||||||
| 5.875%, 3/15/2022 | 40,000 | 41,300 | |||||||
| 6.5%, 2/15/2020 | 210,000 | 230,737 | |||||||
| 7.5%, 2/15/2022 | 80,000 | 87,800 | |||||||
| 7.875%, 2/15/2020 | 365,000 | 391,919 | |||||||
| 8.5%, 4/15/2019 | 45,000 | 47,700 | |||||||
| Hologic, Inc., 6.25%, 8/1/2020 | 30,000 | 31,650 | |||||||
| Laboratory Corp. of America Holdings, 3.75%, 8/23/2022 | 35,000 | 33,902 | |||||||
| LifePoint Hospitals, Inc., 144A, 5.5%, 12/1/2021 | 35,000 | 35,131 | |||||||
| Mallinckrodt International Finance SA, 144A, 4.75%, 4/15/2023 | 75,000 | 69,220 | |||||||
| Par Pharmaceutical Companies, Inc., 7.375%, 10/15/2020 | 55,000 | 56,856 | |||||||
| Physio-Control International, Inc., 144A, 9.875%, 1/15/2019 | 48,000 | 53,760 | |||||||
| Salix Pharmaceuticals Ltd., 144A, 6.0%, 1/15/2021 | 30,000 | 30,750 | |||||||
| Tenet Healthcare Corp.: | |||||||||
| 4.375%, 10/1/2021 | 55,000 | 51,700 | |||||||
| 4.5%, 4/1/2021 | 10,000 | 9,475 | |||||||
| 6.25%, 11/1/2018 | 80,000 | 88,600 | |||||||
| Valeant Pharmaceuticals International, 144A, 6.75%, 8/15/2018 | 70,000 | 76,913 | |||||||
| Warner Chilcott Co., LLC, 7.75%, 9/15/2018 | 75,000 | 81,188 | |||||||
| 1,983,888 | |||||||||
| Principal Amount ($)(a) | Value ($) | ||||||||
| Industrials 6.4% | |||||||||
| Accuride Corp., 9.5%, 8/1/2018 | 65,000 | 63,537 | |||||||
| ADT Corp., 144A, 6.25%, 10/15/2021 | 25,000 | 26,250 | |||||||
| Aeropuertos Dominicanos Siglo XXI SA, 144A, 9.25%, 11/13/2019 | 250,000 | 246,250 | |||||||
| Alphabet Holding Co., Inc.: | |||||||||
| 7.75%, 11/1/2017 (PIK) | 30,000 | 30,938 | |||||||
| 144A, 7.75%, 11/1/2017 (PIK) | 35,000 | 36,094 | |||||||
| Armored Autogroup, Inc., 9.25%, 11/1/2018 | 105,000 | 101,062 | |||||||
| Artesyn Escrow, Inc., 144A, 9.75%, 10/15/2020 | 40,000 | 42,000 | |||||||
| BE Aerospace, Inc., 6.875%, 10/1/2020 | 25,000 | 27,438 | |||||||
| Belden, Inc., 144A, 5.5%, 9/1/2022 | 55,000 | 53,900 | |||||||
| Bombardier, Inc.: | |||||||||
| 144A, 5.75%, 3/15/2022 | 55,000 | 54,587 | |||||||
| 144A, 7.75%, 3/15/2020 | 45,000 | 51,075 | |||||||
| Casella Waste Systems, Inc., 7.75%, 2/15/2019 | 110,000 | 112,750 | |||||||
| Cemex Finance LLC, 144A, 9.375%, 10/12/2022 | 200,000 | 225,500 | |||||||
| CTP Transportation Products LLC, 144A, 8.25%, 12/15/2019 | 35,000 | 36,488 | |||||||
| Darling Escrow Corp., 144A, 5.375%, 1/15/2022 (c) | 30,000 | 30,225 | |||||||
| DigitalGlobe, Inc., 144A, 5.25%, 2/1/2021 | 25,000 | 24,375 | |||||||
| Ducommun, Inc., 9.75%, 7/15/2018 | 65,000 | 72,312 | |||||||
| DynCorp International, Inc., 10.375%, 7/1/2017 | 85,000 | 86,912 | |||||||
| Ferreycorp SAA, 144A, 4.875%, 4/26/2020 | 200,000 | 187,000 | |||||||
| Florida East Coast Railway Corp., 8.125%, 2/1/2017 | 40,000 | 41,750 | |||||||
| FTI Consulting, Inc., 6.75%, 10/1/2020 | 145,000 | 156,600 | |||||||
| Garda World Security Corp., 144A, 7.25%, 11/15/2021 | 45,000 | 45,337 | |||||||
| GenCorp, Inc., 7.125%, 3/15/2021 | 115,000 | 123,050 | |||||||
| Georgian Railway JSC, 144A, 7.75%, 7/11/2022 | 200,000 | 207,740 | |||||||
| Grupo KUO SAB De CV, 144A, 6.25%, 12/4/2022 | 200,000 | 200,000 | |||||||
| Huntington Ingalls Industries, Inc.: | |||||||||
| 6.875%, 3/15/2018 | 50,000 | 54,000 | |||||||
| 7.125%, 3/15/2021 | 10,000 | 10,975 | |||||||
| Ingersoll-Rand Global Holding Co., Ltd., 144A, 2.875%, 1/15/2019 | 20,000 | 19,713 | |||||||
| Kenan Advantage Group, Inc., 144A, 8.375%, 12/15/2018 | 25,000 | 26,313 | |||||||
| Masco Corp., 7.125%, 3/15/2020 | 145,000 | 165,519 | |||||||
| Meritor, Inc.: | |||||||||
| 6.75%, 6/15/2021 | 25,000 | 25,500 | |||||||
| 10.625%, 3/15/2018 | 60,000 | 63,900 | |||||||
| Navios Maritime Holdings, Inc.: | |||||||||
| 144A, 7.375%, 1/15/2022 | 110,000 | 110,550 | |||||||
| 8.125%, 2/15/2019 | 75,000 | 77,062 | |||||||
| Navios South American Logistics, Inc., 9.25%, 4/15/2019 | 10,000 | 10,788 | |||||||
| Nortek, Inc., 8.5%, 4/15/2021 | 75,000 | 83,062 | |||||||
| Odebrecht Offshore Drilling Finance Ltd., 144A, 6.75%, 10/1/2022 | 196,920 | 201,548 | |||||||
| Principal Amount ($)(a) | Value ($) | ||||||||
| Owens Corning, Inc.: | |||||||||
| 4.2%, 12/15/2022 | 30,000 | 28,648 | |||||||
| 9.0%, 6/15/2019 | 29,000 | 35,803 | |||||||
| Ply Gem Industries, Inc., 9.375%, 4/15/2017 | 15,000 | 16,200 | |||||||
| Spirit AeroSystems, Inc., 6.75%, 12/15/2020 | 75,000 | 80,719 | |||||||
| Titan International, Inc., 144A, 6.875%, 10/1/2020 | 90,000 | 93,825 | |||||||
| Total System Services, Inc., 3.75%, 6/1/2023 | 70,000 | 64,706 | |||||||
| TransDigm, Inc.: | |||||||||
| 7.5%, 7/15/2021 | 50,000 | 53,750 | |||||||
| 7.75%, 12/15/2018 | 65,000 | 69,712 | |||||||
| United Rentals North America, Inc.: | |||||||||
| 5.75%, 7/15/2018 | 60,000 | 64,125 | |||||||
| 7.375%, 5/15/2020 | 95,000 | 105,331 | |||||||
| 7.625%, 4/15/2022 | 95,000 | 105,569 | |||||||
| Watco Companies LLC, 144A, 6.375%, 4/1/2023 | 25,000 | 24,750 | |||||||
| 3,875,238 | |||||||||
| Information Technology 1.8% | |||||||||
| ACI Worldwide, Inc., 144A, 6.375%, 8/15/2020 | 15,000 | 15,675 | |||||||
| Activision Blizzard, Inc., 144A, 5.625%, 9/15/2021 | 115,000 | 119,025 | |||||||
| Audatex North America, Inc., 144A, 6.0%, 6/15/2021 | 20,000 | 20,950 | |||||||
| BMC Software Finance, Inc., 144A, 8.125%, 7/15/2021 | 50,000 | 51,500 | |||||||
| CDW LLC, 8.5%, 4/1/2019 | 45,000 | 49,725 | |||||||
| eAccess Ltd., 144A, 8.25%, 4/1/2018 | 60,000 | 65,550 | |||||||
| EarthLink, Inc., 7.375%, 6/1/2020 | 30,000 | 29,925 | |||||||
| Equinix, Inc.: | |||||||||
| 5.375%, 4/1/2023 | 105,000 | 102,637 | |||||||
| 7.0%, 7/15/2021 | 40,000 | 43,700 | |||||||
| First Data Corp.: | |||||||||
| 144A, 6.75%, 11/1/2020 | 110,000 | 114,400 | |||||||
| 144A, 7.375%, 6/15/2019 | 45,000 | 48,037 | |||||||
| 144A, 8.875%, 8/15/2020 | 85,000 | 94,031 | |||||||
| Fiserv, Inc., 3.5%, 10/1/2022 | 95,000 | 88,218 | |||||||
| Freescale Semiconductor, Inc., 144A, 6.0%, 1/15/2022 | 40,000 | 40,500 | |||||||
| Healthcare Technology Intermediate, Inc., 144A, 7.375%, 9/1/2018 (PIK) | 10,000 | 10,400 | |||||||
| Hughes Satellite Systems Corp.: | |||||||||
| 6.5%, 6/15/2019 | 70,000 | 75,775 | |||||||
| 7.625%, 6/15/2021 | 40,000 | 44,600 | |||||||
| IAC/InterActiveCorp., 4.75%, 12/15/2022 | 25,000 | 23,313 | |||||||
| Jabil Circuit, Inc., 7.75%, 7/15/2016 | 30,000 | 34,125 | |||||||
| NCR Escrow Corp.: | |||||||||
| 144A, 5.875%, 12/15/2021 | 10,000 | 10,188 | |||||||
| 144A, 6.375%, 12/15/2023 | 20,000 | 20,425 | |||||||
| 1,102,699 | |||||||||
| Materials 6.6% | |||||||||
| Anglo American Capital PLC, 144A, 4.125%, 9/27/2022 | 250,000 | 235,066 | |||||||
| Ashland, Inc., 3.875%, 4/15/2018 | 20,000 | 20,250 | |||||||
| Ball Corp., 7.375%, 9/1/2019 | 25,000 | 27,000 | |||||||
| BOE Intermediate Holding Corp., 144A, 9.0%, 11/1/2017 (PIK) | 41,820 | 43,597 | |||||||
| Principal Amount ($)(a) | Value ($) | ||||||||
| Cia Minera Milpo SAA, 144A, 4.625%, 3/28/2023 | 200,000 | 181,000 | |||||||
| Clearwater Paper Corp., 7.125%, 11/1/2018 | 65,000 | 69,387 | |||||||
| Crown Americas LLC, 6.25%, 2/1/2021 | 10,000 | 10,850 | |||||||
| CSN Resources SA, 144A, 6.5%, 7/21/2020 | 200,000 | 202,250 | |||||||
| Essar Steel Algoma, Inc.: | |||||||||
| 144A, 9.375%, 3/15/2015 | 220,000 | 207,900 | |||||||
| 144A, 9.875%, 6/15/2015 | 35,000 | 21,350 | |||||||
| Exopack Holding Corp., 144A, 10.0%, 6/1/2018 | 40,000 | 43,400 | |||||||
| FMG Resources (August 2006) Pty Ltd.: | |||||||||
| 144A, 6.0%, 4/1/2017 (b) | 55,000 | 58,438 | |||||||
| 144A, 6.875%, 4/1/2022 | 15,000 | 16,350 | |||||||
| 144A, 7.0%, 11/1/2015 | 33,000 | 34,238 | |||||||
| 144A, 8.25%, 11/1/2019 (b) | 45,000 | 50,513 | |||||||
| FQM Akubra, Inc.: | |||||||||
| 144A, 7.5%, 6/1/2021 | 80,000 | 83,600 | |||||||
| 144A, 8.75%, 6/1/2020 | 45,000 | 48,825 | |||||||
| Glencore Funding LLC, 144A, 4.125%, 5/30/2023 | 110,000 | 102,797 | |||||||
| Greif, Inc., 7.75%, 8/1/2019 | 195,000 | 221,325 | |||||||
| Hexion U.S. Finance Corp.: | |||||||||
| 6.625%, 4/15/2020 | 15,000 | 15,375 | |||||||
| 8.875%, 2/1/2018 | 95,000 | 98,681 | |||||||
| Huntsman International LLC: | |||||||||
| 8.625%, 3/15/2020 | 60,000 | 66,375 | |||||||
| 8.625%, 3/15/2021 | 25,000 | 28,250 | |||||||
| IAMGOLD Corp., 144A, 6.75%, 10/1/2020 | 40,000 | 34,400 | |||||||
| International Paper Co., 7.95%, 6/15/2018 | 145,000 | 176,130 | |||||||
| Kaiser Aluminum Corp., 8.25%, 6/1/2020 | 40,000 | 45,200 | |||||||
| KGHM International Ltd., 144A, 7.75%, 6/15/2019 | 115,000 | 121,325 | |||||||
| Metalloinvest Finance Ltd., 144A, 6.5%, 7/21/2016 | 200,000 | 211,750 | |||||||
| Novelis, Inc., 8.75%, 12/15/2020 | 215,000 | 239,187 | |||||||
| Owens-Brockway Glass Container, Inc., 7.375%, 5/15/2016 | 30,000 | 33,675 | |||||||
| Packaging Dynamics Corp., 144A, 8.75%, 2/1/2016 | 90,000 | 92,475 | |||||||
| Plastipak Holdings, Inc., 144A, 6.5%, 10/1/2021 | 40,000 | 41,400 | |||||||
| Polymer Group, Inc., 7.75%, 2/1/2019 | 55,000 | 58,644 | |||||||
| PolyOne Corp., 5.25%, 3/15/2023 | 40,000 | 39,000 | |||||||
| Polyus Gold International Ltd., 144A, 5.625%, 4/29/2020 | 200,000 | 192,750 | |||||||
| Rain CII Carbon LLC, 144A, 8.0%, 12/1/2018 | 45,000 | 46,575 | |||||||
| Samarco Mineracao SA, 144A, 5.75%, 10/24/2023 | 200,000 | 198,000 | |||||||
| Sealed Air Corp.: | |||||||||
| 144A, 8.125%, 9/15/2019 | 30,000 | 33,675 | |||||||
| 144A, 8.375%, 9/15/2021 | 30,000 | 34,050 | |||||||
| The Mosaic Co., 4.25%, 11/15/2023 | 90,000 | 88,884 | |||||||
| Turkiye Sise ve Cam Fabrikalari AS, 144A, 4.25%, 5/9/2020 | 300,000 | 263,970 | |||||||
| Vedanta Resources PLC, 144A, 8.25%, 6/7/2021 | 200,000 | 200,750 | |||||||
| 4,038,657 | |||||||||
| Principal Amount ($)(a) | Value ($) | ||||||||
| Telecommunication Services 8.3% | |||||||||
| CC Holdings GS V LLC, 3.849%, 4/15/2023 | 70,000 | 65,527 | |||||||
| CenturyLink, Inc.: | |||||||||
| Series V, 5.625%, 4/1/2020 | 15,000 | 15,263 | |||||||
| Series W, 6.75%, 12/1/2023 | 60,000 | 60,750 | |||||||
| Cincinnati Bell, Inc.: | |||||||||
| 8.375%, 10/15/2020 | 215,000 | 232,737 | |||||||
| 8.75%, 3/15/2018 (b) | 210,000 | 220,500 | |||||||
| CPI International, Inc., 8.0%, 2/15/2018 | 45,000 | 47,025 | |||||||
| Cricket Communications, Inc., 7.75%, 10/15/2020 | 245,000 | 279,300 | |||||||
| Digicel Group Ltd.: | |||||||||
| 144A, 8.25%, 9/30/2020 | 105,000 | 108,806 | |||||||
| 144A, 10.5%, 4/15/2018 | 100,000 | 107,000 | |||||||
| Digicel Ltd., 144A, 8.25%, 9/1/2017 | 400,000 | 416,000 | |||||||
| ERC Ireland Preferred Equity Ltd., 144A, 7.69%**, 2/15/2017 (PIK)* | EUR | 88,319 | 0 | ||||||
| Frontier Communications Corp.: | |||||||||
| 7.125%, 1/15/2023 (b) | 200,000 | 197,500 | |||||||
| 7.625%, 4/15/2024 | 15,000 | 14,963 | |||||||
| 8.25%, 4/15/2017 | 62,000 | 71,920 | |||||||
| 8.5%, 4/15/2020 | 90,000 | 100,800 | |||||||
| 8.75%, 4/15/2022 | 25,000 | 27,750 | |||||||
Intelsat Jackson Holdings SA: | |||||||||
| 144A, 5.5%, 8/1/2023 | 55,000 | 52,319 | |||||||
| 7.25%, 10/15/2020 | 195,000 | 213,281 | |||||||
| 7.5%, 4/1/2021 | 215,000 | 237,037 | |||||||
| 8.5%, 11/1/2019 | 100,000 | 109,125 | �� | ||||||
| Intelsat Luxembourg SA: | |||||||||
| 144A, 7.75%, 6/1/2021 | 95,000 | 101,887 | |||||||
| 144A, 8.125%, 6/1/2023 | 10,000 | 10,725 | |||||||
| Level 3 Communications, Inc., 8.875%, 6/1/2019 | 10,000 | 10,925 | |||||||
| Level 3 Financing, Inc.: | |||||||||
| 144A, 6.125%, 1/15/2021 | 20,000 | 20,200 | |||||||
| 7.0%, 6/1/2020 | 75,000 | 79,500 | |||||||
| 8.125%, 7/1/2019 | 75,000 | 82,125 | |||||||
| 8.625%, 7/15/2020 | 50,000 | 56,000 | |||||||
| MetroPCS Wireless, Inc.: | |||||||||
| 6.625%, 11/15/2020 | 65,000 | 68,900 | |||||||
| 144A, 6.625%, 4/1/2023 (b) | 35,000 | 36,137 | |||||||
| 7.875%, 9/1/2018 | 75,000 | 80,531 | |||||||
| Millicom International Cellular SA, 144A, 4.75%, 5/22/2020 | 200,000 | 192,000 | |||||||
| NII Capital Corp., 7.625%, 4/1/2021 | 50,000 | 20,500 | |||||||
| Oi SA, 144A, 5.75%, 2/10/2022 | 200,000 | 184,000 | |||||||
| SBA Communications Corp., 5.625%, 10/1/2019 | 30,000 | 30,900 | |||||||
| SBA Telecommunications, Inc., 8.25%, 8/15/2019 | 16,000 | 17,160 | |||||||
| Sprint Communications, Inc.: | |||||||||
| 6.0%, 12/1/2016 | 320,000 | 349,200 | |||||||
| 8.375%, 8/15/2017 | 55,000 | 63,662 | |||||||
| 9.125%, 3/1/2017 | 50,000 | 58,750 | |||||||
| Sprint Corp., 144A, 7.125%, 6/15/2024 | 35,000 | 35,525 | |||||||
| T-Mobile U.S.A., Inc.: | |||||||||
| 6.125%, 1/15/2022 | 15,000 | 15,263 | |||||||
| 6.5%, 1/15/2024 | 15,000 | 15,188 | |||||||
| Principal Amount ($)(a) | Value ($) | ||||||||
| tw telecom holdings, Inc.: | |||||||||
| 5.375%, 10/1/2022 | 35,000 | 34,388 | |||||||
| 144A, 5.375%, 10/1/2022 | 5,000 | 4,913 | |||||||
| 144A, 6.375%, 9/1/2023 | 35,000 | 36,400 | |||||||
| UPCB Finance V Ltd., 144A, 7.25%, 11/15/2021 | 30,000 | 32,550 | |||||||
| UPCB Finance VI Ltd., 144A, 6.875%, 1/15/2022 | 10,000 | 10,625 | |||||||
| Verizon Communications, Inc., 6.55%, 9/15/2043 | 250,000 | 292,490 | |||||||
| Wind Acquisition Finance SA, 144A, 6.5%, 4/30/2020 | 30,000 | 31,950 | |||||||
| Windstream Corp.: | |||||||||
| 6.375%, 8/1/2023 | 40,000 | 37,400 | |||||||
| 7.5%, 4/1/2023 | 75,000 | 75,375 | |||||||
| 7.75%, 10/15/2020 | 20,000 | 21,225 | |||||||
| 7.75%, 10/1/2021 | 55,000 | 58,300 | |||||||
| 7.875%, 11/1/2017 | 205,000 | 234,212 | |||||||
| 8.125%, 9/1/2018 | 70,000 | 75,250 | |||||||
| 5,051,759 | |||||||||
| Utilities 2.8% | |||||||||
| AES Corp.: | |||||||||
| 8.0%, 10/15/2017 | 10,000 | 11,750 | |||||||
| 8.0%, 6/1/2020 | 175,000 | 204,750 | |||||||
| American Electric Power Co., Inc., Series F, 2.95%, 12/15/2022 | 140,000 | 129,472 | |||||||
| Calpine Corp.: | |||||||||
| 144A, 7.5%, 2/15/2021 | 64,000 | 69,840 | |||||||
| 144A, 7.875%, 7/31/2020 | 70,000 | 76,650 | |||||||
| Electricite de France SA, 144A, 5.25%, 1/29/2049 | 100,000 | 99,450 | |||||||
| Energy Future Holdings Corp., Series Q, 6.5%, 11/15/2024 | 100,000 | 35,000 | |||||||
| Energy Future Intermediate Holding Co., LLC, 10.0%, 12/1/2020 (b) | 80,000 | 85,000 | |||||||
| Instituto Costarricense de Electricidad, 144A, 6.95%, 11/10/2021 | 200,000 | 205,250 | |||||||
| IPALCO Enterprises, Inc., 5.0%, 5/1/2018 | 145,000 | 151,887 | |||||||
| Jersey Central Power & Light Co., 144A, 4.7%, 4/1/2024 | 160,000 | 158,368 | |||||||
| Mexico Generadora de Energia S de rl, 144A, 5.5%, 12/6/2032 | 200,000 | 191,000 | |||||||
| NRG Energy, Inc., 7.625%, 1/15/2018 | 35,000 | 39,900 | |||||||
| PPL Energy Supply LLC, 4.6%, 12/15/2021 | 200,000 | 192,189 | |||||||
| Toledo Edison Co., 7.25%, 5/1/2020 | 38,000 | 45,296 | |||||||
| 1,695,802 | |||||||||
Total Corporate Bonds (Cost $35,649,971) | 36,262,465 | ||||||||
| Mortgage-Backed Securities Pass-Throughs 1.7% | |||||||||
| Federal National Mortgage Association, 4.0%, 5/1/2041 (c) (Cost $1,033,281) | 1,000,000 | 1,030,469 | |||||||
| Principal Amount ($)(a) | Value ($) | ||||||||
| Asset-Backed 0.8% | |||||||||
| Home Equity Loans 0.4% | |||||||||
| CIT Group Home Equity Loan Trust, "AF6", Series 2002-1, 6.2%, 2/25/2030 | 57,912 | 57,724 | |||||||
| Citifinancial Mortgage Securities, Inc., "AFS", Series 2003-4, 5.326%, 10/25/2033 | 190,000 | 198,448 | |||||||
| 256,172 | |||||||||
| Miscellaneous 0.4% | |||||||||
| ARES CLO Ltd., "D", Series 2012-3A, 144A, 4.894%**, 1/17/2024 | 250,000 | 251,018 | |||||||
Total Asset-Backed (Cost $474,924) | 507,190 | ||||||||
| Commercial Mortgage-Backed Securities 3.4% | |||||||||
| Commercial Mortgage Trust, "AM", Series 2007-GG11, 5.867%, 12/10/2049 | 290,000 | 317,761 | |||||||
| Del Coronado Trust, "M", Series 2013-HDMZ, 144A, 5.167%**, 3/15/2018 | 80,000 | 80,280 | |||||||
| JPMorgan Chase Commercial Mortgage Securities Corp.: | |||||||||
| "C", Series 2012-HSBC, 144A, 4.021%, 7/5/2032 | 150,000 | 144,659 | |||||||
| "A4", Series 2006-LDP7, 5.863%**, 4/15/2045 | 140,000 | 152,830 | |||||||
| LB-UBS Commercial Mortgage Trust, "A3", Series 2006-C7, 5.347%, 11/15/2038 | 440,000 | 483,102 | |||||||
| Wachovia Bank Commercial Mortgage Trust, "A4", Series 2005-C22, 5.289%**, 12/15/2044 | 140,000 | 149,030 | |||||||
| WFRBS Commercial Mortgage Trust, "A5", Series 2013-C14, 3.337%, 6/15/2046 | 750,000 | 720,610 | |||||||
Total Commercial Mortgage-Backed Securities (Cost $2,026,132) | 2,048,272 | ||||||||
| Collateralized Mortgage Obligations 4.9% | |||||||||
| Banc of America Mortgage Securities, "2A2", Series 2004-A, 2.91%**, 2/25/2034 | 112,538 | 111,025 | |||||||
| Bear Stearns Adjustable Rate Mortgage Trust, "2A1", Series 2005-11, 3.141%**, 12/25/2035 | 144,496 | 144,643 | |||||||
| Countrywide Home Loans, "2A5", Series 2004-13, 5.75%, 8/25/2034 | 97,691 | 98,729 | |||||||
| Federal Home Loan Mortgage Corp.: | |||||||||
| "AI", Series 4016, Interest Only, 3.0%, 9/15/2025 | 1,306,090 | 124,019 | |||||||
| "ZG", Series 4213, 3.5%, 6/15/2043 | 114,845 | 107,789 | |||||||
| "JI", Series 3558, Interest Only, 4.5%, 12/15/2023 | 59,342 | 2,711 | |||||||
| "PI", Series 3843, Interest Only, 4.5%, 5/15/2038 | 476,226 | 70,334 | |||||||
| "HI", Series 2934, Interest Only, 5.0%, 2/15/2020 | 137,869 | 14,570 | |||||||
| "WI", Series 3010, Interest Only, 5.0%, 7/15/2020 | 222,163 | 22,848 | |||||||
| Principal Amount ($)(a) | Value ($) | ||||||||
| "JS", Series 3572, Interest Only, 6.633%***, 9/15/2039 | 786,433 | 122,593 | |||||||
| Federal National Mortgage Association: | |||||||||
| "BI", Series 2010-13, Interest Only, 5.0%, 12/25/2038 | 100,887 | 8,504 | |||||||
| "SK", Series 2011-78, Interest Only, 5.835%***, 8/25/2041 | 1,516,456 | 216,523 | |||||||
| "PI", Series 2006-20, Interest Only, 6.515%***, 11/25/2030 | 466,906 | 78,656 | |||||||
| "SI", Series 2007-23, Interest Only, 6.605%***, 3/25/2037 | 320,921 | 51,266 | |||||||
| Government National Mortgage Association: | |||||||||
| "BO", Series 2013-10, Principal Only, Zero Coupon, 1/16/2043 | 415,074 | 212,183 | |||||||
| "ZJ", Series 2013-106, 3.5%, 7/20/2043 | 477,452 | 395,320 | |||||||
| "GP", Series 2010-67, 4.5%, 3/20/2039 | 250,000 | 264,448 | |||||||
| "MI", Series 2009-76, Interest Only, 5.0%, 3/20/2035 | 122,850 | 1,601 | |||||||
| "IV", Series 2009-69, Interest Only, 5.5%, 8/20/2039 | 453,825 | 81,853 | |||||||
| "IN", Series 2009-69, Interest Only, 5.5%, 8/20/2039 | 458,651 | 81,365 | |||||||
| "IJ", Series 2009-75, Interest Only, 6.0%, 8/16/2039 | 421,644 | 85,445 | |||||||
| "AI", Series 2007-38, Interest Only, 6.293%***, 6/16/2037 | 117,819 | 16,901 | |||||||
| JPMorgan Mortgage Trust, "2A1", Series 2006-A2, 2.699%**, 4/25/2036 | 320,683 | 284,326 | |||||||
| Merrill Lynch Mortgage Investors Trust, "2A", Series 2003-A6, 2.655%**, 10/25/2033 | 88,507 | 88,063 | |||||||
| Morgan Stanley Mortgage Loan Trust, "5A5", Series 2005-4, 5.5%, 8/25/2035 | 18,245 | 18,239 | |||||||
| Wells Fargo Mortgage-Backed Securities Trust: | |||||||||
| "2A3",Series 2004-EE, 2.613%**, 12/25/2034 | 129,458 | 128,351 | |||||||
| "B1", Series 2004-1, 5.5%, 2/25/2034 | 146,586 | 146,276 | |||||||
Total Collateralized Mortgage Obligations (Cost $2,984,580) | 2,978,581 | ||||||||
| Government & Agency Obligations 19.3% | |||||||||
| Other Government Related (d) 6.5% | |||||||||
| Bank of Moscow, 144A, 6.699%, 3/11/2015 | 250,000 | 262,500 | |||||||
| European Investment Bank: | |||||||||
| 144A, 4.6%, 1/30/2037 | CAD | 1,000,000 | 926,637 | ||||||
| 6.0%, 8/6/2020 | AUD | 500,000 | 477,811 | ||||||
| Gazprom Neft OAO, 144A, 4.375%, 9/19/2022 | 250,000 | 229,063 | |||||||
| KFW, 1.875%, 6/13/2018 | CAD | 421,000 | 389,317 | ||||||
| National JSC Naftogaz of Ukraine, 9.5%, 9/30/2014 | 250,000 | 249,025 | |||||||
| Queensland Treasury Corp., Series 23, 4.25%, 7/21/2023 | AUD | 1,180,000 | 1,009,738 | ||||||
| Vimpel Communications, 144A, 7.748%, 2/2/2021 | 200,000 | 217,250 | |||||||
| VTB Bank OJSC, 144A, 6.0%, 4/12/2017 | 200,000 | 212,500 | |||||||
| 3,973,841 | |||||||||
| Principal Amount ($)(a) | Value ($) | ||||||||
| Sovereign Bonds 6.3% | |||||||||
| Federative Republic of Brazil: | |||||||||
| 4.25%, 1/7/2025 | 200,000 | 190,500 | |||||||
| 12.5%, 1/5/2016 | BRL | 250,000 | 109,940 | ||||||
| Government of Canada, 0.75%, 5/1/2014 | CAD | 1,400,000 | 1,317,074 | ||||||
| Kingdom of Norway, Series 475, 2.0%, 5/24/2023 | NOK | 4,002,000 | 606,539 | ||||||
| Republic of Argentina-Inflation Linked Bond, 5.83%, 12/31/2033 | ARS | 375 | 115 | ||||||
| Republic of Belarus, REG S, 8.75%, 8/3/2015 | 145,000 | 146,450 | |||||||
| Republic of Croatia, 144A, 6.0%, 1/26/2024 | 200,000 | 198,500 | |||||||
| Republic of Singapore, 3.375%, 9/1/2033 | SGD | 862,000 | 716,352 | ||||||
| Republic of Slovenia, 144A, 4.75%, 5/10/2018 | 200,000 | 205,000 | |||||||
| Russian Federation: | |||||||||
| Series 6204, 7.5%, 3/15/2018 | RUB | 2,000,000 | 62,260 | ||||||
| Series 6207, 8.15%, 2/3/2027 | RUB | 4,000,000 | 125,566 | ||||||
| United Mexican States, Series M, 7.75%, 5/29/2031 | MXN | 1,640,000 | 131,494 | ||||||
| 3,809,790 | |||||||||
| U.S. Treasury Obligations 6.5% | |||||||||
| U.S. Treasury Bill, 0.02%****, 2/13/2014 (e) | 152,000 | 151,998 | |||||||
| U.S. Treasury Notes: | |||||||||
| 0.75%, 6/15/2014 | 500,000 | 501,445 | |||||||
| 1.5%, 7/31/2016 | 3,025,000 | 3,094,006 | |||||||
| 1.75%, 5/15/2023 | 253,000 | 228,036 | |||||||
| 3,975,485 | |||||||||
Total Government & Agency Obligations (Cost $12,351,383) | 11,759,116 | ||||||||
| Loan Participations and Assignments 5.0% | |||||||||
| Senior Loans** | |||||||||
| Air Distribution Technologies, Inc., First Lien Term Loan, 4.25%, 11/9/2018 | 64,351 | 64,794 | |||||||
| Avis Budget Car Rental LLC, Term Loan B, 3.0%, 3/15/2019 | 59,849 | 59,872 | |||||||
| Buffalo Gulf Coast Terminals LLC, Term Loan, 5.25%, 10/31/2017 | 74,063 | 74,803 | |||||||
| Burger King Corp., Term Loan B, 3.75%, 9/28/2019 | 69,125 | 69,538 | |||||||
| Calpine Corp., Term Loan B1, 4.0%, 4/2/2018 | 193,508 | 195,182 | |||||||
| Charter Communications Operating LLC, Term Loan E, 3.0%, 7/1/2020 | 194,025 | 193,116 | |||||||
| Chesapeake Energy Corp., Term Loan, 5.75%, 12/1/2017 | 75,000 | 76,682 | |||||||
| Crown Castle International Corp., Term Loan, 3.25%, 1/31/2019 | 49,251 | 49,423 | |||||||
| Cumulus Media Holdings, Inc., Term Loan, Zero Coupon, 12/12/2020 | 30,000 | 30,225 | |||||||
| Goodyear Tire & Rubber Co., Second Lien Term Loan, 4.75%, 4/30/2019 | 220,000 | 222,695 | |||||||
| Principal Amount ($)(a) | Value ($) | ||||||||
| HJ Heinz Co., Term Loan B2, 3.5%, 6/5/2020 | 248,750 | 251,026 | |||||||
| MacDermid, Inc., First Lien Term Loan, 4.0%, 6/8/2020 | 54,725 | 55,221 | |||||||
| MEG Energy Corp., Term Loan, 3.75%, 3/31/2020 | 258,026 | 259,961 | |||||||
| NRG Energy, Inc., Term Loan B, 2.75%, 7/2/2018 | 118,423 | 118,310 | |||||||
| Par Pharmaceutical Companies, Inc., Term Loan B, 4.25%, 9/30/2019 | 118,503 | 119,392 | |||||||
| Pilot Travel Centers LLC: | |||||||||
| Term Loan B, 3.75%, 3/30/2018 | 89,829 | 90,137 | |||||||
| Term Loan B2, 4.25%, 8/7/2019 | 335,750 | 337,850 | |||||||
| Quebecor Media, Inc., Term Loan B1, 3.25%, 8/17/2020 | 89,775 | 89,270 | |||||||
| Samson Investment Co., Second Lien Term Loan, 6.0%, 9/25/2018 | 175,000 | 175,875 | |||||||
| Tallgrass Operations LLC: | |||||||||
| Term Loan B, 4.25%, 11/13/2018 | 51,260 | 51,660 | |||||||
| Term Loan, 5.25%, 11/13/2018 | 109,748 | 110,605 | |||||||
| Travelport LLC, Second Lien Term Loan, 9.5%, 1/29/2016 | 5,040 | 5,231 | |||||||
| Univision Communications, Inc., Term Loan, 4.5%, 3/2/2020 | 59,509 | 59,886 | |||||||
Valeant Pharmaceuticals International, Inc.: | |||||||||
| Term Loan B, 3.75%, 2/13/2019 | 158,794 | 160,095 | |||||||
| Term Loan B, 3.75%, 12/11/2019 | 133,982 | 135,142 | |||||||
Total Loan Participations and Assignments (Cost $3,039,477) | 3,055,991 | ||||||||
| Municipal Bonds and Notes 1.4% | |||||||||
| Chicago, IL, Airport Revenue, O'Hare International Airport, Series B, 6.0%, 1/1/2041 | 145,000 | 155,955 | |||||||
| Massachusetts, State School Building Authority, Sales Tax Revenue, Qualified School Construction Bond, Series A, 4.885%, 7/15/2028 | 300,000 | 303,426 | |||||||
| Orlando & Orange County, FL, Expressway Authority Revenue, Series C, 5.0%, 7/1/2040 | 145,000 | 146,040 | |||||||
| Port Authority of New York & New Jersey, 4.926%, 10/1/2051 | 260,000 | 245,471 | |||||||
Total Municipal Bonds and Notes (Cost $850,852) | 850,892 | ||||||||
| Convertible Bond 0.4% | |||||||||
| Materials | |||||||||
| GEO Specialty Chemicals, Inc., 144A, 7.5%, 3/31/2015 (Cost $118,762) | 120,175 | 232,803 | |||||||
| Preferred Security 0.1% | |||||||||
| Materials | |||||||||
| Hercules, Inc., 6.5%, 6/30/2029 (Cost $59,311) | 95,000 | 82,650 | |||||||
| Shares | Value ($) | |||||||
| Common Stocks 0.1% | ||||||||
| Consumer Discretionary 0.0% | ||||||||
| Dawn Holdings, Inc.* (f) | 1 | 4,221 | ||||||
| Trump Entertainment Resorts, Inc.* | 6 | 0 | ||||||
| Vertis Holdings, Inc.* | 63 | 0 | ||||||
| 4,221 | ||||||||
| Industrials 0.0% | ||||||||
| Congoleum Corp.* | 2,500 | 0 | ||||||
| Materials 0.1% | ||||||||
| GEO Specialty Chemicals, Inc.* | 2,058 | 1,531 | ||||||
| Wolverine Tube, Inc.* | 778 | 25,090 | ||||||
| 26,621 | ||||||||
Total Common Stocks (Cost $45,222) | 30,842 | |||||||
| Preferred Stock 0.1% | ||||||||
| Financials | ||||||||
| Ally Financial, Inc., Series G, 144A, 7.0% (Cost $56,381) | 60 | 57,606 | ||||||
| Warrants 0.0% | ||||||||
| Consumer Discretionary 0.0% | ||||||||
| Reader's Digest Association, Inc., Expiration Date 2/19/2014* | 159 | 0 | ||||||
| Materials 0.0% | ||||||||
| GEO Specialty Chemicals, Inc., Expiration Date 3/31/2015* | 11,138 | 8,200 | ||||||
| Hercules Trust II, Expiration Date 3/31/2029* | 85 | 898 | ||||||
| 9,098 | ||||||||
Total Warrants (Cost $17,432) | 9,098 | |||||||
| Exchange-Traded Fund 1.3% | ||||||||
| SPDR Barclays Convertible Securities (Cost $759,882) | 17,300 | 808,429 | ||||||
| Contract Amount | Value ($) | |||||||
| Call Options Purchased 0.4% | ||||||||
| Options on Interest Rate Swap Contracts | ||||||||
Pay Fixed Rate — 3.72 % – Receive Floating — LIBOR, Swap Expiration Date 4/22/2026, Option Expiration Date 4/20/20161 | 1,300,000 | 86,018 | ||||||
Pay Fixed Rate — 4.19% – Receive Floating — LIBOR, Swap Expiration Date 2/3/2027, Option Expiration Date 2/1/20172 | 1,500,000 | 94,471 | ||||||
Pay Fixed Rate — 4.32% – Receive Floating — LIBOR, Swap Expiration Date 2/3/2027, Option Expiration Date 2/1/20173 | 1,400,000 | 80,993 | ||||||
Total Call Options Purchased (Cost $191,320) | 261,482 | |||||||
| Put Options Purchased 0.0% | ||||||||
| Options on Interest Rate Swap Contracts | ||||||||
Receive Fixed Rate — 2.19% – Pay Floating — LIBOR, Swap Expiration Date 2/3/2027, Option Expiration Date 2/1/20172 | 1,500,000 | 6,681 | ||||||
Receive Fixed Rate — 2.32% – Pay Floating — LIBOR, Swap Expiration Date 2/3/2027, Option Expiration Date 2/1/20173 | 1,400,000 | 7,534 | ||||||
Total Put Options Purchased (Cost $98,573) | 14,215 | |||||||
| Shares | Value ($) | |||||||
| Securities Lending Collateral 1.5% | ||||||||
| Daily Assets Fund Institutional, 0.08% (g) (h) (Cost $927,648) | 927,648 | 927,648 | ||||||
| Cash Equivalents 1.7% | ||||||||
| Central Cash Management Fund, 0.05% (g) (Cost $1,020,194) | 1,020,194 | 1,020,194 | ||||||
| % of Net Assets | Value ($) | |||||||
Total Investment Portfolio (Cost $61,705,325)† | 101.6 | 61,937,943 | ||||||
| Other Assets and Liabilities, Net | (1.6 | ) | (980,934 | ) | ||||
| Net Assets | 100.0 | 60,957,009 | ||||||
The following table represents bonds that are in default:
| Security | Coupon | Maturity Date | Principal Amount | Cost ($) | Value ($) | |||||||||||||
| ERC Ireland Preferred Equity Ltd.* | 7.69 | % | 2/15/2017 | EUR | 88,319 | 120,275 | 0 | |||||||||||
| Hellas Telecommunications Finance* | 8.227 | % | 7/15/2015 | EUR | 109,187 | 32,169 | 0 | |||||||||||
| 152,444 | 0 | |||||||||||||||||
* Non-income producing security.
** Floating rate securities' yields vary with a designated market index or market rate, such as the coupon-equivalent of the U.S. Treasury Bill rate. These securities are shown at their current rate as of December 31, 2013.
*** These securities are shown at their current rate as of December 31, 2013.
****Annualized yield at time of purchase; not a coupon rate.
† The cost for federal income tax purposes was $61,712,106. At December 31, 2013, net unrealized appreciation for all securities based on tax cost was $225,837. This consisted of aggregate gross unrealized appreciation for all securities in which there was an excess of value over tax cost of $2,170,821 and aggregate gross unrealized depreciation for all securities in which there was an excess of tax cost over value of $1,944,984.
(a) Principal amount stated in U.S. dollars unless otherwise noted.
(b) All or a portion of these securities were on loan. In addition, "Other Assets and Liabilities, Net" may include pending sales that are also on loan. The value of securities loaned at December 31, 2013 amounted to $888,134, which is 1.5% of net assets.
(c) When-issued or delayed delivery security included.
(d) Government-backed debt issued by financial companies or government-sponsored enterprises.
(e) At December 31, 2013, this security has been pledged, in whole or in part, to cover initial margin requirements for open futures contracts.
(f) The Fund may purchase securities that are subject to legal or contractual restrictions on resale ("restricted securities"). Restricted securities are securities which have not been registered with the Securities and Exchange Commission under the Securities Act of 1933. The Fund may be unable to sell a restricted security and it may be more difficult to determine a market value for a restricted security. Moreover, if adverse market conditions were to develop during the period between the Fund's decision to sell a restricted security and the point at which the Fund is permitted or able to sell such security, the Fund might obtain a price less favorable than the price that prevailed when it decided to sell. This investment practice, therefore, could have the effect of increasing the level of illiquidity of the Fund. The future value of these securities is uncertain and there may be changes in the estimated value of these securities.
| Schedule of Restricted Securities | Acquisition Date | Cost ($) | Value ($) | Value as % of Net Assets | |||||||||
| Dawn Holdings, Inc.* | August 2013 | 5,273 | 4,221 | .01 | |||||||||
(g) Affiliated fund managed by Deutsche Investment Management Americas Inc. The rate shown is the annualized seven-day yield at period end.
(h) Represents collateral held in connection with securities lending. Income earned by the Fund is net of borrower rebates.
144A: Security exempt from registration under Rule 144A of the Securities Act of 1933. These securities may be resold in transactions exempt from registration, normally to qualified institutional buyers.
CLO: Collateralized Loan Obligation
Interest Only: Interest Only (IO) bonds represent the "interest only" portion of payments on a pool of underlying mortgages or mortgage-backed securities. IO securities are subject to prepayment risk of the pool of underlying mortgages.
LIBOR: London Interbank Offered Rate
PIK: Denotes that all or a portion of the income is paid in-kind in the form of additional principal.
Principal Only: Principal Only (PO) bonds represent the "principal only" portion of payments on a pool of underlying mortgages or mortgage-backed securities.
REG S: Securities sold under Regulation S may not be offered, sold or delivered within the United States or to, or for the account or benefit of, U.S. persons, except pursuant to an exemption from, or in a transaction not subject to, the registration requirements of the Securities Act of 1933.
REIT: Real Estate Investment Trust
SPDR: Standard & Poor's Depositary Receipt
The Fund can invest in certain Senior Loan agreements that include the obligation to make additional loans in certain circumstances. The Fund reserves against such contingent obligations by segregating cash and liquid securities. At December 31, 2013, the Fund had an unfunded loan commitment of $50,000, which could be extended at the option of the borrower, pursuant to the following loan agreement:
| Borrower | Unfunded Loan Commitment ($) | Value ($) | Unrealized Depreciation ($) | |||||||||
| Tallgrass Operations LLC, Term Delay Draw, 11/13/2017 | 50,000 | 49,875 | (125 | ) | ||||||||
At December 31, 2013, open futures contracts purchased were as follows:
| Futures | Currency | Expiration Date | Contracts | Notional Value ($) | Unrealized Depreciation ($) | |||||||||
| 5 Year U.S. Treasury Note | USD | 3/31/2014 | 46 | 5,488,375 | (34,917 | ) | ||||||||
At December 31, 2013, open futures contracts sold were as follows:
| Futures | Currency | Expiration Date | Contracts | Notional Value ($) | Unrealized Appreciation ($) | |||||||||
| 10 Year Japanese Government Bond | JPY | 3/11/2014 | 1 | 1,360,934 | 7,910 | |||||||||
| 90 Day Eurodollar | USD | 12/14/2015 | 9 | 2,224,688 | 2,108 | |||||||||
| U.S. Treasury Long Bond | USD | 3/20/2014 | 4 | 513,250 | 8,992 | |||||||||
| Ultra Long U.S. Treasury Bond | USD | 3/20/2014 | 11 | 1,498,750 | 11,790 | |||||||||
| Total unrealized appreciation | 30,800 | |||||||||||||
At December 31, 2013, open written options contracts were as follows:
| Options on Interest Rate Swap Contracts | Swap Effective/ Expiration Date | Contract Amount | Option Expiration Date | Premiums Received ($) | Value ($) (i) | |||||||||
Call Options Receive Fixed — 3.19% – Pay Floating — LIBOR | 2/3/2017 2/3/2027 | 700,000 | 2 | 2/1/2017 | 50,400 | (79,535 | ) | |||||||
| Receive Fixed — 3.32% – Pay Floating — LIBOR | 2/3/2017 2/3/2027 | 700,000 | 3 | 2/1/2017 | 50,631 | (74,181 | ) | |||||||
| Receive Fixed — 4.22% – Pay Floating — LIBOR | 4/22/2016 4/22/2026 | 1,300,000 | 1 | 4/20/2016 | 46,345 | (59,015 | ) | |||||||
| Total Call Options | 147,376 | (212,731 | ) | |||||||||||
Put Options Pay Fixed — 3.19% – Receive Floating — LIBOR | 2/3/2017 2/3/2027 | 700,000 | 2 | 2/1/2017 | 50,400 | (11,569 | ) | |||||||
| Pay Fixed — 3.32% – Receive Floating — LIBOR | 2/3/2017 2/3/2027 | 700,000 | 3 | 2/1/2017 | 50,631 | (13,400 | ) | |||||||
| Total Put Options | 101,031 | (24,969 | ) | |||||||||||
| Total | 248,407 | (237,700 | ) | |||||||||||
(i) Unrealized appreciation on written options on interest rate swap contracts at December 31, 2013 was $10,707.
At December 31, 2013, open credit default swap contracts sold were as follows:
Effective/ Expiration Dates | Notional Amount ($) (j) | Fixed Cash Flows Received | Underlying Debt Obligation/ Quality Rating (k) | Value ($) | Upfront Payments Paid/ (Received) ($) | Unrealized Appreciation ($) | |||||||||||||||
6/21/2010 9/20/2015 | 90,000 | 4 | 5.0 | % | Ford Motor Co., 6.5%, 8/1/2018, BBB– | 7,296 | (1,604 | ) | 8,900 | ||||||||||||
3/21/2011 6/20/2016 | 120,000 | 2 | 5.0 | % | HCA, Inc., 6.375%, 1/15/2015, B– | 12,039 | 2,217 | 9,822 | |||||||||||||
12/20/2011 3/20/2017 | 60,000 | 5 | 5.0 | % | CIT Group, Inc., 5.5%, 2/15/2019, BB– | 7,234 | 1,627 | 5,607 | |||||||||||||
9/20/2012 12/20/2017 | 75,000 | 6 | 5.0 | % | General Motors Corp., 3.3%, 12/20/2017, BB+ | 11,030 | 4,425 | 6,605 | |||||||||||||
6/20/2013 9/20/2018 | 40,000 | 5 | 5.0 | % | DISH DBS Corp., 6.75%, 6/1/2021, BB– | 5,505 | 3,372 | 2,133 | |||||||||||||
6/20/2013 9/20/2018 | 125,000 | 7 | 5.0 | % | HCA, Inc., 8.0%, 10/1/2018, B– | 16,386 | 9,429 | 6,957 | |||||||||||||
6/20/2013 9/20/2018 | 100,000 | 4 | 5.0 | % | Sprint Communications, Inc., 6.0%, 12/1/2016, BB– | 11,403 | 5,606 | 5,797 | |||||||||||||
| Total unrealized appreciation | 45,821 | ||||||||||||||||||||
(j) The maximum potential amount of future undiscounted payments that the Fund could be required to make under a credit default swap contract would be the notional amount of the contract. These potential amounts would be partially offset by any recovery values of the referenced debt obligation or net amounts received from the settlement of buy protection credit default swap contracts entered into by the Fund for the same referenced debt obligation, if any.
(k) The quality ratings represent the higher of Moody's Investors Service, Inc. ("Moody's") or Standard & Poor's Corporation ("S&P") credit ratings and are unaudited.
At December 31, 2013, open interest rate swap contracts were as follows:
| Centrally Cleared Swaps | ||||||||||||||
Effective/ Expiration Dates | Notional Amount ($) | Cash Flows Paid by the Fund | Cash Flows Received by the Fund | Value ($) | Unrealized Appreciation/ (Depreciation) ($) | |||||||||
12/30/2014 12/30/2016 | 1,900,000 | Fixed — 1.173% | Floating —- LIBOR | (991 | ) | (1,228 | ) | |||||||
12/30/2014 12/30/2024 | 2,300,000 | Fixed — 3.524% | Floating —- LIBOR | 5,146 | 5,383 | |||||||||
| 12/30/201412/30/2019 | 500,000 | Floating —- LIBOR | Fixed — 2.522% | (365 | ) | 102 | ||||||||
12/30/2014 12/30/2034 | 100,000 | Floating —- LIBOR | Fixed — 4.01% | 51 | 765 | |||||||||
12/30/2014 12/30/2044 | 200,000 | Floating —- LIBOR | Fixed — 4.081% | (1,770 | ) | (1,518 | ) | |||||||
| Total net unrealized appreciation | 3,504 | |||||||||||||
Counterparties:
1 Nomura International PLC
2 JPMorgan Chase Securities, Inc.
3 BNP Paribas
4 Bank of America
5 Credit Suisse
6 UBS AG
7 The Goldman Sachs & Co.
At December 31, 2013, the Fund had the following open forward foreign currency exchange contracts:
| Contracts to Deliver | In Exchange For | Settlement Date | Unrealized Appreciation ($) | Counterparty | |||||||||||
| JPY | 130,000,000 | USD | 1,259,226 | 1/6/2014 | 24,776 | Citigroup. Inc. | |||||||||
| CAD | 1,572,402 | NZD | 1,800,000 | 1/6/2014 | 205 | Australia & New Zealand Banking Group Ltd. | |||||||||
| ZAR | 9,500,000 | USD | 917,853 | 1/17/2014 | 14,038 | UBS AG | |||||||||
| NOK | 3,800,000 | USD | 639,400 | 1/23/2014 | 13,354 | UBS AG | |||||||||
| CAD | 2,674,672 | USD | 2,590,356 | 1/23/2014 | 73,685 | Barclays Bank PLC | |||||||||
| SGD | 856,500 | USD | 692,159 | 1/23/2014 | 13,451 | JPMorgan Chase Securities, Inc. | |||||||||
| USD | 883,160 | AUD | 1,000,000 | 1/23/2014 | 8,572 | Commonwealth Bank of Australia | |||||||||
| AUD | 1,000,000 | USD | 892,075 | 1/23/2014 | 343 | Nomura International PLC | |||||||||
| AUD | 1,734,230 | USD | 1,672,843 | 1/23/2014 | 126,375 | UBS AG | |||||||||
| KRW | 779,000,000 | USD | 736,191 | 2/18/2014 | 304 | JPMorgan Chase Securities, Inc. | |||||||||
| Total unrealized appreciation | 275,103 | ||||||||||||||
| Contracts to Deliver | In Exchange For | Settlement Date | Unrealized Depreciation ($) | Counterparty | |||||||||||
| USD | 1,263,802 | JPY | 130,000,000 | 1/6/2014 | (29,351 | ) | Nomura International PLC | ||||||||
| EUR | 105,000 | USD | 144,196 | 1/15/2014 | (252 | ) | Citigroup. Inc. | ||||||||
| USD | 716,586 | SGD | 900,000 | 2/18/2014 | (3,397 | ) | Commonwealth Bank of Australia | ||||||||
| Total unrealized depreciation | (33,000 | ) | |||||||||||||
| Currency Abbreviations |
ARS Argentine Peso AUD Australian Dollar BRL Brazilian Real CAD Canadian Dollar EUR Euro JPY Japanese Yen KRW South Korean Won MXN Mexican Peso NOK Norwegian Krone NZD New Zealand Dollar RUB Russian Ruble SGD Singapore Dollar USD United States Dollar ZAR South African Rand |
For information on the Fund's policy and additional disclosures regarding options purchased, futures contracts, credit default swap contracts, interest rate swap contracts, forward foreign currency exchange contracts and written option contracts, please refer to Note B in the accompanying Notes to Financial Statements.
Fair Value Measurements
Various inputs are used in determining the value of the Fund's investments. These inputs are summarized in three broad levels. Level 1 includes quoted prices in active markets for identical securities. Level 2 includes other significant observable inputs (including quoted prices for similar securities, interest rates, prepayment speeds and credit risk). Level 3 includes significant unobservable inputs (including the Fund's own assumptions in determining the fair value of investments). The level assigned to the securities valuations may not be an indication of the risk or liquidity associated with investing in those securities.
The following is a summary of the inputs used as of December 31, 2013 in valuing the Fund's investments. For information on the Fund's policy regarding the valuation of investments, please refer to the Security Valuation section of Note A in the accompanying Notes to Financial Statements.
| Assets | Level 1 | Level 2 | Level 3 | Total | ||||||||||||
| Fixed Income Investments (l) | ||||||||||||||||
| Corporate Bonds | $ | — | $ | 36,262,465 | $ | 0 | $ | 36,262,465 | ||||||||
| Mortgage-Backed Securities Pass-Throughs | — | 1,030,469 | — | 1,030,469 | ||||||||||||
| Asset-Backed | — | 507,190 | — | 507,190 | ||||||||||||
| Commercial Mortgage-Backed Securities | — | 2,048,272 | — | 2,048,272 | ||||||||||||
| Collateralized Mortgage Obligations | — | 2,978,581 | — | 2,978,581 | ||||||||||||
| Government & Agency Obligations | — | 11,759,116 | — | 11,759,116 | ||||||||||||
| Loan Participations and Assignments | — | 3,055,991 | — | 3,055,991 | ||||||||||||
| Municipal Bonds and Notes | — | 850,892 | — | 850,892 | ||||||||||||
| Convertible Bonds | — | — | 232,803 | 232,803 | ||||||||||||
| Preferred Security | — | 82,650 | — | 82,650 | ||||||||||||
| Common Stocks (l) | — | — | 30,842 | 30,842 | ||||||||||||
| Preferred Stock (l) | — | 57,606 | — | 57,606 | ||||||||||||
| Warrants (l) | — | — | 9,098 | 9,098 | ||||||||||||
| Exchange-Traded Fund | 808,429 | — | — | 808,429 | ||||||||||||
| Short-Term Investments (l) | 1,947,842 | — | — | 1,947,842 | ||||||||||||
Derivatives (m) Purchased Options | — | 275,697 | — | 275,697 | ||||||||||||
| Futures Contracts | 30,800 | — | — | 30,800 | ||||||||||||
| Credit Default Swap Contracts | — | 45,821 | — | 45,821 | ||||||||||||
| Interest Rate Swap Contracts | — | 6,250 | — | 6,250 | ||||||||||||
| Forward Foreign Currency Exchange Contracts | — | 275,103 | — | 275,103 | ||||||||||||
| Total | $ | 2,787,071 | $ | 59,236,103 | $ | 272,743 | $ | 62,295,917 | ||||||||
| Liabilities | Level 1 | Level 2 | Level 3 | Total | ||||||||||||
| Unfunded Loan Commitment | $ | — | $ | (125 | ) | $ | — | $ | (125 | ) | ||||||
Derivatives (m) Futures Contracts | (34,917 | ) | — | — | (34,917 | ) | ||||||||||
| Written Options | — | (237,700 | ) | — | (237,700 | ) | ||||||||||
| Interest Rate Swap Contracts | — | (2,746 | ) | — | (2,746 | ) | ||||||||||
| Forward Foreign Currency Exchange Contracts | — | (33,000 | ) | — | (33,000 | ) | ||||||||||
| Total | $ | (34,917 | ) | $ | (273,571 | ) | $ | — | $ | (308,488 | ) | |||||
During the year ended December 31, 2013, the amount of transfers between Level 2 and Level 3 was $35. Investments were transferred from Level 2 to Level 3 because of the lack of observable market data due to a decrease in market activity.
Transfers between price levels are recognized at the beginning of the reporting period.
(l) See Investment Portfolio for additional detailed categorizations.
(m) Derivatives include value of options purchased, unrealized appreciation (depreciation) on open futures contracts, credit default swap contracts, interest rate swap contracts and forward foreign currency exchange contracts, and written options, at value.
The accompanying notes are an integral part of the financial statements.
| as of December 31, 2013 | ||||
| Assets | ||||
Investments: Investments in non-affiliated securities, at value (cost $59,757,483) — including $888,134 of securities loaned | $ | 59,990,101 | ||
| Investment in Daily Assets Fund Institutional (cost $927,648)* | 927,648 | |||
| Investment in Central Cash Management Fund (cost $1,020,194) | 1,020,194 | |||
| Total investments in securities, at value (cost $61,705,325) | 61,937,943 | |||
| Cash | 39,571 | |||
| Foreign currency, at value (cost $106,381) | 106,091 | |||
| Receivable for investments sold | 17,344 | |||
| Receivable for Fund shares sold | 49,550 | |||
| Dividends receivable | 8,367 | |||
| Interest receivable | 796,749 | |||
| Receivable for variation margin on futures contracts | 11,254 | |||
| Receivable for variation margin on centrally cleared swaps | 2,071 | |||
| Unrealized appreciation on swap contracts | 45,821 | |||
| Unrealized appreciation on forward foreign currency exchange contracts | 275,103 | |||
| Upfront payments paid on swap contracts | 26,676 | |||
| Due from Advisor | 3,676 | |||
| Other assets | 1,690 | |||
| Total assets | $ | 63,321,906 | ||
| Liabilities | ||||
| Payable upon return of securities loaned | 927,648 | |||
| Payable for investments purchased | 40,753 | |||
| Payable for investments purchased — when-issued/delayed delivery securities | 1,064,615 | |||
| Payable for Fund shares redeemed | 73 | |||
| Options written, at value (premiums received $248,407) | 237,700 | |||
| Net payable for pending swaps | 9,476 | |||
| Unrealized depreciation on forward foreign currency exchange contracts | 33,000 | |||
| Unrealized depreciation on unfunded loan commitment | 125 | |||
| Upfront payments received on swap contracts | 1,604 | |||
| Accrued Trustees' fees | 1,546 | |||
| Other accrued expenses and payables | 48,357 | |||
| Total liabilities | 2,364,897 | |||
| Net assets, at value | $ | 60,957,009 | ||
| Net Assets Consist of | ||||
| Undistributed net investment income | 2,602,311 | |||
Net unrealized appreciation (depreciation) on: Investments | 232,618 | |||
| Swap contracts | 49,325 | |||
| Futures | (4,117 | ) | ||
| Unfunded loan commitment | (125 | ) | ||
| Foreign currency | 251,317 | |||
| Written options | 10,707 | |||
| Accumulated net realized gain (loss) | (1,037,195 | ) | ||
| Paid-in-capital | 58,852,168 | |||
| Net assets, at value | $ | 60,957,009 | ||
Class A Net Asset Value, offering and redemption price per share ($60,957,009 ÷ 5,284,551 outstanding shares of beneficial interest, no par value, unlimited number of shares authorized) | $ | 11.53 | ||
* Represents collateral on securities loaned.
The accompanying notes are an integral part of the financial statements.
| for the year ended December 31, 2013 | ||||
| Investment Income | ||||
Income: Interest (net of foreign taxes withheld of $1,164) | $ | 3,393,333 | ||
| Dividends | 25,563 | |||
| Income distributions — Central Cash Management Fund | 4,729 | |||
| Securities lending income, including income from Daily Assets Fund Institutional, net of borrower rebates | 3,880 | |||
| Total income | 3,427,505 | |||
Expenses: Management fee | 384,985 | |||
| Administration fee | 69,997 | |||
| Services to shareholders | 882 | |||
| Custodian fee | 75,335 | |||
| Audit and tax fees | 71,796 | |||
| Legal fees | 12,447 | |||
| Reports to shareholders | 34,546 | |||
| Pricing fee | 56,183 | |||
| Trustees' fees and expenses | 4,887 | |||
| Other | 4,134 | |||
| Total expenses before expense reductions | 715,192 | |||
| Expense reductions | (198,692 | ) | ||
| Total expenses after expense reductions | 516,500 | |||
| Net investment income (loss) | 2,911,005 | |||
| Realized and Unrealized Gain (Loss) | ||||
Net realized gain (loss) from: Investments | (386,939 | ) | ||
| Swap contracts | 236,214 | |||
| Futures | (909,441 | ) | ||
| Written options | 65,881 | |||
| Foreign currency | (192,341 | ) | ||
| (1,186,626 | ) | |||
Change in net unrealized appreciation (depreciation) on: Investments | (2,656,746 | ) | ||
| Swap contracts | (106,914 | ) | ||
| Unfunded loan commitment | (243 | ) | ||
| Futures | 27,844 | |||
| Written options | (129,472 | ) | ||
| Foreign currency | 246,090 | |||
| (2,619,441 | ) | |||
| Net gain (loss) | (3,806,067 | ) | ||
| Net increase (decrease) in net assets resulting from operations | $ | (895,062 | ) | |
The accompanying notes are an integral part of the financial statements.
| Years Ended December 31, | ||||||||
| Increase (Decrease) in Net Assets | 2013 | 2012 | ||||||
Operations: Net investment income | $ | 2,911,005 | $ | 3,374,357 | ||||
| Net realized gain (loss) | (1,186,626 | ) | 2,896,387 | |||||
| Change in net unrealized appreciation (depreciation) | (2,619,441 | ) | 2,483,404 | |||||
| Net increase (decrease) in net assets resulting from operations | (895,062 | ) | 8,754,148 | |||||
Distributions to shareholders from: Net investment income: Class A | (3,703,120 | ) | (4,311,037 | ) | ||||
Net realized gains: Class A | (2,113,421 | ) | (143,246 | ) | ||||
| Total distributions | (5,816,541 | ) | (4,454,283 | ) | ||||
Fund share transactions: Class A Proceeds from shares sold | 8,233,284 | 8,860,430 | ||||||
| Reinvestment of distributions | 5,816,541 | 4,454,283 | ||||||
| Payments for shares redeemed | (19,881,192 | ) | (13,217,365 | ) | ||||
| Net increase (decrease) in net assets from Class A share transactions | (5,831,367 | ) | 97,348 | |||||
| Increase (decrease) in net assets | (12,542,970 | ) | 4,397,213 | |||||
| Net assets at beginning of period | 73,499,979 | 69,102,766 | ||||||
| Net assets at end of period (including undistributed net investment income of $2,602,311 and $3,595,395, respectively) | $ | 60,957,009 | $ | 73,499,979 | ||||
| Other Information | ||||||||
Class A Shares outstanding at beginning of period | 5,832,490 | 5,808,640 | ||||||
| Shares sold | 666,814 | 731,149 | ||||||
| Shares issued to shareholders in reinvestment of distributions | 491,677 | 381,360 | ||||||
| Shares redeemed | (1,706,430 | ) | (1,088,659 | ) | ||||
| Net increase (decrease) in Class A shares | (547,939 | ) | 23,850 | |||||
| Shares outstanding at end of period | 5,284,551 | 5,832,490 | ||||||
The accompanying notes are an integral part of the financial statements.
| Years Ended December 31, | |||||||||||||||||||||
| Class A | 2013 | 2012 | 2011 | 2010 | 2009 | ||||||||||||||||
| Selected Per Share Data | |||||||||||||||||||||
| Net asset value, beginning of period | $ | 12.60 | $ | 11.90 | $ | 11.96 | $ | 11.61 | $ | 10.03 | |||||||||||
Income (loss) from investment operations: Net investment incomea | .49 | .57 | .63 | .66 | .63 | ||||||||||||||||
| Net realized and unrealized gain (loss) | (.59 | ) | .92 | (.01 | ) | .47 | 1.50 | ||||||||||||||
| Total from investment operations | (.10 | ) | 1.49 | .62 | 1.13 | 2.13 | |||||||||||||||
Less distributions from: Net investment income | (.62 | ) | (.76 | ) | (.68 | ) | (.78 | ) | (.55 | ) | |||||||||||
| Net realized gains | (.35 | ) | (.03 | ) | — | — | — | ||||||||||||||
| Total distributions | (.97 | ) | (.79 | ) | (.68 | ) | (.78 | ) | (.55 | ) | |||||||||||
| Net asset value, end of period | $ | 11.53 | $ | 12.60 | $ | 11.90 | $ | 11.96 | $ | 11.61 | |||||||||||
Total Return (%)b | (1.04 | ) | 13.08 | 5.31 | 10.05 | 22.73 | |||||||||||||||
| Ratios to Average Net Assets and Supplemental Data | |||||||||||||||||||||
| Net assets, end of period ($ millions) | 61 | 73 | 69 | 76 | 74 | ||||||||||||||||
| Ratio of expenses before expense reductions (%) | 1.02 | .99 | .99 | .95 | .86 | ||||||||||||||||
| Ratio of expenses after expense reductions (%) | .74 | .77 | .79 | .86 | .80 | ||||||||||||||||
| Ratio of net investment income (%) | 4.16 | 4.72 | 5.38 | 5.62 | 5.96 | ||||||||||||||||
| Portfolio turnover rate (%) | 183 | 164 | 144 | 167 | 370 | ||||||||||||||||
a Based on average shares outstanding during the period. b Total return would have been lower had certain expenses not been reduced. | |||||||||||||||||||||
A. Organization and Significant Accounting Policies
DWS Unconstrained Income VIP (the "Fund") is a diversified series of DWS Variable Series II (the "Trust"), which is registered under the Investment Company Act of 1940, as amended (the "1940 Act"), as an open-end management investment company organized as a Massachusetts business trust.
The Fund's financial statements are prepared in accordance with accounting principles generally accepted in the United States of America which require the use of management estimates. Actual results could differ from those estimates. The policies described below are followed consistently by the Fund in the preparation of its financial statements.
Security Valuation. Investments are stated at value determined as of the close of regular trading on the New York Stock Exchange on each day the exchange is open for trading.
Various inputs are used in determining the value of the Fund's investments. These inputs are summarized in three broad levels. Level 1 includes quoted prices in active markets for identical securities. Level 2 includes other significant observable inputs (including quoted prices for similar securities, interest rates, prepayment speeds and credit risk). Level 3 includes significant unobservable inputs (including the Fund's own assumptions in determining the fair value of investments). The level assigned to the securities valuations may not be an indication of the risk or liquidity associated with investing in those securities.
Debt securities and loan participations and assignments are valued at prices supplied by independent pricing services approved by the Fund's Board. Such services may use various pricing techniques which take into account appropriate factors such as yield, quality, coupon rate, maturity, type of issue, trading characteristics, prepayment speeds and other data, as well as broker quotes. If the pricing services are unable to provide valuations, debt securities are valued at the average of the most recent reliable bid quotations or evaluated prices, as applicable, obtained from broker-dealers and loan participations and assignments are valued at the mean of the most recent bid and ask quotations or evaluated prices, as applicable, obtained from one or more broker-dealers. These securities are generally categorized as Level 2.
Equity securities and exchange-traded funds ("ETFs") are valued at the most recent sale price or official closing price reported on the exchange (U.S. or foreign) or over-the-counter market on which they trade. Securities or ETFs for which no sales are reported are valued at the calculated mean between the most recent bid and asked quotations on the relevant market or, if a mean cannot be determined, at the most recent bid quotation. Equity securities and ETFs are generally categorized as Level 1.
Money market instruments purchased with an original or remaining maturity of sixty days or less, maturing at par, are valued at amortized cost, which approximates value, and are categorized as Level 2. Investments in open-end investment companies are valued at their net asset value each business day and are categorized as Level 1.
Futures contracts are generally valued at the settlement prices established each day on the exchange on which they are traded and are categorized as Level 1.
Forward currency contracts are valued at the prevailing forward exchange rate of the underlying currencies and are categorized as Level 2.
Swap contracts are valued daily based upon prices supplied by a Board approved pricing vendor, if available, and otherwise are valued at the price provided by the broker-dealer. Swap contracts are generally categorized as Level 2.
Exchange-traded options are valued at the last sale price or, in the absence of a sale, the mean between the closing bid and asked prices or at the most recent asked price (bid for purchased options) if no bid or asked price are available. Exchange-traded options are categorized as Level 1. Over-the-counter written or purchased options are valued at prices supplied by a Board approved pricing vendor, if available, and otherwise are valued at the price provided by the broker-dealer with which the option was traded. Over-the-counter written or purchased options are generally categorized as Level 2.
Securities and other assets for which market quotations are not readily available or for which the above valuation procedures are deemed not to reflect fair value are valued in a manner that is intended to reflect their fair value as determined in accordance with procedures approved by the Board and are generally categorized as Level 3. In accordance with the Fund's valuation procedures, factors used in determining value may include, but are not limited to, the type of the security; the size of the holding; the initial cost of the security; the existence of any contractual restrictions on the security's disposition; the price and extent of public trading in similar securities of the issuer or of comparable companies; quotations or evaluated prices from broker-dealers and/or pricing services; information obtained from the issuer, analysts, and/or the appropriate stock exchange (for exchange-traded securities); an analysis of the company's or issuer's financial statements; an evaluation of the forces that influence the issuer and the market(s) in which the security is purchased and sold; and with respect to debt securities, the maturity, coupon, creditworthiness, currency denomination and the movement of the market in which the security is normally traded. The value determined under these procedures may differ from published values for the same securities.
Disclosure about the classification of fair value measurements is included in a table following the Fund's Investment Portfolio.
Foreign Currency Translations. The books and records of the Fund are maintained in U.S. dollars. Investment securities and other assets and liabilities denominated in a foreign currency are translated into U.S. dollars at the prevailing exchange rates at period end. Purchases and sales of investment securities, income and expenses are translated into U.S. dollars at the prevailing exchange rates on the respective dates of the transactions.
Net realized and unrealized gains and losses on foreign currency transactions represent net gains and losses between trade and settlement dates on securities transactions, the acquisition and disposition of foreign currencies, and the difference between the amount of net investment income accrued and the U.S. dollar amount actually received. That portion of both realized and unrealized gains and losses on investments that results from fluctuations in foreign currency exchange rates is not separately disclosed but is included with net realized and unrealized gain/appreciation and loss/depreciation on investments.
Securities Lending. Deutsche Bank AG, as lending agent, lends securities of the Fund to certain financial institutions under the terms of the Security Lending Agreement. The Fund retains benefits of owning the securities it has loaned and continues to receive interest and dividends generated by the securities and to participate in any changes in their market value. The Fund requires the borrowers of the securities to maintain collateral with the Fund consisting of either cash or liquid, unencumbered assets having a value at least equal to the value of the securities loaned. When the collateral falls below specified amounts, the lending agent will use its best effort to obtain additional collateral on the next business day to meet required amounts under the security lending agreement. The Fund may invest the cash collateral into a joint trading account in an affiliated money market fund pursuant to Exemptive Orders issued by the SEC. The Fund receives compensation for lending its securities either in the form of fees or by earning interest on invested cash collateral net of borrower rebates and fees paid to a lending agent. Either the Fund or the borrower may terminate the loan. There may be risks of delay and costs in recovery of securities or even loss of rights in the collateral should the borrower of the securities fail financially. If the Fund is not able to recover securities lent, the Fund may sell the collateral and purchase a replacement investment in the market, incurring the risk that the value of the replacement security is greater than the value of the collateral. The Fund is also subject to all investment risks associated with the reinvestment of any cash collateral received, including, but not limited to, interest rate, credit and liquidity risk associated with such investments.
As of December 31, 2013, the Fund had securities on loan. The value of the related collateral exceeded the value of the securities loaned at period end.
Loan Participations and Assignments. Loan Participations and Assignments are portions of loans originated by banks and sold in pieces to investors. These fixed- and floating-rate loans ("Loans") in which the Fund invests are arranged between the borrower and one or more financial institutions ("Lenders"). These Loans may take the form of Senior Loans, which are corporate obligations often issued in connection with recapitalizations, acquisitions, leveraged buy outs and refinancing. The Fund invests in such Loans in the form of participations in Loans ("Participations") or assignments of all or a portion of Loans from third parties ("Assignments"). Participations typically result in the Fund having a contractual relationship with only the Lender, not with the borrower. The Fund has the right to receive payments of principal, interest and any fees to which it is entitled from the Lender selling the Participation and only upon receipt by the Lender of the payments from the borrower. In connection with purchasing Participations, the Fund generally has no right to enforce compliance by the borrower with the terms of the loan agreement relating to the Loan, or any rights of set off against the borrower, and the Fund will not benefit directly from any collateral supporting the Loan in which it has purchased the Participation. As a result, the Fund assumes the credit risk of both the borrower and the Lender that is selling the Participation. Assignments typically result in the Fund having a direct contractual relationship with the borrower, and the Fund may enforce compliance by the borrower with the terms of the loan agreement. Loans held by the Fund are generally in the form of Assignments, but the Fund may also invest in Participations. All Loans involve interest rate risk, liquidity risk and credit risk, including the potential default or insolvency of the borrower.
When-Issued/Delayed Delivery Securities. The Fund may purchase or sell securities with delivery or payment to occur at a later date beyond the normal settlement period. At the time the Fund enters into a commitment to purchase or sell a security, the transaction is recorded and the value of the transaction is reflected in the net asset value. The price of such security and the date when the security will be delivered and paid for are fixed at the time the transaction is negotiated. The value of the security may vary with market fluctuations. At the time the Fund enters into this type of transaction, it is required to segregate cash or other liquid assets at least equal to the amount of the commitment.
Certain risks may arise upon entering into when-issued or delayed delivery transactions from the potential inability of counterparties to meet the terms of their contracts or if the issuer does not issue the securities due to political, economic, or other factors. Additionally, losses may arise due to changes in the value of the underlying securities.
Taxes. The Fund's policy is to comply with the requirements of the Internal Revenue Code, as amended, which are applicable to regulated investment companies and to distribute all of its taxable income to its shareholders.
Additionally, the Fund may be subject to taxes imposed by the governments of countries in which it invests and are generally based on income and/or capital gains earned or repatriated. Estimated tax liabilities on certain foreign securities are recorded on an accrual basis and are reflected as components of interest income or net change in unrealized gain/loss on investments. Tax liabilities realized as a result of security sales are reflected as a component of net realized gain/loss on investments.
At December 31, 2013, the Fund had net tax basis capital loss carryforwards of approximately $1,042,000, which may be applied against realized net taxable capital gains indefinitely, including short-term losses ($671,000) and long-term losses ($371,000).
The Fund has reviewed the tax positions for the open tax years as of December 31, 2013 and has determined that no provision for income tax is required in the Fund's financial statements. The Fund's federal tax returns for the prior three fiscal years remain open subject to examination by the Internal Revenue Service.
Distribution of Income and Gains. Distributions from net investment income of the Fund, if any, are declared and distributed to shareholders annually. Net realized gains from investment transactions, in excess of available capital loss carryforwards, would be taxable to the Fund if not distributed and, therefore, will be distributed to shareholders at least annually. The Fund may also make additional distributions for tax purposes if necessary.
The timing and characterization of certain income and capital gain distributions are determined annually in accordance with federal tax regulations which may differ from accounting principles generally accepted in the United States of America. These differences primarily relate to investments in foreign denominated investments, forward currency contracts, futures contracts, swap contracts and certain securities sold at a loss. As a result, net investment income (loss) and net realized gain (loss) on investment transactions for a reporting period may differ significantly from distributions during such period. Accordingly, the Fund may periodically make reclassifications among certain of its capital accounts without impacting the net asset value of the Fund.
At December 31, 2013, the Fund's components of distributable earnings on a tax basis were as follows:
| Undistributed ordinary income* | $ | 2,880,005 | ||
| Capital loss carryforwards | $ | (1,042,000 | ) | |
| Unrealized appreciation (depreciation) on investments | $ | 225,837 |
In addition, the tax character of distributions paid by the Fund is summarized as follows:
| Years Ended December 31, | ||||||||
| 2013 | 2012 | |||||||
| Distributions from ordinary income* | $ | 5,146,797 | $ | 4,311,037 | ||||
| Distributions from long-term capital gains | $ | 669,744 | $ | 143,246 | ||||
* For tax purposes, short-term capital gain distributions are considered ordinary income distributions.
Expenses. Expenses of the Trust arising in connection with a specific fund are allocated to that fund. Other Trust expenses which cannot be directly attributed to a fund are apportioned among the funds in the Trust based upon the relative net assets or other appropriate measures.
Contingencies. In the normal course of business, the Fund may enter into contracts with service providers that contain general indemnification clauses. The Fund's maximum exposure under these arrangements is unknown, as this would involve future claims that may be made against the Fund that have not yet been made. However, based on experience, the Fund expects the risk of loss to be remote.
Other. Investment transactions are accounted for on a trade date plus one basis for daily net asset value calculations. However, for financial reporting purposes, investment transactions are reported on trade date. Interest income is recorded on the accrual basis. Dividend income is recorded on the ex-dividend date net of foreign withholding taxes. Realized gains and losses from investment transactions are recorded on an identified cost basis. Proceeds from litigation payments, if any, are included in net realized gain (loss) from investments. All discounts and premiums are accreted/amortized for both tax and financial reporting purposes for the Fund, with the exception of securities in default of principal.
B. Derivative Instruments
Swaps. A swap is a contract between two parties to exchange future cash flows at periodic intervals based on the notional amount of the swap. A bilateral swap is a transaction between the fund and a counterparty where cash flows are exchanged between the two parties. A centrally cleared swap is a transaction executed between the fund and a counterparty, then cleared by a clearing member through a central clearinghouse. The central clearinghouse serves as the counterparty, with whom the fund exchanges cash flows.
The value of a swap is adjusted daily, and the change in value, if any, is recorded as unrealized appreciation or depreciation in the Statement of Assets and Liabilities. Gains or losses are realized when the swap expires or is closed. Certain risks may arise when entering into swap transactions including counterparty default; liquidity; or unfavorable changes in interest rates or the value of the underlying reference security, commodity or index. In connection with bilateral swaps, securities and/or cash may be identified as collateral in accordance with the terms of the swap agreement to provide assets of value and recourse in the event of default. The maximum counterparty credit risk is the net present value of the cash flows to be received from or paid to the counterparty over the term of the swap, to the extent that this amount is beneficial to the Fund, in addition to any related collateral posted to the counterparty by the Fund. This risk may be partially reduced by a master netting arrangement between the Fund and the counterparty. Upon entering into a centrally cleared swap, the Fund is required to deposit with a financial intermediary cash or securities ("initial margin") in an amount equal to a certain percentage of the notional amount of the swap. Subsequent payments ("variation margin") are made or received by the Fund dependent upon the daily fluctuations in the value of the swap. In a cleared swap transaction, counterparty risk is minimized as the central clearinghouse acts as the counterparty.
An upfront payment, if any, made by the Fund is recorded as an asset in the Statement of Assets and Liabilities. An upfront payment, if any, received by the Fund is recorded as a liability in the Statement of Assets and Liabilities. Payments received or made at the end of the measurement period are recorded as realized gain or loss in the Statement of Operations.
Interest Rate Swaps. Interest rate swaps are agreements in which the Fund agrees to pay to the counterparty a fixed rate payment in exchange for the counterparty agreeing to pay to the Fund a variable rate payment, or the Fund agrees to receive from the counterparty a fixed rate payment in exchange for the counterparty agreeing to receive from the Fund a variable rate payment. The payment obligations are based on the notional amount of the swap. For the year ended December 31, 2013, the Fund entered into interest rate swap agreements to gain exposure to different parts of the yield curve while managing overall duration.
A summary of the open interest rate swap contracts as of December 31, 2013 is included in a table following the Fund's Investment Portfolio. For the year ended December 31, 2013, the investment in interest rate swap contracts had a total notional amount generally indicative of a range from $4,500,000 to $5,000,000.
Credit Default Swaps. Credit default swaps are agreements between a buyer and a seller of protection against predefined credit events for the reference entity. The Fund may enter into credit default swaps to gain exposure to an underlying issuer's credit quality characteristics without directly investing in that issuer or to hedge against the risk of a credit event on debt securities. As a seller of a credit default swap, the Fund is required to pay the par (or other agreed-upon) value of the referenced entity to the counterparty with the occurrence of a credit event by a third party, such as a U.S. or foreign corporate issuer, on the reference entity, which would likely result in a loss to the Fund. In return, the Fund receives from the counterparty a periodic stream of payments over the term of the swap provided that no credit event has occurred. If no credit event occurs, the Fund keeps the stream of payments with no payment obligations. The Fund may also buy credit default swaps, in which case the Fund functions as the counterparty referenced above. This involves the risk that the swap may expire worthless. It also involves counterparty risk that the seller may fail to satisfy its payment obligations to the Fund with the occurrence of a credit event. When the Fund sells a credit default swap, it will cover its commitment. This may be achieved by, among other methods, maintaining cash or liquid assets equal to the aggregate notional value of the reference entities for all outstanding credit default swaps sold by the Fund. For the year ended December 31, 2013, the Fund entered into credit default swap agreements to gain exposure to the underlying issuer's credit quality characteristics.
Under the terms of a credit default swap, the Fund receives or makes periodic payments based on a specified interest rate on a fixed notional amount. These payments are recorded as a realized gain or loss in the Statement of Operations. Payments received or made as a result of a credit event or termination of the swap are recognized, net of a proportional amount of the upfront payment, as realized gains or losses in the Statement of Operations.
A summary of the open credit default swap contracts as of December 31, 2013 is included in a table following the Fund's Investment Portfolio. For the year ended December 31, 2013, the investment in credit default swap contracts sold had a total notional value generally indicative of a range from $415,000 to $2,195,000.
Options. An option contract is a contract in which the writer (seller) of the option grants the buyer of the option, upon payment of a premium, the right to purchase from (call option), or sell to (put option), the writer a designated instrument at a specified price within a specified period of time. The Fund may write or purchase interest rate swaption agreements which are options to enter into a pre-defined swap agreement. The interest rate swaption agreement will specify whether the buyer of the swaption will be a fixed-rate receiver or a fixed-rate payer upon exercise. Certain options, including options on indices, will require cash settlement by the Fund if the option is exercised. For the year ended December 31, 2013, the Fund entered into options on interest rate futures and on interest rates swaps in order to hedge against potential adverse interest rate movements of portfolio assets.
If the Fund writes a covered call option, the Fund foregoes, in exchange for the premium, the opportunity to profit during the option period from an increase in the market value of the underlying security above the exercise price. If the Fund writes a put option it accepts the risk of a decline in the value of the underlying security below the exercise price. Over-the-counter options have the risk of the potential inability of counterparties to meet the terms of their contracts. The Fund's maximum exposure to purchased options is limited to the premium initially paid. In addition, certain risks may arise upon entering into option contracts including the risk that an illiquid secondary market will limit the Fund's ability to close out an option contract prior to the expiration date and that a change in the value of the option contract may not correlate exactly with changes in the value of the securities.
A summary of the open purchased option contracts as of December 31, 2013 is included in the Fund's Investment Portfolio. A summary of open written option contracts is included in a table following the Fund's Investment Portfolio. For the year ended December 31, 2013, the investment in written option contracts had a total value generally indicative of a range from approximately $224,000 to $561,000, and purchased option contracts had a total value generally indicative of a range from approximately $251,000 to $423,000.
Futures Contracts. A futures contract is an agreement between a buyer or seller and an established futures exchange or its clearinghouse in which the buyer or seller agrees to take or make a delivery of a specific amount of a financial instrument at a specified price on a specific date (settlement date). For the year ended December 31, 2013, the Fund entered into interest rate futures to gain exposure to different parts of the yield curve while managing overall duration and for non-hedging purposes to seek to enhance potential gains.
Upon entering into a futures contract, the Fund is required to deposit with a financial intermediary cash or securities ("initial margin") in an amount equal to a certain percentage of the face value indicated in the futures contract. Subsequent payments ("variation margin") are made or received by the Fund dependent upon the daily fluctuations in the value and are recorded for financial reporting purposes as unrealized gains or losses by the Fund. Gains or losses are realized when the contract expires or is closed. Since all futures contracts are exchange-traded, counterparty risk is minimized as the exchange's clearinghouse acts as the counterparty, and guarantees the futures against default.
Certain risks may arise upon entering into futures contracts, including the risk that an illiquid market will limit the Fund's ability to close out a futures contract prior to the settlement date and the risk that the futures contract is not well correlated with the security, index or currency to which it relates. Risk of loss may exceed amounts disclosed in the Statement of Assets and Liabilities.
A summary of the open futures contracts as of December 31, 2013 is included in a table following the Fund's Investment Portfolio. For the year ended December 31, 2013, the investment in futures contracts purchased had a total notional value generally indicative of a range from approximately $4,855,000 to $7,631,000, and the investment in futures contracts sold had a total notional value generally indicative of a range from approximately $2,488,000 to $28,086,000.
Forward Foreign Currency Exchange Contracts. A forward foreign currency exchange contract ("forward currency contract") is a commitment to purchase or sell a foreign currency at the settlement date at a negotiated rate. For the year ended December 31, 2013, the Fund entered into forward currency contracts in order to hedge against anticipated currency market changes and for non-hedging purposes to seek to enhance potential gains.
Forward currency contracts are valued at the prevailing forward exchange rate of the underlying currencies and unrealized gain (loss) is recorded daily. On the settlement date of the forward currency contract, the Fund records a realized gain or loss equal to the difference between the value of the contract at the time it was opened and the value of the contract at the time it was closed. Certain risks may arise upon entering into forward currency contracts from the potential inability of counterparties to meet the terms of their contracts. The maximum counterparty credit risk to the Fund is measured by the unrealized gain on appreciated contracts. Additionally, when utilizing forward currency contracts to hedge, the Fund gives up the opportunity to profit from favorable exchange rate movements during the term of the contract.
A summary of the open forward currency contracts as of December 31, 2013 is included in a table following the Fund's Investment Portfolio. For the year ended December 31, 2013, the investment in forward currency contracts short vs. U.S. dollars had a total contract value generally indicative of a range from approximately $6,896,000 to $19,799,000, and the investment in forward currency contracts long vs. U.S. dollars had a total contract value generally indicative of a range from approximately $2,431,000 to $14,678,000. The investment in forward currency contracts long vs. other foreign currencies sold had a total contract value generally indicative of a range from $0 to approximately $4,795,000.
The following tables summarize the value of the Fund's derivative instruments held as of December 31, 2013 and the related location in the accompanying Statement of Assets and Liabilities, presented by primary underlying risk exposure:
| Asset Derivatives | Purchased Options | Forward Contracts | Swap Contracts | Futures Contracts | Total | |||||||||||||||
| Interest Rate Contracts (a) (b) | $ | 275,697 | $ | — | $ | 6,250 | $ | 30,800 | $ | 312,747 | ||||||||||
| Credit Contracts (b) | — | — | 45,821 | — | 45,821 | |||||||||||||||
| Foreign Exchange Contracts (c) | — | 275,103 | — | — | 275,103 | |||||||||||||||
| $ | 275,697 | $ | 275,103 | $ | 52,071 | $ | 30,800 | $ | 633,671 | |||||||||||
Each of the above derivatives is located in the following Statement of Assets and Liabilities accounts: (a) Includes cumulative appreciation of futures and centrally cleared swap contracts as disclosed in the Investment Portfolio. Unsettled variation margin is disclosed separately within the Statement of Assets and Liabilities. (b) Investments in securities, at value (includes purchased options) and unrealized appreciation on swap contracts, respectively (c) Unrealized appreciation on forward foreign currency exchange contracts | ||||||||||||||||||||
| Liability Derivatives | Written Options | Forward Contracts | Swap Contracts | Futures Contracts | Total | |||||||||||||||
| Interest Rate Contracts (a) (b) | $ | (237,700 | ) | $ | — | $ | (2,746 | ) | $ | (34,917 | ) | $ | (275,363 | ) | ||||||
| Foreign Exchange Contracts (c) | — | (33,000 | ) | — | — | (33,000 | ) | |||||||||||||
| $ | (237,700 | ) | $ | (33,000 | ) | $ | (2,746 | ) | $ | (34,917 | ) | $ | (308,363 | ) | ||||||
Each of the above derivatives is located in the following Statement of Assets and Liabilities accounts: (a) Includes cumulative depreciation of futures and centrally cleared swap contracts as disclosed in the Investment Portfolio. Unsettled variation margin is disclosed separately within the Statement of Assets and Liabilities. (b) Options written, at value (c) Unrealized depreciation on forward foreign currency exchange contracts | ||||||||||||||||||||
Additionally, the amount of unrealized and realized gains and losses on derivative instruments recognized in Fund earnings during the year ended December 31, 2013 and the related location in the accompanying Statement of Operations is summarized in the following tables by primary underlying risk exposure:
| Realized Gain (Loss) | Purchased Options | Written Options | Forward Contracts | Swap Contracts | Futures Contracts | Total | ||||||||||||||||||
| Interest Rate Contracts (a) | $ | (5,551 | ) | $ | 65,881 | $ | — | $ | 133,959 | $ | (909,441 | ) | $ | (715,152 | ) | |||||||||
| Credit Contracts (a) | — | — | — | 102,255 | — | 102,255 | ||||||||||||||||||
| Foreign Exchange Contracts (b) | — | — | (193,142 | ) | — | — | (193,142 | ) | ||||||||||||||||
| $ | (5,551 | ) | $ | 65,881 | $ | (193,142 | ) | $ | 236,214 | $ | (909,441 | ) | $ | (806,039 | ) | |||||||||
Each of the above derivatives is located in the following Statement of Operations accounts: (a) Net realized gain (loss) from investments (includes purchased options), written options, swap contracts and futures, respectively (b) Net realized gain (loss) from foreign currency (Statement of Operations includes both forward currency contracts and foreign currency transactions) | ||||||||||||||||||||||||
| Change in Net Unrealized Appreciation (Depreciation) | Purchased Options | Written Options | Forward Contracts | Swap Contracts | Futures Contracts | Total | ||||||||||||||||||
| Interest Rate Contracts (a) | $ | 133,856 | $ | (129,472 | ) | $ | — | $ | (75,983 | ) | $ | 27,844 | $ | (43,755 | ) | |||||||||
| Credit Contracts (a) | — | — | — | (30,931 | ) | — | (30,931 | ) | ||||||||||||||||
| Foreign Exchange Contracts (b) | — | — | 248,763 | — | — | 248,763 | ||||||||||||||||||
| $ | 133,856 | $ | (129,472 | ) | $ | 248,763 | $ | (106,914 | ) | $ | 27,844 | $ | 174,077 | |||||||||||
Each of the above derivatives is located in the following Statement of Operations accounts: (a) Change in net unrealized appreciation (depreciation) on investments (includes purchased options), written options, swap contracts and futures, respectively (b) Change in net unrealized appreciation (depreciation) on foreign currency (Statement of Operations includes both forward currency contracts and foreign currency transactions) | ||||||||||||||||||||||||
As of December 31, 2013, the Fund has transactions subject to enforceable master netting agreements. A reconciliation of the gross amounts on the Statement of Assets and Liabilities to the net amounts by derivative type, including any collateral exposure, is included in the following tables:
| Counterparty | Gross Amounts of Assets Presented in the Statement of Assets and Liabilities (a) | Financial Instruments and Derivatives Available for Offset | Collateral Received | Net Amount of Derivative Assets | ||||||||||||
| Australia & New Zealand Banking Group Ltd. | $ | 205 | $ | — | $ | — | $ | 205 | ||||||||
| Bank of America | 14,697 | — | — | 14,697 | ||||||||||||
| Barclays Bank PLC | 73,685 | — | — | 73,685 | ||||||||||||
| BNP Paribas | 88,527 | (87,581 | ) | — | 946 | |||||||||||
| Citigroup, Inc. | 24,776 | (252 | ) | — | 24,524 | |||||||||||
| Commonwealth Bank of Australia | 8,572 | (3,397 | ) | — | 5,175 | |||||||||||
| Credit Suisse | 7,740 | — | — | 7,740 | ||||||||||||
| JPMorgan Chase Securities, Inc. | 124,729 | (91,104 | ) | — | 33,625 | |||||||||||
| Nomura International PLC | 86,361 | (86,361 | ) | — | — | |||||||||||
| The Goldman Sachs & Co. | 6,957 | — | — | 6,957 | ||||||||||||
| UBS AG | 160,372 | — | — | 160,372 | ||||||||||||
| Exchange Traded Futures and Swaps (b) | 37,050 | — | — | 37,050 | ||||||||||||
| $ | 633,671 | $ | (268,695 | ) | $ | — | $ | 364,976 | ||||||||
| Counterparty | Gross Amounts of Liabilities Presented in the Statement of Assets and Liabilities (a) | Financial Instruments and Derivatives Available for Offset | Collateral Pledged | Net Amount of Derivative Liabilities | ||||||||||||
| BNP Paribas | $ | 87,581 | $ | (87,581 | ) | $ | — | $ | — | |||||||
| Citigroup, Inc. | 252 | (252 | ) | — | — | |||||||||||
| Commonwealth Bank of Australia | 3,397 | (3,397 | ) | — | — | |||||||||||
| JPMorgan Chase Securities, Inc. | 91,104 | (91,104 | ) | — | — | |||||||||||
| Nomura International PLC | 88,366 | (86,361 | ) | — | 2,005 | |||||||||||
| Exchange Traded Futures and Swaps (b) | 37,663 | — | — | 37,663 | ||||||||||||
| $ | 308,363 | $ | (268,695 | ) | $ | — | $ | 39,668 | ||||||||
(a) Forward foreign currency exchange contracts, swap contracts and over-the-counter purchased and written options are netted.
(b) Includes financial instruments (futures and centrally cleared swaps) which are not subject to a master netting arrangement, or another similar arrangement.
C. Purchases and Sales of Securities
During the year ended December 31, 2013, purchases and sales of investment transactions (excluding short-term investments and U.S. Treasury obligations) aggregated $122,597,564 and $135,882,746, respectively. Purchases and sales of U.S. Treasury obligations aggregated $1,324,213 and $3,843,643, respectively.
For the year ended December 31, 2013, transactions for written options on futures contracts and interest rate swap contracts were as follows:
| Contracts/ Contract Amount | Premiums | |||||||
| Outstanding, beginning of period | 10,800,020 | $ | 416,526 | |||||
| Options written | 60 | 50,475 | ||||||
| Options closed | (6,700,000 | ) | (160,350 | ) | ||||
| Options expired | (80 | ) | (58,244 | ) | ||||
| Outstanding, end of period | 4,100,000 | $ | 248,407 | |||||
D. Related Parties
Management Agreement. Under the Investment Management Agreement with Deutsche Investment Management Americas Inc. ("DIMA" or the "Advisor"), an indirect, wholly owned subsidiary of Deutsche Bank AG, the Advisor directs the investments of the Fund in accordance with its investment objectives, policies and restrictions. The Advisor determines the securities, instruments and other contracts relating to investments to be purchased, sold or entered into by the Fund or delegates such responsibility to the Fund's subadvisor.
QS Investors, LLC ("QS Investors") acted as an investment subadvisor to the Fund and managed the portion of assets allocated from time to time to the Fund's global tactical asset allocation ("GTAA") overlay strategy. QS Investors was paid by the Advisor for the services QS Investors provided to the Fund. Effective on or about May 31, 2013, QS Investors no longer serves as subadvisor to the Fund, and the Fund no longer utilizes the GTAA strategy.
Pursuant to the Investment Management Agreement with the Advisor, the Fund pays a monthly management fee based on the Fund's average daily net assets, computed and accrued daily and payable monthly, at the following annual rates:
| First $250 million | .550 | % | ||
| Next $750 million | .520 | % | ||
| Next $1.5 billion | .500 | % | ||
| Next $2.5 billion | .480 | % | ||
| Next $2.5 billion | .450 | % | ||
| Next $2.5 billion | .430 | % | ||
| Next $2.5 billion | .410 | % | ||
| Over $12.5 billion | .390 | % |
For the period from January 1, 2013 through September 30, 2013, the Advisor had contractually agreed to waive its fee and/or reimburse certain operating expenses to the extent necessary to maintain the operating expenses (excluding certain expenses such as extraordinary expenses, taxes, brokerage and interest expense) at 0.73%.
Effective October 1, 2013 through April 30, 2014, the Advisor has contractually agreed to waive its fee and/or reimburse certain operating expenses to the extent necessary to maintain the operating expenses (excluding certain expenses such as extraordinary expenses, taxes, brokerage and interest expense) at 0.76%.
Accordingly, for the year ended December 31, 2013, the Advisor waived a portion of its management fee pursuant to the Investment Management Agreement aggregating $198,544, and the amount charged aggregated $186,441, which was equivalent to an annual effective rate of 0.27% of the Fund's average daily net assets.
Administration Fee. Pursuant to an Administrative Services Agreement, DIMA provides most administrative services to the Fund. For all services provided under the Administrative Services Agreement, the Fund pays DIMA an annual fee ("Administration Fee") of 0.10% of the Fund's average daily net assets, computed and accrued daily and payable monthly. For the year ended December 31, 2013, the Administration Fee was $69,997, of which $5,205 is unpaid.
Service Provider Fees. DWS Investments Service Company ("DISC"), an affiliate of the Advisor, is the transfer agent, dividend-paying agent and shareholder service agent for the Fund. Pursuant to a sub-transfer agency agreement between DISC and DST Systems, Inc. ("DST"), DISC has delegated certain transfer agent, dividend-paying agent and shareholder service agent functions to DST. DISC compensates DST out of the shareholder servicing fee it receives from the Fund. For the year ended December 31, 2013, the amounts charged to the Fund by DISC aggregated $148, all of which was waived.
Typesetting and Filing Service Fees. Under an agreement with DIMA, DIMA is compensated for providing typesetting and certain regulatory filing services to the Fund. For the year ended December 31, 2013, the amount charged to the Fund by DIMA included in the Statement of Operations under "reports to shareholders" aggregated $21,976, of which $7,196 is unpaid.
Trustees' Fees and Expenses. The Fund paid retainer fees to each Trustee not affiliated with the Advisor, plus specified amounts to the Board Chairperson and Vice Chairperson and to each committee Chairperson.
Affiliated Cash Management Vehicles. The Fund may invest uninvested cash balances in Central Cash Management Fund and DWS Variable NAV Money Fund, affiliated money market funds which are managed by the Advisor. Each affiliated money market fund seeks to provide a high level of current income consistent with liquidity and the preservation of capital. Each affiliated money market fund is managed in accordance with Rule 2a-7 under the Investment Company Act of 1940, which governs the quality, maturity, diversity and liquidity of instruments in which a money market fund may invest. Central Cash Management Fund seeks to maintain a stable net asset value, and DWS Variable NAV Money Fund maintains a floating net asset value. The Fund indirectly bears its proportionate share of the expenses of each affiliated money market fund in which it invests. Central Cash Management Fund does not pay the Advisor an investment management fee. To the extent that DWS Variable NAV Money Fund pays an investment management fee to the Advisor, the Advisor will waive an amount of the investment management fee payable to the Advisor by the Fund equal to the amount of the investment management fee payable on the Fund's assets invested in DWS Variable NAV Money Fund.
Security Lending Fees. Deutsche Bank AG serves as securities lending agent for the Fund. For the year ended December 31, 2013, the Fund incurred securities lending agent fees to Deutsche Bank AG in the amount of $431.
E. Investing in High-Yield Securities
The Fund's performance could be hurt if a security declines in credit quality or goes into default, or if an issuer does not make timely payments of interest or principal. Because the issuers of high-yield debt securities or junk bonds (debt securities rated below the fourth-highest category) may be in uncertain financial health, the risk of loss from default by the issuer is significantly greater. Prices and yields of high-yield securities will fluctuate over time and, during periods of economic uncertainty, volatility of high-yield securities may adversely affect a fund's net asset value. Because the Fund may invest in securities not paying current interest or in securities already in default, these risks may be more pronounced.
F. Investing in Emerging Markets
Investing in emerging markets may involve special risks and considerations not typically associated with investing in developed markets. These risks include revaluation of currencies, high rates of inflation or deflation, repatriation restrictions on income and capital, and future adverse political, social and economic developments. Moreover, securities issued in these markets may be less liquid, subject to government ownership controls or delayed settlements, and may have prices that are more volatile or less easily assessed than those of comparable securities of issuers in developed markets.
G. Ownership of the Fund
At December 31, 2013, two participating insurance companies were owners of record of 10% or more of the total outstanding Class A shares of the Fund, each owning 64% and 33%.
H. Line of Credit
The Fund and other affiliated funds (the "Participants") share in a $375 million revolving credit facility provided by a syndication of banks. The Fund may borrow for temporary or emergency purposes, including the meeting of redemption requests that otherwise might require the untimely disposition of securities. The Participants are charged an annual commitment fee which is allocated based on net assets, among each of the Participants. Interest is calculated at a rate per annum equal to the sum of the Federal Funds Rate plus 1.25 percent plus if LIBOR exceeds the Federal Funds Rate the amount of such excess. The Fund may borrow up to a maximum of 33 percent of its net assets under the agreement. The Fund had no outstanding loans at December 31, 2013.
To the Board of Trustees of DWS Variable Series II and Shareholders of DWS Unconstrained Income VIP:
We have audited the accompanying statement of assets and liabilities, including the investment portfolio, of DWS Unconstrained Income VIP (the "Fund") (one of the funds constituting DWS Variable Series II), as of December 31, 2013, and the related statement of operations for the year then ended, the statements of changes in net assets for each of the two years in the period then ended, and the financial highlights for each of the five years in the period then ended. These financial statements and financial highlights are the responsibility of the Fund's management. Our responsibility is to express an opinion on these financial statements and financial highlights based on our audits.
We conducted our audits in accordance with the standards of the Public Company Accounting Oversight Board (United States). Those standards require that we plan and perform the audit to obtain reasonable assurance about whether the financial statements and financial highlights are free of material misstatement. We were not engaged to perform an audit of the Fund's internal control over financial reporting. Our audits included consideration of internal control over financial reporting as a basis for designing audit procedures that are appropriate in the circumstances, but not for the purpose of expressing an opinion on the effectiveness of the Fund's internal control over financial reporting. Accordingly, we express no such opinion. An audit also includes examining, on a test basis, evidence supporting the amounts and disclosures in the financial statements and financial highlights, assessing the accounting principles used and significant estimates made by management, and evaluating the overall financial statement presentation. Our procedures included confirmation of securities owned as of December 31, 2013, by correspondence with the custodian and brokers, or by other appropriate auditing procedures where replies from brokers were not received. We believe that our audits provide a reasonable basis for our opinion.
In our opinion, the financial statements and financial highlights referred to above present fairly, in all material respects, the financial position of DWS Unconstrained Income VIP (one of the funds constituting DWS Variable Series II) at December 31, 2013, the results of its operations for the year then ended, the changes in its net assets for each of the two years in the period then ended, and the financial highlights for each of the five years in the period then ended, in conformity with U.S. generally accepted accounting principles.
| ||
Boston, Massachusetts February 14, 2014 |
As an investor of the Fund, you incur two types of costs: ongoing expenses and transaction costs. Ongoing expenses include management fees and other Fund expenses. Examples of transaction costs include contract charges and account maintenance fees, which are not shown in this section. The following tables are intended to help you understand your ongoing expenses (in dollars) of investing in the Fund and to help you compare these expenses with the ongoing expenses of investing in other mutual funds. In the most recent six-month period, the Fund limited these expenses; had it not done so, expenses would have been higher. The example in the table is based on an investment of $1,000 invested at the beginning of the six-month period and held for the entire period (July 1, 2013 to December 31, 2013).
The tables illustrate your Fund's expenses in two ways:
—Actual Fund Return. This helps you estimate the actual dollar amount of ongoing expenses (but not transaction costs) paid on a $1,000 investment in the Fund using the Fund's actual return during the period. To estimate the expenses you paid over the period, simply divide your account value by $1,000 (for example, an $8,600 account value divided by $1,000 = 8.6), then multiply the result by the number in the "Expenses Paid per $1,000" line under the share class you hold.
— Hypothetical 5% Fund Return. This helps you to compare your Fund's ongoing expenses (but not transaction costs) with those of other mutual funds using the Fund's actual expense ratio and a hypothetical rate of return of 5% per year before expenses. Examples using a 5% hypothetical Fund return may be found in the shareholder reports of other mutual funds. The hypothetical account values and expenses may not be used to estimate the actual ending account balance or expenses you paid for the period.
Please note that the expenses shown in these tables are meant to highlight your ongoing expenses only and do not reflect any transaction costs. The "Expenses Paid per $1,000" line of the tables is useful in comparing ongoing expenses only and will not help you determine the relative total expense of owning different funds. If these transaction costs had been included, your costs would have been higher.
Expenses and Value of a $1,000 Investment for the six months ended December 31, 2013 | ||||
| Actual Fund Return | Class A | |||
| Beginning Account Value 7/1/13 | $ | 1,000.00 | ||
| Ending Account Value 12/31/13 | $ | 1,029.50 | ||
| Expenses Paid per $1,000* | $ | 3.84 | ||
| Hypothetical 5% Fund Return | Class A | |||
| Beginning Account Value 7/1/13 | $ | 1,000.00 | ||
| Ending Account Value 12/31/13 | $ | 1,021.42 | ||
| Expenses Paid per $1,000* | $ | 3.82 | ||
* Expenses are equal to the Fund's annualized expense ratio, multiplied by the average account value over the period, multiplied by 184 (the number of days in the most recent six-month period), then divided by 365.
| Annualized Expense Ratio | Class A | |
| DWS Variable Series II — DWS Unconstrained Income VIP | .75% |
For more information, please refer to the Fund's prospectus.
These tables do not reflect charges and fees ("contract charges") associated with the separate account that invests in the Fund or any variable life insurance policy or variable annuity contract for which the Fund is an investment option.
For an analysis of the fees associated with an investment in the fund or similar funds, please refer to the current and hypothetical expense calculators for Variable Insurance Products which can be found at dws-investments.com/EN/resources/calculators.jsp.
The Fund paid distributions $0.12 per share from net long-term capital gains during the year ended December 31, 2013.
Please consult a tax advisor if you have questions about federal or state income tax laws, or on how to prepare your tax returns. If you have specific questions about your account, please contact your insurance provider.
The Trust's policies and procedures for voting proxies for portfolio securities and information about how the Trust voted proxies related to its portfolio securities during the 12-month period ended June 30 are available on our Web site — dws-investments.com (click on "proxy voting" at the bottom of the page) — or on the SEC's Web site — sec.gov. To obtain a written copy of the Trust's policies and procedures without charge, upon request, call us toll free at (800) 728-3337.
The Board of Trustees approved the renewal of DWS Unconstrained Income VIP's investment management agreement (the "Agreement") with Deutsche Investment Management Americas Inc. ("DIMA") in September 2013.
In terms of the process that the Board followed prior to approving the Agreement, shareholders should know that:
— In September 2013, all but one of the Fund's Trustees were independent of DIMA and its affiliates.
— The Trustees met frequently during the past year to discuss fund matters and dedicated a substantial amount of time to contract review matters. Over the course of several months, the Board's Contract Committee, in coordination with the Board's Fixed Income and Asset Allocation Oversight Committee, reviewed comprehensive materials received from DIMA, independent third parties and independent counsel. These materials included an analysis of the Fund's performance, fees and expenses, and profitability compiled by a fee consultant retained by the Fund's Independent Trustees (the "Fee Consultant"). The Board also received extensive information throughout the year regarding performance of the Fund.
— The Independent Trustees regularly meet privately with their independent counsel to discuss contract review and other matters. In addition, the Independent Trustees were also advised by the Fee Consultant in the course of their review of the Fund's contractual arrangements and considered a comprehensive report prepared by the Fee Consultant in connection with their deliberations.
— In connection with reviewing the Agreement, the Board also reviewed the terms of the Fund's distribution agreement, administrative services agreement, transfer agency agreement and other material service agreements.
— Based on its evaluation of the information provided, the Contract Committee presented its findings and recommendations to the Board. The Board then reviewed the Contract Committee's findings and recommendations.
In connection with the contract review process, the Contract Committee and the Board considered the factors discussed below, among others. The Board also considered that DIMA and its predecessors have managed the Fund since its inception, and the Board believes that a long-term relationship with a capable, conscientious advisor is in the best interests of the Fund. The Board considered, generally, that shareholders chose to invest or remain invested in the Fund knowing that DIMA managed the Fund, and that the Agreement was approved by the Fund's shareholders. DIMA is part of Deutsche Bank AG, a major global banking institution that is engaged in a wide range of financial services. The Board believes that there are advantages to being part of a global asset management business that offers a wide range of investing expertise and resources, including hundreds of portfolio managers and analysts with research capabilities in many countries throughout the world.
As part of the contract review process, the Board carefully considered the fees and expenses of each DWS fund overseen by the Board in light of the fund's performance. In many cases, this led to a negotiation with DIMA of lower expense caps as part of the 2012 and 2013 contract review processes than had previously been in place. As part of these negotiations, the Board indicated that it would consider relaxing these new lower caps in future years following sustained improvements in performance, among other considerations.
In June 2012, Deutsche Bank AG ("DB"), DIMA's parent company, announced that DB would combine its Asset Management (of which DIMA was a part) and Wealth Management divisions. DB has advised the Independent Trustees that the U.S. asset management business is a critical and integral part of DB, and that it has, and will continue to, reinvest a significant portion of the substantial savings it expects to realize by combining its Asset Management and Wealth Management divisions into the new Asset and Wealth Management ("AWM") division, including ongoing enhancements to its investment capabilities. DB also has confirmed its commitment to maintaining strong legal and compliance groups within the AWM division.
While shareholders may focus primarily on fund performance and fees, the Fund's Board considers these and many other factors, including the quality and integrity of DIMA's personnel and such other issues as back-office operations, fund valuations, and compliance policies and procedures.
Nature, Quality and Extent of Services. The Board considered the terms of the Agreement, including the scope of advisory services provided under the Agreement. The Board noted that, under the Agreement, DIMA provides portfolio management services to the Fund and that, pursuant to a separate administrative services agreement, DIMA provides administrative services to the Fund. The Board considered the experience and skills of senior management and investment personnel, the resources made available to such personnel, the ability of DIMA to attract and retain high-quality personnel, and the organizational depth and stability of DIMA. The Board reviewed the Fund's performance over short-term and long-term periods and compared those returns to various agreed-upon performance measures, including market indices and a peer universe compiled by the Fee Consultant using information supplied by Morningstar Direct ("Morningstar"), an independent fund data service. The Board also noted that it has put into place a process of identifying "Focus Funds" (e.g., funds performing poorly relative to their benchmark or a peer universe compiled by an independent fund data service), and receives more frequent reporting and information from DIMA regarding such funds, along with DIMA's remedial plans to address underperformance. The Board believes this process is an effective manner of identifying and addressing underperforming funds. Based on the information provided, the Board noted that for the one-, three- and five-year periods ended December 31, 2012, the Fund's performance (Class A shares) was in the 2nd quartile, 2nd quartile and 1st quartile, respectively, of the applicable Morningstar universe (the 1st quartile being the best performers and the 4th quartile being the worst performers). The Board also observed that the Fund has outperformed its benchmark in the one-, three- and five-year periods ended December 31, 2012.
Fees and Expenses. The Board considered the Fund's investment management fee schedule, operating expenses and total expense ratios, and comparative information provided by Lipper Inc. ("Lipper") and the Fee Consultant regarding investment management fee rates paid to other investment advisors by similar funds (1st quartile being the most favorable and 4th quartile being the least favorable). With respect to management fees paid to other investment advisors by similar funds, the Board noted that the contractual fee rates paid by the Fund, which include a 0.10% fee paid to DIMA under the Fund's administrative services agreement, were equal to the median of the applicable Lipper peer group (based on Lipper data provided as of December 31, 2012). The Board noted that the Fund's Class A shares total (net) operating expenses were expected to be higher than the median (3rd quartile) of the applicable Lipper expense universe (based on Lipper data provided as of December 31, 2012, and analyzing Lipper expense universe Class A (net) expenses less any applicable 12b-1 fees) ("Lipper Universe Expenses"). The Board considered the Fund's management fee rate as compared to fees charged by DIMA to comparable funds and considered differences between the Fund and the comparable funds. The Board also considered how the Fund's total (net) operating expenses compared to the total (net) operating expenses of a more customized peer group selected by Lipper (based on such factors as asset size). The Board also noted that the expense limitation agreed to by DIMA helped to ensure that the Fund's total (net) operating expenses would remain competitive.
The information considered by the Board as part of its review of management fees included information regarding fees charged by DIMA and its affiliates to similar institutional accounts and to similar funds offered primarily to European investors ("DWS Europe funds"), in each case as applicable. The Board observed that advisory fee rates for institutional accounts generally were lower than the management fees charged by similarly managed DWS U.S. mutual funds ("DWS Funds"), but also took note of the differences in services provided to DWS Funds as compared to institutional accounts. In the case of DWS Europe funds, the Board observed that fee rates for DWS Europe funds generally were higher than for similarly managed DWS Funds, but noted that differences in the types of services provided to DWS Funds relative to DWS Europe funds made it difficult to compare such fees.
On the basis of the information provided, the Board concluded that management fees were reasonable and appropriate in light of the nature, quality and extent of services provided by DIMA.
Profitability. The Board reviewed detailed information regarding revenues received by DIMA under the Agreement. The Board considered the estimated costs and pre-tax profits realized by DIMA from advising the DWS Funds, as well as estimates of the pre-tax profits attributable to managing the Fund in particular. The Board also received information regarding the estimated enterprise-wide profitability of DWS and its affiliates with respect to all fund services in totality and by fund. The Board and the Fee Consultant reviewed DIMA's methodology in allocating its costs to the management of the Fund. Based on the information provided, the Board concluded that the pre-tax profits realized by DIMA in connection with the management of the Fund were not unreasonable. The Board also reviewed information regarding the profitability of certain similar investment management firms. The Board noted that while information regarding the profitability of such firms is limited (and in some cases is not necessarily prepared on a comparable basis), DIMA and its affiliates' overall profitability with respect to the DWS fund complex (after taking into account distribution and other services provided to the funds by DIMA and its affiliates) was lower than the overall profitability levels of many comparable firms for which such data was available.
Economies of Scale. The Board considered whether there are economies of scale with respect to the management of the Fund and whether the Fund benefits from any economies of scale. The Board noted that the Fund's management fee schedule includes fee breakpoints. The Board concluded that the Fund's fee schedule represents an appropriate sharing between the Fund and DIMA of such economies of scale as may exist in the management of the Fund at current asset levels.
Other Benefits to DIMA and Its Affiliates. The Board also considered the character and amount of other incidental benefits received by DIMA and its affiliates, including any fees received by DIMA for administrative services provided to the Fund and any fees received by an affiliate of DIMA for distribution services. The Board also considered benefits to DIMA related to brokerage and soft-dollar allocations, including allocating brokerage to pay for research generated by parties other than the executing broker dealers, which pertain primarily to funds investing in equity securities, along with the incidental public relations benefits to DIMA related to DWS Funds advertising and cross-selling opportunities among DIMA products and services. The Board concluded that management fees were reasonable in light of these fallout benefits.
Compliance. The Board considered the significant attention and resources dedicated by DIMA to documenting and enhancing its compliance processes in recent years. The Board noted in particular (i) the experience and seniority of both DIMA's chief compliance officer and the Fund's chief compliance officer; (ii) the large number of DIMA compliance personnel; and (iii) the substantial commitment of resources by DIMA and its affiliates to compliance matters.
Based on all of the information considered and the conclusions reached, the Board unanimously determined that the continuation of the Agreement is in the best interests of the Fund. In making this determination, the Board did not give particular weight to any single factor identified above. The Board considered these factors over the course of numerous meetings, certain of which were in executive session with only the Independent Trustees and their independent counsel present. It is possible that individual Trustees may have weighed these factors differently in reaching their individual decisions to approve the continuation of the Agreement.
The following table presents certain information regarding the Board Members and Officers of the fund. Each Board Member's year of birth is set forth in parentheses after his or her name. Unless otherwise noted, (i) each Board Member has engaged in the principal occupation(s) noted in the table for at least the most recent five years, although not necessarily in the same capacity; and (ii) the address of each Independent Board Member is c/o Kenneth C. Froewiss, Chairman, DWS Mutual Funds, P.O. Box 78, Short Hills, NJ 07078. Except as otherwise noted below, the term of office for each Board Member is until the election and qualification of a successor, or until such Board Member sooner dies, resigns, is removed or as otherwise provided in the governing documents of the fund. Because the fund does not hold an annual meeting of shareholders, each Board Member will hold office for an indeterminate period. The Board Members may also serve in similar capacities with other funds in the fund complex.
| Independent Board Members | ||||
Name, Year of Birth, Position with the Fund and Length of Time Served1 | Business Experience and Directorships During the Past Five Years | Number of Funds in DWS Fund Complex Overseen | Other Directorships Held by Board Member | |
Kenneth C. Froewiss (1945) Chairperson since 2013, and Board Member since 2001 | Adjunct Professor of Finance, NYU Stern School of Business (September 2009–present; Clinical Professor from 1997–September 2009); Member, Finance Committee, Association for Asian Studies (2002–present); Director, Mitsui Sumitomo Insurance Group (US) (2004–present); prior thereto, Managing Director, J.P. Morgan (investment banking firm) (until 1996) | 103 | — | |
William McClayton (1944) Vice Chairperson since 2013, and Board Member since 2004 | Private equity investor (since October 2009); previously, Managing Director, Diamond Management & Technology Consultants, Inc. (global consulting firm) (2001–2009); Directorship: Board of Managers, YMCA of Metropolitan Chicago; formerly: Senior Partner, Arthur Andersen LLP (accounting) (1966–2001); Trustee, Ravinia Festival | 103 | — | |
John W. Ballantine (1946) Board Member since 1999 | Retired; formerly, Executive Vice President and Chief Risk Management Officer, First Chicago NBD Corporation/The First National Bank of Chicago (1996–1998); Executive Vice President and Head of International Banking (1995–1996); former Directorships: Stockwell Capital Investments PLC (private equity); First Oak Brook Bancshares, Inc. and Oak Brook Bank; Prisma Energy International | 103 | Chairman of the Board, Healthways, Inc.2 (provider of disease and care management services) (2003– present); Portland General Electric2 (utility company) (2003– present) | |
Henry P. Becton, Jr. (1943) Board Member since 1990 | Vice Chair and former President, WGBH Educational Foundation. Directorships: Public Radio International; Public Radio Exchange (PRX); North Bennett Street School (Boston); former Directorships: The PBS Foundation; Association of Public Television Stations; Boston Museum of Science; American Public Television; Concord Academy; New England Aquarium; Mass. Corporation for Educational Telecommunications; Committee for Economic Development; Public Broadcasting Service; Connecticut College | 103 | Lead Director, Becton Dickinson and Company2 (medical technology company); Lead Director, Belo Corporation2 (media company) | |
Dawn-Marie Driscoll (1946) Board Member since 1987 | President, Driscoll Associates (consulting firm); Emeritus Executive Fellow, Center for Business Ethics, Bentley University; formerly, Partner, Palmer & Dodge (1988–1990); Vice President of Corporate Affairs and General Counsel, Filene's (1978–1988). Directorships: Director of ICI Mutual Insurance Company (since 2007); Advisory Board, Center for Business Ethics, Bentley University; Chairman of the Board of Trustees, Southwest Florida Community Foundation (charitable organization); former Directorships: Sun Capital Advisers Trust (mutual funds) (2007–2012), Investment Company Institute (audit, executive, nominating committees) and Independent Directors Council (governance, executive committees) | 103 | — | |
Keith R. Fox, CFA (1954) Board Member since 1996 | Managing General Partner, Exeter Capital Partners (a series of private investment funds) (since 1986). Directorships: Progressive International Corporation (kitchen goods importer and distributor); The Kennel Shop (retailer); former Chairman, National Association of Small Business Investment Companies; former Directorships: BoxTop Media Inc. (advertising); Sun Capital Advisers Trust (mutual funds) (2011–2012) | 103 | — | |
Paul K. Freeman (1950) Board Member since 1993 | Consultant, World Bank/Inter-American Development Bank; Executive and Governing Council of the Independent Directors Council (Chairman of Education Committee); formerly: Project Leader, International Institute for Applied Systems Analysis (1998–2001); Chief Executive Officer, The Eric Group, Inc. (environmental insurance) (1986–1998); Directorships: Denver Zoo Foundation (December 2012–present); former Directorships: Prisma Energy International | 103 | — | |
Richard J. Herring (1946) Board Member since 1990 | Jacob Safra Professor of International Banking and Professor, Finance Department, The Wharton School, University of Pennsylvania (since July 1972); Co-Director, Wharton Financial Institutions Center (since July 2000); Co-Chair, U.S. Shadow Financial Regulatory Committee; Executive Director, Financial Economists Roundtable; formerly: Vice Dean and Director, Wharton Undergraduate Division (July 1995–June 2000); Director, Lauder Institute of International Management Studies (July 2000–June 2006) | 103 | Director, Japan Equity Fund, Inc. (since September 2007), Thai Capital Fund, Inc. (since 2007), Singapore Fund, Inc. (since September 2007), Independent Director of Barclays Bank Delaware (since September 2010) | |
Rebecca W. Rimel (1951) Board Member since 1995 | President and Chief Executive Officer, The Pew Charitable Trusts (charitable organization) (1994 to present); formerly: Executive Vice President, The Glenmede Trust Company (investment trust and wealth management) (1983–2004); Board Member, Investor Education (charitable organization) (2004–2005); Trustee, Executive Committee, Philadelphia Chamber of Commerce (2001–2007); Director, Viasys Health Care2 (January 2007–June 2007); Trustee, Thomas Jefferson Foundation (charitable organization) (1994–2012) | 103 | Director, Becton Dickinson and Company2 (medical technology company) (2012– present); Director, CardioNet, Inc.2 (health care) (2009– present) | |
William N. Searcy, Jr. (1946) Board Member since 1993 | Private investor since October 2003; formerly: Pension & Savings Trust Officer, Sprint Corporation2 (telecommunications) (November 1989–September 2003); Trustee, Sun Capital Advisers Trust (mutual funds) (1998–2012) | 103 | — | |
Jean Gleason Stromberg (1943) Board Member since 1997 | Retired. Formerly, Consultant (1997–2001); Director, Financial Markets U.S. Government Accountability Office (1996–1997); Partner, Fulbright & Jaworski, L.L.P. (law firm) (1978–1996). Directorships: The William and Flora Hewlett Foundation; former Directorships: Service Source, Inc., Mutual Fund Directors Forum (2002–2004), American Bar Retirement Association (funding vehicle for retirement plans) (1987–1990 and 1994–1996) | 103 | — | |
Robert H. Wadsworth (1940) Board Member since 1999 | President, Robert H. Wadsworth & Associates, Inc. (consulting firm) (1983 to present); Director, National Horizon, Inc. (non-profit organization); Director and Treasurer, The Phoenix Boys Choir Association | 106 | — | |
Officers4 | ||
Name, Year of Birth, Position with the Fund and Length of Time Served5 | Business Experience and Directorships During the Past Five Years | |
Brian E. Binder8,9 (1972) President and Chief Executive Officer, 2013–present | Managing Director3 and Head of Fund Administration, Deutsche Asset & Wealth Management (2013–present); formerly: Head of Business Management and Consulting at Invesco, Ltd. (2010–2012); Chief Administrative Officer, Van Kampen Funds Inc. (2008–2010); and Chief Administrative Officer, Morgan Stanley Investment Management Americas Distribution (2003–2008) | |
John Millette7 (1962) Vice President and Secretary, 1999–present | Director,3 Deutsche Asset & Wealth Management | |
Paul H. Schubert6 (1963) Chief Financial Officer, 2004–present Treasurer, 2005–present | Managing Director,3 Deutsche Asset & Wealth Management (since July 2004); formerly: Executive Director, Head of Mutual Fund Services and Treasurer for UBS Family of Funds (1998–2004); Vice President and Director of Mutual Fund Finance at UBS Global Asset Management (1994–1998) | |
Caroline Pearson7 (1962) Chief Legal Officer, 2010–present | Managing Director,3 Deutsche Asset & Wealth Management; formerly: Assistant Secretary for DWS family of funds (1997–2010) | |
Melinda Morrow6 (1970) Vice President, 2012–present | Director,3 Deutsche Asset & Wealth Management | |
Hepsen Uzcan7 (1974) Assistant Secretary, 2013–present | Vice President, Deutsche Asset & Wealth Management | |
Paul Antosca7 (1957) Assistant Treasurer, 2007–present | Director,3 Deutsche Asset & Wealth Management | |
Jack Clark7 (1967) Assistant Treasurer, 2007–present | Director,3 Deutsche Asset & Wealth Management | |
Diane Kenneally7 (1966) Assistant Treasurer, 2007–present | Director,3 Deutsche Asset & Wealth Management | |
John Caruso6 (1965) Anti-Money Laundering Compliance Officer, 2010–present | Managing Director,3 Deutsche Asset & Wealth Management | |
Robert Kloby6 (1962) Chief Compliance Officer, 2006–present | Managing Director,3 Deutsche Asset & Wealth Management | |
1 The length of time served represents the year in which the Board Member joined the board of one or more DWS funds currently overseen by the Board.
2 A publicly held company with securities registered pursuant to Section 12 of the Securities Exchange Act of 1934.
3 Executive title, not a board directorship.
4 As a result of their respective positions held with the Advisor, these individuals are considered "interested persons" of the Advisor within the meaning of the 1940 Act. Interested persons receive no compensation from the fund.
5 The length of time served represents the year in which the officer was first elected in such capacity for one or more DWS funds.
6 Address: 60 Wall Street, New York, NY 10005.
7 Address: One Beacon Street, Boston, MA 02108.
8 Address: 222 South Riverside Plaza, Chicago, IL 60606.
9 Effective as of December 1, 2013.
The fund's Statement of Additional Information ("SAI") includes additional information about the Board Members. The SAI is available, without charge, upon request. If you would like to request a copy of the SAI, you may do so by calling the following toll-free number: (800) 728-3337.
Notes
DWS Investments Distributors, Inc.
222 South Riverside Plaza
Chicago, IL 60606
(800) 621-1148
VS2UI-2 (R-025836-3 2/14)
| ITEM 2. | CODE OF ETHICS |
As of the end of the period covered by this report, the registrant has adopted a code of ethics, as defined in Item 2 of Form N-CSR, that applies to its Principal Executive Officer and Principal Financial Officer. There have been no amendments to, or waivers from, a provision of the code of ethics during the period covered by this report that would require disclosure under Item 2. A copy of the code of ethics is filed as an exhibit to this Form N-CSR. | |
| ITEM 3. | AUDIT COMMITTEE FINANCIAL EXPERT |
| The fund’s audit committee is comprised solely of trustees who are "independent" (as such term has been defined by the Securities and Exchange Commission ("SEC") in regulations implementing Section 407 of the Sarbanes-Oxley Act (the "Regulations")). The fund’s Board of Trustees has determined that there are several "audit committee financial experts" (as such term has been defined by the Regulations) serving on the fund’s audit committee including Mr. Paul K. Freeman, the chair of the fund’s audit committee. An “audit committee financial expert” is not an “expert” for any purpose, including for purposes of Section 11 of the Securities Act of 1933 and the designation or identification of a person as an “audit committee financial expert” does not impose on such person any duties, obligations or liability that are greater than the duties, obligations and liability imposed on such person as a member of the audit committee and board of directors in the absence of such designation or identification. | |
| ITEM 4. | PRINCIPAL ACCOUNTANT FEES AND SERVICES |
DWS VARIABLE SERIES II
FORM N-CSR DISCLOSURE RE: AUDIT FEES
The following table shows the amount of fees that Ernst & Young LLP (“EY”), the Series' Independent Registered Public Accounting Firm, billed to the Series during the Series’ last two fiscal years. The Audit Committee approved in advance all audit services and non-audit services that EY provided to the Series.
Services that the Series’ Independent Registered Public Accounting Firm Billed to the Series
| Fiscal Year Ended December 31, | Audit Fees Billed to Series | Audit-Related Fees Billed to Series | Tax Fees Billed to Series | All Other Fees Billed to Series | ||||||||||||
| 2013 | $ | 628,116 | $ | 0 | $ | 68,848 | $ | 0 | ||||||||
| 2012 | $ | 595,318 | $ | 0 | $ | 76,628 | $ | 0 | ||||||||
The above “Tax Fees” were billed for professional services rendered for tax return preparation.
Services that the Series’ Independent Registered Public Accounting Firm Billed to the Adviser and Affiliated Fund Service Providers
The following table shows the amount of fees billed by EY to Deutsche Investment Management Americas, Inc. (“DIMA” or the “Adviser”), and any entity controlling, controlled by or under common control with DIMA (“Control Affiliate”) that provides ongoing services to the Series (“Affiliated Fund Service Provider”), for engagements directly related to the Series’ operations and financial reporting, during the Series’ last two fiscal years.
| Fiscal Year Ended December 31, | Audit-Related Fees Billed to Adviser and Affiliated Fund Service Providers | Tax Fees Billed to Adviser and Affiliated Fund Service Providers | All Other Fees Billed to Adviser and Affiliated Fund Service Providers | |||||||||
| 2013 | $ | 0 | $ | 379,516 | $ | 0 | ||||||
| 2012 | $ | 0 | $ | 359,967 | $ | 0 | ||||||
The above “Tax Fees” were billed in connection with tax compliance services and agreed upon procedures.
Non-Audit Services
The following table shows the amount of fees that EY billed during the Series’ last two fiscal years for non-audit services. The Audit Committee pre-approved all non-audit services that EY provided to the Adviser and any Affiliated Fund Service Provider that related directly to the Series’ operations and financial reporting. The Audit Committee requested and received information from EY about any non-audit services that EY rendered during the Series’ last fiscal year to the Adviser and any Affiliated Fund Service Provider. The Committee considered this information in evaluating EY’s independence.
| Fiscal Year Ended December 31, | Total Non-Audit Fees Billed to Series (A) | Total Non-Audit Fees billed to Adviser and Affiliated Fund Service Providers (engagements related directly to the operations and financial reporting of the Series) (B) | Total Non-Audit Fees billed to Adviser and Affiliated Fund Service Providers (all other engagements) (C) | Total of (A), (B) and (C) | ||||||||||||
| 2013 | $ | 68,848 | $ | 379,516 | $ | 715,427 | $ | 1,163,791 | ||||||||
| 2012 | $ | 76,628 | $ | 359,967 | $ | 579,578 | $ | 1,016,173 | ||||||||
All other engagement fees were billed for services in connection with agreed upon procedures and tax compliance for DIMA and other related entities that provide support for the operations of the Series.
Audit Committee Pre-Approval Policies and Procedures. Generally, each Fund’s Audit Committee must pre approve (i) all services to be performed for a Fund by a Fund’s Independent Registered Public Accounting Firm and (ii) all non-audit services to be performed by a Fund’s Independent Registered Public Accounting Firm for the DIMA Entities with respect to operations and financial reporting of the Fund, except that the Chairperson or Vice Chairperson of each Fund’s Audit Committee may grant the pre-approval for non-audit services described in items (i) and (ii) above for non-prohibited services for engagements of less than $100,000. All such delegated pre approvals shall be presented to each Fund’s Audit Committee no later than the next Audit Committee meeting.
There were no amounts that were approved by the Audit Committee pursuant to the de minimis exception under Rule 2-01 of Regulation S-X.
According to the registrant’s principal Independent Registered Public Accounting Firm, substantially all of the principal Independent Registered Public Accounting Firm's hours spent on auditing the registrant's financial statements were attributed to work performed by full-time permanent employees of the principal Independent Registered Public Accounting Firm.
***
In connection with the audit of the 2012 and 2013 financial statements, the Fund entered into an engagement letter with EY. The terms of the engagement letter required by EY, and agreed to by the Audit Committee, include provisions in which the parties consent to the sole jurisdiction of federal courts in New York, Boston or the Northern District of Illinois, as well as a waiver of right to a trial by jury and an exclusion of punitive damages.
***
| ITEM 5. | AUDIT COMMITTEE OF LISTED REGISTRANTS | |
| Not applicable | ||
| ITEM 6. | SCHEDULE OF INVESTMENTS | |
| Not applicable | ||
| ITEM 7. | DISCLOSURE OF PROXY VOTING POLICIES AND PROCEDURES FOR CLOSED-END MANAGEMENT INVESTMENT COMPANIES | |
| Not applicable | ||
| ITEM 8. | PORTFOLIO MANAGERS OF CLOSED-END MANAGEMENT INVESTMENT COMPANIES | |
| Not applicable | ||
| ITEM 9. | PURCHASES OF EQUITY SECURITIES BY CLOSED-END MANAGEMENT INVESTMENT COMPANY AND AFFILIATED PURCHASERS | |
| Not applicable | ||
| ITEM 10. | SUBMISSION OF MATTERS TO A VOTE OF SECURITY HOLDERS | |
| There were no material changes to the procedures by which shareholders may recommend nominees to the Fund’s Board. The primary function of the Nominating and Governance Committee is to identify and recommend individuals for membership on the Board and oversee the administration of the Board Governance Guidelines. Shareholders may recommend candidates for Board positions by forwarding their correspondence by U.S. mail or courier service to Kenneth C. Froewiss, Independent Chairman, DWS Mutual Funds, P.O. Box 78, Short Hills, NJ 07078. | ||
| ITEM 11. | CONTROLS AND PROCEDURES | |
| (a) | The Chief Executive and Financial Officers concluded that the Registrant’s Disclosure Controls and Procedures are effective based on the evaluation of the Disclosure Controls and Procedures as of a date within 90 days of the filing date of this report. | |
| (b) | There have been no changes in the registrant’s internal control over financial reporting that occurred during the second fiscal quarter of the period covered by this report that has materially affected, or is reasonably likely to materially affect, the registrant’s internal controls over financial reporting. | |
| ITEM 12. | EXHIBITS | |
| (a)(1) | Code of Ethics pursuant to Item 2 of Form N-CSR is filed and attached hereto as EX-99.CODE ETH. | |
| (a)(2) | Certification pursuant to Rule 30a-2(a) under the Investment Company Act of 1940 (17 CFR 270.30a-2(a)) is filed and attached hereto as Exhibit 99.CERT. | |
| (b) | Certification pursuant to Rule 30a-2(b) under the Investment Company Act of 1940 (17 CFR 270.30a-2(b)) is furnished and attached hereto as Exhibit 99.906CERT. | |
SIGNATURES
Pursuant to the requirements of the Securities Exchange Act of 1934 and the Investment Company Act of 1940, the registrant has duly caused this report to be signed on its behalf by the undersigned, thereunto duly authorized.
| Registrant: | DWS Variable Series II |
| By: | /s/Brian E. Binder Brian E. Binder President |
| Date: | February 20, 2014 |
Pursuant to the requirements of the Securities Exchange Act of 1934 and the Investment Company Act of 1940, this report has been signed below by the following persons on behalf of the registrant and in the capacities and on the dates indicated.
| By: | /s/Brian E. Binder Brian E. Binder President |
| Date: | February 20, 2014 |
| By: | /s/Paul Schubert Paul Schubert Chief Financial Officer and Treasurer |
| Date: | February 20, 2014 |