| | |
| UNITED STATES
SECURITIES AND EXCHANGE COMMISSION |
| | |
| CERTIFIED SHAREHOLDER REPORT OF REGISTERED
MANAGEMENT INVESTMENT COMPANIES
|
| | |
| Investment Company Act file number: | (811-00653) |
| | |
| Exact name of registrant as specified in charter: | Putnam Income Fund |
| | |
| Address of principal executive offices: | One Post Office Square, Boston, Massachusetts 02109 |
| | |
| Name and address of agent for service: | Robert T. Burns, Vice President
One Post Office Square
Boston, Massachusetts 02109 |
| | |
| Copy to: | John W. Gerstmayr, Esq.
Ropes & Gray LLP
800 Boylston Street
Boston, Massachusetts 02199-3600 |
| | |
| Registrant’s telephone number, including area code: | (617) 292-1000 |
| | |
| Date of fiscal year end: | October 31, 2012 |
| | |
| Date of reporting period: | November 1, 2011 — October 31, 2012 |
| | |
|
Item 1. Report to Stockholders: | |
| | |
| The following is a copy of the report transmitted to stockholders pursuant to Rule 30e-1 under the Investment Company Act of 1940: | |

Putnam
Income
Fund
Annual report
10 | 31 | 12
| | | |
| Message from the Trustees | 1 | | |
| | |
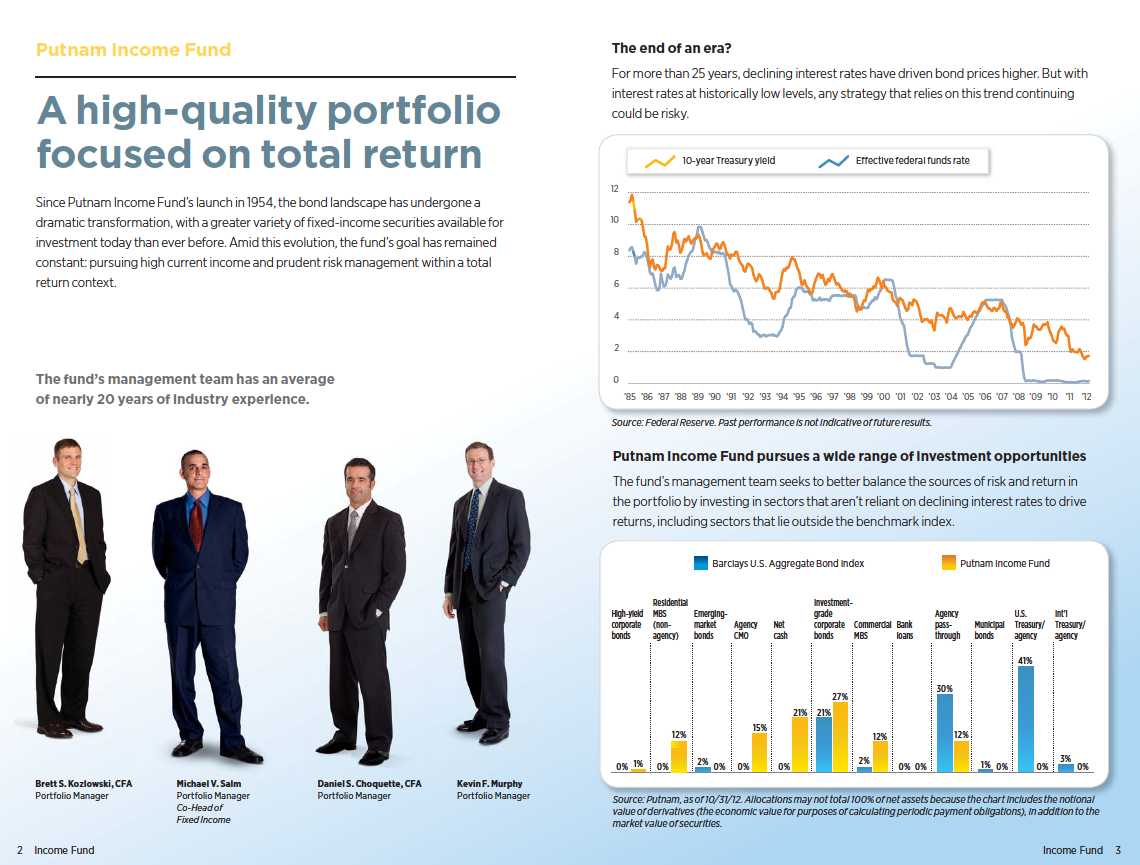
| About the fund | 2 | | |
| | |
| Performance snapshot | 4 | | |
| | |
| Interview with your fund’s portfolio manager | 5 | | |
| | |
| Your fund’s performance | 11 | | |
| | |
| Your fund’s expenses | 14 | | |
| | |
| Terms and definitions | 16 | | |
| | |
| Other information for shareholders | 17 | | |
| | |
| Trustee approval of management contract | 18 | | |
| | |
| Financial statements | 23 | | |
| | |
| Federal tax information | 72 | | |
| | |
| About the Trustees | 73 | | |
| | |
| Officers | 75 | | |
| | |
Consider these risks before investing: Funds that invest in government securities are not guaranteed. Mortgage-backed securities are subject to prepayment risk. The use of derivatives involves additional risks, such as the potential inability to terminate or sell derivatives positions and the potential failure of the other party to the instrument to meet its obligations. Bond investments are subject to interest-rate risk, which means the prices of the fund’s bond investments are likely to fall if interest rates rise. Bond investments also are subject to credit risk, which is the risk that the issuer of the bond may default on payment of interest or principal. Interest-rate risk is generally greater for longer-term bonds, and credit risk is generally greater for below-investment-grade bonds, which may be considered speculative. Unlike bonds, funds that invest in bonds have ongoing fees and expenses. The prices of bonds in the fund’s portfolio may fall or fail to rise over extended periods of time for a variety of reasons, including both general financial market conditions and factors related to a specific issuer or industry.
Message from the Trustees
Dear Fellow Shareholder:
The U.S. economy has been exhibiting greater underlying strength than previously thought, with employment, consumer spending, manufacturing, and housing data all showing steady improvement this year. U.S. stocks and many international markets have responded by delivering strong returns.
Still, the rise in equities has been accompanied by heightened investor anxiety, fostered by Europe’s ongoing troubles, China’s economic slowdown, and the looming “fiscal cliff” in the United States. We believe volatility will remain a feature of market behavior until these challenges are resolved.
At Putnam, our portfolio managers and analysts are trained to uncover opportunities and manage risk in this type of environment. We also strongly believe that it is prudent for long-term investors to rely on the expertise of a trusted financial advisor, who can help them work toward their financial goals.
We would like to take this opportunity to announce the arrival of two new Trustees, Liaquat Ahamed and Katinka Domotorffy, CFA, to your fund’s Board of Trustees. Mr. Ahamed, who in 2010 won the Pulitzer Prize for History with his book, Lords of Finance: The Bankers Who Broke the World, also serves on the Board of Aspen Insurance and the Board of the Rohatyn Group, an emerging-market fund complex that manages money for institutional investors.
Ms. Domotorffy, who until year-end 2011 was a Partner, Chief Investment Officer, and Global Head of Quantitative Investment Strategies at Goldman Sachs Asset Management, currently serves as a member of the Anne Ray Charitable Trust’s Investment Committee, Margaret A. Cargill Philanthropies, and director for Reach Out and Read of Greater New York, an organization dedicated to promoting early childhood literacy.
We would also like to extend a welcome to new shareholders of the fund and to thank all of our investors for your continued confidence in Putnam.

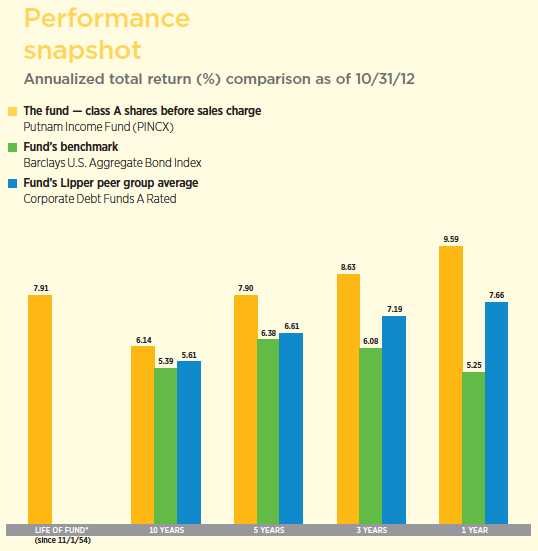
Current performance may be lower or higher than the quoted past performance, which cannot guarantee future results. Share price, principal value, and return will fluctuate, and you may have a gain or a loss when you sell your shares. Performance of class A shares assumes reinvestment of distributions and does not account for taxes. Fund returns in the bar chart do not reflect a sales charge of 4.00%; had they, returns would have been lower. See pages 5 and 11–13 for additional performance information. For a portion of the periods, the fund had expense limitations, without which returns would have been lower. To obtain the most recent month-end performance, visit putnam.com.
* The fund’s benchmark, the Barclays U.S. Aggregate Bond Index, was introduced on 12/31/75, and the fund’s Lipper category was introduced on 12/31/59. Both post-date the inception of the fund’s class A shares.
Interview with your fund’s portfolio manager

Mike, what was the bond-market environment like during the 12 months ended October 31, 2012?
The period began on a difficult note for credit-sensitive fixed-income securities, as concerns about Europe’s sovereign debt crisis and a weakening U.S. economic outlook caused investors to move away from risk. In December, however, riskier assets began to reverse course, as investors grew more optimistic about U.S. growth prospects and less pessimistic about the European situation. Investor confidence was buoyed by the European Central Bank’s [ECB] Long-Term Refinancing Operation, which provided much-needed stability to global credit markets by injecting liquidity into the European banking system, thereby reducing banks’ short-term funding risk.
In the United States, the Federal Reserve remained firm in its resolve to hold its benchmark federal funds rate near zero, announcing that it would do so into 2015. The Fed’s accommodative stance was further in evidence as it extended “Operation Twist,” under which it is helping to keep long-term Treasury yields low by selling short-term bonds and buying longer-term ones.
Within this environment, bonds in sectors entailing greater credit or market risk that trade at a yield premium to U.S. Treasuries — so-called “spread sectors” — rallied broadly from December through March. However, the
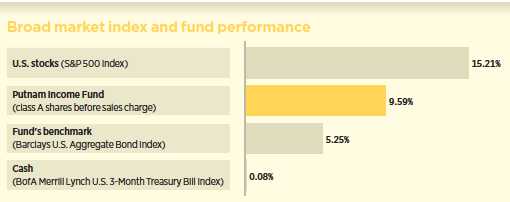
This comparison shows your fund’s performance in the context of broad market indexes for the 12 months ended 10/31/12. See pages 4 and 11–13 for additional fund performance information. Index descriptions can be found on page 17.
rally stalled during the April–June period, as global economic data came in below expectations and rising eurozone risk once again dampened investor sentiment.
Following late-July comments from ECB president Mario Draghi that the central bank would do “whatever it takes” to preserve the euro, credit-sensitive market sectors rallied once again. The Fed’s mid-September announcement of “QE3,” under which it plans to buy large amounts of government-agency mortgage-backed securities [agency pass-throughs] until the job market improves, provided further impetus to the market’s liquidity-fueled advance. The Fed also affirmed that it would continue Operation Twist through December. In early October, the ECB activated a program to purchase unlimited amounts of government bonds issued by Spain and other eurozone members that face higher borrowing costs.
Against this backdrop, the fund outperformed its benchmark and the average return of its Lipper peer group by sizable margins.
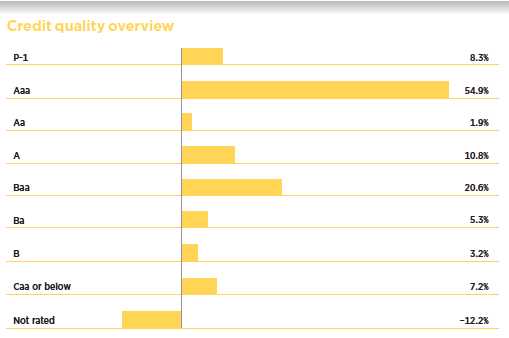
Credit qualities are shown as a percentage of the fund’s net assets as of 10/31/12. A bond rated Baa or higher (Prime-3 or higher, for short-term debt) is considered investment grade. The chart reflects Moody’s ratings; percentages may include bonds or derivatives not rated by Moody’s but rated by Standard & Poor’s (S&P) or, if unrated by S&P, by Fitch, and then included in the closest equivalent Moody’s rating. Ratings will vary over time.
Credit quality includes bonds and represents only the fixed-income portion of the portfolio. Derivative instruments, including forward currency contracts, are only included to the extent of any unrealized gain or loss on such instruments and are shown in the not-rated category. Cash is also shown in the not-rated category. The fund itself has not been rated by an independent rating agency.
A negative percentage reflects the effect of fund strategies that are designed to enhance performance if certain securities decline in value.

What factors drove the fund’s strong relative performance?
Our out-of-benchmark allocation to non-agency residential mortgage-backed securities [non-agency RMBS] was a significant contributor for the period. Robust demand from long-term investors, shrinking supply, and signs of recovery in the housing market bolstered the sector’s performance.
An overweighting in commercial mortgage-backed securities [CMBS] was another notable contributor. The sector benefited from consistent investor demand, given reduced near-term concern about the eurozone debt crisis, accommodative Fed policy, and continued positive U.S. economic growth.
We held both AAA-rated CMBS and “seasoned mezzanine” securities. CMBS are created when an underwriter assembles a package of commercial mortgages and issues bonds of varying creditworthiness.
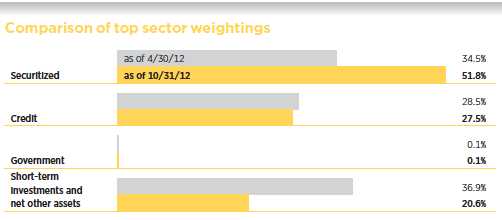
This chart shows how the fund’s top weightings have changed over the past six months. Weightings are shown as a percentage of net assets. Summary information may differ from the portfolio schedule included in the financial statements due to the inclusion of derivative securities, the exclusion of as-of trades, if any, and the use of different classifications of securities for presentation purposes. Holdings will vary over time.
AAA-rated CMBS occupy the top of the underwriter’s capital structure, and thus offer the greatest principal protection. Mezzanine CMBS are slightly lower in the capital structure, but, in our view, still provide a meaningful amount of principal protection along with higher yields. The mezzanine bonds we selected were issued prior to 2006, when CMBS underwriting standards were stronger than they were later in the decade, and they provided the fund with a reliable stream of cash flows.
Our holdings of investment-grade corporate bonds also aided performance, as yield spreads continued to tighten during much of the period, supported by a better risk environment and solid corporate earnings. Late in the period, however, corporate earnings began to show signs of softening. By way of background, when a bond’s yield spread tightens relative to Treasuries, it indicates that the bond’s price has risen.
Lastly, security selection among agency pass-throughs was beneficial, as we held lower-coupon pass-throughs, which generally outperformed their higher-coupon counterparts in the run-up to QE3.
What strategies detracted from results?
The biggest detractor was our conservative term-structure positioning [our duration — or interest-rate sensitivity — and yield-curve strategy]. We generally kept the fund’s duration shorter than that of the benchmark — which can be beneficial when rates are rising — and also positioned the portfolio for a steeper yield curve. However, beginning in March, rates declined and the yield curve flattened as investors anticipated further monetary policy easing by the Fed.
The fund held both agency pass-throughs and to-be-announced commitments to purchase pass-throughs [TBAs]. How do these differ?
TBAs allow us to purchase pass-throughs for a fixed price at a future date. Frequently, TBAs are more liquid than regular pass-throughs, and may represent a better value in terms of their total return potential. We prefer to hold cash or high-grade debt in amounts sufficient to meet our TBA commitments. As a result, it may appear that the fund has allocated a substantial portion of the portfolio to cash, while in actuality we’re simply holding cash to collateralize our TBAs.
How did you use derivatives during the period?
We used bond futures and interest-rate swaps — which allow two parties to exchange one stream of future interest payments for another, based on a specified principal amount — to take tactical positions at various points along the yield curve.
In addition, we employed interest-rate swaps and “swaptions” — which give us the option to enter into a swap contract — to hedge the interest-rate risk associated with our mortgage pass-through and collateralized-mortgage-obligation [CMO] holdings.
The fund reduced its distribution rate during the period. What led to that decision?
The fund’s distribution rate per class A share was lowered to $0.016 from $0.020 in April, due to the fund’s increased focus on higher-quality, lower-yielding segments of the bond market, and lower overall yields across the market. Similar reductions were made to other share classes.
What is your outlook for the coming months, and how are you positioning the fund?
Third-quarter gross domestic product came in at a better-than-expected annualized rate of 2%, indicating that the U.S. economy continues to grow, albeit at a sluggish pace compared with past post-recession recoveries. With Japan and Germany slowing sharply, recession in other parts of Europe, and China growing at a rate that is slow by its own standards, we believe the areas of the U.S. economy that are heavily dependent on global trade have weakened. On the other hand, U.S. consumer demand appears to be reasonably solid, as illustrated by stronger automobile sales. All told, we believe U.S. growth may strengthen in 2013 if the so-called “fiscal cliff” of currently legislated spending cuts and expiring tax reductions looming at year-end can be avoided.
As has been the case for some time, we continue to believe non-government sectors remain the most attractive areas of the bond market. While the “spreads” — or yield advantage — in many sectors of the market have tightened in recent months, they still appear attractive relative to their pre-2008 historical averages, in our view.
In terms of positioning, we continue to prefer credit risk via allocations to CMBS and non-agency RMBS, and prepayment risk through certain types of CMOs, over interest-rate risk. We also remain positive on lower-coupon agency pass-throughs, as well as mid-coupon pass-throughs that, in our view, exhibit favorable prepayment characteristics. While the potential for short-term price volatility continues to be high, we believe our actively managed, risk-conscious approach remains a prudent strategy for investing in today’s bond markets.
Thanks for your time and for bringing us up to date, Mike.
A word about derivatives
Derivatives are an increasingly common type of investment instrument, the performance of which is derived from an underlying security, index, currency, or other area of the capital markets. Derivatives employed by the fund’s managers generally serve one of two main purposes: to implement a strategy that may be difficult or more expensive to invest in through traditional securities, or to hedge unwanted risk associated with a particular position.
For example, the fund’s managers might use forward currency contracts to capitalize on an anticipated change in exchange rates between two currencies. This approach would require a significantly smaller outlay of capital than purchasing traditional bonds denominated in the underlying currencies. In another example, the managers may identify a bond that they believe is undervalued relative to its risk of default, but may seek to reduce the interest-rate risk of that bond by using interest-rate swaps, a derivative through which two parties “swap” payments based on the movement of certain rates.
Like any other investment, derivatives may not appreciate in value and may lose money. Derivatives may amplify traditional fixed-income risks through the creation of leverage and may be less liquid than traditional securities. And because derivatives typically represent contractual agreements between two financial institutions, derivatives entail “counterparty risk,” which is the risk that the other party is unable or unwilling to pay. Putnam monitors the counterparty risks we assume. For some types of derivatives, Putnam also seeks to mitigate the level of ongoing counterparty credit risk by entering into collateral agreements with counterparties that require the counterparties to post collateral on a regular basis to cover their obligations to the fund.
The views expressed in this report are exclusively those of Putnam Management and are subject to change. They are not meant as investment advice.
Please note that the holdings discussed in this report may not have been held by the fund for the entire period. Portfolio composition is subject to review in accordance with the fund’s investment strategy and may vary in the future. Current and future portfolio holdings are subject to risk.
Portfolio Manager Michael V. Salm is Co-Head of Fixed Income at Putnam. He has a B.A. from Cornell University. Michael joined Putnam in 1997 and has been in the investment industry since 1989.
In addition to Michael, your fund’s portfolio managers are Daniel S. Choquette, CFA; Brett S. Kozlowski, CFA; and Kevin F. Murphy.
IN THE NEWS
After decelerating in the middle of the year, the world’s two largest economies — the United States and China — are showing signs of growth. Stronger housing demand and hiring is appearing in the United States, and factory output and retail sales are rising in China, potentially marking an end to the recent slowdown in that economy. This fall, President Barack Obama was elected to a second term in the United States, and Xi Jinping, in a once-in-a-decade transition of power, was named President of China. Neither country is without its potential difficulties, however. The United States must produce a budget agreement that averts the across-the-board tax increases and austerity measures in the “fiscal cliff,” and China’s new leadership remains untested.
Your fund’s performance
This section shows your fund’s performance, price, and distribution information for periods ended October 31, 2012, the end of its most recent fiscal year. In accordance with regulatory requirements for mutual funds, we also include performance as of the most recent calendar quarter-end and expense information taken from the fund’s current prospectus. Performance should always be considered in light of a fund’s investment strategy. Data represent past performance. Past performance does not guarantee future results. More recent returns may be less or more than those shown. Investment return and principal value will fluctuate, and you may have a gain or a loss when you sell your shares. Performance information does not reflect any deduction for taxes a shareholder may owe on fund distributions or on the redemption of fund shares. For the most recent month-end performance, please visit the Individual Investors section at putnam.com or call Putnam at 1-800-225-1581. Class R, class R5, class R6, and class Y shares are not available to all investors. See the Terms and Definitions section in this report for definitions of the share classes offered by your fund.
Fund performance Total return for periods ended 10/31/12
| | | | | | | | | | | | |
| | Class A | Class B | Class C | Class M | Class R | Class R5 | Class R6 | Class Y |
| (inception dates) | (11/1/54) | (3/1/93) | (7/26/99) | (12/14/94) | (1/21/03) | (7/2/12) | (7/2/12) | (6/16/94) |
|
| | Before | After | | | | | Before | After | Net | Net | Net | Net |
| | sales | sales | Before | After | Before | After | sales | sales | asset | asset | asset | asset |
| | charge | charge | CDSC | CDSC | CDSC | CDSC | charge | charge | value | value | value | value |
|
| Annual average | | | | | | | | | | | | |
| (life of fund) | 7.91% | 7.83% | 6.92% | 6.92% | 7.09% | 7.09% | 7.46% | 7.40% | 7.64% | 7.99% | 7.99% | 7.99% |
|
| 10 years | 81.40 | 74.26 | 68.18 | 68.18 | 68.22 | 68.22 | 76.60 | 70.85 | 77.04 | 85.51 | 85.76 | 85.74 |
| Annual average | 6.14 | 5.71 | 5.34 | 5.34 | 5.34 | 5.34 | 5.85 | 5.50 | 5.88 | 6.37 | 6.39 | 6.39 |
|
| 5 years | 46.26 | 40.45 | 40.89 | 38.89 | 40.91 | 40.91 | 44.43 | 39.82 | 44.33 | 47.88 | 48.08 | 48.06 |
| Annual average | 7.90 | 7.03 | 7.10 | 6.79 | 7.10 | 7.10 | 7.63 | 6.93 | 7.61 | 8.14 | 8.17 | 8.17 |
|
| 3 years | 28.19 | 22.97 | 25.28 | 22.28 | 25.27 | 25.27 | 27.25 | 23.08 | 27.15 | 29.04 | 29.22 | 29.20 |
| Annual average | 8.63 | 7.14 | 7.80 | 6.93 | 7.80 | 7.80 | 8.36 | 7.17 | 8.34 | 8.87 | 8.92 | 8.91 |
|
| 1 year | 9.59 | 5.13 | 8.75 | 3.75 | 8.72 | 7.72 | 9.27 | 5.65 | 9.26 | 9.87 | 10.02 | 10.00 |
|
Current performance may be lower or higher than the quoted past performance, which cannot guarantee future results. After-sales-charge returns for class A and M shares reflect the deduction of the maximum 4.00% and 3.25% sales charge, respectively, levied at the time of purchase. Class B share returns after contingent deferred sales charge (CDSC) reflect the applicable CDSC, which is 5% in the first year, declining over time to 1% in the sixth year, and is eliminated thereafter. Class C share returns after CDSC reflect a 1% CDSC for the first year that is eliminated thereafter. Class R, R5, R6 and Y shares have no initial sales charge or CDSC. Performance for class B, C, M, R, and Y shares before their inception is derived from the historical performance of class A shares, adjusted for the applicable sales charge (or CDSC) and the higher operating expenses for such shares, except for class Y shares, for which 12b-1 fees are not applicable.
Performance for class R5 and class R6 shares prior to their inception is derived from the historical performance of class Y shares and has not been adjusted for the lower investor servicing fees applicable to class R5 and class R6 shares; had it, returns would have been higher.
For a portion of the periods, the fund had expense limitations, without which returns would have been lower.
Class B share performance does not reflect conversion to class A shares.
Comparative index returns For periods ended 10/31/12
| | |
| | Barclays U.S. Aggregate | Lipper Corporate Debt Funds |
| | Bond Index | A Rated category average* |
|
| Annual average (life of fund) | —† | —† |
|
| 10 years | 69.10% | 73.80% |
| Annual average | 5.39 | 5.61 |
|
| 5 years | 36.25 | 38.04 |
| Annual average | 6.38 | 6.61 |
|
| 3 years | 19.38 | 23.31 |
| Annual average | 6.08 | 7.19 |
|
| 1 year | 5.25 | 7.66 |
|
Index and Lipper results should be compared with fund performance before sales charge, before CDSC, or at net asset value.
* Over the 1-year, 3-year, 5-year, and 10-year periods ended 10/31/12, there were 101, 83, 78, and 54 funds, respectively, in this Lipper category.
† The fund’s benchmark, the Barclays U.S. Aggregate Bond Index, was introduced on 12/31/75, and the fund’s Lipper category was introduced on 12/31/59. Both post-date the inception of the fund’s class A shares.
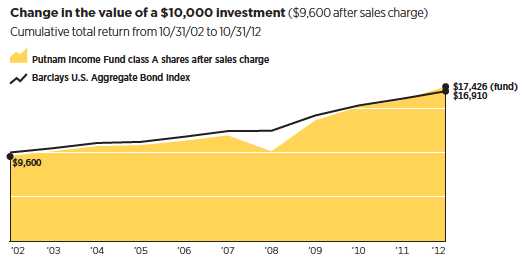
Past performance does not indicate future results. At the end of the same time period, a $10,000 investment in the fund’s class B and class C shares would have been valued at $16,818 and $16,822, respectively, and no contingent deferred sales charges would apply. A $10,000 investment in the fund’s class M shares ($9,675 after sales charge) would have been valued at $17,085. A $10,000 investment in the fund’s class R, class R5, class R6 and class Y shares would have been valued at $17,704, $18,551, $18,576 and $18,574, respectively.
Fund price and distribution information For the 12-month period ended 10/31/12
| | | | | | | | | | |
| Distributions | Class A | Class B | Class C | Class M | Class R | Class R5 | Class R6 | Class Y |
|
| Number | 12 | 12 | 12 | 12 | 12 | 4 | 4 | 12 |
|
| Income | $0.212 | $0.163 | $0.163 | $0.199 | $0.198 | $0.071 | $0.071 | $0.226 |
|
| Capital gains | — | — | — | — | — | — | — | — |
|
| Total | $0.212 | $0.163 | $0.163 | $0.199 | $0.198 | $0.071 | $0.071 | $0.226 |
|
| | Before | After | Net | Net | Before | After | Net | Net | Net | Net |
| | sales | sales | asset | asset | sales | sales | asset | asset | asset | asset |
| Share value | charge | charge | value | value | charge | charge | value | value | value | value |
|
| 10/31/11 | $6.84 | $7.13 | $6.78 | $6.80 | $6.71 | $6.94 | $6.81 | — | — | $6.91 |
|
| 7/2/12* | — | — | — | — | — | — | — | $7.11 | $7.11 | — |
|
| 10/31/12 | 7.27 | 7.57 | 7.20 | 7.22 | 7.12 | 7.36 | 7.23 | 7.35 | 7.36 | 7.36 |
|
| | Before | After | Net | Net | Before | After | Net | Net | Net | Net |
| Current yield | sales | sales | asset | asset | sales | sales | asset | asset | asset | asset |
| (end of period) | charge | charge | value | value | charge | charge | value | value | value | value |
|
| Current dividend | | | | | | | | | | |
| rate 1 | 2.64% | 2.54% | 2.00% | 1.99% | 2.53% | 2.45% | 2.49% | 2.94% | 2.93% | 2.93% |
|
| Current 30-day | | | | | | | | | | |
| SEC yield (without | | | | | | | | | | |
| expense limitation) 2 | N/A | 3.01 | 2.39 | 2.39 | N/A | 2.79 | 2.88 | 3.40 | 3.47 | 3.38 |
|
The classification of distributions, if any, is an estimate. Before-sales-charge share value and current dividend rate for class A and M shares, if applicable, do not take into account any sales charge levied at the time of purchase. After-sales-charge share value, current dividend rate, and current 30-day SEC yield, if applicable, are calculated assuming that the maximum sales charge (4.00% for class A shares and 3.25% for class M shares) was levied at the time of purchase. Final distribution information will appear on your year-end tax forms.
1 Most recent distribution, excluding capital gains, annualized and divided by share price before or after sales charge at period-end.
2 Based only on investment income and calculated using the maximum offering price for each share class, in accordance with SEC guidelines.
* Inception date of class R5 and class R6 shares.
Fund performance as of most recent calendar quarter
Total return for periods ended 9/30/12
| | | | | | | | | | | | |
| | Class A | Class B | Class C | Class M | Class R | Class R5 | Class R6 | Class Y |
| (inception dates) | (11/1/54) | (3/1/93) | (7/26/99) | (12/14/94) | (1/21/03) | (7/2/12) | (7/2/12) | (6/16/94) |
|
| | Before | After | | | | | Before | After | Net | Net | Net | Net |
| | sales | sales | Before | After | Before | After | sales | sales | asset | asset | asset | asset |
| | charge | charge | CDSC | CDSC | CDSC | CDSC | charge | charge | value | value | value | value |
|
| Annual average | | | | | | | | | | | | |
| (life of fund) | 7.90% | 7.82% | 6.91% | 6.91% | 7.09% | 7.09% | 7.46% | 7.40% | 7.63% | 7.98% | 7.98% | 7.98% |
|
| 10 years | 77.79 | 70.62 | 65.02 | 65.02 | 65.07 | 65.07 | 73.52 | 67.93 | 73.52 | 82.35 | 82.35 | 82.32 |
| Annual average | 5.92 | 5.49 | 5.14 | 5.14 | 5.14 | 5.14 | 5.67 | 5.32 | 5.67 | 6.19 | 6.19 | 6.19 |
|
| 5 years | 45.75 | 39.94 | 40.38 | 38.38 | 40.40 | 40.40 | 43.89 | 39.29 | 43.82 | 47.56 | 47.56 | 47.54 |
| Annual average | 7.83 | 6.95 | 7.02 | 6.71 | 7.02 | 7.02 | 7.55 | 6.85 | 7.54 | 8.09 | 8.09 | 8.09 |
|
| 3 years | 30.38 | 25.15 | 27.62 | 24.62 | 27.59 | 27.59 | 29.64 | 25.49 | 29.53 | 31.60 | 31.60 | 31.58 |
| Annual average | 9.25 | 7.76 | 8.47 | 7.61 | 8.46 | 8.46 | 9.04 | 7.86 | 9.01 | 9.59 | 9.59 | 9.58 |
|
| 1 year | 9.09 | 4.78 | 8.40 | 3.40 | 8.37 | 7.37 | 8.91 | 5.44 | 8.76 | 9.35 | 9.35 | 9.34 |
|
Your fund’s expenses
As a mutual fund investor, you pay ongoing expenses, such as management fees, distribution fees (12b-1 fees), and other expenses. Using the following information, you can estimate how these expenses affect your investment and compare them with the expenses of other funds. You may also pay one-time transaction expenses, including sales charges (loads) and redemption fees, which are not shown in this section and would have resulted in higher total expenses. For more information, see your fund’s prospectus or talk to your financial representative.
Expense ratios
| | | | | | | | |
| | Class A | Class B | Class C | Class M | Class R | Class R5 | Class R6 | Class Y |
|
| Total annual operating expenses for | | | | | | | | |
| the fiscal year ended 10/31/11 | 0.87% | 1.62% | 1.62% | 1.12% | 1.12% | 0.60%* | 0.53%* | 0.62% |
|
| Annualized expense ratio | | | | | | | | |
| for the six-month period | | | | | | | | |
| ended 10/31/12† | 0.85% | 1.60% | 1.60% | 1.10% | 1.10% | 0.58% | 0.51% | 0.60% |
|
Fiscal-year expense information in this table is taken from the most recent prospectus, is subject to change, and may differ from that shown for the annualized expense ratio and in the financial highlights of this report. Expenses are shown as a percentage of average net assets.
* Expenses for class R5 and R6 shares are based on the other expenses of class A shares for the fund’s last fiscal year, adjusted to reflect the lower investor servicing fees applicable to class R5 and R6 shares.
† For the fund’s most recent fiscal half year, or in the case of class R5 and R6 shares, from July 3, 2012 (commencement of operations) to October 31, 2012; may differ from expense ratios based on one-year data in the financial highlights.
Expenses per $1,000
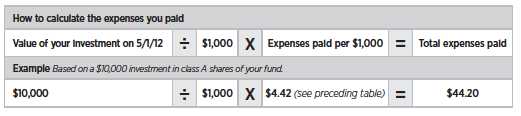
The following table shows the expenses you would have paid on a $1,000 investment in the fund from May 1, 2012 (or in the case of class R5 and R6 shares, from July 3, 2012 (commencement of operations)), to October 31, 2012. It also shows how much a $1,000 investment would be worth at the close of the period, assuming actual returns and expenses.
| | | | | | | | |
| | Class A | Class B | Class C | Class M | Class R | Class R5 | Class R6 | Class Y |
|
| Expenses paid per $1,000*† | $4.42 | $8.30 | $8.30 | $5.71 | $5.72 | $1.96‡ | $1.72‡ | $3.12 |
|
| Ending value (after expenses) | $1,068.00 | $1,064.90 | $1,064.70 | $1,066.80 | $1,067.30 | $1,043.90 | $1,045.40 | $1,069.80 |
|
* Expenses for each share class are calculated using the fund’s annualized expense ratio for each class, which represents the ongoing expenses as a percentage of average net assets for the six months ended 10/31/12 (or, in the case of class R5 and R6 shares, the period from 7/3/12 (commencement of operations) to 10/31/12). The expense ratio may differ for each share class.
† Expenses are calculated by multiplying the expense ratio by the average account value for the period; then multiplying the result by the number of days in the period; and then dividing that result by the number of days in the year.
‡ Had expenses for class R5 and R6 shares been shown for the entire period from May 1, 2012 to October 31, 2012, they would have been higher.
Estimate the expenses you paid
To estimate the ongoing expenses you paid for the six months ended October 31, 2012, use the following calculation method. To find the value of your investment on May 1, 2012, call Putnam at 1-800-225-1581.
Compare expenses using the SEC’s method
The Securities and Exchange Commission (SEC) has established guidelines to help investors assess fund expenses. Per these guidelines, the following table shows your fund’s expenses based on a $1,000 investment, assuming a hypothetical 5% annualized return. You can use this information to compare the ongoing expenses (but not transaction expenses or total costs) of investing in the fund with those of other funds. All mutual fund shareholder reports will provide this information to help you make this comparison. Please note that you cannot use this information to estimate your actual ending account balance and expenses paid during the period.
| | | | | | | | |
| | Class A | Class B | Class C | Class M | Class R | Class R5 | Class R6 | Class Y |
|
| Expenses paid per $1,000*† | $4.32 | $8.11 | $8.11 | $5.58 | $5.58 | $2.95 | $2.59 | $3.05 |
|
| Ending value (after expenses) | $1,020.86 | $1,017.09 | $1,017.09 | $1,019.61 | $1,019.61 | $1,022.22 | $1,022.57 | $1,022.12 |
|
* Expenses for each share class are calculated using the fund’s annualized expense ratio for each class, which represents the ongoing expenses as a percentage of average net assets for the six months ended 10/31/12 (or, in the case of class R5 and R6 shares, the period from 7/3/12 (commencement of operations) to 10/31/12). The expense ratio may differ for each share class.
† Expenses are calculated by multiplying the expense ratio by the average account value for the period; then multiplying the result by the number of days in the period; and then dividing that result by the number of days in the year.
Terms and definitions
Important terms
Total return shows how the value of the fund’s shares changed over time, assuming you held the shares through the entire period and reinvested all distributions in the fund.
Before sales charge, or net asset value, is the price, or value, of one share of a mutual fund, without a sales charge. Before-sales-charge figures fluctuate with market conditions, and are calculated by dividing the net assets of each class of shares by the number of outstanding shares in the class.
After sales charge is the price of a mutual fund share plus the maximum sales charge levied at the time of purchase. After-sales-charge performance figures shown here assume the 4.00% maximum sales charge for class A shares and 3.25% for class M shares.
Contingent deferred sales charge (CDSC) is generally a charge applied at the time of the redemption of class B or C shares and assumes redemption at the end of the period. Your fund’s class B CDSC declines over time from a 5% maximum during the first year to 1% during the sixth year. After the sixth year, the CDSC no longer applies. The CDSC for class C shares is 1% for one year after purchase.
Share classes
Class A shares are generally subject to an initial sales charge and no CDSC (except on certain redemptions of shares bought without an initial sales charge).
Class B shares are not subject to an initial sales charge. They may be subject to a CDSC.
Class C shares are not subject to an initial sales charge and are subject to a CDSC only if the shares are redeemed during the first year.
Class M shares have a lower initial sales charge and a higher 12b-1 fee than class A shares and no CDSC (except on certain redemptions of shares bought without an initial sales charge).
Class R shares are not subject to an initial sales charge or CDSC and are available only to certain defined contribution plans.
Class R5 shares and class R6 shares are not subject to an initial sales charge or CDSC, and carry no 12b-1 fee. They are only available to certain defined contribution plans with assets of at least $50 million.
Class Y shares are not subject to an initial sales charge or CDSC, and carry no 12b-1 fee. They are generally only available to corporate and institutional clients and clients in other approved programs.
Fixed-income terms
Current yield is the annual rate of return earned from dividends or interest of an investment. Current yield is expressed as a percentage of the price of a security, fund share, or principal investment.
Mortgage-backed security (MBS), also known as a mortgage “pass-through”, is a type of asset-backed security that is secured by a mortgage or collection of mortgages. The following are types of MBSs:
• Agency “pass-through” has its principal and interest backed by a U.S. government agency, such as the Federal National Mortgage Association (Fannie Mae), Government National Mortgage Association (Ginnie Mae), and Federal Home Loan Mortgage Corporation (Freddie Mac).
• Collateralized mortgage obligation (CMO) represents claims to specific cash flows from pools of home mortgages. The streams of principal and interest payments on the mortgages are distributed to the different classes of CMO interests in “tranches”. Each tranche may have different principal balances, coupon rates, prepayment risks, and maturity dates. A CMO is highly sensitive to changes in interest rates and any resulting change in the rate at which homeowners sell their properties, refinance, or otherwise prepay loans. CMOs are subject to prepayment, market, and liquidity risks.
• Interest-only (IO) security is a type of CMO in which the underlying asset is the interest portion of mortgage, Treasury, or bond payments.
• Non-agency residential mortgage-backed security (RMBS) is an MBS not backed by Fannie Mae, Ginnie Mae, or Freddie Mac. One type of RMBS is an Alt-A mortgage-backed security.
• Commercial mortgage-backed security (CMBS) is secured by the loan on a commercial property.
Yield curve is a graph that plots the yields of bonds with equal credit quality against their differing maturity dates, ranging from shortest to longest. It is used as a benchmark for other debt, such as mortgage or bank lending rates.
Comparative indexes
Barclays U.S. Aggregate Bond Index is an unmanaged index of U.S. investment-grade fixed-income securities.
BofA (Bank of America) Merrill Lynch U.S. 3-Month Treasury Bill Index is an unmanaged index that seeks to measure the performance of U.S. Treasury bills available in the marketplace.
S&P 500 Index is an unmanaged index of common stock performance.
Indexes assume reinvestment of all distributions and do not account for fees. Securities and performance of a fund and an index will differ. You cannot invest directly in an index.
Lipper is a third-party industry-ranking entity that ranks mutual funds. Its rankings do not reflect sales charges. Lipper rankings are based on total return at net asset value relative to other funds that have similar current investment styles or objectives as determined by Lipper. Lipper may change a fund’s category assignment at its discretion. Lipper category averages reflect performance trends for funds within a category.
Other information for shareholders
Important notice regarding Putnam’s privacy policy
In order to conduct business with our shareholders, we must obtain certain personal information such as account holders’ names, addresses, Social Security numbers, and dates of birth. Using this information, we are able to maintain accurate records of accounts and transactions.
It is our policy to protect the confidentiality of our shareholder information, whether or not a shareholder currently owns shares of our funds. In particular, it is our policy not to sell information about you or your accounts to outside marketing firms. We have safeguards in place designed to prevent unauthorized access to our computer systems and procedures to protect personal information from unauthorized use.
Under certain circumstances, we must share account information with outside vendors who provide services to us, such as mailings and proxy solicitations. In these cases, the service providers enter into confidentiality agreements with us, and we provide only the information necessary to process transactions and perform other services related to your account. Finally, it is our policy to share account information with your financial representative, if you’ve listed one on your Putnam account.
Proxy voting
Putnam is committed to managing our mutual funds in the best interests of our shareholders. The Putnam funds’ proxy voting guidelines and procedures, as well as information regarding how your fund voted proxies relating to portfolio securities during the 12-month period ended June 30, 2012, are available in the Individual Investors section at putnam.com, and on the Securities and Exchange Commission (SEC) website, www.sec.gov. If you have questions about finding forms on the SEC’s website, you may call the SEC at 1-800-SEC-0330. You may also obtain the Putnam funds’ proxy voting guidelines and procedures at no charge by calling Putnam’s Shareholder Services at 1-800-225-1581.
Fund portfolio holdings
The fund will file a complete schedule of its portfolio holdings with the SEC for the first and third quarters of each fiscal year on Form N-Q. Shareholders may obtain the fund’s Forms N-Q on the SEC’s website at www.sec.gov. In addition, the fund’s Forms N-Q may be reviewed and copied at the SEC’s Public Reference Room in Washington, D.C. You may call the SEC at 1-800-SEC-0330 for information about the SEC’s website or the operation of the Public Reference Room.
Trustee and employee fund ownership
Putnam employees and members of the Board of Trustees place their faith, confidence, and, most importantly, investment dollars in Putnam mutual funds. As of October 31, 2012, Putnam employees had approximately $338,000,000 and the Trustees had approximately $82,000,000 invested in Putnam mutual funds. These amounts include investments by the Trustees’ and employees’ immediate family members as well as investments through retirement and deferred compensation plans.
Trustee approval of management contract
General conclusions
The Board of Trustees of the Putnam funds oversees the management of each fund and, as required by law, determines annually whether to approve the continuance of your fund’s management contract with Putnam Investment Management (“Putnam Management”) and the sub-management contract with respect to your fund between Putnam Management and its affiliate, Putnam Investments Limited (“PIL”).
The Board of Trustees, with the assistance of its Contract Committee, requests and evaluates all information it deems reasonably necessary under the circumstances in connection with its annual contract review. The Contract Committee consists solely of Trustees who are not “interested persons” (as this term is defined in the Investment Company Act of 1940, as amended (the “1940 Act”)) of the Putnam funds (“Independent Trustees”).
At the outset of the review process, members of the Board’s independent staff and independent legal counsel met with representatives of Putnam Management to review the annual contract review materials furnished to the Contract Committee during the course of the previous year’s review and to discuss possible changes in these materials that might be necessary or desirable for the coming year. Following these discussions and in consultation with the Contract Committee, the Independent Trustees’ independent legal counsel requested that Putnam Management furnish specified information, together with any additional information that Putnam Management considered relevant, to the Contract Committee. Over the course of several months ending in June 2012, the Contract Committee met on a number of occasions with representatives of Putnam Management, and separately in executive session, to consider the information that Putnam Management provided. Throughout this process, the Contract Committee was assisted by the members of the Board’s independent staff and by independent legal counsel for the Putnam funds and the Independent Trustees.
In May 2012, the Contract Committee met in executive session with the other Independent Trustees to discuss the Contract Committee’s preliminary recommendations with respect to the continuance of the contracts. At the Trustees’ June 22, 2012 meeting, the Contract Committee met in executive session with the other Independent Trustees to review a summary of the key financial data that the Contract Committee considered in the course of its review. The Contract Committee then presented its written report, which summarized the key factors that the Committee had considered and set forth its final recommendations. The Contract Committee then recommended, and the Independent Trustees approved, the continuance of your fund’s management and sub-management contracts, effective July 1, 2012. (Because PIL is an affiliate of Putnam Management and Putnam Management remains fully responsible for all services provided by PIL, the Trustees have not evaluated PIL as a separate entity, and all subsequent references to Putnam Management below should be deemed to include reference to PIL as necessary or appropriate in the context.)
The Independent Trustees’ approval was based on the following conclusions:
• That the fee schedule in effect for your fund represented reasonable compensation in light of the nature and quality of the services being provided to the fund, the fees paid by competitive funds, and the costs incurred by Putnam Management in providing services, and
• That the fee schedule represented an appropriate sharing between fund shareholders and Putnam Management of such economies of scale as may exist in the management of the fund at current asset levels.
These conclusions were based on a comprehensive consideration of all information provided to the Trustees and were not the result of any single factor. Some of the factors that figured particularly in the Trustees’ deliberations and how the Trustees considered these factors are described below, although individual Trustees may have evaluated the information presented differently, giving different weights to various factors. It is also important to recognize that the management arrangements for your fund and the other Putnam funds are the result of many years of review and discussion between the Independent Trustees and Putnam Management, that some aspects of the arrangements may receive greater scrutiny in some years than others, and that the Trustees’ conclusions may be based, in part, on their consideration of fee arrangements in previous years.
Management fee schedules and total expenses
The Trustees reviewed the management fee schedules in effect for all Putnam funds, including fee levels and breakpoints. In reviewing management fees, the Trustees generally focus their attention on material changes in circumstances — for example, changes in assets under management, changes in a fund’s investment style, changes in Putnam Management’s operating costs, or changes in competitive practices in the mutual fund industry — that suggest that consideration of fee changes might be warranted. The Trustees concluded that the circumstances did not warrant changes to the management fee structure of your fund.
Most of the open-end Putnam funds, including your fund, have relatively new management contracts, which introduced fee schedules that reflect more competitive fee levels for many funds, complex-wide breakpoints for the open-end funds, and performance fees for some funds. These new management contracts have been in effect for two years — since January or, for a few funds, February 2010. The Trustees approved the new management contracts on July 10, 2009, and fund shareholders subsequently approved the contracts by overwhelming majorities of the shares voted.
Under its management contract, your fund has the benefit of breakpoints in its management fee that provide shareholders with significant economies of scale in the form of reduced fee levels as assets under management in the Putnam family of funds increase. The Contract Committee observed that the complex-wide breakpoints of the open-end funds had only been in place for two years, and the Trustees will continue to examine the operation of this new breakpoint structure in future years in light of further experience.
As in the past, the Trustees also focused on the competitiveness of each fund’s total expense ratio. In order to ensure that expenses of the Putnam funds continue to meet evolving competitive standards, the Trustees and Putnam Management agreed in 2009 to implement certain expense limitations. These expense limitations serve in particular to maintain competitive expense levels for funds with large numbers of small shareholder accounts and funds with relatively small net assets. Most funds, including your fund, had sufficiently low expenses that these expense limitations did not apply. The expense limitations were: (i) a contractual expense limitation applicable to all retail open-end funds of 37.5 basis points (effective March 1, 2012, this expense limitation was reduced to 32 basis points) on investor servicing fees and expenses and (ii) a contractual expense limitation applicable to all open-end funds of 20 basis points on so-called “other expenses” (i.e., all expenses exclusive of management fees, investor servicing fees, distribution fees, investment-related expenses, interest, taxes, brokerage commissions, extraordinary expenses and acquired fund fees and expenses). Putnam Management’s support for these expense limitations, including its agreement to reduce the expense limitation
applicable to the open-end funds’ investor servicing fees and expenses as noted above, was an important factor in the Trustees’ decision to approve the continuance of your fund’s management and sub-management contracts.
The Trustees reviewed comparative fee and expense information for a custom group of competitive funds selected by Lipper Inc. This comparative information included your fund’s percentile ranking for effective management fees and total expenses (excluding any applicable 12b-1 fee), which provides a general indication of your fund’s relative standing. In the custom peer group, your fund ranked in the 1st quintile in effective management fees (determined for your fund and the other funds in the custom peer group based on fund asset size and the applicable contractual management fee schedule) and in the 2nd quintile in total expenses (excluding any applicable 12b-1 fees) as of December 31, 2011 (the first quintile representing the least expensive funds and the fifth quintile the most expensive funds). The fee and expense data reported by Lipper as of December 31, 2011 reflected the most recent fiscal year-end data available in Lipper’s database at that time.
In connection with their review of the management fees and total expenses of the Putnam funds, the Trustees also reviewed the costs of the services provided and the profits realized by Putnam Management and its affiliates from their contractual relationships with the funds. This information included trends in revenues, expenses and profitability of Putnam Management and its affiliates relating to the investment management, investor servicing and distribution services provided to the funds. In this regard, the Trustees also reviewed an analysis of Putnam Management’s revenues, expenses and profitability, allocated on a fund-by-fund basis, with respect to the funds’ management, distribution, and investor servicing contracts. For each fund, the analysis presented information about revenues, expenses and profitability for each of the agreements separately and for the agreements taken together on a combined basis. The Trustees concluded that, at current asset levels, the fee schedules in place represented reasonable compensation for the services being provided and represented an appropriate sharing of such economies of scale as may exist in the management of the funds at that time.
The information examined by the Trustees as part of their annual contract review for the Putnam funds has included for many years information regarding fees charged by Putnam Management and its affiliates to institutional clients such as defined benefit pension plans, college endowments, and the like. This information included comparisons of those fees with fees charged to the funds, as well as an assessment of the differences in the services provided to these different types of clients. The Trustees observed that the differences in fee rates between institutional clients and mutual funds are by no means uniform when examined by individual asset sectors, suggesting that differences in the pricing of investment management services to these types of clients may reflect historical competitive forces operating in separate markets. The Trustees considered the fact that in many cases fee rates across different asset classes are higher on average for mutual funds than for institutional clients, as well as the differences between the services that Putnam Management provides to the Putnam funds and those that it provides to its institutional clients. The Trustees did not rely on these comparisons to any significant extent in concluding that the management fees paid by your fund are reasonable.
Investment performance
The quality of the investment process provided by Putnam Management represented a major factor in the Trustees’ evaluation of the quality of services provided by Putnam Management under your fund’s management contract. The Trustees were assisted in their review of the Putnam funds’ investment process and
performance by the work of the investment oversight committees of the Trustees, which meet on a regular basis with the funds’ portfolio teams and with the Chief Investment Officer and other members of Putnam Management’s Investment Division throughout the year. The Trustees concluded that Putnam Management generally provides a high-quality investment process — based on the experience and skills of the individuals assigned to the management of fund portfolios, the resources made available to them, and in general Putnam Management’s ability to attract and retain high-quality personnel — but also recognized that this does not guarantee favorable investment results for every fund in every time period.
The Trustees considered the investment performance of each fund over multiple time periods and considered information comparing each fund’s performance with various benchmarks and, where applicable, with the performance of competitive funds or targeted annualized return. They noted that since 2009, when Putnam Management began implementing major changes to strengthen its investment personnel and processes, there has been a steady improvement in the number of Putnam funds showing above-median three-year performance results. They also noted the disappointing investment performance of some funds for periods ended December 31, 2011 and considered information provided by Putnam Management regarding the factors contributing to the underperformance and actions being taken to improve the performance of these particular funds. The Trustees indicated their intention to continue to monitor performance trends to assess the effectiveness of these efforts and to evaluate whether additional actions to address areas of underperformance are warranted.
In the case of your fund, the Trustees considered that its class A share cumulative total return performance at net asset value was in the following quartiles of its Lipper Inc. peer group (Lipper Corporate Debt Funds A Rated) for the one-year, three-year and five-year periods ended December 31, 2011 (the first quartile representing the best-performing funds and the fourth quartile the worst-performing funds):
| | | |
| One-year period | 4th | | |
| | |
| Three-year period | 1st | | |
| | |
| Five-year period | 1st | | |
| | |
Over the one-year, three-year and five-year periods ended December 31, 2011, there were 118, 102 and 94 funds, respectively, in your fund’s Lipper peer group. (When considering performance information, shareholders should be mindful that past performance is not a guarantee of future results.)
The Trustees, while noting that your fund’s investment performance over the three- and five-year periods ended December 31, 2011 had been favorable, expressed concern about your fund’s fourth quartile performance over the one-year period ended December 31, 2011 and considered the circumstances that may have contributed to this disappointing performance. The Trustees considered Putnam Management’s view that the fund’s underperformance over the one-year period was due in significant part to the fund’s relative emphasis on shorter duration investments, which reduced the fund’s sensitivity to interest rate changes but detracted from performance. In addition, performance was hurt by the fund’s exposure to investment-grade corporate bonds and non-agency residential mortgage-backed securities. These investments underperformed in the unpredictable 2011 markets, which were affected by fears of Greek and other European sovereign defaults, Standard & Poor’s downgrade of the United States’ long-term credit rating, and other negative events.
The Trustees considered steps that Putnam Management had taken to support improved performance, noting in particular that, in July 2011, two new portfolio managers had
joined the fund’s portfolio management. The Trustees also considered that, although the fund had not performed well in 2011, the fund ranked in the first quartile for the three- and five-year periods ended December 31, 2011, and that Putnam Management remained confident in the fund’s portfolio managers and their investment process. The Trustees also considered a number of other changes that Putnam Management had made in recent years in efforts to support and improve fund performance generally. In particular, the Trustees recognized that Putnam Management has adjusted the compensation structure for portfolio managers and research analysts so that only those who achieve top-quartile returns over a rolling three-year basis are eligible for full bonuses.
As a general matter, the Trustees believe that cooperative efforts between the Trustees and Putnam Management represent the most effective way to address investment performance problems. The Trustees noted that investors in the Putnam funds have, in effect, placed their trust in the Putnam organization, under the oversight of the funds’ Trustees, to make appropriate decisions regarding the management of the funds. Based on the responsiveness of Putnam Management in the recent past to performance issues, the Trustees concluded that it is preferable to seek change within Putnam Management to address performance shortcomings. In the Trustees’ view, the alternative of engaging a new investment adviser for anunderperforming fund would entail significant disruptions and would not provide any greater assurance of improved investment performance.
Brokerage and soft-dollar allocations; investor servicing
The Trustees considered various potential benefits that Putnam Management may receive in connection with the services it provides under the management contract with your fund. These include benefits related to brokerage allocation and the use of soft dollars, whereby a portion of the commissions paid by a fund for brokerage may be used to acquire research services that are expected to be useful to Putnam Management in managing the assets of the fund and of other clients. Subject to policies established by the Trustees, soft-dollar credits acquired through these means are used primarily to acquire research services that supplement Putnam Management’s internal research efforts. However, the Trustees noted that a portion of available soft-dollar credits continues to be allocated to the payment of fund expenses. The Trustees indicated their continued intent to monitor regulatory developments in this area with the assistance of their Brokerage Committee and also indicated their continued intent to monitor the potential benefits associated with fund brokerage and soft-dollar allocations and trends in industry practices to ensure that the principle of seeking best price and execution remains paramount in the portfolio trading process.
Putnam Management may also receive benefits from payments that the funds make to Putnam Management’s affiliates for investor or distribution services. In conjunction with the annual review of your fund’s management and sub-management contracts, the Trustees reviewed your fund’s investor servicing agreement with Putnam Investor Services, Inc. (“PSERV”) and its distributor’s contracts and distribution plans with Putnam Retail Management Limited Partnership (“PRM”), both of which are affiliates of Putnam Management. The Trustees concluded that the fees payable by the funds to PSERV and PRM, as applicable, for such services are reasonable in relation to the nature and quality of such services.
Financial statements
These sections of the report, as well as the accompanying Notes, preceded by the Report of Independent Registered Public Accounting Firm, constitute the fund’s financial statements.
The fund’s portfolio lists all the fund’s investments and their values as of the last day of the reporting period. Holdings are organized by asset type and industry sector, country, or state to show areas of concentration and diversification.
Statement of assets and liabilities shows how the fund’s net assets and share price are determined. All investment and non-investment assets are added together. Any unpaid expenses and other liabilities are subtracted from this total. The result is divided by the number of shares to determine the net asset value per share, which is calculated separately for each class of shares. (For funds with preferred shares, the amount subtracted from total assets includes the liquidation preference of preferred shares.)
Statement of operations shows the fund’s net investment gain or loss. This is done by first adding up all the fund’s earnings — from dividends and interest income — and subtracting its operating expenses to determine net investment income (or loss). Then, any net gain or loss the fund realized on the sales of its holdings — as well as any unrealized gains or losses over the period — is added to or subtracted from the net investment result to determine the fund’s net gain or loss for the fiscal year.
Statement of changes in net assets shows how the fund’s net assets were affected by the fund’s net investment gain or loss, by distributions to shareholders, and by changes in the number of the fund’s shares. It lists distributions and their sources (net investment income or realized capital gains) over the current reporting period and the most recent fiscal year-end. The distributions listed here may not match the sources listed in the Statement of operations because the distributions are determined on a tax basis and may be paid in a different period from the one in which they were earned.
Financial highlights provide an overview of the fund’s investment results, per-share distributions, expense ratios, net investment income ratios, and portfolio turnover in one summary table, reflecting the five most recent reporting periods. In a semiannual report, the highlights table also includes the current reporting period.
Report of Independent Registered Public Accounting Firm
The Board of Trustees and Shareholders
Putnam Income Fund:
We have audited the accompanying statement of assets and liabilities of Putnam Income Fund (the fund), including the fund’s portfolio, as of October 31, 2012, and the related statement of operations for the year then ended, the statements of changes in net assets for each of the years in the two-year period then ended, and the financial highlights for each of the years or periods in the five-year period then ended. These financial statements and financial highlights are the responsibility of the fund’s management. Our responsibility is to express an opinion on these financial statements and financial highlights based on our audits.
We conducted our audits in accordance with the standards of the Public Company Accounting Oversight Board (United States). Those standards require that we plan and perform the audit to obtain reasonable assurance about whether the financial statements and financial highlights are free of material misstatement. An audit includes examining, on a test basis, evidence supporting the amounts and disclosures in the financial statements. Our procedures included confirmation of securities owned as of October 31, 2012, by correspondence with the custodian and brokers or by other appropriate auditing procedures. An audit also includes assessing the accounting principles used and significant estimates made by management, as well as evaluating the overall financial statement presentation. We believe that our audits provide a reasonable basis for our opinion.
In our opinion, the financial statements and financial highlights referred to above present fairly, in all material respects, the financial position of Putnam Income Fund as of October 31, 2012, the results of its operations for the year then ended, the changes in its net assets for each of the years in the two-year period then ended, and the financial highlights for each of the years or periods in the five-year period then ended, in conformity with U.S. generally accepted accounting principles.
Boston, Massachusetts
December 14, 2012
The fund’s portfolio 10/31/12
| | |
| U.S. GOVERNMENT AND AGENCY | | |
| MORTGAGE OBLIGATIONS (50.0%)* | Principal amount | Value |
|
| U.S. Government Guaranteed Mortgage Obligations (1.2%) | | |
| Government National Mortgage Association | | |
| Pass-Through Certificates | | |
| 3 1/2s, July 15, 2042 | $12,780,958 | $14,016,617 |
| 3s, TBA, January 1, 2043 | 1,000,000 | 1,059,375 |
| 3s, TBA, November 1, 2042 | 2,000,000 | 2,130,156 |
|
| | | 17,206,148 |
| U.S. Government Agency Mortgage Obligations (48.8%) | | |
| Federal Home Loan Mortgage Corporation | | |
| Pass-Through Certificates | | |
| 4s, June 1, 2042 | 16,902,928 | 18,813,752 |
| 3s, TBA, November 1, 2042 | 12,000,000 | 12,569,063 |
|
| Federal National Mortgage Association | | |
| Pass-Through Certificates | | |
| 7s, January 1, 2017 | 4,084 | 4,309 |
| 5s, TBA, November 1, 2042 | 42,000,000 | 45,819,375 |
| 4s, with due dates from June 1, 2042 to November 1, 2042 | 129,393,276 | 144,126,926 |
| 3s, TBA, February 1, 2043 | 93,000,000 | 96,941,600 |
| 3s, TBA, November 1, 2042 | 365,000,000 | 383,164,444 |
|
| | | 701,439,469 |
| | | |
| Total U.S. government and agency mortgage obligations (cost $715,277,298) | $718,645,617 |
| |
| |
| MORTGAGE-BACKED SECURITIES (39.2%)* | Principal amount | Value |
|
| Agency collateralized mortgage obligations (14.8%) | | |
| Federal Home Loan Mortgage Corp. | | |
| IFB Ser. 3408, Class EK, 24.932s, 2037 | $1,595,458 | $2,537,289 |
| IFB Ser. 2976, Class LC, 23.635s, 2035 | 241,219 | 385,951 |
| IFB Ser. 2979, Class AS, 23.489s, 2034 | 152,957 | 203,398 |
| IFB Ser. 3072, Class SB, 22.865s, 2035 | 910,150 | 1,439,791 |
| IFB Ser. 3249, Class PS, 21.569s, 2036 | 831,590 | 1,260,950 |
| IFB Ser. 3065, Class DC, 19.218s, 2035 | 1,021,933 | 1,603,647 |
| IFB Ser. 2990, Class LB, 16.399s, 2034 | 1,224,160 | 1,718,586 |
| IFB Ser. 4105, Class HS, IO, 6.386s, 2042 | 5,899,613 | 1,293,844 |
| IFB Ser. 3803, Class SP, IO, 6.386s, 2038 | 10,382,209 | 830,577 |
| IFB Ser. 3861, Class PS, IO, 6.386s, 2037 | 5,409,405 | 863,449 |
| IFB Ser. 3907, Class KS, IO, 6.336s, 2040 | 6,153,570 | 833,854 |
| IFB Ser. 3708, Class SA, IO, 6.236s, 2040 | 16,896,667 | 2,331,571 |
| IFB Ser. 4112, Class SC, IO, 5.936s, 2042 | 13,350,682 | 2,314,901 |
| IFB Ser. 4105, Class LS, IO, 5.936s, 2041 | 5,855,774 | 1,174,258 |
| IFB Ser. 4012, Class ES, IO, 5.836s, 2038 | 13,974,101 | 2,532,387 |
| IFB Ser. 3852, Class NT, 5.786s, 2041 | 3,864,999 | 4,258,030 |
| IFB Ser. 3752, Class PS, IO, 5.786s, 2040 | 8,640,765 | 1,340,874 |
| FRB Ser. 3036, Class AS, 5 1/2s, 2035 | 54,334 | 47,462 |
| Ser. 3632, Class CI, IO, 5s, 2038 | 325,425 | 18,003 |
| Ser. 3626, Class DI, IO, 5s, 2037 | 191,385 | 6,153 |
| Ser. 4122, Class TI, IO, 4 1/2s, 2042 | 7,398,000 | 1,125,976 |
| Ser. 4018, Class DI, IO, 4 1/2s, 2041 | 9,540,782 | 1,151,763 |
| Ser. 3747, Class HI, IO, 4 1/2s, 2037 | 2,373,740 | 194,448 |
| Ser. 3707, Class PI, IO, 4 1/2s, 2025 | 8,576,302 | 660,032 |
| | |
| MORTGAGE-BACKED SECURITIES (39.2%)* cont. | Principal amount | Value |
|
| Agency collateralized mortgage obligations cont. | | |
| Federal Home Loan Mortgage Corp. | | |
| Ser. 4116, Class MI, IO, 4s, 2042 | $15,001,000 | $2,306,404 |
| Ser. 4090, Class BI, IO, 4s, 2042 | 3,942,209 | 444,721 |
| Ser. 4026, Class JI, IO, 4s, 2041 | 3,334,403 | 380,455 |
| Ser. 3740, Class KI, IO, 4s, 2033 | 11,311,989 | 167,531 |
| Ser. 4077, Class AI, IO, 3s, 2027 | 16,113,802 | 1,649,570 |
| Ser. T-56, Class A, IO, 0.524s, 2043 | 13,226,356 | 227,845 |
| Ser. T-56, Class 3, IO, 0.484s, 2043 | 4,713,314 | 61,862 |
| Ser. T-56, Class 1, IO, 0.299s, 2043 | 15,927,926 | 119,459 |
| Ser. T-56, Class 2, IO, 0.131s, 2043 | 5,672,428 | 17,726 |
| Ser. 4077, Class TO, PO, zero %, 2041 | 3,103,607 | 2,646,694 |
| Ser. 3835, Class FO, PO, zero %, 2041 | 9,085,348 | 7,633,327 |
| Ser. 3369, Class BO, PO, zero %, 2037 | 63,832 | 59,762 |
| Ser. 3391, PO, zero %, 2037 | 155,557 | 141,272 |
| Ser. 3300, PO, zero %, 2037 | 949,314 | 888,699 |
| Ser. 3206, Class EO, PO, zero %, 2036 | 40,601 | 38,092 |
| Ser. 3175, Class MO, PO, zero %, 2036 | 133,077 | 125,043 |
| Ser. 3210, PO, zero %, 2036 | 33,174 | 31,585 |
| FRB Ser. 3117, Class AF, zero %, 2036 | 36,311 | 29,842 |
| FRB Ser. 3326, Class WF, zero %, 2035 | 95,745 | 86,171 |
|
| Federal National Mortgage Association | | |
| IFB Ser. 06-62, Class PS, 38.636s, 2036 | 1,687,145 | 3,129,496 |
| IFB Ser. 06-8, Class HP, 23.794s, 2036 | 947,643 | 1,606,813 |
| IFB Ser. 05-45, Class DA, 23.647s, 2035 | 1,875,011 | 3,122,042 |
| IFB Ser. 05-122, Class SE, 22.363s, 2035 | 1,671,382 | 2,540,758 |
| IFB Ser. 05-75, Class GS, 19.618s, 2035 | 756,625 | 1,109,932 |
| IFB Ser. 05-106, Class JC, 19.471s, 2035 | 971,467 | 1,555,765 |
| IFB Ser. 05-83, Class QP, 16.846s, 2034 | 218,706 | 306,957 |
| IFB Ser. 11-4, Class CS, 12.479s, 2040 | 2,008,134 | 2,413,340 |
| IFB Ser. 12-96, Class PS, IO, 6.489s, 2041 | 10,776,578 | 2,244,761 |
| IFB Ser. 12-88, Class SB, IO, 6.459s, 2042 | 8,605,663 | 1,571,738 |
| IFB Ser. 12-75, Class SK, IO, 6.439s, 2041 | 15,076,956 | 3,026,397 |
| IFB Ser. 12-4, Class SN, IO, 6.389s, 2040 | 7,703,392 | 1,367,352 |
| IFB Ser. 12-75, Class KS, IO, 6.339s, 2042 | 10,255,306 | 1,839,904 |
| IFB Ser. 12-3, Class CS, IO, 6.339s, 2040 | 10,190,844 | 1,878,478 |
| IFB Ser. 12-3, Class SD, IO, 6.299s, 2042 | 3,712,935 | 665,989 |
| IFB Ser. 11-87, Class HS, IO, 6.289s, 2041 | 5,935,499 | 1,032,777 |
| IFB Ser. 11-67, Class BS, IO, 6.289s, 2041 | 19,225,252 | 3,360,766 |
| IFB Ser. 11-27, Class AS, IO, 6.269s, 2041 | 12,952,783 | 1,836,187 |
| IFB Ser. 12-30, Class HS, IO, 6.239s, 2042 | 30,327,106 | 5,773,068 |
| IFB Ser. 10-35, Class SG, IO, 6.189s, 2040 | 29,451,158 | 3,924,661 |
| IFB Ser. 12-113, Class CS, IO, 5.939s, 2041 | 4,933,087 | 960,768 |
| IFB Ser. 12-4, Class SY, IO, 5.739s, 2042 | 6,427,420 | 1,110,722 |
| IFB Ser. 11-53, Class SY, IO, 5.739s, 2041 | 20,180,315 | 2,480,976 |
| Ser. 12-132, Class SA, IO, 5s, 2042 ∆ | 13,754,000 | 2,297,606 |
| Ser. 12-118, Class IO, IO, 4s, 2042 | 12,366,582 | 1,904,701 |
| Ser. 12-124, Class UI, IO, 4s, 2042 ∆ | 25,247,500 | 4,531,926 |
| Ser. 12-118, Class PI, IO, 4s, 2042 | 8,580,000 | 1,473,358 |
| Ser. 12-96, Class PI, IO, 4s, 2041 | 12,477,726 | 1,812,889 |
| Ser. 03-W10, Class 1, IO, 1.4s, 2043 | 10,759,108 | 481,218 |
| | |
| MORTGAGE-BACKED SECURITIES (39.2%)* cont. | Principal amount | Value |
|
| Agency collateralized mortgage obligations cont. | | |
| Federal National Mortgage Association | | |
| Ser. 01-50, Class B1, IO, 0.41s, 2041 | $993,509 | $6,209 |
| Ser. 2002-W6, Class 1AIO, 0.263s, 2042 | 1,204,755 | 3,577 |
| Ser. 2005-W4, Class 1AIO, 0.11s, 2035 | 271,958 | 722 |
| Ser. 03-34, Class P1, PO, zero %, 2043 | 264,141 | 235,511 |
| Ser. 07-64, Class LO, PO, zero %, 2037 | 241,838 | 225,528 |
| Ser. 07-14, Class KO, PO, zero %, 2037 | 575,056 | 534,543 |
| Ser. 06-125, Class OX, PO, zero %, 2037 | 91,077 | 87,246 |
| Ser. 06-84, Class OT, PO, zero %, 2036 | 69,423 | 65,845 |
| Ser. 06-46, Class OC, PO, zero %, 2036 | 65,980 | 61,622 |
|
| Government National Mortgage Association | | |
| IFB Ser. 11-56, Class SA, 23.611s, 2041 | 12,596,452 | 20,091,718 |
| IFB Ser. 10-158, Class SD, 14.368s, 2040 | 2,780,250 | 4,012,090 |
| IFB Ser. 11-70, Class WS, 9.279s, 2040 | 11,858,000 | 14,184,302 |
| IFB Ser. 11-72, Class SE, 7.12s, 2041 F | 9,422,000 | 10,442,829 |
| IFB Ser. 11-56, Class MS, 6.863s, 2041 | 6,198,651 | 6,891,598 |
| IFB Ser. 11-61, Class CS, IO, 6.469s, 2035 | 23,489,038 | 3,259,128 |
| IFB Ser. 11-70, Class SM, IO, 5.676s, 2041 | 5,789,000 | 1,458,481 |
| Ser. 10-35, Class QI, IO, 4 1/2s, 2040 | 12,782,239 | 2,057,142 |
| Ser. 11-116, Class IA, IO, 4 1/2s, 2039 | 11,405,725 | 1,202,277 |
| Ser. 11-116, Class BI, IO, 4s, 2026 | 9,305,445 | 959,857 |
| IFB Ser. 11-70, Class YI, IO, 0.15s, 2040 | 15,722,313 | 84,586 |
| Ser. 11-70, PO, zero %, 2041 | 37,727,101 | 31,346,316 |
| Ser. 10-151, Class KO, PO, zero %, 2037 | 1,187,507 | 1,087,389 |
| Ser. 06-36, Class OD, PO, zero %, 2036 | 72,651 | 68,044 |
| Ser. 99-31, Class MP, PO, zero %, 2029 | 34,045 | 32,213 |
|
| Structured Asset Securities Corp. IFB Ser. 07-4, Class 1A3, | | |
| IO, 6.038s, 2045 | 30,481,136 | 5,791,416 |
|
| Structured Asset Securities Corp. 144A Ser. 98-RF3, | | |
| Class A, IO, 6.1s, 2028 | 749,424 | 116,161 |
|
| | | 212,850,949 |
| Commercial mortgage-backed securities (12.1%) | | |
| Banc of America Commercial Mortgage, Inc. | | |
| Ser. 04-4, Class D, 5.073s, 2042 | 2,385,000 | 2,368,603 |
| Ser. 07-1, Class XW, IO, 0.306s, 2049 | 10,489,744 | 96,275 |
|
| Banc of America Commercial Mortgage, Inc. 144A | | |
| FRB Ser. 05-2, Class E, 5.323s, 2043 | 1,590,000 | 1,625,775 |
| Ser. 04-2, Class F, 4.992s, 2038 | 1,350,000 | 1,360,800 |
| Ser. 04-4, Class XC, IO, 0.861s, 2042 | 19,800,034 | 203,366 |
| Ser. 04-5, Class XC, IO, 0.706s, 2041 | 32,726,591 | 402,373 |
| Ser. 02-PB2, Class XC, IO, 0.457s, 2035 | 9,480,158 | 891 |
| Ser. 07-5, Class XW, IO, 0.392s, 2051 | 21,161,218 | 268,049 |
| Ser. 05-1, Class XW, IO, 0.059s, 2042 | 295,342,189 | 101,302 |
|
| Bear Stearns Commercial Mortgage Securities, Inc. | | |
| FRB Ser. 07-T28, Class AJ, 5.971s, 2042 | 1,708,000 | 1,692,765 |
| FRB Ser. 05-T20, Class C, 5.15s, 2042 | 1,900,000 | 1,835,854 |
| Ser. 04-PWR3, Class D, 4.889s, 2041 | 1,989,000 | 2,019,034 |
| Ser. 04-PR3I, Class X1, IO, 0.968s, 2041 | 8,029,954 | 93,750 |
|
| Bear Stearns Commercial Mortgage Securities, Inc. 144A | | |
| Ser. 06-PW14, Class X1, IO, 0.166s, 2038 | 17,354,949 | 305,447 |
|
| | |
| MORTGAGE-BACKED SECURITIES (39.2%)* cont. | Principal amount | Value |
|
| Commercial mortgage-backed securities cont. | | |
| CFCRE Commercial Mortgage Trust 144A Ser. 11-C1, Class XA, | | |
| IO, 1.477s, 2044 | $28,997,796 | $1,716,670 |
|
| Citigroup Commercial Mortgage Trust FRB Ser. 05-C3, | | |
| Class AJ, 4.96s, 2043 | 2,050,000 | 2,161,500 |
|
| Citigroup Commercial Mortgage Trust 144A Ser. 06-C5, | | |
| Class XC, IO, 0.117s, 2049 | 78,310,174 | 1,090,078 |
|
| Citigroup/Deutsche Bank Commercial Mortgage Trust 144A | | |
| Ser. 07-CD4, Class XW, IO, 0.382s, 2049 | 49,325,522 | 640,245 |
| Ser. 07-CD4, Class XC, IO, 0.146s, 2049 | 156,412,853 | 1,435,870 |
|
| Commercial Mortgage Pass-Through Certificates | | |
| FRB Ser. 06-C7, Class AM, 5.773s, 2046 | 4,560,000 | 4,947,965 |
| Ser. 05-C6, Class AJ, 5.209s, 2044 F | 4,413,000 | 4,486,355 |
|
| Commercial Mortgage Pass-Through Certificates 144A | | |
| Ser. 05-LP5, Class XC, IO, 0.317s, 2043 | 25,782,679 | 220,029 |
| Ser. 06-C8, Class XS, IO, 0.16s, 2046 | 58,374,571 | 749,458 |
|
| Credit Suisse Mortgage Capital Certificates | | |
| FRB Ser. 07-C4, Class A2, 5.762s, 2039 | 4,030,946 | 4,043,990 |
| Ser. 06-C5, Class AX, IO, 0.15s, 2039 | 29,693,744 | 409,774 |
|
| Credit Suisse Mortgage Capital Certificates 144A | | |
| Ser. 07-C2, Class AX, IO, 0.071s, 2049 | 86,317,269 | 320,323 |
|
| CS First Boston Mortgage Securities Corp. | | |
| FRB Ser. 04-C2, Class D, 5.575s, 2036 | 1,733,000 | 1,828,857 |
| FRB Ser. 05-C4, Class B, 5.29s, 2038 | 5,760,000 | 5,626,368 |
| Ser. 05-C6, Class AJ, 5.23s, 2040 | 2,984,000 | 3,172,887 |
| Ser. 05-C5, Class AJ, 5.1s, 2038 | 1,650,000 | 1,744,380 |
| FRB Ser. 04-C5, Class B, 4.929s, 2037 | 2,840,000 | 2,911,000 |
| Ser. 03-CPN1, Class E, 4.891s, 2035 | 1,528,000 | 1,526,732 |
| Ser. 04-C4, Class AJ, 4.772s, 2039 | 4,030,000 | 4,229,288 |
|
| CS First Boston Mortgage Securities Corp. 144A | | |
| Ser. 98-C1, Class F, 6s, 2040 | 2,450,312 | 2,658,589 |
| FRB Ser. 03-CK2, Class G, 5.744s, 2036 | 2,984,000 | 2,987,374 |
| Ser. 03-C3, Class AX, IO, 1.717s, 2038 | 52,667,498 | 143,993 |
| Ser. 02-CP3, Class AX, IO, 1.092s, 2035 | 4,637,655 | 12,842 |
|
| DLJ Commercial Mortgage Corp. 144A FRB Ser. 98-CG1, | | |
| Class B4, 7.204s, 2031 | 3,188,000 | 3,254,025 |
|
| First Union National Bank-Bank of America Commercial | | |
| Mortgage Trust 144A Ser. 01-C1, Class 3, IO, 1.552s, 2033 | 1,787,888 | 18 |
|
| G-Star, Ltd. 144A FRB Ser. 02-2A, Class BFL, 2.211s, 2037 | | |
| (Cayman Islands) | 417,000 | 375,300 |
|
| GE Business Loan Trust 144A Ser. 04-2, Class D, 2.964s, 2032 | 252,769 | 146,606 |
|
| GE Capital Commercial Mortgage Corp. FRB Ser. 05-C4, | | |
| Class AJ, 5.307s, 2045 | 1,387,000 | 1,151,210 |
|
| GE Capital Commercial Mortgage Corp. 144A | | |
| Ser. 05-C3, Class XC, IO, 0.14s, 2045 | 307,747,950 | 1,424,605 |
| Ser. 07-C1, Class XC, IO, 0.099s, 2049 | 127,913,840 | 953,726 |
|
| GMAC Commercial Mortgage Securities, Inc. | | |
| Ser. 97-C1, Class X, IO, 1.234s, 2029 | 2,690,351 | 106,554 |
| Ser. 05-C1, Class X1, IO, 0.592s, 2043 | 33,468,108 | 428,291 |
|
| Greenwich Capital Commercial Funding Corp. 144A Ser. 03-C1, | | |
| Class G, 4.773s, 2035 | 1,618,000 | 1,602,292 |
|
| | |
| MORTGAGE-BACKED SECURITIES (39.2%)* cont. | Principal amount | Value |
|
| Commercial mortgage-backed securities cont. | | |
| GS Mortgage Securities Corp. II | | |
| Ser. 06-GG8, Class AJ, 5.622s, 2039 | $1,924,000 | $1,703,960 |
| Ser. 06-GG6, Class A2, 5.506s, 2038 | 344,109 | 344,109 |
|
| GS Mortgage Securities Corp. II 144A | | |
| Ser. 98-C1, Class F, 6s, 2030 | 520,322 | 536,030 |
| Ser. 06-GG6, Class XC, IO, 0.087s, 2038 | 98,166,062 | 165,017 |
|
| JPMorgan Chase Commercial Mortgage Securities Corp. | | |
| FRB Ser. 07-LD12, Class A3, 5.971s, 2051 | 19,773,000 | 21,084,444 |
| Ser. 07-LD12, Class A2, 5.827s, 2051 | 1,900,990 | 1,939,010 |
| FRB Ser. 04-CB9, Class B, 5.665s, 2041 | 2,082,000 | 2,132,384 |
| Ser. 02-C3, Class D, 5.314s, 2035 | 1,521,000 | 1,521,000 |
| FRB Ser. 02-C2, Class E, 5.256s, 2034 | 1,540,000 | 1,540,000 |
| FRB Ser. 04-CBX, Class B, 5.021s, 2037 | 1,143,000 | 1,126,826 |
| Ser. 06-LDP8, Class X, IO, 0.542s, 2045 | 59,925,774 | 987,397 |
| Ser. 07-LDPX, Class X, IO, 0.311s, 2049 | 79,254,372 | 869,817 |
|
| JPMorgan Chase Commercial Mortgage | | |
| Securities Corp. 144A | | |
| FRB Ser. 01-C1, Class H, 5.626s, 2035 | 1,456,198 | 1,475,711 |
| Ser. 05-CB12, Class X1, IO, 0.337s, 2037 | 27,575,427 | 231,909 |
| Ser. 06-LDP6, Class X1, IO, 0.054s, 2043 | 52,666,223 | 182,120 |
|
| LB Commercial Conduit Mortgage Trust 144A | | |
| Ser. 99-C1, Class F, 6.41s, 2031 | 556,463 | 570,375 |
| Ser. 99-C1, Class G, 6.41s, 2031 | 851,777 | 856,036 |
| Ser. 98-C4, Class G, 5.6s, 2035 F | 417,870 | 427,151 |
| Ser. 98-C4, Class H, 5.6s, 2035 | 808,000 | 880,320 |
|
| LB-UBS Commercial Mortgage Trust | | |
| FRB Ser. 08-C1, Class AM, 6.157s, 2041 | 1,623,000 | 1,848,110 |
| Ser. 06-C7, Class A2, 5.3s, 2038 | 2,253,256 | 2,253,256 |
| Ser. 07-C2, Class XW, IO, 0.499s, 2040 | 8,204,233 | 153,222 |
|
| LB-UBS Commercial Mortgage Trust 144A | | |
| FRB Ser. 02-C7, Class H, 5.747s, 2036 | 4,110,000 | 4,128,244 |
| FRB Ser. 04-C1, Class G, 5.077s, 2036 | 7,400,000 | 6,431,725 |
| Ser. 06-C7, Class XW, IO, 0.657s, 2038 | 41,196,186 | 878,715 |
| Ser. 05-C5, Class XCL, IO, 0.465s, 2040 | 88,971,202 | 1,228,247 |
| Ser. 05-C2, Class XCL, IO, 0.353s, 2040 | 142,065,927 | 998,297 |
| Ser. 06-C7, Class XCL, IO, 0.267s, 2038 | 68,838,833 | 959,820 |
| Ser. 07-C2, Class XCL, IO, 0.139s, 2040 | 181,727,114 | 2,556,901 |
| Ser. 05-C7, Class XCL, IO, 0.103s, 2040 | 120,650,106 | 714,007 |
|
| Merrill Lynch Mortgage Investors, Inc. Ser. 96-C2, | | |
| Class JS, IO, 2.406s, 2028 F | 43,271 | 54 |
|
| Merrill Lynch Mortgage Trust | | |
| FRB Ser. 07-C1, Class A3, 5.847s, 2050 | 475,000 | 509,011 |
| FRB Ser. 08-C1, Class AJ, 5.805s, 2051 F | 1,828,000 | 1,763,417 |
| Ser. 03-KEY1, Class C, 5.373s, 2035 | 3,163,000 | 3,216,138 |
| Ser. 05-CKI1, Class AJ, 5.261s, 2037 | 1,632,000 | 1,663,661 |
|
| Merrill Lynch Mortgage Trust 144A | | |
| Ser. 04-KEY2, Class XC, IO, 0.855s, 2039 | 15,288,751 | 176,784 |
| Ser. 05-MCP1, Class XC, IO, 0.198s, 2043 | 38,085,568 | 444,535 |
|
| Merrill Lynch/Countrywide Commercial Mortgage Trust FRB | | |
| Ser. 06-4, Class A2FL, 0.334s, 2049 | 965,479 | 959,445 |
|
| | |
| MORTGAGE-BACKED SECURITIES (39.2%)* cont. | Principal amount | Value |
|
| Commercial mortgage-backed securities cont. | | |
| Mezz Cap Commercial Mortgage Trust 144A | | |
| Ser. 04-C1, Class X, IO, 9.144s, 2037 F | $1,966,742 | $88,509 |
| Ser. 06-C4, Class X, IO, 5.998s, 2045 | 5,840,451 | 582,293 |
| Ser. 05-C3, Class X, IO, 5.806s, 2044 | 1,831,911 | 133,913 |
|
| Morgan Stanley Capital I | | |
| Ser. 06-HQ9, Class B, 5.832s, 2044 | 6,140,000 | 6,295,115 |
| FRB Ser. 06-T23, Class A2, 5 3/4s, 2041 | 669,468 | 676,417 |
| Ser. 07-IQ14, Class A2, 5.61s, 2049 | 1,401,343 | 1,448,515 |
| FRB Ser. 07-HQ12, Class A2, 5.576s, 2049 | 1,283,061 | 1,317,704 |
| 06-HQ10 Ser. 06-HQ10, Class AJ, 5.389s, 2041 | 1,943,000 | 1,680,695 |
|
| Morgan Stanley Capital I 144A Ser. 03-IQ6, Class C, | | |
| 5.126s, 2041 | 2,350,000 | 2,403,345 |
|
| Morgan Stanley ReREMIC Trust 144A FRB Ser. 10-C30A, | | |
| Class A3B, 5.843s, 2043 | 430,286 | 444,270 |
|
| Nomura Asset Securities Corp. 144A Ser. 98-D6, Class B1, | | |
| 6s, 2030 | 2,002,000 | 2,132,130 |
|
| TIAA Real Estate CDO, Ltd. Ser. 03-1A, Class E, 8s, 2038 | 1,607,898 | 160,790 |
|
| TIAA Seasoned Commercial Mortgage Trust FRB Ser. 07-C4, | | |
| Class AJ, 5.585s, 2039 | 3,105,000 | 3,357,126 |
|
| Wachovia Bank Commercial Mortgage Trust | | |
| Ser. 05-C17, Class D, 5.396s, 2042 | 6,740,000 | 6,471,074 |
| Ser. 06-C29, IO, 0.387s, 2048 | 192,802,855 | 2,759,009 |
| Ser. 07-C34, IO, 0.347s, 2046 | 16,806,172 | 203,355 |
|
| Wachovia Bank Commercial Mortgage Trust 144A | | |
| FRB Ser. 03-C8, Class F, 5.206s, 2035 | 2,569,000 | 2,632,711 |
| Ser. 05-C18, Class XC, IO, 0.335s, 2042 | 23,507,956 | 164,556 |
| Ser. 06-C26, Class XC, IO, 0.042s, 2045 | 11,139,704 | 24,842 |
|
| WAMU Commercial Mortgage Securities Trust 144A Ser. 05-C1A, | | |
| Class G, 5.72s, 2036 | 129,000 | 112,391 |
|
| | | 173,427,443 |
| Residential mortgage-backed securities (non-agency) (12.3%) | | |
| ASG Resecuritization Trust 144A | | |
| FRB Ser. 09-2, Class G65, 5.13s, 2036 | 1,700,000 | 1,692,168 |
| FRB Ser. 10-3, 0.507s, 2045 | 6,630,000 | 3,845,400 |
|
| Citigroup Mortgage Loan Trust, Inc. Ser. 2005-WF2, | | |
| Class AF4, 4.964s, 2035 | 2,364,007 | 2,328,547 |
|
| Citigroup Mortgage Loan Trust, Inc. 144A FRB Ser. 09-7, | | |
| Class 4A2, 2.614s, 2035 | 4,500,000 | 3,555,000 |
|
| Countrywide Alternative Loan Trust FRB Ser. 05-16, | | |
| Class A4, 0.451s, 2035 | 3,020,231 | 2,295,376 |
|
| Countrywide Asset Backed Certificates | | |
| FRB Ser. 05-AB1, Class A3, 0.511s, 2035 | 13,089,318 | 11,453,153 |
| FRB Ser. 07-11, Class 2A2, 0.331s, 2047 | 6,831,758 | 6,695,122 |
|
| First Plus Home Loan Trust Ser. 97-3, Class B1, 7.79s, | | |
| 2023 (In default) † | 134,710 | 13 |
|
| GSAA Home Equity Trust | | |
| FRB Ser. 04-10, Class AF4, 4.819s, 2034 | 3,733,125 | 3,924,448 |
| FRB Ser. 05-8, Class A3, 0.641s, 2035 | 12,629,389 | 10,166,658 |
| FRB Ser. 05-9, Class 2A3, 0.581s, 2035 | 7,919,102 | 6,889,619 |
| FRB Ser. 05-6, Class A3, 0.581s, 2035 | 17,694,335 | 14,951,713 |
|
| | |
| MORTGAGE-BACKED SECURITIES (39.2%)* cont. | Principal amount | Value |
|
| Residential mortgage-backed securities (non-agency) cont. | | |
| MASTR Adjustable Rate Mortgage Trust FRB Ser. 04-13, | | |
| Class 3A7, 2.627s, 2034 | $4,100,000 | $4,192,250 |
|
| Opteum Mortgage Acceptance Corp. FRB Ser. 05-3, Class A2, | | |
| 0.551s, 2035 | 5,659,557 | 4,867,219 |
|
| Structured Asset Mortgage Investments, Inc. Ser. 07-AR4, | | |
| Class X2, IO, 0 1/2s, 2047 | 130,690,633 | 2,901,332 |
|
| WAMU Mortgage Pass-Through Certificates | | |
| FRB Ser. 2004-AR13, Class A1B2, 0.74s, 2034 | 13,678,784 | 11,626,966 |
| FRB Ser. 05-AR11, Class A1C3, 0.721s, 2045 | 5,421,173 | 3,794,821 |
| FRB Ser. 05-AR19, Class A1C3, 0.711s, 2045 | 13,688,036 | 9,444,745 |
| FRB Ser. 05-AR11, Class A1B2, 0.661s, 2045 | 5,666,532 | 4,844,885 |
| FRB Ser. 05-AR13, Class A1C4, 0.641s, 2045 | 22,715,242 | 15,730,305 |
| FRB Ser. 05-AR8, Class 2AB2, 0.631s, 2045 | 10,808,574 | 9,349,417 |
| FRB Ser. 2005-AR17, Class A1B2, 0.621s, 2045 | 7,545,175 | 5,885,236 |
| FRB Ser. 05-AR11, Class A1B3, 0.611s, 2045 | 7,565,668 | 6,468,646 |
| FRB Ser. 05-AR8, Class 2AC3, 0.601s, 2045 | 5,871,074 | 4,843,636 |
| FRB Ser. 05-AR2, Class 2A23, 0.591s, 2045 | 12,112,279 | 10,961,613 |
| FRB Ser. 05-AR6, Class 2AB2, 0.581s, 2045 | 9,510,073 | 8,178,663 |
| FRB Ser. 2005-AR17, Class A1B3, 0.561s, 2045 | 2,244,930 | 1,773,494 |
| FRB Ser. 05-AR2, Class 2A21, 0.541s, 2045 | 2,855,489 | 2,584,218 |
|
| Wells Fargo Mortgage Backed Securities Trust FRB Ser. 04-H, | | |
| Class A1, 2.615s, 2034 | 1,756,171 | 1,791,294 |
|
| | | 177,035,957 |
| | | |
| Total mortgage-backed securities (cost $500,131,292) | | $563,314,349 |
| |
| |
| CORPORATE BONDS AND NOTES (26.8%)* | Principal amount | Value |
|
| Basic materials (2.1%) | | |
| Airgas, Inc. sr. unsec. unsub. notes 3 1/4s, 2015 | $485,000 | $515,740 |
|
| Allegheny Technologies, Inc. sr. unsec. | | |
| unsub. notes 9 3/8s, 2019 | 835,000 | 1,067,838 |
|
| Celanese US Holdings, LLC sr. notes 5 7/8s, 2021 (Germany) | 835,000 | 929,981 |
|
| CF Industries, Inc. company guaranty sr. unsec. | | |
| unsub. notes 7 1/8s, 2020 | 415,000 | 525,997 |
|
| Domtar Corp. company guaranty sr. unsec. | | |
| unsub. notes 6 1/4s, 2042 (Canada) | 645,000 | 697,074 |
|
| Eastman Chemical Co. sr. unsec. notes 4.8s, 2042 | 1,745,000 | 1,894,163 |
|
| Eastman Chemical Co. sr. unsec. notes 3.6s, 2022 | 1,245,000 | 1,317,445 |
|
| Eastman Chemical Co. sr. unsec. unsub. notes 6.3s, 2018 | 300,000 | 356,857 |
|
| Eastman Chemical Co. sr. unsec. unsub. notes 2.4s, 2017 | 395,000 | 409,851 |
|
| Georgia-Pacific, LLC sr. unsec. unsub. notes 7 3/4s, 2029 | 470,000 | 647,988 |
|
| Georgia-Pacific, LLC 144A company guaranty sr. notes 5.4s, 2020 | 2,120,000 | 2,516,124 |
|
| International Paper Co. sr. unsec. notes 9 3/8s, 2019 | 958,000 | 1,315,160 |
|
| International Paper Co. sr. unsec. notes 8.7s, 2038 | 510,000 | 782,430 |
|
| International Paper Co. sr. unsec. notes 7.95s, 2018 | 1,400,000 | 1,820,543 |
|
| LyondellBasell Industries NV sr. unsec. notes 6s, 2021 | | |
| (Netherlands) | 875,000 | 1,011,719 |
|
| Mosaic Co. (The) sr. unsec. notes 3 3/4s, 2021 | 640,000 | 694,278 |
|
| Packaging Corp. of America sr. unsec. unsub. notes 3.9s, 2022 | 945,000 | 976,025 |
|
| PPG Industries, Inc. sr. unsec. unsub. debs. 7.4s, 2019 | 1,130,000 | 1,400,437 |
|
| | |
| CORPORATE BONDS AND NOTES (26.8%)* cont. | Principal amount | Value |
|
| Basic materials cont. | | |
| Rio Tinto Finance USA, Ltd. company guaranty sr. unsec. | | |
| notes 5.2s, 2040 (Australia) | $2,475,000 | $2,970,567 |
|
| Rock-Tenn Co. 144A sr. unsec. notes 4.9s, 2022 | 407,000 | 442,314 |
|
| Rock-Tenn Co. 144A sr. unsec. notes 4.45s, 2019 | 393,000 | 426,146 |
|
| Rohm & Haas Co. sr. unsec. unsub. notes 7.85s, 2029 | 1,815,000 | 2,482,984 |
|
| Sealed Air Corp. sr. notes 7 7/8s, 2017 | 725,000 | 772,125 |
|
| Sealed Air Corp. 144A notes 5 5/8s, 2013 | 678,000 | 694,950 |
|
| Teck Resources Limited sr. notes 10 3/4s, 2019 (Canada) | 82,000 | 98,740 |
|
| Temple-Inland, Inc. sr. unsec. unsub. notes 6 5/8s, 2018 | 1,080,000 | 1,306,538 |
|
| Union Carbide Corp. sr. unsec. unsub. bonds 7 3/4s, 2096 | 135,000 | 163,726 |
|
| Westvaco Corp. company guaranty sr. unsec. | | |
| unsub. notes 7.95s, 2031 | 465,000 | 616,352 |
|
| Xstrata Finance Canada, Ltd. 144A company | | |
| guaranty sr. unsec. notes 6s, 2041 (Canada) | 590,000 | 644,975 |
|
| Xstrata Finance Canada, Ltd. 144A company | | |
| guaranty sr. unsec. unsub. bonds 5.8s, 2016 (Canada) | 610,000 | 691,300 |
|
| | | 30,190,367 |
| Capital goods (0.5%) | | |
| B/E Aerospace, Inc. sr. unsec. unsub. notes 5 1/4s, 2022 | 1,085,000 | 1,133,825 |
|
| Legrand SA unsec. unsub. debs. 8 1/2s, 2025 (France) | 1,393,000 | 1,815,716 |
|
| Parker Hannifin Corp. sr. unsec. unsub. notes Ser. MTN, | | |
| 6 1/4s, 2038 | 435,000 | 605,142 |
|
| Republic Services, Inc. company guaranty sr. unsec. | | |
| notes 5.7s, 2041 | 595,000 | 738,347 |
|
| Republic Services, Inc. company guaranty sr. unsec. | | |
| notes 3.8s, 2018 | 720,000 | 799,467 |
|
| Republic Services, Inc. company guaranty sr. unsec. | | |
| unsub. notes 5 1/2s, 2019 | 660,000 | 782,459 |
|
| United Technologies Corp. sr. unsec. notes 5.7s, 2040 | 100,000 | 134,568 |
|
| United Technologies Corp. sr. unsec. unsub. notes 4 1/2s, 2042 | 905,000 | 1,040,902 |
|
| United Technologies Corp. sr. unsec. unsub. notes 3.1s, 2022 | 560,000 | 602,982 |
|
| | | 7,653,408 |
| Communication services (2.8%) | | |
| America Movil SAB de CV company guaranty sr. unsec. | | |
| unsub. notes 6 1/8s, 2040 (Mexico) | 880,000 | 1,162,168 |
|
| America Movil SAB de CV company guaranty unsec. | | |
| unsub. notes 2 3/8s, 2016 (Mexico) | 670,000 | 696,199 |
|
| American Tower Corp. sr. unsec. notes 7s, 2017 R | 1,210,000 | 1,453,948 |
|
| AT&T, Inc. sr. unsec. unsub. bonds 5 1/2s, 2018 | 1,160,000 | 1,409,553 |
|
| AT&T, Inc. sr. unsec. unsub. notes 6.3s, 2038 | 1,535,000 | 2,055,215 |
|
| Bellsouth Capital Funding unsec. notes 7 7/8s, 2030 | 1,570,000 | 2,140,554 |
|
| CenturyLink, Inc. sr. unsec. debs. Ser. G, 6 7/8s, 2028 | 2,025,000 | 2,130,642 |
|
| CenturyLink, Inc. sr. unsec. unsub. notes Ser. P, 7.6s, 2039 | 855,000 | 876,326 |
|
| Comcast Corp. company guaranty sr. unsec. | | |
| unsub. notes 6.95s, 2037 | 700,000 | 972,411 |
|
| Corning, Inc. sr. unsec. unsub. notes 5 3/4s, 2040 | 265,000 | 327,229 |
|
| Crown Castle Towers, LLC 144A company | | |
| guaranty sr. notes 4.883s, 2020 | 1,915,000 | 2,188,315 |
|
| DISH DBS Corp. company guaranty sr. unsec. notes 6 3/4s, 2021 | 1,635,000 | 1,820,981 |
|
| | |
| CORPORATE BONDS AND NOTES (26.8%)* cont. | Principal amount | Value |
|
| Communication services cont. | | |
| France Telecom sr. unsec. unsub. notes 5 3/8s, 2019 (France) | $880,000 | $1,055,808 |
|
| France Telecom sr. unsec. unsub. notes 4 1/8s, 2021 (France) | 886,000 | 989,593 |
|
| Frontier Communications Corp. sr. unsec. notes 8 1/2s, 2020 | 800,000 | 924,000 |
|
| NBCUniversal Media, LLC sr. unsec. unsub. notes 6.4s, 2040 | 845,000 | 1,107,421 |
|
| Qwest Corp. notes 6 3/4s, 2021 | 1,767,000 | 2,091,381 |
|
| Rogers Communications, Inc. company guaranty notes 6.8s, | | |
| 2018 (Canada) | 610,000 | 772,055 |
|
| SBA Tower Trust 144A company guaranty sr. notes 5.101s, 2017 | 2,425,000 | 2,724,462 |
|
| SBA Tower Trust 144A notes 2.933s, 2017 | 280,000 | 287,746 |
|
| TCI Communications, Inc. company guaranty sr. unsec. | | |
| unsub. debs. 7 7/8s, 2026 | 2,435,000 | 3,520,708 |
|
| Telecom Italia Capital SA company guaranty sr. unsec. | | |
| unsub. notes 6.175s, 2014 (Italy) | 955,000 | 1,012,917 |
|
| Telefonica Emisiones SAU company guaranty sr. unsec. | | |
| notes 5.462s, 2021 (Spain) | 1,500,000 | 1,524,375 |
|
| Telefonica Emisiones SAU company guaranty sr. unsec. | | |
| unsub. notes 6.221s, 2017 (Spain) | 345,000 | 372,600 |
|
| Time Warner Cable, Inc. company guaranty sr. notes 7.3s, 2038 | 1,165,000 | 1,616,574 |
|
| Time Warner Cable, Inc. company guaranty sr. unsec. 6 3/4s, 2018 | 355,000 | 449,088 |
|
| Time Warner Cable, Inc. company guaranty sr. unsec. | | |
| unsub. notes 6 3/4s, 2039 | 350,000 | 467,168 |
|
| Time Warner Cable, Inc. company guaranty sr. unsec. | | |
| unsub. notes 5 1/2s, 2041 | 85,000 | 98,847 |
|
| Time Warner Cable, Inc. company guaranty sr. unsec. | | |
| unsub. notes 4 1/2s, 2042 | 160,000 | 164,407 |
|
| Verizon Communications, Inc. sr. unsec. notes 7.35s, 2039 | 424,000 | 652,976 |
|
| Verizon Communications, Inc. sr. unsec. | | |
| unsub. notes 8 3/4s, 2018 | 856,000 | 1,198,272 |
|
| Verizon New Jersey, Inc. debs. 8s, 2022 | 640,000 | 873,394 |
|
| Verizon Pennsylvania, Inc. debs. 8.35s, 2030 | 795,000 | 1,099,915 |
|
| Verizon Virginia, Inc. debs. Ser. A, 4 5/8s, 2013 | 219,000 | 222,297 |
|
| | | 40,459,545 |
| Consumer cyclicals (2.5%) | | |
| ADT Corp. (The) 144A company guaranty sr. unsec. | | |
| notes 4 7/8s, 2042 | 930,000 | 1,000,053 |
|
| ADT Corp. (The) 144A company guaranty sr. unsec. | | |
| notes 3 1/2s, 2022 | 1,300,000 | 1,352,529 |
|
| Advance Auto Parts, Inc. company guaranty sr. unsec. | | |
| notes 5 3/4s, 2020 | 1,095,000 | 1,270,460 |
|
| Autonation, Inc. company guaranty sr. unsec. notes 6 3/4s, 2018 | 645,000 | 724,013 |
|
| CBS Corp. company guaranty sr. unsec. debs. notes 7 7/8s, 2030 | 2,400,000 | 3,369,758 |
|
| Choice Hotels International, Inc. company | | |
| guaranty sr. unsec. unsub. notes 5.7s, 2020 | 1,195,000 | 1,292,094 |
|
| DIRECTV Holdings, LLC/DIRECTV Financing Co., Inc. company | | |
| guaranty sr. unsec. notes 6.35s, 2040 | 805,000 | 964,102 |
|
| DIRECTV Holdings, LLC/DIRECTV Financing Co., Inc. company | | |
| guaranty sr. unsec. unsub. notes 5 7/8s, 2019 | 1,670,000 | 1,997,773 |
|
| Expedia, Inc. company guaranty sr. unsec. | | |
| unsub. notes 5.95s, 2020 | 950,000 | 1,048,924 |
|
| Ford Motor Co. sr. unsec. unsub. notes 7.4s, 2046 | 350,000 | 424,375 |
|
| | |
| CORPORATE BONDS AND NOTES (26.8%)* cont. | Principal amount | Value |
|
| Consumer cyclicals cont. | | |
| Ford Motor Credit Co., LLC sr. unsec. notes 5s, 2018 | $950,000 | $1,047,892 |
|
| Ford Motor Credit Co., LLC sr. unsec. notes 4.207s, 2016 | 2,760,000 | 2,939,441 |
|
| Ford Motor Credit Co., LLC sr. unsec. unsub. notes 5 3/4s, 2021 | 740,000 | 845,465 |
|
| Limited Brands, Inc. company guaranty sr. unsec. | | |
| notes 6 5/8s, 2021 | 840,000 | 963,900 |
|
| Limited Brands, Inc. sr. notes 5 5/8s, 2022 | 820,000 | 885,600 |
|
| Macy’s Retail Holdings, Inc. company guaranty sr. unsec. | | |
| notes 5 1/8s, 2042 | 240,000 | 271,141 |
|
| Macy’s Retail Holdings, Inc. company guaranty sr. unsec. | | |
| notes 3 7/8s, 2022 | 360,000 | 395,280 |
|
| Marriott International, Inc. sr. unsec. unsub notes 3s, 2019 | 780,000 | 798,717 |
|
| News America Holdings, Inc. company guaranty sr. unsec. | | |
| debs. 7 3/4s, 2024 | 870,000 | 1,113,478 |
|
| News America Holdings, Inc. debs. 7 3/4s, 2045 | 790,000 | 1,125,481 |
|
| NVR, Inc. sr. unsec. unsub. notes 3.95s, 2022 | 740,000 | 764,058 |
|
| Owens Corning company guaranty sr. unsec. notes 9s, 2019 | 672,000 | 856,800 |
|
| QVC, Inc. 144A sr. notes 7 1/8s, 2017 | 535,000 | 565,042 |
|
| Time Warner Entertainment Co., LP debs. 8 3/8s, 2023 | 1,450,000 | 2,066,650 |
|
| Time Warner, Inc. company guaranty sr. unsec. bonds 7.7s, 2032 | 1,850,000 | 2,710,953 |
|
| Time Warner, Inc. company guaranty sr. unsec. notes 4.7s, 2021 | 365,000 | 423,692 |
|
| Time Warner, Inc. debs. 9.15s, 2023 | 675,000 | 964,922 |
|
| Toyota Motor Credit Corp. sr. unsec. unsub. notes 3.3s, 2022 | 2,075,000 | 2,248,446 |
|
| Walt Disney Co. (The) sr. unsec. notes 2 3/4s, 2021 | 1,305,000 | 1,380,655 |
|
| Walt Disney Co. (The) sr. unsec. unsub. notes 4 3/8s, 2041 | 520,000 | 608,698 |
|
| | | 36,420,392 |
| Consumer staples (2.6%) | | |
| Altria Group, Inc. company guaranty sr. unsec. notes 9.7s, 2018 | 308,000 | 439,275 |
|
| Altria Group, Inc. company guaranty sr. unsec. | | |
| notes 9 1/4s, 2019 | 586,000 | 826,943 |
|
| Altria Group, Inc. company guaranty sr. unsec. | | |
| unsub. notes 2.85s, 2022 | 2,595,000 | 2,598,069 |
|
| Anheuser-Busch InBev Worldwide, Inc. company | | |
| guaranty sr. unsec. unsub. notes 8.2s, 2039 | 1,313,000 | 2,207,936 |
|
| Bacardi, Ltd. 144A unsec. notes 4 1/2s, 2021 (Bermuda) | 1,430,000 | 1,602,848 |
|
| Campbell Soup Co. debs. 8 7/8s, 2021 | 715,000 | 1,045,495 |
|
| Corrections Corporation of America company | | |
| guaranty sr. notes 7 3/4s, 2017 | 466,000 | 496,873 |
|
| CVS Caremark Corp. sr. unsec. unsub. notes 6.6s, 2019 | 1,310,000 | 1,688,511 |
|
| CVS Pass-Through Trust 144A company | | |
| guaranty sr. notes 7.507s, 2032 | 2,194,319 | 2,929,658 |
|
| Darden Restaurants, Inc. sr. unsec. unsub. notes 6.8s, 2037 | 2,270,000 | 2,893,190 |
|
| Delhaize Group company guaranty sr. unsec. notes 5.7s, 2040 | | |
| (Belgium) | 2,250,000 | 2,120,150 |
|
| Delhaize Group company guaranty sr. unsec. notes 4 1/8s, | | |
| 2019 (Belgium) | 865,000 | 880,094 |
|
| Diageo Investment Corp. company guaranty sr. unsec. | | |
| debs. 8s, 2022 | 675,000 | 972,984 |
|
| Diageo Investment Corp. company guaranty sr. unsec. | | |
| unsub. notes 4 1/4s, 2042 | 1,700,000 | 1,875,511 |
|
| | |
| CORPORATE BONDS AND NOTES (26.8%)* cont. | Principal amount | Value |
|
| Consumer staples cont. | | |
| General Mills, Inc. sr. unsec. notes 5.65s, 2019 | $190,000 | $233,540 |
|
| Kraft Foods Group, Inc. 144A company guaranty sr. unsec. | | |
| unsub. notes 6 1/2s, 2040 | 3,905,000 | 5,445,233 |
|
| Kraft Foods Group, Inc. 144A company guaranty sr. unsec. | | |
| unsub. notes 5s, 2042 | 420,000 | 490,506 |
|
| Kroger Co. company guaranty sr. unsec. unsub. notes 6.4s, 2017 | 605,000 | 735,091 |
|
| Kroger Co. sr. notes 6.15s, 2020 | 200,000 | 246,515 |
|
| McDonald’s Corp. sr. unsec. Ser. MTN, 6.3s, 2038 | 680,000 | 983,802 |
|
| McDonald’s Corp. sr. unsec. bonds 6.3s, 2037 | 530,000 | 763,499 |
|
| McDonald’s Corp. sr. unsec. notes 5.7s, 2039 | 775,000 | 1,044,293 |
|
| Molson Coors Brewing Co. company guaranty sr. unsec. | | |
| unsub. notes 5s, 2042 | 610,000 | 701,834 |
|
| SABMiller Holdings, Inc. 144A company guaranty sr. unsec. | | |
| notes 4.95s, 2042 | 630,000 | 754,083 |
|
| Tyson Foods, Inc. company guaranty sr. unsec. | | |
| unsub. notes 6.6s, 2016 | 1,540,000 | 1,775,050 |
|
| WPP Finance UK company guaranty sr. unsec. notes 8s, 2014 | | |
| (United Kingdom) | 1,370,000 | 1,529,698 |
|
| | | 37,280,681 |
| Energy (2.0%) | | |
| Access Midstream Partners, LP/ACMP Finance Corp. company | | |
| guaranty sr. unsec. notes 5 7/8s, 2021 | 602,000 | 626,080 |
|
| Anadarko Finance Co. company guaranty sr. unsec. | | |
| unsub. notes Ser. B, 7 1/2s, 2031 | 2,880,000 | 3,932,724 |
|
| BG Energy Capital PLC 144A company guaranty sr. unsec. | | |
| notes 4s, 2021 (United Kingdom) | 200,000 | 224,489 |
|
| BP Capital Markets PLC company guaranty sr. unsec. | | |
| unsub. notes 4.742s, 2021 (United Kingdom) | 1,860,000 | 2,200,750 |
|
| BP Capital Markets PLC company guaranty sr. unsec. | | |
| unsub. notes 4 1/2s, 2020 (United Kingdom) | 620,000 | 728,055 |
|
| Cenovus Energy, Inc. sr. unsec. unsub. notes 4.45s, 2042 | | |
| (Canada) | 985,000 | 1,068,430 |
|
| DCP Midstream, LLC 144A sr. unsec. notes 5.35s, 2020 | 775,000 | 857,456 |
|
| EOG Resources, Inc. sr. unsec. notes 5 5/8s, 2019 | 340,000 | 420,597 |
|
| Kerr-McGee Corp. company guaranty sr. unsec. | | |
| unsub. notes 7 7/8s, 2031 | 885,000 | 1,216,864 |
|
| Marathon Petroleum Corp. sr. unsec. unsub. notes 6 1/2s, 2041 | 525,000 | 679,235 |
|
| Motiva Enterprises, LLC 144A sr. unsec. notes 6.85s, 2040 | 895,000 | 1,252,592 |
|
| Noble Holding International, Ltd. company | | |
| guaranty sr. unsec. notes 6.05s, 2041 | 1,095,000 | 1,365,805 |
|
| Petrohawk Energy Corp. company guaranty sr. unsec. | | |
| notes 7 1/4s, 2018 | 2,910,000 | 3,317,287 |
|
| Pride International, Inc. sr. unsec. notes 7 7/8s, 2040 | 2,160,000 | 3,270,167 |
|
| Ras Laffan Liquefied Natural Gas Co., Ltd. 144A company | | |
| guaranty sr. notes 5 1/2s, 2014 (Qatar) | 1,015,000 | 1,099,753 |
|
| Spectra Energy Capital, LLC company guaranty sr. unsec. | | |
| notes 5.65s, 2020 | 240,000 | 286,994 |
|
| Spectra Energy Capital, LLC company guaranty sr. unsec. | | |
| unsub. notes 6.2s, 2018 | 135,000 | 164,381 |
|
| Spectra Energy Capital, LLC sr. notes 8s, 2019 | 650,000 | 851,051 |
|
| | |
| CORPORATE BONDS AND NOTES (26.8%)* cont. | Principal amount | Value |
|
| Energy cont. | | |
| Statoil ASA company guaranty sr. unsec. notes 5.1s, 2040 | | |
| (Norway) | $1,900,000 | $2,419,762 |
|
| Weatherford Bermuda company guaranty sr. unsec. | | |
| notes 9 5/8s, 2019 | 584,000 | 773,691 |
|
| Weatherford International, Inc. company guaranty sr. unsec. | | |
| unsub. notes 6.8s, 2037 | 205,000 | 238,115 |
|
| Weatherford International, Inc. company guaranty sr. unsec. | | |
| unsub. notes 6.35s, 2017 | 240,000 | 280,398 |
|
| Weatherford International, Ltd. company guaranty 6 1/2s, 2036 | 470,000 | 529,538 |
|
| | | 27,804,214 |
| Financials (9.9%) | | |
| ABN Amro Bank NV 144A sr. unsec. notes 4 1/4s, 2017 | | |
| (Netherlands) | 4,460,000 | 4,834,506 |
|
| Aflac, Inc. sr. unsec. notes 6.9s, 2039 | 1,395,000 | 1,880,089 |
|
| Aflac, Inc. sr. unsec. notes 6.45s, 2040 | 990,000 | 1,269,200 |
|
| American Express Bank FSB sr. unsec. FRN Ser. BKNT, | | |
| 0.514s, 2017 | 1,035,000 | 1,014,502 |
|
| American Express Co. sr. unsec. notes 8 1/8s, 2019 | 1,450,000 | 1,961,699 |
|
| American International Group, Inc. jr. sub. bonds FRB | | |
| 8.175s, 2068 | 1,414,000 | 1,763,965 |
|
| American International Group, Inc. sr. unsec. Ser. MTN, | | |
| 5.85s, 2018 | 2,440,000 | 2,855,479 |
|
| Aon PLC jr. unsec. sub. notes 8.205s, 2027 | 3,255,000 | 4,081,327 |
|
| Associates Corp. of North America sr. unsec. notes 6.95s, 2018 | 1,764,000 | 2,130,995 |
|
| Assurant, Inc. sr. unsec. notes 6 3/4s, 2034 | 1,485,000 | 1,731,049 |
|
| AXA SA 144A jr. unsec. sub. notes FRN 6.463s, 2049 (France) | 1,630,000 | 1,536,275 |
|
| Banco do Brasil SA 144A unsec. sub. notes 5 7/8s, 2022 | | |
| (Brazil) | 1,965,000 | 2,149,173 |
|
| Bank of America Corp. sr. unsec. unsub notes 5 7/8s, 2042 | 840,000 | 1,027,295 |
|
| Bank of America Corp. sub. notes 7 3/4s, 2015 | 1,465,000 | 1,654,057 |
|
| Bank of America NA sub. notes Ser. BKNT, 5.3s, 2017 | 905,000 | 1,016,021 |
|
| Barclays Bank PLC 144A sub. notes 10.179s, 2021 | | |
| (United Kingdom) | 2,881,000 | 3,821,041 |
|
| Barclays Bank PLC 144A unsec. sub. notes 6.05s, 2017 | | |
| (United Kingdom) | 2,815,000 | 3,074,492 |
|
| Bear Stearns Cos., Inc. (The) sr. notes 6.4s, 2017 | 1,020,000 | 1,222,489 |
|
| Bear Stearns Cos., Inc. (The) sr. unsec. notes 7 1/4s, 2018 | 1,685,000 | 2,096,720 |
|
| Capital One Bank USA NA sub. notes 8.8s, 2019 | 1,050,000 | 1,406,545 |
|
| Citigroup, Inc. sr. unsec. notes 6 1/8s, 2018 | 80,000 | 95,592 |
|
| Citigroup, Inc. sr. unsec. sub. FRN 0.678s, 2016 | 1,961,000 | 1,842,538 |
|
| Citigroup, Inc. unsec. sub. notes 6 5/8s, 2032 | 505,000 | 583,655 |
|
| Citigroup, Inc. unsec. sub. notes 6 1/8s, 2036 | 1,615,000 | 1,788,267 |
|
| CNA Financial Corp. sr. unsec. unsub. notes 5 3/4s, 2021 | 580,000 | 683,332 |
|
| Commonwealth Bank of Australia 144A sr. unsec. notes 5s, | | |
| 2019 (Australia) | 510,000 | 591,467 |
|
| Commonwealth Bank of Australia 144A sr. unsec. | | |
| notes 3 3/4s, 2014 (Australia) | 100,000 | 105,490 |
|
| DDR Corp. sr. unsec. unsub. notes 7 7/8s, 2020 R | 910,000 | 1,183,500 |
|
| Duke Realty LP sr. unsec. notes 6 1/2s, 2018 R | 390,000 | 461,671 |
|
| | |
| CORPORATE BONDS AND NOTES (26.8%)* cont. | Principal amount | Value |
|
| Financials cont. | | |
| Duke Realty LP sr. unsec. notes 6 1/4s, 2013 R | $64,000 | $65,840 |
|
| Erac USA Finance, Co. 144A sr. notes 4 1/2s, 2021 | 2,235,000 | 2,458,303 |
|
| FIA Card Services, NA sub. notes Ser. BKNT, 7 1/8s, 2012 | 1,695,000 | 1,698,044 |
|
| GATX Financial Corp. notes 5.8s, 2016 | 455,000 | 507,966 |
|
| General Electric Capital Corp. sr. unsec. 5 5/8s, 2018 | 2,405,000 | 2,856,748 |
|
| General Electric Capital Corp. sr. unsec. FRN Ser. MTN, | | |
| 0.638s, 2016 | 895,000 | 873,205 |
|
| Genworth Financial, Inc. sr. unsec. unsub. notes 7 5/8s, 2021 | 3,230,000 | 3,397,288 |
|
| Goldman Sachs Group, Inc. (The) sr. notes 7 1/2s, 2019 | 940,000 | 1,179,991 |
|
| Goldman Sachs Group, Inc. (The) sr. unsec. 6.15s, 2018 | 595,000 | 696,768 |
|
| Goldman Sachs Group, Inc. (The) sub. notes 6 3/4s, 2037 | 950,000 | 1,043,173 |
|
| Hartford Financial Services Group, Inc. (The) sr. unsec. | | |
| unsub. notes 6 5/8s, 2040 | 3,655,000 | 4,709,705 |
|
| HBOS PLC 144A sr. unsec. sub. notes 6 3/4s, 2018 | | |
| (United Kingdom) | 1,175,000 | 1,245,500 |
|
| HBOS PLC 144A unsec. sub. bonds 6s, 2033 (United Kingdom) | 2,520,000 | 2,211,854 |
|
| Health Care REIT, Inc. sr. unsec. notes 4 1/8s, 2019 R | 825,000 | 893,421 |
|
| Highwood Realty LP sr. unsec. bonds 5.85s, 2017 R | 835,000 | 927,419 |
|
| HSBC Holdings PLC sub. notes 6 1/2s, 2037 (United Kingdom) | 3,945,000 | 4,843,612 |
|
| Icahn Enterprises LP/Icahn Enterprises Finance Corp. | | |
| company guaranty sr. unsec. notes 7 3/4s, 2016 | 670,000 | 700,150 |
|
| ING Bank NV 144A unsec. notes 3 3/4s, 2017 (Netherlands) | 715,000 | 757,107 |
|
| International Lease Finance Corp. sr. unsec. notes 6 1/4s, 2019 | 895,000 | 961,006 |
|
| International Lease Finance Corp. sr. unsec. | | |
| unsub. notes 4 7/8s, 2015 | 1,149,000 | 1,194,960 |
|
| JPMorgan Chase Bank NA sub. notes Ser. BKNT, 6s, 2017 | 404,000 | 477,795 |
|
| JPMorgan Chase Bank NA sub. notes Ser. BKNT, 6s, 2017 | 1,311,000 | 1,537,428 |
|
| Liberty Mutual Group, Inc. 144A notes 6 1/2s, 2035 | 1,715,000 | 1,925,890 |
|
| Lloyds TSB Bank PLC company guaranty sr. unsec. | | |
| sub. notes Ser. MTN, 6 1/2s, 2020 (United Kingdom) | 4,335,000 | 4,722,549 |
|
| Loews Corp. notes 5 1/4s, 2016 | 385,000 | 431,269 |
|
| Macquarie Bank Ltd. 144A unsec. sub. notes 6 5/8s, 2021 | | |
| (Australia) | 2,880,000 | 3,172,320 |
|
| Massachusetts Mutual Life Insurance Co. 144A notes 8 7/8s, 2039 | 2,305,000 | 3,547,704 |
|
| Merrill Lynch & Co., Inc. jr. sub. bonds 7 3/4s, 2038 | 1,535,000 | 2,022,697 |
|
| MetLife Global Funding I 144A sr. unsub. notes 5 1/8s, 2014 | 715,000 | 764,082 |
|
| Metrpolitan Life Insurance Co. 144A unsec. sub. notes 7.8s, 2025 | 3,000,000 | 3,967,158 |
|
| Morgan Stanley sr. unsec. notes Ser. MTN, 5 3/4s, 2016 | 970,000 | 1,080,007 |
|
| MPT Operating Partnership LP/MPT Finance Corp. company | | |
| guaranty sr. unsec. notes 6 7/8s, 2021 R | 1,090,000 | 1,177,200 |
|
| Nationwide Financial Services, Inc. notes 5 5/8s, 2015 | 500,000 | 527,446 |
|
| Nationwide Health Properties, Inc. unsec. notes 6 1/4s, 2013 R | 660,000 | 669,487 |
|
| Nationwide Mutual Insurance Co. 144A notes 9 3/8s, 2039 | 85,000 | 122,429 |
|
| Nordea Bank AB 144A sub. notes 4 7/8s, 2021 (Sweden) | 5,160,000 | 5,459,796 |
|
| OneAmerica Financial Partners, Inc. 144A bonds 7s, 2033 | 1,010,000 | 1,050,295 |
|
| Pacific LifeCorp 144A sr. notes 6s, 2020 | 1,575,000 | 1,752,271 |
|
| Primerica, Inc. sr. unsec. unsub. notes 4 3/4s, 2022 | 357,000 | 393,842 |
|
| | |
| CORPORATE BONDS AND NOTES (26.8%)* cont. | Principal amount | Value |
|
| Financials cont. | | |
| Prudential Covered Trust 2012-1 144A company guaranty mtge. | | |
| notes 2.997s, 2015 | $313,500 | $325,509 |
|
| Prudential Financial, Inc. sr. notes 7 3/8s, 2019 | 340,000 | 436,681 |
|
| Prudential Financial, Inc. sr. notes 6.2s, 2015 | 300,000 | 330,472 |
|
| Prudential Financial, Inc. sr. unsec. notes 6 5/8s, 2040 | 1,135,000 | 1,485,027 |
|
| Prudential Holdings, LLC sr. notes FRN Ser. AGM, 1.26s, 2017 | 160,000 | 153,630 |
|
| Rabobank Nederland 144A jr. unsec. sub. notes FRN 11s, | | |
| perpetual maturity (Netherlands) | 1,255,000 | 1,678,563 |
|
| Rayonier, Inc. company guaranty sr. unsec. | | |
| unsub. notes 3 3/4s, 2022 R | 570,000 | 587,519 |
|
| Royal Bank of Scotland Group PLC sr. sub. notes FRN 9 1/2s, | | |
| 2022 (United Kingdom) | 2,640,000 | 3,025,176 |
|
| Royal Bank of Scotland Group PLC sr. unsec. | | |
| unsub. notes 6.4s, 2019 (United Kingdom) | 360,000 | 418,608 |
|
| Santander Issuances S.A. Unipersonal 144A bank | | |
| guaranty unsec. sub. notes 5.911s, 2016 (Spain) | 2,600,000 | 2,652,000 |
|
| SL Green Realty Corp./SL Green Operating Partnership/ | | |
| Reckson Operating Partnership sr. unsec. notes 5s, 2018 R | 1,185,000 | 1,280,441 |
|
| Tanger Properties, LP sr. unsec. notes 6 1/8s, 2020 R | 645,000 | 769,251 |
|
| TD Ameritrade Holding Corp. company guaranty sr. unsec. | | |
| unsub. notes 5.6s, 2019 | 985,000 | 1,154,201 |
|
| Teachers Insurance & Annuity Association of America 144A | | |
| notes 6.85s, 2039 | 1,555,000 | 2,153,471 |
|
| Vornado Realty LP sr. unsec. unsub. notes 4 1/4s, 2015 R | 1,180,000 | 1,254,065 |
|
| Wachovia Bank NA sub. notes Ser. BKNT, 6s, 2017 | 1,880,000 | 2,244,444 |
|
| WEA Finance, LLC 144A company guaranty sr. notes 7 1/8s, 2018 | 1,070,000 | 1,316,437 |
|
| WEA Finance, LLC/ WT Finance Aust. Pty. Ltd. 144A company | | |
| guaranty sr. unsec. notes 6 3/4s, 2019 | 810,000 | 1,002,591 |
|
| Wells Fargo Bank NA unsec. sub. notes FRN 0.647s, 2016 | 1,180,000 | 1,150,350 |
|
| Willis Group Holdings Ltd. company guaranty sr. unsec. | | |
| unsub. notes 5 3/4s, 2021 | 750,000 | 851,812 |
|
| Willis Group North America, Inc. company guaranty 6.2s, 2017 | 510,000 | 585,694 |
|
| | | 142,742,098 |
| Health care (0.6%) | | |
| Aetna, Inc. sr. unsec. unsub. notes 6 3/4s, 2037 | 1,660,000 | 2,254,260 |
|
| CIGNA Corp. sr. unsec. unsub. notes 5 3/8s, 2042 | 660,000 | 778,403 |
|
| Fresenius Medical Care US Finance II, Inc. 144A company | | |
| guaranty sr. unsec. notes 5 5/8s, 2019 | 356,000 | 374,690 |
|
| Fresenius Medical Care US Finance, Inc. 144A company | | |
| guaranty sr. notes 5 3/4s, 2021 | 839,000 | 887,243 |
|
| Quest Diagnostics, Inc. company guaranty sr. unsec. | | |
| notes 6.95s, 2037 | 1,045,000 | 1,389,022 |
|
| Quest Diagnostics, Inc. company guaranty sr. unsec. | | |
| notes 4 3/4s, 2020 | 244,000 | 272,660 |
|
| UnitedHealth Group, Inc. sr. unsec. unsub. notes 4 5/8s, 2041 | 975,000 | 1,090,474 |
|
| Watson Pharmaceuticals, Inc. sr. unsec. notes 4 5/8s, 2042 | 345,000 | 371,877 |
|
| Watson Pharmaceuticals, Inc. sr. unsec. notes 3 1/4s, 2022 | 275,000 | 281,187 |
|
| Watson Pharmaceuticals, Inc. sr. unsec. notes 1 7/8s, 2017 | 65,000 | 66,026 |
|
| WellPoint, Inc. notes 7s, 2019 | 225,000 | 287,450 |
|
| | | 8,053,292 |
| | |
| CORPORATE BONDS AND NOTES (26.8%)* cont. | Principal amount | Value |
|
| Technology (0.2%) | | |
| Brocade Communications Systems, Inc. company | | |
| guaranty sr. notes 6 7/8s, 2020 | $580,000 | $627,850 |
|
| Brocade Communications Systems, Inc. company | | |
| guaranty sr. notes 6 5/8s, 2018 | 230,000 | 238,625 |
|
| Dell, Inc. sr. unsec. notes 5 7/8s, 2019 | 145,000 | 171,869 |
|
| Lexmark International Inc, sr. unsec. notes 5.9s, 2013 | 855,000 | 873,590 |
|
| Xerox Corp. sr. unsec. notes 4 1/2s, 2021 | 1,115,000 | 1,179,214 |
|
| | | 3,091,148 |
| Transportation (0.5%) | | |
| Burlington Northern Santa Fe Corp. sr. unsec. notes | | |
| 5 3/4s, 2018 | 365,000 | 444,299 |
|
| Burlington Northern Santa Fe, LLC sr. unsec. notes 5.4s, 2041 | 1,520,000 | 1,863,487 |
|
| Continental Airlines, Inc. pass-through certificates | | |
| Ser. 97-4A, 6.9s, 2018 | 865,863 | 941,626 |
|
| Continental Airlines, Inc. pass-through certificates | | |
| Ser. 98-1A, 6.648s, 2017 | 413,085 | 443,034 |
|
| CSX Corp. sr. unsec. unsub. notes 4 3/4s, 2042 | 330,000 | 368,575 |
|
| Norfolk Southern Corp. sr. unsec. notes 6s, 2111 | 1,115,000 | 1,410,182 |
|
| Ryder System, Inc. sr. unsec. unsub. notes 2 1/2s, 2018 | 410,000 | 417,389 |
|
| Southwest Airlines Co. pass-through certificates Ser. 07-1, | | |
| 6.15s, 2022 | 204,282 | 237,989 |
|
| Union Pacific Corp. 144A pass-through certificates 5.214s, 2014 | 390,000 | 416,355 |
|
| United AirLines, Inc. pass-through certificates Ser. 07-A, | | |
| 6.636s, 2022 | 459,400 | 489,261 |
|
| | | 7,032,197 |
| Utilities and power (3.1%) | | |
| AEP Texas North Co. sr. notes Ser. B, 5 1/2s, 2013 | 515,000 | 523,281 |
|
| Appalachian Power Co. sr. notes Ser. L, 5.8s, 2035 | 580,000 | 702,685 |
|
| Arizona Public Services Co. sr. unsec. notes 4 1/2s, 2042 | 390,000 | 429,501 |
|
| Atmos Energy Corp. sr. unsub. notes 6.35s, 2017 | 765,000 | 931,025 |
|
| Beaver Valley Funding Corp. sr. bonds 9s, 2017 | 337,000 | 345,182 |
|
| Boardwalk Pipelines LP company guaranty sr. unsec. | | |
| notes 5 7/8s, 2016 | 980,000 | 1,105,993 |
|
| Bruce Mansfield Unit pass-through certificates 6.85s, 2034 | 1,836,121 | 1,955,468 |
|
| CMS Energy Corp. sr. unsec. notes 8 3/4s, 2019 | 2,280,000 | 3,006,800 |
|
| Commonwealth Edison Co. 1st mtge. sec. bonds 5 7/8s, 2033 | 480,000 | 625,021 |
|
| Consolidated Edison Co. of New York sr. unsec. | | |
| unsub. notes 4.2s, 2042 | 710,000 | 786,248 |
|
| Dominion Resources, Inc. sr. unsec. unsub. notes Ser. 07-A, | | |
| 6s, 2017 | 2,460,000 | 2,989,687 |
|
| Duke Energy Carolinas, LLC sr. mtge. notes 4 1/4s, 2041 | 725,000 | 810,007 |
|
| EDP Finance BV 144A sr. unsec. unsub. notes 6s, 2018 | | |
| (Netherlands) | 1,940,000 | 1,981,710 |
|
| El Paso Natural Gas Co. sr. unsec. unsub. bonds 8 3/8s, 2032 | 830,000 | 1,213,277 |
|
| El Paso Pipeline Partners Operating Co., LP company | | |
| guaranty sr. unsec. notes 6 1/2s, 2020 | 750,000 | 905,400 |
|
| Electricite de France SA (EDF) 144A notes 6.95s, 2039 (France) | 970,000 | 1,357,507 |
|
| Enel Finance International SA 144A company | | |
| guaranty sr. unsec. notes 5 1/8s, 2019 (Netherlands) | 695,000 | 735,567 |
|
| | | |
| CORPORATE BONDS AND NOTES (26.8%)* cont. | | Principal amount | Value |
|
| Utilities and power cont. | | | |
| Energy Transfer Partners LP sr. unsec. unsub. notes | | |
| 6 1/2s, 2042 | | $2,265,000 | $2,859,488 |
|
| Energy Transfer Partners LP sr. unsec. unsub. notes | | |
| 5.2s, 2022 | | 780,000 | 892,090 |
|
| Enterprise Products Operating, LLC company | | | |
| guaranty sr. unsec. unsub. notes 4.85s, 2042 | | 1,220,000 | 1,313,952 |
|
| Iberdrola International BV company guaranty sr. unsec. | | |
| unsub. notes 6 3/4s, 2036 (Spain) | | 510,000 | 552,273 |
|
| ITC Holdings Corp. 144A notes 5 7/8s, 2016 | | 890,000 | 1,016,500 |
|
| ITC Holdings Corp. 144A sr. unsec. notes 6.05s, 2018 | 330,000 | 388,654 |
|
| Kansas Gas and Electric Co. bonds 5.647s, 2021 | | 561,362 | 610,813 |
|
| Kinder Morgan Energy Partners LP sr. unsec. notes 6.85s, 2020 | 1,425,000 | 1,820,227 |
|
| MidAmerican Energy Holdings Co. bonds 6 1/8s, 2036 | 1,000,000 | 1,314,759 |
|
| MidAmerican Energy Holdings Co. sr. unsec. bonds | | |
| 6 1/2s, 2037 | | 410,000 | 566,143 |
|
| MidAmerican Funding, LLC sr. sec. bonds 6.927s, 2029 | 360,000 | 483,103 |
|
| Pacific Gas & Electric Co. sr. unsec. notes 6.35s, 2038 | 295,000 | 407,724 |
|
| Pacific Gas & Electric Co. sr. unsub. 5.8s, 2037 | | 785,000 | 1,025,766 |
|
| PacifiCorp Sinking Fund 1st mtge. 6 1/4s, 2037 | | 460,000 | 647,709 |
|
| Potomac Edison Co. 144A 1st mtge. 5.8s, 2016 | | 885,000 | 997,053 |
|
| PPL WEM Holdings PLC 144A sr. unsec. notes 5 3/8s, 2021 | | |
| (United Kingdom) | | 3,220,000 | 3,625,826 |
|
| Teco Finance, Inc. company guaranty sr. unsec. | | | |
| unsub. notes 6.572s, 2017 | | 340,000 | 412,288 |
|
| Texas-New Mexico Power Co. 144A 1st mtge. bonds 9 1/2s, 2019 | 2,840,000 | 3,845,944 |
|
| West Penn Power Co. 144A 1st mtge. 5.95s, 2017 | 830,000 | 990,763 |
|
| Westar Energy, Inc. sr. mtge. notes 4 1/8s, 2042 | | 530,000 | 576,678 |
|
| | | | 44,752,112 |
| | | | |
| Total corporate bonds and notes (cost $336,285,144) | | $385,479,454 |
| |
| |
| MUNICIPAL BONDS AND NOTES (0.3%)* | | Principal amount | Value |
|
| CA State G.O. Bonds (Build America Bonds), 7 1/2s, 4/1/34 | $770,000 | $1,038,576 |
|
| IL State G.O. Bonds | | | |
| 4.421s, 1/1/15 | | 410,000 | 435,211 |
| 4.071s, 1/1/14 | | 1,220,000 | 1,263,786 |
|
| North TX, Thruway Auth. Rev. Bonds (Build America Bonds), | | |
| 6.718s, 1/1/49 | | 675,000 | 924,156 |
|
| OH State U. Rev. Bonds (Build America Bonds), 4.91s, 6/1/40 | 845,000 | 996,331 |
|
| Total municipal bonds and notes (cost $3,925,279) | | $4,658,060 |
| |
| |
| PURCHASED SWAP OPTIONS OUTSTANDING (0.3%)* | | |
| Counterparty | | | |
| Fixed right % to receive or (pay)/ | Expiration | Contract | |
| Floating rate index/Maturity date | date/strike | amount | Value |
|
| Barclay’s Bank PLC | | | |
|
| (1.75)/3 month USD-LIBOR-BBA/Dec-22 | Dec-12/1.75 | $26,171,000 | $296,517 |
|
| 1.75/3 month USD-LIBOR-BBA/Dec-22 | Dec-12/1.75 | 26,171,000 | 261,710 |
|
| 1.5/3 month USD-LIBOR-BBA/Dec-22 | Dec-12/1.5 | 79,712,000 | 163,410 |
|
| | | |
| PURCHASED SWAP OPTIONS OUTSTANDING (0.3%)* cont. | | |
| Counterparty | | | |
| Fixed right % to receive or (pay)/ | Expiration | Contract | |
| Floating rate index/Maturity date | date/strike | amount | Value |
|
| Credit Suisse International | | | |
|
| (2.25)/3 month USD-LIBOR-BBA/Mar-23 E | Mar-13/2.25 | $86,537,000 | $522,510 |
|
| (2)/3 month USD-LIBOR-BBA/Dec-22 E | Dec-12/2 | 139,987,000 | 482,955 |
|
| Deutsche Bank AG | | | |
|
| (2.25)/3 month USD-LIBOR-BBA/Mar-23 E | Mar-13/2.25 | 86,537,000 | 522,510 |
|
| Goldman Sachs International | | | |
|
| (2.25)/3 month USD-LIBOR-BBA/Mar-23 E | Mar-13/2.25 | 86,537,000 | 522,510 |
|
| 2.325/3 month USD-LIBOR-BBA/Dec-22 | Dec-12/2.325 | 3,487,000 | 186,799 |
|
| (2.325)/3 month USD-LIBOR-BBA/Dec-22 | Dec-12/2.325 | 3,487,000 | 3,348 |
|
| 2.8825/3 month USD-LIBOR-BBA/Dec-42 | Dec-12/2.8825 | 8,593,000 | 568,599 |
|
| (2.8825)/3 month USD-LIBOR-BBA/Dec-42 | Dec-12/2.8825 | 8,593,000 | 56,714 |
|
| JPMorgan Chase Bank NA | | | |
|
| (2)/3 month USD-LIBOR-BBA/Dec-22 E | Dec-12/2 | 136,598,000 | 471,263 |
|
| (2)/3 month USD-LIBOR-BBA/Dec-22 | Dec-12/2 | 85,910,000 | 346,217 |
|
| Total purchased swap options outstanding (cost $7,837,276) | | $4,405,062 |
| |
| |
| U.S. TREASURY OBLIGATIONS (0.2%)* | | Principal amount | Value |
|
| U.S. Treasury Bonds 4.625%, February 15, 2040 i | | $1,011,000 | $1,392,824 |
|
| U.S. Treasury Inflation Protected Securities 2.125%, | | |
| February 15, 2040 i | | 454,969 | 681,516 |
|
| U.S. Treasury Notes 0.750%, September 15, 2013 i | 20,000 | 20,115 |
|
| U.S. Treasury Notes 0.250%, June 30, 2014 i | | 574,000 | 574,281 |
|
| U.S. Treasury Notes 2 5/8s, November 15, 2020 | | 416,000 | 456,912 |
|
| Total U.S. treasury obligations (cost $3,062,304) | | $3,125,648 |
| |
| |
| FOREIGN GOVERNMENT AND AGENCY | | | |
| BONDS AND NOTES (0.1%)* | | Principal amount | Value |
|
| Korea Development Bank sr. unsec. unsub. notes 4s, 2016 | $800,000 | $864,835 |
|
| Total foreign government and agency bonds and notes (cost $797,176) | $864,835 |
| |
| |
| SENIOR LOANS (—%)* c | | Principal amount | Value |
|
| Caesars Entertainment Operating Co., Inc. bank term loan | | |
| FRN Ser. B6, 5.461s, 2018 | | $200,422 | $179,768 |
|
| SunGard Data Systems, Inc. bank term loan FRN 1.964s, 2014 | 6,470 | 6,473 |
|
| SunGard Data Systems, Inc. bank term loan FRN Ser. B, | | |
| 3.906s, 2016 | | 134,059 | 134,227 |
|
| Total senior loans (cost $321,245) | | | $320,468 |
| |
| |
| SHORT-TERM INVESTMENTS (18.2%)* | Principal amount/shares | Value |
|
| Putnam Money Market Liquidity Fund 0.16% L | | 141,049,783 | $141,049,783 |
|
| SSgA Prime Money Market Fund 0.12% P | | 1,002,000 | 1,002,000 |
|
| Straight-A-Funding, LLC commercial paper with | | | |
| an effective yield of 0.178%, January 15, 2013 | | $10,000,000 | 9,996,165 |
|
| Straight-A-Funding, LLC commercial paper with | | | |
| an effective yield of 0.178%, January 7, 2013 | | 15,000,000 | 14,995,175 |
|
| Straight-A-Funding, LLC commercial paper with | | | |
| an effective yield of 0.178%, December 18, 2012 | | 17,000,000 | 16,996,005 |
|
| | |
| SHORT-TERM INVESTMENTS (18.2%)* cont. | Principal amount/shares | Value |
|
| U.S. Treasury Bills with effective yields ranging from | | |
| 0.151% to 0.167%, July 25, 2013 # | $64,666,000 | $64,588,465 |
|
| U.S. Treasury Bills with an effective yield of 0.104%, | | |
| December 13, 2012 # | 12,500,000 | 12,498,483 |
|
| Total short-term investments (cost $261,124,041) | | $261,126,076 |
| |
| |
| TOTAL INVESTMENTS | | |
|
| Total investments (cost $1,828,761,055) | | $1,941,939,569 |
Key to holding’s abbreviations
| |
| BKNT | Bank Note |
| FRB | Floating Rate Bonds: the rate shown is the current interest rate at the close of the reporting period |
| FRN | Floating Rate Notes: the rate shown is the current interest rate at the close of the reporting period |
| G.O. Bonds | General Obligation Bonds |
| IFB | Inverse Floating Rate Bonds, which are securities that pay interest rates that vary inversely to changes in the market interest rates. As interest rates rise, inverse floaters produce less current income. The rate shown is the current interest rate at the close of the reporting period. |
| IO | Interest Only |
| MTN | Medium Term Notes |
| PO | Principal Only |
| TBA | To Be Announced Commitments |
Notes to the fund’s portfolio
Unless noted otherwise, the notes to the fund’s portfolio are for the close of the fund’s reporting period, which ran from November 1, 2011 through October 31, 2012 (the reporting period). Within the following notes to the portfolio, references to “ASC 820” represent Accounting Standards Codification ASC 820 Fair Value Measurements and Disclosures.
* Percentages indicated are based on net assets of $1,436,436,630.
† Non-income-producing security.
# This security, in part or in entirety, was pledged and segregated with the broker to cover margin requirements for futures contracts at the close of the reporting period.
∆ Forward commitment, in part or in entirety (Note 1).
c Senior loans are exempt from registration under the Securities Act of 1933, as amended, but contain certain restrictions on resale and cannot be sold publicly. These loans pay interest at rates which adjust periodically. The interest rates shown for senior loans are the current interest rates at the close of the reporting period. Senior loans are also subject to mandatory and/or optional prepayment which cannot be predicted. As a result, the remaining maturity may be substantially less than the stated maturity shown (Notes 1 and 7).
E Extended settlement date on premium.
F Is valued at fair value following procedures approved by the Trustees. Securities may be classified as Level 2 or Level 3 for ASC 820 based on the securities’ valuation inputs.
i Security was pledged, or purchased with cash that was pledged, to the fund for collateral on certain derivative contracts (Note 1).
L Affiliated company (Note 6). The rate quoted in the security description is the annualized 7-day yield of the fund at the close of the reporting period.
P Security was pledged, or purchased with cash that was pledged, to the fund for collateral on certain derivatives contracts. The rate quoted in the security description is the annualized 7-day yield of the fund at the close of the reporting period (Note 1).
R Real Estate Investment Trust.
At the close of the reporting period, the fund maintained liquid assets totaling $760,619,392 to cover certain derivatives contracts.
Debt obligations are considered secured unless otherwise indicated.
144A after the name of an issuer represents securities exempt from registration under Rule 144A under the Securities Act of 1933, as amended. These securities may be resold in transactions exempt from registration, normally to qualified institutional buyers.
See Note 1 to the financial statements regarding TBA’s.
The dates shown on debt obligations are the original maturity dates.
FUTURES CONTRACTS OUTSTANDING at 10/31/12
| | | | | |
| | | | | | Unrealized |
| | Number of | | | Expiration | appreciation/ |
| | contracts | Value | | date | (depreciation) |
|
| U.S. Treasury Bond 30 yr (Long) | 712 | $106,310,500 | | Dec-12 | $(524,228) |
|
| U.S. Treasury Note 5 yr (Long) | 1,590 | 197,557,500 | | Dec-12 | 158,463 |
|
| U.S. Treasury Note 10 yr (Long) | 750 | 99,773,438 | | Dec-12 | 127,481 |
|
| Total | | | | | $(238,284) |
WRITTEN SWAP OPTIONS OUTSTANDING at 10/31/12 (premiums $1,529,066)
| | | |
| Counterparty | | | |
| Fixed Obligation % to receive or (pay)/ | Expiration | Contract | |
| Floating rate index/Maturity date | date/strike | amount | Value |
|
| Deutsche Bank AG | | | |
|
| (1.75)/3 month USD-LIBOR-BBA/Mar-23 E | Mar-13/1.75 | $39,716,000 | $533,982 |
|
| 1.75/3 month USD-LIBOR-BBA/Mar-23 E | Mar-13/1.75 | 39,716,000 | 838,126 |
|
| | | | $1,372,108 |
E Extended settlement date on premium.
TBA SALE COMMITMENTS OUTSTANDING at 10/31/12 (proceeds receivable $186,552,578)
| | | | |
| | Principal | | Settlement | |
| Agency | amount | | date | Value |
|
| Federal National Mortgage Association, 5s, | | | | |
| November 1, 2042 | $42,000,000 | | 11/14/12 | $45,819,375 |
|
| Federal National Mortgage Association, 3s, | | | | |
| November 1, 2042 | 133,000,000 | | 11/14/12 | 139,618,825 |
|
| Government National Mortgage Association, 3s, | | | | |
| November 1, 2042 | 1,000,000 | | 11/20/12 | 1,065,078 |
|
| Total | | | | $186,503,278 |
INTEREST RATE SWAP CONTRACTS OUTSTANDING at 10/31/12
| | | | | | |
| | Upfront | | | Payments | Payments | Unrealized |
| Swap counterparty/ | premium | Termination | | made by | received by | appreciation/ |
| Notional amount | received (paid) | date | | fund per annum | fund per annum | (depreciation) |
|
| Barclay’s Bank, PLC | | | | | | |
| $81,681,000 E | $70,279 | 12/19/14 | | 0.45% | 3 month USD- | |
| | | | | | LIBOR-BBA | $(18,754) |
|
| 10,980,000 E | 46,468 | 12/19/17 | | 0.90% | 3 month USD- | |
| | | | | | LIBOR-BBA | 22,642 |
|
| 870,000 E | (69,339) | 12/19/42 | | 2.40% | 3 month USD- | |
| | | | | | LIBOR-BBA | (30,459) |
|
| 2,931,000 E | 172,831 | 12/19/42 | | 3 month USD- | | |
| | | | | LIBOR-BBA | 2.40% | 41,845 |
|
| 59,083,000 E | 446,735 | 12/19/22 | | 3 month USD- | | |
| | | | | LIBOR-BBA | 1.75% | 368,745 |
|
INTEREST RATE SWAP CONTRACTS OUTSTANDING at 10/31/12 cont.
| | | | | | |
| | Upfront | | | Payments | Payments | Unrealized |
| Swap counterparty/ | premium | Termination | | made by | received by | appreciation/ |
| Notional amount | received (paid) | date | | fund per annum | fund per annum | (depreciation) |
|
| Barclay’s Bank, PLC cont. | | | | | |
| $283,814,000 E | $(3,098,838) | 12/19/22 | | 1.75% | 3 month USD- | |
| | | | | | LIBOR-BBA | $(2,724,202) |
|
| 63,770,000 E | — | 12/19/22 | | 3 month USD- | | |
| | | | | LIBOR-BBA | 1.805% | 244,877 |
|
| 38,528,000 E | — | 12/19/22 | | 3 month USD- | | |
| | | | | LIBOR-BBA | 1.83% | 238,103 |
|
| 21,257,000 E | — | 12/19/22 | | 3 month USD- | | |
| | | | | LIBOR-BBA | 1.80% | 71,636 |
|
| 20,758,000 E | (4,300) | 12/19/17 | | 3 month USD- | | |
| | | | | LIBOR-BBA | 0.90% | 40,745 |
|
| Citibank, N.A. | | | | | | |
| 2,182,000 E | — | 10/7/21 | | 3 month USD- | | |
| | | | | LIBOR-BBA | 3.0625% | 69,148 |
|
| 11,100,000 E | (12,787) | 12/19/17 | | 0.90% | 3 month USD- | |
| | | | | | LIBOR-BBA | (36,874) |
|
| 21,373,000 E | (5,078) | 12/19/14 | | 3 month USD- | | |
| | | | | LIBOR-BBA | 0.45% | 18,218 |
|
| 59,615,000 E | (580,373) | 12/19/22 | | 1.75% | 3 month USD- | |
| | | | | | LIBOR-BBA | (501,681) |
|
| Credit Suisse International | | | | | |
| 132,164,000 E | (168,474) | 12/19/14 | | 3 month USD- | | |
| | | | | LIBOR-BBA | 0.45% | (24,415) |
|
| 35,651,000 E | (29,046) | 12/19/17 | | 3 month USD- | | |
| | | | | LIBOR-BBA | 0.90% | 48,317 |
|
| 35,313,000 E | 2,264,717 | 12/19/42 | | 3 month USD- | | |
| | | | | LIBOR-BBA | 2.40% | 686,579 |
|
| 349,988,000 E | 341,513 | 12/19/14 | | 0.45% | 3 month USD- | |
| | | | | | LIBOR-BBA | (39,970) |
|
| 60,681,000 E | 37,489 | 12/19/17 | | 0.90% | 3 month USD- | |
| | | | | | LIBOR-BBA | (94,189) |
|
| 30,593,000 E | (2,009,736) | 12/19/42 | | 2.40% | 3 month USD- | |
| | | | | | LIBOR-BBA | (642,535) |
|
| 126,977,000 E | 1,858,196 | 12/19/22 | | 3 month USD- | | |
| | | | | LIBOR-BBA | 1.75% | 1,690,585 |
|
| 312,020,000 E | (2,835,518) | 12/19/22 | | 1.75% | 3 month USD- | |
| | | | | | LIBOR-BBA | (2,423,649) |
|
| Deutsche Bank AG | | | | | | |
| 1,104,000 E | — | 10/7/21 | | 3 month USD- | | |
| | | | | LIBOR-BBA | 3.0475% | 34,224 |
|
| 1,143,000 E | 355 | 12/19/17 | | 0.90% | 3 month USD- | |
| | | | | | LIBOR-BBA | (2,126) |
|
| 52,713,000 E | (495,932) | 12/19/22 | | 1.75% | 3 month USD- | |
| | | | | | LIBOR-BBA | (426,351) |
|
| 66,846,000 E | 886,216 | 12/19/22 | | 3 month USD- | | |
| | | | | LIBOR-BBA | 1.75% | 797,979 |
|
INTEREST RATE SWAP CONTRACTS OUTSTANDING at 10/31/12 cont.
| | | | | | |
| | Upfront | | | Payments | Payments | Unrealized |
| Swap counterparty/ | premium | Termination | | made by | received by | appreciation/ |
| Notional amount | received (paid) | date | | fund per annum | fund per annum | (depreciation) |
|
| Goldman Sachs International | | | | | |
| $14,836,000 E | $(10,221) | 12/19/14 | | 3 month USD- | | |
| | | | | LIBOR-BBA | 0.45% | $5,951 |
|
| 29,746,000 E | (56,869) | 12/19/17 | | 0.90% | 3 month USD- | |
| | | | | | LIBOR-BBA | (121,417) |
|
| 184,554,000 E | (2,660,812) | 12/19/22 | | 1.75% | 3 month USD- | |
| | | | | | LIBOR-BBA | (2,417,200) |
|
| 124,107,000 E | 1,346,836 | 12/19/22 | | 3 month USD- | | |
| | | | | LIBOR-BBA | 1.75% | 1,183,015 |
|
| 25,663,000 E | 1,823,903 | 12/19/42 | | 3 month USD- | | |
| | | | | LIBOR-BBA | 2.40% | 677,024 |
|
| JPMorgan Chase Bank NA | | | | | |
| 2,505,000 E | 4,569 | 12/19/17 | | 3 month USD- | | |
| | | | | LIBOR-BBA | 0.90% | 10,005 |
|
| 68,598,000 E | (215,468) | 12/19/22 | | 1.75% | 3 month USD- | |
| | | | | | LIBOR-BBA | (124,920) |
|
| 85,994,000 E | 1,213,091 | 12/19/22 | | 3 month USD- | | |
| | | | | LIBOR-BBA | 1.75% | 1,099,579 |
|
| 636,000 E | (64,316) | 12/19/42 | | 2.40% | 3 month USD- | |
| | | | | | LIBOR-BBA | (35,893) |
|
| 126,742,000 E | — | 12/19/22 | | 3 month USD- | | |
| | | | | LIBOR-BBA | 1.854% | 1,068,435 |
|
| The Royal Bank of Scotland PLC | | | | | |
| 7,305,000 E | (91,799) | 12/19/22 | | 1.75% | 3 month USD- | |
| | | | | | LIBOR-BBA | (82,158) |
|
| Total | | | | | | $(1,329,141) |
E See Note 1 to the financial statements regarding extended effective dates.
TOTAL RETURN SWAP CONTRACTS OUTSTANDING at 10/31/12
| | | | | | |
| | Upfront | | | Fixed payments | Total return | Unrealized |
| Swap counterparty/ | premium | Termination | | received (paid) by | received by | appreciation/ |
| Notional amount | received (paid) | date | | fund per annum | or paid by fund | (depreciation) |
|
| Bank of America N.A. | | | | | | |
| $2,496,945 | $— | 1/12/41 | | 4.00% (1 month | Synthetic TRS | $17,328 |
| | | | | USD-LIBOR) | Index 4.00% | |
| | | | | | 30 year Fannie Mae | |
| | | | | | pools | |
|
| Barclay’s Bank, PLC | | | | | | |
| 12,068,257 | — | 1/12/36 | | (5.50% ) 1 month | Synthetic TRS | (63,095) |
| | | | | USD-LIBOR | Index 5.50% | |
| | | | | | 30 year Fannie Mae | |
| | | | | | pools | |
|
| 4,680,372 | — | 1/12/41 | | 4.00% (1 month | Synthetic TRS | 32,480 |
| | | | | USD-LIBOR) | Index 4.00% | |
| | | | | | 30 year Fannie Mae | |
| | | | | | pools | |
|
TOTAL RETURN SWAP CONTRACTS OUTSTANDING at 10/31/12 cont.
| | | | | | |
| | Upfront | | | Fixed payments | Total return | Unrealized |
| Swap counterparty/ | premium | Termination | | received (paid) by | received by | appreciation/ |
| Notional amount | received (paid) | date | | fund per annum | or paid by fund | (depreciation) |
|
| Barclay’s Bank, PLC cont. | | | | | |
| $10,110,205 | $— | 1/12/38 | | (6.50%) 1 month | Synthetic MBX | $(61,746) |
| | | | | USD-LIBOR | Index 6.50% | |
| | | | | | 30 year Fannie Mae | |
| | | | | | pools | |
|
| 8,596,537 | — | 1/12/40 | | 4.50% (1 month | Synthetic MBX | 12,600 |
| | | | | USD-LIBOR) | Index 4.50% | |
| | | | | | 30 year Fannie Mae | |
| | | | | | pools | |
|
| 22,882,316 | — | 1/12/38 | | (6.50%) 1 month | Synthetic MBX | (139,749) |
| | | | | USD-LIBOR | Index 6.50% | |
| | | | | | 30 year Fannie Mae | |
| | | | | | pools | |
|
| 15,308,583 | — | 1/12/40 | | 5.00% (1 month | Synthetic MBX | 28,808 |
| | | | | USD-LIBOR) | Index 5.00% | |
| | | | | | 30 year Fannie Mae | |
| | | | | | pools | |
|
| 12,592,588 | — | 1/12/41 | | 5.00% (1 month | Synthetic MBX | 25,649 |
| | | | | USD-LIBOR) | Index 5.00% | |
| | | | | | 30 year Fannie Mae | |
| | | | | | pools | |
|
| 4,006,449 | — | 1/12/41 | | 4.00% (1 month | Synthetic TRS | 27,804 |
| | | | | USD-LIBOR) | Index 4.00% | |
| | | | | | 30 year Fannie Mae | |
| | | | | | pools | |
|
| 8,143,064 | — | 1/12/41 | | 4.00% (1 month | Synthetic TRS | 56,511 |
| | | | | USD-LIBOR) | Index 4.00% | |
| | | | | | 30 year Fannie Mae | |
| | | | | | pools | |
|
| 7,910,062 | — | 1/12/40 | | (4.00%) 1 month | Synthetic TRS | (31,428) |
| | | | | USD-LIBOR | Index 4.00% | |
| | | | | | 30 year Fannie Mae | |
| | | | | | pools | |
|
| 37,592,738 | — | 1/12/41 | | 4.00% (1 month | Synthetic TRS | 260,883 |
| | | | | USD-LIBOR) | Index 4.00% | |
| | | | | | 30 year Fannie Mae | |
| | | | | | pools | |
|
| 2,372,378 | — | 1/12/41 | | 4.00% (1 month | Synthetic TRS | 16,464 |
| | | | | USD-LIBOR) | Index 4.00% | |
| | | | | | 30 year Fannie Mae | |
| | | | | | pools | |
|
| 59,795,390 | — | 1/12/38 | | (6.50%) 1 month | Synthetic MBX | (365,188) |
| | | | | USD-LIBOR | Index 6.50% | |
| | | | | | 30 year Fannie Mae | |
| | | | | | pools | |
|
| 31,318,385 | — | 1/12/41 | | 5.00% (1 month | Synthetic MBX | 63,791 |
| | | | | USD-LIBOR) | Index 5.00% | |
| | | | | | 30 year Fannie Mae | |
| | | | | | pools | |
|
TOTAL RETURN SWAP CONTRACTS OUTSTANDING at 10/31/12 cont.
| | | | | | |
| | Upfront | | | Fixed payments | Total return | Unrealized |
| Swap counterparty/ | premium | Termination | | received (paid) by | received by | appreciation/ |
| Notional amount | received (paid) | date | | fund per annum | or paid by fund | (depreciation) |
|
| Barclay’s Bank, PLC cont. | | | | | |
| $1,741,992 | $— | 1/12/40 | | 4.00% (1 month | Synthetic MBX | $3,186 |
| | | | | USD-LIBOR) | Index 4.00% | |
| | | | | | 30 year Fannie Mae | |
| | | | | | pools | |
|
| 5,436,874 | — | 1/12/41 | | 4.00% (1 month | Synthetic TRS | 37,730 |
| | | | | USD-LIBOR) | Index 4.00% | |
| | | | | | 30 year Fannie Mae | |
| | | | | | pools | |
|
| 2,471,752 | — | 1/12/41 | | 4.00% (1 month | Synthetic TRS | 17,153 |
| | | | | USD-LIBOR) | Index 4.00% | |
| | | | | | 30 year Fannie Mae | |
| | | | | | pools | |
|
| 2,723,752 | — | 1/12/41 | | 5.00% (1 month | Synthetic MBX | 5,548 |
| | | | | USD-LIBOR) | Index 5.00% | |
| | | | | | 30 year Fannie Mae | |
| | | | | | pools | |
|
| 12,984,548 | — | 1/12/41 | | 4.50% (1 month | Synthetic TRS | 93,511 |
| | | | | USD-LIBOR) | Index 4.50% | |
| | | | | | 30 year Fannie Mae | |
| | | | | | pools | |
|
| 5,663,548 | (8,849) | 1/12/39 | | 6.00% (1 month | Synthetic TRS | 25,588 |
| | | | | USD-LIBOR) | Index 6.00% | |
| | | | | | 30 year Fannie Mae | |
| | | | | | pools | |
|
| 51,196,089 | — | 1/12/38 | | (6.50%) 1 month | Synthetic MBX | (312,670) |
| | | | | USD-LIBOR | Index 6.50% | |
| | | | | | 30 year Fannie Mae | |
| | | | | | pools | |
|
| 41,454,149 | — | 1/12/41 | | 5.00% (1 month | Synthetic MBX | 84,436 |
| | | | | USD-LIBOR) | Index 5.00% | |
| | | | | | 30 year Fannie Mae | |
| | | | | | pools | |
|
| 14,491,811 | — | 1/12/40 | | 4.00% (1 month | Synthetic MBX | 26,501 |
| | | | | USD-LIBOR) | Index 4.00% | |
| | | | | | 30 year Fannie Mae | |
| | | | | | pools | |
|
| 1,694,264 | — | 1/12/40 | | 4.00% (1 month | Synthetic TRS | 6,732 |
| | | | | USD-LIBOR) | Index 4.00% | |
| | | | | | 30 year Fannie Mae | |
| | | | | | pools | |
|
| 979,986 | — | 1/12/38 | | 6.50% (1 month | Synthetic TRS | 2,882 |
| | | | | USD-LIBOR) | Index 6.50% | |
| | | | | | 30 year Fannie Mae | |
| | | | | | pools | |
|
| 5,375,197 | — | 1/12/38 | | (6.50%) 1 month | Synthetic MBX | (32,828) |
| | | | | USD-LIBOR | Index 6.50% | |
| | | | | | 30 year Fannie Mae | |
| | | | | | pools | |
|
TOTAL RETURN SWAP CONTRACTS OUTSTANDING at 10/31/12 cont.
| | | | | | |
| | Upfront | | | Fixed payments | Total return | Unrealized |
| Swap counterparty/ | premium | Termination | | received (paid) by | received by | appreciation/ |
| Notional amount | received (paid) | date | | fund per annum | or paid by fund | (depreciation) |
|
| Barclay’s Bank, PLC cont. | | | | | |
| $1,301,310 | $— | 1/12/41 | | 5.00% (1 month | Synthetic MBX | $5,906 |
| | | | | USD-LIBOR) | Index 5.00% | |
| | | | | | 30 year Ginnie Mae II |
| | | | | | pools | |
|
| 22,470,957 | — | 1/12/41 | | 5.00% (1 month | Synthetic MBX | 45,770 |
| | | | | USD-LIBOR) | Index 5.00% | |
| | | | | | 30 year Fannie Mae | |
| | | | | | pools | |
|
| 21,608,436 | — | 1/12/38 | | (6.50%) 1 month | Synthetic MBX | (131,969) |
| | | | | USD-LIBOR | Index 6.50% | |
| | | | | | 30 year Fannie Mae | |
| | | | | | pools | |
|
| 8,638,534 | — | 1/12/41 | | 4.00% (1 month | Synthetic TRS | 59,949 |
| | | | | USD-LIBOR) | Index 4.00% | |
| | | | | | 30 year Fannie Mae | |
| | | | | | pools | |
|
| 3,060,997 | — | 1/12/41 | | 4.00% (1 month | Synthetic TRS | 21,242 |
| | | | | USD-LIBOR) | Index 4.00% | |
| | | | | | 30 year Fannie Mae | |
| | | | | | pools | |
|
| 2,056,675 | — | 1/12/40 | | 5.00% (1 month | Synthetic MBX | 3,870 |
| | | | | USD-LIBOR) | Index 5.00% | |
| | | | | | 30 year Fannie Mae | |
| | | | | | pools | |
|
| 9,605,224 | — | 1/12/40 | | 4.50% (1 month | Synthetic MBX | 14,079 |
| | | | | USD-LIBOR) | Index 4.50% | |
| | | | | | 30 year Fannie Mae | |
| | | | | | pools | |
|
| 35,917,441 | — | 1/12/41 | | 5.00% (1 month | Synthetic MBX | 73,158 |
| | | | | USD-LIBOR) | Index 5.00% | |
| | | | | | 30 year Fannie Mae | |
| | | | | | pools | |
|
| 6,001,107 | — | 1/12/41 | | 5.00% (1 month | Synthetic MBX | 12,223 |
| | | | | USD-LIBOR) | Index 5.00% | |
| | | | | | 30 year Fannie Mae | |
| | | | | | pools | |
|
| 1,137,648 | — | 1/12/40 | | 5.00% (1 month | Synthetic MBX | 2,141 |
| | | | | USD-LIBOR) | Index 5.00% | |
| | | | | | 30 year Fannie Mae | |
| | | | | | pools | |
|
| 3,689,420 | — | 1/12/40 | | 5.00% (1 month | Synthetic MBX | 6,943 |
| | | | | USD-LIBOR) | Index 5.00% | |
| | | | | | 30 year Fannie Mae | |
| | | | | | pools | |
|
| 2,674,650 | — | 1/12/40 | | 5.00% (1 month | Synthetic MBX | 5,033 |
| | | | | USD-LIBOR) | Index 5.00% | |
| | | | | | 30 year Fannie Mae | |
| | | | | | pools | |
|
TOTAL RETURN SWAP CONTRACTS OUTSTANDING at 10/31/12 cont.
| | | | | | |
| | Upfront | | | Fixed payments | Total return | Unrealized |
| Swap counterparty/ | premium | Termination | | received (paid) by | received by | appreciation/ |
| Notional amount | received (paid) | date | | fund per annum | or paid by fund | (depreciation) |
|
| Citibank, N.A. | | | | | | |
| $13,259,907 | $— | 1/12/41 | | 5.00% (1 month | Synthetic MBX | $27,008 |
| | | | | USD-LIBOR) | Index 5.00% | |
| | | | | | 30 year Fannie Mae | |
| | | | | | pools | |
|
| 17,833,768 | — | 1/12/41 | | 5.00% (1 month | Synthetic MBX | 36,325 |
| | | | | USD-LIBOR) | Index 5.00% | |
| | | | | | 30 year Fannie Mae | |
| | | | | | pools | |
|
| Credit Suisse International | | | | | |
| 32,131,490 | — | 1/12/41 | | 4.50% (1 month | Synthetic MBX | 31,937 |
| | | | | USD-LIBOR) | Index 4.50% | |
| | | | | | 30 year Ginnie Mae II |
| | | | | | pools | |
|
| 635,433 | — | 1/12/41 | | 4.00% (1 month | Synthetic TRS | 4,410 |
| | | | | USD-LIBOR) | Index 4.00% | |
| | | | | | 30 year Fannie Mae | |
| | | | | | pools | |
|
| 9,573,419 | — | 1/12/39 | | (5.00%) 1 month | Synthetic TRS | (38,603) |
| | | | | USD-LIBOR | Index 5.00% | |
| | | | | | 30 year Fannie Mae | |
| | | | | | pools | |
|
| 2,496,245 | — | 1/12/41 | | 4.00% (1 month | Synthetic TRS | 17,323 |
| | | | | USD-LIBOR) | Index 4.00% | |
| | | | | | 30 year Fannie Mae | |
| | | | | | pools | |
|
| Goldman Sachs International | | | | | |
| 6,205,272 | — | 1/12/41 | | 4.00% (1 month | Synthetic TRS | 43,063 |
| | | | | USD-LIBOR) | Index 4.00% | |
| | | | | | 30 year Fannie Mae | |
| | | | | | pools | |
|
| 3,552,525 | — | 1/12/38 | | 6.50% (1 month | Synthetic TRS | 10,448 |
| | | | | USD-LIBOR) | Index 6.50% | |
| | | | | | 30 year Fannie Mae | |
| | | | | | pools | |
|
| 12,450,594 | — | 1/12/38 | | 6.50% (1 month | Synthetic TRS | 36,616 |
| | | | | USD-LIBOR) | Index 6.50% | |
| | | | | | 30 year Fannie Mae | |
| | | | | | pools | |
|
| 9,604,674 | — | 1/12/38 | | 6.50% (1 month | Synthetic TRS | 28,246 |
| | | | | USD-LIBOR) | Index 6.50% | |
| | | | | | 30 year Fannie Mae | |
| | | | | | pools | |
|
| 3,892,379 | — | 1/12/41 | | 4.00% (1 month | Synthetic TRS | 27,012 |
| | | | | USD-LIBOR) | Index 4.00% | |
| | | | | | 30 year Fannie Mae | |
| | | | | | pools | |
|
| 12,064,084 | — | 1/12/38 | | 6.50% (1 month | Synthetic TRS | 35,479 |
| | | | | USD-LIBOR) | Index 6.50% | |
| | | | | | 30 year Fannie Mae | |
| | | | | | pools | |
|
TOTAL RETURN SWAP CONTRACTS OUTSTANDING at 10/31/12 cont.
| | | | | | |
| | Upfront | | | Fixed payments | Total return | Unrealized |
| Swap counterparty/ | premium | Termination | | received (paid) by | received by | appreciation/ |
| Notional amount | received (paid) | date | | fund per annum | or paid by fund | (depreciation) |
|
| Goldman Sachs International cont. | | | | | |
| $641,732 | $— | 1/12/41 | | 4.00% (1 month | Synthetic TRS | $4,453 |
| | | | | USD-LIBOR) | Index 4.00% | |
| | | | | | 30 year Fannie Mae | |
| | | | | | pools | |
|
| 1,082,616 | — | 1/12/41 | | 4.00% (1 month | Synthetic TRS | 7,513 |
| | | | | USD-LIBOR) | Index 4.00% | |
| | | | | | 30 year Fannie Mae | |
| | | | | | pools | |
|
| 2,939,229 | — | 1/12/41 | | 4.00% (1 month | Synthetic TRS | 20,397 |
| | | | | USD-LIBOR) | Index 4.00% | |
| | | | | | 30 year Fannie Mae | |
| | | | | | pools | |
|
| 4,836,431 | — | 1/12/41 | | 4.00% (1 month | Synthetic TRS | 33,563 |
| | | | | USD-LIBOR) | Index 4.00% | |
| | | | | | 30 year Fannie Mae | |
| | | | | | pools | |
|
| 11,129,180 | — | 1/12/41 | | (4.00%) 1 month | Synthetic TRS | (77,233) |
| | | | | USD-LIBOR | Index 4.00% | |
| | | | | | 30 year Fannie Mae | |
| | | | | | pools | |
|
| 11,214,695 | — | 1/12/41 | | 4.50% (1 month | Synthetic TRS | 80,765 |
| | | | | USD-LIBOR) | Index 4.50% | |
| | | | | | 30 year Fannie Mae | |
| | | | | | pools | |
|
| 2,183,864 | — | 1/12/40 | | (4.00%) 1 month | Synthetic TRS | (8,677) |
| | | | | USD-LIBOR | Index 4.00% | |
| | | | | | 30 year Fannie Mae | |
| | | | | | pools | |
|
| 2,183,427 | — | 1/12/41 | | 4.00% (1 month | Synthetic TRS | 15,152 |
| | | | | USD-LIBOR) | Index 4.00% | |
| | | | | | 30 year Fannie Mae | |
| | | | | | pools | |
|
| 5,487,960 | — | 1/12/41 | | 4.00% (1 month | Synthetic TRS | 38,085 |
| | | | | USD-LIBOR) | Index 4.00% | |
| | | | | | 30 year Fannie Mae | |
| | | | | | pools | |
|
| 17,821,323 | — | 1/12/38 | | (6.50%) 1 month | Synthetic MBX | (108,840) |
| | | | | USD-LIBOR | Index 6.50% | |
| | | | | | 30 year Fannie Mae | |
| | | | | | pools | |
|
| 6,694,979 | — | 1/12/38 | | (6.50%) 1 month | Synthetic MBX | (40,888) |
| | | | | USD-LIBOR | Index 6.50% | |
| | | | | | 30 year Fannie Mae | |
| | | | | | pools | |
|
| 12,068,257 | — | 1/12/36 | | 5.50% (1 month | Synthetic TRS | 63,095 |
| | | | | USD-LIBOR) | Index 5.50% | |
| | | | | | 30 year Fannie Mae | |
| | | | | | pools | |
|
TOTAL RETURN SWAP CONTRACTS OUTSTANDING at 10/31/12 cont.
| | | | | | |
| | Upfront | | | Fixed payments | Total return | Unrealized |
| Swap counterparty/ | premium | Termination | | received (paid) by | received by | appreciation/ |
| Notional amount | received (paid) | date | | fund per annum | or paid by fund | (depreciation) |
|
| Goldman Sachs International cont. | | | | | |
| $16,307,122 | $— | 1/12/41 | | 4.00% (1 month | Synthetic TRS | $113,167 |
| | | | | USD-LIBOR) | Index 4.00% | |
| | | | | | 30 year Fannie Mae | |
| | | | | | pools | |
|
| 16,637,141 | — | 1/12/41 | | 4.50% (1 month | Synthetic TRS | 119,816 |
| | | | | USD-LIBOR) | Index 4.50% | |
| | | | | | 30 year Fannie Mae | |
| | | | | | pools | |
|
| 4,846,336 | 2,272 | 1/12/41 | | 4.50% (1 month | Synthetic TRS | 37,174 |
| | | | | USD-LIBOR) | Index 4.50% | |
| | | | | | 30 year Fannie Mae | |
| | | | | | pools | |
|
| 1,650,867 | 903 | 1/12/41 | | 4.00% (1 month | Synthetic TRS | 12,359 |
| | | | | USD-LIBOR) | Index 4.00% | |
| | | | | | 30 year Fannie Mae | |
| | | | | | pools | |
|
| 3,949,800 | (5,554) | 1/12/39 | | 6.00% (1 month | Synthetic TRS | 18,462 |
| | | | | USD-LIBOR) | Index 6.00% | |
| | | | | | 30 year Fannie Mae | |
| | | | | | pools | |
|
| 8,007,299 | — | 1/12/41 | | 4.00% (1 month | Synthetic TRS | 55,568 |
| | | | | USD-LIBOR) | Index 4.00% | |
| | | | | | 30 year Fannie Mae | |
| | | | | | pools | |
|
| 744,383 | — | 1/12/38 | | 6.50% (1 month | Synthetic TRS | 2,189 |
| | | | | USD-LIBOR) | Index 6.50% | |
| | | | | | 30 year Fannie Mae | |
| | | | | | pools | |
|
| 10,961,924 | — | 1/12/41 | | 4.00% (1 month | Synthetic TRS | 76,073 |
| | | | | USD-LIBOR) | Index 4.00% | |
| | | | | | 30 year Fannie Mae | |
| | | | | | pools | |
|
| 2,296,098 | — | 1/12/41 | | 4.00% (1 month | Synthetic TRS | 15,934 |
| | | | | USD-LIBOR) | Index 4.00% | |
| | | | | | 30 year Fannie Mae | |
| | | | | | pools | |
|
| 4,882,619 | — | 1/12/41 | | 4.00% (1 month | Synthetic TRS | 33,884 |
| | | | | USD-LIBOR) | Index 4.00% | |
| | | | | | 30 year Fannie Mae | |
| | | | | | pools | |
|
| 24,413,328 | — | 1/12/38 | | (6.50%) 1 month | Synthetic MBX | (149,100) |
| | | | | USD-LIBOR | Index 6.50% | |
| | | | | | 30 year Fannie Mae | |
| | | | | | pools | |
|
| 1,649,017 | — | 1/12/38 | | 6.50% (1 month | Synthetic TRS | 4,850 |
| | | | | USD-LIBOR) | Index 6.50% | |
| | | | | | 30 year Fannie Mae | |
| | | | | | pools | |
|
TOTAL RETURN SWAP CONTRACTS OUTSTANDING at 10/31/12 cont.
| | | | | | |
| | Upfront | | | Fixed payments | Total return | Unrealized |
| Swap counterparty/ | premium | Termination | | received (paid) by | received by | appreciation/ |
| Notional amount | received (paid) | date | | fund per annum | or paid by fund | (depreciation) |
|
| Goldman Sachs International cont. | | | | | |
| $10,730,985 | $— | 1/12/41 | | 4.00% (1 month | Synthetic TRS | $74,470 |
| | | | | USD-LIBOR) | Index 4.00% | |
| | | | | | 30 year Fannie Mae | |
| | | | | | pools | |
|
| 3,376,229 | — | 1/12/38 | | 6.50% (1 month | Synthetic TRS | 9,929 |
| | | | | USD-LIBOR) | Index 6.50% | |
| | | | | | 30 year Fannie Mae | |
| | | | | | pools | |
|
| 905,243 | — | 1/12/38 | | (6.50%) 1 month | Synthetic MBX | (5,529) |
| | | | | USD-LIBOR | Index 6.50% | |
| | | | | | 30 year Fannie Mae | |
| | | | | | pools | |
|
| 2,413,710 | — | 1/12/38 | | (6.50%) 1 month | Synthetic MBX | (14,741) |
| | | | | USD-LIBOR | Index 6.50% | |
| | | | | | 30 year Fannie Mae | |
| | | | | | pools | |
|
| 3,276,910 | — | 1/12/38 | | 6.50% (1 month | Synthetic TRS | 9,637 |
| | | | | USD-LIBOR) | Index 6.50% | |
| | | | | | 30 year Fannie Mae | |
| | | | | | pools | |
|
| 6,553,821 | — | 1/12/38 | | 6.50% (1 month | Synthetic TRS | 19,274 |
| | | | | USD-LIBOR) | Index 6.50% | |
| | | | | | 30 year Fannie Mae | |
| | | | | | pools | |
|
| 4,439,489 | — | 1/12/38 | | 6.50% (1 month | Synthetic TRS | 13,056 |
| | | | | USD-LIBOR) | Index 6.50% | |
| | | | | | 30 year Fannie Mae | |
| | | | | | pools | |
|
| 1,690,756 | — | 1/12/41 | | 4.00% (1 month | Synthetic TRS | 11,733 |
| | | | | USD-LIBOR) | Index 4.00% | |
| | | | | | 30 year Fannie Mae | |
| | | | | | pools | |
|
| 2,047,714 | — | 1/12/38 | | 6.50% (1 month | Synthetic TRS | 6,022 |
| | | | | USD-LIBOR) | Index 6.50% | |
| | | | | | 30 year Fannie Mae | |
| | | | | | pools | |
|
| 13,644,857 | — | 1/12/38 | | 6.50% (1 month | Synthetic TRS | 40,128 |
| | | | | USD-LIBOR) | Index 6.50% | |
| | | | | | 30 year Fannie Mae | |
| | | | | | pools | |
|
| JPMorgan Chase Bank NA | | | | | |
| 7,524,472 | 4,703 | 1/12/41 | | 4.50% (1 month | Synthetic TRS | 58,896 |
| | | | | USD-LIBOR) | Index 4.50% | |
| | | | | | 30 year Fannie Mae | |
| | | | | | pools | |
|
| Total | | | | | | $807,126 |
ASC 820 establishes a three-level hierarchy for disclosure of fair value measurements. The valuation hierarchy is based upon the transparency of inputs to the valuation of the fund’s investments. The three levels are defined as follows:
Level 1: Valuations based on quoted prices for identical securities in active markets.
Level 2: Valuations based on quoted prices in markets that are not active or for which all significant inputs are observable, either directly or indirectly.
Level 3: Valuations based on inputs that are unobservable and significant to the fair value measurement.
The following is a summary of the inputs used to value the fund’s net assets as of the close of the reporting period:
| | | |
| | | Valuation inputs | |
|
| Investments in securities: | Level 1 | Level 2 | Level 3 |
|
| Corporate bonds and notes | $— | $385,479,454 | $— |
|
| Foreign government and agency bonds and notes | — | 864,835 | — |
|
| Mortgage-backed securities | — | 563,314,349 | — |
|
| Municipal bonds and notes | — | 4,658,060 | — |
|
| Purchased swap options outstanding | — | 4,405,062 | — |
|
| Senior loans | — | 320,468 | — |
|
| U.S. Government and agency mortgage obligations | — | 718,645,617 | — |
|
| U.S. Treasury obligations | — | 3,125,648 | — |
|
| Short-term investments | 142,051,783 | 119,074,293 | — |
|
| Totals by level | $142,051,783 | $1,799,887,786 | $— |
| | | |
| | | Valuation inputs | |
|
| Other financial instruments: | Level 1 | Level 2 | Level 3 |
|
| Futures contracts | $(238,284) | $— | $— |
|
| Written swap options outstanding | — | (1,372,108) | — |
|
| TBA sale commitments | — | (186,503,278) | — |
|
| Interest rate swap contracts | — | 566,567 | — |
|
| Total return swap contracts | — | 813,651 | — |
|
| Totals by level | $(238,284) | $(186,495,168) | $— |
At the start and close of the reporting period, Level 3 investments in securities were not considered a significant portion of the fund’s portfolio.
The accompanying notes are an integral part of these financial statements.
Statement of assets and liabilities 10/31/12
| |
| ASSETS | |
|
| Investment in securities, at value (Note 1): | |
| Unaffiliated issuers (identified cost $1,687,711,272) | $1,800,889,786 |
| Affiliated issuers (identified cost $141,049,783) (Notes 1 and 6) | 141,049,783 |
|
| Interest and other receivables | 9,790,223 |
|
| Receivable for shares of the fund sold | 2,690,843 |
|
| Receivable for investments sold | 102,759,901 |
|
| Receivable for sales of delayed delivery securities (Note 1) | 275,723,630 |
|
| Unrealized appreciation on swap contracts (Note 1) | 10,807,062 |
|
| Receivable for variation margin (Note 1) | 1,156,531 |
|
| Premium paid on swap contracts (Note 1) | 12,423,309 |
|
| Total assets | 2,357,291,068 |
| |
| LIABILITIES | |
|
| Payable to custodian | 3,523,144 |
|
| Payable for investments purchased | 104,733,431 |
|
| Payable for purchases of delayed delivery securities (Note 1) | 593,771,109 |
|
| Payable for shares of the fund repurchased | 3,661,098 |
|
| Payable for compensation of Manager (Note 2) | 490,151 |
|
| Payable for investor servicing fees (Note 2) | 180,620 |
|
| Payable for custodian fees (Note 2) | 32,833 |
|
| Payable for Trustee compensation and expenses (Note 2) | 337,589 |
|
| Payable for administrative services (Note 2) | 2,792 |
|
| Payable for distribution fees (Note 2) | 428,308 |
|
| Written options outstanding, at value (premiums $1,529,066) (Notes 1 and 3) | 1,372,108 |
|
| Premium received on swap contracts (Note 1) | 10,521,076 |
|
| Unrealized depreciation on swap contracts (Note 1) | 11,329,077 |
|
| TBA sale commitments, at value (proceeds receivable $186,552,578) (Note 1) | 186,503,278 |
|
| Collateral on certain derivative contracts, at value (Note 1) | 3,670,736 |
|
| Other accrued expenses | 297,088 |
|
| Total liabilities | 920,854,438 |
| | |
| Net assets | $1,436,436,630 |
|
| |
| REPRESENTED BY | |
|
| Paid-in capital (Unlimited shares authorized) (Notes 1 and 4) | $1,527,261,454 |
|
| Undistributed net investment income (Note 1) | 6,088,116 |
|
| Accumulated net realized loss on investments (Note 1) | (209,537,413) |
|
| Net unrealized appreciation of investments | 112,624,473 |
|
| Total — Representing net assets applicable to capital shares outstanding | $1,436,436,630 |
(Continued on next page)
Statement of assets and liabilities (Continued)
| |
| COMPUTATION OF NET ASSET VALUE AND OFFERING PRICE | |
|
| Net asset value and redemption price per class A share | |
| ($878,866,392 divided by 120,939,883 shares) | $7.27 |
|
| Offering price per class A share (100/96.00 of $7.27)* | $7.57 |
|
| Net asset value and offering price per class B share ($41,214,580 divided by 5,723,450 shares)** | $7.20 |
|
| Net asset value and offering price per class C share ($166,406,628 divided by 23,053,690 shares)** | $7.22 |
|
| Net asset value and redemption price per class M share | |
| ($151,112,829 divided by 21,221,276 shares) | $7.12 |
|
| Offering price per class M share (100/96.75 of $7.12)† | $7.36 |
|
| Net asset value, offering price and redemption price per class R share | |
| ($5,265,307 divided by 728,513 shares) | $7.23 |
|
| Net asset value, offering price and redemption price per class R5 share | |
| ($10,446 divided by 1,420 shares)†† | $7.35 |
|
| Net asset value, offering price and redemption price per class R6 share | |
| ($10,447 divided by 1,420 shares) | $7.36 |
|
| Net asset value, offering price and redemption price per class Y share | |
| ($193,550,001 divided by 26,313,835 shares) | $7.36 |
|
* On single retail sales of less than $100,000. On sales of $100,000 or more the offering price is reduced.
** Redemption price per share is equal to net asset value less any applicable contingent deferred sales charge.
† On single retail sales of less than $50,000. On sales of $50,000 or more the offering price is reduced.
†† Net asset value may not recalculate due to rounding of fractional shares.
The accompanying notes are an integral part of these financial statements.
Statement of operations Year ended 10/31/12
| |
| INVESTMENT INCOME | |
|
| Interest (net of foreign tax of $40,457) (including interest income of $253,882 from investments | |
| in affiliated issuers) (Note 6) | $53,668,406 |
|
| Total investment income | 53,668,406 |
| |
| EXPENSES | |
|
| Compensation of Manager (Note 2) | 5,608,363 |
|
| Investor servicing fees (Note 2) | 2,049,795 |
|
| Custodian fees (Note 2) | 78,126 |
|
| Trustee compensation and expenses (Note 2) | 122,896 |
|
| Administrative services (Note 2) | 42,157 |
|
| Distribution fees (Note 2) | 5,031,437 |
|
| Other | 575,184 |
|
| Total expenses | 13,507,958 |
| | |
| Expense reduction (Note 2) | (2,806) |
|
| Net expenses | 13,505,152 |
| | |
| Net investment income | 40,163,254 |
|
| |
| Net realized loss on investments (Notes 1 and 3) | (1,484,872) |
|
| Net realized loss on swap contracts (Note 1) | (38,156,213) |
|
| Net realized gain on futures contracts (Note 1) | 22,123,189 |
|
| Net realized loss on written options (Notes 1 and 3) | (11,129,194) |
|
| Net unrealized appreciation of investments, futures contracts, swap contracts, written options, | |
| and TBA sale commitments during the year | 114,096,560 |
|
| Net gain on investments | 85,449,470 |
| | |
| Net increase in net assets resulting from operations | $125,612,724 |
|
The accompanying notes are an integral part of these financial statements.
Statement of changes in net assets
| | |
| INCREASE (DECREASE) IN NET ASSETS | Year ended 10/31/12 | Year ended 10/31/11 |
|
| Operations: | | |
| Net investment income | $40,163,254 | $53,058,709 |
|
| Net realized gain (loss) on investments | (28,647,090) | 13,122,104 |
|
| Net unrealized appreciation (depreciation) of investments | 114,096,560 | (4,199,417) |
|
| Net increase in net assets resulting from operations | 125,612,724 | 61,981,396 |
|
| Distributions to shareholders (Note 1): | | |
| From ordinary income | | |
| Net investment income | | |
|
| Class A | (26,043,813) | (42,249,610) |
|
| Class B | (954,906) | (1,773,181) |
|
| Class C | (3,948,093) | (7,304,305) |
|
| Class M | (4,646,629) | (10,221,649) |
|
| Class R | (143,597) | (209,934) |
|
| Class R5 | (100) | — |
|
| Class R6 | (100) | — |
|
| Class Y | (5,026,699) | (6,319,275) |
|
| Increase in capital from settlement payments (Note 9) | — | 433,895 |
|
| Decrease from capital share transactions (Note 4) | (8,602,096) | (72,913,778) |
|
| Total increase (decrease) in net assets | 76,246,691 | (78,576,441) |
| |
| NET ASSETS | | |
|
| Beginning of year | 1,360,189,939 | 1,438,766,380 |
|
| End of year (including undistributed net investment income | | |
| of $6,088,116 and $5,017,584, respectively) | $1,436,436,630 | $1,360,189,939 |
|
The accompanying notes are an integral part of these financial statements.
Financial highlights (For a common share outstanding throughout the period)
| | | | | | | | | | | | | | | |
| INVESTMENT OPERATIONS: | | LESS DISTRIBUTIONS: | | | RATIOS AND SUPPLEMENTAL DATA: | |
|
| | | | | | | | | | | | | | Ratio | | |
| | | | | | | | | | | | | | of expenses | | |
| | | | | | | | | | | | | | to average | Ratio | |
| | Net asset | | Net realized | | | | | | | | | Ratio | net assets, | of net investment | |
| | value, | | and unrealized | Total from | From | | | Non-recurring | | Total return | Net assets, | of expenses | excluding | income (loss) | |
| | beginning | Net investment | gain (loss) | investment | net investment | Total | Redemption | reimburse- | Net asset value, | at net asset | end of period | to average | interest expense | to average | Portfolio |
| Period ended | of period | income (loss) a | on investments | operations | income | distributions | fees | ments | end of period | value (%) b | (in thousands) | net assets (%) c | (%) c | net assets (%) | turnover (%) d |
|
| Class A | | | | | | | | | | | | | | | |
| October 31, 2012 | $6.84 | .21 | .43 | .64 | (.21) | (.21) | — | — | $7.27 | 9.59 | $878,866 | .86 | .86 | 3.02 | 204 |
| October 31, 2011 | 6.86 | .28 | .05 | .33 | (.35) | (.35) | — | — e,f | 6.84 | 4.95 | 843,019 | .86 | .86 | 4.02 | 339 |
| October 31, 2010 | 6.61 | .43 | .31 | .74 | (.49) | (.49) | — f | — f,g | 6.86 | 11.45 | 855,659 | .88 h,i | .88 h,i | 6.38 h | 112 |
| October 31, 2009 | 5.35 | .29 | 1.44 | 1.73 | (.47) | (.47) | — f | — | 6.61 | 34.44 | 667,144 | 1.68 h,j | .96 h | 5.12 h | 331 |
| October 31, 2008 | 6.77 | .38 | (1.34) | (.96) | (.46) | (.46) | — f | — | 5.35 | (15.13) | 537,220 | .99 h | .99 h | 5.91 h | 200 |
|
| Class B | | | | | | | | | | | | | | | |
| October 31, 2012 | $6.78 | .16 | .42 | .58 | (.16) | (.16) | — | — | $7.20 | 8.75 | $41,215 | 1.61 | 1.61 | 2.27 | 204 |
| October 31, 2011 | 6.80 | .22 | .06 | .28 | (.30) | (.30) | — | — e,f | 6.78 | 4.22 | 39,859 | 1.61 | 1.61 | 3.29 | 339 |
| October 31, 2010 | 6.56 | .39 | .28 | .67 | (.43) | (.43) | — f | — f,g | 6.80 | 10.54 | 43,205 | 1.63 h,i | 1.63 h,i | 5.82 h | 112 |
| October 31, 2009 | 5.32 | .24 | 1.43 | 1.67 | (.43) | (.43) | — f | — | 6.56 | 33.21 | 45,772 | 2.43 h,j | 1.71 h | 4.31 h | 331 |
| October 31, 2008 | 6.72 | .34 | (1.33) | (.99) | (.41) | (.41) | — f | — | 5.32 | (15.58) | 57,171 | 1.74 h | 1.74 h | 5.22 h | 200 |
|
| Class C | | | | | | | | | | | | | | | |
| October 31, 2012 | $6.80 | .16 | .42 | .58 | (.16) | (.16) | — | — | $7.22 | 8.72 | $166,407 | 1.61 | 1.61 | 2.27 | 204 |
| October 31, 2011 | 6.82 | .22 | .06 | .28 | (.30) | (.30) | — | — e,f | 6.80 | 4.21 | 169,692 | 1.61 | 1.61 | 3.27 | 339 |
| October 31, 2010 | 6.58 | .35 | .33 | .68 | (.44) | (.44) | — f | — f,g | 6.82 | 10.57 | 167,237 | 1.63 h,i | 1.63 h,i | 5.08 h | 112 |
| October 31, 2009 | 5.33 | .26 | 1.42 | 1.68 | (.43) | (.43) | — f | — | 6.58 | 33.40 | 43,310 | 2.43 h,j | 1.71 h | 4.45 h | 331 |
| October 31, 2008 | 6.74 | .33 | (1.33) | (1.00) | (.41) | (.41) | — f | — | 5.33 | (15.67) | 16,414 | 1.74 h | 1.74 h | 5.16 h | 200 |
|
| Class M | | | | | | | | | | | | | | | |
| October 31, 2012 | $6.71 | .19 | .42 | .61 | (.20) | (.20) | — | — | $7.12 | 9.27 | $151,113 | 1.11 | 1.11 | 2.77 | 204 |
| October 31, 2011 | 6.74 | .26 | .05 | .31 | (.34) | (.34) | — | — e,f | 6.71 | 4.66 | 170,347 | 1.11 | 1.11 | 3.82 | 339 |
| October 31, 2010 | 6.50 | .42 | .29 | .71 | (.47) | (.47) | — f | — f,g | 6.74 | 11.28 | 222,916 | 1.13 h,i | 1.13 h,i | 6.23 h | 112 |
| October 31, 2009 | 5.28 | .27 | 1.41 | 1.68 | (.46) | (.46) | — f | — | 6.50 | 33.82 | 194,199 | 1.93 h,j | 1.21 h | 4.83 h | 331 |
| October 31, 2008 | 6.68 | .36 | (1.31) | (.95) | (.45) | (.45) | — f | — | 5.28 | (15.19) | 167,743 | 1.24 h | 1.24 h | 5.67 h | 200 |
|
| Class R | | | | | | | | | | | | | | | |
| October 31, 2012 | $6.81 | .19 | .43 | .62 | (.20) | (.20) | — | — | $7.23 | 9.26 | $5,265 | 1.11 | 1.11 | 2.77 | 204 |
| October 31, 2011 | 6.83 | .25 | .07 | .32 | (.34) | (.34) | — | — e,f | 6.81 | 4.74 | 4,723 | 1.11 | 1.11 | 3.74 | 339 |
| October 31, 2010 | 6.59 | .40 | .31 | .71 | (.47) | (.47) | — f | — f,g | 6.83 | 11.10 | 4,068 | 1.13 h,i | 1.13 h,i | 5.91 h | 112 |
| October 31, 2009 | 5.34 | .27 | 1.44 | 1.71 | (.46) | (.46) | — f | — | 6.59 | 34.02 | 2,353 | 1.93 h,j | 1.21 h | 4.85 h | 331 |
| October 31, 2008 | 6.76 | .36 | (1.33) | (.97) | (.45) | (.45) | — f | — | 5.34 | (15.30) | 1,448 | 1.24 h | 1.24 h | 5.54 h | 200 |
|
| Class R5 | | | | | | | | | | | | | | | |
| October 31, 2012† | $7.11 | .08 | .23 | .31 | (.07) | (.07) | — | — | $7.35 | 4.39 * | $10 | .19 * | .19 * | 1.12 * | 204 |
|
| Class R6 | | | | | | | | | | | | | | | |
| October 31, 2012† | $7.11 | .08 | .24 | .32 | (.07) | (.07) | — | — | $7.36 | 4.54 * | $10 | .17 * | .17* | 1.14 * | 204 |
|
| Class Y | | | | | | | | | | | | | | | |
| October 31, 2012 | $6.91 | .23 | .45 | .68 | (.23) | (.23) | — | — | $7.36 | 10.00 | $193,550 | .61 | .61 | 3.26 | 204 |
| October 31, 2011 | 6.93 | .29 | .06 | .35 | (.37) | (.37) | — | — e,f | 6.91 | 5.12 | 132,550 | .61 | .61 | 4.25 | 339 |
| October 31, 2010 | 6.67 | .46 | .30 | .76 | (.50) | (.50) | — f | — f,g | 6.93 | 11.73 | 145,681 | .63 h,i | .63 h,i | 6.74 h | 112 |
| October 31, 2009 | 5.40 | .32 | 1.43 | 1.75 | (.48) | (.48) | — f | — | 6.67 | 34.59 | 227,134 | 1.43 h,j | .71 h | 5.87 h | 331 |
| October 31, 2008 | 6.82 | .40 | (1.35) | (.95) | (.47) | (.47) | — f | — | 5.40 | (14.85) | 790,264 | .74 h | .74 h | 6.14 h | 200 |
|
See notes to financial highlights at the end of this section.
The accompanying notes are an integral part of these financial statements.
| | | |
| 58 | Income Fund | Income Fund | 59 |
Financial highlights (Continued)
* Not annualized.
† For the period July 3, 2012 (commencement of operations) to October 31, 2012.
a Per share net investment income has been determined on the basis of the weighted average number of shares outstanding during the period.
b Total return assumes dividend reinvestment and does not reflect the effect of sales charges.
c Includes amounts paid through expense offset arrangements (Note 2).
d Portfolio turnover excludes TBA purchase and sale transactions.
e Reflects a non-recurring reimbursement related to restitution amounts in connection with a distribution plan approved by the Securities and Exchange Commission (the SEC) which amounted to less than $0.01 per share outstanding on July 21, 2011. Also reflects a non-recurring reimbursement related to short-term trading related lawsuits, which amounted to less than $0.01 per share outstanding on May 11, 2011 (Note 9).
f Amount represents less than $0.01 per share.
g Reflects a non-recurring reimbursement pursuant to a settlement between the SEC and Prudential Securities, Inc., which amounted to less than $0.01 per share outstanding as of March 30, 2010.
h Reflects an involuntary contractual expense limitation in effect during the period. For periods prior to October 31, 2009, certain fund expenses were waived in connection with the fund’s investment in Putnam Prime Money Market Fund. As a result of such limitation and/or waivers, the expenses of each class reflect a reduction of the following amounts:
| |
| | Percentage of |
| | average net assets |
|
| October 31, 2010 | 0.03% |
|
| October 31, 2009 | 0.19 |
|
| October 31, 2008 | 0.09 |
|
i Excludes the impact of a current period reduction to interest expense related to the resolution of certain terminated derivatives contracts, which amounted to 0.18% of average net assets for the period ended October 31, 2010.
j Includes interest accrued in connection with certain terminated derivatives contracts, which amounted to 0.72% of average net assets for the period ended October 31, 2009.
The accompanying notes are an integral part of these financial statements.
Notes to financial statements 10/31/12
Within the following Notes to financial statements, references to “State Street” represent State Street Bank and Trust Company, references to “the SEC” represent the Securities and Exchange Commission and references to “Putnam Management” represent Putnam Investment Management, LLC, the fund’s manager, an indirect wholly-owned subsidiary of Putnam Investments, LLC. Unless otherwise noted, the “reporting period” represents the period from November 1, 2011 through October 31, 2012.
Putnam Income Fund (the fund) is a Massachusetts business trust, which is registered under the Investment Company Act of 1940, as amended, as a diversified open-end management investment company. The fund seeks high current income with what Putnam Management believes to be prudent risk. The fund invests mainly in bonds that are securitized debt instruments (such as mortgage-backed investments) and other obligations of companies and governments worldwide denominated in U.S. dollars, are either investment-grade or below investment-grade (sometimes referred to as “junk bonds”) and have intermediate- to long-term maturities (three years or longer).
The fund offers class A, class B, class C, class M, class R, class R5, class R6 and class Y shares. The fund began offering class R5 and class R6 shares on July 2, 2012. Class A and class M shares are sold with a maximum front-end sales charge of 4.00% and 3.25%, respectively, and generally do not pay a contingent deferred sales charge. Class B shares, which convert to class A shares after approximately eight years, do not pay a front-end sales charge and are subject to a contingent deferred sales charge if those shares are redeemed within six years of purchase. Class C shares have a one-year 1.00% contingent deferred sales charge and do not convert to class A shares. Class R shares, which are not available to all investors, are sold at net asset value. The expenses for class A, class B, class C, class M and class R shares may differ based on the distribution fee of each class, which is identified in Note 2. Class R5, class R6 and class Y shares, which are sold at net asset value, are generally subject to the same expenses as class A, class B, class C, class M and class R shares, but do not bear a distribution fee and in the case of class R5 and class R6 shares, bear a lower investor servicing fee, which is identified in Note 2. Class R5, class R6 and class Y shares are not available to all investors.
In the normal course of business, the fund enters into contracts that may include agreements to indemnify another party under given circumstances. The fund’s maximum exposure under these arrangements is unknown as this would involve future claims that may be, but have not yet been, made against the fund. However, the fund’s management team expects the risk of material loss to be remote.
Note 1: Significant accounting policies
The following is a summary of significant accounting policies consistently followed by the fund in the preparation of its financial statements. The preparation of financial statements is in conformity with accounting principles generally accepted in the United States of America and requires management to make estimates and assumptions that affect the reported amounts of assets and liabilities in the financial statements and the reported amounts of increases and decreases in net assets from operations. Actual results could differ from those estimates. Subsequent events after the Statement of assets and liabilities date through the date that the financial statements were issued have been evaluated in the preparation of the financial statements.
Investment income, realized and unrealized gains and losses and expenses of the fund are borne pro-rata based on the relative net assets of each class to the total net assets of the fund, except that each class bears expenses unique to that class (including the distribution fees applicable to such classes). Each class votes as a class only with respect to its own distribution plan or other matters on which a class vote is required by law or determined by the Trustees. If the fund were liquidated, shares of each class would receive their pro-rata share of the net assets of the fund. In addition, the Trustees declare separate dividends on each class of shares.
Security valuation Market quotations are not considered to be readily available for certain debt obligations and other investments; such investments are valued on the basis of valuations furnished by an independent pricing service approved by the Trustees or dealers selected by Putnam Management. Such services or dealers determine valuations for normal institutional-size trading units of such securities using methods based on market transactions for comparable securities and various relationships, generally recognized by institutional traders, between securities (which consider such factors as security prices, yields, maturities and ratings). These securities will generally be categorized as Level 2. Securities quoted in foreign currencies, if any, are translated into U.S. dollars at the current exchange rate.
Investments in other open-end investment companies (excluding exchange traded funds), which are classified as Level 1 securities, are based on their net asset value. The net asset value of an investment company equals the total
value of its assets less its liabilities and divided by the number of its outstanding shares. Shares are only valued as of the close of regular trading on the New York Stock Exchange each day that the exchange is open.
To the extent a pricing service or dealer is unable to value a security or provides a valuation that Putnam Management does not believe accurately reflects the security’s fair value, the security will be valued at fair value by Putnam Management. Certain investments, including certain restricted and illiquid securities and derivatives, are also valued at fair value following procedures approved by the Trustees. These valuations consider such factors as significant market or specific security events such as interest rate or credit quality changes, various relationships with other securities, discount rates, U.S. Treasury, U.S. swap and credit yields, index levels, convexity exposures and recovery rates. These securities are classified as Level 2 or as Level 3 depending on the priority of the significant inputs.
Such valuations and procedures are reviewed periodically by the Trustees. Certain securities may be valued on the basis of a price provided by a single source. The fair value of securities is generally determined as the amount that the fund could reasonably expect to realize from an orderly disposition of such securities over a reasonable period of time. By its nature, a fair value price is a good faith estimate of the value of a security in a current sale and does not reflect an actual market price, which may be different by a material amount.
Security transactions and related investment income Security transactions are recorded on the trade date (the date the order to buy or sell is executed). Gains or losses on securities sold are determined on the identified cost basis. Interest income, net of any applicable withholding taxes, is recorded on the accrual basis. All premiums/discounts are amortized/accreted on a yield-to-maturity basis.
Securities purchased or sold on a forward commitment or delayed delivery basis may be settled a month or more after the trade date; interest income is accrued based on the terms of the securities. Losses may arise due to changes in the market value of the underlying securities or if the counterparty does not perform under the contract.
The fund earned certain fees in connection with its senior loan purchasing activities. These fees are treated as market discount and are amortized into income in the Statement of operations.
Stripped securities The fund may invest in stripped securities which represent a participation in securities that may be structured in classes with rights to receive different portions of the interest and principal. Interest-only securities receive all of the interest and principal-only securities receive all of the principal. If the interest-only securities experience greater than anticipated prepayments of principal, the fund may fail to recoup fully its initial investment in these securities. Conversely, principal-only securities increase in value if prepayments are greater than anticipated and decline if prepayments are slower than anticipated. The market value of these securities is highly sensitive to changes in interest rates.
Options contracts The fund uses options contracts to hedge duration and convexity and to isolate prepayment risk.
The potential risk to the fund is that the change in value of options contracts may not correspond to the change in value of the hedged instruments. In addition, losses may arise from changes in the value of the underlying instruments if there is an illiquid secondary market for the contracts, if interest or exchange rates move unexpectedly or if the counterparty to the contract is unable to perform. Realized gains and losses on purchased options are included in realized gains and losses on investment securities. If a written call option is exercised, the premium originally received is recorded as an addition to sales proceeds. If a written put option is exercised, the premium originally received is recorded as a reduction to the cost of investments.
Exchange traded options are valued at the last sale price or, if no sales are reported, the last bid price for purchased options and the last ask price for written options. Options traded over-the-counter are valued using prices supplied by dealers. Certain options contracts include premiums that do not settle until the expiration date of the contract.
Written option contracts outstanding at period end, if any, are listed after the fund’s portfolio. See Note 3 for the volume of written options contracts activity for the reporting period. The fund had an average contract amount of approximately $2,075,900,000 on purchased options contracts for the reporting period.
Futures contracts The fund uses futures contracts to hedge interest rate risk and to gain exposure to interest rates.
The potential risk to the fund is that the change in value of futures contracts may not correspond to the change in value of the hedged instruments. In addition, losses may arise from changes in the value of the underlying instruments if there is an illiquid secondary market for the contracts, if interest or exchange rates move unexpectedly or if the counterparty to the contract is unable to perform. With futures, there is minimal counterparty credit risk to the fund since futures are exchange traded and the exchange’s clearinghouse, as counterparty to all exchange traded futures, guarantees the futures against default. Risks may exceed amounts recognized on the Statement of assets
and liabilities. When the contract is closed, the fund records a realized gain or loss equal to the difference between the value of the contract at the time it was opened and the value at the time it was closed.
Futures contracts are valued at the quoted daily settlement prices established by the exchange on which they trade. The fund and the broker agree to exchange an amount of cash equal to the daily fluctuation in the value of the futures contract. Such receipts or payments are known as “variation margin.”
Futures contracts outstanding at period end, if any, are listed after the fund’s portfolio. The fund had an average of approximately 2,500 futures contracts outstanding for the reporting period.
Total return swap contracts The fund entered into total return swap contracts, which are arrangements to exchange a market linked return for a periodic payment, both based on a notional principal amount, to hedge sector exposure, to manage exposure to specific sectors or industries, to gain exposure to specific sectors or industries, to gain exposure to rates of inflation in specific regions or countries and to hedge inflation in specific regions or countries.
To the extent that the total return of the security, index or other financial measure underlying the transaction exceeds or falls short of the offsetting interest rate obligation, the fund will receive a payment from or make a payment to the counterparty. Total return swap contracts are marked to market daily based upon quotations from an independent pricing service or market makers and the change, if any, is recorded as an unrealized gain or loss. Payments received or made are recorded as realized gains or losses. Certain total return swap contracts may include extended effective dates. Payments related to these swap contracts are accrued based on the terms of the contract. The fund could be exposed to credit or market risk due to unfavorable changes in the fluctuation of interest rates or in the price of the underlying security or index, the possibility that there is no liquid market for these agreements or that the counterparty may default on its obligation to perform. The fund’s maximum risk of loss from counterparty risk is the fair value of the contract. This risk may be mitigated by having a master netting arrangement between the fund and the counterparty. Risk of loss may exceed amounts recognized on the Statement of assets and liabilities.
Total return swap contracts outstanding at period end, if any, are listed after the fund’s portfolio. Outstanding notional amount on total return swap contracts at the close of the reporting period are indicative of the volume of activity during the reporting period.
Interest rate swap contracts The fund entered into interest rate swap contracts, which are arrangements between two parties to exchange cash flows based on a notional principal amount, to hedge interest rate risk and to gain exposure on interest rates.
An interest rate swap can be purchased or sold with an upfront premium. An upfront payment received by the fund is recorded as a liability on the fund’s books. An upfront payment made by the fund is recorded as an asset on the fund’s books. Upfront payments are recorded as realized gains and losses at the closing of the contract. Interest rate swap contracts are marked to market daily based upon quotations from an independent pricing service or market makers and the change, if any, is recorded as an unrealized gain or loss. Payments received or made are recorded as realized gains or losses. Certain interest rate swap contracts may include extended effective dates. Payments related to these swap contracts are accrued based on the terms of the contract. The fund could be exposed to credit or market risk due to unfavorable changes in the fluctuation of interest rates or if the counterparty defaults on its obligation to perform. The fund’s maximum risk of loss from counterparty risk is the fair value of the contract. This risk may be mitigated by having a master netting arrangement between the fund and the counterparty. Risk of loss may exceed amounts recognized on the Statement of assets and liabilities.
Interest rate swap contracts outstanding at period end, if any, are listed after the fund’s portfolio. The fund had an average notional amount of approximately $4,282,900,000 on interest rate swap contracts for the reporting period.
Master agreements The fund is a party to ISDA (International Swaps and Derivatives Association, Inc.) Master Agreements (Master Agreements) with certain counterparties that govern over-the-counter derivative and foreign exchange contracts entered into from time to time. The Master Agreements may contain provisions regarding, among other things, the parties’ general obligations, representations, agreements, collateral requirements, events of default and early termination. With respect to certain counterparties, in accordance with the terms of the Master Agreements, collateral posted to the fund is held in a segregated account by the fund’s custodian and with respect to those amounts which can be sold or repledged, are presented in the fund’s portfolio. Collateral posted to the fund which cannot be sold or repledged totaled $2,131,208 at the close of the reporting period.
Collateral pledged by the fund is segregated by the fund’s custodian and identified in the fund’s portfolio. Collateral can be in the form of cash or debt securities issued by the U.S. Government or related agencies or other securities
as agreed to by the fund and the applicable counterparty. Collateral requirements are determined based on the fund’s net position with each counterparty.
Termination events applicable to the fund may occur upon a decline in the fund’s net assets below a specified threshold over a certain period of time. Termination events applicable to counterparties may occur upon a decline in the counterparty’s long-term and short-term credit ratings below a specified level. In each case, upon occurrence, the other party may elect to terminate early and cause settlement of all derivative and foreign exchange contracts outstanding, including the payment of any losses and costs resulting from such early termination, as reasonably determined by the terminating party. Any decision by one or more of the fund’s counterparties to elect early termination could impact the fund’s future derivative activity.
At the close of the reporting period, the fund had a net liability position of $987,360 on open derivative contracts subject to the Master Agreements. There was no collateral posted by the fund.
TBA purchase commitments The fund may enter into TBA (to be announced) commitments to purchase securities for a fixed unit price at a future date beyond customary settlement time. Although the unit price has been established, the principal value has not been finalized. However, it is anticipated that the amount of the commitments will not significantly differ from the principal amount. The fund holds, and maintains until settlement date, cash or high-grade debt obligations in an amount sufficient to meet the purchase price, or the fund may enter into offsetting contracts for the forward sale of other securities it owns. Income on the securities will not be earned until settlement date. TBA purchase commitments may be considered securities themselves, and involve a risk of loss if the value of the security to be purchased declines prior to the settlement date, which risk is in addition to the risk of decline in the value of the fund’s other assets. Unsettled TBA purchase commitments are valued at fair value of the underlying securities, according to the procedures described under “Security valuation” above. The contract is marked to market daily and the change in market value is recorded by the fund as an unrealized gain or loss.
Although the fund will generally enter into TBA purchase commitments with the intention of acquiring securities for its portfolio or for delivery pursuant to options contracts it has entered into, the fund may dispose of a commitment prior to settlement if Putnam Management deems it appropriate to do so.
TBA sale commitments The fund may enter into TBA sale commitments to hedge its portfolio positions or to sell mortgage-backed securities it owns under delayed delivery arrangements. Proceeds of TBA sale commitments are not received until the contractual settlement date. During the time a TBA sale commitment is outstanding, equivalent deliverable securities, or an offsetting TBA purchase commitment deliverable on or before the sale commitment date, are held as “cover” for the transaction.
Unsettled TBA sale commitments are valued at the fair value of the underlying securities, generally according to the procedures described under “Security valuation” above. The contract is marked to market daily and the change in market value is recorded by the fund as an unrealized gain or loss. If the TBA sale commitment is closed through the acquisition of an offsetting TBA purchase commitment, the fund realizes a gain or loss. If the fund delivers securities under the commitment, the fund realizes a gain or a loss from the sale of the securities based upon the unit price established at the date the commitment was entered into. TBA sale commitments outstanding at period end, if any, are listed after the fund’s portfolio.
Interfund lending The fund, along with other Putnam funds, may participate in an interfund lending program pursuant to an exemptive order issued by the SEC. This program allows the fund to borrow from or lend to other Putnam funds that permit such transactions. Interfund lending transactions are subject to each fund’s investment policies and borrowing and lending limits. Interest earned or paid on the interfund lending transaction will be based on the average of certain current market rates. During the reporting period, the fund did not utilize the program.
Line of credit The fund participates, along with other Putnam funds, in a $315 million unsecured committed line of credit and a $185 million unsecured uncommitted line of credit, both provided by State Street. Borrowings may be made for temporary or emergency purposes, including the funding of shareholder redemption requests and trade settlements. Interest is charged to the fund based on the fund’s borrowing at a rate equal to the Federal Funds rate plus 1.25% for the committed line of credit and the Federal Funds rate plus 1.30% for the uncommitted line of credit. A closing fee equal to 0.02% of the committed line of credit and $50,000 for the uncommitted line of credit has been paid by the participating funds. In addition, a commitment fee of 0.11% per annum on any unutilized portion of the committed line of credit is allocated to the participating funds based on their relative net assets and paid quarterly. During the reporting period, the fund had no borrowings against these arrangements.
Federal taxes It is the policy of the fund to distribute all of its taxable income within the prescribed time period and otherwise comply with the provisions of the Internal Revenue Code of 1986, as amended (the Code), applicable
to regulated investment companies. It is also the intention of the fund to distribute an amount sufficient to avoid imposition of any excise tax under Section 4982 of the Code.
The fund is subject to the provisions of Accounting Standards Codification ASC 740 Income Taxes (ASC 740). ASC 740 sets forth a minimum threshold for financial statement recognition of the benefit of a tax position taken or expected to be taken in a tax return. The fund did not have a liability to record for any unrecognized tax benefits in the accompanying financial statements. No provision has been made for federal taxes on income, capital gains or unrealized appreciation on securities held nor for excise tax on income and capital gains. Each of the fund’s federal tax returns for the prior three fiscal years remains subject to examination by the Internal Revenue Service.
At October 31, 2012, the fund had a capital loss carryover of $194,801,386 available to the extent allowed by the Code to offset future net capital gain, if any. The amounts of the carryovers and the expiration dates are:
| | | |
| Loss carryover |
|
| Short-term | Long-term | Total | Expiration |
|
| $16,899,346 | $21,706,087 | $38,605,433 | * |
|
| 92,884,454 | N/A | 92,884,454 | October 31, 2016 |
|
| 63,311,499 | N/A | 63,311,499 | October 31, 2017 |
|
* Under the Regulated Investment Company Modernization Act of 2010, the fund will be permitted to carry forward capital losses incurred in taxable years beginning after December 22, 2010 for an unlimited period. However, any losses incurred during those future years will be required to be utilized prior to the losses incurred in pre-enactment tax years. As a result of this ordering rule, pre-enactment capital loss carryforwards may be more likely to expire unused. Additionally, post-enactment capital losses that are carried forward will retain their character as either short-term or long-term capital losses rather than being considered all short-term as under previous law.
Distributions to shareholders Distributions to shareholders from net investment income are recorded by the fund on the ex-dividend date. Distributions from capital gains, if any, are recorded on the ex-dividend date and paid at least annually. The amount and character of income and gains to be distributed are determined in accordance with income tax regulations, which may differ from generally accepted accounting principles. These differences include temporary and/or permanent differences of income on swap contracts and interest only securities. Reclassifications are made to the fund’s capital accounts to reflect income and gains available for distribution (or available capital loss carryovers) under income tax regulations. For the reporting period ended, the fund reclassified $1,671,215 to increase undistributed net investment income and $1,671,215 to increase accumulated net realized losses.
The tax basis components of distributable earnings and the federal tax cost as of the close of the reporting period were as follows:
| |
| Unrealized appreciation | $105,132,641 |
| Unrealized depreciation | (6,977,078) |
|
| Net unrealized appreciation | 98,155,563 |
| Undistributed ordinary income | 6,895,242 |
| Capital loss carryforward | (194,801,386) |
| Cost for federal income tax purposes | $1,843,784,006 |
Note 2: Management fee, administrative services and other transactions
The fund pays Putnam Management a management fee (based on the fund’s average net assets and computed and paid monthly) at annual rates that may vary based on the average of the aggregate net assets of most open-end funds, as defined in the fund’s management contract, sponsored by Putnam Management. Such annual rates may vary as follows:
| | | | |
| 0.550% | of the first $5 billion, | | 0.350% | of the next $50 billion, |
| |
|
| 0.500% | of the next $5 billion, | | 0.330% | of the next $50 billion, |
| |
|
| 0.450% | of the next $10 billion, | | 0.320% | of the next $100 billion and |
| |
|
| 0.400% | of the next $10 billion, | | 0.315% | of any excess thereafter. |
| |
|
Putnam Management has contractually agreed, through June 30, 2013, to waive fees or reimburse the fund’s expenses to the extent necessary to limit the cumulative expenses of the fund, exclusive of brokerage, interest,
taxes, investment-related expenses, extraordinary expenses, acquired fund fees and expenses and payments under the fund’s investor servicing contract, investment management contract and distribution plans, on a fiscal year-to-date basis to an annual rate of 0.20% of the fund’s average net assets over such fiscal year-to-date period. During the reporting period, the fund’s expenses were not reduced as a result of this limit.
Putnam Investments Limited (PIL), an affiliate of Putnam Management, is authorized by the Trustees to manage a separate portion of the assets of the fund as determined by Putnam Management from time to time. Putnam Management pays a quarterly sub-management fee to PIL for its services at an annual rate of 0.40% of the average net assets of the portion of the fund managed by PIL.
The fund reimburses Putnam Management an allocated amount for the compensation and related expenses of certain officers of the fund and their staff who provide administrative services to the fund. The aggregate amount of all such reimbursements is determined annually by the Trustees.
Custodial functions for the fund’s assets are provided by State Street. Custody fees are based on the fund’s asset level, the number of its security holdings and transaction volumes.
Putnam Investor Services, Inc., an affiliate of Putnam Management, provides investor servicing agent functions to the fund. Putnam Investor Services, Inc. received fees for investor servicing (except for Class R5 and R6 shares) based on the fund’s retail asset level, the number of shareholder accounts in the fund and the level of defined contribution plan assets in the fund. Class R5 shares pay a monthly fee based on the average net assets of class R5 shares at an annual rate of 0.12%. Class R6 shares pay a monthly fee based on the average net assets of class R6 shares at an annual rate of 0.05%. Investor servicing fees will not exceed an annual rate of 0.32% of the fund’s average net assets. Prior to March 1, 2012, investor servicing fees could not exceed an annual rate of 0.375% of the fund’s average net assets. During the reporting period, the class specific expenses related to investor servicing fees were as follows:
| | | | |
| Class A | $1,267,246 | | Class R5 | 4 |
| |
|
| Class B | 59,908 | | Class R6 | 2 |
| |
|
| Class C | 247,415 | | Class Y | 232,720 |
| |
|
| Class M | 235,068 | | Total | $2,049,795 |
| |
|
| Class R | 7,432 | | | |
| | | |
The fund has entered into expense offset arrangements with Putnam Investor Services, Inc. and State Street whereby Putnam Investor Services, Inc.’s and State Street’s fees are reduced by credits allowed on cash balances. For the reporting period, the fund’s expenses were reduced by $2,806 under the expense offset arrangements.
Each independent Trustee of the fund receives an annual Trustee fee, of which $1,119, as a quarterly retainer, has been allocated to the fund, and an additional fee for each Trustees meeting attended. Trustees also are reimbursed for expenses they incur relating to their services as Trustees.
The fund has adopted a Trustee Fee Deferral Plan (the Deferral Plan) which allows the Trustees to defer the receipt of all or a portion of Trustees fees payable on or after July 1, 1995. The deferred fees remain invested in certain Putnam funds until distribution in accordance with the Deferral Plan.
The fund has adopted an unfunded noncontributory defined benefit pension plan (the Pension Plan) covering all Trustees of the fund who have served as a Trustee for at least five years and were first elected prior to 2004. Benefits under the Pension Plan are equal to 50% of the Trustee’s average annual attendance and retainer fees for the three years ended December 31, 2005. The retirement benefit is payable during a Trustee’s lifetime, beginning the year following retirement, for the number of years of service through December 31, 2006. Pension expense for the fund is included in Trustee compensation and expenses in the Statement of operations. Accrued pension liability is included in Payable for Trustee compensation and expenses in the Statement of assets and liabilities. The Trustees have terminated the Pension Plan with respect to any Trustee first elected after 2003.
The fund has adopted distribution plans (the Plans) with respect to its class A, class B, class C, class M and class R shares pursuant to Rule 12b–1 under the Investment Company Act of 1940. The purpose of the Plans is to compensate Putnam Retail Management Limited Partnership, an indirect wholly-owned subsidiary of Putnam Investments, LLC, for services provided and expenses incurred in distributing shares of the fund. The Plans provide for payments by the fund to Putnam Retail Management Limited Partnership at an annual rate of up to 0.35%, 1.00%, 1.00%, 1.00% and 1.00% of the average net assets attributable to class A, class B, class C, class M and class R shares, respectively. The Trustees have approved payment by the fund at an annual rate of 0.25%, 1.00%, 1.00%, 0.50% and
0.50% of the average net assets attributable to class A, class B, class C, class M and class R shares, respectively. During the reporting period, the class specific expenses related to distribution fees were as follows:
| | | | |
| Class A | $2,139,203 | | Class M | 792,892 |
| |
|
| Class B | 404,512 | | Class R | 25,062 |
| |
|
| Class C | 1,669,768 | | Total | $5,031,437 |
| |
|
For the reporting period, Putnam Retail Management Limited Partnership, acting as underwriter, received net commissions of $110,700 and $13,013 from the sale of class A and class M shares, respectively, and received $32,495 and $7,212 in contingent deferred sales charges from redemptions of class B and class C shares, respectively.
A deferred sales charge of up to 1.00% and 0.40% is assessed on certain redemptions of class A and class M shares, respectively. For the reporting period, Putnam Retail Management Limited Partnership, acting as underwriter, received $3,408 and no monies on class A and class M redemptions, respectively.
Note 3: Purchases and sales of securities
During the reporting period, cost of purchases and proceeds from sales of investment securities other than short-term investments aggregated $2,268,429,858 and $2,035,148,665, respectively. These figures include the cost of purchases and proceeds from sales of long-term U.S. government securities of $5,972,188 and $5,971,484, respectively.
Written option transactions during the reporting period are summarized as follows:
| | |
| | Written swap option | Written swap option |
| | contract amounts | premiums |
|
| Written options outstanding at the | | |
| beginning of the reporting period | $2,343,944,374 | $125,397,305 |
|
| Options opened | 1,772,454,238 | 65,113,914 |
|
| Options exercised | (685,880,454) | (24,099,944) |
|
| Options expired | — | — |
|
| Options closed | (3,351,086,158) | (164,882,209) |
|
| Written options outstanding at the | | |
| end of the reporting period | $79,432,000 | $1,529,066 |
|
Note 4: Capital shares
At the close of the reporting period, there was an unlimited number of shares of beneficial interest authorized. Transactions in capital shares were as follows:
| | | | |
| | Year ended 10/31/12 | Year ended 10/31/11 |
|
| Class A | Shares | Amount | Shares | Amount |
|
| Shares sold | 27,350,698 | $189,503,530 | 31,938,569 | $218,790,518 |
|
| Shares issued in connection with | | | | |
| reinvestment of distributions | 3,272,191 | 22,639,769 | 5,196,313 | 35,449,398 |
|
| | 30,622,889 | 212,143,299 | 37,134,882 | 254,239,916 |
|
| Shares repurchased | (32,950,350) | (228,777,619) | (38,649,700) | (263,845,938) |
|
| Net decrease | (2,327,461) | $(16,634,320) | (1,514,818) | $(9,606,022) |
|
| | | | |
| | Year ended 10/31/12 | Year ended 10/31/11 |
|
| Class B | Shares | Amount | Shares | Amount |
|
| Shares sold | 1,388,528 | $9,538,158 | 2,105,943 | $14,318,416 |
|
| Shares issued in connection with | | | | |
| reinvestment of distributions | 108,522 | 744,380 | 208,992 | 1,412,938 |
|
| | 1,497,050 | 10,282,538 | 2,314,935 | 15,731,354 |
|
| Shares repurchased | (1,651,519) | (11,377,763) | (2,787,583) | (18,884,104) |
|
| Net decrease | (154,469) | $(1,095,225) | (472,648) | $(3,152,750) |
|
| |
| | Year ended 10/31/12 | Year ended 10/31/11 |
|
| Class C | Shares | Amount | Shares | Amount |
|
| Shares sold | 5,123,472 | $35,269,152 | 8,428,929 | $57,395,078 |
|
| Shares issued in connection with | | | | |
| reinvestment of distributions | 376,116 | 2,585,433 | 660,999 | 4,480,909 |
|
| | 5,499,588 | 37,854,585 | 9,089,928 | 61,875,987 |
|
| Shares repurchased | (7,411,220) | (51,136,287) | (8,652,088) | (58,620,817) |
|
| Net increase (decrease) | (1,911,632) | $(13,281,702) | 437,840 | $3,255,170 |
|
| |
| | Year ended 10/31/12 | Year ended 10/31/11 |
|
| Class M | Shares | Amount | Shares | Amount |
|
| Shares sold | 1,131,897 | $7,695,763 | 4,252,299 | $28,443,376 |
|
| Shares issued in connection with | | | | |
| reinvestment of distributions | 57,125 | 387,404 | 96,626 | 646,826 |
|
| | 1,189,022 | 8,083,167 | 4,348,925 | 29,090,202 |
|
| Shares repurchased | (5,356,881) | (36,496,132) | (12,052,732) | (80,978,751) |
|
| Net decrease | (4,167,859) | $(28,412,965) | (7,703,807) | $(51,888,549) |
|
| |
| | Year ended 10/31/12 | Year ended 10/31/11 |
|
| Class R | Shares | Amount | Shares | Amount |
|
| Shares sold | 372,015 | $2,551,886 | 308,145 | $2,097,773 |
|
| Shares issued in connection with | | | | |
| reinvestment of distributions | 18,450 | 127,087 | 24,597 | 167,075 |
|
| | 390,465 | 2,678,973 | 332,742 | 2,264,848 |
|
| Shares repurchased | (355,775) | (2,444,067) | (234,689) | (1,602,134) |
|
| Net increase | 34,690 | $234,906 | 98,053 | $662,714 |
|
| |
| | | | For the period 7/3/12 |
| | | (commencement of operations) to 10/31/12 |
|
| Class R5 | | Shares | Amount |
|
| Shares sold | | | 1,406 | $10,000 |
|
| Shares issued in connection with reinvestment of distributions | 14 | 100 |
|
| | | | 1,420 | 10,100 |
|
| Shares repurchased | | | — | — |
|
| Net increase | | | 1,420 | $10,100 |
|
| | | | |
| | | | For the period 7/3/12 |
| | | (commencement of operations) to 10/31/12 |
|
| Class R6 | | Shares | Amount |
|
| Shares sold | | | 1,406 | $10,000 |
|
| Shares issued in connection with reinvestment of distributions | 14 | 100 |
|
| | | | 1,420 | 10,100 |
|
| Shares repurchased | | | — | — |
|
| Net increase | | | 1,420 | $10,100 |
|
| |
| | Year ended 10/31/12 | Year ended 10/31/11 |
|
| Class Y | Shares | Amount | Shares | Amount |
|
| Shares sold | 20,514,428 | $144,552,458 | 19,234,583 | $133,635,790 |
|
| Shares issued in connection with | | | | |
| reinvestment of distributions | 533,133 | 3,744,348 | 554,836 | 3,832,111 |
|
| | 21,047,561 | 148,296,806 | 19,789,419 | 137,467,901 |
|
| Shares repurchased | (13,902,881) | (97,729,796) | (21,652,336) | (149,652,242) |
|
| Net increase (decrease) | 7,144,680 | $50,567,010 | (1,862,917) | $(12,184,341) |
|
At the close of the reporting period, Putnam Investments, LLC owned the following class shares of the fund:
| | | |
| | Shares owned | Percentage of ownership | Value |
|
| Class R5 | 1,420 | 100% | $10,446 |
|
| Class R6 | 1,420 | 100 | 10,447 |
|
Note 5: Summary of derivative activity
The following is a summary of the market values of derivative instruments as of the close of the reporting period:
Market values of derivative instruments as of the close of the reporting period
| | | | |
| | Asset derivatives | Liability derivatives |
|
| Derivatives not | | | | |
| accounted for as | Statement of | | Statement of | |
| hedging instruments | assets and | | assets and | |
| under ASC 815 | liabilities location | Market value | liabilities location | Market value |
|
| | Investments, | | | |
| | Receivables, Net | | Payables, Net | |
| | assets — Unrealized | | assets — Unrealized | |
| Interest rate contracts | appreciation | $11,837,818* | depreciation | $7,662,930* |
|
| Total | | $11,837,818 | | $7,662,930 |
|
* Includes cumulative appreciation/depreciation of futures contracts as reported in the fund’s portfolio. Only current day’s variation margin is reported within the Statement of assets and liabilities.
The following is a summary of realized and change in unrealized gains or losses of derivative instruments on the Statement of operations for the reporting period (see Note 1):
Amount of realized gain or (loss) on derivatives recognized in net gain or (loss) on investments
| | | | |
| Derivatives not accounted for | | | | |
| as hedging instruments under | | | | |
| ASC 815 | Options | Futures | Swaps | Total |
|
| Interest rate contracts | $(44,634,368) | $22,123,189 | $(38,156,213) | $(60,667,392) |
|
| Total | $(44,634,368) | $22,123,189 | $(38,156,213) | $(60,667,392) |
|
Change in unrealized appreciation or (depreciation) on derivatives recognized in net gain or (loss) on investments
| | | | |
| Derivatives not accounted for | | | | |
| as hedging instruments under | | | | |
| ASC 815 | Options | Futures | Swaps | Total |
|
| Interest rate contracts | $17,757,596 | $(1,521,659) | $30,397,359 | $46,633,296 |
|
| Total | $17,757,596 | $(1,521,659) | $30,397,359 | $46,633,296 |
|
Note 6: Transactions with affiliated issuer
Transactions during the reporting period with Putnam Money Market Liquidity Fund, which is under common ownership and control, were as follows:
| | | | | |
| | Market value at | | | | Market value |
| | the beginning | | | | at the end of |
| | of the reporting | | | Investment | the reporting |
| Name of affiliate | period | Purchase cost | Sale proceeds | income | period |
|
| Putnam Money Market | | | | | |
| Liquidity Fund* | $235,139,135 | $999,698,920 | $1,093,788,272 | $253,882 | $141,049,783 |
|
* Management fees charged to Putnam Money Market Liquidity Fund have been waived by Putnam Management.
Note 7: Senior loan commitments
Senior loans are purchased or sold on a when-issued or delayed delivery basis and may be settled a month or more after the trade date, which from time to time can delay the actual investment of available cash balances; interest income is accrued based on the terms of the securities. Senior loans can be acquired through an agent, by assignment from another holder of the loan, or as a participation interest in another holder’s portion of the loan. When the fund invests in a loan or participation, the fund is subject to the risk that an intermediate participant between the fund and the borrower will fail to meet its obligations to the fund, in addition to the risk that the borrower under the loan may default on its obligations.
Note 8: Market, credit and other risks
In the normal course of business, the fund trades financial instruments and enters into financial transactions where risk of potential loss exists due to changes in the market (market risk) or failure of the contracting party to the transaction to perform (credit risk). The fund may be exposed to additional credit risk that an institution or other entity with which the fund has unsettled or open transactions will default. Investments in foreign securities involve certain risks, including those related to economic instability, unfavorable political developments, and currency fluctuations. The fund may invest a significant portion of its assets in securitized debt instruments, including mortgage-backed and asset-backed investments. The yields and values of these investments are sensitive to changes in interest rates, the rate of principal payments on the underlying assets and the market’s perception of the issuers. The market for these investments may be volatile and limited, which may make them difficult to buy or sell.
Note 9: Regulatory matters and litigation
In late 2003 and 2004, Putnam Management settled charges brought by the SEC and the Massachusetts Securities Division in connection with excessive short-term trading in Putnam funds. In July 2011, the fund recorded a receivable of $424,890 related to restitution amounts in connection with a distribution plan approved by the SEC. This amount, which was received by the fund in December 2011, is reported as part of Increase in capital from settlement payments on the Statement of changes in net assets. These allegations and related matters have served as the general basis for certain lawsuits, including purported class action lawsuits against Putnam Management and, in a limited number of cases, some Putnam funds. In May 2011, the fund received a payment of $9,005 related to settlement of those lawsuits. This amount is reported as a part of Increase in capital from settlement payments on the Statement of changes in net assets. Putnam Management has agreed to bear any costs incurred by the Putnam funds as a result of these matters.
Note 10: New accounting pronouncements
In May 2011, the Financial Accounting Standards Board (FASB) issued Accounting Standards Update (ASU) 2011–04 “Fair Value Measurements and Disclosures (Topic 820) — Amendments to Achieve Common Fair Value Measurement and Disclosure Requirements in U.S. GAAP and IFRS”. ASU 2011–04 amends FASB Topic 820 “Fair Value Measurement” and seeks to develop common requirements for measuring fair value and for disclosing information about fair value measurements in accordance with GAAP. ASU 2011–04 is effective for fiscal years and interim periods beginning after December 15, 2011. The application of ASU 2011–04 did not have a material impact on the fund’s financial statements.
In December 2011, the FASB issued ASU No. 2011–11 “Disclosures about Offsetting Assets and Liabilities”. The update creates new disclosure requirements requiring entities to disclose both gross and net information for derivatives and other financial instruments that are either offset in the Statement of assets and liabilities or subject to an enforceable master netting arrangement or similar agreement. The disclosure requirements are effective for annual reporting periods beginning on or after January 1, 2013 and interim periods within those annual periods. Putnam Management is currently evaluating the application of ASU 2011–11 and its impact, if any, on the fund’s financial statements.
Federal tax information (Unaudited)
For the reporting period ended, pursuant to §871(k) of the Internal Revenue Code, the fund hereby designates $32,979,161 of distributions paid as qualifying to be taxed as interest-related dividends, and no monies to be taxed as short-term capital gain dividends for nonresident alien shareholders.
The Form 1099 that will be mailed to you in January 2013 will show the tax status of all distributions paid to your account in calendar 2012.
About the Trustees
Independent Trustees


* Mr. Reynolds is an “interested person” (as defined in the Investment Company Act of 1940) of the fund, Putnam Management, and Putnam Retail Management. He is President and Chief Executive Officer of Putnam Investments, as well as the President of your fund and each of the other Putnam funds.
The address of each Trustee is One Post Office Square, Boston, MA 02109.
As of October 31, 2012, there were 109 Putnam funds. All Trustees serve as Trustees of all Putnam funds.
Each Trustee serves for an indefinite term, until his or her resignation, retirement at age 75, removal, or death.
Officers
In addition to Robert L. Reynolds, the other officers of the fund are shown below:
| |
| Jonathan S. Horwitz (Born 1955) | Janet C. Smith (Born 1965) |
| Executive Vice President, Principal Executive | Vice President, Principal Accounting Officer, |
| Officer, and Compliance Liaison | and Assistant Treasurer |
| Since 2004 | Since 2007 |
| Director of Fund Administration Services, |
| Steven D. Krichmar (Born 1958) | Putnam Investments and Putnam Management |
| Vice President and Principal Financial Officer | |
| Since 2002 | Susan G. Malloy (Born 1957) |
| Chief of Operations, Putnam Investments and | Vice President and Assistant Treasurer |
| Putnam Management | Since 2007 |
| Director of Accounting & Control Services, |
| Robert T. Burns (Born 1961) | Putnam Management |
| Vice President and Chief Legal Officer | |
| Since 2011 | James P. Pappas (Born 1953) |
| General Counsel, Putnam Investments and | Vice President |
| Putnam Management | Since 2004 |
| Director of Trustee Relations, |
| Robert R. Leveille (Born 1969) | Putnam Investments and Putnam Management |
| Vice President and Chief Compliance Officer | |
| Since 2007 | Mark C. Trenchard (Born 1962) |
| Chief Compliance Officer, Putnam Investments, | Vice President and BSA Compliance Officer |
| Putnam Management, and Putnam Retail | Since 2002 |
| Management | Director of Operational Compliance, |
| Putnam Investments and Putnam |
| Michael J. Higgins (Born 1976) | Retail Management |
| Vice President and Treasurer | |
| Since 2010 | Judith Cohen (Born 1945) |
| Manager of Finance, Dunkin’ Brands (2008– | Vice President, Clerk, and Associate Treasurer |
| 2010); Senior Financial Analyst, Old Mutual Asset | Since 1993 |
| Management (2007–2008); Senior Financial | |
| Analyst, Putnam Investments (1999–2007) | Nancy E. Florek (Born 1957) |
| Vice President, Proxy Manager, Assistant Clerk, |
| | and Associate Treasurer |
| | Since 2000 |
The principal occupations of the officers for the past five years have been with the employers as shown above although in some cases, they have held different positions with such employers. The address of each Officer is One Post Office Square, Boston, MA 02109.
Services for shareholders
Investor services
Systematic investment plan Tell us how much you wish to invest regularly — weekly, semimonthly, or monthly — and the amount you choose will be transferred automatically from your checking or savings account. There’s no additional fee for this service, and you can suspend it at any time. This plan may be a great way to save for college expenses or to plan for your retirement.
Please note that regular investing does not guarantee a profit or protect against loss in a declining market. Before arranging a systematic investment plan, consider your financial ability to continue making purchases in periods when prices are low.
Systematic exchange You can make regular transfers from one Putnam fund to another Putnam fund. There are no additional fees for this service, and you can cancel or change your options at any time.
Dividends PLUS You can choose to have the dividend distributions from one of your Putnam funds automatically reinvested in another Putnam fund at no additional charge.
Free exchange privilege You can exchange money between Putnam funds free of charge, as long as they are the same class of shares. A signature guarantee is required if you are exchanging more than $500,000. The fund reserves the right to revise or terminate the exchange privilege.
Reinstatement privilege If you’ve sold Putnam shares or received a check for a dividend or capital gain, you may reinvest the proceeds with Putnam within 90 days of the transaction and they will be reinvested at the fund’s current net asset value — with no sales charge. However, reinstatement of class B shares may have special tax consequences. Ask your financial or tax representative for details.
Check-writing service You have ready access to many Putnam accounts. It’s as simple as writing a check, and there are no special fees or service charges. For more information about the check-writing service, call Putnam or visit our website.
Dollar cost averaging When you’re investing for long-term goals, it’s time, not timing, that counts. Investing on a systematic basis is a better strategy than trying to figure out when the markets will go up or down. This means investing the same amount of money regularly over a long period. This method of investing is called dollar cost averaging. When a fund’s share price declines, your investment dollars buy more shares at lower prices. When it increases, they buy fewer shares. Over time, you will pay a lower average price per share.
For more information
Visit the Individual Investors section at putnam.com A secure section of our website contains complete information on your account, including balances and transactions, updated daily. You may also conduct transactions, such as exchanges, additional investments, and address changes. Log on today to get your password.
Call us toll free at 1-800-225-1581 Ask a helpful Putnam representative or your financial advisor for details about any of these or other services, or see your prospectus.
Fund information
Founded 75 years ago, Putnam Investments was built around the concept that a balance between risk and reward is the hallmark of a well-rounded financial program. We manage over 100 funds across income, value, blend, growth, asset allocation, absolute return, and global sector categories.
| | |
| Investment Manager | Trustees | Robert R. Leveille |
| Putnam Investment | Jameson A. Baxter, Chair | Vice President and |
| Management, LLC | Liaquat Ahamed | Chief Compliance Officer |
| One Post Office Square | Ravi Akhoury | |
| Boston, MA 02109 | Barbara M. Baumann | Michael J. Higgins |
| | Charles B. Curtis | Vice President and Treasurer |
| Investment Sub-Manager | Robert J. Darretta | |
| Putnam Investments Limited | Katinka Domotorffy | Janet C. Smith |
| 57–59 St James’s Street | John A. Hill | Vice President, |
| London, England SW1A 1LD | Paul L. Joskow | Principal Accounting Officer, |
| | Elizabeth T. Kennan | and Assistant Treasurer |
| Marketing Services | Kenneth R. Leibler | |
| Putnam Retail Management | Robert E. Patterson | Susan G. Malloy |
| One Post Office Square | George Putnam, III | Vice President and |
| Boston, MA 02109 | Robert L. Reynolds | Assistant Treasurer |
| | W. Thomas Stephens | |
| Custodian | | James P. Pappas |
| State Street Bank | Officers | Vice President |
| and Trust Company | Robert L. Reynolds | |
| | President | Mark C. Trenchard |
| Legal Counsel | | Vice President and |
| Ropes & Gray LLP | Jonathan S. Horwitz | BSA Compliance Officer |
| | Executive Vice President, | |
| Independent Registered | Principal Executive Officer, and | Judith Cohen |
| Public Accounting Firm | Compliance Liaison | Vice President, Clerk, and |
| KPMG LLP | | Associate Treasurer |
| | Steven D. Krichmar | |
| | Vice President and | Nancy E. Florek |
| | Principal Financial Officer | Vice President, Proxy |
| | | Manager, Assistant Clerk, and |
| | Robert T. Burns | Associate Treasurer |
| | Vice President and | |
| | Chief Legal Officer | |
This report is for the information of shareholders of Putnam Income Fund. It may also be used as sales literature when preceded or accompanied by the current prospectus, the most recent copy of Putnam’s Quarterly Performance Summary, and Putnam’s Quarterly Ranking Summary. For more recent performance, please visit putnam.com. Investors should carefully consider the investment objectives, risks, charges, and expenses of a fund, which are described in its prospectus. For this and other information or to request a prospectus or summary prospectus, call 1-800-225-1581 toll free. Please read the prospectus carefully before investing. The fund’s Statement of Additional Information contains additional information about the fund’s Trustees and is available without charge upon request by calling 1-800-225-1581.
| |
| (a) The fund’s principal executive, financial and accounting officers are employees of Putnam Investment Management, LLC, the Fund’s investment manager. As such they are subject to a comprehensive Code of Ethics adopted and administered by Putnam Investments which is designed to protect the interests of the firm and its clients. The Fund has adopted a Code of Ethics which incorporates the Code of Ethics of Putnam Investments with respect to all of its officers and Trustees who are employees of Putnam Investment Management, LLC. For this reason, the Fund has not adopted a separate code of ethics governing its principal executive, financial and accounting officers. |
| |
| (c) In May 2008, the Code of Ethics of Putnam Investment Management, LLC was updated in its entirety to include the amendments adopted in August 2007 as well as a several additional technical, administrative and non-substantive changes. In May of 2009, the Code of Ethics of Putnam Investment Management, LLC was amended to reflect that all employees will now be subject to a 90-day blackout restriction on holding Putnam open-end funds, except for portfolio managers and their supervisors (and each of their immediate family members), who will be subject to a one-year blackout restriction on the funds that they manage or supervise. In June 2010, the Code of Ethics of Putnam Investments was updated in its entirety to include the amendments adopted in May of 2009 and to change certain rules and limits contained in the Code of Ethics. In addition, the updated Code of Ethics included numerous technical, administrative and non-substantive changes, which were intended primarily to make the document easier to navigate and understand. In July 2011, the Code of Ethics of Putnam Investments was updated to reflect several technical, administrative and non-substantive changes resulting from changes in employee titles. |
| |
| Item 3. Audit Committee Financial Expert: |
| |
| The Funds’ Audit and Compliance Committee is comprised solely of Trustees who are “independent” (as such term has been defined by the Securities and Exchange Commission (“SEC”) in regulations implementing Section 407 of the Sarbanes-Oxley Act (the “Regulations”)). The Trustees believe that each of the members of the Audit and Compliance Committee also possess a combination of knowledge and experience with respect to financial accounting matters, as well as other attributes, that qualify them for service on the Committee. In addition, the Trustees have determined that each of Mr. Leibler, Mr. Hill, Mr. Darretta and Ms. Baumann qualifies as an “audit committee financial expert” (as such term has been defined by the Regulations) based on their review of his or her pertinent experience and education. The SEC has stated that the designation or identification of a person as an audit committee financial expert pursuant to this Item 3 of Form N-CSR does not impose on such person any duties, obligations or liability that are greater than the duties, obligations and liability imposed on such person as a member of the Audit and Compliance Committee and the Board of Trustees in the absence of such designation or identification. |
| |
| Item 4. Principal Accountant Fees and Services: |
| |
| The following table presents fees billed in each of the last two fiscal years for services rendered to the fund by the fund’s independent auditor: |
| | | | | |
| Fiscal year ended | Audit Fees | Audit-Related Fees | Tax Fees | All Other Fees |
|
|
| | | | | |
| October 31, 2012 | $109,651 | $ — | $6,300 | $ — |
| October 31, 2011 | $101,397 | $ — | $6,100 | $ — |
| |
| For the fiscal years ended October 31 2012 and October 31, 2011, the fund’s independent auditor billed aggregate non-audit fees in the amounts of $6,300 and $6,100 respectively, to the fund, Putnam Management and any entity controlling, controlled by or under common control with Putnam Management that provides ongoing services to the fund. |
| |
| Audit Fees represent fees billed for the fund’s last two fiscal years relating to the audit and review of the financial statements included in annual reports and registration statements, and other services that are normally provided in connection with statutory and regulatory filings or engagements. |
| |
| Audit-Related Fees represent fees billed in the fund’s last two fiscal years for services traditionally performed by the fund’s auditor, including accounting consultation for proposed transactions or concerning financial accounting and reporting standards and other audit or attest services not required by statute or regulation. |
| |
| Tax Fees represent fees billed in the fund’s last two fiscal years for tax compliance, tax planning and tax advice services. Tax planning and tax advice services include assistance with tax audits, employee benefit plans and requests for rulings or technical advice from taxing authorities. |
| |
| Pre-Approval Policies of the Audit and Compliance Committee. The Audit and Compliance Committee of the Putnam funds has determined that, as a matter of policy, all work performed for the funds by the funds’ independent auditors will be pre-approved by the Committee itself and thus will generally not be subject to pre-approval procedures. |
| |
| The Audit and Compliance Committee also has adopted a policy to pre-approve the engagement by Putnam Management and certain of its affiliates of the funds’ independent auditors, even in circumstances where pre-approval is not required by applicable law. Any such requests by Putnam Management or certain of its affiliates are typically submitted in writing to the Committee and explain, among other things, the nature of the proposed engagement, the estimated fees, and why this work should be performed by that particular audit firm as opposed to another one. In reviewing such requests, the Committee considers, among other things, whether the provision of such services by the audit firm are compatible with the independence of the audit firm. |
| |
| The following table presents fees billed by the fund’s independent auditor for services required to be approved pursuant to paragraph (c)(7)(ii) of Rule 2-01 of Regulation S-X. |
| | | | | |
| Fiscal year ended | Audit-Related Fees | Tax Fees | All Other Fees | Total Non-Audit Fees |
|
|
| | | | | |
| October 31, 2012 | $ — | $ — | $ — | $ — |
| | | | | |
| October 31, 2011 | $ — | $ — | $ — | $ — |
| |
| Item 5. Audit Committee of Listed Registrants |
| |
| Item 6. Schedule of Investments: |
| |
| The registrant’s schedule of investments in unaffiliated issuers is included in the report to shareholders in Item 1 above. |
| |
| Item 7. Disclosure of Proxy Voting Policies and Procedures For Closed-End Management Investment Companies: |
| |
| Item 8. Portfolio Managers of Closed-End Investment Companies |
| |
| Item 9. Purchases of Equity Securities by Closed-End Management Investment Companies and Affiliated Purchasers: |
| |
| Item 10. Submission of Matters to a Vote of Security Holders: |
| |
| Item 11. Controls and Procedures: |
| |
| (a) The registrant’s principal executive officer and principal financial officer have concluded, based on their evaluation of the effectiveness of the design and operation of the registrant’s disclosure controls and procedures as of a date within 90 days of the filing date of this report, that the design and operation of such procedures are generally effective to provide reasonable assurance that information required to be disclosed by the registrant in this report is recorded, processed, summarized and reported within the time periods specified in the Commission’s rules and forms. |
| |
| (b) Changes in internal control over financial reporting: Not applicable |
| |
| (a)(1) The Code of Ethics of The Putnam Funds, which incorporates the Code of Ethics of Putnam Investments, is filed herewith. |
| |
| (a)(2) Separate certifications for the principal executive officer and principal financial officer of the registrant as required by Rule 30a-2(a) under the Investment Company Act of 1940, as amended, are filed herewith. |
| |
| (b) The certifications required by Rule 30a-2(b) under the Investment Company Act of 1940, as amended, are filed herewith. |
| |
| Pursuant to the requirements of the Securities Exchange Act of 1934 and the Investment Company Act of 1940, the registrant has duly caused this report to be signed on its behalf by the undersigned, thereunto duly authorized. |
| |
| By (Signature and Title): |
| |
| /s/Janet C. Smith
Janet C. Smith
Principal Accounting Officer
|
| |
| Pursuant to the requirements of the Securities Exchange Act of 1934 and the Investment Company Act of 1940, this report has been signed below by the following persons on behalf of the registrant and in the capacities and on the dates indicated. |
| |
| By (Signature and Title): |
| |
| /s/Jonathan S. Horwitz
Jonathan S. Horwitz
Principal Executive Officer
|
| |
| By (Signature and Title): |
| |
| /s/Steven D. Krichmar
Steven D. Krichmar
Principal Financial Officer
|