| | |
| UNITED STATES
SECURITIES AND EXCHANGE COMMISSION |
| | |
| CERTIFIED SHAREHOLDER REPORT OF REGISTERED
MANAGEMENT INVESTMENT COMPANIES
|
| | |
| Investment Company Act file number: | (811-00653) |
| | |
| Exact name of registrant as specified in charter: | Putnam Income Fund |
| | |
| Address of principal executive offices: | One Post Office Square, Boston, Massachusetts 02109 |
| | |
| Name and address of agent for service: | Robert T. Burns, Vice President
One Post Office Square
Boston, Massachusetts 02109 |
| | |
| Copy to: | John W. Gerstmayr, Esq.
Ropes & Gray LLP
800 Boylston Street
Boston, Massachusetts 02199-3600 |
| | |
| Registrant’s telephone number, including area code: | (617) 292-1000 |
| | |
| Date of fiscal year end: | October 31, 2013 |
| | |
| Date of reporting period : | November 1, 2012 — October 31, 2013 |
| | |
|
Item 1. Report to Stockholders: | |
| | |
| The following is a copy of the report transmitted to stockholders pursuant to Rule 30e-1 under the Investment Company Act of 1940: | |

Putnam
Income
Fund
Annual report
10 | 31 | 13
| | |
| Message from the Trustees | 1 | |
| |
| About the fund | 2 | |
| |
| Performance snapshot | 4 | |
| |
| Interview with your fund’s portfolio manager | 5 | |
| |
| Your fund’s performance | 11 | |
| |
| Your fund’s expenses | 14 | |
| |
| Terms and definitions | 16 | |
| |
| Other information for shareholders | 17 | |
| |
| Important notice regarding Putnam’s privacy policy | 18 | |
| |
| Trustee approval of management contract | 19 | |
| |
| Financial statements | 25 | |
| |
| Federal tax information | 81 | |
| |
| About the Trustees | 82 | |
| |
| Officers | 84 | |
| |
Consider these risks before investing: Funds that invest in government securities are not guaranteed. Mortgage-backed securities are subject to prepayment risk and the risk that they may increase in value less when interest rates decline and decline in value more when interest rates rise. Bond investments are subject to interest-rate risk (the risk of bond prices falling if interest rates rise) and credit risk (the risk of an issuer defaulting on interest or principal payments). Interest-rate risk is greater for longer-term bonds, and credit risk is greater for below-investment-grade bonds. Risks associated with derivatives include increased investment exposure (which may be considered leverage) and, in the case of over-the-counter instruments, the potential inability to terminate or sell derivatives positions and the potential failure of the other party to the instrument to meet its obligations. Unlike bonds, funds that invest in bonds have fees and expenses. Bond prices may fall or fail to rise over time for several reasons, including general financial market conditions and factors related to a specific issuer or industry. You can lose money by investing in the fund.
Message from the Trustees
Dear Fellow Shareholder:
In the final months of 2013, we continue to see business conditions as generally positive for well-diversified investment portfolios. Financial markets have shown surprising resilience in the face of recent headwinds, most notably the confrontation over the federal budget and debt ceiling, which took a toll on the economy during October. With Congressional negotiations now continuing into 2014, there is hope that lawmakers may reach an agreement beneficial to the economy, even as investors remain alert to the risk of additional disruption.
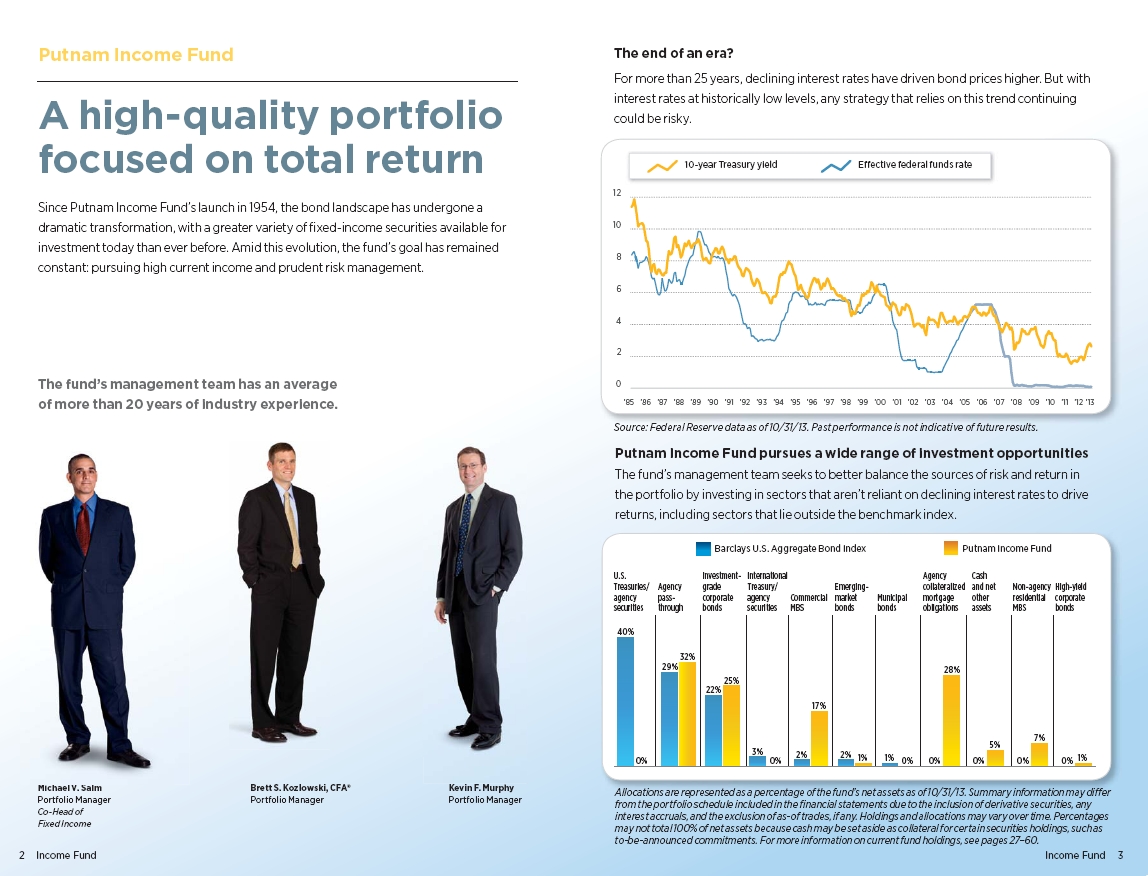
Fortunately, equity markets have easily overcome recent obstacles. Supported by generally solid corporate earnings and healthy balance sheets, stock market gains to this point are far above the long-term average for a single year. International stocks have also performed well, particularly in Europe and Japan. While bonds have lagged behind stocks, many fixed-income sectors have advanced, reminding investors of the need for flexible and selective approaches. The sting of rising interest rates has been felt primarily by Treasuries and other government bonds.
At Putnam, we believe markets in flux can often provide the best opportunity for realizing the benefits of financial advice and active portfolio management. An experienced advisor can help investors stay focused on their long-term goals without getting distracted by daily economic and political events. Challenging times also call for innovative and alternative investment strategies managed by experts. In seeking returns for fund shareholders, Putnam’s investment professionals engage in fundamental research, active investing, and risk management strategies.
We would like to welcome new shareholders of the fund and to thank you for investing with Putnam. We would also like to extend our thanks to Elizabeth Kennan, who has retired from the Board of Trustees, for her 20 years of dedicated service.

Current performance may be lower or higher than the quoted past performance, which cannot guarantee future results. Share price, principal value, and return will fluctuate, and you may have a gain or a loss when you sell your shares. Performance of class A shares assumes reinvestment of distributions and does not account for taxes. Fund returns in the bar chart do not reflect a sales charge of 4.00%; had they, returns would have been lower. See pages 5 and 11–13 for additional performance information. For a portion of the periods, the fund had expense limitations, without which returns would have been lower. To obtain the most recent month-end performance, visit putnam.com.
* The fund’s benchmark, the Barclays U.S. Aggregate Bond Index, was introduced on 12/31/75, and the fund’s Lipper category was introduced on 12/31/59. Both post-date the inception date of the fund’s class A shares.
Interview with your fund’s portfolio manager

Mike, what was the bond market environment like during the 12 months ended October 31, 2013?
Spread sectors — sectors that trade at a yield premium to U.S. Treasuries — posted gains in the final quarter of 2012, as investors stopped focusing on what might go wrong in the global economy and concentrated instead on where the greatest opportunities for returns existed. As we moved into the early months of 2013, credit-sensitive fixed-income securities continued to benefit from a more favorable economic backdrop and the tailwind of increased global liquidity that resulted from accommodative monetary policy in the United States and overseas. In May, however, the market environment changed, as concern about higher interest rates weighed on sentiment, leading investors to take profits. A debate that began in May about when the Federal Reserve would begin reducing its bond-buying program intensified in June, when Chairman Ben Bernanke announced that the central bank could begin scaling back its stimulus program later in 2013, and end it by mid 2014, sooner than investors expected. Investors reacted to this potential shift in Fed monetary policy by selling bonds across all market sectors, driving rates higher and yield spreads wider.
After spiking in June, interest rates remained elevated until mid September, due to uncertainty about when the central bank would actually start the process of trimming its
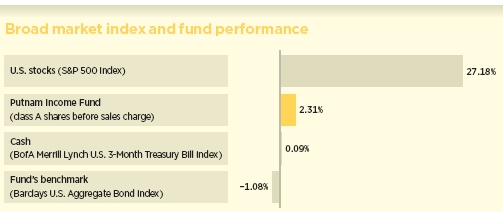
This comparison shows your fund’s performance in the context of broad market indexes for the 12 months ended 10/31/13. See pages 4 and 11–13 for additional fund performance information. Index descriptions can be found on page 17.
monthly bond purchases. However, seeing a more uneven economic climate than it expected, including a weak September employment report along with the potential for fiscal discord in Washington, the Fed decided at its mid-September policy meeting to keep its $85-billion-a-month bond-buying program in place. This announcement surprised investors, causing bonds to rally, rates to decline, and spreads to tighten. The rally was further fueled when President Obama signed a short-term bill on October 17 that raised the U.S. debt ceiling and will fund the government through January 15, 2014, which ended a partial government shutdown.
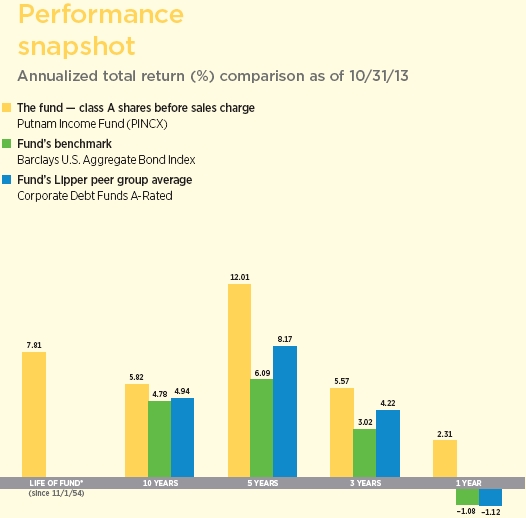
Against this backdrop, I’m pleased to report that Putnam Income Fund outperformed its benchmark and the average return for its Lipper peer group.
The fund outpaced its benchmark by a sizable margin. What factors fueled this solid showing?
Our mortgage credit holdings — which included commercial mortgage-backed securities [CMBS] and an out-of-benchmark stake in non-agency residential mortgage-backed securities [RMBS] — bolstered the fund’s results versus the index. CMBS benefited from stable-to-rising commercial property values, as well as continued investor demand for risk. Our investments in “mezzanine” bonds rated BBB/Baa offered relatively high yields for their level of risk. Mezzanine CMBS are lower in the capital structure of a package of securities backed by commercial mortgages, and provide a yield advantage over higher-rated bonds along with meaningful principal protection. Non-agency RMBS performed
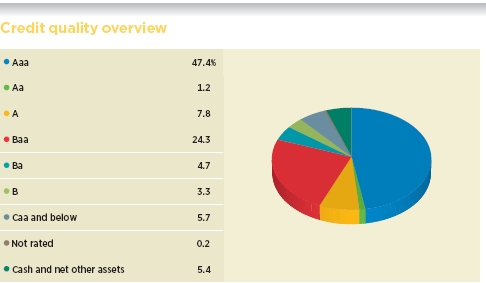
Credit qualities are shown as a percentage of the fund’s net assets as of 10/31/13. A bond rated Baa or higher (Prime-3 or higher, for short-term debt) is considered investment grade. The chart reflects Moody’s ratings; percentages may include bonds or derivatives not rated by Moody’s but rated by Standard & Poor’s (S&P) or, if unrated by S&P, by Fitch ratings, and then included in the closest equivalent Moody’s rating. Ratings may vary over time.
Credit quality includes bonds and represents only the fixed-income portion of the portfolio. Cash and net other assets, if any, represent the market value weights of cash, derivatives, short-term securities, and other unclassified assets in the portfolio. The fund itself has not been rated by an independent rating agency.
well during the period’s first half, driven by investors’ appetite for higher-yielding securities, as well as a strengthening U.S. housing market.

An overweight allocation to investment-grade corporate bonds also proved beneficial. In July and August, given continuing steady U.S. economic growth, corporate bonds were less influenced by the uncertainty surrounding Fed tapering. Then in September, when the central bank decided to postpone scaling back its bond purchases, investors had a renewed appetite for credit risk, and sought to capitalize on the wider yield spreads offered by corporate securities. From a sector perspective, our investments in securities issued by financial institutions, particularly large banks, were among the biggest contributors.
After detracting in April and May, our prepayment strategies, which we implemented with securitized bonds, such as interest-only collateralized mortgage obligations [IO CMOs], helped performance for the period as a whole. Generally speaking, it was a positive environment for prepayment-sensitive securities, such as IO CMOs, particularly in the summer months. During that time, as interest rates rose, investors began to expect prepayment speeds to slow, which would

This chart shows how the fund’s top weightings have changed over the past six months. Allocations are shown as a percentage of the fund’s net assets. Cash and net other assets, if any, represent the market value weights of cash, derivatives, short-term securities, and other unclassified assets in the portfolio. Current period summary information may differ from the portfolio schedule included in the financial statements due to the inclusion of derivative securities, any interest accruals, and the use of different classifications of securities for presentation purposes. Allocations may not total 100% because the table includes the notional value of derivatives (the economic value for purposes of calculating period payment obligations), in addition to the market value of securities. Holdings and allocations may vary over time.
reduce the likelihood that the mortgages underlying our IO CMO positions would be refinanced. As these dynamics developed, they helped boost the value of our IO CMO holdings.
Our term-structure strategy — duration and yield-curve positioning — was moderately helpful, as we generally took less interest-rate risk versus the benchmark during periods when rates were rising, while also positioning the portfolio for a steeper yield curve. Adverse results from some of our tactical duration adjustments partially offset the overall positive contribution from our term-structure positioning. For example, in June, believing that the amount by which rates increased wasn’t justified by the economic environment, we modestly lengthened the portfolio’s duration to try to capitalize on any retracement in rates. However, the timing of our strategy proved to be a bit early, because rates didn’t meaningfully pull back until mid July, before resuming their upward trend until September.
How did you use derivatives during the period?
We used bond futures and interest-rate swaps — which allow two parties to exchange one stream of future interest payments for another, based on a specified notional amount — to take tactical positions at various points along the yield curve. In addition, we employed interest-rate swaps and “swaptions” — which give us the option to enter into a swap contract — to hedge the interest-rate and prepayment risks associated with our CMO holdings. We also used total return swaps as a hedging tool and to help manage the fund’s sector exposure, as well as credit default swaps to hedge the fund’s credit risk.
The fund increased its distribution rate twice during the period. What led to those decisions?
The fund’s distribution rate per class A share was raised from $0.016 to $0.018 in December 2012 and to $0.021 in April 2013. We’re pleased to report that these increases were possible because the portfolio generated greater distributable income as a result of the fund’s diversification across a wide range of market sectors. Similar increases were made to other share classes.
What is your outlook for the coming months?
As we approach 2014, we are anticipating the Fed’s policy response to the generally better economic activity we have witnessed in 2013. Growth in the United States looks to be on track, while Europe appears to be entering the early-cycle phase of an economic recovery. As a result, we believe the U.S. central bank will begin tapering its bond buying in the near future, possibly during the first quarter of 2014, provided the markets maintain the overall stability they have recently exhibited.
From a medium-term perspective, the desire among policymakers and investors alike is for the financial markets to return to a more normalized environment. Consequently, the Fed would prefer to transition from aggressively providing liquidity to the markets to letting the markets function on their own again. As the markets make this transition, we believe periods of volatility and uncertainty will continue. Overall, however, investors appear to be navigating through the beginning stage of this transition fairly well, as risk-seeking behavior has been prevalent in both the fixed-income and equity markets.
All told, we believe continued modest U.S. economic growth, coupled with improving economic conditions overseas, will allow interest rates to normalize, which could pave the way for the 10-year Treasury yield to be at or slightly above 3% by early 2014.
Moreover, we believe this normalization in the level of rates can occur without creating meaningful disruptions in the financial and housing markets.
How was the portfolio positioned as of period-end?
The fund was positioned for a rising-rate environment in the United States. Additionally, we were continuing to find what we believed to be compelling opportunities for taking prepayment risk via IO CMOs, and continued to add to our holdings of mezzanine CMBS.
Thanks for your time and for bringing us up to date, Mike.
The views expressed in this report are exclusively those of Putnam Management and are subject to change. They are not meant as investment advice.
Please note that the holdings discussed in this report may not have been held by the fund for the entire period. Portfolio composition is subject to review in accordance with the fund’s investment strategy and may vary in the future. Current and future portfolio holdings are subject to risk.
Portfolio Manager Michael V. Salm is Co-Head of Fixed Income at Putnam. He has a B.A. from Cornell University. Michael joined Putnam in 1997 and has been in the investment industry since 1989.
In addition to Michael, your fund’s portfolio managers are Brett S. Kozlowski, CFA®, and Kevin F. Murphy.
ABOUT DERIVATIVES
Derivatives are an increasingly common type of investment instrument, the performance of which is derived from an underlying security, index, currency, or other area of the capital markets. Derivatives employed by the fund’s managers generally serve one of two main purposes: to implement a strategy that may be difficult or more expensive to invest in through traditional securities, or to hedge unwanted risk associated with a particular position.
For example, the fund’s managers might use currency forward contracts to capitalize on an anticipated change in exchange rates between two currencies. This approach would require a significantly smaller outlay of capital than purchasing traditional bonds denominated in the underlying currencies. In another example, the managers may identify a bond that they believe is undervalued relative to its risk of default, but may seek to reduce the interest-rate risk of that bond by using interest-rate swaps, a derivative through which two parties “swap” payments based on the movement of certain rates.
Like any other investment, derivatives may not appreciate in value and may lose money. Derivatives may amplify traditional investment risks through the creation of leverage and may be less liquid than traditional securities. And because derivatives typically represent contractual agreements between two financial institutions, derivatives entail “counterparty risk,” which is the risk that the other party is unable or unwilling to pay. Putnam monitors the counterparty risks we assume. For example, Putnam often enters into collateral agreements that require the counterparties to post collateral on a regular basis to cover their obligations to the fund.
IN THE NEWS
With stocks rallying and interest rates increasingly volatile, investors are pouring money into equity-based mutual funds. For the first nine months of 2013, inflows into stock funds more than quadrupled, compared with the same time period in 2012, according to the Strategic Insight Monthly Fund Industry Review. U.S. equity funds attracted over $168 billion versus $31 billion during the first three quarters of 2012, while international stock funds garnered over $163 billion in comparison with nearly $50 billion a year ago. Investors are on track in 2013 to invest the most money in equity mutual funds since 2000, according to investment research firm TrimTabs. Meanwhile, fixed-income investors have tapped the brakes, with year-to-date inflows of about $27 billion as of September 30, down from over $290 billion a year ago.
Your fund’s performance
This section shows your fund’s performance, price, and distribution information for periods ended October 31, 2013, the end of its most recent fiscal year. In accordance with regulatory requirements for mutual funds, we also include performance information as of the most recent calendar quarter-end and expense information taken from the fund’s current prospectus. Performance should always be considered in light of a fund’s investment strategy. Data represent past performance. Past performance does not guarantee future results. More recent returns may be less or more than those shown. Investment return and principal value will fluctuate, and you may have a gain or a loss when you sell your shares. Performance information does not reflect any deduction for taxes a shareholder may owe on fund distributions or on the redemption of fund shares. For the most recent month-end performance, please visit the Individual Investors section at putnam.com or call Putnam at 1-800-225-1581. Class R, class R5, class R6, and class Y shares are not available to all investors. See the Terms and Definitions section in this report for definitions of the share classes offered by your fund.
Fund performance Total return for periods ended 10/31/13
| | | | | | | | | | | | |
| | Class A | Class B | Class C | Class M | Class R | Class R5 | Class R6 | Class Y |
| (inception dates) | (11/1/54) | (3/1/93) | (7/26/99) | (12/14/94) | (1/21/03) | (7/2/12) | (7/2/12) | (6/16/94) |
|
| | Before | After | | | | | Before | After | Net | Net | Net | Net |
| sales | sales | Before | After | Before | After | sales | sales | asset | asset | asset | asset |
| charge | charge | CDSC | CDSC | CDSC | CDSC | charge | charge | value | value | value | value |
|
| Annual average | | | | | | | | | | | | |
| (life of fund) | 7.81% | 7.73% | 6.83% | 6.83% | 7.00% | 7.00% | 7.37% | 7.31% | 7.54% | 7.90% | 7.90% | 7.90% |
|
| 10 years | 76.01 | 68.97 | 63.21 | 63.21 | 63.21 | 63.21 | 71.61 | 66.03 | 71.76 | 80.67 | 80.70 | 80.50 |
| Annual average | 5.82 | 5.39 | 5.02 | 5.02 | 5.02 | 5.02 | 5.55 | 5.20 | 5.56 | 6.09 | 6.10 | 6.08 |
|
| 5 years | 76.31 | 69.26 | 69.54 | 67.54 | 69.74 | 69.74 | 73.94 | 68.29 | 74.01 | 78.44 | 78.47 | 78.27 |
| Annual average | 12.01 | 11.10 | 11.14 | 10.87 | 11.16 | 11.16 | 11.71 | 10.97 | 11.72 | 12.28 | 12.28 | 12.26 |
|
| 3 years | 17.67 | 12.96 | 15.13 | 12.13 | 15.09 | 15.09 | 16.81 | 13.01 | 16.86 | 18.66 | 18.68 | 18.55 |
| Annual average | 5.57 | 4.15 | 4.81 | 3.89 | 4.80 | 4.80 | 5.31 | 4.16 | 5.33 | 5.87 | 5.87 | 5.84 |
|
| 1 year | 2.31 | –1.78 | 1.58 | –3.37 | 1.58 | 0.59 | 2.15 | –1.17 | 2.11 | 2.75 | 2.62 | 2.52 |
|
Current performance may be lower or higher than the quoted past performance, which cannot guarantee future results. After-sales-charge returns for class A and M shares reflect the deduction of the maximum 4.00% and 3.25% sales charge, respectively, levied at the time of purchase. Class B share returns after contingent deferred sales charge (CDSC) reflect the applicable CDSC, which is 5% in the first year, declining over time to 1% in the sixth year, and is eliminated thereafter. Class C share returns after CDSC reflect a 1% CDSC for the first year that is eliminated thereafter. Class R, R5, R6, and Y shares have no initial sales charge or CDSC. Performance for class B, C, M, R, and Y shares before their inception is derived from the historical performance of class A shares, adjusted for the applicable sales charge (or CDSC) and the higher operating expenses for such shares, except for class Y shares, for which 12b-1 fees are not applicable. Performance for class R5 and R6 shares prior to their inception is derived from the historical performance of class Y shares and has not been adjusted for the lower investor servicing fees applicable to class R5 and R6 shares; had it, returns would have been higher.
For a portion of the periods, the fund had expense limitations, without which returns would have been lower.
Class B share performance does not reflect conversion to class A shares.
Comparative index returns For periods ended 10/31/13
| | |
| | Barclays U.S. Aggregate | Lipper Corporate Debt Funds |
| | Bond Index | A-Rated category average* |
|
| Annual average (life of fund) | —† | —† |
|
| 10 years | 59.45% | 62.85% |
| Annual average | 4.78 | 4.94 |
|
| 5 years | 34.37 | 49.09 |
| Annual average | 6.09 | 8.17 |
|
| 3 years | 9.32 | 13.27 |
| Annual average | 3.02 | 4.22 |
|
| 1 year | –1.08 | –1.12 |
|
Index and Lipper results should be compared with fund performance before sales charge, before CDSC, or at net asset value.
* Over the 1-year, 3-year, 5-year, and 10-year periods ended 10/31/13, there were 63, 58, 52, and 40 funds, respectively, in this Lipper category.
† The fund’s benchmark, the Barclays U.S. Aggregate Bond Index, was introduced on 12/31/75, and the fund’s Lipper category was introduced on 12/31/59. Both post-date the inception of the fund’s class A shares.
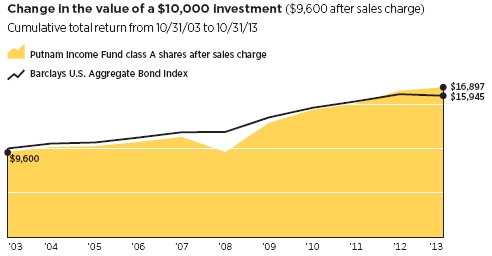
Past performance does not indicate future results. At the end of the same time period, a $10,000 investment in the fund’s class B and class C shares would have been valued at $16,321 and $16,321, respectively, and no contingent deferred sales charges would apply. A $10,000 investment in the fund’s class M shares ($9,675 after sales charge) would have been valued at $16,603. A $10,000 investment in the fund’s class R, R5, R6, and Y shares would have been valued at $17,176, $18,067, $18,070, and $18,050, respectively, and no contingent deferred sales charges would apply.
Fund price and distribution information For the 12-month period ended 10/31/13
| | | | | | | | | | |
| Distributions | Class A | Class B | Class C | Class M | Class R | Class R5 | Class R6 | Class Y |
|
| Number | 12 | 12 | 12 | 12 | 12 | 12 | 12 | 12 |
|
| Income | $0.235 | $0.182 | $0.182 | $0.220 | $0.220 | $0.258 | $0.259 | $0.252 |
|
| Capital gains | — | — | — | — | — | — | — | — |
|
| Total | $0.235 | $0.182 | $0.182 | $0.220 | $0.220 | $0.258 | $0.259 | $0.252 |
|
| | Before | After | Net | Net | Before | After | Net | Net | Net | Net |
| | sales | sales | asset | asset | sales | sales | asset | asset | asset | asset |
| Share value | charge | charge | value | value | charge | charge | value | value | value | value |
|
| 10/31/12 | $7.27 | $7.57 | $7.20 | $7.22 | $7.12 | $7.36 | $7.23 | $7.35 | $7.36 | $7.36 |
|
| 10/31/13 | 7.20 | 7.50 | 7.13 | 7.15 | 7.05 | 7.29 | 7.16 | 7.29 | 7.29 | 7.29 |
|
| | Before | After | Net | Net | Before | After | Net | Net | Net | Net |
| Current rate | sales | sales | asset | asset | sales | sales | asset | asset | asset | asset |
| (end of period) | charge | charge | value | value | charge | charge | value | value | value | value |
|
| Current dividend | | | | | | | | | | |
| rate 1 | 3.50% | 3.36% | 2.86% | 2.85% | 3.40% | 3.29% | 3.35% | 3.79% | 3.79% | 3.62% |
|
| Current 30-day | | | | | | | | | | |
| SEC yield 2 | N/A | 3.80 | 3.22 | 3.22 | N/A | 3.59 | 3.71 | 4.26 | 4.31 | 4.22 |
|
The classification of distributions, if any, is an estimate. Before-sales-charge share value and current dividend rate for class A and M shares, if applicable, do not take into account any sales charge levied at the time of purchase. After-sales-charge share value, current dividend rate, and current 30-day SEC yield, if applicable, are calculated assuming that the maximum sales charge (4.00% for class A shares and 3.25% for class M shares) was levied at the time of purchase. Final distribution information will appear on your year-end tax forms.
1 Most recent distribution, including any return of capital and excluding capital gains, annualized and divided by share price before or after sales charge at period-end.
2 Based only on investment income and calculated using the maximum offering price for each share class, in accordance with SEC guidelines.
Fund performance as of most recent calendar quarter
Total return for periods ended 9/30/13
| | | | | | | | | | | | |
| | Class A | Class B | Class C | Class M | Class R | Class R5 | Class R6 | Class Y |
| (inception dates) | (11/1/54) | (3/1/93) | (7/26/99) | (12/14/94) | (1/21/03) | (7/2/12) | (7/2/12) | (6/16/94) |
|
| | Before | After | | | | | Before | After | Net | Net | Net | Net |
| sales | sales | Before | After | Before | After | sales | sales | asset | asset | asset | asset |
| charge | charge | CDSC | CDSC | CDSC | CDSC | charge | charge | value | value | value | value |
|
| Annual average | | | | | | | | | | | | |
| (life of fund) | 7.79% | 7.72% | 6.81% | 6.81% | 6.98% | 6.98% | 7.35% | 7.29% | 7.52% | 7.88% | 7.88% | 7.88% |
|
| 10 years | 72.00 | 65.12 | 59.45 | 59.45 | 59.46 | 59.46 | 67.63 | 62.18 | 67.83 | 76.57 | 76.60 | 76.43 |
| Annual average | 5.57 | 5.14 | 4.78 | 4.78 | 4.78 | 4.78 | 5.30 | 4.95 | 5.31 | 5.85 | 5.85 | 5.84 |
|
| 5 years | 57.17 | 50.88 | 51.26 | 49.26 | 51.22 | 51.22 | 55.07 | 50.03 | 55.07 | 58.96 | 58.98 | 58.83 |
| Annual average | 9.46 | 8.57 | 8.63 | 8.34 | 8.62 | 8.62 | 9.17 | 8.45 | 9.17 | 9.71 | 9.72 | 9.70 |
|
| 3 years | 15.83 | 11.19 | 13.30 | 10.30 | 13.27 | 13.27 | 14.94 | 11.20 | 15.02 | 16.81 | 16.83 | 16.72 |
| Annual average | 5.02 | 3.60 | 4.25 | 3.32 | 4.24 | 4.24 | 4.75 | 3.60 | 4.77 | 5.32 | 5.32 | 5.29 |
|
| 1 year | 1.95 | –2.13 | 1.07 | –3.86 | 1.07 | 0.08 | 1.63 | –1.68 | 1.74 | 2.24 | 2.26 | 2.17 |
|
See the discussion following the Fund performance table on page 11 for information about the calculation of fund performance.
Your fund’s expenses
As a mutual fund investor, you pay ongoing expenses, such as management fees, distribution fees (12b-1 fees), and other expenses. Using the following information, you can estimate how these expenses affect your investment and compare them with the expenses of other funds. You may also pay one-time transaction expenses, including sales charges (loads) and redemption fees, which are not shown in this section and would have resulted in higher total expenses. For more information, see your fund’s prospectus or talk to your financial representative.
Expense ratios
| | | | | | | | |
| | Class A | Class B | Class C | Class M | Class R | Class R5 | Class R6 | Class Y |
|
| Total annual operating expenses for | | | | | | | | |
| the fiscal year ended 10/31/12 | 0.86% | 1.61% | 1.61% | 1.11% | 1.11% | 0.58%* | 0.51%* | 0.61% |
|
| Annualized expense ratio for | | | | | | | | |
| the six-month period ended | | | | | | | | |
| 10/31/13† | 0.86% | 1.61% | 1.61% | 1.11% | 1.11% | 0.58% | 0.51% | 0.61% |
|
Fiscal-year expense information in this table is taken from the most recent prospectus, is subject to change, and may differ from that shown for the annualized expense ratio and in the financial highlights of this report. Expenses are shown as a percentage of average net assets.
* Other expenses for class R5 and R6 have been annualized.
† For the fund’s most recent fiscal half year; may differ from expense ratios based on one-year data in the financial highlights.
Expenses per $1,000
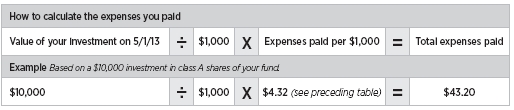
The following table shows the expenses you would have paid on a $1,000 investment in the fund from May 1, 2013, to October 31, 2013. It also shows how much a $1,000 investment would be worth at the close of the period, assuming actual returns and expenses.
| | | | | | | | |
| | Class A | Class B | Class C | Class M | Class R | Class R5 | Class R6 | Class Y |
|
| Expenses paid per $1,000*† | $4.32 | $8.07 | $8.07 | $5.57 | $5.57 | $2.91 | $2.56 | $3.06 |
|
| Ending value (after expenses) | $991.60 | $987.90 | $987.90 | $991.80 | $991.80 | $993.40 | $993.40 | $992.80 |
|
* Expenses for each share class are calculated using the fund’s annualized expense ratio for each class, which represents the ongoing expenses as a percentage of average net assets for the six months ended 10/31/13. The expense ratio may differ for each share class.
† Expenses are calculated by multiplying the expense ratio by the average account value for the period; then multiplying the result by the number of days in the period; and then dividing that result by the number of days in the year.
Estimate the expenses you paid
To estimate the ongoing expenses you paid for the six months ended October 31, 2013, use the following calculation method. To find the value of your investment on May 1, 2013, call Putnam at 1-800-225-1581.
Compare expenses using the SEC’s method
The Securities and Exchange Commission (SEC) has established guidelines to help investors assess fund expenses. Per these guidelines, the following table shows your fund’s expenses based on a $1,000 investment, assuming a hypothetical 5% annualized return. You can use this information to compare the ongoing expenses (but not transaction expenses or total costs) of investing in the fund with those of other funds. All mutual fund shareholder reports will provide this information to help you make this comparison. Please note that you cannot use this information to estimate your actual ending account balance and expenses paid during the period.
| | | | | | | | |
| | Class A | Class B | Class C | Class M | Class R | Class R5 | Class R6 | Class Y |
|
| Expenses paid per $1,000*† | $4.38 | $8.19 | $8.19 | $5.65 | $5.65 | $2.96 | $2.60 | $3.11 |
|
| Ending value (after expenses) | $1,020.87 | $1,017.09 | $1,017.09 | $1,019.61 | $1,019.61 | $1,022.28 | $1,022.63 | $1,022.13 |
|
* Expenses for each share class are calculated using the fund’s annualized expense ratio for each class, which represents the ongoing expenses as a percentage of average net assets for the six months ended 10/31/13. The expense ratio may differ for each share class.
† Expenses are calculated by multiplying the expense ratio by the average account value for the six-month period; then multiplying the result by the number of days in the six-month period; and then dividing that result by the number of days in the year.
Terms and definitions
Important terms
Total return shows how the value of the fund’s shares changed over time, assuming you held the shares through the entire period and reinvested all distributions in the fund.
Before sales charge, or net asset value, is the price, or value, of one share of a mutual fund, without a sales charge. Before-sales-charge figures fluctuate with market conditions, and are calculated by dividing the net assets of each class of shares by the number of outstanding shares in the class.
After sales charge is the price of a mutual fund share plus the maximum sales charge levied at the time of purchase. After-sales-charge performance figures shown here assume the 4.00% maximum sales charge for class A shares and 3.25% for class M shares.
Contingent deferred sales charge (CDSC) is generally a charge applied at the time of the redemption of class B or C shares and assumes redemption at the end of the period. Your fund’s class B CDSC declines over time from a 5% maximum during the first year to 1% during the sixth year. After the sixth year, the CDSC no longer applies. The CDSC for class C shares is 1% for one year after purchase.
Share classes
Class A shares are generally subject to an initial sales charge and no CDSC (except on certain redemptions of shares bought without an initial sales charge).
Class B shares are not subject to an initial sales charge. They may be subject to a CDSC.
Class C shares are not subject to an initial sales charge and are subject to a CDSC only if the shares are redeemed during the first year.
Class M shares have a lower initial sales charge and a higher 12b-1 fee than class A shares and no CDSC (except on certain redemptions of shares bought without an initial sales charge).
Class R shares are not subject to an initial sales charge or CDSC and are available only to certain defined contribution plans.
Class R5 shares and class R6 shares are not subject to an initial sales charge or CDSC, and carry no 12b-1 fee. They are only available to employer-sponsored retirement plans.
Class Y shares are not subject to an initial sales charge or CDSC, and carry no 12b-1 fee. They are generally only available to corporate and institutional clients and clients in other approved programs.
Fixed-income terms
Current rate is the annual rate of return earned from dividends or interest of an investment. Current rate is expressed as a percentage of the price of a security, fund share, or principal investment.
Mortgage-backed security (MBS), also known as a mortgage “pass-through,” is a type of asset-backed security that is secured by a mortgage or collection of mortgages. The following are types of MBSs:
• Agency “pass-through” has its principal and interest backed by a U.S. government agency, such as the Federal National Mortgage Association (Fannie Mae), Government National Mortgage Association (Ginnie Mae), and Federal Home Loan Mortgage Corporation (Freddie Mac).
• Collateralized mortgage obligation (CMO) represents claims to specific cash flows from pools of home mortgages. The streams of principal and interest payments on the mortgages are distributed to the different classes of CMO interests in “tranches.” Each tranche may have different principal balances, coupon rates, prepayment risks, and maturity dates. A CMO is highly sensitive to changes in interest rates and any resulting change in the rate at which homeowners sell their properties, refinance, or otherwise prepay loans. CMOs are subject to prepayment, market, and liquidity risks.
• Interest-only (IO) security is a type of CMO in which the underlying asset is the interest portion of mortgage, Treasury, or bond payments.
• Non-agency residential mortgage-backed security (RMBS) is an MBS not backed by Fannie Mae, Ginnie Mae, or Freddie Mac. One type of RMBS is an Alt-A mortgage-backed security.
• Commercial mortgage-backed security (CMBS) is secured by the loan on a commercial property.
Yield curve is a graph that plots the yields of bonds with equal credit quality against their differing maturity dates, ranging from shortest to longest. It is used as a benchmark for other debt, such as mortgage or bank lending rates.
Comparative indexes
Barclays U.S. Aggregate Bond Index is an unmanaged index of U.S. investment-grade fixed-income securities.
BofA Merrill Lynch U.S. 3-Month Treasury Bill Index is an unmanaged index that seeks to measure the performance of U.S. Treasury bills available in the marketplace.
S&P 500 Index is an unmanaged index of common stock performance.
Indexes assume reinvestment of all distributions and do not account for fees. Securities and performance of a fund and an index will differ. You cannot invest directly in an index.
Lipper is a third-party industry-ranking entity that ranks mutual funds. Its rankings do not reflect sales charges. Lipper rankings are based on total return at net asset value relative to other funds that have similar current investment styles or objectives as determined by Lipper. Lipper may change a fund’s category assignment at its discretion. Lipper category averages reflect performance trends for funds within a category.
Other information for shareholders
Proxy voting
Putnam is committed to managing our mutual funds in the best interests of our shareholders. The Putnam funds’ proxy voting guidelines and procedures, as well as information regarding how your fund voted proxies relating to portfolio securities during the 12-month period ended June 30, 2013, are available in the Individual Investors section of putnam.com, and on the Securities and Exchange Commission (SEC) website, www.sec.gov. If you have questions about finding forms on the SEC’s website, you may call the SEC at 1-800-SEC-0330. You may also obtain the Putnam funds’ proxy voting guidelines and procedures at no charge by calling Putnam’s Shareholder Services at 1-800-225-1581.
Fund portfolio holdings
The fund will file a complete schedule of its portfolio holdings with the SEC for the first and third quarters of each fiscal year on Form N-Q. Shareholders may obtain the fund’s Forms N-Q on the SEC’s website at www.sec.gov. In addition, the fund’s Forms N-Q may be reviewed and copied at the SEC’s Public Reference Room in Washington, D.C. You may call the SEC at 1-800-SEC-0330 for information about the SEC’s website or the operation of the Public Reference Room.
Trustee and employee fund ownership
Putnam employees and members of the Board of Trustees place their faith, confidence, and, most importantly, investment dollars in Putnam mutual funds. As of October 31, 2013, Putnam employees had approximately $414,000,000 and the Trustees had approximately $99,000,000 invested in Putnam mutual funds. These amounts include investments by the Trustees’ and employees’ immediate family members as well as investments through retirement and deferred compensation plans.
Important notice regarding Putnam’s privacy policy
In order to conduct business with our shareholders, we must obtain certain personal information such as account holders’ names, addresses, Social Security numbers, and dates of birth. Using this information, we are able to maintain accurate records of accounts and transactions.
It is our policy to protect the confidentiality of our shareholder information, whether or not a shareholder currently owns shares of our funds. In particular, it is our policy not to sell information about you or your accounts to outside marketing firms. We have safeguards in place designed to prevent unauthorized access to our computer systems and procedures to protect personal information from unauthorized use.
Under certain circumstances, we must share account information with outside vendors who provide services to us, such as mailings and proxy solicitations. In these cases, the service providers enter into confidentiality agreements with us, and we provide only the information necessary to process transactions and perform other services related to your account. Finally, it is our policy to share account information with your financial representative, if you’ve listed one on your Putnam account.
Trustee approval of management contract
General conclusions
The Board of Trustees of the Putnam funds oversees the management of each fund and, as required by law, determines annually whether to approve the continuance of your fund’s management contract with Putnam Investment Management (“Putnam Management”) and the sub-management contract with respect to your fund between Putnam Management and its affiliate, Putnam Investments Limited (“PIL”). The Board of Trustees, with the assistance of its Contract Committee, requests and evaluates all information it deems reasonably necessary under the circumstances in connection with its annual contract review. The Contract Committee consists solely of Trustees who are not “interested persons” (as this term is defined in the Investment Company Act of 1940, as amended (the “1940 Act”)) of the Putnam funds (“Independent Trustees”).
At the outset of the review process, members of the Board’s independent staff and independent legal counsel met with representatives of Putnam Management to review the annual contract review materials furnished to the Contract Committee during the course of the previous year’s review and to discuss possible changes in these materials that might be necessary or desirable for the coming year. Following these discussions and in consultation with the Contract Committee, the Independent Trustees’ independent legal counsel requested that Putnam Management furnish specified information, together with any additional information that Putnam Management considered relevant, to the Contract Committee. Over the course of several months ending in June 2013, the Contract Committee met on a number of occasions with representatives of Putnam Management, and separately in executive session, to consider the information that Putnam Management provided. Throughout this process, the Contract Committee was assisted by the members of the Board’s independent staff and by independent legal counsel for the Putnam funds and the Independent Trustees.
In May 2013, the Contract Committee met in executive session to discuss and consider its preliminary recommendations with respect to the continuance of the contracts. At the Trustees’ June 20, 2013 meeting, the Contract Committee met in executive session with the other Independent Trustees to review a summary of the key financial data that the Contract Committee considered in the course of its review. The Contract Committee then presented its written report, which summarized the key factors that the Committee had considered and set forth its final recommendations. The Contract Committee then recommended, and the Independent Trustees approved, the continuance of your fund’s management and sub-management contracts, effective July 1, 2013, subject to certain changes in the sub-management contract noted below. (Because PIL is an affiliate of Putnam Management and Putnam Management remains fully responsible for all services provided by PIL, the Trustees have not evaluated PIL as a separate entity, and all subsequent references to Putnam Management below should be deemed to include reference to PIL as necessary or appropriate in the context.) The Independent Trustees’ approval was based on the following conclusions:
• That the fee schedule in effect for your fund represented reasonable compensation in light of the nature and quality of the services being provided to the fund, the fees paid by competitive funds, and the costs incurred by Putnam Management in providing services to the fund, and
• That the fee schedule represented an appropriate sharing between fund
shareholders and Putnam Management of such economies of scale as may exist in the management of the fund at current asset levels.
These conclusions were based on a comprehensive consideration of all information provided to the Trustees and were not the result of any single factor. Some of the factors that figured particularly in the Trustees’ deliberations and how the Trustees considered these factors are described below, although individual Trustees may have evaluated the information presented differently, giving different weights to various factors. It is also important to recognize that the management arrangements for your fund and the other Putnam funds are the result of many years of review and discussion between the Independent Trustees and Putnam Management, that some aspects of the arrangements may receive greater scrutiny in some years than others, and that the Trustees’ conclusions may be based, in part, on their consideration of fee arrangements in previous years. For example, with some minor exceptions, the current fee arrangements in the management contracts for the Putnam funds were implemented at the beginning of 2010 following extensive review and discussion by the Trustees, as well as approval by shareholders.
As noted above, the Trustees considered administrative revisions to your fund’s sub-management contract. Putnam Management recommended that the sub-management contract be revised to reduce the sub-management fee that Putnam Management pays to PIL from 40 basis points to 25 basis points with respect to the portion of the portfolios of certain funds, including your fund, that may be allocated to PIL from time to time. These revisions had no effect on the management fees paid by your fund to Putnam Management. The Independent Trustees’ approval of this recommendation was based on their conclusion that these changes would have no practical effect on Putnam Management’s continued responsibility for the management of these funds or the costs borne by fund shareholders and would not result in any reduction in the nature and quality of services provided to the funds.
Management fee schedules and total expenses
The Trustees reviewed the management fee schedules in effect for all Putnam funds, including fee levels and breakpoints. The Trustees also reviewed the total expenses of each Putnam fund, recognizing that in most cases management fees represented the major, but not the sole, determinant of total costs to shareholders.
In reviewing fees and expenses, the Trustees generally focus their attention on material changes in circumstances — for example, changes in assets under management, changes in a fund’s investment style, changes in Putnam Management’s operating costs or profitability, or changes in competitive practices in the mutual fund industry — that suggest that consideration of fee changes might be warranted. The Trustees concluded that the circumstances did not warrant changes to the management fee structure of your fund.
Under its management contract, your fund has the benefit of breakpoints in its management fee schedule that provide shareholders with economies of scale in the form of reduced fee levels as assets under management in the Putnam family of funds increase. The Trustees concluded that the fee schedule in effect for your fund represented an appropriate sharing of economies of scale between fund shareholders and Putnam Management.
As in the past, the Trustees also focused on the competitiveness of each fund’s total expense ratio. In order to ensure that expenses of the Putnam funds continue to meet competitive standards, the Trustees and Putnam Management have implemented certain expense limitations. These expense limitations were:
(i) a contractual expense limitation applicable to all retail open-end funds of 32 basis points on investor servicing fees and expenses and (ii) a contractual expense limitation applicable to all open-end funds of 20 basis points on so-called “other expenses” (i.e., all expenses exclusive of management fees, investor servicing fees, distribution fees, investment-related expenses, interest, taxes, brokerage commissions, extraordinary expenses and acquired fund fees and expenses). These expense limitations serve in particular to maintain competitive expense levels for funds with large numbers of small shareholder accounts and funds with relatively small net assets. Most funds, including your fund, had sufficiently low expenses that these expense limitations did not apply. Putnam Management’s support for these expense limitations was an important factor in the Trustees’ decision to approve the continuance of your fund’s management and sub-management contracts.
The Trustees reviewed comparative fee and expense information for a custom group of competitive funds selected by Lipper Inc. This comparative information included your fund’s percentile ranking for effective management fees and total expenses (excluding any applicable 12b-1 fee), which provides a general indication of your fund’s relative standing. In the custom peer group, your fund ranked in the 1st quintile in effective management fees (determined for your fund and the other funds in the custom peer group based on fund asset size and the applicable contractual management fee schedule) and in the 2nd quintile in total expenses (excluding any applicable 12b-1 fees) as of December 31, 2012 (the first quintile representing the least expensive funds and the fifth quintile the most expensive funds). The fee and expense data reported by Lipper as of December 31, 2012 reflected the most recent fiscal year-end data available in Lipper’s database at that time.
In connection with their review of the management fees and total expenses of the Putnam funds, the Trustees also reviewed the costs of the services provided and the profits realized by Putnam Management and its affiliates from their contractual relationships with the funds. This information included trends in revenues, expenses and profitability of Putnam Management and its affiliates relating to the investment management, investor servicing and distribution services provided to the funds. In this regard, the Trustees also reviewed an analysis of Putnam Management’s revenues, expenses and profitability, allocated on a fund-by-fund basis, with respect to the funds’ management, distribution, and investor servicing contracts. For each fund, the analysis presented information about revenues, expenses and profitability for each of the agreements separately and for the agreements taken together on a combined basis. The Trustees concluded that, at current asset levels, the fee schedules in place represented reasonable compensation for the services being provided and represented an appropriate sharing of such economies of scale as may exist in the management of the Putnam funds at that time.
The information examined by the Trustees as part of their annual contract review for the Putnam funds has included for many years information regarding fees charged by Putnam Management and its affiliates to institutional clients such as defined benefit pension plans, college endowments, and the like. This information included comparisons of those fees with fees charged to the funds, as well as an assessment of the differences in the services provided to these different types of clients. The Trustees observed that the differences in fee rates between institutional clients and mutual funds are by no means uniform when examined by individual asset sectors, suggesting that differences in the pricing of investment management services to these types of clients may reflect historical competitive forces operating
in separate markets. The Trustees considered the fact that in many cases fee rates across different asset classes are higher on average for mutual funds than for institutional clients, as well as the differences between the services that Putnam Management provides to the Putnam funds and those that it provides to its institutional clients. The Trustees did not rely on these comparisons to any significant extent in concluding that the management fees paid by your fund are reasonable.
Investment performance
The quality of the investment process provided by Putnam Management represented a major factor in the Trustees’ evaluation of the quality of services provided by Putnam Management under your fund’s management contract. The Trustees were assisted in their review of the Putnam funds’ investment process and performance by the work of the investment oversight committees of the Trustees, which meet on a regular basis with the funds’ portfolio teams and with the Chief Investment Officer and other senior members of Putnam Management’s Investment Division throughout the year. The Trustees concluded that Putnam Management generally provides a high-quality investment process — based on the experience and skills of the individuals assigned to the management of fund portfolios, the resources made available to them, and in general Putnam Management’s ability to attract and retain high-quality personnel — but also recognized that this does not guarantee favorable investment results for every fund in every time period.
The Trustees considered that 2012 was a year of strong competitive performance for many of the Putnam funds, with only a relatively small number of exceptions. They noted that this strong performance was exemplified by the fact that the Putnam funds were recognized by Barron’s as the best performing mutual fund complex for 2012 — the second time in four years that Putnam Management has achieved this distinction for the Putnam funds. They also noted, however, the disappointing investment performance of some funds for periods ended December 31, 2012 and considered information provided by Putnam Management regarding the factors contributing to the underperformance and actions being taken to improve the performance of these particular funds. The Trustees indicated their intention to continue to monitor performance trends to assess the effectiveness of these efforts and to evaluate whether additional actions to address areas of underperformance are warranted.
For purposes of evaluating investment performance, the Trustees generally focus on competitive industry rankings for the one-year, three-year, and five-year periods. For a number of Putnam funds with relatively unique investment mandates, the Trustees evaluated performance based on comparisons of their total returns with the returns of selected investment benchmarks or targeted returns. In the case of your fund, the Trustees considered that its class A share cumulative total return performance at net asset value was in the following quartiles of its Lipper Inc. peer group (Lipper Corporate Debt Funds A Rated) for the one-year, three-year and five-year periods ended December 31, 2012 (the first quartile representing the best-performing funds and the fourth quartile the worst-performing funds):
| |
| One-year period | 1st |
|
| Three-year period | 1st |
|
| Five-year period | 1st |
|
For the one-year period ended December 31, 2012, your fund’s performance was in the top decile of its Lipper Inc. peer group. Over the one-year, three-year and five-year periods ended December 31, 2012, there were 96, 83 and 78 funds, respectively, in your fund’s Lipper peer group. (When considering performance information, shareholders should be mindful that past performance is not a guarantee of future results.)
Brokerage and soft-dollar allocations; investor servicing
The Trustees considered various potential benefits that Putnam Management may receive in connection with the services it provides under the management contract with your fund. These include benefits related to brokerage allocation and the use of soft dollars, whereby a portion of the commissions paid by a fund for brokerage may be used to acquire research services that are expected to be useful to Putnam Management in managing the assets of the fund and of other clients. Subject to policies established by the Trustees, soft dollars generated by these means are used primarily to acquire brokerage and research services that enhance Putnam Management’s investment capabilities and supplement Putnam Management’s internal research efforts. However, the Trustees noted that a portion of available soft dollars continues to be used to pay fund expenses. The Trustees indicated their continued intent to monitor regulatory and industry developments in this area with the assistance of their Brokerage Committee and also indicated their continued intent to monitor the allocation of the Putnam funds’ brokerage in order to ensure that the principle of seeking best price and execution remains paramount in the portfolio trading process.
Putnam Management may also receive benefits from payments that the funds make to Putnam Management’s affiliates for investor or distribution services. In conjunction with the annual review of your fund’s management and sub-management contracts, the Trustees reviewed your fund’s investor servicing agreement with Putnam Investor Services, Inc. (“PSERV”) and its distributor’s contracts and distribution plans with Putnam Retail Management Limited Partnership (“PRM”), both of which are affiliates of Putnam Management. The Trustees concluded that the fees payable by the funds to PSERV and PRM, as applicable, for such services are reasonable in relation to the nature and quality of such services, the fees paid by competitive funds, and the costs incurred by PSERV and PRM, as applicable, in providing such services.
Consideration of your fund’s interim management contract and the continuance of the fund’s sub-management contract
Following the Trustees’ approval of the continuance of your fund’s management and sub-management contracts, on October 8, 2013, The Honourable Paul G. Desmarais passed away. Mr. Desmarais, both directly and though holding companies, controlled a majority of the voting shares of Power Corporation of Canada, the ultimate parent company of Putnam Management. Upon his death, Mr. Desmarais’ voting control of shares of Power Corporation of Canada was transferred to The Desmarais Family Residuary Trust (the “Transfer”). As a technical matter, the Transfer may have constituted an “assignment” within the meaning of the Investment Company Act of 1940, causing the fund’s existing management and sub-management contracts to terminate automatically. On October 18, 2013, the Trustees approved your fund’s interim management contract and the continuance of your fund’s sub-management contract to address this possibility and to avoid disruption of investment advisory and other services provided to your fund. At a subsequent meeting on November 22, 2013, the Trustees, including all of the Independent Trustees, approved new definitive management contracts between the Putnam funds and Putnam Management and determined to recommend their approval to the shareholders of the Putnam funds at a shareholder meeting to be held in early 2014.
In considering whether to approve your fund’s interim management contract and new definitive management contract and the continuance of your fund’s sub-management contract, the Trustees took into account that
they had most recently approved the annual continuation of the fund’s previous management and sub-management contracts at their meeting in June 2013, as described above. The Trustees considered that the terms of the interim management contract and new definitive management contract were identical to the previous management contract, except for the effective dates and initial terms and for certain non-substantive changes. They also considered that the sub-management contract was identical to the previous sub-management contract, except for the effective dates and initial terms. Because the proposed contracts were substantially identical to the previous versions of these contracts approved by the Trustees at their June 2013 meeting, the Trustees relied to a considerable extent on their prior approval of these contracts. In addition, the Trustees considered a number other factors relating to the Transfer, including, but not limited to, the following:
• Information about the operations of The Desmarais Family Residuary Trust, including that Paul Desmarais, Jr. and André Desmarais, Mr. Desmarais’ sons, were expected to exercise, jointly, voting control over the Power Corporation of Canada shares controlled by The Desmarais Family Residuary Trust.
• That Paul Desmarais, Jr. and André Desmarais had been playing active managerial roles at Power Corporation of Canada, with responsibility for the oversight of Power Corporation of Canada’s subsidiaries, including Putnam Investments, since Power Corporation of Canada had acquired Putnam Investments in 2007, including serving as Directors of Putnam Investments, and that the Transfer would not affect their responsibilities as officers of Power Corporation of Canada.
• The intention expressed by representatives of Power Corporation of Canada and its subsidiaries, Power Financial Corporation and Great-West Lifeco, that there would be no change to the operations or management of Putnam Investments, to Putnam Management’s management of the funds or to investment, advisory and other services provided to the funds by Putnam Management and its affiliates as a result of the Transfer.
• Putnam Management’s assurances that, following the Transfer, Putnam Management would continue to provide the same level of services to each fund and that the Transfer will not have an adverse impact on the ability of Putnam Management and its affiliates to continue to provide high quality investment advisory and other services to the funds.
• Putnam Management’s assurances that there are no current plans to make any changes to the operations of the funds, existing management fees, expense limitations, distribution arrangements, or the quality of any services provided to the funds or their shareholders, as a result of the Transfer.
• The benefits that the funds have received and may potentially receive as a result of Putnam Management being a member of the Power Corporation of Canada group of companies, which promotes the stability of the Putnam organization.
Financial statements
These sections of the report, as well as the accompanying Notes, preceded by the Report of Independent Registered Public Accounting Firm, constitute the fund’s financial statements.
The fund’s portfolio lists all the fund’s investments and their values as of the last day of the reporting period. Holdings are organized by asset type and industry sector, country, or state to show areas of concentration and diversification.
Statement of assets and liabilities shows how the fund’s net assets and share price are determined. All investment and non-investment assets are added together. Any unpaid expenses and other liabilities are subtracted from this total. The result is divided by the number of shares to determine the net asset value per share, which is calculated separately for each class of shares. (For funds with preferred shares, the amount subtracted from total assets includes the liquidation preference of preferred shares.)
Statement of operations shows the fund’s net investment gain or loss. This is done by first adding up all the fund’s earnings — from dividends and interest income — and subtracting its operating expenses to determine net investment income (or loss). Then, any net gain or loss the fund realized on the sales of its holdings — as well as any unrealized gains or losses over the period — is added to or subtracted from the net investment result to determine the fund’s net gain or loss for the fiscal year.
Statement of changes in net assets shows how the fund’s net assets were affected by the fund’s net investment gain or loss, by distributions to shareholders, and by changes in the number of the fund’s shares. It lists distributions and their sources (net investment income or realized capital gains) over the current reporting period and the most recent fiscal year-end. The distributions listed here may not match the sources listed in the Statement of operations because the distributions are determined on a tax basis and may be paid in a different period from the one in which they were earned.
Financial highlights provide an overview of the fund’s investment results, per-share distributions, expense ratios, net investment income ratios, and portfolio turnover in one summary table, reflecting the five most recent reporting periods. In a semiannual report, the highlights table also includes the current reporting period.
Report of Independent Registered Public Accounting Firm
The Board of Trustees and Shareholders
Putnam Income Fund:
We have audited the accompanying statement of assets and liabilities of Putnam Income Fund (the fund), including the fund’s portfolio, as of October 31, 2013, and the related statement of operations for the year then ended, the statements of changes in net assets for each of the years in the two-year period then ended, and the financial highlights for each of the years or periods in the five-year period then ended. These financial statements and financial highlights are the responsibility of the fund’s management. Our responsibility is to express an opinion on these financial statements and financial highlights based on our audits.
We conducted our audits in accordance with the standards of the Public Company Accounting Oversight Board (United States). Those standards require that we plan and perform the audit to obtain reasonable assurance about whether the financial statements and financial highlights are free of material misstatement. An audit includes examining, on a test basis, evidence supporting the amounts and disclosures in the financial statements. Our procedures included confirmation of securities owned as of October 31, 2013, by correspondence with the custodian and brokers or by other appropriate auditing procedures. An audit also includes assessing the accounting principles used and significant estimates made by management, as well as evaluating the overall financial statement presentation. We believe that our audits provide a reasonable basis for our opinion.
In our opinion, the financial statements and financial highlights referred to above present fairly, in all material respects, the financial position of Putnam Income Fund as of October 31, 2013, the results of its operations for the year then ended, the changes in its net assets for each of the years in the two-year period then ended, and the financial highlights for each of the years or periods in the five-year period then ended, in conformity with U.S. generally accepted accounting principles.

Boston, Massachusetts
December 9, 2013
The fund’s portfolio 10/31/13
| | |
| MORTGAGE-BACKED SECURITIES (48.2%)* | Principal amount | Value |
|
| Agency collateralized mortgage obligations (25.1%) | | |
| Federal Home Loan Mortgage Corp. | | |
| IFB Ser. 3182, Class SP, 27.904s, 2032 | $150,953 | $232,916 |
| IFB Ser. 3408, Class EK, 25.093s, 2037 | 1,731,145 | 2,574,531 |
| IFB Ser. 2976, Class LC, 23.782s, 2035 | 205,593 | 307,924 |
| IFB Ser. 2979, Class AS, 23.635s, 2034 | 88,677 | 115,010 |
| IFB Ser. 3072, Class SB, 23.012s, 2035 | 683,208 | 988,904 |
| IFB Ser. 3249, Class PS, 21.701s, 2036 | 564,915 | 785,253 |
| IFB Ser. 3065, Class DC, 19.338s, 2035 | 901,680 | 1,305,929 |
| IFB Ser. 2990, Class LB, 16.501s, 2034 | 1,020,868 | 1,365,891 |
| IFB Ser. 4105, Class HS, IO, 6.426s, 2042 | 5,173,432 | 1,248,039 |
| IFB Ser. 3861, Class PS, IO, 6.426s, 2037 | 4,536,070 | 680,773 |
| IFB Ser. 3907, Class KS, IO, 6.376s, 2040 | 4,778,004 | 803,187 |
| IFB Ser. 3708, Class SA, IO, 6.276s, 2040 | 12,231,788 | 2,063,503 |
| IFB Ser. 4112, Class SC, IO, 5.976s, 2042 | 14,511,098 | 2,651,323 |
| IFB Ser. 4105, Class LS, IO, 5.976s, 2041 | 5,473,110 | 1,064,301 |
| IFB Ser. 4245, Class AS, IO, 5.826s, 2043 | 13,806,235 | 3,123,246 |
| IFB Ser. 3852, Class NT, 5.826s, 2041 | 3,506,432 | 3,508,711 |
| IFB Ser. 3752, Class PS, IO, 5.826s, 2040 | 6,795,538 | 1,037,067 |
| IFB Ser. 310, Class S4, IO, 5.776s, 2043 | 3,820,979 | 950,469 |
| IFB Ser. 311, Class S1, IO, 5.776s, 2043 | 31,421,947 | 7,033,803 |
| IFB Ser. 314, Class AS, IO, 5.716s, 2043 | 9,014,369 | 2,000,390 |
| Ser. 3632, Class CI, IO, 5s, 2038 | 178,311 | 13,386 |
| Ser. 3626, Class DI, IO, 5s, 2037 | 61,482 | 1,398 |
| Ser. 4132, Class IP, IO, 4 1/2s, 2042 | 16,943,801 | 2,989,570 |
| Ser. 4122, Class TI, IO, 4 1/2s, 2042 | 6,078,408 | 1,199,270 |
| Ser. 4018, Class DI, IO, 4 1/2s, 2041 | 7,062,119 | 1,074,996 |
| Ser. 3747, Class HI, IO, 4 1/2s, 2037 | 1,765,615 | 170,648 |
| Ser. 3707, Class PI, IO, 4 1/2s, 2025 | 4,651,306 | 381,175 |
| Ser. 4116, Class MI, IO, 4s, 2042 | 13,160,907 | 2,624,092 |
| Ser. 4122, Class AI, IO, 3 1/2s, 2042 | 11,373,709 | 1,774,299 |
| Ser. 4141, Class PI, IO, 3s, 2042 | 11,658,085 | 1,634,580 |
| Ser. 4158, Class TI, IO, 3s, 2042 | 29,840,861 | 4,136,839 |
| Ser. 4165, Class TI, IO, 3s, 2042 | 35,584,478 | 4,960,476 |
| Ser. 4176, Class DI, IO, 3s, 2042 | 32,076,062 | 4,455,686 |
| Ser. 4171, Class NI, IO, 3s, 2042 | 18,700,401 | 2,576,915 |
| Ser. 4183, Class MI, IO, 3s, 2042 | 10,681,064 | 1,482,532 |
| Ser. T-56, Class A, IO, 0.524s, 2043 | 11,774,389 | 201,912 |
| Ser. T-56, Class 1, IO, zero %, 2043 | 14,053,150 | 105,399 |
| Ser. T-56, Class 2, IO, zero %, 2043 | 5,062,290 | 15,820 |
| Ser. T-56, Class 3, IO, zero %, 2043 | 4,241,175 | 55,665 |
| Ser. 3835, Class FO, PO, zero %, 2041 | 11,982,147 | 10,027,140 |
| Ser. 3369, Class BO, PO, zero %, 2037 | 38,447 | 34,639 |
| Ser. 3391, PO, zero %, 2037 | 319,432 | 271,045 |
| Ser. 3300, PO, zero %, 2037 | 515,595 | 468,975 |
| Ser. 3206, Class EO, PO, zero %, 2036 | 24,816 | 22,099 |
| Ser. 3175, Class MO, PO, zero %, 2036 | 86,371 | 76,101 |
| Ser. 3210, PO, zero %, 2036 | 88,326 | 80,875 |
| | |
| MORTGAGE-BACKED SECURITIES (48.2%)* cont. | Principal amount | Value |
|
| Agency collateralized mortgage obligations cont. | | |
| Federal Home Loan Mortgage Corp. | | |
| FRB Ser. 3117, Class AF, zero %, 2036 | $20,530 | $18,424 |
| FRB Ser. 3326, Class WF, zero %, 2035 | 22,307 | 20,395 |
| FRB Ser. 3036, Class AS, zero %, 2035 | 7,984 | 7,951 |
|
| Federal National Mortgage Association | | |
| IFB Ser. 06-62, Class PS, 38.879s, 2036 | 1,095,822 | 2,163,581 |
| IFB Ser. 06-8, Class HP, 23.943s, 2036 | 795,931 | 1,240,522 |
| IFB Ser. 05-45, Class DA, 23.796s, 2035 | 1,551,972 | 2,355,481 |
| IFB Ser. 05-122, Class SE, 22.504s, 2035 | 1,655,750 | 2,430,950 |
| IFB Ser. 05-75, Class GS, 19.739s, 2035 | 510,077 | 687,606 |
| IFB Ser. 05-106, Class JC, 19.596s, 2035 | 872,492 | 1,310,501 |
| IFB Ser. 05-83, Class QP, 16.951s, 2034 | 180,627 | 237,758 |
| IFB Ser. 11-4, Class CS, 12.56s, 2040 | 1,925,682 | 2,288,198 |
| IFB Ser. 12-96, Class PS, IO, 6.53s, 2041 | 8,947,980 | 1,728,481 |
| IFB Ser. 12-75, Class SK, IO, 6.48s, 2041 | 13,518,545 | 2,573,525 |
| IFB Ser. 12-75, Class KS, IO, 6.38s, 2042 | 8,227,729 | 1,523,940 |
| IFB Ser. 12-3, Class CS, IO, 6.38s, 2040 | 8,843,598 | 1,471,133 |
| IFB Ser. 11-27, Class AS, IO, 6.31s, 2041 | 8,384,427 | 1,389,048 |
| IFB Ser. 10-35, Class SG, IO, 6.23s, 2040 | 20,462,987 | 3,662,261 |
| IFB Ser. 12-132, Class SB, IO, 6.03s, 2042 | 11,235,219 | 1,703,147 |
| IFB Ser. 13-19, Class DS, IO, 6.03s, 2041 | 9,284,191 | 1,787,932 |
| Ser. 06-10, Class GC, 6s, 2034 | 6,831,424 | 7,036,367 |
| IFB Ser. 13-59, Class SC, IO, 5.98s, 2043 | 13,080,840 | 2,898,224 |
| IFB Ser. 13-13, Class SA, IO, 5.98s, 2043 | 14,348,594 | 3,509,809 |
| IFB Ser. 13-101, Class AS, IO, 5.78s, 2043 | 22,492,244 | 5,252,164 |
| IFB Ser. 11-53, Class SY, IO, 5.78s, 2041 | 12,282,436 | 1,408,795 |
| IFB Ser. 13-103, Class SK, IO, 5 3/4s, 2043 | 5,152,699 | 1,214,219 |
| Ser. 13-101, Class SE, IO, 5.73s, 2043 | 12,136,893 | 3,079,737 |
| IFB Ser. 13-102, Class SH, IO, 5.73s, 2043 | 12,244,307 | 2,754,969 |
| Ser. 12-129, Class TI, IO, 4 1/2s, 2040 | 9,635,445 | 1,811,464 |
| Ser. 418, Class C24, IO, 4s, 2043 | 8,950,000 | 1,932,691 |
| Ser. 12-124, Class UI, IO, 4s, 2042 | 26,277,220 | 4,945,373 |
| Ser. 12-40, Class MI, IO, 4s, 2041 | 13,507,841 | 2,402,033 |
| Ser. 418, Class C15, IO, 3 1/2s, 2043 | 18,269,000 | 3,939,662 |
| Ser. 13-55, Class IK, IO, 3s, 2043 | 9,246,000 | 1,349,084 |
| Ser. 13-35, Class IP, IO, 3s, 2042 | 10,626,850 | 1,298,053 |
| Ser. 13-55, Class PI, IO, 3s, 2042 | 17,915,061 | 2,338,095 |
| Ser. 13-30, Class IP, IO, 3s, 2041 | 9,427,840 | 1,026,692 |
| Ser. 13-23, Class LI, 3s, 2041 | 10,842,160 | 1,197,733 |
| Ser. 03-W10, Class 1, IO, 1.147s, 2043 | 8,679,705 | 282,768 |
| Ser. 01-50, Class B1, IO, 0.405s, 2041 | 836,915 | 8,369 |
| Ser. 2002-W6, Class 1AIO, 0.173s, 2042 | 1,070,260 | 2,341 |
| Ser. 2005-W4, Class 1AIO, 0.095s, 2035 | 236,140 | 664 |
| Ser. 03-34, Class P1, PO, zero %, 2043 | 228,299 | 184,922 |
| Ser. 07-64, Class LO, PO, zero %, 2037 | 124,430 | 110,479 |
| Ser. 07-14, Class KO, PO, zero %, 2037 | 366,294 | 320,562 |
| Ser. 06-125, Class OX, PO, zero %, 2037 | 51,053 | 46,503 |
| Ser. 06-84, Class OT, PO, zero %, 2036 | 39,393 | 35,413 |
| Ser. 06-46, Class OC, PO, zero %, 2036 | 35,398 | 31,233 |
|
| | |
| MORTGAGE-BACKED SECURITIES (48.2%)* cont. | Principal amount | Value |
|
| Agency collateralized mortgage obligations cont. | | |
| Government National Mortgage Association | | |
| IFB Ser. 11-56, Class SA, 23.751s, 2041 | $10,309,384 | $15,983,462 |
| IFB Ser. 10-158, Class SD, 14.483s, 2040 | 2,780,250 | 3,410,866 |
| IFB Ser. 11-70, Class WS, 9.355s, 2040 | 11,858,000 | 11,774,164 |
| IFB Ser. 11-72, Class SE, 7.174s, 2041 | 9,422,000 | 9,400,612 |
| IFB Ser. 11-61, Class CS, IO, 6.508s, 2035 | 15,967,354 | 2,303,291 |
| IFB Ser. 12-26, Class SP, IO, 6.478s, 2042 | 9,236,566 | 2,272,472 |
| IFB Ser. 10-109, Class SB, 6.428s, 2040 | 10,750,502 | 2,225,137 |
| Ser. 10-9, Class XD, IO, 6.425s, 2040 | 35,183,282 | 6,915,626 |
| IFB Ser. 11-3, Class SG, IO, 6.378s, 2041 | 3,699,068 | 725,461 |
| IFB Ser. 10-56, Class SC, IO, 6.328s, 2040 | 3,912,346 | 728,831 |
| IFB Ser. 10-35, Class CS, IO, 6.298s, 2040 | 15,815,538 | 3,022,824 |
| IFB Ser. 11-56, Class MI, IO, 6.278s, 2041 | 5,590,772 | 1,253,731 |
| IFB Ser. 10-20, Class SE, IO, 6.078s, 2040 | 12,509,446 | 2,230,434 |
| IFB Ser. 13-113, Class SL, IO, 6.058s, 2042 | 5,312,164 | 975,695 |
| IFB Ser. 13-87, Class AS, IO, 6.028s, 2043 | 5,313,809 | 902,604 |
| IFB Ser. 13-87, Class SA, IO, 6.028s, 2043 | 9,669,246 | 1,654,001 |
| IFB Ser. 13-124, Class SC, IO, 6.028s, 2041 | 6,145,751 | 1,047,052 |
| IFB Ser. 13-129, Class SN, IO, 5.978s, 2043 | 7,484,250 | 1,223,750 |
| IFB Ser. 13-99, Class SL, IO, 5.978s, 2043 | 9,710,099 | 1,802,680 |
| IFB Ser. 10-20, Class SC, IO, 5.978s, 2040 | 7,751,316 | 1,377,099 |
| IFB Ser. 13-129, Class SA, IO, 5.928s, 2043 | 3,958,667 | 662,483 |
| IFB Ser. 11-94, Class SA, IO, 5.928s, 2041 | 14,515,015 | 2,618,509 |
| IFB Ser. 11-146, Class AS, IO, 5.925s, 2041 | 7,744,712 | 1,576,775 |
| Ser. 13-149, Class MS, IO, 5.922s, 2039 | 11,755,000 | 1,899,167 |
| IFB Ser. 10-158, Class SA, IO, 5.878s, 2040 | 4,691,096 | 842,193 |
| IFB Ser. 10-151, Class SA, IO, 5.878s, 2040 | 4,658,431 | 836,887 |
| IFB Ser. 10-120, Class SA, IO, 5.878s, 2040 | 9,730,610 | 1,747,812 |
| IFB Ser. 11-128, Class TS, IO, 5 7/8s, 2041 | 25,380,281 | 5,418,690 |
| IFB Ser. 11-13, Class SB, IO, 5.778s, 2041 | 7,748,542 | 1,374,032 |
| IFB Ser. 11-70, Class SM, IO, 5.715s, 2041 | 5,789,000 | 1,425,715 |
| IFB Ser. 10-31, Class SA, IO, 5.578s, 2040 | 10,149,991 | 1,717,900 |
| IFB Ser. 10-37, Class SG, IO, 5.528s, 2040 | 12,983,882 | 2,109,751 |
| IFB Ser. 10-42, Class SK, IO, 5.498s, 2040 | 7,426,802 | 1,138,529 |
| Ser. 13-3, Class IT, IO, 5s, 2043 | 8,997,395 | 1,876,486 |
| Ser. 11-116, Class IB, IO, 5s, 2040 | 10,762,073 | 926,321 |
| Ser. 13-16, Class IB, IO, 5s, 2040 | 18,699,223 | 1,928,400 |
| Ser. 10-35, Class UI, IO, 5s, 2040 | 10,564,792 | 2,194,828 |
| Ser. 10-9, Class UI, IO, 5s, 2040 | 70,310,063 | 14,419,541 |
| Ser. 09-121, Class UI, IO, 5s, 2039 | 20,623,978 | 4,212,448 |
| Ser. 12-129, Class IO, IO, 4 1/2s, 2042 | 8,650,870 | 2,104,757 |
| Ser. 10-35, Class QI, IO, 4 1/2s, 2040 | 9,411,689 | 1,958,698 |
| Ser. 10-9, Class QI, IO, 4 1/2s, 2040 | 31,347,301 | 6,511,963 |
| Ser. 11-116, Class IA, IO, 4 1/2s, 2039 | 8,500,812 | 1,309,805 |
| Ser. 12-56, Class IB, IO, 4s, 2042 | 17,717,874 | 3,691,345 |
| Ser. 13-37, Class JI, IO, 3 1/2s, 2043 | 9,813,324 | 1,542,066 |
| Ser. 13-27, Class PI, IO, 3 1/2s, 2042 | 11,833,690 | 1,930,903 |
| Ser. 12-71, Class AI, IO, 3 1/2s, 2042 | 22,519,650 | 2,939,039 |
| | |
| MORTGAGE-BACKED SECURITIES (48.2%)* cont. | Principal amount | Value |
|
| Agency collateralized mortgage obligations cont. | | |
| Government National Mortgage Association | | |
| Ser. 13-18, Class GI, IO, 3 1/2s, 2041 | $10,530,134 | $1,684,821 |
| Ser. 12-48, Class KI, IO, 3 1/2s, 2039 | 8,943,827 | 1,492,814 |
| Ser. 13-53, Class PI, IO, 3s, 2041 | 15,616,106 | 2,087,093 |
| Ser. 13-23, Class IK, IO, 3s, 2037 | 3,988,575 | 691,579 |
| IFB Ser. 11-70, Class YI, IO, 0.15s, 2040 | 15,722,313 | 83,800 |
| Ser. 10-151, Class KO, PO, zero %, 2037 | 796,140 | 689,823 |
| Ser. 06-36, Class OD, PO, zero %, 2036 | 45,913 | 42,412 |
|
| Structured Asset Securities Corp. 144A | | |
| Ser. 98-RF3, Class A, IO, 6.1s, 2028 | 443,546 | 73,185 |
| IFB Ser. 07-4, Class 1A3, IO, 5.997s, 2045 | 32,273,154 | 5,647,802 |
|
| | | 308,334,118 |
| Commercial mortgage-backed securities (15.8%) | | |
| Banc of America Commercial Mortgage Trust | | |
| FRB Ser. 05-5, Class B, 5.223s, 2045 | 6,500,000 | 6,768,450 |
| FRB Ser. 05-1, Class A4, 5.168s, 2042 | 1,075,127 | 1,107,994 |
| Ser. 04-4, Class D, 5.073s, 2042 | 994,000 | 1,020,093 |
| Ser. 07-1, Class XW, IO, 0.323s, 2049 | 8,699,398 | 68,490 |
|
| Banc of America Commercial Mortgage Trust 144A | | |
| Ser. 04-4, Class XC, IO, 0.823s, 2042 | 16,162,580 | 64,586 |
| Ser. 04-5, Class XC, IO, 0.697s, 2041 | 31,886,828 | 170,021 |
| Ser. 02-PB2, Class XC, IO, 0.403s, 2035 | 6,627,411 | 66 |
| Ser. 07-5, Class XW, IO, 0.367s, 2051 | 19,721,270 | 192,598 |
| Ser. 05-1, Class XW, IO, 0.038s, 2042 | 221,636,795 | 50,533 |
|
| Bear Stearns Commercial Mortgage Securities, Inc. Ser. 04-PR3I, | | |
| Class X1, IO, 0.895s, 2041 | 4,452,664 | 34,824 |
|
| Bear Stearns Commercial Mortgage Securities, Inc. 144A | | |
| FRB Ser. 06-PW11, Class B, 5.443s, 2039 | 1,881,000 | 1,877,050 |
| Ser. 06-PW14, Class X1, IO, 0.167s, 2038 | 16,028,404 | 275,689 |
|
| CFCRE Commercial Mortgage Trust 144A FRB Ser. 11-C2, | | |
| Class D, 5.559s, 2047 | 1,750,000 | 1,791,650 |
|
| Citigroup Commercial Mortgage Trust 144A | | |
| FRB Ser. 12-GC8, Class D, 4.878s, 2045 | 7,098,000 | 6,540,807 |
| Ser. 06-C5, Class XC, IO, 0.144s, 2049 | 112,018,142 | 1,646,667 |
|
| Citigroup/Deutsche Bank Commercial Mortgage Trust 144A | | |
| Ser. 07-CD4, Class XW, IO, 0.378s, 2049 | 46,219,725 | 499,173 |
| Ser. 07-CD4, Class XC, IO, 0.169s, 2049 | 146,564,270 | 1,377,704 |
|
| Commercial Mortgage Trust | | |
| Ser. 07-C9, Class AJ, 5.65s, 2049 | 3,377,000 | 3,549,565 |
| Pass-Through Certificates Ser. 12-CR3, Class XA, IO, | | |
| 2.204s, 2045 | 25,114,345 | 3,234,728 |
|
| Commercial Mortgage Trust 144A | | |
| FRB Ser. 07-C9, Class AJFL, 0.864s, 2049 | 1,943,000 | 1,709,840 |
| Pass-Through Certificates Ser. 06-C8, Class XS, IO, | | |
| 0.162s, 2046 | 50,260,534 | 659,548 |
|
| Credit Suisse First Boston Commercial Mortgage Trust | | |
| Ser. 05-C5, Class C, 5.1s, 2038 | 1,487,000 | 1,524,937 |
|
| Credit Suisse Mortgage Capital Certificates FRB Ser. 07-C4, | | |
| Class A2, 5.761s, 2039 | 3,069,464 | 3,074,931 |
|
| | |
| MORTGAGE-BACKED SECURITIES (48.2%)* cont. | Principal amount | Value |
|
| Commercial mortgage-backed securities cont. | | |
| Credit Suisse Mortgage Capital Certificates 144A Ser. 07-C2, | | |
| Class AX, IO, 0.071s, 2049 | $84,643,848 | $278,224 |
|
| CS First Boston Mortgage Securities Corp. Ser. 03-CPN1, | | |
| Class E, 4.891s, 2035 | 1,528,000 | 1,528,000 |
|
| CS First Boston Mortgage Securities Corp. 144A | | |
| Ser. 98-C1, Class F, 6s, 2040 | 1,846,736 | 2,031,409 |
| Ser. 03-C3, Class AX, IO, 1.322s, 2038 | 4,086,335 | 41 |
| Ser. 02-CP3, Class AX, IO, 1.23s, 2035 | 1,523,954 | 10,636 |
|
| DBRR Trust 144A FRB Ser. 13-EZ3, Class A, 1.636s, 2049 | 9,610,402 | 9,625,418 |
|
| Deutsche Bank-UBS Commercial Mortgage Trust 144A FRB | | |
| Ser. 11-LC2A, Class D, 5.444s, 2044 | 500,000 | 500,617 |
|
| DLJ Commercial Mortgage Corp. 144A FRB Ser. 98-CG1, | | |
| Class B4, 7.172s, 2031 | 192,289 | 192,574 |
|
| First Union National Bank-Bank of America Commercial | | |
| Mortgage Trust 144A Ser. 01-C1, Class 3, IO, 1.692s, 2033 | 974,910 | 4,760 |
|
| GE Business Loan Trust 144A Ser. 04-2, Class D, 2.924s, 2032 F | 209,192 | 104,069 |
|
| GE Capital Commercial Mortgage Corp. 144A | | |
| Ser. 05-C3, Class XC, IO, 0.16s, 2045 | 260,189,922 | 725,935 |
| Ser. 07-C1, Class XC, IO, 0.112s, 2049 | 124,956,542 | 642,776 |
|
| GE Commercial Mortgage Corporation Trust FRB Ser. 05-C1, | | |
| Class B, 4.846s, 2048 | 3,997,000 | 4,093,895 |
|
| GMAC Commercial Mortgage Securities, Inc. | | |
| Ser. 97-C1, Class X, IO, 1.291s, 2029 | 2,316,011 | 61,557 |
| Ser. 05-C1, Class X1, IO, 0.602s, 2043 | 30,327,605 | 221,301 |
|
| Greenwich Capital Commercial Funding Corp. FRB Ser. 05-GG3, | | |
| Class B, 4.894s, 2042 | 1,894,000 | 1,944,570 |
|
| GS Mortgage Securities Corp. II 144A Ser. 06-GG6, Class XC, IO, | | |
| 0.082s, 2038 | 91,921,304 | 106,721 |
|
| GS Mortgage Securities Trust | | |
| FRB Ser. 04-GG2, Class D, 5.645s, 2038 | 1,628,000 | 1,653,946 |
| Ser. 06-GG8, Class AJ, 5.622s, 2039 | 866,000 | 847,042 |
| Ser. 06-GG6, Class A2, 5.506s, 2038 | 1,454,564 | 1,472,746 |
|
| GS Mortgage Securities Trust 144A | | |
| Ser. 98-C1, Class F, 6s, 2030 | 125,225 | 125,225 |
| FRB Ser. GC10, Class D, 4.415s, 2046 | 3,433,000 | 3,023,100 |
|
| JPMorgan Chase Commercial Mortgage Securities Trust | | |
| FRB Ser. 07-CB20, Class AJ, 6.072s, 2051 | 3,663,000 | 3,742,121 |
| FRB Ser. 07-LD12, Class A3, 5.925s, 2051 | 19,773,000 | 20,272,130 |
| FRB Ser. 06-LDP7, Class B, 5.863s, 2045 | 3,516,000 | 3,042,594 |
| Ser. 07-LD12, Class A2, 5.827s, 2051 | 98,240 | 98,240 |
| FRB Ser. 07-LD11, Class A2, 5.798s, 2049 | 2,303,860 | 2,308,468 |
| FRB Ser. 04-CB9, Class B, 5.647s, 2041 | 2,374,000 | 2,436,911 |
| FRB Ser. 06-CB14, Class A3B, 5.486s, 2044 | 811,924 | 814,261 |
| Ser. 02-C3, Class D, 5.314s, 2035 | 188,174 | 188,409 |
| FRB Ser. 04-CBX, Class B, 5.021s, 2037 | 1,143,000 | 1,134,532 |
| FRB Ser. 13-C10, Class D, 4.161s, 2047 | 1,709,000 | 1,456,924 |
| Ser. 06-LDP8, Class X, IO, 0.546s, 2045 | 50,202,452 | 706,700 |
| Ser. 07-LDPX, Class X, IO, 0.302s, 2049 | 66,980,878 | 577,710 |
|
| | |
| MORTGAGE-BACKED SECURITIES (48.2%)* cont. | Principal amount | Value |
|
| Commercial mortgage-backed securities cont. | | |
| JPMorgan Chase Commercial Mortgage Securities Trust 144A | | |
| FRB Ser. 10-C1, Class D, 6.312s, 2043 | $3,439,000 | $3,627,805 |
| FRB Ser. 07-CB20, Class C, 6.172s, 2051 | 1,556,000 | 1,453,506 |
| FRB Ser. 01-C1, Class H, 5.626s, 2035 | 1,338,565 | 1,341,243 |
| FRB Ser. 11-C3, Class E, 5.541s, 2046 | 1,416,000 | 1,464,994 |
| FRB Ser. 12-C8, Class D, 4.668s, 2045 | 5,984,000 | 5,800,447 |
| FRB Ser. 12-LC9, Class E, 4.427s, 2047 | 932,000 | 819,583 |
| FRB Ser. 12_LC9, Class D, 4.427s, 2047 | 3,277,000 | 3,088,316 |
| Ser. 05-CB12, Class X1, IO, 0.34s, 2037 | 25,808,440 | 149,560 |
| Ser. 06-LDP6, Class X1, IO, 0.078s, 2043 | 48,087,106 | 139,741 |
|
| LB Commercial Conduit Mortgage Trust 144A | | |
| Ser. 99-C1, Class F, 6.41s, 2031 | 248,114 | 249,974 |
| Ser. 99-C1, Class G, 6.41s, 2031 | 851,777 | 886,814 |
| Ser. 98-C4, Class G, 5.6s, 2035 | 93,740 | 96,009 |
| Ser. 98-C4, Class H, 5.6s, 2035 | 808,000 | 857,127 |
|
| LB-UBS Commercial Mortgage Trust | | |
| FRB Ser. 06-C6, Class AJ, 5.452s, 2039 | 3,913,000 | 4,186,268 |
| Ser. 06-C7, Class A2, 5.3s, 2038 | 2,170,479 | 2,260,857 |
| Ser. 07-C2, Class XW, IO, 0.538s, 2040 | 5,910,496 | 105,538 |
|
| LB-UBS Commercial Mortgage Trust 144A | | |
| FRB Ser. 04-C1, Class G, 5.077s, 2036 | 7,400,000 | 7,002,294 |
| Ser. 06-C7, Class XW, IO, 0.651s, 2038 | 37,064,025 | 665,522 |
| Ser. 05-C5, Class XCL, IO, 0.462s, 2040 | 83,829,807 | 768,552 |
| Ser. 05-C2, Class XCL, IO, 0.348s, 2040 | 137,505,314 | 477,968 |
| Ser. 06-C7, Class XCL, IO, 0.256s, 2038 | 61,933,991 | 1,087,685 |
| Ser. 05-C7, Class XCL, IO, 0.207s, 2040 | 116,880,592 | 458,406 |
| Ser. 07-C2, Class XCL, IO, 0.131s, 2040 | 130,919,906 | 2,089,613 |
|
| Merrill Lynch Mortgage Investors, Inc. Ser. 96-C2, Class JS, IO, | | |
| 2.377s, 2028 | 39,018 | 4 |
|
| Merrill Lynch Mortgage Trust | | |
| FRB Ser. 08-C1, Class AJ, 6.263s, 2051 | 1,828,000 | 1,906,970 |
| FRB Ser. 07-C1, Class A3, 5.852s, 2050 | 1,012,000 | 1,036,622 |
| FRB Ser. 05-CKI1, Class B, 5.28s, 2037 | 10,872,000 | 11,169,893 |
|
| Merrill Lynch Mortgage Trust 144A | | |
| Ser. 04-KEY2, Class XC, IO, 0.93s, 2039 | 12,752,006 | 71,067 |
| Ser. 05-MCP1, Class XC, IO, 0.59s, 2043 | 36,006,277 | 276,492 |
|
| Merrill Lynch/Countrywide Commercial Mortgage Trust FRB | | |
| Ser. 06-4, Class A2FL, 0.294s, 2049 | 480,986 | 480,385 |
|
| Merrill Lynch/Countrywide Financial Corp. Commercial | | |
| Mortgage Trust Ser. 06-4, Class AJ, 5.239s, 2049 | 1,286,000 | 1,221,700 |
|
| Mezz Cap Commercial Mortgage Trust 144A | | |
| Ser. 04-C1, Class X, IO, 8.619s, 2037 | 764,431 | 35,393 |
| Ser. 06-C4, Class X, IO, 6.109s, 2045 | 4,937,942 | 481,449 |
| Ser. 05-C3, Class X, IO, 5.953s, 2044 | 1,762,681 | 166,045 |
|
| Morgan Stanley Capital I Trust | | |
| FRB Ser. 06-T23, Class A2, 5.741s, 2041 | 62,690 | 62,690 |
| Ser. 07-IQ14, Class A2, 5.61s, 2049 | 877,497 | 884,663 |
| | |
| MORTGAGE-BACKED SECURITIES (48.2%)* cont. | Principal amount | Value |
|
| Commercial mortgage-backed securities cont. | | |
| Morgan Stanley Capital I Trust | | |
| FRB Ser. 07-HQ12, Class A2, 5.579s, 2049 | $2,003,220 | $2,009,229 |
| FRB Ser. 07-HQ12, Class A2FX, 5.579s, 2049 | 6,133,031 | 6,256,919 |
|
| Morgan Stanley ReREMIC Trust 144A FRB Ser. 10-C30A, | | |
| Class A3B, 5.246s, 2043 | 424,262 | 432,590 |
|
| Morgan Stanley/Bank of America/Merrill Lynch Trust 144A | | |
| Ser. 13-C10, Class D, 4.083s, 2046 | 1,803,000 | 1,438,632 |
|
| TIAA Real Estate CDO, Ltd. Ser. 03-1A, Class E, 8s, 2038 | 1,577,941 | 394,485 |
|
| UBS-Barclays Commercial Mortgage Trust 144A | | |
| FRB Ser. 12-C3, Class D, 4.958s, 2049 | 2,810,000 | 2,552,171 |
| Ser. 12-C4, Class XA, IO, 1.884s, 2045 | 23,873,626 | 2,784,190 |
|
| Wachovia Bank Commercial Mortgage Trust | | |
| Ser. 06-C24, Class AJ, 5.658s, 2045 | 2,171,000 | 2,093,495 |
| Ser. 05-C17, Class D, 5.396s, 2042 | 6,740,000 | 6,638,226 |
| Ser. 06-C29, IO, 0.393s, 2048 | 177,523,974 | 2,089,457 |
| Ser. 07-C34, IO, 0.337s, 2046 | 16,304,776 | 197,288 |
|
| Wachovia Bank Commercial Mortgage Trust 144A | | |
| Ser. 05-C18, Class XC, IO, 0.326s, 2042 | 22,783,196 | 90,905 |
| Ser. 06-C26, Class XC, IO, 0.051s, 2045 | 10,954,877 | 20,157 |
|
| WF-RBS Commercial Mortgage Trust 144A | | |
| FRB Ser. 11-C4, Class E, 5.248s, 2044 | 3,999,768 | 3,892,377 |
| FRB Ser. 12-C10, Class D, 4.46s, 2045 | 2,618,000 | 2,342,901 |
| FRB Ser. 13-C11, Class D, 4.184s, 2045 | 1,605,000 | 1,338,169 |
|
| | | 194,655,892 |
| Residential mortgage-backed securities (non-agency) (7.3%) | | |
| Citigroup Mortgage Loan Trust, Inc. Ser. 2005-WF2, Class AF4, | | |
| 4.964s, 2035 | 1,141,114 | 1,138,261 |
|
| Citigroup Mortgage Loan Trust, Inc. 144a Ser. 10-8, Class 1A2, | | |
| 5 1/2s, 2036 | 1,300,000 | 1,274,000 |
|
| Countrywide Asset Backed Certificates FRB Ser. 05-AB1, | | |
| Class A3, 0.77s, 2035 | 10,723,146 | 10,052,949 |
|
| First Plus Home Loan Trust Ser. 97-3, Class B1, 7.79s, 2023 | | |
| (In default) † | 134,710 | 13 |
|
| Harborview Mortgage Loan Trust FRB Ser. 05-9, Class 2A1B, | | |
| 0.543s, 2035 | 7,878,121 | 7,216,359 |
|
| Mortgageit Trust FRB Ser. 05-1, Class 1M2, 0.76s, 2035 | 3,861,035 | 3,262,876 |
|
| WAMU Mortgage Pass-Through Certificates | | |
| FRB Ser. 05-AR11, Class A1C3, 0.68s, 2045 | 4,778,701 | 3,942,428 |
| FRB Ser. 2004-AR13, Class A1B2, 0.678s, 2034 | 12,169,628 | 10,952,665 |
| FRB Ser. 05-AR19, Class A1C3, 0.67s, 2045 | 12,214,453 | 10,260,141 |
| FRB Ser. 05-AR11, Class A1B2, 0.62s, 2045 | 4,994,982 | 4,295,684 |
| FRB Ser. 05-AR13, Class A1C4, 0.6s, 2045 | 20,164,757 | 17,140,044 |
| FRB Ser. 05-AR17, Class A1B2, 0.58s, 2045 | 6,751,251 | 5,806,076 |
| FRB Ser. 05-AR11, Class A1B3, 0.57s, 2045 | 8,897,377 | 7,740,718 |
| FRB Ser. 05-AR8, Class 2AC3, 0.56s, 2045 | 5,236,264 | 4,558,167 |
| FRB Ser. 2005-AR17, Class A1B3, 0.52s, 2045 | 2,008,712 | 1,777,710 |
|
| | | 89,418,091 |
| | | |
| Total mortgage-backed securities (cost $544,315,512) | | $592,408,101 |
| | |
| U.S. GOVERNMENT AND AGENCY | | |
| MORTGAGE OBLIGATIONS (34.3%)* | Principal amount | Value |
|
| U.S. Government Guaranteed Mortgage Obligations (5.9%) | | |
| Government National Mortgage Association Pass-Through Certificates | | |
| 5s, TBA, November 1, 2043 | $10,000,000 | $10,884,375 |
| 4 1/2s, TBA, November 1, 2043 | 45,000,000 | 48,747,654 |
| 3 1/2s, TBA, November 1, 2043 | 12,000,000 | 12,464,063 |
|
| | | 72,096,092 |
| U.S. Government Agency Mortgage Obligations (28.4%) | | |
| Federal Home Loan Mortgage Corporation Pass-Through Certificates | | |
| 4s, with due dates from June 1, 2042 to June 1, 2043 | 35,157,211 | 36,805,205 |
|
| Federal National Mortgage Association Pass-Through Certificates | | |
| 7s, January 1, 2017 | 2,551 | 2,642 |
| 6s, TBA, November 1, 2043 | 10,000,000 | 10,960,938 |
| 4s, with due dates from June 1, 2042 to November 1, 2042 | 124,437,157 | 130,386,808 |
| 4s, TBA, December 1, 2043 | 6,000,000 | 6,303,985 |
| 4s, TBA, November 1, 2043 | 16,000,000 | 16,857,501 |
| 3 1/2s, with due dates from November 1, 2042 to May 1, 2043 | 51,744,977 | 52,743,494 |
| 3 1/2s, TBA, December 1, 2043 | 22,000,000 | 22,515,625 |
| 3 1/2s, TBA, November 1, 2043 | 22,000,000 | 22,575,782 |
| 3s, TBA, November 1, 2043 | 51,000,000 | 50,338,591 |
|
| | | 349,490,571 |
| | | |
| Total U.S. government and agency mortgage obligations (cost $429,101,386) | $421,586,663 |
|
| |
| U.S. TREASURY OBLIGATIONS (—%)* | Principal amount | Value |
|
| U.S. Treasury Notes 2s, September 30, 2020 | $429,000 | $431,074 |
|
| Total U.S. treasury obligations (cost $428,734) | | $431,074 |
|
| |
| CORPORATE BONDS AND NOTES (27.2%)* | Principal amount | Value |
|
| Basic materials (1.7%) | | |
| Ashland, Inc. company guaranty sr. unsec. unsub. notes | | |
| 4 3/4s, 2022 | $571,000 | $548,160 |
|
| Celanese US Holdings, LLC sr. notes 5 7/8s, 2021 (Germany) | 835,000 | 893,450 |
|
| CF Industries, Inc. company guaranty sr. unsec. unsub. notes | | |
| 7 1/8s, 2020 | 112,000 | 133,427 |
|
| Cytec Industries, Inc. sr. unsec. unsub. notes 3 1/2s, 2023 | 355,000 | 335,758 |
|
| Eastman Chemical Co. sr. unsec. notes 3.6s, 2022 | 1,245,000 | 1,216,204 |
|
| Eastman Chemical Co. sr. unsec. unsub. notes 6.3s, 2018 | 300,000 | 344,810 |
|
| FMC Corp. sr. unsec. unsub. notes 5.2s, 2019 | 625,000 | 690,542 |
|
| Georgia-Pacific, LLC sr. unsec. unsub. notes 7 3/4s, 2029 | 470,000 | 600,662 |
|
| International Paper Co. sr. unsec. notes 8.7s, 2038 | 510,000 | 718,331 |
|
| International Paper Co. sr. unsec. notes 7.95s, 2018 | 1,400,000 | 1,734,372 |
|
| LYB International Finance BV sr. unsec. unsub. notes 4s, | | |
| 2023 (Netherlands) | 610,000 | 612,737 |
|
| LyondellBasell Industries NV sr. unsec. notes 6s, 2021 | 1,935,000 | 2,251,380 |
|
| Mosaic Co. (The) sr. unsec. notes 3 3/4s, 2021 | 640,000 | 631,552 |
|
| Packaging Corp. of America sr. unsec. unsub. notes 4 1/2s, 2023 | 215,000 | 219,802 |
|
| Packaging Corp. of America sr. unsec. unsub. notes 3.9s, 2022 | 945,000 | 935,881 |
|
| PPG Industries, Inc. sr. unsec. unsub. debs. 7.4s, 2019 | 1,130,000 | 1,361,859 |
|
| | |
| CORPORATE BONDS AND NOTES (27.2%)* cont. | Principal amount | Value |
|
| Basic materials cont. | | |
| Rock-Tenn Co. company guaranty sr. unsec. unsub. | | |
| notes 4.9s, 2022 | $899,000 | $948,366 |
|
| Rock-Tenn Co. company guaranty sr. unsec. unsub. notes | | |
| 4.45s, 2019 | 393,000 | 420,331 |
|
| Temple-Inland, Inc. sr. unsec. unsub. notes 6 5/8s, 2018 | 1,080,000 | 1,261,418 |
|
| Union Carbide Corp. sr. unsec. unsub. bonds 7 3/4s, 2096 | 135,000 | 150,123 |
|
| Westvaco Corp. company guaranty sr. unsec. unsub. notes | | |
| 7.95s, 2031 | 1,470,000 | 1,746,109 |
|
| Weyerhaeuser Co. sr. unsec. unsub. notes 7 3/8s, 2032 R | 1,385,000 | 1,722,164 |
|
| Xstrata Finance Canada, Ltd. 144A company guaranty sr. unsec. | | |
| notes 6s, 2041 (Canada) | 590,000 | 568,612 |
|
| Xstrata Finance Canada, Ltd. 144A company guaranty sr. unsec. | | |
| unsub. bonds 5.8s, 2016 (Canada) | 610,000 | 671,789 |
|
| | | 20,717,839 |
| Capital goods (0.8%) | | |
| B/E Aerospace, Inc. sr. unsec. unsub. notes 5 1/4s, 2022 | 1,085,000 | 1,113,481 |
|
| Crown Americas, LLC/Crown Americas Capital Corp. IV 144A | | |
| company guaranty sr. unsec. notes 4 1/2s, 2023 | 450,000 | 418,500 |
|
| Delphi Corp. company guaranty sr. unsec. unsub. notes 5s, 2023 | 2,099,000 | 2,214,445 |
|
| Legrand France SA sr. unsec. unsub. debs 8 1/2s, 2025 (France) | 1,393,000 | 1,824,343 |
|
| Parker Hannifin Corp. sr. unsec. unsub. notes Ser. MTN, | | |
| 6 1/4s, 2038 | 435,000 | 530,642 |
|
| Republic Services, Inc. company guaranty sr. unsec. | | |
| notes 5.7s, 2041 | 595,000 | 648,772 |
|
| Republic Services, Inc. company guaranty sr. unsec. | | |
| notes 3.8s, 2018 | 720,000 | 771,872 |
|
| Republic Services, Inc. company guaranty sr. unsec. unsub. | | |
| notes 5 1/2s, 2019 | 660,000 | 752,203 |
|
| Staples, Inc. sr. unsec. unsub. notes 2 3/4s, 2018 | 905,000 | 916,710 |
|
| United Technologies Corp. sr. unsec. notes 5.7s, 2040 | 100,000 | 116,961 |
|
| United Technologies Corp. sr. unsec. unsub. notes 3.1s, 2022 | 560,000 | 553,201 |
|
| | | 9,861,130 |
| Communication services (2.8%) | | |
| America Movil SAB de CV company guaranty sr. unsec. unsub. | | |
| notes 6 1/8s, 2040 (Mexico) | 880,000 | 941,190 |
|
| America Movil SAB de CV company guaranty unsec. unsub. | | |
| notes 2 3/8s, 2016 (Mexico) | 670,000 | 682,900 |
|
| American Tower Corp. sr. unsec. notes 7s, 2017 R | 1,210,000 | 1,404,845 |
|
| CC Holdings GS V, LLC/Crown Castle GS III Corp. company | | |
| guaranty sr. notes 3.849s, 2023 | 1,415,000 | 1,343,336 |
|
| CenturyLink, Inc. sr. unsec. debs. notes Ser. G, 6 7/8s, 2028 | 2,025,000 | 1,873,125 |
|
| Comcast Corp. company guaranty sr. unsec. unsub. notes | | |
| 6 1/2s, 2035 | 700,000 | 851,347 |
|
| Corning, Inc. sr. unsec. unsub. notes 5 3/4s, 2040 | 265,000 | 299,392 |
|
| Crown Castle Towers, LLC 144A company guaranty sr. notes | | |
| 4.883s, 2020 | 1,915,000 | 2,059,778 |
|
| Frontier Communications Corp. sr. unsec. notes 8 1/2s, 2020 | 800,000 | 914,000 |
|
| NBCUniversal Media, LLC sr. unsec. unsub. notes 6.4s, 2040 | 845,000 | 1,022,412 |
|
| Orange SA sr. unsec. unsub. notes 5 3/8s, 2019 (France) | 880,000 | 993,619 |
|
| Orange SA sr. unsec. unsub. notes 4 1/8s, 2021 (France) | 886,000 | 913,680 |
|
| Qwest Corp. sr. unsec. notes 6 3/4s, 2021 | 1,394,000 | 1,523,055 |
|
| | |
| CORPORATE BONDS AND NOTES (27.2%)* cont. | Principal amount | Value |
|
| Communication services cont. | | |
| Rogers Communications, Inc. company guaranty notes 6.8s, | | |
| 2018 (Canada) | $610,000 | $733,115 |
|
| Rogers Communications, Inc. company guaranty sr. unsec. | | |
| unsub. notes 4 1/2s, 2043 (Canada) | 425,000 | 376,578 |
|
| SBA Tower Trust 144A company guaranty sr. notes 5.101s, 2017 | 2,425,000 | 2,642,313 |
|
| SBA Tower Trust 144A notes 2.933s, 2017 | 280,000 | 288,834 |
|
| SES 144A company guaranty sr. unsec. notes 5.3s, | | |
| 2043 (France) | 920,000 | 878,306 |
|
| TCI Communications, Inc. company guaranty sr. unsec. unsub. | | |
| debs. 7 7/8s, 2026 | 2,435,000 | 3,240,927 |
|
| Telecom Italia Capital SA company guaranty sr. unsec. unsub. | | |
| notes 6.175s, 2014 (Italy) | 621,000 | 637,978 |
|
| Telefonica Emisiones SAU company guaranty sr. unsec. notes | | |
| 5.462s, 2021 (Spain) | 1,845,000 | 1,954,803 |
|
| Telefonica Emisiones SAU company guaranty sr. unsec. notes | | |
| 4.57s, 2023 (Spain) | 770,000 | 767,455 |
|
| Telefonica Emisiones SAU company guaranty sr. unsec. unsub. | | |
| notes 3.192s, 2018 (Spain) | 850,000 | 862,459 |
|
| Time Warner Cable, Inc. company guaranty sr. notes 7.3s, 2038 | 1,165,000 | 1,174,663 |
|
| Time Warner Cable, Inc. company guaranty sr. unsec. notes | | |
| 6 3/4s, 2018 | 355,000 | 399,398 |
|
| Time Warner Cable, Inc. company guaranty sr. unsec. unsub. | | |
| notes 6 3/4s, 2039 | 350,000 | 333,377 |
|
| Time Warner Cable, Inc. company guaranty sr. unsec. unsub. | | |
| notes 5 1/2s, 2041 | 85,000 | 69,584 |
|
| Time Warner Cable, Inc. sr. unsec. FRN notes 8 3/4s, 2019 | 800,000 | 953,392 |
|
| Time Warner Entertainment Co., LP company guaranty sr. | | |
| unsec. bonds 8 3/8s, 2033 | 449,000 | 491,651 |
|
| Time Warner Entertainment Co., LP sr. unsec. debs. 8 3/8s, 2023 | 1,119,000 | 1,313,849 |
|
| Verizon Communications, Inc. sr. unsec. unsub. notes 6.4s, 2033 | 985,000 | 1,112,291 |
|
| Verizon New Jersey, Inc. company guaranty sr. unsec. unsub. | | |
| bonds 8s, 2022 | 640,000 | 772,829 |
|
| Verizon Pennsylvania, Inc. company guaranty sr. unsec. bonds | | |
| 8.35s, 2030 | 795,000 | 972,065 |
|
| | | 34,798,546 |
| Consumer cyclicals (2.4%) | | |
| Autonation, Inc. company guaranty sr. unsec. notes | | |
| 6 3/4s, 2018 | 645,000 | 741,750 |
|
| CBS Corp. company guaranty sr. unsec. debs. 7 7/8s, 2030 | 2,400,000 | 2,985,926 |
|
| Choice Hotels International, Inc. company guaranty sr. unsec. | | |
| unsub. notes 5.7s, 2020 | 1,195,000 | 1,244,294 |
|
| Expedia, Inc. company guaranty sr. unsec. unsub. notes | | |
| 5.95s, 2020 | 950,000 | 1,008,359 |
|
| Ford Motor Co. sr. unsec. unsub. notes 7.4s, 2046 | 350,000 | 432,740 |
|
| Ford Motor Credit Co., LLC sr. unsec. notes 4.207s, 2016 | 2,760,000 | 2,945,778 |
|
| Ford Motor Credit Co., LLC sr. unsec. unsub. notes 5 7/8s, 2021 | 1,675,000 | 1,919,002 |
|
| Ford Motor Credit Co., LLC sr. unsec. unsub. notes 5 3/4s, 2021 | 400,000 | 455,627 |
|
| General Motors Financial Co., Inc. 144A sr. unsec. notes | | |
| 3 1/4s, 2018 | 661,000 | 658,521 |
|
| General Motors Financial Co., Inc. 144A sr. unsec. notes | | |
| 2 3/4s, 2016 | 944,000 | 951,080 |
|
| | |
| CORPORATE BONDS AND NOTES (27.2%)* cont. | Principal amount | Value |
|
| Consumer cyclicals cont. | | |
| GLP Capital LP/GLP Financing II, Inc. 144A company guaranty | | |
| sr. unsec. notes 4 3/8s, 2018 | $130,000 | $132,600 |
|
| Grupo Televisa SAB sr. unsec. unsub. notes 6 5/8s, | | |
| 2025 (Mexico) | 510,000 | 596,001 |
|
| Historic TW, Inc. company guaranty sr. unsec. unsub. bonds | | |
| 9.15s, 2023 | 675,000 | 910,456 |
|
| Host Hotels & Resorts LP sr. unsec. unsub. notes 6s, 2021 R | 266,000 | 294,444 |
|
| Host Hotels & Resorts LP sr. unsec. unsub. notes 5 1/4s, 2022 R | 124,000 | 131,182 |
|
| Hyatt Hotels Corp. sr. unsec. unsub. notes 3 3/8s, 2023 | 660,000 | 623,840 |
|
| L Brands, Inc. company guaranty sr. unsec. notes 6 5/8s, 2021 | 840,000 | 924,000 |
|
| L Brands, Inc. sr. notes 5 5/8s, 2022 | 820,000 | 845,625 |
|
| Macy’s Retail Holdings, Inc. company guaranty sr. unsec. | | |
| notes 6.9s, 2029 | 345,000 | 394,094 |
|
| Macy’s Retail Holdings, Inc. company guaranty sr. unsec. notes | | |
| 6.65s, 2024 | 405,000 | 482,294 |
|
| Macy’s Retail Holdings, Inc. company guaranty sr. unsec. notes | | |
| 5 1/8s, 2042 | 240,000 | 231,616 |
|
| Macy’s Retail Holdings, Inc. company guaranty sr. unsec. notes | | |
| 3 7/8s, 2022 | 360,000 | 359,025 |
|
| Marriott International, Inc. sr. unsec. unsub. notes 3s, 2019 | 780,000 | 794,128 |
|
| News America Holdings, Inc. company guaranty sr. unsec. debs. | | |
| 7 3/4s, 2024 | 870,000 | 1,051,352 |
|
| News America Holdings, Inc. debs. 7 3/4s, 2045 | 790,000 | 995,707 |
|
| News America, Inc. company guaranty sr. unsec. unsub. | | |
| notes 6.2s, 2034 | 675,000 | 754,693 |
|
| NVR, Inc. sr. unsec. unsub. notes 3.95s, 2022 | 740,000 | 720,344 |
|
| O’Reilly Automotive, Inc. company guaranty sr. unsec. unsub. | | |
| notes 3.85s, 2023 | 640,000 | 628,708 |
|
| Owens Corning company guaranty sr. unsec. notes 9s, 2019 | 114,000 | 140,790 |
|
| Time Warner, Inc. company guaranty sr. unsec. bonds 7.7s, 2032 | 1,850,000 | 2,365,070 |
|
| TJX Cos., Inc. sr. unsec. notes 2 1/2s, 2023 | 1,020,000 | 953,484 |
|
| Walt Disney Co. (The) sr. unsec. notes 2 3/4s, 2021 | 1,305,000 | 1,290,228 |
|
| Walt Disney Co. (The) sr. unsec. unsub. notes 4 3/8s, 2041 | 520,000 | 504,403 |
|
| | | 29,467,161 |
| Consumer staples (2.3%) | | |
| Altria Group, Inc. company guaranty sr. unsec. bonds 4s, 2024 | 694,000 | 693,050 |
|
| Altria Group, Inc. company guaranty sr. unsec. notes 9.7s, 2018 | 308,000 | 413,599 |
|
| Altria Group, Inc. company guaranty sr. unsec. notes | | |
| 9 1/4s, 2019 | 586,000 | 782,145 |
|
| Anheuser-Busch InBev Worldwide, Inc. company guaranty sr. | | |
| unsec. unsub. notes 8.2s, 2039 | 1,313,000 | 1,975,243 |
|
| Bacardi, Ltd. 144A unsec. notes 4 1/2s, 2021 (Bermuda) | 1,430,000 | 1,527,386 |
|
| Campbell Soup Co. sr. unsec. unsub. notes 8 7/8s, 2021 | 715,000 | 942,818 |
|
| Corrections Corp. of America company guaranty sr. unsec. notes | | |
| 4 1/8s, 2020 R | 285,000 | 278,588 |
|
| CVS Pass-Through Trust 144A company guaranty sr. notes | | |
| 7.507s, 2032 | 2,140,272 | 2,595,305 |
|
| Darden Restaurants, Inc. sr. unsec. unsub. notes 6.8s, 2037 | 2,270,000 | 2,361,517 |
|
| Delhaize Group company guaranty sr. unsec. notes 4 1/8s, | | |
| 2019 (Belgium) | 360,000 | 374,813 |
|
| | |
| CORPORATE BONDS AND NOTES (27.2%)* cont. | Principal amount | Value |
|
| Consumer staples cont. | | |
| Diageo Investment Corp. company guaranty sr. unsec. | | |
| debs. 8s, 2022 | $675,000 | $898,376 |
|
| Erac USA Finance, LLC 144A sr. unsec. notes 4 1/2s, 2021 | 2,235,000 | 2,355,851 |
|
| Kerry Group Financial Services 144A company guaranty sr. | | |
| unsec. notes 3.2s, 2023 (Ireland) | 1,300,000 | 1,214,742 |
|
| Kraft Foods Group, Inc. sr. unsec. unsub. notes 6 1/2s, 2040 | 3,905,000 | 4,667,715 |
|
| Kraft Foods Group, Inc. sr. unsec. unsub. notes 5s, 2042 | 420,000 | 422,135 |
|
| Kroger Co. (The) company guaranty sr. unsec. unsub. | | |
| notes 6.4s, 2017 | 605,000 | 699,437 |
|
| Kroger Co. (The) sr. notes 6.15s, 2020 | 200,000 | 232,376 |
|
| McDonald’s Corp. sr. unsec. Ser. MTN, 6.3s, 2038 | 680,000 | 850,865 |
|
| McDonald’s Corp. sr. unsec. bonds 6.3s, 2037 | 530,000 | 664,752 |
|
| McDonald’s Corp. sr. unsec. notes 5.7s, 2039 | 775,000 | 907,082 |
|
| Molson Coors Brewing Co. company guaranty sr. unsec. unsub. | | |
| notes 5s, 2042 | 610,000 | 606,671 |
|
| SABMiller Holdings, Inc. 144A company guaranty sr. unsec. | | |
| notes 4.95s, 2042 | 630,000 | 643,861 |
|
| WPP Finance UK company guaranty sr. unsec. notes 8s, 2014 | | |
| (United Kingdom) | 1,370,000 | 1,452,118 |
|
| | | 27,560,445 |
| Energy (2.3%) | | |
| Access Midstream Partners LP/ACMP Finance Corp. company | | |
| guaranty sr. unsec. notes 5 7/8s, 2021 | 602,000 | 645,645 |
|
| Anadarko Finance Co. company guaranty sr. unsec. unsub. | | |
| notes Ser. B, 7 1/2s, 2031 | 2,880,000 | 3,667,199 |
|
| BG Energy Capital PLC 144A company guaranty sr. unsec. notes | | |
| 4s, 2021 (United Kingdom) | 200,000 | 208,385 |
|
| BP Capital Markets PLC company guaranty sr. unsec. unsub. | | |
| notes 4.742s, 2021 (United Kingdom) | 1,860,000 | 2,053,726 |
|
| BP Capital Markets PLC company guaranty sr. unsec. unsub. | | |
| notes 4 1/2s, 2020 (United Kingdom) | 620,000 | 679,900 |
|
| Continental Resources, Inc. company guaranty sr. unsec. notes | | |
| 4 1/2s, 2023 | 450,000 | 453,375 |
|
| DCP Midstream, LLC 144A sr. unsec. notes 5.35s, 2020 | 775,000 | 826,785 |
|
| Kerr-McGee Corp. company guaranty sr. unsec. unsub. notes | | |
| 7 7/8s, 2031 | 885,000 | 1,135,574 |
|
| Lukoil International Finance BV 144A company guaranty sr. | | |
| unsec. notes 4.563s, 2023 (Russia) | 1,040,000 | 996,012 |
|
| Marathon Petroleum Corp. sr. unsec. unsub. notes 6 1/2s, 2041 | 525,000 | 595,216 |
|
| Motiva Enterprises, LLC 144A sr. unsec. notes 6.85s, 2040 | 895,000 | 1,112,924 |
|
| Noble Holding International, Ltd. company guaranty sr. unsec. | | |
| notes 6.05s, 2041 | 1,095,000 | 1,129,712 |
|
| Petrobras Global Finance BV company guaranty sr. unsec. | | |
| unsub. notes 4 3/8s, 2023 (Brazil) | 820,000 | 757,178 |
|
| Petrohawk Energy Corp. company guaranty sr. unsec. notes | | |
| 7 1/4s, 2018 | 2,910,000 | 3,154,440 |
|
| Plains Exploration & Production Co. company guaranty sr. | | |
| unsec. notes 6 3/4s, 2022 | 1,680,000 | 1,847,412 |
|
| Pride International, Inc. sr. unsec. notes 7 7/8s, 2040 | 2,160,000 | 2,952,027 |
|
| Ras Laffan Liquefied Natural Gas Co., Ltd. 144A company | | |
| guaranty sr. notes 5 1/2s, 2014 (Qatar) | 1,015,000 | 1,055,600 |
|
| | |
| CORPORATE BONDS AND NOTES (27.2%)* cont. | Principal amount | Value |
|
| Energy cont. | | |
| Spectra Energy Capital, LLC company guaranty sr. unsec. notes | | |
| 5.65s, 2020 | $240,000 | $262,849 |
|
| Spectra Energy Capital, LLC company guaranty sr. unsec. unsub. | | |
| notes 6.2s, 2018 | 135,000 | 155,327 |
|
| Spectra Energy Capital, LLC sr. notes 8s, 2019 | 650,000 | 791,529 |
|
| Statoil ASA company guaranty sr. unsec. notes 5.1s, | | |
| 2040 (Norway) | 1,900,000 | 2,028,163 |
|
| Weatherford Bermuda company guaranty sr. unsec. notes | | |
| 9 5/8s, 2019 (Bermuda) | 584,000 | 745,141 |
|
| Weatherford International, LLC company guaranty sr. unsec. | | |
| unsub. notes 6.8s, 2037 | 205,000 | 219,696 |
|
| Weatherford International, LLC company guaranty sr. unsec. | | |
| unsub. notes 6.35s, 2017 | 240,000 | 272,499 |
|
| Weatherford International, Ltd. company guaranty notes 6 1/2s, | | |
| 2036 (Bermuda) | 82,000 | 84,803 |
|
| | | 27,831,117 |
| Financials (10.0%) | | |
| ABN Amro Bank NV 144A sr. unsec. notes 4 1/4s, | | |
| 2017 (Netherlands) | 4,460,000 | 4,799,807 |
|
| Aflac, Inc. sr. unsec. notes 6.9s, 2039 | 1,725,000 | 2,180,209 |
|
| Aflac, Inc. sr. unsec. notes 6.45s, 2040 | 675,000 | 817,807 |
|
| American International Group, Inc. jr. sub. FRB bonds | | |
| 8.175s, 2068 | 1,414,000 | 1,742,755 |
|
| Aon PLC company guaranty sr. unsec. unsub. notes 4 1/4s, 2042 | 3,255,000 | 2,852,705 |
|
| Associates Corp. of North America sr. unsec. notes 6.95s, 2018 | 1,764,000 | 2,107,999 |
|
| Assurant, Inc. sr. unsec. notes 6 3/4s, 2034 | 1,485,000 | 1,631,798 |
|
| AXA SA 144A jr. unsec. sub. FRN notes 6.463s, perpetual | | |
| maturity (France) | 1,630,000 | 1,656,488 |
|
| Banco del Estado de Chile 144A sr. unsec. notes 2s, 2017 (Chile) | 1,000,000 | 981,642 |
|
| Banco do Brasil SA 144A unsec. sub. notes 5 7/8s, 2022 (Brazil) | 1,965,000 | 1,982,923 |
|
| Bank of America Corp. sub. notes 7 3/4s, 2015 | 1,465,000 | 1,622,319 |
|
| Bank of America, NA sub. notes Ser. BKNT, 5.3s, 2017 | 905,000 | 1,004,990 |
|
| Barclays Bank PLC 144A sub. notes 10.179s, 2021 | | |
| (United Kingdom) | 2,881,000 | 3,814,242 |
|
| Barclays Bank PLC 144A unsec. sub. notes 6.05s, 2017 | | |
| (United Kingdom) | 381,000 | 428,566 |
|
| BBVA International Preferred SAU bank guaranty jr. unsec. sub. | | |
| FRN notes 5.919s, perpetual maturity (Spain) | 1,135,000 | 1,066,900 |
|
| Bear Stearns Cos., Inc. (The) sr. notes 6.4s, 2017 | 1,020,000 | 1,190,717 |
|
| Bear Stearns Cos., Inc. (The) sr. unsec. notes 7 1/4s, 2018 | 1,685,000 | 2,031,994 |
|
| Berkshire Hathaway Finance Corp. company guaranty sr. unsec. | | |
| unsub. notes 4.3s, 2043 | 2,065,000 | 1,922,517 |
|
| BPCE SA 144A unsec. sub. notes 5.7s, 2023 (France) | 265,000 | 271,776 |
|
| Capital One Bank USA NA unsec. sub. notes 3 3/8s, 2023 | 1,260,000 | 1,200,982 |
|
| Citigroup, Inc. sr. unsec. notes 8 1/2s, 2019 | 100,000 | 129,388 |
|
| Citigroup, Inc. sr. unsec. sub. FRN notes 0.528s, 2016 | 1,961,000 | 1,919,639 |
|
| CNA Financial Corp. sr. unsec. unsub. notes 5 3/4s, 2021 | 580,000 | 662,919 |
|
| Commerzbank AG 144A unsec. sub. notes 8 1/8s, | | |
| 2023 (Germany) | 545,000 | 581,788 |
|
| | |
| CORPORATE BONDS AND NOTES (27.2%)* cont. | Principal amount | Value |
|
| Financials cont. | | |
| Commonwealth Bank of Australia 144A sr. unsec. notes 5s, | | |
| 2019 (Australia) | $510,000 | $576,378 |
|
| DDR Corp. sr. unsec. unsub. notes 7 7/8s, 2020 R | 1,715,000 | 2,129,838 |
|
| Duke Realty LP company guaranty sr. unsec. notes | | |
| 6 3/4s, 2020 R | 800,000 | 934,989 |
|
| Duke Realty LP sr. unsec. notes 6 1/2s, 2018 R | 390,000 | 451,551 |
|
| EPR Properties unsec. notes 5 1/4s, 2023 R | 1,150,000 | 1,148,712 |
|
| Fifth Third Bancorp jr. unsec. sub. FRB bonds 5.1s, 2049 | 626,000 | 563,400 |
|
| Genworth Financial, Inc. sr. unsec. unsub. notes 7 5/8s, 2021 | 1,075,000 | 1,318,042 |
|
| Goldman Sachs Group, Inc. (The) sr. notes 7 1/2s, 2019 | 940,000 | 1,151,549 |
|
| Goldman Sachs Group, Inc. (The) sr. unsec. notes 6.15s, 2018 | 595,000 | 689,601 |
|
| Goldman Sachs Group, Inc. (The) sub. notes 6 3/4s, 2037 | 950,000 | 1,025,046 |
|
| Hartford Financial Services Group, Inc. (The) sr. unsec. unsub. | | |
| notes 6 5/8s, 2040 | 3,548,000 | 4,408,315 |
|
| HBOS PLC 144A sr. unsec. sub. notes 6 3/4s, 2018 | | |
| (United Kingdom) | 1,175,000 | 1,321,476 |
|
| HBOS PLC 144A unsec. sub. bonds 6s, 2033 (United Kingdom) | 2,520,000 | 2,457,504 |
|
| Health Care REIT, Inc. sr. unsec. unsub. notes 3 3/4s, 2023 R | 825,000 | 787,033 |
|
| Highwood Realty LP sr. unsec. bonds 5.85s, 2017 R | 835,000 | 926,293 |
|
| HSBC Bank USA, N.A. unsec. sub. notes 7s, 2039 | 2,000,000 | 2,519,948 |
|
| HSBC USA Capital Trust I 144A jr. bank guaranty unsec. notes | | |
| 7.808s, 2026 | 955,000 | 970,519 |
|
| Icahn Enterprises LP/Icahn Enterprises Finance Corp. company | | |
| guaranty sr. unsec. notes 7 3/4s, 2016 | 670,000 | 690,100 |
|
| ING Bank N.V. 144A unsec. sub. notes 5.8s, 2023 (Netherlands) | 1,705,000 | 1,781,424 |
|
| International Lease Finance Corp. sr. unsec. notes 6 1/4s, 2019 | 895,000 | 977,788 |
|
| International Lease Finance Corp. sr. unsec. unsub. notes | | |
| 4 7/8s, 2015 | 1,149,000 | 1,192,088 |
|
| JPMorgan Chase Bank, NA sub. notes Ser. BKNT, 6s, 2017 | 404,000 | 465,712 |
|
| JPMorgan Chase Bank, NA sub. notes Ser. BKNT, 6s, 2017 | 1,311,000 | 1,498,418 |
|
| Leucadia National Corp. sr. unsec. bonds 5 1/2s, 2023 | 425,000 | 429,096 |
|
| Liberty Mutual Group, Inc. 144A company guaranty jr. unsec. | | |
| sub. bonds 7.8s, 2037 | 130,000 | 141,700 |
|
| Liberty Mutual Group, Inc. 144A notes 6 1/2s, 2035 | 1,715,000 | 1,902,050 |
|
| Lloyds Bank PLC company guaranty sr. unsec. sub. notes | | |
| Ser. MTN, 6 1/2s, 2020 (United Kingdom) | 4,335,000 | 4,897,822 |
|
| Macquarie Bank, Ltd. 144A unsec. sub. notes 6 5/8s, | | |
| 2021 (Australia) | 2,880,000 | 3,200,832 |
|
| Massachusetts Mutual Life Insurance Co. 144A notes | | |
| 8 7/8s, 2039 | 2,305,000 | 3,380,278 |
|
| Metropolitan Life Global Funding I 144A notes 3s, 2023 | 715,000 | 689,118 |
|
| Metropolitan Life Insurance Co. 144A unsec. sub. notes 7.8s, 2025 | 3,000,000 | 3,863,163 |
|
| Mid-America Apartments LP sr. unsec. notes 4.3s, 2023 R | 150,000 | 150,319 |
|
| Morgan Stanley sr. unsec. notes Ser. MTN, 5 3/4s, 2016 | 970,000 | 1,088,143 |
|
| MPT Operating Partnership LP/MPT Finance Corp. company | | |
| guaranty sr. unsec. notes 6 7/8s, 2021 R | 1,090,000 | 1,171,750 |
|
| Nationwide Financial Services, Inc. notes 5 5/8s, 2015 | 500,000 | 524,925 |
|
| Nationwide Mutual Insurance Co. 144A notes 9 3/8s, 2039 | 85,000 | 119,263 |
|
| Nordea Bank AB 144A sub. notes 4 7/8s, 2021 (Sweden) | 5,160,000 | 5,435,916 |
|
| | |
| CORPORATE BONDS AND NOTES (27.2%)* cont. | Principal amount | Value |
|
| Financials cont. | | |
| OneAmerica Financial Partners, Inc. 144A bonds 7s, 2033 | $1,010,000 | $1,002,842 |
|
| Pacific LifeCorp 144A sr. notes 6s, 2020 | 1,575,000 | 1,767,053 |
|
| Primerica, Inc. sr. unsec. unsub. notes 4 3/4s, 2022 | 357,000 | 378,005 |
|
| Prudential Financial, Inc. sr. unsec. notes 6 5/8s, 2040 | 1,135,000 | 1,411,337 |
|
| Prudential Holdings, LLC sr. FRN notes Ser. AGM, 1.127s, 2017 | 160,000 | 158,701 |
|
| Rabobank Nederland 144A jr. unsec. sub. FRN notes 11s, | | |
| perpetual maturity (Netherlands) | 1,255,000 | 1,650,325 |
|
| Rayonier, Inc. company guaranty sr. unsec. unsub. notes | | |
| 3 3/4s, 2022 R | 570,000 | 554,602 |
|
| Realty Income Corp. sr. unsec. notes 4.65s, 2023 R | 455,000 | 470,335 |
|
| Royal Bank of Scotland PLC (The) sr. sub. FRN notes 9 1/2s, | | |
| 2022 (United Kingdom) | 2,640,000 | 3,076,102 |
|
| Royal Bank of Scotland PLC (The) unsec. sub. notes 6.1s, 2023 | | |
| (United Kingdom) | 1,465,000 | 1,507,323 |
|
| Santander Issuances S.A. Unipersonal 144A bank guaranty | | |
| unsec. sub. notes 5.911s, 2016 (Spain) | 2,600,000 | 2,709,643 |
|
| Santander UK PLC 144A unsec. sub. notes 5s, 2023 | | |
| (United Kingdom) | 565,000 | 563,198 |
|
| SL Green Realty Corp./SL Green Operating Partnership/ | | |
| Reckson Operating Partnership sr. unsec. notes 5s, 2018 R | 1,185,000 | 1,272,088 |
|
| Standard Chartered PLC 144A unsec. sub. notes 3.95s, 2023 | | |
| (United Kingdom) | 2,835,000 | 2,719,998 |
|
| Tanger Properties, LP sr. unsec. notes 6 1/8s, 2020 R | 645,000 | 756,287 |
|
| Teachers Insurance & Annuity Association of America 144A | | |
| notes 6.85s, 2039 | 889,000 | 1,120,224 |
|
| Travelers Property Casuality Corp. sr. unsec. unsub. bonds | | |
| 7 3/4s, 2026 | 975,000 | 1,290,578 |
|
| Wachovia Bank NA sr. unsec. sub. notes 6.6s, 2038 | 250,000 | 312,044 |
|
| WEA Finance, LLC 144A company guaranty sr. notes | | |
| 7 1/8s, 2018 | 1,070,000 | 1,282,358 |
|
| WEA Finance, LLC/WT Finance Aust. Pty. Ltd. 144A company | | |
| guaranty sr. unsec. notes 6 3/4s, 2019 | 810,000 | 971,620 |
|
| Wells Fargo Bank, NA unsec. sub. FRN notes 0.473s, 2016 | 1,180,000 | 1,170,627 |
|
| Willis Group Holdings PLC company guaranty sr. unsec. unsub. | | |
| notes 5 3/4s, 2021 | 750,000 | 822,749 |
|
| | | 122,551,008 |
| Health care (0.6%) | | |
| Actavis PLC sr. unsec. notes 4 5/8s, 2042 | 345,000 | 319,061 |
|
| Actavis PLC sr. unsec. notes 3 1/4s, 2022 | 275,000 | 260,593 |
|
| Aetna, Inc. sr. unsec. unsub. notes 6 3/4s, 2037 | 1,660,000 | 2,073,416 |
|
| Fresenius Medical Care US Finance II, Inc. 144A company | | |
| guaranty sr. unsec. notes 5 5/8s, 2019 | 356,000 | 380,920 |
|
| Fresenius Medical Care US Finance, Inc. 144A company | | |
| guaranty sr. notes 5 3/4s, 2021 | 839,000 | 887,243 |
|
| Mylan, Inc./PA 144A sr. unsec. notes 2.6s, 2018 | 375,000 | 377,075 |
|
| Quest Diagnostics, Inc. company guaranty sr. unsec. notes | | |
| 6.95s, 2037 | 1,045,000 | 1,168,590 |
|
| Quest Diagnostics, Inc. company guaranty sr. unsec. notes | | |
| 4 3/4s, 2020 | 244,000 | 261,037 |
|
| UnitedHealth Group, Inc. sr. unsec. unsub. notes 4 5/8s, 2041 | 975,000 | 949,396 |
|
| WellPoint, Inc. sr. unsec. unsub. notes 4 5/8s, 2042 | 665,000 | 620,970 |
|
| | | 7,298,301 |
| | |
| CORPORATE BONDS AND NOTES (27.2%)* cont. | Principal amount | Value |
|
| Technology (0.4%) | | |
| Apple, Inc. sr. unsec. unsub. notes 3.85s, 2043 | $1,835,000 | $1,554,738 |
|
| Brocade Communications Systems, Inc. company guaranty sr. | | |
| notes 6 7/8s, 2020 | 580,000 | 624,950 |
|
| Fidelity National Information Services, Inc. company guaranty sr. | | |
| unsec. unsub. notes 5s, 2022 | 1,075,000 | 1,105,885 |
|
| SoftBank Corp. 144A sr. unsec. notes 4 1/2s, 2020 (Japan) | 820,000 | 811,800 |
|
| Xerox Corp. sr. unsec. notes 6.35s, 2018 | 1,205,000 | 1,389,540 |
|
| | | 5,486,913 |
| Transportation (0.5%) | | |
| Burlington Northern Santa Fe, LLC sr. unsec. notes 5 3/4s, 2018 | 365,000 | 422,196 |
|
| Burlington Northern Santa Fe, LLC sr. unsec. notes 5.4s, 2041 | 1,520,000 | 1,613,628 |
|
| Continental Airlines, Inc. pass-through certificates | | |
| Ser. 97-4A, 6.9s, 2019 | 778,665 | 833,172 |
|
| Continental Airlines, Inc. pass-through certificates Ser. 98-1A, | | |
| 6.648s, 2017 | 310,996 | 330,045 |
|
| Kansas City Southern de Mexico SA de CV sr. unsec. unsub. | | |
| notes 2.35s, 2020 (Mexico) | 154,000 | 147,383 |
|
| Kansas City Southern Railway Co. (The) 144A sr. unsec. | | |
| notes 4.3s, 2043 | 286,000 | 255,634 |
|
| Norfolk Southern Corp. sr. unsec. notes 6s, 2111 | 1,115,000 | 1,212,257 |
|
| Southwest Airlines Co. pass-through certificates Ser. 07-1, | | |
| 6.15s, 2022 | 194,726 | 223,935 |
|
| Union Pacific Corp. 144A pass-through certificates 5.214s, 2014 | 390,000 | 402,896 |
|
| United AirLines, Inc. pass-through certificates Ser. 07-A, | | |
| 6.636s, 2022 | 434,021 | 455,722 |
|
| | | 5,896,868 |
| Utilities and power (3.4%) | | |
| Appalachian Power Co. sr. notes Ser. L, 5.8s, 2035 | 580,000 | 619,927 |
|
| Arizona Public Services Co. sr. unsec. notes 4 1/2s, 2042 | 390,000 | 381,641 |
|
| Beaver Valley Funding Corp. sr. bonds 9s, 2017 | 142,000 | 143,399 |
|
| Boardwalk Pipelines LP company guaranty sr. unsec. notes | | |
| 5 7/8s, 2016 | 980,000 | 1,095,430 |
|
| CMS Energy Corp. sr. unsec. notes 8 3/4s, 2019 | 2,280,000 | 2,939,884 |
|
| Commonwealth Edison Co. 1st mtge. sec. bonds 5 7/8s, 2033 | 480,000 | 556,450 |
|
| Consolidated Edison Co. of New York sr. unsec. unsub. | | |
| notes 4.2s, 2042 | 710,000 | 668,846 |
|
| Duke Energy Carolinas, LLC sr. mtge. notes 4 1/4s, 2041 | 725,000 | 697,761 |
|
| EDP Finance BV 144A sr. unsec. unsub. notes 6s, | | |
| 2018 (Netherlands) | 1,940,000 | 2,051,550 |
|
| El Paso Natural Gas Co. sr. unsec. unsub. bonds 8 3/8s, 2032 | 830,000 | 1,075,062 |
|
| El Paso Pipeline Partners Operating Co., LP company guaranty | | |
| sr. unsec. notes 6 1/2s, 2020 | 750,000 | 873,718 |
|
| Electricite de France SA 144A sr. unsec. notes 6.95s, | | |
| 2039 (France) | 970,000 | 1,212,305 |
|
| Electricite de France SA 144A unsec. sub. FRN notes 5 1/4s, | | |
| perpetual maturity (France) | 2,895,000 | 2,833,481 |
|
| Enel Finance International SA 144A company guaranty sr. unsec. | | |
| notes 5 1/8s, 2019 (Netherlands) | 695,000 | 745,654 |
|
| Energy Transfer Partners LP sr. unsec. unsub. notes 6 1/2s, 2042 | 2,265,000 | 2,488,331 |
|
| Energy Transfer Partners LP sr. unsec. unsub. notes 5.2s, 2022 | 780,000 | 838,676 |
|
| | |
| CORPORATE BONDS AND NOTES (27.2%)* cont. | Principal amount | Value |
|
| Utilities and power cont. | | |
| Enterprise Products Operating, LLC company guaranty sr. | | |
| unsec. unsub. notes 4.85s, 2042 | $1,220,000 | $1,165,952 |
|
| Iberdrola International BV company guaranty sr. unsec. unsub. | | |
| notes 6 3/4s, 2036 (Spain) | 510,000 | 562,674 |
|
| ITC Holdings Corp. 144A notes 5 7/8s, 2016 | 890,000 | 991,674 |
|
| ITC Holdings Corp. 144A sr. unsec. notes 6.05s, 2018 | 330,000 | 375,501 |
|
| Kansas Gas and Electric Co. bonds 5.647s, 2021 | 509,901 | 543,192 |
|
| Kinder Morgan Energy Partners LP sr. unsec. notes 6.85s, 2020 | 1,425,000 | 1,710,232 |
|
| Kinder Morgan, Inc./DE 144A sr. notes 5s, 2021 | 89,000 | 89,000 |
|
| Korea Gas Corp. 144A sr. unsec. unsub. notes 6 1/4s, 2042 | | |
| (South Korea) | 1,285,000 | 1,509,756 |
|
| MidAmerican Energy Holdings Co. bonds 6 1/8s, 2036 | 1,000,000 | 1,133,538 |
|
| MidAmerican Energy Holdings Co. sr. unsec. bonds 6 1/2s, 2037 | 410,000 | 484,474 |
|
| MidAmerican Funding, LLC sr. bonds 6.927s, 2029 | 360,000 | 446,104 |
|
| Narragansett Electric Co. (The) 144A sr. unsec. notes | | |
| 4.17s, 2042 | 1,345,000 | 1,209,662 |
|
| Oncor Electric Delivery Co., LLC bank guaranty unsec. sub. | | |
| notes 4.55s, 2041 | 1,455,000 | 1,361,681 |
|
| Pacific Gas & Electric Co. sr. unsec. notes 6.35s, 2038 | 295,000 | 344,787 |
|
| Pacific Gas & Electric Co. sr. unsub. notes 5.8s, 2037 | 785,000 | 868,963 |
|
| PacifiCorp Sinking Fund 1st mtge. 6 1/4s, 2037 | 460,000 | 565,135 |
|
| Potomac Edison Co. 144A sr. bonds 5.8s, 2016 | 885,000 | 978,913 |
|
| PPL WEM Holdings PLC 144A sr. unsec. notes 5 3/8s, 2021 | | |
| (United Kingdom) | 3,220,000 | 3,516,414 |
|
| Teco Finance, Inc. company guaranty sr. unsec. unsub. notes | | |
| 6.572s, 2017 | 340,000 | 395,184 |
|
| Texas-New Mexico Power Co. 144A 1st mtge. bonds Ser. A, | | |
| 9 1/2s, 2019 | 2,840,000 | 3,649,385 |
|
| West Penn Power Co. 144A 1st mtge. 5.95s, 2017 | 830,000 | 952,986 |
|
| | | 42,077,322 |
| | | |
| Total corporate bonds and notes (cost $314,616,779) | | $333,546,650 |
|
| |
| MUNICIPAL BONDS AND NOTES (0.4%)* | Principal amount | Value |
|
| CA State G.O. Bonds (Build America Bonds), 7 1/2s, 4/1/34 | $770,000 | $1,010,848 |
|
| IL State G.O. Bonds | | |
| 4.421s, 1/1/15 | 410,000 | 423,805 |
| 4.071s, 1/1/14 | 1,220,000 | 1,226,454 |
|
| North TX, Thruway Auth. Rev. Bonds (Build America Bonds), | | |
| 6.718s, 1/1/49 | 675,000 | 828,299 |
|
| OH State U. Rev. Bonds (Build America Bonds), 4.91s, 6/1/40 | 845,000 | 876,975 |
|
| Total municipal bonds and notes (cost $3,925,173) | | $4,366,381 |
| | | |
| PURCHASED SWAP OPTIONS OUTSTANDING (0.2%)* | | | |
| Counterparty | | | |
| Fixed right % to receive or (pay)/ | Expiration | Contract | |
| Floating rate index/Maturity date | date/strike | amount | Value |
|
| Credit Suisse International | | | |
| 2.88/3 month USD-LIBOR-BBA/Nov-23 | Nov-13/2.88 | $146,570,000 | $2,532,730 |
|
| (3.08)/3 month USD-LIBOR-BBA/Nov-23 | Nov-13/3.08 | 146,570,000 | 1,466 |
|
| Total purchased swap options outstanding (cost $2,535,661) | | $2,534,196 |
| | | |
| PURCHASED OPTIONS | Expiration date/ | Contract | |
| OUTSTANDING (—%)* | strike price | amount | Value |
|
| Federal National Mortgage Association 30 yr. 3s TBA | | | |
| commitment (Call) | Dec-13/$98.52 | $19,000,000 | $143,450 |
|
| Federal National Mortgage Association 30 yr. 3s TBA | | | |
| commitment (Call) | Dec-13/98.59 | 19,000,000 | 135,470 |
|
| Total purchased options outstanding (cost $299,102) | | | $278,920 |
|
| |
| FOREIGN GOVERNMENT AND AGENCY | | | |
| BONDS AND NOTES (0.1%)* | Principal amount | Value |
|
| Korea Development Bank sr. unsec. unsub. notes 4s, 2016 | | |
| (South Korea) | | $800,000 | $852,587 |
|
| Total foreign government and agency bonds and notes (cost $797,867) | | $852,587 |
|
| |
| SENIOR LOANS (—%)* c | Principal amount | Value |
|
| Caesars Entertainment Operating Co., Inc. bank term loan FRN | | |
| Ser. B6, 5.488s, 2018 | | $160,015 | $149,992 |
|
| SunGard Data Systems, Inc. bank term loan FRN 1.953s, 2014 | 1,451 | 1,451 |
|
| Total senior loans (cost $153,874) | | | $151,443 |
|
| |
| SHORT-TERM INVESTMENTS (5.0%)* | Principal amount/shares | Value |
|
| Putnam Short Term Investment Fund 0.07% L | | 27,481,533 | $27,481,533 |
|
| SSgA Prime Money Market Fund 0.02% P | | 2,210,000 | 2,210,000 |
|
| U.S. Treasury Bills with effective yields ranging from 0.08% | | |
| to 0.13%, August 21, 2014 # Δ § | | $16,473,000 | 16,462,606 |
|
| U.S. Treasury Bills with an effective yield of 0.11%, | | | |
| July 24, 2014 # § | | 1,522,000 | 1,521,216 |
|
| U.S. Treasury Bills with effective yields ranging from 0.08% | | |
| to 0.09%, May 29, 2014 # Δ § | | 13,319,000 | 13,313,779 |
|
| Total short-term investments (cost $60,983,605) | | | $60,989,134 |
|
| |
| TOTAL INVESTMENTS | | | |
|
| Total investments (cost $1,357,157,693) | | | $1,417,145,149 |
Key to holding’s abbreviations
BKNT Bank Note
FRB Floating Rate Bonds: the rate shown is the current interest rate at the close of the reporting period
FRN Floating Rate Notes: the rate shown is the current interest rate at the close of the reporting period
G.O. Bonds General Obligation Bonds
IFB Inverse Floating Rate Bonds, which are securities that pay interest rates that vary inversely to changes in the market interest rates. As interest rates rise, inverse floaters produce less current income. The rate shown is the current interest rate at the close of the reporting period.
IO Interest Only
MTN Medium Term Notes
PO Principal Only
TBA To Be Announced Commitments
Notes to the fund’s portfolio
Unless noted otherwise, the notes to the fund’s portfolio are for the close of the fund’s reporting period, which ran from November 1, 2012 through October 31, 2013 (the reporting period). Within the following notes to the portfolio, references to “ASC 820” represent Accounting Standards Codification 820 Fair Value Measurements and Disclosures and references to “OTC”, if any, represent over-the-counter.
* Percentages indicated are based on net assets of $1,227,849,965.
† Non-income-producing security.
# This security, in part or in entirety, was pledged and segregated with the broker to cover margin requirements for futures contracts at the close of the reporting period.
Δ This security, in part or in entirety, was pledged and segregated with the custodian for collateral on certain derivative contracts at the close of the reporting period.
§ This security, in part or in entirety, was pledged and segregated with the custodian for collateral on the initial margin on certain centrally cleared derivative contracts at the close of the reporting period.
c Senior loans are exempt from registration under the Securities Act of 1933, as amended, but contain certain restrictions on resale and cannot be sold publicly. These loans pay interest at rates which adjust periodically. The interest rates shown for senior loans are the current interest rates at the close of the reporting period. Senior loans are also subject to mandatory and/or optional prepayment which cannot be predicted. As a result, the remaining maturity may be substantially less than the stated maturity shown (Notes 1 and 6).
F Is valued at fair value following procedures approved by the Trustees. Securities may be classified as Level 2 or Level 3 for ASC 820 based on the securities’ valuation inputs.
L Affiliated company (Note 5). The rate quoted in the security description is the annualized 7-day yield of the fund at the close of the reporting period.
P Security was pledged, or purchased with cash that was pledged, to the fund for collateral on certain derivatives contracts. The rate quoted in the security description is the annualized 7-day yield of the fund at the close of the reporting period (Note 1).
R Real Estate Investment Trust.
At the close of the reporting period, the fund maintained liquid assets totaling $243,036,529 to cover certain derivatives contracts and delayed delivery securities.
Debt obligations are considered secured unless otherwise indicated.
144A after the name of an issuer represents securities exempt from registration under Rule 144A under the Securities Act of 1933, as amended. These securities may be resold in transactions exempt from registration, normally to qualified institutional buyers.
See Note 1 to the financial statements regarding TBA’s.
The dates shown on debt obligations are the original maturity dates.
| | | | | |
| FUTURES CONTRACTS OUTSTANDING at 10/31/13 | | | | |
| | Number of | | | Expiration | Unrealized |
| | contracts | Value | | date | depreciation |
|
| U.S. Treasury Note 5 yr (Short) | 173 | $21,051,938 | | Dec-13 | $(133,743) |
|
| U.S. Treasury Note 10 yr (Short) | 35 | 4,457,578 | | Dec-13 | (20,051) |
|
| Total | | | | | $(153,794) |
| | | |
| WRITTEN SWAP OPTIONS OUTSTANDING at 10/31/13 (premiums $2,535,653) | | |
| Counterparty | | | |
| Fixed Obligation % to receive or (pay)/ | Expiration | Contract | |
| Floating rate index/Maturity date | date/strike | amount | Value |
|
| Credit Suisse International | | | |
| 2.98/3 month USD-LIBOR-BBA/Nov-23 | Nov-13/2.98 | $103,582,700 | $7,251 |
|
| (2.98)/3 month USD-LIBOR-BBA/Nov-23 | Nov-13/2.98 | 103,582,700 | 2,709,723 |
|
| Total | | | $2,716,974 |
| | | |
| | | |
| FORWARD PREMIUM SWAP OPTION CONTRACTS OUTSTANDING at 10/31/13 | | |
| Counterparty | | | |
| Fixed right or obligation % to receive or (pay)/ | Expiration | Contract | Unrealized |
| Floating rate index/Maturity date | date/strike | amount | appreciation |
|
| |
| Credit Suisse International | | | |
| (2.70625)/3 month USD-LIBOR-BBA/ | | | |
| Dec-23 (Written) | Dec-13/2.70625 | $17,100,000 | $9,234 |
|
| (2.7165)/3 month USD-LIBOR-BBA/ | | | |
| Dec-23 (Written) | Dec-13/2.7165 | 17,100,000 | 1,026 |
|
| Total | | | $10,260 |
| | | |
| | | | |
| TBA SALE COMMITMENTS OUTSTANDING at 10/31/13 (proceeds receivable $28,943,438) | |
| | Principal | | Settlement | |
| Agency | amount | | date | Value |
|
| |
| Federal National Mortgage Association, 4s, | | | | |
| November 1, 2043 | $6,000,000 | | 11/13/13 | $6,321,563 |
|
| Federal National Mortgage Association, 3 1/2s, | | | | |
| November 1, 2043 | 22,000,000 | | 11/13/13 | 22,575,782 |
|
| Total | | | | $28,897,345 |
| | | | | | |
| CENTRALLY CLEARED INTEREST RATE SWAP CONTRACTS OUTSTANDING at 10/31/13 | |
| | Upfront | | | Payments | Payments | Unrealized |
| | premium | Termination | | made by | received by | appreciation/ |
| Notional amount | received (paid) | date | | fund per annum | fund per annum | (depreciation) |
|
| $2,797,000 | $(176) | 9/25/23 | | 3 month USD- | 2.92% | $71,739 |
| | | | | LIBOR-BBA | | |
|
| 472,134,100 E | 111,245 | 12/18/15 | | 3 month USD- | 0.75% | (2,598,804) |
| | | | | LIBOR-BBA | | |
|
| 215,877,200 E | (413,758) | 12/18/18 | | 3 month USD- | 2.05% | (6,013,612) |
| | | | | LIBOR-BBA | | |
|
| 94,927,700 E | (1,088,845) | 12/18/43 | | 3 month USD- | 3.85% | 3,303,461 |
| | | | | LIBOR-BBA | | |
|
| 158,458,300 E | (472,015) | 12/18/23 | | 3 month USD- | 3.15% | (6,461,739) |
| | | | | LIBOR-BBA | | |
|
| Total | $(1,863,549) | | | | | $(11,698,955) |
E Extended effective date.
| | | | | | |
| OTC TOTAL RETURN SWAP CONTRACTS OUTSTANDING at 10/31/13 | | |
| | Upfront | | | Payments | Total return | Unrealized |
| Swap counterparty/ | premium | Termination | | received (paid) by | received by | appreciation/ |
| Notional amount | received (paid) | date | | fund per annum | or paid by fund | (depreciation) |
|
| Bank of America N.A. | | | | | | |
| $1,754,689 | $— | 1/12/41 | | 4.00% (1 month | Synthetic TRS Index | $(24,574) |
| | | | | USD-LIBOR) | 4.00% 30 year Fannie | |
| | | | | | Mae pools | |
|
| 3,358,279 | — | 1/12/41 | | 4.50% (1 month | Synthetic TRS Index | (63,461) |
| | | | | USD-LIBOR) | 4.50% 30 year Fannie | |
| | | | | | Mae pools | |
|
| Barclays Bank PLC | | | | | | |
| 7,284,650 | — | 1/12/36 | | (5.50% ) 1 month | Synthetic TRS Index | 72,320 |
| | | | | USD-LIBOR | 5.50% 30 year Fannie | |
| | | | | | Mae pools | |
|
| 3,289,058 | — | 1/12/41 | | 4.00% (1 month | Synthetic TRS Index | (46,063) |
| | | | | USD-LIBOR) | 4.00% 30 year Fannie | |
| | | | | | Mae pools | |
|
| 5,985,162 | — | 1/12/38 | | (6.50%) 1 month | Synthetic MBX Index | (52,621) |
| | | | | USD-LIBOR | 6.50% 30 year Fannie | |
| | | | | | Mae pools | |
|
| 5,374,160 | — | 1/12/40 | | 4.50% (1 month | Synthetic MBX Index | 20,605 |
| | | | | USD-LIBOR) | 4.50% 30 year Fannie | |
| | | | | | Mae pools | |
|
| 2,879,129 | — | 1/12/42 | | 4.00% (1 month | Synthetic TRS Index | (38,525) |
| | | | | USD-LIBOR) | 4.00% 30 year Fannie | |
| | | | | | Mae pools | |
|
| 13,546,151 | — | 1/12/38 | | (6.50%) 1 month | Synthetic MBX Index | (119,097) |
| | | | | USD-LIBOR | 6.50% 30 year Fannie | |
| | | | | | Mae pools | |
|
| 10,589,069 | — | 1/12/40 | | 5.00% (1 month | Synthetic MBX Index | 23,515 |
| | | | | USD-LIBOR) | 5.00% 30 year Fannie | |
| | | | | | Mae pools | |
|
| 9,365,554 | — | 1/12/41 | | 5.00% (1 month | Synthetic MBX Index | 23,721 |
| | | | | USD-LIBOR) | 5.00% 30 year Fannie | |
| | | | | | Mae pools | |
|
| 2,815,469 | — | 1/12/41 | | 4.00% (1 month | Synthetic TRS Index | (39,430) |
| | | | | USD-LIBOR) | 4.00% 30 year Fannie | |
| | | | | | Mae pools | |
|
| 5,722,410 | — | 1/12/41 | | 4.00% (1 month | Synthetic TRS Index | (80,141) |
| | | | | USD-LIBOR) | 4.00% 30 year Fannie | |
| | | | | | Mae pools | |
|
| 3,890,179 | — | 1/12/40 | | (4.00%) 1 month | Synthetic TRS Index | 78,790 |
| | | | | USD-LIBOR | 4.00% 30 year Fannie | |
| | | | | | Mae pools | |
|
| 26,417,704 | — | 1/12/41 | | 4.00% (1 month | Synthetic TRS Index | (369,975) |
| | | | | USD-LIBOR) | 4.00% 30 year Fannie | |
| | | | | | Mae pools | |
|
| 1,667,151 | — | 1/12/41 | | 4.00% (1 month | Synthetic TRS Index | (23,348) |
| | | | | USD-LIBOR) | 4.00% 30 year Fannie | |
| | | | | | Mae pools | |
|
| | | | | | |
| OTC TOTAL RETURN SWAP CONTRACTS OUTSTANDING at 10/31/13 cont. | | |
| | Upfront | | | Payments | Total return | Unrealized |
| Swap counterparty/ | premium | Termination | | received (paid) by | received by | appreciation/ |
| Notional amount | received (paid) | date | | fund per annum | or paid by fund | (depreciation) |
|
| Barclays Bank PLC cont. | | | | | | |
| $35,398,402 | $— | 1/12/38 | | (6.50%) 1 month | Synthetic MBX Index | $(311,221) |
| | | | | USD-LIBOR | 6.50% 30 year Fannie | |
| | | | | | Mae pools | |
|
| 23,292,593 | — | 1/12/41 | | 5.00% (1 month | Synthetic MBX Index | 58,995 |
| | | | | USD-LIBOR) | 5.00% 30 year Fannie | |
| | | | | | Mae pools | |
|
| 1,090,232 | — | 1/12/40 | | 4.00% (1 month | Synthetic MBX Index | 9,005 |
| | | | | USD-LIBOR) | 4.00% 30 year Fannie | |
| | | | | | Mae pools | |
|
| 3,820,677 | — | 1/12/41 | | 4.00% (1 month | Synthetic TRS Index | (53,508) |
| | | | | USD-LIBOR) | 4.00% 30 year Fannie | |
| | | | | | Mae pools | |
|
| 1,736,984 | — | 1/12/41 | | 4.00% (1 month | Synthetic TRS Index | (24,326) |
| | | | | USD-LIBOR) | 4.00% 30 year Fannie | |
| | | | | | Mae pools | |
|
| 2,025,751 | — | 1/12/41 | | 5.00% (1 month | Synthetic MBX Index | 5,131 |
| | | | | USD-LIBOR) | 5.00% 30 year Fannie | |
| | | | | | Mae pools | |
|
| 9,106,165 | — | 1/12/41 | | 4.50% (1 month | Synthetic TRS Index | (172,079) |
| | | | | USD-LIBOR) | 4.50% 30 year Fannie | |
| | | | | | Mae pools | |
|
| 3,046,652 | — | 1/12/39 | | 6.00% (1 month | Synthetic TRS Index | (28,485) |
| | | | | USD-LIBOR) | 6.00% 30 year Fannie | |
| | | | | | Mae pools | |
|
| 30,307,683 | — | 1/12/38 | | (6.50%) 1 month | Synthetic MBX Index | (266,464) |
| | | | | USD-LIBOR | 6.50% 30 year Fannie | |
| | | | | | Mae pools | |
|
| 30,830,919 | — | 1/12/41 | | 5.00% (1 month | Synthetic MBX Index | 78,088 |
| | | | | USD-LIBOR) | 5.00% 30 year Fannie | |
| | | | | | Mae pools | |
|
| 9,069,751 | — | 1/12/40 | | 4.00% (1 month | Synthetic MBX Index | 74,918 |
| | | | | USD-LIBOR) | 4.00% 30 year Fannie | |
| | | | | | Mae pools | |
|
| 580,144 | — | 1/12/38 | | 6.50% (1 month | Synthetic TRS Index | (2,824) |
| | | | | USD-LIBOR) | 6.50% 30 year Fannie | |
| | | | | | Mae pools | |
|
| 3,182,075 | — | 1/12/38 | | (6.50%) 1 month | Synthetic MBX Index | (27,977) |
| | | | | USD-LIBOR | 6.50% 30 year Fannie | |
| | | | | | Mae pools | |
|
| 1,442,841 | — | 1/12/41 | | 5.00% (1 month | Synthetic MBX Index | 3,654 |
| | | | | USD-LIBOR) | 5.00% 30 year Fannie | |
| | | | | | Mae pools | |
|
| 942,096 | — | 1/12/41 | | 5.00% (1 month | Synthetic MBX Index | 1,944 |
| | | | | USD-LIBOR) | 5.00% 30 year Ginnie | |
| | | | | | Mae II pools | |
|
| 16,712,447 | — | 1/12/41 | | 5.00% (1 month | Synthetic MBX Index | 42,329 |
| | | | | USD-LIBOR) | 5.00% 30 year Fannie | |
| | | | | | Mae pools | |
|
| | | | | | |
| OTC TOTAL RETURN SWAP CONTRACTS OUTSTANDING at 10/31/13 cont. | | |
| | Upfront | | | Payments | Total return | Unrealized |
| Swap counterparty/ | premium | Termination | | received (paid) by | received by | appreciation/ |
| Notional amount | received (paid) | date | | fund per annum | or paid by fund | (depreciation) |
|
| Barclays Bank PLC cont. | | | | | | |
| $12,792,024 | $— | 1/12/38 | | (6.50%) 1 month | Synthetic MBX Index | $(112,467) |
| | | | | USD-LIBOR | 6.50% 30 year Fannie | |
| | | | | | Mae pools | |
|
| 6,070,593 | — | 1/12/41 | | 4.00% (1 month | Synthetic TRS Index | (85,018) |
| | | | | USD-LIBOR) | 4.00% 30 year Fannie | |
| | | | | | Mae pools | |
|
| 2,151,067 | — | 1/12/41 | | 4.00% (1 month | Synthetic TRS Index | (30,125) |
| | | | | USD-LIBOR) | 4.00% 30 year Fannie | |
| | | | | | Mae pools | |
|
| 1,422,618 | — | 1/12/40 | | 5.00% (1 month | Synthetic MBX Index | 3,159 |
| | | | | USD-LIBOR) | 5.00% 30 year Fannie | |
| | | | | | Mae pools | |
|
| 6,004,745 | — | 1/12/40 | | 4.50% (1 month | Synthetic MBX Index | 23,023 |
| | | | | USD-LIBOR) | 4.50% 30 year Fannie | |
| | | | | | Mae pools | |
|
| 26,713,073 | — | 1/12/41 | | 5.00% (1 month | Synthetic MBX Index | 67,658 |
| | | | | USD-LIBOR) | 5.00% 30 year Fannie | |
| | | | | | Mae pools | |
|
| 4,463,236 | — | 1/12/41 | | 5.00% (1 month | Synthetic MBX Index | 11,304 |
| | | | | USD-LIBOR) | 5.00% 30 year Fannie | |
| | | | | | Mae pools | |
|
| 786,920 | — | 1/12/40 | | 5.00% (1 month | Synthetic MBX Index | 1,747 |
| | | | | USD-LIBOR) | 5.00% 30 year Fannie | |
| | | | | | Mae pools | |
|
| 2,552,001 | — | 1/12/40 | | 5.00% (1 month | Synthetic MBX Index | 5,667 |
| | | | | USD-LIBOR) | 5.00% 30 year Fannie | |
| | | | | | Mae pools | |
|
| 1,850,077 | — | 1/12/40 | | 5.00% (1 month | Synthetic MBX Index | 4,108 |
| | | | | USD-LIBOR) | 5.00% 30 year Fannie | |
| | | | | | Mae pools | |
|
| 937,143 | — | 1/12/39 | | (6.00%) 1 month | Synthetic MBX Index | (2,136) |
| | | | | USD-LIBOR | 6.00% 30 year Fannie | |
| | | | | | Mae pools | |
|
| 991,595 | — | 1/12/38 | | (6.50%) 1 month | Synthetic MBX Index | (8,718) |
| | | | | USD-LIBOR | 6.50% 30 year Fannie | |
| | | | | | Mae pools | |
|
| 26,595,844 | — | 1/12/38 | | (6.50%) 1 month | Synthetic MBX Index | (233,830) |
| | | | | USD-LIBOR | 6.50% 30 year Fannie | |
| | | | | | Mae pools | |
|
| 32,535,780 | — | 1/12/39 | | (6.00%) 1 month | Synthetic MBX Index | (74,173) |
| | | | | USD-LIBOR | 6.00% 30 year Fannie | |
| | | | | | Mae pools | |
|
| 18,996,980 | — | 1/12/38 | | 6.50% (1 month | Synthetic MBX Index | 167,021 |
| | | | | USD-LIBOR) | 6.50% 30 year Fannie | |
| | | | | | Mae pools | |
|
| 23,239,843 | — | 1/12/39 | | 6.00% (1 month | Synthetic MBX Index | 52,981 |
| | | | | USD-LIBOR) | 6.00% 30 year Fannie | |
| | | | | | Mae pools | |
|
| | | | | | |
| OTC TOTAL RETURN SWAP CONTRACTS OUTSTANDING at 10/31/13 cont. | | |
| | Upfront | | | Payments | Total return | Unrealized |
| Swap counterparty/ | premium | Termination | | received (paid) by | received by | appreciation/ |
| Notional amount | received (paid) | date | | fund per annum | or paid by fund | (depreciation) |
|
| Barclays Bank PLC cont. | | | | | | |
| $6,387,303 | $— | 1/12/41 | | (4.00%) 1 month | Synthetic TRS Index | $89,453 |
| | | | | USD-LIBOR | 4.00% 30 year Fannie | |
| | | | | | Mae pools | |
|
| 4,017,308 | — | 1/12/39 | | (5.50%) 1 month | Synthetic MBX Index | (5,590) |
| | | | | USD-LIBOR | 5.50% 30 year Fannie | |
| | | | | | Mae pools | |
|
| 2,008,594 | — | 1/12/39 | | (5.50%) 1 month | Synthetic MBX Index | (2,795) |
| | | | | USD-LIBOR | 5.50% 30 year Fannie | |
| | | | | | Mae pools | |
|
| 2,008,594 | — | 1/12/39 | | (5.50%) 1 month | Synthetic MBX Index | (2,795) |
| | | | | USD-LIBOR | 5.50% 30 year Fannie | |
| | | | | | Mae pools | |
|
| 3,358,279 | — | 1/12/41 | | 4.50% (1 month | Synthetic TRS Index | (63,461) |
| | | | | USD-LIBOR) | 4.50% 30 year Fannie | |
| | | | | | Mae pools | |
|
| 4,030,695 | — | 1/12/39 | | (5.50%) 1 month | Synthetic MBX Index | (5,609) |
| | | | | USD-LIBOR | 5.50% 30 year Fannie | |
| | | | | | Mae pools | |
|
| 10,469,894 | — | 1/12/39 | | (5.50%) 1 month | Synthetic MBX Index | (14,568) |
| | | | | USD-LIBOR | 5.50% 30 year Fannie | |
| | | | | | Mae pools | |
|
| 4,030,454 | — | 1/12/39 | | (5.50%) 1 month | Synthetic MBX Index | (5,608) |
| | | | | USD-LIBOR | 5.50% 30 year Fannie | |
| | | | | | Mae pools | |
|
| 1,379,119 | — | 1/12/38 | | (6.50%) 1 month | Synthetic MBX Index | (12,125) |
| | | | | USD-LIBOR | 6.50% 30 year Fannie | |
| | | | | | Mae pools | |
|
| 3,172,833 | — | 1/12/41 | | 5.00% (1 month | Synthetic MBX Index | 8,036 |
| | | | | USD-LIBOR) | 5.00% 30 year Ginnie | |
| | | | | | Mae II pools | |
|
| 8,447,618 | — | 1/12/38 | | (6.50%) 1 month | Synthetic MBX Index | (74,271) |
| | | | | USD-LIBOR | 6.50% 30 year Fannie | |
| | | | | | Mae pools | |
|
| 2,691,264 | — | 1/12/41 | | 4.50% (1 month | Synthetic TRS Index | (50,857) |
| | | | | USD-LIBOR) | 4.50% 30 year Fannie | |
| | | | | | Mae pools | |
|
| 5,139,895 | — | 1/12/38 | | 6.50% (1 month | Synthetic TRS Index | (25,023) |
| | | | | USD-LIBOR) | 6.50% 30 year Fannie | |
| | | | | | Mae pools | |
|
| 7,902,001 | — | 1/12/41 | | (4.00%) 1 month | Synthetic TRS Index | 110,666 |
| | | | | USD-LIBOR | 4.00% 30 year Fannie | |
| | | | | | Mae pools | |
|
| 8,048,245 | — | 1/12/39 | | (5.50%) 1 month | Synthetic MBX Index | (11,199) |
| | | | | USD-LIBOR | 5.50% 30 year Fannie | |
| | | | | | Mae pools | |
|
| 4,745,878 | — | 1/12/38 | | (6.50%) 1 month | Synthetic MBX Index | (41,726) |
| | | | | USD-LIBOR | 6.50% 30 year Fannie | |
| | | | | | Mae pools | |
|
| | | | | | |
| OTC TOTAL RETURN SWAP CONTRACTS OUTSTANDING at 10/31/13 cont. | | |
| | Upfront | | | Payments | Total return | Unrealized |
| Swap counterparty/ | premium | Termination | | received (paid) by | received by | appreciation/ |
| Notional amount | received (paid) | date | | fund per annum | or paid by fund | (depreciation) |
|
| Barclays Bank PLC cont. | | | | | | |
| $4,430,318 | $— | 1/12/41 | | (5.00%) 1 month | Synthetic TRS Index | $82,548 |
| | | | | USD-LIBOR | 5.00% 30 year Fannie | |
| | | | | | Mae pools | |
|
| 2,875,535 | — | 1/12/41 | | (4.50%) 1 month | Synthetic TRS Index | 54,339 |
| | | | | USD-LIBOR | 4.50% 30 year Fannie | |
| | | | | | Mae pools | |
|
| 2,264,670 | — | 1/12/41 | | (4.00%) 1 month | Synthetic TRS Index | 31,716 |
| | | | | USD-LIBOR | 4.00% 30 year Fannie | |
| | | | | | Mae pools | |
|
| 6,627,228 | — | 1/12/38 | | (6.50%) 1 month | Synthetic MBX Index | (58,266) |
| | | | | USD-LIBOR | 6.50% 30 year Fannie | |
| | | | | | Mae pools | |
|
| 6,973,511 | — | 1/12/38 | | (6.50%) 1 month | Synthetic MBX Index | (61,311) |
| | | | | USD-LIBOR | 6.50% 30 year Fannie | |
| | | | | | Mae pools | |
|
| Citibank, N.A. | | | | | | |
| 9,861,863 | — | 1/12/41 | | 5.00% (1 month | Synthetic MBX Index | 24,978 |
| | | | | USD-LIBOR) | 5.00% 30 year Fannie | |
| | | | | | Mae pools | |
|
| 13,263,605 | — | 1/12/41 | | 5.00% (1 month | Synthetic MBX Index | 33,594 |
| | | | | USD-LIBOR) | 5.00% 30 year Fannie | |
| | | | | | Mae pools | |
|
| 7,348,994 | — | 1/12/41 | | (4.50%) 1 month | Synthetic TRS Index | 138,874 |
| | | | | USD-LIBOR | 4.50% 30 year Fannie | |
| | | | | | Mae pools | |
|
| 1,581,325 | — | 1/12/41 | | (3.50%) 1 month | Synthetic TRS Index | 17,127 |
| | | | | USD-LIBOR | 3.50% 30 year Fannie | |
| | | | | | Mae pools | |
|
| 6,231,899 | — | 1/12/41 | | (4.00%) 1 month | Synthetic TRS Index | 87,277 |
| | | | | USD-LIBOR | 4.00% 30 year Fannie | |
| | | | | | Mae pools | |
|
| 7,028,682 | — | 1/12/41 | | (4.50%) 1 month | Synthetic TRS Index | 132,821 |
| | | | | USD-LIBOR | 4.50% 30 year Fannie | |
| | | | | | Mae pools | |
|
| Credit Suisse International | | | | | |
| 23,978,118 | — | 1/12/41 | | 4.50% (1 month | Synthetic MBX Index | 118,117 |
| | | | | USD-LIBOR) | 4.50% 30 year Ginnie | |
| | | | | | Mae II pools | |
|
| 4,698,393 | — | 1/12/39 | | (5.00%) 1 month | Synthetic TRS Index | 138,914 |
| | | | | USD-LIBOR | 5.00% 30 year Fannie | |
| | | | | | Mae pools | |
|
| 4,188,049 | — | 1/12/43 | | 3.50% (1 month | Synthetic TRS Index | (33,586) |
| | | | | USD-LIBOR) | 3.50% 30 year Fannie | |
| | | | | | Mae pools | |
|
| 11,366,625 | — | 1/12/41 | | (4.00%) 1 month | Synthetic TRS Index | 159,187 |
| | | | | USD-LIBOR | 4.00% 30 year Fannie | |
| | | | | | Mae pools | |
|
| | | | | | |
| OTC TOTAL RETURN SWAP CONTRACTS OUTSTANDING at 10/31/13 cont. | | |
| | Upfront | | | Payments | Total return | Unrealized |
| Swap counterparty/ | premium | Termination | | received (paid) by | received by | appreciation/ |
| Notional amount | received (paid) | date | | fund per annum | or paid by fund | (depreciation) |
|
| Credit Suisse International cont. | | | | | |
| $4,627,673 | $— | 1/12/43 | | 3.00% (1 month | Synthetic MBX Index | $79,200 |
| | | | | USD-LIBOR) | 3.00% 30 year Fannie | |
| | | | | | Mae pools | |
|
| 2,592,987 | — | 1/12/41 | | 4.50% (1 month | Synthetic TRS Index | (49,000) |
| | | | | USD-LIBOR) | 4.50% 30 year Fannie | |
| | | | | | Mae pools | |
|
| 3,358,279 | — | 1/12/41 | | 4.50% (1 month | Synthetic TRS Index | (63,461) |
| | | | | USD-LIBOR) | 4.50% 30 year Fannie | |
| | | | | | Mae pools | |
|
| 2,691,264 | — | 1/12/41 | | 4.50% (1 month | Synthetic TRS Index | (50,857) |
| | | | | USD-LIBOR) | 4.50% 30 year Fannie | |
| | | | | | Mae pools | |
|
| 16,725,606 | — | 1/12/41 | | (4.00%) 1 month | Synthetic TRS Index | 234,239 |
| | | | | USD-LIBOR | 4.00% 30 year Fannie | |
| | | | | | Mae pools | |
|
| 9,342,304 | — | 1/12/41 | | (4.50%) 1 month | Synthetic TRS Index | 176,541 |
| | | | | USD-LIBOR | 4.50% 30 year Fannie | |
| | | | | | Mae pools | |
|
| 10,692,714 | — | 1/12/41 | | (4.50%) 1 month | Synthetic TRS Index | 202,060 |
| | | | | USD-LIBOR | 4.50% 30 year Fannie | |
| | | | | | Mae pools | |
|
| 2,213,525 | — | 1/12/41 | | (4.50%) 1 month | Synthetic TRS Index | 41,829 |
| | | | | USD-LIBOR | 4.50% 30 year Fannie | |
| | | | | | Mae pools | |
|
| 4,411,126 | — | 1/12/41 | | (4.50%) 1 month | Synthetic TRS Index | 83,357 |
| | | | | USD-LIBOR | 4.50% 30 year Fannie | |
| | | | | | Mae pools | |
|
| 2,875,990 | — | 1/12/41 | | (4.50%) 1 month | Synthetic TRS Index | 54,347 |
| | | | | USD-LIBOR | 4.50% 30 year Fannie | |
| | | | | | Mae pools | |
|
| 2,844,596 | — | 1/12/41 | | (4.50%) 1 month | Synthetic TRS Index | 53,754 |
| | | | | USD-LIBOR | 4.50% 30 year Fannie | |
| | | | | | Mae pools | |
|
| 5,384,860 | (40,387) | 1/12/40 | | (4.00%) 1 month | Synthetic TRS Index | 71,640 |
| | | | | USD-LIBOR | 4.00% 30 year Fannie | |
| | | | | | Mae pools | |
|
| Goldman Sachs International | | | | | |
| 4,360,657 | — | 1/12/41 | | 4.00% (1 month | Synthetic TRS Index | (61,070) |
| | | | | USD-LIBOR) | 4.00% 30 year Fannie | |
| | | | | | Mae pools | |
|
| 2,103,067 | — | 1/12/38 | | 6.50% (1 month | Synthetic TRS Index | (10,239) |
| | | | | USD-LIBOR) | 6.50% 30 year Fannie | |
| | | | | | Mae pools | |
|
| 7,370,654 | — | 1/12/38 | | 6.50% (1 month | Synthetic TRS Index | (35,883) |
| | | | | USD-LIBOR) | 6.50% 30 year Fannie | |
| | | | | | Mae pools | |
|
| | | | | | |
| OTC TOTAL RETURN SWAP CONTRACTS OUTSTANDING at 10/31/13 cont. | | |
| | Upfront | | | Payments | Total return | Unrealized |
| Swap counterparty/ | premium | Termination | | received (paid) by | received by | appreciation/ |
| Notional amount | received (paid) | date | | fund per annum | or paid by fund | (depreciation) |
|
| Goldman Sachs International cont. | | | | | |
| $5,685,892 | $— | 1/12/38 | | 6.50% (1 month | Synthetic TRS Index | $(27,681) |
| | | | | USD-LIBOR) | 6.50% 30 year Fannie | |
| | | | | | Mae pools | |
|
| 1,974,899 | — | 1/12/39 | | 6.00% (1 month | Synthetic TRS Index | (18,464) |
| | | | | USD-LIBOR) | 6.00% 30 year Fannie | |
| | | | | | Mae pools | |
|
| 19,019,200 | — | 1/12/39 | | 6.00% (1 month | Synthetic TRS Index | (177,819) |
| | | | | USD-LIBOR) | 6.00% 30 year Fannie | |
| | | | | | Mae pools | |
|
| 2,735,308 | — | 1/12/41 | | 4.00% (1 month | Synthetic TRS Index | (38,307) |
| | | | | USD-LIBOR) | 4.00% 30 year Fannie | |
| | | | | | Mae pools | |
|
| 7,141,843 | — | 1/12/38 | | 6.50% (1 month | Synthetic TRS Index | (34,769) |
| | | | | USD-LIBOR) | 6.50% 30 year Fannie | |
| | | | | | Mae pools | |
|
| 450,967 | — | 1/12/41 | | 4.00% (1 month | Synthetic TRS Index | (6,316) |
| | | | | USD-LIBOR) | 4.00% 30 year Fannie | |
| | | | | | Mae pools | |
|
| 3,444,462 | — | 1/12/41 | | 4.00% (1 month | Synthetic TRS Index | (48,239) |
| | | | | USD-LIBOR) | 4.00% 30 year Fannie | |
| | | | | | Mae pools | |
|
| 3,386,034 | — | 1/12/41 | | 4.50% (1 month | Synthetic TRS Index | (63,986) |
| | | | | USD-LIBOR) | 4.50% 30 year Fannie | |
| | | | | | Mae pools | |
|
| 7,144,236 | — | 1/12/42 | | 4.00% (1 month | Synthetic TRS Index | (95,595) |
| | | | | USD-LIBOR) | 4.00% 30 year Fannie | |
| | | | | | Mae pools | |
|
| 7,144,236 | — | 1/12/42 | | 4.00% (1 month | Synthetic TRS Index | (95,595) |
| | | | | USD-LIBOR) | 4.00% 30 year Fannie | |
| | | | | | Mae pools | |
|
| 760,791 | — | 1/12/41 | | 4.00% (1 month | Synthetic TRS Index | (10,655) |
| | | | | USD-LIBOR) | 4.00% 30 year Fannie | |
| | | | | | Mae pools | |
|
| 2,065,497 | — | 1/12/41 | | 4.00% (1 month | Synthetic TRS Index | (28,927) |
| | | | | USD-LIBOR) | 4.00% 30 year Fannie | |
| | | | | | Mae pools | |
|
| 3,398,726 | — | 1/12/41 | | 4.00% (1 month | Synthetic TRS Index | (47,599) |
| | | | | USD-LIBOR) | 4.00% 30 year Fannie | |
| | | | | | Mae pools | |
|
| 7,820,856 | — | 1/12/41 | | (4.00%) 1 month | Synthetic TRS Index | 109,530 |
| | | | | USD-LIBOR | 4.00% 30 year Fannie | |
| | | | | | Mae pools | |
|
| 7,864,953 | — | 1/12/41 | | 4.50% (1 month | Synthetic TRS Index | (148,624) |
| | | | | USD-LIBOR) | 4.50% 30 year Fannie | |
| | | | | | Mae pools | |
|
| 1,366,779 | — | 1/12/40 | | (4.00%) 1 month | Synthetic TRS Index | 27,682 |
| | | | | USD-LIBOR | 4.00% 30 year Fannie | |
| | | | | | Mae pools | |
|
| | | | | | |
| OTC TOTAL RETURN SWAP CONTRACTS OUTSTANDING at 10/31/13 cont. | | |
| | Upfront | | | Payments | Total return | Unrealized |
| Swap counterparty/ | premium | Termination | | received (paid) by | received by | appreciation/ |
| Notional amount | received (paid) | date | | fund per annum | or paid by fund | (depreciation) |
|
| Goldman Sachs International cont. | | | | | |
| $1,534,369 | $— | 1/12/41 | | 4.00% (1 month | Synthetic TRS Index | $(21,489) |
| | | | | USD-LIBOR) | 4.00% 30 year Fannie | |
| | | | | | Mae pools | |
|
| 3,856,578 | — | 1/12/41 | | 4.00% (1 month | Synthetic TRS Index | (54,011) |
| | | | | USD-LIBOR) | 4.00% 30 year Fannie | |
| | | | | | Mae pools | |
|
| 10,550,084 | — | 1/12/38 | | (6.50%) 1 month | Synthetic MBX Index | (92,756) |
| | | | | USD-LIBOR | 6.50% 30 year Fannie | |
| | | | | | Mae pools | |
|
| 3,963,375 | — | 1/12/38 | | (6.50%) 1 month | Synthetic MBX Index | (34,846) |
| | | | | USD-LIBOR | 6.50% 30 year Fannie | |
| | | | | | Mae pools | |
|
| 7,284,650 | — | 1/12/36 | | 5.50% (1 month | Synthetic TRS Index | (72,320) |
| | | | | USD-LIBOR) | 5.50% 30 year Fannie | |
| | | | | | Mae pools | |
|
| 11,459,573 | — | 1/12/41 | | 4.00% (1 month | Synthetic TRS Index | (160,489) |
| | | | | USD-LIBOR) | 4.00% 30 year Fannie | |
| | | | | | Mae pools | |
|
| 11,667,757 | — | 1/12/41 | | 4.50% (1 month | Synthetic TRS Index | (220,485) |
| | | | | USD-LIBOR) | 4.50% 30 year Fannie | |
| | | | | | Mae pools | |
|
| 3,398,773 | — | 1/12/41 | | 4.50% (1 month | Synthetic TRS Index | (64,226) |
| | | | | USD-LIBOR) | 4.50% 30 year Fannie | |
| | | | | | Mae pools | |
|
| 1,160,121 | — | 1/12/41 | | 4.00% (1 month | Synthetic TRS Index | (16,247) |
| | | | | USD-LIBOR) | 4.00% 30 year Fannie | |
| | | | | | Mae pools | |
|
| 2,124,757 | — | 1/12/39 | | 6.00% (1 month | Synthetic TRS Index | (19,865) |
| | | | | USD-LIBOR) | 6.00% 30 year Fannie | |
| | | | | | Mae pools | |
|
| 3,598,214 | — | 1/12/39 | | 6.00% (1 month | Synthetic TRS Index | (33,641) |
| | | | | USD-LIBOR) | 6.00% 30 year Fannie | |
| | | | | | Mae pools | |
|
| 5,627,003 | — | 1/12/41 | | 4.00% (1 month | Synthetic TRS Index | (78,805) |
| | | | | USD-LIBOR) | 4.00% 30 year Fannie | |
| | | | | | Mae pools | |
|
| 440,669 | — | 1/12/38 | | 6.50% (1 month | Synthetic TRS Index | (2,145) |
| | | | | USD-LIBOR) | 6.50% 30 year Fannie | |
| | | | | | Mae pools | |
|
| 3,760,945 | — | 1/12/41 | | 4.50% (1 month | Synthetic TRS Index | (71,070) |
| | | | | USD-LIBOR) | 4.50% 30 year Fannie | |
| | | | | | Mae pools | |
|
| 13,436,622 | — | 1/12/40 | | 4.00% (1 month | Synthetic TRS Index | (272,140) |
| | | | | USD-LIBOR) | 4.00% 30 year Fannie | |
| | | | | | Mae pools | |
|
| 3,782,318 | — | 1/12/39 | | 6.00% (1 month | Synthetic TRS Index | (35,363) |
| | | | | USD-LIBOR) | 6.00% 30 year Fannie | |
| | | | | | Mae pools | |
|
| | | | | | |
| OTC TOTAL RETURN SWAP CONTRACTS OUTSTANDING at 10/31/13 cont. | | |
| | Upfront | | | Payments | Total return | Unrealized |
| Swap counterparty/ | premium | Termination | | received (paid) by | received by | appreciation/ |
| Notional amount | received (paid) | date | | fund per annum | or paid by fund | (depreciation) |
|
| Goldman Sachs International cont. | | | | | |
| $2,259,367 | $— | 1/12/39 | | 6.00% (1 month | Synthetic TRS Index | $(21,124) |
| | | | | USD-LIBOR) | 6.00% 30 year Fannie | |
| | | | | | Mae pools | |
|
| 7,564,635 | — | 1/12/39 | | 6.00% (1 month | Synthetic TRS Index | (70,725) |
| | | | | USD-LIBOR) | 6.00% 30 year Fannie | |
| | | | | | Mae pools | |
|
| 1,642,198 | — | 1/12/38 | | 6.50% (1 month | Synthetic TRS Index | (7,995) |
| | | | | USD-LIBOR) | 6.50% 30 year Fannie | |
| | | | | | Mae pools | |
|
| 7,703,319 | — | 1/12/41 | | 4.00% (1 month | Synthetic TRS Index | (107,884) |
| | | | | USD-LIBOR) | 4.00% 30 year Fannie | |
| | | | | | Mae pools | |
|
| 1,613,546 | — | 1/12/41 | | 4.00% (1 month | Synthetic TRS Index | (22,597) |
| | | | | USD-LIBOR) | 4.00% 30 year Fannie | |
| | | | | | Mae pools | |
|
| 3,431,184 | — | 1/12/41 | | 4.00% (1 month | Synthetic TRS Index | (48,053) |
| | | | | USD-LIBOR) | 4.00% 30 year Fannie | |
| | | | | | Mae pools | |
|
| 14,452,499 | — | 1/12/38 | | (6.50%) 1 month | Synthetic MBX Index | (127,066) |
| | | | | USD-LIBOR | 6.50% 30 year Fannie | |
| | | | | | Mae pools | |
|
| 976,205 | — | 1/12/38 | | 6.50% (1 month | Synthetic TRS Index | (4,753) |
| | | | | USD-LIBOR) | 6.50% 30 year Fannie | |
| | | | | | Mae pools | |
|
| 7,541,030 | — | 1/12/41 | | 4.00% (1 month | Synthetic TRS Index | (105,611) |
| | | | | USD-LIBOR) | 4.00% 30 year Fannie | |
| | | | | | Mae pools | |
|
| 1,998,701 | — | 1/12/38 | | 6.50% (1 month | Synthetic TRS Index | (9,731) |
| | | | | USD-LIBOR) | 6.50% 30 year Fannie | |
| | | | | | Mae pools | |
|
| 535,897 | — | 1/12/38 | | (6.50%) 1 month | Synthetic MBX Index | (4,712) |
| | | | | USD-LIBOR | 6.50% 30 year Fannie | |
| | | | | | Mae pools | |
|
| 1,428,898 | — | 1/12/38 | | (6.50%) 1 month | Synthetic MBX Index | (12,563) |
| | | | | USD-LIBOR | 6.50% 30 year Fannie | |
| | | | | | Mae pools | |
|
| 1,939,905 | — | 1/12/38 | | 6.50% (1 month | Synthetic TRS Index | (9,444) |
| | | | | USD-LIBOR) | 6.50% 30 year Fannie | |
| | | | | | Mae pools | |
|
| 3,879,811 | — | 1/12/38 | | 6.50% (1 month | Synthetic TRS Index | (18,889) |
| | | | | USD-LIBOR) | 6.50% 30 year Fannie | |
| | | | | | Mae pools | |
|
| 2,628,142 | — | 1/12/38 | | 6.50% (1 month | Synthetic TRS Index | (12,795) |
| | | | | USD-LIBOR) | 6.50% 30 year Fannie | |
| | | | | | Mae pools | |
|
| 1,188,152 | — | 1/12/41 | | 4.00% (1 month | Synthetic TRS Index | (16,640) |
| | | | | USD-LIBOR) | 4.00% 30 year Fannie | |
| | | | | | Mae pools | |
|
| | | | | | |
| OTC TOTAL RETURN SWAP CONTRACTS OUTSTANDING at 10/31/13 cont. | | |
| | Upfront | | | Payments | Total return | Unrealized |
| Swap counterparty/ | premium | Termination | | received (paid) by | received by | appreciation/ |
| Notional amount | received (paid) | date | | fund per annum | or paid by fund | (depreciation) |
|
| Goldman Sachs International cont. | | | | | |
| $1,212,230 | $— | 1/12/38 | | 6.50% (1 month | Synthetic TRS Index | $(5,902) |
| | | | | USD-LIBOR) | 6.50% 30 year Fannie | |
| | | | | | Mae pools | |
|
| 8,077,648 | — | 1/12/38 | | 6.50% (1 month | Synthetic TRS Index | (39,325) |
| | | | | USD-LIBOR) | 6.50% 30 year Fannie | |
| | | | | | Mae pools | |
|
| 5,884,921 | — | 1/12/42 | | 4.00% (1 month | Synthetic TRS Index | (78,744) |
| | | | | USD-LIBOR) | 4.00% 30 year Fannie | |
| | | | | | Mae pools | |
|
| 5,674,706 | — | 1/12/41 | | (4.00%) 1 month | Synthetic TRS Index | 79,473 |
| | | | | USD-LIBOR | 4.00% 30 year Fannie | |
| | | | | | Mae pools | |
|
| 13,266,391 | — | 1/12/41 | | (4.00%) 1 month | Synthetic TRS Index | 185,793 |
| | | | | USD-LIBOR | 4.00% 30 year Fannie | |
| | | | | | Mae pools | |
|
| 2,664,737 | — | 1/12/41 | | (4.00%) 1 month | Synthetic TRS Index | 37,319 |
| | | | | USD-LIBOR | 4.00% 30 year Fannie | |
| | | | | | Mae pools | |
|
| 2,664,737 | — | 1/12/41 | | (4.00%) 1 month | Synthetic TRS Index | 37,319 |
| | | | | USD-LIBOR | 4.00% 30 year Fannie | |
| | | | | | Mae pools | |
|
| 3,729,096 | — | 1/12/41 | | (4.50%) 1 month | Synthetic TRS Index | 70,469 |
| | | | | USD-LIBOR | 4.50% 30 year Fannie | |
| | | | | | Mae pools | |
|
| 13,807,846 | — | 1/12/41 | | (4.00%) 1 month | Synthetic TRS Index | 193,376 |
| | | | | USD-LIBOR | 4.00% 30 year Fannie | |
| | | | | | Mae pools | |
|
| 1,581,325 | — | 1/12/41 | | 3.50% (1 month | Synthetic TRS Index | (17,127) |
| | | | | USD-LIBOR) | 3.50% 30 year Fannie | |
| | | | | | Mae pools | |
|
| 14,364,966 | — | 1/12/38 | | (6.50%) 1 month | Synthetic TRS Index | 69,935 |
| | | | | USD-LIBOR | 6.50% 30 year Fannie | |
| | | | | | Mae pools | |
|
| 13,655,689 | — | 1/12/39 | | 6.00% (1 month | Synthetic TRS Index | (127,673) |
| | | | | USD-LIBOR) | 6.00% 30 year Fannie | |
| | | | | | Mae pools | |
|
| 4,107,880 | — | 1/12/41 | | 4.00% (1 month | Synthetic TRS Index | (57,530) |
| | | | | USD-LIBOR) | 4.00% 30 year Fannie | |
| | | | | | Mae pools | |
|
| 4,016,649 | — | 1/12/41 | | 4.50% (1 month | Synthetic TRS Index | (75,902) |
| | | | | USD-LIBOR) | 4.50% 30 year Fannie | |
| | | | | | Mae pools | |
|
| 7,622,264 | — | 1/12/42 | | 4.00% (1 month | Synthetic TRS Index | (101,991) |
| | | | | USD-LIBOR) | 4.00% 30 year Fannie | |
| | | | | | Mae pools | |
|
| 3,358,279 | — | 1/12/41 | | 4.50% (1 month | Synthetic TRS Index | (63,461) |
| | | | | USD-LIBOR) | 4.50% 30 year Fannie | |
| | | | | | Mae pools | |
|
| | | | | | |
| OTC TOTAL RETURN SWAP CONTRACTS OUTSTANDING at 10/31/13 cont. | | |
| | Upfront | | | Payments | Total return | Unrealized |
| Swap counterparty/ | premium | Termination | | received (paid) by | received by | appreciation/ |
| Notional amount | received (paid) | date | | fund per annum | or paid by fund | (depreciation) |
|
| Goldman Sachs International cont. | | | | | |
| $6,612,540 | $— | 1/12/41 | | 4.00% (1 month | Synthetic TRS Index | $(92,607) |
| | | | | USD-LIBOR) | 4.00% 30 year Fannie | |
| | | | | | Mae pools | |
|
| 5,382,074 | — | 1/12/41 | | 4.50% (1 month | Synthetic TRS Index | (101,705) |
| | | | | USD-LIBOR) | 4.50% 30 year Fannie | |
| | | | | | Mae pools | |
|
| 11,204,122 | — | 1/12/41 | | (4.50%) 1 month | Synthetic TRS Index | 211,724 |
| | | | | USD-LIBOR | 4.50% 30 year Fannie | |
| | | | | | Mae pools | |
|
| 1,978,295 | — | 1/12/41 | | (4.50%) 1 month | Synthetic TRS Index | 37,384 |
| | | | | USD-LIBOR | 4.50% 30 year Fannie | |
| | | | | | Mae pools | |
|
| 3,174,472 | — | 1/12/41 | | (4.00%) 1 month | Synthetic TRS Index | 44,458 |
| | | | | USD-LIBOR | 4.00% 30 year Fannie | |
| | | | | | Mae pools | |
|
| 3,173,980 | — | 1/12/41 | | (4.00%) 1 month | Synthetic TRS Index | 44,451 |
| | | | | USD-LIBOR | 4.00% 30 year Fannie | |
| | | | | | Mae pools | |
|
| 8,309,023 | — | 1/12/41 | | (4.50%) 1 month | Synthetic TRS Index | 157,015 |
| | | | | USD-LIBOR | 4.50% 30 year Fannie | |
| | | | | | Mae pools | |
|
| 278,909 | — | 1/12/41 | | (4.50%) 1 month | Synthetic TRS Index | 5,271 |
| | | | | USD-LIBOR | 4.50% 30 year Fannie | |
| | | | | | Mae pools | |
|
| JPMorgan Chase Bank N.A. | | | | | |
| 5,276,971 | — | 1/12/41 | | 4.50% (1 month | Synthetic TRS Index | (99,719) |
| | | | | USD-LIBOR) | 4.50% 30 year Fannie | |
| | | | | | Mae pools | |
|
| 13,493,582 | — | 1/12/39 | | (6.00%) 1 month | Synthetic TRS Index | 126,155 |
| | | | | USD-LIBOR | 6.00% 30 year Fannie | |
| | | | | | Mae pools | |
|
| Total | $(40,387) | | | | | $(2,092,977) |
| | | |
| | | | | | | |
| OTC CREDIT DEFAULT CONTRACTS OUTSTANDING at 10/31/13 | | | | |
| | | Upfront | | | | Payments | |
| | | premium | | | Termi- | received | Unrealized |
| Swap counterparty/ | | received | Notional | | nation | (paid) by fund | appreciation/ |
| Referenced debt* | Rating*** | (paid)** | amount | | date | per annum | (depreciation) |
|
| Bank of America N.A. | | | | | | |
| CMBX NA BBB | BBB–/P | $13,534 | $198,000 | | 5/11/63 | 300 bp | $2,185 |
| Index | | | | | | | |
|
| CMBX NA BBB | BBB–/P | 26,395 | 438,000 | | 5/11/63 | 300 bp | 1,291 |
| Index | | | | | | | |
|
| CMBX NA BBB | BBB–/P | 54,079 | 876,000 | | 5/11/63 | 300 bp | 3,870 |
| Index | | | | | | | |
|
| CMBX NA BBB | BBB–/P | 51,528 | 904,000 | | 5/11/63 | 300 bp | (286) |
| Index | | | | | | | |
|
| | | | | | | |
| OTC CREDIT DEFAULT CONTRACTS OUTSTANDING at 10/31/13 cont. | | | | |
| | | Upfront | | | | Payments | |
| | | premium | | | Termi- | received | Unrealized |
| Swap counterparty/ | | received | Notional | | nation | (paid) by fund | appreciation/ |
| Referenced debt* | Rating*** | (paid)** | amount | | date | per annum | (depreciation) |
|
| Barclays Bank PLC | | | | | | | |
| CMBX NA BBB | BBB–/P | $88,467 | $798,000 | | 5/11/63 | 300 bp | $42,728 |
| Index | | | | | | | |
|
| Credit Suisse International | | | | | | |
| CMBX NA BBB | BBB–/P | 3,320 | 113,000 | | 5/11/63 | 300 bp | (3,157) |
| Index | | | | | | | |
|
| CMBX NA BBB | BBB–/P | 7,252 | 379,000 | | 5/11/63 | 300 bp | (14,471) |
| Index | | | | | | | |
|
| CMBX NA BBB | BBB–/P | 3,491 | 450,000 | | 5/11/63 | 300 bp | (22,302) |
| Index | | | | | | | |
|
| CMBX NA BBB | BBB–/P | 55,247 | 452,000 | | 5/11/63 | 300 bp | 29,339 |
| Index | | | | | | | |
|
| CMBX NA BBB | BBB–/P | 44,521 | 459,000 | | 5/11/63 | 300 bp | 18,212 |
| Index | | | | | | | |
|
| CMBX NA BBB | BBB–/P | 58,504 | 735,000 | | 5/11/63 | 300 bp | 16,376 |
| Index | | | | | | | |
|
| CMBX NA BBB | BBB–/P | 59,046 | 740,000 | | 5/11/63 | 300 bp | 16,632 |
| Index | | | | | | | |
|
| CMBX NA BBB | BBB–/P | 57,683 | 745,000 | | 5/11/63 | 300 bp | 14,982 |
| Index | | | | | | | |
|
| CMBX NA BBB | BBB–/P | 49,008 | 745,000 | | 5/11/63 | 300 bp | 6,308 |
| Index | | | | | | | |
|
| CMBX NA BBB | BBB–/P | 23,034 | 757,000 | | 5/11/63 | 300 bp | (20,355) |
| Index | | | | | | | |
|
| CMBX NA BBB | BBB–/P | 13,355 | 758,000 | | 5/11/63 | 300 bp | (30,091) |
| Index | | | | | | | |
|
| CMBX NA BBB | BBB–/P | 12,276 | 799,000 | | 5/11/63 | 300 bp | (33,520) |
| Index | | | | | | | |
|
| CMBX NA BBB | BBB–/P | 64,541 | 886,000 | | 5/11/63 | 300 bp | 13,758 |
| Index | | | | | | | |
|
| CMBX NA BBB | BBB–/P | 10,449 | 900,000 | | 5/11/63 | 300 bp | (41,136) |
| Index | | | | | | | |
|
| CMBX NA BBB | BBB–/P | 102,818 | 910,000 | | 5/11/63 | 300 bp | 50,660 |
| Index | | | | | | | |
|
| CMBX NA BBB | BBB–/P | 98,633 | 1,287,000 | | 5/11/63 | 300 bp | 24,867 |
| Index | | | | | | | |
|
| CMBX NA BBB | BBB–/P | 60,857 | 1,483,000 | | 5/11/63 | 300 bp | (24,143) |
| Index | | | | | | | |
|
| CMBX NA BBB | BBB–/P | 1,885 | 17,000 | | 5/11/63 | 300 bp | 910 |
| Index | | | | | | | |
|
| CMBX NA BBB | BBB–/P | 19,798 | 254,000 | | 5/11/63 | 300 bp | 5,239 |
| Index | | | | | | | |
|
| CMBX NA BBB | BBB–/P | 33,674 | 387,000 | | 5/11/63 | 300 bp | 11,493 |
| Index | | | | | | | |
|
| CMBX NA BBB | BBB–/P | 33,419 | 387,000 | | 5/11/63 | 300 bp | 11,237 |
| Index | | | | | | | |
|
| | | | | | | |
| OTC CREDIT DEFAULT CONTRACTS OUTSTANDING at 10/31/13 cont. | | | | |
| | | Upfront | | | | Payments | |
| | | premium | | | Termi- | received | Unrealized |
| Swap counterparty/ | | received | Notional | | nation | (paid) by fund | appreciation/ |
| Referenced debt* | Rating*** | (paid)** | amount | | date | per annum | (depreciation) |
|
| Credit Suisse International cont. | | | | | | |
| CMBX NA BBB | BBB–/P | $39,926 | $412,000 | | 5/11/63 | 300 bp | $16,312 |
| Index | | | | | | | |
|
| CMBX NA BBB | BBB–/P | 128,508 | 1,206,000 | | 5/11/63 | 300 bp | 59,384 |
| Index | | | | | | | |
|
| CMBX NA BBB | BBB–/P | 165,598 | 1,568,000 | | 5/11/63 | 300 bp | 75,726 |
| Index | | | | | | | |
|
| Total | | $1,380,846 | | | | | $232,048 |
* Payments related to the referenced debt are made upon a credit default event.
** Upfront premium is based on the difference between the original spread on issue and the market spread on day of execution.
*** Ratings are presented for credit default contracts in which the fund has sold protection on the underlying referenced debt. Ratings for an underlying index represent the average of the ratings of all the securities included in that index. The Moody’s, Standard & Poor’s or Fitch ratings are believed to be the most recent ratings available at October 31, 2013. Securities rated by Putnam are indicated by “/P.”
ASC 820 establishes a three-level hierarchy for disclosure of fair value measurements. The valuation hierarchy is based upon the transparency of inputs to the valuation of the fund’s investments. The three levels are defined as follows:
Level 1: Valuations based on quoted prices for identical securities in active markets.
Level 2: Valuations based on quoted prices in markets that are not active or for which all significant inputs are observable, either directly or indirectly.
Level 3: Valuations based on inputs that are unobservable and significant to the fair value measurement.
The following is a summary of the inputs used to value the fund’s net assets as of the close of the reporting period:
| | | |
| | | Valuation inputs | |
|
| Investments in securities: | Level 1 | Level 2 | Level 3 |
|
| Corporate bonds and notes | $— | $333,546,650 | $— |
|
| Foreign government and agency bonds and notes | — | 852,587 | — |
|
| Mortgage-backed securities | — | 592,408,101 | — |
|
| Municipal bonds and notes | — | 4,366,381 | — |
|
| Purchased options outstanding | — | 278,920 | — |
|
| Purchased swap options outstanding | — | 2,534,196 | — |
|
| Senior loans | — | 151,443 | — |
|
| U.S. government and agency mortgage obligations | — | 421,586,663 | — |
|
| U.S. treasury obligations | — | 431,074 | — |
|
| Short-term investments | 29,691,533 | 31,297,601 | — |
|
| Totals by level | $29,691,533 | $1,387,453,616 | $— |
| | | |
| | | Valuation inputs | |
|
| Other financial instruments: | Level 1 | Level 2 | Level 3 |
|
| Futures contracts | $(153,794) | $— | $— |
|
| Written swap options outstanding | — | (2,716,974) | — |
|
| Forward premium swap option contracts | — | 10,260 | — |
|
| TBA sale commitments | — | (28,897,345) | — |
|
| Interest rate swap contracts | — | (9,835,406) | — |
|
| Total return swap contracts | — | (2,052,590) | — |
|
| Credit default contracts | — | (1,148,798) | — |
|
| Totals by level | $(153,794) | $(44,640,853) | $— |
The accompanying notes are an integral part of these financial statements.
Statement of assets and liabilities 10/31/13
| |
| ASSETS | |
|
| Investment in securities, at value (Note 1): | |
| Unaffiliated issuers (identified cost $1,329,676,160) | $1,389,663,616 |
| Affiliated issuers (identified cost $27,481,533) (Notes 1 and 5) | 27,481,533 |
|
| Cash | 346,722 |
|
| Interest and other receivables | 10,963,148 |
|
| Receivable for shares of the fund sold | 12,055,197 |
|
| Receivable for investments sold | 4,367,218 |
|
| Receivable for sales of delayed delivery securities (Note 1) | 41,069,343 |
|
| Receivable for variation margin (Note 1) | 486,702 |
|
| Unrealized appreciation on forward premium swap option contracts (Note 1) | 10,260 |
|
| Unrealized appreciation on OTC swap contracts (Note 1) | 4,913,160 |
|
| Premium paid on OTC swap contracts (Note 1) | 40,387 |
|
| Total assets | 1,491,397,286 |
| |
| LIABILITIES | |
|
| Payable for investments purchased | 3,659,172 |
|
| Payable for purchases of delayed delivery securities (Note 1) | 213,404,372 |
|
| Payable for shares of the fund repurchased | 2,282,785 |
|
| Payable for variation margin (Note 1) | 445,225 |
|
| Payable for compensation of Manager (Note 2) | 413,577 |
|
| Payable for custodian fees (Note 2) | 25,087 |
|
| Payable for investor servicing fees (Note 2) | 307,629 |
|
| Payable for Trustee compensation and expenses (Note 2) | 404,373 |
|
| Payable for administrative services (Note 2) | 4,523 |
|
| Payable for distribution fees (Note 2) | 365,835 |
|
| Unrealized depreciation on OTC swap contracts (Note 1) | 6,774,089 |
|
| Premium received on OTC swap contracts (Note 1) | 1,380,846 |
|
| Written options outstanding, at value (premiums $2,535,653) (Notes 1 and 3) | 2,716,974 |
|
| TBA sale commitments, at value (proceeds receivable $28,943,438) (Note 1) | 28,897,345 |
|
| Collateral on certain derivative contracts, at value (Note 1) | 2,210,000 |
|
| Other accrued expenses | 255,489 |
|
| Total liabilities | 263,547,321 |
| | |
| Net assets | $1,227,849,965 |
|
| |
| REPRESENTED BY | |
|
| Paid-in capital (Unlimited shares authorized) (Notes 1 and 4) | $1,333,967,435 |
|
| Undistributed net investment income (Note 1) | 33,683,609 |
|
| Accumulated net realized loss on investments (Note 1) | (185,949,889) |
|
| Net unrealized appreciation of investments | 46,148,810 |
|
| Total — Representing net assets applicable to capital shares outstanding | $1,227,849,965 |
(Continued on next page)
| |
| Statement of assets and liabilities (Continued) | |
| |
| COMPUTATION OF NET ASSET VALUE AND OFFERING PRICE | |
|
| Net asset value and redemption price per class A share | |
| ($783,734,948 divided by 108,866,360 shares) | $7.20 |
|
| Offering price per class A share (100/96.00 of $7.20)* | $7.50 |
|
| Net asset value and offering price per class B share ($34,513,884 divided by 4,840,138 shares)** | $7.13 |
|
| Net asset value and offering price per class C share ($133,269,192 divided by 18,643,892 shares)** | $7.15 |
|
| Net asset value and redemption price per class M share | |
| ($128,376,148 divided by 18,218,176 shares) | $7.05 |
|
| Offering price per class M share (100/96.75 of $7.05)† | $7.29 |
|
| Net asset value, offering price and redemption price per class R share | |
| ($8,040,442 divided by 1,123,720 shares) | $7.16 |
|
| Net asset value, offering price and redemption price per class R5 share | |
| ($10,720 divided by 1,471 shares) | $7.29 |
|
| Net asset value, offering price and redemption price per class R6 share | |
| ($6,187,813 divided by 848,632 shares) | $7.29 |
|
| Net asset value, offering price and redemption price per class Y share | |
| ($133,716,818 divided by 18,344,320 shares) | $7.29 |
|
* On single retail sales of less than $100,000. On sales of $100,000 or more the offering price is reduced.
** Redemption price per share is equal to net asset value less any applicable contingent deferred sales charge.
† On single retail sales of less than $50,000. On sales of $50,000 or more the offering price is reduced.
The accompanying notes are an integral part of these financial statements.
| |
| Statement of operations Year ended 10/31/13 | |
| | |
| INVESTMENT INCOME | |
|
| Interest (including interest income of $117,633 from investments in affiliated issuers) (Note 5) | $66,333,047 |
|
| Total investment income | 66,333,047 |
| |
| EXPENSES | |
|
| Compensation of Manager (Note 2) | 5,434,826 |
|
| Investor servicing fees (Note 2) | 2,074,643 |
|
| Custodian fees (Note 2) | 85,151 |
|
| Trustee compensation and expenses (Note 2) | 128,002 |
|
| Distribution fees (Note 2) | 4,747,650 |
|
| Administrative services (Note 2) | 39,918 |
|
| Other | 566,839 |
|
| Total expenses | 13,077,029 |
| | |
| Expense reduction (Note 2) | (1,608) |
|
| Net expenses | 13,075,421 |
| | |
| Net investment income | 53,257,626 |
|
| |
| Net realized gain on investments (Notes 1 and 3) | 16,086,349 |
|
| Net increase from payments by affiliates (Note 2) | 11,664 |
|
| Net realized gain on swap contracts (Note 1) | 31,376,158 |
|
| Net realized loss on futures contracts (Note 1) | (14,429,478) |
|
| Net realized gain on written options (Notes 1 and 3) | 7,469,208 |
|
| Net unrealized depreciation of investments, futures contracts, swap contracts, written options, | |
| and TBA sale commitments during the year | (66,475,663) |
|
| Net loss on investments | (25,961,762) |
| | |
| Net increase in net assets resulting from operations | $27,295,864 |
|
The accompanying notes are an integral part of these financial statements.
| | |
| Statement of changes in net assets | | |
| |
| INCREASE (DECREASE) IN NET ASSETS | Year ended 10/31/13 | Year ended 10/31/12 |
|
| Operations: | | |
| Net investment income | $53,257,626 | $40,163,254 |
|
| Net realized gain (loss) on investments | 40,513,901 | (28,647,090) |
|
| Net unrealized appreciation (depreciation) of investments | (66,475,663) | 114,096,560 |
|
| Net increase in net assets resulting from operations | 27,295,864 | 125,612,724 |
|
| Distributions to shareholders (Note 1): | | |
| From ordinary income | | |
| Net investment income | | |
|
| Class A | (27,142,179) | (26,043,813) |
|
| Class B | (976,648) | (954,906) |
|
| Class C | (3,872,863) | (3,948,093) |
|
| Class M | (4,276,503) | (4,646,629) |
|
| Class R | (213,023) | (143,597) |
|
| Class R5 | (373) | (100) |
|
| Class R6 | (131,370) | (100) |
|
| Class Y | (5,975,551) | (5,026,699) |
|
| Decrease from capital share transactions (Note 4) | (193,294,019) | (8,602,096) |
|
| Total increase (decrease) in net assets | (208,586,665) | 76,246,691 |
| |
| NET ASSETS | | |
|
| Beginning of year | 1,436,436,630 | 1,360,189,939 |
|
| End of year (including undistributed net investment income | | |
| of $33,746,784 and $6,088,116, respectively) | $1,227,849,965 | $1,436,436,630 |
|
The accompanying notes are an integral part of these financial statements.
|
| This page left blank intentionally. |
Financial highlights (For a common share outstanding throughout the period)
| | | | | | | | | | | | | | |
| INVESTMENT OPERATIONS: | | | | LESS DISTRIBUTIONS: | | | | | RATIOS AND SUPPLEMENTAL DATA: | |
|
| | | | | | | | | | | | | Ratio | Ratio | |
| | | | Net realized | | | | | | | | | of expenses | of net investment | |
| | Net asset value, | | and unrealized | Total from | From | | | | | Total return | Net assets, | to average | income (loss) | Portfolio |
| | beginning | Net investment | gain (loss) | investment | net investment | Total | Redemption | Non-recurring | Net asset value, | at net asset | end of period | net assets | to average | turnover |
| Period ended | of period | income (loss) a | on investments | operations | income | distributions | fees | reimbursements | end of period | value (%) b | (in thousands) | (%) c | net assets (%) | (%) d |
|
| Class A | | | | | | | | | | | | | | |
| October 31, 2013 | $7.27 | .29 | (.12) | .17 | (.24) | (.24) | — | — | $7.20 | 2.31 | $783,735 | .87 | 4.03 | 267 |
| October 31, 2012 | 6.84 | .21 | .43 | .64 | (.21) | (.21) | — | — | 7.27 | 9.59 | 878,866 | .86 | 3.02 | 204 |
| October 31, 2011 | 6.86 | .28 | .05 | .33 | (.35) | (.35) | — | — e,f | 6.84 | 4.95 | 843,019 | .86 | 4.02 | 339 |
| October 31, 2010 | 6.61 | .43 | .31 | .74 | (.49) | (.49) | — f | — f,g | 6.86 | 11.45 | 855,659 | .88 h,i | 6.38 h | 112 |
| October 31, 2009 | 5.35 | .29 | 1.44 | 1.73 | (.47) | (.47) | — f | — | 6.61 | 34.44 | 667,144 | 1.68 h,j | 5.12 h | 331 |
|
| Class B | | | | | | | | | | | | | | |
| October 31, 2013 | $7.20 | .23 | (.12) | .11 | (.18) | (.18) | — | — | $7.13 | 1.58 | $34,514 | 1.62 | 3.28 | 267 |
| October 31, 2012 | 6.78 | .16 | .42 | .58 | (.16) | (.16) | — | — | 7.20 | 8.75 | 41,215 | 1.61 | 2.27 | 204 |
| October 31, 2011 | 6.80 | .22 | .06 | .28 | (.30) | (.30) | — | — e,f | 6.78 | 4.22 | 39,859 | 1.61 | 3.29 | 339 |
| October 31, 2010 | 6.56 | .39 | .28 | .67 | (.43) | (.43) | — f | — f,g | 6.80 | 10.54 | 43,205 | 1.63 h,i | 5.82 h | 112 |
| October 31, 2009 | 5.32 | .24 | 1.43 | 1.67 | (.43) | (.43) | — f | — | 6.56 | 33.21 | 45,772 | 2.43 h,j | 4.31 h | 331 |
|
| Class C | | | | | | | | | | | | | | |
| October 31, 2013 | $7.22 | .24 | (.13) | .11 | (.18) | (.18) | — | — | $7.15 | 1.58 | $133,269 | 1.62 | 3.28 | 267 |
| October 31, 2012 | 6.80 | .16 | .42 | .58 | (.16) | (.16) | — | — | 7.22 | 8.72 | 166,407 | 1.61 | 2.27 | 204 |
| October 31, 2011 | 6.82 | .22 | .06 | .28 | (.30) | (.30) | — | — e,f | 6.80 | 4.21 | 169,692 | 1.61 | 3.27 | 339 |
| October 31, 2010 | 6.58 | .35 | .33 | .68 | (.44) | (.44) | — f | — f,g | 6.82 | 10.57 | 167,237 | 1.63 h,i | 5.08 h | 112 |
| October 31, 2009 | 5.33 | .26 | 1.42 | 1.68 | (.43) | (.43) | — f | — | 6.58 | 33.40 | 43,310 | 2.43 h,j | 4.45 h | 331 |
|
| Class M | | | | | | | | | | | | | | |
| October 31, 2013 | $7.12 | .27 | (.12) | .15 | (.22) | (.22) | — | — | $7.05 | 2.15 | $128,376 | 1.12 | 3.79 | 267 |
| October 31, 2012 | 6.71 | .19 | .42 | .61 | (.20) | (.20) | — | — | 7.12 | 9.27 | 151,113 | 1.11 | 2.77 | 204 |
| October 31, 2011 | 6.74 | .26 | .05 | .31 | (.34) | (.34) | — | — e,f | 6.71 | 4.66 | 170,347 | 1.11 | 3.82 | 339 |
| October 31, 2010 | 6.50 | .42 | .29 | .71 | (.47) | (.47) | — f | — f,g | 6.74 | 11.28 | 222,916 | 1.13 h,i | 6.23 h | 112 |
| October 31, 2009 | 5.28 | .27 | 1.41 | 1.68 | (.46) | (.46) | — f | — | 6.50 | 33.82 | 194,199 | 1.93 h,j | 4.83 h | 331 |
|
| Class R | | | | | | | | | | | | | | |
| October 31, 2013 | $7.23 | .27 | (.12) | .15 | (.22) | (.22) | — | — | $7.16 | 2.11 | $8,040 | 1.12 | 3.79 | 267 |
| October 31, 2012 | 6.81 | .19 | .43 | .62 | (.20) | (.20) | — | — | 7.23 | 9.26 | 5,265 | 1.11 | 2.77 | 204 |
| October 31, 2011 | 6.83 | .25 | .07 | .32 | (.34) | (.34) | — | — e,f | 6.81 | 4.74 | 4,723 | 1.11 | 3.74 | 339 |
| October 31, 2010 | 6.59 | .40 | .31 | .71 | (.47) | (.47) | — f | — f,g | 6.83 | 11.10 | 4,068 | 1.13 h,i | 5.91 h | 112 |
| October 31, 2009 | 5.34 | .27 | 1.44 | 1.71 | (.46) | (.46) | — f | — | 6.59 | 34.02 | 2,353 | 1.93 h,j | 4.85 h | 331 |
|
| Class R5 | | | | | | | | | | | | | | |
| October 31, 2013 | $7.35 | .32 | (.12) | .20 | (.26) | (.26) | — | — | $7.29 | 2.75 | $11 | .58 | 4.33 | 267 |
| October 31, 2012† | 7.11 | .08 | .23 | .31 | (.07) | (.07) | — | — | 7.35 | 4.39* | 10 | .19* | 1.12* | 204 |
|
| Class R6 | | | | | | | | | | | | | | |
| October 31, 2013 | $7.36 | .31 | (.12) | .19 | (.26) | (.26) | — | — | $7.29 | 2.62 | $6,188 | .51 | 4.25 | 267 |
| October 31, 2012† | 7.11 | .08 | .24 | .32 | (.07) | (.07) | — | — | 7.36 | 4.54* | 10 | .17* | 1.14* | 204 |
|
| Class Y | | | | | | | | | | | | | | |
| October 31, 2013 | $7.36 | .31 | (.13) | .18 | (.25) | (.25) | — | — | $7.29 | 2.52 | $133,717 | .62 | 4.30 | 267 |
| October 31, 2012 | 6.91 | .23 | .45 | .68 | (.23) | (.23) | — | — | 7.36 | 10.00 | 193,550 | .61 | 3.26 | 204 |
| October 31, 2011 | 6.93 | .29 | .06 | .35 | (.37) | (.37) | — | — e,f | 6.91 | 5.12 | 132,550 | .61 | 4.25 | 339 |
| October 31, 2010 | 6.67 | .46 | .30 | .76 | (.50) | (.50) | — f | — f,g | 6.93 | 11.73 | 145,681 | .63 h,i | 6.74 h | 112 |
| October 31, 2009 | 5.40 | .32 | 1.43 | 1.75 | (.48) | (.48) | — f | — | 6.67 | 34.59 | 227,134 | 1.43 h,j | 5.87 h | 331 |
|
See notes to financial highlights at the end of this section.
The accompanying notes are an integral part of these financial statements.
| | |
| 66 Income Fund | Income Fund | 67 |
Financial highlights (Continued)
* Not annualized.
† For the period July 3, 2012 (commencement of operations) to October 31, 2012.
a Per share net investment income has been determined on the basis of the weighted average number of shares outstanding during the period.
b Total return assumes dividend reinvestment and does not reflect the effect of sales charges.
c Includes amounts paid through expense offset arrangements (Note 2).
d Portfolio turnover excludes TBA purchase and sale transactions.
e Reflects a non-recurring reimbursement related to restitution amounts in connection with a distribution plan approved by the Securities and Exchange Commission (the SEC) which amounted to less than $0.01 per share outstanding on July 21, 2011. Also reflects a non-recurring reimbursement related to short-term trading related lawsuits, which amounted to less than $0.01 per share outstanding on May 11, 2011.
f Amount represents less than $0.01 per share.
g Reflects a non-recurring reimbursement pursuant to a settlement between the SEC and Prudential Securities, Inc., which amounted to less than $0.01 per share outstanding as of March 30, 2010.
h Reflects an involuntary contractual expense limitation in effect during the period. As a result of such limitation and/or waivers, the expenses of each class reflect a reduction of the following amounts:
| |
| | Percentage of |
| | average net assets |
|
| October 31, 2010 | 0.03% |
|
| October 31, 2009 | 0.19 |
|
i Excludes the impact of a current period reduction to interest expense related to the resolution of certain terminated derivatives contracts, which amounted to 0.18% of average net assets for the period ended October 31, 2010.
j Includes interest accrued in connection with certain terminated derivatives contracts, which amounted to 0.72% of average net assets for the period ended October 31, 2009.
The accompanying notes are an integral part of these financial statements.
Notes to financial statements 10/31/13
Within the following Notes to financial statements, references to “State Street” represent State Street Bank and Trust Company, references to “the SEC” represent the Securities and Exchange Commission, references to “Putnam Management” represent Putnam Investment Management, LLC, the fund’s manager, an indirect wholly-owned subsidiary of Putnam Investments, LLC and references to “OTC”, if any, represent over-the-counter. Unless otherwise noted, the “reporting period” represents the period from November 1, 2012 through October 31, 2013.
Putnam Income Fund (the fund) is a Massachusetts business trust, which is registered under the Investment Company Act of 1940, as amended, as a diversified open-end management investment company. The fund seeks high current income consistent with what Putnam Management believes to be prudent risk. The fund invests mainly in bonds that are securitized debt instruments (such as mortgage-backed investments) and other obligations of companies and governments worldwide denominated in U.S. dollars, are either investment-grade or below investment-grade in quality (sometimes referred to as “junk bonds”) and have intermediate- to long-term maturities (three years or longer). Putnam Management may consider, among other factors, credit, interest rate and prepayment risks, as well as general market conditions, when deciding whether to buy or sell investments.
The fund offers class A, class B, class C, class M, class R, class R5, class R6 and class Y shares. Class A and class M shares are sold with a maximum front-end sales charge of 4.00% and 3.25%, respectively, and generally do not pay a contingent deferred sales charge. Class B shares, which convert to class A shares after approximately eight years, do not pay a front-end sales charge and are subject to a contingent deferred sales charge if those shares are redeemed within six years of purchase. Class C shares have a one-year 1.00% contingent deferred sales charge and do not convert to class A shares. Class R shares, which are not available to all investors, are sold at net asset value. The expenses for class A, class B, class C, class M and class R shares may differ based on the distribution fee of each class, which is identified in Note 2. Class R5, class R6 and class Y shares, which are sold at net asset value, are generally subject to the same expenses as class A, class B, class C, class M and class R shares, but do not bear a distribution fee and in the case of class R5 and class R6 shares, bear a lower investor servicing fee, which is identified in Note 2. Class R5, class R6 and class Y shares are not available to all investors.
In the normal course of business, the fund enters into contracts that may include agreements to indemnify another party under given circumstances. The fund’s maximum exposure under these arrangements is unknown as this would involve future claims that may be, but have not yet been, made against the fund. However, the fund’s management team expects the risk of material loss to be remote.
Note 1: Significant accounting policies
The following is a summary of significant accounting policies consistently followed by the fund in the preparation of its financial statements. The preparation of financial statements is in conformity with accounting principles generally accepted in the United States of America and requires management to make estimates and assumptions that affect the reported amounts of assets and liabilities in the financial statements and the reported amounts of increases and decreases in net assets from operations. Actual results could differ from those estimates. Subsequent events after the Statement of assets and liabilities date through the date that the financial statements were issued have been evaluated in the preparation of the financial statements.
Investment income, realized and unrealized gains and losses and expenses of the fund are borne pro-rata based on the relative net assets of each class to the total net assets of the fund, except that each class bears expenses unique to that class (including the distribution fees applicable to such classes). Each class votes as a class only with respect to its own distribution plan or other matters on which a class vote is required by law or determined by the Trustees. If the fund were liquidated, shares of each class would receive their pro-rata share of the net assets of the fund. In addition, the Trustees declare separate dividends on each class of shares.
Security valuation Market quotations are not considered to be readily available for certain debt obligations and other investments; such investments are valued on the basis of valuations furnished by an independent pricing service approved by the Trustees or dealers selected by Putnam Management. Such services or dealers determine valuations for normal institutional-size trading units of such securities using methods based on market transactions for comparable securities and various relationships, generally recognized by institutional traders, between securities (which consider such factors as security prices, yields, maturities and ratings). These securities will generally be categorized as Level 2. Securities quoted in foreign currencies, if any, are translated into U.S. dollars at the current exchange rate.
Investments in open-end investment companies (excluding exchange traded funds), if any, which can be classified as Level 1 or Level 2 securities, are valued based on their net asset value. The net asset value of such
investment companies equals the total value of their assets less their liabilities and divided by the number of their outstanding shares.
To the extent a pricing service or dealer is unable to value a security or provides a valuation that Putnam Management does not believe accurately reflects the security’s fair value, the security will be valued at fair value by Putnam Management in accordance with policies and procedures approved by the Trustees. Certain investments, including certain restricted and illiquid securities and derivatives, are also valued at fair value following procedures approved by the Trustees. These valuations consider such factors as significant market or specific security events such as interest rate or credit quality changes, various relationships with other securities, discount rates, U.S. Treasury, U.S. swap and credit yields, index levels, convexity exposures and recovery rates. These securities are classified as Level 2 or as Level 3 depending on the priority of the significant inputs.
Such valuations and procedures are reviewed periodically by the Trustees. Certain securities may be valued on the basis of a price provided by a single source. The fair value of securities is generally determined as the amount that the fund could reasonably expect to realize from an orderly disposition of such securities over a reasonable period of time. By its nature, a fair value price is a good faith estimate of the value of a security in a current sale and does not reflect an actual market price, which may be different by a material amount.
Security transactions and related investment income Security transactions are recorded on the trade date (the date the order to buy or sell is executed). Gains or losses on securities sold are determined on the identified cost basis. Interest income, net of any applicable withholding taxes, is recorded on the accrual basis. All premiums/discounts are amortized/accreted on a yield-to-maturity basis.
The fund earned certain fees in connection with its senior loan purchasing activities. These fees are treated as market discount and are amortized into income in the Statement of operations.
Securities purchased or sold on a delayed delivery basis may be settled a month or more after the trade date; interest income is accrued based on the terms of the securities. Losses may arise due to changes in the market value of the underlying securities or if the counterparty does not perform under the contract.
Stripped securities The fund may invest in stripped securities which represent a participation in securities that may be structured in classes with rights to receive different portions of the interest and principal. Interest-only securities receive all of the interest and principal-only securities receive all of the principal. If the interest-only securities experience greater than anticipated prepayments of principal, the fund may fail to recoup fully its initial investment in these securities. Conversely, principal-only securities increase in value if prepayments are greater than anticipated and decline if prepayments are slower than anticipated. The market value of these securities is highly sensitive to changes in interest rates.
Options contracts The fund uses options contracts to hedge duration and convexity, to isolate prepayment risk and to manage downside risks.
The potential risk to the fund is that the change in value of options contracts may not correspond to the change in value of the hedged instruments. In addition, losses may arise from changes in the value of the underlying instruments if there is an illiquid secondary market for the contracts, if interest or exchange rates move unexpectedly or if the counterparty to the contract is unable to perform. Realized gains and losses on purchased options are included in realized gains and losses on investment securities. If a written call option is exercised, the premium originally received is recorded as an addition to sales proceeds. If a written put option is exercised, the premium originally received is recorded as a reduction to the cost of investments.
Exchange traded options are valued at the last sale price or, if no sales are reported, the last bid price for purchased options and the last ask price for written options. OTC traded options are valued using prices supplied by dealers. Forward premium swap option contracts include premiums that do not settle until the expiration date of the contract. The delayed settlement of the premiums are factored into the daily valuation of the option contracts.
Written option contracts outstanding at period end, if any, are listed after the fund’s portfolio.
Futures contracts The fund uses futures contracts to hedge interest rate risk and to gain exposure to interest rates.
The potential risk to the fund is that the change in value of futures contracts may not correspond to the change in value of the hedged instruments. In addition, losses may arise from changes in the value of the underlying instruments, if there is an illiquid secondary market for the contracts, if interest or exchange rates move unexpectedly or if the counterparty to the contract is unable to perform. With futures, there is minimal counterparty credit risk to the fund since futures are exchange traded and the exchange’s clearinghouse, as counterparty to all exchange traded futures, guarantees the futures against default. Risks may exceed amounts recognized on the
Statement of assets and liabilities. When the contract is closed, the fund records a realized gain or loss equal to the difference between the value of the contract at the time it was opened and the value at the time it was closed.
Futures contracts are valued at the quoted daily settlement prices established by the exchange on which they trade. The fund and the broker agree to exchange an amount of cash equal to the daily fluctuation in the value of the futures contract. Such receipts or payments are known as “variation margin.”
Futures contracts outstanding at period end, if any, are listed after the fund’s portfolio.
Interest rate swap contracts The fund entered into OTC and/or centrally cleared interest rate swap contracts, which are arrangements between two parties to exchange cash flows based on a notional principal amount, to hedge interest rate risk and to gain exposure on interest rates.
An OTC and centrally cleared interest rate swap can be purchased or sold with an upfront premium. For OTC interest rate contracts, an upfront payment received by the fund is recorded as a liability on the fund’s books. An upfront payment made by the fund is recorded as an asset on the fund’s books. OTC and centrally cleared interest rate swap contracts are marked to market daily based upon quotations from an independent pricing service or market makers. Any change is recorded as an unrealized gain or loss on OTC interest rate swaps. Daily fluctuations in the value of centrally cleared interest rate swaps are recorded in variation margin on the Statement of assets and liabilities and recorded as unrealized gain or loss. Payments, including upfront premiums, received or made are recorded as realized gains or losses at the closing of the contract. Certain OTC and centrally cleared interest rate swap contracts may include extended effective dates. Payments related to these swap contracts are accrued based on the terms of the contract.
The fund could be exposed to credit or market risk due to unfavorable changes in the fluctuation of interest rates or if the counterparty defaults, in the case of OTC interest rate contracts, or the central clearing agency or a clearing member defaults, in the case of centrally cleared interest rate swap contracts, on its respective obligation to perform under the contract. The fund’s maximum risk of loss from counterparty risk or central clearing risk is the fair value of the contract. This risk may be mitigated for OTC interest rate swap contracts by having a master netting arrangement between the fund and the counterparty and for centrally cleared interest rate swap contracts through the daily exchange of variation margin. There is minimal counterparty risk with respect to centrally cleared interest rate swap contracts due to the clearinghouse guarantee fund and other resources that are available in the event of a clearing member default. Risk of loss may exceed amounts recognized on the Statement of assets and liabilities.
OTC and centrally cleared interest rate swap contracts outstanding, including their respective notional amounts at period end, if any, are listed after the fund’s portfolio.
Total return swap contracts The fund entered into OTC total return swap contracts, which are arrangements to exchange a market linked return for a periodic payment, both based on a notional principal amount, to hedge sector exposure, to manage exposure to specific sectors or industries and to gain exposure to specific sectors or industries.
To the extent that the total return of the security, index or other financial measure underlying the transaction exceeds or falls short of the offsetting interest rate obligation, the fund will receive a payment from or make a payment to the counterparty. OTC total return swap contracts are marked to market daily based upon quotations from an independent pricing service or market makers and the change, if any, is recorded as an unrealized gain or loss. Payments received or made are recorded as realized gains or losses. Certain OTC total return swap contracts may include extended effective dates. Payments related to these swap contracts are accrued based on the terms of the contract. The fund could be exposed to credit or market risk due to unfavorable changes in the fluctuation of interest rates or in the price of the underlying security or index, the possibility that there is no liquid market for these agreements or that the counterparty may default on its obligation to perform. The fund’s maximum risk of loss from counterparty risk is the fair value of the contract. This risk may be mitigated by having a master netting arrangement between the fund and the counterparty. Risk of loss may exceed amounts recognized on the Statement of assets and liabilities.
OTC total return swap contracts outstanding, including their respective notional amounts at period end, if any, are listed after the fund’s portfolio.
Credit default contracts The fund entered into OTC and/or centrally cleared credit default contracts to gain exposure on individual names and/or baskets of securities.
In OTC and centrally cleared credit default contracts, the protection buyer typically makes an upfront payment and a periodic stream of payments to a counterparty, the protection seller, in exchange for the right to receive a
contingent payment upon the occurrence of a credit event on the reference obligation or all other equally ranked obligations of the reference entity. Credit events are contract specific but may include bankruptcy, failure to pay, restructuring and obligation acceleration. For OTC credit default contracts, an upfront payment received by the fund is recorded as a liability on the fund’s books. An upfront payment made by the fund is recorded as an asset on the fund’s books. Periodic payments received or paid by the fund for OTC and centrally cleared credit default contracts are recorded as realized gains or losses at the close of the contract. Centrally cleared credit default contracts provide the same rights to the protection buyer and seller except the payments between parties are settled through a central clearing agent through variation margin payments. The OTC and centrally cleared credit default contracts are marked to market daily based upon quotations from an independent pricing service or market makers. Any change in value of OTC credit default contracts is recorded as an unrealized gain or loss. Daily fluctuations in the value of centrally cleared credit default contracts are recorded in variation margin on the Statement of assets and liabilities and recorded as unrealized gain or loss. Upon the occurrence of a credit event, the difference between the par value and market value of the reference obligation, net of any proportional amount of the upfront payment, is recorded as a realized gain or loss.
In addition to bearing the risk that the credit event will occur, the fund could be exposed to market risk due to unfavorable changes in interest rates or in the price of the underlying security or index or the possibility that the fund may be unable to close out its position at the same time or at the same price as if it had purchased the underlying reference obligations. In certain circumstances, the fund may enter into offsetting OTC and centrally cleared credit default contracts which would mitigate its risk of loss. Risks of loss may exceed amounts recognized on the Statement of assets and liabilities. The fund’s maximum risk of loss from counterparty risk, either as the protection seller or as the protection buyer, is the fair value of the contract. This risk may be mitigated for OTC credit default contracts by having a master netting arrangement between the fund and the counterparty and for centrally cleared credit default contracts through the daily exchange of variation margin. Counterparty risk is further mitigated with respect to centrally cleared credit default swap contracts due to the clearinghouse guarantee fund and other resources that are available in the event of a clearing member default. Where the fund is a seller of protection, the maximum potential amount of future payments the fund may be required to make is equal to the notional amount.
OTC and centrally cleared credit default contracts outstanding, including their respective notional amounts at period end, if any, are listed after the fund’s portfolio.
Master agreements The fund is a party to ISDA (International Swaps and Derivatives Association, Inc.) Master Agreements (Master Agreements) with certain counterparties that govern OTC derivative and foreign exchange contracts entered into from time to time. The Master Agreements may contain provisions regarding, among other things, the parties’ general obligations, representations, agreements, collateral requirements, events of default and early termination. With respect to certain counterparties, in accordance with the terms of the Master Agreements, collateral posted to the fund is held in a segregated account by the fund’s custodian and with respect to those amounts which can be sold or repledged, are presented in the fund’s portfolio. Collateral posted to the fund which cannot be sold or repledged totaled $569,685 at the close of the reporting period.
Collateral pledged by the fund is segregated by the fund’s custodian and identified in the fund’s portfolio. Collateral can be in the form of cash or debt securities issued by the U.S. Government or related agencies or other securities as agreed to by the fund and the applicable counterparty. Collateral requirements are determined based on the fund’s net position with each counterparty.
Termination events applicable to the fund may occur upon a decline in the fund’s net assets below a specified threshold over a certain period of time. Termination events applicable to counterparties may occur upon a decline in the counterparty’s long-term and short-term credit ratings below a specified level. In each case, upon occurrence, the other party may elect to terminate early and cause settlement of all derivative and foreign exchange contracts outstanding, including the payment of any losses and costs resulting from such early termination, as reasonably determined by the terminating party. Any decision by one or more of the fund’s counterparties to elect early termination could impact the fund’s future derivative activity.
At the close of the reporting period, the fund had a net liability position of $3,954,580 on open derivative contracts subject to the Master Agreements. Collateral posted by the fund for these agreements totaled $4,401,120.
TBA purchase commitments The fund may enter into TBA (to be announced) commitments to purchase securities for a fixed unit price at a future date beyond customary settlement time. Although the unit price has been established, the principal value has not been finalized. However, it is anticipated that the amount of the
commitments will not significantly differ from the principal amount. The fund holds, and maintains until settlement date, cash or high-grade debt obligations in an amount sufficient to meet the purchase price, or the fund may enter into offsetting contracts for the forward sale of other securities it owns. Income on the securities will not be earned until settlement date. TBA purchase commitments may be considered securities themselves, and involve a risk of loss if the value of the security to be purchased declines prior to the settlement date, which risk is in addition to the risk of decline in the value of the fund’s other assets. Unsettled TBA purchase commitments are valued at fair value of the underlying securities, according to the procedures described under “Security valuation” above. The contract is marked to market daily and the change in market value is recorded by the fund as an unrealized gain or loss.
Although the fund will generally enter into TBA purchase commitments with the intention of acquiring securities for its portfolio or for delivery pursuant to options contracts it has entered into, the fund may dispose of a commitment prior to settlement if Putnam Management deems it appropriate to do so.
TBA sale commitments The fund may enter into TBA sale commitments to hedge its portfolio positions or to sell mortgage-backed securities it owns under delayed delivery arrangements. Proceeds of TBA sale commitments are not received until the contractual settlement date. During the time a TBA sale commitment is outstanding, equivalent deliverable securities, or an offsetting TBA purchase commitment deliverable on or before the sale commitment date, are held as “cover” for the transaction.
Unsettled TBA sale commitments are valued at the fair value of the underlying securities, generally according to the procedures described under “Security valuation” above. The contract is marked to market daily and the change in market value is recorded by the fund as an unrealized gain or loss. If the TBA sale commitment is closed through the acquisition of an offsetting TBA purchase commitment, the fund realizes a gain or loss. If the fund delivers securities under the commitment, the fund realizes a gain or a loss from the sale of the securities based upon the unit price established at the date the commitment was entered into. TBA sale commitments outstanding at period end, if any, are listed after the fund’s portfolio.
Interfund lending The fund, along with other Putnam funds, may participate in an interfund lending program pursuant to an exemptive order issued by the SEC. This program allows the fund to borrow from or lend to other Putnam funds that permit such transactions. Interfund lending transactions are subject to each fund’s investment policies and borrowing and lending limits. Interest earned or paid on the interfund lending transaction will be based on the average of certain current market rates. During the reporting period, the fund did not utilize the program.
Line of credit The fund participates, along with other Putnam funds, in a $315 million unsecured committed line of credit and a $185 million unsecured uncommitted line of credit, both provided by State Street. Borrowings may be made for temporary or emergency purposes, including the funding of shareholder redemption requests and trade settlements. Interest is charged to the fund based on the fund’s borrowing at a rate equal to the Federal Funds rate plus 1.25% for the committed line of credit and the Federal Funds rate plus 1.30% for the uncommitted line of credit. A closing fee equal to 0.02% of the committed line of credit and $50,000 for the uncommitted line of credit has been paid by the participating funds. In addition, a commitment fee of 0.11% per annum on any unutilized portion of the committed line of credit is allocated to the participating funds based on their relative net assets and paid quarterly. During the reporting period, the fund had no borrowings against these arrangements.
Federal taxes It is the policy of the fund to distribute all of its taxable income within the prescribed time period and otherwise comply with the provisions of the Internal Revenue Code of 1986, as amended (the Code), applicable to regulated investment companies. It is also the intention of the fund to distribute an amount sufficient to avoid imposition of any excise tax under Section 4982 of the Code.
The fund is subject to the provisions of Accounting Standards Codification 740 Income Taxes (ASC 740). ASC 740 sets forth a minimum threshold for financial statement recognition of the benefit of a tax position taken or expected to be taken in a tax return. The fund did not have a liability to record for any unrecognized tax benefits in the accompanying financial statements. No provision has been made for federal taxes on income, capital gains or unrealized appreciation on securities held nor for excise tax on income and capital gains. Each of the fund’s federal tax returns for the prior three fiscal years remains subject to examination by the Internal Revenue Service.
At October 31, 2013, the fund had a capital loss carryover of $173,457,392 available to the extent allowed by the Code to offset future net capital gain, if any. The amounts of the carryovers and the expiration dates are:
| | | |
| Loss carryover |
|
| Short-term | Long-term | Total | Expiration |
|
| $6,653,400 | $10,608,039 | $17,261,439 | * |
|
| 92,884,454 | N/A | 92,884,454 | October 31, 2016 |
|
| 63,311,499 | N/A | 63,311,499 | October 31, 2017 |
|
* Under the Regulated Investment Company Modernization Act of 2010, the fund will be permitted to carry forward capital losses incurred in taxable years beginning after December 22, 2010 for an unlimited period. However, any losses incurred will be required to be utilized prior to the losses incurred in pre-enactment tax years. As a result of this ordering rule, pre-enactment capital loss carryforwards may be more likely to expire unused. Additionally, post-enactment capital losses that are carried forward will retain their character as either short-term or long-term capital losses rather than being considered all short-term as under previous law.
Distributions to shareholders Distributions to shareholders from net investment income are recorded by the fund on the ex-dividend date. Distributions from capital gains, if any, are recorded on the ex-dividend date and paid at least annually. The amount and character of income and gains to be distributed are determined in accordance with income tax regulations, which may differ from generally accepted accounting principles. These differences include temporary and/or permanent differences from income on swap contracts and from interest-only securities. Reclassifications are made to the fund’s capital accounts to reflect income and gains available for distribution (or available capital loss carryovers) under income tax regulations. At the close of the reporting period, the fund reclassified $16,926,377 to increase undistributed net investment income and $16,926,377 to increase accumulated net realized loss.
The tax basis components of distributable earnings and the federal tax cost as of the close of the reporting period were as follows:
| |
| Unrealized appreciation | $72,781,704 |
| Unrealized depreciation | (25,416,927) |
|
| Net unrealized appreciation | 47,364,777 |
| Undistributed ordinary income | 31,830,128 |
| Capital loss carryforward | (173,457,392) |
| Cost for federal income tax purposes | $1,369,780,372 |
Note 2: Management fee, administrative services and other transactions
The fund pays Putnam Management a management fee (based on the fund’s average net assets and computed and paid monthly) at annual rates that may vary based on the average of the aggregate net assets of most open-end funds, as defined in the fund’s management contract, sponsored by Putnam Management. Such annual rates may vary as follows:
| | | | |
| 0.550% | of the first $5 billion, | | 0.350% | of the next $50 billion, |
| |
|
| 0.500% | of the next $5 billion, | | 0.330% | of the next $50 billion, |
| |
|
| 0.450% | of the next $10 billion, | | 0.320% | of the next $100 billion and |
| |
|
| 0.400% | of the next $10 billion, | | 0.315% | of any excess thereafter. |
| |
|
Following the death on October 8, 2013 of The Honourable Paul G. Desmarais, who controlled directly and indirectly a majority of the voting shares of Power Corporation of Canada, the ultimate parent company of Putnam Management, the Trustees of the fund approved an interim management contract with Putnam Management. Consistent with Rule 15a–4 under the Investment Company Act of 1940, the interim management contract will remain in effect until the earlier to occur of (i) approval by the fund’s shareholders of a new management contract and (ii) March 7, 2014. Except with respect to termination, the substantive terms of the interim management contract, including terms relating to fees payable to Putnam Management, are identical to the terms of the fund’s previous management contract with Putnam Management. The Trustees of the fund also approved the continuance, effective October 8, 2013, of the sub-management contract between Putnam Management and Putnam Investments Limited (PIL) described below,
for a term no longer than March 7, 2014. The Trustees of the fund have called a shareholder meeting for February 27, 2014, at which shareholders of the fund will consider approval of a proposed new management contract between the fund and Putnam Management. The substantive terms of the proposed new management contract, including terms relating to fees, are identical to the terms of the fund’s previous management contract.
Putnam Management has contractually agreed, through June 30, 2014, to waive fees or reimburse the fund’s expenses to the extent necessary to limit the cumulative expenses of the fund, exclusive of brokerage, interest, taxes, investment-related expenses, extraordinary expenses, acquired fund fees and expenses and payments under the fund’s investor servicing contract, investment management contract and distribution plans, on a fiscal year-to-date basis to an annual rate of 0.20% of the fund’s average net assets over such fiscal year-to-date period. This expense limitation remains in place under the interim management contract described above. During the reporting period, the fund’s expenses were not reduced as a result of this limit.
PIL, an affiliate of Putnam Management, is authorized by the Trustees to manage a separate portion of the assets of the fund as determined by Putnam Management from time to time. Effective July 1, 2013 Putnam Management pays a quarterly sub-management fee to PIL for its services at an annual rate of 0.25% of the average net assets of the portion of the fund managed by PIL. Prior to July 1, 2013, the annual rate that Putnam Management paid for these services was 0.40% of the average net assets of the portion of the fund managed by PIL.
Putnam Management voluntarily reimbursed the fund $11,664 for a trading error which occurred during the reporting period. The effect of the loss incurred and the reimbursement by Putnam Management of such amounts had no impact on total return.
The fund reimburses Putnam Management an allocated amount for the compensation and related expenses of certain officers of the fund and their staff who provide administrative services to the fund. The aggregate amount of all such reimbursements is determined annually by the Trustees.
Custodial functions for the fund’s assets are provided by State Street. Custody fees are based on the fund’s asset level, the number of its security holdings and transaction volumes.
Putnam Investor Services, Inc., an affiliate of Putnam Management, provides investor servicing agent functions to the fund. Putnam Investor Services, Inc. received fees for investor servicing (except for Class R5 and R6 shares) based on the fund’s retail asset level, the number of shareholder accounts in the fund and the level of defined contribution plan assets in the fund. Class R5 shares pay a monthly fee based on the average net assets of class R5 shares at an annual rate of 0.12%. Class R6 shares pay a monthly fee based on the average net assets of class R6 shares at an annual rate of 0.05%. Investor servicing fees will not exceed an annual rate of 0.32% of the fund’s average net assets. During the reporting period, the expenses for each class of shares related to investor servicing fees were as follows:
| | | | |
| Class A | $1,286,356 | | Class R5 | 13 |
| |
|
| Class B | 59,347 | | Class R6 | 1,734 |
| |
|
| Class C | 236,039 | | Class Y | 268,637 |
| |
|
| Class M | 211,993 | | Total | $2,074,643 |
| |
|
| Class R | 10,524 | | | |
| | |
The fund has entered into expense offset arrangements with Putnam Investor Services, Inc. and State Street whereby Putnam Investor Services, Inc.’s and State Street’s fees are reduced by credits allowed on cash balances. For the reporting period, the fund’s expenses were reduced by $1,608 under the expense offset arrangements.
Each independent Trustee of the fund receives an annual Trustee fee, of which $838, as a quarterly retainer, has been allocated to the fund, and an additional fee for each Trustees meeting attended. Trustees also are reimbursed for expenses they incur relating to their services as Trustees.
The fund has adopted a Trustee Fee Deferral Plan (the Deferral Plan) which allows the Trustees to defer the receipt of all or a portion of Trustees fees payable on or after July 1, 1995. The deferred fees remain invested in certain Putnam funds until distribution in accordance with the Deferral Plan.
The fund has adopted an unfunded noncontributory defined benefit pension plan (the Pension Plan) covering all Trustees of the fund who have served as a Trustee for at least five years and were first elected prior to 2004. Benefits under the Pension Plan are equal to 50% of the Trustee’s average annual attendance and retainer fees for the three years ended December 31, 2005. The retirement benefit is payable during a Trustee’s lifetime, beginning the year following retirement, for the number of years of service through December 31, 2006. Pension expense
for the fund is included in Trustee compensation and expenses in the Statement of operations. Accrued pension liability is included in Payable for Trustee compensation and expenses in the Statement of assets and liabilities. The Trustees have terminated the Pension Plan with respect to any Trustee first elected after 2003.
The fund has adopted distribution plans (the Plans) with respect to its class A, class B, class C, class M and class R shares pursuant to Rule 12b–1 under the Investment Company Act of 1940. The purpose of the Plans is to compensate Putnam Retail Management Limited Partnership, an indirect wholly-owned subsidiary of Putnam Investments, LLC, for services provided and expenses incurred in distributing shares of the fund. The Plans provide for payments by the fund to Putnam Retail Management Limited Partnership at an annual rate of up to 0.35%, 1.00%, 1.00%, 1.00% and 1.00% of the average net assets attributable to class A, class B, class C, class M and class R shares, respectively. The Trustees have approved payment by the fund at an annual rate of 0.25%, 1.00%, 1.00%, 0.50% and 0.50% of the average net assets attributable to class A, class B, class C, class M and class R shares, respectively. During the reporting period, the class specific expenses related to distribution fees were as follows:
| | | | |
| Class A | $2,096,545 | | Class M | 691,168 |
| |
|
| Class B | 386,926 | | Class R | 34,376 |
| |
|
| Class C | 1,538,635 | | Total | $4,747,650 |
| |
|
For the reporting period, Putnam Retail Management Limited Partnership, acting as underwriter, received net commissions of $87,703 and $9,233 from the sale of class A and class M shares, respectively, and received $21,786 and $5,188 in contingent deferred sales charges from redemptions of class B and class C shares, respectively.
A deferred sales charge of up to 1.00% and 0.40% is assessed on certain redemptions of class A and class M shares, respectively. For the reporting period, Putnam Retail Management Limited Partnership, acting as underwriter, received $2,545 and no monies on class A and class M redemptions, respectively.
Note 3: Purchases and sales of securities
During the reporting period, cost of purchases and proceeds from sales of investment securities other than short-term investments and TBA transactions aggregated $3,321,533,633 and $3,154,258,294, respectively. These figures include the cost of purchases and proceeds from sales of long-term U.S. government securities of no monies and $432,981, respectively.
Written option transactions during the reporting period are summarized as follows:
| | | | |
| | | | Written option | |
| | | | contract | |
| | Written swap | | amounts/ | |
| | option contract | Written swap | number of | Written option |
| | amounts | option premiums | contracts | premiums |
|
| Written options outstanding | | | | |
| at the beginning of the | | | | |
| reporting period | $79,432,000 | $1,529,066 | $— | $— |
|
| Options opened | 3,649,963,556 | 11,870,705 | 57 | 22,157 |
| Options exercised | (276,173,800) | (596,963) | — | — |
| Options expired | — | — | (57) | (22,157) |
| Options closed | (3,211,856,356) | (10,267,155) | — | — |
|
| Written options outstanding at | | | | |
| the end of the reporting period | $241,365,400 | $2,535,653 | $— | $— |
|
Note 4: Capital shares
At the close of the reporting period, there was an unlimited number of shares of beneficial interest authorized. Transactions in capital shares were as follows:
| | | | |
| | Year ended 10/31/13 | Year ended 10/31/12 |
|
| Class A | Shares | Amount | Shares | Amount |
|
| Shares sold | 20,725,283 | $150,177,288 | 27,350,698 | $189,503,530 |
|
| Shares issued in connection with | | | | |
| reinvestment of distributions | 3,334,755 | 24,048,309 | 3,272,191 | 22,639,769 |
|
| | 24,060,038 | 174,225,597 | 30,622,889 | 212,143,299 |
|
| Shares repurchased | (36,133,561) | (260,478,835) | (32,950,350) | (228,777,619) |
|
| Net decrease | (12,073,523) | $(86,253,238) | (2,327,461) | $(16,634,320) |
|
| |
| | Year ended 10/31/13 | Year ended 10/31/12 |
|
| Class B | Shares | Amount | Shares | Amount |
|
| Shares sold | 828,163 | $5,959,446 | 1,388,528 | $9,538,158 |
|
| Shares issued in connection with | | | | |
| reinvestment of distributions | 114,704 | 819,305 | 108,522 | 744,380 |
|
| | 942,867 | 6,778,751 | 1,497,050 | 10,282,538 |
|
| Shares repurchased | (1,826,179) | (13,066,485) | (1,651,519) | (11,377,763) |
|
| Net decrease | (883,312) | $(6,287,734) | (154,469) | $(1,095,225) |
|
| |
| | Year ended 10/31/13 | Year ended 10/31/12 |
|
| Class C | Shares | Amount | Shares | Amount |
|
| Shares sold | 2,888,515 | $20,818,710 | 5,123,472 | $35,269,152 |
|
| Shares issued in connection with | | | | |
| reinvestment of distributions | 389,912 | 2,792,633 | 376,116 | 2,585,433 |
|
| | 3,278,427 | 23,611,343 | 5,499,588 | 37,854,585 |
|
| Shares repurchased | (7,688,225) | (54,891,598) | (7,411,220) | (51,136,287) |
|
| Net decrease | (4,409,798) | $(31,280,255) | (1,911,632) | $(13,281,702) |
|
| |
| | Year ended 10/31/13 | Year ended 10/31/12 |
|
| Class M | Shares | Amount | Shares | Amount |
|
| Shares sold | 673,386 | $4,797,863 | 1,131,897 | $7,695,763 |
|
| Shares issued in connection with | | | | |
| reinvestment of distributions | 54,910 | 387,694 | 57,125 | 387,404 |
|
| | 728,296 | 5,185,557 | 1,189,022 | 8,083,167 |
|
| Shares repurchased | (3,731,396) | (26,426,129) | (5,356,881) | (36,496,132) |
|
| Net decrease | (3,003,100) | $(21,240,572) | (4,167,859) | $(28,412,965) |
|
| |
| | Year ended 10/31/13 | Year ended 10/31/12 |
|
| Class R | Shares | Amount | Shares | Amount |
|
| Shares sold | 748,244 | $5,381,147 | 372,015 | $2,551,886 |
|
| Shares issued in connection with | | | | |
| reinvestment of distributions | 26,004 | 186,217 | 18,450 | 127,087 |
|
| | 774,248 | 5,567,364 | 390,465 | 2,678,973 |
|
| Shares repurchased | (379,041) | (2,715,551) | (355,775) | (2,444,067) |
|
| Net increase | 395,207 | $2,851,813 | 34,690 | $234,906 |
|
| | | | |
| | | | For the period 7/3/12 |
| | | | (commencement of operations) |
| | Year ended 10/31/13 | to 10/31/12 |
|
| Class R5 | Shares | Amount | Shares | Amount |
|
| Shares sold | — | $— | 1,406 | $10,000 |
|
| Shares issued in connection with | | | | |
| reinvestment of distributions | 51 | 373 | 14 | 100 |
|
| | 51 | 373 | 1,420 | 10,100 |
|
| Shares repurchased | — | — | — | — |
|
| Net increase | 51 | $373 | 1,420 | $10,100 |
|
| |
| | | | For the period 7/3/12 |
| | | | (commencement of operations) |
| | Year ended 10/31/13 | to 10/31/12 |
|
| Class R6 | Shares | Amount | Shares | Amount |
|
| Shares sold | 939,717 | $6,974,232 | 1,406 | $10,000 |
|
| Shares issued in connection with | | | | |
| reinvestment of distributions | 18,090 | 131,370 | 14 | 100 |
|
| | 957,807 | 7,105,602 | 1,420 | 10,100 |
|
| Shares repurchased | (110,595) | (805,572) | — | — |
|
| Net increase | 847,212 | $6,300,030 | 1,420 | $10,100 |
|
| |
| | Year ended 10/31/13 | Year ended 10/31/12 |
|
| Class Y | Shares | Amount | Shares | Amount |
|
| Shares sold | 13,446,440 | $98,603,847 | 20,514,428 | $144,552,458 |
|
| Shares issued in connection with | | | | |
| reinvestment of distributions | 637,375 | 4,652,623 | 533,133 | 3,744,348 |
|
| | 14,083,815 | 103,256,470 | 21,047,561 | 148,296,806 |
|
| Shares repurchased | (22,053,330) | (160,640,906) | (13,902,881) | (97,729,796) |
|
| Net increase (decrease) | (7,969,515) | $(57,384,436) | 7,144,680 | $50,567,010 |
|
At the close of the reporting period, Putnam Investments, LLC owned the following class shares of the fund:
| | | |
| | Shares owned | Percentage of ownership | Value |
|
| Class R5 | 1,471 | 100.00% | $10,720 |
|
| Class R6 | 1,472 | 0.17 | 10,731 |
|
Note 5: Affiliated transactions
Transactions during the reporting period with Putnam Money Market Liquidity Fund and Putnam Short Term Investment Fund, which are under common ownership or control, were as follows:
| | | | | |
| | Market value at | | | | Market value |
| | the beginning | | | | at the end of |
| | of the reporting | | | Investment | the reporting |
| Name of affiliate | period | Purchase cost | Sale proceeds | income | period |
|
| Putnam Money Market | | | | | |
| Liquidity Fund* | $141,049,783 | $221,019,516 | $362,069,299 | $83,368 | $— |
|
| Putnam Short Term | | | | | |
| Investment Fund* | — | 515,828,997 | 488,347,464 | 34,265 | 27,481,533 |
|
| Totals | $141,049,783 | $736,848,513 | $850,416,763 | $117,633 | $27,481,533 |
|
* Management fees charged to Putnam Money Market Liquidity Fund and Putnam Short Term Investment Fund have been waived by Putnam Management.
Note 6: Senior loan commitments
Senior loans are purchased or sold on a when-issued or delayed delivery basis and may be settled a month or more after the trade date, which from time to time can delay the actual investment of available cash balances; interest income is accrued based on the terms of the securities. Senior loans can be acquired through an agent, by assignment from another holder of the loan, or as a participation interest in another holder’s portion of the loan. When the fund invests in a loan or participation, the fund is subject to the risk that an intermediate participant between the fund and the borrower will fail to meet its obligations to the fund, in addition to the risk that the borrower under the loan may default on its obligations.
Note 7: Market, credit and other risks
In the normal course of business, the fund trades financial instruments and enters into financial transactions where risk of potential loss exists due to changes in the market (market risk) or failure of the contracting party to the transaction to perform (credit risk). The fund may be exposed to additional credit risk that an institution or other entity with which the fund has unsettled or open transactions will default. Investments in foreign securities involve certain risks, including those related to economic instability, unfavorable political developments, and currency fluctuations. The fund may invest a significant portion of its assets in securitized debt instruments, including mortgage-backed and asset-backed investments. The yields and values of these investments are sensitive to changes in interest rates, the rate of principal payments on the underlying assets and the market’s perception of the issuers. The market for these investments may be volatile and limited, which may make them difficult to buy or sell.
Note 8: Summary of derivative activity
The volume of activity for the reporting period for any derivative type that was held during the period is listed below and was as follows based on an average of the holdings at the end of each fiscal quarter:
| |
| Purchased TBA commitment option contracts (contract amount) | $9,700,000 |
|
| Purchased swap option contracts (contract amount) | $754,400,000 |
|
| Written futures contract option contracts (number of contracts) (Note 3) | 10 |
|
| Written swap option contracts (contract amount) (Note 3) | $569,000,000 |
|
| Futures contracts (number of contracts) | 2,000 |
|
| OTC interest rate swap contracts (notional) | $1,820,700,000 |
|
| Centrally cleared interest rate swap contracts (notional) | $458,500,000 |
|
| OTC total return swap contracts (notional) | $1,076,500,000 |
|
| OTC credit default swap contracts (notional) | $9,800,000 |
|
| Centrally cleared credit default contracts (notional) | —* |
|
* For the reporting period, the transactions were minimal.
The following is a summary of the market values of derivative instruments as of the close of the reporting period:
Market values of derivative instruments as of the close of the reporting period
| | | | |
| | Asset derivatives | Liability derivatives |
|
| Derivatives not | | | | |
| accounted for as | Statement of | | Statement of | |
| hedging instruments | assets and | | assets and | |
| under ASC 815 | liabilities location | Market value | liabilities location | Market value |
|
| Credit contracts | Receivables | $— | Payables | $1,148,798 |
|
| | Investments, | | | |
| | Receivables, Net | | Payables, | |
| | assets — | | Net assets — | |
| | Unrealized | | Unrealized | |
| Interest rate contracts | appreciation | 11,819,635* | depreciation | 23,755,023* |
|
| Total | | $11,819,635 | | $24,903,821 |
|
* Includes cumulative appreciation/depreciation of futures contracts and centrally cleared swaps as reported in the fund’s portfolio. Only current day’s variation margin is reported within the Statement of assets and liabilities.
The following is a summary of realized and change in unrealized gains or losses of derivative instruments on the Statement of operations for the reporting period (see Note 1):
Amount of realized gain or (loss) on derivatives recognized in net gain or (loss) on investments
| | | | |
| Derivatives not accounted for | | | | |
| as hedging instruments under | | | | |
| ASC 815 | Options | Futures | Swaps | Total |
|
| Credit contracts | $— | $— | $446,942 | $446,942 |
|
| Interest rate contracts | (7,720,912) | (14,429,478) | 30,929,216 | $8,778,826 |
|
| Total | $(7,720,912) | $(14,429,478) | $31,376,158 | $9,225,768 |
|
Change in unrealized appreciation or (depreciation) on derivatives recognized in net gain or (loss) on investments
| | | | |
| Derivatives not accounted for | | | | |
| as hedging instruments under | | | | |
| ASC 815 | Options | Futures | Swaps | Total |
|
| Credit contracts | $— | $— | $232,048 | $232,048 |
|
| Interest rate contracts | 3,082,548 | 84,490 | (13,269,917) | $(10,102,879) |
|
| Total | $3,082,548 | $84,490 | $(13,037,869) | $(9,870,831) |
|
Note 9: New accounting pronouncement
In January 2013, ASU 2013–01, “Clarifying the Scope of Disclosures about Offsetting Assets and Liabilities,” amended ASU No. 2011–11, “Disclosures about Offsetting Assets and Liabilities.” The ASUs create new disclosure requirements requiring entities to disclose both gross and net information for derivatives and other financial instruments that are either offset in the Statement of assets and liabilities or subject to an enforceable master netting arrangement or similar agreement. The disclosure requirements are effective for annual reporting periods beginning on or after January 1, 2013 and interim periods within those annual periods. Putnam Management is currently evaluating the application of ASUs 2013–01 and 2011–11 and their impact, if any, on the fund’s financial statements.
Federal tax information (Unaudited)
For the reporting period, pursuant to §871(k) of the Internal Revenue Code, the fund hereby designates $41,893,971 of distributions paid as qualifying to be taxed as interest-related dividends, and no monies to be taxed as short-term capital gain dividends for nonresident alien shareholders.
The Form 1099 that will be mailed to you in January 2014 will show the tax status of all distributions paid to your account in calendar 2013.
About the Trustees
Independent Trustees


* Mr. Reynolds is an “interested person” (as defined in the Investment Company Act of 1940) of the fund and Putnam Investments. He is President and Chief Executive Officer of Putnam Investments, as well as the President of your fund and each of the other Putnam funds.
The address of each Trustee is One Post Office Square, Boston, MA 02109.
As of October 31, 2013, there were 116 Putnam funds. All Trustees serve as Trustees of all Putnam funds.
Each Trustee serves for an indefinite term, until his or her resignation, retirement at age 75, removal, or death.
Officers
In addition to Robert L. Reynolds, the other officers of the fund are shown below:
| |
| Jonathan S. Horwitz (Born 1955) | Janet C. Smith (Born 1965) |
| Executive Vice President, Principal Executive | Vice President, Principal Accounting Officer, |
| Officer, and Compliance Liaison | and Assistant Treasurer |
| Since 2004 | Since 2007 |
| | Director of Fund Administration Services, |
| Steven D. Krichmar (Born 1958) | Putnam Investments and Putnam Management |
| Vice President and Principal Financial Officer | |
| Since 2002 | Susan G. Malloy (Born 1957) |
| Chief of Operations, Putnam Investments and | Vice President and Assistant Treasurer |
| Putnam Management | Since 2007 |
| | Director of Accounting & Control Services, |
| Robert T. Burns (Born 1961) | Putnam Investments and Putnam Management |
| Vice President and Chief Legal Officer | |
| Since 2011 | James P. Pappas (Born 1953) |
| General Counsel, Putnam Investments, Putnam | Vice President |
| Management, and Putnam Retail Management | Since 2004 |
| | Director of Trustee Relations, |
| Robert R. Leveille (Born 1969) | Putnam Investments and Putnam Management |
| Vice President and Chief Compliance Officer | |
| Since 2007 | Mark C. Trenchard (Born 1962) |
| Chief Compliance Officer, Putnam Investments, | Vice President and BSA Compliance Officer |
| Putnam Management, and Putnam Retail | Since 2002 |
| Management | Director of Operational Compliance, |
| | Putnam Investments and Putnam |
| Michael J. Higgins (Born 1976) | Retail Management |
| Vice President, Treasurer, and Clerk | |
| Since 2010 | Nancy E. Florek (Born 1957) |
| Manager of Finance, Dunkin’ Brands (2008– | Vice President, Director of Proxy Voting and |
| 2010); Senior Financial Analyst, Old Mutual Asset | Corporate Governance, Assistant Clerk, |
| Management (2007–2008); Senior Financial | and Associate Treasurer |
| Analyst, Putnam Investments (1999–2007) | Since 2000 |
The principal occupations of the officers for the past five years have been with the employers as shown above, although in some cases they have held different positions with such employers. The address of each Officer is One Post Office Square, Boston, MA 02109.
Fund information
Founded over 75 years ago, Putnam Investments was built around the concept that a balance between risk and reward is the hallmark of a well-rounded financial program. We manage over 100 funds across income, value, blend, growth, asset allocation, absolute return, and global sector categories.
| | |
| Investment Manager | Trustees | Robert R. Leveille |
| Putnam Investment | Jameson A. Baxter, Chair | Vice President and |
| Management, LLC | Liaquat Ahamed | Chief Compliance Officer |
| One Post Office Square | Ravi Akhoury | |
| Boston, MA 02109 | Barbara M. Baumann | Michael J. Higgins |
| | Charles B. Curtis | Vice President, Treasurer, |
| Investment Sub-Manager | Robert J. Darretta | and Clerk |
| Putnam Investments Limited | Katinka Domotorffy | |
| 57–59 St James’s Street | John A. Hill | Janet C. Smith |
| London, England SW1A 1LD | Paul L. Joskow | Vice President, |
| | Kenneth R. Leibler | Principal Accounting Officer, |
| Marketing Services | Robert E. Patterson | and Assistant Treasurer |
| Putnam Retail Management | George Putnam, III | |
| One Post Office Square | Robert L. Reynolds | Susan G. Malloy |
| Boston, MA 02109 | W. Thomas Stephens | Vice President and |
| | | Assistant Treasurer |
| Custodian | Officers | |
| State Street Bank | Robert L. Reynolds | James P. Pappas |
| and Trust Company | President | Vice President |
| | | |
| Legal Counsel | Jonathan S. Horwitz | Mark C. Trenchard |
| Ropes & Gray LLP | Executive Vice President, | Vice President and |
| | Principal Executive Officer, and | BSA Compliance Officer |
| Independent Registered | Compliance Liaison | |
| Public Accounting Firm | | Nancy E. Florek |
| KPMG LLP | Steven D. Krichmar | Vice President, Director of |
| Vice President and | Proxy Voting and Corporate |
| Principal Financial Officer | Governance, Assistant Clerk, |
| | | and Associate Treasurer |
| | Robert T. Burns | |
| | Vice President and | |
| | Chief Legal Officer | |
This report is for the information of shareholders of Putnam Income Fund. It may also be used as sales literature when preceded or accompanied by the current prospectus, the most recent copy of Putnam’s Quarterly Performance Summary, and Putnam’s Quarterly Ranking Summary. For more recent performance, please visit putnam.com. Investors should carefully consider the investment objectives, risks, charges, and expenses of a fund, which are described in its prospectus. For this and other information or to request a prospectus or summary prospectus, call 1-800-225-1581 toll free. Please read the prospectus carefully before investing. The fund’s Statement of Additional Information contains additional information about the fund’s Trustees and is available without charge upon request by calling 1-800-225-1581.
| |
| (a) The fund’s principal executive, financial and accounting officers are employees of Putnam Investment Management, LLC, the Fund’s investment manager. As such they are subject to a comprehensive Code of Ethics adopted and administered by Putnam Investments which is designed to protect the interests of the firm and its clients. The Fund has adopted a Code of Ethics which incorporates the Code of Ethics of Putnam Investments with respect to all of its officers and Trustees who are employees of Putnam Investment Management, LLC. For this reason, the Fund has not adopted a separate code of ethics governing its principal executive, financial and accounting officers. |
| |
| (c) In July 2013, the Code of Ethics of Putnam Investment Management, LLC was amended. The changes to the Code of Ethics were as follows: (i) eliminating the requirement for employees to hold their shares of Putnam mutual funds for specified periods of time, (ii) removing the requirement to preclear transactions in certain kinds of exchange-traded funds and exchange-traded notes, although reporting of all such instruments remains required; (iii) eliminating the excessive trading rule related to employee transactions in securities requiring preclearance under the Code; (iv) adding provisions related to monitoring of employee trading; (v) changing from a set number of shares to a set dollar value of stock of mid- and large-cap companies on the Restricted List that can be purchased or sold; (vi) adding a requirement starting in March 2014 for employees to generally use certain approved brokers that provide Putnam with an electronic feed of transactions and statements for their personal brokerage accounts; and (vii) certain other changes. |
| |
| Item 3. Audit Committee Financial Expert: |
| |
| The Funds’ Audit and Compliance Committee is comprised solely of Trustees who are “independent” (as such term has been defined by the Securities and Exchange Commission (“SEC”) in regulations implementing Section 407 of the Sarbanes-Oxley Act (the “Regulations”)). The Trustees believe that each of the members of the Audit and Compliance Committee also possess a combination of knowledge and experience with respect to financial accounting matters, as well as other attributes, that qualify them for service on the Committee. In addition, the Trustees have determined that each of Mr. Leibler, Mr. Hill, Mr. Darretta and Ms. Baumann qualifies as an “audit committee financial expert” (as such term has been defined by the Regulations) based on their review of his or her pertinent experience and education. The SEC has stated that the designation or identification of a person as an audit committee financial expert pursuant to this Item 3 of Form N-CSR does not impose on such person any duties, obligations or liability that are greater than the duties, obligations and liability imposed on such person as a member of the Audit and Compliance Committee and the Board of Trustees in the absence of such designation or identification. |
| |
| Item 4. Principal Accountant Fees and Services: |
| |
| The following table presents fees billed in each of the last two fiscal years for services rendered to the fund by the fund’s independent auditor: |
| | | | | |
| Fiscal year ended | Audit Fees | Audit-Related Fees | Tax Fees | All Other Fees |
|
|
| | | | | |
| October 31, 2013 | $109,883 | $ — | $6,458 | $ — |
| October 31, 2012 | $109,651 | $ — | $6,300 | $ — |
| |
| For the fiscal years ended October 31, 2013 and October 31, 2012, the fund’s independent auditor billed aggregate non-audit fees in the amounts of $6,458 and $6,300 respectively, to the fund, Putnam Management and any entity controlling, controlled by or under common control with Putnam Management that provides ongoing services to the fund. |
| |
| Audit Fees represent fees billed for the fund’s last two fiscal years relating to the audit and review of the financial statements included in annual reports and registration statements, and other services that are normally provided in connection with statutory and regulatory filings or engagements. |
| |
| Audit-Related Fees represent fees billed in the fund’s last two fiscal years for services traditionally performed by the fund’s auditor, including accounting consultation for proposed transactions or concerning financial accounting and reporting standards and other audit or attest services not required by statute or regulation. |
| |
| Tax Fees represent fees billed in the fund’s last two fiscal years for tax compliance, tax planning and tax advice services. Tax planning and tax advice services include assistance with tax audits, employee benefit plans and requests for rulings or technical advice from taxing authorities. |
| |
| Pre-Approval Policies of the Audit and Compliance Committee. The Audit and Compliance Committee of the Putnam funds has determined that, as a matter of policy, all work performed for the funds by the funds’ independent auditors will be pre-approved by the Committee itself and thus will generally not be subject to pre-approval procedures. |
| |
| The Audit and Compliance Committee also has adopted a policy to pre-approve the engagement by Putnam Management and certain of its affiliates of the funds’ independent auditors, even in circumstances where pre-approval is not required by applicable law. Any such requests by Putnam Management or certain of its affiliates are typically submitted in writing to the Committee and explain, among other things, the nature of the proposed engagement, the estimated fees, and why this work should be performed by that particular audit firm as opposed to another one. In reviewing such requests, the Committee considers, among other things, whether the provision of such services by the audit firm are compatible with the independence of the audit firm. |
| |
| The following table presents fees billed by the fund’s independent auditor for services required to be approved pursuant to paragraph (c)(7)(ii) of Rule 2-01 of Regulation S-X. |
| | | | | |
| Fiscal year ended | Audit-Related Fees | Tax Fees | All Other Fees | Total Non-Audit Fees |
|
|
| | | | | |
| October 31, 2013 | $ — | $ — | $ — | $ — |
| | | | | |
| October 31, 2012 | $ — | $ — | $ — | $ — |
| |
| Item 5. Audit Committee of Listed Registrants |
| |
| Item 6. Schedule of Investments: |
| |
| The registrant’s schedule of investments in unaffiliated issuers is included in the report to shareholders in Item 1 above. |
| |
| Item 7. Disclosure of Proxy Voting Policies and Procedures For Closed-End Management Investment Companies: |
| |
| Item 8. Portfolio Managers of Closed-End Investment Companies |
| |
| Item 9. Purchases of Equity Securities by Closed-End Management Investment Companies and Affiliated Purchasers: |
| |
| Item 10. Submission of Matters to a Vote of Security Holders: |
| |
| Item 11. Controls and Procedures: |
| |
| (a) The registrant’s principal executive officer and principal financial officer have concluded, based on their evaluation of the effectiveness of the design and operation of the registrant’s disclosure controls and procedures as of a date within 90 days of the filing date of this report, that the design and operation of such procedures are generally effective to provide reasonable assurance that information required to be disclosed by the registrant in this report is recorded, processed, summarized and reported within the time periods specified in the Commission’s rules and forms. |
| |
| (b) Changes in internal control over financial reporting: Not applicable |
| |
| (a)(1) The Code of Ethics of The Putnam Funds, which incorporates the Code of Ethics of Putnam Investments, is filed herewith. |
| |
| (a)(2) Separate certifications for the principal executive officer and principal financial officer of the registrant as required by Rule 30a-2(a) under the Investment Company Act of 1940, as amended, are filed herewith. |
| |
| (b) The certifications required by Rule 30a-2(b) under the Investment Company Act of 1940, as amended, are filed herewith. |
| |
| Pursuant to the requirements of the Securities Exchange Act of 1934 and the Investment Company Act of 1940, the registrant has duly caused this report to be signed on its behalf by the undersigned, thereunto duly authorized. |
| |
| By (Signature and Title): |
| |
| /s/Janet C. Smith
Janet C. Smith
Principal Accounting Officer
|
| |
| Pursuant to the requirements of the Securities Exchange Act of 1934 and the Investment Company Act of 1940, this report has been signed below by the following persons on behalf of the registrant and in the capacities and on the dates indicated. |
| |
| By (Signature and Title): |
| |
| /s/Jonathan S. Horwitz
Jonathan S. Horwitz
Principal Executive Officer
|
| |
| By (Signature and Title): |
| |
| /s/Steven D. Krichmar
Steven D. Krichmar
Principal Financial Officer
|