UNITED STATES
SECURITIES AND EXCHANGE COMMISSION
WASHINGTON, D.C. 20549
FORM N-CSR
CERTIFIED SHAREHOLDER REPORT OF REGISTERED
MANAGEMENT INVESTMENT COMPANIES
Investment Company Act file number 811-5225
Oppenheimer Quest for Value Funds
(Exact name of registrant as specified in charter)
6803 South Tucson Way,
Centennial, Colorado 80112-3924
(Address of principal executive offices) (Zip code)
Arthur S. Gabinet
OFI Global Asset Management, Inc.
225 Liberty Street, New York, New York 10281-1008
(Name and address of agent for service)
Registrant’s telephone number, including area code: (303) 768-3200
Date of fiscal year end: October 31
Date of reporting period: 10/31/2014
Item 1. Reports to Stockholders.
Table of Contents
Class A Shares
AVERAGE ANNUAL TOTAL RETURNS AT 10/31/14
| | | | | | | | | | | | |
| | | 1-Year | | | 5-Year | | | 10-Year | |
Class A Shares of the Fund without Sales Charge | | | 2.85 | % | | | 7.68 | % | | | 3.57 | % |
Class A Shares of the Fund with Sales Charge | | | -3.07 | | | | 6.42 | | | | 2.96 | |
S&P 500 Index | | | 17.27 | | | | 16.69 | | | | 8.20 | |
Russell 1000 Index | | | 16.78 | | | | 16.98 | | | | 8.54 | |
MSCI All Country World Index (ex-U.S.) | | | 0.06 | | | | 6.09 | | | | 6.59 | |
Barclays U.S. Aggregate Bond Index | | | 4.14 | | | | 4.22 | | | | 4.64 | |
Barclays Multiverse Index (ex-U.S.) | | | -2.49 | | | | 1.53 | | | | 3.81 | |
Reference Index | | | 5.33 | | | | 8.37 | | | | 6.94 | |
Performance data quoted represents past performance, which does not guarantee future results. The investment return and principal value of an investment in the Fund will fluctuate so that an investor’s shares, when redeemed, may be worth more or less than their original cost. Fund returns include changes in share price, reinvested distributions, and a 5.75% maximum applicable sales charge except where “without sales charge” is indicated. Current performance may be lower or higher than the performance quoted. Returns do not consider capital gains or income taxes on an individual’s investment. For performance data current to the most recent month-end, visit oppenheimerfunds.com or call 1.800.CALL OPP (225.5677).
2 OPPENHEIMER GLOBAL ALLOCATION FUND
Fund Performance Discussion
The Fund’s Class A shares (without sales charge) produced a return of 2.85% during the reporting period. The Fund underperformed its Reference Index (the “Index”), a customized weighted index currently comprised of 30% of the Russell 1000 Index, 30% of the MSCI All Country World Index (ex-U.S.), 20% of the Barclays U.S. Aggregate Bond Index, and 20% of the Barclays Multiverse Index (ex-U.S.), which returned 5.33%. The Fund’s relative underperformance resulted primarily from our return shaping or hedging strategies, which are intended to act as overall risk reducers. This was offset by a small contribution from security selection within the portfolio’s underlying investment strategies, followed by neutral returns from our asset allocation decisions.
MARKET OVERVIEW
Global equity and fixed-income markets were choppy for the one-year reporting period ended October 31, 2014. U.S. equities were among the top performing asset classes, outperforming foreign equities, including European and emerging market equities, as well as U.S. Treasuries and credit markets.
At the outset of the reporting period, equities and higher-yielding fixed-income securities generally rallied as central banks on balance maintained their accommodative policies. In the U.S., the Federal Reserve (the “Fed”) began winding down its open-ended quantitative easing program. The Fed had
COMPARISON OF CHANGE IN VALUE OF $10,000 HYPOTHETICAL INVESTMENTS IN:
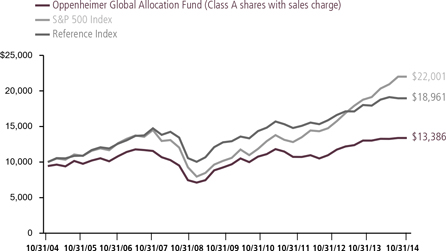
3 OPPENHEIMER GLOBAL ALLOCATION FUND
been making monthly bond purchases of $85 billion through the end of 2013, but announced in December last year that it would begin tapering its purchases in January 2014. Over the course of 2014, the Fed reduced its monthly purchases of U.S. government Treasuries and mortgage-backed securities (“MBS”) in steady $10 billion increments, and completed the process (thereby ending the program’s purchases) on October 31. Tapering the QE program in increments helped reduce market volatility and enabled investors to prepare for a post-QE market environment. While the U.S. equity market faced volatility early in 2014 due to weak first quarter data partially attributed to cold weather effects across much of the country, and again in September, it generally produced positive results and ended the reporting period at record levels, and volatility was very low for much of the year. Economic data in the U.S. was positive in the second and third quarters of 2014, with Gross Domestic Product growing at 4.6% and an estimated 3.9%, respectively.
While economic growth in the U.S. remained largely on track, it slowed in other areas, including Europe, parts of both Latin America and parts of Asia Pacific. Concerns about economic instability in the emerging markets caused some analysts to question the sustainability of the global economic recovery, and the markets responded negatively to rising geopolitical tensions between Russia and Ukraine. In Europe, positive data points that had emerged in
2013 and early 2014 largely reversed themselves later in the reporting period and the European Central Bank (the “ECB”) came under increasing pressure to provide a credible plan to boost growth and avoid deflation. In response, the ECB adopted a number of policies designed to stimulate growth. In Japan, which has been mired in economic weakness, the Abe administration adopted even more aggressive economic policies with the Bank of Japan (the “BoJ”) initiating a massive QE program. However, the results have largely not shown in the data, with Japan’s economy slipping back into recession in the third quarter of 2014 following a consumption tax increase. Emerging markets’ economic growth was mixed, as certain regions like Eastern Europe and the Middle East remained burdened by geopolitical turmoil. Many commodity producing emerging market economies like Venezuela and Russia also struggled as prices for most commodities fell.
As a result of U.S. economic strength, the U.S. dollar rallied strongly against most major currencies this reporting period, including the euro and Japanese yen.
FUND REVIEW
The Fund’s overweight to international equities versus domestic equities detracted from performance for the reporting period. Despite representing a less compelling valuation opportunity, domestic equities significantly outperformed international equities. Decoupling from their international
4 OPPENHEIMER GLOBAL ALLOCATION FUND
counterparts, domestic equities were propelled higher on the back of stronger economic growth in comparison to deterioration in areas like Japan and Europe. This underperformance was partially offset by the Fund’s lack of exposure to international (emerging and developed market) debt, which was the largest positive contributor on the asset allocation front. In our view, developed market spreads are somewhat narrow in comparison to relative historical periods. This has made the asset class expensive within our risk/reward framework. We are staying away from emerging market debt on lackluster global economic growth and negative dynamics in commodity markets; moreover, a less accommodative Fed should be positive for the U.S. dollar, leading to a headwind for foreign currency denominated bonds. This allocation decision added value as international debt and currencies weakened during the year on renewed concerns in Europe and rate normalization signaling from the Fed.
During the year, the security selection component of the Fund’s investment process also contributed positively to relative performance. Stock selection within the emerging market equity strategy added positive excess return to the Fund. The emerging market equity strategy outperformed the MSCI Emerging Markets Index by roughly 4%. Although outperformance in international equities was partially offset by domestic equity strategy
underperformance, on a net basis, security selection was a small positive to the overall Fund’s return.
The Fund’s return shaping strategies, which are designed to improve the overall risk profile of the Fund, detracted from performance during the year. Under normal circumstances, we expect return shaping strategies to cost money, like any insurance premium, and commensurately enhance returns or partially protect principal in environments of extreme market volatility. Despite uncertainty around the growth outlook, volatility continued to move lower, a significant headwind for our return shaping strategies, which are often implemented via options. Although we maintained hedges against many of our downside risk exposures in a rallying market, we financed the protection via upside capture strategies, which are intended to capture gains from sustained market appreciation. Our upside capture strategies benefited as equity markets rallied during the period. Specifically, our S&P 500 call options were accretive to returns and offset some of the downside hedging cost.
A significant portion of our downside protection strategy entailed put spreads on the S&P 500 Index as implied volatility appeared cheap. These allow us to partially finance the cost of purchased put options by selling further out of the money put options. Additionally, given lower implied volatility levels, we purchased Chicago Board Options
5 OPPENHEIMER GLOBAL ALLOCATION FUND
Exchange Market Volatility Index (the “CBOE VIX Index”)1 futures and call spreads as a cost effective way to provide additional downside protection, in the event of future market selloffs. Again, under normal circumstances we expect return shaping strategies to cost money and commensurately enhance returns or partially protect principal in environments of extreme market volatility. It is worth noting that since volatility was persistently low, the strategies proved relatively inexpensive by historical standards during the year.
STRATEGY & OUTLOOK
Overall, we are neutrally positioned in terms of risk in the portfolio and are slightly overweight equities relative to the Reference Index, but with defensive hedges built in for downside protection. In our view, central bankers have significantly lifted global equity valuations back to average to slightly rich territory. We believe current zero short-term rates will be left largely unchanged for some time given the Fed’s more dovish stance, and on the back of further deterioration on the macroeconomic front in areas like Japan and Europe. Moreover, the BoJ and ECB are ramping up asset purchases as the Fed steps back. Given weaker global growth outlook, falling risk appetite, and slightly rich valuations, we believe in being more conservatively positioned than we were at this time last year.
Among fixed-income investments, we currently favor floating rate securities and higher-yielding corporate bonds, as the corporate sector globally has gone to great lengths to term out debt, improve balance sheet quality, and bolster profit margins. Given that we are in a period of lower volatility and positive growth, we feel carry assets will do fairly well. We therefore maintain limited exposure to U.S. Treasuries with a view toward eventual rate and borrowing cost increases. Any normalization in monetary policy could have adverse effects on the Treasury market and portions of the corporate and emerging market credit markets. Therefore, we remain focused on establishing downside protection via derivative strategies, which we are currently able to purchase somewhat inexpensively due to low volatility. To the extent unconventional central bank policy suppressed volatility, as these policies are unwound, we believe volatility should rise to more typical levels, which can benefit our hedging overlays.
At the end of the day, reduced Fed “intervention” is inevitable. In this environment, we expect correlation among assets to continue to decline as investors focus more on company fundamentals rather than macro events. This should enhance the opportunity for our security selection teams
1. The CBOE VIX Index is a measure of market expectations of near-term volatility conveyed by S&P 500 stock index option prices.
6 OPPENHEIMER GLOBAL ALLOCATION FUND
to add value. At the same time, less Fed activity in terms of providing market support only enhances the importance of seeking cost-efficient hedges in the event of a downturn. Finally, it is worth noting that most asset classes have returned to at least to normal levels as investors gradually returned to the market. Of course, this implies fewer opportunities, but that is one of the advantages of the Fund’s wide ranging mandate.
| | | | | | | | | | |

| |  | | 
| |  |
| | Mark Hamilton Portfolio Manager | | | Benjamin Rockmuller, CFA Portfolio Manager |
7 OPPENHEIMER GLOBAL ALLOCATION FUND
Top Holdings and Allocations
TOP TEN COMMON STOCK HOLDINGS
| | | | |
Apple, Inc. | | | 1.0% | |
Walt Disney Co. (The) | | | 0.9 | |
Citigroup, Inc. | | | 0.8 | |
Telefonaktiebolaget LM Ericsson, Cl. B | | | 0.7 | |
Gilead Sciences, Inc. | | | 0.7 | |
Tiffany & Co. | | | 0.6 | |
McGraw Hill Financial, Inc. | | | 0.6 | |
ICICI Bank Ltd., Sponsored ADR | | | 0.6 | |
LVMH Moet Hennessy Louis Vuitton SA | | | 0.6 | |
Microsoft Corp. | | | 0.6 | |
Portfolio holdings and allocations are subject to change. Percentages are as of October 31, 2014, and are based on net assets. For more current Fund holdings, please visit oppenheimerfunds.com.
TOP TEN GEOGRAPHICAL HOLDINGS
| | | | |
United States | | | 67.3% | |
United Kingdom | | | 4.1 | |
France | | | 3.2 | |
Japan | | | 3.1 | |
Germany | | | 3.1 | |
Switzerland | | | 3.0 | |
India | | | 2.0 | |
Brazil | | | 1.9 | |
China | | | 1.4 | |
Canada | | | 1.3 | |
Portfolio holdings and allocation are subject to change. Percentages are as of October 31, 2014, and are based on total market value of investments.
PORTFOLIO ALLOCATION
| | | | |
Common Stocks | | | 71.5% | |
Investment Companies Oppenheimer Master Event-Linked Bond Fund, LLC | | | 8.1 | |
Oppenheimer Master Loan Fund, LLC | | | 10.1 | |
Non-Convertible Corporate Bonds and Notes | | | 7.9 | |
Corporate Loans | | | 1.0 | |
Preferred Stocks | | | 0.9 | |
Exchange-Traded Options Purchased | | | 0.5 | |
Rights, Warrants and Certificates | | | — * | |
* Represents a value of less than 0.005%.
Portfolio holdings and allocations are subject to change. Percentages are as of October 31, 2014, and are based on the total market value of investments.
REGIONAL ALLOCATION
| | | | |
U.S./Canada | | | 68.6% | |
Europe | | | 18.6 | |
Asia | | | 8.2 | |
Latin America | | | 3.2 | |
Emerging Europe | | | 0.8 | |
Middle East/Africa | | | 0.6 | |
Portfolio holdings and allocations are subject to change. Percentages are as of October 31, 2014, and are based on the total market value of investments.
8 OPPENHEIMER GLOBAL ALLOCATION FUND
Share Class Performance
AVERAGE ANNUAL TOTAL RETURNS WITHOUT SALES CHARGE AS OF 10/31/14
| | | | | | | | | | |
| | | Inception Date | | 1-Year | | 5-Year | | 10-Year | | |
Class A (QVGIX) | | 11/1/91 | | 2.85% | | 7.68% | | 3.57% | | |
Class B (QGRBX) | | 9/1/93 | | 2.05% | | 6.78% | | 3.08% | | |
Class C (QGRCX) | | 9/1/93 | | 2.10% | | 6.90% | | 2.82% | | |
Class I (QGRIX) | | 2/28/12 | | 3.32% | | 7.73% * | | N/A | | |
Class R (QGRNX) | | 3/1/01 | | 2.56% | | 7.41% | | 3.30% | | |
Class Y (QGRYX) | | 5/1/00 | | 3.17% | | 8.05% | | 3.93% | | |
AVERAGE ANNUAL TOTAL RETURNS WITH SALES CHARGE AS OF 10/31/14
| | | | | | | | | | |
| | | Inception Date | | 1-Year | | 5-Year | | 10-Year | | |
Class A (QVGIX) | | 11/1/91 | | -3.07% | | 6.42% | | 2.96% | | |
Class B (QGRBX) | | 9/1/93 | | -2.96% | | 6.47% | | 3.08% | | |
Class C (QGRCX) | | 9/1/93 | | 1.10% | | 6.90% | | 2.82% | | |
Class I (QGRIX) | | 2/28/12 | | 3.32% | | 7.73% * | | N/A | | |
Class R (QGRNX) | | 3/1/01 | | 1.56% | | 7.41% | | 3.30% | | |
Class Y (QGRYX) | | 5/1/00 | | 3.17% | | 8.05% | | 3.93% | | |
| * Shows performance since inception. | | |
Performance data quoted represents past performance, which does not guarantee future results. The investment return and principal value of an investment in the Fund will fluctuate so that an investor’s shares, when redeemed, may be worth more or less than their original cost. Current performance may be lower or higher than the performance quoted. For performance data current to the most recent month-end, visit oppenheimerfunds.com or call 1.800.CALL OPP (225.5677). Fund returns include changes in share price, reinvested distributions, and the applicable sales charge: for Class A shares, the current maximum initial sales charge of 5.75%; for Class B shares, the contingent deferred sales charge of 5% (1-year) and 2% (5-year); and for Class C shares, the contingent deferred sales charge (“CDSC”) of 1% for the 1-year period. Prior to 7/1/14, Class R shares were named Class N shares. Beginning 7/1/14, new purchases of Class R shares will no longer be subject to a CDSC upon redemption (any CDSC will remain in effect for purchases prior to 7/1/14). There is no sales charge for Class I and Class Y shares. Because Class B shares convert to Class A shares 72 months after purchase, the 10-year return for Class B shares uses Class A performance for the period after conversion.
The Fund’s performance is compared to the performance of the S&P 500 Index, the Russell 1000 Index, the MSCI All Country World Index (ex-U.S.), the Barclays U.S. Aggregate Bond Index, the Barclays Multiverse Index (ex-U.S.) and the Fund’s Reference Index. The S&P 500 Index is a capitalization-weighted index of 500 stocks intended to be a representative sample of leading companies in leading industries within the U.S. economy. The Russell 1000 Index measures the performance of the large-cap segment of the U.S. equity universe. The MSCI All Country World Index (ex U.S.) is designed to measure global developed and emerging equity market performance excluding the United States. The Barclays U.S. Aggregate Bond Index is
9 OPPENHEIMER GLOBAL ALLOCATION FUND
an index of U.S dollar-denominated, investment-grade U.S. corporate government and mortgage-backed securities. The Barclays Multiverse Index (ex-U.S.) provides a broad-based measure of the global fixed-income bond market. The Fund’s Reference Index is a customized weighted index currently comprised of 30% of the Russell 1000 Index, 30% of the MSCI All Country World Index (ex-U.S.), 20% of the Barclays U.S. Aggregate Bond Index, and 20% of the Barclays Multiverse Index (ex-U.S.). The indices are unmanaged and cannot be purchased directly by investors. While index comparisons may be useful to provide a benchmark for the Fund’s performance, it must be noted that the Fund’s investments are not limited to the investments comprising the indices. Index performance includes reinvestment of income, but does not reflect transaction costs, fees, expenses or taxes. Index performance is shown for illustrative purposes only as a benchmark for the Fund’s performance, and does not predict or depict performance of the Fund. The Fund’s performance reflects the effects of the Fund’s business and operating expenses.
The Fund’s investment strategy and focus can change over time. The mention of specific fund holdings does not constitute a recommendation by OppenheimerFunds, Inc. or its affiliates.
Before investing in any of the Oppenheimer funds, investors should carefully consider a fund’s investment objectives, risks, charges and expenses. Fund prospectuses and summary prospectuses contain this and other information about the funds, and may be obtained by asking your financial advisor, visiting oppenheimerfunds.com, or calling 1.800.CALL OPP (225.5677). Read prospectuses and summary prospectuses carefully before investing.
Shares of Oppenheimer funds are not deposits or obligations of any bank, are not guaranteed by any bank, are not insured by the FDIC or any other agency, and involve investment risks, including the possible loss of the principal amount invested.
10 OPPENHEIMER GLOBAL ALLOCATION FUND
Fund Expenses
Fund Expenses. As a shareholder of the Fund, you incur two types of costs: (1) transaction costs, which may include sales charges (loads) on purchase payments, contingent deferred sales charges on redemptions; and (2) ongoing costs, including management fees; distribution and service fees; and other Fund expenses. These examples are intended to help you understand your ongoing costs (in dollars) of investing in the Fund and to compare these costs with the ongoing costs of investing in other mutual funds.
The examples are based on an investment of $1,000.00 invested at the beginning of the period and held for the entire 6-month period ended October 31, 2014.
Actual Expenses. The first section of the table provides information about actual account values and actual expenses. You may use the information in this section for the class of shares you hold, together with the amount you invested, to estimate the expense that you paid over the period. Simply divide your account value by $1,000.00 (for example, an $8,600.00 account value divided by $1,000.00 = 8.60), then multiply the result by the number in the first section under the heading entitled “Expenses Paid During 6 Months Ended October 31, 2014” to estimate the expenses you paid on your account during this period.
Hypothetical Example for Comparison Purposes. The second section of the table provides information about hypothetical account values and hypothetical expenses based on the Fund’s actual expense ratio for each class of shares, and an assumed rate of return of 5% per year for each class before expenses, which is not the Fund’s actual return. The hypothetical account values and expenses may not be used to estimate the actual ending account balance or expenses you paid for the period. You may use this information to compare the ongoing costs of investing in the Fund and other funds. To do so, compare this 5% hypothetical example for the class of shares you hold with the 5% hypothetical examples that appear in the shareholder reports of the other funds.
Please note that the expenses shown in the table are meant to highlight your ongoing costs only and do not reflect any transactional costs, such as front-end or contingent deferred sales charges (loads). Therefore, the “hypothetical” section of the table is useful in comparing ongoing costs only, and will not help you determine the relative total costs of owning different funds. In addition, if these transactional costs were included, your costs would have been higher.
11 OPPENHEIMER GLOBAL ALLOCATION FUND
| | | | | | | | | | | | | | | | | | |
| Actual | | Beginning
Account
Value
May 1, 2014 | | | | | Ending
Account
Value
October 31, 2014 | | Expenses
Paid During
6 Months Ended
October 31, 2014 |
Class A | | $ | 1,000.00 | | | | | $ | 1,009.20 | | | | | $ | 6.66 | | | |
Class B | | | 1,000.00 | | | | | | 1,005.40 | | | | | | 10.57 | | | |
Class C | | | 1,000.00 | | | | | | 1,005.50 | | | | | | 10.52 | | | |
Class I | | | 1,000.00 | | | | | | 1,012.10 | | | | | | 4.47 | | | |
Class R | | | 1,000.00 | | | | | | 1,008.40 | | | | | | 7.93 | | | |
Class Y | | | 1,000.00 | | | | | | 1,011.20 | | | | | | 5.34 | | | |
| | | | | | |
| Hypothetical | | | | | | | | | | | | | | | | | | |
(5% return before expenses) | | | | | | | | | | | | | | | | | | |
Class A | | | 1,000.00 | | | | | | 1,018.60 | | | | | | 6.69 | | | |
Class B | | | 1,000.00 | | | | | | 1,014.72 | | | | | | 10.62 | | | |
Class C | | | 1,000.00 | | | | | | 1,014.77 | | | | | | 10.57 | | | |
Class I | | | 1,000.00 | | | | | | 1,020.77 | | | | | | 4.49 | | | |
Class R | | | 1,000.00 | | | | | | 1,017.34 | | | | | | 7.96 | | | |
Class Y | | | 1,000.00 | | | | | | 1,019.91 | | | | | | 5.36 | | | |
Expenses are equal to the Fund’s annualized expense ratio for that class, multiplied by the average account value over the period, multiplied by 184/365 (to reflect the one-half year period). Those annualized expense ratios, excluding indirect expenses from affiliated funds, based on the 6-month period ended October 31, 2014 are as follows:
| | | | | | |
| Class | | Expense Ratios | | | |
Class A | | | 1.31 | % | | |
Class B | | | 2.08 | | | |
Class C | | | 2.07 | | | |
Class I | | | 0.88 | | | |
Class R | | | 1.56 | | | |
Class Y | | | 1.05 | | | |
The expense ratios reflect voluntary and/or contractual waivers and/or reimbursements of expenses by the Fund’s Manager and Transfer Agent. Some of these undertakings may be modified or terminated at any time, as indicated in the Fund’s prospectus. The “Financial Highlights” tables in the Fund’s financial statements, included in this report, also show the gross expense ratios, without such waivers or reimbursements and reduction to custodian expenses, if applicable.
12 OPPENHEIMER GLOBAL ALLOCATION FUND
| | |
| |
| CONSOLIDATED STATEMENT OF INVESTMENTS October 31, 2014 | | |
| | | | | | | | | | |
| | | | | Shares | | | Value | |
| |
Common Stocks—69.6% | | | | | | | | | | |
| |
Consumer Discretionary—10.5% | | | | | | | | | | |
| |
Auto Components—0.5% | | | | | | | | | | |
| |
Continental AG | | | | | 9,372 | | | $ | 1,839,912 | |
| |
Delphi Automotive plc | | | | | 11,260 | | | | 776,715 | |
| |
Gentherm, Inc.1 | | | | | 30,280 | | | | 1,262,676 | |
| |
Johnson Controls, Inc. | | | | | 46,260 | | | | 2,185,785 | |
| |
Magna International, Inc. | | | | | 6,780 | | | | 669,254 | |
| |
Valeo SA | | | | | 8,948 | | | | 1,005,725 | |
| | | | | | | | | | |
| | | | | | | | | 7,740,067 | |
|
| |
Automobiles—0.3% | | | | | | | | | | |
| |
Astra International Tbk PT | | | | | 3,276,500 | | | | 1,859,693 | |
| |
Bayerische Motoren Werke (BMW) AG | | | | | 14,635 | | | | 1,565,807 | |
| |
Ford Motor Co. | | | | | 55,100 | | | | 776,359 | |
| | | | | | | | | | |
| | | | | | | | | 4,201,859 | |
|
| |
Diversified Consumer Services—0.5% | | | | | | | | | | |
| |
Apollo Education Group, Inc.1 | | | | | 34,050 | | | | 975,873 | |
| |
Benesse Holdings, Inc.2 | | | | | 300 | | | | 9,514 | |
| |
Bright Horizons Family Solutions, Inc.1 | | | | | 36,162 | | | | 1,611,379 | |
| |
Dignity plc | | | | | 38,598 | | | | 970,318 | |
| |
Estacio Participacoes SA | | | | | 98,400 | | | | 1,139,707 | |
| |
Grand Canyon Education, Inc.1 | | | | | 18,870 | | | | 903,873 | |
| |
Kroton Educacional SA | | | | | 184,740 | | | | 1,316,643 | |
| |
LifeLock, Inc.1 | | | | | 61,230 | | | | 1,035,399 | |
| |
New Oriental Education & Technology Group, Inc., Sponsored ADR1 | | | | | 55,910 | | | | 1,207,656 | |
| | | | | | | | | | |
| | | | | | | | | 9,170,362 | |
|
| |
Hotels, Restaurants & Leisure—1.5% | | | | | | | | | | |
| |
Buffalo Wild Wings, Inc.1 | | | | | 11,550 | | | | 1,724,184 | |
| |
Carnival Corp. | | | | | 42,490 | | | | 1,705,973 | |
| |
Chipotle Mexican Grill, Inc., Cl. A1 | | | | | 1,560 | | | | 995,280 | |
| |
Domino’s Pizza Group plc | | | | | 128,220 | | | | 1,304,411 | |
| |
Fiesta Restaurant Group, Inc.1 | | | | | 26,720 | | | | 1,473,608 | |
| |
Genting Bhd | | | | | 520,000 | | | | 1,546,979 | |
| |
GTECH SpA | | | | | 84,107 | | | | 1,958,992 | |
| |
Home Inns & Hotels Management, Inc., ADR1 | | | | | 19,680 | | | | 594,533 | |
| |
Jack in the Box, Inc. | | | | | 14,520 | | | | 1,031,501 | |
| |
Jollibee Foods Corp. | | | | | 243,130 | | | | 1,070,807 | |
| |
La Quinta Holdings, Inc.1 | | | | | 61,330 | | | | 1,251,745 | |
| |
McDonald’s Corp. | | | | | 35,590 | | | | 3,335,851 | |
| |
MGM Resorts International1 | | | | | 48,720 | | | | 1,132,740 | |
| |
Revel Entertainment, Inc.1 | | | | | 5,092 | | | | — | |
| |
Royal Caribbean Cruises Ltd. | | | | | 28,900 | | | | 1,964,333 | |
| |
William Hill plc | | | | | 320,954 | | | | 1,852,792 | |
| |
Wynn Resorts Ltd. | | | | | 3,870 | | | | 735,339 | |
| |
Zoe’s Kitchen, Inc.1 | | | | | 20,110 | | | | 733,211 | |
| | | | | | | | | | |
| | | | | | | | | 24,412,279 | |
|
| |
Household Durables—0.3% | | | | | | | | | | |
| |
Cyrela Brazil Realty SA Empreendimentos e Participacoes | | | | | 100,200 | | | | 498,189 | |
13 OPPENHEIMER GLOBAL ALLOCATION FUND
| | |
| |
| CONSOLIDATED STATEMENT OF INVESTMENTS Continued | | |
| | | | | | | | | | |
| | | | | Shares | | | Value | |
| |
Household Durables (Continued) | | | | | | | | | | |
| |
Harman International Industries, Inc. | | | | | 16,190 | | | $ | 1,737,835 | |
| |
Newell Rubbermaid, Inc. | | | | | 27,360 | | | | 911,909 | |
| |
SEB SA | | | | | 13,820 | | | | 1,130,984 | |
| | | | | | | | | | |
| | | | | | | | | 4,278,917 | |
|
| |
Internet & Catalog Retail—0.3% | | | | | | | | | | |
| |
Amazon.com, Inc.1 | | | | | 796 | | | | 243,146 | |
| |
B2W Cia Digital1 | | | | | 35,921 | | | | 467,949 | |
| |
Ctrip.com International Ltd., ADR1 | | | | | 15,780 | | | | 919,974 | |
| |
JD.com, Inc., ADR1 | | | | | 51,377 | | | | 1,227,397 | |
| |
Priceline Group, Inc. (The)1 | | | | | 230 | | | | 277,428 | |
| |
Qunar Cayman Islands Ltd., ADR1 | | | | | 13,200 | | | | 355,080 | |
| |
TripAdvisor, Inc.1 | | | | | 14,500 | | | | 1,285,570 | |
| |
Yoox SpA1 | | | | | 38,559 | | | | 712,425 | |
| | | | | | | | | | |
| | | | | | | | | 5,488,969 | |
|
| |
Media—2.5% | | | | | | | | | | |
| |
British Sky Broadcasting Group plc | | | | | 111,902 | | | | 1,586,910 | |
| |
Cinemark Holdings, Inc. | | | | | 25,850 | | | | 913,022 | |
| |
Comcast Corp., Cl. A | | | | | 25,920 | | | | 1,434,672 | |
| |
DISH Network Corp., Cl. A1 | | | | | 14,640 | | | | 931,836 | |
| |
Grupo Televisa SAB, Sponsored ADR | | | | | 83,680 | | | | 3,024,195 | |
| |
Naspers Ltd., Cl. N | | | | | 7,289 | | | | 906,017 | |
| |
ProSiebenSat.1 Media AG | | | | | 16,692 | | | | 673,352 | |
| |
Rentrak Corp.1 | | | | | 1,000 | | | | 76,870 | |
| |
SES SA | | | | | 42,030 | | | | 1,451,507 | |
| |
Time Warner, Inc. | | | | | 62,166 | | | | 4,940,332 | |
| |
Twenty-First Century Fox, Inc., Cl. A3 | | | | | 83,180 | | | | 2,868,046 | |
| |
Twenty-First Century Fox, Inc., Cl. B | | | | | 74,620 | | | | 2,475,145 | |
| |
Walt Disney Co. (The) | | | | | 171,896 | | | | 15,707,857 | |
| |
Zee Entertainment Enterprises Ltd. | | | | | 920,609 | | | | 5,192,965 | |
| | | | | | | | | | |
| | | | | | | | | 42,182,726 | |
|
| |
Multiline Retail—0.5% | | | | | | | | | | |
| |
Burlington Stores, Inc.1 | | | | | 35,610 | | | | 1,493,483 | |
| |
Dollarama, Inc. | | | | | 21,400 | | | | 1,880,154 | |
| |
Hudson’s Bay Co. | | | | | 49,200 | | | | 853,868 | |
| |
Kohl’s Corp. | | | | | 10,840 | | | | 587,745 | |
| |
Macy’s, Inc. | | | | | 69,380 | | | | 4,011,552 | |
| |
Shinsegae Co. Ltd. | | | | | 345 | | | | 64,117 | |
| | | | | | | | | | |
| | | | | | | | | 8,890,919 | |
|
| |
Specialty Retail—1.5% | | | | | | | | | | |
| |
Boot Barn Holdings, Inc.1 | | | | | 7,430 | | | | 131,882 | |
| |
Gap, Inc. (The) | | | | | 26,050 | | | | 987,034 | |
| |
Inditex SA | | | | | 283,959 | | | | 7,996,254 | |
| |
Lithia Motors, Inc., Cl. A | | | | | 12,150 | | | | 943,083 | |
| |
Ross Stores, Inc. | | | | | 5,540 | | | | 447,189 | |
| |
Staples, Inc. | | | | | 59,780 | | | | 758,010 | |
| |
Tiffany & Co. | | | | | 109,923 | | | | 10,565,799 | |
14 OPPENHEIMER GLOBAL ALLOCATION FUND
| | | | | | | | | | |
| | | | | Shares | | | Value | |
| |
Specialty Retail (Continued) | | | | | | | | | | |
| |
TJX Cos., Inc. (The) | | | | | 52,636 | | | $ | 3,332,912 | |
| | | | | | | | | | |
| | | | | | | | | 25,162,163 | |
|
| |
Textiles, Apparel & Luxury Goods—2.6% | | | | | | | | | | |
| |
Brunello Cucinelli SpA | | | | | 11,590 | | | | 234,539 | |
| |
Burberry Group plc | | | | | 75,559 | | | | 1,853,076 | |
| |
Carter’s, Inc. | | | | | 8,180 | | | | 639,103 | |
| |
Cie Financiere Richemont SA | | | | | 34,392 | | | | 2,897,758 | |
| |
Deckers Outdoor Corp.1 | | | | | 16,170 | | | | 1,414,228 | |
| |
G-III Apparel Group Ltd.1 | | | | | 18,860 | | | | 1,496,541 | |
| |
Kering | | | | | 39,520 | | | | 7,642,464 | |
| |
Luxottica Group SpA | | | | | 11,535 | | | | 586,996 | |
| |
LVMH Moet Hennessy Louis Vuitton SA | | | | | 59,820 | | | | 10,171,139 | |
| |
NIKE, Inc., Cl. B | | | | | 36,222 | | | | 3,367,559 | |
| |
Prada SpA | | | | | 550,700 | | | | 3,424,587 | |
| |
Ralph Lauren Corp., Cl. A | | | | | 2,200 | | | | 362,648 | |
| |
Skechers U.S.A., Inc., Cl. A1 | | | | | 34,462 | | | | 1,886,794 | |
| |
Swatch Group AG (The) | | | | | 2,880 | | | | 1,365,374 | |
| |
Tod’s SpA | | | | | 23,350 | | | | 2,148,240 | |
| |
VF Corp. | | | | | 69,070 | | | | 4,674,658 | |
| | | | | | | | | | |
| | | | | | | | | 44,165,704 | |
|
| |
Consumer Staples—6.0% | | | | | | | | | | |
| |
Beverages—1.8% | | | | | | | | | | |
| |
AMBEV SA, ADR | | | | | 513,520 | | | | 3,430,314 | |
| |
Anadolu Efes Biracilik Ve Malt Sanayii AS1 | | | | | 73,650 | | | | 860,578 | |
| |
Anheuser-Busch InBev NV, Sponsored ADR | | | | | 16,690 | | | | 1,852,256 | |
| |
Boston Beer Co., Inc. (The), Cl. A1 | | | | | 2,970 | | | | 739,530 | |
| |
Brown-Forman Corp., Cl. B | | | | | 23,030 | | | | 2,134,190 | |
| |
Carlsberg AS, Cl. B | | | | | 14,469 | | | | 1,274,213 | |
| |
Diageo plc | | | | | 31,441 | | | | 925,387 | |
| |
Fomento Economico Mexicano SAB de CV, ADR | | | | | 39,216 | | | | 3,774,148 | |
| |
Fomento Economico Mexicano SAB de CV, UBD | | | | | 133,869 | | | | 1,289,656 | |
| |
Heineken NV | | | | | 23,979 | | | | 1,791,545 | |
| |
Nigerian Breweries plc | | | | | 611,085 | | | | 597,620 | |
| |
PepsiCo, Inc. | | | | | 53,790 | | | | 5,172,984 | |
| |
Pernod Ricard SA | | | | | 22,500 | | | | 2,566,246 | |
| |
SABMiller plc | | | | | 48,920 | | | | 2,763,017 | |
| |
Tsingtao Brewery Co. Ltd., Cl. H | | | | | 72,000 | | | | 530,742 | |
| | | | | | | | | | |
| | | | | | | | | 29,702,426 | |
|
| |
Food & Staples Retailing—1.5% | | | | | | | | | | |
| |
Almacenes Exito SA | | | | | 43,892 | | | | 619,074 | |
| |
Almacenes Exito SA, GDR4 | | | | | 57,600 | | | | 813,375 | |
| |
BIM Birlesik Magazalar AS | | | | | 31,202 | | | | 712,238 | |
| |
Cencosud SA | | | | | 420,359 | | | | 1,246,484 | |
| |
Costco Wholesale Corp. | | | | | 54,455 | | | | 7,262,663 | |
| |
CP ALL PCL | | | | | 2,181,900 | | | | 3,047,700 | |
| |
CVS Health Corp. | | | | | 59,770 | | | | 5,128,864 | |
| |
Magnit PJSC1 | | | | | 12,873 | | | | 3,564,396 | |
| |
Walgreen Co. | | | | | 18,930 | | | | 1,215,685 | |
15 OPPENHEIMER GLOBAL ALLOCATION FUND
| | |
| |
| CONSOLIDATED STATEMENT OF INVESTMENTS Continued | | |
| | | | | | | | | | |
| | | | | Shares | | | Value | |
| |
Food & Staples Retailing (Continued) | | | | | | | | | | |
| |
Wal-Mart Stores, Inc. | | | | | 19,710 | | | $ | 1,503,282 | |
| | | | | | | | | | |
| | | | | | | | | 25,113,761 | |
|
| |
Food Products—1.7% | | | | | | | | | | |
| |
Aryzta AG1 | | | | | 23,411 | | | | 1,991,571 | |
| |
Barry Callebaut AG1 | | | | | 1,114 | | | | 1,166,717 | |
| |
ConAgra Foods, Inc. | | | | | 19,850 | | | | 681,847 | |
| |
Danone SA | | | | | 18,130 | | | | 1,232,340 | |
| |
Hain Celestial Group, Inc. (The)1 | | | | | 12,650 | | | | 1,369,362 | |
| |
Hershey Co. (The) | | | | | 23,180 | | | | 2,223,194 | |
| |
J&J Snack Foods Corp. | | | | | 9,084 | | | | 935,925 | |
| |
Kraft Foods Group, Inc. | | | | | 27,260 | | | | 1,536,101 | |
| |
Nestle SA | | | | | 52,073 | | | | 3,812,302 | |
| |
Saputo, Inc. | | | | | 41,730 | | | | 1,184,087 | |
| |
SunOpta, Inc.1 | | | | | 51,116 | | | | 723,803 | |
| |
Tingyi Cayman Islands Holding Corp. | | | | | 700,000 | | | | 1,747,462 | |
| |
Ulker Biskuvi Sanayi AS | | | | | 29,156 | | | | 215,193 | |
| |
Unilever plc | | | | | 207,104 | | | | 8,334,195 | |
| |
Want Want China Holdings Ltd. | | | | | 613,000 | | | | 842,295 | |
| | | | | | | | | | |
| | | | | | | | | 27,996,394 | |
|
| |
Household Products—0.7% | | | | | | | | | | |
| |
Colgate-Palmolive Co. | | | | | 121,810 | | | | 8,146,653 | |
| |
Hindustan Unilever Ltd. | | | | | 26,093 | | | | 313,037 | |
| |
Reckitt Benckiser Group plc | | | | | 19,622 | | | | 1,649,425 | |
| |
Reckitt Benckiser Group plc, Sponsored ADR | | | | | 105,190 | | | | 1,767,192 | |
| |
Unilever Indonesia Tbk PT | | | | | 121,000 | | | | 304,570 | |
| | | | | | | | | | |
| | | | | | | | | 12,180,877 | |
|
| |
Personal Products—0.1% | | | | | | | | | | |
| |
Colgate-Palmolive India Ltd. | | | | | 15,514 | | | | 429,839 | |
| |
Marico Ltd. | | | | | 73,112 | | | | 370,884 | |
| |
Natura Cosmeticos SA | | | | | 47,100 | | | | 684,289 | |
| | | | | | | | | | |
| | | | | | | | | 1,485,012 | |
|
| |
Tobacco—0.2% | | | | | | | | | | |
| |
Lorillard, Inc. | | | | | 45,140 | | | | 2,776,110 | |
| |
Swedish Match AB | | | | | 27,545 | | | | 895,616 | |
| | | | | | | | | | |
| | | | | | | | | 3,671,726 | |
|
| |
Energy—3.4% | | | | | | | | | | |
| |
Energy Equipment & Services—1.0% | | | | | | | | | | |
| |
Cameron International Corp.1 | | | | | 13,426 | | | | 799,518 | |
| |
China Oilfield Services Ltd., Cl. H | | | | | 246,000 | | | | 513,570 | |
| |
Eurasia Drilling Co. Ltd., GDR | | | | | 12,810 | | | | 320,567 | |
| |
Forum Energy Technologies, Inc.1 | | | | | 27,816 | | | | 759,377 | |
| |
Halliburton Co. | | | | | 30,640 | | | | 1,689,490 | |
| |
National Oilwell Varco, Inc. | | | | | 22,280 | | | | 1,618,419 | |
| |
Saipem SpA1 | | | | | 32,363 | | | | 507,699 | |
| |
Schlumberger Ltd. | | | | | 37,718 | | | | 3,721,258 | |
| |
Schoeller-Bleckmann Oilfield Equipment AG | | | | | 6,581 | | | | 568,161 | |
16 OPPENHEIMER GLOBAL ALLOCATION FUND
| | | | | | | | | | |
| | | | | Shares | | | Value | |
| |
Energy Equipment & Services (Continued) | | | | | | | | | | |
| |
Technip SA | | | | | 75,290 | | | $ | 5,460,975 | |
| |
Tenaris SA, ADR | | | | | 32,870 | | | | 1,302,967 | |
| |
Transocean Ltd. | | | | | 17,440 | | | | 520,235 | |
| | | | | | | | | | |
| | | | | | | | | 17,782,236 | |
|
| |
Oil, Gas & Consumable Fuels—2.4% | | | | | | | | | | |
| |
Anadarko Petroleum Corp. | | | | | 7,790 | | | | 714,966 | |
| |
Antero Resources Corp.1 | | | | | 4,800 | | | | 251,712 | |
| |
Athlon Energy, Inc.1 | | | | | 39,430 | | | | 2,298,769 | |
| |
BP plc, Sponsored ADR | | | | | 37,560 | | | | 1,632,358 | |
| |
Canadian Natural Resources Ltd. | | | | | 20,900 | | | | 728,992 | |
| |
Chevron Corp. | | | | | 14,302 | | | | 1,715,525 | |
| |
Cimarex Energy Co. | | | | | 1,960 | | | | 222,793 | |
| |
CNOOC Ltd. | | | | | 701,000 | | | | 1,095,567 | |
| |
ConocoPhillips3 | | | | | 14,930 | | | | 1,077,200 | |
| |
Diamondback Energy, Inc.1 | | | | | 16,500 | | | | 1,129,260 | |
| |
Enbridge, Inc. | | | | | 44,950 | | | | 2,128,832 | |
| |
EOG Resources, Inc. | | | | | 19,650 | | | | 1,867,733 | |
| |
Genel Energy plc1 | | | | | 39,350 | | | | 443,320 | |
| |
Kinder Morgan, Inc. | | | | | 18,300 | | | | 708,210 | |
| |
Koninklijke Vopak NV | | | | | 30,602 | | | | 1,534,141 | |
| |
Marathon Petroleum Corp. | | | | | 12,280 | | | | 1,116,252 | |
| |
Matador Resources Co.1 | | | | | 27,410 | | | | 665,241 | |
| |
NOVATEK OAO, Sponsored GDR | | | | | 28,000 | | | | 3,009,576 | |
| |
Occidental Petroleum Corp. | | | | | 41,110 | | | | 3,655,912 | |
| |
Petroleo Brasileiro SA, Cl. A, Sponsored ADR | | | | | 197,400 | | | | 2,414,202 | |
| |
Phillips 66 | | | | | 15,630 | | | | 1,226,955 | |
| |
Pioneer Natural Resources Co. | | | | | 1,990 | | | | 376,229 | |
| |
Repsol SA | | | | | 130,058 | | | | 2,908,980 | |
| |
Suncor Energy, Inc. | | | | | 139,530 | | | | 4,958,896 | |
| |
Tullow Oil plc | | | | | 157,819 | | | | 1,228,404 | |
| |
Williams Cos., Inc. (The) | | | | | 18,870 | | | | 1,047,474 | |
| | | | | | | | | | |
| | | | | | | | | 40,157,499 | |
|
| |
Financials—11.4% | | | | | | | | | | |
| |
Capital Markets—2.4% | | | | | | | | | | |
| |
Ameriprise Financial, Inc. | | | | | 16,800 | | | | 2,119,656 | |
| |
Charles Schwab Corp. (The) | | | | | 82,060 | | | | 2,352,660 | |
| |
Credit Suisse Group AG1 | | | | | 186,475 | | | | 4,967,103 | |
| |
Deutsche Bank AG | | | | | 97,553 | | | | 3,043,740 | |
| |
Evercore Partners, Inc., Cl. A | | | | | 14,300 | | | | 740,311 | |
| |
Goldman Sachs Group, Inc. (The) | | | | | 50,430 | | | | 9,581,196 | |
| |
HFF, Inc., Cl. A | | | | | 20,345 | | | | 640,461 | |
| |
ICAP plc | | | | | 253,323 | | | | 1,699,017 | |
| |
Invesco Ltd. | | | | | 88,360 | | | | 3,575,929 | |
| |
Morgan Stanley | | | | | 105,720 | | | | 3,694,914 | |
| |
Tullett Prebon plc | | | | | 83,870 | | | | 380,992 | |
| |
UBS AG1 | | | | | 463,800 | | | | 8,060,873 | |
| | | | | | | | | | |
| | | | | | | | | 40,856,852 | |
17 OPPENHEIMER GLOBAL ALLOCATION FUND
| | |
| |
| CONSOLIDATED STATEMENT OF INVESTMENTS Continued | | |
| | | | | | | | | | |
| | | | | Shares | | | Value | |
| |
Commercial Banks—3.8% | | | | | | | | | | |
| |
Banco Bilbao Vizcaya Argentaria SA | | | | | 486,571 | | | $ | 5,440,453 | |
| |
Banco Bradesco SA, ADR | | | | | 46,060 | | | | 689,979 | |
| |
Bancolombia SA, Sponsored ADR | | | | | 12,490 | | | | 706,559 | |
| |
Bank of America Corp. | | | | | 169,320 | | | | 2,905,531 | |
| |
Bank of the Ozarks, Inc. | | | | | 44,620 | | | | 1,572,409 | |
| |
Citigroup, Inc. | | | | | 255,420 | | | | 13,672,633 | |
| |
Commercial International Bank Egypt SAE | | | | | 123,279 | | | | 843,119 | |
| |
Grupo Aval Acciones y Valores, ADR | | | | | 45,890 | | | | 618,597 | |
| |
Grupo Financiero Banorte SAB de CV, Cl. O | | | | | 235,610 | | | | 1,509,934 | |
| |
Grupo Financiero Inbursa SAB de CV, Cl. O | | | | | 313,127 | | | | 944,758 | |
| |
Guaranty Trust Bank plc | | | | | 2,866,834 | | | | 432,664 | |
| |
HSBC Holdings plc | | | | | 97,238 | | | | 991,018 | |
| |
ICICI Bank Ltd., Sponsored ADR | | | | | 183,440 | | | | 10,338,678 | |
| |
JPMorgan Chase & Co. | | | | | 53,422 | | | | 3,230,963 | |
| |
KeyCorp | | | | | 119,810 | | | | 1,581,492 | |
| |
PNC Financial Services Group, Inc. (The) | | | | | 22,220 | | | | 1,919,586 | |
| |
PrivateBancorp, Inc. | | | | | 28,010 | | | | 905,283 | |
| |
Sberbank of Russia, ADR | | | | | 39,300 | | | | 298,928 | |
| |
Signature Bank1 | | | | | 10,920 | | | | 1,322,740 | |
| |
Societe Generale SA | | | | | 60,460 | | | | 2,925,167 | |
| |
Sumitomo Mitsui Financial Group, Inc. | | | | | 90,600 | | | | 3,682,919 | |
| |
Turkiye Garanti Bankasi AS | | | | | 227,679 | | | | 888,867 | |
| |
U.S. Bancorp | | | | | 48,100 | | | | 2,049,060 | |
| |
Wells Fargo & Co. | | | | | 41,694 | | | | 2,213,534 | |
| |
Western Alliance Bancorp1 | | | | | 47,990 | | | | 1,277,494 | |
| |
Zenith Bank plc | | | | | 3,527,678 | | | | 453,604 | |
| |
Zions Bancorporation | | | | | 45,651 | | | | 1,322,510 | |
| | | | | | | | | | |
| | | | | | | | | 64,738,479 | |
|
| |
Consumer Finance—0.5% | | | | | | | | | | |
| |
American Express Co. | | | | | 12,476 | | | | 1,122,216 | |
| |
Capital One Financial Corp. | | | | | 36,920 | | | | 3,055,869 | |
| |
Discover Financial Services | | | | | 49,230 | | | | 3,139,889 | |
| |
Navient Corp. | | | | | 46,190 | | | | 913,638 | |
| |
Shriram Transport Finance Co. Ltd. | | | | | 8,039 | | | | 124,727 | |
| | | | | | | | | | |
| | | | | | | | | 8,356,339 | |
|
| |
Diversified Financial Services—1.2% | | | | | | | | | | |
| |
BM&FBovespa SA | | | | | 869,400 | | | | 3,824,392 | |
| |
CME Group, Inc. | | | | | 9,230 | | | | 773,566 | |
| |
FNFV Group1 | | | | | 11,750 | | | | 157,920 | |
| |
Grupo de Inversiones Suramericana SA | | | | | 36,260 | | | | 753,926 | |
| |
Haci Omer Sabanci Holding AS | | | | | 247,888 | | | | 1,131,779 | |
| |
Hong Kong Exchanges & Clearing Ltd. | | | | | 62,613 | | | | 1,388,803 | |
| |
McGraw Hill Financial, Inc. | | | | | 116,130 | | | | 10,507,442 | |
| |
Moscow Exchange (The) | | | | | 913,404 | | | | 1,231,941 | |
| | | | | | | | | | |
| | | | | | | | | 19,769,769 | |
|
| |
Insurance—2.4% | | | | | | | | | | |
| |
Aflac, Inc. | | | | | 18,470 | | | | 1,103,213 | |
| |
AIA Group Ltd. | | | | | 379,200 | | | | 2,115,740 | |
| |
Allianz SE | | | | | 42,566 | | | | 6,761,609 | |
18 OPPENHEIMER GLOBAL ALLOCATION FUND
| | | | | | | | | | |
| | | | | Shares | | | Value | |
| |
Insurance (Continued) | | | | | | | | | | |
| |
Allstate Corp. (The) | | | | | 35,170 | | | $ | 2,280,774 | |
| |
American International Group, Inc. | | | | | 72,010 | | | | 3,857,576 | |
| |
Aon plc | | | | | 34,920 | | | | 3,003,120 | |
| |
China Life Insurance Co. Ltd., Cl. H | | | | | 103,000 | | | | 307,464 | |
| |
China Pacific Insurance Group Co. Ltd., Cl. H | | | | | 96,600 | | | | 362,861 | |
| |
Dai-ichi Life Insurance Co. Ltd. (The) | | | | | 305,400 | | | | 4,647,304 | |
| |
FNF Group | | | | | 87,700 | | | | 2,616,968 | |
| |
MetLife, Inc. | | | | | 41,300 | | | | 2,240,112 | |
| |
Old Mutual plc | | | | | 349,609 | | | | 1,085,382 | |
| |
Prudential plc | | | | | 403,962 | | | | 9,335,062 | |
| |
Sul America SA | | | | | 100,060 | | | | 531,413 | |
| |
Sun Life Financial, Inc. | | | | | 18,350 | | | | 653,260 | |
| | | | | | | | | | |
| | | | | | | | | 40,901,858 | |
|
| |
Real Estate Investment Trusts (REITs)—0.4% | | | | | | | | | | |
| |
American Tower Corp., Cl. A | | | | | 18,490 | | | | 1,802,775 | |
| |
Equity Residential | | | | | 21,180 | | | | 1,473,281 | |
| |
Pebblebrook Hotel Trust | | | | | 22,917 | | | | 976,264 | |
| |
Public Storage | | | | | 8,950 | | | | 1,649,843 | |
| | | | | | | | | | |
| | | | | | | | | 5,902,163 | |
|
| |
Real Estate Management & Development—0.5% | | | | | | | | | | |
| |
DLF Ltd. | | | | | 1,762,025 | | | | 3,559,305 | |
| |
Hang Lung Group Ltd. | | | | | 129,500 | | | | 644,930 | |
| |
Hang Lung Properties Ltd. | | | | | 671,570 | | | | 2,096,152 | |
| |
SM Prime Holdings, Inc. | | | | | 2,819,103 | | | | 1,101,991 | |
| |
SOHO China Ltd. | | | | | 891,000 | | | | 652,813 | |
| |
Wallace Theater Holdings, Inc.1,5 | | | | | 430 | | | | 4 | |
| | | | | | | | | | |
| | | | | | | | | 8,055,195 | |
|
| |
Thrifts & Mortgage Finance—0.2% | | | | | | | | | | |
| |
Essent Group Ltd.1 | | | | | 18,800 | | | | 457,592 | |
| |
Housing Development Finance Corp. Ltd. | | | | | 181,201 | | | | 3,254,733 | |
| | | | | | | | | | |
| | | | | | | | | 3,712,325 | |
|
| |
Health Care—11.2% | | | | | | | | | | |
| |
Biotechnology—2.9% | | | | | | | | | | |
| |
Amgen, Inc. | | | | | 22,920 | | | | 3,717,166 | |
| |
Biogen Idec, Inc.1 | | | | | 24,320 | | | | 7,808,666 | |
| |
BioMarin Pharmaceutical, Inc.1 | | | | | 29,760 | | | | 2,455,200 | |
| |
Bluebird Bio, Inc.1 | | | | | 8,490 | | | | 356,495 | |
| |
Celgene Corp.1 | | | | | 27,756 | | | | 2,972,390 | |
| |
Celldex Therapeutics, Inc.1 | | | | | 175,330 | | | | 2,936,778 | |
| |
Cepheid1 | | | | | 15,120 | | | | 801,511 | |
| |
Circassia Pharmaceuticals plc1 | | | | | 349,220 | | | | 1,638,746 | |
| |
Clovis Oncology, Inc.1 | | | | | 36,540 | | | | 2,179,976 | |
| |
CSL Ltd. | | | | | 24,600 | | | | 1,741,651 | |
| |
Exact Sciences Corp.1 | | | | | 25,070 | | | | 603,435 | |
| |
Gilead Sciences, Inc.1 | | | | | 97,090 | | | | 10,874,080 | |
| |
Grifols SA | | | | | 30,968 | | | | 1,261,673 | |
| |
Medivation, Inc.1 | | | | | 20,320 | | | | 2,147,824 | |
19 OPPENHEIMER GLOBAL ALLOCATION FUND
| | |
| |
| CONSOLIDATED STATEMENT OF INVESTMENTS Continued | | |
| | | | | | | | | | |
| | | | | Shares | | | Value | |
| |
Biotechnology (Continued) | | | | | | | | | | |
| |
PTC Therapeutics, Inc.1 | | | | | 17,300 | | | $ | 707,051 | |
| |
Ultragenyx Pharmaceutical, Inc.1 | | | | | 14,730 | | | | 692,457 | |
| |
Vertex Pharmaceuticals, Inc.1 | | | | | 46,385 | | | | 5,224,806 | |
| | | | | | | | | | |
| | | | | | | | | 48,119,905 | |
|
| |
Health Care Equipment & Supplies—1.6% | | | | | | | | | | |
| |
Baxter International, Inc. | | | | | 21,070 | | | | 1,477,850 | |
| |
Becton Dickinson & Co. | | | | | 11,390 | | | | 1,465,893 | |
| |
Cantel Medical Corp. | | | | | 20,850 | | | | 884,040 | |
| |
Cardiovascular Systems, Inc.1 | | | | | 23,320 | | | | 722,920 | |
| |
DexCom, Inc.1 | | | | | 32,521 | | | | 1,461,819 | |
| |
DiaSorin SpA | | | | | 25,604 | | | | 989,320 | |
| |
Essilor International SA | | | | | 9,680 | | | | 1,070,227 | |
| |
Insulet Corp.1 | | | | | 19,640 | | | | 847,859 | |
| |
Medtronic, Inc. | | | | | 34,630 | | | | 2,360,381 | |
| |
Mindray Medical International Ltd., ADR | | | | | 1,260 | | | | 36,716 | |
| |
Shandong Weigao Group Medical Polymer Co. Ltd., Cl. H | | | | | 426,000 | | | | 429,155 | |
| |
Sonova Holding AG | | | | | 10,525 | | | | 1,641,480 | |
| |
Spectranetics Corp. (The)1 | | | | | 67,060 | | | | 2,130,496 | |
| |
St. Jude Medical, Inc. | | | | | 41,440 | | | | 2,659,205 | |
| |
STERIS Corp. | | | | | 11,040 | | | | 682,272 | |
| |
Stryker Corp. | | | | | 13,570 | | | | 1,187,782 | |
| |
West Pharmaceutical Services, Inc. | | | | | 21,920 | | | | 1,123,400 | |
| |
William Demant Holding1 | | | | | 12,044 | | | | 913,313 | |
| |
Wright Medical Group, Inc.1 | | | | | 27,378 | | | | 865,692 | |
| |
Zimmer Holdings, Inc. | | | | | 40,920 | | | | 4,551,941 | |
| | | | | | | | | | |
| | | | | | | | | 27,501,761 | |
|
| |
Health Care Providers & Services—2.5% | | | | | | | | | | |
| |
Acadia Healthcare Co., Inc.1 | | | | | 48,050 | | | | 2,981,502 | |
| |
Aetna, Inc. | | | | | 81,220 | | | | 6,701,462 | |
| |
Apollo Hospitals Enterprise Ltd. | | | | | 43,579 | | | | 792,434 | |
| |
Cardinal Health, Inc. | | | | | 65,720 | | | | 5,157,706 | |
| |
Centene Corp.1 | | | | | 22,840 | | | | 2,116,583 | |
| |
Diagnosticos da America SA | | | | | 102,900 | | | | 438,941 | |
| |
ExamWorks Group, Inc.1 | | | | | 33,950 | | | | 1,316,581 | |
| |
HCA Holdings, Inc.1 | | | | | 13,290 | | | | 930,964 | |
| |
HealthEquity, Inc.1 | | | | | 17,000 | | | | 346,800 | |
| |
LifePoint Hospitals, Inc.1 | | | | | 35,258 | | | | 2,468,060 | |
| |
MWI Veterinary Supply, Inc.1 | | | | | 3,190 | | | | 541,199 | |
| |
Omnicare, Inc. | | | | | 11,610 | | | | 773,110 | |
| |
Sinopharm Group Co. Ltd., Cl. H | | | | | 245,800 | | | | 964,534 | |
| |
Sonic Healthcare Ltd. | | | | | 52,100 | | | | 859,400 | |
| |
Team Health Holdings, Inc.1 | | | | | 33,430 | | | | 2,090,712 | |
| |
UnitedHealth Group, Inc. | | | | | 54,660 | | | | 5,193,247 | |
| |
VCA, Inc.1 | | | | | 14,970 | | | | 682,183 | |
| |
WellPoint, Inc. | | | | | 55,210 | | | | 6,994,555 | |
| | | | | | | | | | |
| | | | | | | | | 41,349,973 | |
|
| |
Health Care Technology—0.1% | | | | | | | | | | |
| |
CompuGroup Medical AG | | | | | 7,495 | | | | 171,885 | |
| |
Omnicell, Inc.1 | | | | | 25,700 | | | | 830,367 | |
20 OPPENHEIMER GLOBAL ALLOCATION FUND
| | | | | | | | | | |
| | | | | Shares | | | Value | |
| |
Health Care Technology (Continued) | | | | | | | | | | |
| |
Veeva Systems, Inc., Cl. A1 | | | | | 29,540 | | | $ | 879,701 | |
| | | | | | | | | | |
| | | | | | | | | 1,881,953 | |
|
| |
Life Sciences Tools & Services—0.4% | | | | | | | | | | |
| |
Albany Molecular Research, Inc.1 | | | | | 35,090 | | | | 816,193 | |
| |
Divi’s Laboratories Ltd. | | | | | 3,525 | | | | 107,699 | |
| |
ICON plc1 | | | | | 33,670 | | | | 1,771,379 | |
| |
Illumina, Inc.1 | | | | | 3,280 | | | | 631,662 | |
| |
Thermo Fisher Scientific, Inc. | | | | | 26,540 | | | | 3,120,308 | |
| | | | | | | | | | |
| | | | | | | | | 6,447,241 | |
|
| |
Pharmaceuticals—3.7% | | | | | | | | | | |
| |
AbbVie, Inc. | | | | | 26,428 | | | | 1,677,121 | |
| |
Actavis plc1 | | | | | 9,990 | | | | 2,424,973 | |
| |
Akorn, Inc.1 | | | | | 50,430 | | | | 2,246,656 | |
| |
Allergan, Inc. | | | | | 42,130 | | | | 8,007,228 | |
| |
Bayer AG | | | | | 47,371 | | | | 6,737,800 | |
| |
BioDelivery Sciences International, Inc.1 | | | | | 20,060 | | | | 349,044 | |
| |
Bristol-Myers Squibb Co. | | | | | 53,367 | | | | 3,105,426 | |
| |
Cipla Ltd. | | | | | 71,703 | | | | 789,083 | |
| |
Dr. Reddy’s Laboratories Ltd. | | | | | 15,249 | | | | 789,779 | |
| |
Eli Lilly & Co. | | | | | 12,960 | | | | 859,637 | |
| |
Galenica AG | | | | | 1,225 | | | | 1,047,836 | |
| |
Glenmark Pharmaceuticals Ltd. | | | | | 16,584 | | | | 194,441 | |
| |
Johnson & Johnson | | | | | 14,217 | | | | 1,532,308 | |
| |
Lupin Ltd. | | | | | 7,361 | | | | 163,523 | |
| |
Merck & Co., Inc. | | | | | 70,910 | | | | 4,108,525 | |
| |
Novo Nordisk AS, Cl. B | | | | | 43,584 | | | | 1,969,788 | |
| |
Novo Nordisk AS, Sponsored ADR | | | | | 38,670 | | | | 1,747,111 | |
| |
Pacira Pharmaceuticals, Inc.1 | | | | | 11,320 | | | | 1,050,722 | |
| |
Perrigo Co. plc | | | | | 15,710 | | | | 2,536,380 | |
| |
Pfizer, Inc. | | | | | 49,094 | | | | 1,470,365 | |
| |
Roche Holding AG | | | | | 26,923 | | | | 7,951,881 | |
| |
Roche Holding AG, Sponsored ADR | | | | | 75,950 | | | | 2,795,719 | |
| |
Sanofi, ADR | | | | | 39,550 | | | | 1,828,792 | |
| |
Shire plc | | | | | 33,310 | | | | 2,217,498 | |
| |
Sun Pharmaceutical Industries Ltd. | | | | | 27,272 | | | | 374,350 | |
| |
Teva Pharmaceutical Industries Ltd., Sponsored ADR | | | | | 26,150 | | | | 1,476,691 | |
| |
Theravance Biopharma, Inc.1 | | | | | 24,442 | | | | 447,289 | |
| |
Theravance, Inc. | | | | | 95,570 | | | | 1,531,031 | |
| |
Valeant Pharmaceuticals International, Inc.1 | | | | | 12,454 | | | | 1,656,880 | |
| | | | | | | | | | |
| | | | | | | | | 63,087,877 | |
|
| |
Industrials—8.7% | | | | | | | | | | |
| |
Aerospace & Defense—1.5% | | | | | | | | | | |
| |
Airbus Group NV | | | | | 141,170 | | | | 8,451,240 | |
| |
B/E Aerospace, Inc.1 | | | | | 11,230 | | | | 836,074 | |
| |
Boeing Co. (The) | | | | | 8,330 | | | | 1,040,500 | |
| |
Curtiss-Wright Corp. | | | | | 21,220 | | | | 1,468,636 | |
| |
Embraer SA | | | | | 108,400 | | | | 1,049,484 | |
| |
Embraer SA, Sponsored ADR | | | | | 141,880 | | | | 5,482,243 | |
21 OPPENHEIMER GLOBAL ALLOCATION FUND
| | |
| |
| CONSOLIDATED STATEMENT OF INVESTMENTS Continued | | |
| | | | | | | | | | |
| | | | | Shares | | | Value | |
| |
Aerospace & Defense (Continued) | | | | | | | | | | |
| |
General Dynamics Corp. | | | | | 14,340 | | | $ | 2,004,158 | |
| |
Lockheed Martin Corp. | | | | | 9,400 | | | | 1,791,358 | |
| |
Rolls-Royce Holdings plc1 | | | | | 113,161 | | | | 1,528,874 | |
| |
United Technologies Corp. | | | | | 13,640 | | | | 1,459,480 | |
| | | | | | | | | | |
| | | | | | | | | 25,112,047 | |
|
| |
Air Freight & Couriers—0.4% | | | | | | | | | | |
| |
FedEx Corp. | | | | | 4,250 | | | | 711,450 | |
| |
Royal Mail plc | | | | | 109,376 | | | | 772,538 | |
| |
United Parcel Service, Inc., Cl. B | | | | | 48,220 | | | | 5,058,760 | |
| | | | | | | | | | |
| | | | | | | | | 6,542,748 | |
|
| |
Airlines—0.4% | | | | | | | | | | |
| |
Allegiant Travel Co., Cl. A | | | | | 8,286 | | | | 1,105,933 | |
| |
Delta Air Lines, Inc. | | | | | 117,210 | | | | 4,715,358 | |
| | | | | | | | | | |
| | | | | | | | | 5,821,291 | |
|
| |
Building Products—0.6% | | | | | | | | | | |
| |
A.O. Smith Corp. | | | | | 29,070 | | | | 1,550,885 | |
| |
Allegion plc | | | | | 11,160 | | | | 592,484 | |
| |
Assa Abloy AB, Cl. B | | | | | 121,111 | | | | 6,440,919 | |
| |
Lennox International, Inc. | | | | | 5,610 | | | | 498,841 | |
| |
Nortek, Inc.1 | | | | | 5,864 | | | | 488,354 | |
| | | | | | | | | | |
| | | | | | | | | 9,571,483 | |
|
| |
Commercial Services & Supplies—0.6% | | | | | | | | | | |
| |
Aggreko plc | | | | | 55,223 | | | | 1,346,573 | |
| |
Edenred | | | | | 47,637 | | | | 1,321,439 | |
| |
Mobile Mini, Inc. | | | | | 42,680 | | | | 1,870,665 | |
| |
Prosegur Compania de Seguridad SA | | | | | 255,599 | | | | 1,500,617 | |
| |
Tyco International Ltd. | | | | | 64,280 | | | | 2,759,540 | |
| |
Waste Management, Inc. | | | | | 40,790 | | | | 1,994,223 | |
| | | | | | | | | | |
| | | | | | | | | 10,793,057 | |
|
| |
Construction & Engineering—0.3% | | | | | | | | | | |
| |
FLSmidth & Co. AS | | | | | 35,986 | | | | 1,631,511 | |
| |
Koninklijke Boskalis Westminster NV | | | | | 36,659 | | | | 1,956,286 | |
| |
Larsen & Toubro Ltd. | | | | | 9,587 | | | | 258,083 | |
| |
Leighton Holdings Ltd. | | | | | 52,000 | | | | 1,011,253 | |
| |
Trevi Finanziaria Industriale SpA | | | | | 70,192 | | | | 251,974 | |
| | | | | | | | | | |
| | | | | | | | | 5,109,107 | |
|
| |
Electrical Equipment—1.1% | | | | | | | | | | |
| |
ABB Ltd.1 | | | | | 59,724 | | | | 1,309,703 | |
| |
Eaton Corp. plc | | | | | 48,070 | | | | 3,287,507 | |
| |
Emerson Electric Co. | | | | | 54,820 | | | | 3,511,769 | |
| |
Legrand SA | | | | | 25,670 | | | | 1,382,823 | |
| |
Nidec Corp. | | | | | 99,400 | | | | 6,531,741 | |
| |
Prysmian SpA | | | | | 75,763 | | | | 1,312,055 | |
| |
Schneider Electric SE | | | | | 18,430 | | | | 1,458,986 | |
| | | | | | | | | | |
| | | | | | | | | 18,794,584 | |
22 OPPENHEIMER GLOBAL ALLOCATION FUND
| | | | | | | | | | |
| | | | | Shares | | | Value | |
| |
Industrial Conglomerates—0.9% | | | | | | | | | | |
| |
3M Co. | | | | | 36,150 | | | $ | 5,558,785 | |
| |
Danaher Corp. | | | | | 24,684 | | | | 1,984,594 | |
| |
Jardine Strategic Holdings Ltd. | | | | | 31,742 | | | | 1,131,323 | |
| |
Seibu Holdings, Inc. | | | | | 49,300 | | | | 937,020 | |
| |
Siemens AG | | | | | 40,214 | | | | 4,533,178 | |
| |
SM Investments Corp. | | | | | 80,573 | | | | 1,406,295 | |
| | | | | | | | | | |
| | | | | | | | | 15,551,195 | |
|
| |
Machinery—1.4% | | | | | | | | | | |
| |
Aalberts Industries NV | | | | | 63,267 | | | | 1,686,768 | |
| |
Atlas Copco AB, Cl. A | | | | | 60,269 | | | | 1,741,369 | |
| |
Caterpillar, Inc. | | | | | 32,640 | | | | 3,310,023 | |
| |
FANUC Corp. | | | | | 16,600 | | | | 2,916,542 | |
| |
Greenbrier Cos., Inc. (The) | | | | | 16,310 | | | | 1,020,027 | |
| |
Middleby Corp. (The)1 | | | | | 25,690 | | | | 2,273,565 | |
| |
Pall Corp. | | | | | 12,080 | | | | 1,104,354 | |
| |
Parker-Hannifin Corp. | | | | | 35,680 | | | | 4,532,430 | |
| |
Pentair plc | | | | | 5,060 | | | | 339,273 | |
| |
Proto Labs, Inc.1 | | | | | 15,600 | | | | 1,019,772 | |
| |
Wabtec Corp. | | | | | 23,520 | | | | 2,029,776 | |
| |
Weir Group plc (The) | | | | | 41,374 | | | | 1,513,127 | |
| | | | | | | | | | |
| | | | | | | | | 23,487,026 | |
|
| |
Professional Services—0.4% | | | | | | | | | | |
| |
Experian plc | | | | | 81,318 | | | | 1,222,130 | |
| |
Huron Consulting Group, Inc.1 | | | | | 20,740 | | | | 1,443,711 | |
| |
Intertek Group plc | | | | | 36,620 | | | | 1,596,227 | |
| |
Korn/Ferry International1 | | | | | 36,890 | | | | 1,030,338 | |
| |
SGS SA | | | | | 563 | | | | 1,237,135 | |
| | | | | | | | | | |
| | | | | | | | | 6,529,541 | |
|
| |
Road & Rail—0.5% | | | | | | | | | | |
| |
Canadian Pacific Railway Ltd. | | | | | 9,800 | | | | 2,035,264 | |
| |
CSX Corp. | | | | | 48,500 | | | | 1,728,055 | |
| |
Genesee & Wyoming, Inc., Cl. A1 | | | | | 7,110 | | | | 683,982 | |
| |
Old Dominion Freight Line, Inc.1 | | | | | 14,470 | | | | 1,054,429 | |
| |
Saia, Inc.1 | | | | | 13,630 | | | | 668,142 | |
| |
Union Pacific Corp. | | | | | 19,820 | | | | 2,308,039 | |
| | | | | | | | | | |
| | | | | | | | | 8,477,911 | |
|
| |
Trading Companies & Distributors—0.5% | | | | | | | | | | |
| |
Brenntag AG | | | | | 24,777 | | | | 1,199,860 | |
| |
Bunzl plc | | | | | 66,176 | | | | 1,796,767 | |
| |
H&E Equipment Services, Inc. | | | | | 66,270 | | | | 2,477,835 | |
| |
United Rentals, Inc.1 | | | | | 3,470 | | | | 381,908 | |
| |
Wolseley plc | | | | | 33,463 | | | | 1,778,195 | |
| | | | | | | | | | |
| | | | | | | | | 7,634,565 | |
|
| |
Transportation Infrastructure—0.1% | | | | | | | | | | |
| |
Airports of Thailand PCL | | | | | 30,900 | | | | 229,537 | |
| |
DP World Ltd. | | | | | 80,848 | | | | 1,549,048 | |
23 OPPENHEIMER GLOBAL ALLOCATION FUND
| | |
| |
| CONSOLIDATED STATEMENT OF INVESTMENTS Continued | | |
| | | | | | | | | | |
| | | | | Shares | | | Value | |
| |
Transportation Infrastructure (Continued) | | | | | | | | | | |
| |
Grupo Aeroportuario del Sureste SAB de CV, Cl. B | | | | | 20,471 | | | $ | 275,987 | |
| | | | | | | | | | |
| | | | | | | | | 2,054,572 | |
|
| |
Information Technology—14.9% | | | | | | | | | | |
| |
Communications Equipment—0.9% | | | | | | | | | | |
| |
Cisco Systems, Inc. | | | | | 154,090 | | | | 3,770,582 | |
| |
Telefonaktiebolaget LM Ericsson, Cl. B | | | | | 962,944 | | | | 11,386,152 | |
| | | | | | | | | | |
| | | | | | | | | 15,156,734 | |
|
| |
Electronic Equipment, Instruments, & Components—1.6% | | | | | | | | | | |
| |
Hoya Corp. | | | | | 41,500 | | | | 1,517,214 | |
| |
Keyence Corp. | | | | | 16,250 | | | | 7,857,399 | |
| |
Kyocera Corp. | | | | | 89,100 | | | | 4,180,672 | |
| |
Methode Electronics, Inc. | | | | | 34,390 | | | | 1,354,278 | |
| |
Murata Manufacturing Co. Ltd. | | | | | 69,800 | | | | 7,937,850 | |
| |
Omron Corp. | | | | | 10,200 | | | | 494,799 | |
| |
Spectris plc | | | | | 21,788 | | | | 628,959 | |
| |
TE Connectivity Ltd. | | | | | 35,450 | | | | 2,167,059 | |
| | | | | | | | | | |
| | | | | | | | | 26,138,230 | |
|
| |
Internet Software & Services—3.8% | | | | | | | | | | |
| |
58.com, Inc., ADR1 | | | | | 5,300 | | | | 209,721 | |
| |
Alibaba Group Holding Ltd., Sponsored ADR1 | | | | | 17,200 | | | | 1,695,920 | |
| |
Baidu, Inc., Sponsored ADR1 | | | | | 24,970 | | | | 5,962,087 | |
| |
Cornerstone OnDemand, Inc.1 | | | | | 29,830 | | | | 1,081,934 | |
| |
CoStar Group, Inc.1 | | | | | 13,760 | | | | 2,216,599 | |
| |
Demandware, Inc.1 | | | | | 22,120 | | | | 1,326,094 | |
| |
eBay, Inc.1 | | | | | 161,850 | | | | 8,497,125 | |
| |
Envestnet, Inc.1 | | | | | 24,320 | | | | 1,080,295 | |
| |
Facebook, Inc., Cl. A1,3 | | | | | 126,980 | | | | 9,522,230 | |
| |
Google, Inc., Cl. A1 | | | | | 13,799 | | | | 7,836,038 | |
| |
Google, Inc., Cl. C1,3 | | | | | 10,800 | | | | 6,038,064 | |
| |
GrubHub, Inc.1 | | | | | 25,800 | | | | 938,088 | |
| |
LinkedIn Corp., Cl. A1 | | | | | 11,560 | | | | 2,646,778 | |
| |
MercadoLibre, Inc. | | | | | 13,280 | | | | 1,808,072 | |
| |
NAVER Corp. | | | | | 1,177 | | | | 826,989 | |
| |
Shutterstock, Inc.1 | | | | | 19,040 | | | | 1,480,550 | |
| |
SPS Commerce, Inc.1 | | | | | 10,230 | | | | 596,409 | |
| |
Telecity Group plc | | | | | 63,270 | | | | 781,550 | |
| |
Tencent Holdings Ltd. | | | | | 130,885 | | | | 2,083,832 | |
| |
United Internet AG | | | | | 37,917 | | | | 1,483,319 | |
| |
WebMD Health Corp., Cl. A1 | | | | | 18,428 | | | | 786,507 | |
| |
Yahoo Japan Corp. | | | | | 331,000 | | | | 1,171,706 | |
| |
Yandex NV, Cl. A1 | | | | | 98,620 | | | | 2,822,504 | |
| |
Yelp, Inc., Cl. A1 | | | | | 12,680 | | | | 760,800 | |
| | | | | | | | | | |
| | | | | | | | | 63,653,211 | |
|
| |
IT Services—1.0% | | | | | | | | | | |
| |
Amadeus IT Holding SA, Cl. A | | | | | 45,231 | | | | 1,664,075 | |
| |
Computer Sciences Corp. | | | | | 41,260 | | | | 2,492,104 | |
| |
Earthport plc1 | | | | | 865,776 | | | | 623,854 | |
24 OPPENHEIMER GLOBAL ALLOCATION FUND
| | | | | | | | | | |
| | | | | Shares | | | Value | |
| |
IT Services (Continued) | | | | | | | | | | |
| |
Infosys Ltd. | | | | | 44,469 | | | $ | 2,957,538 | |
| |
MasterCard, Inc., Cl. A | | | | | 57,310 | | | | 4,799,712 | |
| |
Tata Consultancy Services Ltd. | | | | | 33,411 | | | | 1,436,695 | |
| |
Visa, Inc., Cl. A | | | | | 13,868 | | | | 3,348,151 | |
| | | | | | | | | | |
| | | | | | | | | 17,322,129 | |
|
| |
Semiconductors & Semiconductor Equipment—1.8% | | | | | | | | | | |
| |
Altera Corp. | | | | | 207,710 | | | | 7,138,993 | |
| |
ARM Holdings plc | | | | | 45,780 | | | | 648,204 | |
| |
Broadcom Corp., Cl. A | | | | | 68,890 | | | | 2,885,113 | |
| |
Cavium, Inc.1 | | | | | 30,440 | | | | 1,561,877 | |
| |
Infineon Technologies AG | | | | | 114,248 | | | | 1,108,430 | |
| |
Intel Corp. | | | | | 161,880 | | | | 5,505,539 | |
| |
Maxim Integrated Products, Inc. | | | | | 202,540 | | | | 5,942,524 | |
| |
Micron Technology, Inc.1 | | | | | 23,976 | | | | 793,366 | |
| |
Monolithic Power Systems, Inc. | | | | | 48,180 | | | | 2,129,074 | |
| |
Spansion, Inc., Cl. A1 | | | | | 32,040 | | | | 659,383 | |
| |
Taiwan Semiconductor Manufacturing Co. Ltd. | | | | | 503,000 | | | | 2,171,164 | |
| | | | | | | | | | |
| | | | | | | | | 30,543,667 | |
|
| |
Software—3.9% | | | | | | | | | | |
| |
Adobe Systems, Inc.1 | | | | | 95,300 | | | | 6,682,436 | |
| |
Aspen Technology, Inc.1 | | | | | 35,050 | | | | 1,294,397 | |
| |
Autodesk, Inc.1 | | | | | 28,760 | | | | 1,654,850 | |
| |
Aveva Group plc | | | | | 22,810 | | | | 561,309 | |
| |
Check Point Software Technologies Ltd.1 | | | | | 6,930 | | | | 514,553 | |
| |
Citrix Systems, Inc.1 | | | | | 20,760 | | | | 1,333,415 | |
| |
Dassault Systemes SA | | | | | 22,074 | | | | 1,400,427 | |
| |
Gemalto NV | | | | | 13,690 | | | | 1,047,133 | |
| |
Guidewire Software, Inc.1 | | | | | 51,420 | | | | 2,567,915 | |
| |
Intuit, Inc. | | | | | 80,180 | | | | 7,056,642 | |
| |
Microsoft Corp. | | | | | 205,771 | | | | 9,660,948 | |
| |
Oracle Corp. | | | | | 165,690 | | | | 6,470,195 | |
| |
Proofpoint, Inc.1 | | | | | 40,300 | | | | 1,774,812 | |
| |
Sage Group plc (The) | | | | | 133,339 | | | | 806,663 | |
| |
SAP SE | | | | | 137,228 | | | | 9,330,042 | |
| |
ServiceNow, Inc.1 | | | | | 29,220 | | | | 1,984,915 | |
| |
Splunk, Inc.1 | | | | | 11,640 | | | | 769,171 | |
| |
Synopsys, Inc.1 | | | | | 19,090 | | | | 782,308 | |
| |
Tableau Software, Inc., Cl. A1 | | | | | 19,290 | | | | 1,593,161 | |
| |
Temenos Group AG | | | | | 27,431 | | | | 956,775 | |
| |
Tyler Technologies, Inc.1 | | | | | 20,110 | | | | 2,250,711 | |
| |
Ultimate Software Group, Inc. (The)1 | | | | | 18,110 | | | | 2,725,736 | |
| |
Verint Systems, Inc.1 | | | | | 18,230 | | | | 1,048,043 | |
| |
Workday, Inc., Cl. A1 | | | | | 10,030 | | | | 957,664 | |
| | | | | | | | | | |
| | | | | | | | | 65,224,221 | |
|
| |
Technology Hardware, Storage & Peripherals—1.9% | | | | | | | | | | |
| |
Apple, Inc.3 | | | | | 153,031 | | | | 16,527,348 | |
| |
EMC Corp.3 | | | | | 226,560 | | | | 6,509,069 | |
| |
Lenovo Group Ltd. | | | | | 742,000 | | | | 1,116,733 | |
25 OPPENHEIMER GLOBAL ALLOCATION FUND
| | |
| |
| CONSOLIDATED STATEMENT OF INVESTMENTS Continued | | |
| | | | | | | | | | |
| | | | | Shares | | | Value | |
| |
Technology Hardware, Storage & Peripherals (Continued) | | | | | | | | | | |
| |
SanDisk Corp. | | | | | 29,500 | | | $ | 2,777,130 | |
| |
Stratasys Ltd.1 | | | | | 14,200 | | | | 1,709,112 | |
| |
Western Digital Corp. | | | | | 35,460 | | | | 3,488,200 | |
| | | | | | | | | | |
| | | | | | | | | 32,127,592 | |
|
| |
Materials—1.8% | | | | | | | | | | |
| |
Chemicals—1.1% | | | | | | | | | | |
| |
Asian Paints Ltd. | | | | | 26,677 | | | | 286,809 | |
| |
Dow Chemical Co. (The) | | | | | 68,830 | | | | 3,400,202 | |
| |
Essentra plc | | | | | 121,292 | | | | 1,334,258 | |
| |
Linde AG | | | | | 21,507 | | | | 3,966,781 | |
| |
LyondellBasell Industries NV, Cl. A | | | | | 24,229 | | | | 2,220,103 | |
| |
Methanex Corp. | | | | | 8,870 | | | | 526,346 | |
| |
Potash Corp. of Saskatchewan, Inc. | | | | | 34,356 | | | | 1,173,945 | |
| |
PPG Industries, Inc. | | | | | 6,590 | | | | 1,342,317 | |
| |
Sherwin-Williams Co. (The) | | | | | 5,090 | | | | 1,168,460 | |
| |
Sika AG | | | | | 414 | | | | 1,479,441 | |
| |
Syngenta AG | | | | | 5,942 | | | | 1,841,506 | |
| | | | | | | | | | |
| | | | | | | | | 18,740,168 | |
|
| |
Construction Materials—0.3% | | | | | | | | | | |
| |
Ambuja Cements Ltd. | | | | | 123,994 | | | | 461,213 | |
| |
Caesarstone Sdot-Yam Ltd. | | | | | 16,990 | | | | 949,061 | |
| |
Eagle Materials, Inc. | | | | | 14,210 | | | | 1,242,380 | |
| |
Indocement Tunggal Prakarsa Tbk PT | | | | | 304,000 | | | | 612,272 | |
| |
James Hardie Industries plc | | | | | 101,400 | | | | 1,113,657 | |
| |
Semen Indonesia (Persero) Tbk PT | | | | | 477,000 | | | | 635,296 | |
| |
Ultratech Cement Ltd. | | | | | 10,712 | | | | 447,156 | |
| | | | | | | | | | |
| | | | | | | | | 5,461,035 | |
|
| |
Metals & Mining—0.3% | | | | | | | | | | |
| |
Alrosa AO | | | | | 1,813,534 | | | | 1,623,751 | |
| |
Glencore plc | | | | | 435,420 | | | | 2,232,505 | |
| |
Grupo Mexico SAB de CV, Series B | | | | | 76,019 | | | | 261,653 | |
| |
Real Gold Mining Ltd.1 | | | | | 273,000 | | | | 352 | |
| |
Vale SA, Cl. B, Sponsored ADR | | | | | 117,000 | | | | 1,180,530 | |
| | | | | | | | | | |
| | | | | | | | | 5,298,791 | |
|
| |
Paper & Forest Products—0.1% | | | | | | | | | | |
| |
Louisiana-Pacific Corp.1 | | | | | 104,400 | | | | 1,524,240 | |
|
| |
Telecommunication Services—1.3% | | | | | | | | | | |
| |
Diversified Telecommunication Services—0.7% | | | | | | | | | | |
| |
BT Group plc, Cl. A | | | | | 325,325 | | | | 1,914,675 | |
| |
Iliad SA | | | | | 4,660 | | | | 1,018,979 | |
| |
Inmarsat plc | | | | | 131,780 | | | | 1,435,258 | |
| |
Nippon Telegraph & Telephone Corp. | | | | | 24,800 | | | | 1,549,285 | |
| |
Telefonica Brasil SA, ADR | | | | | 62,670 | | | | 1,280,975 | |
| |
Verizon Communications, Inc. | | | | | 99,013 | | | | 4,975,403 | |
| | | | | | | | | | |
| | | | | | | | | 12,174,575 | |
26 OPPENHEIMER GLOBAL ALLOCATION FUND
| | | | | | | | | | |
| | | | | Shares | | | Value | |
Wireless Telecommunication Services—0.6% | | | | | | | | | | |
America Movil SAB de CV, Cl. L, ADR | | | | | 76,940 | | | $ | 1,878,106 | |
KDDI Corp. | | | | | 113,500 | | | | 7,312,055 | |
MTN Group Ltd. | | | | | 39,843 | | | | 881,974 | |
| | | | | | | | | | |
| | | | | | | | | 10,072,135 | |
| | | |
| | | | | | | | | | | |
Utilities—0.4% | | | | | | | | | | |
Electric Utilities—0.3% | | | | | | | | | | |
Edison International | | | | | 46,550 | | | | 2,913,099 | |
Entergy Corp. | | | | | 13,160 | | | | 1,105,703 | |
NextEra Energy, Inc. | | | | | 14,327 | | | | 1,435,852 | |
| | | | | | | | | | |
| | | | | | | | | 5,454,654 | |
| | | |
| | | | | | | | | | | |
Independent Power and Renewable Electricity Producers—0.0% | | | | | | | | | | |
APR Energy plc | | | | | 18,210 | | | | 105,782 | |
| | | | | | | | | | |
| | | |
Multi-Utilities—0.1% | | | | | | | | | | |
Sempra Energy | | | | | 6,510 | | | | 716,100 | |
| | | | | | | | | | |
Total Common Stocks (Cost $944,691,478) | | | | | | | | | 1,169,657,977 | |
| | | |
| | | | | | | | | | | |
Preferred Stocks—0.9% | | | | | | | | | | |
Ally Financial, Inc., 7% Cum., Series G, Non-Vtg.4 | | | | | 656 | | | | 660,264 | |
Banco Davivienda SA, Preference | | COP | | | 55,678 | | | | 830,773 | |
Bancolombia SA, Preference | | COP | | | 7,619 | | | | 107,092 | |
Bayerische Motoren Werke (BMW) AG, Preference | | EUR | | | 88,159 | | | | 7,056,310 | |
Itau Unibanco Holding SA, Preference, Sponsored ADR | | | | | 279,151 | | | | 4,120,269 | |
Lojas Americanas SA, Preference | | BRL | | | 305,612 | | | | 1,803,159 | |
Telefonica Brasil SA, Preference | | BRL | | | 100 | | | | 2,042 | |
Zee Entertainment Enterprises Ltd., 6% Cum. Non-Cv. | | INR | | | 21,135,219 | | | | 292,588 | |
| | | | | | | | | | |
Total Preferred Stocks (Cost $11,936,451) | | | | | | | | | 14,872,497 | |
| | | |
| | | | | | Units | | | | | |
Rights, Warrants and Certificates—0.0% | | | | | | | | | | |
Genting Bhd Wts.,Strike Price 7.96MYR, Exp. 12/18/181 | | | | | 123,800 | | | | 101,622 | |
Trevi Finanziaria Industriale SpA Rts.,Strike Price 2.1EUR, Exp. 11/13/141 | | | | | 64,159 | | | | 71,557 | |
| | | | | | | | | | |
Total Rights, Warrants and Certificates (Cost $189,559) | | | | | | | | | 173,179 | |
| | | |
| | | | | | Principal Amount | | | | | |
Non-Convertible Corporate Bonds and Notes—7.6% | | | | | | | | | | |
1011778 B.C. ULC/New Red Finance, Inc., 6% Sec. Nts., 4/1/224 | | | | $ | 345,000 | | | | 351,469 | |
Access Midstream Partners LP/ACMP Finance Corp.: | | | | | | | | | | |
4.875% Sr. Unsec. Nts., 3/15/24 | | | | | 130,000 | | | | 136,175 | |
6.125% Sr. Unsec. Nts., 7/15/22 | | | | | 335,000 | | | | 365,987 | |
Actuant Corp., 5.625% Sr. Unsec. Nts., 6/15/22 | | | | | 360,000 | | | | 375,300 | |
ADS Waste Holdings, Inc., 8.25% Sr. Unsec. Nts., 10/1/20 | | | | | 265,000 | | | | 278,912 | |
AerCap Ireland Capital Ltd./AerCap Global Aviation Trust, 4.50% Sr. Unsec. Nts., 5/15/214 | | | | | 315,000 | | | | 318,544 | |
AES Corp., 7.375% Sr. Unsec. Nts., 7/1/21 | | | | | 205,000 | | | | 234,917 | |
Affinia Group, Inc., 7.75% Sr. Unsec. Nts., 5/1/21 | | | | | 510,000 | | | | 518,925 | |
Affinion Group, Inc., 7.875% Sr. Unsec. Nts., 12/15/18 | | | | | 880,000 | | | | 690,800 | |
Ahern Rentals, Inc., 9.50% Sec. Nts., 6/15/184 | | | | | 405,000 | | | | 434,362 | |
Air Canada, 6.75% Sr. Sec. Nts., 10/1/194 | | | | | 320,000 | | | | 337,200 | |
27 OPPENHEIMER GLOBAL ALLOCATION FUND
| | |
| |
| CONSOLIDATED STATEMENT OF INVESTMENTS Continued | | |
| | | | | | | | |
| | | Principal Amount | | | Value | |
Non-Convertible Corporate Bonds and Notes (Continued) | | | | | | | | |
| AK Steel Corp., 7.625% Sr. Unsec. Nts., 5/15/20 | | $ | 400,000 | | | $ | 405,000 | |
Alcatel-Lucent USA, Inc., 6.75% Sr. Unsec. Nts., 11/15/204 | | | 360,000 | | | | 372,600 | |
Alere, Inc., 6.50% Sr. Sub. Nts., 6/15/20 | | | 305,000 | | | | 316,437 | |
Aleris International, Inc.: | | | | | | | | |
7.625% Sr. Unsec. Nts., 2/15/18 | | | 655,000 | | | | 678,744 | |
7.875% Sr. Unsec. Nts., 11/1/20 | | | 680,000 | | | | 710,600 | |
Ally Financial, Inc., 7.50% Sr. Unsec. Nts., 9/15/20 | | | 220,000 | | | | 262,350 | |
Altice Financing SA, 6.50% Sec. Nts., 1/15/224 | | | 210,000 | | | | 216,300 | |
American Capital Ltd., 6.50% Sr. Unsec. Nts., 9/15/184 | | | 385,000 | | | | 400,400 | |
American Energy-Permian Basin LLC/AEPB Finance Corp., 7.125% Sr. Unsec. Nts., 11/1/204 | | | 360,000 | | | | 318,375 | |
Amsted Industries, Inc., 5% Sr. Unsec. Nts., 3/15/225 | | | 360,000 | | | | 356,400 | |
Amsurg Corp., 5.625% Sr. Unsec. Nts., 7/15/224 | | | 180,000 | | | | 187,402 | |
Anixter, Inc., 5.625% Sr. Unsec. Nts., 5/1/19 | | | 290,000 | | | | 307,400 | |
Antero Resources Finance Corp., 6% Sr. Unsec. Nts., 12/1/20 | | | 335,000 | | | | 350,075 | |
Apex Tool Group LLC, 7% Sr. Unsec. Nts., 2/1/214 | | | 710,000 | | | | 639,000 | |
Arch Coal, Inc.: | | | | | | | | |
7.25% Sr. Unsec. Nts., 6/15/21 | | | 90,000 | | | | 33,750 | |
8.00% Sec. Nts., 1/15/194 | | | 225,000 | | | | 147,375 | |
Ardagh Packaging Finance plc/Ardagh Holdings USA, Inc.: | | | | | | | | |
6.00% Sr. Unsec. Nts., 6/30/214 | | | 360,000 | | | | 355,950 | |
6.75% Sr. Unsec. Nts., 1/31/214 | | | 270,000 | | | | 276,750 | |
Ardagh Packaging Finance plc/Ardagh MP Holdings USA, Inc., 7% Sr. Unsec. Nts., 11/15/204 | | | 126,176 | | | | 129,331 | |
Athlon Holdings LP/Athlon Finance Corp., 6% Sr. Unsec. Nts., 5/1/224 | | | 430,000 | | | | 464,131 | |
Atlantic Power Corp., 9% Sr. Unsec. Nts., 11/15/18 | | | 330,000 | | | | 334,125 | |
Atlas Pipeline Partners LP/Atlas Pipeline Finance Corp.: | | | | | | | | |
5.875% Sr. Unsec. Nts., 8/1/23 | | | 320,000 | | | | 333,600 | |
6.625% Sr. Unsec. Nts., 10/1/20 | | | 340,000 | | | | 362,100 | |
Avaya, Inc., 7% Sr. Sec. Nts., 4/1/194 | | | 365,000 | | | | 360,437 | |
Axalta Coating Systems Dutch Holding BV, 7.375% Sr. Unsec. Nts., 5/1/214 | | | 495,000 | | | | 538,313 | |
B/E Aerospace, Inc., 6.875% Sr. Unsec. Nts., 10/1/20 | | | 162,000 | | | | 175,972 | |
Baytex Energy Corp., 5.125% Sr. Unsec. Nts., 6/1/214 | | | 140,000 | | | | 137,200 | |
Beazer Homes USA, Inc., 9.125% Sr. Unsec. Nts., 5/15/19 | | | 660,000 | | | | 692,175 | |
Belden, Inc., 5.50% Sr. Sub. Nts., 9/1/224 | | | 325,000 | | | | 333,531 | |
Berry Plastics Corp., 5.50% Sec. Nts., 5/15/22 | | | 140,000 | | | | 140,700 | |
Bill Barrett Corp., 7.625% Sr. Unsec. Nts., 10/1/19 | | | 560,000 | | | | 568,400 | |
BI-LO LLC/BI-LO Finance Corp., 8.625% Sr. Unsec. Nts., 9/15/184,6 | | | 355,000 | | | | 320,387 | |
Blackboard, Inc., 7.75% Sr. Unsec. Nts., 11/15/195 | | | 440,000 | | | | 446,600 | |
BMC Software Finance, Inc., 8.125% Sr. Unsec. Nts., 7/15/214 | | | 405,000 | | | | 389,812 | |
Boyd Gaming Corp., 9.125% Sr. Unsec. Nts., 12/1/18 | | | 215,000 | | | | 226,287 | |
Brand Energy & Infrastructure Services, Inc., 8.50% Sr. Unsec. Nts., 12/1/215 | | | 720,000 | | | | 720,900 | |
BreitBurn Energy Partners LP/BreitBurn Finance Corp., 8.625% Sr. Unsec. Nts., 10/15/20 | | | 645,000 | | | | 661,125 | |
Building Materials Corp. of America: | | | | | | | | |
5.375% Sr. Unsec. Nts., 11/15/242,4 | | | 410,000 | | | | 413,075 | |
6.75% Sr. Unsec. Nts., 5/1/215 | | | 225,000 | | | | 241,875 | |
BWAY Holding Co., 9.125% Sr. Unsec. Nts., 8/15/214 | | | 335,000 | | | | 349,237 | |
Caesars Entertainment Resort Properties LLC, 11% Sec. Nts., 10/1/214 | | | 335,000 | | | | 312,806 | |
28 OPPENHEIMER GLOBAL ALLOCATION FUND
| | | | | | | | |
| | | Principal Amount | | | Value | |
Non-Convertible Corporate Bonds and Notes (Continued) | | | | | | | | |
| Caesars Growth Properties Holdings LLC/Caesars Growth Properties Finance, Inc., 9.375% Sec. Nts., 5/1/224 | | $ | 365,000 | | | $ | 340,819 | |
Calpine Corp.: | | | | | | | | |
5.375% Sr. Unsec. Nts., 1/15/23 | | | 450,000 | | | | 455,062 | |
7.875% Sr. Sec. Nts., 1/15/234 | | | 171,000 | | | | 190,237 | |
Cantor Commercial Real Estate Co. LP/CCRE Finance Corp., 7.75% Sr. Unsec. Nts., 2/15/184 | | | 465,000 | | | | 495,225 | |
Capsugel SA, 7% Sr. Unsec. Nts., 5/15/194,6 | | | 365,000 | | | | 371,844 | |
Cash America International, Inc., 5.75% Sr. Unsec. Nts., 5/15/18 | | | 265,000 | | | | 276,925 | |
CBC Ammo LLC/CBC FinCo, Inc., 7.25% Sr. Unsec. Nts., 11/15/214 | | | 1,135,000 | | | | 1,129,325 | |
| CBS Outdoor Americas Capital LLC/CBS Outdoor Americas Capital Corp., 5.875% Sr. Unsec. Nts., 3/15/254 | | | 345,000 | | | | 363,112 | |
CCO Holdings LLC/CCO Holdings Capital Corp., 5.75% Sr. Unsec. Nts., 9/1/23 | | | 375,000 | | | | 386,719 | |
CCOH Safari LLC, 5.75% Sr. Unsec. Nts., 12/1/242 | | | 1,495,000 | | | | 1,509,950 | |
Cenveo Corp.: | | | | | | | | |
6.00% Sr. Sec. Nts., 8/1/194 | | | 570,000 | | | | 551,475 | |
8.50% Sec. Nts., 9/15/224 | | | 495,000 | | | | 457,875 | |
Cequel Communications Holdings I LLC/Cequel Capital Corp., 6.375% Sr. Unsec. Nts., 9/15/204 | | | 1,325,000 | | | | 1,387,937 | |
Ceridian LLC/Comdata, Inc., 8.125% Sr. Unsec. Nts., 11/15/175 | | | 115,000 | | | | 115,287 | |
CEVA Group plc, 7% Sr. Sec. Nts., 3/1/214 | | | 725,000 | | | | 708,687 | |
Chaparral Energy, Inc., 7.625% Sr. Unsec. Nts., 11/15/22 | | | 330,000 | | | | 323,400 | |
Chesapeake Energy Corp.: | | | | | | | | |
4.875% Sr. Unsec. Nts., 4/15/22 | | | 420,000 | | | | 431,655 | |
5.375% Sr. Unsec. Nts., 6/15/21 | | | 85,000 | | | | 89,037 | |
5.75% Sr. Unsec. Nts., 3/15/23 | | | 360,000 | | | | 396,000 | |
Chiquita Brands International, Inc./Chiquita Brands LLC, 7.875% Sr. Sec. Nts., 2/1/21 | | | 377,000 | | | | 415,171 | |
CHS/Community Health Systems, Inc., 7.125% Sr. Unsec. Nts., 7/15/20 | | | 270,000 | | | | 292,612 | |
Churchill Downs, Inc., 5.375% Sr. Unsec. Nts., 12/15/215 | | | 270,000 | | | | 277,425 | |
CIT Group, Inc.: | | | | | | | | |
4.25% Sr. Unsec. Nts., 8/15/17 | | | 145,000 | | | | 149,350 | |
5.00% Sr. Unsec. Nts., 8/15/22 | | | 425,000 | | | | 446,250 | |
Claire’s Stores, Inc., 8.875% Sr. Unsec. Nts., 3/15/19 | | | 875,000 | | | | 750,312 | |
Cleaver-Brooks, Inc., 8.75% Sr. Sec. Nts., 12/15/194 | | | 495,000 | | | | 540,787 | |
Cloud Peak Energy Resources LLC/Cloud Peak Energy Finance Corp.: | | | | | | | | |
6.375% Sr. Unsec. Nts., 3/15/24 | | | 165,000 | | | | 162,525 | |
8.50% Sr. Unsec. Nts., 12/15/19 | | | 150,000 | | | | 156,750 | |
CNH Industrial Capital LLC, 6.25% Sr. Unsec. Nts., 11/1/16 | | | 180,000 | | | | 191,250 | |
Compressco Partners LP/Compressco Finance, Inc., 7.25% Sr. Unsec. Nts., 8/15/224 | | | 445,000 | | | | 441,662 | |
Concho Resources, Inc., 5.50% Sr. Unsec. Unsub. Nts., 4/1/23 | | | 100,000 | | | | 106,250 | |
Consolidated Container Co. LLC/Consolidated Container Capital, Inc., 10.125% Sr. Unsec. Nts., 7/15/204 | | | 160,000 | | | | 151,200 | |
Constellium NV, 5.75% Sr. Unsec. Nts., 5/15/244 | | | 265,000 | | | | 263,675 | |
Coveris Holdings SA, 7.875% Sr. Unsec. Nts., 11/1/195 | | | 395,000 | | | | 416,725 | |
Crestwood Midstream Partners LP/Crestwood Midstream Finance Corp.: | | | | | | | | |
6.00% Sr. Unsec. Nts., 12/15/20 | | | 140,000 | | | | 142,450 | |
6.125% Sr. Unsec. Nts., 3/1/22 | | | 350,000 | | | | 355,250 | |
Crimson Merger Sub, Inc., 6.625% Sr. Unsec. Nts., 5/15/224 | | | 705,000 | | | | 660,056 | |
29 OPPENHEIMER GLOBAL ALLOCATION FUND
| | |
| |
| CONSOLIDATED STATEMENT OF INVESTMENTS Continued | | |
| | | | | | | | |
| | | Principal Amount | | | Value | |
Non-Convertible Corporate Bonds and Notes (Continued) | | | | | | | | |
| Crown Americas LLC/Crown Americas Capital Corp. IV, 4.50% Sr. Unsec. Nts., 1/15/23 | | $ | 150,000 | | | $ | 148,125 | |
CTR Partnership LP/CareTrust Capital Corp., 5.875% Sr. Unsec. Nts., 6/1/21 | | | 320,000 | | | | 328,000 | |
Cumulus Media Holdings, Inc., 7.75% Sr. Unsec. Nts., 5/1/19 | | | 410,000 | | | | 425,887 | |
DaVita HealthCare Partners, Inc.: | | | | | | | | |
5.125% Sr. Unsec. Nts., 7/15/24 | | | 160,000 | | | | 163,500 | |
5.75% Sr. Unsec. Nts., 8/15/22 | | | 280,000 | | | | 297,850 | |
Dean Foods Co., 9.75% Sr. Unsec. Nts., 12/15/18 | | | 400,000 | | | | 422,000 | |
Denali Borrower LLC/Denali Finance Corp., 5.625% Sr. Sec. Nts., 10/15/204 | | | 440,000 | | | | 467,775 | |
Denbury Resources, Inc., 4.625% Sr. Sub. Nts., 7/15/23 | | | 295,000 | | | | 272,875 | |
DISH DBS Corp.: | | | | | | | | |
5.875% Sr. Unsec. Nts., 7/15/22 | | | 250,000 | | | | 265,625 | |
6.75% Sr. Unsec. Nts., 6/1/21 | | | 180,000 | | | | 200,250 | |
7.875% Sr. Unsec. Nts., 9/1/19 | | | 305,000 | | | | 354,944 | |
DJO Finance LLC/DJO Finance Corp., 8.75% Sec. Nts., 3/15/18 | | | 330,000 | | | | 349,800 | |
| Drawbridge Special Opportunities Fund LP/Drawbridge Special Opportunities Finance Corp., 5% Sr. Unsec. Nts., 8/1/214 | | | 595,000 | | | | 595,000 | |
DreamWorks Animation SKG, Inc., 6.875% Sr. Unsec. Nts., 8/15/204 | | | 355,000 | | | | 372,750 | |
Drill Rigs Holdings, Inc., 6.50% Sr. Sec. Nts., 10/1/174 | | | 375,000 | | | | 354,375 | |
DuPont Fabros Technology LP, 5.875% Sr. Unsec. Nts., 9/15/21 | | | 445,000 | | | | 465,025 | |
Dynegy, Inc., 5.875% Sr. Unsec. Nts., 6/1/23 | | | 95,000 | | | | 93,575 | |
EarthLink Holdings Corp., 7.375% Sr. Sec. Nts., 6/1/20 | | | 695,000 | | | | 712,375 | |
Eletson Holdings, 9.625% Sr. Sec. Nts., 1/15/224 | | | 325,000 | | | | 325,000 | |
Energy Transfer Equity LP: | | | | | | | | |
5.875% Sr. Sec. Nts., 1/15/24 | | | 230,000 | | | | 242,650 | |
7.50% Sr. Sec. Nts., 10/15/20 | | | 355,000 | | | | 410,025 | |
Energy XXI Gulf Coast, Inc., 6.875% Sr. Unsec. Nts., 3/15/244 | | | 90,000 | | | | 71,325 | |
Enova International, Inc., 9.75% Sr. Nts., 6/1/214 | | | 365,000 | | | | 371,387 | |
EnPro Industries, Inc., 5.875% Sr. Unsec. Nts., 9/15/224 | | | 345,000 | | | | 354,919 | |
Entercom Radio LLC, 10.50% Sr. Unsec. Nts., 12/1/19 | | | 270,000 | | | | 300,375 | |
Envision Healthcare Corp., 5.125% Sr. Unsec. Nts., 7/1/224 | | | 115,000 | | | | 116,725 | |
EP Energy LLC/Everest Acquisition Finance, Inc., 7.75% Sr. Unsec. Nts., 9/1/22 | | | 630,000 | | | | 667,800 | |
Equinix, Inc., 4.875% Sr. Unsec. Nts., 4/1/20 | | | 345,000 | | | | 354,487 | |
Erickson, Inc., 8.25% Sec. Nts., 5/1/20 | | | 896,000 | | | | 851,200 | |
EXCO Resources, Inc., 7.50% Sr. Unsec. Nts., 9/15/18 | | | 475,000 | | | | 421,562 | |
Exterran Partners LP/EXLP Finance Corp., 6% Sr. Unsec. Nts., 4/1/21 | | | 355,000 | | | | 344,350 | |
FairPoint Communications, Inc., 8.75% Sr. Sec. Nts., 8/15/194 | | | 1,015,000 | | | | 1,075,900 | |
Ferrellgas LP/Ferrellgas Finance Corp., 6.50% Sr. Unsec. Nts., 5/1/21 | | | 265,000 | | | | 268,312 | |
FGI Operating Co. LLC/FGI Finance, Inc., 7.875% Sec. Nts., 5/1/20 | | | 765,000 | | | | 732,487 | |
First Data Corp.: | | | | | | | | |
6.75% Sr. Sec. Nts., 11/1/204 | | | 357,000 | | | | 382,882 | |
8.25% Sec. Nts., 1/15/214 | | | 665,000 | | | | 724,850 | |
10.625% Sr. Unsec. Nts., 6/15/21 | | | 298,000 | | | | 344,935 | |
First Data Holdings, Inc., 14.50% Sr. Unsec. Nts., 9/24/194,6 | | | 44,091 | | | | 46,814 | |
Fly Leasing Ltd., 6.75% Sr. Unsec. Nts., 12/15/20 | | | 400,000 | | | | 413,000 | |
FMG Resources August 2006 Pty Ltd., 6.875% Sr. Unsec. Nts., 4/1/224 | | | 215,000 | | | | 222,794 | |
Forbes Energy Services Ltd., 9% Sr. Unsec. Nts., 6/15/19 | | | 300,000 | | | | 291,000 | |
Ford Motor Co., 7.45% Sr. Unsec. Nts., 7/16/31 | | | 230,000 | | | | 308,858 | |
30 OPPENHEIMER GLOBAL ALLOCATION FUND
| | | | | | | | |
| | | | Principal Amount | | | | Value | |
Non-Convertible Corporate Bonds and Notes (Continued) | | | | | | | | |
Freescale Semiconductor, Inc.: | | | | | | | | |
6.00% Sr. Sec. Nts., 1/15/224 | | $ | 730,000 | | | $ | 750,075 | |
10.75% Sr. Unsec. Nts., 8/1/20 | | | 407,000 | | | | 445,665 | |
Fresenius Medical Care US Finance II, Inc.: | | | | | | | | |
4.75% Sr. Unsec. Nts., 10/15/244 | | | 280,000 | | | | 283,150 | |
5.875% Sr. Unsec. Nts., 1/31/224 | | | 145,000 | | | | 158,775 | |
Frontier Communications Corp.: | | | | | | | | |
7.125% Sr. Unsec. Nts., 1/15/23 | | | 425,000 | | | | 454,750 | |
7.625% Sr. Unsec. Nts., 4/15/24 | | | 355,000 | | | | 383,400 | |
FTI Consulting, Inc., 6% Sr. Unsec. Nts., 11/15/22 | | | 650,000 | | | | 668,687 | |
GameStop Corp., 5.50% Sr. Unsec. Nts., 10/1/194 | | | 345,000 | | | | 349,312 | |
Gannett Co., Inc.: | | | | | | | | |
5.125% Sr. Unsec. Nts., 7/15/20 | | | 335,000 | | | | 348,400 | |
5.50% Sr. Unsec. Nts., 9/15/244 | | | 85,000 | | | | 87,975 | |
Gates Global LLC/Gates Global Co., 6% Sr. Unsec. Nts., 7/15/224 | | | 350,000 | | | | 341,250 | |
GenCorp, Inc., 7.125% Sec. Nts., 3/15/21 | | | 565,000 | | | | 603,137 | |
General Cable Corp., 5.75% Sr. Unsec. Nts., 10/1/22 | | | 495,000 | | | | 438,075 | |
Genesis Energy LP/Genesis Energy Finance Corp., 5.75% Sr. Unsec. Nts., 2/15/21 | | | 350,000 | | | | 352,187 | |
Gentiva Health Services, Inc., 11.50% Sr. Unsec. Nts., 9/1/18 | | | 390,000 | | | | 418,275 | |
Goodyear Tire & Rubber Co., 8.25% Sr. Unsec. Nts., 8/15/20 | | | 465,000 | | | | 502,200 | |
Graphic Packaging International, Inc., 4.875% Sr. Unsec. Nts., 11/15/222 | | | 105,000 | | | | 105,787 | |
Gray Television, Inc., 7.50% Sr. Unsec. Nts., 10/1/20 | | | 675,000 | | | | 709,594 | |
Greektown Holdings LLC/Greektown Mothership Corp., 8.875% Sr. Sec. Nts., 3/15/194 | | | 495,000 | | | | 499,950 | |
Halcon Resources Corp.: | | | | | | | | |
8.875% Sr. Unsec. Nts., 5/15/21 | | | 560,000 | | | | 462,000 | |
9.75% Sr. Unsec. Nts., 7/15/20 | | | 190,000 | | | | 159,481 | |
Harland Clarke Holdings Corp., 6.875% Sr. Sec. Nts., 3/1/204 | | | 365,000 | | | | 376,862 | |
HCA, Inc., 7.50% Sr. Unsec. Nts., 2/15/22 | | | 550,000 | | | | 640,062 | |
HD Supply, Inc., 7.50% Sr. Unsec. Nts., 7/15/20 | | | 860,000 | | | | 920,200 | |
Hexion US Finance Corp., 6.625% Sr. Sec. Nts., 4/15/20 | | | 210,000 | | | | 211,050 | |
Hexion US Finance Corp./Hexion Nova Scotia Finance ULC, 8.875% Sr. Sec. Nts., 2/1/18 | | | 195,000 | | | | 192,806 | |
Hiland Partners LP/Hiland Partners Finance Corp., 7.25% Sr. Unsec. Nts., 10/1/204 | | | 335,000 | | | | 355,937 | |
| Hilton Worldwide Finance LLC/Hilton Worldwide Finance Corp., 5.625% Sr. Unsec. Nts., 10/15/214 | | | 200,000 | | | | 211,125 | |
HJ Heinz Co., 4.25% Sec. Nts., 10/15/20 | | | 285,000 | | | | 288,505 | |
Hockey Merger Sub 2, Inc., 7.875% Sr. Unsec. Nts., 10/1/214 | | | 440,000 | | | | 460,900 | |
Hologic, Inc., 6.25% Sr. Unsec. Nts., 8/1/20 | | | 50,000 | | | | 52,812 | |
Hornbeck Offshore Services, Inc., 5.875% Sr. Unsec. Nts., 4/1/20 | | | 470,000 | | | | 444,150 | |
Hot Topic, Inc., 9.25% Sr. Sec. Nts., 6/15/214 | | | 580,000 | | | | 626,400 | |
Huntington Ingalls Industries, Inc., 7.125% Sr. Unsec. Unsub. Nts., 3/15/21 | | | 460,000 | | | | 496,800 | |
IAC/InterActiveCorp, 4.75% Sr. Unsec. Nts., 12/15/22 | | | 275,000 | | | | 270,188 | |
IASIS Healthcare LLC/IASIS Capital Corp., 8.375% Sr. Unsec. Nts., 5/15/19 | | | 665,000 | | | | 703,238 | |
Icahn Enterprises LP/Icahn Enterprises Finance Corp., 5.875% Sr. Unsec. Nts., 2/1/22 | | | 545,000 | | | | 562,713 | |
INEOS Group Holdings SA, 6.125% Sr. Unsec. Nts., 8/15/184 | | | 430,000 | | | | 435,375 | |
Intelsat Luxembourg SA, 7.75% Sr. Unsec. Nts., 6/1/21 | | | 655,000 | | | | 686,931 | |
31 OPPENHEIMER GLOBAL ALLOCATION FUND
| | |
| |
| CONSOLIDATED STATEMENT OF INVESTMENTS Continued | | |
| | | | | | | | |
| | | | Principal Amount | | | | Value | |
Non-Convertible Corporate Bonds and Notes (Continued) | | | | | | | | |
Interactive Data Corp., 5.875% Sr. Unsec. Nts., 4/15/194 | | $ | 405,000 | | | $ | 406,772 | |
Isle of Capri Casinos, Inc., 7.75% Sr. Unsec. Nts., 3/15/19 | | | 320,000 | | | | 337,600 | |
iStar Financial, Inc., 4.875% Sr. Unsec. Nts., 7/1/18 | | | 255,000 | | | | 255,638 | |
Jaguar Land Rover Automotive plc, 5.625% Sr. Unsec. Nts., 2/1/234 | | | 285,000 | | | | 297,469 | |
Jarden Corp.: | | | | | | | | |
3.75% Sr. Unsec. Nts., 10/1/214 | | | 110,000 | | | | 140,239 | |
6.125% Sr. Unsec. Nts., 11/15/22 | | | 110,000 | | | | 115,500 | |
Jefferies Finance LLC/JFIN Co.-Issuer Corp.: | | | | | | | | |
6.875% Sr. Unsec. Nts., 4/15/224 | | | 345,000 | | | | 336,375 | |
7.375% Sr. Unsec. Nts., 4/1/204 | | | 420,000 | | | | 421,050 | |
Jefferies LoanCore LLC/JLC Finance Corp., 6.875% Sr. Unsec. Nts., 6/1/204 | | | 350,000 | | | | 340,375 | |
JLL/Delta Dutch Newco BV, 7.50% Sr. Unsec. Nts., 2/1/224 | | | 300,000 | | | | 306,315 | |
JMC Steel Group, Inc., 8.25% Sr. Nts., 3/15/184 | | | 375,000 | | | | 382,031 | |
Jones Energy Holdings LLC/Jones Energy Finance Corp., 6.75% Sr. Unsec. Nts., 4/1/224 | | | 165,000 | | | | 157,988 | |
Jurassic Holdings III, Inc., 6.875% Sec. Nts., 2/15/214 | | | 670,000 | | | | 676,700 | |
K Hovnanian Enterprises, Inc.: | | | | | | | | |
7.00% Sr. Unsec. Nts., 1/15/194 | | | 285,000 | | | | 278,766 | |
9.125% Sec. Nts., 11/15/205 | | | 370,000 | | | | 403,300 | |
Kenan Advantage Group, Inc. (The), 8.375% Sr. Unsec. Nts., 12/15/185 | | | 510,000 | | | | 535,500 | |
Kindred Healthcare, Inc., 6.375% Sr. Unsec. Nts., 4/15/224 | | | 330,000 | | | | 326,700 | |
Kinetic Concepts, Inc./KCI USA, Inc., 10.50% Sec. Nts., 11/1/18 | | | 320,000 | | | | 353,600 | |
Kodiak Oil & Gas Corp., 5.50% Sr. Unsec. Nts., 1/15/21 | | | 405,000 | | | | 413,100 | |
Kratos Defense & Security Solutions, Inc., 7% Sr. Sec. Nts., 5/15/19 | | | 350,000 | | | | 344,750 | |
L Brands, Inc., 6.625% Sr. Unsec. Nts., 4/1/21 | | | 480,000 | | | | 546,000 | |
Landry’s, Inc., 9.375% Sr. Unsec. Nts., 5/1/204 | | | 595,000 | | | | 638,881 | |
Laredo Petroleum, Inc., 5.625% Sr. Unsec. Nts., 1/15/22 | | | 135,000 | | | | 133,650 | |
LBC Tank Terminals Holding Netherlands BV, 6.875% Sr. Unsec. Nts., 5/15/235 | | | 140,000 | | | | 149,800 | |
Lear Corp., 4.75% Sr. Unsec. Nts., 1/15/23 | | | 490,000 | | | | 493,675 | |
Level 3 Escrow II, Inc., 5.375% Sr. Unsec. Nts., 8/15/224 | | | 105,000 | | | | 107,100 | |
LifePoint Hospitals, Inc., 5.50% Sr. Unsec. Nts., 12/1/21 | | | 720,000 | | | | 757,800 | |
Lightstream Resources Ltd., 8.625% Sr. Unsec. Nts., 2/1/204 | | | 355,000 | | | | 328,375 | |
Linn Energy LLC/Linn Energy Finance Corp.: | | | | | | | | |
7.75% Sr. Unsec. Nts., 2/1/21 | | | 655,000 | | | | 645,175 | |
8.625% Sr. Unsec. Nts., 4/15/20 | | | 325,000 | | | | 327,438 | |
Manitowoc Co., Inc. (The), 8.50% Sr. Unsec. Nts., 11/1/20 | | | 435,000 | | | | 473,063 | |
MarkWest Energy Partners LP/MarkWest Energy Finance Corp., 4.50% Sr. Unsec. Nts., 7/15/23 | | | 145,000 | | | | 149,350 | |
MCE Finance Ltd., 5% Sr. Unsec. Nts., 2/15/214 | | | 430,000 | | | | 425,700 | |
Media General Financing Sub, Inc., 5.875% Sr. Unsec. Nts., 11/15/224 | | | 505,000 | | | | 510,050 | |
MEG Energy Corp., 6.50% Sr. Unsec. Nts., 3/15/214 | | | 1,005,000 | | | | 999,975 | |
| Memorial Production Partners LP/Memorial Production Finance Corp., 7.625% Sr. Unsec. Nts., 5/1/21 | | | 370,000 | | | | 360,288 | |
Meritage Homes Corp., 7.15% Sr. Unsec. Nts., 4/15/20 | | | 615,000 | | | | 679,575 | |
Meritor, Inc., 6.25% Sr. Unsec. Nts., 2/15/24 | | | 715,000 | | | | 732,875 | |
MGM Resorts International: | | | | | | | | |
6.625% Sr. Unsec. Nts., 12/15/21 | | | 55,000 | | | | 60,500 | |
6.75% Sr. Unsec. Nts., 10/1/20 | | | 390,000 | | | | 429,000 | |
Michaels Stores, Inc., 5.875% Sr. Sub. Nts., 12/15/204 | | | 652,000 | | | | 661,780 | |
Micron Technology, Inc., 5.875% Sr. Unsec. Nts., 2/15/224 | | | 135,000 | | | | 142,088 | |
32 OPPENHEIMER GLOBAL ALLOCATION FUND
| | | | | | | | |
| | | | Principal Amount | | | | Value | |
Non-Convertible Corporate Bonds and Notes (Continued) | | | | | | | | |
Midstates Petroleum Co., Inc./Midstates Petroleum Co. LLC, 9.25% Sr. Unsec. Nts., 6/1/21 | | $ | 345,000 | | | $ | 294,975 | |
Milestone Aviation Group Ltd. (The), 8.625% Sr. Unsec. Nts., 12/15/174 | | | 395,000 | | | | 441,413 | |
Miran Mid-Atlantic Trust, 10.06% Sec. Pass-Through Certificates, Series C, 12/30/28 | | | 370,232 | | | | 404,941 | |
MMC Energy. Inc., 8.875% Sr. Unsec. Nts., 10/15/208 | | | 395,000 | | | | 40 | |
Momentive Performance Materials, Inc., 3.88% Sec. Nts., 10/24/21 | | | 395,000 | | | | 345,625 | |
Monitronics International, Inc., 9.125% Sr. Unsec. Nts., 4/1/20 | | | 680,000 | | | | 703,800 | |
MPG Holdco I, Inc., 7.375% Sr. Unsec. Nts., 10/15/224 | | | 535,000 | | | | 564,425 | |
MPH Acquisition Holdings LLC, 6.625% Sr. Unsec. Nts., 4/1/224 | | | 165,000 | | | | 173,044 | |
MTR Gaming Group, Inc., 11.50% Sec. Nts., 8/1/19 | | | 326,575 | | | | 360,049 | |
Murray Energy Corp.: | | | | | | | | |
8.625% Sr. Sec. Nts., 6/15/214 | | | 140,000 | | | | 145,250 | |
9.50% Sr. Sec. Nts., 12/5/204 | | | 755,000 | | | | 811,625 | |
National Financial Partners Corp., 9% Sr. Unsec. Nts., 7/15/214 | | | 390,000 | | | | 418,275 | |
Nationstar Mortgage LLC/Nationstar Capital Corp.: | | | | | | | | |
6.50% Sr. Unsec. Nts., 8/1/18 | | | 120,000 | | | | 117,600 | |
7.875% Sr. Unsec. Nts., 10/1/20 | | | 200,000 | | | | 197,500 | |
Navient Corp., 7.25% Sr. Unsec. Nts., 1/25/22 | | | 400,000 | | | | 448,000 | |
| Navios Maritime Acquisition Corp./Navios Acquisition Finance US, Inc., 8.125% Sr. Sec. Nts., 11/15/214 | | | 365,000 | | | | 373,213 | |
Navios Maritime Holdings, Inc./Navios Maritime Finance II US, Inc., 7.375% Sr. Nts., 1/15/224 | | | 395,000 | | | | 398,456 | |
Navistar International Corp., 8.25% Sr. Unsec. Nts., 11/1/21 | | | 345,000 | | | | 355,954 | |
Neiman Marcus Group Ltd., Inc.: | | | | | | | | |
8.00% Sr. Unsec. Nts., 10/15/214 | | | 65,000 | | | | 69,660 | |
8.75% Sr. Unsec. Nts., 10/15/214,6 | | | 630,000 | | | | 677,250 | |
Nexstar Broadcasting, Inc., 6.875% Sr. Unsec. Nts., 11/15/20 | | | 445,000 | | | | 463,913 | |
NGPL PipeCo LLC, 7.119% Sr. Sec. Nts., 12/15/174 | | | 325,000 | | | | 327,438 | |
Nortek, Inc., 8.50% Sr. Unsec. Nts., 4/15/21 | | | 640,000 | | | | 691,200 | |
North Atlantic Drilling Ltd., 6.25% Sr. Unsec. Nts., 2/1/194 | | | 385,000 | | | | 321,475 | |
Novelis, Inc., 8.75% Sr. Unsec. Nts., 12/15/20 | | | 450,000 | | | | 493,313 | |
NRG Energy, Inc.: | | | | | | | | |
6.25% Sr. Unsec. Nts., 7/15/22 | | | 380,000 | | | | 399,950 | |
6.25% Sr. Unsec. Nts., 5/1/244 | | | 555,000 | | | | 575,813 | |
6.625% Sr. Unsec. Nts., 3/15/23 | | | 135,000 | | | | 143,100 | |
Numericable Group SA, 6% Sr. Sec. Nts., 5/15/224 | | | 700,000 | | | | 716,625 | |
Oasis Petroleum, Inc., 6.875% Sr. Unsec. Nts., 1/15/23 | | | 180,000 | | | | 188,100 | |
Offshore Group Investment Ltd., 7.50% Sr. Sec. Nts., 11/1/19 | | | 595,000 | | | | 510,213 | |
Opal Acquisition, Inc., 8.875% Sr. Unsec. Nts., 12/15/214 | | | 145,000 | | | | 151,888 | |
PaperWorks Industries, Inc., 9.50% Sr. Sec. Nts., 8/15/194 | | | 340,000 | | | | 348,925 | |
Parsley Energy LLC/Parsley Finance Corp., 7.50% Sr. Unsec. Nts., 2/15/224 | | | 355,000 | | | | 349,675 | |
Party City Holdings, Inc., 8.875% Sr. Unsec. Nts., 8/1/20 | | | 220,000 | | | | 239,800 | |
Penn Virginia Corp., 8.50% Sr. Unsec. Nts., 5/1/20 | | | 100,000 | | | | 98,250 | |
PetroLogistics LP/PetroLogistics Finance Corp., 6.25% Sr. Unsec. Nts., 4/1/20 | | | 88,000 | | | | 96,580 | |
PF Chang’s China Bistro, Inc., 10.25% Sr. Unsec. Nts., 6/30/204 | | | 100,000 | | | | 100,000 | |
Pinnacle Entertainment, Inc., 6.375% Sr. Unsec. Nts., 8/1/21 | | | 475,000 | | | | 510,625 | |
Polymer Group, Inc.: | | | | | | | | |
6.875% Sr. Unsec. Nts., 6/1/194 | | | 140,000 | | | | 138,775 | |
33 OPPENHEIMER GLOBAL ALLOCATION FUND
| | |
| |
| CONSOLIDATED STATEMENT OF INVESTMENTS Continued | | |
| | | | | | | | |
| | | | Principal Amount | | | | Value | |
Non-Convertible Corporate Bonds and Notes (Continued) | | | | | | | | |
Polymer Group, Inc.(Continued) | | | | | | | | |
7.75% Sr. Sec. Nts., 2/1/19 | | $ | 432,000 | | | $ | 451,440 | |
Post Holdings, Inc., 7.375% Sr. Unsec. Nts., 2/15/22 | | | 260,000 | | | | 266,500 | |
PQ Corp., 8.75% Sec. Nts., 5/1/184 | | | 285,000 | | | | 303,169 | |
Precision Drilling Corp., 6.625% Sr. Unsec. Nts., 11/15/20 | | | 330,000 | | | | 341,550 | |
Prospect Medical Holdings, Inc., 8.375% Sr. Sec. Nts., 5/1/194 | | | 460,000 | | | | 494,500 | |
R.R. Donnelley & Sons Co., 7.875% Sr. Unsec. Nts., 3/15/21 | | | 335,000 | | | | 378,550 | |
Range Resources Corp.: | | | | | | | | |
5.00% Sr. Sub. Nts., 8/15/22 | | | 205,000 | | | | 216,019 | |
5.00% Sr. Sub. Nts., 3/15/23 | | | 60,000 | | | | 63,000 | |
Realogy Group LLC: | | | | | | | | |
7.625% Sr. Sec. Nts., 1/15/204 | | | 380,000 | | | | 414,200 | |
9.00% Sr. Sec. Nts., 1/15/205 | | | 245,000 | | | | 269,500 | |
Regency Energy Partners LP/Regency Energy Finance Corp., 5% Sr. Unsec. Nts., 10/1/22 | | | 340,000 | | | | 347,225 | |
Rentech Nitrogen Partners LP/Rentech Nitrogen Finance Corp., 6.50% Sec. Nts., 4/15/214 | | | 230,000 | | | | 223,100 | |
Revlon Consumer Products Corp., 5.75% Sr. Unsec. Nts., 2/15/21 | | | 70,000 | | | | 70,350 | |
| Reynolds Group Issuer, Inc./Reynolds Group Issuer LLC/Reynolds Group Issuer Luxembourg SA, 5.75% Sr. Sec. Nts., 10/15/20 | | | 675,000 | | | | 705,375 | |
Rice Energy, Inc., 6.25% Sr. Unsec. Nts., 5/1/224 | | | 150,000 | | | | 145,781 | |
Rite Aid Corp., 6.75% Sr. Unsec. Nts., 6/15/21 | | | 195,000 | | | | 209,138 | |
Rosetta Resources, Inc., 5.625% Sr. Unsec. Nts., 5/1/21 | | | 355,000 | | | | 346,125 | |
Sabine Pass Liquefaction LLC, 5.625% Sr. Sec. Nts., 2/1/21 | | | 207,000 | | | | 217,868 | |
Sabre GLBL, Inc., 8.50% Sr. Sec. Nts., 5/15/194 | | | 378,000 | | | | 407,768 | |
Salix Pharmaceuticals Ltd., 6% Sr. Unsec. Nts., 1/15/214 | | | 315,000 | | | | 341,775 | |
Sally Holdings LLC/Sally Capital, Inc., 5.75% Sr. Unsec. Nts., 6/1/22 | | | 300,000 | | | | 321,000 | |
Samson Investment Co., 9.75% Sr. Unsec. Nts., 2/15/20 | | | 900,000 | | | | 657,000 | |
Sanchez Energy Corp.: | | | | | | | | |
6.125% Sr. Unsec. Nts., 1/15/234 | | | 300,000 | | | | 286,500 | |
7.75% Sr. Unsec. Nts., 6/15/21 | | | 350,000 | | | | 358,750 | |
SandRidge Energy, Inc.: | | | | | | | | |
7.50% Sr. Unsec. Nts., 2/15/23 | | | 275,000 | | | | 246,813 | |
7.51% Sr. Unsec. Nts., 3/15/21 | | | 468,000 | | | | 418,860 | |
SBA Telecommunications, Inc., 5.75% Sr. Unsec. Nts., 7/15/20 | | | 215,000 | | | | 225,750 | |
Sealed Air Corp., 6.50% Sr. Unsec. Nts., 12/1/204 | | | 360,000 | | | | 402,300 | |
Select Medical Corp., 6.375% Sr. Unsec. Nts., 6/1/21 | | | 395,000 | | | | 405,863 | |
Sensata Technologies BV, 5.625% Sr. Unsec. Nts., 11/1/244 | | | 400,000 | | | | 423,000 | |
Seventy Seven Operating LLC, 6.625% Sr. Unsec. Nts., 11/15/19 | | | 35,000 | | | | 34,825 | |
| Signode Industrial Group Lux SA/Signode Industrial Group US, Inc., 6.375% Sr. Unsec. Nts., 5/1/224 | | | 280,000 | | | | 272,300 | |
Sinclair Television Group, Inc.: | | | | | | | | |
5.375% Sr. Unsec. Nts., 4/1/21 | | | 350,000 | | | | 352,625 | |
5.625% Sr. Unsec. Nts., 8/1/244 | | | 220,000 | | | | 218,900 | |
6.125% Sr. Unsec. Nts., 10/1/22 | | | 690,000 | | | | 717,600 | |
SM Energy Co., 6.50% Sr. Unsec. Nts., 1/1/23 | | | 330,000 | | | | 342,375 | |
Spectrum Brands, Inc., 6.375% Sr. Unsec. Nts., 11/15/20 | | | 195,000 | | | | 207,675 | |
Speedy Cash Intermediate Holdings Corp., 10.75% Sec. Nts., 5/15/184 | | | 365,000 | | | | 365,000 | |
Spirit AeroSystems, Inc., 5.25% Sr. Unsec. Nts., 3/15/22 | | | 365,000 | | | | 373,213 | |
SPL Logistics Escrow LLC/SPL Logistics Finance Corp., 8.875% Sr. Sec. Nts., 8/1/204 | | | 685,000 | | | | 744,938 | |
34 OPPENHEIMER GLOBAL ALLOCATION FUND
| | | | | | | | | | |
| | | | | Principal Amount | | | Value | |
Non-Convertible Corporate Bonds and Notes (Continued) | | | | | | | | | | |
| |
Springs Industries, Inc., 6.25% Sr. Sec. Nts., 6/1/21 | | | | $ | 1,025,000 | | | $ | 1,010,906 | |
| |
Sprint Corp., 7.25% Sr. Unsec. Nts., 9/15/214 | | | | | 475,000 | | | | 503,500 | |
| |
Stackpole International Intermediate Co., 7.75% Sr. Sec. Nts., 10/15/214 | | | | | 600,000 | | | | 612,750 | |
| |
| Sugarhouse HSP Gaming Prop Mezz LP/Sugarhouse HSP Gaming Finance Corp., 6.375% Sr. Sec. Nts., 6/1/214 | | | | | 365,000 | | | | 351,313 | |
| |
Summit Midstream Holdings LLC/Summit Midstream Finance Corp., 5.50% Sr. Unsec. Nts., 8/15/22 | | | | | 265,000 | | | | 265,663 | |
| |
| Targa Resources Partners LP/Targa Resources Partners Finance Corp., 4.125% Sr. Unsec. Nts., 11/15/194 | | | | | 200,000 | | | | 203,500 | |
| |
Taylor Morrison Communities, Inc./Monarch Communities, Inc., 5.25% Sr. Unsec. Nts., 4/15/214 | | | | | 230,000 | | | | 232,790 | |
| |
Tenet Healthcare Corp., 6% Sr. Sec. Nts., 10/1/20 | | | | | 300,000 | | | | 323,250 | |
| |
Terex Corp., 6% Sr. Unsec. Nts., 5/15/21 | | | | | 385,000 | | | | 402,325 | |
| |
Tervita Corp., 8% Sr. Sec. Nts., 11/15/184 | | | | | 275,000 | | | | 265,375 | |
| |
Tesoro Logistics LP/Tesoro Logistics Finance Corp.: | | | | | | | | | | |
5.875% Sr. Unsec. Nts., 10/1/20 | | | | | 270,000 | | | | 277,425 | |
6.25% Sr. Unsec. Nts., 10/15/224 | | | | | 130,000 | | | | 134,875 | |
| |
Thompson Creek Metals Co., Inc., 7.375% Sr. Unsec. Nts., 6/1/18 | | | | | 390,000 | | | | 360,750 | |
| |
T-Mobile USA, Inc.: | | | | | | | | | | |
6.25% Sr. Unsec. Nts., 4/1/21 | | | | | 470,000 | | | | 492,325 | |
6.625% Sr. Unsec. Nts., 11/15/20 | | | | | 1,020,000 | | | | 1,078,650 | |
| |
TMX Finance LLC/TitleMax Finance Corp., 8.50% Sr. Sec. Nts., 9/15/184 | | | | | 430,000 | | | | 420,325 | |
| |
TransDigm, Inc., 6% Sr. Sub. Nts., 7/15/22 | | | | | 350,000 | | | | 355,688 | |
| |
Triangle USA Petroleum Corp., 6.75% Sr. Unsec. Nts., 7/15/224 | | | | | 355,000 | | | | 312,400 | |
| |
Trinseo Materials Operating SCA/Trinseo Materials Finance, Inc., 8.75% Sr. Sec. Nts., 2/1/19 | | | | | 162,000 | | | | 171,720 | |
| |
Triumph Group, Inc., 5.25% Sr. Unsec. Nts., 6/1/22 | | | | | 495,000 | | | | 503,663 | |
| |
Universal Hospital Services, Inc., 7.625% Sec. Nts., 8/15/20 | | | | | 350,000 | | | | 328,160 | |
| |
Univision Communications, Inc., 8.50% Sr. Unsec. Nts., 5/15/214 | | | | | 320,000 | | | | 348,000 | |
| |
UPCB Finance V Ltd., 7.25% Sr. Sec. Nts., 11/15/214 | | | | | 530,000 | | | | 585,650 | |
| |
UPCB Finance VI Ltd., 6.875% Sr. Sec. Nts., 1/15/224 | | | | | 675,000 | | | | 740,813 | |
| |
US Airways 2011-1 Class A Pass Through Trust, 7.125% Pass-Through Certificates, 10/22/23 | | | | | 489,062 | | | | 566,700 | |
| |
US Shale Solutions, Inc., 12.50% Sr. Sec. Nts., 9/1/174 | | | | | 340 | | | | 311,100 | |
| |
Valeant Pharmaceuticals International, Inc., 6.375% Sr. Unsec. Nts., 10/15/204 | | | | | 270,000 | | | | 278,100 | |
| |
Vector Group Ltd., 7.75% Sr. Sec. Nts., 2/15/21 | | | | | 390,000 | | | | 423,638 | |
| |
ViaSat, Inc., 6.875% Sr. Unsec. Nts., 6/15/20 | | | | | 286,000 | | | | 303,875 | |
| |
Viking Cruises Ltd., 8.50% Sr. Unsec. Nts., 10/15/224 | | | | | 395,000 | | | | 429,563 | |
| |
Walter Investment Management Corp., 7.875% Sr. Unsec. Nts., 12/15/214 | | | | | 580,000 | | | | 549,550 | |
| |
Wells Enterprises, Inc., 6.75% Sr. Sec. Nts., 2/1/204 | | | | | 283,000 | | | | 294,320 | |
| |
West Corp., 5.375% Sr. Unsec. Nts., 7/15/224 | | | | | 695,000 | | | | 675,888 | |
| |
Western Express, Inc., 12.50% Sr. Sec. Nts., 4/15/155 | | | | | 535,000 | | | | 478,825 | |
| |
Whiting Petroleum Corp., 5.75% Sr. Unsec. Nts., 3/15/21 | | | | | 315,000 | | | | 333,113 | |
| |
Windstream Corp.: | | | | | | | | | | |
6.375% Sr. Unsec. Nts., 8/1/23 | | | | | 300,000 | | | | 303,375 | |
7.75% Sr. Unsec. Nts., 10/15/20 | | | | | 325,000 | | | | 347,750 | |
7.75% Sr. Unsec. Nts., 10/1/21 | | | | | 350,000 | | | | 376,250 | |
| |
Wise Metals Group LLC/Wise Alloys Finance Corp., 8.75% Sr. Sec. Nts., 12/15/184 | | | | | 215,000 | | | | 233,275 | |
35 OPPENHEIMER GLOBAL ALLOCATION FUND
| | |
| |
| CONSOLIDATED STATEMENT OF INVESTMENTS Continued | | |
| | | | | | | | | | |
| | | | | Principal Amount | | | Value | |
Non-Convertible Corporate Bonds and Notes (Continued) | | | | | | | | | | |
| |
| WPX Energy, Inc., 5.25% Sr. Unsec. Nts., 9/15/24 | | | | $ | 170,000 | | | $ | 166,175 | |
| Xerium Technologies, Inc., 8.875% Sr. Unsec. Nts., 6/15/18 | | | | | 430,000 | | | | 454,456 | |
| XPO Logistics, Inc., 7.875% Sr. Unsec. Nts., 9/1/194 | | | | | 210,000 | | | | 221,550 | |
Zebra Technologies Corp., 7.25% Sr. Unsec. Nts., 10/15/224 | | | | | 200,000 | | | | 211,000 | |
| | | | | | | | | | |
Total Non-Convertible Corporate Bonds and Notes (Cost $128,444,037) | | | | | | | | | 128,898,634 | |
| | | |
| | | | | | | | | | | |
Corporate Loans—1.0% | | | | | | | | | | |
| Accellent, Inc., Sr. Sec. Credit Facilities 2nd Lien Term Loan, 7.50%, 3/11/227 | | | | | 320,000 | | | | 310,267 | |
| Affinion Group, Inc., Sr. Sec. Credit Facilities 1st Lien Term Loan, Tranche B, 6.75%, 4/12/187 | | | | | 189,677 | | | | 184,382 | |
| Affinion Group, Inc., Sr. Sec. Credit Facilities 2nd Lien Term Loan, 8.50%, 10/31/182,7 | | | | | 142,647 | | | | 133,482 | |
| Amaya BV, Sr. Sec. Credit Facilities 2nd Lien Term Loan, 8.00%, 7/29/227 | | | | | 315,000 | | | | 318,412 | |
| Asurion LLC, Sr. Sec. Credit Facilities 2nd Lien Term Loan, 8.50%, 3/3/217 | | | | | 355,000 | | | | 361,545 | |
| AZ Chem US, Inc., Sr. Sec. Credit Facilities 2nd Lien Term Loan, 7.50%, 6/10/227 | | | | | 230,000 | | | | 230,383 | |
| BJ’s Wholesale Club, Inc., Sr. Sec. Credit Facilities 2nd Lien Term Loan, 8.50%, 3/26/207 | | | | | 420,000 | | | | 421,260 | |
| Blue Coat Systems, Inc., Sr. Sec. Credit Facilities 2nd Lien Term Loan, 9.50%, 6/26/207 | | | | | 200,000 | | | | 200,500 | |
| Brock Holdings III, Inc., Sr. Sec. Credit Facilities 2nd Lien Term Loan, 10.00%, 3/16/187 | | | | | 280,000 | | | | 271,600 | |
| Caesars Entertainment Operating Co., Inc., Sr. Sec. Credit Facilities 1st Lien Term Loan, 9.75%, 1/29/187 | | | | | 214,463 | | | | 199,048 | |
| Caesars Entertainment Resort Properties LLC, Sr. Sec. Credit Facilities 1st Lien Term Loan, Tranche B, 7.00%, 10/11/207 | | | | | 943,397 | | | | 903,775 | |
| Caesars Growth Properties Holdings LLC/Caesars Growth Properties Finance, Inc., Sr. Sec. Credit Facilities 1st Lien Term Loan, 6.25%, 5/10/217 | | | | | 244,387 | | | | 231,786 | |
| Catalent Pharma Solutions, Inc., Sr. Sec. Credit Facilities 1st Lien Term Loan, 6.50%, 12/31/177 | | | | | 40,500 | | | | 40,500 | |
| Clear Channel Communications, Inc., Extended Sr. Sec. Credit Facilities 1st Lien Term Loan, Tranche D, 6.904%, 1/30/197 | | | | | 1,199,336 | | | | 1,136,071 | |
| Clear Channel Communications, Inc., Sr. Sec. Credit Facilities 1st Lien Term Loan: Tranche B, 3.804%, 1/29/167 | | | | | 5,491 | | | | 5,453 | |
| Tranche E, 7.654%, 7/30/197 | | | | | 209,337 | | | | 202,848 | |
| Connolly Corp., Sr. Sec. Credit Facilities 2nd Lien Term Loan, 8.00%, 5/9/227 | | | | | 365,000 | | | | 367,737 | |
| CRC Health Corp., Sr. Sec. Credit Facilities 2nd Lien Term Loan, 9.00%, 9/28/217 | | | | | 555,000 | | | | 569,396 | |
| Del Monte Foods Co., Inc., Sr. Sec. Credit Facilities 2nd Lien Term Loan, 8.25%, 8/18/217 | | | | | 330,000 | | | | 300,712 | |
| Deltek, Inc., Sr. Sec. Credit Facilities 2nd Lien Term Loan, 10.00%, 10/10/197 | | | | | 455,000 | | | | 459,834 | |
| Deluxe Entertainment Services, Sr. Sec. Credit Facilities 1st Lien Term Loan, Tranche B, 6.50%, 2/26/207 | | | | | 80,000 | | | | 75,200 | |
36 OPPENHEIMER GLOBAL ALLOCATION FUND
| | | | | | | | | | | | | | | | | | | | | | | | |
| | | | | | | | | | | | | | | Principal Amount | | | Value | |
Corporate Loans (Continued) | | | | | | | | | | | | | | | | | | | | | | | | |
| Dialysis Newco, Inc., Sr. Sec. Credit Facilities 2nd Lien Term Loan, 7.75%, 10/21/217 | | | | | | | $ | 555,000 | | | $ | 556,387 | |
| FairPoint Communications, Inc., Sr. Sec. Credit Facilities 1st Lien Term Loan, Tranche B, 7.50%, 2/14/197 | | | | | | | | 425,678 | | | | 429,935 | |
| Fieldwood Energy LLC, Sr. Sec. Credit Facilities 2nd Lien Term Loan, 8.375%, 9/30/202,7 | | | | | | | | 694,152 | | | | 670,898 | |
| Flint Group GmbH, Sr. Sec. Credit Facilities 2nd Lien Term Loan, 8.25%, 5/2/222,7 | | | | | | | | 140,000 | | | | 134,750 | |
| Fram Group Holdings, Sr. Sec. Credit Facilities 1st Lien Term Loan, 6.50%, 7/31/177 | | | | | | | | 124,983 | | | | 125,432 | |
| GYP Holdings III Corp., Sr. Sec. Credit Facilities 2nd Lien Term Loan, 7.75%, 3/27/227 | | | | | | | | 550,000 | | | | 550,860 | |
| Internet Brands, Sr. Sec. Credit Facilities 2nd Lien Term Loan, 8.50%, 6/27/227 | | | | | | | | 420,000 | | | | 411,950 | |
| IPC Systems, Inc., Sr. Sec. Credit Facilities 1st Lien Term Loan, 6.00%, 11/9/207 | | | | | | | | 304,238 | | | | 304,333 | |
| IPC Systems, Inc., Sr. Sec. Credit Facilities 2nd Lien Term Loan, 9.50%, 5/10/217 | | | | | | | | 165,000 | | | | 166,134 | |
| iStar Financial, Inc., Sr. Sec. Credit Facilities 1st Lien Term Loan, 7.00%, 3/19/177 | | | | | | | | 262,585 | | | | 269,313 | |
| Liberty Cablevision of Puerto Rico LLC, Sr. Sec. Credit Facilities 2nd Lien Term Loan, 7.75%, 6/26/237 | | | | | | | | 305,000 | | | | 303,094 | |
| Moxie Patriot LLC, Sr. Sec. Credit Facilities 1st Lien Term Loan, Tranche B1, 6.75%, 12/19/207 | | | | | | | | 325,000 | | | | 328,250 | |
| NewPage Corp., Sr. Sec. Credit Facilities 1st Lien Term Loan, 9.50%, 2/5/217 | | | | | | | | 695,000 | | | | 679,362 | |
| NFR Energy LLC, Sr. Sec. Credit Facilities 2nd Lien Term Loan, 8.75%, 12/31/187 | | | | | | | | 705,000 | | | | 674,156 | |
| NTELOS, Inc., Sr. Sec. Credit Facilities 1st Lien Term Loan, Tranche B, 5.75%, 11/9/197 | | | | | | | | 293,627 | | | | 294,177 | |
| Quicksilver Resources, Inc., Sr. Sec. Credit Facilities 2nd Lien Term Loan, 7.00%, 6/21/197 | | | | | | | | 735,000 | | | | 671,913 | |
| Radnet Management, Inc., Sr. Sec. Credit Facilities 2nd Lien Term Loan, Tranche B, 8.00%, 3/25/217 | | | | | | | | 415,000 | | | | 412,925 | |
| Revel Entertainment, Inc., Sr. Sec. Credit Facilities 2nd Lien Exit Term Loan, 14.50%, 5/20/187,8 | | | | | | | | 326,143 | | | | 1,631 | |
| Rexam plc, Sr. Sec. Credit Facilities 2nd Lien Term Loan, 8.00%, 5/2/227 | | | | | | | | 440,000 | | | | 437,663 | |
| Road Infrastructure Investment LLC, Sr. Sec. Credit Facilities 2nd Lien Term Loan, 7.75%, 9/21/217 | | | | | | | | 435,000 | | | | 398,025 | |
| Templar Energy LLC, Sr. Sec. Credit Facilities 2nd Lien Term Loan, 8.50%, 11/25/207 | | | | | | | | 1,195,000 | | | | 1,089,691 | |
| TWCC Holding Corp., Sr. Sec. Credit Facilities 2nd Lien Term Loan, 7.00%, 6/26/207 | | | | | | | | 600,000 | | | | 590,625 | |
| | | | | | | | | | | | | | | | | | | | | | | | |
Total Corporate Loans (Cost $16,962,121) | | | | | | | | | | | | | | | | | | | | | | | 16,425,695 | |
| | | | | | |
| | | | | | Exercise
Price | | | Expiration
Date | | | | | | | | | | |
| | | | | | | | | | | Contracts | | | | |
Exchange-Traded Options Purchased—0.5% | | | | | | | | | | | | | | | | | | | | | | | | |
CBOE Volatility Index Put1 | | | USD | | | | 13.000 | | | | 12/17/14 | | | | USD | | | | 40,000 | | | | 1,000,000 | |
S&P 500 Index Call1 | | | USD | | | | 2,030.000 | | | | 12/20/14 | | | | USD | | | | 1,500 | | | | 3,990,000 | |
37 OPPENHEIMER GLOBAL ALLOCATION FUND
| | |
| |
| CONSOLIDATED STATEMENT OF INVESTMENTS Continued | | |
| | | | | | | | | | | | | | | | | | | | | | | | |
| | | | | | Exercise | | | Expiration | | | | | | | | | | |
| | | | | | Price | | | Date | | | | | | Contracts | | | Value | |
| |
| Exchange-Traded Options Purchased (Continued) | |
| |
S&P 500 Index Put1 | | | USD | | | | 1,920.000 | | | | 12/20/14 | | | | USD | | | | 1,000 | | | $ | 1,540,000 | |
S&P 500 Index Call1 | | | USD | | | | 2,015.000 | | | | 11/22/14 | | | | USD | | | | 900 | | | | 1,984,500 | |
S&P 500 Index Put1 | | | USD | | | | 1,700.000 | | | | 1/17/15 | | | | USD | | | | 500 | | | | 255,000 | |
Total Exchange-Traded Options Purchased (Cost $10,089,977) | | | | | | | | | | | | | | | | | | | | | | | 8,769,500 | |
| | | | | | | | | | | | | | | Shares | | | | |
| Investment Companies—17.7% | |
Oppenheimer Master Event-Linked Bond Fund, LLC9 | | | | | | | | | | | | | | | | | | | 9,092,652 | | | | 131,623,776 | |
Oppenheimer Master Loan Fund, LLC9 | | | | | | | | | | | | | | | | | | | 11,380,561 | | | | 165,509,512 | |
Total Investment Companies (Cost $296,617,341) | | | | | | | | | | | | | | | | | | | | | | | 297,133,288 | |
|
| |
Total Investments, at Value (Cost $1,408,930,964) | | | | | | | | | | | | | | | | | | | 97.3 | % | | | 1,635,930,770 | |
Net Other Assets (Liabilities) | | | | | | | | | | | | | | | | | | | 2.7 | | | | 45,333,183 | |
Net Assets | | | | | | | | | | | | | | | | | | | 100.0 | % | | $ | 1,681,263,953 | |
Footnotes to Consolidated Statement of Investments
|
1. Non-income producing security. |
2. All or a portion of the security position is when-issued or delayed delivery to be delivered and settled after October 31, 2014. See Note 1 of the accompanying Notes. |
3. All or a portion of the security position is held in segregated accounts and pledged to cover margin requirements with respect to outstanding written options. The aggregate market value of such securities is $26,266,141. See Note 6 of the accompanying Notes. |
4. Represents securities sold under Rule 144A, which are exempt from registration under the Securities Act of 1933, as amended . These securities have been determined to be liquid under guidelines established by the Board of Trustees. These securities amount to $55,997,946 or 3.33% of the Fund’s net assets as of October 31, 2014. |
5. Restricted security. The aggregate value of restricted securities as of October 31, 2014 was $4,412,141, which represents 0.26% of the Fund’s net assets. See Note 7 of the accompanying Notes. Information concerning restricted securities is as follows: |
| | | | | | | | | | | | | | | | |
| | | | | | | | | | | | Unrealized | |
| | | Acquisition | | | | | | | | | Appreciation/ | |
| Security | | Dates | | | Cost | | | Value | | | (Depreciation) | |
Amsted Industries, Inc., 5% Sr. Unsec. Nts., 3/15/22 | | | 3/3/14-3/5/14 | | | $ | 362,654 | | | $ | 356,400 | | | $ | (6,254 | ) |
Blackboard, Inc., 7.75% Sr. Unsec. Nts., 11/15/19 | | | 10/24/13-12/2/13 | | | | 439,250 | | | | 446,600 | | | | 7,350 | |
Brand Energy & Infrastructure Services, Inc., 8.50% Sr. Unsec. Nts., 12/1/21 | | | 11/22/13-11/25/13 | | | | 726,885 | | | | 720,900 | | | | (5,985 | ) |
Building Materials Corp. of America, 6.75% Sr. Unsec. Nts., 5/1/21 | | | 4/26/11 | | | | 222,988 | | | | 241,875 | | | | 18,887 | |
Ceridian LLC/Comdata, Inc., 8.125% Sr. Unsec. Nts., 11/15/17 | | | 5/21/14 | | | | 114,713 | | | | 115,287 | | | | 574 | |
Churchill Downs, Inc., 5.375% Sr. Unsec. Nts., 12/15/21 | | | 12/1/13 | | | | 270,000 | | | | 277,425 | | | | 7,425 | |
Coveris Holdings SA, 7.875% Sr. Unsec. Nts., 11/1/19 | | | 10/24/13 | | | | 395,000 | | | | 416,725 | | | | 21,725 | |
38 OPPENHEIMER GLOBAL ALLOCATION FUND
Footnotes to Consolidated Statement of Investments (Continued)
| | | | | | | | | | | | | | | | |
| | | | | | | | | | | | Unrealized | |
| | | Acquisition | | | | | | | | | Appreciation/ | |
| Security | | Dates | | | Cost | | | Value | | | (Depreciation) | |
| |
K Hovnanian Enterprises, Inc., | | | | | | | | | | | | | | | | |
9.125% Sec. Nts., 11/15/20 | | | 9/19/12-12/6/13 | | | $ | 385,158 | | | $ | 403,300 | | | $ | 18,142 | |
Kenan Advantage Group, Inc.
(The), 8.375% Sr. Unsec. Nts., 12/15/18 | | | 12/7/12-12/12/13 | | | | 518,515 | | | | 535,500 | | | | 16,985 | |
LBC Tank Terminals Holding
Netherlands BV, 6.875%
Sr. Unsec. Nts., 5/15/23 | | | 5/8/13 | | | | 140,000 | | | | 149,800 | | | | 9,800 | |
Realogy Group LLC, 9% Sr. Sec.
Nts., 1/15/20 | | | 2/1/12 | | | | 243,775 | | | | 269,500 | | | | 25,725 | |
Wallace Theater Holdings, Inc. | | | 3/28/13 | | | | 4 | | | | 4 | | | | — | |
Western Express, Inc., 12.50%
Sr. Sec. Nts., 4/15/15 | | | 8/24/10-1/24/11 | | | | 532,058 | | | | 478,825 | | | | (53,233 | ) |
| | | | | | | | |
| | | | | | $ | 4,351,000 | | | $ | 4,412,141 | | | $ | 61,141 | |
| | | | | | | | |
6. Interest or dividend is paid-in-kind, when applicable.
7. Represents the current interest rate for a variable or increasing rate security.
8. This security is not accruing income because the issuer has missed an interest payment on it and/or is not anticipated to make future interest and or principal payments. The rate shown is the original contractual interest rate. See Note 1 of the accompanying Notes.
9. Is or was an affiliate, as defined in the Investment Company Act of 1940, as amended, at or during the period ended October 31, 2014, by virtue of the Fund owning at least 5% of the voting securities of the issuer or as a result of the Fund and the issuer having the same investment adviser. Transactions during the period in which the issuer was an affiliate are as follows:
| | | | | | | | | | | | | | | | |
| | | Shares | | | Gross | | | Gross | | | Shares | |
| | | October 31, 2013 | | | Additions | | | Reductions | | | October 31, 2014 | |
| |
| Oppenheimer Institutional Money Market Fund, Cl. E | | | 1,392,718 | | | | 510,516,629 | | | | 511,909,347 | | | | — | |
| Oppenheimer Master Event-Linked Bond Fund, LLC | | | 9,251,612 | | | | — | | | | 158,960 | | | | 9,092,652 | |
| Oppenheimer Master Loan Fund, LLC | | | 12,766,071 | | | | — | | | | 1,385,510 | | | | 11,380,561 | |
| Oppenheimer Ultra Short Duration Fund, Cl. Y (formerly Oppenheimer Short Duration Fund, Cl. Y) | | | 4,513,213 | | | | 4,995,145 | | | | 9,508,358 | | | | — | |
| | | | |
| | | | | | Value | | | Income | | | Realized Gain | |
| |
Oppenheimer Institutional Money Market Fund, Cl. E | | | | | | $ | — | | | $ | 19,319 | | | $ | — | |
Oppenheimer Master Event-Linked Bond Fund, LLC | | | | | | | 131,623,776 | | | | 8,942,191 | a | | | 1,058,146 | a |
Oppenheimer Master Loan Fund, LLC | | | | | | | 165,509,512 | | | | 9,971,584 | b | | | 444,554 | b |
| Oppenheimer Ultra Short Duration Fund, Cl. Y (formerly Oppenheimer Short Duration Fund, Cl. Y) | | | | | | | — | | | | 54,268 | | | | — | |
| | | | | | | | |
Total | | | | | | $ | 297,133,288 | | | $ | 18,987,362 | | | $ | 1,502,700 | |
| | | | | | | | |
a. Represents the amount allocated to the Fund from Oppenheimer Master Event-Linked Bond Fund, LLC.
b. Represents the amount allocated to the Fund from Oppenheimer Master Loan Fund, LLC.
39 OPPENHEIMER GLOBAL ALLOCATION FUND
| | |
| |
| CONSOLIDATED STATEMENT OF INVESTMENTS Continued | | |
Distribution of investments representing geographic holdings, as a percentage of total investments at value, is as follows:
| | | | | | | | | | |
| Geographic Holdings | | Value | | | Percent | | | |
United States | | $ | 1,101,164,759 | | | | 67.3 | % | | |
United Kingdom | | | 67,494,994 | | | | 4.1 | | | |
France | | | 52,236,083 | | | | 3.2 | | | |
Japan | | | 50,746,021 | | | | 3.1 | | | |
Germany | | | 50,048,698 | | | | 3.1 | | | |
Switzerland | | | 49,442,974 | | | | 3.0 | | | |
India | | | 33,428,872 | | | | 2.0 | | | |
Brazil | | | 30,354,720 | | | | 1.9 | | | |
China | | | 23,282,164 | | | | 1.4 | | | |
Canada | | | 20,890,594 | | | | 1.3 | | | |
Spain | | | 20,772,052 | | | | 1.3 | | | |
Sweden | | | 20,464,056 | | | | 1.3 | | | |
Netherlands | | | 13,361,178 | | | | 0.8 | | | |
Mexico | | | 12,958,435 | | | | 0.8 | | | |
Italy | | | 12,198,384 | | | | 0.7 | | | |
Russia | | | 10,049,159 | | | | 0.6 | | | |
Denmark | | | 7,535,935 | | | | 0.5 | | | |
Hong Kong | | | 7,376,948 | | | | 0.5 | | | |
Ireland | | | 6,148,233 | | | | 0.4 | | | |
Colombia | | | 4,449,397 | | | | 0.3 | | | |
Australia | | | 3,835,097 | | | | 0.2 | | | |
Turkey | | | 3,808,655 | | | | 0.2 | | | |
Philippines | | | 3,579,093 | | | | 0.2 | | | |
Indonesia | | | 3,411,831 | | | | 0.2 | | | |
Thailand | | | 3,277,237 | | | | 0.2 | | | |
Israel | | | 3,156,604 | | | | 0.2 | | | |
Luxembourg | | | 2,707,674 | | | | 0.2 | | | |
Taiwan | | | 2,171,164 | | | | 0.1 | | | |
Belgium | | | 2,002,056 | | | | 0.1 | | | |
Argentina | | | 1,808,072 | | | | 0.1 | | | |
South Africa | | | 1,787,991 | | | | 0.1 | | | |
Malaysia | | | 1,648,600 | | | | 0.1 | | | |
United Arab Emirates | | | 1,549,048 | | | | 0.1 | | | |
Nigeria | | | 1,483,889 | | | | 0.1 | | | |
Chile | | | 1,246,484 | | | | 0.1 | | | |
South Korea | | | 891,106 | | | | 0.1 | | | |
Egypt | | | 843,119 | | | | 0.1 | | | |
Greece | | | 679,375 | | | | 0.0 | | | |
Austria | | | 568,161 | | | | 0.0 | | | |
Cayman Islands | | | 447,289 | | | | 0.0 | | | |
Norway | | | 321,475 | | | | 0.0 | | | |
Puerto Rico | | | 303,094 | | | | 0.0 | | | |
| | | |
Total | | $ | 1,635,930,770 | | | | 100.0 | % | | |
| | | |
| | | | | | | | | | | | | | | | | | | | |
|
Forward Currency Exchange Contracts as of October 31, 2014 | | |
| Counterparty | | Settlement Month(s) | | | Currency
Purchased (000’s) | | | Currency Sold (000’s) | | | Unrealized Appreciation |
|
BOA | | | 01/2015 | | | USD | | | 150 | | | EUR | | | 110 | | | $ 11,914 |
40 OPPENHEIMER GLOBAL ALLOCATION FUND
| | | | | | | | | | | | | | | | | | | | | | | | |
Futures Contracts as of October 31, 2014 | | | | | | | | | | | | | | | | | | | | | |
| Description | | Exchange | | | Buy/Sell
| | | Expiration
Date | | | Number of
Contracts | | | Value | | | Unrealized
Appreciation
(Depreciation) | |
CBOE Volatility Index | | | CBE | | | | Buy | | | | 12/16/14 | | | | 2,600 | | | $ | 41,730,000 | | | $ | (7,888,145) | |
CBOE Volatility Index | | | CBE | | | | Sell | | | | 11/18/14 | | | | 2,000 | | | | 31,600,000 | | | | 7,698,180 | |
Euro Stoxx 50 Index | | | EUX | | | | Sell | | | | 12/19/14 | | | | 1,800 | | | | 69,948,326 | | | | (130,987) | |
S&P 500 E-Mini Index | | | CME | | | | Sell | | | | 12/19/14 | | | | 2,500 | | | | 251,425,000 | | | | (21,271,248) | |
United States Treasury Nts., 5 yr. | | | CBT | | | | Buy | | | | 12/31/14 | | | | 3,333 | | | | 398,059,157 | | | | 2,444,106 | |
| | | | | | | | | | | | | | | | | | | | | | | | |
| | | | | | | | | | | | | | | | | | | | | | $ | (19,148,094) | |
| | | | | | | | | | | | | | | | | | | | | | | | |
| | | | | | | | | | | | | | | | | | | | | | | | | | | | |
Exchange-Traded Options Written at October 31, 2014 | | | | | | | | | | | | | | | | | | | | | |
| Description | | | | | Exercise
Price | | | Expiration
Date | | | | | | Number of
Contracts | | | Premiums
Received | | | Value | |
S&P 500 Index Put | | | USD | | | | 1,820.000 | | | | 12/20/14 | | | | USD | | | | (1,000 | ) | | $ | 996,962 | | | $ | (600,000) | |
| | |
Glossary: | | |
Counterparty Abbreviations |
BOA | | Bank of America NA |
|
Currency abbreviations indicate amounts reporting in currencies |
COP | | Colombian Peso |
BRL | | Brazilian Real |
EUR | | Euro |
INR | | Indian Rupee |
MYR | | Malaysian Ringgit |
|
Exchange Abbreviations |
CBE | | Chicago Board Options Exchange |
CBT | | Chicago Board of Trade |
CME | | Chicago Mercantile Exchanges |
EUX | | European Stock Exchange |
See accompanying Notes to Consolidated Financial Statements.
41 OPPENHEIMER GLOBAL ALLOCATION FUND
| | |
| |
| CONSOLIDATED STATEMENT OF ASSETS AND LIABILITIES October 31, 2014 | | |
| | | | |
Assets | | | | |
Investments, at value—see accompanying statement of investments: | | | | |
Unaffiliated companies (cost $1,112,313,623) | | $ | 1,338,797,482 | |
Affiliated companies (cost $296,617,341) | | | 297,133,288 | |
| | | | |
| | | | 1,635,930,770 | |
Cash | | | 25,238,293 | |
Cash—foreign currencies (cost $172,915) | | | 172,413 | |
Cash used for collateral on futures | | | 22,361,000 | |
Unrealized appreciation on foreign currency exchange contracts | | | 11,914 | |
Receivables and other assets: | | | | |
Investments sold (including $890,465 sold on a when-issued or delayed delivery basis) | | | 8,646,014 | |
Interest and dividends | | | 4,061,967 | |
Variation margin receivable | | | 700,000 | |
Shares of beneficial interest sold | | | 69,930 | |
Other | | | 255,161 | |
| | | | |
Total assets | | | 1,697,447,462 | |
Liabilities | | | | |
Options written, at value (premiums received $996,962) | | | 600,000 | |
Payables and other liabilities: | | | | |
Investments purchased (including $2,700,738 purchased on a when-issued or delayed delivery basis) | | | 6,259,365 | |
Variation margin payable | | | 5,783,132 | |
Shares of beneficial interest redeemed | | | 2,081,889 | |
Trustees’ compensation | | | 795,543 | |
Distribution and service plan fees | | | 362,940 | |
Foreign capital gains tax | | | 160,799 | |
Shareholder communications | | | 29,321 | |
Other | | | 110,520 | |
| | | | |
Total liabilities | | | 16,183,509 | |
|
| |
Net Assets | | $ | 1,681,263,953 | |
| | | | |
| | | | |
Composition of Net Assets | | | | |
Par value of shares of beneficial interest | | $ | 970,809 | |
Additional paid-in capital | | | 2,182,757,202 | |
Accumulated net investment income | | | 9,147,751 | |
Accumulated net realized loss on investments and foreign currency transactions | | | (719,691,757 | ) |
Net unrealized appreciation on investments and translation of assets and liabilities
denominated in foreign currencies | | | 208,079,948 | |
| | | | |
Net Assets | | $ | 1,681,263,953 | |
| | | | |
42 OPPENHEIMER GLOBAL ALLOCATION FUND
| | | | |
Net Asset Value Per Share | |
Class A Shares: | | | | |
| Net asset value and redemption price per share (based on net assets of $1,279,187,134 and 73,377,852 shares of beneficial interest outstanding) | | $ | 17.43 | |
Maximum offering price per share (net asset value plus sales charge of 5.75% of offering price) | | $ | 18.49 | |
| |
Class B Shares: | | | | |
| |
| Net asset value, redemption price (excludes applicable contingent deferred sales charge) and offering price per share (based on net assets of $56,316,673 and 3,339,528 shares of beneficial interest outstanding) | | $ | 16.86 | |
| |
Class C Shares: | | | | |
| |
| Net asset value, redemption price (excludes applicable contingent deferred sales charge) and offering price per share (based on net assets of $262,594,526 and 15,553,537 shares of beneficial interest outstanding) | | $ | 16.88 | |
| |
Class I Shares: | | | | |
| |
| Net asset value, redemption price and offering price per share (based on net assets of $3,030,604 and 174,054 shares of beneficial interest outstanding) | | $ | 17.41 | |
| |
Class R Shares: | | | | |
| |
| Net asset value, redemption price (excludes applicable contingent deferred sales charge) and offering price per share (based on net assets of $39,483,293 and 2,301,908 shares of beneficial interest outstanding) | | $ | 17.15 | |
| |
Class Y Shares: | | | | |
| |
| Net asset value, redemption price and offering price per share (based on net assets of $40,651,723 and 2,334,051 shares of beneficial interest outstanding) | | $ | 17.42 | |
See accompanying Notes to Consolidated Financial Statements.
43 OPPENHEIMER GLOBAL ALLOCATION FUND
| | |
| |
CONSOLIDATED STATEMENT
OF OPERATIONS For the Year Ended October 31, 2014 | | |
| | | | |
Allocation of Income and Expenses from Master Funds1 | | | | |
Net investment income allocated from Oppenheimer Master Event-Linked Bond Fund, LLC: | | | | |
Interest | | $ | 8,940,489 | |
Dividends | | | 1,702 | |
Net Expenses | | | (556,255 | ) |
| | | | |
Net investment income allocated from Oppenheimer Master Event-Linked Bond Fund, LLC | | | 8,385,936 | |
Net investment income allocated from Oppenheimer Master Loan Fund, LLC: | | | | |
Interest | | | 9,506,710 | |
Dividends | | | 464,874 | |
Net Expenses | | | (613,531 | ) |
| | | | |
Net investment income allocated from Oppenheimer Master Loan Fund, LLC | | | 9,358,053 | |
| | | | |
Total allocation of net investment income from master funds | | | 17,743,989 | |
| | | | |
Investment Income | | | | |
Dividends: | | | | |
Unaffiliated companies (net of foreign withholding taxes of $1,244,409) | | | 19,911,736 | |
Affiliated companies | | | 73,587 | |
Interest | | | 11,848,209 | |
| | | | |
Total investment income | | | 31,833,532 | |
| | | | |
Expenses | | | | |
Management fees | | | 13,993,820 | |
Distribution and service plan fees: | | | | |
Class A | | | 3,275,223 | |
Class B | | | 694,696 | |
Class C | | | 2,753,585 | |
Class R2 | | | 209,832 | |
Transfer and shareholder servicing agent fees: | | | | |
Class A | | | 3,012,856 | |
Class B | | | 211,712 | |
Class C | | | 594,018 | |
Class I | | | 326 | |
Class R2 | | | 96,488 | |
Class Y | | | 75,887 | |
Shareholder communications: | | | | |
Class A | | | 192,235 | |
Class B | | | 10,467 | |
Class C | | | 31,626 | |
Class I | | | 68 | |
Class R2 | | | 4,078 | |
Class Y | | | 816 | |
Custodian fees and expenses | | | 144,766 | |
Trustees’ compensation | | | 51,800 | |
Other | | | 325,354 | |
| | | | |
Total expenses | | | 25,679,653 | |
Less waivers and reimbursements of expenses | | | (1,310,630 | ) |
| | | | |
Net expenses | | | 24,369,023 | |
Net Investment Income | | | 25,208,498 | |
44 OPPENHEIMER GLOBAL ALLOCATION FUND
| | | | |
Realized and Unrealized Gain (Loss) | | | | |
Net realized gain (loss) on: | | | | |
Investments from unaffiliated companies (includes premiums on options exercised)(net of foreign capital gains tax of $67,268) | | $ | 40,728,111 | |
Closing and expiration of option contracts written | | | 26,143,785 | |
Closing and expiration of futures contracts | | | 715,798 | |
Foreign currency transactions | | | (92,997 | ) |
Swap contracts | | | 2,469,564 | |
Net realized gain allocated from: | | | | |
Oppenheimer Master Event-Linked Bond Fund, LLC | | | 1,058,146 | |
Oppenheimer Master Loan Fund, LLC | | | 444,554 | |
| | | | |
Net realized gain | | | 71,466,961 | |
Net change in unrealized appreciation/depreciation on: | | | | |
Investments (net of foreign capital gains tax of $147,541) | | | 5,341,073 | |
Translation of assets and liabilities denominated in foreign currencies | | | (23,904,037 | ) |
Futures contracts | | | (20,938,450 | ) |
Option contracts written | | | (4,099,038 | ) |
Swap contracts | | | (1,493,798 | ) |
Net change in unrealized appreciation/depreciation allocated from: | | | | |
Oppenheimer Master Event-Linked Bond Fund, LLC | | | (1,620,887 | ) |
Oppenheimer Master Loan Fund, LLC | | | (2,210,939 | ) |
| | | | |
Net change in unrealized appreciation/depreciation | | | (48,926,076 | ) |
Net Increase in Net Assets Resulting from Operations | | $ | 47,749,383 | |
| | | | |
1. The Fund invests in certain affiliated mutual funds that expect to be treated as partnerships for tax purposes. See Note 1 of the accompanying Consolidated Notes.
2. Effective July 1, 2014, Class N shares were renamed Class R. See Note 1 of the accompanying Consolidated Notes.
See accompanying Notes to Consolidated Financial Statements.
45 OPPENHEIMER GLOBAL ALLOCATION FUND
| | |
| |
| CONSOLIDATED STATEMENTS OF CHANGES IN NET ASSETS | | |
| | | | | | | | |
| | | Year Ended | | | Year Ended | |
| | | October 31, 2014 | | | October 31, 2013 | |
Operations | | | | | | | | |
Net investment income | | $ | 25,208,498 | | | $ | 34,625,240 | |
Net realized gain | | | 71,466,961 | | | | 96,677,175 | |
Net change in unrealized appreciation/depreciation | | | (48,926,076 | ) | | | 170,766,109 | |
| | | | |
Net increase in net assets resulting from operations | | | 47,749,383 | | | | 302,068,524 | |
| | | | | | | | |
Dividends and/or Distributions to Shareholders | | | | | | | | |
Dividends from net investment income: | | | | | | | | |
Class A | | | (25,302,052 | ) | | | (14,740,309 | ) |
Class B | | | (1,107,865 | ) | | | (420,207 | ) |
Class C | | | (4,103,782 | ) | | | (1,470,325 | ) |
Class I | | | (19,453 | ) | | | (2,401 | ) |
Class R1 | | | (727,916 | ) | | | (391,600 | ) |
Class Y | | | (830,701 | ) | | | (496,821 | ) |
| | | | |
| | | (32,091,769 | ) | | | (17,521,663 | ) |
| | | | | | | | | |
Beneficial Interest Transactions | | | | | | | | |
Net increase (decrease) in net assets resulting from beneficial interest transactions: | | | | | | | | |
Class A | | | (102,831,852 | ) | | | (138,689,585 | ) |
Class B | | | (28,342,530 | ) | | | (32,624,127 | ) |
Class C | | | (20,551,374 | ) | | | (29,656,121 | ) |
Class I | | | 2,200,600 | | | | 717,984 | |
Class R1 | | | (4,563,303 | ) | | | (8,121,300 | ) |
Class Y | | | 3,037,082 | | | | (140,408 | ) |
| | | | |
| | | (151,051,377 | ) | | | (208,513,557 | ) |
| | | | | | | | | |
Net Assets | | | | | | | | |
Total increase (decrease) | | | (135,393,763 | ) | | | 76,033,304 | |
Beginning of period | | | 1,816,657,716 | | | | 1,740,624,412 | |
| | | | |
End of period (including accumulated net investment income of $9,147,751 and $23,900,523, respectively) | | $ | 1,681,263,953 | | | $ | 1,816,657,716 | |
| | | | |
1. Effective July 1, 2014, Class N shares were renamed Class R. See Note 1 of the accompanying Consolidated Notes.
46 OPPENHEIMER GLOBAL ALLOCATION FUND
| | |
| |
| CONSOLIDATED FINANCIAL HIGHLIGHTS | | |
| | | | | | | | | | | | | | | | | | | | |
| | | Year Ended | | | Year Ended | | | Year Ended | | | Year Ended | | | Year Ended | |
| | | October 31, | | | October 31, | | | October 31, | | | October 31, | | | October 29, | |
| Class A | | 2014 | | | 2013 | | | 2012 | | | 2011 | | | 2010 1 | |
| |
Per Share Operating Data | | | | | | | | | | | | | | | | | | | | |
| Net asset value, beginning of period | | $ | 17.27 | | | $ | 14.70 | | | $ | 14.81 | | | $ | 15.08 | | | $ | 13.05 | |
| |
| Income (loss) from investment operations: | | | | | | | | | | | | | | | | | | | | |
| Net investment income2 | | | 0.27 | | | | 0.34 | | | | 0.33 | | | | 0.36 | | | | 0.18 | |
| Net realized and unrealized gain (loss) | | | 0.21 | | | | 2.41 | | | | (0.04) | | | | (0.41) | | | | 1.96 | |
| | | | |
| Total from investment operations | | | 0.48 | | | | 2.75 | | | | 0.29 | | | | (0.05) | | | | 2.14 | |
| |
| Dividends and/or distributions to shareholders: | | | | | | | | | | | | | | | | | | | | |
| Dividends from net investment income | | | (0.32) | | | | (0.18) | | | | (0.40) | | | | (0.22) | | | | (0.11) | |
| |
| Net asset value, end of period | | $ | 17.43 | | | $ | 17.27 | | | $ | 14.70 | | | $ | 14.81 | | | $ | 15.08 | |
| | | | |
|
| |
Total Return, at Net Asset Value3 | | | 2.85% | | | | 18.81% | | | | 2.14% | | | | (0.37)% | | | | 16.44% | |
|
| |
Ratios/Supplemental Data | | | | | | | | | | | | | | | | | | | | |
| Net assets, end of period (in thousands) | | $ | 1,279,187 | | | $ | 1,369,331 | | | $ | 1,294,433 | | | $ | 1,473,322 | | | $ | 1,623,802 | |
| |
| Average net assets (in thousands) | | $ | 1,336,323 | | | $ | 1,327,442 | | | $ | 1,358,002 | | | $ | 1,589,726 | | | $ | 1,619,840 | |
| |
| Ratios to average net assets:4,5 | | | | | | | | | | | | | | | | | | | | |
| Net investment income | | | 1.58% | | | | 2.11% | | | | 2.29% | | | | 2.35% | | | | 1.29% | |
| Total expenses6 | | | 1.37% | | | | 1.43% | | | | 1.46% | | | | 1.44% | | | | 1.37% | |
| Expenses after payments, waivers and/or reimbursements and reduction to custodian expenses | | | 1.30% | | | | 1.35% | | | | 1.38% | | | | 1.36% | | | | 1.37% | |
| |
| Portfolio turnover rate | | | 43% | | | | 37% | | | | 59% | | | | 82% | | | | 204% | 7 |
1. October 29, 2010 represents the last business day of the Fund’s reporting period.
2. Per share amounts calculated based on the average shares outstanding during the period.
3. Assumes an initial investment on the business day before the first day of the fiscal period, with all dividends and distributions reinvested in additional shares on the reinvestment date, and redemption at the net asset value calculated on the last business day of the fiscal period. Sales charges are not reflected in the total returns. Total returns are not annualized for periods less than one full year. Returns do not reflect the deduction of taxes that a shareholder would pay on fund distributions or the redemption of fund shares.
4. Annualized for periods less than one full year.
5. Includes the Fund’s share of the allocated expenses and/or net investment income from the master funds.
6. Total expenses including indirect expenses from affiliated fund fees and expenses were as follows:
| | | | | | | | |
| | Year Ended October 31, 2014 | | | 1.38 | % | | |
| | Year Ended October 31, 2013 | | | 1.44 | % | | |
| | Year Ended October 31, 2012 | | | 1.46 | % | | |
| | Year Ended October 31, 2011 | | | 1.44 | % | | |
| | Year Ended October 29, 2010 | | | 1.37 | % | | |
7. The portfolio turnover rate excludes purchase and sale transactions of To Be Announced (TBA) mortgage-related securities as follows:
| | | | | | | | |
| | | Purchase Transactions | | | Sale Transactions | |
| |
Year Ended October 29, 2010 | | | $125,339,102 | | | | $124,699,026 | |
See accompanying Notes to Consolidated Financial Statements.
47 OPPENHEIMER GLOBAL ALLOCATION FUND
| | |
| |
| CONSOLIDATED FINANCIAL HIGHLIGHTS Continued | | |
| | | | | | | | | | | | | | | | | | | | |
| | | Year Ended | | | Year Ended | | | Year Ended | | | Year Ended | | | Year Ended | |
| | | October 31, | | | October 31, | | | October 31, | | | October 31, | | | October 29, | |
| Class B | | 2014 | | | 2013 | | | 2012 | | | 2011 | | | 2010 1 | |
| |
Per Share Operating Data | | | | | | | | | | | | | | | | | | | | |
| Net asset value, beginning of period | | $ | 16.76 | | | $ | 14.30 | | | $ | 14.43 | | | $ | 14.73 | | | $ | 12.77 | |
| |
| Income (loss) from investment operations: | | | | | | | | | | | | | | | | | | | | |
| Net investment income2 | | | 0.13 | | | | 0.19 | | | | 0.20 | | | | 0.23 | | | | 0.06 | |
| Net realized and unrealized gain (loss) | | | 0.21 | | | | 2.34 | | | | (0.02) | | | | (0.41) | | | | 1.91 | |
| | | | |
| Total from investment operations | | | 0.34 | | | | 2.53 | | | | 0.18 | | | | (0.18) | | | | 1.97 | |
| |
| Dividends and/or distributions to shareholders: | | | | | | | | | | | | | | | | | | | | |
| Dividends from net investment income | | | (0.24) | | | | (0.07) | | | | (0.31) | | | | (0.12) | | | | (0.01) | |
| |
| Net asset value, end of period | | $ | 16.86 | | | $ | 16.76 | | | $ | 14.30 | | | $ | 14.43 | | | $ | 14.73 | |
| | | | |
|
| |
Total Return, at Net Asset Value3 | | | 2.05% | | | | 17.72% | | | | 1.36% | | | | (1.25)% | | | | 15.45% | |
|
| |
Ratios/Supplemental Data | | | | | | | | | | | | | | | | | | | | |
| Net assets, end of period (in thousands) | | $ | 56,317 | | | $ | 84,161 | | | $ | 102,131 | | | $ | 145,291 | | | $ | 277,243 | |
| |
| Average net assets (in thousands) | | $ | 69,381 | | | $ | 91,497 | | | $ | 119,580 | | | $ | 224,604 | | | $ | 309,274 | |
| |
| Ratios to average net assets:4,5 | | | | | | | | | | | | | | | | | | | | |
| Net investment income | | | 0.79% | | | | 1.24% | | | | 1 .46% | | | | 1.52% | | | | 0.46% | |
| Total expenses6 | | | 2.21% | | | | 2.42% | | | | 2.41% | | | | 2.43% | | | | 2.33% | |
| Expenses after payments, waivers and/or reimbursements and reduction to custodian expenses | | | 2.09% | | | | 2.22% | | | | 2.20% | | | | 2.21% | | | | 2.18% | |
| |
| Portfolio turnover rate | | | 43% | | | | 37% | | | | 59% | | | | 82% | | | | 204% | 7 |
1. October 29, 2010 represents the last business day of the Fund’s reporting period.
2. Per share amounts calculated based on the average shares outstanding during the period.
3. Assumes an initial investment on the business day before the first day of the fiscal period, with all dividends and distributions reinvested in additional shares on the reinvestment date, and redemption at the net asset value calculated on the last business day of the fiscal period. Sales charges are not reflected in the total returns. Total returns are not annualized for periods less than one full year. Returns do not reflect the deduction of taxes that a shareholder would pay on fund distributions or the redemption of fund shares.
4. Annualized for periods less than one full year.
5. Includes the Fund’s share of the allocated expenses and/or net investment income from the master funds.
6. Total expenses including indirect expenses from affiliated fund fees and expenses were as follows:
| | | | | | | | |
| | Year Ended October 31, 2014 | | | 2.22 | % | | |
| | Year Ended October 31, 2013 | | | 2.43 | % | | |
| | Year Ended October 31, 2012 | | | 2.41 | % | | |
| | Year Ended October 31, 2011 | | | 2.43 | % | | |
| | Year Ended October 29, 2010 | | | 2.33 | % | | |
7. The portfolio turnover rate excludes purchase and sale transactions of To Be Announced (TBA) mortgage-related securities as follows:
| | | | | | | | |
| | | Purchase Transactions | | | Sale Transactions | |
| |
Year Ended October 29, 2010 | | | $125,339,102 | | | | $124,699,026 | |
See accompanying Notes to Consolidated Financial Statements.
48 OPPENHEIMER GLOBAL ALLOCATION FUND
| | | | | | | | | | | | | | | | | | | | |
| | | Year Ended | | | Year Ended | | | Year Ended | | | Year Ended | | | Year Ended | |
| | | October 31, | | | October 31, | | | October 31, | | | October 31, | | | October 29, | |
| Class C | | 2014 | | | 2013 | | | 2012 | | | 2011 | | | 2010 1 | |
| |
Per Share Operating Data | | | | | | | | | | | | | | | | | | | | |
| Net asset value, beginning of period | | $ | 16.78 | | | $ | 14.31 | | | $ | 14.44 | | | $ | 14.73 | | | $ | 12.77 | |
| |
| Income (loss) from investment operations: | | | | | | | | | | | | | | | | | | | | |
| Net investment income2 | | | 0.14 | | | | 0.22 | | | | 0.22 | | | | 0.25 | | | | 0.08 | |
| Net realized and unrealized gain (loss) | | | 0.21 | | | | 2.33 | | | | (0.03) | | | | (0.40) | | | | 1.90 | |
| | | | |
| Total from investment operations | | | 0.35 | | | | 2.55 | | | | 0.19 | | | | (0.15) | | | | 1.98 | |
| |
| Dividends and/or distributions to shareholders: | | | | | | | | | | | | | | | | | | | | |
| Dividends from net investment income | | | (0.25) | | | | (0.08) | | | | (0.32) | | | | (0.14) | | | | (0.02) | |
| |
| Net asset value, end of period | | $ | 16.88 | | | $ | 16.78 | | | $ | 14.31 | | | $ | 14.44 | | | $ | 14.73 | |
| | | | |
|
| |
Total Return, at Net Asset Value3 | | | 2.10% | | | | 17.90% | | | | 1.45% | | | | (1.08)% | | | | 15.55% | |
|
| |
Ratios/Supplemental Data | | | | | | | | | | | | | | | | | | | | |
| Net assets, end of period (in thousands) | | $ | 262,594 | | | $ | 281,444 | | | $ | 267,392 | | | $ | 313,963 | | | $ | 363,252 | |
| |
| Average net assets (in thousands) | | $ | 275,145 | | | $ | 273,813 | | | $ | 284,820 | | | $ | 350,372 | | | $ | 366,311 | |
| |
| Ratios to average net assets:4,5 | | | | | | | | | | | | | | | | | | | | |
| Net investment income | | | 0.83% | | | | 1.39% | | | | 1.58% | | | | 1.64% | | | | 0.57% | |
| Total expenses6 | | | 2.12% | | | | 2.14% | | | | 2.17% | | | | 2.15% | | | | 2.08% | |
| Expenses after payments, waivers and/or reimbursements and reduction to custodian expenses | | | 2.05% | | | | 2.06% | | | | 2.09% | | | | 2.07% | | | | 2.08% | |
| |
| Portfolio turnover rate | | | 43% | | | | 37% | | | | 59% | | | | 82% | | | | 204% | 7 |
1. October 29, 2010 represents the last business day of the Fund’s reporting period.
2. Per share amounts calculated based on the average shares outstanding during the period.
3. Assumes an initial investment on the business day before the first day of the fiscal period, with all dividends and distributions reinvested in additional shares on the reinvestment date, and redemption at the net asset value calculated on the last business day of the fiscal period. Sales charges are not reflected in the total returns. Total returns are not annualized for periods less than one full year. Returns do not reflect the deduction of taxes that a shareholder would pay on fund distributions or the redemption of fund shares.
4. Annualized for periods less than one full year.
5. Includes the Fund’s share of the allocated expenses and/or net investment income from the master funds.
6. Total expenses including indirect expenses from affiliated fund fees and expenses were as follows:
| | | | | | | | |
| | Year Ended October 31, 2014 | | | 2.13 | % | | |
| | Year Ended October 31, 2013 | | | 2.15 | % | | |
| | Year Ended October 31, 2012 | | | 2.17 | % | | |
| | Year Ended October 31, 2011 | | | 2.15 | % | | |
| | Year Ended October 29, 2010 | | | 2.08 | % | | |
7. The portfolio turnover rate excludes purchase and sale transactions of To Be Announced (TBA) mortgage-related securities as follows:
| | | | | | | | |
| | | Purchase Transactions | | | Sale Transactions | |
| |
Year Ended October 29, 2010 | | | $125,339,102 | | | | $124,699,026 | |
See accompanying Notes to Consolidated Financial Statements.
49 OPPENHEIMER GLOBAL ALLOCATION FUND
| | |
| |
| CONSOLIDATED FINANCIAL HIGHLIGHTS Continued | | |
| | | | | | | | | | | | | | | | |
| | | Year Ended October 31, 2014 | | | Year Ended October 31, 2013 | | | Period Ended October 31,
20121 | | | | | |
| | | | | | | | |
| Class I | | | | | | | |
| | | | | |
Per Share Operating Data | | | | | | | | | | | | | | | | |
Net asset value, beginning of period | | $ | 17.25 | | | $ | 14.69 | | | $ | 14.98 | | | | | |
| | | | | |
Income (loss) from investment operations: | | | | | | | | | | | | | | | | |
Net investment income2 | | | 0.32 | | | | 0.34 | | | | 0.37 | | | | | |
Net realized and unrealized gain (loss) | | | 0.24 | | | | 2.48 | | | | (0.53) | | | | | |
| | | | | | | | |
Total from investment operations | | | 0.56 | | | | 2.82 | | | | (0.16) | | | | | |
| | | | | |
Dividends and/or distributions to shareholders: | | | | | | | | | | | | | | | | |
Dividends from net investment income | | | (0.40) | | | | (0.26) | | | | (0.13) | | | | | |
| | | | | |
Net asset value, end of period | | $ | 17.41 | | | $ | 17.25 | | | $ | 14.69 | | | | | |
| | | | | | | | |
| | |
| | | | | |
Total Return, at Net Asset Value3 | | | 3.32% | | | | 19.35% | | | | (1.04)% | | | | | |
| | |
| | | | | |
Ratios/Supplemental Data | | | | | | | | | | | | | | | | |
Net assets, end of period (in thousands) | | $ | 3,031 | | | $ | 775 | | | $ | 10 | | | | | |
| | | | | |
Average net assets (in thousands) | | $ | 1,075 | | | $ | 147 | | | $ | 10 | | | | | |
| | | | | |
Ratios to average net assets:4,5 | | | | | | | | | | | | | | | | |
Net investment income | | | 1.90% | | | | 2.01% | | | | 3.78% | | | | | |
Total expenses6 | | | 0.94% | | | | 0.92% | | | | 0.94% | | | | | |
| Expenses after payments, waivers and/or reimbursements and reduction to custodian expenses | | | 0.87% | | | | 0.84% | | | | 0.89% | | | | | |
| | | | | |
Portfolio turnover rate | | | 43% | | | | 37% | | | | 59% | | | | | |
1. For the period from February 28, 2012 (inception of offering) to October 31, 2012.
2. Per share amounts calculated based on the average shares outstanding during the period.
3. Assumes an initial investment on the business day before the first day of the fiscal period, with all dividends and distributions reinvested in additional shares on the reinvestment date, and redemption at the net asset value calculated on the last business day of the fiscal period. Sales charges are not reflected in the total returns. Total returns are not annualized for periods less than one full year. Returns do not reflect the deduction of taxes that a shareholder would pay on fund distributions or the redemption of fund shares.
4. Annualized for periods less than one full year.
5. Includes the Fund’s share of the allocated expenses and/or net investment income from the master funds.
6. Total expenses including indirect expenses from affiliated fund fees and expenses were as follows:
| | | | | | | | |
| | Year Ended October 31, 2014 | | | 0.95 | % | | |
| | Year Ended October 31, 2013 | | | 0.93 | % | | |
| | Period Ended October 31, 2012 | | | 0.94 | % | | |
See accompanying Notes to Consolidated Financial Statements.
50 OPPENHEIMER GLOBAL ALLOCATION FUND
| | | | | | | | | | | | | | | | | | | | |
| | | Year Ended | | | Year Ended | | | Year Ended | | | Year Ended | | | Year Ended | |
| | | October 31, | | | October 31, | | | October 31, | | | October 31, | | | October 29, | |
| Class R | | 2014 | | | 2013 | | | 2012 | | | 2011 | | | 2010 1 | |
| |
Per Share Operating Data | | | | | | | | | | | | | | | | | | | | |
| Net asset value, beginning of period | | $ | 17.01 | | | $ | 14.48 | | | $ | 14.60 | | | $ | 14.86 | | | $ | 12.87 | |
| |
| Income (loss) from investment operations: | | | | | | | | | | | | | | | | | | | | |
| Net investment income2 | | | 0.23 | | | | 0.29 | | | | 0.29 | | | | 0.32 | | | | 0.14 | |
| Net realized and unrealized gain (loss) | | | 0.20 | | | | 2.38 | | | | (0.04) | | | | (0.39) | | | | 1.93 | |
| | | | |
| Total from investment operations | | | 0.43 | | | | 2.67 | | | | 0.25 | | | | (0.07) | | | | 2.07 | |
| |
| Dividends and/or distributions to shareholders: | | | | | | | | | | | | | | | | | | | | |
| Dividends from net investment income | | | (0.29) | | | | (0.14) | | | | (0.37) | | | | (0.19) | | | | (0.08) | |
| |
| Net asset value, end of period | | $ | 17.15 | | | $ | 17.01 | | | $ | 14.48 | | | $ | 14.60 | | | $ | 14.86 | |
| | | | |
|
| |
Total Return, at Net Asset Value3 | | | 2.56% | | | | 18.52% | | | | 1.86% | | | | (0.55)% | | | | 16.09% | |
|
| |
Ratios/Supplemental Data | | | | | | | | | | | | | | | | | | | | |
| Net assets, end of period (in thousands) | | $ | 39,483 | | | $ | 43,683 | | | $ | 44,700 | | | $ | 56,284 | | | $ | 69,338 | |
| |
| Average net assets (in thousands) | | $ | 42,159 | | | $ | 44,174 | | | $ | 50,331 | | | $ | 63,592 | | | $ | 71,783 | |
| |
| Ratios to average net assets:4,5 | | | | | | | | | | | | | | | | | | | | |
| Net investment income | | | 1.33% | | | | 1.86% | | | | 2.05% | | | | 2.12% | | | | 1.03% | |
| Total expenses6 | | | 1.63% | | | | 1.68% | | | | 1.70% | | | | 1.67% | | | | 1.61% | |
| Expenses after payments, waivers and/or reimbursements and reduction to custodian expenses | | | 1.56% | | | | 1.60% | | | | 1.62% | | | | 1.59% | | | | 1.61% | |
| |
| Portfolio turnover rate | | | 43% | | | | 37% | | | | 59% | | | | 82% | | | | 204% | 7 |
1. October 29, 2010 represents the last business day of the Fund’s reporting period.
2. Per share amounts calculated based on the average shares outstanding during the period.
3. Assumes an initial investment on the business day before the first day of the fiscal period, with all dividends and distributions reinvested in additional shares on the reinvestment date, and redemption at the net asset value calculated on the last business day of the fiscal period. Sales charges are not reflected in the total returns. Total returns are not annualized for periods less than one full year. Returns do not reflect the deduction of taxes that a shareholder would pay on fund distributions or the redemption of fund shares.
4. Annualized for periods less than one full year.
5. Includes the Fund’s share of the allocated expenses and/or net investment income from the master funds.
6. Total expenses including indirect expenses from affiliated fund fees and expenses were as follows:
| | | | | | | | |
| | Year Ended October 31, 2014 | | | 1.64 | % | | |
| | Year Ended October 31, 2013 | | | 1.69 | % | | |
| | Year Ended October 31, 2012 | | | 1.70 | % | | |
| | Year Ended October 31, 2011 | | | 1.67 | % | | |
| | Year Ended October 29, 2010 | | | 1.61 | % | | |
7. The portfolio turnover rate excludes purchase and sale transactions of To Be Announced (TBA) mortgage-related securities as follows:
| | | | | | | | |
| | | Purchase Transactions | | | Sale Transactions | |
| |
Year Ended October 29, 2010 | | | $125,339,102 | | | | $124,699,026 | |
See accompanying Notes to Consolidated Financial Statements.
51 OPPENHEIMER GLOBAL ALLOCATION FUND
| | |
| |
| CONSOLIDATED FINANCIAL HIGHLIGHTS Continued | | |
| | | | | | | | | | | | | | | | | | | | |
| | | Year Ended | | | Year Ended | | | Year Ended | | | Year Ended | | | Year Ended | |
| | | October 31, | | | October 31, | | | October 31, | | | October 31, | | | October 29, | |
| Class Y | | 2014 | | | 2013 | | | 2012 | | | 2011 | | | 2010 1 | |
| |
Per Share Operating Data | | | | | | | | | | | | | | | | | | | | |
| Net asset value, beginning of period | | $ | 17.26 | | | $ | 14.69 | | | $ | 14.80 | | | $ | 15.07 | | | $ | 13.05 | |
| |
| Income (loss) from investment operations: | | | | | | | | | | | | | | | | | | | | |
| Net investment income2 | | | 0.32 | | | | 0.40 | | | | 0.38 | | | | 0.42 | | | | 0.23 | |
| Net realized and unrealized gain (loss) | | | 0.22 | | | | 2.41 | | | | (0.03) | | | | (0.42) | | | | 1.95 | |
| | | | |
| Total from investment operations | | | 0.54 | | | | 2.81 | | | | 0.35 | | | | 0.00 | | | | 2.18 | |
| |
| Dividends and/or distributions to shareholders: | | | | | | | | | | | | | | | | | | | | |
| Dividends from net investment income | | | (0.38) | | | | (0.24) | | | | (0.46) | | | | (0.27) | | | | (0.16) | |
| |
| Net asset value, end of period | | $ | 17.42 | | | $ | 17.26 | | | $ | 14.69 | | | $ | 14.80 | | | $ | 15.07 | |
| | | | |
|
| |
Total Return, at Net Asset Value3 | | | 3.17% | | | | 19.26% | | | | 2.53% | | | | (0.04)% | | | | 16.80% | |
|
| |
Ratios/Supplemental Data | | | | | | | | | | | | | | | | | | | | |
| Net assets, end of period (in thousands) | | $ | 40,652 | | | $ | 37,264 | | | $ | 31,958 | | | $ | 36,291 | | | $ | 35,843 | |
| |
| Average net assets (in thousands) | | $ | 39,075 | | | $ | 33,958 | | | $ | 33,356 | | | $ | 38,475 | | | $ | 35,361 | |
| |
| Ratios to average net assets:4,5 | | | | | | | | | | | | | | | | | | | | |
| Net investment income | | | 1.86% | | | | 2.47% | | | | 2.65% | | | | 2.70% | | | | 1.64% | |
| Total expenses6 | | | 1.09% | | | | 1.06% | | | | 1.09% | | | | 1.11% | | | | 1.01% | |
| Expenses after payments, waivers and/or reimbursements and reduction to custodian expenses | | | 1.02% | | | | 0.98% | | | | 1.01% | | | | 1.03% | | | | 1.01% | |
| |
| Portfolio turnover rate | | | 43% | | | | 37% | | | | 59% | | | | 82% | | | | 204% | 7 |
1. October 29, 2010 represents the last business day of the Fund’s reporting period.
2. Per share amounts calculated based on the average shares outstanding during the period.
3. Assumes an initial investment on the business day before the first day of the fiscal period, with all dividends and distributions reinvested in additional shares on the reinvestment date, and redemption at the net asset value calculated on the last business day of the fiscal period. Sales charges are not reflected in the total returns. Total returns are not annualized for periods less than one full year. Returns do not reflect the deduction of taxes that a shareholder would pay on fund distributions or the redemption of fund shares.
4. Annualized for periods less than one full year.
5. Includes the Fund’s share of the allocated expenses and/or net investment income from the master funds.
6. Total expenses including indirect expenses from affiliated fund fees and expenses were as follows:
| | | | | | | | |
| | Year Ended October 31, 2014 | | | 1.10 | % | | |
| | Year Ended October 31, 2013 | | | 1.07 | % | | |
| | Year Ended October 31, 2012 | | | 1.09 | % | | |
| | Year Ended October 31, 2011 | | | 1.11 | % | | |
| | Year Ended October 29, 2010 | | | 1.01 | % | | |
7. The portfolio turnover rate excludes purchase and sale transactions of To Be Announced (TBA) mortgage-related securities as follows:
| | | | | | | | |
| | | Purchase Transactions | | | Sale Transactions | |
| |
Year Ended October 29, 2010 | | | $125,339,102 | | | | $124,699,026 | |
See accompanying Notes to Consolidated Financial Statements.
52 OPPENHEIMER GLOBAL ALLOCATION FUND
| | |
| NOTES TO CONSOLIDATED FINANCIAL STATEMENTS October 31, 2014 | | |
| | |
1. Significant Accounting Policies
Oppenheimer Global Allocation Fund (the “Fund”), a series of Oppenheimer Quest for Value Funds, is registered under the Investment Company Act of 1940 (“1940 Act”), as amended, as a diversified open-end management investment company. The Fund’s investment objective is to seek total return. The Fund’s investment adviser is OFI Global Asset Management, Inc. (“OFI Global” or the “Manager”), a wholly-owned subsidiary of OppenheimerFunds, Inc. (“OFI” or the “Sub-Adviser”). The Manager has entered into a sub-advisory agreement with OFI.
The Fund offers Class A, Class C, Class I, Class R and Class Y shares, and previously offered Class B shares for new purchase through June 29, 2012. Subsequent to that date, no new purchases of Class B shares are permitted, however reinvestment of dividend and/or capital gain distributions and exchanges of Class B shares into and from other Oppenheimer funds will be allowed. As of July 1, 2014, Class N shares were renamed Class R shares. Class N shares subject to a contingent deferred sales charge (“CDSC”) on July 1, 2014, will continue to be subject to a CDSC after the shares are renamed. Purchases of Class R shares occurring on or after July 1, 2014, will not be subject to a CDSC upon redemption. Class A shares are sold at their offering price, which is normally net asset value plus a front-end sales charge. Class C and Class R shares are sold, and Class B shares were sold, without a front-end sales charge but may be subject to a contingent deferred sales charge (“CDSC”). Class R shares are sold only through retirement plans. Retirement plans that offer Class R shares may impose charges on those accounts. Class I and Class Y shares are sold to certain institutional investors or intermediaries without either a front-end sales charge or a CDSC, however, the intermediaries may impose charges on their accountholders who beneficially own Class I and Class Y shares. All classes of shares have identical rights and voting privileges with respect to the Fund in general and exclusive voting rights on matters that affect that class alone. Earnings, net assets and net asset value per share may differ due to each class having its own expenses, such as transfer and shareholder servicing agent fees and shareholder communications, directly attributable to that class. Class A, B, C and R shares have separate distribution and/or service plans under which they pay fees. Class I and Class Y shares do not pay such fees. Class B shares will automatically convert to Class A shares 72 months after the date of purchase.
The following is a summary of significant accounting policies consistently followed by the Fund.
Securities on a When-Issued or Delayed Delivery Basis. The Fund may purchase securities on a “when-issued” basis, and may purchase or sell securities on a “delayed delivery” basis. “When-issued” or “delayed delivery” refers to securities whose terms and indenture are available and for which a market exists, but which are not available for immediate delivery. Delivery and payment for securities that have been purchased by the Fund on a when-issued basis normally takes place within six months and possibly as long as two years or more after the trade date. During this period, such securities do not earn interest, are subject to market fluctuation and may increase or decrease in value prior to their delivery. The purchase of securities on a when-issued basis may increase the volatility of the Fund’s net asset value to the extent the Fund executes such transactions while remaining substantially
53 OPPENHEIMER GLOBAL ALLOCATION FUND
| | |
| NOTES TO CONSOLIDATED FINANCIAL STATEMENTS Continued | | |
| | |
1. Significant Accounting Policies (Continued)
fully invested. When the Fund engages in when-issued or delayed delivery transactions, it relies on the buyer or seller, as the case may be, to complete the transaction. Their failure to do so may cause the Fund to lose the opportunity to obtain or dispose of the security at a price and yield it considers advantageous. The Fund may also sell securities that it purchased on a when-issued basis or forward commitment prior to settlement of the original purchase.
As of October 31, 2014, the Fund had purchased securities issued on a when-issued or delayed delivery basis and sold securities issued on a delayed delivery basis as follows:
| | | | |
| | | When-Issued or Delayed Delivery Basis Transactions | |
| |
Purchased securities | | | $2,700,738 | |
Sold securities | | | 890,465 | |
Credit Risk. The Fund invests in high-yield, non-investment-grade bonds, which may be subject to a greater degree of credit risk. Credit risk relates to the ability of the issuer to meet interest or principal payments or both as they become due. The Fund may acquire securities that have missed an interest payment, and is not obligated to dispose of securities whose issuers or underlying obligors subsequently miss an interest payment. Information concerning securities not accruing interest as of October 31, 2014 is as follows:
| | | | |
Cost | | | $315,293 | |
Market Value | | | $1,631 | |
Market value as % of Net Assets | | | Less than 0.005% | |
Basis for Consolidation. The Fund has established a Cayman Islands exempted company, Oppenheimer Global Allocation Fund (Cayman) Ltd., which is wholly-owned and controlled by the Fund (the “Subsidiary”). The Fund and Subsidiary are both managed by the Manager. The Fund may invest up to 25% of its total assets in the Subsidiary. The Subsidiary invests primarily in commodity-linked derivatives (including commodity futures, financial futures, options and swap contracts) and certain fixed-income securities and other investments that may serve as margin or collateral for its derivatives positions. Investments in the Subsidiary are expected to provide the Fund with exposure to commodities markets within the limitations of the federal tax requirements that apply to the Fund. The Subsidiary is subject to the same investment restrictions and guidelines, and follows the same compliance policies and procedures, as the Fund.
The financial statements have been consolidated and include accounts of the Fund and the Subsidiary. Accordingly, all inter-company transactions and balances have been eliminated. At October 31, 2014, the Fund owned 2,921 shares with a market value of $14,702,027.
Equity Security Risk. Stocks and other equity securities fluctuate in price. The value of the Fund’s portfolio may be affected by changes in the equity markets generally. Equity markets may experience significant short-term volatility and may fall sharply at times. Different markets may behave differently from each other and U.S. equity markets may move in the opposite direction from one or more foreign stock markets.
54 OPPENHEIMER GLOBAL ALLOCATION FUND
1. Significant Accounting Policies (Continued)
The prices of individual equity securities generally do not all move in the same direction at the same time and a variety of factors can affect the price of a particular company’s securities. These factors may include, but are not limited to, poor earnings reports, a loss of customers, litigation against the company, general unfavorable performance of the company’s sector or industry, or changes in government regulations affecting the company or its industry.
Investment in Oppenheimer Master Funds. The Fund is permitted to invest in entities sponsored and/or advised by the Manager or an affiliate. Certain of these entities in which the Fund invests are mutual funds registered under the Investment Company Act of 1940 that expect to be treated as partnerships for tax purposes, specifically Oppenheimer Master Loan Fund, LLC and Oppenheimer Master Event-Linked Bond Fund, LLC (the “Master Funds”). Each Master Fund has its own investment risks, and those risks can affect the value of the Fund’s investments and therefore the value of the Fund’s shares. To the extent that the Fund invests more of its assets in one Master Fund than in another, the Fund will have greater exposure to the risks of that Master Fund.
The investment objective of Oppenheimer Master Loan Fund, LLC is to seek income. The investment objective of Oppenheimer Master Event-Linked Bond Fund, LLC is to seek total return. The Fund’s investments in the Master Funds are included in the Consolidated Statement of Investments. The Fund recognizes income and gain/(loss) on its investments in each Master Fund according to its allocated pro-rata share, based on its relative proportion of total outstanding Master Fund shares held, of the total net income earned and the net gain/(loss) realized on investments sold by the Master Funds. As a shareholder, the Fund is subject to its proportional share of the Master Funds’ expenses, including their management fee. The Manager will waive fees and/or reimburse Fund expenses in an amount equal to the indirect management fees incurred through the Fund’s investment in the Master Funds.
Foreign Currency Translation. The Fund’s accounting records are maintained in U.S. dollars. The values of securities denominated in foreign currencies and amounts related to the purchase and sale of foreign securities and foreign investment income are translated into U.S. dollars as of the close of the New York Stock Exchange (the “Exchange”), normally 4:00 P.M. Eastern time, on each day the Exchange is open for trading. Foreign exchange rates may be valued primarily using a reliable bank, dealer or service authorized by the Board of Trustees.
Reported net realized gains and losses from foreign currency transactions arise from sales of portfolio securities, sales and maturities of short-term securities, sales of foreign currencies, exchange rate fluctuations between the trade and settlement dates on securities transactions, and the difference between the amounts of dividends, interest, and foreign withholding taxes recorded on the Fund’s books and the U.S. dollar equivalent of the amounts actually received or paid. Net unrealized appreciation and depreciation on the translation of assets and liabilities denominated in foreign currencies arise from changes in the values of assets and liabilities, including investments in securities at fiscal period end, resulting from changes in exchange rates.
The effect of changes in foreign currency exchange rates on investments is separately identified from the fluctuations arising from changes in market values of securities held and
55 OPPENHEIMER GLOBAL ALLOCATION FUND
| | |
| NOTES TO CONSOLIDATED FINANCIAL STATEMENTS Continued | | |
| | |
1. Significant Accounting Policies (Continued)
reported with all other foreign currency gains and losses in the Fund’s Consolidated Statement of Operations.
Allocation of Income, Expenses, Gains and Losses. Income, expenses (other than those attributable to a specific class), gains and losses are allocated on a daily basis to each class of shares based upon the relative proportion of net assets represented by such class. Operating expenses directly attributable to a specific class are charged against the operations of that class.
Federal Taxes. The Fund intends to comply with provisions of the Internal Revenue Code applicable to regulated investment companies and to distribute substantially all of its investment company taxable income, including any net realized gain on investments not offset by capital loss carryforwards, if any, to shareholders. Therefore, no federal income or excise tax provision is required. The Fund files income tax returns in U.S. federal and applicable state jurisdictions. The statute of limitations on the Fund’s tax return filings generally remain open for the three preceding fiscal reporting period ends.
Subchapter M requires, among other things, that at least 90% of the Fund’s gross income be derived from securities or derived with respect to its business of investing in securities (typically referred to as “qualifying income”). Income from commodity-linked derivatives may not be treated as “qualifying income” for purposes of the 90% gross income requirement. The Internal Revenue Service (IRS) has previously issued a number of private letter rulings which conclude that income derived from commodity index-linked notes and investments in a wholly-owned subsidiary will be “qualifying income.” As a result, the Fund will gain exposure to commodities through commodity-linked notes and its wholly-owned subsidiary.
The IRS has suspended the granting of private letter rulings pending further review. As a result, there can be no assurance that the IRS will not change its position with respect to commodity-linked notes and wholly-owned subsidiaries. In addition, future legislation and guidance from Treasury and the IRS may adversely affect the fund’s ability to gain exposure to commodities through commodity-linked notes and its wholly-owned subsidiary.
The Fund is required to include in income for federal income tax purposes all of the subsidiary’s net income and gains whether or not such income is distributed by the subsidiary. Net income and gains from the subsidiary are generally treated as ordinary income by the Fund, regardless of the character of the subsidiary’s underlying income. Net losses from the subsidiary do not pass through to the Fund for federal income tax purposes.
The tax components of capital shown in the following table represent distribution requirements the Fund must satisfy under the income tax regulations, losses the Fund may be able to offset against income and gains realized in future years and unrealized appreciation or depreciation of securities and other investments for federal income tax purposes.
56 OPPENHEIMER GLOBAL ALLOCATION FUND
1. Significant Accounting Policies (Continued)
| | | | | | | | | | | | |
| | | | | | | | | Net Unrealized | |
| | | | | | | | | Appreciation | |
| | | | | | | | | Based on cost of | |
| | | | | | | | | Securities and | |
| Undistributed | | Undistributed | | | Accumulated | | | Other Investments | |
| Net Investment | | Long-Term | | | Loss | | | for Federal Income | |
| Income | | Gain | | | Carryforward1,2,3 | | | Tax Purposes | |
| |
$10,727,696 | | | $— | | | | $734,778,384 | | | | $222,471,224 | |
1. As of October 31, 2014, the Fund had $734,778,384 of net capital loss carryforward available to offset future realized capital gains, if any, and thereby reduce future taxable gain distributions. Details of the capital loss carryforwards are included in the table below. Capital loss carryovers with no expiration, if any, must be utilized prior to those with expiration dates.
| | | | |
| Expiring | | | |
| |
2016 | | $ | 324,304,938 | |
2017 | | | 410,473,446 | |
| | | | |
Total | | $ | 734,778,384 | |
| | | | |
2. During the fiscal year ended October 31, 2014, the Fund utilized $57,021,311 of capital loss carryforward to offset capital gains realized in that fiscal year.
3. During the fiscal year ended October 31, 2013, the Fund utilized $96,482,419 of capital loss carryforward to offset capital gains realized in that fiscal year.
Net investment income (loss) and net realized gain (loss) may differ for financial statement and tax purposes. The character of dividends and distributions made during the fiscal year from net investment income or net realized gains may differ from their ultimate characterization for federal income tax purposes. Also, due to timing of dividends and distributions, the fiscal year in which amounts are distributed may differ from the fiscal year in which the income or net realized gain was recorded by the Fund.
Accordingly, the following amounts have been reclassified for October 31, 2014. Net assets of the Fund were unaffected by the reclassifications.
| | | | |
| Reduction | | Reduction | |
| to Accumulated | | to Accumulated Net | |
| Net Investment | | Realized Loss | |
| Income | | on Investments | |
| |
$7,869,501 | | | $7,869,501 | |
The tax character of distributions paid during the years ended October 31, 2014 and October 31, 2013 was as follows:
| | | | | | | | |
| | | Year Ended
October 31, 2014 | | | Year Ended
October 31, 2013 | |
| |
Distributions paid from: | | | | | | | | |
Ordinary income | | $ | 32,091,769 | | | $ | 17,521,663 | |
The aggregate cost of securities and other investments and the composition of unrealized appreciation and depreciation of securities and other investments for federal income tax purposes as of October 31, 2014 are noted in the following table. The primary difference
57 OPPENHEIMER GLOBAL ALLOCATION FUND
| | |
| NOTES TO CONSOLIDATED FINANCIAL STATEMENTS Continued | | |
| | |
1. Significant Accounting Policies (Continued)
between book and tax appreciation or depreciation of securities and other investments, if applicable, is attributable to the tax deferral of losses or tax realization of financial statement unrealized gain or loss.
| | | | |
Federal tax cost of securities | | $ | 1,406,063,611 | |
Federal tax cost of other investments | | | (12,347,970 | ) |
| | | | |
Total federal tax cost | | $ | 1,393,715,641 | |
| | | | |
Gross unrealized appreciation | | $ | 356,686,685 | |
Gross unrealized depreciation | | | (134,215,461 | ) |
| | | | |
Net unrealized appreciation | | $ | 222,471,224 | |
| | | | |
Certain foreign countries impose a tax on capital gains which is accrued by the Fund based on unrealized appreciation, if any, on affected securities. The tax is paid when the gain is realized.
Dividends and Distributions to Shareholders. Dividends and distributions to shareholders, which are determined in accordance with income tax regulations and may differ from U.S. generally accepted accounting principles, are recorded on the ex-dividend date. Income distributions, if any, are declared and paid quarterly. Capital gain distributions, if any, are declared and paid annually.
Investment Income. Dividend income is recorded on the ex-dividend date or upon ex-dividend notification in the case of certain foreign dividends where the ex-dividend date may have passed. Non-cash dividends included in dividend income, if any, are recorded at the fair market value of the securities received. Interest income is recognized on an accrual basis. Discount and premium, which are included in interest income on the Consolidated Statement of Operations, are amortized or accreted daily.
Custodian Fees. “Custodian fees and expenses” in the Consolidated Statement of Operations may include interest expense incurred by the Fund on any cash overdrafts of its custodian account during the period. Such cash overdrafts may result from the effects of failed trades in portfolio securities and from cash outflows resulting from unanticipated shareholder redemption activity. The Fund pays interest to its custodian on such cash overdrafts, to the extent they are not offset by positive cash balances maintained by the Fund, at a rate equal to the Federal Funds Rate plus 0.50%. The “Reduction to custodian expenses” line item, if applicable, represents earnings on cash balances maintained by the Fund during the period. Such interest expense and other custodian fees may be paid with these earnings.
Security Transactions. Security transactions are recorded on the trade date. Realized gains and losses on securities sold are determined on the basis of identified cost.
Indemnifications. The Fund’s organizational documents provide current and former Trustees and officers with a limited indemnification against liabilities arising in connection with the performance of their duties to the Fund. In the normal course of business, the Fund
58 OPPENHEIMER GLOBAL ALLOCATION FUND
1. Significant Accounting Policies (Continued)
may also enter into contracts that provide general indemnifications. The Fund’s maximum exposure under these arrangements is unknown as this would be dependent on future claims that may be made against the Fund. The risk of material loss from such claims is considered remote.
Other. The preparation of financial statements in conformity with accounting principles generally accepted in the United States of America requires management to make estimates and assumptions that affect the reported amounts of assets and liabilities and disclosure of contingent assets and liabilities at the date of the financial statements and the reported amounts of increases and decreases in net assets from operations during the reporting period. Actual results could differ from those estimates.
2. Securities Valuation
The Fund calculates the net asset value of its shares as of the close of the New York Stock Exchange (the “Exchange”), normally 4:00 P.M. Eastern time, on each day the Exchange is open for trading.
The Fund’s Board has adopted procedures for the valuation of the Fund’s securities and has delegated the day-to-day responsibility for valuation determinations under those procedures to the Manager. The Manager has established a Valuation Committee which is responsible for determining a “fair valuation” for any security for which market quotations are not “readily available.” The Valuation Committee’s fair valuation determinations are subject to review, approval and ratification by the Fund’s Board at its next regularly scheduled meeting covering the calendar quarter in which the fair valuation was determined.
Valuation Methods and Inputs
Securities are valued using unadjusted quoted market prices, when available, as supplied primarily by third party pricing services or dealers.
The following methodologies are used to determine the market value or the fair value of the types of securities described below:
Securities traded on a registered U.S. securities exchange (including exchange-traded derivatives other than futures and futures options) are valued based on the last sale price of the security reported on the principal exchange on which it is traded, prior to the time when the Fund’s assets are valued. In the absence of a sale, the security is valued at the last sale price on the prior trading day, if it is within the spread of the current day’s closing “bid” and “asked” prices, and if not, at the current day’s closing bid price. A security of a foreign issuer traded on a foreign exchange, but not listed on a registered U.S. securities exchange, is valued based on the last sale price on the principal exchange on which the security is traded, as identified by the third party pricing service used by the Manager, prior to the time when the Fund’s assets are valued. If the last sale price is unavailable, the security is valued at the most recent official closing price on the principal exchange on which it is traded. If the last sales price or official closing price for a foreign security is not available, the security is valued at the mean between the bid and asked price per the exchange or, if not available from the exchange, obtained from two dealers. If bid and asked prices are not available from either the
59 OPPENHEIMER GLOBAL ALLOCATION FUND
| | |
| NOTES TO CONSOLIDATED FINANCIAL STATEMENTS Continued | | |
| | |
2. Securities Valuation (Continued)
exchange or two dealers, the security is valued by using one of the following methodologies (listed in order of priority): (1) using a bid from the exchange, (2) the mean between the bid and asked price as provided by a single dealer, or (3) a bid from a single dealer.
Shares of a registered investment company that are not traded on an exchange are valued at that investment company’s net asset value per share.
Corporate and government debt securities (of U.S. or foreign issuers) and municipal debt securities, event—linked bonds, loans, mortgage-backed securities, collateralized mortgage obligations, and asset-backed securities are valued at the mean between the “bid” and “asked” prices utilizing evaluated prices obtained from third party pricing services or broker-dealers who may use matrix pricing methods to determine the evaluated prices.
Short-term money market type debt securities with a remaining maturity of sixty days or less are valued at cost adjusted by the amortization of discount or premium to maturity (amortized cost), which approximates market value. Short-term debt securities with a remaining maturity in excess of sixty days are valued at the mean between the “bid” and “asked” prices utilizing evaluated prices obtained from third party pricing services or broker-dealers.
Forward foreign currency exchange contracts are valued utilizing current and forward currency rates obtained from third party pricing services. When the settlement date of a contract is an interim date for which a quotation is not available, interpolated values are derived using the nearest dated forward currency rate.
Futures contracts and futures options traded on a commodities or futures exchange will be valued at the final settlement price or official closing price on the principal exchange as reported by such principal exchange at its trading session ending at, or most recently prior to, the time when the Fund’s assets are valued.
A description of the standard inputs that may generally be considered by the third party pricing vendors in determining their evaluated prices is provided below.
| | |
Security Type | | Standard inputs generally considered by third-party pricing vendors |
| Corporate debt, government debt, municipal, mortgage- backed and asset-backed securities | | Reported trade data, broker-dealer price quotations, benchmark yields, issuer spreads on comparable securities, the credit quality, yield, maturity, and other appropriate factors. |
Loans | | Information obtained from market participants regarding reported trade data and broker-dealer price quotations. |
Event-linked bonds | | Information obtained from market participants regarding reported trade data and broker-dealer price quotations. |
If a market value or price cannot be determined for a security using the methodologies described above, or if, in the “good faith” opinion of the Manager, the market value or price obtained does not constitute a “readily available market quotation,” or a significant event has occurred that would materially affect the value of the security the security is fair valued either (i) by a standardized fair valuation methodology applicable to the security type or the significant event as previously approved by the Valuation Committee and the Fund’s Board or (ii) as determined in good faith by the Manager’s Valuation Committee. The Valuation Committee considers all relevant facts that are reasonably available, through either public
60 OPPENHEIMER GLOBAL ALLOCATION FUND
2. Securities Valuation (Continued)
information or information available to the Manager, when determining the fair value of a security. Fair value determinations by the Manager are subject to review, approval and ratification by the Fund’s Board at its next regularly scheduled meeting covering the calendar quarter in which the fair valuation was determined. Those fair valuation standardized methodologies include, but are not limited to, valuing securities at the last sale price or initially at cost and subsequently adjusting the value based on: changes in company specific fundamentals, changes in an appropriate securities index, or changes in the value of similar securities which may be further adjusted for any discounts related to security-specific resale restrictions. When possible, such methodologies use observable market inputs such as unadjusted quoted prices of similar securities, observable interest rates, currency rates and yield curves. The methodologies used for valuing securities are not necessarily an indication of the risks associated with investing in those securities nor can it be assured that the Fund can obtain the fair value assigned to a security if it were to sell the security.
To assess the continuing appropriateness of security valuations, the Manager, or its third party service provider who is subject to oversight by the Manager, regularly compares prior day prices, prices on comparable securities, and sale prices to the current day prices and challenges those prices exceeding certain tolerance levels with the third party pricing service or broker source. For those securities valued by fair valuations, whether through a standardized fair valuation methodology or a fair valuation determination, the Valuation Committee reviews and affirms the reasonableness of the valuations based on such methodologies and fair valuation determinations on a regular basis after considering all relevant information that is reasonably available.
Classifications
Each investment asset or liability of the Fund is assigned a level at measurement date based on the significance and source of the inputs to its valuation. Various data inputs are used in determining the value of each of the Fund’s investments as of the reporting period end. These data inputs are categorized in the following hierarchy under applicable financial accounting standards:
1) Level 1-unadjusted quoted prices in active markets for identical assets or liabilities (including securities actively traded on a securities exchange)
2) Level 2-inputs other than unadjusted quoted prices that are observable for the asset or liability (such as unadjusted quoted prices for similar assets and market corroborated inputs such as interest rates, prepayment speeds, credit risks, etc.)
3) Level 3-significant unobservable inputs (including the Manager’s own judgments about assumptions that market participants would use in pricing the asset or liability).
The inputs used for valuing securities are not necessarily an indication of the risks associated with investing in those securities.
61 OPPENHEIMER GLOBAL ALLOCATION FUND
| | |
| NOTES TO CONSOLIDATED FINANCIAL STATEMENTS Continued | | |
| | |
2. Securities Valuation (Continued)
The table below categorizes amounts that are included in the Fund’s Consolidated Statement of Assets and Liabilities as of October 31, 2014 based on valuation input level:
| | | | | | | | | | | | | | | | |
| | | Level 1—
Unadjusted
Quoted Prices | | | Level 2—
Other Significant
Observable Inputs | | | Level 3—
Significant
Unobservable
Inputs | | | Value | |
Assets Table | | | | | | | | | | | | | | | | |
Investments, at Value: | | | | | | | | | | | | | | | | |
Common Stocks | | | | | | | | | | | | | | | | |
Consumer Discretionary | | $ | 110,670,311 | | | $ | 65,023,654 | | | $ | — | | | $ | 175,693,965 | |
Consumer Staples | | | 62,304,796 | | | | 37,845,400 | | | | — | | | | 100,150,196 | |
Energy | | | 40,348,775 | | | | 17,590,960 | | | | — | | | | 57,939,735 | |
Financials | | | 120,111,303 | | | | 72,181,673 | | | | 4 | | | | 192,292,980 | |
Health Care | | | 154,619,050 | | | | 33,769,660 | | | | — | | | | 188,388,710 | |
Industrials | | | 82,087,039 | | | | 63,392,088 | | | | — | | | | 145,479,127 | |
Information Technology | | | 183,986,301 | | | | 66,179,483 | | | | �� | | | | 250,165,784 | |
Materials | | | 14,989,237 | | | | 16,034,645 | | | | 352 | | | | 31,024,234 | |
Telecommunication Services | | | 8,134,484 | | | | 14,112,226 | | | | — | | | | 22,246,710 | |
Utilities | | | 6,170,754 | | | | 105,782 | | | | — | | | | 6,276,536 | |
Preferred Stocks | | | 7,155,923 | | | | 7,716,574 | | | | — | | | | 14,872,497 | |
Rights, Warrants and Certificates | | | 173,179 | | | | — | | | | — | | | | 173,179 | |
Non-Convertible Corporate Bonds and Notes | | | — | | | | 128,898,594 | | | | 40 | | | | 128,898,634 | |
Corporate Loans | | | — | | | | 16,424,064 | | | | 1,631 | | | | 16,425,695 | |
Exchange-Traded Options Purchased | | | 3,239,500 | | | | 5,530,000 | | | | — | | | | 8,769,500 | |
Investment Companies | | | — | | | | 297,133,288 | | | | — | | | | 297,133,288 | |
| | | | |
Total Investments, at Value | | | 793,990,652 | | | | 841,938,091 | | | | 2,027 | | | | 1,635,930,770 | |
Other Financial Instruments: | | | | | | | | | | | | | | | | |
Futures contracts | | | 10,142,286 | | | | — | | | | — | | | | 10,142,286 | |
Foreign currency exchange contracts | | | — | | | | 11,914 | | | | — | | | | 11,914 | |
| | | | |
Total Assets | | $ | 804,132,938 | | | $ | 841,950,005 | | | $ | 2,027 | | | $ | 1,646,084,970 | |
| | | | |
| | | | |
Liabilities Table | | | | | | | | | | | | | | | | |
Other Financial Instruments: | | | | | | | | | | | | | | | | |
Options written, at value | | $ | — | | | $ | (600,000 | ) | | $ | — | | | $ | (600,000 | ) |
Futures contracts | | | (29,290,380 | ) | | | — | | | | — | | | | (29,290,380 | ) |
| | | | |
Total Liabilities | | $ | (29,290,380 | ) | | $ | (600,000 | ) | | $ | — | | | $ | (29,890,380 | ) |
| | | | |
Forward currency exchange contracts and futures contracts, if any, are reported at their unrealized appreciation/depreciation at measurement date, which represents the change in the contract’s value from trade date. All additional assets and liabilities included in the above table are reported at their market value at measurement date.
62 OPPENHEIMER GLOBAL ALLOCATION FUND
2. Securities Valuation (Continued)
The table below shows the transfers between Level 1, Level 2 and Level 3. The Fund’s policy is to recognize transfers in and transfers out as of the beginning of the reporting period.
| | | | | | | | | | | | | | | | | | | | |
| | | Transfers
out
of Level 1 | | | Transfers
into Level 1 | | | Transfers
out
of Level 2 | | | Transfers
into
Level 2 | | | Transfers
into
Level 3 | |
Assets Table | | | | | | | | | | | | | | | | | | | | |
Investments, at Value: | | | | | | | | | | | | | | | | | | | | |
Common Stocks | | | | | | | | | | | | | | | | | | | | |
Consumer Discretionary | | $ | — | | | $ | 4,541,055 | a | | $ | (4,541,055 | )a | | $ | — | | | $ | — | |
Consumer Staples | | | — | | | | 8,838,668 | a | | | (8,838,668 | )a | | | — | | | | — | |
Financials | | | (2,042,409 | )b | | | 8,340,646 | a | | | (8,340,646 | )a | | | 2,042,40 | 9b | | | — | |
Health Care | | | — | | | | 528,234 | a | | | (528,234 | )a | | | — | | | | — | |
Industrials | | | — | | | | 1,442,905 | a | | | (1,442,905 | )a | | | — | | | | — | |
Corporate Loans | | | — | | | | — | | | | (289,618 | )c | | | — | | | | 289,618 | c |
| | | | |
Total Assets | | $ | (2,042,409 | ) | | $ | 23,691,508 | | | $ | (23,981,126 | ) | | $ | 2,042,409 | | | $ | 289,618 | |
| | | | |
a. Transferred from Level 2 to Level 1 due to the presence of a readily available unadjusted quoted market price.
b. Transferred from Level 1 to Level 2 due to the absence of a readily available unadjusted quoted market price.
c. Transferred from Level 2 to Level 3 because of the lack of observable market data due to a decrease in market activity for these securities.
3. Shares of Beneficial Interest
The Fund has authorized an unlimited number of $0.01 par value shares of beneficial interest of each class. Transactions in shares of beneficial interest were as follows:
| | | | | | | | | | | | | | | | |
| | | Year Ended October 31, 2014 | | | Year Ended October 31, 2013 | |
| | | Shares | | | Amount | | | Shares | | | Amount | |
Class A | | | | | | | | | | | | | | | | |
Sold | | | 4,725,514 | | | $ | 81,989,635 | | | | 5,284,040 | | | $ | 84,264,351 | |
Dividends and/or distributions reinvested | | | 1,361,783 | | | | 23,274,224 | | | | 856,406 | | | | 13,475,276 | |
Redeemed | | | (11,997,612 | ) | | | (208,095,711 | ) | | | (14,903,832 | ) | | | (236,429,212 | ) |
| | | | |
Net decrease | | | (5,910,315 | ) | | $ | (102,831,852 | ) | | | (8,763,386 | ) | | $ | (138,689,585 | ) |
| | | | |
| | | | |
| | | | | | | | | | | | | | | | | |
Class B | | | | | | | | | | | | | | | | |
Sold | | | 64,944 | | | $ | 1,090,813 | | | | 49,266 | | | $ | 780,124 | |
Dividends and/or distributions reinvested | | | 65,832 | | | | 1,089,088 | | | | 27,521 | | | | 412,759 | |
Redeemed | | | (1,812,134 | ) | | | (30,522,431 | ) | | | (2,199,862 | ) | | | (33,817,010 | ) |
| | | | |
Net decrease | | | (1,681,358 | ) | | $ | (28,342,530 | ) | | | (2,123,075 | ) | | $ | (32,624,127 | ) |
| | | | |
| | | | |
| | | | | | | | | | | | | | | | | |
Class C | | | | | | | | | | | | | | | | |
Sold | | | 1,181,122 | | | $ | 19,864,976 | | | | 1,277,126 | | | $ | 19,804,767 | |
Dividends and/or distributions reinvested | | | 219,806 | | | | 3,642,988 | | | | 86,185 | | | | 1,301,190 | |
Redeemed | | | (2,616,808 | ) | | | (44,059,338 | ) | | | (3,284,095 | ) | | | (50,762,078 | ) |
| | | | |
Net decrease | | | (1,215,880 | ) | | $ | (20,551,374 | ) | | | (1,920,784 | ) | | $ | (29,656,121 | ) |
| | | | |
63 OPPENHEIMER GLOBAL ALLOCATION FUND
| | |
| NOTES TO CONSOLIDATED FINANCIAL STATEMENTS Continued | | |
| | |
3. Shares of Beneficial Interest (Continued)
| | | | | | | | | | | | | | | | |
| | | Year Ended October 31, 2014 | | | Year Ended October 31, 2013 | |
| | | Shares | | | Amount | | | Shares | | | Amount | |
Class I | | | | | | | | | | | | | | | | |
Sold | | | 151,132 | | | $ | 2,581,973 | | | | 58,815 | | | $ | 956,098 | |
Dividends and/or distributions reinvested | | | 1,121 | | | | 19,184 | | | | 133 | | | | 2,230 | |
Redeemed | | | (23,126 | ) | | | (400,557 | ) | | | (14,689 | ) | | | (240,344 | ) |
| | | | |
Net increase | | | 129,127 | | | $ | 2,200,600 | | | | 44,259 | | | $ | 717,984 | |
| | | | |
| | | | |
| | | | | | | | | | | | | | | | | |
Class R1 | | | | | | | | | | | | | | | | |
Sold | | | 279,679 | | | $ | 4,768,684 | | | | 346,258 | | | $ | 5,427,902 | |
Dividends and/or distributions reinvested | | | 41,128 | | | | 691,463 | | | | 24,106 | | | | 371,919 | |
Redeemed | | | (587,624 | ) | | | (10,023,450 | ) | | | (888,780 | ) | | | (13,921,121 | ) |
| | | | |
Net decrease | | | (266,817 | ) | | $ | (4,563,303 | ) | | | (518,416 | ) | | $ | (8,121,300 | ) |
| | | | |
| | | | |
| | | | | | | | | | | | | | | | | |
Class Y | | | | | | | | | | | | | | | | |
Sold | | | 566,540 | | | $ | 9,836,794 | | | | 401,300 | | | $ | 6,467,550 | |
Dividends and/or distributions reinvested | | | 45,107 | | | | 771,596 | | | | 28,910 | | | | 456,453 | |
Redeemed | | | (436,944 | ) | | | (7,571,308 | ) | | | (446,374 | ) | | | (7,064,411 | ) |
| | | | |
Net increase (decrease) | | | 174,703 | | | $ | 3,037,082 | | | | (16,164 | ) | | $ | (140,408 | ) |
| | | | |
1. Effective July 1, 2014, Class N shares were renamed Class R.
4. Purchases and Sales of Securities
The aggregate cost of purchases and proceeds from sales of securities, other than short-term obligations and investments in IMMF, for the year ended October 31, 2014 were as follows:
| | | | | | | | |
| | | Purchases | | | Sales | |
Investment securities | | $ | 733,948,881 | | | $ | 928,726,447 | |
5. Fees and Other Transactions with Affiliates
Management Fees. Under the investment advisory agreement, the Fund pays the Manager a management fee based on the daily net assets of the Fund at an annual rate as shown in the following table:
| | | | |
| Fee Schedule | | | |
Up to $1.0 billion | | | 0.80% | |
Next $2.0 billion | | | 0.76 | |
Next $1.0 billion | | | 0.71 | |
Next $1.0 billion | | | 0.66 | |
Next $1.0 billion | | | 0.60 | |
Next $1.0 billion | | | 0.55 | |
Next $2.0 billion | | | 0.50 | |
Over $9.0 billion | | | 0.48 | |
64 OPPENHEIMER GLOBAL ALLOCATION FUND
5. Fees and Other Transactions with Affiliates (Continued)
The Fund’s management fee for the fiscal year ended October 31, 2014 was 0.79% of average annual net assets before any applicable waivers.
Sub-Adviser Fees. The Manager has retained the Sub-Adviser to provide the day-to-day portfolio management of the Fund. Under the Sub-Advisory Agreement, the Manager pays the Sub-Adviser an annual fee in monthly installments, equal to a percentage of the investment management fee collected by the Manager from the Fund, which shall be calculated after any investment management fee waivers. The fee paid to the Sub-Adviser is paid by the Manager, not by the Fund.
Transfer Agent Fees. OFI Global (the “Transfer Agent”) serves as the transfer and shareholder servicing agent for the Fund. The Fund pays the Transfer Agent a fee based on annual net assets. Fees incurred and average net assets for each class with respect to these services are detailed in the Consolidated Statement of Operations and Financial Highlights, respectively.
Sub-Transfer Agent Fees. The Transfer Agent has retained Shareholder Services, Inc., a wholly-owned subsidiary of OFI (the “Sub-Transfer Agent”), to provide the day-to-day transfer agent and shareholder servicing of the Fund. Under the Sub-Transfer Agency Agreement, the Transfer Agent pays the Sub-Transfer Agent an annual fee in monthly installments, equal to a percentage of the transfer agent fee collected by the Transfer Agent from the Fund, which shall be calculated after any applicable fee waivers. The fee paid to the Sub-Transfer Agent is paid by the Transfer Agent, not by the Fund.
Trustees’ Compensation. The Fund has adopted an unfunded retirement plan (the “Plan”) for the Fund’s Independent Trustees. Benefits are based on years of service and fees paid to each Trustee during their period of service. The Plan was frozen with respect to adding new participants effective December 31, 2006 (the “Freeze Date”) and existing Plan Participants as of the Freeze Date will continue to receive accrued benefits under the Plan. Active Independent Trustees as of the Freeze Date have each elected a distribution method with respect to their benefits under the Plan. During the year ended October 31, 2014, the Fund’s projected benefit obligations, payments to retired Trustees and accumulated liability were as follows:
| | | | |
Projected Benefit Obligations Increased | | $ | 12,107 | |
Payments Made to Retired Trustees | | | 97,659 | |
Accumulated Liability as of October 31, 2014 | | | 584,585 | |
The Fund’s Board of Trustees (“Board”) has adopted a compensation deferral plan for Independent Trustees that enables Trustees to elect to defer receipt of all or a portion of the annual compensation they are entitled to receive from the Fund. For purposes of determining the amount owed to the Trustee under the plan, deferred amounts are treated as though equal dollar amounts had been invested in shares of the Fund or in other Oppenheimer funds
65 OPPENHEIMER GLOBAL ALLOCATION FUND
| | |
| NOTES TO CONSOLIDATED FINANCIAL STATEMENTS Continued | | |
| | |
5. Fees and Other Transactions with Affiliates (Continued)
selected by the Trustee. The Fund purchases shares of the funds selected for deferral by the Trustee in amounts equal to his or her deemed investment, resulting in a Fund asset equal to the deferred compensation liability. Such assets are included as a component of “Other” within the asset section of the Consolidated Statement of Assets and Liabilities. Deferral of Trustees’ fees under the plan will not affect the net assets of the Fund and will not materially affect the Fund’s assets, liabilities or net investment income per share. Amounts will be deferred until distributed in accordance with the compensation deferral plan.
Distribution and Service Plan (12b-1) Fees. Under its General Distributor’s Agreement with the Fund, OppenheimerFunds Distributor, Inc. (the “Distributor”) acts as the Fund’s principal underwriter in the continuous public offering of the Fund’s classes of shares.
Distribution and Service Plan for Class A Shares. The Fund has adopted a Distribution and Service Plan (the “Plan”) for Class A shares pursuant to Rule 12b-1 under the 1940 Act. Under the Plan, the Fund pays a service fee to the Distributor at an annual rate of 0.25% of the daily net assets of Class A shares. The Distributor currently uses all of those fees to pay dealers, brokers, banks and other financial institutions periodically for providing personal services and maintenance of accounts of their customers that hold Class A shares. Under the Plan, the Fund may also pay an asset-based sales charge to the Distributor. However, the Fund’s Board has currently set the rate at zero. Fees incurred by the Fund under the Plan are detailed in the Consolidated Statement of Operations.
Distribution and Service Plans for Class B, Class C and Class R Shares. The Fund has adopted Distribution and Service Plans (the “Plans”) for Class B, Class C and Class R shares pursuant to Rule 12b-1 under the 1940 Act to compensate the Distributor for distributing those share classes, maintaining accounts and providing shareholder services. Under the Plans, the Fund pays the Distributor an annual asset-based sales charge of 0.75% on Class B and Class C shares daily net assets and 0.25% on Class R shares daily net assets. The Fund also pays a service fee under the Plans at an annual rate of 0.25% of daily net assets. The Plans continue in effect from year to year only if the Fund’s Board of Trustees vote annually to approve its continuance at an in person meeting called for that purpose. Fees incurred by the Fund under the Plans are detailed in the Consolidated Statement of Operations.
Sales Charges. Front-end sales charges and CDSC do not represent expenses of the Fund. They are deducted from the proceeds of sales of Fund shares prior to investment or from redemption proceeds prior to remittance, as applicable. The sales charges retained by the Distributor from the sale of shares and the CDSC retained by the Distributor on the redemption of shares is shown in the following table for the period indicated.
66 OPPENHEIMER GLOBAL ALLOCATION FUND
5. Fees and Other Transactions with Affiliates (Continued)
| | | | | | | | | | | | | | | | | | | | |
| Year Ended | | Class A Front-End Sales Charges Retained by Distributor | | | Class A Contingent Deferred Sales
Charges
Retained by
Distributor | | | Class B Contingent Deferred Sales Charges Retained by Distributor | | | Class C Contingent Deferred Sales
Charges Retained by Distributor | | | Class R Contingent Deferred Sales Charges Retained by Distributor | |
October 31, 2014 | | | $282,847 | | | | $1,191 | | | | $73,729 | | | | $13,430 | | | | $876 | |
Waivers and Reimbursements of Expenses. The Manager has contractually agreed to waive the management fee it receives from the Fund in an amount equal to the management fee it receives from the Subsidiary. This undertaking will continue in effect for so long as the Fund invests in the Subsidiary and may not be terminated unless approved by the Fund’s Board of Trustees. During the year ended October 31, 2014, the Manager waived $118,876.
The Manager will waive fees and/or reimburse Fund expenses in an amount equal to the indirect management fees incurred through the Fund’s investments in IMMF, Oppenheimer Ultra Short Duration Fund and Master Funds. During the year ended October 31, 2014, the Manager waived fees and/or reimbursed the Fund $1,143,811 for management fees.
The Transfer Agent has contractually agreed to limit transfer and shareholder servicing agent fees for Classes B, C, R and Y shares to 0.35% of average annual net assets per class and for Class A shares to 0.30% of average annual net assets of the class. The limit was removed on February 28, 2014.
During the year ended October 31, 2014, the Transfer Agent waived transfer and shareholder servicing agent fees as follows:
| | | | |
Class A | | $ | 8,663 | |
Class B | | | 36,062 | |
Class C | | | 1,545 | |
Class R | | | 508 | |
Class Y | | | 1,165 | |
These undertakings may be modified or terminated as set forth according to the terms in the prospectus.
6. Risk Exposures and the Use of Derivative Instruments
The Fund’s investment objective not only permits the Fund to purchase investment securities, it also allows the Fund to enter into various types of derivatives contracts, including, but not limited to, futures contracts, forward currency exchange contracts, credit default swaps, interest rate swaps, total return swaps, variance swaps and purchased and written options. In doing so, the Fund will employ strategies in differing combinations to permit it to increase, decrease, or change the level or types of exposure to market risk factors. These instruments may allow the Fund to pursue its objectives more quickly and efficiently than if it were to make direct purchases or sales of securities capable of effecting a similar response to market factors. Such contracts may be entered into through a bilateral over-the-counter (“OTC”) transaction, or through a securities or futures exchange and cleared through a clearinghouse.
67 OPPENHEIMER GLOBAL ALLOCATION FUND
| | |
| NOTES TO CONSOLIDATED FINANCIAL STATEMENTS Continued | | |
| | |
6. Risk Exposures and the Use of Derivative Instruments (Continued)
Market Risk Factors. In accordance with its investment objectives, the Fund may use derivatives to increase or decrease its exposure to one or more of the following market risk factors:
Commodity Risk. Commodity risk relates to the change in value of commodities or commodity indexes as they relate to increases or decreases in the commodities market. Commodities are physical assets that have tangible properties. Examples of these types of assets are crude oil, heating oil, metals, livestock, and agricultural products.
Credit Risk. Credit risk relates to the ability of the issuer to meet interest and principal payments, or both, as they come due. In general, lower-grade, higher-yield bonds are subject to credit risk to a greater extent than lower-yield, higher-quality bonds.
Equity Risk. Equity risk relates to the change in value of equity securities as they relate to increases or decreases in the general market.
Foreign Exchange Rate Risk. Foreign exchange rate risk relates to the change in the U.S. dollar value of a security held that is denominated in a foreign currency. The U.S. dollar value of a foreign currency denominated security will decrease as the dollar appreciates against the currency, while the U.S. dollar value will increase as the dollar depreciates against the currency.
Interest Rate Risk. Interest rate risk refers to the fluctuations in value of fixed-income securities resulting from the inverse relationship between price and yield. For example, an increase in general interest rates will tend to reduce the market value of already issued fixed-income investments, and a decline in general interest rates will tend to increase their value. In addition, debt securities with longer maturities, which tend to have higher yields, are subject to potentially greater fluctuations in value from changes in interest rates than obligations with shorter maturities.
Volatility Risk. Volatility risk refers to the magnitude of the movement, but not the direction of the movement, in a financial instrument’s price over a defined time period. Large increases or decreases in a financial instrument’s price over a relative time period typically indicate greater volatility risk, while small increases or decreases in its price typically indicate lower volatility risk.
Derivatives may have little or no initial cash investment relative to their market value exposure and therefore can produce significant gains or losses in excess of their cost due to unanticipated changes in the market risk factors and the overall market. This use of embedded leverage allows the Fund to increase its market value exposure relative to its net assets and can substantially increase the volatility of the Fund’s performance. In instances where the Fund is using derivatives to decrease, or hedge, exposures to market risk factors for securities held by the Fund, there are also risks that those derivatives may not perform as expected resulting in losses for the combined or hedged positions. Some derivatives have the potential for unlimited loss, regardless of the size of the Fund’s initial investment.
Additional associated risks from investing in derivatives also exist and potentially could have significant effects on the valuation of the derivative and the Fund. Typically, the associated risks are not the risks that the Fund is attempting to increase or decrease exposure to, per its investment objectives, but are the additional risks from investing in derivatives.
68 OPPENHEIMER GLOBAL ALLOCATION FUND
6. Risk Exposures and the Use of Derivative Instruments (Continued)
Examples of these associated risks are liquidity risk, which is the risk that the Fund will not be able to sell the derivative in the open market in a timely manner, and counterparty credit risk, which is the risk that the counterparty will not fulfill its obligation to the Fund.
The Fund’s actual exposures to these market risk factors and associated risks during the period are discussed in further detail, by derivative type, below.
Forward Currency Exchange Contracts
The Fund may enter into forward currency exchange contracts (“forward contracts”) for the purchase or sale of a foreign currency at a negotiated rate at a future date. Such contracts are traded in the OTC inter-bank currency dealer market.
Forward contracts are reported on a schedule following the Consolidated Statement of Investments. The unrealized appreciation (depreciation) is reported in the Consolidated Statement of Assets and Liabilities as a receivable (or payable) and in the Consolidated Statement of Operations within the change in unrealized appreciation (depreciation). At contract close, the difference between the original cost of the contract and the value at the close date is recorded as a realized gain (loss) in the Consolidated Statement of Operations.
The Fund has entered into forward contracts with the obligation to sell specified foreign currencies in the future at a currently negotiated forward rate in order to decrease exposure to foreign exchange rate risk associated with foreign currency denominated securities held by the Fund.
During the year ended October 31, 2014, the Fund had daily average contract amounts on forward contracts to sell of $76,957.
Additional associated risk to the Fund includes counterparty credit risk. Counterparty credit risk arises from the possibility that the counterparty to a forward contract will default and fail to perform its obligations to the Fund.
Futures Contracts
A futures contract is a commitment to buy or sell a specific amount of a commodity, financial instrument or currency at a negotiated price on a stipulated future date. The Fund may buy and sell futures contracts and may also buy or write put or call options on these futures contracts. Futures contracts and options thereon are generally entered into on a regulated futures exchange and cleared through a clearinghouse associated with the exchange.
Upon entering into a futures contract, the Fund is required to deposit either cash or securities (initial margin) in an amount equal to a certain percentage of the contract value in an account registered in the futures commission merchant’s name. Subsequent payments (variation margin) are paid to or from the futures commission merchant each day equal to the daily changes in the contract value. Such payments are recorded as unrealized gains and losses. Should the Fund fail to make requested variation margin payments, the futures commission merchant can gain access to the initial margin to satisfy the Fund’s payment obligations.
Futures contracts are reported on a schedule following the Consolidated Statement of Investments. Securities held by a futures commission merchant to cover initial margin requirements on open futures contracts are noted in the Consolidated Statement of
69 OPPENHEIMER GLOBAL ALLOCATION FUND
| | |
| NOTES TO CONSOLIDATED FINANCIAL STATEMENTS Continued | | |
| | |
6. Risk Exposures and the Use of Derivative Instruments (Continued)
Investments. Cash held by a futures commission merchant to cover initial margin requirements on open futures contracts and the receivable and/or payable for the daily mark to market for the variation margin are noted in the Consolidated Statement of Assets and Liabilities. The net change in unrealized appreciation and depreciation is reported in the Consolidated Statement of Operations. Realized gains (losses) are reported in the Consolidated Statement of Operations at the closing or expiration of futures contracts.
The Fund has purchased futures contracts on various bonds and notes to increase exposure to interest rate risk.
The Fund has sold futures contracts on various bonds and notes to decrease exposure to interest rate risk.
The Fund has purchased futures contracts on various equity indexes to increase exposure to equity risk.
The Fund has sold futures contracts on various equity indexes to decrease exposure to equity risk.
The Fund has purchased futures contracts, which have values that are linked to the price movement of the related volatility indexes, in order to increase exposure to volatility risk.
The Fund has sold futures contracts, which have values that are linked to the price movement of the related volatility indexes, in order to decrease exposure to volatility risk.
During the year ended October 31, 2014, the Fund had an ending monthly average market value of $243,683,252 and $155,035,685 on futures contracts purchased and sold, respectively.
Additional associated risks of entering into futures contracts (and related options) include the possibility that there may be an illiquid market where the Fund is unable to liquidate the contract or enter into an offsetting position and, if used for hedging purposes, the risk that the price of the contract will correlate imperfectly with the prices of the Fund’s securities.
Option Activity
The Fund may buy and sell put and call options, or write put and call options. When an option is written, the Fund receives a premium and becomes obligated to sell or purchase the underlying security, currency or other underlying financial instrument at a fixed price, upon exercise of the option.
Options can be traded through an exchange or through a privately negotiated arrangement with a dealer in an OTC transaction. Options traded through an exchange are generally cleared through a clearinghouse (such as The Options Clearing Corporation). The difference between the premium received or paid, and market value of the option, is recorded as unrealized appreciation or depreciation. The net change in unrealized appreciation or depreciation is reported in the Consolidated Statement of Operations. When an option is exercised, the cost of the security purchased or the proceeds of the security sale are adjusted by the amount of premium received or paid. Upon the expiration or closing of the option transaction, a gain or loss is reported in the Consolidated Statement of Operations.
The Fund has purchased call options on treasury and/or euro futures to increase exposure to interest rate risk. A purchased call option becomes more valuable as the price of the underlying financial instrument appreciates relative to the strike price.
70 OPPENHEIMER GLOBAL ALLOCATION FUND
6. Risk Exposures and the Use of Derivative Instruments (Continued)
The Fund has purchased call options on individual equity securities and/or equity indexes to increase exposure to equity risk. A purchased call option becomes more valuable as the price of the underlying financial instrument appreciates relative to the strike price.
The Fund has purchased put options on individual equity securities and/or equity indexes to decrease exposure to equity risk. A purchased put option becomes more valuable as the price of the underlying financial instrument depreciates relative to the strike price.
The Fund has purchased call options on volatility indexes to increase exposure to volatility risk. A purchased call option becomes more valuable as the level of the underlying volatility index increases relative to the strike price.
The Fund has purchased put options on volatility indexes to decrease exposure to volatility risk. A purchased put option becomes more valuable as the level of the underlying volatility index decreases relative to the strike price.
During the year ended October 31, 2014, the Fund had an ending monthly average market value of $11,546,324 and $3,973,601 on purchased call options and purchased put options, respectively.
Options written, if any, are reported in a schedule following the Consolidated Statement of Investments and as a liability in the Consolidated Statement of Assets and Liabilities. Securities held in collateral accounts to cover potential obligations with respect to outstanding written options are noted in the Consolidated Statement of Investments.
The risk in writing a call option is that the market price of the security increases and if the option is exercised, the Fund must either purchase the security at a higher price for delivery or, if the Fund owns the underlying security, give up the opportunity for profit. The risk in writing a put option is that the Fund may incur a loss if the market price of the security decreases and the option is exercised. The risk in buying an option is that the Fund pays a premium whether or not the option is exercised. The Fund also has the additional risk that there may be an illiquid market where the Fund is unable to close the contract.
The Fund has written put options on individual equity securities and/or equity indexes to increase exposure to equity risk. A written put option becomes more valuable as the price of the underlying financial instrument appreciates relative to the strike price.
The Fund has written call options on individual equity securities and/or equity indexes to decrease exposure to equity risk. A written call option becomes more valuable as the price of the underlying financial instrument depreciates relative to the strike price.
The Fund has written call options on volatility indexes to decrease exposure to volatility risk. A written call option becomes more valuable as the level of the underlying volatility index decreases relative to the strike price.
The Fund has written put options on volatility indexes to increase exposure to volatility risk. A written put option becomes more valuable as the level of the underlying volatility index increases relative to the strike price.
During the year ended October 31, 2014, the Fund had an ending monthly average market value of $1,620,000 and $2,533,404 on written call options and written put options, respectively.
Additional associated risks to the Fund include counterparty credit risk and liquidity risk.
71 OPPENHEIMER GLOBAL ALLOCATION FUND
| | |
| NOTES TO CONSOLIDATED FINANCIAL STATEMENTS Continued | | |
| | |
6. Risk Exposures and the Use of Derivative Instruments (Continued)
Written option activity for the year ended October 31, 2014 was as follows:
| | | | | | | | | | | | | | | | |
| | | Call Options | | | Put Options | |
| | | Number of
Contracts | | | Amount of
Premiums | | | Number of
Contracts | | | Amount of
Premiums | |
| Options outstanding as of October 31, 2013 | | | 115,000 | | | $ | 10,998,142 | | | | 4,000 | | | $ | 10,667,858 | |
Options written | | | 540,000 | | | | 22,478,729 | | | | 91,100 | | | | 21,492,719 | |
Options closed or expired | | | (315,000 | ) | | | (18,739,945 | ) | | | (12,850 | ) | | | (9,955,604 | ) |
Options exercised | | | (340,000 | ) | | | (14,736,926 | ) | | | (81,250 | ) | | | (21,208,011 | ) |
| | | | |
| Options outstanding as of October 31, 2014 | | | – | | | $ | – | | | | 1,000 | | | $ | 996,962 | |
| | | | |
Swap Contracts
The Fund may enter into swap contract agreements with a counterparty to exchange a series of cash flows based on either specified reference rates, the price or volatility of asset or non-asset references, or the occurrence of a credit event, over a specified period. Swaps can be executed in a bi-lateral privately negotiated arrangement with a dealer in an OTC transaction (“OTC swaps”) or executed on a regulated market. Certain swaps, regardless of the venue of their execution, are required to be cleared through a clearinghouse (“centrally cleared swaps”). Swap contracts may include interest rate, equity, debt, index, total return, credit default, currency, and volatility swaps.
Swap contracts are reported on a schedule following the Consolidated Statement of Investments. The values of centrally cleared swap and OTC swap contracts are aggregated by positive and negative values and disclosed separately on the Consolidated Statement of Assets and Liabilities. The unrealized appreciation (depreciation) related to the change in the valuation of the notional amount of the swap is combined with the accrued interest due to (owed by) the Fund, if any, at termination or settlement. The net change in this amount during the period is included on the Consolidated Statement of Operations. The Fund also records any periodic payments received from (paid to) the counterparty, including at termination, under such contracts as realized gain (loss) on the Consolidated Statement of Operations.
Swap contract agreements are exposed to the market risk factor of the specific underlying reference rate or asset. Swap contracts are typically more attractively priced compared to similar investments in related cash securities because they isolate the risk to one market risk factor and eliminate the other market risk factors. Investments in cash securities (for instance bonds) have exposure to multiple risk factors (credit and interest rate risk). Because swaps have embedded leverage, they can expose the Fund to substantial risk in the isolated market risk factor.
Volatility Swap Contracts. A volatility swap is an agreement between counterparties to exchange periodic payments based on the measured volatility of a reference security, index, currency or other reference investment over a specified time frame. One cash flow is typically based on the realized volatility of the reference investment as measured by changes in its price or level over the specified time period while the other cash flow is based on a specified rate representing expected volatility for the reference investment at
72 OPPENHEIMER GLOBAL ALLOCATION FUND
6. Risk Exposures and the Use of Derivative Instruments (Continued)
the time the swap is executed, or the measured volatility of a different reference investment over the specified time period. The appreciation or depreciation on a volatility swap will typically depend on the magnitude of the reference investment’s volatility, or size of the movements in its price, over the specified time period, rather than general directional increases or decreases in its price.
Volatility swaps are less standard in structure than other types of swaps and provide pure, or isolated, exposure to volatility risk of the specific underlying reference investment. Volatility swaps are typically used to speculate on future volatility levels, to trade the spread between realized and expected volatility, or to decrease the volatility exposure of investments held by the Fund.
Variance swaps are a type of volatility swap where counterparties agree to exchange periodic payments based on the measured variance (or the volatility squared) of a reference security, index, or other reference investment over a specified time period. At payment date, a net cash flow will be exchanged based on the difference between the realized variance of the reference investment over the specified time period and the specified rate representing expected variance for the reference investment at the time the swap is executed multiplied by the notional amount of the contract.
The Fund has entered into variance swaps to decrease exposure to the volatility risk of various reference investments. These types of volatility swaps require the Fund to make a payment if the measured price variance of the reference asset is less than the specified fixed rate. If the measured variance of the related reference investment increases over the period, the swaps will appreciate in value. Conversely, if the measured variance of the related reference investment decreases over the period, the swaps will depreciate in value.
For the year ended October 31, 2014, the Fund had ending monthly average notional amounts of $3,179 on volatility swaps which receive measured volatility/variance, respectively.
Additional associated risks to the Fund include counterparty credit risk and liquidity risk.
As of October 31, 2014, the Fund had no such volatility swap agreements outstanding.
Counterparty Credit Risk. Derivative positions are subject to the risk that the counterparty will not fulfill its obligation to the Fund. The Fund intends to enter into derivative transactions with counterparties that the Manager believes to be creditworthy at the time of the transaction.
The Fund’s risk of loss from counterparty credit risk on OTC derivatives is generally limited to the aggregate unrealized gain netted against any collateral held by the Fund. For OTC options purchased, the Fund bears the risk of loss of the amount of the premiums paid plus the positive change in market values net of any collateral held by the Fund should the counterparty fail to perform under the contracts. Options written by the Fund do not typically give rise to counterparty credit risk, as options written generally obligate the Fund and not the counterparty to perform.
73 OPPENHEIMER GLOBAL ALLOCATION FUND
| | |
| NOTES TO CONSOLIDATED FINANCIAL STATEMENTS Continued | | |
| | |
6. Risk Exposures and the Use of Derivative Instruments (Continued)
To reduce counterparty risk with respect to OTC transactions, the Fund has entered into master netting arrangements, established within the Fund’s International Swap and Derivatives Association, Inc. (“ISDA”) master agreements, which allow the Fund to make (or to have an entitlement to receive) a single net payment in the event of default (close-out netting) for outstanding payables and receivables with respect to certain OTC positions in swaps, options, swaptions, and forward currency exchange contracts for each individual counterparty. In addition, the Fund may require that certain counterparties post cash and/or securities in collateral accounts to cover their net payment obligations for those derivative contracts subject to ISDA master agreements. If the counterparty fails to perform under these contracts and agreements, the cash and/or securities will be made available to the Fund.
ISDA master agreements include credit related contingent features which allow counterparties to OTC derivatives to terminate derivative contracts prior to maturity in the event that, for example, the Fund’s net assets decline by a stated percentage or the Fund fails to meet the terms of its ISDA master agreements, which would cause the Fund to accelerate payment of any net liability owed to the counterparty.
For financial reporting purposes, the Fund does not offset derivative assets and derivative liabilities that are subject to netting arrangements in the Consolidated Statement of Assets and Liabilities. Bankruptcy or insolvency laws of a particular jurisdiction may impose restrictions on or prohibitions against the right of offset in bankruptcy, insolvency or other events.
The Fund’s risk of loss from counterparty credit risk on exchange-traded derivatives cleared through a clearinghouse and for centrally cleared swaps is generally considered lower than as compared to OTC derivatives. However, counterparty credit risk exists with respect to initial and variation margin deposited/paid by the Fund that is held in futures commission merchant, broker and/or clearinghouse accounts for such exchange-traded derivatives and for centrally cleared swaps.
With respect to centrally cleared swaps, such transactions will be submitted for clearing, and if cleared, will be held in accounts at futures commission merchants or brokers that are members of clearinghouses. While brokers, futures commission merchants and clearinghouses are required to segregate customer margin from their own assets, in the event that a broker, futures commission merchant or clearinghouse becomes insolvent or goes into bankruptcy and at that time there is a shortfall in the aggregate amount of margin held by the broker, futures commission merchant or clearinghouse for all its customers, U.S. bankruptcy laws will typically allocate that shortfall on a pro-rata basis across all the broker’s, futures commission merchant’s or clearinghouse’s customers, potentially resulting in losses to the Fund.
There is the risk that a broker, futures commission merchant or clearinghouse will decline to clear a transaction on the Fund’s behalf, and the Fund may be required to pay a termination fee to the executing broker with whom the Fund initially enters into the transaction. Clearinghouses may also be permitted to terminate centrally cleared swaps at any
74 OPPENHEIMER GLOBAL ALLOCATION FUND
6. Risk Exposures and the Use of Derivative Instruments (Continued)
time. The Fund is also subject to the risk that the broker or futures commission merchant will improperly use the Fund’s assets deposited/paid as initial or variation margin to satisfy payment obligations of another customer. In the event of a default by another customer of the broker or futures commission merchant, the Fund might not receive its variation margin payments from the clearinghouse, due to the manner in which variation margin payments are aggregated for all customers of the broker/futures commission merchant.
Collateral and margin requirements differ by type of derivative. Margin requirements are established by the broker, futures commission merchant or clearinghouse for exchange-traded and cleared derivatives, including centrally cleared swaps. Brokers, futures commission merchants and clearinghouses can ask for margin in excess of the regulatory minimum, or increase the margin amount, in certain circumstances.
Collateral terms are contract specific for OTC derivatives. For derivatives traded under an ISDA master agreement, the collateral requirements are typically calculated by netting the mark to market amount for each transaction under such agreement and comparing that amount to the value of any collateral currently pledged by the Fund or the counterparty.
For financial reporting purposes, cash collateral that has been pledged to cover obligations of the Fund, if any, is reported separately on the Consolidated Statement of Assets and Liabilities as cash pledged as collateral. Non-cash collateral pledged by the Fund, if any, is noted in the Consolidated Statement of Investments. Generally, the amount of collateral due from or to a party must exceed a minimum transfer amount threshold (e.g. $250,000) before a transfer has to be made. To the extent amounts due to the Fund from its counterparties are not fully collateralized, contractually or otherwise, the Fund bears the risk of loss from counterparty nonperformance.
The following table presents by counterparty the Fund’s OTC derivative assets net of the related collateral posted for the benefit of the Fund at October 31, 2014:
| | | | | | | | | | | | | | | | | | | | |
| | | Gross Amounts Not Offset in the Consolidated | |
| | | | | | Statement of Assets & Liabilities | | | | |
| Counterparty | | Gross Amount
of Assets in the
Consolidated
Statement of
Assets &
Liabilities* | | | Financial
Instruments
Available for
Offset | | | Financial
Instruments
Collateral
Received** | | | Cash Collateral
Received** | | | Net Amount | |
Bank of America NA | | $ | 11,914 | | | $ | — | | | $ | — | | | $ | — | | | $ | 11,914 | |
*OTC derivatives are reported gross on the Consolidated Statement of Assets and Liabilities. Exchange traded options and margin related to cleared swaps and futures are excluded from these reported amounts.
**Reported collateral posted for the benefit of the Fund within this table is limited to the net outstanding amount due from an individual counterparty. The collateral posted for the benefit of the Fund may exceed these amounts.
The following table presents the valuations of derivative instruments by risk exposure as reported within the Consolidated Statement of Assets and Liabilities as of October 31, 2014:
75 OPPENHEIMER GLOBAL ALLOCATION FUND
| | |
| NOTES TO CONSOLIDATED FINANCIAL STATEMENTS Continued | | |
| | |
6. Risk Exposures and the Use of Derivative Instruments (Continued)
| | | | | | | | | | | | |
| | | Asset Derivatives | | | Liability Derivatives | |
Derivatives Not
Accounted for as
Hedging
Instruments | | Consolidated Statement
of Assets and Liabilities
Location | | Value | | | Consolidated Statement
of Assets and Liabilities
Location | | Value | |
Equity contracts | | | | | | | | Variation margin payable | | $ | 4,586,312 | * |
Interest rate contracts | | | | | | | | Variation margin payable | | | 546,820 | * |
Volatility contracts | | Variation margin receivable | | $ | 700,000 | * | | Variation margin payable | | | 650,000 | * |
Foreign exchange contracts | | Unrealized appreciation on
foreign currency exchange
contracts | | | 11,914 | | | | | | | |
Equity contracts | | | | | | | | | | | | |
Equity contracts | | Investments, at value | | | 7,769,500 | ** | | | | | | |
Equity contracts | | Investments, at value | | | 1,000,000 | ** | | Options written, at value | | | 600,000 | |
| | | | | | | | | | | | |
Total | | | | $ | 9,481,414 | | | | | $ | 6,383,132 | |
| | | | | | | | | | | | |
*Includes only the current day’s variation margin. Prior variation margin movements have been reflected in cash on the Consolidated Statement of Assets and Liabilities upon receipt or payment.
**Amounts relate to purchased option contracts and purchased swaption contracts.
The effect of derivative instruments on the Consolidated Statement of Operations is as follows:
| | | | | | | | | | | | | | | | | | | | |
Derivatives Not
Accounted for as
Hedging
Instruments | | Investments from
unaffiliated
companies
(including
premiums on
options
exercised)* | | | Closing and
expiration of
option contracts
written | | | Closing and
expiration of
futures
contracts | | | Swap
contracts | | | Total | |
Equity contracts | | $ | (11,999,797 | ) | | $ | 9,955,604 | | | $ | (167,812 | ) | | $ | — | | | $ | (2,212,005 | ) |
Interest rate contracts | | | (1,197,402 | ) | | | — | | | | 6,285,331 | | | | — | | | | 5,087,929 | |
Volatility contracts | | | (48,995,905 | ) | | | 16,188,181 | | | | (5,401,721 | ) | | | 2,469,564 | | | | (35,739,881 | ) |
| | | | |
Total | | $ | (62,193,104 | ) | | $ | 26,143,785 | | | $ | 715,798 | | | $ | 2,469,564 | | | $ | (32,863,957 | ) |
| | | | |
*Includes purchased option contracts, purchased swaption contracts, written option contracts exercised and written swaption contracts exercised, if any.
| | | | | | | | | | | | | | | | | | | | | | | | |
| Amount of Change in Unrealized Gain or (Loss) Recognized on Derivatives | |
Derivatives
Not
Accounted
for as
Hedging
Instruments | | Investments* | | | Option
contracts
Written | | | Futures
contracts | | | Translation of
assets and
liabilities
denominated
in foreign
currencies | | | Swap
contracts | | | Total | |
Equity contracts | | $ | 2,208,114 | | | $ | 335,792 | | | $ | (29,223,086) | | | $ | — | | | $ | — | | | $ | (26,679,180) | |
Foreign exchange contracts | | | — | | | | — | | | | — | | | | 11,914 | | | | — | | | | 11,914 | |
76 OPPENHEIMER GLOBAL ALLOCATION FUND
6. Risk Exposures and the Use of Derivative Instruments (Continued)
| | | | | | | | | | | | | | | | | | | | | | | | |
| Amount of Change in Unrealized Gain or (Loss) Recognized on Derivatives (Continued) | |
Derivatives
Not
Accounted
for as
Hedging
Instruments | | Investments* | | | Option
contracts
written | | | Futures
contracts | | | Translation
of assets and
liabilities
denominated
in foreign
currencies | | | Swap
contracts | | | Total | |
Interest rate contracts | | $ | — | | | $ | — | | | $ | 2,444,106 | | | $ | — | | | $ | — | | | $ | 2,444,106 | |
Volatility contracts | | | 9,301,542 | | | | (4,434,830 | ) | | | 5,840,530 | | | | — | | | | (1,493,798 | ) | | | 9,213,444 | |
| | | | | | | | | | | | | | | | | | | | | | | | |
Total | | $ | 11,509,656 | | | $ | (4,099,038 | ) | | $ | (20,938,450 | ) | | $ | 11,914 | | | $ | (1,493,798 | ) | | $ | (15,009,716 | ) |
| | | | | | | | | | | | | | | | | | | | | | | | |
*Includes purchased option contracts and purchased swaption contracts, if any.
7. Restricted Securities
As of October 31, 2014, investments in securities included issues that are restricted. A restricted security may have a contractual restriction on its resale and is valued under methods approved by the Board of Trustees as reflecting fair value. Securities that are restricted are marked with an applicable footnote on the Consolidated Statement of Investments. Restricted securities are reported on a schedule following the Consolidated Statement of Investments.
8. Pending Litigation
In 2009, seven class action lawsuits were filed in the U.S. District Court for the District of Colorado against OppenheimerFunds, Inc. (“OFI”), OppenheimerFunds Distributor, Inc., the Fund’s principal underwriter and distributor (the “Distributor”), and certain funds (but not including the Fund) advised by OFI Global Asset Management, Inc. and distributed by the Distributor (the “Defendant Funds”). The lawsuits also named as defendants certain officers and current and former trustees of the respective Defendant Funds. The lawsuits raised claims under federal securities laws and alleged, among other things, that the disclosure documents of the respective Defendant Funds contained misrepresentations and omissions and that the respective Defendant Funds’ investment policies were not followed. The plaintiffs in these actions sought unspecified damages, equitable relief and awards of attorneys’ fees and litigation expenses. The Defendant Funds’ Boards of Trustees also engaged counsel to represent the Funds and the present and former Independent Trustees named in those suits. In March 2014, the parties in six of these lawsuits executed stipulations and agreements of settlement resolving those actions. In July 2014, the court entered an order and final judgment approving the settlements as fair, reasonable and adequate. The settlements do not resolve a seventh outstanding lawsuit relating to Oppenheimer Rochester California Municipal Fund (the “California Fund Suit”). OFI believes the California Fund Suit is without legal merit and is defending the suit vigorously. While it is premature to render any opinion as to the
77 OPPENHEIMER GLOBAL ALLOCATION FUND
| | |
| NOTES TO CONSOLIDATED FINANCIAL STATEMENTS Continued | | |
| | |
8. Pending Litigation (Continued)
outcome in the California Fund Suit, or whether any costs that OFI may bear in defending the California Fund Suit might not be reimbursed by insurance, OFI believes the California Fund Suit should not impair the ability of OFI or the Distributor to perform their respective duties to the Fund, and that the outcome of the California Fund Suit should not have any material effect on the operations of any of the Oppenheimer Funds.
78 OPPENHEIMER GLOBAL ALLOCATION FUND
| | |
REPORT OF INDEPENDENT REGISTERED PUBLIC ACCOUNTING FIRM | | |
The Board of Trustees and Shareholders of Oppenheimer Quest for Value Funds:
We have audited the accompanying consolidated statement of assets and liabilities of Oppenheimer Global Allocation Fund (a series of Oppenheimer Quest for Value Funds) and subsidiary, including the consolidated statement of investments, as of October 31, 2014, and related consolidated statement of operations for the year then ended, the consolidated statements of changes in net assets for each of the years in the two-year period then ended, and the consolidated financial highlights for each of the years or periods in the five-year period then ended. These consolidated financial statements and consolidated financial highlights are the responsibility of the Fund’s management. Our responsibility is to express an opinion on these consolidated financial statements and consolidated financial highlights based on our audits.
We conducted our audits in accordance with the standards of the Public Company Accounting Oversight Board (United States). Those standards require that we plan and perform the audit to obtain reasonable assurance about whether the financial statements and financial highlights are free of material misstatement. An audit includes examining, on a test basis, evidence supporting the amounts and disclosures in the financial statements. Our procedures included confirmation of securities owned as of October 31, 2014, by correspondence with the custodian, transfer agent and brokers, or by other appropriate auditing procedures where replies from brokers were not received. An audit also includes assessing the accounting principles used and significant estimates made by management, as well as evaluating the overall financial statement presentation. We believe that our audits provide a reasonable basis for our opinion.
In our opinion, the consolidated financial statements and consolidated financial highlights referred to above present fairly, in all material respects, the financial position of Oppenheimer Global Allocation Fund and subsidiary as of October 31, 2014, the results of their operations for the year then ended, the changes in their net assets for each of the years in the two-year period then ended, and the financial highlights for each of the years or periods in the five-year period then ended, in conformity with U.S. generally accepted accounting principles.
KPMG LLP
Denver, Colorado
December 22, 2014
79 OPPENHEIMER GLOBAL ALLOCATION FUND
| | |
| FEDERAL INCOME TAX INFORMATION Unaudited | | |
In early 2014, if applicable, shareholders of record received information regarding all dividends and distributions paid to them by the Fund during calendar year 2013.
Dividends, if any, paid by the Fund during the fiscal year ended October 31, 2014 which are not designated as capital gain distributions should be multiplied by the maximum amount allowable but not less than 30.05% to arrive at the amount eligible for the corporate dividend-received deduction.
A portion, if any, of the dividends paid by the Fund during the fiscal year ended October 31, 2014 which are not designated as capital gain distributions are eligible for lower individual income tax rates to the extent that the Fund has received qualified dividend income as stipulated by recent tax legislation. The maximum amount allowable but not less than $18,471,151 of the Fund’s fiscal year taxable income may be eligible for the lower individual income tax rates. In early 2014, shareholders of record received information regarding the percentage of distributions that are eligible for lower individual income tax rates.
Recent tax legislation allows a regulated investment company to designate distributions not designated as capital gain distributions, as either interest related dividends or short-term capital gain dividends, both of which are exempt from the U.S. withholding tax applicable to non U.S. taxpayers. For the fiscal year ended October 31, 2014, the maximum amount allowable but not less than $15,035,693 of the ordinary distributions to be paid by the Fund qualifies as an interest related dividend.
The foregoing information is presented to assist shareholders in reporting distributions received from the Fund to the Internal Revenue Service. Because of the complexity of the federal regulations which may affect your individual tax return and the many variations in state and local tax regulations, we recommend that you consult your tax advisor for specific guidance.
80 OPPENHEIMER GLOBAL ALLOCATION FUND
| | |
BOARD APPROVAL OF THE FUND’S INVESTMENT ADVISORY AND SUB-ADVISORY AGREEMENTS Unaudited | | |
| | |
The Fund has entered into an investment advisory agreement with OFI Global Asset Management, Inc. (“OFI Global” or the “Adviser”), a wholly-owned subsidiary of OppenheimerFunds, Inc. (“OFI” or the “Sub-Adviser”) (“OFI Global” and “OFI” together the “Managers”) and OFI Global has entered into a sub-advisory agreement with OFI whereby OFI provides investment sub-advisory services to the Fund (collectively, the “Agreements”). Each year, the Board of Trustees (the “Board”), including a majority of the independent Trustees, is required to determine whether to renew the Agreements. The Investment Company Act of 1940, as amended, requires that the Board request and evaluate, and that the Managers provide, such information as may be reasonably necessary to evaluate the terms of the Agreements. The Board employs an independent consultant to prepare a report that provides information, including comparative information that the Board requests for that purpose. In addition to in-person meetings focused on this evaluation, the Board receives information throughout the year regarding Fund services, fees, expenses and performance.
The Adviser, Sub-Adviser and the independent consultant provided information to the Board on the following factors: (i) the nature, quality and extent of the Managers’ services, (ii) the investment performance of the Fund and the Managers, (iii) the fees and expenses of the Fund, including comparative expense information, (iv) the profitability of the Managers and their affiliates, including an analysis of the cost of providing services, (v) whether economies of scale are realized as the Fund grows and whether fee levels reflect these economies of scale for Fund investors and (vi) other benefits to the Managers from their relationship with the Fund. The Board was aware that there are alternatives to retaining the Managers.
Outlined below is a summary of the principal information considered by the Board as well as the Board’s conclusions.
Nature, Quality and Extent of Services. The Board considered information about the nature, quality and extent of the services provided to the Fund and information regarding the Managers’ key personnel who provide such services. The Sub-Adviser’s duties include providing the Fund with the services of the portfolio managers and the Sub-Adviser’s investment team, who provide research, analysis and other advisory services in regard to the Fund’s investments; securities trading services; oversight of third-party service providers; monitoring compliance with applicable Fund policies and procedures and adherence to the Fund’s investment restrictions; and risk management. The Managers are responsible for providing certain administrative services to the Fund as well. Those services include providing and supervising all administrative and clerical personnel who are necessary in order to provide effective corporate administration for the Fund; compiling and maintaining records with respect to the Fund’s operations; preparing and filing reports required by the Securities and Exchange Commission; preparing periodic reports regarding the operations of the Fund for its shareholders; preparing proxy materials for shareholder meetings; and preparing the registration statements required by Federal and state securities laws for the sale of the Fund’s shares. The Managers also provide the Fund with office space, facilities and equipment.
The Board also considered the quality of the services provided and the quality of the Managers’ resources that are available to the Fund. The Board took account of the fact that the Sub-Adviser has had over fifty years of experience as an investment adviser and that its assets under management rank it among the top mutual fund managers in the United States. The Board evaluated the Sub-Adviser’s advisory, administrative, accounting, legal, compliance
81 OPPENHEIMER GLOBAL ALLOCATION FUND
| | |
BOARD APPROVAL OF THE FUND’S INVESTMENT ADVISORY AND SUB-ADVISORY AGREEMENTS Unaudited / Continued | | |
| | |
services and risk management, and information the Board has received regarding the experience and professional qualifications of the Managers’ key personnel and the size and functions of its staff. In its evaluation of the quality of the portfolio management services provided, the Board considered the experience of Mark Hamilton and Benjamin Rockmuller, the portfolio managers for the Fund, and the Sub-Adviser’s investment team and analysts. The Board members also considered the totality of their experiences with the Managers as directors or trustees of the Fund and other funds advised by the Managers. The Board considered information regarding the quality of services provided by affiliates of the Managers, which its members have become knowledgeable about in connection with the renewal of the Fund’s service agreements. The Board concluded, in light of the Managers’ experience, reputation, personnel, operations and resources that the Fund benefits from the services provided under the Agreements.
Investment Performance of the Adviser and the Fund. Throughout the year, the Adviser provided information on the investment performance of the Fund, including comparative performance information. The Board also reviewed information, prepared by the Adviser and by the independent consultant, comparing the Fund’s historical performance to relevant market indices and to the performance of other retail funds in the world allocation category. The Board noted that the Fund’s one- and five-year performance was better than its category median although its three- and ten-year performance was below its category median.
Costs of Services by the Adviser. The Board reviewed the fees paid to the Adviser and the other expenses borne by the Fund. The independent consultant provided comparative data in regard to the fees and expenses of the Fund and other retail front-end load world allocation funds with comparable asset levels and distribution features. The Fund’s contractual management fees were lower than its peer group median and category median. The Fund’s total expenses were higher than its peer group median and category median.
Economies of Scale and Profits Realized by the Managers. The Board considered information regarding OFI Global’s costs in serving as the Fund’s investment adviser, including the costs associated with the personnel and systems necessary to manage the Fund, and information regarding the Managers’ profitability from their relationship with the Fund. The Board reviewed whether the Managers may realize economies of scale in managing and supporting the Fund. The Board noted that the Fund currently has management fee breakpoints, which are intended to share with Fund shareholders economies of scale that may exist as the Fund’s assets grow.
Other Benefits to the Managers. In addition to considering the profits realized by the Managers, the Board considered information that was provided regarding the direct and indirect benefits the Managers receive as a result of their relationship with the Fund, including compensation paid to the Managers’ affiliates and research provided to the Adviser in connection with permissible brokerage arrangements (soft dollar arrangements). The Board also considered that the Managers must be able to pay and retain experienced professional personnel at competitive rates to provide quality services to the Fund.
Conclusions. These factors were also considered by the independent Trustees meeting separately from the full Board, assisted by experienced counsel to the Fund and to the independent Trustees. Fund counsel and the independent Trustees’ counsel are independent
82 OPPENHEIMER GLOBAL ALLOCATION FUND
of the Managers within the meaning and intent of the Securities and Exchange Commission Rules.
Based on its review of the information it received and its evaluations described above, the Board, including a majority of the independent Trustees, decided to continue the Agreements through September 30, 2015. In arriving at its decision, the Board did not identify any factor or factors as being more important than others, but considered all of the above information, and considered the terms and conditions of the Agreements, including the management fees, in light of all the surrounding circumstances.
83 OPPENHEIMER GLOBAL ALLOCATION FUND
| | |
PORTFOLIO PROXY VOTING POLICIES AND PROCEDURES; UPDATES TO STATEMENTS OF INVESTMENTS Unaudited | | |
| | |
The Fund has adopted Portfolio Proxy Voting Policies and Procedures under which the Fund votes proxies relating to securities (“portfolio proxies”) held by the Fund. A description of the Fund’s Portfolio Proxy Voting Policies and Procedures is available (i) without charge, upon request, by calling the Fund toll-free at 1.800.CALL OPP (225.5677), (ii) on the Fund’s website at www.oppenheimerfunds.com, and (iii) on the SEC’s website at www.sec.gov. In addition, the Fund is required to file Form N-PX, with its complete proxy voting record for the 12 months ended June 30th, no later than August 31st of each year. The Fund’s voting record is available (i) without charge, upon request, by calling the Fund toll-free at 1.800.CALL OPP (225.5677), and (ii) in the Form N-PX filing on the SEC’s website at www.sec.gov.
The Fund files its complete schedule of portfolio holdings with the SEC for the first quarter and the third quarter of each fiscal year on Form N-Q. The Fund’s Form N-Q filings are available on the SEC’s website at www.sec.gov. Those forms may be reviewed and copied at the SEC’s Public Reference Room in Washington, D.C. Information on the operation of the Public Reference Room may be obtained by calling 1-800-SEC-0330.
Householding—Delivery of Shareholder Documents
This is to inform you about OppenheimerFunds’ “householding” policy. If more than one member of your household maintains an account in a particular fund, OppenheimerFunds will mail only one copy of the fund’s prospectus (or, if available, the fund’s summary prospectus), annual and semiannual report and privacy policy. The consolidation of these mailings, called householding, benefits your fund through reduced mailing expense, and benefits you by reducing the volume of mail you receive from OppenheimerFunds. Householding does not affect the delivery of your account statements.
Please note that we will continue to household these mailings for as long as you remain an OppenheimerFunds shareholder, unless you request otherwise. If you prefer to receive multiple copies of these materials, please call us at 1.800.CALL-OPP (225-5677). You may also notify us in writing or via email. We will begin sending you individual copies of the prospectus (or, if available, the summary prospectus), reports and privacy policy within 30 days of receiving your request to stop householding.
84 OPPENHEIMER GLOBAL ALLOCATION FUND
| | |
| TRUSTEES AND OFFICERS Unaudited | | |
| | |
| | |
Name, Position(s) Held with
the Fund, Length of Service,
Year of Birth | | Principal Occupation(s) During the Past 5 Years; Other Trusteeships/Directorships Held; Number of Portfolios in the Fund Complex Currently Overseen |
| |
| INDEPENDENT TRUSTEES | | The address of each Trustee in the chart below is 6803 S. Tucson Way, Centennial, Colorado 80112-3924. Each Trustee serves for an indefinite term, or until his or her resignation, retirement, death or removal. |
| |
Brian F. Wruble,
Chairman of the Board of Trustees
(since 2007), Trustee (since 2001) Year of Birth: 1943 | | Director and Vice Chairman of Community Foundation of the Florida Keys (non-profit) (since July 2012); Trustee of the Board of Trustees, The Jackson Laboratory (non-profit) (1991-2011 and since May 2014); Chairman Emeritus (since August 2011) of The Jackson Laboratory (non-profit); Director of Special Value Opportunities Fund, LLC (registered investment company) (affiliate of the Sub-Adviser’s parent company) (since September 2004); Member of Zurich Insurance Group’s Investment Management Advisory Council (insurance) (since 2004); Treasurer (since 2007) and Trustee of the Institute for Advanced Study (non-profit educational institute) (since May 1992); General Partner of Odyssey Partners, L.P. (hedge fund) (September 1995-December 2007); Special Limited Partner of Odyssey Investment Partners, LLC (private equity investment) (January 1999-September 2004). Oversees 52 portfolios in the OppenheimerFunds complex. Mr. Wruble has served on the Boards of certain Oppenheimer funds since April 2001, during which time he has become familiar with the Fund’s (and other Oppenheimer funds’) financial, accounting, regulatory and investment matters and has contributed to the Boards’ deliberations. |
| |
David K. Downes,
Trustee (since 2005) Year of Birth: 1940 | | Director of THL Credit Inc. (since June 2009); Chief Executive Officer and Board Member of Community Capital Management (investment management company) (since January 2004); President of The Community Reinvestment Act Qualified Investment Fund (investment management company) (since 2004); Director of Actua Corporation (information technology company) (since October 2003); formerly, Independent Chairman GSK Employee Benefit Trust (April 2006-June2013); Director of Correctnet (January 2006-2007); Independent Chairman of the Board of Trustees of Quaker Investment Trust (registered investment company) (2004-2007); Chief Operating Officer and Chief Financial Officer of Lincoln National Investment Companies, Inc. (subsidiary of Lincoln National Corporation, a publicly traded company) and Delaware Investments U.S., Inc. (investment management subsidiary of Lincoln National Corporation) (1993-2003); President, Chief Executive Officer and Trustee of Delaware Investment Family of Funds (1993-2003); President and Board Member of Lincoln National Convertible Securities Funds, Inc. and the Lincoln National Income Funds, TDC (1993-2003); Chairman and Chief Executive Officer of Retirement Financial Services, Inc. (registered transfer agent and investment adviser and subsidiary of Delaware Investments U.S., Inc.) (1993-2003); President and Chief Executive Officer of Delaware Service Company, Inc. (1995-2003); Chief Administrative Officer, Chief Financial Officer, Vice Chairman and Director of Equitable Capital Management Corporation (investment subsidiary of Equitable Life Assurance Society) (1985-1992); Corporate Controller of Merrill Lynch Company (financial services holding company) (1977-1985); held the following positions at the Colonial Penn Group, Inc. (insurance company): Corporate Budget Director (1974-1977), Assistant Treasurer (1972-1974) and Director of Corporate Taxes (1969-1972); held |
85 OPPENHEIMER GLOBAL ALLOCATION FUND
| | |
| |
| TRUSTEES AND OFFICERS Unaudited / Continued | | |
| | |
David K. Downes,
Continued | | the following positions at Price Waterhouse Company (financial services firm): Tax Manager (1967-1969), Tax Senior (1965-1967) and Staff Accountant (1963-1965); United States Marine Corps (1957-1959). Oversees 52 portfolios in the OppenheimerFunds complex. Mr. Downes has served on the Boards of certain Oppenheimer funds since December 2005, during which time he has become familiar with the Fund’s (and other Oppenheimer funds’) financial, accounting, regulatory and investment matters and has contributed to the Boards’ deliberations. |
| |
Matthew P. Fink,
Trustee (since 2009) Year of Birth: 1941 | | Trustee of the Committee for Economic Development (policy research foundation) (2005-2011); Director of ICI Education Foundation (education foundation) (October 1991-August 2006); President of the Investment Company Institute (trade association) (October 1991-June 2004); Director of ICI Mutual Insurance Company (insurance company) (October 1991-June 2004); Author of The Rise of Mutual Funds: An Insider’s View published by Oxford University Press (second edition 2010). Oversees 52 portfolios in the OppenheimerFunds complex. Mr. Fink has served on the Boards of certain Oppenheimer funds since January 2005, during which time he has become familiar with the Fund’s (and other Oppenheimer funds’) financial, accounting, regulatory and investment matters and has contributed to the Boards’ deliberations. |
| |
Edmund P. Giambastiani, Jr.,
Trustee (since 2013) Year of Birth: 1948 | | Advisory Board Member of the Maxwell School of Citizenship and Public Affairs of Syracuse University (since April 2012); Director of Mercury Defense Systems Inc. (information technology) (August 2011-February 2013); Trustee of the U.S. Naval Academy Foundation (since November 2010); Advisory Board Member of the Massachusetts Institute of Technology Lincoln Laboratory (federally-funded research development center) (since May 2010); Director of The Boeing Company (aerospace and defense) (since October 2009); Trustee of MITRE Corporation (federally-funded research development center) (since September 2008); Independent Director of QinetiQ Group Plc (defense technology and security) (February 2008-August 2011); Director of Monster Worldwide, Inc. (on-line career services) (since January 2008, Lead Director since June 2011); Chairman of Alenia North America, Inc. (military and defense products) (January 2008-October 2009); Director of SRA International, Inc. (information technology and services) (January 2008-July 2011); President of Giambastiani Group LLC (national security and energy consulting) (since October 2007); United States Navy, career nuclear submarine officer (June 1970-October 2007), Vice Chairman of the Joint Chiefs of Staff (2005-October 2007), NATO Supreme Allied Commander Transformation (2003-2005), Commander, U.S. Joint Forces Command (2002-2005). Since his retirement from the U.S. Navy in October 2007, Admiral Giambastiani has also served on numerous U.S. Government advisory boards, investigations and task forces for the Secretaries of Defense, State and Interior and the Central Intelligence Agency. Oversees 52 portfolios in the OppenheimerFunds complex. Admiral Giambastiani has served on the Boards of certain Oppenheimer funds since February 2013, including as an Advisory Board Member for certain Oppenheimer funds, during which time he has become familiar with the Fund’s (and other Oppenheimer funds’) financial, accounting, regulatory and investment matters and has contributed to the Boards’ deliberations. For purposes of this report, Admiral Giambastiani is identified as a Trustee. |
86 OPPENHEIMER GLOBAL ALLOCATION FUND
| | |
Elizabeth Krentzman,
Trustee (since 2014) Year of Birth: 1959 | | Advisory Board Member of the Securities and Exchange Commission Historical Society (since 2007); held the following positions at Deloitte & Touche LLP: Principal and Chief Regulatory Advisor for Asset Management Services (2007 - 2014) and U.S. Mutual Fund Leader (2011 - 2014); General Counsel of the Investment Company Institute (trade association) (June 2004-April 2007); held the following positions at Deloitte & Touche LLP: National Director of the Investment Management Regulatory Consulting Practice (1997 - 2004), Principal (2003 - 2004), Director (1998 - 2003) and Senior Manager (1997 - 1998); Assistant Director of the Division of Investment Management – Office of Disclosure and Investment Adviser Regulation (1996 - 1997) and various positions with the Division of Investment Management-Office of Regulatory Policy (1991 - 1996) of the U.S. Securities and Exchange Commission; Associate at Ropes & Gray (1987 - 1991); former Chair of the Investment Management Subcommittee of the Washington, D.C. Bar. Oversees 52 portfolios in the OppenheimerFunds complex. Ms. Krentzman has served on the Boards of certain Oppenheimer funds since August 2014, during which time she has become familiar with the Fund’s (and other Oppenheimer funds’) financial, accounting, regulatory and investment matters and has contributed to the Boards’ deliberations. |
| |
Mary F. Miller,
Trustee (since 2009) Year of Birth: 1942 | | Trustee of International House (not-for-profit) (since June 2007); Trustee of the American Symphony Orchestra (not-for-profit) (October 1998-November 2011); and Senior Vice President and General Auditor of American Express Company (financial services company) (July 1998-February 2003). Oversees 52 portfolios in the OppenheimerFunds complex. Ms. Miller has served on the Boards of certain Oppenheimer funds since August 2004, during which time she has become familiar with the Fund’s (and other Oppenheimer funds’) financial, accounting, regulatory and investment matters and has contributed to the Boards’ deliberations. |
| |
Joel W. Motley,
Trustee (since 2009) Year of Birth: 1952 | | Member of the Vestry of Trinity Wall Street (since April 2012); Director of Southern Africa Legal Services Foundation (since March 2012); Board Member of Pulitzer Center for Crisis Reporting (non-profit journalism) (since December 2010); Managing Director of Public Capital Advisors, LLC (privately-held financial advisor) (since January 2006); Managing Director of Carmona Motley, Inc. (privately-held financial advisor) (since January 2002); Director of Columbia Equity Financial Corp. (privately-held financial advisor) (2002-2007); Managing Director of Carmona Motley Hoffman Inc. (privately-held financial advisor) (January 1998-December 2001); Member of the Finance and Budget Committee of the Council on Foreign Relations, Member of the Investment Committee and Board of Human Rights Watch and Member of the Investment Committee and Board of Historic Hudson Valley. Oversees 52 portfolios in the OppenheimerFunds complex. Mr. Motley has served on the Boards of certain Oppenheimer funds since October 2002, during which time he has become familiar with the Fund’s (and other Oppenheimer funds’) financial, accounting, regulatory and investment matters and has contributed to the Boards’ deliberations. |
| |
Joanne Pace,
Trustee (since 2012) Year of Birth: 1958 | | Board Director of Horizon Blue Cross Blue Shield of New Jersey (since November 2012); Advisory Board Director of The Alberleen Group LLC (since March 2012); Advisory Board Director of The Agile Trading Group LLC (since March 2012); Advisory Council Member of 100 Women in Hedge Funds (non-profit) (since December 2012); Advisory Council Member of Morgan |
87 OPPENHEIMER GLOBAL ALLOCATION FUND
| | |
| |
| TRUSTEES AND OFFICERS Unaudited / Continued | | |
| | |
Joanne Pace,
Continued | | Stanley Children’s Hospital (non-profit) (since May 2012); Board Director of The Komera Project (non-profit) (since April 2012); New York Advisory Board Director of Peace First (non-profit) (since March 2010); Senior Advisor of SECOR Asset Management, LP (2010-2011); Managing Director and Chief Operating Officer of Morgan Stanley Investment Management (2006-2010); Partner and Chief Operating Officer of FrontPoint Partners, LLC (hedge fund) (2005-2006); held the following positions at Credit Suisse: Managing Director (2003-2005); Global Head of Human Resources and member of Executive Board and Operating Committee (2004-2005), Global Head of Operations and Product Control (2003-2004); held the following positions at Morgan Stanley: Managing Director (1997-2003), Controller and Principal Accounting Officer (1999-2003); Chief Financial Officer (temporary assignment) for the Oversight Committee, Long Term Capital Management (1998-1999). Lead Independent Director and Chair of the Audit and Nominating Committee of The Global Chartist Fund, LLC of Oppenheimer Asset Management (2011-2012); Board Director of Managed Funds Association (2008-2010); Board Director of Morgan Stanley Foundation (2007-2010) and Investment Committee Chair (2008-2010). Oversees 52 portfolios in the OppenheimerFunds complex. Ms. Pace has served on the Boards of certain Oppenheimer funds since November 2012, including as an Advisory Board Member for certain Oppenheimer funds, during which time she has become familiar with the Fund’s (and other Oppenheimer funds’) financial, accounting, regulatory and investment matters and has contributed to the Board’s deliberations. For purposes of this report, Ms. Pace is identified as a Trustee. |
| |
Peter I. Wold,
Trustee (since 2009) Year of Birth: 1948 | | Director of Arch Coal, Inc. (since 2010); President of Wold Oil Properties, Inc. (oil and gas exploration and production company) (since 1994); Vice President of American Talc Company, Inc. (talc mining and milling) (since 1999); Managing Member of Hole-in-the-Wall Ranch (cattle ranching) (since 1979); Director and Chairman of Wyoming Enhanced Oil Recovery Institute Commission (enhanced oil recovery study) (2004-2012); Director and Chairman of the Denver Branch of the Federal Reserve Bank of Kansas City (1993-1999); and Director of PacifiCorp. (electric utility) (1995-1999). Oversees 52 portfolios in the OppenheimerFunds complex. Mr. Wold has served on the Boards of certain Oppenheimer funds since August 2005, during which time he has become familiar with the Fund’s (and other Oppenheimer funds’) financial, accounting, regulatory and investment matters and has contributed to the Boards’ deliberations. |
| |
| | | |
| |
| INTERESTED TRUSTEE | | Mr. Glavin is an “Interested Trustee” because he is affiliated with the Manager and the Sub-Adviser by virtue of his positions as director of the Sub-Adviser, and as a shareholder of the Sub-Adviser’s parent company. As a Trustee, he serves for an indefinite term, or until his resignation, retirement, death or removal. Mr. Glavin’s address is 225 Liberty Street, 11th Floor, New York, New York 10281-1008. |
| |
William F. Glavin, Jr.,
Trustee (since 2009) Year of Birth: 1958 | | Chairman of the Sub-Adviser (since July 2014 and December 2009-December 2012) and Director of the Sub-Adviser (since January 2009); Chairman, Director and Chief Executive Officer (January 2013-June 2014) of the Manager; President of the Manager (January 2013-May 2013); Chief Executive Officer (January 2009-December 2012); President of the Sub-Adviser (May 2009-December 2012); Management Director (June 2009-June |
88 OPPENHEIMER GLOBAL ALLOCATION FUND
| | |
William F. Glavin, Jr.,
Continued | | 2014), President (December 2009-June 2014) and Chief Executive Officer (January 2011-June 2014) of Oppenheimer Acquisition Corp. (“OAC”) (the Sub-Adviser’s parent holding company); Director of Oppenheimer Real Asset Management, Inc. (March 2010-June 2014); Executive Vice President (March 2006-February 2009) and Chief Operating Officer (July 2007-February 2009) of Massachusetts Mutual Life Insurance Company (OAC’s parent company); Director (May 2004-March 2006) and Chief Operating Officer and Chief Compliance Officer (May 2004-January 2005), President (January 2005-March 2006) and Chief Executive Officer (June 2005-March 2006) of Babson Capital Management LLC; Director (March 2005-March 2006), President (May 2003-March 2006) and Chief Compliance Officer (July 2005-March 2006) of Babson Capital Securities, Inc. (a broker-dealer); President (May 2003-March 2006) of Babson Investment Company, Inc.; Director (May 2004-August 2006) of Babson Capital Europe Limited; Director (May 2004-October 2006) of Babson Capital Guernsey Limited; Director (May 2004-March 2006) of Babson Capital Management LLC; Non-Executive Director (March 2005-March 2007) of Baring Asset Management Limited; Director (February 2005-June 2006) Baring Pension Trustees Limited; Director and Treasurer (December 2003-November 2006) of Charter Oak Capital Management, Inc.; Director (May 2006-September 2006) of C.M. Benefit Insurance Company; Director (May 2008-June 2009) and Executive Vice President (June 2007-July 2009) of C.M. Life Insurance Company; President (March 2006-May 2007) of MassMutual Assignment Company; Director (January 2005-December 2006), Deputy Chairman (March 2005-December 2006) and President (February 2005-March 2005) of MassMutual Holdings (Bermuda) Limited; Director (May 2008-June 2009) and Executive Vice President (June 2007-July 2009) of MML Bay State Life Insurance Company; Chief Executive Officer and President (April 2007-January 2009) of MML Distributors, LLC; and Chairman (March 2006-December 2008) and Chief Executive Officer (May 2007-December 2008) of MML Investors Services, Inc. An officer of 91 portfolios in the OppenheimerFunds complex. Mr. Glavin has served on the Boards of certain Oppenheimer funds since December 2009, during which time he has become familiar with the Fund’s (and other Oppenheimer funds’) financial, accounting, regulatory and investment matters and has contributed to the Boards’ deliberations. |
| |
| | | |
| |
OTHER OFFICERS OF THE
FUND | | The addresses of the Officers in the chart below are as follows: for Messrs. Hamilton, Rockmuller, Steinmetz, Gabinet, Mss. Sexton and Picciotto, 225 Liberty Street, New York, New York 10281-1008, for Mr. Wixted, 6803 S. Tucson Way, Centennial, Colorado 80112-3924. Each Officer serves for an indefinite term or until his or her resignation, retirement, death or removal. |
| |
Mark Hamilton
Vice President (since 2013) Year of Birth: 1965 | | Chief Investment Officer, Asset Allocation of the Sub-Adviser (since April 2013) and a Senior Vice President of the Sub-Adviser (since April 2013). Mr. Hamilton served at AllianceBernstein L.P. (from 1994-2013), as an Investment Director of Dynamic Asset Allocation (from 2010-2013), Head of North American Blend Team (from 2009-2010), and Senior Portfolio Manager of Blend Strategies (from 2006-2010). A portfolio manager and an officer of other portfolios in the OppenheimerFunds complex. |
| |
Benjamin H. Rockmuller,
Vice President (since 2011) Year of Birth: 1979 | | Vice President of the Sub-Adviser (since September 2010); Assistant Vice President of the Sub-Adviser (January 2010-August 2010); Portfolio Manager of the Sub-Adviser (since July 2010); Senior Analyst of the Sub-Adviser for the Global Debt Team (January 2010-July 2010); Intermediate Analyst of the Sub-Adviser for |
89 OPPENHEIMER GLOBAL ALLOCATION FUND
| | |
| |
| TRUSTEES AND OFFICERS Unaudited / Continued | | |
| | |
Benjamin H. Rockmuller,
Continued | | the Global Debt Team (January 2007-January 2010); Junior Analyst of the Sub-Adviser for the Global Debt Team (April 2004-January 2007) and Junior Analyst of the Sub-Adviser for the High Yield Team (June 2003-April 2004). A portfolio manager and an officer in the OppenheimerFunds complex. |
| |
Arthur P. Steinmetz,
President and Principal
Executive Officer
(since 2014) Year of Birth: 1958 | | CEO and Chairman of the Manager (since July 2014), President of the Manager (since May 2013), a Director of the Manager (since January 2013), Director of the Sub-Adviser (since July 2014), President, Management Director and CEO of Oppenheimer Acquisition Corp. (the Sub-Adviser’s parent holding company) (since July 2014), and President and Director of OFI SteelPath, Inc. (since January 2013). Chief Investment Officer of the OppenheimerFunds advisory entities from (January 2013-December 2013); Executive Vice President of the Manager (January 2013-May 2013); Chief Investment Officer of the Sub-Adviser (October 2010-December 2012); Chief Investment Officer, Fixed-Income, of the Sub-Adviser (April 2009-October 2010); Executive Vice President of the Sub-Adviser (October 2009-December 2012); Director of Fixed Income of the Sub-Adviser (January 2009-April 2009); and a Senior Vice President of the Sub-Adviser (March 1993-September 2009). An officer of 91 portfolios in the OppenheimerFunds complex. |
| |
Arthur S. Gabinet,
Secretary and Chief Legal
Officer (since 2011) Year of Birth: 1958 | | Executive Vice President, Secretary and General Counsel of the Manager (since January 2013); General Counsel OFI SteelPath, Inc. (since January 2013); Executive Vice President (May 2010-December 2012) and General Counsel (since January 2011) of the Sub-Adviser; General Counsel of the Distributor (since January 2011); General Counsel of Centennial Asset Management Corporation (January 2011-December 2012); Executive Vice President (January 2011-December 2012) and General Counsel of HarbourView Asset Management Corporation (since January 2011); Assistant Secretary (since January 2011) and Director (since January 2011) of OppenheimerFunds International Ltd. and OppenheimerFunds plc; Director of Oppenheimer Real Asset Management, Inc. (January 2011-December 2012) and General Counsel (since January 2011); Executive Vice President (January 2011-December 2011) and General Counsel of Shareholder Financial Services, Inc. and Shareholder Services, Inc. (since January 2011); Executive Vice President (January 2011-December 2012) and General Counsel of OFI Private Investments Inc. (since January 2011); Vice President of OppenheimerFunds Legacy Program (January 2011-December 2011); Executive Vice President (January 2011-December 2012) and General Counsel of OFI Institutional Asset Management, Inc. (since January 2011); General Counsel, Asset Management of the Sub-Adviser (May 2010-December 2010); Principal, The Vanguard Group (November 2005-April 2010); District Administrator, U.S. Securities and Exchange Commission (January 2003-October 2005). An officer of 91 portfolios in the OppenheimerFunds complex. |
| |
Jennifer Sexton,
Vice President and Chief
Business Officer
(since 2014) Year of Birth: 1969 | | Senior Vice President of OppenheimerFunds Distributor, Inc. (since June 2014); Vice President of OppenheimerFunds Distributor, Inc. (April 2006-June 2014); Vice President of the Sub-Adviser (January 1998-March 2006); Assistant Vice President of the Sub-Adviser (October 1991-December 1998). An officer of 91 portfolios in the OppenheimerFunds complex. |
90 OPPENHEIMER GLOBAL ALLOCATION FUND
| | |
Mary Ann Picciotto,
Chief Compliance
Officer and Chief
Anti-Money
Laundering Officer
(since 2014) Year of Birth: 1973 | | Senior Vice President and Chief Compliance Officer of the Manager (since March 2014); Chief Compliance Officer of the Sub-Adviser, OFI SteelPath, Inc., OFI Global Trust Company, OFI Global Institutional, Inc., Oppenheimer Real Asset Management, Inc., OFI Private Investments, Inc., Harborview Asset Management Corporation, Trinity Investment Management Corporation, and Shareholder Services, Inc. (since March 2014); Managing Director of Morgan Stanley Investment Management Inc. and certain of its various affiliated entities; Chief Compliance Officer of various Morgan Stanley Funds (May 2010-January 2014); Chief Compliance Officer of Morgan Stanley Investment Management Inc. (April 2007-January 2014). An officer of 91 portfolios in the OppenheimerFunds complex. |
| |
Brian W. Wixted,
Treasurer and
Principal Financial &
Accounting Officer
(since 1999) Year of Birth: 1959 | | Senior Vice President of the Manager (since January 2013); Treasurer of the Sub-Adviser, HarbourView Asset Management Corporation, Shareholder Financial Services, Inc., Shareholder Services, Inc., and Oppenheimer Real Asset Management, Inc. (March 1999-June 2008), OFI Private Investments, Inc. (March 2000-June 2008), OppenheimerFunds International Ltd. and OppenheimerFunds plc (since May 2000), OFI Institutional Asset Management, Inc. (November 2000-June 2008), and OppenheimerFunds Legacy Program (charitable trust program established by the Sub-Adviser) (June 2003-December 2011); Treasurer and Chief Financial Officer of OFI Trust Company (since May 2000); Assistant Treasurer of Oppenheimer Acquisition Corporation (March 1999-June 2008). An officer of 91 portfolios in the OppenheimerFunds complex. |
The Fund’s Statement of Additional Information contains additional information about the Fund’s Trustees and Officers and is available without charge upon request, by calling 1.800.CALL OPP (225.5677).
91 OPPENHEIMER GLOBAL ALLOCATION FUND
| | |
| |
| OPPENHEIMER GLOBAL ALLOCATION FUND | | |
| | |
| Manager | | OFI Global Asset Management, Inc. |
| |
| Sub-Adviser | | OppenheimerFunds, Inc. |
| |
| Distributor | | OppenheimerFunds Distributor, Inc. |
| |
Transfer and Shareholder
Servicing Agent | | OFI Global Asset Management, Inc. |
| |
| Sub-Transfer Agent | | Shareholder Services, Inc. |
| | DBA OppenheimerFunds Services |
| |
Independent Registered
Public Accounting Firm | | KPMG LLP |
| |
| Legal Counsel | | Kramer Levin Naftalis & Frankel LLP |
© 2014 OppenheimerFunds, Inc. All rights reserved.
92 OPPENHEIMER GLOBAL ALLOCATION FUND
As an Oppenheimer fund shareholder, you are entitled to know how we protect your personal information and how we limit its disclosure.
Information Sources
We obtain nonpublic personal information about our shareholders from the following sources:
| — | | Applications or other forms |
| — | | When you create a user ID and password for online account access |
| — | | When you enroll in eDocs Direct, our electronic document delivery service |
| — | | Your transactions with us, our affiliates or others |
| — | | A software program on our website, often referred to as a “cookie,” which indicates which parts of our site you’ve visited |
| — | | When you set up challenge questions to reset your password online |
If you visit oppenheimerfunds.com and do not log on to the secure account information areas, we do not obtain any personal information about you. When you do log on to a secure area, we do obtain your user ID and password to identify you. We also use this information to provide you with products and services you have requested, to inform you about products and services that you may be interested in and assist you in other ways.
We do not collect personal information through our website unless you willingly provide it to us, either directly by email or in those areas of the website that request information. In order to update your personal information (including your mailing address, email address and phone number) you must first log on and visit your user profile.
If you have set your browser to warn you before accepting cookies, you will receive the warning message with each cookie. You can refuse cookies by turning them off in your browser. However, doing so may limit your access to certain sections of our website.
We use cookies to help us improve and manage our website. For example, cookies help us recognize new versus repeat visitors to the site, track the pages visited, and enable some special features on the website. This data helps us provide a better service for our website visitors.
Protection of Information
We do not disclose any non-public personal information (such as names on a customer list) about current or former customers to anyone, except as permitted by law.
Disclosure of Information
Copies of confirmations, account statements and other documents reporting activity in your fund accounts are made available to your financial advisor (as designated by you). We may also use details about you and your investments to help us, our financial service affiliates, or firms that jointly market their financial products and services with ours, to better serve your investment needs or suggest financial services or educational material that may be of interest to you. If this requires us to provide you with an opportunity to “opt in” or “opt out” of such information sharing with a firm not affiliated with us, you will receive notification on how to do so, before any such sharing takes place.
Right of Refusal
We will not disclose your personal information to unaffiliated third parties (except as permitted by law), unless we first offer you a reasonable opportunity to refuse or “opt out” of such disclosure.
93 OPPENHEIMER GLOBAL ALLOCATION FUND
| | |
| |
| PRIVACY POLICY NOTICE Continued | | |
Internet Security and Encryption
In general, the email services provided by our website are encrypted and provide a secure and private means of communication with us. To protect your own privacy, confidential and/or personal information should only be communicated via email when you are advised that you are using a secure website.
As a security measure, we do not include personal or account information in non-secure emails, and we advise you not to send such information to us in non-secure emails. Instead, you may take advantage of the secure features of our website to encrypt your email correspondence. To do this, you will need to use a browser that supports Secure Sockets Layer (SSL) protocol.
We do not guarantee or warrant that any part of our website, including files available for download, are free of viruses or other harmful code. It is your responsibility to take appropriate precautions, such as use of an anti-virus software package, to protect your computer hardware and software.
| — | | All transactions, including redemptions, exchanges and purchases, are secured by SSL and 128-bit encryption. SSL is used to establish a secure connection between your PC and OppenheimerFunds’ server. It transmits information in an encrypted and scrambled format. |
| — | | Encryption is achieved through an electronic scrambling technology that uses a “key” to code and then decode the data. Encryption acts like the cable converter box you may have on your television set. It scrambles data with a secret code so that no one can make sense of it while it is being transmitted. When the data reaches its destination, the same software unscrambles the data. |
| — | | You can exit the secure area by either closing your browser, or for added security, you can use the Log Out button before you close your browser. |
Other Security Measures
We maintain physical, electronic and procedural safeguards to protect your personal account information. Our employees and agents have access to that information only so that they may offer you products or provide services, for example, when responding to your account questions.
How You Can Help
You can also do your part to keep your account information private and to prevent unauthorized transactions. If you obtain a user ID and password for your account, do not allow it to be used by anyone else. Also, take special precautions when accessing your account on a computer used by others.
Who We Are
This joint notice describes the privacy policies of the Oppenheimer funds, OppenheimerFunds, Inc., each of its investment adviser subsidiaries, OppenheimerFunds Distributor, Inc. and OFI Global Trust Co. It applies to all Oppenheimer fund accounts you presently have, or may open in the future, using your Social Security number—whether or not you remain a shareholder of our funds. This notice was last updated November 2014. In the event it is updated or changed, we will post an updated notice on our website at oppenheimerfunds.com. If you have any questions about this privacy policy, write to us at P.O. Box 5270, Denver, CO 80217-5270, email us by clicking on the Contact Us section of our website at oppenheimerfunds.com or call us at 1.800.CALL OPP (225.5677).
94 OPPENHEIMER GLOBAL ALLOCATION FUND
THIS PAGE INTENTIONALLY LEFT BLANK.
95 OPPENHEIMER GLOBAL ALLOCATION FUND

Table of Contents
Class A Shares
AVERAGE ANNUAL TOTAL RETURNS AT 10/31/14
| | | | | | | | | | | | | | | | | | | | |
| | | Class A Shares of the Fund | | | | |
| | | Without Sales Charge | | With Sales Charge | | S&P 500 Index | | HFRI Fund Weighted
Composite Index |
1-Year | | | | 8.82 | % | | | | 2.57 | % | | | | 17.27 | % | | | | 4.99 | % |
5-Year | | | | 3.98 | | | | | 2.75 | | | | | 16.69 | | | | | 5.13 | |
10-Year | | | | 4.14 | | | | | 3.53 | | | | | 8.20 | | | | | 5.58 | |
Performance data quoted represents past performance, which does not guarantee future results. The investment return and principal value of an investment in the Fund will fluctuate so that an investor’s shares, when redeemed, may be worth more or less than their original cost. Fund returns include changes in share price, reinvested distributions, and a 5.75% maximum applicable sales charge except where “without sales charge” is indicated. Current performance may be lower or higher than the performance quoted. Returns do not consider capital gains or income taxes on an individual’s investment. For performance data current to the most recent month-end, visit oppenheimerfunds.com or call
1.800.CALL OPP (225.5677).
| | |
| 2 | | OPPENHEIMER FLEXIBLE STRATEGIES FUND |
Fund Performance Discussion
The Fund’s Class A shares (without sales charge) produced a total return of 8.82% for the twelve month period ending 10/31/14. The Fund outperformed its benchmark, the HFRI Fund Weighted Composite Index, which returned 4.99%, by 383 basis points. The Fund also meaningfully outperformed its peers in the Morningstar Multialternative category, which produced an average return of 2.87% during the same period, by 595 basis points. The Fund’s Equity Hedge strategy was the largest contributor to performance followed by its Long/Short Credit strategy. The Relative Value strategy was a modest contributor to performance while the Global Macro strategy was a detractor. In fact, the Fund’s Equity Hedge strategy, which consists of long and short positions in equities, generated a total return of 16.63%, outperforming the HFRI Long/Short Equity Index (which represents the long/short equity portion of the benchmark), by 1,206 basis points over the reporting period. (These long/short equity returns are reported gross of fees and before any cash allocation. We report these numbers separately to provide some insight into how this part of the Fund performed as compared to the equity portion of the benchmark. All other performance numbers are reported net of fees.) Finally, Morningstar ranked the Fund’s Class A shares in the second percentile (7 out of 313 funds) in the Multialternative category for the one-year period ended 10/31/14 (ranking is based on total return without considering sales charges.)
COMPARISON OF CHANGE IN VALUE OF $10,000 HYPOTHETICAL INVESTMENTS IN:
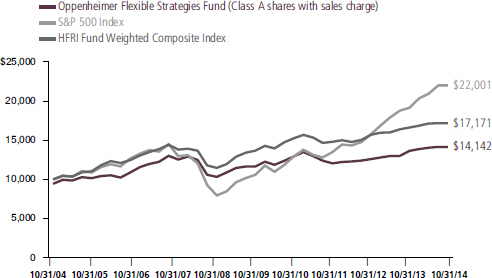
Endnotes for this discussion begin on page 15.
| | |
| 3 | | OPPENHEIMER FLEXIBLE STRATEGIES FUND |
The Fund is designed to pursue strong risk-adjusted returns on a long-term basis in a variety of market conditions by employing broad and flexible alternative mandates across capital structures and asset classes. The Fund seeks to provide investors with strong risk-adjusted returns that have low sensitivity to traditional market factors over the long term. The investment team’s process has an underlying value philosophy that combines bottom-up and top-down fundamental analysis for security selection and portfolio construction. The Fund is able to invest both long and short across many asset classes. The investment team’s views are expressed across four alternative investment strategies including Equity Hedge, Long/Short Credit, Global Macro and Relative Value, which are designed to make the Fund truly flexible. Although many investors focus on the short-term outlook when considering potential investments, the Fund utilizes a long-term approach. We look at changing dynamics on both a macroeconomic and microeconomic basis over a multi-year time horizon to uncover investment opportunities which emerge from change.
The Fund is designed to provide investors with strong risk-adjusted returns, high alpha, low beta, low volatility and good downside risk mitigation. Our strategy seeks to offer investors access to idiosyncratic returns, which means the Fund marches to the beat of its own drum, not that of the broader equity and fixed income
markets. This characteristic helps to explain the Fund’s low beta of 0.22 to the S&P 500 Index and its negative beta of 0.05 to the Barclays U.S. Aggregate Bond Index for the period from 3/31/12 to 9/30/14.
We believe that upside/downside capture ratios are an important measure of the Fund’s downside protection. The upside capture ratio is the cumulative performance of the Fund in all up months divided by the cumulative return of its benchmark. The downside capture ratio is the opposite. For the period from 3/31/12 to 9/30/14, the Fund’s upside capture was 83% and its downside capture was 41% versus the HFRI Fund Weighted Composite Index. This demonstrates that the Fund has been able to deliver much more upside than downside, with the Fund capturing 83% of the upside of the HFRI Fund Weighted Composite Index in up markets, and capturing only 41% of the downside of the HFRI Fund Weighted Composite Index in down markets. In contrast, the Morningstar Multialternative peer group had an upside capture of 62% and a downside capture of 107% versus the HFRI Fund Weighted Composite Index over the same period, which means it too has delivered asymmetric returns but in the wrong direction. We believe our upside/downside capture ratio is a testament to the Fund’s intelligent blending of multiple strategies and asset classes as well as its ability to generate idiosyncratic and asymmetric returns.
| | |
| 4 | | OPPENHEIMER FLEXIBLE STRATEGIES FUND |
The periodic sharp declines in the equity markets this year, including the selloffs in January and September/October, suggest that investors should remain mindful of risk. The partisan dysfunction in Washington continues unabated, structural flaws in Europe and Japan remain unresolved, the emerging markets and many developed markets are stuck in low gear, the Eurozone is on recession watch, and continuing issues in Russia/Ukraine, the Middle East and West Africa have caused spikes in geopolitical risk. Highly accommodative central banks around the world, the Federal Reserve’s (the “Fed”) measured pace of tapering and extremely low market volatility for the last two years have helped to mask structural weaknesses that remain unaddressed. The Fund’s multi-asset class approach offers the flexibility to navigate what we see as a dynamic, unpredictable and still challenging environment.
MARKET OVERVIEW
For the twelve month period ending October 31, 2014, market movements continued to be driven by central bank policies. Through the end of 2013, central banks around the world maintained their accommodative policies that resulted in a rally among risk markets. In the U.S., the Fed began tapering its most recent quantitative easing (“QE”) program in January 2014 and completed the process (thereby ending the program’s purchases) on October 31. The Fed reduced its
monthly purchases of U.S. government Treasuries and mortgage-backed securities (“MBS”) in steady $10 billion increments, which helped reduced market volatility and enabled investors to prepare for a post-QE market environment. The QE program was designed to help boost the U.S. economy by keeping mortgage rates and other long-term interest rates low, but a primary benefit to investors has turned out to be its contribution to asset price inflation.
The U.S. equity market had several sharp selloffs in 2014. Starting in January, parts of the U.S. faced unusually cold weather, economic data began to weaken and the Fed announced another $10 billion reduction in monthly purchases of Treasuries and MBS at its second consecutive meeting. Investors reacted strongly as volatility spiked and the S&P 500 Index fell 5.5% into early February. Equity markets in Europe and Japan also fell early in the year. However, interest rates reversed course from 2013 with the 10-year Treasury yield rallying 45 basis points into early February. Equity markets in the U.S. then recovered and began grinding higher as investors came to the realization that an end to QE did not necessarily imply an imminent increase in short-term interest rates.
Starting in mid-September, volatility spiked again as the Chicago Board Options Exchange Market Volatility Index (the
| | |
| 5 | | OPPENHEIMER FLEXIBLE STRATEGIES FUND |
“CBOE VIX Index”) climbed 108% and the S&P 500 Index sold off 7.5% in a matter of weeks.1 However, the market soon stabilized before going on to set a new all-time high on October 31, the final day of the QE program. Interest rates in the U.S. continued to rally through the end of the reporting period, with the 10-year Treasury yield falling 69 basis points to 2.34% by 10/31/14.
Turning to Europe, in an effort to address the sovereign debt crisis, persistently slow growth and the risk of deflation, the European Central Bank (“ECB”) adopted a number of policies designed to stimulate growth. However, while the U.S. embarked on what has become a series of successive QE programs, Europe has relied on a combination of austerity and stimulus in an effort to recover from the global financial crisis. Both strategies have resulted in disappointing economic growth, with GDP in the U.S. and Eurozone expanding at less than 1.50% in the first half of 2014. In Japan, which has been mired in economic weakness for years, the Abe administration has adopted even more aggressive economic policies (“Abenomics”) with the Bank of Japan (the “BoJ”) executing a massive QE program. However, the results have not been particularly impressive, with that economy slipping back into recession in the third quarter of 2014 following the
consumption tax increase. We believe there are significant risks and could be unintended consequences from such aggressive policies.
FUND REVIEW
Equity Hedge Strategy. The Fund’s Equity Hedge strategy was the major contributor to performance during the reporting period. In the long component of this strategy, the top performers were AerCap Holdings NV and Actavis plc, while the largest detractors were Noble Energy, Inc. and Canadian Natural Resources. In the short component of the strategy, the largest contributors were our positions in Cliffs Natural Resources Ltd. and Walter Energy, Inc., while the biggest detractors were SanDisk Corp. and BJ’s Restaurants, Inc.
AerCap, a global aircraft lessor based in Netherlands, was a positive contributor to performance. The acquisition of AIG’s aircraft leasing business (“ILFC”), which transformed the company into the largest leasing company in the world, was the primary positive catalyst for the stock. The company also benefited from a favorable aircraft leasing market outlook for 2014 on the back of strong demand, controlled supply, and increasing air traffic. The company also announced a series of positive earnings results, reflecting the favorable operating environment for aircraft
1. The CBOE VIX Index is a measure of market expectations of near-term volatility conveyed by S&P 500 stock index option prices.
| | |
| 6 | | OPPENHEIMER FLEXIBLE STRATEGIES FUND |
lessors. In addition, the company successfully integrated ILFC into its operations, generating more efficiencies than expected. The implications are that AerCap is on track to achieve its $1 billion+ (roughly $5/share) earnings run-rate target later this calendar year instead of in 2015, and that this should enable the company to regain its investment grade debt rating sooner than expected. The combination of these factors helped send the shares higher during the reporting period.
Actavis, a specialty pharmaceutical company that markets branded drugs for patients suffering from diseases principally in the central nervous system, gastroenterology and women’s health categories, also contributed to performance. The company sells approximately 1,000 generic and branded pharmaceutical products globally through operations in more than 60 countries. In early July, Actavis closed its acquisition of Forest Laboratories, which strengthened its existing gastroenterology business and expanded it into new areas of cognitive neuroscience, cardiovascular, respiratory, cystic fibrosis and infectious diseases. In addition to its organic growth potential, Actavis now has an improved tax structure and financial flexibility which allow it to consider additional acquisitions to bolster its branded and generic businesses. These factors could also potentially make it attractive as an acquisition target.
Noble Energy, a U.S. oil and natural gas exploration and production company,
detracted from performance during the period due largely to the decline in oil prices. Investors became concerned about Noble’s ability to drive 16-18% year-over-year annual growth for the next five years, with a development capital expenditure budget looking to be higher than the company’s operating cash flow. In addition, investors have been concerned with slowing production growth from the Wattenberg field due to a midstream bottleneck.
Canadian Natural Resources, a Canadian oil and natural gas exploration and production company, also detracted from performance due largely to the decline in oil prices. The company’s exposure to oil sands hurt in part because of investor perception that oil sands sit at the high end of the oil production cost curve. In addition, the company faced production hiccups at two of its key oil sands projects, Kirby and Primrose.
Our short positions in Cliffs Natural Resources (an iron ore producer) and Walter Energy (a metallurgical coal producer) contributed to performance during the period. These are positions we have owned since 2012 based on our thesis about the changing (and less steel intensive) growth profile in China. These short positions have worked extremely well so far, with the stock price of Walter Energy falling an impressive 93% from the start of the fourth quarter in 2012 to 10/31/14, while the stock price of Cliffs Natural Resources has fallen 71% over the same period. During the reporting
| | |
| 7 | | OPPENHEIMER FLEXIBLE STRATEGIES FUND |
period, a sharp rise in the U.S. dollar combined with declining commodity prices (including iron ore and met coal) helped drive these stocks lower, once again benefitting our short positions. Cliffs Natural Resources continues to struggle due to an oversupplied iron ore market and its position as a higher cost producer. Walter Energy has been hurt by a bloated cost structure against the backdrop of an oversupplied market as well. It also has a highly levered balance sheet, which raises the risk of bankruptcy.
Our short position in SanDisk detracted from performance as the company’s operations benefited from continued supply constraints in its core memory market. SanDisk was a key contributor to the industry’s discipline as it pulled back investment in new capacity in an effort to ensure the market remained in alignment. We think there is incremental risk to industry supply/demand balance going forward. For example, SanDisk has less flexibility to constrain supply going forward. The company’s underinvestment benefited the industry but negatively impacted SanDisk’s market share, and is starting to impact its ability to fulfill customer commitments. In addition, we expect lower cost memory from Samsung to enter the market in a more disruptive way in 2015.
Likewise, our short position in BJ’s Restaurants negatively impacted performance. Although the company faces many competitive issues within the casual dining industry, its results have benefited
from unexpected success in cost cutting. For now, management has been able to reduce the impact of commodity food inflation and has generated some kitchen-related labor cost savings. As investors gain a better understanding of these initiatives, we believe their attention will shift to BJ’s ability to drive traffic. We believe this will be more difficult for the company in light of the variety of competitors populating the industry.
Opportunistic Strategies. The Fund’s opportunistic strategies include Long/Short Credit, Global Macro and Relative Value. Long/Short Credit was a significant contributor to the Fund’s outperformance during the reporting period, Relative Value was a modest contributor, and Global Macro was a detractor. In terms of individual holdings, the top performers were our positions in senior bank loans through an investment in Oppenheimer Master Loan Fund, LLC, a non-residential mortgage-backed security (“RMBS”) and our short position in the yen. The largest detractors were our credit default swaps (“CDS”) on Italian and Austrian sovereign credit, and our long position in gold.
Within the Long/Short Credit strategy, our position in Oppenheimer Master Loan Fund, LLC was a meaningful contributor to performance during the period. Senior loans, with their floating rates, short durations, senior and secured place in the capital structure and relatively high yields, performed well in 2013 as interest rates backed up.
| | |
| 8 | | OPPENHEIMER FLEXIBLE STRATEGIES FUND |
Flows into the asset class were also strong early in the reporting period before they began to moderate and eventually turn negative. Nonetheless, a combination of reduced loan issuance, strong credit performance and increased collateralized loan obligation issuance offset negative flows into mutual funds and resulted in solid performance from senior loans. Defaults remained low throughout the period, and the asset class held up well during the market correction in September/October due to its senior and securitized position in the capital structure.
Also within the Long/Short Credit strategy, our position in Structured Asset Securities Corp. Mortgage Loan Trust, Series 2007 GEL2 A2, a front pay non-agency RMBS, contributed to performance. This bond is backed by residential mortgages. During the last twelve months, it began receiving principal payments as the senior A2 bond was paid off. This improvement in the bond’s cash flow characteristics resulted in an improvement in its valuation.
Our long U.S. dollar / short Japanese yen position, part of our Global Macro strategy, contributed to performance as well. The yen weakened dramatically as Japanese economic data disappointed, GDP contracted 7.1% in the second quarter, and the economy slipped into another recession in the third quarter. The rebound following the introduction of the consumption tax was
significantly weaker than expected, leading to expectations that more quantitative easing and currency devaluation would be needed to help revive growth. In fact, that is precisely what occurred as the BoJ doubled down on its QE program on October 31, sending the yen sharply lower versus the dollar. Against this backdrop, the Fed tapered its QE program steadily throughout 2014, and officially ended its program purchases on October 31. This normalization of monetary policy in the U.S. (at least on a relative basis) helped send the dollar sharply higher against a number of major currencies, including the yen.
Our long positions in Italian and Austrian CDS within the Global Macro strategy, which are functional short positions on Italian and Austrian sovereign credit, detracted from performance during the period. We believe that many structural weaknesses remain unaddressed in Europe, just as they do in the U.S. and Japan. However, continued support for peripheral Europe by the European Union decreased credit concerns for Italy and Austria, despite poor economic performance in those countries, which negatively impacted these CDS positions.
Finally, our long position in gold in the Global Macro strategy detracted from performance as the yellow metal fell by 11.3% (or $150) to $1,172 per troy ounce during the reporting period. After rising early in 2014, commodities in general were under
| | |
| 9 | | OPPENHEIMER FLEXIBLE STRATEGIES FUND |
pressure in the second half of the period, and gold as well as the other precious metals were no exception. Investors wrestled with the anticipated ending in October of the Fed’s current QE program, while at the same time the ECB was launching its own QE effort and the BoJ continued to pump money into the economy. Partly as a result, the U.S. dollar rose sharply. At the same time, inflation expectations fell, real interest rates climbed, and investors became increasingly concerned about a potentially hawkish change in U.S. monetary policy. After the end of the third quarter, some of this reversed. All of these factors tend to be bearish for gold, and they helped to put pressure on pricing later in the reporting period.
OUTLOOK
The macro environment remains complex and we continue to see numerous cross currents. While equities look interesting versus bonds in the mid to longer term, we see a shorter-term disconnect between the strong performance in equities well in excess of earnings growth, and occurring despite negative earnings revisions. Simply put, the U.S. equity market moved meaningfully ahead of earnings growth in 2012-2013, and valuations climbed to the point where U.S. equities are no longer inexpensive, which means security selection really matters and volatility is likely to increase. Extremely accommodative monetary policies around the world have impacted all asset classes, including equities, and have been an important driver of rising asset prices during
the last several years. We believe that any normalization of rates and/or the withdrawal of central bank stimulus could pressure risk asset prices significantly. We also believe that there is more risk lurking beneath the surface of the market than many investors recognize, but it has been masked by unusually accommodative monetary policy, unusually low interest rates, unusually low volatility and adequate market liquidity.
More broadly, Treasury rates seem range bound in the near term absent some exogenous shock, with yields oscillating between 2% and 3%. In the longer run, however, we do not believe rates this low are sustainable. Although the economy expanded at less than 1.5% in the first half of 2014, that growth rate actually makes the U.S. look attractive compared to other geographic regions. Japan is becoming more desperate as consumption falls and evidence mounts that Abenomics is not working. Abenomics aimed to revive the Japanese economy with “three arrows.” The third arrow in the quiver—meaningful structural reform—is proving to be a significant challenge. The Japanese economy contracted 7.1% in the second quarter of 2014, and then slipped back into recession in the third quarter, despite the BoJ’s aggressive QE efforts. The economy is not bouncing back as expected from an increase in the consumption tax. In our view, early evidence that the market is becoming disillusioned with Abenomics will center around a weakening yen. Indeed, that is happening
| | |
| 10 | | OPPENHEIMER FLEXIBLE STRATEGIES FUND |
today, and has been for some time. Additional evidence could involve investors’ loss of faith in the supposed omnipotence of the BoJ and the efficacy of its continuing QE efforts.
Against this backdrop, growth in Europe is stagnating with the three largest economies showing near zero to negative GDP growth in the third quarter. Last year, the ECB’s balance sheet was shrinking due to Long-Term Refinancing Operations (“LTRO”) funds being repaid while the balance sheet of the Fed was expanding as it bought $1.12 trillion of securities. Going into the end of 2014 and during 2015, we expect this to reverse as the Fed stops buying, LTRO payments abate and the ECB potentially expands its own QE efforts. It is precisely because growth is so slow in the Eurozone that the ECB is now considering administering its own form of QE six years after the U.S. first went down that path. While we believe that more stimulative monetary policy from the ECB could help inflate asset prices in the near term, we believe the real impediment to growth is the lack of meaningful structural reform over the last six years. As central banks in these regions resort to more aggressive policy, the Fed has ended its latest QE program, which is sending the dollar sharply higher against other currencies. Partly as a result of this, as well as issues specific to the various regions in question, we hold positions that are long the U.S. dollar and short other currencies. We believe this relative divergence in monetary policy could ultimately feed through
to interest rates. Currently, the moves that historically could have occurred in the rates markets are being pushed to the currency markets due to the central banks’ aggressive monetary policy holding rates low.
At the same time, we believe the U.S. economy still has attractive growth potential in certain areas. For example, we believe the energy renaissance is real and can have significant positive ripple effects through other parts of the economy. Our positions in chemical producers are partly a play on the differentiated costs of feedstock that result from cheap and abundant natural gas in the U.S. versus more scarce and expensive oil in Europe and elsewhere. This advantage still holds true even in a lower oil price environment as we have seen in the last few months. In addition, a variety of changes in the technology and pharmaceutical sectors could create a host of winners and losers, and could drive growth in a number of related areas. Nonetheless, we are mindful that U.S. equity valuations are pushing up against the edge of bubble territory after several years when S&P 500 Index performance ran well ahead of earnings growth, leading to significant multiple expansion. In addition, volatility has been artificially restrained by highly accommodative monetary policy, and could pick up again now that the Fed has ended its most recent QE program. In the past few years, whenever equities sold off, buyers typically stepped in quickly because valuations were still relatively attractive. Because valuations are less attractive today,
| | |
| 11 | | OPPENHEIMER FLEXIBLE STRATEGIES FUND |
selloffs could be steeper and it could take longer for buyers to appear. Moreover, banking regulations are significantly stricter, the fixed income markets are a lot less liquid, and banks are holding significantly fewer bonds in inventory due to capital constraints. Under these circumstances, we believe that any softness in the markets could lead to more volatility on the fixed income side than we have seen in recent years.
Accordingly, we continue to pick our spots, selecting securities that we believe offer
attractive risk-adjusted returns. We remain focused on controlling volatility, mitigating downside risk, and generating returns that are both idiosyncratic and asymmetric. We expect to be in a low return world for a while. We believe that the ability to generate attractive returns efficiently and without taking on undue risk will be of greater value to investors in a low return world, and that is where our investment team’s efforts are focused.
| | |
 | | 
Michelle Borré, CFA Portfolio Manager |
| | |
| 12 | | OPPENHEIMER FLEXIBLE STRATEGIES FUND |
Portfolio Positioning
LONG/SHORT CREDIT STRATEGY ALLOCATIONS
| | | | | | | | | | | | | | | |
| | | | | Long | | | Short | | | | Net | |
Asset Backed Securities | | | | 16.11 | % | | —% | | | | 16.11 | % |
Bank Loans | | | | 13.79 | | | — | | | | 13.79 | |
Non-Convertible Bonds | | | | 3.32 | | | — | | | | 3.32 | |
Non-Convertible Preferred Stocks | | | | 2.56 | | | — | | | | 2.56 | |
Municipal Bonds | | | | 0.29 | | | — | | | | 0.29 | |
Bond Futures | | | | — | | | -1.53 | | | | -1.53 | |
EQUITY HEDGE STRATEGY ALLOCATIONS
| | | | | | | | | | |
| | | | Long | | | Short | | | Net | |
Common Stocks | | | 53.14 | % | | -24.89% | | | 28.25 | % |
Convertible Bonds | | | 0.42 | | | — | | | 0.42 | |
Private Securities | | | 0.11 | | | — | | | 0.11 | |
Equity Total Return Swaps | | | 0.77 | | | — | | | 0.77 | |
GLOBAL MACRO STRATEGY ALLOCATIONS
| | | | | | | | | | |
| | | | Long | | | Short | | | Net | |
Credit Default Swaps | | | — | % | | -8.55% | | | -8.55 | % |
Bond Futures | | | — | | | -7.64 | | | -7.64 | |
Swaptions | | | — | | | -6.46 | | | -6.46 | |
Currency Forwards | | | 0.54 | | | -5.45 | | | -4.92 | |
Commodity Futures | | | 2.61 | | | — | | | 2.61 | |
Bond Calls | | | 1.63 | | | — | | | 1.63 | |
Portfolio holdings and allocations are dollar-weighted based on assets and are subject to change. Holdings exclude cash and cash equivalents. As of 10/31/14, the Fund held 22.7% of total net assets in collateral cash held at prime brokers and 5.0% of total net assets in net cash. Totals may not equal individual weights due to rounding. Percentages are as of October 31, 2014. Negative weightings may result from the use of leverage. Leverage involves the use of various financial instruments or borrowed capital in an attempt to increase investment return. Leverage risks include potential for higher volatility, greater decline of the Fund’s net asset value and fluctuations of dividends and distributions paid by the Fund.
| | |
| 13 | | OPPENHEIMER FLEXIBLE STRATEGIES FUND |
RELATIVE VALUE STRATEGY ALLOCATIONS
| | | | | | | | | | |
| | | | Long | | | Short | | | Net | |
Credit Default Swaps | | | 3.13 | % | | -5.59% | | | -2.46 | % |
Bank Loans | | | 2.45 | | | — | | | 2.45 | |
| | |
TOTAL PORTFOLIO ALLOCATIONS | | | | | | | |
| | | | Long | | | Short | | | Net | |
Long/Short Credit | | | 36.07 | % | | -1.53% | | | 34.54 | % |
Equity Hedge | | | 54.44 | | | -24.89 | | | 29.55 | |
Global Macro | | | 4.78 | | | -28.10 | | | 23.32 | |
Relative Value | | | 5.57 | | | -5.59 | | | — | |
Total Portfolio | | | 100.87 | % | | -60.12% | | | 40.75 | % |
Portfolio holdings and allocations are dollar-weighted based on assets and are subject to change. Holdings exclude cash and cash equivalents. As of 10/31/14, the Fund held 22.7% of total net assets in collateral cash held at prime brokers and 5.0% of total net assets in net cash. Totals may not equal individual weights due to rounding. Percentages are as of October 31, 2014. Negative weightings may result from the use of leverage. Leverage involves the use of various financial instruments or borrowed capital in an attempt to increase investment return. Leverage risks include potential for higher volatility, greater decline of the Fund’s net asset value and fluctuations of dividends and distributions paid by the Fund.
| | |
| 14 | | OPPENHEIMER FLEXIBLE STRATEGIES FUND |
Share Class Performance
AVERAGE ANNUAL TOTAL RETURNS WITHOUT SALES CHARGE AS OF 10/31/14
| | | | | | | | | | | | | | | | |
| | | Inception Date | | | 1-Year | | | 5-Year | | | 10-Year | |
Class A (QVOPX) | | | 1/3/89 | | | | 8.82% | | | | 3.98% | | | | 4.14% | |
Class B (QOPBX) | | | 9/1/93 | | | | 7.97% | | | | 3.08% | | | | 3.64% | |
Class C (QOPCX) | | | 9/1/93 | | | | 8.00% | | | | 3.20% | | | | 3.36% | |
Class I (QOPIX) | | | 2/28/13 | | | | 9.25% | | | | 7.40% | * | | | N/A | |
Class R (QOPNX) | | | 3/1/01 | | | | 8.54% | | | | 3.65% | | | | 3.80% | |
Class Y (QOPYX) | | | 12/16/96 | | | | 9.06% | | | | 4.26% | | | | 4.39% | |
|
AVERAGE ANNUAL TOTAL RETURNS WITH SALES CHARGE AS OF 10/31/14 | |
| | | Inception Date | | | 1-Year | | | 5-Year | | | 10-Year | |
Class A (QVOPX) | | | 1/3/89 | | | | 2.57% | | | | 2.75% | | | | 3.53% | |
Class B (QOPBX) | | | 9/1/93 | | | | 2.97% | | | | 2.72% | | | | 3.64% | |
Class C (QOPCX) | | | 9/1/93 | | | | 7.00% | | | | 3.20% | | | | 3.36% | |
Class I (QOPIX) | | | 2/28/13 | | | | 9.25% | | | | 7.40% | * | | | N/A | |
Class R (QOPNX) | | | 3/1/01 | | | | 7.54% | | | | 3.65% | | | | 3.80% | |
Class Y (QOPYX) | | | 12/16/96 | | | | 9.06% | | | | 4.26% | | | | 4.39% | |
| * | Shows performance since inception. |
Performance data quoted represents past performance, which does not guarantee future results. The investment return and principal value of an investment in the Fund will fluctuate so that an investor’s shares, when redeemed, may be worth more or less than their original cost. Current performance may be lower or higher than the performance quoted. Returns do not consider capital gains or income taxes on an individual’s investment. For performance data current to the most recent month-end, visit oppenheimerfunds.com or call 1.800.CALL OPP (225.5677). Fund returns include changes in share price, reinvested distributions, and the applicable sales charge: for Class A shares, the current maximum initial sales charge of 5.75%; for Class B shares, the contingent deferred sales charge of 5% (1-year) and 2% (5-year); and for Class C shares, the contingent deferred sales charge (“CDSC”) of 1% for the 1-year period. Prior to 7/1/14, Class R shares were named Class N shares. Beginning 7/1/14, new purchases of Class R shares will no longer be subject to a CDSC upon redemption (any CDSC will remain in effect for purchases prior to 7/1/14). There is no sales charge for Class I and Class Y shares. Because Class B shares convert to Class A shares 72 months after purchase, the 10-year return for Class B shares uses Class A performance for the period after conversion.
The Fund’s performance is compared to the performance of the S&P 500 Index and the HFRI Fund Weighted Composite Index. The S&P 500 Index is a capitalization-weighted index of 500 stocks intended to be a representative sample of leading companies in leading industries within the U.S. economy. The HFRI Fund Weighted Composite Index is a global, equal-weighted index of over 2,000 single-manager funds that report to HFR Database. Constituent funds report monthly net of all fees performance in U.S. Dollars and have a minimum of $50 million under management or a twelve (12) month track record of active performance. The HFRI Fund Weighted Composite Index’s returns are calculated three times each month and are subject to periodic recalculation by Hedge Fund Research, Inc. As a result, the HFRI Fund
| | |
| 15 | | OPPENHEIMER FLEXIBLE STRATEGIES FUND |
Weighted Composite Index returns shown may differ from the same Index’s returns for the same period published elsewhere. If subsequent recalculations cause the Index’s returns to change, the Fund does not expect to update the Index returns. The indices are unmanaged and cannot be purchased directly by investors. While index comparisons may be useful to provide a benchmark for the Fund’s performance, it must be noted that the Fund’s investments are not limited to the investments comprising the indices. Index performance includes reinvestment of income, but does not reflect transaction costs, fees, expenses or taxes. Index performance is shown for illustrative purposes only as a benchmark for the Fund’s performance, and does not predict or depict performance of the Fund. The Fund’s performance reflects the effects of the Fund’s business and operating expenses.
Morningstar ranked the Fund’s Class A shares in the 61st percentile (66 out of 107 funds) and in the 40th percentile (7 out of 16 funds) in the Multialternative category for the five-year and ten-year periods ended 10/31/14, respectively. Ranking is for Class A shares and ranking may include more than one share class of funds in the category, including other shares classes of the Fund. Ranking is based on total return as of 10/31/14, without considering sales charges. Different share classes may have different expenses and performance characteristic.
The Fund’s investment strategy and focus can change over time. The mention of specific fund holdings does not constitute a recommendation by OppenheimerFunds, Inc. or its affiliates.
Before investing in any of the Oppenheimer funds, investors should carefully consider a fund’s investment objectives, risks, charges and expenses. Fund prospectuses and summary prospectuses contain this and other information about the funds, and may be obtained by asking your financial advisor, visiting oppenheimerfunds.com, or calling 1.800.CALL OPP (225.5677). Read prospectuses and summary prospectuses carefully before investing.
Shares of Oppenheimer funds are not deposits or obligations of any bank, are not guaranteed by any bank, are not insured by the FDIC or any other agency, and involve investment risks, including the possible loss of the principal amount invested.
| | |
| 16 | | OPPENHEIMER FLEXIBLE STRATEGIES FUND |
Fund Expenses
Fund Expenses. As a shareholder of the Fund, you incur two types of costs: (1) transaction costs, which may include sales charges (loads) on purchase payments, contingent deferred sales charges on redemptions; and (2) ongoing costs, including management fees; distribution and service fees; and other Fund expenses. These examples are intended to help you understand your ongoing costs (in dollars) of investing in the Fund and to compare these costs with the ongoing costs of investing in other mutual funds.
The examples are based on an investment of $1,000.00 invested at the beginning of the period and held for the entire 6-month period ended October 31, 2014.
Actual Expenses. The first section of the table provides information about actual account values and actual expenses. You may use the information in this section for the class of shares you hold, together with the amount you invested, to estimate the expense that you paid over the period. Simply divide your account value by $1,000.00 (for example, an $8,600.00 account value divided by $1,000.00 = 8.60), then multiply the result by the number in the first section under the heading entitled “Expenses Paid During 6 Months Ended October 31, 2014” to estimate the expenses you paid on your account during this period.
Hypothetical Example for Comparison Purposes. The second section of the table provides information about hypothetical account values and hypothetical expenses based on the Fund’s actual expense ratio for each class of shares, and an assumed rate of return of 5% per year for each class before expenses, which is not the Fund’s actual return. The hypothetical account values and expenses may not be used to estimate the actual ending account balance or expenses you paid for the period. You may use this information to compare the ongoing costs of investing in the Fund and other funds. To do so, compare this 5% hypothetical example for the class of shares you hold with the 5% hypothetical examples that appear in the shareholder reports of the other funds.
Please note that the expenses shown in the table are meant to highlight your ongoing costs only and do not reflect any transactional costs, such as front-end or contingent deferred sales charges (loads). Therefore, the “hypothetical” section of the table is useful in comparing ongoing costs only, and will not help you determine the relative total costs of owning different funds. In addition, if these transactional costs were included, your costs would have been higher.
| | |
| 17 | | OPPENHEIMER FLEXIBLE STRATEGIES FUND |
| | | | | | | | | | | | |
| Actual | | Beginning
Account
Value
May 1, 2014 | | | Ending Account Value
October 31, 2014 | | | Expenses
Paid During
6 Months Ended
October 31, 2014 | |
Class A | | $ | 1,000.00 | | | $ | 1,019.50 | | | $ | 11.11 | |
Class B | | | 1,000.00 | | | | 1,015.80 | | | | 15.00 | |
Class C | | | 1,000.00 | | | | 1,015.70 | | | | 15.00 | |
Class I | | | 1,000.00 | | | | 1,022.00 | | | | 8.75 | |
Class R | | | 1,000.00 | | | | 1,018.40 | | | | 12.33 | |
Class Y | | | 1,000.00 | | | | 1,020.90 | | | | 9.88 | |
| | | |
Hypothetical | | | | | | | | | | | | |
(5% return before expenses) | | | | | | | | | | | | |
Class A | | | 1,000.00 | | | | 1,014.27 | | | | 11.08 | |
Class B | | | 1,000.00 | | | | 1,010.44 | | | | 14.96 | |
Class C | | | 1,000.00 | | | | 1,010.44 | | | | 14.96 | |
Class I | | | 1,000.00 | | | | 1,016.59 | | | | 8.73 | |
Class R | | | 1,000.00 | | | | 1,013.06 | | | | 12.30 | |
Class Y | | | 1,000.00 | | | | 1,015.48 | | | | 9.85 | |
Expenses are equal to the Fund’s annualized expense ratio for that class, multiplied by the average account value over the period, multiplied by 184/365 (to reflect the one-half year period). Those annualized expense ratios, excluding indirect expenses from affiliated funds, based on the 6-month period ended October 31, 2014 are as follows:
| | | | |
| Class | | Expense Ratios | |
Class A | | | 2.17 | % |
Class B | | | 2.93 | |
Class C | | | 2.93 | |
Class I | | | 1.71 | |
Class R | | | 2.41 | |
Class Y | | | 1.93 | |
The expense ratios reflect voluntary and/or contractual waivers and/or reimbursements of expenses by the Fund’s Manager and Transfer Agent. Some of these undertakings may be modified or terminated at any time, as indicated in the Fund’s prospectus. The “Financial Highlights” tables in the Fund’s financial statements, included in this report, also show the gross expense ratios, without such waivers or reimbursements and reduction to custodian expenses, if applicable.
| | |
| 18 | | OPPENHEIMER FLEXIBLE STRATEGIES FUND |
CONSOLIDATED STATEMENT OF INVESTMENTS October 31, 2014
| | | | | | | | |
| | | Shares | | | Value | |
Common Stocks—50.7% | | | | | | | | |
Consumer Discretionary—7.0% | | | | | | | | |
Hotels, Restaurants & Leisure—1.4% | | | | | | | | |
Brinker International, Inc. | | | 219,599 | | | $ | 11,779,290 | |
Media—3.3% | | | | | | | | |
Cinemark Holdings, Inc.1 | | | 363,000 | | | | 12,821,160 | |
Comcast Corp., Cl. A | | | 248,400 | | | | 13,748,940 | |
| | | | | | | | |
| | | | | | | 26,570,100 | |
Multiline Retail—2.3% | | | | | | | | |
Dollar General Corp.2 | | | 75,000 | | | | 4,700,250 | |
Macy’s, Inc. | | | 207,300 | | | | 11,986,086 | |
Target Corp. | | | 35,820 | | | | 2,214,393 | |
| | | | | | | | |
| | | | | | | 18,900,729 | |
Consumer Staples—2.0% | | | | | | | | |
Beverages—0.6% | | | | | | | | |
Coca-Cola Co. (The) | | | 120,770 | | | | 5,057,848 | |
Tobacco—1.4% | | | | | | | | |
Altria Group, Inc.1 | | | 108,000 | | | | 5,220,720 | |
Philip Morris International, Inc.1 | | | 69,500 | | | | 6,186,195 | |
| | | | | | | | |
| | | | | | | 11,406,915 | |
Energy—6.8% | | | | | | | | |
Energy Equipment & Services—1.7% | | | | | | | | |
Baker Hughes, Inc.1 | | | 111,300 | | | | 5,894,448 | |
Schlumberger Ltd. | | | 83,000 | | | | 8,188,780 | |
| | | | | | | | |
| | | | | | | 14,083,228 | |
Oil, Gas & Consumable Fuels—5.1% | | | | | | | | |
Canadian Natural Resources Ltd. | | | 102,620 | | | | 3,581,070 | |
Chevron Corp. | | | 55,540 | | | | 6,662,023 | |
ConocoPhillips | | | 106,000 | | | | 7,647,900 | |
EOG Resources, Inc. | | | 68,880 | | | | 6,547,044 | |
HollyFrontier Corp. | | | 106,820 | | | | 4,847,491 | |
Noble Energy, Inc. | | | 90,000 | | | | 5,186,700 | |
Valero Energy Corp.1 | | | 142,820 | | | | 7,153,854 | |
| | | | | | | | |
| | | | | | | 41,626,082 | |
Financials—6.9% | | | | | | | | |
Commercial Banks—1.9% | | | | | | | | |
Citigroup, Inc. | | | 94,850 | | | | 5,077,321 | |
JPMorgan Chase & Co. | | | 91,500 | | | | 5,533,920 | |
M&T Bank Corp. | | | 39,640 | | | | 4,843,215 | |
| | | | | | | | |
| | | | | | | 15,454,456 | |
Insurance—1.3% | | | | | | | | |
ACE Ltd. | | | 96,570 | | | | 10,555,101 | |
Real Estate Investment Trusts (REITs)—3.7% | | | | | | | | |
American Assets Trust, Inc. | | | 60,788 | | | | 2,330,612 | |
Blackstone Mortgage Trust, Inc., Cl. A1 | | | 251,870 | | | | 7,032,210 | |
| | |
| 19 | | OPPENHEIMER FLEXIBLE STRATEGIES FUND |
CONSOLIDATED STATEMENT OF INVESTMENTS Continued
| | | | | | | | |
| | | Shares | | | Value | |
Real Estate Investment Trusts (REITs) (Continued) | | | | | | | | |
Macerich Co. (The) | | | 89,500 | | | $ | 6,309,750 | |
Starwood Property Trust, Inc.1 | | | 634,000 | | | | 14,303,040 | |
| | | | | | | | |
| | | | | | | 29,975,612 | |
Health Care—8.1% | | | | | | | | |
Health Care Equipment & Supplies—1.4% | | | | | | | | |
Baxter International, Inc. | | | 109,000 | | | | 7,645,260 | |
Covidien plc | | | 38,000 | | | | 3,512,720 | |
| | | | | | | | |
| | | | | | | 11,157,980 | |
Health Care Providers & Services—1.7% | | | | | | | | |
HCA Holdings, Inc.2 | | | 20,000 | | | | 1,401,000 | |
UnitedHealth Group, Inc. | | | 101,130 | | | | 9,608,361 | |
Universal Health Services, Inc. | | | 31,000 | | | | 3,215,010 | |
| | | | | | | | |
| | | | | | | 14,224,371 | |
Pharmaceuticals—5.0% | | | | | | | | |
Actavis plc2 | | | 44,790 | | | | 10,872,325 | |
Merck & Co., Inc.1 | | | 208,000 | | | | 12,051,520 | |
Novartis AG, ADR | | | 90,500 | | | | 8,388,445 | |
Roche Holding AG | | | 32,500 | | | | 9,599,084 | |
| | | | | | | | |
| | | | | | | 40,911,374 | |
Industrials—6.4% | | | | | | | | |
Aerospace & Defense—2.3% | | | | | | | | |
Honeywell International, Inc. | | | 149,330 | | | | 14,353,599 | |
Northrop Grumman Corp. | | | 34,000 | | | | 4,690,640 | |
| | | | | | | | |
| | | | | | | 19,044,239 | |
Airlines—0.3% | | | | | | | | |
United Continental Holdings, Inc.2 | | | 40,506 | | | | 2,139,122 | |
Commercial Services & Supplies—0.6% | | | | | | | | |
Tyco International Ltd.1 | | | 105,620 | | | | 4,534,267 | |
Construction & Engineering—1.8% | | | | | | | | |
Quanta Services, Inc.1,2 | | | 425,000 | | | | 14,484,000 | |
Machinery—0.1% | | | | | | | | |
Flowserve Corp. | | | 15,300 | | | | 1,040,247 | |
Trading Companies & Distributors—1.3% | | | | | | | | |
AerCap Holdings NV2 | | | 140,901 | | | | 6,106,649 | |
WESCO International, Inc.2 | | | 57,120 | | | | 4,707,259 | |
| | | | | | | | |
| | | | | | | 10,813,908 | |
Information Technology—5.9% | | | | | | | | |
Communications Equipment—3.0% | | | | | | | | |
Juniper Networks, Inc.1 | | | 345,790 | | | | 7,285,795 | |
QUALCOMM, Inc.1 | | | 143,160 | | | | 11,239,492 | |
Telefonaktiebolaget LM Ericsson, Cl. B | | | 520,000 | | | | 6,148,643 | |
| | | | | | | | |
| | | | | | | 24,673,930 | |
| | |
| 20 | | OPPENHEIMER FLEXIBLE STRATEGIES FUND |
| | | | | | | | |
| | | Shares | | | Value | |
| |
Internet Software & Services—1.1% | | | | | | | | |
| |
Google, Inc., Cl. A1,2 | | | 7,750 | | | $ | 4,400,992 | |
| |
Google, Inc., Cl. C2 | | | 7,750 | | | | 4,332,870 | |
| | | | | | | | |
| | | | | | | 8,733,862 | |
| | | | | | | | |
| |
Semiconductors & Semiconductor Equipment—0.9% | | | | | | | | |
| |
Xilinx, Inc. | | | 152,000 | | | | 6,760,960 | |
| | | | | | | | |
| |
Technology Hardware, Storage & Peripherals—0.9% | | | | | | | | |
| |
Apple, Inc.1 | | | 69,386 | | | | 7,493,688 | |
| | | | | | | | |
| |
Materials—3.0% | | | | | | | | |
| |
Chemicals—3.0% | | | | | | | | |
| |
Celanese Corp., Series A | | | 80,700 | | | | 4,739,511 | |
| |
LyondellBasell Industries NV, Cl. A | | | 136,900 | | | | 12,544,147 | |
| |
Methanex Corp. | | | 120,000 | | | | 7,120,800 | |
| | | | | | | | |
| | | | | | | 24,404,458 | |
| | | | | | | | |
| |
Telecommunication Services—1.1% | | | | | | | | |
| |
Diversified Telecommunication Services—1.1% | | | | | | | | |
| |
BCE, Inc. | | | 202,000 | | | | 8,982,940 | |
| | | | | | | | |
| |
Utilities—3.5% | | | | | | | | |
| |
Electric Utilities—3.2% | | | | | | | | |
| |
Edison International | | | 156,050 | | | | 9,765,609 | |
| |
PPL Corp. | | | 473,824 | | | | 16,579,102 | |
| | | | | | | | |
| | | | | | | 26,344,711 | |
| | | | | | | | |
| |
Multi-Utilities—0.3% | | | | | | | | |
| |
CMS Energy Corp. | | | 58,350 | | | | 1,906,294 | |
| | | | | | | | |
Total Common Stocks (Cost $322,893,221) | | | | | | | 413,059,712 | |
| | | | | | | | |
| |
Preferred Stocks—2.6% | | | | | | | | |
| |
M&T Bank Corp., 6.375% Cum., Series A, Non-Vtg. | | | 5,167 | | | | 5,218,670 | |
| |
M&T Bank Corp., 6.375% Cum., Series C, Non-Vtg. | | | 7,500 | | | | 7,500,000 | |
| |
U.S. Bancorp, 6% Non-Cum., Series G, Non-Vtg.3 | | | 300,000 | | | | 8,118,000 | |
| | | | | | | | |
Total Preferred Stocks (Cost $20,387,098) | | | | | | | 20,836,670 | |
| | | | | | | | |
| | | Principal Amount | | | | | |
| |
Asset-Backed Securities—10.6% | | | | | | | | |
| |
Home Equity Loan—3.9% | | | | | | | | |
| |
New Century Home Equity Loan Trust, Series 2005-2, Cl. M3, 0.642%, | | | | | | | | |
6/25/353 | | $ | 5,500,000 | | | | 4,358,448 | |
| |
Park Place Securities, Inc., Series 2005-WCW3, Cl. M1, 0.632%, 8/25/353 | | | 5,000,000 | | | | 4,641,080 | |
| |
RAMP Trust, Series 2006-EFC1, Cl. M2, 0.552%, 2/25/363 | | | 5,490,000 | | | | 4,480,685 | |
| |
Saxon Asset Securities Trust, Series 2007-3, Cl. 2A4, 0.642%, 9/25/473 | | | 7,595,000 | | | | 5,149,759 | |
| |
Structured Asset Securities Corp. Mortgage Loan Trust, Series 2007-GEL2, | | | | | | | | |
Cl. A2, 0.472%, 5/25/373,4 | | | 14,379,198 | | | | 13,072,719 | |
| | | | | | | | |
| | | | | | | 31,702,691 | |
| | | | | | | | |
| |
Loans: Other—6.7% | | | | | | | | |
| |
Airspeed Ltd.: | | | | | | | | |
Series 2007-1A,Cl. G1, 0.423%, 6/15/323,5 | | | 27,954,993 | | | | 23,682,525 | |
Series 2007-1A,Cl. G2, 0.433%, 6/15/323,5 | | | 7,444,452 | | | | 6,420,840 | |
| | |
| 21 | | OPPENHEIMER FLEXIBLE STRATEGIES FUND |
CONSOLIDATED STATEMENT OF INVESTMENTS Continued
| | | | | | | | |
| | | Principal Amount | | | Value | |
| |
Loans: Other (Continued) | | | | | | | | |
| |
Blade Engine Securitization Ltd., Series 2006-1AW, Cl. A1, 0.453%, 9/15/413,5 | | $ | 30,957,081 | | | $ | 24,450,850 | |
| | | | | | | | |
| | | | | | | 54,554,215 | |
| | | | | | | | |
Total Asset-Backed Securities (Cost $76,190,489) | | | | | | | 86,256,906 | |
| | | | | | | | |
| |
Mortgage-Backed Obligations—5.8% | | | | | | | | |
| |
Ameriquest Mortgage Securities, Inc., Series 2004-R2, Cl. M1, 0.80%, 4/25/343 | | | 3,558,338 | | | | 2,961,872 | |
| |
Asset-Backed Funding Certificates Trust, Series 2005-HE2, Cl. M3, 0.932%, 6/25/353 | | | 4,000,000 | | | | 3,531,720 | |
| |
Bear Stearns Asset Backed Securities I Trust, Series 2004-HE9, Cl. M2, 1.955%, 11/25/343 | | | 7,070,724 | | | | 6,082,859 | |
| |
First NLC Trust, Series 2005-4, Cl. A4, 0.542%, 2/25/363 | | | 11,003,000 | | | | 9,388,563 | |
| |
Home Equity Asset Trust, Series 2005-5, Cl. M2, 0.662%, 11/25/353 | | | 1,888,088 | | | | 1,745,728 | |
| |
Home Equity Mortgage Loan Asset-Backed Trust, Series 2005-B, Cl. M3, 0.642%, 8/25/353 | | | 1,298,061 | | | | 1,184,870 | |
| |
MASTR Adjustable Rate Mortgages Trust, Series 2004-13, Cl. 2A2, 2.643%, 4/21/343 | | | 666,216 | | | | 681,322 | |
| |
RAMP Trust: | | | | | | | | |
Series 2005-RS2, Cl. M4, 0.872%, 2/25/353 | | | 4,469,000 | | | | 4,000,868 | |
Series 2005-RS6, Cl. M2, 0.662%, 6/25/353 | | | 944,044 | | | | 921,603 | |
Series 2006-NC3, Cl. A3, 0.422%, 3/25/363 | | | 16,698,000 | | | | 13,762,725 | |
| |
Structured Asset Securities Corp. Mortgage Loan Trust, Series 2007-GEL2, Cl. A3, 0.602%, 5/25/373,4 | | | 4,486,000 | | | | 3,298,713 | |
| | | | | | | | |
Total Mortgage-Backed Obligations (Cost $36,253,921) | | | | | | | 47,560,843 | |
| | | | | | | | |
| |
Non-Convertible Corporate Bonds and Notes—3.3% | | | | | | | | |
| |
Appvion, Inc., 9% Sec. Nts., 6/1/204 | | | 955,000 | | | | 759,225 | |
| |
Goldman Sachs Capital II, 4% Jr. Sub. Perpetual Bonds3,6 | | | 999,000 | | | | 756,243 | |
| |
Lukoil International Finance BV, 6.125% Sr. Unsec. Nts., 11/9/204 | | | 14,000,000 | | | | 14,315,000 | |
| |
Wachovia Capital Trust III, 5.57% Jr. Sub. Perpetual Bonds3,6 | | | 11,000,000 | | | | 10,697,500 | |
| | | | | | | | |
Total Non-Convertible Corporate Bonds and Notes (Cost $26,054,406) | | | | | | | 26,527,968 | |
| | | | | | | | |
| |
Convertible Corporate Bond and Note—0.4% | | | | | | | | |
| |
SEACOR Holdings, Inc., 2.50% Cv. Sr. Unsec. Nts., 12/15/27 (Cost $3,000,000) | | | 3,000,000 | | | | 3,380,625 | |
| | | | | | | | |
| |
Corporate Loans—1.4% | | | | | | | | |
| |
Appvion, Inc., Sr. Sec. Credit Facilities 1st Lien Term Loan, 5.75%, 6/28/193 | | | 6,912,500 | | | | 6,869,297 | |
| |
Dynegy, Inc., Sr. Sec. Credit Facilities 1st Lien Term Loan, Tranche B2, 4.00%, 4/23/203 | | | 4,937,500 | | | | 4,915,898 | |
| | | | | | | | |
Total Corporate Loans (Cost $11,760,990) | | | | | | | 11,785,195 | |
| | | | | | | | |
| | | Shares | | | | | |
| |
Structured Security—0.1% | | | | | | | | |
| |
Africa Telecommunications Media & Technology Fund 1 LLC2,5 (Cost $10,000,000) | | | 9,542,930 | | | | 895,986 | |
| | |
| 22 | | OPPENHEIMER FLEXIBLE STRATEGIES FUND |
| | | | | | | | |
| | | Principal Amount | | | Value | |
Municipal Bonds and Notes—0.3% | | | | | | | | |
University of Puerto Rico, Series P: | | | | | | | | |
5.00%, 6/1/23 | | $ | 1,820,000 | | | $ | 1,174,009 | |
5.00%, 6/1/30 | | | 1,820,000 | | | | 1,079,315 | |
| | | | | | | | |
Total Municipal Bonds and Notes (Cost $2,305,359) | | | | | | | 2,253,324 | |
| | | | | | | | | | | | | | | | |
| | | Exercise Expiration | | | | | | | |
| | | Price | | | Date | | | Contracts | | | | |
Exchange-Traded Options Purchased—0.1% | | | | | | | | | |
S&P 500 Index Call2 | | USD | 2,020.000 | | | | 1/17/15 | | | USD | 100 | | | | 426,000 | |
S&P 500 Index Call2 | | USD | 2,010.000 | | | | 12/20/14 | | | USD | 100 | | | | 400,000 | |
| United States Treasury Nts., 10 yr. Futures, 3/15 Call2 | | USD | 127.500 | | | | 2/20/15 | | | USD | 350 | | | | 229,688 | |
| | | | | | | | | | | | | | | | |
Total Exchange-Traded Options Purchased (Cost $761,368) | | | | | | | | 1,055,688 | |
| | | | | | | | | | | | | | | | | | | | | | | | |
| | | Counterparty | | | Pay/Receive Floating Rate | | | Floating Rate | | | | | Notional Amount (000’s) | | | | |
| | | | | | Fixed Expiration | | | | |
| | | | | | Rate | | Date | | | | |
Over-the-Counter Interest Rate Swaptions Purchased—0.3% | | | | | |
Interest
Rate Swap
maturing
1/21/25
Put2 | | | GSG | | | | Receive | | |
| Six-Month
JPY BBA
LIBOR |
| | 2.000% | | 1/19/15 | | JPY | 3,838,000 | | | | — | |
Interest
Rate Swap
maturing
1/25/26
Put2 | | | GSG | | | | Receive | | |
| Six-Month
JPY BBA
LIBOR |
| | 1.870 | | 1/21/16 | | JPY | 5,406,000 | | | | 8,267 | |
Interest
Rate Swap
maturing
2/28/27
Put2 | | | JPM | | | | Receive | | |
| Three-Month
USD BBA
LIBOR |
| | 4.500 | | 2/24/17 | | USD | 50,000 | | | | 720,624 | |
Interest
Rate Swap
maturing
4/13/26
Call2 | | | JPM | | | | Receive | | |
| Three-Month
USD BBA
LIBOR |
| | 3.410 | | 4/11/16 | | USD | 33,000 | | | | 682,738 | |
Interest
Rate Swap
maturing
4/13/26
Call2 | | | JPM | | | | Receive | | |
| Three-Month
USD BBA
LIBOR |
| | 3.468 | | 4/11/16 | | USD | 33,000 | | | | 638,902 | |
| | |
| 23 | | OPPENHEIMER FLEXIBLE STRATEGIES FUND |
CONSOLIDATED STATEMENT OF INVESTMENTS Continued
| | | | | | | | | | | | | | | | | | | | | | | | | | | | |
| | | | | | Pay/Receive | | | | | | | | | | | | Notional | | | | |
| | | | | | Floating | | | Floating | | | Fixed Expiration | | | Amount | | | | |
| | | Counterparty | | | Rate | | | Rate | | | Rate | | | Date | | | (000’s) | | | Value | |
Over-the-Counter Interest Rate Swaptions Purchased (Continued) | | | | | |
Interest
Rate Swap
maturing
4/27/26
Call2 | | | JPM | | | | Receive | | |
| Three-Month
USD BBA
LIBOR |
| | | 3.373 | % | | | 4/25/16 | | | USD | 30,000 | | | $ | 633,704 | |
| | | | | | | | | | | | | | | | | | | | | | | | | | | | |
Total Over-the-Counter Interest Rate Swaptions Purchased (Cost $8,098,189) | | | | | | | | 2,684,235 | |
| | | | | | | | |
| | | Shares | | | | |
Investment Companies—21.7% | | | | | | | | |
Oppenheimer Institutional Money Market Fund, Cl. E, 0.08%7,8 | | | 40,870,565 | | | | 40,870,565 | |
Oppenheimer Master Loan Fund, LLC2,7 | | | 8,288,014 | | | | 120,534,049 | |
SPDR Gold Trust Exchange Traded Fund2,9 | | | 135,900 | | | | 15,310,494 | |
| | | | | | | | |
Total Investment Companies (Cost $179,432,127) | | | | | | | 176,715,108 | |
| | | | | | | | |
| | | | | | | | |
| Total Investments, at Value (Cost $697,137,168) | | | 97.3% | | | | 793,012,260 | |
| Net Other Assets (Liabilities) | | | 2.7 | | | | 22,146,747 | |
| | | | |
| Net Assets | | | 100.0% | | | $ | 815,159,007 | |
| | | | |
Footnotes to Consolidated Statement of Investments
1. All or portion of the security position is held in segregated accounts and pledged to cover margin requirements with respect to securities sold short. The aggregate market value of such securities is $24,047,252. See Note 1 of accompanying Consolidated Notes.
2. Non-income producing security.
3. Represents the current interest rate for a variable or increasing rate security.
4. Represents securities sold under Rule 144A, which are exempt from registration under the Securities Act of 1933, as amended. These securities have been determined to be liquid under guidelines established by the Board of Trustees. These securities amount to $31,445,657 or 3.86% of the Fund’s net assets as of October 31, 2014.
5. Restricted security. The aggregate value of restricted securities as of October 31, 2014 was $55,450,201, which represents 6.80% of the Fund’s net assets. See Note 7 of the accompanying Notes. Information concerning restricted securities is as follows:
| | | | | | | | | | | | | | | | |
| Security | | Acquisition Dates | | | Cost | | | Value | | | Unrealized
Appreciation/
(Depreciation) | |
| Africa Telecommunications Media & Technology Fund 1 LLC | | | 4/20/11 | | | $ | 10,000,000 | | | $ | 895,986 | | | $ | (9,104,014 | ) |
| Airspeed Ltd., Series 2007-1A, Cl. G1, 0.423%, 6/15/32 | | | 1/9/13 - 7/10/13 | | | | 22,523,908 | | | | 23,682,525 | | | | 1,158,617 | |
| Airspeed Ltd., Series 2007-1A, Cl. G2, 0.433%, 6/15/32 | | | 1/9/13 - 1/25/13 | | | | 6,127,621 | | | | 6,420,840 | | | | 293,219 | |
| Blade Engine Securitization Ltd., Series 2006-1AW, Cl. A1, 0.453%, 9/15/41 | | | 4/19/13 - 5/29/13 | | | | 23,981,054 | | | | 24,450,850 | | | | 469,796 | |
| | | | | | | | |
| | | | | | $ | 62,632,583 | | | $ | 55,450,201 | | | $ | (7,182,382 | ) |
| | | | | | | | |
6. This bond has no contractual maturity date, is not redeemable and contractually pays an indefinite stream of interest. Rate reported represents the current interest rate for this variable rate security.
| | |
| 24 | | OPPENHEIMER FLEXIBLE STRATEGIES FUND |
Footnotes to Consolidated Statement of Investments (Continued)
7. Is or was an affiliate, as defined in the Investment Company Act of 1940, as amended, or during the period ended October 31, 2014, by virtue of the Fund owning at least 5% of the voting securities of the issuer or as a result of the Fund and the issuer having the same investment adviser. Transactions during the period in which the issuer was an affiliate are as follows:
| | | | | | | | | | | | | | | | |
| | | Shares | | | Gross | | | Gross | | | Shares | |
| | | October 31, 2013 | | | Additions | | | Reductions | | | October 31, 2014 | |
| |
Oppenheimer Institutional Money | | | | | | | | | | | | | | | | |
Market Fund, Cl. E | | | 341,351 | | | | 269,690,826 | | | | 229,161,612 | | | | 40,870,565 | |
Oppenheimer Master Loan Fund, LLC | | | 8,288,014 | | | | — | | | | — | | | | 8,288,014 | |
Oppenheimer Short Duration Fund, Cl. Y | | | 3,016,273 | | | | 902 | | | | 3,017,175 | | | | — | |
| | | | | | | | | | | | |
| | | Value | | | | Income | | | | Realized Gain | |
| |
Oppenheimer Institutional Money Market Fund, Cl. E | | $ | 40,870,565 | | | $ | 30,113 | | | $ | — | |
Oppenheimer Master Loan Fund, LLC | | | 120,534,049 | | | | 6,613,208 | a | | | 304,811 | a |
Oppenheimer Short Duration Fund, Cl. Y | | | — | | | | 14,790 | | | | — | |
| | | | |
Total | | $ | 161,404,614 | | | $ | 6,658,111 | | | $ | 304,811 | |
| | | | |
a. Represents the amount allocated to the Fund from Oppenheimer Master Loan Fund, LLC.
8. Rate shown is the 7-day yield as of October 31, 2014.
9. All or a portion of this security is owned by the subsidiary. See accompanying Consolidated Notes.
| | | | | | | | | | | | |
| | | Shares Sold | | | | | | | |
| | | Short | | | | | | Value | |
| |
Securities Sold Short—(21.4)% | | | | | | | | | | | | |
Common Stock Securities Sold Short—(21.4)% | | | | | | | | | | | | |
Aflac, Inc. | | | (139,000 | ) | | $ | | | | | (8,302,470 | ) |
| |
Air Lease Corp., Cl. A | | | (176,000 | ) | | | | | | | (6,439,840 | ) |
| |
Aircastle Ltd. | | | (165,000 | ) | | | | | | | (3,148,200 | ) |
| |
Assurant, Inc. | | | (63,500 | ) | | | | | | | (4,331,970 | ) |
| |
BHP Billiton Ltd., Sponsored ADR | | | (98,000 | ) | | | | | | | (5,825,120 | ) |
| |
BJ’s Restaurants, Inc. | | | (165,700 | ) | | | | | | | (7,294,114 | ) |
| |
Boeing Co. (The) | | | (74,600 | ) | | | | | | | (9,318,286 | ) |
| |
Camden Property Trust | | | (60,000 | ) | | | | | | | (4,600,200 | ) |
| |
Caterpillar, Inc. | | | (43,000 | ) | | | | | | | (4,360,630 | ) |
| |
CBL & Associates Properties, Inc. | | | (361,000 | ) | | | | | | | (6,905,930 | ) |
| |
Chesapeake Energy Corp. | | | (217,000 | ) | | | | | | | (4,813,060 | ) |
| |
Cliffs Natural Resources, Inc. | | | (71,870 | ) | | | | | | | (807,100 | ) |
| |
CME Group, Inc. | | | (58,000 | ) | | | | | | | (4,860,980 | ) |
| |
Comerica, Inc. | | | (186,000 | ) | | | | | | | (8,879,640 | ) |
| |
Commerce Bancshares, Inc. | | | (69,457 | ) | | | | | | | (3,143,624 | ) |
| |
First Niagara Financial Group, Inc. | | | (400,000 | ) | | | | | | | (2,996,000 | ) |
| |
FirstMerit Corp. | | | (155,000 | ) | | | | | | | (2,844,250 | ) |
| |
KCG Holdings, Inc., Cl. A | | | (200,000 | ) | | | | | | | (2,132,000 | ) |
| |
Kohl’s Corp. | | | (94,000 | ) | | | | | | | (5,096,680 | ) |
| |
Montpelier Re Holdings Ltd. | | | (120,000 | ) | | | | | | | (3,976,800 | ) |
| |
NASDAQ OMX Group, Inc. (The) | | | (170,000 | ) | | | | | | | (7,354,200 | ) |
| |
Nationstar Mortgage Holdings, Inc. | | | (100,000 | ) | | | | | | | (3,512,000 | ) |
| |
Oracle Corp. | | | (113,000 | ) | | | | | | | (4,412,650 | ) |
| |
Pennsylvania Real Estate Investment Trust | | | (430,000 | ) | | | | | | | (9,214,900 | ) |
| |
Rio Tinto plc, Sponsored ADR | | | (55,000 | ) | | | | | | | (2,638,350 | ) |
| |
Rouse Properties, Inc. | | | (203,392 | ) | | | | | | | (3,703,769 | ) |
| | |
| 25 | | OPPENHEIMER FLEXIBLE STRATEGIES FUND |
CONSOLIDATED STATEMENT OF INVESTMENTS Continued
| | | | | | | | |
| | | Shares Sold
Short | | | Value | |
| |
Common Stock Securities Sold Short (Continued) | |
| |
SanDisk Corp. | | | (126,500 | ) | | $ | (11,908,710) | |
| |
SandRidge Energy, Inc. | | | (845,000 | ) | | | (3,295,500) | |
| |
Southern Copper Corp. | | | (391,000 | ) | | | (11,252,980) | |
| |
Transocean Ltd. | | | (236,000 | ) | | | (7,039,880) | |
| |
United Technologies Corp. | | | (26,500 | ) | | | (2,835,500) | |
| |
Walter Energy, Inc. | | | (133,000 | ) | | | (320,530) | |
| |
Weingarten Realty Investors | | | (197,000 | ) | | | (7,141,250) | |
| | | | | | | | |
Total Securities Sold Short (Proceeds $ 151,928,504) | | | | | | $ | (174,707,113) | |
| | | | | | | | |
| | | | | | | | | | | | | | | | | | | | | | | | | | | | |
Forward Currency Exchange Contracts as of October 31, 2014 | | | | | | | | | |
| Counterparty | | Settlement
Month(s) | | | | | | Currency
Purchased
(000’s) | | | | | | Currency Sold (000’s) | | | Unrealized
Appreciation | | | Unrealized Depreciation | |
| |
DEU | | | 01/2015 | | | | AUD | | | | 5,000 | | | | USD | | | | 4,572 | | | $ | — | | | $ | 198,652 | |
DEU | �� | | 01/2015 | | | | USD | | | | 17,200 | | | | AUD | | | | 19,760 | | | | — | | | | 83,693 | |
MSCO | | | 01/2015 | | | | USD | | | | 18,927 | | | | JPY | | | | 2,020,000 | | | | 924,541 | | | | — | |
RBS | | | 01/2015 | | | | USD | | | | 9,356 | | | | EUR | | | | 7,300 | | | | 202,446 | | | | — | |
| | | | | | | | | | | | | | | | | | | | | | | | |
Total Unrealized Appreciation and Depreciation | | | | | | | | | | | $ | 1,126,987 | | | $ | 282,345 | |
| | | | | | | | | | | | | | | | | | | | | | | | |
| | | | | | | | | | | | | | | | | | | | | | | | |
Futures Contracts as of October 31, 2014 | | | | | | | | | | | | | |
| Description | | Exchange | | | Buy/Sell | | | Expiration
Date | | | Number of
Contracts | | | Value | | | Unrealized
Depreciation | |
| |
90 Day Euro | | | CME | | | | Sell | | | | 12/19/16 | | | | 225 | | | $ | 55,220,625 | | | $ | 216,330 | |
Euro-BTP | | | EUX | | | | Sell | | | | 12/8/14 | | | | 43 | | | | 7,022,352 | | | | 44,772 | |
S&P 500 Index | | | CME | | | | Sell | | | | 12/18/14 | | | | 56 | | | | 28,159,600 | | | | 1,954,668 | |
United States Treasury Nts., 10 yr. | | | CBT | | | | Sell | | | | 12/19/14 | | | | 99 | | | | 12,509,579 | | | | 71,263 | |
| | | | | | | | | | | | | | | | | | | | | | | | |
| | | | | | | | | | | | | | | | | | | | | | $ | 2,287,033 | |
| | | | | | | | | | | | | | | | | | | | | | | | |
| | | | | | | | | | | | | | | | | | | | | | | | | | | | |
Centrally Cleared Credit Default Swaps at October 31, 2014 | | | | | | | | | |
| Reference Asset | | Buy/Sell
Protection | | | Fixed
Rate | | | Maturity
Date | | | | | | Notional Amount (000’s) | | | Premiums Received/(Paid) | | | Value | |
| |
CDX.IG.22 | | | Sell | | | | 1.000% | | | | 6/20/19 | | | | USD | | | | 25,000 | | | $ | (496,010 | ) | | $ | 504,325 | |
| |
CDX.NA.HY.22 | | | Buy | | | | 5.000 | | | | 6/20/19 | | | | USD | | | | 19,800 | | | | 1,717,650 | | | | (1,491,743) | |
| |
iTraxx.Main.21 | | | Buy | | | | 1.000 | | | | 6/20/19 | | | | EUR | | | | 19,000 | | | | 496,756 | | | | (467,978) | |
| | | | | | | | | | | | | | | | | | | | | | | | |
Total Centrally Cleared Credit Default Swaps | | | | | | | | | | | | | | | $ | 1,718,396 | | | $ | (1,455,396) | |
| | | | | | | | | | | | | | | | | | | | | | | | |
| | | | | | | | | | | | | | | | | | | | | | | | | | | | | | |
Over-the-Counter Credit Default Swaps at October 31, 2014 | | | | | | | | | |
| Reference Asset | | Counterparty | | | Buy/Sell
Protection | | | Fixed
Rate | | | Maturity
Date | | | | | Notional Amount
(000’s) | | | Premiums
Received/(Paid) | | | Value | |
| |
Republic of Austria | | | GSG | | | | Buy | | | | 1.000% | | | | 12/20/16 | | | USD | | | 25,000 | | | $ | (874,393 | ) | | $ | (502,613) | |
| |
Republic of Italy | | | BAC | | | | Buy | | | | 1.000 | | | | 9/20/19 | | | USD | | | 15,000 | | | | 19,699 | | | | 233,184 | |
| |
Republic of Italy | | | GSG | | | | Buy | | | | 1.000 | | | | 12/20/19 | | | USD | | | 30,000 | | | | (18,181 | ) | | | 553,467 | |
| | | | | | | | | | | | | | | | | | | | | | | | | | |
Total Over-the-Counter Credit Default Swaps | | | | | | | | | | | | | $ | (872,875 | ) | | $ | 284,038 | |
| | | | | | | | | | | | | | | | | | | | | | | | | | |
| | |
| 26 | | OPPENHEIMER FLEXIBLE STRATEGIES FUND |
The table that follows shows the undiscounted maximum potential payment by the Fund related to selling credit protection in credit default swaps:
| | | | | | | | | | | | |
Type of Reference Asset on which the Fund Sold Protection | | Total Maximum
Potential Payments for
Selling Credit Protection
(Undiscounted) | | | Amount
Recoverable* | | | Reference
Asset Rating
Range** | |
Investment Grade Corporate Debt Indexes | | | $25,000,000 | | | | $- | | | | BBB+ | |
*The Fund has no amounts recoverable from related purchased protection. In addition, the Fund has no recourse provisions under the credit derivatives and holds no collateral which can offset or reduce potential payments under a triggering event.
** The period end reference asset security ratings, as rated by any rating organization, are included in the equivalent Standard & Poor’s rating category. The reference asset rating represents the likelihood of a potential credit event on the reference asset which would result in a related payment by the Fund.
| | | | | | | | | | | | | | | | | | | | | | | | |
Over-the-Counter Total Return Swaps at October 31, 2014 | |
| Reference Asset | | Counterparty | | | Pay/Receive
Total
Return | | | Floating Rate | | | Maturity
Date | | | Notional Amount
(000’s) | | | Value | |
BX Index | | | GSG | | | | Receive | | |
| One-Month USD
BBA LIBOR plus
65 basis points |
| | | 3/16/15 | | | USD | 6,789 | | | | $ (415,786) | |
Glossary:
Counterparty Abbreviations
| | |
| BAC | | Barclays Bank plc |
| DEU | | Deutsche Bank AG |
| GSG | | Goldman Sachs Group, Inc. (The) |
| JPM | | JPMorgan Chase Bank NA |
| MSCO | | Morgan Stanley Capital Services, Inc. |
| RBS | | Royal Bank of Scotland plc (The) |
Currency abbreviations indicate amounts reporting in currencies
| | |
| AUD | | Australian Dollar |
| EUR | | Euro |
| JPY | | Japanese Yen |
Definitions
| | |
| BBA LIBOR | | British Bankers’ Association London - Interbank Offered Rate |
| CDX.IG.22 | | Markit CDX North American Investment Grade High Volatility |
| CDX.NA.HY.22 | | Markit CDX North American High Yield |
| iTraxx.Main.21 | | Credit Default Swap Trading Index CDXE for a Specific Basket of Securities |
|
| Exchange Abbreviations |
| CBT | | Chicago Board of Trade |
| CME | | Chicago Mercantile Exchanges |
| EUX | | European Stock Exchange |
See accompanying Notes to Consolidated Financial Statements.
| | |
| 27 | | OPPENHEIMER FLEXIBLE STRATEGIES FUND |
CONSOLIDATED STATEMENT OF ASSETS AND LIABILITIES October 31, 2014
| | | | | | |
Assets | | | | | | |
Investments, at value—see accompanying consolidated statement of investments: | | | | | | |
Unaffiliated companies (cost $534,539,102) | | $ | 631,607,646 | | | |
Affiliated companies (cost $162,598,066) | | | 161,404,614 | | | |
| | | |
| | | 793,012,260 | | | |
|
Cash | | | 7,350,550 | | | |
|
Cash used for collateral on futures | | | 1,960,204 | | | |
|
Cash used for collateral on OTC derivatives | | | 960,000 | | | |
|
Cash used for collateral on centrally cleared swaps | | | 2,448,542 | | | |
|
Deposits with broker for securities sold short | | | 184,912,825 | | | |
|
Unrealized appreciation on foreign currency exchange contracts | | | 1,126,987 | | | |
|
Swaps, at value (net premiums received $1,518) | | | 786,651 | | | |
|
Centrally cleared swaps, at value (premiums paid $496,010) | | | 504,325 | | | |
|
Receivables and other assets: | | | | | | |
Shares of beneficial interest sold | | | 2,100,343 | | | |
Interest and dividends | | | 1,335,335 | | | |
Investments sold | | | 79,649 | | | |
Variation margin receivable | | | 48,797 | | | |
Other | | | 130,544 | | | |
| | | |
Total assets | | | 996,757,012 | | | |
Liabilities | | | | | | |
Securities sold short (proceeds $151,928,504)—see accompanying consolidated statement of investments | | | 174,707,113 | | | |
|
Unrealized depreciation on foreign currency exchange contracts | | | 282,345 | | | |
|
Swaps, at value (premiums paid $874,393) | | | 918,399 | | | |
|
Centrally cleared swaps, at value (premiums paid $2,214,406 ) | | | 1,959,721 | | | |
|
Payables and other liabilities: | | | | | | |
Shares of beneficial interest redeemed | | | 1,947,142 | | | |
Investments purchased | | | 820,475 | | | |
Variation margin payable | | | 373,068 | | | |
Trustees’ compensation | | | 264,034 | | | |
Distribution and service plan fees | | | 179,171 | | | |
Dividends | | | 68,050 | | | |
Shareholder communications | | | 19,020 | | | |
Other | | | 59,467 | | | |
| | | |
Total liabilities | | | 181,598,005 | | | |
Net Assets | | $ | 815,159,007 | | | |
| | | |
| | | | | | |
Composition of Net Assets | | | | | | |
Par value of shares of beneficial interest | | $ | 311,951 | | | |
|
Additional paid-in capital | | | 774,295,358 | | | |
|
Accumulated net investment income | | | 11,413,762 | | | |
|
Accumulated net realized loss on investments and foreign currency transactions | | | (41,754,181 | ) | | |
|
Net unrealized appreciation on investments and translation of assets and liabilities denominated in foreign currencies | | | 70,892,117 | | | |
| | | |
Net Assets | | $ | 815,159,007 | | | |
| | | |
| | |
| 28 | | OPPENHEIMER FLEXIBLE STRATEGIES FUND |
| | | | | | |
Net Asset Value Per Share |
Class A Shares: | | | | | | |
| Net asset value and redemption price per share (based on net assets of $642,788,537 and 24,126,485 shares of beneficial interest outstanding) | | $ | 26.64 | | | |
| Maximum offering price per share (net asset value plus sales charge of 5.75% of offering price) | | $ | 28.27 | | | |
|
Class B Shares: | | | | | | |
| Net asset value, redemption price (excludes applicable contingent deferred sales charge) and offering price per share (based on net assets of $25,296,332 and 1,060,929 shares of beneficial interest outstanding) | | $ | 23.84 | | | |
|
Class C Shares: | | | | | | |
| Net asset value, redemption price (excludes applicable contingent deferred sales charge) and offering price per share (based on net assets of $110,383,304 and 4,620,835 shares of beneficial interest outstanding) | | $ | 23.89 | | | |
|
Class I Shares: | | | | | | |
| Net asset value, redemption price and offering price per share (based on net assets of $11,272 and 411 shares of beneficial interest outstanding) | | $ | 27.41 | | | |
|
Class R Shares: | | | | | | |
| Net asset value, redemption price (excludes applicable contingent deferred sales charge) and offering price per share (based on net assets of $17,301,362 and 677,086 shares of beneficial interest outstanding) | | $ | 25.55 | | | |
|
Class Y Shares: | | | | | | |
| Net asset value, redemption price and offering price per share (based on net assets of $19,378,200 and 709,354 shares of beneficial interest outstanding) | | $ | 27.32 | | | |
See accompanying Notes to Consolidated Financial Statements.
| | |
| 29 | | OPPENHEIMER FLEXIBLE STRATEGIES FUND |
CONSOLIDATED STATEMENT OF
OPERATIONS For the Year Ended October 31, 2014
| | | | | | |
Allocation of Income and Expenses from Master Funds1 | | | | | | |
Net investment income allocated from Oppenheimer Master Loan Fund, LLC: | | | | | | |
Interest | | $ | 6,311,273 | | | |
Dividends | | | 301,935 | | | |
Expenses | | | (407,285 | ) | | |
| | | |
Net investment income allocated from Oppenheimer Master Loan Fund, LLC | | | 6,205,923 | | | |
Investment Income | | | | | | |
Interest | | | 9,533,275 | | | |
|
Dividends: | | | | | | |
Unaffiliated companies (net of foreign withholding taxes of $190,301) | | | 12,096,231 | | | |
Affiliated companies | | | 44,903 | | | |
| | | |
Total investment income | | | 21,674,409 | | | |
Expenses | | | | | | |
Management fees | | | 7,357,807 | | | |
|
Distribution and service plan fees: | | | | | | |
Class A | | | 1,607,284 | | | |
Class B | | | 303,384 | | | |
Class C | | | 1,129,946 | | | |
Class R2 | | | 95,875 | | | |
|
Transfer and shareholder servicing agent fees: | | | | | | |
Class A | | | 1,470,606 | | | |
Class B | | | 94,833 | | | |
Class C | | | 253,923 | | | |
Class I | | | 4 | | | |
Class R2 | | | 49,682 | | | |
Class Y | | | 117,780 | | | |
|
Shareholder communications: | | | | | | |
Class A | | | 83,311 | | | |
Class B | | | 8,177 | | | |
Class C | | | 11,800 | | | |
Class R2 | | | 2,041 | | | |
Class Y | | | 686 | | | |
|
Dividends on short sales | | | 4,344,068 | | | |
|
Financing expense from short sales | | | 3,485,499 | | | |
|
Interest on short sales | | | 278,441 | | | |
|
Trustees’ compensation | | | 31,521 | | | |
|
Custodian fees and expenses | | | 10,527 | | | |
|
Other | | | 174,301 | | | |
| | | |
Total expenses | | | 20,911,496 | | | |
Less waivers and reimbursements of expenses | | | (1,276,549 | ) | | |
| | | |
Net expenses | | | 19,634,947 | | | |
Net Investment Income | | | 8,245,385 | | | |
1. The Fund invests in a certain affiliated mutual fund that expects to be treated as a partnership for tax purposes. See Note 1 of the accompanying Consolidated Notes.
2. Effective July 1, 2014 Class N were renamed Class R. See Note 1 of the accompanying Consolidated Notes.
| | |
| 30 | | OPPENHEIMER FLEXIBLE STRATEGIES FUND |
| | | | |
Realized and Unrealized Gain (Loss) | | | | |
Net realized gain (loss) on: | | | | |
Investments from: | | | | |
Unaffiliated companies (includes premiums on options exercised) | | $ | 51,152,546 | |
Closing and expiration of futures contracts | | | (2,837,268 | ) |
Foreign currency transactions | | | 2,354,042 | |
Short positions | | | (1,050,655 | ) |
Swap contracts | | | (5,797,592 | ) |
Net realized gain allocated from: | | | | |
Oppenheimer Master Loan Fund, LLC | | | 304,811 | |
| | | | |
Net realized gain | | | 44,125,884 | |
Net change in unrealized appreciation/depreciation on: | | | | |
Investments | | | 14,236,394 | |
Translation of assets and liabilities denominated in foreign currencies | | | 486 | |
Futures contracts | | | (1,016,748 | ) |
Short positions | | | 544,774 | |
Swap contracts | | | 5,905,381 | |
Net change in unrealized appreciation/depreciation allocated from: | | | | |
Oppenheimer Master Loan Fund, LLC | | | (1,490,743 | ) |
| | | | |
Net change in unrealized appreciation/depreciation | | | 18,179,544 | |
Net Increase in Net Assets Resulting from Operations | | $ | 70,550,813 | |
| | | | |
| | | | |
See accompanying Notes to Consolidated Financial Statements.
| | |
| 31 | | OPPENHEIMER FLEXIBLE STRATEGIES FUND |
CONSOLIDATED STATEMENTS OF CHANGES IN NET ASSETS
| | | | | | | | |
| | | Year Ended
October 31, 2014 | | | Year Ended
October 31, 2013 | |
Operations | | | | | | | | |
Net investment income | | $ | 8,245,385 | | | $ | 10,137,159 | |
Net realized gain | | | 44,125,884 | | | | 26,621,764 | |
Net change in unrealized appreciation/depreciation | | | 18,179,544 | | | | 5,982,485 | |
| | | | | | | | |
Net increase in net assets resulting from operations | | | 70,550,813 | | | | 42,741,408 | |
Beneficial Interest Transactions | | | | | | | | |
Net increase (decrease) in net assets resulting from beneficial interest transactions: | | | | | | | | |
Class A | | | (82,035,611 | ) | | | (140,308,061 | ) |
Class B | | | (11,579,268 | ) | | | (14,031,285 | ) |
Class C | | | (11,356,414 | ) | | | (27,694,063 | ) |
Class I | | | — | | | | 10,000 | |
Class R1 | | | (4,758,398 | ) | | | (7,842,250 | ) |
Class Y | | | 7,106,738 | | | | (5,596,759 | ) |
| | | | | | | | |
| | | (102,622,953 | ) | | | (195,462,418 | ) |
Net Assets | | | | | | | | |
| Total decrease | | | (32,072,140 | ) | | | (152,721,010 | ) |
Beginning of period | | | 847,231,147 | | | | 999,952,157 | |
| | | | | | | | |
| | |
| End of period (including accumulated net investment income of $11,413,762 and $8,216,591, respectively) | | $ | 815,159,007 | | | $ | 847,231,147 | |
| | | | | | | | |
| | | | | | | | |
| | | | | | | | |
1. Effective July 1, 2014, Class N shares were renamed Class R. See Note 1 of the accompanying Consolidated Notes.
See accompanying Notes to Consolidated Financial Statements.
| | |
| 32 | | OPPENHEIMER FLEXIBLE STRATEGIES FUND |
CONSOLIDATED FINANCIAL HIGHLIGHTS
| | | | | | | | | | | | | | | | | | | | |
| Class A | | Year Ended
October 31,
2014 | | | Year Ended
October 31,
2013 | | | Year Ended
October 31,
2012 | | | Year Ended
October 31,
2011 | | | Year Ended
October 29,
20101 | |
Per Share Operating Data | | | | | | | | | | | | | | | | | | | | |
| Net asset value, beginning of period | | $ | 24.48 | | | $ | 23.35 | | | $ | 25.55 | | | $ | 26.01 | | | $ | 24.46 | |
| |
| Income (loss) from investment operations: | | | | | | | | | | | | | | | | | | | | |
| Net investment income (loss)2 | | | 0.29 | | | | 0.30 | | | | 0.04 | | | | (0.17 | ) | | | (0.11) | |
| Net realized and unrealized gain (loss) | | | 1.87 | | | | 0.83 | | | | (0.10 | ) | | | 0.22 | | | | 1.66 | |
| | | | |
| Total from investment operations | | | 2.16 | | | | 1.13 | | | | (0.06 | ) | | | 0.05 | | | | 1.55 | |
| |
| Dividends and/or distributions to shareholders: | | | | | | | | | | | | | | | | | | | | |
| Distributions from net realized gain | | | 0.00 | | | | 0.00 | | | | (2.13 | ) | | | (0.51 | ) | | | 0.00 | |
| Tax return of capital distribution | | | 0.00 | | | | 0.00 | | | | (0.01 | ) | | | 0.00 | | | | 0.00 | |
| | | | |
| Total dividends and/or distributions to shareholders | | | 0.00 | | | | 0.00 | | | | (2.14 | ) | | | (0.51 | ) | | | 0.00 | |
| |
| Net asset value, end of period | | $ | 26.64 | | | $ | 24.48 | | | $ | 23.35 | | | $ | 25.55 | | | $ | 26.01 | |
| | | | |
| |
| Total Return, at Net Asset Value3 | | | 8.82 | % | | | 4.84 | % | | | 0.03 | % | | | 0.14 | % | | | 6.34% | |
| |
| Ratios/Supplemental Data | | | | | | | | | | | | | | | | | | | | |
Net assets, end of period (in thousands) | | $ | 642,789 | | | $ | 668,235 | | | $ | 774,007 | | | $ | 1,024,109 | | | $ | 1,229,920 | |
| |
| Average net assets (in thousands) | | $ | 662,351 | | | $ | 721,521 | | | $ | 870,856 | | | $ | 1,165,257 | | | $ | 1,297,058 | |
| |
| Ratios to average net assets:4 | | | | | | | | | | | | | | | | | | | | |
| Net investment income (loss) | | | 1.12% | 5 | | | 1.25% | 5 | | | 0.19% | 5 | | | (0.65)% | | | | (0.44)% | |
| Total expenses6 | | | 2.39% | 5 | | | 2.04% | 5 | | | 1.85% | 5 | | | 1.57% | | | | 1.43% | |
| Expenses after payments, waivers and/or reimbursements and reduction to custodian expenses | | | 2.25% | 5 | | | 1.97% | 5 | | | 1.78% | 5 | | | 1.52% | | | | 1.38% | |
| |
| Portfolio turnover rate | | | 44% | | | | 76% | | | | 212% | | | | 181% | | | | 58% | |
1. October 29, 2010 represents the last business day of the Fund’s reporting period.
2. Per share amounts calculated based on the average shares outstanding during the period.
3. Assumes an initial investment on the business day before the first day of the fiscal period, with all dividends and distributions reinvested in additional shares on the reinvestment date, and redemption at the net asset value calculated on the last business day of the fiscal period. Sales charges are not reflected in the total returns. Total returns are not annualized for periods less than one full year. Returns do not reflect the deduction of taxes that a shareholder would pay on fund distributions or the redemption of fund shares.
4. Annualized for periods less than one full year.
5. Includes the Fund’s share of the allocated expenses and/or net investment income from the master funds.
6. Total expenses including indirect expenses from affiliated fund fees and expenses were as follows:
| | | | |
Year Ended October 31, 2014 | | | 2.40 | % |
Year Ended October 31, 2013 | | | 2.06 | % |
Year Ended October 31, 2012 | | | 1.90 | % |
Year Ended October 31, 2011 | | | 1.62 | % |
Year Ended October 29, 2010 | | | 1.48 | % |
See accompanying Notes to Consolidated Financial Statements.
| | |
| 33 | | OPPENHEIMER FLEXIBLE STRATEGIES FUND |
CONSOLIDATED FINANCIAL HIGHLIGHTS Continued
| | | | | | | | | | | | | | | | | | | | |
| Class B | | Year Ended
October 31,
2014 | | | Year Ended
October 31,
2013 | | | Year Ended
October 31,
2012 | | | Year Ended
October 31,
2011 | | | Year Ended
October 29,
20101 | |
Per Share Operating Data | | | | | | | | | | | | | | | | | | | | |
| Net asset value, beginning of period | | $ | 22.08 | | | $ | 21.25 | | | $ | 23.63 | | | $ | 24.32 | | | $ | 23.07 | |
| |
| Income (loss) from investment operations: | | | | | | | | | | | | | | | | | | | | |
| Net investment income (loss)2 | | | 0.08 | | | | 0.08 | | | | (0.15 | ) | | | (0.38 | ) | | | (0.31) | |
| Net realized and unrealized gain (loss) | | | 1.68 | | | | 0.75 | | | | (0.09 | ) | | | 0.20 | | | | 1.56 | |
| | | | |
| Total from investment operations | | | 1.76 | | | | 0.83 | | | | (0.24 | ) | | | (0.18 | ) | | | 1.25 | |
| |
| Dividends and/or distributions to shareholders: | | | | | | | | | | | | | | | | | | | | |
| Distributions from net realized gain | | | 0.00 | | | | 0.00 | | | | (2.13 | ) | | | (0.51 | ) | | | 0.00 | |
| Tax return of capital distribution | | | 0.00 | | | | 0.00 | | | | (0.01 | ) | | | 0.00 | | | | 0.00 | |
| | | | |
| Total dividends and/or distributions to shareholders | | | 0.00 | | | | 0.00 | | | | (2.14 | ) | | | (0.51 | ) | | | 0.00 | |
| |
| Net asset value, end of period | | $ | 23.84 | | | $ | 22.08 | | | $ | 21.25 | | | $ | 23.63 | | | $ | 24.32 | |
| | | | |
| |
| Total Return, at Net Asset Value3 | | | 7.97 | % | | | 3.91 | % | | | (0.79 | )% | | | (0.81 | )% | | | 5.42% | |
| |
| Ratios/Supplemental Data | | | | | | | | | | | | | | | | | | | | |
Net assets, end of period (in thousands) | | $ | 25,296 | | | $ | 34,346 | | | $ | 46,780 | | | $ | 68,426 | | | $ | 91,209 | |
| |
| Average net assets (in thousands) | | $ | 30,329 | | | $ | 40,057 | | | $ | 56,004 | | | $ | 82,022 | | | $ | 98,421 | |
| |
| Ratios to average net assets:4 | | | | | | | | | | | | | | | | | | | | |
| Net investment income (loss) | | | 0.34% | 5 | | | 0.35% | 5 | | | (0.70)%5 | | | | (1.55)% | | | | (1.34)% | |
| Total expenses6 | | | 3.26% | 5 | | | 3.06% | 5 | | | 2.85% | 5 | | | 2.57% | | | | 2.43% | |
| Expenses after payments, waivers and/or reimbursements and reduction to custodian expenses | | | 3.06% | 5 | | | 2.86% | 5 | | | 2.67% | 5 | | | 2.43% | | | | 2.29% | |
| |
| Portfolio turnover rate | | | 44% | | | | 76% | | | | 212% | | | | 181% | | | | 58% | |
1. October 29, 2010 represents the last business day of the Fund’s reporting period.
2. Per share amounts calculated based on the average shares outstanding during the period.
3. Assumes an initial investment on the business day before the first day of the fiscal period, with all dividends and distributions reinvested in additional shares on the reinvestment date, and redemption at the net asset value calculated on the last business day of the fiscal period. Sales charges are not reflected in the total returns. Total returns are not annualized for periods less than one full year. Returns do not reflect the deduction of taxes that a shareholder would pay on fund distributions or the redemption of fund shares.
4. Annualized for periods less than one full year.
5. Includes the Fund’s share of the allocated expenses and/or net investment income from the master funds.
6. Total expenses including indirect expenses from affiliated fund fees and expenses were as follows:
| | | | |
Year Ended October 31, 2014 | | | 3.27 | % |
Year Ended October 31, 2013 | | | 3.08 | % |
Year Ended October 31, 2012 | | | 2.90 | % |
Year Ended October 31, 2011 | | | 2.62 | % |
Year Ended October 29, 2010 | | | 2.48 | % |
See accompanying Notes to Consolidated Financial Statements.
| | |
| 34 | | OPPENHEIMER FLEXIBLE STRATEGIES FUND |
| | | | | | | | | | | | | | | | | | | | |
| Class C | | Year Ended
October 31,
2014 | | | Year Ended
October 31,
2013 | | | Year Ended
October 31,
2012 | | | Year Ended
October 31,
2011 | | | Year Ended
October 29,
20101 | |
Per Share Operating Data | | | | | | | | | | | | | | | | | | | | |
| Net asset value, beginning of period | | $ | 22.12 | | | $ | 21.26 | | | $ | 23.62 | | | $ | 24.27 | | | $ | 22.99 | |
| |
| Income (loss) from investment operations: | | | | | | | | | | | | | | | | | | | | |
| Net investment income (loss)2 | | | 0.08 | | | | 0.10 | | | | (0.12 | ) | | | (0.35 | ) | | | (0.28) | |
| Net realized and unrealized gain (loss) | | | 1.69 | | | | 0.76 | | | | (0.10 | ) | | | 0.21 | | | | 1.56 | |
| | | | |
| Total from investment operations | | | 1.77 | | | | 0.86 | | | | (0.22 | ) | | | (0.14 | ) | | | 1.28 | |
| |
| Dividends and/or distributions to shareholders: | | | | | | | | | | | | | | | | | | | | |
| Distributions from net realized gain | | | 0.00 | | | | 0.00 | | | | (2.13 | ) | | | (0.51 | ) | | | 0.00 | |
| Tax return of capital distribution | | | 0.00 | | | | 0.00 | | | | (0.01 | ) | | | 0.00 | | | | 0.00 | |
| | | | |
| Total dividends and/or distributions to shareholders | | | 0.00 | | | | 0.00 | | | | (2.14 | ) | | | (0.51 | ) | | | 0.00 | |
| |
| Net asset value, end of period | | $ | 23.89 | | | $ | 22.12 | | | $ | 21.26 | | | $ | 23.62 | | | $ | 24.27 | |
| | | | |
| |
| Total Return, at Net Asset Value3 | | | 8.00 | % | | | 4.05 | % | | | (0.71 | )% | | | (0.64 | )% | | | 5.57% | |
| |
| Ratios/Supplemental Data | | | | | | | | | | | | | | | | | | | | |
Net assets, end of period (in thousands) | | $ | 110,383 | | | $ | 112,993 | | | $ | 135,750 | | | $ | 199,765 | | | $ | 247,138 | |
| |
| Average net assets (in thousands) | | $ | 112,984 | | | $ | 122,514 | | | $ | 160,258 | | | $ | 233,997 | | | $ | 259,581 | |
| |
| Ratios to average net assets:4 | | | | | | | | | | | | | | | | | | | | |
| Net investment income (loss) | | | 0.36% | 5 | | | 0.48% | 5 | | | (0.59)%5 | | | | (1.40)% | | | | (1.20)% | |
| Total expenses6 | | | 3.16% | 5 | | | 2.81% | 5 | | | 2.62% | 5 | | | 2.32% | | | | 2.18% | |
| Expenses after payments, waivers and/or reimbursements and reduction to custodian expenses | | | 3.02% | 5 | | | 2.74% | 5 | | | 2.55% | 5 | | | 2.27% | | | | 2.13% | |
| |
| Portfolio turnover rate | | | 44% | | | | 76% | | | | 212% | | | | 181% | | | | 58% | |
1. October 29, 2010 represents the last business day of the Fund’s reporting period.
2. Per share amounts calculated based on the average shares outstanding during the period.
3. Assumes an initial investment on the business day before the first day of the fiscal period, with all dividends and distributions reinvested in additional shares on the reinvestment date, and redemption at the net asset value calculated on the last business day of the fiscal period. Sales charges are not reflected in the total returns. Total returns are not annualized for periods less than one full year. Returns do not reflect the deduction of taxes that a shareholder would pay on fund distributions or the redemption of fund shares.
4. Annualized for periods less than one full year.
5. Includes the Fund’s share of the allocated expenses and/or net investment income from the master funds.
6. Total expenses including indirect expenses from affiliated fund fees and expenses were as follows:
| | | | |
Year Ended October 31, 2014 | | | 3.17 | % |
Year Ended October 31, 2013 | | | 2.83 | % |
Year Ended October 31, 2012 | | | 2.67 | % |
Year Ended October 31, 2011 | | | 2.37 | % |
Year Ended October 29, 2010 | | | 2.23 | % |
See accompanying Notes to Consolidated Financial Statements.
| | |
| 35 | | OPPENHEIMER FLEXIBLE STRATEGIES FUND |
CONSOLIDATED FINANCIAL HIGHLIGHTS Continued
| | | | | | | | |
| Class I | | Year Ended
October 31,
2014 | | | Period Ended
October 31,
20131 | |
Per Share Operating Data | | | | | | | | |
| Net asset value, beginning of period | | $ | 25.09 | | | $ | 24.32 | |
| |
| Income (loss) from investment operations: | | | | | | | | |
| Net investment income2 | | | 0.42 | | | | 0.34 | |
| Net realized and unrealized gain | | | 1.90 | | | | 0.43 | |
| | | | |
| Total from investment operations | | | 2.32 | | | | 0.77 | |
| |
| Dividends and/or distributions to shareholders: | | | | | | | | |
| Distributions from net realized gain | | | 0.00 | | | | 0.00 | |
| Tax return of capital distribution | | | 0.00 | | | | 0.00 | |
| | | | |
| Total dividends and/or distributions to shareholders | | | 0.00 | | | | 0.00 | |
| |
| Net asset value, end of period | | $ | 27.41 | | | $ | 25.09 | |
| | | | |
| |
| Total Return, at Net Asset Value3 | | | 9.25% | | | | 3.17% | |
| |
| Ratios/Supplemental Data | | | | | | | | |
Net assets, end of period (in thousands) | | $ | 11 | | | $ | 10 | |
| |
| Average net assets (in thousands) | | $ | 11 | | | $ | 10 | |
| |
| Ratios to average net assets:4,5 | | | | | | | | |
| Net investment income | | | 1.57% | | | | 2.07% | |
| Total expenses6 | | | 1.92% | | | | 1.86% | |
| Expenses after payments, waivers and/or reimbursements and reduction to custodian expenses | | | 1.79% | | | | 1.79% | |
| |
| Portfolio turnover rate | | | 44% | | | | 76% | |
1. For the period from February 28, 2013 (inception of offering) to October 31, 2013.
2. Per share amounts calculated based on the average shares outstanding during the period.
3. Assumes an initial investment on the business day before the first day of the fiscal period, with all dividends and distributions reinvested in additional shares on the reinvestment date, and redemption at the net asset value calculated on the last business day of the fiscal period. Sales charges are not reflected in the total returns. Total returns are not annualized for periods less than one full year. Returns do not reflect the deduction of taxes that a shareholder would pay on fund distributions or the redemption of fund shares.
4. Annualized for periods less than one full year.
5. Includes the Fund’s share of the allocated expenses and/or net investment income from the master funds.
6. Total expenses including indirect expenses from affiliated fund fees and expenses were as follows:
| | | | |
Year Ended October 31, 2014 | | | 1.93 | % |
Period Ended October 31, 2013 | | | 1.88 | % |
See accompanying Notes to Consolidated Financial Statements.
| | |
| 36 | | OPPENHEIMER FLEXIBLE STRATEGIES FUND |
| | | | | | | | | | | | | | | | | | | | |
| Class R | | Year Ended
October 31,
2014 | | | Year Ended
October 31,
2013 | | | Year Ended
October 31,
2012 | | | Year Ended
October 31,
2011 | | | Year Ended
October 29,
20101 | |
Per Share Operating Data | | | | | | | | | | | | | | | | | | | | |
| Net asset value, beginning of period | | $ | 23.54 | | | $ | 22.53 | | | $ | 24.80 | | | $ | 25.34 | | | $ | 23.91 | |
| |
| Income (loss) from investment operations: | | | | | | | | | | | | | | | | | | | | |
| Net investment income (loss)2 | | | 0.21 | | | | 0.21 | | | | (0.03 | ) | | | (0.24 | ) | | | (0.19) | |
| Net realized and unrealized gain (loss) | | | 1.80 | | | | 0.80 | | | | (0.10 | ) | | | 0.21 | | | | 1.62 | |
| | | | |
| Total from investment operations | | | 2.01 | | | | 1.01 | | | | (0.13 | ) | | | (0.03 | ) | | | 1.43 | |
| |
| Dividends and/or distributions to shareholders: | | | | | | | | | | | | | | | | | | | | |
| Distributions from net realized gain | | | 0.00 | | | | 0.00 | | | | (2.13 | ) | | | (0.51 | ) | | | 0.00 | |
| Tax return of capital distribution | | | 0.00 | | | | 0.00 | | | | (0.01 | ) | | | 0.00 | | | | 0.00 | |
| | | | |
| Total dividends and/or distributions to shareholders | | | 0.00 | | | | 0.00 | | | | (2.14 | ) | | | (0.51 | ) | | | 0.00 | |
| |
| Net asset value, end of period | | $ | 25.55 | | | $ | 23.54 | | | $ | 22.53 | | | $ | 24.80 | | | $ | 25.34 | |
| | | | |
| |
| Total Return, at Net Asset Value3 | | | 8.54 | % | | | 4.48 | % | | | (0.27 | )% | | | (0.18 | )% | | | 5.98% | |
| |
| Ratios/Supplemental Data | | | | | | | | | | | | | | | | | | | | |
Net assets, end of period (in thousands) | | $ | 17,302 | | | $ | 20,410 | | | $ | 27,181 | | | $ | 39,916 | | | $ | 46,237 | |
| |
| Average net assets (in thousands) | | $ | 19,224 | | | $ | 23,822 | | | $ | 33,095 | | | $ | 45,004 | | | $ | 43,184 | |
| |
| Ratios to average net assets:4 | | | | | | | | | | | | | | | | | | | | |
| Net investment income (loss) | | | 0.85% | 5 | | | 0.92% | 5 | | | (0.14)%5 | | | | (0.95)% | | | | (0.79)% | |
| Total expenses6 | | | 2.69% | 5 | | | 2.36% | 5 | | | 2.18% | 5 | | | 1.87% | | | | 1.77% | |
| Expenses after payments, waivers and/or reimbursements and reduction to custodian expenses | | | 2.54% | 5 | | | 2.29% | 5 | | | 2.11% | 5 | | | 1.82% | | | | 1.71% | |
| |
| Portfolio turnover rate | | | 44% | | | | 76% | | | | 212% | | | | 181% | | | | 58% | |
1. October 29, 2010 represents the last business day of the Fund’s reporting period.
2. Per share amounts calculated based on the average shares outstanding during the period.
3. Assumes an initial investment on the business day before the first day of the fiscal period, with all dividends and distributions reinvested in additional shares on the reinvestment date, and redemption at the net asset value calculated on the last business day of the fiscal period. Sales charges are not reflected in the total returns. Total returns are not annualized for periods less than one full year. Returns do not reflect the deduction of taxes that a shareholder would pay on fund distributions or the redemption of fund shares.
4. Annualized for periods less than one full year.
5. Includes the Fund’s share of the allocated expenses and/or net investment income from the master funds.
6. Total expenses including indirect expenses from affiliated fund fees and expenses were as follows:
| | | | |
Year Ended October 31, 2014 | | | 2.70 | % |
Year Ended October 31, 2013 | | | 2.38 | % |
Year Ended October 31, 2012 | | | 2.23 | % |
Year Ended October 31, 2011 | | | 1.92 | % |
Year Ended October 29, 2010 | | | 1.82 | % |
See accompanying Notes to Consolidated Financial Statements.
| | |
| 37 | | OPPENHEIMER FLEXIBLE STRATEGIES FUND |
CONSOLIDATED FINANCIAL HIGHLIGHTS Continued
| | | | | | | | | | | | | | | | | | | | |
| Class Y | | Year Ended
October 31,
2014 | | | Year Ended
October 31,
2013 | | | Year Ended
October 31,
2012 | | | Year Ended
October 31,
2011 | | | Year Ended
October 29,
20101 | |
Per Share Operating Data | | | | | | | | | | | | | | | | | | | | |
| Net asset value, beginning of period | | $ | 25.05 | | | $ | 23.84 | | | $ | 25.97 | | | $ | 26.35 | | | $ | 24.70 | |
| |
| Income (loss) from investment operations: | | | | | | | | | | | | | | | | | | | | |
| Net investment income (loss)2 | | | 0.34 | | | | 0.38 | | | | 0.10 | | | | (0.09 | ) | | | (0.04) | |
| Net realized and unrealized gain (loss) | | | 1.93 | | | | 0.83 | | | | (0.09 | ) | | | 0.22 | | | | 1.69 | |
| | | | |
| Total from investment operations | | | 2.27 | | | | 1.21 | | | | 0.01 | | | | 0.13 | | | | 1.65 | |
| |
| Dividends and/or distributions to shareholders: | | | | | | | | | | | | | | | | | | | | |
| Distributions from net realized gain | | | 0.00 | | | | 0.00 | | | | (2.13 | ) | | | (0.51 | ) | | | 0.00 | |
| Tax return of capital distribution | | | 0.00 | | | | 0.00 | | | | (0.01 | ) | | | 0.00 | | | | 0.00 | |
| | | | |
| Total dividends and/or distributions to shareholders | | | 0.00 | | | | 0.00 | | | | (2.14 | ) | | | (0.51 | ) | | | 0.00 | |
| |
| Net asset value, end of period | | $ | 27.32 | | | $ | 25.05 | | | $ | 23.84 | | | $ | 25.97 | | | $ | 26.35 | |
| | | | |
| |
| Total Return, at Net Asset Value3 | | | 9.06 | % | | | 5.08 | % | | | 0.32 | % | | | 0.45 | % | | | 6.68% | |
| |
| Ratios/Supplemental Data | | | | | | | | | | | | | | | | | | | | |
Net assets, end of period (in thousands) | | $ | 19,378 | | | $ | 11,237 | | | $ | 16,234 | | | $ | 53,803 | | | $ | 50,445 | |
| |
| Average net assets (in thousands) | | $ | 14,096 | | | $ | 12,213 | | | $ | 28,561 | | | $ | 58,196 | | | $ | 50,667 | |
| |
| Ratios to average net assets:4 | | | | | | | | | | | | | | | | | | | | |
| Net investment income (loss) | | | 1.27% | 5 | | | 1.52% | 5 | | | 0.41%5 | | | | (0.34)% | | | | (0.14)% | |
| Total expenses6 | | | 2.75% | 5 | | | 1.79% | 5 | | | 1.60% | 5 | | | 1.25% | | | | 1.11% | |
| Expenses after payments, waivers and/or reimbursements and reduction to custodian expenses | | | 2.04% | 5 | | | 1.72% | 5 | | | 1.53% | 5 | | | 1.20% | | | | 1.06% | |
| |
| Portfolio turnover rate | | | 44% | | | | 76% | | | | 212% | | | | 181% | | | | 58% | |
1. October 29, 2010 represents the last business day of the Fund’s reporting period.
2. Per share amounts calculated based on the average shares outstanding during the period.
3. Assumes an initial investment on the business day before the first day of the fiscal period, with all dividends and distributions reinvested in additional shares on the reinvestment date, and redemption at the net asset value calculated on the last business day of the fiscal period. Sales charges are not reflected in the total returns. Total returns are not annualized for periods less than one full year. Returns do not reflect the deduction of taxes that a shareholder would pay on fund distributions or the redemption of fund shares.
4. Annualized for periods less than one full year.
5. Includes the Fund’s share of the allocated expenses and/or net investment income from the master funds.
6. Total expenses including indirect expenses from affiliated fund fees and expenses were as follows:
| | | | |
Year Ended October 31, 2014 | | | 2.76 | % |
Year Ended October 31, 2013 | | | 1.81 | % |
Year Ended October 31, 2012 | | | 1.65 | % |
Year Ended October 31, 2011 | | | 1.30 | % |
Year Ended October 29, 2010 | | | 1.16 | % |
See accompanying Notes to Consolidated Financial Statements.
| | |
| 38 | | OPPENHEIMER FLEXIBLE STRATEGIES FUND |
NOTES TO CONSOLIDATED FINANCIAL STATEMENTS October 31, 2014
1. Significant Accounting Policies
Oppenheimer Flexible Strategies Fund (the “Fund”), a series of Oppenheimer Quest For Value Funds, is registered under the Investment Company Act of 1940 (“1940 Act”), as amended, as a diversified open-end management investment company. The Fund’s investment objective is to seek total return. The Fund’s investment adviser is OFI Global Asset Management, Inc. (“OFI Global” or the “Manager”), a wholly-owned subsidiary of OppenheimerFunds, Inc. (“OFI” or the “Sub-Adviser”). The Manager has entered into a sub-advisory agreement with OFI.
The Fund offers Class A, Class C, Class I, Class R and Class Y shares, and previously offered Class B shares for new purchase through June 29, 2012. Subsequent to that date, no new purchases of Class B shares are permitted, however reinvestment of dividend and/or capital gain distributions and exchanges of Class B shares into and from other Oppenheimer funds will be allowed. As of July 1, 2014, Class N shares were renamed Class R shares. Class N shares subject to a contingent deferred sales charge (“CDSC”) on July 1, 2014, will continue to be subject to a CDSC after the shares are renamed. Purchases of Class R shares occurring on or after July 1, 2014, will not be subject to a CDSC upon redemption. Class A shares are sold at their offering price, which is normally net asset value plus a front-end sales charge. Class C and Class R shares are sold, and Class B shares were sold, without a front-end sales charge but may be subject to a contingent deferred sales charge (“CDSC”). Class R shares are sold only through retirement plans. Retirement plans that offer Class R shares may impose charges on those accounts. Class I and Class Y shares are sold to certain institutional investors or intermediaries without either a front-end sales charge or a CDSC, however, the intermediaries may impose charges on their accountholders who beneficially own Class I and Class Y shares. All classes of shares have identical rights and voting privileges with respect to the Fund in general and exclusive voting rights on matters that affect that class alone. Earnings, net assets and net asset value per share may differ due to each class having its own expenses, such as transfer and shareholder servicing agent fees and shareholder communications, directly attributable to that class. Class A, B, C and R shares have separate distribution and/or service plans under which they pay fees. Class I and Class Y shares do not pay such fees. Class B shares will automatically convert to Class A shares 72 months after the date of purchase.
The following is a summary of significant accounting policies consistently followed by the Fund.
Structured Securities. The Fund invests in structured securities whose market values, interest rates and/or redemption prices are linked to the performance of underlying foreign currencies, interest rate spreads, stock market indices, prices of individual securities, commodities or other financial instruments or the occurrence of other specific events. The structured securities are often leveraged, increasing the volatility of each note’s market value relative to the change in the underlying linked financial element or event. Fluctuations in value of these securities are recorded as unrealized gains and losses in the accompanying Consolidated Statement of Operations. The Fund records a realized gain or loss when a structured security is sold or matures.
| | |
| 39 | | OPPENHEIMER FLEXIBLE STRATEGIES FUND |
NOTES TO CONSOLIDATED FINANCIAL STATEMENTS Continued
1. Significant Accounting Policies (Continued)
Securities Sold Short. The Fund sells securities that it does not own, and it will therefore be obligated to purchase such securities at a future date. Upon entering into a short position, the Fund is required to segregate cash or securities at its custodian which are pledged for the benefit of the lending broker and/or to deposit and pledge cash directly at the lending broker, with a value equal to a certain percentage, exceeding 100%, of the value of the securities that it sold short. Cash that has been segregated and pledged for this purpose will be disclosed on the Consolidated Statement of Assets and Liabilities; securities that have been segregated and pledged for this purpose are disclosed as such in the Consolidated Statement of Investments. The aggregate market value of such cash and securities at period end is $209,039,726. The value of the open short position is recorded as a liability, and the Fund records an unrealized gain or loss to the extent of the difference between the proceeds received and the change in value of the open short position. The Fund records a realized gain or loss when the short position is closed out. By entering into short sales, the Fund bears the market risk of increases in value of the security sold short in excess of the proceeds received. Until the security is replaced, the Fund is required to pay the lender any dividend or interest earned. Dividend expense on short sales is treated as an expense in the Consolidated Statement of Operations.
Basis for Consolidation. The Fund has established a Cayman Islands exempted company, Oppenheimer Flexible Strategies (Cayman) Fund Ltd., which is wholly-owned and controlled by the Fund (the “Subsidiary”). The Fund and Subsidiary are both managed by the Manager. The Fund may invest up to 25% of its total assets in the Subsidiary. The Subsidiary invests primarily in commodity-linked derivatives (including commodity futures, financial futures, options and swap contracts), and certain fixed-income securities and other investments that may serve as margin or collateral for its derivatives positions. The Subsidiary is subject to the same investment restrictions and guidelines, and follows the same compliance policies and procedures, as the Fund.
The financial statements have been consolidated and include accounts of the Fund and the Subsidiary. Accordingly, all inter-company transactions and balances have been eliminated. At October 31, 2014, the Fund owned 7,500 shares with a market value of $21,292,875.
Equity Security Risk. Stocks and other equity securities fluctuate in price. The value of the Fund’s portfolio may be affected by changes in the equity markets generally. Equity markets may experience significant short-term volatility and may fall sharply at times. Different markets may behave differently from each other and U.S. equity markets may move in the opposite direction from one or more foreign stock markets.
The prices of individual equity securities generally do not all move in the same direction at the same time and a variety of factors can affect the price of a particular company’s securities. These factors may include, but are not limited to, poor earnings reports, a loss of customers, litigation against the company, general unfavorable performance of the company’s sector or industry, or changes in government regulations affecting the company or its industry.
| | |
| 40 | | OPPENHEIMER FLEXIBLE STRATEGIES FUND |
1. Significant Accounting Policies (Continued)
Investment in Oppenheimer Institutional Money Market Fund. The Fund is permitted to invest daily available cash balances in an affiliated money market fund. The Fund may invest the available cash in Class E shares of Oppenheimer Institutional Money Market Fund (“IMMF”) to seek current income while preserving liquidity or for defensive purposes. IMMF is a registered open-end management investment company, regulated as a money market fund under the 1940 Act. The Manager is the investment adviser of IMMF, and the Sub-Adviser provides investment and related advisory services to IMMF. When applicable, the Fund’s investment in IMMF is included in the Consolidated Statement of Investments. Shares of IMMF are valued at their net asset value per share. As a shareholder, the Fund is subject to its proportional share of IMMF’s Class E expenses, including its management fee. The Manager will waive fees and/or reimburse Fund expenses in an amount equal to the indirect management fees incurred through the Fund’s investment in IMMF.
Investment in Oppenheimer Master Fund. The Fund is permitted to invest in entities sponsored and/or advised by the Manager or an affiliate. Certain of these entities in which the Fund invests are mutual funds registered under the Investment Company Act of 1940 that expect to be treated as partnerships for tax purposes, specifically Oppenheimer Master Loan Fund, LLC (the “Master Fund”). The Master Fund has its own investment risks, and those risks can affect the value of the Fund’s investments and therefore the value of the Fund’s shares. To the extent that the Fund invests more of its assets in the Master Fund, the Fund will have greater exposure to the risks of the Master Fund.
The investment objective of the Master Fund is to seek income. The Fund’s investment in the Master Fund is included in the Consolidated Statement of Investments. The Fund recognizes income and gain/(loss) on its investment in the master fund according to its allocated pro-rata share, based on its relative proportion of total outstanding Master Fund shares held, of the total net income earned and the net gain/(loss) realized on investments sold by the Master Fund. As a shareholder, the Fund is subject to its proportional share of the Master Fund’s expenses, including its management fee. The Manager will waive fees and/or reimburse Fund expenses in an amount equal to the indirect management fees incurred through the Fund’s investment in the Master Fund.
Foreign Currency Translation. The Fund’s accounting records are maintained in U.S. dollars. The values of securities denominated in foreign currencies and amounts related to the purchase and sale of foreign securities and foreign investment income are translated into U.S. dollars as of the close of the New York Stock Exchange (the “Exchange”), normally 4:00 P.M. Eastern time, on each day the Exchange is open for trading. Foreign exchange rates may be valued primarily using a reliable bank, dealer or service authorized by the Board of Trustees.
Reported net realized gains and losses from foreign currency transactions arise from sales of portfolio securities, sales and maturities of short-term securities, sales of foreign currencies, exchange rate fluctuations between the trade and settlement dates on securities transactions, and the difference between the amounts of dividends, interest, and foreign withholding taxes recorded on the Fund’s books and the U.S. dollar equivalent of the amounts actually received
| | |
| 41 | | OPPENHEIMER FLEXIBLE STRATEGIES FUND |
NOTES TO CONSOLIDATED FINANCIAL STATEMENTS Continued
1. Significant Accounting Policies (Continued)
or paid. Net unrealized appreciation and depreciation on the translation of assets and liabilities denominated in foreign currencies arise from changes in the values of assets and liabilities, including investments in securities at fiscal period end, resulting from changes in exchange rates.
The effect of changes in foreign currency exchange rates on investments is separately identified from the fluctuations arising from changes in market values of securities held and reported with all other foreign currency gains and losses in the Fund’s Consolidated Statement of Operations.
Allocation of Income, Expenses, Gains and Losses. Income, expenses (other than those attributable to a specific class), gains and losses are allocated on a daily basis to each class of shares based upon the relative proportion of net assets represented by such class. Operating expenses directly attributable to a specific class are charged against the operations of that class.
Federal Taxes. The Fund intends to comply with provisions of the Internal Revenue Code applicable to regulated investment companies and to distribute substantially all of its investment company taxable income, including any net realized gain on investments not offset by capital loss carryforwards, if any, to shareholders. Therefore, no federal income or excise tax provision is required. The Fund files income tax returns in U.S. federal and applicable state jurisdictions. The statute of limitations on the Fund’s tax return filings generally remain open for the three preceding fiscal reporting period ends.
Subchapter M requires, among other things, that at least 90% of the Fund’s gross income be derived from securities or derived with respect to its business of investing in securities (typically referred to as “qualifying income”). Income from commodity-linked derivatives may not be treated as “qualifying income” for purposes of the 90% gross income requirement. The Internal Revenue Service (IRS) has previously issued a number of private letter rulings which conclude that income derived from commodity index-linked notes and investments in a wholly-owned subsidiary will be “qualifying income.” As a result, the Fund will gain exposure to commodities through commodity-linked notes and its wholly-owned subsidiary.
The IRS has suspended the granting of private letter rulings pending further review. As a result, there can be no assurance that the IRS will not change its position with respect to commodity-linked notes and wholly-owned subsidiaries. In addition, future legislation and guidance from Treasury and the IRS may adversely affect the fund’s ability to gain exposure to commodities through commodity-linked notes and its wholly-owned subsidiary.
The Fund is required to include in income for federal income tax purposes all of the subsidiary’s net income and gains whether or not such income is distributed by the subsidiary. Net income and gains from the subsidiary are generally treated as ordinary income by the Fund, regardless of the character of the subsidiary’s underlying income. Net losses from the subsidiary do not pass through to the Fund for federal income tax purposes.
| | |
| 42 | | OPPENHEIMER FLEXIBLE STRATEGIES FUND |
1. Significant Accounting Policies (Continued)
The tax components of capital shown in the following table represent distribution requirements the Fund must satisfy under the income tax regulations, losses the Fund may be able to offset against income and gains realized in future years and unrealized appreciation or depreciation of securities and other investments for federal income tax purposes.
| | | | | | |
Undistributed Net Investment Income | | Undistributed Long-Term Gain | | Accumulated Loss
Carryforward1,2,3 | | Net Unrealized Appreciation Based on cost of Securities and Other Investments for Federal Income Tax Purposes |
$10,957,497 | | $— | | $40,636,922 | | $69,882,937 |
1. As of October 31, 2014, the Fund had $40,636,922 of net capital loss carryforward available to offset future realized capital gains, if any, and thereby reduce future taxable gain distributions. Details of the capital loss carryforwards are included in the table below. Capital loss carryovers with no expiration, if any, must be utilized prior to those with expiration dates.
| | |
| Expiring | | |
No expiration | | $ 40,636,922 |
2. During the fiscal year ended October 31, 2014, the Fund utilized $48,133,930 of capital loss carryforward to offset capital gains realized in that fiscal year.
3. During the fiscal year ended October 31, 2013, the Fund utilized $36,560,232 of capital loss carryforward to offset capital gains realized in that fiscal year.
Net investment income (loss) and net realized gain (loss) may differ for financial statement and tax purposes. The character of dividends and distributions made during the fiscal year from net investment income or net realized gains may differ from their ultimate characterization for federal income tax purposes. Also, due to timing of dividends and distributions, the fiscal year in which amounts are distributed may differ from the fiscal year in which the income or net realized gain was recorded by the Fund.
Accordingly, the following amounts have been reclassified for October 31, 2014. Net assets of the Fund were unaffected by the reclassifications.
| | | | | | | | |
Increase to Paid-in Capital | | Reduction to Accumulated Net Investment Income | | | Reduction to Accumulated Net Realized Loss on Investments | |
$363,468 | | | $5,048,214 | | | | $4,684,746 | |
No distributions were paid during the years ended October 31, 2014 and October 31, 2013.
The aggregate cost of securities and other investments and the composition of unrealized appreciation and depreciation of securities and other investments for federal income tax purposes as of October 31, 2014 are noted in the following table. The primary difference between book and tax appreciation or depreciation of securities and other investments, if
| | |
| 43 | | OPPENHEIMER FLEXIBLE STRATEGIES FUND |
NOTES TO CONSOLIDATED FINANCIAL STATEMENTS Continued
1. Significant Accounting Policies (Continued)
applicable, is attributable to the tax deferral of losses or tax realization of financial statement unrealized gain or loss.
| | | | |
Federal tax cost of securities | | | $ 700,139,061 | |
Federal tax cost of other investments | | | (154,766,738 | ) |
| | | | |
Total federal tax cost | | | $ 545,372,323 | |
| | | | |
Gross unrealized appreciation | | | $ 142,994,775 | |
Gross unrealized depreciation | | | (73,111,838 | ) |
| | | | |
Net unrealized appreciation | | | $ 69,882,937 | |
| | | | |
Dividends and Distributions to Shareholders. Dividends and distributions to shareholders, which are determined in accordance with income tax regulations and may differ from U.S. generally accepted accounting principles, are recorded on the ex-dividend date. Income and capital gain distributions, if any, are declared and paid annually or at other times as deemed necessary by the Manager.
Investment Income. Dividend income is recorded on the ex-dividend date or upon ex-dividend notification in the case of certain foreign dividends where the ex-dividend date may have passed. Non-cash dividends included in dividend income, if any, are recorded at the fair market value of the securities received. Interest income is recognized on an accrual basis. Discount and premium, which are included in interest income on the Consolidated Statement of Operations, are amortized or accreted daily.
Custodian Fees. “Custodian fees and expenses” in the Consolidated Statement of Operations may include interest expense incurred by the Fund on any cash overdrafts of its custodian account during the period. Such cash overdrafts may result from the effects of failed trades in portfolio securities and from cash outflows resulting from unanticipated shareholder redemption activity. The Fund pays interest to its custodian on such cash overdrafts, to the extent they are not offset by positive cash balances maintained by the Fund, at a rate equal to the Federal Funds Rate plus 0.50%. The “Reduction to custodian expenses” line item, if applicable, represents earnings on cash balances maintained by the Fund during the period. Such interest expense and other custodian fees may be paid with these earnings.
Security Transactions. Security transactions are recorded on the trade date. Realized gains and losses on securities sold are determined on the basis of identified cost.
Indemnifications. The Fund’s organizational documents provide current and former Trustees and officers with a limited indemnification against liabilities arising in connection with the performance of their duties to the Fund. In the normal course of business, the Fund may also enter into contracts that provide general indemnifications. The Fund’s maximum exposure under these arrangements is unknown as this would be dependent on future claims that may be made against the Fund. The risk of material loss from such claims is considered remote.
| | |
| 44 | | OPPENHEIMER FLEXIBLE STRATEGIES FUND |
1. Significant Accounting Policies (Continued)
Other. The preparation of financial statements in conformity with accounting principles generally accepted in the United States of America requires management to make estimates and assumptions that affect the reported amounts of assets and liabilities and disclosure of contingent assets and liabilities at the date of the financial statements and the reported amounts of increases and decreases in net assets from operations during the reporting period. Actual results could differ from those estimates.
2. Securities Valuation
The Fund calculates the net asset value of its shares as of the close of the New York Stock Exchange (the “Exchange”), normally 4:00 P.M. Eastern time, on each day the Exchange is open for trading.
The Fund’s Board has adopted procedures for the valuation of the Fund’s securities and has delegated the day-to-day responsibility for valuation determinations under those procedures to the Manager. The Manager has established a Valuation Committee which is responsible for determining a “fair valuation” for any security for which market quotations are not “readily available.” The Valuation Committee’s fair valuation determinations are subject to review, approval and ratification by the Fund’s Board at its next regularly scheduled meeting covering the calendar quarter in which the fair valuation was determined.
Valuation Methods and Inputs
Securities are valued using unadjusted quoted market prices, when available, as supplied primarily by third party pricing services or dealers.
The following methodologies are used to determine the market value or the fair value of the types of securities described below:
Securities traded on a registered U.S. securities exchange (including exchange-traded derivatives other than futures and futures options) are valued based on the last sale price of the security reported on the principal exchange on which it is traded, prior to the time when the Fund’s assets are valued. In the absence of a sale, the security is valued at the last sale price on the prior trading day, if it is within the spread of the current day’s closing “bid” and “asked” prices, and if not, at the current day’s closing bid price. A security of a foreign issuer traded on a foreign exchange, but not listed on a registered U.S. securities exchange, is valued based on the last sale price on the principal exchange on which the security is traded, as identified by the third party pricing service used by the Manager, prior to the time when the Fund’s assets are valued. If the last sale price is unavailable, the security is valued at the most recent official closing price on the principal exchange on which it is traded. If the last sales price or official closing price for a foreign security is not available, the security is valued at the mean between the bid and asked price per the exchange or, if not available from the exchange, obtained from two dealers. If bid and asked prices are not available from either the exchange or two dealers, the security is valued by using one of the following methodologies (listed in order of priority): (1) using a bid from the exchange, (2) the mean between the bid and asked price as provided by a single dealer, or (3) a bid from a single dealer.
Shares of a registered investment company that are not traded on an exchange are valued at that investment company’s net asset value per share.
| | |
| 45 | | OPPENHEIMER FLEXIBLE STRATEGIES FUND |
NOTES TO CONSOLIDATED FINANCIAL STATEMENTS Continued
2. Securities Valuation (Continued)
Corporate and government debt securities (of U.S. or foreign issuers) and municipal debt securities, event-linked bonds, loans, mortgage-backed securities, collateralized mortgage obligations, and asset-backed securities are valued at the mean between the “bid” and “asked” prices utilizing evaluated prices obtained from third party pricing services or broker-dealers who may use matrix pricing methods to determine the evaluated prices.
Short-term money market type debt securities with a remaining maturity of sixty days or less are valued at cost adjusted by the amortization of discount or premium to maturity (amortized cost), which approximates market value. Short-term debt securities with a remaining maturity in excess of sixty days are valued at the mean between the “bid” and “asked” prices utilizing evaluated prices obtained from third party pricing services or broker-dealers.
Structured securities, swaps, swaptions, and other over-the-counter derivatives are valued utilizing evaluated prices obtained from third party pricing services or broker-dealers.
Forward foreign currency exchange contracts are valued utilizing current and forward currency rates obtained from third party pricing services. When the settlement date of a contract is an interim date for which a quotation is not available, interpolated values are derived using the nearest dated forward currency rate.
Futures contracts and futures options traded on a commodities or futures exchange will be valued at the final settlement price or official closing price on the principal exchange as reported by such principal exchange at its trading session ending at, or most recently prior to, the time when the Fund’s assets are valued.
A description of the standard inputs that may generally be considered by the third party pricing vendors in determining their evaluated prices is provided below.
| | |
| Security Type | | Standard inputs generally considered by third-party pricing vendors |
| Corporate debt, government debt, municipal, mortgage-backed and asset-backed securities | | Reported trade data, broker-dealer price quotations, benchmark yields, issuer spreads on comparable securities, the credit quality, yield, maturity, and other appropriate factors. |
| Loans | | Information obtained from market participants regarding reported trade data and broker-dealer price quotations. |
| Event-linked bonds | | Information obtained from market participants regarding reported trade data and broker-dealer price quotations. |
| Structured securities | | Relevant market information such as the price of underlying financial instruments, stock market indices, foreign currencies, interest rate spreads, commodities, or the occurrence of other specific events. |
| Swaps | | Relevant market information, including underlying reference assets such as credit spreads, credit event probabilities, index values, individual security values, forward interest rates, variable interest rates, volatility measures, and forward currency rates. |
If a market value or price cannot be determined for a security using the methodologies described above, or if, in the “good faith” opinion of the Manager, the market value or price obtained does not constitute a “readily available market quotation,” or a significant event has occurred that would materially affect the value of the security the security is fair valued
| | |
| 46 | | OPPENHEIMER FLEXIBLE STRATEGIES FUND |
2. Securities Valuation (Continued)
either (i) by a standardized fair valuation methodology applicable to the security type or the significant event as previously approved by the Valuation Committee and the Fund’s Board or (ii) as determined in good faith by the Manager’s Valuation Committee. The Valuation Committee considers all relevant facts that are reasonably available, through either public information or information available to the Manager, when determining the fair value of a security. Fair value determinations by the Manager are subject to review, approval and ratification by the Fund’s Board at its next regularly scheduled meeting covering the calendar quarter in which the fair valuation was determined. Those fair valuation standardized methodologies include, but are not limited to, valuing securities at the last sale price or initially at cost and subsequently adjusting the value based on: changes in company specific fundamentals, changes in an appropriate securities index, or changes in the value of similar securities which may be further adjusted for any discounts related to security-specific resale restrictions. When possible, such methodologies use observable market inputs such as unadjusted quoted prices of similar securities, observable interest rates, currency rates and yield curves. The methodologies used for valuing securities are not necessarily an indication of the risks associated with investing in those securities nor can it be assured that the Fund can obtain the fair value assigned to a security if it were to sell the security.
To assess the continuing appropriateness of security valuations, the Manager, or its third party service provider who is subject to oversight by the Manager, regularly compares prior day prices, prices on comparable securities, and sale prices to the current day prices and challenges those prices exceeding certain tolerance levels with the third party pricing service or broker source. For those securities valued by fair valuations, whether through a standardized fair valuation methodology or a fair valuation determination, the Valuation Committee reviews and affirms the reasonableness of the valuations based on such methodologies and fair valuation determinations on a regular basis after considering all relevant information that is reasonably available.
Classifications
Each investment asset or liability of the Fund is assigned a level at measurement date based on the significance and source of the inputs to its valuation. Various data inputs are used in determining the value of each of the Fund’s investments as of the reporting period end. These data inputs are categorized in the following hierarchy under applicable financial accounting standards:
1) Level 1-unadjusted quoted prices in active markets for identical assets or liabilities (including securities actively traded on a securities exchange)
2) Level 2-inputs other than unadjusted quoted prices that are observable for the asset or liability (such as unadjusted quoted prices for similar assets and market corroborated inputs such as interest rates, prepayment speeds, credit risks, etc.)
3) Level 3-significant unobservable inputs (including the Manager’s own judgments about assumptions that market participants would use in pricing the asset or liability).
The inputs used for valuing securities are not necessarily an indication of the risks associated with investing in those securities.
| | |
| 47 | | OPPENHEIMER FLEXIBLE STRATEGIES FUND |
NOTES TO CONSOLIDATED FINANCIAL STATEMENTS Continued
2. Securities Valuation (Continued)
The table below categorizes amounts that are included in the Fund’s Consolidated Statement of Assets and Liabilities as of October 31, 2014 based on valuation input level:
| | | | | | | | | | | | | | | | |
| | | Level 1—
Unadjusted
Quoted Prices | | | Level 2— Other Significant
Observable Inputs | | | Level 3—
Significant
Unobservable
Inputs | | | Value | |
Assets Table | | | | | | | | | | | | | | | | |
Investments, at Value: | | | | | | | | | | | | | | | | |
Common Stocks | | | | | | | | | | | | | | | | |
Consumer Discretionary | | $ | 57,250,119 | | | $ | — | | | $ | — | | | $ | 57,250,119 | |
Consumer Staples | | | 16,464,763 | | | | — | | | | — | | | | 16,464,763 | |
Energy | | | 55,709,310 | | | | — | | | | — | | | | 55,709,310 | |
Financials | | | 55,985,169 | | | | — | | | | — | | | | 55,985,169 | |
Health Care | | | 56,694,641 | | | | 9,599,084 | | | | — | | | | 66,293,725 | |
Industrials | | | 52,055,783 | | | | — | | | | — | | | | 52,055,783 | |
Information Technology | | | 41,513,797 | | | | 6,148,643 | | | | — | | | | 47,662,440 | |
Materials | | | 24,404,458 | | | | — | | | | — | | | | 24,404,458 | |
Telecommunication Services | | | 8,982,940 | | | | — | | | | — | | | | 8,982,940 | |
Utilities | | | 28,251,005 | | | | — | | | | — | | | | 28,251,005 | |
Preferred Stocks | | | — | | | | 20,836,670 | | | | — | | | | 20,836,670 | |
Asset-Backed Securities | | | — | | | | 61,806,056 | | | | 24,450,850 | | | | 86,256,906 | |
Mortgage-Backed Obligations | | | — | | | | 47,560,843 | | | | — | | | | 47,560,843 | |
Non-Convertible Corporate Bonds and Notes | | | — | | | | 26,527,968 | | | | — | | | | 26,527,968 | |
Convertible Corporate Bond and Note | | | — | | | | 3,380,625 | | | | — | | | | 3,380,625 | |
Corporate Loans | | | — | | | | 11,785,195 | | | | — | | | | 11,785,195 | |
Structured Security | | | — | | | | — | | | | 895,986 | | | | 895,986 | |
Municipal Bonds and Notes | | | — | | | | 2,253,324 | | | | — | | | | 2,253,324 | |
Exchange-Traded Options Purchased | | | 1,055,688 | | | | — | | | | — | | | | 1,055,688 | |
Over-the-Counter Interest Rate | | | | | | | | | | | | | | | | |
Swaptions Purchased | | | — | | | | 2,684,235 | | | | — | | | | 2,684,235 | |
Investment Companies | | | 56,181,059 | | | | 120,534,049 | | | | — | | | | 176,715,108 | |
| | | | |
Total Investments, at Value | | | 454,548,732 | | | | 313,116,692 | | | | 25,346,836 | | | | 793,012,260 | |
Other Financial Instruments: | | | | | | | | | | | | | | | | |
Swaps, at value | | $ | — | | | $ | 786,651 | | | $ | — | | | $ | 786,651 | |
Centrally cleared swaps, at value | | | — | | | | 504,325 | | | | — | | | | 504,325 | |
Foreign currency exchange contracts | | | — | | | | 1,126,987 | | | | — | | | | 1,126,987 | |
| | | | |
Total Assets | | $ | 454,548,732 | | | $ | 315,534,655 | | | $ | 25,346,836 | | | $ | 795,430,223 | |
| | | | |
| | | | |
Liabilities Table | | | | | | | | | | | | | | | | |
Other Financial Instruments: | | | | | | | | | | | | | | | | |
Common Stock Securities Sold Short | | $ | (174,707,113 | ) | | $ | — | | | $ | — | | | $ | (174,707,113 | ) |
Swaps, at value | | | — | | | | (918,399 | ) | | | — | | | | (918,399 | ) |
Centrally cleared swaps, at value | | | — | | | | (1,959,721 | ) | | | — | | | | (1,959,721 | ) |
Futures contracts | | | (2,287,033 | ) | | | — | | | | — | | | | (2,287,033 | ) |
Foreign currency exchange contracts | | | — | | | | (282,345 | ) | | | — | | | | (282,345 | ) |
| | | | |
Total Liabilities | | $ | (176,994,146 | ) | | $ | (3,160,465 | ) | | $ | — | | | $ | (180,154,611 | ) |
| | | | |
Forward currency exchange contracts and futures contracts, if any, are reported at their unrealized appreciation/depreciation at measurement date, which represents the change in the contract’s value from trade date. All additional assets and liabilities included in the above table are reported at their market value at measurement date.
| | |
| 48 | | OPPENHEIMER FLEXIBLE STRATEGIES FUND |
2. Securities Valuation (Continued)
The following is a reconciliation of assets in which significant unobservable inputs (level 3) were used in determining fair value:
| | | | | | | | | | | | | | | | | | | | |
| | | Value as of
October 31,
2013 | | | Realized
Gain
(Loss) | | | Change in
unrealized
appreciation/
depreciation | | | Accretion/
(amortization)
of premium/
discounta | | | Value as of
October 31,
2014 | |
Assets Table | | | | | | | | | | | | | | | | | | | | |
Investments, at Value: | | | | | | | | | | | | | | | | | | | | |
Asset-Backed Securities | | $ | 23,012,297 | | | $ | 249,818 | | | $ | 669,619 | | | $ | 519,116 | | | $ | 24,450,850 | |
Structured Security | | | 2,576,591 | | | | — | | | | (1,680,605 | ) | | | — | | | | 895,986 | |
| | | | |
Total Assets | | $ | 25,588,888 | | | $ | 249,818 | | | $ | (1,010,986 | ) | | $ | 519,116 | | | $ | 25,346,836 | |
| | | | |
a. Included in net investment income.
The total change in unrealized appreciation/depreciation included in the Consolidated Statement of Operations attributable to Level 3 investments still held at October 31, 2014:
| | | | |
| | | Change in unrealized
appreciation/depreciation | |
Assets Table | | | | |
Investments, at Value: | | | | |
Asset-Backed Securities | | $ | 669,619 | |
Structured Security | | | (1,680,605 | ) |
| | | | |
Total | | $ | (1,010,986 | ) |
| | | | |
The following table summarizes the valuation techniques and significant unobservable inputs used in determining fair value measurements for those investments classified as Level 3 as of October 31, 2014:
| | | | | | | | | | | | |
| | | Value as of
October 31, 2014 | | | Valuation Technique | | Unobservable input | | Range of
Unobservable
Inputs | | Unobservable
Input Used |
Assets Table | | | | | | | | | | | | |
Investments, at Value: | | | | | | | | | | | | |
Asset-Backed Security | | $ | 24,450,850 | | | Pricing Service | | N/A | | N/A | | N/A (a) |
Structured Security | | | 895,986 | | | Discount to Capital Account Balance | | Discount rate | | N/A | | 84% (b) |
| | | | | | | | Capital Account Balance | | N/A | | 5,572,570 (b) |
| | | | | | | | | | | | |
Total | | $ | 25,346,836 | | | | | | | | | |
| | | | | | | | | | | | |
(a) Security classified as Level 3 whose unadjusted value was provided by a pricing service for which such inputs are unobservable. The Manager periodically reviews pricing vendor methodologies and inputs to confirm they are determined using unobservable inputs and have been appropriately classified. Such security’s fair valuation could change significantly based on changes in unobservable inputs used by the pricing service.
(b) The Fund fair values the structured security at a discount to the last reported capital account balance according to the most recent quarterly financial statements issued by the company to reflect uncertainty and illiquidity. A significant decrease (increase) to the discount rate, or a significant increase (decrease) to the capital account balance, will result in a significant increase (decrease) to the fair value of the investment.
| | |
| 49 | | OPPENHEIMER FLEXIBLE STRATEGIES FUND |
NOTES TO CONSOLIDATED FINANCIAL STATEMENTS Continued
3. Shares of Beneficial Interest
The Fund has authorized an unlimited number of $0.01 par value shares of beneficial interest of each class. Transactions in shares of beneficial interest were as follows:
| | | | | | | | | | | | | | | | |
| | | Year Ended October 31, 2014 | | | Year Ended October 31, 2013 | |
| | | Shares | | | Amount | | | Shares | | | Amount | |
Class A | | | | | | | | | | | | | | | | |
Sold | | | 1,674,826 | | | $ | 43,580,738 | | | | 1,628,620 | | | $ | 39,070,980 | |
Dividends and/or distributions reinvested | | | — | | | | — | | | | — | | | | — | |
Redeemed | | | (4,841,916 | ) | | | (125,616,349 | ) | | | (7,478,759 | ) | | | (179,379,041 | ) |
| | | | |
Net decrease | | | (3,167,090 | ) | | $ | (82,035,611 | ) | | | (5,850,139 | ) | | $ | (140,308,061 | ) |
| | | | |
| | | | | | | | | | | | | | | | | |
Class B | | | | | | | | | | | | | | | | |
Sold | | | 15,376 | | | $ | 360,881 | | | | 30,166 | | | $ | 657,593 | |
Dividends and/or distributions reinvested | | | — | | | | — | | | | — | | | | — | |
Redeemed | | | (510,042 | ) | | | (11,940,149 | ) | | | (676,245 | ) | | | (14,688,878 | ) |
| | | | |
Net decrease | | | (494,666 | ) | | $ | (11,579,268 | ) | | | (646,079 | ) | | $ | (14,031,285 | ) |
| | | | |
| | | | | | | | | | | | | | | | | |
Class C | | | | | | | | | | | | | | | | |
Sold | | | 510,313 | | | $ | 12,012,240 | | | | 458,878 | | | $ | 10,004,823 | |
Dividends and/or distributions reinvested | | | — | | | | — | | | | — | | | | — | |
Redeemed | | | (998,059 | ) | | | (23,368,654 | ) | | | (1,735,128 | ) | | | (37,698,886 | ) |
| | | | |
Net decrease | | | (487,746 | ) | | $ | (11,356,414 | ) | | | (1,276,250 | ) | | $ | (27,694,063 | ) |
| | | | |
| | | | | | | | | | | | | | | | | |
Class I | | | | | | | | | | | | | | | | |
Sold | | | — | | | $ | — | | | | 411 | | | $ | 10,000 | |
Dividends and/or distributions reinvested | | | — | | | | — | | | | — | | | | — | |
Redeemed | | | — | | | | — | | | | — | | | | — | |
| | | | |
Net increase | | | — | | | $ | — | | | | 411 | | | $ | 10,000 | |
| | | | |
| | | | | | | | | | | | | | | | | |
Class R2 | | | | | | | | | | | | | | | | |
Sold | | | 90,119 | | | $ | 2,253,271 | | | | 127,722 | | | $ | 2,948,706 | |
Dividends and/or distributions reinvested | | | — | | | | — | | | | — | | | | — | |
Redeemed | | | (279,979 | ) | | | (7,011,669 | ) | | | (467,256 | ) | | | (10,790,956 | ) |
| | | | |
Net decrease | | | (189,860 | ) | | $ | (4,758,398 | ) | | | (339,534 | ) | | $ | (7,842,250 | ) |
| | | | |
| | | | | | | | | | | | | | | | | |
Class Y | | | | | | | | | | | | | | | | |
Sold | | | 527,470 | | | $ | 14,233,847 | | | | 196,189 | | | $ | 4,864,663 | |
Dividends and/or distributions reinvested | | | — | | | | — | | | | — | | | | — | |
Redeemed | | | (266,639 | ) | | | (7,127,109 | ) | | | (428,730 | ) | | | (10,461,422 | ) |
| | | | |
Net increase (decrease) | | | 260,831 | | | $ | 7,106,738 | | | | (232,541 | ) | | $ | (5,596,759 | ) |
| | | | |
| | |
| 50 | | OPPENHEIMER FLEXIBLE STRATEGIES FUND |
3. Shares of Beneficial Interest (Continued)
1. For the year ended October 21, 2013 for Class A, Class B, Class C, Class R and Class Y shares, and for the period from February 28, 2013 (inception of offering) to October 31, 2013 for Class I shares.
2. Effective July 1, 2014, Class N shares were renamed Class R.
4. Purchases and Sales of Securities
The aggregate cost of purchases and proceeds from sales of securities, other than short-term obligations and investments in IMMF, for the year ended October 31, 2014 were as follows:
| | | | | | | | | | |
| | | Purchases | | | | | Sales | |
Investment securities | | $ | 272,830,410 | | | | | $ | 383,497,281 | |
5. Fees and Other Transactions with Affiliates
Management Fees. Under the investment advisory agreement, the Fund pays the Manager a management fee based on the daily net assets of the Fund at an annual rate as shown in the following table:
| | | | |
| Fee Schedule | | | |
Up to $1.0 billion | | | 0.85 | % |
Next $500 million | | | 0.80 | |
Next $500 million | | | 0.75 | |
Next $500 million | | | 0.70 | |
Next $500 million | | | 0.65 | |
Next $500 million | | | 0.60 | |
Next $500 million | | | 0.55 | |
Over $4.0 billion | | | 0.50 | |
The Fund’s management fee for the fiscal year end October 31, 2014 was 0.88% of average annual net assets before any applicable waivers.
Sub-Adviser Fees. The Manager has retained the Sub-Adviser to provide the day-to-day portfolio management of the Fund. Under the Sub-Advisory Agreement, the Manager pays the Sub-Adviser an annual fee in monthly installments, equal to a percentage of the investment management fee collected by the Manager from the Fund, which shall be calculated after any investment management fee waivers. The fee paid to the Sub-Adviser is paid by the Manager, not by the Fund.
Transfer Agent Fees. OFI Global (the “Transfer Agent”) serves as the transfer and shareholder servicing agent for the Fund. The Fund pays the Transfer Agent a fee based on annual net assets. Fees incurred and average net assets for each class with respect to these services are detailed in the Consolidated Statement of Operations and Financial Highlights, respectively.
Sub-Transfer Agent Fees. The Transfer Agent has retained Shareholder Services, Inc., a wholly-owned subsidiary of OFI (the “Sub-Transfer Agent”), to provide the day-to-day transfer agent and shareholder servicing of the Fund. Under the Sub-Transfer Agency Agreement, the Transfer Agent pays the Sub-Transfer Agent an annual fee in monthly installments, equal to a percentage of the transfer agent fee collected by the Transfer Agent from the Fund, which
| | |
| 51 | | OPPENHEIMER FLEXIBLE STRATEGIES FUND |
NOTES TO CONSOLIDATED FINANCIAL STATEMENTS Continued
5. Fees and Other Transactions with Affiliates (Continued)
shall be calculated after any applicable fee waivers. The fee paid to the Sub-Transfer Agent is paid by the Transfer Agent, not by the Fund.
Trustees’ Compensation. The Fund has adopted an unfunded retirement plan (the “Plan”) for the Fund’s Independent Trustees. Benefits are based on years of service and fees paid to each Trustee during their period of service. The Plan was frozen with respect to adding new participants effective December 31, 2006 (the “Freeze Date”) and existing Plan Participants as of the Freeze Date will continue to receive accrued benefits under the Plan. Active Independent Trustees as of the Freeze Date have each elected a distribution method with respect to their benefits under the Plan. During the year ended October 31, 2014, the Fund’s projected benefit obligations, payments to retired Trustees and accumulated liability were as follows:
| | | | |
Projected Benefit Obligations Increased | | $ | 5,994 | |
Payments Made to Retired Trustees | | | 28,007 | |
Accumulated Liability as of October 31, 2014 | | | 169,529 | |
The Fund’s Board of Trustees (“Board”) has adopted a compensation deferral plan for Independent Trustees that enables Trustees to elect to defer receipt of all or a portion of the annual compensation they are entitled to receive from the Fund. For purposes of determining the amount owed to the Trustee under the plan, deferred amounts are treated as though equal dollar amounts had been invested in shares of the Fund or in other Oppenheimer funds selected by the Trustee. The Fund purchases shares of the funds selected for deferral by the Trustee in amounts equal to his or her deemed investment, resulting in a Fund asset equal to the deferred compensation liability. Such assets are included as a component of “Other” within the asset section of the Consolidated Statement of Assets and Liabilities. Deferral of Trustees’ fees under the plan will not affect the net assets of the Fund and will not materially affect the Fund’s assets, liabilities or net investment income per share. Amounts will be deferred until distributed in accordance with the compensation deferral plan.
Distribution and Service Plan (12b-1) Fees. Under its General Distributor’s Agreement with the Fund, OppenheimerFunds Distributor, Inc. (the “Distributor”) acts as the Fund’s principal underwriter in the continuous public offering of the Fund’s classes of shares.
Distribution and Service Plan for Class A Shares. The Fund has adopted a Distribution and Service Plan (the “Plan”) for Class A shares pursuant to Rule 12b-1 under the 1940 Act. Under the Plan, the Fund pays a service fee to the Distributor at an annual rate of 0.25% of the daily net assets of Class A shares. The Distributor currently uses all of those fees to pay dealers, brokers, banks and other financial institutions periodically for providing personal services and maintenance of accounts of their customers that hold Class A shares. Under the Plan, the Fund may also pay an asset-based sales charge to the Distributor. However, the Fund’s Board has currently set the rate at zero. Fees incurred by the Fund under the Plan are detailed in the Consolidated Statement of Operations.
| | |
| 52 | | OPPENHEIMER FLEXIBLE STRATEGIES FUND |
5. Fees and Other Transactions with Affiliates (Continued)
Distribution and Service Plans for Class B, Class C and Class R Shares. The Fund has adopted Distribution and Service Plans (the “Plans”) for Class B, Class C and Class R shares pursuant to Rule 12b-1 under the 1940 Act to compensate the Distributor for distributing those share classes, maintaining accounts and providing shareholder services. Under the Plans, the Fund pays the Distributor an annual asset-based sales charge of 0.75% on Class B and Class C shares daily net assets and 0.25% on Class R shares daily net assets. The Fund also pays a service fee under the Plans at an annual rate of 0.25% of daily net assets. The Plans continue in effect from year to year only if the Fund’s Board of Trustees vote annually to approve its continuance at an in person meeting called for that purpose. Fees incurred by the Fund under the Plans are detailed in the Consolidated Statement of Operations.
Sales Charges. Front-end sales charges and CDSC do not represent expenses of the Fund. They are deducted from the proceeds of sales of Fund shares prior to investment or from redemption proceeds prior to remittance, as applicable. The sales charges retained by the Distributor from the sale of shares and the CDSC retained by the Distributor on the redemption of shares is shown in the following table for the period indicated.
| | | | | | | | | | | | | | | | | | | | |
| Year Ended | | Class A Front-End
Sales Charges
Retained by
Distributor | | | Class A
Contingent
Deferred Sales
Charges
Retained by
Distributor | | | Class B
Contingent
Deferred Sales
Charges
Retained by
Distributor | | | Class C
Contingent
Deferred Sales
Charges
Retained by
Distributor | | | Class R
Contingent
Deferred Sales
Charges
Retained by
Distributor | |
October 31, 2014 | | | $125,897 | | | | $877 | | | | $45,677 | | | | $3,408 | | | | $502 | |
Waivers and Reimbursements of Expenses. The Manager has contractually agreed to waive the management fee it receives from the Fund in an amount equal to the management fee it receives from the Subsidiary. This undertaking will continue in effect for so long as the Fund invests in the Subsidiary and may not be terminated unless approved by the Fund’s Board of Trustees. During the year ended October 31, 2014, the Manager waived $187,832.
The Manager will waive fees and/or reimburse Fund expenses in an amount equal to the indirect management fees incurred through the Fund’s investments in underlying funds managed by the Manager or its affiliates. During the year ended October 31, 2014, the Manager waived fees and/or reimbursed the Fund $411,627 for management fees.
The Manager, upon discussion with the Board, has voluntarily agreed to reduce its management fee by 0.10% of the Fund’s daily net assets until the Fund’s trailing one-year total performance is out of the 5th quintile of the Fund’s Morningstar peer group as measured at the end of each calendar quarter. After that, the Manager will voluntarily reduce its management fee by 0.05% of the Fund’s daily net assets until the Fund’s trailing one-year performance is out of the 4th quintile of the Fund’s Morningstar peer group as measured at the end of each calendar quarter. During the year ended October 31, 2014, the Manager reimbursed the Fund $561,129.
The Transfer Agent has contractually agreed to limit transfer and shareholder servicing agent fees for Classes B, C, R and Y shares to 0.35% of average annual net assets per class
| | |
| 53 | | OPPENHEIMER FLEXIBLE STRATEGIES FUND |
NOTES TO CONSOLIDATED FINANCIAL STATEMENTS Continued
5. Fees and Other Transactions with Affiliates (Continued)
and for Class A shares to 0.30% of average annual net assets of the class. The limit was removed on February 28, 2014.
During the year ended October 31, 2014, the Transfer Agent waived transfer and shareholder servicing agent fees as follows:
| | | | |
Class A | | | $13,549 | |
Class B | | | 18,912 | |
Class C | | | 845 | |
Class R | | | 1,379 | |
Class Y | | | 81,276 | |
These undertakings may be modified or terminated as set forth according to the terms in the prospectus.
6. Risk Exposures and the Use of Derivative Instruments
The Fund’s investment objective not only permits the Fund to purchase investment securities, it also allows the Fund to enter into various types of derivatives contracts, including, but not limited to, futures contracts, forward currency exchange contracts, credit default swaps, interest rate swaps, total return swaps, variance swaps and purchased and written options. In doing so, the Fund will employ strategies in differing combinations to permit it to increase, decrease, or change the level or types of exposure to market risk factors. These instruments may allow the Fund to pursue its objectives more quickly and efficiently than if it were to make direct purchases or sales of securities capable of effecting a similar response to market factors. Such contracts may be entered into through a bilateral over-the-counter (“OTC”) transaction, or through a securities or futures exchange and cleared through a clearinghouse.
Market Risk Factors. In accordance with its investment objectives, the Fund may use derivatives to increase or decrease its exposure to one or more of the following market risk factors:
Commodity Risk. Commodity risk relates to the change in value of commodities or commodity indexes as they relate to increases or decreases in the commodities market. Commodities are physical assets that have tangible properties. Examples of these types of assets are crude oil, heating oil, metals, livestock, and agricultural products.
Credit Risk. Credit risk relates to the ability of the issuer to meet interest and principal payments, or both, as they come due. In general, lower-grade, higher-yield bonds are subject to credit risk to a greater extent than lower-yield, higher-quality bonds.
Equity Risk. Equity risk relates to the change in value of equity securities as they relate to increases or decreases in the general market.
Foreign Exchange Rate Risk. Foreign exchange rate risk relates to the change in the U.S. dollar value of a security held that is denominated in a foreign currency. The U.S. dollar value of a foreign currency denominated security will decrease as the dollar appreciates against the currency, while the U.S. dollar value will increase as the dollar depreciates against the currency.
| | |
| 54 | | OPPENHEIMER FLEXIBLE STRATEGIES FUND |
| 6. | Risk Exposures and the Use of Derivative Instruments (Continued) |
Interest Rate Risk. Interest rate risk refers to the fluctuations in value of fixed-income securities resulting from the inverse relationship between price and yield. For example, an increase in general interest rates will tend to reduce the market value of already issued fixed-income investments, and a decline in general interest rates will tend to increase their value. In addition, debt securities with longer maturities, which tend to have higher yields, are subject to potentially greater fluctuations in value from changes in interest rates than obligations with shorter maturities.
Volatility Risk. Volatility risk refers to the magnitude of the movement, but not the direction of the movement, in a financial instrument’s price over a defined time period. Large increases or decreases in a financial instrument’s price over a relative time period typically indicate greater volatility risk, while small increases or decreases in its price typically indicate lower volatility risk.
Derivatives may have little or no initial cash investment relative to their market value exposure and therefore can produce significant gains or losses in excess of their cost due to unanticipated changes in the market risk factors and the overall market. This use of embedded leverage allows the Fund to increase its market value exposure relative to its net assets and can substantially increase the volatility of the Fund’s performance. In instances where the Fund is using derivatives to decrease, or hedge, exposures to market risk factors for securities held by the Fund, there are also risks that those derivatives may not perform as expected resulting in losses for the combined or hedged positions. Some derivatives have the potential for unlimited loss, regardless of the size of the Fund’s initial investment.
Additional associated risks from investing in derivatives also exist and potentially could have significant effects on the valuation of the derivative and the Fund. Typically, the associated risks are not the risks that the Fund is attempting to increase or decrease exposure to, per its investment objectives, but are the additional risks from investing in derivatives. Examples of these associated risks are liquidity risk, which is the risk that the Fund will not be able to sell the derivative in the open market in a timely manner, and counterparty credit risk, which is the risk that the counterparty will not fulfill its obligation to the Fund.
The Fund’s actual exposures to these market risk factors and associated risks during the period are discussed in further detail, by derivative type, below.
Forward Currency Exchange Contracts
The Fund may enter into forward currency exchange contracts (“forward contracts”) for the purchase or sale of a foreign currency at a negotiated rate at a future date. Such contracts are traded in the OTC inter-bank currency dealer market.
Forward contracts are reported on a schedule following the Consolidated Statement of Investments. The unrealized appreciation (depreciation) is reported in the Consolidated Statement of Assets and Liabilities as a receivable (or payable) and in the Consolidated Statement of Operations within the change in unrealized appreciation (depreciation). At contract close, the difference between the original cost of the contract and the value at the close date is recorded as a realized gain (loss) in the Consolidated Statement of Operations.
| | |
| 55 | | OPPENHEIMER FLEXIBLE STRATEGIES FUND |
NOTES TO CONSOLIDATED FINANCIAL STATEMENTS Continued
6. Risk Exposures and the Use of Derivative Instruments (Continued)
The Fund has entered into forward contracts with the obligation to purchase specified foreign currencies in the future at a currently negotiated forward rate in order to take a positive investment perspective on the related currency. These forward contracts seek to increase exposure to foreign exchange rate risk.
The Fund has entered into forward contracts with the obligation to purchase specified foreign currencies in the future at a currently negotiated forward rate in order to decrease exposure to foreign exchange rate risk associated with foreign currency denominated securities held by the Fund.
The Fund has entered into forward contracts with the obligation to sell specified foreign currencies in the future at a currently negotiated forward rate in order to take a negative investment perspective on the related currency. These forward contracts seek to increase exposure to foreign exchange rate risk.
The Fund has entered into forward contracts with the obligation to sell specified foreign currencies in the future at a currently negotiated forward rate in order to decrease exposure to foreign exchange rate risk associated with foreign currency denominated securities held by the Fund.
During the year ended October 31, 2014, the Fund had daily average contract amounts on forward contracts to buy and sell of $28,051,156 and $103,641,899, respectively.
Additional associated risk to the Fund includes counterparty credit risk. Counterparty credit risk arises from the possibility that the counterparty to a forward contract will default and fail to perform its obligations to the Fund.
Futures Contracts
A futures contract is a commitment to buy or sell a specific amount of a commodity, financial instrument or currency at a negotiated price on a stipulated future date. The Fund may buy and sell futures contracts and may also buy or write put or call options on these futures contracts. Futures contracts and options thereon are generally entered into on a regulated futures exchange and cleared through a clearinghouse associated with the exchange.
Upon entering into a futures contract, the Fund is required to deposit either cash or securities (initial margin) in an amount equal to a certain percentage of the contract value in an account registered in the futures commission merchant’s name. Subsequent payments (variation margin) are paid to or from the futures commission merchant each day equal to the daily changes in the contract value. Such payments are recorded as unrealized gains and losses. Should the Fund fail to make requested variation margin payments, the futures commission merchant can gain access to the initial margin to satisfy the Fund’s payment obligations.
Futures contracts are reported on a schedule following the Consolidated Statement of Investments. Securities held by a futures commission merchant to cover initial margin requirements on open futures contracts are noted in the Consolidated Statement of Investments. Cash held by a futures commission merchant to cover initial margin requirements on open futures contracts and the receivable and/or payable for the daily mark to market for the variation margin are noted in the Consolidated Statement of Assets and Liabilities. The net change in unrealized appreciation and depreciation is reported in the
| | |
| 56 | | OPPENHEIMER FLEXIBLE STRATEGIES FUND |
6. Risk Exposures and the Use of Derivative Instruments (Continued)
Consolidated Statement of Operations. Realized gains (losses) are reported in the Consolidated Statement of Operations at the closing or expiration of futures contracts.
The Fund has purchased futures contracts on various bonds and notes to increase exposure to interest rate risk.
The Fund has sold futures contracts on various bonds and notes to decrease exposure to interest rate risk.
The Fund has sold futures contracts on various equity indexes to decrease exposure to equity risk.
The Fund has purchased futures contracts, which have values that are linked to the price movement of the related commodities, in order to increase exposure to commodity risk.
During the year ended October 31, 2014, the Fund had an ending monthly average market value of $274,323 and $34,928,231 on futures contracts purchased and sold, respectively.
Additional associated risks of entering into futures contracts (and related options) include the possibility that there may be an illiquid market where the Fund is unable to liquidate the contract or enter into an offsetting position and, if used for hedging purposes, the risk that the price of the contract will correlate imperfectly with the prices of the Fund’s securities.
Option Activity
The Fund may buy and sell put and call options, or write put and call options. When an option is written, the Fund receives a premium and becomes obligated to sell or purchase the underlying security, currency or other underlying financial instrument at a fixed price, upon exercise of the option.
Options can be traded through an exchange or through a privately negotiated arrangement with a dealer in an OTC transaction. Options traded through an exchange are generally cleared through a clearinghouse (such as The Options Clearing Corporation). The difference between the premium received or paid, and market value of the option, is recorded as unrealized appreciation or depreciation. The net change in unrealized appreciation or depreciation is reported in the Consolidated Statement of Operations. When an option is exercised, the cost of the security purchased or the proceeds of the security sale are adjusted by the amount of premium received or paid. Upon the expiration or closing of the option transaction, a gain or loss is reported in the Consolidated Statement of Operations.
The Fund has purchased put options on currencies to decrease exposure to foreign exchange rate risk. A purchased put option becomes more valuable as the price of the underlying financial instrument depreciates relative to the strike price.
The Fund has purchased call options on treasury and/or euro futures to increase exposure to interest rate risk. A purchased call option becomes more valuable as the price of the underlying financial instrument appreciates relative to the strike price.
The Fund has purchased call options on individual equity securities and/or equity indexes to increase exposure to equity risk. A purchased call option becomes more valuable as the price of the underlying financial instrument appreciates relative to the strike price.
During the year ended October 31, 2014, the Fund had an ending monthly average market value of $1,307,392 and $6,212 on purchased call options and purchased put options, respectively.
| | |
| 57 | | OPPENHEIMER FLEXIBLE STRATEGIES FUND |
NOTES TO CONSOLIDATED FINANCIAL STATEMENTS Continued
6. Risk Exposures and the Use of Derivative Instruments (Continued)
Options written, if any, are reported in a schedule following the Consolidated Statement of Investments and as a liability in the Consolidated Statement of Assets and Liabilities. Securities held in collateral accounts to cover potential obligations with respect to outstanding written options are noted in the Consolidated Statement of Investments.
The risk in writing a call option is that the market price of the security increases and if the option is exercised, the Fund must either purchase the security at a higher price for delivery or, if the Fund owns the underlying security, give up the opportunity for profit. The risk in writing a put option is that the Fund may incur a loss if the market price of the security decreases and the option is exercised. The risk in buying an option is that the Fund pays a premium whether or not the option is exercised. The Fund also has the additional risk that there may be an illiquid market where the Fund is unable to close the contract.
Additional associated risks to the Fund include counterparty credit risk and liquidity risk. As of October 31, 2014, the Fund had no outstanding written options.
Swap Contracts
The Fund may enter into swap contract agreements with a counterparty to exchange a series of cash flows based on either specified reference rates, the price or volatility of asset or non-asset references, or the occurrence of a credit event, over a specified period. Swaps can be executed in a bi-lateral privately negotiated arrangement with a dealer in an OTC transaction (“OTC swaps”) or executed on a regulated market. Certain swaps, regardless of the venue of their execution, are required to be cleared through a clearinghouse (“centrally cleared swaps”). Swap contracts may include interest rate, equity, debt, index, total return, credit default, currency, and volatility swaps.
Swap contracts are reported on a schedule following the Consolidated Statement of Investments. The values of centrally cleared swap and OTC swap contracts are aggregated by positive and negative values and disclosed separately on the Consolidated Statement of Assets and Liabilities. The unrealized appreciation (depreciation) related to the change in the valuation of the notional amount of the swap is combined with the accrued interest due to (owed by) the Fund, if any, at termination or settlement. The net change in this amount during the period is included on the Consolidated Statement of Operations. The Fund also records any periodic payments received from (paid to) the counterparty, including at termination, under such contracts as realized gain (loss) on the Consolidated Statement of Operations.
Swap contract agreements are exposed to the market risk factor of the specific underlying reference rate or asset. Swap contracts are typically more attractively priced compared to similar investments in related cash securities because they isolate the risk to one market risk factor and eliminate the other market risk factors. Investments in cash securities (for instance bonds) have exposure to multiple risk factors (credit and interest rate risk). Because swaps have embedded leverage, they can expose the Fund to substantial risk in the isolated market risk factor.
Credit Default Swap Contracts. A credit default swap is a contract that enables an investor to buy or sell protection against a defined-issuer credit event, such as the issuer’s failure to make timely payments of interest or principal on a debt security, bankruptcy or
| | |
| 58 | | OPPENHEIMER FLEXIBLE STRATEGIES FUND |
6. Risk Exposures and the Use of Derivative Instruments (Continued)
restructuring. The Fund may enter into credit default swaps either by buying or selling protection on a corporate issuer, sovereign issuer, or a basket or index of issuers (the “reference asset”).
The buyer of protection pays a periodic fee to the seller of protection based on the notional amount of the swap contract. The seller of protection agrees to compensate the buyer of protection for future potential losses as a result of a credit event on the reference asset. The contract effectively transfers the credit event risk of the reference asset from the buyer of protection to the seller of protection.
The ongoing value of the contract will fluctuate throughout the term of the contract based primarily on the credit risk of the reference asset. If the credit quality of the reference asset improves relative to the credit quality at contract initiation, the buyer of protection may have an unrealized loss greater than the anticipated periodic fee owed. This unrealized loss would be the result of current credit protection being cheaper than the cost of credit protection at contract initiation. If the buyer elects to terminate the contract prior to its maturity, and there has been no credit event, this unrealized loss will become realized. If the contract is held to maturity, and there has been no credit event, the realized loss will be equal to the periodic fee paid over the life of the contract.
If there is a credit event, the buyer of protection can exercise its rights under the contract and receive a payment from the seller of protection equal to the notional amount of the swap less the market value of specified debt securities issued by the reference asset. Upon exercise of the contract the difference between such value and the notional amount is recorded as realized gain (loss) and is included on the Consolidated Statement of Operations.
The Fund has sold credit protection through credit default swaps to increase exposure to the credit risk of individual issuers and/or indexes of issuers that are either unavailable or considered to be less attractive in the bond market.
The Fund has purchased credit protection through credit default swaps to take an outright negative investment perspective on the credit risk of an individual issuer or basket or index of issuers as opposed to decreasing its credit risk exposure related to debt securities of such issuer(s) held by the Fund.
For the year ended October 31, 2014, the Fund had ending monthly average notional amounts of $154,169,267 and $25,000,000 on credit default swaps to buy protection and credit default swaps to sell protection, respectively.
Additional associated risks to the Fund include counterparty credit risk and liquidity risk.
Total Return Swap Contracts. A total return swap is an agreement between counterparties to exchange periodic payments based on the value of asset or non-asset references. One cash flow is typically based on a non-asset reference (such as an interest rate) and the other on the total return of a reference asset (such as a security or a basket of securities or securities index). The total return of the reference asset typically includes appreciation or depreciation on the reference asset, plus any interest or dividend payments.
Total return swap contracts are exposed to the market risk factor of the specific underlying financial instrument or index. Total return swaps are less standard in structure
| | |
| 59 | | OPPENHEIMER FLEXIBLE STRATEGIES FUND |
NOTES TO CONSOLIDATED FINANCIAL STATEMENTS Continued
6. Risk Exposures and the Use of Derivative Instruments (Continued)
than other types of swaps and can isolate and/or include multiple types of market risk factors including equity risk, credit risk, and interest rate risk.
The Fund has entered into total return swaps on various equity securities or indexes to increase exposure to equity risk. These equity risk related total return swaps require the Fund to pay a floating reference interest rate, and an amount equal to the negative price movement of securities or an index (expressed as a percentage) multiplied by the notional amount of the contract. The Fund will receive payments equal to the positive price movement of the same securities or index (expressed as a percentage) multiplied by the notional amount of the contract and, in some cases, dividends paid on the securities.
The Fund has entered into total return swaps on various equity securities or indexes to decrease exposure to equity risk. These equity risk related total return swaps require the Fund to pay an amount equal to the positive price movement of securities or an index (expressed as a percentage) multiplied by the notional amount of the contract and, in some cases, dividends paid on the securities. The Fund will receive payments of a floating reference interest rate and an amount equal to the negative price movement of the same securities or index (expressed as a percentage) multiplied by the notional amount of the contract.
For the year ended October 31, 2014, the Fund had ending monthly average notional amounts of $6,384,132 and $1,597,641 on total return swaps which are long the reference asset and total return swaps which are short the reference asset, respectively.
Additional associated risks to the Fund include counterparty credit risk and liquidity risk.
Swaption Transactions
The Fund may enter into a swaption contract which grants the purchaser the right, but not the obligation, to enter into a swap transaction at preset terms detailed in the underlying agreement within a specified period of time. The purchaser pays a premium to the swaption writer who bears the risk of unfavorable changes in the preset terms on the underlying swap.
Purchased swaptions are reported as a component of investments in the Consolidated Statement of Investments and the Consolidated Statement of Assets and Liabilities. Written swaptions are reported on a schedule following the Consolidated Statement of Investments and their value is reported as a separate asset or liability line item in the Consolidated Statement of Assets and Liabilities. The net change in unrealized appreciation or depreciation on written swaptions is separately reported in the Consolidated Statement of Operations. When a swaption is exercised, the cost of the swap is adjusted by the amount of premium paid or received. Upon the expiration or closing of an unexercised swaption contract, a gain or loss is reported in the Consolidated Statement of Operations for the amount of the premium paid or received.
The Fund generally will incur a greater risk when it writes a swaption than when it purchases a swaption. When the Fund writes a swaption it will become obligated, upon exercise of the swaption, according to the terms of the underlying agreement. Swaption contracts written by the Fund do not give rise to counterparty credit risk prior to exercise as they obligate the Fund, not its counterparty, to perform. When the Fund purchases a swaption it only risks losing the amount of the premium it paid if the swaption expires unexercised.
| | |
| 60 | | OPPENHEIMER FLEXIBLE STRATEGIES FUND |
6. Risk Exposures and the Use of Derivative Instruments (Continued)
However, when the Fund exercises a purchased swaption there is a risk that the counterparty will fail to perform or otherwise default on its obligations under the swaption contract.
The Fund has purchased swaptions which gives it the option to enter into an interest rate swap in which it pays a fixed interest rate and receives a floating interest rate in order to decrease exposure to interest rate risk. A purchased swaption of this type becomes more valuable as the reference interest rate increases relative to the preset interest rate.
During the year ended October 31, 2014, the Fund had an ending monthly average market value of $5,912,888 on purchased swaptions.
Counterparty Credit Risk. Derivative positions are subject to the risk that the counterparty will not fulfill its obligation to the Fund. The Fund intends to enter into derivative transactions with counterparties that the Manager believes to be creditworthy at the time of the transaction.
The Fund’s risk of loss from counterparty credit risk on OTC derivatives is generally limited to the aggregate unrealized gain netted against any collateral held by the Fund. For OTC options purchased, the Fund bears the risk of loss of the amount of the premiums paid plus the positive change in market values net of any collateral held by the Fund should the counterparty fail to perform under the contracts. Options written by the Fund do not typically give rise to counterparty credit risk, as options written generally obligate the Fund and not the counterparty to perform.
To reduce counterparty risk with respect to OTC transactions, the Fund has entered into master netting arrangements, established within the Fund’s International Swap and Derivatives Association, Inc. (“ISDA”) master agreements, which allow the Fund to make (or to have an entitlement to receive) a single net payment in the event of default (close-out netting) for outstanding payables and receivables with respect to certain OTC positions in swaps, options, swaptions, and forward currency exchange contracts for each individual counterparty. In addition, the Fund may require that certain counterparties post cash and/or securities in collateral accounts to cover their net payment obligations for those derivative contracts subject to ISDA master agreements. If the counterparty fails to perform under these contracts and agreements, the cash and/or securities will be made available to the Fund.
As of October 31, 2014, the Fund has required certain counterparties to post collateral of $2,476,364.
ISDA master agreements include credit related contingent features which allow counterparties to OTC derivatives to terminate derivative contracts prior to maturity in the event that, for example, the Fund’s net assets decline by a stated percentage or the Fund fails to meet the terms of its ISDA master agreements, which would cause the Fund to accelerate payment of any net liability owed to the counterparty.
For financial reporting purposes, the Fund does not offset derivative assets and derivative liabilities that are subject to netting arrangements in the Consolidated Statement of Assets and Liabilities. Bankruptcy or insolvency laws of a particular jurisdiction may impose restrictions on or prohibitions against the right of offset in bankruptcy, insolvency or other events.
| | |
| 61 | | OPPENHEIMER FLEXIBLE STRATEGIES FUND |
NOTES TO CONSOLIDATED FINANCIAL STATEMENTS Continued
6. Risk Exposures and the Use of Derivative Instruments (Continued)
The Fund’s risk of loss from counterparty credit risk on exchange-traded derivatives cleared through a clearinghouse and for centrally cleared swaps is generally considered lower than as compared to OTC derivatives. However, counterparty credit risk exists with respect to initial and variation margin deposited/paid by the Fund that is held in futures commission merchant, broker and/or clearinghouse accounts for such exchange-traded derivatives and for centrally cleared swaps.
With respect to centrally cleared swaps, such transactions will be submitted for clearing, and if cleared, will be held in accounts at futures commission merchants or brokers that are members of clearinghouses. While brokers, futures commission merchants and clearinghouses are required to segregate customer margin from their own assets, in the event that a broker, futures commission merchant or clearinghouse becomes insolvent or goes into bankruptcy and at that time there is a shortfall in the aggregate amount of margin held by the broker, futures commission merchant or clearinghouse for all its customers, U.S. bankruptcy laws will typically allocate that shortfall on a pro-rata basis across all the broker’s, futures commission merchant’s or clearinghouse’s customers, potentially resulting in losses to the Fund.
There is the risk that a broker, futures commission merchant or clearinghouse will decline to clear a transaction on the Fund’s behalf, and the Fund may be required to pay a termination fee to the executing broker with whom the Fund initially enters into the transaction. Clearinghouses may also be permitted to terminate centrally cleared swaps at any time. The Fund is also subject to the risk that the broker or futures commission merchant will improperly use the Fund’s assets deposited/paid as initial or variation margin to satisfy payment obligations of another customer. In the event of a default by another customer of the broker or futures commission merchant, the Fund might not receive its variation margin payments from the clearinghouse, due to the manner in which variation margin payments are aggregated for all customers of the broker/futures commission merchant.
Collateral and margin requirements differ by type of derivative. Margin requirements are established by the broker, futures commission merchant or clearinghouse for exchange-traded and cleared derivatives, including centrally cleared swaps. Brokers, futures commission merchants and clearinghouses can ask for margin in excess of the regulatory minimum, or increase the margin amount, in certain circumstances.
Collateral terms are contract specific for OTC derivatives. For derivatives traded under an ISDA master agreement, the collateral requirements are typically calculated by netting the mark to market amount for each transaction under such agreement and comparing that amount to the value of any collateral currently pledged by the Fund or the counterparty.
For financial reporting purposes, cash collateral that has been pledged to cover obligations of the Fund, if any, is reported separately on the Consolidated Statement of Assets and Liabilities as cash pledged as collateral. Non-cash collateral pledged by the Fund, if any, is noted in the Consolidated Statement of Investments. Generally, the amount of collateral due from or to a party must exceed a minimum transfer amount threshold (e.g. $250,000) before a transfer has to be made. To the extent amounts due to the Fund from its counterparties are not fully collateralized, contractually or otherwise, the Fund bears the risk of loss from counterparty nonperformance.
| | |
| 62 | | OPPENHEIMER FLEXIBLE STRATEGIES FUND |
6. Risk Exposures and the Use of Derivative Instruments (Continued)
The following table presents by counterparty the Fund’s OTC derivative assets net of the related collateral posted for the benefit of the Fund at October 31, 2014.
| | | | | | | | | | | | | | | | | | | | |
| | | | | | Gross Amounts Not Offset in the Consolidated Statement of Assets & Liabilities | | | | |
| Counterparty | | Gross Amount
of Assets in the
Consolidated
Statement of
Assets &
Liabilities* | | | Financial
Instruments
Available for
Offset | | | Financial
Instruments
Collateral
Received** | | | Cash Collateral
Received** | | | Net Amount | |
Barclays Bank plc | | $ | 233,184 | | | $ | — | | | $ | — | | | $ | — | | | $ | 233,184 | |
Goldman Sachs Group, Inc. (The) | | | 561,734 | | | | (561,734 | ) | | | — | | | | — | | | | — | |
JPMorgan Chase Bank NA | | | 2,675,968 | | | | — | | | | (2,476,364 | ) | | | — | | | | 199,604 | |
Morgan Stanley Capital Services, Inc. | | | 924,541 | | | | — | | | | — | | | | — | | | | 924,541 | |
Royal Bank of Scotland plc (The) | | | 202,446 | | | | — | | | | — | | | | — | | | | 202,446 | |
| | | | |
| | $ | 4,597,873 | | | $ | (561,734 | ) | | $ | (2,476,364 | ) | | $ | — | | | $ | 1,559,775 | |
| | | | |
* OTC derivatives are reported gross on the Consolidated Statement of Assets and Liabilities. Exchange traded options and margin related to cleared swaps and futures are excluded from these reported amounts.
** Reported collateral posted for the benefit of the Fund within this table is limited to the net outstanding amount due from an individual counterparty. The collateral posted for the benefit of the Fund may exceed these amounts.
The following table presents by counterparty the Fund’s OTC derivative liabilities net of the related collateral pledged by the Fund at October 31, 2014.
| | | | | | | | | | | | | | | | | | | | |
| | | | | | Gross Amounts Not Offset in the Consolidated Statement of Assets & Liabilities | | | | |
| Counterparty | | Gross Amount
of Liabilities in
the
Consolidated
Statement of
Assets &
Liabilities* | | | Financial
Instruments
Available for
Offset | | | Financial
Instruments
Collateral
Pledged** | | | Cash Collateral
Pledged** | | | Net Amount | |
Deutsche Bank Securities, Inc. | | $ | (282,345 | ) | | $ | — | | | $ | — | | | $ | — | | | $ | (282,345 | ) |
Goldman Sachs Group, Inc. (The) | | | (918,399 | ) | | | 561,734 | | | | — | | | | (960,000 | ) | | | (1,316,665 | ) |
| | | | |
| | $ | (1,200,744 | ) | | $ | 561,734 | | | $ | — | | | $ | (960,000 | ) | | $ | (1,599,010 | ) |
| | | | |
* OTC derivatives are reported gross on the Consolidated Statement of Assets and Liabilities. Exchange traded options and margin related to cleared swaps and futures are excluded from these reported amounts.
** Reported collateral pledged within this table is limited to the net outstanding amount due from the Fund. The securities pledged as collateral by the Fund as reported on the Consolidated Statements of investments may exceed these amounts.
The following table presents the valuations of derivative instruments by risk exposure as reported within the Consolidated Statement of Assets and Liabilities as of October 31, 2014:
| | |
| 63 | | OPPENHEIMER FLEXIBLE STRATEGIES FUND |
NOTES TO CONSOLIDATED FINANCIAL STATEMENTS Continued
6. Risk Exposures and the Use of Derivative Instruments (Continued)
| | | | | | | | | | | | |
| | | Asset Derivatives | | | Liability Derivatives | |
Derivatives Not Accounted for as | | Consolidated Statement | | | Consolidated Statement of | |
Hedging Instruments | | of Assets and Liabilities Location | | Value | | | Assets and Liabilities Location | | Value | |
Credit contracts | | Swaps, at value | | $ | 786,651 | | | Swaps, at value | | $ | 502,613 | |
Equity contracts | | | | | | | | Swaps, at value | | | 415,786 | |
Credit contracts | | Centrally cleared swaps, at value | | | 504,325 | | | Centrally cleared swaps, at value | | | 1,959,721 | |
Equity contracts | | | | | | | | Variation margin payable | | | 319,200 | * |
Interest rate contracts | | Variation margin receivable | | | 48,797 | * | | Variation margin payable | | | 53,868 | * |
Foreign exchange contracts | | Unrealized appreciation on foreign currency exchange contracts | | | 1,126,987 | | | Unrealized depreciation on foreign currency exchange contracts | | | 282,345 | |
Equity contracts | | Investments, at value | | | 826,000 | ** | | | | | | |
Interest rate contracts | | Investments, at value | | | 2,913,923 | ** | | | | | | |
| | | | | | | | | | | | |
Total | | | | $ | 6,206,683 | | | | | $ | 3,533,533 | |
| | | | | | | | | | | | |
*Includes only the current day’s variation margin. Prior variation margin movements have been reflected in cash on the Consolidated Statement of Assets and Liabilities upon receipt or payment.
**Amounts relate to purchased option contracts and purchased swaption contracts.
The effect of derivative instruments on the Consolidated Statement of Operations is as follows:
| | | | | | | | | | | | | | | | | | | | |
| Amount of Realized Gain or (Loss) Recognized on Derivatives | |
Derivatives Not Accounted for as Hedging Instruments | | Investment
from
unaffiliated
companies* | | | Closing and
expiration of
futures
contracts | | | Foreign
currency
transactions | | | Swap contracts | | | Total | |
Commodity contracts | | $ | — | | | $ | (618,146 | ) | | $ | — | | | $ | — | | | $ | (618,146 | ) |
Credit contracts | | | — | | | | — | | | | — | | | | (9,039,757 | ) | | | (9,039,757 | ) |
Equity contracts | | | 139,704 | | | | (185,414 | ) | | | — | | | | 3,242,165 | | | | 3,196,455 | |
Foreign exchange contracts | | | (390,000 | ) | | | — | | | | 3,451,944 | | | | — | | | | 3,061,944 | |
Interest rate contracts | | | (955,645 | ) | | | (2,033,708 | ) | | | — | | | | — | | | | (2,989,353 | ) |
| | | | |
Total | | $ | (1,205,941 | ) | | $ | (2,837,268 | ) | | $ | 3,451,944 | | | $ | (5,797,592 | ) | | $ | (6,388,857 | ) |
| | | | |
*Includes purchased option contracts, purchased swaption contracts, written option contracts exercised and written swaption contracts exercised, if any.
| | |
| 64 | | OPPENHEIMER FLEXIBLE STRATEGIES FUND |
6. Risk Exposures and the Use of Derivative Instruments (Continued)
| | | | | | | | | | | | | | | | | | | | |
| Amount of Change in Unrealized Gain or (Loss) Recognized on Derivatives | |
Derivatives Not Accounted for as Hedging Instruments | | Investments* | | | Futures contracts | | | Translation of assets and liabilities
denominated in
foreign currencies | | | Swap contracts | | | Total | |
Commodity contracts | | $ | — | | | $ | 606,479 | | | $ | — | | | $ | — | | | $ | 606,479 | |
Credit contracts | | | — | | | | — | | | | — | | | | 7,459,842 | | | | 7,459,842 | |
Equity contracts | | | (410,393 | ) | | | (1,954,668 | ) | | | — | | | | (1,554,461 | ) | | | (3,919,522 | |
Foreign exchange contracts | | | 381,240 | | | | — | | | | 1,326,446 | | | | — | | | | 1,707,686 | |
Interest rate contracts | | | (5,987,036 | ) | | | 331,441 | | | | — | | | | — | | | | (5,655,595 | |
| | | | |
Total | | $ | (6,016,189 | ) | | $ | (1,016,748 | ) | | $ | 1,326,446 | | | $ | 5,905,381 | | | $ | 198,890 | |
| | | | |
*Includes purchased option contracts and purchased swaption contracts, if any.
7. Restricted Securities
As of October 31, 2014, investments in securities included issues that are restricted. A restricted security may have a contractual restriction on its resale and is valued under methods approved by the Board of Trustees as reflecting fair value. Securities that are restricted are marked with an applicable footnote on the Consolidated Statement of Investments. Restricted securities are reported on a schedule following the Consolidated Statement of Investments.
8. Pending Litigation
In 2009, seven class action lawsuits were filed in the U.S. District Court for the District of Colorado against OppenheimerFunds, Inc. (“OFI”), OppenheimerFunds Distributor, Inc., the Fund’s principal underwriter and distributor (the “Distributor”), and certain funds (but not including the Fund) advised by OFI Global Asset Management, Inc. and distributed by the Distributor (the “Defendant Funds”). The lawsuits also named as defendants certain officers and current and former trustees of the respective Defendant Funds. The lawsuits raised claims under federal securities laws and alleged, among other things, that the disclosure documents of the respective Defendant Funds contained misrepresentations and omissions and that the respective Defendant Funds’ investment policies were not followed. The plaintiffs in these actions sought unspecified damages, equitable relief and awards of attorneys’ fees and litigation expenses. The Defendant Funds’ Boards of Trustees also engaged counsel to represent the Funds and the present and former Independent Trustees named in those suits. In March 2014, the parties in six of these lawsuits executed stipulations and agreements of settlement resolving those actions. In July 2014, the court entered an order and final judgment approving the settlements as fair, reasonable and adequate. The settlements do not resolve a seventh outstanding lawsuit relating to Oppenheimer Rochester California Municipal Fund (the “California Fund Suit”). OFI believes the California Fund Suit is without legal merit and is defending the suit vigorously. While it is premature to render any opinion as to the outcome in the California Fund Suit, or whether any costs that OFI may bear in defending the
| | |
| 65 | | OPPENHEIMER FLEXIBLE STRATEGIES FUND |
NOTES TO CONSOLIDATED FINANCIAL STATEMENTS Continued
8. Pending Litigation (Continued)
California Fund Suit might not be reimbursed by insurance, OFI believes the California Fund Suit should not impair the ability of OFI or the Distributor to perform their respective duties to the Fund, and that the outcome of the California Fund Suit should not have any material effect on the operations of any of the Oppenheimer Funds.
| | |
| 66 | | OPPENHEIMER FLEXIBLE STRATEGIES FUND |
REPORT OF INDEPENDENT REGISTERED PUBLIC ACCOUNTING FIRM
The Board of Trustees and Shareholders of Oppenheimer Quest for Value Funds: We have audited the accompanying consolidated statement of assets and liabilities of Oppenheimer Flexible Strategies Fund (a series of Oppenheimer Quest For Value Funds) and subsidiary, including the consolidated statement of investments, as of October 31, 2014, and the related consolidated statement of operations for the year then ended, the consolidated statements of changes in net assets for each of the years in the two-year period then ended, and the consolidated financial highlights for each of the years or periods in the five-year period then ended. These consolidated financial statements and consolidated financial highlights are the responsibility of the Fund’s management. Our responsibility is to express an opinion on these consolidated financial statements and consolidated financial highlights based on our audits.
We conducted our audits in accordance with the standards of the Public Company Accounting Oversight Board (United States). Those standards require that we plan and perform the audit to obtain reasonable assurance about whether the financial statements and financial highlights are free of material misstatement. An audit includes examining, on a test basis, evidence supporting the amounts and disclosures in the financial statements. Our procedures included confirmation of securities owned as of October 31, 2014, by correspondence with the custodian, transfer agent and brokers, or by other appropriate auditing procedures where replies from brokers were not received. An audit also includes assessing the accounting principles used and significant estimates made by management, as well as evaluating the overall financial statement presentation. We believe that our audits provide a reasonable basis for our opinion.
In our opinion, the consolidated financial statements and consolidated financial highlights referred to above present fairly, in all material respects, the financial position of Oppenheimer Flexible Strategies Fund and subsidiary as of October 31, 2014, the results of their operations for the year then ended, the changes in their net assets for each of the years in the two-year period then ended, and the financial highlights for each of the years or periods in the five-year period then ended, in conformity with U.S. generally accepted accounting principles.
KPMG LLP
Denver, Colorado
December 22, 2014
| | |
| 67 | | OPPENHEIMER FLEXIBLE STRATEGIES FUND |
FEDERAL INCOME TAX INFORMATION Unaudited
In early 2015, if applicable, shareholders of record received information regarding all dividends and distributions paid to them by the Fund during calendar year 2014.
Dividends, if any, paid by the Fund during the fiscal year ended October 31, 2014 which are not designated as capital gain distributions should be multiplied by the maximum amount allowable but not less than 73.27% to arrive at the amount eligible for the corporate dividend-received deduction.
A portion, if any, of the dividends paid by the Fund during the fiscal year ended October 31, 2014 which are not designated as capital gain distributions are eligible for lower individual income tax rates to the extent that the Fund has received qualified dividend income as stipulated by recent tax legislation. The maximum amount allowable but not less than $10,408,031 of the Fund’s fiscal year taxable income may be eligible for the lower individual income tax rates. In early 2015, shareholders of record received information regarding the percentage of distributions that are eligible for lower individual income tax rates.
Recent tax legislation allows a regulated investment company to designate distributions not designated as capital gain distributions, as either interest related dividends or short-term capital gain dividends, both of which are exempt from the U.S. withholding tax applicable to non U.S. taxpayers. For the fiscal year ended October 31, 2014, the maximum amount allowable but not less than $1,583,273 of the ordinary distributions to be paid by the Fund qualifies as an interest related dividend.
The foregoing information is presented to assist shareholders in reporting distributions received from the Fund to the Internal Revenue Service. Because of the complexity of the federal regulations which may affect your individual tax return and the many variations in state and local tax regulations, we recommend that you consult your tax advisor for specific guidance.
| | |
| 68 | | OPPENHEIMER FLEXIBLE STRATEGIES FUND |
BOARD APPROVAL OF THE FUND’S INVESTMENT ADVISORY AND SUB-ADVISORY AGREEMENTS Unaudited
The Fund has entered into an investment advisory agreement with OFI Global Asset Management, Inc. (“OFI Global” or the “Adviser”), a wholly-owned subsidiary of OppenheimerFunds, Inc. (“OFI” or the “Sub-Adviser”) (“OFI Global” and “OFI” together the “Managers”) and OFI Global has entered into a sub-advisory agreement with OFI whereby OFI provides investment sub-advisory services to the Fund (collectively, the “Agreements”). Each year, the Board of Trustees (the “Board”), including a majority of the independent Trustees, is required to determine whether to renew the Agreements. The Investment Company Act of 1940, as amended, requires that the Board request and evaluate, and that the Managers provide, such information as may be reasonably necessary to evaluate the terms of the Agreements. The Board employs an independent consultant to prepare a report that provides information, including comparative information that the Board requests for that purpose. In addition to in-person meetings focused on this evaluation, the Board receives information throughout the year regarding Fund services, fees, expenses and performance.
The Adviser, Sub-Adviser and the independent consultant provided information to the Board on the following factors: (i) the nature, quality and extent of the Managers’ services, (ii) the investment performance of the Fund and the Managers, (iii) the fees and expenses of the Fund, including comparative expense information, (iv) the profitability of the Managers and their affiliates, including an analysis of the cost of providing services, (v) whether economies of scale are realized as the Fund grows and whether fee levels reflect these economies of scale for Fund investors and (vi) other benefits to the Managers from their relationship with the Fund. The Board was aware that there are alternatives to retaining the Managers.
Outlined below is a summary of the principal information considered by the Board as well as the Board’s conclusions.
Nature, Quality and Extent of Services. The Board considered information about the nature, quality and extent of the services provided to the Fund and information regarding the Managers’ key personnel who provide such services. The Sub-Adviser’s duties include providing the Fund with the services of the portfolio manager and the Sub-Adviser’s investment team, who provide research, analysis and other advisory services in regard to the Fund’s investments; securities trading services; oversight of third-party service providers; monitoring compliance with applicable Fund policies and procedures and adherence to the Fund’s investment restrictions; and risk management. The Managers are responsible for providing certain administrative services to the Fund as well. Those services include providing and supervising all administrative and clerical personnel who are necessary in order to provide effective corporate administration for the Fund; compiling and maintaining records with respect to the Fund’s operations; preparing and filing reports required by the Securities and Exchange Commission; preparing periodic reports regarding the operations of the Fund for its shareholders; preparing proxy materials for shareholder meetings; and preparing the registration statements required by Federal and state securities laws for the sale of the Fund’s shares. The Managers also provide the Fund with office space, facilities and equipment.
The Board also considered the quality of the services provided and the quality of the Managers’ resources that are available to the Fund. The Board took account of the fact that the Sub-Adviser has had over fifty years of experience as an investment adviser and that its assets under management rank it among the top mutual fund managers in the United States. The Board evaluated the Sub-Adviser’s advisory, administrative, accounting, legal, compliance
| | |
| 69 | | OPPENHEIMER FLEXIBLE STRATEGIES FUND |
BOARD APPROVAL OF THE FUND’S INVESTMENT ADVISORY AND SUB-ADVISORY
AGREEMENTS Unaudited / Continued
services and risk management, and information the Board has received regarding the experience and professional qualifications of the Managers’ key personnel and the size and functions of its staff. In its evaluation of the quality of the portfolio management services provided, the Board considered the experience of Michelle Borré, the portfolio manager for the Fund, and the Sub-Adviser’s investment team and analysts. The Board members also considered the totality of their experiences with the Managers as directors or trustees of the Fund and other funds advised by the Managers. The Board considered information regarding the quality of services provided by affiliates of the Managers, which its members have become knowledgeable about in connection with the renewal of the Fund’s service agreements. The Board concluded, in light of the Managers’ experience, reputation, personnel, operations and resources that the Fund benefits from the services provided under the Agreements.
Investment Performance of the Adviser and the Fund. Throughout the year, the Adviser provided information on the investment performance of the Fund, including comparative performance information. The Board also reviewed information, prepared by the Adviser and by the independent consultant, comparing the Fund’s historical performance to relevant market indices and to the performance of other retail funds in the multialternative category. The Board noted that the Fund’s one-, five-, and ten-year performance was better than its category median although its three-year performance was below its category median.
Costs of Services by the Adviser. The Board reviewed the fees paid to the Adviser and the other expenses borne by the Fund. The independent consultant provided comparative data in regard to the fees and expenses of the Fund and other retail front-end load multialternative funds with comparable asset levels and distribution features. The Fund’s contractual management fees were lower than its peer group median and category median. The Fund’s total expenses were higher than its peer group median and category median.
Economies of Scale and Profits Realized by the Managers. The Board considered information regarding OFI Global’s costs in serving as the Fund’s investment adviser, including the costs associated with the personnel and systems necessary to manage the Fund, and information regarding the Managers’ profitability from their relationship with the Fund. The Board reviewed whether the Managers may realize economies of scale in managing and supporting the Fund. The Board noted that the Fund currently has management fee breakpoints, which are intended to share with Fund shareholders economies of scale that may exist as the Fund’s assets grow.
Other Benefits to the Managers. In addition to considering the profits realized by the Managers, the Board considered information that was provided regarding the direct and indirect benefits the Managers receive as a result of their relationship with the Fund, including compensation paid to the Managers’ affiliates and research provided to the Adviser in connection with permissible brokerage arrangements (soft dollar arrangements).The Board also considered that the Managers must be able to pay and retain experienced professional personnel at competitive rates to provide quality services to the Fund.
Conclusions. These factors were also considered by the independent Trustees meeting separately from the full Board, assisted by experienced counsel to the Fund and to the independent Trustees. Fund counsel and the independent Trustees’ counsel are independent of the Managers within the meaning and intent of the Securities and Exchange Commission Rules.
| | |
| 70 | | OPPENHEIMER FLEXIBLE STRATEGIES FUND |
Based on its review of the information it received and its evaluations described above, the Board, including a majority of the independent Trustees, decided to continue the Agreements through September 30, 2015. In arriving at its decision, the Board did not identify any factor or factors as being more important than others, but considered all of the above information, and considered the terms and conditions of the Agreements, including the management fees, in light of all the surrounding circumstances.
| | |
| 71 | | OPPENHEIMER FLEXIBLE STRATEGIES FUND |
PORTFOLIO PROXY VOTING POLICIES AND PROCEDURES; UPDATES
TO CONSOLIDATED STATEMENTS OF INVESTMENTS Unaudited
The Fund has adopted Portfolio Proxy Voting Policies and Procedures under which the Fund votes proxies relating to securities (“portfolio proxies”) held by the Fund. A description of the Fund’s Portfolio Proxy Voting Policies and Procedures is available (i) without charge, upon request, by calling the Fund toll-free at 1.800.CALL OPP (225.5677), (ii) on the Fund’s website at www.oppenheimerfunds.com, and (iii) on the SEC’s website at www.sec.gov. In addition, the Fund is required to file Form N-PX, with its complete proxy voting record for the 12 months ended June 30th, no later than August 31st of each year. The Fund’s voting record is available (i) without charge, upon request, by calling the Fund toll-free at 1.800.CALL OPP (225.5677), and (ii) in the Form N-PX filing on the SEC’s website at www.sec.gov.
The Fund files its complete schedule of portfolio holdings with the SEC for the first quarter and the third quarter of each fiscal year on Form N-Q. The Fund’s Form N-Q filings are available on the SEC’s website at www.sec.gov. Those forms may be reviewed and copied at the SEC’s Public Reference Room in Washington, D.C. Information on the operation of the Public Reference Room may be obtained by calling 1-800-SEC-0330.
Householding—Delivery of Shareholder Documents
This is to inform you about OppenheimerFunds’ “householding” policy. If more than one member of your household maintains an account in a particular fund, OppenheimerFunds will mail only one copy of the fund’s prospectus (or, if available, the fund’s summary prospectus), annual and semiannual report and privacy policy. The consolidation of these mailings, called householding, benefits your fund through reduced mailing expense, and benefits you by reducing the volume of mail you receive from OppenheimerFunds. Householding does not affect the delivery of your account statements.
Please note that we will continue to household these mailings for as long as you remain an OppenheimerFunds shareholder, unless you request otherwise. If you prefer to receive multiple copies of these materials, please call us at 1.800.CALL-OPP (225-5677). You may also notify us in writing or via email. We will begin sending you individual copies of the prospectus (or, if available, the summary prospectus), reports and privacy policy within 30 days of receiving your request to stop householding.
| | |
| 72 | | OPPENHEIMER FLEXIBLE STRATEGIES FUND |
TRUSTEES AND OFFICERS Unaudited
| | |
Name, Position(s) Held with the Fund, Length of Service, Year of Birth | | Principal Occupation(s) During the Past 5 Years; Other Trusteeships/Directorships Held; Number of Portfolios in the Fund Complex Currently Overseen |
| |
INDEPENDENT TRUSTEES | | The address of each Trustee in the chart below is 6803 S. Tucson Way, Centennial, Colorado 80112-3924. Each Trustee serves for an indefinite term, or until his or her resignation, retirement, death or removal. |
| |
Brian F. Wruble, Chairman of the Board of Trustees (since 2007), Trustee (since 2001) Year of Birth: 1943 | | Director and Vice Chairman of Community Foundation of the Florida Keys (non- profit) (since July 2012); Trustee of the Board of Trustees, The Jackson Laboratory (non-profit) (1991-2011 and since May 2014); Chairman Emeritus (since August 2011) of The Jackson Laboratory (non-profit); Director of Special Value Opportunities Fund, LLC (registered investment company) (affiliate of the Sub- Adviser’s parent company) (since September 2004); Member of Zurich Insurance Group’s Investment Management Advisory Council (insurance) (since 2004); Treasurer (since 2007) and Trustee of the Institute for Advanced Study (non-profit educational institute) (since May 1992); General Partner of Odyssey Partners, L.P. (hedge fund) (September 1995-December 2007); Special Limited Partner of Odyssey Investment Partners, LLC (private equity investment) (January 1999- September 2004). Oversees 52 portfolios in the OppenheimerFunds complex. Mr. Wruble has served on the Boards of certain Oppenheimer funds since April 2001, during which time he has become familiar with the Fund’s (and other Oppenheimer funds’) financial, accounting, regulatory and investment matters and has contributed to the Boards’ deliberations. |
| |
David K. Downes, Trustee (since 2005) Year of Birth: 1940 | | Director of THL Credit Inc. (since June 2009); Chief Executive Officer and Board Member of Community Capital Management (investment management company) (since January 2004); President of The Community Reinvestment Act Qualified Investment Fund (investment management company) (since 2004); Director of Actua Corporation (information technology company) (since October 2003); formerly, Independent Chairman GSK Employee Benefit Trust (April 2006- June2013); Director of Correctnet (January 2006-2007); Independent Chairman of the Board of Trustees of Quaker Investment Trust (registered investment company) (2004-2007); Chief Operating Officer and Chief Financial Officer of Lincoln National Investment Companies, Inc. (subsidiary of Lincoln National Corporation, a publicly traded company) and Delaware Investments U.S., Inc. (investment management subsidiary of Lincoln National Corporation) (1993-2003); President, Chief Executive Officer and Trustee of Delaware Investment Family of Funds (1993-2003); President and Board Member of Lincoln National Convertible Securities Funds, Inc. and the Lincoln National Income Funds, TDC (1993-2003); Chairman and Chief Executive Officer of Retirement Financial Services, Inc. (registered transfer agent and investment adviser and subsidiary of Delaware Investments U.S., Inc.) (1993-2003); President and Chief Executive Officer of Delaware Service Company, Inc. (1995-2003); Chief Administrative Officer, Chief Financial Officer, Vice Chairman and Director of Equitable Capital Management Corporation (investment subsidiary of Equitable Life Assurance Society) (1985- 1992); Corporate Controller of Merrill Lynch Company (financial services holding company) (1977-1985); held the following positions at the Colonial Penn Group, Inc. (insurance company): Corporate Budget Director (1974-1977), Assistant Treasurer (1972-1974) and Director of Corporate Taxes (1969-1972); held the following positions at Price Waterhouse Company (financial services firm): Tax Manager (1967-1969), Tax Senior (1965-1967) and Staff Accountant (1963-1965); United States Marine Corps (1957-1959). Oversees 52 portfolios in the OppenheimerFunds complex. |
| | |
| 73 | | OPPENHEIMER FLEXIBLE STRATEGIES FUND |
TRUSTEES AND OFFICERS Unaudited / Continued
| | |
David K. Downes, Continued | | Mr. Downes has served on the Boards of certain Oppenheimer funds since December 2005, during which time he has become familiar with the Fund’s (and other Oppenheimer funds’) financial, accounting, regulatory and investment matters and has contributed to the Boards’ deliberations. |
| |
Matthew P. Fink, Trustee (since 2009) Year of Birth: 1941 | | Trustee of the Committee for Economic Development (policy research foundation) (2005-2011); Director of ICI Education Foundation (education foundation) (October 1991-August 2006); President of the Investment Company Institute (trade association) (October 1991-June 2004); Director of ICI Mutual Insurance Company (insurance company) (October 1991-June 2004); Author of The Rise of Mutual Funds: An Insider’s View published by Oxford University Press (second edition 2010). Oversees 52 portfolios in the OppenheimerFunds complex. Mr. Fink has served on the Boards of certain Oppenheimer funds since January 2005, during which time he has become familiar with the Fund’s (and other Oppenheimer funds’) financial, accounting, regulatory and investment matters and has contributed to the Boards’ deliberations. |
| |
Edmund P. Giambastiani, Jr., Trustee (since 2013) Year of Birth: 1948 | | Advisory Board Member of the Maxwell School of Citizenship and Public Affairs of Syracuse University (since April 2012); Director of Mercury Defense Systems Inc. (information technology) (August 2011-February 2013); Trustee of the U.S. Naval Academy Foundation (since November 2010); Advisory Board Member of the Massachusetts Institute of Technology Lincoln Laboratory (federally-funded research development center) (since May 2010); Director of The Boeing Company (aerospace and defense) (since October 2009); Trustee of MITRE Corporation (federally-funded research development center) (since September 2008); Independent Director of QinetiQ Group Plc (defense technology and security) (February 2008-August 2011); Director of Monster Worldwide, Inc. (on-line career services) (since January 2008, Lead Director since June 2011); Chairman of Alenia North America, Inc. (military and defense products) (January 2008-October 2009); Director of SRA International, Inc. (information technology and services) (January 2008-July 2011); President of Giambastiani Group LLC (national security and energy consulting) (since October 2007); United States Navy, career nuclear submarine officer (June 1970-October 2007), Vice Chairman of the Joint Chiefs of Staff (2005-October 2007), NATO Supreme Allied Commander Transformation (2003-2005), Commander, U.S. Joint Forces Command (2002-2005). Since his retirement from the U.S. Navy in October 2007, Admiral Giambastiani has also served on numerous U.S. Government advisory boards, investigations and task forces for the Secretaries of Defense, State and Interior and the Central Intelligence Agency. Oversees 52 portfolios in the OppenheimerFunds complex. Admiral Giambastiani has served on the Boards of certain Oppenheimer funds since February 2013, including as an Advisory Board Member for certain Oppenheimer funds, during which time he has become familiar with the Fund’s (and other Oppenheimer funds’) financial, accounting, regulatory and investment matters and has contributed to the Boards’ deliberations. For purposes of this report, Admiral Giambastiani is identified as a Trustee. |
| |
Elizabeth Krentzman, Trustee (since 2014) Year of Birth: 1959 | | Advisory Board Member of the Securities and Exchange Commission Historical Society (since 2007); held the following positions at Deloitte & Touche LLP: Principal and Chief Regulatory Advisor for Asset Management Services (2007 - 2014) and U.S. Mutual Fund Leader (2011 - 2014); General Counsel of the Investment Company Institute (trade association) (June 2004 - April 2007); held the following positions at Deloitte & Touche LLP: National Director of the Investment Management Regulatory Consulting Practice (1997 - 2004), Principal |
| | |
| 74 | | OPPENHEIMER FLEXIBLE STRATEGIES FUND |
| | |
Elizabeth Krentzman, Continued | | (2003 - 2004), Director (1998 - 2003) and Senior Manager (1997 - 1998); Assistant Director of the Division of Investment Management - Office of Disclosure and Investment Adviser Regulation (1996 - 1997) and various positions with the Division of Investment Management – Office of Regulatory Policy (1991 - 1996) of the U.S. Securities and Exchange Commission; Associate at Ropes & Gray (1987 - 1991); former Chair of the Investment Management Subcommittee of the Washington, D.C. Bar. Oversees 52 portfolios in the OppenheimerFunds complex. Ms. Krentzman has served on the Boards of certain Oppenheimer funds since August 2014, during which time she has become familiar with the Fund’s (and other Oppenheimer funds’) financial, accounting, regulatory and investment matters and has contributed to the Boards’ deliberations. |
| |
Mary F. Miller, Trustee (since 2009) Year of Birth: 1942 | | Trustee of International House (not-for-profit) (since June 2007); Trustee of the American Symphony Orchestra (not-for-profit) (October 1998-November 2011); and Senior Vice President and General Auditor of American Express Company (financial services company) (July 1998-February 2003). Oversees 52 portfolios in the OppenheimerFunds complex. Ms. Miller has served on the Boards of certain Oppenheimer funds since August 2004, during which time she has become familiar with the Fund’s (and other Oppenheimer funds’) financial, accounting, regulatory and investment matters and has contributed to the Boards’ deliberations. |
| |
Joel W. Motley, Trustee (since 2009) Year of Birth: 1952 | | Member of the Vestry of Trinity Wall Street (since April 2012); Director of Southern Africa Legal Services Foundation (since March 2012); Board Member of Pulitzer Center for Crisis Reporting (non-profit journalism) (since December 2010); Managing Director of Public Capital Advisors, LLC (privately-held financial advisor) (since January 2006); Managing Director of Carmona Motley, Inc. (privately-held financial advisor) (since January 2002); Director of Columbia Equity Financial Corp. (privately-held financial advisor) (2002-2007); Managing Director of Carmona Motley Hoffman Inc. (privately-held financial advisor) (January 1998-December 2001); Member of the Finance and Budget Committee of the Council on Foreign Relations, Member of the Investment Committee and Board of Human Rights Watch and Member of the Investment Committee and Board of Historic Hudson Valley. Oversees 52 portfolios in the OppenheimerFunds complex. Mr. Motley has served on the Boards of certain Oppenheimer funds since October 2002, during which time he has become familiar with the Fund’s (and other Oppenheimer funds’) financial, accounting, regulatory and investment matters and has contributed to the Boards’ deliberations. |
| |
Joanne Pace, Trustee (since 2012) Year of Birth: 1958 | | Board Director of Horizon Blue Cross Blue Shield of New Jersey (since November 2012); Advisory Board Director of The Alberleen Group LLC (since March 2012); Advisory Board Director of The Agile Trading Group LLC (since March 2012); Advisory Council Member of 100 Women in Hedge Funds (non-profit) (since December 2012); Advisory Council Member of Morgan Stanley Children’s Hospital (non-profit) (since May 2012); Board Director of The Komera Project (non-profit) (since April 2012); New York Advisory Board Director of Peace First (non-profit) (since March 2010); Senior Advisor of SECOR Asset Management, LP (2010- 2011); Managing Director and Chief Operating Officer of Morgan Stanley Investment Management (2006-2010); Partner and Chief Operating Officer of FrontPoint Partners, LLC (hedge fund) (2005-2006); held the following positions at Credit Suisse: Managing Director (2003-2005); Global Head of Human Resources and member of Executive Board and Operating Committee (2004-2005), Global Head of Operations and Product Control (2003-2004); held the following positions at |
| | |
| 75 | | OPPENHEIMER FLEXIBLE STRATEGIES FUND |
TRUSTEES AND OFFICERS Unaudited / Continued
| | |
Joanne Pace, Continued | | Morgan Stanley: Managing Director (1997-2003), Controller and Principal Accounting Officer (1999-2003); Chief Financial Officer (temporary assignment) for the Oversight Committee, Long Term Capital Management (1998-1999). Lead Independent Director and Chair of the Audit and Nominating Committee of The Global Chartist Fund, LLC of Oppenheimer Asset Management (2011-2012); Board Director of Managed Funds Association (2008-2010); Board Director of Morgan Stanley Foundation (2007-2010) and Investment Committee Chair (2008-2010). Oversees 52 portfolios in the OppenheimerFunds complex. Ms. Pace has served on the Boards of certain Oppenheimer funds since November 2012, including as an Advisory Board Member for certain Oppenheimer funds, during which time she has become familiar with the Fund’s (and other Oppenheimer funds’) financial, accounting, regulatory and investment matters and has contributed to the Board’s deliberations. For purposes of this report, Ms. Pace is identified as a Trustee. |
| |
Peter I. Wold, Trustee (since 2009) Year of Birth: 1948 | | Director of Arch Coal, Inc. (since 2010); President of Wold Oil Properties, Inc. (oil and gas exploration and production company) (since 1994); Vice President of American Talc Company, Inc. (talc mining and milling) (since 1999); Managing Member of Hole-in-the-Wall Ranch (cattle ranching) (since 1979); Director and Chairman of Wyoming Enhanced Oil Recovery Institute Commission (enhanced oil recovery study) (2004-2012); Director and Chairman of the Denver Branch of the Federal Reserve Bank of Kansas City (1993-1999); and Director of PacifiCorp. (electric utility) (1995-1999). Oversees 52 portfolios in the OppenheimerFunds complex. Mr. Wold has served on the Boards of certain Oppenheimer funds since August 2005, during which time he has become familiar with the Fund’s (and other Oppenheimer funds’) financial, accounting, regulatory and investment matters and has contributed to the Boards’ deliberations. |
|
| |
INTERESTED TRUSTEE | | Mr. Glavin is an “Interested Trustee” because he is affiliated with the Manager and the Sub-Adviser by virtue of his positions as director of the Sub-Adviser, and as a shareholder of the Sub-Adviser’s parent company. As a Trustee, he serves for an indefinite term, or until his resignation, retirement, death or removal. Mr. Glavin’s address is 225 Liberty Street, 11th Floor, New York, New York 10281-1008. |
| |
William F. Glavin, Jr., Trustee (since 2009) Year of Birth: 1958 | | Chairman of the Sub-Adviser (since July 2014 and December 2009-December 2012) and Director of the Sub-Adviser (since January 2009); Chairman, Director and Chief Executive Officer (January 2013-June 2014) of the Manager; President of the Manager (January 2013-May 2013); Chief Executive Officer (January 2009-December 2012); President of the Sub-Adviser (May 2009-December 2012); Management Director (June 2009-June 2014), President (December 2009-June 2014) and Chief Executive Officer (January 2011-June 2014) of Oppenheimer Acquisition Corp. (“OAC”) (the Sub-Adviser’s parent holding company); Director of Oppenheimer Real Asset Management, Inc. (March 2010-June 2014); Executive Vice President (March 2006-February 2009) and Chief Operating Officer (July 2007-February 2009) of Massachusetts Mutual Life Insurance Company (OAC’s parent company); Director (May 2004-March 2006) and Chief Operating Officer and Chief Compliance Officer (May 2004-January 2005), President (January 2005-March 2006) and Chief Executive Officer (June 2005-March 2006) of Babson Capital Management LLC; Director (March 2005-March 2006), President (May 2003-March 2006) and Chief Compliance Officer (July 2005-March 2006) of Babson Capital Securities, Inc. (a broker-dealer); President (May 2003-March 2006) of Babson Investment Company, Inc.; Director (May 2004-August 2006) of |
| | |
| 76 | | OPPENHEIMER FLEXIBLE STRATEGIES FUND |
| | |
William F. Glavin, Jr., Continued | | Babson Capital Europe Limited; Director (May 2004-October 2006) of Babson Capital Guernsey Limited; Director (May 2004-March 2006) of Babson Capital Management LLC; Non-Executive Director (March 2005-March 2007) of Baring Asset Management Limited; Director (February 2005-June 2006) Baring Pension Trustees Limited; Director and Treasurer (December 2003-November 2006) of Charter Oak Capital Management, Inc.; Director (May 2006-September 2006) of C.M. Benefit Insurance Company; Director (May 2008-June 2009) and Executive Vice President (June 2007-July 2009) of C.M. Life Insurance Company; President (March 2006-May 2007) of MassMutual Assignment Company; Director (January 2005-December 2006), Deputy Chairman (March 2005-December 2006) and President (February 2005-March 2005) of MassMutual Holdings (Bermuda) Limited; Director (May 2008-June 2009) and Executive Vice President (June 2007- July 2009) of MML Bay State Life Insurance Company; Chief Executive Officer and President (April 2007-January 2009) of MML Distributors, LLC; and Chairman (March 2006-December 2008) and Chief Executive Officer (May 2007-December 2008) of MML Investors Services, Inc. An officer of 91 portfolios in the OppenheimerFunds complex. Mr. Glavin has served on the Boards of certain Oppenheimer funds since December 2009, during which time he has become familiar with the Fund’s (and other Oppenheimer funds’) financial, accounting, regulatory and investment matters and has contributed to the Boards’ deliberations. |
| |
| OTHER OFFICERS OF THE FUND | | The addresses of the Officers in the chart below are as follows: for Messrs. Steinmetz, Gabinet, Mss. Borré, Sexton and Picciotto, 225 Liberty Street, New York, New York 10281-1008, for Mr. Wixted, 6803 S. Tucson Way, Centennial, Colorado 80112-3924. Each Officer serves for an indefinite term or until his or her resignation, retirement, death or removal. |
| |
Michelle Borré, Vice President (since 2011) Year of Birth: 1967 | | Vice President of the Sub-Adviser (since April 2003); Senior Portfolio Manager of the Sub-Adviser (since April 2009); Senior Research Analyst of the Sub-Adviser (February 2003-April 2009). Ms. Borre held various positions, including Managing Director and Partner, at J&W Seligman (July 1996 –January 2003). Adjunct Professor of Finance and Economics at Columbia Business School; Served on the Executive Advisory Board at the Heilbrunn Center for Graham and Dodd Investing at Columbia Business School (from 2004 to 2005). A portfolio manager and an officer of other portfolios in the OppenheimerFunds complex. |
| |
Arthur P. Steinmetz, President and Principal Executive Officer (since 2014) Year of Birth: 1958 | | CEO and Chairman of the Manager (since July 2014), President of the Manager (since May 2013), a Director of the Manager (since January 2013), Director of the Sub-Adviser (since July 2014), President, Management Director and CEO of Oppenheimer Acquisition Corp. (the Sub-Adviser’s parent holding company) (since July 2014), and President and Director of OFI SteelPath, Inc. (since January 2013). Chief Investment Officer of the OppenheimerFunds advisory entities from (January 2013-December 2013); Executive Vice President of the Manager (January 2013-May 2013); Chief Investment Officer of the Sub-Adviser (October 2010-December 2012); Chief Investment Officer, Fixed-Income, of the Sub-Adviser (April 2009-October 2010); Executive Vice President of the Sub-Adviser (October 2009-December 2012); Director of Fixed Income of the Sub-Adviser (January 2009-April 2009); and a Senior Vice President of the Sub-Adviser (March 1993- September 2009). An officer of 91 portfolios in the OppenheimerFunds complex. |
| | |
| 77 | | OPPENHEIMER FLEXIBLE STRATEGIES FUND |
TRUSTEES AND OFFICERS Unaudited / Continued
| | |
Arthur S. Gabinet, Secretary and Chief Legal Officer (since 2011) Year of Birth: 1958 | | Executive Vice President, Secretary and General Counsel of the Manager (since January 2013); General Counsel OFI SteelPath, Inc. (since January 2013); Executive Vice President (May 2010-December 2012) and General Counsel (since January 2011) of the Sub-Adviser; General Counsel of the Distributor (since January 2011); General Counsel of Centennial Asset Management Corporation (January 2011-December 2012); Executive Vice President (January 2011- December 2012) and General Counsel of HarbourView Asset Management Corporation (since January 2011); Assistant Secretary (since January 2011) and Director (since January 2011) of OppenheimerFunds International Ltd. and OppenheimerFunds plc; Director of Oppenheimer Real Asset Management, Inc. (January 2011-December 2012) and General Counsel (since January 2011); Executive Vice President (January 2011-December 2011) and General Counsel of Shareholder Financial Services, Inc. and Shareholder Services, Inc. (since January 2011); Executive Vice President (January 2011-December 2012) and General Counsel of OFI Private Investments Inc. (since January 2011); Vice President of OppenheimerFunds Legacy Program (January 2011-December 2011); Executive Vice President (January 2011-December 2012) and General Counsel of OFI Institutional Asset Management, Inc. (since January 2011); General Counsel, Asset Management of the Sub-Adviser (May 2010-December 2010); Principal, The Vanguard Group (November 2005-April 2010); District Administrator, U.S. Securities and Exchange Commission (January 2003-October 2005). An officer of 91 portfolios in the OppenheimerFunds complex. |
| |
Jennifer Sexton, Vice President and Chief Business Officer (since 2014) Year of Birth: 1969 | | Senior Vice President of OppenheimerFunds Distributor, Inc. (since June 2014); Vice President of OppenheimerFunds Distributor, Inc. (April 2006-June 2014); Vice President of the Sub-Adviser (January 1998-March 2006); Assistant Vice President of the Sub-Adviser (October 1991-December 1998). An officer of 91 portfolios in the OppenheimerFunds complex. |
| |
Mary Ann Picciotto, Chief Compliance Officer and Chief Anti-Money Laundering Officer (since 2014) Year of Birth: 1973 | | Senior Vice President and Chief Compliance Officer of the Manager (since March 2014); Chief Compliance Officer of the Sub-Adviser, OFI SteelPath, Inc., OFI Global Trust Company, OFI Global Institutional, Inc., Oppenheimer Real Asset Management, Inc., OFI Private Investments, Inc., Harborview Asset Management Corporation, Trinity Investment Management Corporation, and Shareholder Services, Inc. (since March 2014); Managing Director of Morgan Stanley Investment Management Inc. and certain of its various affiliated entities; Chief Compliance Officer of various Morgan Stanley Funds (May 2010-January 2014); Chief Compliance Officer of Morgan Stanley Investment Management Inc. (April 2007-January 2014). An officer of 91 portfolios in the OppenheimerFunds complex. |
| |
Brian W. Wixted, Treasurer and Principal Financial & Accounting Officer (since 1999) Year of Birth: 1959 | | Senior Vice President of the Manager (since January 2013); Treasurer of the Sub- Adviser, HarbourView Asset Management Corporation, Shareholder Financial Services, Inc., Shareholder Services, Inc., and Oppenheimer Real Asset Management, Inc. (March 1999-June 2008), OFI Private Investments, Inc. (March 2000-June 2008), OppenheimerFunds International Ltd. and OppenheimerFunds plc (since May 2000), OFI Institutional Asset Management, Inc. (November 2000- June 2008), and OppenheimerFunds Legacy Program (charitable trust program established by the Sub-Adviser) (June 2003-December 2011); Treasurer and Chief Financial Officer of OFI Trust Company (since May 2000); Assistant Treasurer of Oppenheimer Acquisition Corporation (March 1999-June 2008). An officer of 91 portfolios in the OppenheimerFunds complex. |
| | |
| 78 | | OPPENHEIMER FLEXIBLE STRATEGIES FUND |
The Fund’s Statement of Additional Information contains additional information about the Fund’s Trustees and Officers and is available without charge upon request, by calling 1.800.CALL OPP (225.5677).
| | |
| 79 | | OPPENHEIMER FLEXIBLE STRATEGIES FUND |
| | |
| OPPENHEIMER FLEXIBLE STRATEGIES FUND |
| |
Manager | | OFI Global Asset Management, Inc. |
| |
| Sub-Adviser | | OppenheimerFunds, Inc. |
| |
| Distributor | | OppenheimerFunds Distributor, Inc. |
| |
| Transfer and Shareholder Servicing Agent | | OFI Global Asset Management, Inc. |
| |
| Sub-Transfer Agent | | Shareholder Services, Inc. DBA OppenheimerFunds Services |
| |
Independent Registered Public Accounting Firm | | KPMG LLP |
| |
| Legal Counsel | | Kramer Levin Naftalis & Frankel LLP |
|
| © 2014 OppenheimerFunds, Inc. All rights reserved. |
| | |
| 80 | | OPPENHEIMER FLEXIBLE STRATEGIES FUND |
PRIVACY POLICY NOTICE
As an Oppenheimer fund shareholder, you are entitled to know how we protect your personal information and how we limit its disclosure.
Information Sources
We obtain nonpublic personal information about our shareholders from the following sources:
| • | | Applications or other forms |
| • | | When you create a user ID and password for online account access |
| • | | When you enroll in eDocs Direct, our electronic document delivery service |
| • | | Your transactions with us, our affiliates or others |
| • | | A software program on our website, often referred to as a “cookie,” which indicates which parts of our site you’ve visited |
| • | | When you set up challenge questions to reset your password online |
If you visit oppenheimerfunds.com and do not log on to the secure account information areas, we do not obtain any personal information about you. When you do log on to a secure area, we do obtain your user ID and password to identify you. We also use this information to provide you with products and services you have requested, to inform you about products and services that you may be interested in and assist you in other ways.
We do not collect personal information through our website unless you willingly provide it to us, either directly by email or in those areas of the website that request information. In order to update your personal information (including your mailing address, email address and phone number) you must first log on and visit your user profile.
If you have set your browser to warn you before accepting cookies, you will receive the warning message with each cookie. You can refuse cookies by turning them off in your browser. However, doing so may limit your access to certain sections of our website.
We use cookies to help us improve and manage our website. For example, cookies help us recognize new versus repeat visitors to the site, track the pages visited, and enable some special features on the website. This data helps us provide a better service for our website visitors.
Protection of Information
We do not disclose any non-public personal information (such as names on a customer list) about current or former customers to anyone, except as permitted by law.
Disclosure of Information
Copies of confirmations, account statements and other documents reporting activity in your fund accounts are made available to your financial advisor (as designated by you). We may also use details about you and your investments to help us, our financial service affiliates, or firms that jointly market their financial products and services with ours, to better serve your investment needs or suggest financial services or educational material that may be of interest to you. If this requires us to provide you with an opportunity to “opt in” or “opt out” of such information sharing with a firm not affiliated with us, you will receive notification on how to do so, before any such sharing takes place.
Right of Refusal
We will not disclose your personal information to unaffiliated third parties (except as permitted by law), unless we first offer you a reasonable opportunity to refuse or “opt out” of such disclosure.
| | |
| 81 | | OPPENHEIMER FLEXIBLE STRATEGIES FUND |
PRIVACY POLICY NOTICE Continued
Internet Security and Encryption
In general, the email services provided by our website are encrypted and provide a secure and private means of communication with us. To protect your own privacy, confidential and/or personal information should only be communicated via email when you are advised that you are using a secure website. As a security measure, we do not include personal or account information in non-secure emails, and we advise you not to send such information to us in non-secure emails. Instead, you may take advantage of the secure features of our website to encrypt your email correspondence. To do this, you will need to use a browser that supports Secure Sockets Layer (SSL) protocol.
We do not guarantee or warrant that any part of our website, including files available for download, are free of viruses or other harmful code. It is your responsibility to take appropriate precautions, such as use of an anti-virus software package, to protect your computer hardware and software.
| • | | All transactions, including redemptions, exchanges and purchases, are secured by SSL and 128-bit encryption. SSL is used to establish a secure connection between your PC and OppenheimerFunds’ server. It transmits information in an encrypted and scrambled format. |
| • | | Encryption is achieved through an electronic scrambling technology that uses a “key” to code and then decode the data. Encryption acts like the cable converter box you may have on your television set. It scrambles data with a secret code so that no one can make sense of it while it is being transmitted. When the data reaches its destination, the same software unscrambles the data. |
| • | | You can exit the secure area by either closing your browser, or for added security, you can use the Log Out button before you close your browser. |
Other Security Measures
We maintain physical, electronic and procedural safeguards to protect your personal account information. Our employees and agents have access to that information only so that they may offer you products or provide services, for example, when responding to your account questions.
How You Can Help
You can also do your part to keep your account information private and to prevent unauthorized transactions. If you obtain a user ID and password for your account, do not allow it to be used by anyone else. Also, take special precautions when accessing your account on a computer used by others.
Who We Are
This joint notice describes the privacy policies of the Oppenheimer funds, OppenheimerFunds, Inc., each of its investment adviser subsidiaries, OppenheimerFunds Distributor, Inc. and OFI Global Trust Co. It applies to all Oppenheimer fund accounts you presently have, or may open in the future, using your Social Security number—whether or not you remain a shareholder of our funds. This notice was last updated November 2014. In the event it is updated or changed, we will post an updated notice on our website at oppenheimerfunds.com. If you have any questions about this privacy policy, write to us at P.O. Box 5270, Denver, CO 80217-5270, email us by clicking on the Contact Us section of our website at oppenheimerfunds.com or call us at 1.800.CALL OPP (225.5677).
| | |
| 82 | | OPPENHEIMER FLEXIBLE STRATEGIES FUND |
THIS PAGE INTENTIONALLY LEFT BLANK.
| | |
| 83 | | OPPENHEIMER FLEXIBLE STRATEGIES FUND |
THIS PAGE INTENTIONALLY LEFT BLANK.
| | |
| 84 | | OPPENHEIMER FLEXIBLE STRATEGIES FUND |
THIS PAGE INTENTIONALLY LEFT BLANK.
| | |
| 85 | | OPPENHEIMER FLEXIBLE STRATEGIES FUND |
THIS PAGE INTENTIONALLY LEFT BLANK.
| | |
| 86 | | OPPENHEIMER FLEXIBLE STRATEGIES FUND |
THIS PAGE INTENTIONALLY LEFT BLANK.
| | |
| 87 | | OPPENHEIMER FLEXIBLE STRATEGIES FUND |
| | |

The Right Way to Invest | | |
| |
A Better Website for Investors We redesigned the OppenheimerFunds investor site to help you find the information and services you need—quickly. Visit oppenheimerfunds.com/investors to see how well the new site will work for you. You can also visit our website for 24-hour access to account information and transactions or call us at 800 CALL OPP (225 5677) for 24-hour automated information and automated transactions. Representatives are also available Mon–Fri 8am–8pm ET. | | |
Visit Us
oppenheimerfunds.com
Call Us
800 225 5677
| | |

| | Oppenheimer funds are distributed by OppenheimerFunds Distributor, Inc. 225 Liberty Street, New York, NY 10281-1008 © 2014 OppenheimerFunds Distributor, Inc. All rights reserved. RA0236.001.1014 December 22, 2014 |
| |
| |
| |
Table of Contents
Class A Shares
AVERAGE ANNUAL TOTAL RETURNS AT 10/31/14
| | | | | | | | | | | | | | | | | | | | |
| | | Class A Shares of the Fund | | | | | | | | | | |
| | | Without Sales
Charge | | | With Sales
Charge | | | Russell 2000
Index | | | Russell 2500
Index | | | Russell 2500
Value Index | |
1-Year | | | 10.91 | % | | | 4.53 | % | | | 8.06 | % | | | 10.23 | % | | | 10.23 | % |
5-Year | | | 14.21 | | | | 12.86 | | | | 17.39 | | | | 18.40 | | | | 17.63 | |
10-Year | | | 7.88 | | | | 7.24 | | | | 8.67 | | | | 9.68 | | | | 8.93 | |
Performance data quoted represents past performance, which does not guarantee future results. The investment return and principal value of an investment in the Fund will fluctuate so that an investor’s shares, when redeemed, may be worth more or less than their original cost. Fund returns include changes in share price, reinvested distributions, and a 5.75% maximum applicable sales charge except where “without sales charge” is indicated. Current performance may be lower or higher than the performance quoted. Returns do not consider capital gains or income taxes on an individual’s investment. For performance data current to the most recent month-end, visit oppenheimerfunds.com or call 1.800.CALL OPP (225.5677).
2 OPPENHEIMER SMALL- & MID- CAP VALUE FUND
Fund Performance Discussion
The Fund’s Class A shares (without sales charge) produced a total return of 10.91% during the reporting period, outperforming the Russell 2500 Value Index (the “Index”), which returned 10.23% during the same period. The Fund’s outperformance versus the Index stemmed primarily from stronger relative stock selection in the industrials, financials and materials sectors, along with an overweight position and stock selection in health care. The Fund underperformed the Index in the consumer discretionary sector due to less favorable stock selection, and in the consumer staples sector as a result of weaker relative stock selection and an overweight position.
MARKET OVERVIEW
Equity markets were choppy for the one-year reporting period ended October 31, 2014. U.S. equities generally ended the reporting period with positive returns, and outperformed foreign equities, including European and emerging market equities. At the outset of the reporting period, U.S. stocks generally rallied as central banks throughout the world maintained their accommodative
policies. In the U.S., the Federal Reserve (“Fed”) maintained its open-ended quantitative easing program involving monthly bond purchases of $85 billion. In December 2013, the Fed announced for the first time that it would reduce its monthly purchases by $10 billion effective the following month. This set the stage for the Fed’s much anticipated tapering of the program.
COMPARISON OF CHANGE IN VALUE OF $10,000 HYPOTHETICAL INVESTMENTS IN:
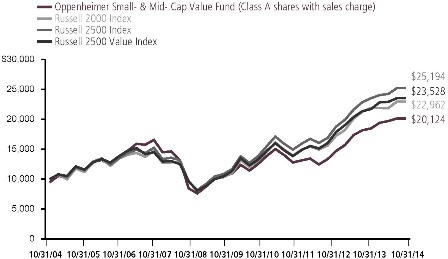
3 OPPENHEIMER SMALL- & MID- CAP VALUE FUND
To start 2014, U.S. equities fell amid fears that political and economic instability in the world’s emerging markets might further dampen the U.S. economic recovery. While these fears generally failed to materialize, economic activity was constrained by unusually harsh winter weather over much of the U.S., which caused downturns in consumer spending, corporate investment, and business inventory replenishment. Despite additional cuts in quantitative easing and signs of ongoing strength in U.S. labor markets, U.S. Gross Domestic Product (“GDP”) contracted at a surprising 2.1% annualized rate over the first quarter.
Equity markets in the U.S. then rebounded as economic data released in the second quarter was positive, with the economy finally regaining all of the jobs lost during the 2008 recession, and the U.S. stock market achieving record highs. The U.S. Department of Commerce later announced that U.S. GDP rebounded at a robust 4.6% annualized rate during the second quarter. Markets were also buoyed by additional stimulative monetary policies enacted by central banks throughout the world, including the European Central Bank (the “ECB”).
The upward march of U.S. equity prices then paused in the third quarter of 2014, with large capitalization stocks mostly moving sideways, mid-capitalization stocks declining modestly, and small-capitalization stocks falling significantly. Smaller capitalization stocks generally exhibit greater sensitivity to the domestic economy and as the noise
around expected Fed tightening got louder, the market worried that a slowing in domestic growth would negatively impact these stocks. Other macroeconomic concerns over the third quarter included geopolitical tensions in Ukraine and the Middle East, and falling oil prices. However, domestic equity markets rallied again in the closing weeks of the reporting period, eliminating the losses experienced over the third quarter. In addition, the reporting period ended with the U.S. Department of Commerce announcing that U.S. GDP grew at an estimated 3.5% over the third quarter of 2014. That figure was later revised to 3.9%.
FUND REVIEW
Top performing stocks for the Fund this reporting period included Delta Air Lines, Inc., Lazard Ltd. and Humana, Inc. Delta, the second largest airline in the U.S. by passenger volume, benefited from strong revenue growth in both the domestic market and in Latin America. In addition, the company benefited as management announced a new capital deployment plan that was well-received by investors. The plan includes raising targets for operating margin and return on invested capital, as well as a modest increase to dividend payments and a significantly larger share repurchase program. As a result of this announcement, many analysts raised their estimates, providing the tailwind for share price gains. Lazard is a boutique investment bank focused on mergers and acquisitions (M&A), restructuring, and asset management. The company continued to report strong revenue
4 OPPENHEIMER SMALL- & MID- CAP VALUE FUND
and earnings results, driven primarily by strong advisory revenue as the global recovery in M&A continues. We believe Lazard is well-positioned to gain market share as M&A volumes increase. Humana, a health insurer, had a strong reporting period. Concerns emerged when federal regulators unveiled proposed cuts to reimbursements for insurers operating private Medicare health plans in 2015. However, shares of Humana rallied after it was determined that cuts would be less than anticipated. Later in the reporting period, Humana also announced a $2 billion share buyback program, which boosted its performance.
Detractors from performance this reporting period included NCR Corp., Noble Corp. and GameStop Corp. NCR makes financial transaction machines and software. NCR declined during the fourth quarter of 2013 as the firm announced disappointing revenue growth. The market also reacted negatively to NCR’s announced acquisition of Digital Insight, a leading provider of customer-facing digital banking software, due to concerns over the size of the premium that NCR paid. We exited our position in NCR during the reporting period. Noble is a provider of deepwater oil and gas contract drilling services. The stock was hurt by falling oil prices during the reporting period. Shares of GameStop, a retailer of video games and computer entertainment software, fell sharply in January after management lowered earnings guidance. This guidance stemmed from an unfavorable change in the sales mix, with a strong increase in lower margin
hardware displacing sales of higher margin software. Subsequent to the end of the reporting period, we exited our position in GameStop.
STRATEGY & OUTLOOK
We remain optimistic about the U.S. economy and believe that, although there may be bumps along the road, the U.S. is on a path to sustainable recovery. As part of that view, we believe investment back into growth opportunities has the potential to benefit companies in the industrials sector focused on non-residential construction and housing. In addition, innovation and cyclical improvements have the potential to positively impact information technology; and we believe attractive investment opportunities exist within health care. Conversely, we remain less sanguine about the outlook for materials. Risk factors have increased recently around global growth – particularly in emerging economies but also now in certain developed economies – where we believe at period end that markets are in the process of adjusting expectations. In that light, we remain cautious about the longer term outlook for stocks with similar characteristics to bonds, such as real estate investment trusts (REITs) and those in the utilities sector, but believe a balanced approach is required. Though they have performed well recently, these stocks have historically reacted negatively to rises in interest rates which are at historically low levels. Management behavior towards the use of free cash flow continues to guide our investment decisions, and our search for
5 OPPENHEIMER SMALL- & MID- CAP VALUE FUND
companies poised for an unanticipated acceleration in return on invested capital is our constant imperative.
While many investors focus on a short-term view when considering potential investments, the Fund utilizes in-depth fundamental research to identify companies that we believe are poised for an unanticipated acceleration in return on invested capital over
| | | | |
 | | 
Laton Spahr, CFA Portfolio Manager | | |
a multi-year time horizon. We believe this longer-term approach provides a more comprehensive outlook of potential investments by focusing on all three financial statements – income statement, balance sheet and statement of cash flows – and aids in finding companies whose generation and use of free cash flow we deem as yet to be fully reflected in the current stock price.
| | | | |
 | | 
Eric Hewitt Portfolio Manager | | |
6 OPPENHEIMER SMALL- & MID- CAP VALUE FUND
Top Holdings and Allocations
TOP TEN COMMON STOCK HOLDINGS
| | | | |
Eaton Corp. plc | | | 2.2 | % |
Lennar Corp., Cl. A | | | 2.1 | |
Oshkosh Corp. | | | 2.0 | |
Lazard Ltd., Cl. A | | | 1.9 | |
Newell Rubbermaid, Inc. | | | 1.9 | |
Reinsurance Group of America, Inc., Cl. A | | | 1.9 | |
Invesco Ltd. | | | 1.9 | |
HD Supply Holdings, Inc. | | | 1.7 | |
Deluxe Corp. | | | 1.6 | |
Lorillard, Inc. | | | 1.6 | |
Portfolio holdings and allocations are subject to change. Percentages are as of October 31, 2014, and are based on net assets. For more current Fund holdings, please visit oppenheimerfunds.com.
TOP TEN COMMON STOCK INDUSTRIES
| | | | |
Commercial Banks | | | 7.8 | % |
Insurance | | | 6.4 | |
Real Estate Investment Trusts (REITs) | | | 6.1 | |
Capital Markets | | | 5.9 | |
Household Durables | | | 4.6 | |
Health Care Equipment & Supplies | | | 4.5 | |
Machinery | | | 4.3 | |
Oil, Gas & Consumable Fuels | | | 3.5 | |
Media | | | 3.4 | |
Electrical Equipment | | | 3.0 | |
Portfolio holdings and allocations are subject to change. Percentages are as of October 31, 2014, and are based on net assets.
SECTOR ALLOCATION
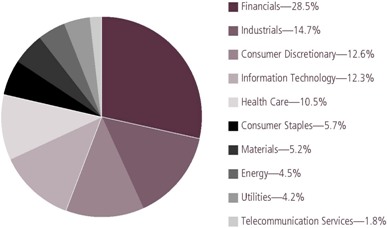
Portfolio holdings and allocations are subject to change. Percentages are as of October 31, 2014, and are based on the total market value of common stocks.
7 OPPENHEIMER SMALL- & MID- CAP VALUE FUND
Share Class Performance
AVERAGE ANNUAL TOTAL RETURNS WITHOUT SALES CHARGE AS OF 10/31/14
| | | | | | | | | | |
| | | Inception Date | | 1-Year | | 5-Year | | 10-Year | | |
Class A (QVSCX) | | 1/3/89 | | 10.91% | | 14.21% | | 7.88% | | |
Class B (QSCBX) | | 9/1/93 | | 10.03% | | 13.28% | | 7.36% | | |
Class C (QSCCX) | | 9/1/93 | | 10.05% | | 13.32% | | 7.05% | | |
Class I (QSCIX) | | 2/28/12 | | 11.36% | | 15.70%* | | N/A | | |
Class R (QSCNX) | | 3/1/01 | | 10.61% | | 13.90% | | 7.56% | | |
Class Y (QSCYX) | | 10/24/05 | | 11.30% | | 14.57% | | 6.69%* | | |
AVERAGE ANNUAL TOTAL RETURNS WITH SALES CHARGE AS OF 10/31/14
| | | | | | | | | | |
| | | Inception Date | | 1-Year | | 5-Year | | 10-Year | | |
Class A (QVSCX) | | 1/3/89 | | 4.53% | | 12.86% | | 7.24% | | |
Class B (QSCBX) | | 9/1/93 | | 5.03% | | 13.04% | | 7.36% | | |
Class C (QSCCX) | | 9/1/93 | | 9.05% | | 13.32% | | 7.05% | | |
Class I (QSCIX) | | 2/28/12 | | 11.36% | | 15.70%* | | N/A | | |
Class R (QSCNX) | | 3/1/01 | | 9.61% | | 13.90% | | 7.56% | | |
Class Y (QSCYX) | | 10/24/05 | | 11.30% | | 14.57% | | 6.69%* | | |
*Shows performance since inception
Performance data quoted represents past performance, which does not guarantee future results. The investment return and principal value of an investment in the Fund will fluctuate so that an investor’s shares, when redeemed, may be worth more or less than their original cost. Current performance may be lower or higher than the performance quoted. Returns do not consider capital gains or income taxes on an individual’s investment. For performance data current to the most recent month-end, visit oppenheimerfunds.com or call 1.800.CALL OPP (225.5677). Fund returns include changes in share price, reinvested distributions, and the applicable sales charge: for Class A shares, the current maximum initial sales charge of 5.75%; for Class B shares, the contingent deferred sales charge of 5% (1-year) and 2% (5-year); and for Class C shares, the contingent deferred sales charge (“CDSC”) of 1% for the 1-year period. Prior to 7/1/14, Class R shares were named Class N shares. Beginning 7/1/14, new purchases of Class R shares will no longer be subject to a CDSC upon redemption (any CDSC will remain in effect for purchases prior to 7/1/14). There is no sales charge for Class I and Class Y shares. Because Class B shares convert to Class A shares 72 months after purchase, the 10-year return for Class B shares uses Class A performance for the period after conversion.
The Fund’s performance is compared to that of the Russell 2000 Index, the Russell 2500 Index and the Russell 2500 Value Index. The Russell 2000 Index is an unmanaged index of small-capitalization stocks. The Russell 2500 Index measures the performance of the small to mid-cap segment of the U.S. equity universe, commonly referred to as “smid” cap. The Russell 2500 Value Index measures the performance of the small to mid-cap value segment of the U.S. equity universe. It includes those Russell 2500 Index companies with lower price-to-book ratios and lower forecasted growth values. The indices are unmanaged and cannot be purchased directly by investors. While index comparisons may be useful to provide a benchmark for the Fund’s performance, it must be noted that the Fund’s investments are not
8 OPPENHEIMER SMALL- & MID- CAP VALUE FUND
limited to the investments comprising the indices. Index performance includes reinvestment of income, but does not reflect transaction costs, fees, expenses or taxes. Index performance is shown for illustrative purposes only as a benchmark for the Fund’s performance, and does not predict or depict performance of the Fund. The Fund’s performance reflects the effects of the Fund’s business and operating expenses.
The Fund’s investment strategy and focus can change over time. The mention of specific fund holdings does not constitute a recommendation by OppenheimerFunds, Inc. or its affiliates.
Before investing in any of the Oppenheimer funds, investors should carefully consider a fund’s investment objectives, risks, charges and expenses. Fund prospectuses and summary prospectuses contain this and other information about the funds, and may be obtained by asking your financial advisor, visiting oppenheimerfunds.com, or calling 1.800.CALL OPP (225.5677). Read prospectuses and summary prospectuses carefully before investing.
Shares of Oppenheimer funds are not deposits or obligations of any bank, are not guaranteed by any bank, are not insured by the FDIC or any other agency, and involve investment risks, including the possible loss of the principal amount invested.
9 OPPENHEIMER SMALL- & MID- CAP VALUE FUND
Fund Expenses
Fund Expenses. As a shareholder of the Fund, you incur two types of costs: (1) transaction costs, which may include sales charges (loads) on purchase payments, contingent deferred sales charges on redemptions; and (2) ongoing costs, including management fees; distribution and service fees; and other Fund expenses. These examples are intended to help you understand your ongoing costs (in dollars) of investing in the Fund and to compare these costs with the ongoing costs of investing in other mutual funds.
The examples are based on an investment of $1,000.00 invested at the beginning of the period and held for the entire 6-month period ended October 31, 2014.
Actual Expenses. The first section of the table provides information about actual account values and actual expenses. You may use the information in this section for the class of shares you hold, together with the amount you invested, to estimate the expense that you paid over the period. Simply divide your account value by $1,000.00 (for example, an $8,600.00 account value divided by $1,000.00 = 8.60), then multiply the result by the number in the first section under the heading entitled “Expenses Paid During 6 Months Ended October 31, 2014” to estimate the expenses you paid on your account during this period.
Hypothetical Example for Comparison Purposes. The second section of the table provides information about hypothetical account values and hypothetical expenses based on the Fund’s actual expense ratio for each class of shares, and an assumed rate of return of 5% per year for each class before expenses, which is not the Fund’s actual return. The hypothetical account values and expenses may not be used to estimate the actual ending account balance or expenses you paid for the period. You may use this information to compare the ongoing costs of investing in the Fund and other funds. To do so, compare this 5% hypothetical example for the class of shares you hold with the 5% hypothetical examples that appear in the shareholder reports of the other funds.
Please note that the expenses shown in the table are meant to highlight your ongoing costs only and do not reflect any transactional costs, such as front-end or contingent deferred sales charges (loads). Therefore, the “hypothetical” section of the table is useful in comparing ongoing costs only, and will not help you determine the relative total costs of owning different funds. In addition, if these transactional costs were included, your costs would have been higher.
10 OPPENHEIMER SMALL- & MID- CAP VALUE FUND
| | | | | | | | | | | | | | | | | | |
| Actual | | Beginning Account Value May 1, 2014 | | Ending Account Value
October 31, 2014 | | Expenses Paid During 6 Months Ended October 31, 2014 |
Class A | | $ | 1,000.00 | | | | | $ | 1,037.10 | | | | | $ | 6.02 | | | |
Class B | | | 1,000.00 | | | | | | 1,033.10 | | | | | | 9.94 | | | |
Class C | | | 1,000.00 | | | | | | 1,033.00 | | | | | | 9.94 | | | |
Class I | | | 1,000.00 | | | | | | 1,039.30 | | | | | | 3.91 | | | |
Class R | | | 1,000.00 | | | | | | 1,035.60 | | | | | | 7.31 | | | |
Class Y | | | 1,000.00 | | | | | | 1,038.50 | | | | | | 4.58 | | | |
| | | | | | |
| Hypothetical | | | | | | | | | | | | | | | | | | |
(5% return before expenses) | | | | | | | | | | | | | | | | | | |
Class A | | | 1,000.00 | | | | | | 1,019.31 | | | | | | 5.97 | | | |
Class B | | | 1,000.00 | | | | | | 1,015.48 | | | | | | 9.85 | | | |
Class C | | | 1,000.00 | | | | | | 1,015.48 | | | | | | 9.85 | | | |
Class I | | | 1,000.00 | | | | | | 1,021.37 | | | | | | 3.88 | | | |
Class R | | | 1,000.00 | | | | | | 1,018.05 | | | | | | 7.25 | | | |
Class Y | | | 1,000.00 | | | | | | 1,020.72 | | | | | | 4.54 | | | |
Expenses are equal to the Fund’s annualized expense ratio for that class, multiplied by the average account value over the period, multiplied by 184/365 (to reflect the one-half year period). Those annualized expense ratios, excluding indirect expenses from affiliated funds, based on the 6-month period ended October 31, 2014 are as follows:
| | | | | | |
| Class | | Expense Ratios | | | |
Class A | | | 1.17 | % | | |
Class B | | | 1.93 | | | |
Class C | | | 1.93 | | | |
Class I | | | 0.76 | | | |
Class R | | | 1.42 | | | |
Class Y | | | 0.89 | | | |
The expense ratios reflect voluntary and/or contractual waivers and/or reimbursements of expenses by the Fund’s Manager and Transfer Agent. Some of these undertakings may be modified or terminated at any time, as indicated in the Fund’s prospectus. The “Financial Highlights” tables in the Fund’s financial statements, included in this report, also show the gross expense ratios, without such waivers or reimbursements and reduction to custodian expenses, if applicable.
11 OPPENHEIMER SMALL- & MID- CAP VALUE FUND
| | |
| |
| STATEMENT OF INVESTMENTS October 31, 2014 | | |
| | | | | | | | |
| | | Shares | | | Value | |
Common Stocks—99.4% | |
Consumer Discretionary—12.5% | |
Auto Components—1.3% | |
BorgWarner, Inc. | | | 373,720 | | | $ | 21,309,514 | |
Diversified Consumer Services—0.8% | |
Apollo Education Group, Inc.1 | | | 465,550 | | | | 13,342,663 | |
Household Durables—4.6% | |
Lennar Corp., Cl. A | | | 762,450 | | | | 32,846,346 | |
Newell Rubbermaid, Inc. | | | 922,730 | | | | 30,754,591 | |
PulteGroup, Inc. | | | 540,240 | | | | 10,367,206 | |
| | | | | | | 73,968,143 | |
| | |
| | | | | | | | | |
Media—3.4% | |
Cinemark Holdings, Inc. | | | 239,870 | | | | 8,472,208 | |
DISH Network Corp., Cl. A1 | | | 233,920 | | | | 14,889,008 | |
Gannett Co., Inc. | | | 584,440 | | | | 18,409,860 | |
National CineMedia, Inc. | | | 573,413 | | | | 9,117,267 | |
Regal Entertainment Group, Cl. A | | | 141,940 | | | | 3,143,971 | |
| | | | | | | 54,032,314 | |
| | |
| | | | | | | | | |
Multiline Retail—0.9% | |
Kohl’s Corp. | | | 148,950 | | | | 8,076,069 | |
Macy’s, Inc. | | | 105,710 | | | | 6,112,152 | |
| | | | | | | 14,188,221 | |
| | |
| | | | | | | | | |
Specialty Retail—1.5% | |
GameStop Corp., Cl. A | | | 122,092 | | | | 5,220,654 | |
Ross Stores, Inc. | | | 124,290 | | | | 10,032,689 | |
Staples, Inc. | | | 610,450 | | | | 7,740,506 | |
| | | | | | | 22,993,849 | |
| | |
| | | | | | | | | |
Consumer Staples—5.7% | |
Beverages—0.8% | |
Molson Coors Brewing Co. | | | 181,780 | | | | 13,520,796 | |
Food & Staples Retailing—0.9% | |
Rite Aid Corp.1 | | | 2,603,898 | | | | 13,670,465 | |
Food Products—1.2% | |
B&G Foods, Inc. | | | 659,255 | | | | 19,421,652 | |
| | | | | | | | | | |
| | | | | Shares | | | Value | |
| | | Household Products—1.2% | |
| | | Energizer Holdings, Inc. | | | 153,991 | | | $ | 18,886,996 | |
| | | Tobacco—1.6% | |
| | | Lorillard, Inc. | | | 419,964 | | | | 25,827,786 | |
| | | Energy—4.5% | |
| | | Energy Equipment & Services—1.0% | |
| | | Diamond Offshore Drilling, Inc. | | | 142,650 | | | | 5,379,331 | |
| | | Noble Corp. plc | | | 230,640 | | | | 4,824,989 | |
| | | Oceaneering International, Inc. | | | 91,875 | | | | 6,456,056 | |
| | | | | | | | | | 16,660,376 | |
| | | | |
| | | | | | | | | | | |
| | | Oil, Gas & Consumable Fuels—3.5% | |
| | | Cimarex Energy Co. | | | 97,750 | | | | 11,111,243 | |
| | | EQT Corp. | | | 118,570 | | | | 11,150,323 | |
| | | HollyFrontier Corp. | | | 117,300 | | | | 5,323,074 | |
| | | Kodiak Oil & Gas Corp.1 | | | 627,390 | | | | 6,769,538 | |
| | | Tesoro Corp. | | | 131,330 | | | | 9,378,275 | |
| | | Whiting Petroleum Corp.1 | | | 186,600 | | | | 11,427,384 | |
| | | | | | | | | | 55,159,837 | |
| | | | |
| | | | | | | | | | | |
| | | Financials—28.4% | |
| | | Capital Markets—5.9% | |
| | | Ares Management LP | | | 573,152 | | | | 9,101,654 | |
| | | Invesco Ltd. | | | 748,524 | | | | 30,292,766 | |
| | | Lazard Ltd., Cl. A | | | 632,076 | | | | 31,104,460 | |
| | | Raymond James Financial, Inc. | | | 416,030 | | | | 23,351,764 | |
| | | | | | | | | | 93,850,644 | |
| | | | |
| | | | | | | | | | | |
| | | Commercial Banks—7.8% | |
| | | Associated Banc-Corp. | | | 1,154,620 | | | | 21,706,856 | |
| | | Boston Private Financial Holdings, Inc. | | | 764,090 | | | | 10,047,784 | |
| | | East West Bancorp, Inc. | | | 366,760 | | | | 13,482,098 | |
| | | First NBC Bank Holding Co.1 | | | 391,190 | | | | 14,368,409 | |
| | | Huntington Bancshares, Inc. | | | 1,866,840 | | | | 18,500,384 | |
| | | KeyCorp | | | 1,250,380 | | | | 16,505,016 | |
| | | SunTrust Banks, Inc. | | | 349,060 | | | | 13,662,208 | |
| | | | | | | | | | |
| | | | | | | | | | |
| | | | | | | | | | |
12 OPPENHEIMER SMALL- & MID- CAP VALUE FUND
| | | | | | | | |
| | | Shares | | | Value | |
Commercial Banks (Continued) | |
Zions Bancorporation | | | 544,857 | | | $ | 15,784,507 | |
| | | | | | | 124,057,262 | |
| | |
| | | | | | | | | |
Consumer Finance—2.2% | |
Navient Corp. | | | 1,300,293 | | | | 25,719,795 | |
Synchrony Financial1 | | | 345,000 | | | | 9,321,900 | |
| | | | | | | 35,041,695 | |
| | |
| | | | | | | | | |
Insurance—6.4% | |
Everest Re Group Ltd. | | | 30,550 | | | | 5,213,358 | |
FNF Group | | | 112,731 | | | | 3,363,893 | |
Genworth Financial, Inc., Cl. A1 | | | 231,170 | | | | 3,234,068 | |
Lincoln National Corp. | | | 251,790 | | | | 13,788,020 | |
Reinsurance Group of America, Inc., Cl. A | | | 364,630 | | | | 30,720,078 | |
Unum Group | | | 715,420 | | | | 23,937,953 | |
Validus Holdings Ltd. | | | 551,160 | | | | 21,925,145 | |
| | | | | | | 102,182,515 | |
| | |
| | | | | | | | | |
Real Estate Investment Trusts (REITs)—6.1% | |
Alexandria Real Estate Equities, Inc. | | | 123,890 | | | | 10,282,870 | |
Apartment Investment & Management Co., Cl. A | | | 273,510 | | | | 9,788,923 | |
Aviv REIT, Inc. | | | 182,920 | | | | 6,169,892 | |
Camden Property Trust | | | 124,660 | | | | 9,557,682 | |
CubeSmart | | | 665,410 | | | | 14,006,881 | |
Equity LifeStyle Properties, Inc. | | | 199,120 | | | | 9,776,792 | |
LaSalle Hotel Properties | | | 558,634 | | | | 21,904,039 | |
Omega Healthcare Investors, Inc. | | | 308,121 | | | | 11,757,897 | |
Retail Opportunity Investments Corp. | | | 309,057 | | | | 5,049,991 | |
| | | | | | | 98,294,967 | |
| | |
| | | | | | | | | |
Health Care—10.4% | |
Health Care Equipment & Supplies—4.5% | |
Boston Scientific Corp.1 | | | 913,467 | | | | 12,130,842 | |
Cooper Cos., Inc. (The) | | | 148,240 | | | | 24,296,536 | |
| | | | | | | | | | |
| | | | | Shares | | | Value | |
| | | Health Care Equipment & Supplies (Continued) | |
| | | Teleflex, Inc. | | | 205,727 | | | $ | 23,477,565 | |
| | | Zimmer Holdings, Inc. | | | 106,940 | | | | 11,896,006 | |
| | | | | | | | | | 71,800,949 | |
| | | | |
| | | | | | | | | | | |
| | | Health Care Providers & Services—2.6% | |
| | | Humana, Inc. | | | 162,980 | | | | 22,629,773 | |
| | | Omnicare, Inc. | | | 284,721 | | | | 18,959,571 | |
| | | | | | | | | | 41,589,344 | |
| | | | |
| | | | | | | | | | | |
| | | Health Care Technology—1.0% | |
| | | MedAssets, Inc.1 | | | 720,310 | | | | 15,601,915 | |
| | | | |
| | | | | | | | | | | |
| | | Life Sciences Tools & Services—1.4% | |
| | | Quintiles Transnational Holdings, Inc.1 | | | 397,161 | | | | 23,249,805 | |
| | | Pharmaceuticals—0.9% | |
| | | Hospira, Inc.1 | | | 262,030 | | | | 14,071,011 | |
| | | Industrials—14.6% | |
| | | Aerospace & Defense—1.5% | |
| | | L-3 Communications Holdings, Inc. | | | 134,370 | | | | 16,320,580 | |
| | | Raytheon Co. | | | 78,220 | | | | 8,125,494 | |
| | | | | | | | | | 24,446,074 | |
| | | | |
| | | | | | | | | | | |
| | | Airlines—2.1% | |
| | | Air Canada, Cl. B1 | | | 1,025,533 | | | | 8,574,481 | |
| | | Delta Air Lines, Inc. | | | 603,092 | | | | 24,262,391 | |
| | | | | | | | | | 32,836,872 | |
| | | | | | | | | | | |
| | | Commercial Services & Supplies—1.6% | |
| | | Deluxe Corp. | | | 426,410 | | | | 25,925,728 | |
| | | Electrical Equipment—3.0% | |
| | | Eaton Corp. plc | | | 511,760 | | | | 34,999,266 | |
| | | Hubbell, Inc., Cl. B | | | 119,970 | | | | 13,605,798 | |
| | | | | | | | | | 48,605,064 | |
| | | | | | | | | | | |
| | | Machinery—4.3% | |
| | | Oshkosh Corp. | | | 727,520 | | | | 32,563,795 | |
| | | Parker-Hannifin Corp. | | | 135,710 | | | | 17,239,241 | |
| | | Sun Hydraulics Corp. | | | 116,040 | | | | 4,619,553 | |
| | | Timken Co. (The) | | | 318,630 | | | | 13,697,904 | |
| | | | | | | | | | 68,120,493 | |
| | | | | | | | | | | |
| | | Professional Services—0.4% | |
| | | On Assignment, Inc.1 | | | 213,870 | | | | 6,223,617 | |
13 OPPENHEIMER SMALL- & MID- CAP VALUE FUND
| | |
| |
| STATEMENT OF INVESTMENTS Continued | | |
| | | | | | | | |
| | | Shares | | | Value | |
Trading Companies & Distributors—1.7% | |
HD Supply Holdings, Inc.1 | | | 940,170 | | | $ | 27,114,503 | |
Information Technology—12.3% | |
Electronic Equipment, Instruments, & Components—1.6% | |
Anixter International, Inc. | | | 96,309 | | | | 8,202,638 | |
Dolby Laboratories, Inc., Cl. A | | | 429,610 | | | | 18,009,251 | |
| | | | | | | 26,211,889 | |
| | |
| | | | | | | | | |
Internet Software & Services—1.5% | |
IAC/InterActiveCorp | | | 341,980 | | | | 23,148,626 | |
IT Services—1.6% | |
Sapient Corp.1 | | | 758,840 | | | | 13,143,109 | |
VeriFone Systems, Inc.1 | | | 311,550 | | | | 11,608,353 | |
| | | | | | | 24,751,462 | |
| | |
| | | | | | | | | |
Semiconductors & Semiconductor Equipment—3.0% | |
Microchip Technology, Inc. | | | 109,799 | | | | 4,733,435 | |
Semtech Corp.1 | | | 733,470 | | | | 18,615,469 | |
Skyworks Solutions, Inc. | | | 157,310 | | | | 9,161,734 | |
Spansion, Inc., Cl. A1 | | | 732,800 | | | | 15,081,024 | |
| | | | | | | 47,591,662 | |
| | |
| | | | | | | | | |
Software—2.8% | |
Check Point Software Technologies Ltd.1 | | | 54,230 | | | | 4,026,577 | |
Citrix Systems, Inc.1 | | | 316,260 | | | | 20,313,380 | |
Synopsys, Inc.1 | | | 511,850 | | | | 20,975,613 | |
| | | | | | | 45,315,570 | |
| | |
| | | | | | | | | |
Technology Hardware, Storage & Peripherals—1.8% | |
Seagate Technology plc | | | 128,280 | | | | 8,059,832 | |
Western Digital Corp. | | | 209,420 | | | | 20,600,646 | |
| | | | | | | 28,660,478 | |
| | |
| | | | | | | | | |
Materials—5.2% | |
Chemicals—1.9% | |
International Flavors & Fragrances, Inc. | | | 97,310 | | | | 9,648,286 | |
PPG Industries, Inc. | | | 69,400 | | | | 14,136,086 | |
| | | | | | | | | | |
| | | | | Shares | | | Value | |
| | Chemicals (Continued) | | | | | | | | |
| | Westlake Chemical Corp. | | | 98,010 | | | $ | 6,914,606 | |
| | | | | | | | | 30,698,978 | |
| | | |
| | | | | | | | | | |
| | Containers & Packaging—1.5% | |
| | Ball Corp. | | | 246,370 | | | | 15,873,619 | |
| | Rock-Tenn Co., Cl. A | | | 163,600 | | | | 8,368,140 | |
| | | | | | | | | 24,241,759 | |
| | | |
| | | | | | | | | | |
| | Metals & Mining—0.5% | |
| | Steel Dynamics, Inc. | | | 353,280 | | | | 8,128,973 | |
| | Paper & Forest Products—1.3% | |
| | Louisiana-Pacific Corp.1 | | | 1,386,730 | | | | 20,246,258 | |
| | Telecommunication Services—1.7% | |
| | Diversified Telecommunication Services—1.7% | |
| | Frontier Communications Corp. | | | 2,289,240 | | | | 14,971,630 | |
| | Windstream Holdings, Inc. | | | 1,225,440 | | | | 12,842,611 | |
| | | | | | | | | 27,814,241 | |
| | | |
| | | | | | | | | | |
| | Utilities—4.1% | |
| | Electric Utilities—1.1% | |
| | Entergy Corp. | | | 112,482 | | | | 9,450,738 | |
| | Portland General Electric Co. | | | 210,060 | | | | 7,648,284 | |
| | | | | | | | | 17,099,022 | |
| | | |
| | | | | | | | | | |
| | Gas Utilities—0.4% | |
| | Questar Corp. | | | 295,060 | | | | 7,113,897 | |
| | Multi-Utilities—2.6% | |
| | Alliant Energy Corp. | | | 145,550 | | | | 9,011,000 | |
| | Ameren Corp. | | | 375,730 | | | | 15,908,408 | |
| | Avista Corp. | | | 214,400 | | | | 7,600,480 | |
| | DTE Energy Co. | | | 114,380 | | | | 9,397,461 | |
| | | | | | | | | 41,917,349 | |
| | Total Common Stocks (Cost $1,306,038,473) | | | | | | | 1,588,935,234 | |
14 OPPENHEIMER SMALL- & MID- CAP VALUE FUND
| | | | | | | | |
| | | Shares | | | Value | |
| |
Investment Company—0.6% | | | | | | | | |
| |
Oppenheimer Institutional Money Market Fund, Cl. E, 0.08%2,3 (Cost $8,807,907) | | | 8,807,907 | | | $ | 8,807,907 | |
| |
Total Investments, at Value (Cost $1,314,846,380) | | | 100.0% | | | | 1,597,743,141 | |
| |
Net Other Assets (Liabilities) | | | 0.0 | | | | (21,497) | |
| | | | |
Net Assets | | | 100.0% | | | $ | 1,597,721,644 | |
| | | | |
Footnotes to Statement of Investments
1. Non-income producing security.
2. Is or was an affiliate, as defined in the Investment Company Act of 1940, as amended, at or during the period ended October 31, 2014, by virtue of the Fund owning at least 5% of the voting securities of the issuer or as a result of the Fund and the issuer having the same investment adviser. Transactions during the period in which the issuer was an affiliate are as follows:
| | | | | | | | | | | | | | | | |
| | | Shares
October 31, 2013 | | | Gross
Additions | | | Gross
Reductions | | | Shares
October 31, 2014 | |
Oppenheimer Institutional Money Market Fund, Cl. E | | | 28,250,948 | | | | 318,969,350 | | | | 338,412,391 | | | | 8,807,907 | |
| | | | |
| | | | | | | | | Value | | | Income | |
Oppenheimer Institutional Money Market Fund, Cl. E | | | | | | | | | | $ | 8,807,907 | | | $ | 13,319 | |
3. Rate shown is the 7-day yield as of October 31, 2014.
See accompanying Notes to Financial Statements.
15 OPPENHEIMER SMALL- & MID- CAP VALUE FUND
| | |
| |
| STATEMENT OF ASSETS AND LIABILITIES October 31, 2014 | | |
| | | | |
Assets | | | | |
Investments, at value—see accompanying statement of investments: | | | | |
Unaffiliated companies (cost $1,306,038,473) | | $ | 1,588,935,234 | |
Affiliated companies (cost $8,807,907) | | | 8,807,907 | |
| | | | |
| | | 1,597,743,141 | |
| |
Cash | | | 1,000,000 | |
| |
Receivables and other assets: | | | | |
Investments sold | | | 15,989,401 | |
Dividends | | | 772,001 | |
Shares of beneficial interest sold | | | 6,203 | |
Other | | | 188,778 | |
| | | | |
Total assets | | | 1,615,699,524 | |
| | | | |
| |
Liabilities | | | | |
Payables and other liabilities: | | | | |
Investments purchased | | | 14,925,240 | |
Shares of beneficial interest redeemed | | | 2,157,322 | |
Trustees’ compensation | | | 523,303 | |
Distribution and service plan fees | | | 333,266 | |
Shareholder communications | | | 12,622 | |
Other | | | 26,127 | |
| | | | |
Total liabilities | | | 17,977,880 | |
|
| |
Net Assets | | $ | 1,597,721,644 | |
| | | | |
|
| |
Composition of Net Assets | | | | |
Par value of shares of beneficial interest | | $ | 355,525 | |
| |
Additional paid-in capital | | | 1,547,026,492 | |
| |
Accumulated net investment income | | | 1,110,338 | |
| |
Accumulated net realized loss on investments | | | (233,667,472 | ) |
| |
Net unrealized appreciation on investments | | | 282,896,761 | |
| | | | |
Net Assets | | $ | 1,597,721,644 | |
| | | | |
16 OPPENHEIMER SMALL- & MID- CAP VALUE FUND
| | | | |
| |
Net Asset Value Per Share | | | | |
Class A Shares: | | | | |
| |
| Net asset value and redemption price per share (based on net assets of $1,104,252,440 and 23,633,441 shares of beneficial interest outstanding) | | | $46.72 | |
| Maximum offering price per share (net asset value plus sales charge of 5.75% of offering price) | | | $49.57 | |
| |
| |
Class B Shares: | | | | |
| |
| Net asset value, redemption price (excludes applicable contingent deferred sales charge) and offering price per share (based on net assets of $37,091,594 and 943,936 shares of beneficial interest outstanding) | | | $39.29 | |
| |
| |
Class C Shares: | | | | |
| |
| Net asset value, redemption price (excludes applicable contingent deferred sales charge) and offering price per share (based on net assets of $279,924,938 and 7,114,203 shares of beneficial interest outstanding) | | | $39.35 | |
| |
| |
Class I Shares: | | | | |
| |
| Net asset value, redemption price and offering price per share (based on net assets of $426,606 and 8,983 shares of beneficial interest outstanding) | | | $47.49 | |
| |
| |
Class R Shares: | | | | |
| |
| Net asset value, redemption price (excludes applicable contingent deferred sales charge) and offering price per share (based on net assets of $125,703,216 and 2,800,967 shares of beneficial interest outstanding) | | | $44.88 | |
| |
| |
Class Y Shares: | | | | |
| |
| Net asset value, redemption price and offering price per share (based on net assets of $50,322,850 and 1,050,933 shares of beneficial interest outstanding) | | | $47.88 | |
See accompanying Notes to Financial Statements.
17 OPPENHEIMER SMALL- & MID- CAP VALUE FUND
STATEMENT OF OPERATIONS For the Year Ended October 31, 2014
| | | | |
| | |
Investment Income | | | | |
Dividends: | | | | |
Unaffiliated companies (net of foreign withholding taxes of $75,487) | | $ | 32,763,002 | |
Affiliated companies | | | 13,319 | |
| |
Interest | | | 298 | |
| | | | |
Total investment income | | | 32,776,619 | |
| | | | |
| | |
Expenses | | | | |
Management fees | | | 11,411,265 | |
| |
Distribution and service plan fees: | | | | |
Class A | | | 2,838,675 | |
Class B | | | 440,188 | |
Class C | | | 2,842,962 | |
Class R1 | | | 649,852 | |
| |
Transfer and shareholder servicing agent fees: | | | | |
Class A | | | 2,655,795 | |
Class B | | | 134,599 | |
Class C | | | 643,773 | |
Class I | | | 54 | |
Class R1 | | | 315,758 | |
Class Y | | | 71,824 | |
| |
Shareholder communications: | | | | |
Class A | | | 22,016 | |
Class B | | | 654 | |
Class C | | | 5,824 | |
Class I | | | 46 | |
Class R1 | | | 241 | |
Class Y | | | 107 | |
| |
Trustees’ compensation | | | 36,368 | |
| |
Custodian fees and expenses | | | 9,737 | |
| |
Other | | | 153,799 | |
| | | | |
Total expenses | | | 22,233,537 | |
Less waivers and reimbursements of expenses | | | (85,671) | |
| | | | |
Net expenses | | | 22,147,866 | |
| |
Net Investment Income | | | 10,628,753 | |
| |
Realized and Unrealized Gain | | | | |
Net realized gain on investments from unaffiliated companies | | | 143,033,274 | |
| |
Net change in unrealized appreciation/depreciation on investments | | | 14,924,621 | |
| |
Net Increase in Net Assets Resulting from Operations | | $ | 168,586,648 | |
| | | | |
1. Effective July 1, 2014, Class N shares were renamed Class R. See Note 1 of the accompanying Notes.
See accompanying Notes to Financial Statements.
18 OPPENHEIMER SMALL- & MID- CAP VALUE FUND
STATEMENTS OF CHANGES IN NET ASSETS
| | | | | | | | |
| | | Year Ended
October 31, 2014 | | | Year Ended
October 31, 2013 | |
Operations | | | | | | | | |
Net investment income | | $ | 10,628,753 | | | $ | 7,137,698 | |
| |
Net realized gain | | | 143,033,274 | | | | 369,113,955 | |
| |
Net change in unrealized appreciation/depreciation | | | 14,924,621 | | | | 78,759,113 | |
| | | | | | | | |
Net increase in net assets resulting from operations | | | 168,586,648 | | | | 455,010,766 | |
| | | | | | | | |
Dividends and/or Distributions to Shareholders | | | | | | | | |
Dividends from net investment income: | | | | | | | | |
Class A | | | (13,504,460) | | | | (840,861) | |
Class B | | | (39,242) | | | | — | |
Class C | | | (661,974) | | | | — | |
Class I | | | (2,835) | | | | — | |
Class R1 | | | (938,463) | | | | — | |
Class Y | | | (917,484) | | | | (235,182) | |
| | | | | | | | |
| | | (16,064,458) | | | | (1,076,043) | |
| | | | | | | | |
Beneficial Interest Transactions | | | | | | | | |
Net increase (decrease) in net assets resulting from beneficial interest transactions: | | | | | | | | |
Class A | | | (163,106,871) | | | | (84,634,225) | |
Class B | | | (16,201,497) | | | | (18,908,898) | |
Class C | | | (23,054,913) | | | | (32,813,044) | |
Class I | | | 314,035 | | | | 76,697 | |
Class R1 | | | (16,759,062) | | | | (41,636,313) | |
Class Y | | | (4,001,224) | | | | (29,512,040) | |
| | | | | | | | |
| | | (222,809,532) | | | | (207,427,823) | |
| | | | | | | | |
Net Assets | | | | | | | | |
| Total increase (decrease) | | | (70,287,342) | | | | 246,506,900 | |
| |
| Beginning of period | | | 1,668,008,986 | | | | 1,421,502,086 | |
| | | | | | | | |
| | |
End of period (including accumulated net investment income of $1,110,338 and $6,546,043, respectively) | | $ | 1,597,721,644 | | | $ | 1,668,008,986 | |
| | | | | | | | |
1. Effective July 1, 2014, Class N shares were renamed Class R. See Note 1 of the accompanying Notes.
See accompanying Notes to Financial Statements.
19 OPPENHEIMER SMALL- & MID- CAP VALUE FUND
FINANCIAL HIGHLIGHTS
| | | | | | | | | | | | | | | | | | | | |
| Class A | | Year Ended
October 31,
2014 | | | Year Ended
October 31,
2013 | | | Year Ended
October 31,
2012 | | | Year Ended
October 31,
2011 | | | Year Ended
October 29,
20101 | |
| |
Per Share Operating Data | | | | | | | | | | | | | | | | | | | | |
Net asset value, beginning of period | | $ | 42.63 | | | $ | 31.33 | | | $ | 30.05 | | | $ | 29.44 | | | $ | 24.35 | |
| |
Income (loss) from investment operations: | | | | | | | | | | | | | | | | | | | | |
Net investment income (loss)2 | | | 0.36 | | | | 0.24 | | | | 0.07 | | | | 0.03 | | | | (0.03 | ) |
Net realized and unrealized gain | | | 4.25 | | | | 11.09 | | | | 1.21 | | | | 0.58 | | | | 5.12 | |
| | | | |
Total from investment operations | | | 4.61 | | | | 11.33 | | | | 1.28 | | | | 0.61 | | | | 5.09 | |
| |
Dividends and/or distributions to shareholders: | | | | | | | | | | | | | | | | | | | | |
Dividends from net investment income | | | (0.52 | ) | | | (0.03 | ) | | | 0.00 | | | | 0.00 | | | | 0.00 | |
| |
Net asset value, end of period | | $ | 46.72 | | | $ | 42.63 | | | $ | 31.33 | | | $ | 30.05 | | | $ | 29.44 | |
| | | | |
| |
Total Return, at Net Asset Value3 | | | 10.91% | | | | 36.16% | | | | 4.26% | | | | 2.07% | | | | 20.90% | |
| |
Ratios/Supplemental Data | | | | | | | | | | | | | | | | | | | | |
Net assets, end of period (in thousands) | | $ | 1,104,252 | | | $ | 1,162,455 | | | $ | 938,427 | | | $ | 1,250,055 | | | $ | 1,573,085 | |
| |
Average net assets (in thousands) | | $ | 1,151,106 | | | $ | 1,013,781 | | | $ | 1,099,549 | | | $ | 1,527,052 | | | $ | 1,642,391 | |
| |
Ratios to average net assets:4 | | | | | | | | | | | | | | | | | | | | |
Net investment income (loss) | | | 0.80% | | | | 0.65% | | | | 0.24% | | | | 0.11% | | | | (0.13)% | |
Total expenses5 | | | 1.18% | | | | 1.27% | | | | 1.31% | | | | 1.26% | | | | 1.29% | |
Expenses after payments, waivers and/or reimbursements
and reduction to custodian expenses | | | 1.18% | | | | 1.27% | | | | 1.26% | | | | 1.25% | | | | 1.28% | |
| |
Portfolio turnover rate | | | 51% | | | | 128% | | | | 54% | | | | 89% | | | | 71% | |
1. October 29, 2010 represents the last business day of the Fund’s reporting period.
2. Per share amounts calculated based on the average shares outstanding during the period.
3. Assumes an initial investment on the business day before the first day of the fiscal period, with all dividends and distributions reinvested in additional shares on the reinvestment date, and redemption at the net asset value calculated on the last business day of the fiscal period. Sales charges are not reflected in the total returns. Total returns are not annualized for periods less than one full year. Returns do not reflect the deduction of taxes that a shareholder would pay on fund distributions or the redemption of fund shares.
4. Annualized for periods less than one full year.
5. Total expenses including indirect expenses from affiliated fund fees and expenses were as follows:
| | | | | | | | |
| | Year Ended October 31, 2014 | | | 1.18 | % | | |
| | Year Ended October 31, 2013 | | | 1.27 | % | | |
| | Year Ended October 31, 2012 | | | 1.31 | % | | |
| | Year Ended October 31, 2011 | | | 1.27 | % | | |
| | Year Ended October 29, 2010 | | | 1.29 | % | | |
See accompanying Notes to Financial Statements.
20 OPPENHEIMER SMALL- & MID- CAP VALUE FUND
| | | | | | | | | | | | | | | | | | | | |
| Class B | | Year Ended
October 31,
2014 | | | Year Ended
October 31,
2013 | | | Year Ended
October 31,
2012 | | | Year Ended
October 31,
2011 | | | Year Ended
October 29,
20101 | |
| |
Per Share Operating Data | | | | | | | | | | | | | | | | | | | | |
Net asset value, beginning of period | | $ | 35.74 | | | $ | 26.48 | | | $ | 25.60 | | | $ | 25.29 | | | $ | 21.08 | |
| |
Income (loss) from investment operations: | | | | | | | | | | | | | | | | | | | | |
Net investment income (loss)2 | | | 0.01 | | | | (0.08 | ) | | | (0.15 | ) | | | (0.20 | ) | | | (0.22 | ) |
Net realized and unrealized gain | | | 3.57 | | | | 9.34 | | | | 1.03 | | | | 0.51 | | | | 4.43 | |
| | | | |
Total from investment operations | | | 3.58 | | | | 9.26 | | | | 0.88 | | | | 0.31 | | | | 4.21 | |
| |
Dividends and/or distributions to shareholders: | | | | | | | | | | | | | | | | | | | | |
Dividends from net investment income | | | (0.03 | ) | | | 0.00 | | | | 0.00 | | | �� | 0.00 | | | | 0.00 | |
| |
Net asset value, end of period | | $ | 39.29 | | | $ | 35.74 | | | $ | 26.48 | | | $ | 25.60 | | | $ | 25.29 | |
| | | | |
| |
Total Return, at Net Asset Value3 | | | 10.03% | | | | 34.97% | | | | 3.44% | | | | 1.23% | | | | 19.97% | |
| |
Ratios/Supplemental Data | | | | | | | | | | | | | | | | | | | | |
Net assets, end of period (in thousands) | | $ | 37,092 | | | $ | 48,927 | | | $ | 53,204 | | | $ | 85,100 | | | $ | 123,847 | |
| |
Average net assets (in thousands) | | $ | 43,889 | | | $ | 48,518 | | | $ | 67,022 | | | $ | 113,687 | | | $ | 131,255 | |
| |
Ratios to average net assets:4 | | | | | | | | | | | | | | | | | | | | |
Net investment income (loss) | | | 0.04% | | | | (0.25)% | | | | (0.57)% | | | | (0.71)% | | | | (0.91)% | |
Total expenses5 | | | 2.01% | | | | 2.35% | | | | 2.37% | | | | 2.30% | | | | 2.31% | |
| Expenses after payments, waivers and/or reimbursements and reduction to custodian expenses | | | 1.96% | | | | 2.15% | | | | 2.09% | | | | 2.08% | | | | 2.07% | |
| |
Portfolio turnover rate | | | 51% | | | | 128% | | | | 54% | | | | 89% | | | | 71% | |
1. October 29, 2010 represents the last business day of the Fund’s reporting period.
2. Per share amounts calculated based on the average shares outstanding during the period.
3. Assumes an initial investment on the business day before the first day of the fiscal period, with all dividends and distributions reinvested in additional shares on the reinvestment date, and redemption at the net asset value calculated on the last business day of the fiscal period. Sales charges are not reflected in the total returns. Total returns are not annualized for periods less than one full year. Returns do not reflect the deduction of taxes that a shareholder would pay on fund distributions or the redemption of fund shares.
4. Annualized for periods less than one full year.
5. Total expenses including indirect expenses from affiliated fund fees and expenses were as follows:
| | | | | | | | |
| | Year Ended October 31, 2014 | | | 2.01 | % | | |
| | Year Ended October 31, 2013 | | | 2.35 | % | | |
| | Year Ended October 31, 2012 | | | 2.37 | % | | |
| | Year Ended October 31, 2011 | | | 2.31 | % | | |
| | Year Ended October 29, 2010 | | | 2.31 | % | | |
See accompanying Notes to Financial Statements.
21 OPPENHEIMER SMALL- & MID- CAP VALUE FUND
| | |
| |
| FINANCIAL HIGHLIGHTS Continued | | |
| | | | | | | | | | | | | | | | | | | | |
| Class C | | Year Ended
October 31,
2014 | | | Year Ended
October 31,
2013 | | | Year Ended
October 31,
2012 | | | Year Ended
October 31,
2011 | | | Year Ended
October 29,
20101 | |
| |
Per Share Operating Data | | | | | | | | | | | | | | | | | | | | |
Net asset value, beginning of period | | $ | 35.83 | | | $ | 26.52 | | | $ | 25.64 | | | $ | 25.32 | | | $ | 21.10 | |
| |
Income (loss) from investment operations: | | | | | | | | | | | | | | | | | | | | |
Net investment income (loss)2 | | | 0.02 | | | | (0.04 | ) | | | (0.14 | ) | | | (0.18 | ) | | | (0.21 | ) |
Net realized and unrealized gain | | | 3.59 | | | | 9.35 | | | | 1.02 | | | | 0.50 | | | | 4.43 | |
| | | | |
Total from investment operations | | | 3.61 | | | | 9.31 | | | | 0.88 | | | | 0.32 | | | | 4.22 | |
| |
Dividends and/or distributions to shareholders: | | | | | | | | | | | | | | | | | | | | |
Dividends from net investment income | | | (0.09 | ) | | | 0.00 | | | | 0.00 | | | | 0.00 | | | | 0.00 | |
| |
Net asset value, end of period | | $ | 39.35 | | | $ | 35.83 | | | $ | 26.52 | | | $ | 25.64 | | | $ | 25.32 | |
| | | | |
| |
Total Return, at Net Asset Value3 | | | 10.05% | | | | 35.10% | | | | 3.43% | | | | 1.26% | | | | 20.00% | |
| |
Ratios/Supplemental Data | | | | | | | | | | | | | | | | | | | | |
Net assets, end of period (in thousands) | | $ | 279,925 | | | $ | 276,676 | | | $ | 234,237 | | | $ | 285,735 | | | $ | 334,710 | |
| |
Average net assets (in thousands) | | $ | 283,792 | | | $ | 252,028 | | | $ | 258,974 | | | $ | 336,244 | | | $ | 336,938 | |
| |
Ratios to average net assets:4 | | | | | | | | | | | | | | | | | | | | |
Net investment income (loss) | | | 0.05% | | | | (0.13)% | | | | (0.56)% | | | | (0.67)% | | | | (0.89)% | |
Total expenses5 | | | 1.93% | | | | 2.05% | | | | 2.08% | | | | 2.03% | | | | 2.07% | |
| Expenses after payments, waivers and/or reimbursements and reduction to custodian expenses | | | 1.93% | | | | 2.05% | | | | 2.06% | | | | 2.02% | | | | 2.04% | |
| |
Portfolio turnover rate | | | 51% | | | | 128% | | | | 54% | | | | 89% | | | | 71% | |
1. October 29, 2010 represents the last business day of the Fund’s reporting period.
2. Per share amounts calculated based on the average shares outstanding during the period.
3. Assumes an initial investment on the business day before the first day of the fiscal period, with all dividends and distributions reinvested in additional shares on the reinvestment date, and redemption at the net asset value calculated on the last business day of the fiscal period. Sales charges are not reflected in the total returns. Total returns are not annualized for periods less than one full year. Returns do not reflect the deduction of taxes that a shareholder would pay on fund distributions or the redemption of fund shares.
4. Annualized for periods less than one full year.
5. Total expenses including indirect expenses from affiliated fund fees and expenses were as follows:
| | | | | | |
| | Year Ended October 31, 2014 | | 1.93% | | |
| | Year Ended October 31, 2013 | | 2.05% | | |
| | Year Ended October 31, 2012 | | 2.08% | | |
| | Year Ended October 31, 2011 | | 2.04% | | |
| | Year Ended October 29, 2010 | | 2.07% | | |
See accompanying Notes to Financial Statements.
22 OPPENHEIMER SMALL- & MID- CAP VALUE FUND
| | | | | | | | | | | | | | | | |
| Class I | | Year Ended
October 31,
2014 | | | Year Ended
October 31,
2013 | | | Period Ended
October 31,
20121 | | | | | |
| | | | | |
Per Share Operating Data | | | | | | | | | | | | | | | | |
Net asset value, beginning of period | | $ | 43.64 | | | $ | 31.88 | | | $ | 32.90 | | | | | |
| | | | | |
Income (loss) from investment operations: | | | | | | | | | | | | | | | | |
Net investment income2 | | | 0.47 | | | | 0.49 | | | | 0.21 | | | | | |
Net realized and unrealized gain (loss) | | | 4.42 | | | | 11.27 | | | | (1.23 | ) | | | | |
| | | | | | | | |
Total from investment operations | | | 4.89 | | | | 11.76 | | | | (1.02 | ) | | | | |
| | | | | |
Dividends and/or distributions to shareholders: | | | | | | | | | | | | | | | | |
Dividends from net investment income | | | (1.04 | ) | | | 0.00 | | | | 0.00 | | | | | |
| | | | | |
Net asset value, end of period | | $ | 47.49 | | | $ | 43.64 | | | $ | 31.88 | | | | | |
| | | | | | | | |
| | | | | |
Total Return, at Net Asset Value3 | | | 11.36% | | | | 36.85% | | | | (3.07)% | | | | | |
| | | | | |
Ratios/Supplemental Data | | | | | | | | | | | | | | | | |
Net assets, end of period (in thousands) | | $ | 427 | | | $ | 95 | | | $ | 10 | | | | | |
| | | | | |
Average net assets (in thousands) | | $ | 178 | | | $ | 35 | | | $ | 422 | | | | | |
| | | | | |
Ratios to average net assets:4 | | | | | | | | | | | | | | | | |
Net investment income | | | 1.02% | | | | 1.23% | | | | 0.99% | | | | | |
Total expenses5 | | | 0.76% | | | | 0.77% | | | | 0.74% | | | | | |
| Expenses after payments, waivers and/or reimbursements and reduction to custodian expenses | | | 0.76% | | | | 0.77% | | | | 0.74% | | | | | |
| | | | | |
Portfolio turnover rate | | | 51% | | | | 128% | | | | 54% | | | | | |
1. For the period from February 28, 2012 (inception of offering) to October 31, 2012.
2. Per share amounts calculated based on the average shares outstanding during the period.
3. Assumes an initial investment on the business day before the first day of the fiscal period, with all dividends and distributions reinvested in additional shares on the reinvestment date, and redemption at the net asset value calculated on the last business day of the fiscal period. Sales charges are not reflected in the total returns. Total returns are not annualized for periods less than one full year. Returns do not reflect the deduction of taxes that a shareholder would pay on fund distributions or the redemption of fund shares.
4. Annualized for periods less than one full year.
5. Total expenses including indirect expenses from affiliated fund fees and expenses were as follows:
| | | | | | | | |
| | Year Ended October 31, 2014 | | | 0.76 | % | | |
| | Year Ended October 31, 2013 | | | 0.77 | % | | |
| | Period Ended October 31, 2012 | | | 0.74 | % | | |
See accompanying Notes to Financial Statements.
23 OPPENHEIMER SMALL- & MID- CAP VALUE FUND
| | |
| |
| FINANCIAL HIGHLIGHTS Continued | | |
| | | | | | | | | | | | | | | | | | | | |
| Class R | | Year Ended
October 31,
2014 | | | Year Ended
October 31,
2013 | | | Year Ended
October 31,
2012 | | | Year Ended
October 31,
2011 | | | Year Ended
October 29,
20101 | |
| |
Per Share Operating Data | | | | | | | | | | | | | | | | | | | | |
Net asset value, beginning of period | | $ | 40.87 | | | $ | 30.09 | | | $ | 28.94 | | | $ | 28.44 | | | $ | 23.58 | |
| |
Income (loss) from investment operations: | | | | | | | | | | | | | | | | | | | | |
Net investment income (loss)2 | | | 0.23 | | | | 0.14 | | | | (0.02 | ) | | | (0.05 | ) | | | (0.10 | ) |
Net realized and unrealized gain | | | 4.09 | | | | 10.64 | | | | 1.17 | | | | 0.55 | | | | 4.96 | |
| | | | |
Total from investment operations | | | 4.32 | | | | 10.78 | | | | 1.15 | | | | 0.50 | | | | 4.86 | |
| |
Dividends and/or distributions to shareholders: | | | | | | | | | | | | | | | | | | | | |
Dividends from net investment income | | | (0.31 | ) | | | 0.00 | | | | 0.00 | | | | 0.00 | | | | 0.00 | |
| |
Net asset value, end of period | | $ | 44.88 | | | $ | 40.87 | | | $ | 30.09 | | | $ | 28.94 | | | $ | 28.44 | |
| | | | |
| |
Total Return, at Net Asset Value3 | | | 10.61% | | | | 35.79% | | | | 3.97% | | | | 1.76% | | | | 20.61% | |
| |
Ratios/Supplemental Data | | | | | | | | | | | | | | | | | | | | |
Net assets, end of period (in thousands) | | $ | 125,703 | | | $ | 130,267 | | | $ | 132,365 | | | $ | 176,002 | | | $ | 224,132 | |
| |
Average net assets (in thousands) | | $ | 129,580 | | | $ | 129,674 | | | $ | 154,101 | | | $ | 213,872 | | | $ | 227,923 | |
| |
Ratios to average net assets:4 | | | | | | | | | | | | | | | | | | | | |
Net investment income (loss) | | | 0.53% | | | | 0.39% | | | | (0.05)% | | | | (0.17)% | | | | (0.38)% | |
Total expenses5 | | | 1.45% | | | | 1.53% | | | | 1.59% | | | | 1.54% | | | | 1.62% | |
| Expenses after payments, waivers and/or reimbursements and reduction to custodian expenses | | | 1.45% | | | | 1.53% | | | | 1.55% | | | | 1.53% | | | | 1.52% | |
| |
Portfolio turnover rate | | | 51% | | | | 128% | | | | 54% | | | | 89% | | | | 71% | |
1. October 29, 2010 represents the last business day of the Fund’s reporting period.
2. Per share amounts calculated based on the average shares outstanding during the period.
3. Assumes an initial investment on the business day before the first day of the fiscal period, with all dividends and distributions reinvested in additional shares on the reinvestment date, and redemption at the net asset value calculated on the last business day of the fiscal period. Sales charges are not reflected in the total returns. Total returns are not annualized for periods less than one full year. Returns do not reflect the deduction of taxes that a shareholder would pay on fund distributions or the redemption of fund shares.
4. Annualized for periods less than one full year.
5. Total expenses including indirect expenses from affiliated fund fees and expenses were as follows:
| | | | | | | | |
| | Year Ended October 31, 2014 | | | 1.45 | % | | |
| | Year Ended October 31, 2013 | | | 1.53 | % | | |
| | Year Ended October 31, 2012 | | | 1.59 | % | | |
| | Year Ended October 31, 2011 | | | 1.55 | % | | |
| | Year Ended October 29, 2010 | | | 1.62 | % | | |
See accompanying Notes to Financial Statements.
24 OPPENHEIMER SMALL- & MID- CAP VALUE FUND
| | | | | | | | | | | | | | | | | | | | |
| Class Y | | Year Ended
October 31,
2014 | | | Year Ended
October 31,
2013 | | | Year Ended
October 31,
2012 | | | Year Ended
October 31,
2011 | | | Year Ended
October 29,
20101 | |
| |
Per Share Operating Data | | | | | | | | | | | | | | | | | | | | |
Net asset value, beginning of period | | $ | 43.81 | | | $ | 32.20 | | | $ | 30.78 | | | $ | 30.08 | | | $ | 24.79 | |
| |
Income (loss) from investment operations: | | | | | | | | | | | | | | | | | | | | |
Net investment income2 | | | 0.52 | | | | 0.34 | | | | 0.19 | | | | 0.12 | | | | 0.06 | |
Net realized and unrealized gain | | | 4.37 | | | | 11.40 | | | | 1.23 | | | | 0.58 | | | | 5.23 | |
| | | | |
Total from investment operations | | | 4.89 | | | | 11.74 | | | | 1.42 | | | | 0.70 | | | | 5.29 | |
| |
Dividends and/or distributions to shareholders: | | | | | | | | | | | | | | | | | | | | |
Dividends from net investment income | | | (0.82 | ) | | | (0.13 | ) | | | 0.00 | | | | 0.00 | | | | 0.00 | |
| |
Net asset value, end of period | | $ | 47.88 | | | $ | 43.81 | | | $ | 32.20 | | | $ | 30.78 | | | $ | 30.08 | |
| | | | |
| |
Total Return, at Net Asset Value3 | | | 11.30% | | | | 36.55% | | | | 4.62% | | | | 2.33% | | | | 21.34% | |
| |
Ratios/Supplemental Data | | | | | | | | | | | | | | | | | | | | |
Net assets, end of period (in thousands) | | $ | 50,323 | | | $ | 49,589 | | | $ | 63,259 | | | $ | 100,231 | | | $ | 101,045 | |
| |
Average net assets (in thousands) | | $ | 50,290 | | | $ | 50,572 | | | $ | 85,178 | | | $ | 102,025 | | | $ | 120,886 | |
| |
Ratios to average net assets:4 | | | | | | | | | | | | | | | | | | | | |
Net investment income | | | 1.13% | | | | 0.91% | | | | 0.60% | | | | 0.35% | | | | 0.21% | |
Total expenses5 | | | 0.84% | | | | 0.98% | | | | 0.92% | | | | 1.00% | | | | 0.91% | |
| Expenses after payments, waivers and/or reimbursements and reduction to custodian expenses | | | 0.83% | | | | 0.98% | | | | 0.92% | | | | 0.99% | | | | 0.90% | |
| |
Portfolio turnover rate | | | 51% | | | | 128% | | | | 54% | | | | 89% | | | | 71% | |
1. October 29, 2010 represents the last business day of the Fund’s reporting period.
2. Per share amounts calculated based on the average shares outstanding during the period.
3. Assumes an initial investment on the business day before the first day of the fiscal period, with all dividends and distributions reinvested in additional shares on the reinvestment date, and redemption at the net asset value calculated on the last business day of the fiscal period. Sales charges are not reflected in the total returns. Total returns are not annualized for periods less than one full year. Returns do not reflect the deduction of taxes that a shareholder would pay on fund distributions or the redemption of fund shares.
4. Annualized for periods less than one full year.
5. Total expenses including indirect expenses from affiliated fund fees and expenses were as follows:
| | | | | | | | |
| | Year Ended October 31, 2014 | | | 0.84 | % | | |
| | Year Ended October 31, 2013 | | | 0.98 | % | | |
| | Year Ended October 31, 2012 | | | 0.92 | % | | |
| | Year Ended October 31, 2011 | | | 1.01 | % | | |
| | Year Ended October 29, 2010 | | | 0.91 | % | | |
See accompanying Notes to Financial Statements.
25 OPPENHEIMER SMALL- & MID- CAP VALUE FUND
| | |
| NOTES TO FINANCIAL STATEMENTS October 31, 2014 | | |
| | |
1. Significant Accounting Policies
Oppenheimer Small- & Mid- Cap Value Fund (the “Fund”), a series of Oppenheimer Quest for Value Funds, is registered under the Investment Company Act of 1940 (“1940 Act”), as amended, as a diversified open-end management investment company. The Fund’s investment objective is to seek capital appreciation. The Fund’s investment adviser is OFI Global Asset Management, Inc. (“OFI Global” or the “Manager”), a wholly-owned subsidiary of OppenheimerFunds, Inc. (“OFI” or the “Sub-Adviser”). The Manager has entered into a sub-advisory agreement with OFI.
The Fund offers Class A, Class C, Class I, Class R and Class Y shares, and previously offered Class B shares for new purchase through June 29, 2012. Subsequent to that date, no new purchases of Class B shares are permitted, however reinvestment of dividend and/or capital gain distributions and exchanges of Class B shares into and from other Oppenheimer funds will be allowed. As of July 1, 2014, Class N shares were renamed Class R shares. Class N shares subject to a contingent deferred sales charge (“CDSC”) on July 1, 2014, will continue to be subject to a CDSC after the shares are renamed. Purchases of Class R shares occurring on or after July 1, 2014, will not be subject to a CDSC upon redemption. Class A shares are sold at their offering price, which is normally net asset value plus a front-end sales charge. Class C and Class R shares are sold, and Class B shares were sold, without a front-end sales charge but may be subject to a contingent deferred sales charge (“CDSC”). Class R shares are sold only through retirement plans. Retirement plans that offer Class R shares may impose charges on those accounts. Class I and Class Y shares are sold to certain institutional investors or intermediaries without either a front-end sales charge or a CDSC, however, the intermediaries may impose charges on their accountholders who beneficially own Class I and Class Y shares. All classes of shares have identical rights and voting privileges with respect to the Fund in general and exclusive voting rights on matters that affect that class alone. Earnings, net assets and net asset value per share may differ due to each class having its own expenses, such as transfer and shareholder servicing agent fees and shareholder communications, directly attributable to that class. Class A, B, C and R shares have separate distribution and/or service plans under which they pay fees. Class I and Class Y shares do not pay such fees. Class B shares will automatically convert to Class A shares 72 months after the date of purchase.
The following is a summary of significant accounting policies consistently followed by the Fund.
Equity Security Risk. Stocks and other equity securities fluctuate in price. The value of the Fund’s portfolio may be affected by changes in the equity markets generally. Equity markets may experience significant short-term volatility and may fall sharply at times. Different markets may behave differently from each other and U.S. equity markets may move in the opposite direction from one or more foreign stock markets.
The prices of individual equity securities generally do not all move in the same direction at the same time and a variety of factors can affect the price of a particular company’s securities. These factors may include, but are not limited to, poor earnings reports, a loss of customers, litigation against the company, general unfavorable performance of the company’s
sector or industry, or changes in government regulations affecting the company or its industry.
26 OPPENHEIMER SMALL- & MID- CAP VALUE FUND
1. Significant Accounting Policies (Continued)
Investment in Oppenheimer Institutional Money Market Fund. The Fund is permitted to invest daily available cash balances in an affiliated money market fund. The Fund may invest the available cash in Class E shares of Oppenheimer Institutional Money Market Fund (“IMMF”) to seek current income while preserving liquidity or for defensive purposes. IMMF is a registered open-end management investment company, regulated as a money market fund under the 1940 Act. The Manager is the investment adviser of IMMF, and the Sub-Adviser provides investment and related advisory services to IMMF. When applicable, the Fund’s investment in IMMF is included in the Statement of Investments. Shares of IMMF are valued at their net asset value per share. As a shareholder, the Fund is subject to its proportional share of IMMF’s Class E expenses, including its management fee. The Manager will waive fees and/or reimburse Fund expenses in an amount equal to the indirect management fees incurred through the Fund’s investment in IMMF.
Allocation of Income, Expenses, Gains and Losses. Income, expenses (other than those attributable to a specific class), gains and losses are allocated on a daily basis to each class of shares based upon the relative proportion of net assets represented by such class. Operating expenses directly attributable to a specific class are charged against the operations of that class.
Federal Taxes. The Fund intends to comply with provisions of the Internal Revenue Code applicable to regulated investment companies and to distribute substantially all of its investment company taxable income, including any net realized gain on investments not offset by capital loss carryforwards, if any, to shareholders. Therefore, no federal income or excise tax provision is required. The Fund files income tax returns in U.S. federal and applicable state jurisdictions. The statute of limitations on the Fund’s tax return filings generally remain open for the three preceding fiscal reporting period ends.
The tax components of capital shown in the following table represent distribution requirements the Fund must satisfy under the income tax regulations, losses the Fund may be able to offset against income and gains realized in future years and unrealized appreciation or depreciation of securities and other investments for federal income tax purposes.
| | | | | | | | | | | | |
Undistributed Net Investment Income | | Undistributed
Long-Term
Gain | | | Accumulated
Loss
Carryforward1,2,3 | | | Net Unrealized
Appreciation
Based on cost of
Securities and
Other Investments
for Federal Income
Tax Purposes | |
$677,596 | | | $— | | | | $231,460,315 | | | | $281,758,560 | |
27 OPPENHEIMER SMALL- & MID- CAP VALUE FUND
| | |
| NOTES TO FINANCIAL STATEMENTS Continued | | |
1. Significant Accounting Policies (Continued)
1. As of October 31, 2014, the Fund had $231,460,315 of net capital loss carryforward available to offset future realized capital gains, if any, and thereby reduce future taxable gain distributions. Details of the capital loss carryforwards are included in the table below. Capital loss carryovers with no expiration, if any, must be utilized prior to those with expiration dates.
| | | | |
| Expiring | |
2017 | | $ | 231,460,315 | |
2. During the fiscal year ended October 31, 2014, the Fund utilized $142,738,929 of capital loss carryforward to offset capital gains realized in that fiscal year.
3. During the fiscal year ended October 31, 2013, the Fund utilized $344,664,676 of capital loss carryforward to offset capital gains realized in that fiscal year.
Net investment income (loss) and net realized gain (loss) may differ for financial statement and tax purposes. The character of dividends and distributions made during the fiscal year from net investment income or net realized gains may differ from their ultimate characterization for federal income tax purposes. Also, due to timing of dividends and distributions, the fiscal year in which amounts are distributed may differ from the fiscal year in which the income or net realized gain was recorded by the Fund.
The tax character of distributions paid during the years ended October 31, 2014 and October 31, 2013 was as follows:
| | | | | | | | |
| | | Year Ended
October 31, 2014 | | | Year Ended
October 31, 2013 | |
Distributions paid from: | | | | | | | | |
Ordinary income | | $ | 16,064,458 | | | $ | 1,076,043 | |
The aggregate cost of securities and other investments and the composition of unrealized appreciation and depreciation of securities and other investments for federal income tax purposes as of October 31, 2014 are noted in the following table. The primary difference between book and tax appreciation or depreciation of securities and other investments, if applicable, is attributable to the tax deferral of losses or tax realization of financial statement unrealized gain or loss.
| | | | |
Federal tax cost of securities | | $ | 1,315,984,581 | |
| | | | |
Gross unrealized appreciation | | $ | 301,259,176 | |
Gross unrealized depreciation | | | (19,500,616) | |
| | | | |
Net unrealized appreciation | | $ | 281,758,560 | |
| | | | |
Dividends and Distributions to Shareholders. Dividends and distributions to shareholders, which are determined in accordance with income tax regulations and may differ from U.S. generally accepted accounting principles, are recorded on the ex-dividend date. Income distributions, if any, are declared and paid quarterly. Capital gain distributions, if any, are declared and paid annually.
28 OPPENHEIMER SMALL- & MID- CAP VALUE FUND
1. Significant Accounting Policies (Continued)
Investment Income. Dividend income is recorded on the ex-dividend date or upon ex-dividend notification in the case of certain foreign dividends where the ex-dividend date may have passed. Non-cash dividends included in dividend income, if any, are recorded at the fair market value of the securities received. Interest income is recognized on an accrual basis. Discount and premium, which are included in interest income on the Statement of Operations, are amortized or accreted daily.
Custodian Fees. “Custodian fees and expenses” in the Statement of Operations may include interest expense incurred by the Fund on any cash overdrafts of its custodian account during the period. Such cash overdrafts may result from the effects of failed trades in portfolio securities and from cash outflows resulting from unanticipated shareholder redemption activity. The Fund pays interest to its custodian on such cash overdrafts, to the extent they are not offset by positive cash balances maintained by the Fund, at a rate equal to the Federal Funds Rate plus 0.50%. The “Reduction to custodian expenses” line item, if applicable, represents earnings on cash balances maintained by the Fund during the period. Such interest expense and other custodian fees may be paid with these earnings.
Security Transactions. Security transactions are recorded on the trade date. Realized gains and losses on securities sold are determined on the basis of identified cost.
Indemnifications. The Fund’s organizational documents provide current and former Trustees and officers with a limited indemnification against liabilities arising in connection with the performance of their duties to the Fund. In the normal course of business, the Fund may also enter into contracts that provide general indemnifications. The Fund’s maximum exposure under these arrangements is unknown as this would be dependent on future claims that may be made against the Fund. The risk of material loss from such claims is considered remote.
Other. The preparation of financial statements in conformity with accounting principles generally accepted in the United States of America requires management to make estimates and assumptions that affect the reported amounts of assets and liabilities and disclosure of contingent assets and liabilities at the date of the financial statements and the reported amounts of increases and decreases in net assets from operations during the reporting period. Actual results could differ from those estimates.
2. Securities Valuation
The Fund calculates the net asset value of its shares as of the close of the New York Stock Exchange (the “Exchange”), normally 4:00 P.M. Eastern time, on each day the Exchange is open for trading.
The Fund’s Board has adopted procedures for the valuation of the Fund’s securities and has delegated the day-to-day responsibility for valuation determinations under those procedures to the Manager. The Manager has established a Valuation Committee which is
29 OPPENHEIMER SMALL- & MID- CAP VALUE FUND
| | |
| NOTES TO FINANCIAL STATEMENTS Continued | | |
2. Securities Valuation (Continued)
responsible for determining a “fair valuation” for any security for which market quotations are not “readily available.” The Valuation Committee’s fair valuation determinations are subject to review, approval and ratification by the Fund’s Board at its next regularly scheduled meeting covering the calendar quarter in which the fair valuation was determined.
Valuation Methods and Inputs
Securities are valued using unadjusted quoted market prices, when available, as supplied primarily by third party pricing services or dealers.
The following methodologies are used to determine the market value or the fair value of the types of securities described below:
Securities traded on a registered U.S. securities exchange (including exchange-traded derivatives other than futures and futures options) are valued based on the last sale price of the security reported on the principal exchange on which it is traded, prior to the time when the Fund’s assets are valued. In the absence of a sale, the security is valued at the last sale price on the prior trading day, if it is within the spread of the current day’s closing “bid” and “asked” prices, and if not, at the current day’s closing bid price. A security of a foreign issuer traded on a foreign exchange, but not listed on a registered U.S. securities exchange, is valued based on the last sale price on the principal exchange on which the security is traded, as identified by the third party pricing service used by the Manager, prior to the time when the Fund’s assets are valued. If the last sale price is unavailable, the security is valued at the most recent official closing price on the principal exchange on which it is traded. If the last sales price or official closing price for a foreign security is not available, the security is valued at the mean between the bid and asked price per the exchange or, if not available from the exchange, obtained from two dealers. If bid and asked prices are not available from either the exchange or two dealers, the security is valued by using one of the following methodologies (listed in order of priority): (1) using a bid from the exchange, (2) the mean between the bid and asked price as provided by a single dealer, or (3) a bid from a single dealer.
Shares of a registered investment company that are not traded on an exchange are valued at that investment company’s net asset value per share.
Corporate and government debt securities (of U.S. or foreign issuers) and municipal debt securities, event-linked bonds, loans, mortgage-backed securities, collateralized mortgage obligations, and asset-backed securities are valued at the mean between the “bid” and “asked” prices utilizing evaluated prices obtained from third party pricing services or broker-dealers who may use matrix pricing methods to determine the evaluated prices.
Short-term money market type debt securities with a remaining maturity of sixty days or less are valued at cost adjusted by the amortization of discount or premium to maturity (amortized cost), which approximates market value. Short-term debt securities with a remaining maturity in excess of sixty days are valued at the mean between the “bid” and “asked” prices utilizing evaluated prices obtained from third party pricing services or broker-dealers.
A description of the standard inputs that may generally be considered by the third party pricing vendors in determining their evaluated prices is provided below.
30 OPPENHEIMER SMALL- & MID- CAP VALUE FUND
2. Securities Valuation (Continued)
| | |
| Security Type | | Standard inputs generally considered by third-party pricing vendors |
|
| Corporate debt, government debt, municipal, mortgage-backed and asset-backed securities | | Reported trade data, broker-dealer price quotations, benchmark yields, issuer spreads on comparable securities, the credit quality, yield, maturity, and other appropriate factors. |
|
Loans | | Information obtained from market participants regarding reported trade data and broker-dealer price quotations. |
|
Event-linked bonds | | Information obtained from market participants regarding reported trade data and broker-dealer price quotations. |
If a market value or price cannot be determined for a security using the methodologies described above, or if, in the “good faith” opinion of the Manager, the market value or price obtained does not constitute a “readily available market quotation,” or a significant event has occurred that would materially affect the value of the security the security is fair valued either (i) by a standardized fair valuation methodology applicable to the security type or the significant event as previously approved by the Valuation Committee and the Fund’s Board or (ii) as determined in good faith by the Manager’s Valuation Committee. The Valuation Committee considers all relevant facts that are reasonably available, through either public information or information available to the Manager, when determining the fair value of a security. Fair value determinations by the Manager are subject to review, approval and ratification by the Fund’s Board at its next regularly scheduled meeting covering the calendar quarter in which the fair valuation was determined. Those fair valuation standardized methodologies include, but are not limited to, valuing securities at the last sale price or initially at cost and subsequently adjusting the value based on: changes in company specific fundamentals, changes in an appropriate securities index, or changes in the value of similar securities which may be further adjusted for any discounts related to security-specific resale restrictions. When possible, such methodologies use observable market inputs such as unadjusted quoted prices of similar securities, observable interest rates, currency rates and yield curves. The methodologies used for valuing securities are not necessarily an indication of the risks associated with investing in those securities nor can it be assured that the Fund can obtain the fair value assigned to a security if it were to sell the security.
To assess the continuing appropriateness of security valuations, the Manager, or its third party service provider who is subject to oversight by the Manager, regularly compares prior day prices, prices on comparable securities, and sale prices to the current day prices and challenges those prices exceeding certain tolerance levels with the third party pricing service or broker source. For those securities valued by fair valuations, whether through a standardized fair valuation methodology or a fair valuation determination, the Valuation Committee reviews and affirms the reasonableness of the valuations based on such methodologies and fair valuation determinations on a regular basis after considering all relevant information that is reasonably available.
Classifications
Each investment asset or liability of the Fund is assigned a level at measurement date based on the significance and source of the inputs to its valuation. Various data inputs are used in determining the value of each of the Fund’s investments as of the reporting period end. These
31 OPPENHEIMER SMALL- & MID- CAP VALUE FUND
| | |
| NOTES TO FINANCIAL STATEMENTS Continued | | |
| | |
2. Securities Valuation (Continued)
data inputs are categorized in the following hierarchy under applicable financial accounting standards:
1) Level 1-unadjusted quoted prices in active markets for identical assets or liabilities (including securities actively traded on a securities exchange)
2) Level 2-inputs other than unadjusted quoted prices that are observable for the asset or liability (such as unadjusted quoted prices for similar assets and market corroborated inputs such as interest rates, prepayment speeds, credit risks, etc.)
3) Level 3-significant unobservable inputs (including the Manager’s own judgments about assumptions that market participants would use in pricing the asset or liability).
The inputs used for valuing securities are not necessarily an indication of the risks associated with investing in those securities.
The table below categorizes amounts that are included in the Fund’s Statement of Assets and Liabilities as of October 31, 2014 based on valuation input level:
| | | | | | | | | | | | | | | | |
| | | Level 1—
Unadjusted
Quoted Prices | | | Level 2—
Other Significant
Observable
Inputs | | | Level 3—
Significant
Unobservable
Inputs | | | Value | |
| |
Assets Table | | | | | | | | | | | | | | | | |
Investments, at Value: | | | | | | | | | | | | | | | | |
Common Stocks | | | | | | | | | | | | | | | | |
Consumer Discretionary | | $ | 199,834,704 | | | $ | — | | | $ | — | | | $ | 199,834,704 | |
Consumer Staples | | | 91,327,695 | | | | — | | | | — | | | | 91,327,695 | |
Energy | | | 71,820,213 | | | | — | | | | — | | | | 71,820,213 | |
Financials | | | 453,427,083 | | | | — | | | | — | | | | 453,427,083 | |
Health Care | | | 166,313,024 | | | | — | | | | — | | | | 166,313,024 | |
Industrials | | | 233,272,351 | | | | — | | | | — | | | | 233,272,351 | |
Information Technology | | | 195,679,687 | | | | — | | | | — | | | | 195,679,687 | |
Materials | | | 83,315,968 | | | | — | | | | — | | | | 83,315,968 | |
Telecommunication Services | | | 27,814,241 | | | | — | | | | — | | | | 27,814,241 | |
Utilities | | | 66,130,268 | | | | — | | | | — | | | | 66,130,268 | |
Investment Company | | | 8,807,907 | | | | — | | | | — | | | | 8,807,907 | |
| | | | |
Total Assets | | $ | 1,597,743,141 | | | $ | — | | | $ | — | | | $ | 1,597,743,141 | |
| | | | |
Forward currency exchange contracts and futures contracts, if any, are reported at their unrealized appreciation/depreciation at measurement date, which represents the change in the contract’s value from trade date. All additional assets and liabilities included in the above table are reported at their market value at measurement date.
3. Shares of Beneficial Interest
The Fund has authorized an unlimited number of $0.01 par value shares of beneficial interest of each class. Transactions in shares of beneficial interest were as follows:
32 OPPENHEIMER SMALL- & MID- CAP VALUE FUND
3. Shares of Beneficial Interest (Continued)
| | | | | | | | | | | | | | | | |
| | | Year Ended October 31, 2014 | | | Year Ended October 31, 2013 | |
| | | Shares | | | Amount | | | Shares | | | Amount | |
| |
Class A | | | | | | | | | | | | | | | | |
Sold | | | 3,187,950 | | | $ | 143,191,106 | | | | 6,012,410 | | | $ | 229,492,865 | |
Dividends and/or distributions reinvested | | | 288,729 | | | | 12,740,510 | | | | 24,509 | | | | 781,094 | |
Redeemed | | | (7,114,378 | ) | | | (319,038,487 | ) | | | (8,720,933 | ) | | | (314,908,184 | ) |
| | | | |
Net decrease | | | (3,637,699 | ) | | $ | (163,106,871 | ) | | | (2,684,014 | ) | | $ | (84,634,225 | ) |
| | | | |
| | | | | | | | | | | | | | | | |
| |
Class B | | | | | | | | | | | | | | | | |
Sold | | | 39,064 | | | $ | 1,458,869 | | | | 155,683 | | | $ | 4,980,576 | |
Dividends and/or distributions reinvested | | | 981 | | | | 37,819 | | | | — | | | | — | |
Redeemed | | | (465,030 | ) | | | (17,698,185 | ) | | | (796,309 | ) | | | (23,889,474 | ) |
| | | | |
Net decrease | | | (424,985 | ) | | $ | (16,201,497 | ) | | | (640,626 | ) | | $ | (18,908,898 | ) |
| | | | |
| | | | | | | | | | | | | | | | |
| |
Class C | | | | | | | | | | | | | | | | |
Sold | | | 854,974 | | | $ | 32,350,377 | | | | 1,168,428 | | | $ | 36,821,008 | |
Dividends and/or distributions reinvested | | | 15,096 | | | | 563,782 | | | | — | | | | — | |
Redeemed | | | (1,477,278 | ) | | | (55,969,072 | ) | | | (2,280,794 | ) | | | (69,634,052 | ) |
| | | | |
Net decrease | | | (607,208 | ) | | $ | (23,054,913 | ) | | | (1,112,366 | ) | | $ | (32,813,044 | ) |
| | | | |
| | | | | | | | | | | | | | | | |
| |
Class I | | | | | | | | | | | | | | | | |
Sold | | | 8,445 | | | $ | 388,877 | | | | 2,119 | | | $ | 86,602 | |
Dividends and/or distributions reinvested | | | 55 | | | | 2,519 | | | | — | | | | — | |
Redeemed | | | (1,704 | ) | | | (77,361 | ) | | | (236 | ) | | | (9,905 | ) |
| | | | |
Net increase | | | 6,796 | | | $ | 314,035 | | | | 1,883 | | | $ | 76,697 | |
| | | | |
| | | | | | | | | | | | | | | | |
| |
Class R1 | | | | | | | | | | | | | | | | |
Sold | | | 567,378 | | | $ | 24,430,423 | | | | 726,988 | | | $ | 25,913,549 | |
Dividends and/or distributions reinvested | | | 19,770 | | | | 841,931 | | | | — | | | | — | |
Redeemed | | | (973,378 | ) | | | (42,031,416 | ) | | | (1,938,822 | ) | | | (67,549,862 | ) |
| | | | |
Net decrease | | | (386,230 | ) | | $ | (16,759,062 | ) | | | (1,211,834 | ) | | $ | (41,636,313 | ) |
| | | | |
| | | | | | | | | | | | | | | | |
| |
Class Y | | | | | | | | | | | | | | | | |
Sold | | | 503,843 | | | $ | 23,790,106 | | | | 408,620 | | | $ | 15,453,039 | |
Dividends and/or distributions reinvested | | | 16,712 | | | | 757,570 | | | | 5,962 | | | | 194,843 | |
Redeemed | | | (601,561 | ) | | | (28,548,900 | ) | | | (1,247,131 | ) | | | (45,159,922 | ) |
| | | | |
Net decrease | | | (81,006 | ) | | $ | (4,001,224 | ) | | | (832,549 | ) | | $ | (29,512,040 | ) |
| | | | |
1. Effective July 1, 2014, Class N shares were renamed Class R.
33 OPPENHEIMER SMALL- & MID- CAP VALUE FUND
| | |
| NOTES TO FINANCIAL STATEMENTS Continued | | |
4. Purchases and Sales of Securities
The aggregate cost of purchases and proceeds from sales of securities, other than short-term obligations and investments in IMMF, for the year ended October 31, 2014 were as follows:
| | | | | | | | | | |
| | | Purchases | | | | | Sales | |
| |
Investment securities | | $ | 837,770,239 | | | | | $ | 1,054,795,085 | |
5. Fees and Other Transactions with Affiliates
Management Fees. Under the investment advisory agreement, the Fund pays the Manager a management fee based on the daily net assets of the Fund at an annual rate as shown in the following table:
| | | | |
| Fee Schedule | |
| |
Up to $400 million | | | 0.80% | |
Next $400 million | | | 0.75 | |
Next $1.2 billion | | | 0.60 | |
Next $4.0 billion | | | 0.58 | |
Over $6.0 billion | | | 0.56 | |
The Fund’s management fee for the fiscal year ended October 31, 2014 was 0.69% of average annual net assets before any applicable waivers.
Sub-Adviser Fees. The Manager has retained the Sub-Adviser to provide the day-to-day portfolio management of the Fund. Under the Sub-Advisory Agreement, the Manager pays the Sub-Adviser an annual fee in monthly installments, equal to a percentage of the investment management fee collected by the Manager from the Fund, which shall be calculated after any investment management fee waivers. The fee paid to the Sub-Adviser is paid by the Manager, not by the Fund.
Transfer Agent Fees. OFI Global (the “Transfer Agent”) serves as the transfer and shareholder servicing agent for the Fund. The Fund pays the Transfer Agent a fee based on annual net assets. Fees incurred and average net assets for each class with respect to these services are detailed in the Statement of Operations and Financial Highlights, respectively.
Sub-Transfer Agent Fees. The Transfer Agent has retained Shareholder Services, Inc., a wholly-owned subsidiary of OFI (the “Sub-Transfer Agent”), to provide the day-to-day transfer agent and shareholder servicing of the Fund. Under the Sub-Transfer Agency Agreement, the Transfer Agent pays the Sub-Transfer Agent an annual fee in monthly installments, equal to a percentage of the transfer agent fee collected by the Transfer Agent from the Fund, which shall be calculated after any applicable fee waivers. The fee paid to the Sub-Transfer Agent is paid by the Transfer Agent, not by the Fund.
Trustees’ Compensation. The Fund has adopted an unfunded retirement plan (the “Plan”) for the Fund’s Independent Trustees. Benefits are based on years of service and fees paid to each Trustee during their period of service. The Plan was frozen with respect to adding new participants effective December 31, 2006 (the “Freeze Date”) and existing Plan Participants
34 OPPENHEIMER SMALL- & MID- CAP VALUE FUND
5. Fees and Other Transactions with Affiliates (Continued)
as of the Freeze Date will continue to receive accrued benefits under the Plan. Active Independent Trustees as of the Freeze Date have each elected a distribution method with respect to their benefits under the Plan. During the year ended October 31, 2014, the Fund’s projected benefit obligations, payments to retired Trustees and accumulated liability were as follows:
| | | | |
Projected Benefit Obligations Increased | | $ | 10,790 | |
Payments Made to Retired Trustees | | | 60,229 | |
Accumulated Liability as of October 31, 2014 | | | 363,393 | |
The Fund’s Board of Trustees (“Board”) has adopted a compensation deferral plan for Independent Trustees that enables Trustees to elect to defer receipt of all or a portion of the annual compensation they are entitled to receive from the Fund. For purposes of determining the amount owed to the Trustee under the plan, deferred amounts are treated as though equal dollar amounts had been invested in shares of the Fund or in other Oppenheimer funds selected by the Trustee. The Fund purchases shares of the funds selected for deferral by the Trustee in amounts equal to his or her deemed investment, resulting in a Fund asset equal to the deferred compensation liability. Such assets are included as a component of “Other” within the asset section of the Statement of Assets and Liabilities. Deferral of Trustees’ fees under the plan will not affect the net assets of the Fund and will not materially affect the Fund’s assets, liabilities or net investment income per share. Amounts will be deferred until distributed in accordance with the compensation deferral plan.
Distribution and Service Plan (12b-1) Fees. Under its General Distributor’s Agreement with the Fund, OppenheimerFunds Distributor, Inc. (the “Distributor”) acts as the Fund’s principal underwriter in the continuous public offering of the Fund’s classes of shares.
Distribution and Service Plan for Class A Shares. The Fund has adopted a Distribution and Service Plan (the “Plan”) for Class A shares pursuant to Rule 12b-1 under the 1940 Act. Under the Plan, the Fund pays a service fee to the Distributor at an annual rate of 0.25% of the daily net assets of Class A shares. The Distributor currently uses all of those fees to pay dealers, brokers, banks and other financial institutions periodically for providing personal services and maintenance of accounts of their customers that hold Class A shares. Under the Plan, the Fund may also pay an asset-based sales charge to the Distributor. However, the Fund’s Board has currently set the rate at zero. Fees incurred by the Fund under the Plan are detailed in the Statement of Operations.
Distribution and Service Plans for Class B, Class C and Class R Shares. The Fund has adopted Distribution and Service Plans (the “Plans”) for Class B, Class C and Class R shares pursuant to Rule 12b-1 under the 1940 Act to compensate the Distributor for distributing those share classes, maintaining accounts and providing shareholder services. Under the Plans, the Fund pays the Distributor an annual asset-based sales charge of 0.75% on Class B and Class C shares daily net assets and 0.25% on Class R shares daily net assets. The Fund
35 OPPENHEIMER SMALL- & MID- CAP VALUE FUND
| | |
| NOTES TO FINANCIAL STATEMENTS Continued | | |
5. Fees and Other Transactions with Affiliates (Continued)
also pays a service fee under the Plans at an annual rate of 0.25% of daily net assets. The Plans continue in effect from year to year only if the Fund’s Board of Trustees vote annually to approve its continuance at an in person meeting called for that purpose. Fees incurred by the Fund under the Plans are detailed in the Statement of Operations.
Sales Charges. Front-end sales charges and CDSC do not represent expenses of the Fund. They are deducted from the proceeds of sales of Fund shares prior to investment or from redemption proceeds prior to remittance, as applicable. The sales charges retained by the Distributor from the sale of shares and the CDSC retained by the Distributor on the redemption of shares is shown in the following table for the period indicated.
| | | | | | | | | | | | | | | | | | | | |
| Year Ended | | Class A
Front-End
Sales Charges
Retained by
Distributor | | | Class A
Contingent
Deferred Sales
Charges
Retained by
Distributor | | | Class B
Contingent
Deferred Sales
Charges
Retained by
Distributor | | | Class C
Contingent
Deferred Sales
Charges
Retained by
Distributor | | | Class R
Contingent
Deferred Sales
Charges
Retained by
Distributor | |
October 31, 2014 | | $ | 333,734 | | | $ | 3,192 | | | $ | 46,201 | | | $ | 9,098 | | | $ | 1,397 | |
Waivers and Reimbursements of Expenses. The Manager will waive fees and/or reimburse Fund expenses in an amount equal to the indirect management fees incurred through the Fund’s investment in IMMF. During the year ended October 31, 2014, the Manager waived fees and/or reimbursed the Fund $16,085 for IMMF management fees.
The Transfer Agent has contractually agreed to limit transfer and shareholder servicing agent fees for Classes B, C, R and Y shares to 0.35% of average annual net assets per class and for Class A shares to 0.30% of average annual net assets of the class. The limit was removed on February 28, 2014.
During the year ended October 31, 2014, the Transfer Agent waived transfer and shareholder servicing agent fees as follows:
| | | | |
Class A | | $ | 36,160 | |
Class B | | | 21,773 | |
Class C | | | 3,211 | |
Class Y | | | 8,442 | |
These undertakings may be modified or terminated as set forth according to the terms in the prospectus.
6. Pending Litigation
In 2009, seven class action lawsuits were filed in the U.S. District Court for the District of Colorado against OppenheimerFunds, Inc. (“OFI”), OppenheimerFunds Distributor, Inc., the Fund’s principal underwriter and distributor (the “Distributor”), and certain funds (but not including the Fund) advised by OFI Global Asset Management, Inc. and distributed by the Distributor (the “Defendant Funds”). The lawsuits also named as defendants certain officers and current and former trustees of the respective Defendant Funds. The lawsuits raised claims
36 OPPENHEIMER SMALL- & MID- CAP VALUE FUND
6. Pending Litigation (Continued)
under federal securities laws and alleged, among other things, that the disclosure documents of the respective Defendant Funds contained misrepresentations and omissions and that the respective Defendant Funds’ investment policies were not followed. The plaintiffs in these actions sought unspecified damages, equitable relief and awards of attorneys’ fees and litigation expenses. The Defendant Funds’ Boards of Trustees also engaged counsel to represent the Funds and the present and former Independent Trustees named in those suits. In March 2014, the parties in six of these lawsuits executed stipulations and agreements of settlement resolving those actions. In July 2014, the court entered an order and final judgment approving the settlements as fair, reasonable and adequate. The settlements do not resolve a seventh outstanding lawsuit relating to Oppenheimer Rochester California Municipal Fund (the “California Fund Suit”). OFI believes the California Fund Suit is without legal merit and is defending the suit vigorously. While it is premature to render any opinion as to the outcome in the California Fund Suit, or whether any costs that OFI may bear in defending the California Fund Suit might not be reimbursed by insurance, OFI believes the California Fund Suit should not impair the ability of OFI or the Distributor to perform their respective duties to the Fund, and that the outcome of the California Fund Suit should not have any material effect on the operations of any of the Oppenheimer Funds.
37 OPPENHEIMER SMALL- & MID- CAP VALUE FUND
| | |
REPORT OF INDEPENDENT REGISTERED PUBLIC ACCOUNTING FIRM | | |
| | |
The Board of Trustees and Shareholders of Oppenheimer Quest for Value Funds:
We have audited the accompanying statement of assets and liabilities of Oppenheimer Small- & Mid- Cap Value Fund (a series of Oppenheimer Quest for Value Funds), including the statement of investments, as of October 31, 2014, and the related statement of operations for the year then ended, the statements of changes in net assets for each of the years in the two-year period then ended, and the financial highlights for each of the years or periods in the five-year period then ended. These financial statements and financial highlights are the responsibility of the Fund’s management. Our responsibility is to express an opinion on these financial statements and financial highlights based on our audits.
We conducted our audits in accordance with the standards of the Public Company Accounting Oversight Board (United States). Those standards require that we plan and perform the audit to obtain reasonable assurance about whether the financial statements and financial highlights are free of material misstatement. An audit includes examining, on a test basis, evidence supporting the amounts and disclosures in the financial statements. Our procedures included confirmation of securities owned as of October 31, 2014, by correspondence with the custodian, transfer agent and brokers, or by other appropriate auditing procedures where replies from brokers were not received. An audit also includes assessing the accounting principles used and significant estimates made by management, as well as evaluating the overall financial statement presentation. We believe that our audits provide a reasonable basis for our opinion.
In our opinion, the financial statements and financial highlights referred to above present fairly, in all material respects, the financial position of Oppenheimer Small- & Mid- Cap Value Fund as of October 31, 2014, the results of its operations for the year then ended, the changes in its net assets for each of the years in the two-year period then ended, and the financial highlights for each of the years or periods in the five-year period then ended, in conformity with U.S. generally accepted accounting principles.
KPMG LLP
Denver, Colorado
December 22, 2014
38 OPPENHEIMER SMALL- & MID- CAP VALUE FUND
| | |
| FEDERAL INCOME TAX INFORMATION Unaudited | | |
| | |
In early 2014, if applicable, shareholders of record received information regarding all dividends and distributions paid to them by the Fund during calendar year 2013.
Dividends, if any, paid by the Fund during the fiscal year ended October 31, 2014 which are not designated as capital gain distributions should be multiplied by the maximum amount allowable but not less than 100% to arrive at the amount eligible for the corporate dividend-received deduction.
A portion, if any, of the dividends paid by the Fund during the fiscal year ended October 31, 2014 which are not designated as capital gain distributions are eligible for lower individual income tax rates to the extent that the Fund has received qualified dividend income as stipulated by recent tax legislation. The maximum amount allowable but not less than $27,573,838 of the Fund’s fiscal year taxable income may be eligible for the lower individual income tax rates. In early 2014, shareholders of record received information regarding the percentage of distributions that are eligible for lower individual income tax rates.
Recent tax legislation allows a regulated investment company to designate distributions not designated as capital gain distributions, as either interest related dividends or short-term capital gain dividends, both of which are exempt from the U.S. withholding tax applicable to non U.S. taxpayers. For the fiscal year ended October 31, 2014, the maximum amount allowable but not less than $4,283 of the ordinary distributions to be paid by the Fund qualifies as an interest related dividend.
The foregoing information is presented to assist shareholders in reporting distributions received from the Fund to the Internal Revenue Service. Because of the complexity of the federal regulations which may affect your individual tax return and the many variations in state and local tax regulations, we recommend that you consult your tax advisor for specific guidance.
39 OPPENHEIMER SMALL- & MID- CAP VALUE FUND
| | |
| BOARD APPROVAL OF THE FUND’S INVESTMENT ADVISORY AND SUB-ADVISORY AGREEMENTS Unaudited | | |
| | |
The Fund has entered into an investment advisory agreement with OFI Global Asset Management, Inc. (“OFI Global” or the “Adviser”), a wholly-owned subsidiary of OppenheimerFunds, Inc. (“OFI” or the “Sub-Adviser”) (“OFI Global” and “OFI” together the “Managers”) and OFI Global has entered into a sub-advisory agreement with OFI whereby OFI provides investment sub-advisory services to the Fund (collectively, the “Agreements”). Each year, the Board of Trustees (the “Board”), including a majority of the independent Trustees, is required to determine whether to renew the Agreements. The Investment Company Act of 1940, as amended, requires that the Board request and evaluate, and that the Managers provide, such information as may be reasonably necessary to evaluate the terms of the Agreements. The Board employs an independent consultant to prepare a report that provides information, including comparative information that the Board requests for that purpose. In addition to in-person meetings focused on this evaluation, the Board receives information throughout the year regarding Fund services, fees, expenses and performance.
The Adviser, Sub-Adviser and the independent consultant provided information to the Board on the following factors: (i) the nature, quality and extent of the Managers’ services, (ii) the investment performance of the Fund and the Managers, (iii) the fees and expenses of the Fund, including comparative expense information, (iv) the profitability of the Managers and their affiliates, including an analysis of the cost of providing services, (v) whether economies of scale are realized as the Fund grows and whether fee levels reflect these economies of scale for Fund investors and (vi) other benefits to the Managers from their relationship with the Fund. The Board was aware that there are alternatives to retaining the Managers.
Outlined below is a summary of the principal information considered by the Board as well as the Board’s conclusions.
Nature, Quality and Extent of Services. The Board considered information about the nature, quality and extent of the services provided to the Fund and information regarding the Managers’ key personnel who provide such services. The Sub-Adviser’s duties include providing the Fund with the services of the portfolio managers and the Sub-Adviser’s investment team, who provide research, analysis and other advisory services in regard to the Fund’s investments; securities trading services; oversight of third-party service providers; monitoring compliance with applicable Fund policies and procedures and adherence to the Fund’s investment restrictions; and risk management. The Managers are responsible for providing certain administrative services to the Fund as well. Those services include providing and supervising all administrative and clerical personnel who are necessary in order to provide effective corporate administration for the Fund; compiling and maintaining records with respect to the Fund’s operations; preparing and filing reports required by the Securities and Exchange Commission; preparing periodic reports regarding the operations of the Fund for its shareholders; preparing proxy materials for shareholder meetings; and preparing the registration statements required by Federal and state securities laws for the sale of the Fund’s shares. The Managers also provide the Fund with office space, facilities and equipment.
The Board also considered the quality of the services provided and the quality of the Managers’ resources that are available to the Fund. The Board took account of the fact that the Sub-Adviser has had over fifty years of experience as an investment adviser and that its assets under management rank it among the top mutual fund managers in the United States. The Board evaluated the Sub-Adviser’s advisory, administrative, accounting, legal, compliance
40 OPPENHEIMER SMALL- & MID- CAP VALUE FUND
services and risk management, and information the Board has received regarding the experience and professional qualifications of the Managers’ key personnel and the size and functions of its staff. In its evaluation of the quality of the portfolio management services provided, the Board considered the experience of Laton Spahr and Eric Hewitt, the portfolio managers for the Fund, and the Sub-Adviser’s investment team and analysts. The Board members also considered the totality of their experiences with the Managers as directors or trustees of the Fund and other funds advised by the Managers. The Board considered information regarding the quality of services provided by affiliates of the Managers, which its members have become knowledgeable about in connection with the renewal of the Fund’s service agreements. The Board concluded, in light of the Managers’ experience, reputation, personnel, operations and resources that the Fund benefits from the services provided under the Agreements.
Investment Performance of the Adviser and the Fund. Throughout the year, the Adviser provided information on the investment performance of the Fund, including comparative performance information. The Board also reviewed information, prepared by the Adviser and by the independent consultant, comparing the Fund’s historical performance to relevant market indices and to the performance of other retail funds in the mid-cap value category. The Board noted that the Fund’s one-year performance was better than its category median although its three-, five- and ten-year performance was below its category median.
Costs of Services by the Adviser. The Board reviewed the fees paid to the Adviser and the other expenses borne by the Fund. The independent consultant provided comparative data in regard to the fees and expenses of the Fund and other retail front-end load mid-cap value funds with comparable asset levels and distribution features. The Fund’s contractual management fees were lower than its peer group median and category median. The Fund’s total expenses were higher than its peer group median and category median.
Economies of Scale and Profits Realized by the Managers. The Board considered information regarding OFI Global’s costs in serving as the Fund’s investment adviser, including the costs associated with the personnel and systems necessary to manage the Fund, and information regarding the Managers’ profitability from their relationship with the Fund. The Board reviewed whether the Managers may realize economies of scale in managing and supporting the Fund. The Board noted that the Fund currently has management fee breakpoints, which are intended to share with Fund shareholders economies of scale that may exist as the Fund’s assets grow.
Other Benefits to the Managers. In addition to considering the profits realized by the Managers, the Board considered information that was provided regarding the direct and indirect benefits the Managers receive as a result of their relationship with the Fund, including compensation paid to the Managers’ affiliates and research provided to the Adviser in connection with permissible brokerage arrangements (soft dollar arrangements). The Board also considered that the Managers must be able to pay and retain experienced professional personnel at competitive rates to provide quality services to the Fund.
Conclusions. These factors were also considered by the independent Trustees meeting separately from the full Board, assisted by experienced counsel to the Fund and to the independent Trustees. Fund counsel and the independent Trustees’ counsel are independent of the Managers within the meaning and intent of the Securities and Exchange Commission Rules.
41 OPPENHEIMER SMALL- & MID- CAP VALUE FUND
| | |
| BOARD APPROVAL OF THE FUND’S INVESTMENT ADVISORY AND SUB-ADVISORY AGREEMENTS Unaudited / Continued | | |
| | |
Based on its review of the information it received and its evaluations described above, the Board, including a majority of the independent Trustees, decided to continue the Agreements through September 30, 2015. In arriving at its decision, the Board did not identify any factor or factors as being more important than others, but considered all of the above information, and considered the terms and conditions of the Agreements, including the management fees, in light of all the surrounding circumstances.
42 OPPENHEIMER SMALL- & MID- CAP VALUE FUND
| | |
PORTFOLIO PROXY VOTING POLICIES AND PROCEDURES; UPDATES TO STATEMENTS OF INVESTMENTS Unaudited | | |
| | |
The Fund has adopted Portfolio Proxy Voting Policies and Procedures under which the Fund votes proxies relating to securities (“portfolio proxies”) held by the Fund. A description of the Fund’s Portfolio Proxy Voting Policies and Procedures is available (i) without charge, upon request, by calling the Fund toll-free at 1.800.CALL OPP (225.5677), (ii) on the Fund’s website at www.oppenheimerfunds.com, and (iii) on the SEC’s website at www.sec.gov. In addition, the Fund is required to file Form N-PX, with its complete proxy voting record for the 12 months ended June 30th, no later than August 31st of each year. The Fund’s voting record is available (i) without charge, upon request, by calling the Fund toll-free at 1.800.CALL OPP (225.5677), and (ii) in the Form N-PX filing on the SEC’s website at www.sec.gov.
The Fund files its complete schedule of portfolio holdings with the SEC for the first quarter and the third quarter of each fiscal year on Form N-Q. The Fund’s Form N-Q filings are available on the SEC’s website at www.sec.gov. Those forms may be reviewed and copied at the SEC’s Public Reference Room in Washington, D.C. Information on the operation of the Public Reference Room may be obtained by calling 1-800-SEC-0330.
Householding—Delivery of Shareholder Documents
This is to inform you about OppenheimerFunds’ “householding” policy. If more than one member of your household maintains an account in a particular fund, OppenheimerFunds will mail only one copy of the fund’s prospectus (or, if available, the fund’s summary prospectus), annual and semiannual report and privacy policy. The consolidation of these mailings, called householding, benefits your fund through reduced mailing expense, and benefits you by reducing the volume of mail you receive from OppenheimerFunds. Householding does not affect the delivery of your account statements.
Please note that we will continue to household these mailings for as long as you remain an OppenheimerFunds shareholder, unless you request otherwise. If you prefer to receive multiple copies of these materials, please call us at 1.800.CALL-OPP (225-5677). You may also notify us in writing or via email. We will begin sending you individual copies of the prospectus (or, if available, the summary prospectus), reports and privacy policy within 30 days of receiving your request to stop householding.
43 OPPENHEIMER SMALL- & MID- CAP VALUE FUND
| | |
| TRUSTEES AND OFFICERS Unaudited | | |
| | |
| | |
Name, Position(s) Held with
the Fund, Length of
Service, Year of Birth | | Principal Occupation(s) During the Past 5 Years; Other Trusteeships/Directorships Held; Number of Portfolios in the Fund Complex Currently Overseen |
| |
| INDEPENDENT TRUSTEES | | The address of each Trustee in the chart below is 6803 S. Tucson Way, Centennial, Colorado 80112-3924. Each Trustee serves for an indefinite term, or until his or her resignation, retirement, death or removal. |
| |
Brian F. Wruble,
Chairman of the Board of
Trustees (since 2007), Trustee (since 2001) Year of Birth: 1943 | | Director and Vice Chairman of Community Foundation of the Florida Keys (non-profit) (since July 2012); Trustee of the Board of Trustees, The Jackson Laboratory (non-profit) (1991-2011 and since May 2014); Chairman Emeritus (since August 2011) of The Jackson Laboratory (non-profit); Director of Special Value Opportunities Fund, LLC (registered investment company) (affiliate of the Sub-Adviser’s parent company) (since September 2004); Member of Zurich Insurance Group’s Investment Management Advisory Council (insurance) (since 2004); Treasurer (since 2007) and Trustee of the Institute for Advanced Study (non-profit educational institute) (since May 1992); General Partner of Odyssey Partners, L.P. (hedge fund) (September 1995-December 2007); Special Limited Partner of Odyssey Investment Partners, LLC (private equity investment) (January 1999-September 2004). Oversees 52 portfolios in the OppenheimerFunds complex. Mr. Wruble has served on the Boards of certain Oppenheimer funds since April 2001, during which time he has become familiar with the Fund’s (and other Oppenheimer funds’) financial, accounting, regulatory and investment matters and has contributed to the Boards’ deliberations. |
| |
David K. Downes,
Trustee (since 2005) Year of Birth: 1940 | | Director of THL Credit Inc. (since June 2009); Chief Executive Officer and Board Member of Community Capital Management (investment management company) (since January 2004); President of The Community Reinvestment Act Qualified Investment Fund (investment management company) (since 2004); Director of Actua Corporation (information technology company) (since October 2003); formerly, Independent Chairman GSK Employee Benefit Trust (April 2006-June 2013); Director of Correctnet (January 2006-2007); Independent Chairman of the Board of Trustees of Quaker Investment Trust (registered investment company) (2004-2007); Chief Operating Officer and Chief Financial Officer of Lincoln National Investment Companies, Inc. (subsidiary of Lincoln National Corporation, a publicly traded company) and Delaware Investments U.S., Inc. (investment management subsidiary of Lincoln National Corporation) (1993-2003); President, Chief Executive Officer and Trustee of Delaware Investment Family of Funds (1993-2003); President and Board Member of Lincoln National Convertible Securities Funds, Inc. and the Lincoln National Income Funds, TDC (1993-2003); Chairman and Chief Executive Officer of Retirement Financial Services, Inc. (registered transfer agent and investment adviser and subsidiary of Delaware Investments U.S., Inc.) (1993-2003); President and Chief Executive Officer of Delaware Service Company, Inc. (1995-2003); Chief Administrative Officer, Chief Financial Officer, Vice Chairman and Director of Equitable Capital Management Corporation (investment subsidiary of Equitable Life Assurance Society) (1985-1992); Corporate Controller of Merrill Lynch Company (financial services holding company) (1977-1985); held the following positions at the Colonial Penn Group, Inc. (insurance company): Corporate Budget Director (1974-1977), Assistant Treasurer (1972-1974) and Director of Corporate Taxes (1969-1972); held the following positions at Price Waterhouse Company (financial services |
44 OPPENHEIMER SMALL- & MID- CAP VALUE FUND
| | |
David K. Downes,
Continued | | firm): Tax Manager (1967-1969), Tax Senior (1965-1967) and Staff Accountant (1963-1965); United States Marine Corps (1957-1959). Oversees 52 portfolios in the OppenheimerFunds complex. Mr. Downes has served on the Boards of certain Oppenheimer funds since December 2005, during which time he has become familiar with the Fund’s (and other Oppenheimer funds’) financial, accounting, regulatory and investment matters and has contributed to the Boards’ deliberations. |
| |
Matthew P. Fink,
Trustee (since 2009) Year of Birth: 1941 | | Trustee of the Committee for Economic Development (policy research foundation) (2005-2011); Director of ICI Education Foundation (education foundation) (October 1991-August 2006); President of the Investment Company Institute (trade association) (October 1991-June 2004); Director of ICI Mutual Insurance Company (insurance company) (October 1991-June 2004); Author of The Rise of Mutual Funds: An Insider’s View published by Oxford University Press (second edition 2010). Oversees 52 portfolios in the OppenheimerFunds complex. Mr. Fink has served on the Boards of certain Oppenheimer funds since January 2005, during which time he has become familiar with the Fund’s (and other Oppenheimer funds’) financial, accounting, regulatory and investment matters and has contributed to the Boards’ deliberations. |
| |
Edmund P. Giambastiani, Jr.,
Trustee (since 2013) Year of Birth: 1948 | | Advisory Board Member of the Maxwell School of Citizenship and Public Affairs of Syracuse University (since April 2012); Director of Mercury Defense Systems Inc. (information technology) (August 2011-February 2013); Trustee of the U.S. Naval Academy Foundation (since November 2010); Advisory Board Member of the Massachusetts Institute of Technology Lincoln Laboratory (federally-funded research development center) (since May 2010); Director of The Boeing Company (aerospace and defense) (since October 2009); Trustee of MITRE Corporation (federally-funded research development center) (since September 2008); Independent Director of QinetiQ Group Plc (defense technology and security) (February 2008-August 2011); Director of Monster Worldwide, Inc. (on-line career services) (since January 2008, Lead Director since June 2011); Chairman of Alenia North America, Inc. (military and defense products) (January 2008-October 2009); Director of SRA International, Inc. (information technology and services) (January 2008-July 2011); President of Giambastiani Group LLC (national security and energy consulting) (since October 2007); United States Navy, career nuclear submarine officer (June 1970-October 2007), Vice Chairman of the Joint Chiefs of Staff (2005-October 2007), NATO Supreme Allied Commander Transformation (2003-2005), Commander, U.S. Joint Forces Command (2002-2005). Since his retirement from the U.S. Navy in October 2007, Admiral Giambastiani has also served on numerous U.S. Government advisory boards, investigations and task forces for the Secretaries of Defense, State and Interior and the Central Intelligence Agency. Oversees 52 portfolios in the OppenheimerFunds complex. Admiral Giambastiani has served on the Boards of certain Oppenheimer funds since February 2013, including as an Advisory Board Member for certain Oppenheimer funds, during which time he has become familiar with the Fund’s (and other Oppenheimer funds’) financial, accounting, regulatory and investment matters and has contributed to the Boards’ deliberations. For purposes of this report, Admiral Giambastiani is identified as a Trustee. |
45 OPPENHEIMER SMALL- & MID- CAP VALUE FUND
| | |
| |
| TRUSTEES AND OFFICERS Unaudited / Continued | | |
| | |
Elizabeth Krentzman,
Trustee (since 2014) Year of Birth: 1959 | | Advisory Board Member of the Securities and Exchange Commission Historical Society (since 2007); held the following positions at Deloitte & Touche LLP: Principal and Chief Regulatory Advisor for Asset Management Services (2007 - 2014) and U.S. Mutual Fund Leader (2011 - 2014); General Counsel of the Investment Company Institute (trade association) (June 2004 - April 2007); held the following positions at Deloitte & Touche LLP: National Director of the Investment Management Regulatory Consulting Practice (1997 - 2004), Principal (2003 - 2004), Director (1998 - 2003) and Senior Manager (1997 - 1998); Assistant Director of the Division of Investment Management – Office of Disclosure and Investment Adviser Regulation (1996 - 1997) and various positions with the Division of Investment Management – Office of Regulatory Policy (1991 - 1996) of the U.S. Securities and Exchange Commission; Associate at Ropes & Gray (1987 - 1991); former Chair of the Investment Management Subcommittee of the Washington, D.C. Bar. Oversees 52 portfolios in the OppenheimerFunds complex. Ms. Krentzman has served on the Boards of certain Oppenheimer funds since August 2014, during which time she has become familiar with the Fund’s (and other Oppenheimer funds’) financial, accounting, regulatory and investment matters and has contributed to the Boards’ deliberations. |
| |
Mary F. Miller,
Trustee (since 2009) Year of Birth: 1942 | | Trustee of International House (not-for-profit) (since June 2007); Trustee of the American Symphony Orchestra (not-for-profit) (October 1998-November 2011); and Senior Vice President and General Auditor of American Express Company (financial services company) (July 1998-February 2003). Oversees 52 portfolios in the OppenheimerFunds complex. Ms. Miller has served on the Boards of certain Oppenheimer funds since August 2004, during which time she has become familiar with the Fund’s (and other Oppenheimer funds’) financial, accounting, regulatory and investment matters and has contributed to the Boards’ deliberations. |
| |
Joel W. Motley,
Trustee (since 2009) Year of Birth: 1952 | | Member of the Vestry of Trinity Wall Street (since April 2012); Director of Southern Africa Legal Services Foundation (since March 2012); Board Member of Pulitzer Center for Crisis Reporting (non-profit journalism) (since December 2010); Managing Director of Public Capital Advisors, LLC (privately-held financial advisor) (since January 2006); Managing Director of Carmona Motley, Inc. (privately-held financial advisor) (since January 2002); Director of Columbia Equity Financial Corp. (privately-held financial advisor) (2002-2007); Managing Director of Carmona Motley Hoffman Inc. (privately-held financial advisor) (January 1998-December 2001); Member of the Finance and Budget Committee of the Council on Foreign Relations, Member of the Investment Committee and Board of Human Rights Watch and Member of the Investment Committee and Board of Historic Hudson Valley. Oversees 52 portfolios in the OppenheimerFunds complex. Mr. Motley has served on the Boards of certain Oppenheimer funds since October 2002, during which time he has become familiar with the Fund’s (and other Oppenheimer funds’) financial, accounting, regulatory and investment matters and has contributed to the Boards’ deliberations. |
| |
Joanne Pace,
Trustee (since 2012) Year of Birth: 1958 | | Board Director of Horizon Blue Cross Blue Shield of New Jersey (since November 2012); Advisory Board Director of The Alberleen Group LLC (since March 2012); Advisory Board Director of The Agile Trading Group LLC (since March 2012); Advisory Council Member of 100 Women in Hedge Funds (non-profit) (since December 2012); Advisory Council Member of Morgan Stanley |
46 OPPENHEIMER SMALL- & MID- CAP VALUE FUND
| | |
Joanne Pace,
Continued | | Children’s Hospital (non-profit) (since May 2012); Board Director of The Komera Project (non-profit) (since April 2012); New York Advisory Board Director of Peace First (non-profit) (since March 2010); Senior Advisor of SECOR Asset Management, LP (2010-2011); Managing Director and Chief Operating Officer of Morgan Stanley Investment Management (2006-2010); Partner and Chief Operating Officer of FrontPoint Partners, LLC (hedge fund) (2005-2006); held the following positions at Credit Suisse: Managing Director (2003-2005); Global Head of Human Resources and member of Executive Board and Operating Committee (2004-2005), Global Head of Operations and Product Control (2003-2004); held the following positions at Morgan Stanley: Managing Director (1997-2003), Controller and Principal Accounting Officer (1999-2003); Chief Financial Officer (temporary assignment) for the Oversight Committee, Long Term Capital Management (1998-1999). Lead Independent Director and Chair of the Audit and Nominating Committee of The Global Chartist Fund, LLC of Oppenheimer Asset Management (2011-2012); Board Director of Managed Funds Association (2008-2010); Board Director of Morgan Stanley Foundation (2007-2010) and Investment Committee Chair (2008-2010). Oversees 52 portfolios in the OppenheimerFunds complex. Ms. Pace has served on the Boards of certain Oppenheimer funds since November 2012, including as an Advisory Board Member for certain Oppenheimer funds, during which time she has become familiar with the Fund’s (and other Oppenheimer funds’) financial, accounting, regulatory and investment matters and has contributed to the Board’s deliberations. For purposes of this report, Ms. Pace is identified as a Trustee. |
| |
Peter I. Wold,
Trustee (since 2009) Year of Birth: 1948 | | Director of Arch Coal, Inc. (since 2010); President of Wold Oil Properties, Inc. (oil and gas exploration and production company) (since 1994); Vice President of American Talc Company, Inc. (talc mining and milling) (since 1999); Managing Member of Hole-in-the-Wall Ranch (cattle ranching) (since 1979); Director and Chairman of Wyoming Enhanced Oil Recovery Institute Commission (enhanced oil recovery study) (2004-2012); Director and Chairman of the Denver Branch of the Federal Reserve Bank of Kansas City (1993-1999); and Director of PacifiCorp. (electric utility) (1995-1999). Oversees 52 portfolios in the OppenheimerFunds complex. Mr. Wold has served on the Boards of certain Oppenheimer funds since August 2005, during which time he has become familiar with the Fund’s (and other Oppenheimer funds’) financial, accounting, regulatory and investment matters and has contributed to the Boards’ deliberations. |
| |
| | | |
| |
| INTERESTED TRUSTEE | | Mr. Glavin is an “Interested Trustee” because he is affiliated with the Manager and the Sub-Adviser by virtue of his positions as director of the Sub-Adviser, and as a shareholder of the Sub-Adviser’s parent company. As a Trustee, he serves for an indefinite term, or until his resignation, retirement, death or removal. Mr. Glavin’s address is 225 Liberty Street, 11th Floor, New York, New York 10281-1008. |
| |
William F. Glavin, Jr.,
Trustee (since 2009) Year of Birth: 1958 | | Chairman of the Sub-Adviser (since July 2014 and December 2009-December 2012) and Director of the Sub-Adviser (since January 2009); Chairman, Director and Chief Executive Officer (January 2013-June 2014) of the Manager; President of the Manager (January 2013-May 2013); Chief Executive Officer (January 2009-December 2012); President of the Sub-Adviser (May 2009-December 2012); Management Director (June 2009-June 2014), President (December 2009-June 2014) and Chief Executive Officer (January 2011-June |
47 OPPENHEIMER SMALL- & MID- CAP VALUE FUND
| | |
| |
| TRUSTEES AND OFFICERS Unaudited / Continued | | |
| | |
William F. Glavin, Jr., Continued | | 2014) of Oppenheimer Acquisition Corp. (“OAC”) (the Sub-Adviser’s parent holding company); Director of Oppenheimer Real Asset Management, Inc. (March 2010-June 2014); Executive Vice President (March 2006-February 2009) and Chief Operating Officer (July 2007-February 2009) of Massachusetts Mutual Life Insurance Company (OAC’s parent company); Director (May 2004-March 2006) and Chief Operating Officer and Chief Compliance Officer (May 2004-January 2005), President (January 2005-March 2006) and Chief Executive Officer (June 2005-March 2006) of Babson Capital Management LLC; Director (March 2005-March 2006), President (May 2003-March 2006) and Chief Compliance Officer (July 2005-March 2006) of Babson Capital Securities, Inc. (a broker-dealer); President (May 2003-March 2006) of Babson Investment Company, Inc.; Director (May 2004-August 2006) of Babson Capital Europe Limited; Director (May 2004-October 2006) of Babson Capital Guernsey Limited; Director (May 2004-March 2006) of Babson Capital Management LLC; Non-Executive Director (March 2005-March 2007) of Baring Asset Management Limited; Director (February 2005-June 2006) Baring Pension Trustees Limited; Director and Treasurer (December 2003-November 2006) of Charter Oak Capital Management, Inc.; Director (May 2006-September 2006) of C.M. Benefit Insurance Company; Director (May 2008-June 2009) and Executive Vice President (June 2007-July 2009) of C.M. Life Insurance Company; President (March 2006-May 2007) of MassMutual Assignment Company; Director (January 2005-December 2006), Deputy Chairman (March 2005-December 2006) and President (February 2005-March 2005) of MassMutual Holdings (Bermuda) Limited; Director (May 2008-June 2009) and Executive Vice President (June 2007-July 2009) of MML Bay State Life Insurance Company; Chief Executive Officer and President (April 2007-January 2009) of MML Distributors, LLC; and Chairman (March 2006-December 2008) and Chief Executive Officer (May 2007-December 2008) of MML Investors Services, Inc. An officer of 91 portfolios in the OppenheimerFunds complex. Mr. Glavin has served on the Boards of certain Oppenheimer funds since December 2009, during which time he has become familiar with the Fund’s (and other Oppenheimer funds’) financial, accounting, regulatory and investment matters and has contributed to the Boards’ deliberations. |
| |
| | | |
| |
| OTHER OFFICERS OF THE FUND | | The addresses of the Officers in the chart below are as follows: for Messrs. Spahr, Hewitt, Steinmetz, Gabinet, Mss. Sexton and Picciotto, 225 Liberty Street, New York, New York 10281-1008, for Mr. Wixted, 6803 S. Tucson Way, Centennial, Colorado 80112-3924. Each Officer serves for an indefinite term or until his or her resignation, retirement, death or removal. |
| |
Laton Spahr, Vice President (since 2013) Year of Birth: 1975 | | Senior Vice President of the Sub-Adviser since March 2013. Senior portfolio manager (2003-2013) and equity analyst (2001-2002) for Columbia Management Investment Advisers, LLC. A portfolio manager and an officer of other portfolios in the OppenheimerFunds complex. |
| |
Eric Hewitt, Vice President (since 2013) Year of Birth: 1971 | | Vice President of the Sub-Adviser (since March 2013). Customer portfolio manager and product manager for Columbia Management Investment Advisors, LLC (2012–2013). Senior Equity Analyst with Diamondback/Harbor Watch Capital Management, LLC (2009–2012) and a Senior Equity Analyst and Portfolio Manager with AllianceBernstein LP (1999–2009). A portfolio manager and an officer in the OppenheimerFunds complex. |
48 OPPENHEIMER SMALL- & MID- CAP VALUE FUND
| | |
Arthur P. Steinmetz,
President and Principal
Executive Officer (since 2014) Year of Birth: 1958 | | CEO and Chairman of the Manager (since July 2014), President of the Manager (since May 2013), a Director of the Manager (since January 2013), Director of the Sub-Adviser (since July 2014), President, Management Director and CEO of Oppenheimer Acquisition Corp. (the Sub-Adviser’s parent holding company) (since July 2014), and President and Director of OFI SteelPath, Inc. (since January 2013). Chief Investment Officer of the OppenheimerFunds advisory entities from (January 2013-December 2013); Executive Vice President of the Manager (January 2013-May 2013); Chief Investment Officer of the Sub-Adviser (October 2010-December 2012); Chief Investment Officer, Fixed-Income, of the Sub-Adviser (April 2009-October 2010); Executive Vice President of the Sub-Adviser (October 2009-December 2012); Director of Fixed Income of the Sub-Adviser (January 2009-April 2009); and a Senior Vice President of the Sub-Adviser (March 1993-September 2009). An officer of 91 portfolios in the OppenheimerFunds complex. |
| |
Arthur S. Gabinet,
Secretary and Chief Legal
Officer (since 2011) Year of Birth: 1958 | | Executive Vice President, Secretary and General Counsel of the Manager (since January 2013); General Counsel OFI SteelPath, Inc. (since January 2013); Executive Vice President (May 2010-December 2012) and General Counsel (since January 2011) of the Sub-Adviser; General Counsel of the Distributor (since January 2011); General Counsel of Centennial Asset Management Corporation (January 2011-December 2012); Executive Vice President (January 2011-December 2012) and General Counsel of HarbourView Asset Management Corporation (since January 2011); Assistant Secretary (since January 2011) and Director (since January 2011) of OppenheimerFunds International Ltd. and OppenheimerFunds plc; Director of Oppenheimer Real Asset Management, Inc. (January 2011-December 2012) and General Counsel (since January 2011); Executive Vice President (January 2011-December 2011) and General Counsel of Shareholder Financial Services, Inc. and Shareholder Services, Inc. (since January 2011); Executive Vice President (January 2011-December 2012) and General Counsel of OFI Private Investments Inc. (since January 2011); Vice President of OppenheimerFunds Legacy Program (January 2011-December 2011); Executive Vice President (January 2011-December 2012) and General Counsel of OFI Institutional Asset Management, Inc. (since January 2011); General Counsel, Asset Management of the Sub-Adviser (May 2010-December 2010); Principal, The Vanguard Group (November 2005-April 2010); District Administrator, U.S. Securities and Exchange Commission (January 2003-October 2005). An officer of 91 portfolios in the OppenheimerFunds complex. |
| |
Jennifer Sexton,
Vice President and Chief
Business Officer (since 2014) Year of Birth: 1969 | | Senior Vice President of OppenheimerFunds Distributor, Inc. (since June 2014); Vice President of OppenheimerFunds Distributor, Inc. (April 2006-June 2014); Vice President of the Sub-Adviser (January 1998-March 2006); Assistant Vice President of the Sub-Adviser (October 1991-December 1998). An officer of 91 portfolios in the OppenheimerFunds complex. |
| |
Mary Ann Picciotto,
Chief Compliance Officer and
Chief Anti-Money Laundering
Officer (since 2014) Year of Birth: 1973 | | Senior Vice President and Chief Compliance Officer of the Manager (since March 2014); Chief Compliance Officer of the Sub-Adviser, OFI SteelPath, Inc., OFI Global Trust Company, OFI Global Institutional, Inc., Oppenheimer Real Asset Management, Inc., OFI Private Investments, Inc., Harborview Asset Management Corporation, Trinity Investment Management Corporation, and Shareholder Services, Inc. (since March 2014); Managing Director of Morgan Stanley Investment Management Inc. and certain of its various affiliated |
49 OPPENHEIMER SMALL- & MID- CAP VALUE FUND
| | |
| |
| TRUSTEES AND OFFICERS Unaudited / Continued | | |
| | |
Mary Ann Picciotto,
Continued | | entities; Chief Compliance Officer of various Morgan Stanley Funds (May 2010-January 2014); Chief Compliance Officer of Morgan Stanley Investment Management Inc. (April 2007-January 2014). An officer of 91 portfolios in the OppenheimerFunds complex. |
| |
Brian W. Wixted,
Treasurer and Principal
Financial & Accounting
Officer (since 1999) Year of Birth: 1959 | | Senior Vice President of the Manager (since January 2013); Treasurer of the Sub-Adviser, HarbourView Asset Management Corporation, Shareholder Financial Services, Inc., Shareholder Services, Inc., and Oppenheimer Real Asset Management, Inc. (March 1999-June 2008), OFI Private Investments, Inc. (March 2000-June 2008), OppenheimerFunds International Ltd. and OppenheimerFunds plc (since May 2000), OFI Institutional Asset Management, Inc. (November 2000-June 2008), and OppenheimerFunds Legacy Program (charitable trust program established by the Sub-Adviser) (June 2003-December 2011); Treasurer and Chief Financial Officer of OFI Trust Company (since May 2000); Assistant Treasurer of Oppenheimer Acquisition Corporation (March 1999-June 2008). An officer of 91 portfolios in the OppenheimerFunds complex. |
|
| The Fund’s Statement of Additional Information contains additional information about the Fund’s Trustees and Officers and is available without charge upon request, by calling 1.800.CALL OPP (225.5677). |
50 OPPENHEIMER SMALL- & MID- CAP VALUE FUND
| | |
| |
| OPPENHEIMER SMALL- & MID- CAP VALUE FUND | | |
| | |
| Manager | | OFI Global Asset Management, Inc. |
| |
| Sub-Adviser | | OppenheimerFunds, Inc. |
| |
| Distributor | | OppenheimerFunds Distributor, Inc. |
| |
| Transfer and Shareholder Servicing Agent | | OFI Global Asset Management, Inc. |
| |
| Sub-Transfer Agent | | Shareholder Services, Inc. |
| | DBA OppenheimerFunds Services |
| |
| Independent Registered Public Accounting Firm | | KPMG LLP |
| |
| Legal Counsel | | Kramer Levin Naftalis & Frankel LLP |
© 2014 OppenheimerFunds, Inc. All rights reserved.
51 OPPENHEIMER SMALL- & MID- CAP VALUE FUND
As an Oppenheimer fund shareholder, you are entitled to know how we protect your personal information and how we limit its disclosure.
Information Sources
We obtain nonpublic personal information about our shareholders from the following sources:
| • | | Applications or other forms |
| • | | When you create a user ID and password for online account access |
| • | | When you enroll in eDocs Direct, our electronic document delivery service |
| • | | Your transactions with us, our affiliates or others |
| • | | A software program on our website, often referred to as a “cookie,” which indicates which parts of our site you’ve visited |
| • | | When you set up challenge questions to reset your password online |
If you visit oppenheimerfunds.com and do not log on to the secure account information areas, we do not obtain any personal information about you. When you do log on to a secure area, we do obtain your user ID and password to identify you. We also use this information to provide you with products and services you have requested, to inform you about products and services that you may be interested in and assist you in other ways.
We do not collect personal information through our website unless you willingly provide it to us, either directly by email or in those areas of the website that request information. In order to update your personal information (including your mailing address, email address and phone number) you must first log on and visit your user profile.
If you have set your browser to warn you before accepting cookies, you will receive the warning message with each cookie. You can refuse cookies by turning them off in your browser. However, doing so may limit your access to certain sections of our website.
We use cookies to help us improve and manage our website. For example, cookies help us recognize new versus repeat visitors to the site, track the pages visited, and enable some special features on the website. This data helps us provide a better service for our website visitors.
Protection of Information
We do not disclose any non-public personal information (such as names on a customer list) about current or former customers to anyone, except as permitted by law.
Disclosure of Information
Copies of confirmations, account statements and other documents reporting activity in your fund accounts are made available to your financial advisor (as designated by you). We may also use details about you and your investments to help us, our financial service affiliates, or firms that jointly market their financial products and services with ours, to better serve your investment needs or suggest financial services or educational material that may be of interest to you. If this requires us to provide you with an opportunity to “opt in” or “opt out” of such information sharing with a firm not affiliated with us, you will receive notification on how to do so, before any such sharing takes place.
Right of Refusal
We will not disclose your personal information to unaffiliated third parties (except as permitted by law), unless we first offer you a reasonable opportunity to refuse or “opt out” of such disclosure.
52 OPPENHEIMER SMALL- & MID- CAP VALUE FUND
Internet Security and Encryption
In general, the email services provided by our website are encrypted and provide a secure and private means of communication with us. To protect your own privacy, confidential and/or personal information should only be communicated via email when you are advised that you are using a secure website.
As a security measure, we do not include personal or account information in non-secure emails, and we advise you not to send such information to us in non-secure emails. Instead, you may take advantage of the secure features of our website to encrypt your email correspondence. To do this, you will need to use a browser that supports Secure Sockets Layer (SSL) protocol.
We do not guarantee or warrant that any part of our website, including files available for download, are free of viruses or other harmful code. It is your responsibility to take appropriate precautions, such as use of an anti-virus software package, to protect your computer hardware and software.
| — | | All transactions, including redemptions, exchanges and purchases, are secured by SSL and 128-bit encryption. SSL is used to establish a secure connection between your PC and OppenheimerFunds’ server. It transmits information in an encrypted and scrambled format. |
| — | | Encryption is achieved through an electronic scrambling technology that uses a “key” to code and then decode the data. Encryption acts like the cable converter box you may have on your television set. It scrambles data with a secret code so that no one can make sense of it while it is being transmitted. When the data reaches its destination, the same software unscrambles the data. |
| — | | You can exit the secure area by either closing your browser, or for added security, you can use the Log Out button before you close your browser. |
Other Security Measures
We maintain physical, electronic and procedural safeguards to protect your personal account information. Our employees and agents have access to that information only so that they may offer you products or provide services, for example, when responding to your account questions.
How You Can Help
You can also do your part to keep your account information private and to prevent unauthorized transactions. If you obtain a user ID and password for your account, do not allow it to be used by anyone else. Also, take special precautions when accessing your account on a computer used by others.
Who We Are
This joint notice describes the privacy policies of the Oppenheimer funds, OppenheimerFunds, Inc., each of its investment adviser subsidiaries, OppenheimerFunds Distributor, Inc. and OFI Global Trust Co. It applies to all Oppenheimer fund accounts you presently have, or may open in the future, using your Social Security number—whether or not you remain a shareholder of our funds. This notice was last updated November 2014. In the event it is updated or changed, we will post an updated notice on our website at oppenheimerfunds.com. If you have any questions about this privacy policy, write to us at P.O. Box 5270, Denver, CO 80217-5270, email us by clicking on the Contact Us section of our website at oppenheimerfunds.com or call us at 1.800.CALL OPP (225.5677).
53 OPPENHEIMER SMALL- & MID- CAP VALUE FUND
THIS PAGE INTENTIONALLY LEFT BLANK.
54 OPPENHEIMER SMALL- & MID- CAP VALUE FUND
THIS PAGE INTENTIONALLY LEFT BLANK.
55 OPPENHEIMER SMALL- & MID- CAP VALUE FUND
Item 2. Code of Ethics.
The registrant has adopted a code of ethics that applies to the registrant’s principal executive officer, principal financial officer, principal accounting officer or controller or persons performing similar functions.
Item 3. Audit Committee Financial Expert.
The Board of Trustees of the registrant has determined that David Downes, the Board’s Audit Committee Chairman, is an audit committee financial expert and that Mr. Downes is “independent” for purposes of this Item 3.
Item 4. Principal Accountant Fees and Services.
The principal accountant for the audit of the registrant’s annual financial statements billed $92,400 in fiscal 2014 and $90,500 in fiscal 2013.
The principal accountant for the audit of the registrant’s annual financial statements billed no such fees in fiscal 2014 and $1,500 in fiscal 2013.
The principal accountant for the audit of the registrant’s annual financial statements billed $1,042,959 in fiscal 2014 and $459,080 in fiscal 2013 to the registrant’s investment adviser or any entity controlling, controlled by, or under common control with the adviser that provides ongoing services to the registrant.
Such services include: GIPS attestation procedures, system conversion testing, and entity reorganization
The principal accountant for the audit of the registrant’s annual financial statements billed $44,425 in fiscal 2014 and $36,070 in fiscal 2013.
The principal accountant for the audit of the registrant’s annual financial statements billed $467,462 in fiscal 2014 and $581,620 in fiscal 2013 to the registrant’s investment adviser or any entity controlling, controlled by, or under common control with the adviser that provides ongoing services to the registrant.
Such services include: tax compliance, tax planning and tax advice. Tax compliance generally involves preparation of original and amended tax returns, claims for a refund and tax payment-planning services. Tax planning and tax advice includes assistance with tax audits and appeals, tax advice related to mergers and acquisitions and requests for rulings or technical advice from taxing authorities.
The principal accountant for the audit of the registrant’s annual financial statements billed no such fees in fiscal 2014 and no such fees in fiscal 2013.
The principal accountant for the audit of the registrant’s annual financial statements billed no such fees in fiscal 2014 and no such fees in fiscal 2013 to the registrant’s investment adviser or any entity controlling, controlled by, or under common control with the adviser that provides ongoing services to the registrant.
Such fees would include the cost to the principal accountant of attending audit committee meetings and consultations regarding the registrant’s retirement plan with respect to its Trustees.
| (e) | (1) During its regularly scheduled periodic meetings, the registrant’s audit committee will pre-approve all audit, audit-related, tax and other services to be provided by the principal accountants of the registrant. |
The audit committee has delegated pre-approval authority to its Chairman for any subsequent new engagements that arise between regularly scheduled meeting dates provided that any fees such pre-approved are presented to the audit committee at its next regularly scheduled meeting.
Under applicable laws, pre-approval of non-audit services may be waived provided that: 1) the aggregate amount of all such services provided constitutes no more than five percent of the total amount of fees paid by the registrant to its principal accountant during the fiscal year in which services are provided 2) such services were not recognized by the registrant at the time of engagement as non-audit services and 3) such services are promptly brought to the attention of the audit committee of the registrant and approved prior to the completion of the audit.
(2) 0%
| (f) | Not applicable as less than 50%. |
| (g) | The principal accountant for the audit of the registrant’s annual financial statements billed $1,554,846 in fiscal 2014 and $1,076,770 in fiscal 2013 to the registrant and the registrant’s investment adviser or any entity controlling, controlled by, or under common control with the adviser that provides ongoing services to the registrant related to non-audit fees. Those billings did not include any prohibited non-audit services as defined by the Securities Exchange Act of 1934. |
| (h) | The registrant’s audit committee of the board of Trustees has considered whether the provision of non-audit services that were rendered to the registrant’s investment adviser, |
| | and any entity controlling, controlled by, or under common control with the investment adviser that provides ongoing services to the registrant that were not pre-approved pursuant to paragraph (c)(7)(ii) of Rule 2-01 of Regulation S-X is compatible with maintaining the principal accountant’s independence. No such services were rendered. |
Item 5. Audit Committee of Listed Registrants
Not applicable.
Item 6. Schedule of Investments.
a) Not applicable. The complete schedule of investments is included in Item 1 of this Form N-CSR.
b) Not applicable.
Item 7. Disclosure of Proxy Voting Policies and Procedures for Closed-End Management Investment Companies.
Not applicable.
Item 8. Portfolio Managers of Closed-End Management Investment Companies.
Not applicable.
Item 9. Purchases of Equity Securities by Closed-End Management Investment Company and Affiliated Purchasers.
Not applicable.
Item 10. Submission of Matters to a Vote of Security Holders.
The Fund’s Governance Committee Provisions with Respect to Nominations of Directors/Trustees to the Respective Boards
None
Item 11. Controls and Procedures.
Based on their evaluation of the registrant’s disclosure controls and procedures (as defined in rule 30a-3(c) under the Investment Company Act of 1940 (17 CFR 270.30a-3(c)) as of 10/31/2014, the registrant’s principal executive officer and principal financial officer found the registrant’s disclosure controls and procedures to provide reasonable assurances that information required to be disclosed by the registrant in the reports that it files under the Securities Exchange Act of 1934 (a) is accumulated and communicated to registrant’s management, including its principal executive officer and principal financial officer, to allow timely decisions regarding required disclosure, and (b) is recorded, processed, summarized and reported, within the time periods specified in the rules and forms adopted by the U.S. Securities and Exchange Commission.
There have been no changes in the registrant’s internal controls over financial reporting that occurred during the registrant’s second fiscal quarter of the period covered by this report that have materially affected, or are reasonably likely to materially affect, the registrant’s internal control over financial reporting.
Item 12. Exhibits.
| (a) | (1) Exhibit attached hereto. |
(2) Exhibits attached hereto.
(3) Not applicable.
| (b) | Exhibit attached hereto. |
SIGNATURES
Pursuant to the requirements of the Securities Exchange Act of 1934 and the Investment Company Act of 1940, the registrant has duly caused this report to be signed on its behalf by the undersigned, thereunto duly authorized.
Oppenheimer Quest for Value Funds
| | |
| By: | | /s/ Arthur P. Steinmetz |
| | Arthur P. Steinmetz |
| | Principal Executive Officer |
| |
| Date: | | 12/12/2014 |
Pursuant to the requirements of the Securities Exchange Act of 1934 and the Investment Company Act of 1940, this report has been signed below by the following persons on behalf of the registrant and in the capacities and on the dates indicated.
| | |
| By: | | /s/ Arthur P. Steinmetz |
| | Arthur P. Steinmetz |
| | Principal Executive Officer |
| |
| Date: | | 12/12/2014 |
| |
| By: | | /s/ Brian W. Wixted |
| | Brian W. Wixted |
| | Principal Financial Officer |
| |
| Date: | | 12/12/2014 |