UNITED STATES
SECURITIES AND EXCHANGE COMMISSION
WASHINGTON, D.C. 20549
FORM N-CSR
CERTIFIED SHAREHOLDER REPORT OF REGISTERED MANAGEMENT
INVESTMENT COMPANIES
Investment Company Act file number 811-5225
Oppenheimer Quest for Value Funds
(Exact name of registrant as specified in charter)
6803 South Tucson Way, Centennial, Colorado 80112-3924
(Address of principal executive offices) (Zip code)
Arthur S. Gabinet
OFI Global Asset Management, Inc.
225 Liberty Street, New York, New York 10281-1008
(Name and address of agent for service)
Registrant’s telephone number, including area code: (303) 768-3200
Date of fiscal year end: October 31
Date of reporting period: 10/30/2015
Item 1. Reports to Stockholders.
Table of Contents
Class A Shares
AVERAGE ANNUAL TOTAL RETURNS AT 10/30/15*
| | | | | | | | | | | | |
| | | 1-Year | | | 5-Year | | | 10-Year | |
| | | |
Class A Shares of the Fund without Sales Charge | | | 2.26 | % | | | 4.92 | % | | | 3.45 | % |
| | | |
Class A Shares of the Fund with Sales Charge | | | -3.62 | | | | 3.69 | | | | 2.84 | |
| | | |
S&P 500 Index | | | 5.20 | | | | 14.33 | | | | 7.85 | |
| | | |
Russell 1000 Index | | | 4.86 | | | | 14.32 | | | | 7.98 | |
| | | |
MSCI All County World Index (ex-U.S.) | | | -4.68 | | | | 2.60 | | | | 4.16 | |
| | | |
Barclays U.S. Aggregate Bond Index | | | 1.96 | | | | 3.03 | | | | 4.72 | |
| | | |
Barclays Multiverse Index (ex-U.S.) | | | -6.72 | | | | -1.08 | | | | 3.28 | |
| | | |
Reference Index | | | -0.60 | | | | 5.72 | | | | 5.92 | |
Performance data quoted represents past performance, which does not guarantee future results. The investment return and principal value of an investment in the Fund will fluctuate so that an investor’s shares, when redeemed, may be worth more or less than their original cost. Fund returns include changes in share price, reinvested distributions, and a 5.75% maximum applicable sales charge except where “without sales charge” is indicated. Current performance may be lower or higher than the performance quoted. Returns do not consider capital gains or income taxes on an individual’s investment. For performance data current to the most recent month-end, visit oppenheimerfunds.com or call 1.800.CALL OPP (225.5677).
*October 30, 2015, was the last business day of the Fund’s fiscal year. See Note 2 of the accompanying Notes to Financial Statements. Index returns are calculated through October 31, 2015.
2 OPPENHEIMER GLOBAL ALLOCATION FUND
Fund Performance Discussion
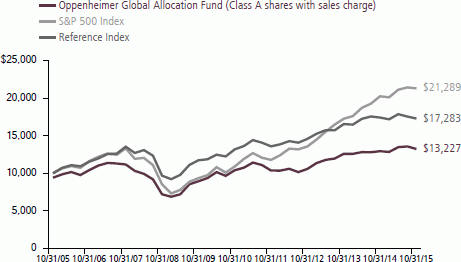
The Fund’s Class A shares (without sales charge) produced a return of 2.26% during the reporting period. The Fund outperformed its Reference Index (the “Index”), a customized weighted index currently comprised of 30% of the Russell 1000 Index, 30% of the MSCI All Country World Index (ex-U.S.), 20% of the Barclays U.S. Aggregate Bond Index, and 20% of the Barclays Multiverse Index (ex-U.S.), which returned -0.60%.
MARKET OVERVIEW
In 2014, growth in the U.S. continued at a higher pace than any other developed economy and employment gains remained positive. Growth in the rest of the world was subdued, however, with major developed economies like the Eurozone and Japan continuing to disappoint due to weak aggregate demand. The biggest surprise of the reporting period and possibly all of 2014 was the precipitous fall in the price of crude oil. Weak demand amid tepid global growth was responsible for part of the drop, but significantly, the U.S. energy revolution is
increasingly helping to insulate global and domestic energy supplies from shocks in the Middle East and elsewhere.
The start of 2015 was marked by cooling U.S. growth after the positive results in 2014. The dollar continued to strengthen significantly during this time against most of the U.S.’s major trading partners, which acted as a drag on growth. Businesses, especially U.S. firms with revenues
COMPARISON OF CHANGE IN VALUE OF $10,000 HYPOTHETICAL INVESTMENTS IN:
3 OPPENHEIMER GLOBAL ALLOCATION FUND
dependent on exporting goods and services, cited this as a headwind. European Central Bank (“ECB”) President Mario Draghi announced the purchase of €60 billion a month in sovereign bonds from Eurozone countries for at least 19 months, a form of quantitative easing (“QE”) that is projected to increase the ECB’s balance sheet by over €1 trillion. The announcement and implementation of these extraordinary monetary policies had a significant impact on financial markets, with European markets rallying and the euro falling against most major trading partners. The Federal Reserve (the “Fed”) appeared to remain on track to raise U.S. rates during 2015, but made it clear that it will remain flexible on the timing and the extent of rate hikes.
Over the second half of the reporting period, major risk asset classes were vulnerable to profit taking as negative macroeconomic catalysts emerged. Two stole the show. Uncertainty around the global economic impact and extent of China’s ongoing economic slowdown led the way, with many fearing the stunning collapse in commodity prices signals more pain ahead. The timing of when the Fed would raise interest rates was a close second. These issues resulted in market volatility over the second half of the reporting period.
FUND REVIEW
Considering an improving macro environment in Europe, attractive valuations, and additional policy support from the ECB, we decreased our allocation to U.S. equities and redeployed capital into international equities. This proved to be a timely move as international equity markets surpassed their domestic counterparts in dollar terms and even by a wider margin in local terms. Given the ECB’s asset purchase program, we also anticipated that the Euro would decline. To capitalize on this divergence and our associated unfavorable view on the Euro, we took an active view of hedging some of our international equity exposure through U.S. dollar futures. We implemented this in the early part of February and it has helped to generate additional return and reduce the Fund’s overall volatility. Our process separates currency exposure from asset allocation decisions, another way of providing potential return enhancement and risk management.
During the reporting period, the security selection component of the Fund’s investment process was a positive contributor to relative performance, driven mostly by international equity selection, especially within our global developed equity strategy. Our developed
4 OPPENHEIMER GLOBAL ALLOCATION FUND
international growth equity strategy also was a contributor to outperformance, partially offset by negative relative results in our emerging market equity strategy. The emerging market equity strategy continues to suffer headwinds by the further deterioration in crude oil prices, and the resulting impact on commodity currencies. Domestic equity strategies, in particular small cap growth, delivered positive performance relative to their respective benchmarks.
The Fund’s return shaping strategies, which are designed to improve the overall risk profile of the Fund, were a neutral contributor to performance during the period. Under normal circumstances, we expect return shaping strategies to cost money, like any insurance premium, and commensurately enhance returns or partially protect principal in environments of extreme market volatility. These strategies are often used as an efficient way to access upside market participation, especially when we are running lower levels of risk. With implied volatility higher than realized volatility across a number of assets (implying a relatively high cost of portfolio protection), we preferred to reduce risk
through our asset allocation overlays, and had limited exposure to hedging strategies through options.
STRATEGY & OUTLOOK
Overall, we are underweight risk in the portfolio and are underweight equities relative to the Index, and have a slightly long duration posture. Despite a decline in valuations due to the equity market selloff, many equity markets are still expensive relative to history and have not yet fallen to attractive levels. In terms of the macro environment, we are seeing an unsynchronized and relatively weaker economic picture that is counterbalanced by supportive monetary policy, but with financial conditions diverging.
As we look ahead, we expect a continuation this year’s seesaw behavior, in which global markets alternate between risk-on and risk-off. Our view is informed by the divergence in policy across the world’s major economies, as the U.S. looks to increase interest rates, while Europe and China maintain and may even expand stimulative measures. This muted growth outlook coupled with lack of directional pull on assets in terms of valuation causes a
5 OPPENHEIMER GLOBAL ALLOCATION FUND
high degree of financial market uncertainty that may persist for some time. With this type of backdrop, we believe in being somewhat cautious with our risk posture and capitalizing on attractive relative value differences across equity regions.
| | | | | | | | | | |

| |  | | 
| |  |
| | Mark Hamilton Portfolio Manager | | | Benjamin Rockmuller, CFA Portfolio Manager |
| | | |

| |  | | 
| |  |
| | Alessio de Longis, CFA1 Portfolio Manager | | | Dokyoung Lee, CFA1 Portfolio Manager |
1. Alessio de Longis and Dokyoung Lee became portfolio managers in April 2015.
6 OPPENHEIMER GLOBAL ALLOCATION FUND
Top Holdings and Allocations*
TOP TEN COMMON STOCK HOLDINGS
| | | | |
Citigroup, Inc. | | | 1.0% | |
Alphabet, Inc., Cl. C | | | 0.8 | |
Apple, Inc. | | | 0.8 | |
Alphabet, Inc., Cl. A | | | 0.8 | |
Facebook, Inc., Cl. A | | | 0.7 | |
Gilead Sciences, Inc. | | | 0.7 | |
Airbus Group SE | | | 0.7 | |
SAP SE | | | 0.6 | |
PayPal Holdings, Inc. | | | 0.5 | |
UBS Group AG | | | 0.5 | |
Portfolio holdings and allocations are subject to change. Percentages are as of October 30, 2015, and are based on net assets. For more current Fund holdings, please visit oppenheimerfunds.com.
TOP TEN COMMON STOCK INDUSTRIES
| | | | |
Internet Software & Services | | | 3.9% | |
Commercial Banks | | | 2.9 | |
Pharmaceuticals | | | 2.8 | |
Software | | | 2.3 | |
Biotechnology | | | 2.1 | |
Food Products | | | 2.1 | |
Textiles, Apparel & Luxury Goods | | | 2.1 | |
IT Services | | | 2.0 | |
Insurance | | | 1.9 | |
Oil, Gas & Consumable Fuels | | | 1.8 | |
Portfolio holdings and allocations are subject to change. Percentages are as of October 30, 2015, and are based on net assets.
PORTFOLIO ALLOCATION
| | | | |
Common Stocks | | | 62.8% | |
Investment Companies Oppenheimer Institutional Money Market Fund | | | 1.8 | |
Oppenheimer Master Event-Linked Bond Fund, LLC | | | 5.6 | |
Oppenheimer Master Loan Fund, LLC | | | 5.5 | |
Non-Convertible Corporate Bonds and Notes | | | 11.7 | |
U.S. Government Obligations | | | 11.5 | |
Preferred Stocks | | | 0.5 | |
Corporate Loans | | | 0.3 | |
Over-the-Counter Options Purchased | | | 0.3 | |
Rights, Warrants and Certificates | | | —** | |
** Represents a value of less than 0.05%.
Portfolio holdings and allocations are subject to change. Percentages are as of October 30, 2015, and are based on the total market value of investments.
7 OPPENHEIMER GLOBAL ALLOCATION FUND
TOP TEN GEOGRAPHICAL HOLDINGS
| | | | |
United States | | | 64.3% | |
United Kingdom | | | 5.7 | |
Japan | | | 4.2 | |
France | | | 3.9 | |
Germany | | | 3.7 | |
Switzerland | | | 3.0 | |
China | | | 2.2 | |
Canada | | | 1.9 | |
Netherlands | | | 1.8 | |
India | | | 1.5 | |
Portfolio holdings and allocation are subject to change. Percentages are as of October 30, 2015, and are based on total market value of investments.
REGIONAL ALLOCATION
| | | | |
U.S./Canada | | | 66.2% | |
Europe | | | 21.8 | |
Asia | | | 9.8 | |
Latin America | | | 1.1 | |
Middle East/Africa | | | 0.8 | |
Emerging Europe | | | 0.3 | |
Portfolio holdings and allocation are subject to change. Percentages are as of October 30, 2015, and are based on total market value of investments.
*October 30, 2015, was the last business day of the Fund’s fiscal year. See Note 2 of the accompanying Consolidated Notes to Financial Statements.
8 OPPENHEIMER GLOBAL ALLOCATION FUND
Share Class Performance
AVERAGE ANNUAL TOTAL RETURNS WITHOUT SALES CHARGE AS OF 10/30/15
| | | | | | | | | | |
| | | Inception Date | | 1-Year | | 5-Year | | 10-Year | | |
Class A (QVGIX) | | 11/1/91 | | 2.26% | | 4.92% | | 3.45% | | |
Class B (QGRBX) | | 9/1/93 | | 1.45% | | 4.06% | | 2.96% | | |
Class C (QGRCX) | | 9/1/93 | | 1.50% | | 4.16% | | 2.70% | | |
Class I (QGRIX) | | 2/28/12 | | 2.71% | | 6.34% * | | N/A | | |
Class R (QGRNX) | | 3/1/01 | | 1.98% | | 4.66% | | 3.19% | | |
Class Y (QGRYX) | | 5/1/00 | | 2.47% | | 5.26% | | 3.80% | | |
AVERAGE ANNUAL TOTAL RETURNS WITH SALES CHARGE AS OF 10/30/15
| | | | | | | | | | |
| | | Inception
Date | | 1-Year | | 5-Year | | 10-Year | | |
Class A (QVGIX) | | 11/1/91 | | -3.62% | | 3.69% | | 2.84% | | |
Class B (QGRBX) | | 9/1/93 | | -3.55% | | 3.71% | | 2.96% | | |
Class C (QGRCX) | | 9/1/93 | | 0.50% | | 4.16% | | 2.70% | | |
Class I (QGRIX) | | 2/28/12 | | 2.71% | | 6.34% * | | N/A | | |
Class R (QGRNX) | | 3/1/01 | | 1.98% | | 4.66% | | 3.19% | | |
Class Y (QGRYX) | | 5/1/00 | | 2.47% | | 5.26% | | 3.80% | | |
| * Shows performance since inception. | | |
Performance data quoted represents past performance, which does not guarantee future results. The investment return and principal value of an investment in the Fund will fluctuate so that an investor’s shares, when redeemed, may be worth more or less than their original cost. Current performance may be lower or higher than the performance quoted. For performance data current to the most recent month-end, visit oppenheimerfunds.com or call 1.800.CALL OPP (225.5677). Fund returns include changes in share price, reinvested distributions, and the applicable sales charge: for Class A shares, the current maximum initial sales charge of 5.75%; for Class B shares, the contingent deferred sales charge of 5% (1-year) and 2% (5-year); and for Class C shares, the contingent deferred sales charge (“CDSC”) of 1% for the 1-year period. Prior to 7/1/14, Class R shares were named Class N shares. Beginning 7/1/14, new purchases of Class R shares will no longer be subject to a CDSC upon redemption (any CDSC will remain in effect for purchases prior to 7/1/14). There is no sales charge for Class I and Class Y shares. Because Class B shares convert to Class A shares 72 months after purchase, the 10-year return for Class B shares uses Class A performance for the period after conversion.
The Fund’s performance is compared to the performance of the S&P 500 Index, the Russell 1000 Index, the MSCI All Country World Index (ex-U.S.), the Barclays U.S. Aggregate Bond Index, the Barclays Multiverse Index (ex-U.S.) and the Fund’s Reference Index. The S&P 500 Index is a capitalization-weighted index of 500 stocks intended to be a representative sample of leading companies in leading industries within the U.S. economy. The Russell 1000 Index measures the performance of the large-cap segment of the U.S. equity universe. The MSCI All Country World Index (ex U.S.) is designed to measure global developed and emerging equity market performance excluding the United States. The Barclays U.S. Aggregate Bond Index is an index of U.S dollar-denominated, investment-grade U.S. corporate government and
9 OPPENHEIMER GLOBAL ALLOCATION FUND
mortgage-backed securities. The Barclays Multiverse Index (ex-U.S.) provides a broad-based measure of the global fixed-income bond market. The Fund’s Reference Index is a customized weighted index currently comprised of 30% of the Russell 1000 Index, 30% of the MSCI All Country World Index (ex-U.S.), 20% of the Barclays U.S. Aggregate Bond Index, and 20% of the Barclays Multiverse Index (ex-U.S.). The indices are unmanaged and cannot be purchased directly by investors. While index comparisons may be useful to provide a benchmark for the Fund’s performance, it must be noted that the Fund’s investments are not limited to the investments comprising the indices. Index performance includes reinvestment of income, but does not reflect transaction costs, fees, expenses or taxes. Index performance is shown for illustrative purposes only as a benchmark for the Fund’s performance, and does not predict or depict performance of the Fund. The Fund’s performance reflects the effects of the Fund’s business and operating expenses.
The Fund’s investment strategy and focus can change over time. The mention of specific fund holdings does not constitute a recommendation by OppenheimerFunds, Inc. or its affiliates.
Before investing in any of the Oppenheimer funds, investors should carefully consider a fund’s investment objectives, risks, charges and expenses. Fund prospectuses and summary prospectuses contain this and other information about the funds, and may be obtained by asking your financial advisor, visiting oppenheimerfunds.com, or calling 1.800.CALL OPP (225.5677). Read prospectuses and summary prospectuses carefully before investing.
Shares of Oppenheimer funds are not deposits or obligations of any bank, are not guaranteed by any bank, are not insured by the FDIC or any other agency, and involve investment risks, including the possible loss of the principal amount invested.
10 OPPENHEIMER GLOBAL ALLOCATION FUND
Fund Expenses
Fund Expenses. As a shareholder of the Fund, you incur two types of costs: (1) transaction costs, which may include sales charges (loads) on purchase payments and/or contingent deferred sales charges on redemptions; and (2) ongoing costs, including management fees; distribution and service fees; and other Fund expenses. These examples are intended to help you understand your ongoing costs (in dollars) of investing in the Fund and to compare these costs with the ongoing costs of investing in other mutual funds.
The examples are based on an investment of $1,000.00 invested at the beginning of the period and held for the entire 6-month period ended October 30, 2015.
Actual Expenses. The first section of the table provides information about actual account values and actual expenses. You may use the information in this section for the class of shares you hold, together with the amount you invested, to estimate the expense that you paid over the period. Simply divide your account value by $1,000.00 (for example, an $8,600.00 account value divided by $1,000.00 = 8.60), then multiply the result by the number in the first section under the heading entitled “Expenses Paid During 6 Months Ended October 30, 2015” to estimate the expenses you paid on your account during this period.
Hypothetical Example for Comparison Purposes. The second section of the table provides information about hypothetical account values and hypothetical expenses based on the Fund’s actual expense ratio for each class of shares, and an assumed rate of return of 5% per year for each class before expenses, which is not the Fund’s actual return. The hypothetical account values and expenses may not be used to estimate the actual ending account balance or expenses you paid for the period. You may use this information to compare the ongoing costs of investing in the Fund and other funds. To do so, compare this 5% hypothetical example for the class of shares you hold with the 5% hypothetical examples that appear in the shareholder reports of the other funds.
Please note that the expenses shown in the table are meant to highlight your ongoing costs only and do not reflect any transactional costs, such as front-end or contingent deferred sales charges (loads). Therefore, the “hypothetical” section of the table is useful in comparing ongoing costs only, and will not help you determine the relative total costs of owning different funds. In addition, if these transactional costs were included, your costs would have been higher.
11 OPPENHEIMER GLOBAL ALLOCATION FUND
| | | | | | | | | | | | | | | | | | |
| Actual | | Beginning
Account
Value
May 1, 2015 | | | | | Ending
Account
Value
October 30, 2015 | | Expenses
Paid During
6 Months Ended
October 30, 2015 |
Class A | | $ | 1,000.00 | | | | | $ | 981.60 | | | | | $ | 6.43 | | | |
Class B | | | 1,000.00 | | | | | | 977.10 | | | | | | 10.21 | | | |
Class C | | | 1,000.00 | | | | | | 978.00 | | | | | | 10.22 | | | |
Class I | | | 1,000.00 | | | | | | 983.80 | | | | | | 4.29 | | | |
Class R | | | 1,000.00 | | | | | | 980.00 | | | | | | 7.67 | | | |
Class Y | | | 1,000.00 | | | | | | 982.90 | | | | | | 5.23 | | | |
| | | | | | |
| Hypothetical | | | | | | | | | | | | | | | | | | |
(5% return before expenses) | | | | | | | | | | | | | | | | | | |
Class A | | | 1,000.00 | | | | | | 1,018.60 | | | | | | 6.55 | | | |
Class B | | | 1,000.00 | | | | | | 1,014.79 | | | | | | 10.41 | | | |
Class C | | | 1,000.00 | | | | | | 1,014.79 | | | | | | 10.41 | | | |
Class I | | | 1,000.00 | | | | | | 1,020.76 | | | | | | 4.37 | | | |
Class R | | | 1,000.00 | | | | | | 1,017.35 | | | | | | 7.82 | | | |
Class Y | | | 1,000.00 | | | | | | 1,019.80 | | | | | | 5.33 | | | |
Expenses are equal to the Fund’s annualized expense ratio for that class, multiplied by the average account value over the period, multiplied by 183/365 (to reflect the one-half year period). Those annualized expense ratios, excluding indirect expenses from affiliated funds, based on the 6-month period ended October 30, 2015 are as follows:
| | | | | | |
| Class | | Expense Ratios | | | |
Class A | | | 1.29 | % | | |
Class B | | | 2.05 | | | |
Class C | | | 2.05 | | | |
Class I | | | 0.86 | | | |
Class R | | | 1.54 | | | |
Class Y | | | 1.05 | | | |
The expense ratios reflect voluntary and/or contractual waivers and/or reimbursements of expenses by the Fund’s Manager. Some of these undertakings may be modified or terminated at any time, as indicated in the Fund’s prospectus. The “Financial Highlights” tables in the Fund’s financial statements, included in this report, also show the gross expense ratios, without such waivers or reimbursements and reduction to custodian expenses, if applicable.
12 OPPENHEIMER GLOBAL ALLOCATION FUND
| | |
| |
| CONSOLIDATED STATEMENT OF INVESTMENTS October 30, 2015* | | |
| | | | | | | | | | |
| | | | | Shares | | | Value | |
| |
Common Stocks—60.6% | | | | | | | | | | |
| |
Consumer Discretionary—10.4% | | | | | | | | | | |
| |
Auto Components—0.7% | | | | | | | | | | |
| |
Bridgestone Corp. | | | | | 51,100 | | | $ | 1,873,555 | |
| |
Continental AG | | | | | 14,669 | | | | 3,526,775 | |
| |
Delphi Automotive plc | | | | | 19,640 | | | | 1,633,852 | |
| |
Johnson Controls, Inc. | | | | | 31,770 | | | | 1,435,368 | |
| |
Valeo SA | | | | | 19,259 | | | | 2,973,766 | |
| | | | | | | | | | |
| | | | | | | | | 11,443,316 | |
|
| |
Automobiles—0.7% | | | | | | | | | | |
| |
Astra International Tbk PT | | | | | 3,965,500 | | | | 1,700,111 | |
| |
Bayerische Motoren Werke AG | | | | | 15,174 | | | | 1,557,742 | |
| |
Ferrari NV1 | | | | | 3,530 | | | | 178,018 | |
| |
Ford Motor Co. | | | | | 56,280 | | | | 833,507 | |
| |
General Motors Co. | | | | | 48,740 | | | | 1,701,513 | |
| |
Harley-Davidson, Inc. | | | | | 12,350 | | | | 610,707 | |
| |
Hero MotoCorp Ltd. | | | | | 45,529 | | | | 1,797,442 | |
| |
Suzuki Motor Corp. | | | | | 31,300 | | | | 1,021,717 | |
| |
Tata Motors Ltd., ADR1 | | | | | 55,440 | | | | 1,639,361 | |
| | | | | | | | | | |
| | | | | | | | | 11,040,118 | |
|
| |
Diversified Consumer Services—0.2% | | | | | | | | | | |
| |
Dignity plc | | | | | 44,341 | | | | 1,658,878 | |
| |
Estacio Participacoes SA | | | | | 91,700 | | | | 367,604 | |
| |
Kroton Educacional SA | | | | | 230,454 | | | | 589,199 | |
| |
New Oriental Education & Technology Group, Inc., Sponsored ADR | | | | | 27,740 | | | | 763,128 | |
| |
Service Corp. International | | | | | 11,900 | | | | 336,294 | |
| | | | | | | | | | |
| | | | | | | | | 3,715,103 | |
|
| |
Hotels, Restaurants & Leisure—1.5% | | | | | | | | | | |
| |
Accor SA | | | | | 44,480 | | | | 2,208,328 | |
| |
Carnival Corp. | | | | | 115,230 | | | | 6,231,638 | |
| |
China Lodging Group Ltd., ADR1 | | | | | 5,731 | | | | 168,033 | |
| |
Chipotle Mexican Grill, Inc., Cl. A1 | | | | | 300 | | | | 192,069 | |
| |
Crown Resorts Ltd. | | | | | 202,300 | | | | 1,653,889 | |
| |
Domino’s Pizza Group plc | | | | | 153,220 | | | | 2,573,697 | |
| |
Dunkin’ Brands Group, Inc. | | | | | 23,400 | | | | 968,994 | |
| |
Galaxy Entertainment Group Ltd. | | | | | 50,000 | | | | 170,139 | |
| |
Genting Bhd | | | | | 437,700 | | | | 754,161 | |
| |
Genting Malaysia Bhd | | | | | 235,900 | | | | 235,798 | |
| |
Genting Singapore plc | | | | | 32,000 | | | | 18,593 | |
| |
Homeinns Hotel Group, ADR1 | | | | | 13,370 | | | | 400,833 | |
| |
International Game Technology plc | | | | | 55,914 | | | | 906,925 | |
| |
Jollibee Foods Corp. | | | | | 92,130 | | | | 404,744 | |
| |
Las Vegas Sands Corp. | | | | | 11,460 | | | | 567,385 | |
| |
McDonald’s Corp. | | | | | 10,150 | | | | 1,139,337 | |
| |
Melco Crown Entertainment Ltd., ADR | | | | | 38,740 | | | | 725,600 | |
| |
Revel Entertainment, Inc.1 | | | | | 5,092 | | | | — | |
| |
Sands China Ltd. | | | | | 194,400 | | | | 697,802 | |
| |
Starbucks Corp. | | | | | 19,160 | | | | 1,198,841 | |
| |
William Hill plc | | | | | 412,988 | | | | 2,016,191 | |
13 OPPENHEIMER GLOBAL ALLOCATION FUND
| | |
| |
| CONSOLIDATED STATEMENT OF INVESTMENTS Continued | | |
| | | | | | | | | | |
| | | | | Shares | | | Value | |
| |
Hotels, Restaurants & Leisure (Continued) | | | | | | | | | | |
| |
Yum! Brands, Inc. | | | | | 15,030 | | | $ | 1,065,777 | |
| | | | | | | | | | |
| | | | | | | | | 24,298,774 | |
|
| |
Household Durables—0.7% | | | | | | | | | | |
| |
Cyrela Brazil Realty SA Empreendimentos e Participacoes | | | | | 61,100 | | | | 141,955 | |
| |
Lennar Corp., Cl. A | | | | | 12,300 | | | | 615,861 | |
| |
SEB SA | | | | | 21,300 | | | | 2,163,396 | |
| |
Sony Corp. | | | | | 158,600 | | | | 4,497,996 | |
| |
Taylor Wimpey plc | | | | | 779,610 | | | | 2,374,064 | |
| |
Whirlpool Corp. | | | | | 2,660 | | | | 425,973 | |
| | | | | | | | | | |
| | | | | | | | | 10,219,245 | |
|
| |
Internet & Catalog Retail—1.0% | | | | | | | | | | |
| |
Amazon.com, Inc.1 | | | | | 8,556 | | | | 5,355,201 | |
| |
B2W Cia Digital1 | | | | | 18,500 | | | | 69,941 | |
| |
Ctrip.com International Ltd., ADR1 | | | | | 15,720 | | | | 1,461,488 | |
| |
JD.com, Inc., ADR1 | | | | | 180,029 | | | | 4,972,401 | |
| |
Netflix, Inc.1 | | | | | 5,750 | | | | 623,185 | |
| |
Qunar Cayman Islands Ltd., ADR1 | | | | | 3,200 | | | | 155,328 | |
| |
Rakuten, Inc. | | | | | 178,500 | | | | 2,470,248 | |
| |
TripAdvisor, Inc.1 | | | | | 10,410 | | | | 872,150 | |
| | | | | | | | | | |
| | | | | | | | | 15,979,942 | |
|
| |
Leisure Products—0.1% | | | | | | | | | | |
| |
Hasbro, Inc. | | | | | 13,760 | | | | 1,057,181 | |
| |
Nintendo Co. Ltd. | | | | | 3,100 | | | | 494,871 | |
| | | | | | | | | | |
| | | | | | | | | 1,552,052 | |
|
| |
Media—1.8% | | | | | | | | | | |
| |
CBS Corp., Cl. B | | | | | 10,740 | | | | 499,625 | |
| |
Cinemark Holdings, Inc. | | | | | 19,550 | | | | 692,852 | |
| |
Comcast Corp., Cl. A | | | | | 69,570 | | | | 4,356,473 | |
| |
DISH Network Corp., Cl. A1 | | | | | 15,840 | | | | 997,445 | |
| |
Grupo Televisa SAB, Sponsored ADR | | | | | 74,300 | | | | 2,165,102 | |
| |
ProSiebenSat.1 Media SE | | | | | 44,846 | | | | 2,427,062 | |
| |
SES SA | | | | | 52,710 | | | | 1,556,413 | |
| |
SKY Perfect JSAT Holdings, Inc. | | | | | 225,900 | | | | 1,186,214 | |
| |
Sky plc | | | | | 248,613 | | | | 4,192,136 | |
| |
Time Warner, Inc. | | | | | 2,019 | | | | 152,111 | |
| |
Walt Disney Co. (The) | | | | | 54,356 | | | | 6,182,451 | |
| |
Zee Entertainment Enterprises Ltd. | | | | | 535,359 | | | | 3,337,913 | |
| | | | | | | | | | |
| | | | | | | | | 27,745,797 | |
|
| |
Multiline Retail—0.4% | | | | | | | | | | |
| |
Dollarama, Inc. | | | | | 55,182 | | | | 3,727,612 | |
| |
Hudson’s Bay Co. | | | | | 120,193 | | | | 2,089,314 | |
| |
Kohl’s Corp. | | | | | 12,490 | | | | 576,039 | |
| | | | | | | | | | |
| | | | | | | | | 6,392,965 | |
|
| |
Specialty Retail—1.2% | | | | | | | | | | |
| |
AutoZone, Inc.1 | | | | | 4,210 | | | | 3,302,366 | |
| |
Foot Locker, Inc. | | | | | 8,250 | | | | 558,937 | |
| |
Home Depot, Inc. (The) | | | | | 31,640 | | | | 3,911,970 | |
14 OPPENHEIMER GLOBAL ALLOCATION FUND
| | | | | | | | | | |
| | | | | Shares | | | Value | |
| |
Specialty Retail (Continued) | | | | | | | | | | |
| |
Industria de Diseno Textil SA | | | | | 163,541 | | | $ | 6,125,765 | |
| |
Tiffany & Co. | | | | | 28,020 | | | | 2,309,969 | |
| |
TJX Cos., Inc. (The) | | | | | 26,726 | | | | 1,956,076 | |
| | | | | | | | | | |
| | | | | | | | | 18,165,083 | |
|
| |
Textiles, Apparel & Luxury Goods—2.1% | | | | | | | | | | |
| |
adidas AG | | | | | 36,194 | | | | 3,244,471 | |
| |
Brunello Cucinelli SpA | | | | | 31,293 | | | | 566,877 | |
| |
Burberry Group plc | | | | | 139,397 | | | | 2,849,820 | |
| |
Christian Dior SE | | | | | 18,040 | | | | 3,545,941 | |
| |
Cie Financiere Richemont SA | | | | | 26,299 | | | | 2,249,403 | |
| |
Hermes International | | | | | 4,921 | | | | 1,893,135 | |
| |
Kering | | | | | 30,188 | | | | 5,577,320 | |
| |
LVMH Moet Hennessy Louis Vuitton SE | | | | | 34,440 | | | | 6,407,506 | |
| |
NIKE, Inc., Cl. B | | | | | 13,248 | | | | 1,735,885 | |
| |
Prada SpA | | | | | 343,100 | | | | 1,393,793 | |
| |
Swatch Group AG (The) | | | | | 3,672 | | | | 1,433,540 | |
| |
Tod’s SpA | | | | | 10,162 | | | | 850,399 | |
| |
VF Corp. | | | | | 10,100 | | | | 681,952 | |
| | | | | | | | | | |
| | | | | | | | | 32,430,042 | |
|
| |
Consumer Staples—6.2% | | | | | | | | | | |
| |
Beverages—1.5% | | | | | | | | | | |
| |
Ambev SA, ADR | | | | | 66,650 | | | | 324,585 | |
| |
Anadolu Efes Biracilik Ve Malt Sanayii AS | | | | | 44,650 | | | | 352,136 | |
| |
Coca-Cola Co. (The) | | | | | 28,470 | | | | 1,205,705 | |
| |
Coca-Cola Enterprises, Inc. | | | | | 27,600 | | | | 1,416,984 | |
| |
Constellation Brands, Inc., Cl. A | | | | | 8,140 | | | | 1,097,272 | |
| |
Diageo plc | | | | | 83,081 | | | | 2,400,896 | |
| |
Fomento Economico Mexicano SAB de CV | | | | | 78,944 | | | | 779,078 | |
| |
Fomento Economico Mexicano SAB de CV, ADR | | | | | 10,866 | | | | 1,076,712 | |
| |
Heineken NV | | | | | 31,763 | | | | 2,896,112 | |
| |
Nigerian Breweries plc | | | | | 453,064 | | | | 311,825 | |
| |
PepsiCo, Inc. | | | | | 60,890 | | | | 6,222,349 | |
| |
Pernod Ricard SA | | | | | 35,630 | | | | 4,193,953 | |
| |
SABMiller plc | | | | | 10,100 | | | | 621,285 | |
| |
Tsingtao Brewery Co. Ltd., Cl. H | | | | | 42,000 | | | | 200,038 | |
| | | | | | | | | | |
| | | | | | | | | 23,098,930 | |
|
| |
Food & Staples Retailing—0.8% | | | | | | | | | | |
| |
Almacenes Exito SA | | | | | 31,185 | | | | 140,585 | |
| |
Almacenes Exito SA, GDR2 | | | | | 22,400 | | | | 101,174 | |
| |
BIM Birlesik Magazalar AS | | | | | 18,892 | | | | 384,218 | |
| |
Casino Guichard Perrachon SA | | | | | 2,020 | | | | 116,047 | |
| |
Costco Wholesale Corp. | | | | | 15,015 | | | | 2,374,172 | |
| |
CP ALL PCL | | | | | 1,889,500 | | | | 2,649,409 | |
| |
CVS Health Corp. | | | | | 15,190 | | | | 1,500,468 | |
| |
Kroger Co. (The) | | | | | 17,270 | | | | 652,806 | |
| |
Magnit PJSC | | | | | 11,321 | | | | 1,973,045 | |
| |
Spar Group Ltd. (The) | | | | | 107,771 | | | | 1,547,152 | |
| |
Sumber Alfaria Trijaya Tbk PT | | | | | 6,600 | | | | 293 | |
| |
Walgreens Boots Alliance, Inc. | | | | | 8,020 | | | | 679,134 | |
15 OPPENHEIMER GLOBAL ALLOCATION FUND
| | |
| |
| CONSOLIDATED STATEMENT OF INVESTMENTS Continued | | |
| | | | | | | | | | |
| | | | | Shares | | | Value | |
| |
Food & Staples Retailing (Continued) | | | | | | | | | | |
| |
Wal-Mart de Mexico SAB de CV | | | | | 120,830 | | | $ | 320,037 | |
| |
Wal-Mart Stores, Inc. | | | | | 7,570 | | | | 433,307 | |
| | | | | | | | | | |
| | | | | | | | | 12,871,847 | |
|
| |
Food Products—2.1% | | | | | | | | | | |
| |
Aryzta AG1 | | | | | 41,397 | | | | 1,864,811 | |
| |
Barry Callebaut AG1 | | | | | 1,397 | | | | 1,675,681 | |
| |
Danone SA | | | | | 69,465 | | | | 4,836,151 | |
| |
Kraft Heinz Co. (The) | | | | | 23,690 | | | | 1,847,109 | |
| |
Mondelez International, Inc., Cl. A | | | | | 148,930 | | | | 6,874,609 | |
| |
Nestle SA | | | | | 91,731 | | | | 7,003,023 | |
| |
Saputo, Inc. | | | | | 80,058 | | | | 1,909,000 | |
| |
Tingyi Cayman Islands Holding Corp. | | | | | 390,000 | | | | 667,383 | |
| |
Unilever plc | | | | | 122,774 | | | | 5,452,335 | |
| |
Want Want China Holdings Ltd. | | | | | 568,000 | | | | 471,530 | |
| | | | | | | | | | |
| | | | | | | | | 32,601,632 | |
|
| |
Household Products—0.7% | | | | | | | | | | |
| |
Colgate-Palmolive Co. | | | | | 64,110 | | | | 4,253,698 | |
| |
Henkel AG & Co. KGaA | | | | | 25,340 | | | | 2,338,794 | |
| |
Procter & Gamble Co. (The) | | | | | 7,170 | | | | 547,645 | |
| |
Reckitt Benckiser Group plc | | | | | 25,176 | | | | 2,456,382 | |
| |
Reckitt Benckiser Group plc, Sponsored ADR | | | | | 64,340 | | | | 1,275,219 | |
| | | | | | | | | | |
| | | | | | | | | 10,871,738 | |
|
| |
Personal Products—0.1% | | | | | | | | | | |
| |
Shiseido Co. Ltd. | | | | | 76,200 | | | | 1,797,275 | |
|
| |
Tobacco—1.0% | | | | | | | | | | |
| |
Japan Tobacco, Inc. | | | | | 97,100 | | | | 3,354,523 | |
| |
KT&G Corp. | | | | | 20,469 | | | | 2,045,592 | |
| |
Philip Morris International, Inc. | | | | | 73,150 | | | | 6,466,460 | |
| |
Reynolds American, Inc. | | | | | 14,368 | | | | 694,262 | |
| |
Swedish Match AB | | | | | 92,095 | | | | 2,894,861 | |
| | | | | | | | | | |
| | | | | | | | | 15,455,698 | |
|
| |
Energy—2.1% | | | | | | | | | | |
| |
Energy Equipment & Services—0.3% | | | | | | | | | | |
| |
China Oilfield Services Ltd., Cl. H | | | | | 126,000 | | | | 139,626 | |
| |
Halliburton Co. | | | | | 11,730 | | | | 450,197 | |
| |
Schlumberger Ltd. | | | | | 12,140 | | | | 948,862 | |
| |
Technip SA | | | | | 40,690 | | | | 2,122,256 | |
| |
Tenaris SA, ADR | | | | | 10,580 | | | | 267,357 | |
| | | | | | | | | | |
| | | | | | | | | 3,928,298 | |
|
| |
Oil, Gas & Consumable Fuels—1.8% | | | | | | | | | | |
| |
Anadarko Petroleum Corp. | | | | | 18,940 | | | | 1,266,707 | |
| |
Apache Corp. | | | | | 24,930 | | | | 1,174,951 | |
| |
BP plc, Sponsored ADR | | | | | 31,870 | | | | 1,137,759 | |
| |
Chesapeake Energy Corp. | | | | | 63,910 | | | | 455,678 | |
| |
Chevron Corp. | | | | | 51,700 | | | | 4,698,496 | |
| |
ConocoPhillips | | | | | 18,530 | | | | 988,575 | |
| |
Enbridge, Inc. | | | | | 22,330 | | | | 953,268 | |
16 OPPENHEIMER GLOBAL ALLOCATION FUND
| | | | | | | | | | |
| | | | | Shares | | | Value | |
| |
Oil, Gas & Consumable Fuels (Continued) | | | | | | | | | | |
| |
EOG Resources, Inc. | | | | | 12,350 | | | $ | 1,060,247 | |
| |
HollyFrontier Corp. | | | | | 25,720 | | | | 1,259,508 | |
| |
Koninklijke Vopak NV | | | | | 41,789 | | | | 1,676,677 | |
| |
Magellan Midstream Partners LP3 | | | | | 16,850 | | | | 1,075,199 | |
| |
Newfield Exploration Co.1 | | | | | 6,840 | | | | 274,900 | |
| |
Noble Energy, Inc. | | | | | 70,450 | | | | 2,524,928 | |
| |
Novatek OAO, Sponsored GDR | | | | | 14,100 | | | | 1,290,174 | |
| |
Occidental Petroleum Corp. | | | | | 5,260 | | | | 392,080 | |
| |
Phillips 66 | | | | | 8,890 | | | | 791,655 | |
| |
Pioneer Natural Resources Co. | | | | | 2,940 | | | | 403,192 | |
| |
Repsol SA | | | | | 79,893 | | | | 1,006,639 | |
| |
Suncor Energy, Inc. | | | | | 196,760 | | | | 5,849,675 | |
| | | | | | | | | | |
| | | | | | | | | 28,280,308 | |
|
| |
Financials—9.3% | | | | | | | | | | |
| |
Capital Markets—1.8% | | | | | | | | | | |
| |
Bank of New York Mellon Corp. (The) | | | | | 73,960 | | | | 3,080,434 | |
| |
Charles Schwab Corp. (The) | | | | | 52,240 | | | | 1,594,365 | |
| |
China Cinda Asset Management Co. Ltd., Cl. H | | | | | 2,853,000 | | | | 1,106,678 | |
| |
Credit Suisse Group AG1 | | | | | 88,527 | | | | 2,204,474 | |
| |
Deutsche Bank AG | | | | | 67,245 | | | | 1,885,831 | |
| |
Goldman Sachs Group, Inc. (The) | | | | | 23,570 | | | | 4,419,375 | |
| |
ICAP plc | | | | | 342,161 | | | | 2,317,475 | |
| |
Invesco Ltd. | | | | | 2,980 | | | | 98,847 | |
| |
Morgan Stanley | | | | | 44,070 | | | | 1,452,988 | |
| |
Nomura Holdings, Inc. | | | | | 153,700 | | | | 962,940 | |
| |
T. Rowe Price Group, Inc. | | | | | 7,070 | | | | 534,633 | |
| |
Tullett Prebon plc | | | | | 113,340 | | | | 613,952 | |
| |
UBS Group AG | | | | | 376,893 | | | | 7,521,985 | |
| | | | | | | | | | |
| | | | | | | | | 27,793,977 | |
|
| |
Commercial Banks—2.9% | | | | | | | | | | |
| |
Banca Monte dei Paschi di Siena SpA1 | | | | | 485,995 | | | | 891,415 | |
| |
Banco Bilbao Vizcaya Argentaria SA1 | | | | | 2,172 | | | | 18,672 | |
| |
Banco Bilbao Vizcaya Argentaria SA | | | | | 362,947 | | | | 3,120,160 | |
| |
Bancolombia SA, Sponsored ADR | | | | | 4,970 | | | | 172,061 | |
| |
Bank of America Corp. | | | | | 80,590 | | | | 1,352,300 | |
| |
Barclays plc | | | | | 394,510 | | | | 1,404,055 | |
| |
BNP Paribas SA | | | | | 27,910 | | | | 1,692,867 | |
| |
Citigroup, Inc. | | | | | 276,290 | | | | 14,690,339 | |
| |
Commercial International Bank Egypt SAE | | | | | 56,770 | | | | 374,694 | |
| |
Grupo Aval Acciones y Valores SA, ADR | | | | | 68,510 | | | | 548,765 | |
| |
Grupo Financiero Banorte SAB de CV, Cl. O | | | | | 199,775 | | | | 1,069,519 | |
| |
Grupo Financiero Inbursa SAB de CV, Cl. O | | | | | 289,790 | | | | 580,710 | |
| |
Guaranty Trust Bank plc | | | | | 1,618,801 | | | | 186,687 | |
| |
ICICI Bank Ltd., Sponsored ADR | | | | | 532,690 | | | | 4,591,788 | |
| |
Intesa Sanpaolo SpA, Sponsored ADR | | | | | 31,950 | | | | 670,630 | |
| |
JPMorgan Chase & Co. | | | | | 80,810 | | | | 5,192,043 | |
| |
Kotak Mahindra Bank Ltd.1 | | | | | 212 | | | | 2,235 | |
| |
Kotak Mahindra Bank Ltd. | | | | | 18,795 | | | | 197,317 | |
| |
Lloyds Banking Group plc | | | | | 1,400,570 | | | | 1,589,189 | |
17 OPPENHEIMER GLOBAL ALLOCATION FUND
| | |
| |
| CONSOLIDATED STATEMENT OF INVESTMENTS Continued | | |
| | | | | | | | | | |
| | | | | Shares | | | Value | |
| |
Commercial Banks (Continued) | | | | | | | | | | |
| |
M&T Bank Corp. | | | | | 13,130 | | | $ | 1,573,631 | |
| |
Sberbank PAO, ADR | | | | | 63,000 | | | | 384,961 | |
| |
Societe Generale SA | | | | | 37,360 | | | | 1,734,627 | |
| |
Sumitomo Mitsui Financial Group, Inc. | | | | | 52,700 | | | | 2,095,183 | |
| |
SVB Financial Group1 | | | | | 3,880 | | | | 473,632 | |
| |
Zenith Bank plc | | | | | 2,543,620 | | | | 224,532 | |
| |
Zions Bancorporation | | | | | 42,701 | | | | 1,228,508 | |
| | | | | | | | | | |
| | | | | | | | | 46,060,520 | |
|
| |
Consumer Finance—0.3% | | | | | | | | | | |
| |
Ally Financial, Inc.1 | | | | | 113,380 | | | | 2,258,529 | |
| |
Capital One Financial Corp. | | | | | 10,580 | | | | 834,762 | |
| |
Discover Financial Services | | | | | 40,640 | | | | 2,284,781 | |
| | | | | | | | | | |
| | | | | | | | | 5,378,072 | |
|
| |
Diversified Financial Services—1.4% | | | | | | | | | | |
| |
ASX Ltd. | | | | | 25,500 | | | | 749,941 | |
| |
Berkshire Hathaway, Inc., Cl. B1 | | | | | 27,790 | | | | 3,779,996 | |
| |
BM&FBovespa SA-Bolsa de Valores Mercadorias e Futuros | | | | | 221,100 | | | | 653,574 | |
| |
CME Group, Inc., Cl. A | | | | | 57,380 | | | | 5,420,688 | |
| |
Grupo de Inversiones Suramericana SA | | | | | 35,201 | | | | 446,908 | |
| |
Haci Omer Sabanci Holding AS | | | | | 136,676 | | | | 433,402 | |
| |
Hong Kong Exchanges & Clearing Ltd. | | | | | 29,287 | | | | 762,344 | |
| |
Investment AB Kinnevik, Cl. B | | | | | 44,966 | | | | 1,432,472 | |
| |
McGraw Hill Financial, Inc. | | | | | 81,040 | | | | 7,507,546 | |
| | | | | | | | | | |
| | | | | | | | | 21,186,871 | |
|
| |
Insurance—1.9% | | | | | | | | | | |
| |
AIA Group Ltd. | | | | | 187,200 | | | | 1,091,920 | |
| |
Allianz SE | | | | | 19,017 | | | | 3,329,875 | |
| |
American International Group, Inc. | | | | | 91,300 | | | | 5,757,378 | |
| |
Aon plc | | | | | 14,800 | | | | 1,380,988 | |
| |
China Life Insurance Co. Ltd., Cl. H | | | | | 154,000 | | | | 552,256 | |
| |
China Pacific Insurance Group Co. Ltd., Cl. H | | | | | 127,200 | | | | 506,927 | |
| |
Dai-ichi Life Insurance Co. Ltd. (The) | | | | | 155,800 | | | | 2,693,705 | |
| |
FNF Group | | | | | 40,880 | | | | 1,442,246 | |
| |
Genworth Financial, Inc., Cl. A1 | | | | | 242,920 | | | | 1,136,866 | |
| |
Japan Post Insurance Co. Ltd.1 | | | | | 14,100 | | | | 257,065 | |
| |
Marsh & McLennan Cos., Inc. | | | | | 44,760 | | | | 2,494,922 | |
| |
Old Mutual plc | | | | | 280,052 | | | | 910,335 | |
| |
People’s Insurance Co. Group of China Ltd. (The), Cl. H | | | | | 309,000 | | | | 165,158 | |
| |
PICC Property & Casualty Co. Ltd., Cl. H | | | | | 178,000 | | | | 403,732 | |
| |
Ping An Insurance Group Co. of China Ltd., Cl. H | | | | | 370,500 | | | | 2,074,784 | |
| |
Prudential plc | | | | | 227,799 | | | | 5,317,048 | |
| |
Sul America SA | | | | | 54,560 | | | | 267,810 | |
| | | | | | | | | | |
| | | | | | | | | 29,783,015 | |
|
| |
Real Estate Investment Trusts (REITs)—0.3% | | | | | | | | | | |
| |
Equity Residential | | | | | 8,730 | | | | 675,004 | |
| |
Hammerson plc | | | | | 133,280 | | | | 1,305,772 | |
| |
Public Storage | | | | | 3,740 | | | | 858,181 | |
18 OPPENHEIMER GLOBAL ALLOCATION FUND
| | | | | | | | | | |
| | | | | Shares | | | Value | |
| |
Real Estate Investment Trusts (REITs) (Continued) | | | | | | | | | | |
| |
Simon Property Group, Inc. | | | | | 12,990 | | | $ | 2,616,965 | |
| | | | | | | | | | |
| | | | | | | | | 5,455,922 | |
|
| |
Real Estate Management & Development—0.5% | | | | | | | | | | |
| |
Deutsche Wohnen AG | | | | | 60,368 | | | | 1,702,205 | |
| |
DLF Ltd. | | | | | 1,311,407 | | | | 2,316,153 | |
| |
Global Logistic Properties Ltd. | | | | | 221,000 | | | | 351,855 | |
| |
Hang Lung Group Ltd. | | | | | 78,500 | | | | 285,172 | |
| |
Hang Lung Properties Ltd. | | | | | 248,570 | | | | 607,831 | |
| |
Realogy Holdings Corp.1 | | | | | 1,710 | | | | 66,861 | |
| |
SM Prime Holdings, Inc. | | | | | 1,424,103 | | | | 654,270 | |
| |
SOHO China Ltd. | | | | | 383,500 | | | | 196,616 | |
| |
Vonovia SE | | | | | 59,698 | | | | 1,988,751 | |
| |
Wallace Theater Holdings, Inc.1,4 | | | | | 430 | | | | 4 | |
| | | | | | | | | | |
| | | | | | | | | 8,169,718 | |
|
| |
Thrifts & Mortgage Finance—0.2% | | | | | | | | | | |
| |
Housing Development Finance Corp. Ltd. | | | | | 135,597 | | | | 2,597,781 | |
|
| |
Health Care—7.3% | | | | | | | | | | |
| |
Biotechnology—2.1% | | | | | | | | | | |
| |
ACADIA Pharmaceuticals, Inc.1 | | | | | 33,680 | | | | 1,172,738 | |
| |
Amgen, Inc. | | | | | 3,860 | | | | 610,575 | |
| |
Baxalta, Inc. | | | | | 10,580 | | | | 364,587 | |
| |
Biogen, Inc.1 | | | | | 16,480 | | | | 4,787,605 | |
| |
BioMarin Pharmaceutical, Inc.1 | | | | | 14,440 | | | | 1,690,058 | |
| |
Bluebird Bio, Inc.1 | | | | | 11,710 | | | | 903,192 | |
| |
Celgene Corp.1 | | | | | 11,446 | | | | 1,404,539 | |
| |
Celldex Therapeutics, Inc.1 | | | | | 89,290 | | | | 1,076,837 | |
| |
Circassia Pharmaceuticals plc1 | | | | | 314,724 | | | | 1,358,129 | |
| |
Clovis Oncology, Inc.1 | | | | | 12,510 | | | | 1,249,874 | |
| |
CSL Ltd. | | | | | 30,900 | | | | 2,052,215 | |
| |
Gilead Sciences, Inc. | | | | | 97,250 | | | | 10,515,642 | |
| |
Grifols SA | | | | | 54,486 | | | | 2,525,177 | |
| |
Incyte Corp.1 | | | | | 4,730 | | | | 555,917 | |
| |
MacroGenics, Inc.1 | | | | | 28,810 | | | | 895,127 | |
| |
Medivation, Inc.1 | | | | | 15,160 | | | | 637,630 | |
| |
Vertex Pharmaceuticals, Inc.1 | | | | | 10,525 | | | | 1,312,888 | |
| | | | | | | | | | |
| | | | | | | | | 33,112,730 | |
|
| |
Health Care Equipment & Supplies—0.9% | | | | | | | | | | |
| |
Abbott Laboratories | | | | | 13,180 | | | | 590,464 | |
| |
Boston Scientific Corp.1 | | | | | 133,870 | | | | 2,447,143 | |
| |
Coloplast, Cl. B | | | | | 22,428 | | | | 1,606,034 | |
| |
DiaSorin SpA | | | | | 13,352 | | | | 597,571 | |
| |
Essilor International SA | | | | | 12,660 | | | | 1,661,332 | |
| |
Hologic, Inc.1 | | | | | 2,630 | | | | 102,202 | |
| |
Sonova Holding AG | | | | | 13,622 | | | | 1,857,275 | |
| |
St. Jude Medical, Inc. | | | | | 18,510 | | | | 1,181,123 | |
| |
William Demant Holding AS1 | | | | | 15,104 | | | | 1,310,064 | |
19 OPPENHEIMER GLOBAL ALLOCATION FUND
| | |
| |
| CONSOLIDATED STATEMENT OF INVESTMENTS Continued | | |
| | | | | | | | | | |
| | | | | Shares | | | Value | |
| |
Health Care Equipment & Supplies (Continued) | | | | | | | | | | |
| |
Zimmer Biomet Holdings, Inc. | | | | | 19,380 | | | $ | 2,026,567 | |
| | | | | | | | | | |
| | | | | | | | | 13,379,775 | |
|
| |
Health Care Providers & Services—1.4% | | | | | | | | | | |
| |
Aetna, Inc. | | | | | 40,950 | | | | 4,700,241 | |
| |
Anthem, Inc. | | | | | 21,870 | | | | 3,043,211 | |
| |
Apollo Hospitals Enterprise Ltd. | | | | | 24,051 | | | | 481,770 | |
| |
Cardinal Health, Inc. | | | | | 20,410 | | | | 1,677,702 | |
| |
Cigna Corp. | | | | | 3,320 | | | | 445,013 | |
| |
Diagnosticos da America SA | | | | | 127,900 | | | | 298,148 | |
| |
Express Scripts Holding Co.1 | | | | | 46,880 | | | | 4,049,494 | |
| |
HCA Holdings, Inc.1 | | | | | 4,090 | | | | 281,351 | |
| |
Humana, Inc. | | | | | 730 | | | | 130,400 | |
| |
Sinopharm Group Co. Ltd., Cl. H | | | | | 222,600 | | | | 913,966 | |
| |
Sonic Healthcare Ltd. | | | | | 54,289 | | | | 746,632 | |
| |
UnitedHealth Group, Inc. | | | | | 48,940 | | | | 5,764,153 | |
| | | | | | | | | | |
| | | | | | | | | 22,532,081 | |
|
| |
Life Sciences Tools & Services—0.1% | | | | | | | | | | |
| |
Lonza Group AG1 | | | | | 5,155 | | | | 755,592 | |
| |
Quintiles Transnational Holdings, Inc.1 | | | | | 6,540 | | | | 416,271 | |
| |
Thermo Fisher Scientific, Inc. | | | | | 5,190 | | | | 678,748 | |
| |
WuXi PharmaTech Cayman, Inc., ADR1 | | | | | 4,631 | | | | 207,006 | |
| | | | | | | | | | |
| | | | | | | | | 2,057,617 | |
|
�� | |
Pharmaceuticals—2.8% | | | | | | | | | | |
| |
Allergan plc1 | | | | | 20,560 | | | | 6,342,143 | |
| |
Bayer AG | | | | | 21,647 | | | | 2,889,442 | |
| |
Bristol-Myers Squibb Co. | | | | | 56,281 | | | | 3,711,732 | |
| |
Cipla Ltd. | | | | | 27,352 | | | | 287,743 | |
| |
Dr. Reddy’s Laboratories Ltd. | | | | | 14,437 | | | | 940,526 | |
| |
Eli Lilly & Co. | | | | | 16,440 | | | | 1,341,011 | |
| |
Galenica AG | | | | | 1,536 | | | | 2,248,608 | |
| |
Glenmark Pharmaceuticals Ltd. | | | | | 12,818 | | | | 193,757 | |
| |
Johnson & Johnson | | | | | 42,980 | | | | 4,342,269 | |
| |
Lupin Ltd. | | | | | 6,478 | | | | 190,313 | |
| |
Merck & Co., Inc. | | | | | 71,310 | | | | 3,897,805 | |
| |
Mylan NV1 | | | | | 36,980 | | | | 1,630,448 | |
| |
Novo Nordisk AS, Cl. B | | | | | 55,364 | | | | 2,932,835 | |
| |
Perrigo Co. plc | | | | | 710 | | | | 111,995 | |
| |
Pfizer, Inc. | | | | | 80,640 | | | | 2,727,245 | |
| |
Roche Holding AG | | | | | 16,065 | | | | 4,351,399 | |
| |
Roche Holding AG, Sponsored ADR | | | | | 9,830 | | | | 333,335 | |
| |
Shire plc | | | | | 17,300 | | | | 1,310,010 | |
| |
Shire plc, ADR | | | | | 1,560 | | | | 354,198 | |
| |
Sun Pharmaceutical Industries Ltd. | | | | | 30,058 | | | | 407,379 | |
| |
Teva Pharmaceutical Industries Ltd., Sponsored ADR | | | | | 39,140 | | | | 2,316,697 | |
| |
Theravance Biopharma, Inc.1 | | | | | 10,912 | | | | 163,134 | |
| |
Valeant Pharmaceuticals International, Inc.1 | | | | | 6,806 | | | | 638,199 | |
| | | | | | | | | | |
| | | | | | | | | 43,662,223 | |
20 OPPENHEIMER GLOBAL ALLOCATION FUND
| | | | | | | | | | |
| | | | | Shares | | | Value | |
| |
Industrials—8.0% | | | | | | | | | | |
| |
Aerospace & Defense—1.4% | | | | | | | | | | |
| |
Airbus Group SE | | | | | 148,050 | | | $ | 10,287,111 | |
| |
Embraer SA | | | | | 136,000 | | | | 997,285 | |
| |
Embraer SA, Sponsored ADR | | | | | 77,060 | | | | 2,263,252 | |
| |
Lockheed Martin Corp. | | | | | 12,340 | | | | 2,712,702 | |
| |
Rolls-Royce Holdings plc1 | | | | | 330,762 | | | | 3,499,260 | |
| |
TransDigm Group, Inc.1 | | | | | 3,390 | | | | 745,292 | |
| |
United Technologies Corp. | | | | | 17,680 | | | | 1,739,889 | |
| | | | | | | | | | |
| | | | | | | | | 22,244,791 | |
|
| |
Air Freight & Couriers—0.5% | | | | | | | | | | |
| |
FedEx Corp. | | | | | 6,210 | | | | 969,071 | |
| |
Royal Mail plc | | | | | 565,991 | | | | 3,880,472 | |
| |
United Parcel Service, Inc., Cl. B | | | | | 24,570 | | | | 2,531,201 | |
| | | | | | | | | | |
| | | | | | | | | 7,380,744 | |
|
| |
Airlines—0.2% | | | | | | | | | | |
| |
Delta Air Lines, Inc. | | | | | 11,430 | | | | 581,101 | |
| |
Japan Airlines Co. Ltd. | | | | | 65,700 | | | | 2,470,786 | |
| | | | | | | | | | |
| | | | | | | | | 3,051,887 | |
|
| |
Building Products—0.3% | | | | | | | | | | |
| |
A.O. Smith Corp. | | | | | 4,720 | | | | 362,590 | |
| |
Allegion plc | | | | | 6,390 | | | | 416,436 | |
| |
Assa Abloy AB, Cl. B | | | | | 150,974 | | | | 2,994,187 | |
| |
Nortek, Inc.1 | | | | | 5,864 | | | | 359,757 | |
| | | | | | | | | | |
| | | | | | | | | 4,132,970 | |
|
| |
Commercial Services & Supplies—0.7% | | | | | | | | | | |
| |
Aggreko plc | | | | | 70,669 | | | | 994,749 | |
| |
Cintas Corp. | | | | | 12,300 | | | | 1,145,007 | |
| |
Edenred | | | | | 68,974 | | | | 1,264,059 | |
| |
Prosegur Cia de Seguridad SA | | | | | 327,408 | | | | 1,456,547 | |
| |
Republic Services, Inc., Cl. A | | | | | 15,600 | | | | 682,344 | |
| |
Tyco International plc | | | | | 75,390 | | | | 2,747,212 | |
| |
Waste Connections, Inc. | | | | | 19,440 | | | | 1,059,091 | |
| |
Waste Management, Inc. | | | | | 18,830 | | | | 1,012,301 | |
| | | | | | | | | | |
| | | | | | | | | 10,361,310 | |
|
| |
Construction & Engineering—0.5% | | | | | | | | | | |
| |
Boskalis Westminster | | | | | 67,511 | | | | 3,277,279 | |
| |
CIMIC Group Ltd. | | | | | 58,100 | | | | 1,148,956 | |
| |
FLSmidth & Co. AS | | | | | 11,901 | | | | 449,806 | |
| |
Vinci SA | | | | | 41,180 | | | | 2,775,565 | |
| | | | | | | | | | |
| | | | | | | | | 7,651,606 | |
|
| |
Electrical Equipment—0.8% | | | | | | | | | | |
| |
ABB Ltd.1 | | | | | 42,855 | | | | 807,170 | |
| |
Acuity Brands, Inc. | | | | | 2,440 | | | | 533,384 | |
| |
Eaton Corp. plc | | | | | 22,170 | | | | 1,239,525 | |
| |
Emerson Electric Co. | | | | | 26,010 | | | | 1,228,452 | |
| |
Legrand SA | | | | | 32,600 | | | | 1,787,062 | |
| |
Nidec Corp. | | | | | 72,900 | | | | 5,477,451 | |
21 OPPENHEIMER GLOBAL ALLOCATION FUND
| | |
| |
| CONSOLIDATED STATEMENT OF INVESTMENTS Continued | | |
| | | | | | | | | | |
| | | | | Shares | | | Value | |
| |
Electrical Equipment (Continued) | | | | | | | | | | |
| |
Prysmian SpA | | | | | 35,255 | | | $ | 762,251 | |
| |
Schneider Electric SE | | | | | 24,430 | | | | 1,477,181 | |
| | | | | | | | | | |
| | | | | | | | | 13,312,476 | |
|
| |
Industrial Conglomerates—0.9% | | | | | | | | | | |
| |
3M Co. | | | | | 17,200 | | | | 2,704,012 | |
| |
Beijing Enterprises Holdings Ltd. | | | | | 187,500 | | | | 1,177,974 | |
| |
Danaher Corp. | | | | | 22,234 | | | | 2,074,655 | |
| |
General Electric Co. | | | | | 232,010 | | | | 6,709,729 | |
| |
Jardine Strategic Holdings Ltd. | | | | | 23,072 | | | | 695,510 | |
| |
Siemens AG | | | | | 9,343 | | | | 939,638 | |
| |
SM Investments Corp. | | | | | 36,823 | | | | 685,988 | |
| | | | | | | | | | |
| | | | | | | | | 14,987,506 | |
|
| |
Machinery—0.9% | | | | | | | | | | |
| |
Aalberts Industries NV | | | | | 81,042 | | | | 2,627,787 | |
| |
Atlas Copco AB, Cl. A | | | | | 78,827 | | | | 2,049,969 | |
| |
Caterpillar, Inc. | | | | | 9,540 | | | | 696,324 | |
| |
Deere & Co. | | | | | 32,520 | | | | 2,536,560 | |
| |
FANUC Corp. | | | | | 17,200 | | | | 3,026,820 | |
| |
Ingersoll-Rand plc | | | | | 5,960 | | | | 353,189 | |
| |
Parker-Hannifin Corp. | | | | | 4,810 | | | | 503,607 | |
| |
Stanley Black & Decker, Inc. | | | | | 6,860 | | | | 727,023 | |
| |
Wabtec Corp. | | | | | 9,230 | | | | 764,890 | |
| |
Weir Group plc (The) | | | | | 35,035 | | | | 575,464 | |
| | | | | | | | | | |
| | | | | | | | | 13,861,633 | |
|
| |
Professional Services—0.7% | | | | | | | | | | |
| |
Experian plc | | | | | 159,357 | | | | 2,717,335 | |
| |
Intertek Group plc | | | | | 52,990 | | | | 2,141,291 | |
| |
Nielsen Holdings plc | | | | | 51,910 | | | | 2,466,244 | |
| |
Recruit Holdings Co. Ltd. | | | | | 69,400 | | | | 2,226,060 | |
| |
SGS SA | | | | | 666 | | | | 1,266,743 | |
| | | | | | | | | | |
| | | | | | | | | 10,817,673 | |
|
| |
Road & Rail—0.3% | | | | | | | | | | |
| |
Canadian National Railway Co. | | | | | 50,160 | | | | 3,064,274 | |
| |
CSX Corp. | | | | | 90,200 | | | | 2,434,498 | |
| | | | | | | | | | |
| | | | | | | | | 5,498,772 | |
|
| |
Trading Companies & Distributors—0.7% | | | | | | | | | | |
| |
Brenntag AG | | | | | 73,559 | | | | 4,444,632 | |
| |
Bunzl plc | | | | | 94,138 | | | | 2,692,141 | |
| |
Travis Perkins plc | | | | | 73,460 | | | | 2,165,058 | |
| |
Wolseley plc | | | | | 36,923 | | | | 2,166,946 | |
| | | | | | | | | | |
| | | | | | | | | 11,468,777 | |
|
| |
Transportation Infrastructure—0.1% | | | | | | | | | | |
| |
Airports of Thailand PCL | | | | | 19,800 | | | | 165,498 | |
| |
DP World Ltd. | | | | | 42,473 | | | | 858,043 | |
| |
Grupo Aeroportuario del Sureste SAB de CV, Cl. B | | | | | 16,975 | | | | 263,065 | |
| | | | | | | | | | |
| | | | | | | | | 1,286,606 | |
22 OPPENHEIMER GLOBAL ALLOCATION FUND
| | | | | | | | | | |
| | | | | Shares | | | Value | |
| |
Information Technology—12.6% | | | | | | | | | | |
| |
Communications Equipment—0.5% | | | | | | | | | | |
| |
Nokia OYJ | | | | | 266,126 | | | $ | 1,974,870 | |
| |
Telefonaktiebolaget LM Ericsson, Cl. B | | | | | 590,105 | | | | 5,737,960 | |
| | | | | | | | | | |
| | | | | | | | | 7,712,830 | |
|
| |
Electronic Equipment, Instruments, & Components—1.1% | | | | | | | | | | |
| |
Hoya Corp. | | | | | 55,000 | | | | 2,260,536 | |
| |
Keyence Corp. | | | | | 9,350 | | | | 4,852,845 | |
| |
Kyocera Corp. | | | | | 44,200 | | | | 1,992,423 | |
| |
Murata Manufacturing Co. Ltd. | | | | | 35,100 | | | | 4,977,326 | |
| |
Spectris plc | | | | | 40,332 | | | | 1,034,801 | |
| |
TE Connectivity Ltd. | | | | | 23,430 | | | | 1,509,829 | |
| | | | | | | | | | |
| | | | | | | | | 16,627,760 | |
|
| |
Internet Software & Services—3.9% | | | | | | | | | | |
| |
Alibaba Group Holding Ltd., Sponsored ADR1 | | | | | 41,200 | | | | 3,453,796 | |
| |
Alphabet, Inc., Cl. A1 | | | | | 16,499 | | | | 12,166,198 | |
| |
Alphabet, Inc., Cl. C1 | | | | | 18,362 | | | | 13,051,893 | |
| |
Baidu, Inc., Sponsored ADR1 | | | | | 29,620 | | | | 5,552,861 | |
| |
eBay, Inc.1 | | | | | 153,750 | | | | 4,289,625 | |
| |
Facebook, Inc., Cl. A1 | | | | | 104,340 | | | | 10,639,550 | |
| |
LinkedIn Corp., Cl. A1 | | | | | 15,780 | | | | 3,800,929 | |
| |
MercadoLibre, Inc. | | | | | 3,110 | | | | 305,931 | |
| |
NAVER Corp. | | | | | 1,365 | | | | 715,975 | |
| |
Qihoo 360 Technology Co. Ltd., ADR1 | | | | | 14,390 | | | | 821,525 | |
| |
Tencent Holdings Ltd. | | | | | 118,385 | | | | 2,215,689 | |
| |
United Internet AG | | | | | 33,522 | | | | 1,741,450 | |
| |
Yahoo Japan Corp. | | | | | 428,400 | | | | 1,811,687 | |
| | | | | | | | | | |
| | | | | | | | | 60,567,109 | |
|
| |
IT Services—2.0% | | | | | | | | | | |
| |
Amadeus IT Holding SA, Cl. A | | | | | 59,508 | | | | 2,532,181 | |
| |
Amdocs Ltd. | | | | | 63,180 | | | | 3,763,633 | |
| |
Computer Sciences Corp. | | | | | 18,620 | | | | 1,239,906 | |
| |
Earthport plc1 | | | | | 714,434 | | | | 428,725 | |
| |
First Data Corp., Cl. A1 | | | | | 31,290 | | | | 495,634 | |
| |
Infosys Ltd. | | | | | 99,153 | | | | 1,715,451 | |
| |
International Business Machines Corp. | | | | | 4,050 | | | | 567,324 | |
| |
MasterCard, Inc., Cl. A | | | | | 44,850 | | | | 4,439,701 | |
| |
NTT Data Corp. | | | | | 43,100 | | | | 2,136,218 | |
| |
PayPal Holdings, Inc.1 | | | | | 230,600 | | | | 8,303,906 | |
| |
Tata Consultancy Services Ltd. | | | | | 21,844 | | | | 834,531 | |
| |
Visa, Inc., Cl. A | | | | | 35,872 | | | | 2,782,950 | |
| |
Xerox Corp. | | | | | 185,560 | | | | 1,742,408 | |
| | | | | | | | | | |
| | | | | | | | | 30,982,568 | |
|
| |
Semiconductors & Semiconductor Equipment—1.7% | | | | | | | | | | |
| |
Altera Corp. | | | | | 73,610 | | | | 3,868,205 | |
| |
Applied Materials, Inc. | | | | | 104,850 | | | | 1,758,335 | |
| |
ARM Holdings plc | | | | | 106,700 | | | | 1,686,525 | |
| |
ASML Holding NV | | | | | 24,520 | | | | 2,273,048 | |
| |
Broadcom Corp., Cl. A | | | | | 32,840 | | | | 1,687,976 | |
23 OPPENHEIMER GLOBAL ALLOCATION FUND
| | |
| |
| CONSOLIDATED STATEMENT OF INVESTMENTS Continued | | |
| | | | | | | | | | |
| | | | | Shares | | | Value | |
| |
Semiconductors & Semiconductor Equipment (Continued) | | | | | | | | | | |
| |
Infineon Technologies AG | | | | | 393,950 | | | $ | 4,848,507 | |
| |
Intel Corp. | | | | | 38,090 | | | | 1,289,727 | |
| |
Maxim Integrated Products, Inc. | | | | | 97,330 | | | | 3,988,583 | |
| |
Micron Technology, Inc.1 | | | | | 38,396 | | | | 635,838 | |
| |
NVIDIA Corp. | | | | | 16,670 | | | | 472,928 | |
| |
SunEdison, Inc.1 | | | | | 162,900 | | | | 1,189,170 | |
| |
Taiwan Semiconductor Manufacturing Co. Ltd. | | | | | 300,000 | | | | 1,267,970 | |
| |
Texas Instruments, Inc. | | | | | 11,650 | | | | 660,788 | |
| |
Tokyo Electron Ltd. | | | | | 15,800 | | | | 943,465 | |
| | | | | | | | | | |
| | | | | | | | | 26,571,065 | |
|
| |
Software—2.3% | | | | | | | | | | |
| |
Activision Blizzard, Inc. | | | | | 41,040 | | | | 1,426,550 | |
| |
Adobe Systems, Inc.1 | | | | | 43,680 | | | | 3,872,669 | |
| |
AVEVA Group plc | | | | | 28,130 | | | | 888,666 | |
| |
Check Point Software Technologies Ltd.1 | | | | | 8,540 | | | | 725,388 | |
| |
Dassault Systemes | | | | | 27,815 | | | | 2,194,653 | |
| |
Electronic Arts, Inc.1 | | | | | 22,070 | | | | 1,590,585 | |
| |
Gemalto NV | | | | | 27,846 | | | | 1,745,043 | |
| |
Intuit, Inc. | | | | | 35,480 | | | | 3,456,816 | |
| |
Microsoft Corp. | | | | | 83,180 | | | | 4,378,595 | |
| |
Oracle Corp. | | | | | 77,690 | | | | 3,017,480 | |
| |
SAP SE | | | | | 120,048 | | | | 9,490,681 | |
| |
ServiceNow, Inc.1 | | | | | 2,270 | | | | 185,346 | |
| |
Synopsys, Inc.1 | | | | | 19,640 | | | | 981,607 | |
| |
Temenos Group AG1 | | | | | 45,481 | | | | 2,125,713 | |
| | | | | | | | | | |
| | | | | | | | | 36,079,792 | |
|
| |
Technology Hardware, Storage & Peripherals—1.1% | | | | | | | | | | |
| |
Apple, Inc. | | | | | 103,291 | | | | 12,343,275 | |
| |
Lenovo Group Ltd. | | | | | 1,692,000 | | | | 1,560,787 | |
| |
SanDisk Corp. | | | | | 14,630 | | | | 1,126,510 | |
| |
Western Digital Corp. | | | | | 45,870 | | | | 3,065,033 | |
| | | | | | | | | | |
| | | | | | | | | 18,095,605 | |
|
| |
Materials—1.8% | | | | | | | | | | |
| |
Chemicals—1.1% | | | | | | | | | | |
| |
Asian Paints Ltd. | | | | | 9,175 | | | | 116,529 | |
| |
Eastman Chemical Co. | | | | | 8,610 | | | | 621,384 | |
| |
Essentra plc | | | | | 189,836 | | | | 2,460,461 | |
| |
Linde AG | | | | | 21,131 | | | | 3,664,989 | |
| |
LyondellBasell Industries NV, Cl. A | | | | | 5,190 | | | | 482,203 | |
| |
Novozymes AS, Cl. B | | | | | 35,924 | | | | 1,661,409 | |
| |
PPG Industries, Inc. | | | | | 12,500 | | | | 1,303,250 | |
| |
Sika AG | | | | | 483 | | | | 1,582,190 | |
| |
Syngenta AG | | | | | 13,838 | | | | 4,648,756 | |
| |
Toray Industries, Inc. | | | | | 169,000 | | | | 1,471,256 | |
| | | | | | | | | | |
| | | | | | | | | 18,012,427 | |
|
| |
Construction Materials—0.3% | | | | | | | | | | |
| |
Ambuja Cements Ltd. | | | | | 16,234 | | | | 51,233 | |
| |
Indocement Tunggal Prakarsa Tbk PT | | | | | 204,500 | | | | 266,898 | |
24 OPPENHEIMER GLOBAL ALLOCATION FUND
| | | | | | | | | | |
| | | | | Shares | | | Value | |
| |
Construction Materials (Continued) | | | | | | | | | | |
| |
James Hardie Industries plc | | | | | 134,600 | | | $ | 1,757,252 | |
| |
Semen Indonesia Persero Tbk PT | | | | | 318,000 | | | | 226,183 | |
| |
UltraTech Cement Ltd. | | | | | 7,724 | | | | 342,899 | |
| |
Vulcan Materials Co. | | | | | 20,420 | | | | 1,972,164 | |
| | | | | | | | | | |
| | | | | | | | | 4,616,629 | |
|
| |
Metals & Mining—0.3% | | | | | | | | | | |
| |
Alrosa PAO1 | | | | | 419,982 | | | | 337,806 | |
| |
BHP Billiton Ltd., Sponsored ADR | | | | | 10,860 | | | | 357,186 | |
| |
Glencore plc1 | | | | | 147,000 | | | | 253,182 | |
| |
Goldcorp, Inc. | | | | | 100,920 | | | | 1,293,794 | |
| |
Newcrest Mining Ltd.1 | | | | | 129,600 | | | | 1,125,758 | |
| |
Real Gold Mining Ltd.1 | | | | | 273,000 | | | | 352 | |
| |
Silver Wheaton Corp. | | | | | 60,300 | | | | 819,477 | |
| |
Teck Resources Ltd., Cl. B | | | | | 32,100 | | | | 188,427 | |
| | | | | | | | | | |
| | | | | | | | | 4,375,982 | |
|
| |
Paper & Forest Products—0.1% | | | | | | | | | | |
| |
Louisiana-Pacific Corp.1 | | | | | 54,230 | | | | 957,702 | |
|
| |
Telecommunication Services—2.3% | | | | | | | | | | |
| |
Diversified Telecommunication Services—1.2% | | | | | | | | | | |
| |
BT Group plc, Cl. A | | | | | 372,901 | | | | 2,665,965 | |
| |
Iliad SA | | | | | 8,520 | | | | 1,790,123 | |
| |
Inmarsat plc | | | | | 168,110 | | | | 2,547,674 | |
| |
Nippon Telegraph & Telephone Corp. | | | | | 80,000 | | | | 2,937,852 | |
| |
Spark New Zealand Ltd. | | | | | 665,878 | | | | 1,514,012 | |
| |
Verizon Communications, Inc. | | | | | 89,490 | | | | 4,195,291 | |
| |
Vivendi SA | | | | | 143,380 | | | | 3,450,304 | |
| | | | | | | | | | |
| | | | | | | | | 19,101,221 | |
|
| |
Wireless Telecommunication Services—1.1% | | | | | | | | | | |
| |
America Movil SAB de CV, Cl. L, ADR | | | | | 31,120 | | | | 554,247 | |
| |
China Mobile Ltd. | | | | | 199,000 | | | | 2,366,055 | |
| |
KDDI Corp. | | | | | 146,100 | | | | 3,529,167 | |
| |
MTN Group Ltd. | | | | | 21,539 | | | | 245,215 | |
| |
Rogers Communications, Inc., Cl. B | | | | | 61,755 | | | | 2,457,260 | |
| |
SK Telecom Co. Ltd. | | | | | 10,269 | | | | 2,175,959 | |
| |
T-Mobile US, Inc.1 | | | | | 14,790 | | | | 560,393 | |
| |
Vodafone Group plc | | | | | 1,629,330 | | | | 5,371,296 | |
| | | | | | | | | | |
| | | | | | | | | 17,259,592 | |
|
| |
Utilities—0.6% | | | | | | | | | | |
| |
Electric Utilities—0.2% | | | | | | | | | | |
| |
Edison International | | | | | 36,670 | | | | 2,219,269 | |
| |
ITC Holdings Corp. | | | | | 31,620 | | | | 1,034,606 | |
| |
NextEra Energy, Inc. | | | | | 5,640 | | | | 579,002 | |
| | | | | | | | | | |
| | | | | | | | | 3,832,877 | |
|
| |
Gas Utilities—0.1% | | | | | | | | | | |
| |
AmeriGas Partners LP3 | | | | | 21,900 | | | | 933,816 | |
25 OPPENHEIMER GLOBAL ALLOCATION FUND
| | |
| |
| CONSOLIDATED STATEMENT OF INVESTMENTS Continued | | |
| | | | | | | | |
| | | Shares | | | Value | |
Multi-Utilities—0.3% | | | | | | | | |
PG&E Corp. | | | 89,000 | | | $ | 4,752,600 | |
WEC Energy Group, Inc. | | | 12,130 | | | | 625,423 | |
| | | | | | | | |
| | | | | | | 5,378,023 | |
| | | | | | | | |
Total Common Stocks (Cost $897,610,956) | | | | | | | 950,220,214 | |
| | |
| | | | | | | | | |
Preferred Stocks—0.5% | | | | | | | | |
Banco Davivienda SA, Preference | | | 25,678 | | | | 211,132 | |
Bayerische Motoren Werke (BMW) AG, Preference | | | 40,659 | | | | 3,281,532 | |
Cia Brasileira de Distribuicao, Preference | | | 34,573 | | | | 454,871 | |
Fuchs Petrolub SE, Preference | | | 53,800 | | | | 2,580,410 | |
Lojas Americanas SA, Preference | | | 195,812 | | | | 848,432 | |
Zee Entertainment Enterprises Ltd., 6% Cum. Non-Cv. | | | 11,755,819 | | | | 160,115 | |
| | | | | | | | |
Total Preferred Stocks (Cost $7,343,624) | | | | | | | 7,536,492 | |
| | |
| | | | Units | | | | | |
Rights, Warrants and Certificates—0.0% | | | | | | | | |
Genting Bhd Wts., Strike Price 7.96MYR, Exp. 12/18/181 (Cost $77,776) | | | 123,800 | | | | 25,504 | |
| | |
| | | | Principal Amount | | | | | |
U.S. Government Obligation—11.1% | | | | | | | | |
United States Treasury Bonds, 2.875%, 8/15/45 (Cost $175,565,617) | | $ | 175,200,000 | | | | 173,437,663 | |
| | |
| | | | | | | | | |
Non-Convertible Corporate Bonds and Notes—11.2% | | | | | | | | |
Consumer Discretionary—2.5% | | | | | | | | |
Auto Components—0.3% | | | | | | | | |
Affinia Group, Inc., 7.75% Sr. Unsec. Nts., 5/1/21 | | | 665,000 | | | | 693,262 | |
Gates Global LLC/Gates Global Co., 6% Sr. Unsec. Nts., 7/15/222 | | | 910,000 | | | | 734,825 | |
Icahn Enterprises LP/Icahn Enterprises Finance Corp., 5.875% Sr. Unsec. Nts., 2/1/22 | | | 1,150,000 | | | | 1,188,813 | |
Lear Corp., 4.75% Sr. Unsec. Nts., 1/15/23 | | | 805,000 | | | | 814,056 | |
MPG Holdco I, Inc., 7.375% Sr. Unsec. Nts., 10/15/22 | | | 1,085,000 | | | | 1,158,238 | |
| | | | | | | | |
| | | | | | | 4,589,194 | |
| | | | | | | | |
Automobiles—0.1% | | | | | | | | |
General Motors Co., 5% Sr. Unsec. Nts., 4/1/35 | | | 665,000 | | | | 652,348 | |
Jaguar Land Rover Automotive plc, 5.625% Sr. Unsec. Nts., 2/1/232 | | | 555,000 | | | | 573,731 | |
ZF North America Capital, Inc., 4.50% Sr. Unsec. Nts., 4/29/222 | | | 295,000 | | | | 298,133 | |
| | | | | | | | |
| | | | | | | 1,524,212 | |
| | | | | | | | |
Distributors—0.1% | | | | | | | | |
LKQ Corp., 4.75% Sr. Unsec. Nts., 5/15/23 | | | 610,000 | | | | 602,375 | |
| | | | | | | | |
Hotels, Restaurants & Leisure—0.5% | | | | | | | | |
1011778 B.C. ULC/New Red Finance, Inc., 6% Sec. Nts., 4/1/222 | | | 665,000 | | | | 696,920 | |
Boyd Gaming Corp., 6.875% Sr. Unsec. Nts., 5/15/23 | | | 330,000 | | | | 351,450 | |
Caesars Entertainment Resort Properties LLC, 11% Sec. Nts., 10/1/21 | | | 335,000 | | | | 321,600 | |
| Caesars Growth Properties Holdings LLC/Caesars Growth Properties Finance, Inc., 9.375% Sec. Nts., 5/1/22 | | | 195,000 | | | | 162,337 | |
Churchill Downs, Inc., 5.375% Sr. Unsec. Nts., 12/15/21 | | | 485,000 | | | | 499,550 | |
26 OPPENHEIMER GLOBAL ALLOCATION FUND
| | | | | | | | | | |
| | | | | Principal
Amount | | | Value | |
| |
Hotels, Restaurants & Leisure (Continued) | | | | | | | | | | |
| |
Greektown Holdings LLC/Greektown Mothership Corp., 8.875% Sr. Sec. Nts., 3/15/192 | | | | $ | 680,000 | | | $ | 693,600 | |
| |
Hilton Worldwide Finance LLC/Hilton Worldwide Finance Corp., 5.625% Sr. Unsec. Nts., 10/15/21 | | | | | 550,000 | | | | 580,266 | |
| |
International Game Technology plc, 6.25% Sr. Sec. Nts., 2/15/222 | | | | | 480,000 | | | | 470,400 | |
| |
Isle of Capri Casinos, Inc., 5.875% Sr. Unsec. Nts., 3/15/21 | | | | | 251,000 | | | | 265,432 | |
| |
Landry’s, Inc., 9.375% Sr. Unsec. Nts., 5/1/202 | | | | | 935,000 | | | | 1,007,463 | |
| |
MCE Finance Ltd., 5% Sr. Unsec. Nts., 2/15/212 | | | | | 430,000 | | | | 404,759 | |
| |
MGM Resorts International: | | | | | | | | | | |
6.00% Sr. Unsec. Nts., 3/15/23 | | | | | 600,000 | | | | 613,500 | |
6.625% Sr. Unsec. Nts., 12/15/21 | | | | | 55,000 | | | | 58,988 | |
6.75% Sr. Unsec. Nts., 10/1/20 | | | | | 390,000 | | | | 419,250 | |
| |
NCL Corp. Ltd., 5.25% Sr. Unsec. Nts., 11/15/192 | | | | | 315,000 | | | | 325,434 | |
| |
PF Chang’s China Bistro, Inc., 10.25% Sr. Unsec. Nts., 6/30/202 | | | | | 285,000 | | | | 266,475 | |
| |
Pinnacle Entertainment, Inc., 6.375% Sr. Unsec. Nts., 8/1/21 | | | | | 475,000 | | | | 508,250 | |
| |
Sugarhouse HSP Gaming Prop Mezz LP/Sugarhouse HSP Gaming Finance Corp., 6.375% Sr. Sec. Nts., 6/1/212 | | | | | 365,000 | | | | 354,050 | |
| |
Viking Cruises Ltd., 8.50% Sr. Unsec. Nts., 10/15/222 | | | | | 395,000 | | | | 431,538 | |
| | | | | | | | | | |
| | | | | | | | | 8,431,262 | |
|
| |
Household Durables—0.2% | | | | | | | | | | |
| |
Jarden Corp.: | | | | | | | | | | |
5.00% Sr. Unsec. Nts., 11/15/232 | | | | | 70,000 | | | | 72,275 | |
6.125% Sr. Unsec. Nts., 11/15/22 | | | | | 240,000 | | | | 249,300 | |
| |
KB Home: | | | | | | | | | | |
7.00% Sr. Unsec. Nts., 12/15/21 | | | | | 550,000 | | | | 559,625 | |
7.625% Sr. Unsec. Nts., 5/15/23 | | | | | 640,000 | | | | 652,800 | |
| |
Lennar Corp.: | | | | | | | | | | |
4.75% Sr. Unsec. Nts., 11/15/22 | | | | | 100,000 | | | | 100,500 | |
4.75% Sr. Unsec. Nts., 5/30/25 | | | | | 360,000 | | | | 358,200 | |
| |
Meritage Homes Corp., 7.15% Sr. Unsec. Nts., 4/15/20 | | | | | 730,000 | | | | 799,350 | |
| |
Taylor Morrison Communities, Inc./Monarch Communities, Inc., 5.25% Sr. Unsec. Nts., 4/15/212 | | | | | 500,000 | | | | 506,250 | |
| | | | | | | | | | |
| | | | | | | | | 3,298,300 | |
|
| |
Media—0.8% | | | | | | | | | | |
| |
Altice Financing SA, 6.50% Sec. Nts., 1/15/222 | | | | | 1,140,000 | | | | 1,157,100 | |
| |
Altice Finco SA, 8.125% Sec. Nts., 1/15/242 | | | | | 530,000 | | | | 528,675 | |
| |
CCO Holdings LLC/CCO Holdings Capital Corp.: | | | | | | | | | | |
5.125% Sr. Unsec. Nts., 5/1/232 | | | | | 460,000 | | | | 463,450 | |
5.75% Sr. Unsec. Nts., 9/1/23 | | | | | 585,000 | | | | 602,550 | |
| |
DISH DBS Corp.: | | | | | | | | | | |
5.875% Sr. Unsec. Nts., 11/15/24 | | | | | 1,795,000 | | | | 1,721,405 | |
6.75% Sr. Unsec. Nts., 6/1/21 | | | | | 280,000 | | | | 291,900 | |
| |
DreamWorks Animation SKG, Inc., 6.875% Sr. Unsec. Nts., 8/15/202 | | | | | 355,000 | | | | 355,000 | |
| |
Entercom Radio LLC, 10.50% Sr. Unsec. Nts., 12/1/19 | | | | | 270,000 | | | | 282,150 | |
| |
Gannett Co., Inc., 5.50% Sr. Unsec. Nts., 9/15/242 | | | | | 1,385,000 | | | | 1,409,237 | |
| |
Gray Television, Inc., 7.50% Sr. Unsec. Nts., 10/1/20 | | | | | 440,000 | | | | 460,878 | |
| |
iHeartCommunications, Inc., 9% Sr. Sec. Nts., 12/15/19 | | | | | 500,000 | | | | 425,000 | |
| |
LIN Television Corp., 6.375% Sr. Unsec. Nts., 1/15/21 | | | | | 985,000 | | | | 1,033,019 | |
27 OPPENHEIMER GLOBAL ALLOCATION FUND
| | |
| |
| CONSOLIDATED STATEMENT OF INVESTMENTS Continued | | |
| | | | | | | | |
| | | Principal
Amount | | | Value | |
| |
Media (Continued) | | | | | | | | |
| |
Nexstar Broadcasting, Inc.: | | | | | | | | |
6.125% Sr. Unsec. Nts., 2/15/222 | | $ | 290,000 | | | $ | 290,725 | |
6.875% Sr. Unsec. Nts., 11/15/20 | | | 370,000 | | | | 383,875 | |
| |
Numericable SFR SAS, 6% Sr. Sec. Nts., 5/15/222 | | | 1,280,000 | | | | 1,286,400 | |
| |
Sinclair Television Group, Inc.: | | | | | | | | |
5.625% Sr. Unsec. Nts., 8/1/242 | | | 490,000 | | | | 482,038 | |
6.125% Sr. Unsec. Nts., 10/1/22 | | | 690,000 | | | | 712,425 | |
| |
Tribune Media Co., 5.875% Sr. Unsec. Nts., 7/15/222 | | | 235,000 | | | | 242,050 | |
| |
Univision Communications, Inc., 5.125% Sr. Sec. Nts., 2/15/252 | | | 315,000 | | | | 310,275 | |
| |
UPCB Finance VI Ltd., 6.875% Sr. Sec. Nts., 1/15/222 | | | 427,500 | | | | 453,684 | |
| | | | | | | | |
| | | | | | | 12,891,836 | |
|
| |
Multiline Retail—0.1% | | | | | | | | |
| |
Dollar Tree, Inc., 5.75% Sr. Sec. Nts., 3/1/232 | �� | | 1,350,000 | | | | 1,429,312 | |
| |
Neiman Marcus Group Ltd., Inc., 8.75% Sr. Unsec. Nts., 10/15/212,5 | | | 545,000 | | | | 568,817 | |
| | | | | | | | |
| | | | | | | 1,998,129 | |
|
| |
Specialty Retail—0.3% | | | | | | | | |
| |
Apex Tool Group LLC, 7% Sr. Unsec. Nts., 2/1/212 | | | 1,055,000 | | | | 854,550 | |
| |
CST Brands, Inc., 5% Sr. Unsec. Nts., 5/1/23 | | | 285,000 | | | | 289,275 | |
| |
GameStop Corp., 5.50% Sr. Unsec. Nts., 10/1/192 | | | 595,000 | | | | 622,024 | |
| |
L Brands, Inc.: | | | | | | | | |
6.625% Sr. Unsec. Nts., 4/1/21 | | | 885,000 | | | | 1,006,688 | |
6.875% Sr. Unsec. Nts., 11/1/352 | | | 490,000 | | | | 512,662 | |
| |
Michaels Stores, Inc., 5.875% Sr. Sub. Nts., 12/15/202 | | | 342,000 | | | | 362,520 | |
| |
Sally Holdings LLC/Sally Capital, Inc., 5.75% Sr. Unsec. Nts., 6/1/22 | | | 455,000 | | | | 482,300 | |
| |
Toys R U.S. Property Co. II LLC, 8.50% Sr. Sec. Nts., 12/1/17 | | | 180,000 | | | | 175,050 | |
| | | | | | | | |
| | | | | | | 4,305,069 | |
|
| |
Textiles, Apparel & Luxury Goods—0.1% | | | | | | | | |
| |
Levi Strauss & Co.: | | | | | | | | |
5.00% Sr. Unsec. Nts., 5/1/25 | | | 495,000 | | | | 506,138 | |
6.875% Sr. Unsec. Nts., 5/1/22 | | | 105,000 | | | | 115,631 | |
| |
PVH Corp., 4.50% Sr. Unsec. Unsub. Nts., 12/15/22 | | | 390,000 | | | | 392,925 | |
| |
Springs Industries, Inc., 6.25% Sr. Sec. Nts., 6/1/21 | | | 595,000 | | | | 595,000 | |
| | | | | | | | |
| | | | | | | 1,609,694 | |
|
| |
Consumer Staples—0.4% | | | | | | | | |
| |
Beverages—0.0% | | | | | | | | |
| |
Constellation Brands, Inc., 4.75% Sr. Unsec. Nts., 11/15/24 | | | 490,000 | | | | 514,500 | |
|
| |
Food & Staples Retailing—0.1% | | | | | | | | |
| |
Ingles Markets, Inc., 5.75% Sr. Unsec. Nts., 6/15/23 | | | 190,000 | | | | 194,750 | |
| |
Omnicare, Inc., 4.75% Sr. Unsec. Nts., 12/1/22 | | | 210,000 | | | | 229,302 | |
| |
Rite Aid Corp.: | | | | | | | | |
6.125% Sr. Unsec. Nts., 4/1/232 | | | 490,000 | | | | 529,812 | |
6.75% Sr. Unsec. Nts., 6/15/21 | | | 755,000 | | | | 812,569 | |
| | | | | | | | |
| | | | | | | 1,766,433 | |
|
| |
Food Products—0.2% | | | | | | | | |
| |
Chiquita Brands International, Inc./Chiquita Brands LLC, 7.875% Sr. Sec. Nts., 2/1/21 | | | 173,000 | | | | 184,245 | |
28 OPPENHEIMER GLOBAL ALLOCATION FUND
| | | | | | | | | | |
| | | | | Principal
Amount | | | Value | |
| |
Food Products (Continued) | | | | | | | | | | |
| |
Dean Foods Co., 6.50% Sr. Unsec. Nts., 3/15/232 | | | | $ | 575,000 | | | $ | 608,062 | |
| |
JBS USA LLC/JBS USA Finance, Inc., 5.75% Sr. Unsec. Nts., 6/15/252 | | | | | 480,000 | | | | 466,800 | |
| |
Pilgrim’s Pride Corp., 5.75% Sr. Unsec. Nts., 3/15/252 | | | | | 455,000 | | | | 466,375 | |
| |
Post Holdings, Inc.: | | | | | | | | | | |
6.75% Sr. Unsec. Nts., 12/1/212 | | | | | 440,000 | | | | 456,500 | |
7.375% Sr. Unsec. Nts., 2/15/22 | | | | | 660,000 | | | | 697,851 | |
| |
WhiteWave Foods Co., 5.375% Sr. Unsec. Nts., 10/1/22 | | | | | 175,000 | | | | 188,125 | |
| | | | | | | | | | |
| | | | | | | | | 3,067,958 | |
|
| |
Household Products—0.1% | | | | | | | | | | |
| |
Spectrum Brands, Inc.: | | | | | | | | | | |
6.125% Sr. Unsec. Nts., 12/15/242 | | | | | 115,000 | | | | 124,488 | |
6.375% Sr. Unsec. Nts., 11/15/20 | | | | | 370,000 | | | | 396,825 | |
| | | | | | | | | | |
| | | | | | | | | 521,313 | |
|
| |
Personal Products—0.0% | | | | | | | | | | |
| |
Revlon Consumer Products Corp., 5.75% Sr. Unsec. Nts., 2/15/21 | | | | | 495,000 | | | | 503,663 | |
|
| |
Tobacco—0.0% | | | | | | | | | | |
| |
Vector Group Ltd., 7.75% Sr. Sec. Nts., 2/15/21 | | | | | 470,000 | | | | 502,900 | |
|
| |
Energy—1.3% | | | | | | | | | | |
| |
Energy Equipment & Services—0.1% | | | | | | | | | | |
| |
Eletson Holdings, 9.625% Sr. Sec. Nts., 1/15/222 | | | | | 585,000 | | | | 539,662 | |
| |
Endeavor Energy Resources LP/EER Finance, Inc., 7% Sr. Unsec. Nts., 8/15/212 | | | | | 375,000 | | | | 361,875 | |
| |
Hornbeck Offshore Services, Inc., 5.875% Sr. Unsec. Nts., 4/1/20 | | | | | 400,000 | | | | 324,000 | |
| |
Precision Drilling Corp., 6.625% Sr. Unsec. Nts., 11/15/20 | | | | | 330,000 | | | | 295,763 | |
| | | | | | | | | | |
| | | | | | | | | 1,521,300 | |
|
| |
Oil, Gas & Consumable Fuels—1.2% | | | | | | | | | | |
| |
Antero Resources Corp., 6% Sr. Unsec. Nts., 12/1/20 | | | | | 745,000 | | | | 718,925 | |
| |
Bill Barrett Corp., 7.625% Sr. Unsec. Nts., 10/1/19 | | | | | 255,000 | | | | 196,987 | |
| |
California Resources Corp., 5.50% Sr. Unsec. Nts., 9/15/21 | | | | | 1,295,000 | | | | 896,787 | |
| |
Carrizo Oil & Gas, Inc., 7.50% Sr. Unsec. Nts., 9/15/20 | | | | | 560,000 | | | | 561,400 | |
| |
Chaparral Energy, Inc., 7.625% Sr. Unsec. Nts., 11/15/22 | | | | | 155,000 | | | | 51,925 | |
| |
Chesapeake Energy Corp.: | | | | | | | | | | |
4.875% Sr. Unsec. Nts., 4/15/22 | | | | | 420,000 | | | | 262,500 | |
5.375% Sr. Unsec. Nts., 6/15/21 | | | | | 290,000 | | | | 189,225 | |
| |
Cloud Peak Energy Resources LLC/Cloud Peak Energy Finance Corp., | | | | | | | | | | |
8.50% Sr. Unsec. Nts., 12/15/19 | | | | | 295,000 | | | | 175,525 | |
| |
Concho Resources, Inc., 5.50% Sr. Unsec. Unsub. Nts., 4/1/23 | | | | | 615,000 | | | | 621,150 | |
| |
CONSOL Energy, Inc., 5.875% Sr. Unsec. Nts., 4/15/22 | | | | | 585,000 | | | | 383,175 | |
| |
Denbury Resources, Inc., 5.50% Sr. Sub. Nts., 5/1/22 | | | | | 525,000 | | | | 370,125 | |
| |
Energy Transfer Equity LP: | | | | | | | | | | |
5.875% Sr. Sec. Nts., 1/15/24 | | | | | 930,000 | | | | 905,611 | |
7.50% Sr. Sec. Nts., 10/15/20 | | | | | 355,000 | | | | 383,471 | |
| |
Energy XXI Gulf Coast, Inc., 11% Sec. Nts., 3/15/202 | | | | | 270,000 | | | | 146,137 | |
| |
EP Energy LLC/Everest Acquisition Finance, Inc.: | | | | | | | | | | |
6.375% Sr. Unsec. Nts., 6/15/23 | | | | | 135,000 | | | | 103,275 | |
7.75% Sr. Unsec. Nts., 9/1/22 | | | | | 360,000 | | | | 279,000 | |
9.375% Sr. Unsec. Nts., 5/1/20 | | | | | 450,000 | | | | 393,750 | |
29 OPPENHEIMER GLOBAL ALLOCATION FUND
| | |
| |
| CONSOLIDATED STATEMENT OF INVESTMENTS Continued | | |
| | | | | | | | |
| | | Principal
Amount | | | Value | |
| |
Oil, Gas & Consumable Fuels (Continued) | | | | | | | | |
| |
Genesis Energy LP/Genesis Energy Finance Corp., 5.75% Sr. Unsec. Nts., 2/15/21 | | $ | 485,000 | | | $ | 455,900 | |
| |
Halcon Resources Corp., 8.875% Sr. Unsec. Nts., 5/15/21 | | | 200,000 | | | | 68,125 | |
| |
Laredo Petroleum, Inc.: | | | | | | | | |
5.625% Sr. Unsec. Nts., 1/15/22 | | | 135,000 | | | | 127,575 | |
6.25% Sr. Unsec. Nts., 3/15/23 | | | 590,000 | | | | 569,350 | |
| |
LBC Tank Terminals Holding Netherlands BV, 6.875% Sr. Unsec. Nts., 5/15/234 | | | 280,000 | | | | 288,400 | |
| |
Linn Energy LLC/Linn Energy Finance Corp., 7.75% Sr. Unsec. Nts., 2/1/21 | | | 440,000 | | | | 103,400 | |
| |
MarkWest Energy Partners LP/MarkWest Energy Finance Corp.: | | | | | | | | |
4.875% Sr. Unsec. Nts., 12/1/24-6/1/25 | | | 670,000 | | | | 634,312 | |
| |
MEG Energy Corp., 6.50% Sr. Unsec. Nts., 3/15/212 | | | 500,000 | | | | 442,500 | |
| |
Memorial Production Partners LP/Memorial Production Finance Corp., 7.625% Sr. Unsec. Nts., 5/1/21 | | | 205,000 | | | | 138,375 | |
| |
Murray Energy Corp., 11.25% Sec. Nts., 4/15/212 | | | 1,090,000 | | | | 294,300 | |
| |
Navios Maritime Acquisition Corp./Navios Acquisition Finance US, Inc., 8.125% Sr. Sec. Nts., 11/15/212 | | | 365,000 | | | | 350,856 | |
| |
Newfield Exploration Co., 5.625% Sr. Unsec. Nts., 7/1/24 | | | 545,000 | | | | 545,000 | |
| |
Noble Energy, Inc., 5.625% Sr. Unsec. Nts., 5/1/21 | | | 355,000 | | | | 360,388 | |
| |
Oasis Petroleum, Inc., 6.875% Sr. Unsec. Nts., 1/15/23 | | | 215,000 | | | | 187,050 | |
| |
ONEOK, Inc., 7.50% Sr. Unsec. Nts., 9/1/23 | | | 530,000 | | | | 524,700 | |
| |
Peabody Energy Corp., 6% Sr. Unsec. Nts., 11/15/18 | | | 265,000 | | | | 47,700 | |
| |
Range Resources Corp.: | | | | | | | | |
5.00% Sr. Sub. Nts., 8/15/22 | | | 495,000 | | | | 442,999 | |
5.00% Sr. Sub. Nts., 3/15/23 | | | 375,000 | | | | 334,688 | |
| |
Rice Energy, Inc., 6.25% Sr. Unsec. Nts., 5/1/22 | | | 665,000 | | | | 605,150 | |
| |
Sabine Pass Liquefaction LLC: | | | | | | | | |
5.625% Sr. Sec. Nts., 3/1/252 | | | 980,000 | | | | 943,250 | |
5.75% Sr. Sec. Nts., 5/15/24 | | | 135,000 | | | | 130,613 | |
| |
Sanchez Energy Corp.: | | | | | | | | |
6.125% Sr. Unsec. Nts., 1/15/23 | | | 190,000 | | | | 138,700 | |
7.75% Sr. Unsec. Nts., 6/15/21 | | | 110,000 | | | | 88,000 | |
| |
SandRidge Energy, Inc., 8.75% Sec. Nts., 6/1/202 | | | 215,000 | | | | 131,688 | |
| |
SM Energy Co., 6.50% Sr. Unsec. Nts., 1/1/23 | | | 330,000 | | | | 326,831 | |
| |
Summit Midstream Holdings LLC/Summit Midstream Finance Corp., 5.50% Sr. Unsec. Nts., 8/15/22 | | | 265,000 | | | | 231,875 | |
| |
Targa Resources Partners LP/Targa Resources Partners Finance Corp.: | | | | | | | | |
4.125% Sr. Unsec. Nts., 11/15/19 | | | 675,000 | | | | 631,125 | |
5.00% Sr. Unsec. Nts., 1/15/182 | | | 375,000 | | | | 371,250 | |
| |
Tesoro Logistics LP/Tesoro Logistics Finance Corp.: | | | | | | | | |
5.875% Sr. Unsec. Nts., 10/1/20 | | | 270,000 | | | | 282,150 | |
6.25% Sr. Unsec. Nts., 10/15/222 | | | 130,000 | | | | 135,850 | |
| |
Whiting Petroleum Corp., 5.75% Sr. Unsec. Nts., 3/15/21 | | | 1,015,000 | | | | 950,294 | |
| |
Williams Partners LP/ACMP, 6.125% Sr. Unsec. Nts., 7/15/22 | | | 335,000 | | | | 343,281 | |
| |
WPX Energy, Inc.: | | | | | | | | |
5.25% Sr. Unsec. Nts., 9/15/24 | | | 170,000 | | | | 141,950 | |
6.00% Sr. Unsec. Nts., 1/15/22 | | | 300,000 | | | | 267,000 | |
| | | | | | | | |
| | | | | | | 18,273,593 | |
30 OPPENHEIMER GLOBAL ALLOCATION FUND
| | | | | | | | | | |
| | | |
| Principal
Amount |
| | | Value | |
| |
Financials—1.3% | | | | | | | | | | |
| |
Capital Markets—0.4% | | | | | | | | | | |
| |
Cantor Commercial Real Estate Co. LP/CCRE Finance Corp., 7.75% Sr. Unsec. Nts., 2/15/182 | | | | $ | 465,000 | | | $ | 487,087 | |
| |
| Drawbridge Special Opportunities Fund LP/Drawbridge Special Opportunities Finance Corp., 5% Sr. Unsec. Nts., 8/1/212 | | | | | 595,000 | | | | 584,587 | |
| |
First Data Corp.: | | | | | | | | | | |
6.75% Sr. Sec. Nts., 11/1/202 | | | | | 417,000 | | | | 440,456 | |
7.00% Sr. Unsec. Nts., 12/1/232,6 | | | | | 485,000 | | | | 495,913 | |
8.25% Sec. Nts., 1/15/212 | | | | | 665,000 | | | | 699,081 | |
10.625% Sr. Unsec. Nts., 6/15/21 | | | | | 858,000 | | | | 959,888 | |
| |
KCG Holdings, Inc., 6.875% Sr. Sec. Nts., 3/15/202 | | | | | 910,000 | | | | 866,775 | |
| |
Prospect Medical Holdings, Inc., 8.375% Sr. Sec. Nts., 5/1/192 | | | | | 460,000 | | | | 487,025 | |
| |
Signode Industrial Group Lux SA/Signode Industrial Group US, Inc., 6.375% Sr. Unsec. Nts., 5/1/222 | | | | | 280,000 | | | | 263,900 | |
| |
Springleaf Finance Corp., 5.25% Sr. Unsec. Nts., 12/15/19 | | | | | 700,000 | | | | 698,250 | |
| | | | | | | | | | |
| | | | | | | | | 5,982,962 | |
|
| |
Commercial Banks—0.1% | | | | | | | | | | |
| |
CIT Group, Inc.: | | | | | | | | | | |
4.25% Sr. Unsec. Nts., 8/15/17 | | | | | 145,000 | | | | 148,625 | |
5.00% Sr. Unsec. Nts., 8/15/22 | | | | | 425,000 | | | | 448,906 | |
| |
Constellis Holdings LLC/Constellis Finance Corp., 9.75% Sr. Sec. Nts., 5/15/202 | | | | | 495,000 | | | | 449,831 | |
| |
OPE KAG Finance Sub, Inc., 7.875% Sr. Unsec. Nts., 7/31/232 | | | | | 475,000 | | | | 495,188 | |
| | | | | | | | | | |
| | | | | | | | | 1,542,550 | |
|
| |
Consumer Finance—0.3% | | | | | | | | | | |
| |
Ahern Rentals, Inc., 7.375% Sec. Nts., 5/15/232 | | | | | 495,000 | | | | 462,825 | |
| |
Ally Financial, Inc.: | | | | | | | | | | |
4.625% Sr. Unsec. Nts., 5/19/22 | | | | | 520,000 | | | | 542,100 | |
5.125% Sr. Unsec. Nts., 9/30/24 | | | | | 685,000 | | | | 724,353 | |
| |
Cash America International, Inc., 5.75% Sr. Unsec. Nts., 5/15/18 | | | | | 265,000 | | | | 268,313 | |
| |
Navient Corp.: | | | | | | | | | | |
5.50% Sr. Unsec. Nts., 1/25/23 | | | | | 800,000 | | | | 724,000 | |
7.25% Sr. Unsec. Nts., 1/25/22 | | | | | 400,000 | | | | 397,250 | |
| |
Speedy Cash Intermediate Holdings Corp., 10.75% Sec. Nts., 5/15/182 | | | | | 495,000 | | | | 358,875 | |
| |
TMX Finance LLC/TitleMax Finance Corp., 8.50% Sr. Sec. Nts., 9/15/182 | | | | | 620,000 | | | | 489,800 | |
| | | | | | | | | | |
| | | | | | | | | 3,967,516 | |
|
| |
Diversified Financial Services—0.0% | | | | | | | | | | |
| |
Capsugel SA, 7% Sr. Unsec. Nts., 5/15/192,5 | | | | | 365,000 | | | | 368,422 | |
| |
Jefferies LoanCore LLC/JLC Finance Corp., 6.875% Sr. Unsec. Nts., 6/1/202 | | | | | 350,000 | | | | 344,750 | |
| | | | | | | | | | |
| | | | | | | | | 713,172 | |
|
| |
Insurance—0.1% | | | | | | | | | | |
| |
CNO Financial Group, Inc., 4.50% Sr. Unsec. Nts., 5/30/20 | | | | | 520,000 | | | | 545,935 | |
| |
HUB International Ltd., 7.875% Sr. Unsec. Nts., 10/1/212 | | | | | 440,000 | | | | 440,000 | |
31 OPPENHEIMER GLOBAL ALLOCATION FUND
| | |
| |
| CONSOLIDATED STATEMENT OF INVESTMENTS Continued | | |
| | | | | | | | | | |
| | | | | Principal
Amount | | | Value | |
| |
Insurance (Continued) | | | | | | | | | | |
| |
National Financial Partners Corp., 9% Sr. Unsec. Nts., 7/15/212 | | | | $ | 645,000 | | | $ | 634,519 | |
| | | | | | | | | | |
| | | | | | | | | 1,620,454 | |
|
| |
Real Estate Investment Trusts (REITs)—0.2% | | | | | | | | | | |
| |
Communications Sales & Leasing, Inc./CSL Capital LLC, 8.25% Sr. Unsec. Nts., 10/15/23 | | | | | 555,000 | | | | 515,872 | |
| |
CTR Partnership LP/CareTrust Capital Corp., 5.875% Sr. Unsec. Nts., 6/1/21 | | | | | 320,000 | | | | 329,760 | |
| |
DuPont Fabros Technology LP, 5.875% Sr. Unsec. Nts., 9/15/21 | | | | | 445,000 | | | | 469,475 | |
| |
Equinix, Inc.: | | | | | | | | | | |
4.875% Sr. Unsec. Nts., 4/1/20 | | | | | 345,000 | | | | 362,250 | |
5.375% Sr. Unsec. Nts., 1/1/22 | | | | | 505,000 | | | | 530,098 | |
| |
Iron Mountain, Inc., 6% Sr. Unsec. Nts., 10/1/202 | | | | | 185,000 | | | | 196,563 | |
| |
iStar, Inc., 4.875% Sr. Unsec. Nts., 7/1/18 | | | | | 495,000 | | | | 489,431 | |
| |
Outfront Media Capital LLC/Outfront Media Capital Corp., 5.875% Sr. Unsec. Nts., 3/15/25 | | | | | 475,000 | | | | 494,594 | |
| | | | | | | | | | |
| | | | | | | | | 3,388,043 | |
|
| |
Real Estate Management & Development—0.1% | | | | | | | | | | |
| |
Brookfield Residential Properties, Inc., 6.50% Sr. Unsec. Nts., 12/15/202 | | | | | 475,000 | | | | 478,562 | |
| |
Realogy Group LLC, 9% Sr. Sec. Nts., 1/15/204 | | | | | 245,000 | | | | 259,394 | |
| |
Realogy Group LLC/Realogy Co.-Issuer Corp., 5.25% Sr. Unsec. Nts., 12/1/212 | | | | | 370,000 | | | | 385,263 | |
| | | | | | | | | | |
| | | | | | | | | 1,123,219 | |
|
| |
Thrifts & Mortgage Finance—0.1% | | | | | | | | | | |
| |
Jefferies Finance LLC/JFIN Co.-Issuer Corp.: | | | | | | | | | | |
6.875% Sr. Unsec. Nts., 4/15/222 | | | | | 145,000 | | | | 137,025 | |
7.375% Sr. Unsec. Nts., 4/1/202 | | | | | 260,000 | | | | 256,100 | |
| |
Quicken Loans, Inc., 5.75% Sr. Unsec. Nts., 5/1/252 | | | | | 505,000 | | | | 503,106 | |
| |
Radian Group, Inc., 5.25% Sr. Unsec. Nts., 6/15/20 | | | | | 995,000 | | | | 996,244 | |
| |
Walter Investment Management Corp., 7.875% Sr. Unsec. Nts., 12/15/21 | | | | | 465,000 | | | | 378,394 | |
| | | | | | | | | | |
| | | | | | | | | 2,270,869 | |
|
| |
Health Care—1.1% | | | | | | | | | | |
| |
Biotechnology—0.0% | | | | | | | | | | |
| |
Universal Hospital Services, Inc., 7.625% Sec. Nts., 8/15/20 | | | | | 175,000 | | | | 167,781 | |
|
| |
Health Care Equipment & Supplies—0.2% | | | | | | | | | | |
| |
Alere, Inc., 6.50% Sr. Sub. Nts., 6/15/20 | | | | | 305,000 | | | | 316,438 | |
| |
DJO Finco, Inc./DJO Finance LLC/DJO Finance Corp., 8.125% Sec. Nts., 6/15/212 | | | | | 330,000 | | | | 328,350 | |
| |
Hill-Rom Holdings, Inc., 5.75% Sr. Unsec. Nts., 9/1/232 | | | | | 195,000 | | | | 199,875 | |
| |
Hologic, Inc., 5.25% Sr. Unsec. Nts., 7/15/222 | | | | | 590,000 | | | | 618,025 | |
| |
Jaguar Holding Co. II/Pharmaceutical Product Development LLC, 6.375% Sr. Unsec. Nts., 8/1/232 | | | | | 640,000 | | | | 642,400 | |
| |
Kinetic Concepts, Inc./KCI USA, Inc., 10.50% Sec. Nts., 11/1/18 | | | | | 320,000 | | | | 338,688 | |
| | | | | | | | | | |
| | | | | | | | | 2,443,776 | |
32 OPPENHEIMER GLOBAL ALLOCATION FUND
| | | | | | | | | | |
| | | | | Principal
Amount | | | Value | |
| |
Health Care Providers & Services—0.6% | | | | | | | | | | |
| |
Acadia Healthcare Co., Inc., 5.625% Sr. Unsec. Nts., 2/15/23 | | | | $ | 210,000 | | | $ | 211,312 | |
| |
Amsurg Corp., 5.625% Sr. Unsec. Nts., 7/15/22 | | | | | 180,000 | | | | 177,525 | |
| |
Centene Corp., 4.75% Sr. Unsec. Nts., 5/15/22 | | | | | 635,000 | | | | 635,000 | |
| |
CHS/Community Health Systems, Inc.: | | | | | | | | | | |
6.875% Sr. Unsec. Nts., 2/1/22 | | | | | 920,000 | | | | 931,500 | |
7.125% Sr. Unsec. Nts., 7/15/20 | | | | | 270,000 | | | | 278,100 | |
| |
DaVita HealthCare Partners, Inc.: | | | | | | | | | | |
5.00% Sr. Unsec. Nts., 5/1/25 | | | | | 275,000 | | | | 273,679 | |
5.125% Sr. Unsec. Nts., 7/15/24 | | | | | 160,000 | | | | 163,000 | |
5.75% Sr. Unsec. Nts., 8/15/22 | | | | | 280,000 | | | | 295,050 | |
| |
Envision Healthcare Corp., 5.125% Sr. Unsec. Nts., 7/1/222 | | | | | 515,000 | | | | 502,125 | |
| |
ExamWorks Group, Inc., 5.625% Sr. Unsec. Nts., 4/15/23 | | | | | 275,000 | | | | 287,031 | |
| |
FGI Operating Co. LLC/FGI Finance, Inc., 7.875% Sec. Nts., 5/1/20 | | | | | 450,000 | | | | 358,875 | |
| |
Fresenius Medical Care US Finance II, Inc.: | | | | | | | | | | |
4.75% Sr. Unsec. Nts., 10/15/242 | | | | | 280,000 | | | | 284,900 | |
5.875% Sr. Unsec. Nts., 1/31/222 | | | | | 145,000 | | | | 158,775 | |
| |
HCA, Inc.: | | | | | | | | | | |
5.375% Sr. Unsec. Nts., 2/1/25 | | | | | 155,000 | | | | 159,650 | |
5.875% Sr. Unsec. Nts., 5/1/23 | | | | | 930,000 | | | | 990,450 | |
7.50% Sr. Unsec. Nts., 2/15/22 | | | | | 550,000 | | | | 635,250 | |
| |
HealthSouth Corp.: | | | | | | | | | | |
5.75% Sr. Unsec. Nts., 11/1/24 | | | | | 270,000 | | | | 271,350 | |
5.75% Sr. Unsec. Nts., 11/1/242 | | | | | 515,000 | | | | 517,575 | |
| |
Kindred Healthcare, Inc., 6.375% Sr. Unsec. Nts., 4/15/22 | | | | | 330,000 | | | | 313,087 | |
| |
LifePoint Health, Inc., 5.50% Sr. Unsec. Nts., 12/1/21 | | | | | 335,000 | | | | 340,863 | |
| |
Select Medical Corp., 6.375% Sr. Unsec. Nts., 6/1/21 | | | | | 395,000 | | | | 351,550 | |
| |
Tenet Healthcare Corp.: | | | | | | | | | | |
6.75% Sr. Unsec. Nts., 6/15/23 | | | | | 1,150,000 | | | | 1,154,313 | |
8.125% Sr. Unsec. Nts., 4/1/22 | | | | | 875,000 | | | | 929,688 | |
| | | | | | | | | | |
| | | | | | | | | 10,220,648 | |
|
| |
Life Sciences Tools & Services—0.0% | | | | | | | | | | |
| |
Quintiles Transnational Corp., 4.875% Sr. Unsec. Nts., 5/15/232 | | | | | 380,000 | | | | 392,586 | |
|
| |
Pharmaceuticals—0.3% | | | | | | | | | | |
| |
Concordia Healthcare Corp., 7% Sr. Unsec. Nts., 4/15/232 | | | | | 385,000 | | | | 336,875 | |
| |
DPx Holdings BV, 7.50% Sr. Unsec. Nts., 2/1/222 | | | | | 300,000 | | | | 307,125 | |
| |
Endo Finance LLC/Endo Finco, Inc., 5.375% Sr. Unsec. Nts., 1/15/232 | | | | | 600,000 | | | | 591,420 | |
| |
Endo Finance LLC/Endo Ltd./Endo Finco, Inc.: | | | | | | | | | | |
6.00% Sr. Unsec. Nts., 7/15/23-2/1/252 | | | | | 315,000 | | | | 316,475 | |
| |
Mallinckrodt International Finance SA/Mallinckrodt CB LLC: | | | | | | | | | | |
4.875% Sr. Unsec. Nts., 4/15/202 | | | | | 275,000 | | | | 265,031 | |
5.50% Sr. Unsec. Nts., 4/15/252 | | | | | 275,000 | | | | 251,625 | |
| |
Valeant Pharmaceuticals International, Inc.: | | | | | | | | | | |
5.375% Sr. Unsec. Nts., 3/15/202 | | | | | 215,000 | | | | 188,125 | |
5.50% Sr. Unsec. Nts., 3/1/232 | | | | | 525,000 | | | | 443,625 | |
5.875% Sr. Unsec. Nts., 5/15/232 | | | | | 1,255,000 | | | | 1,060,475 | |
6.375% Sr. Unsec. Nts., 10/15/202 | | | | | 270,000 | | | | 243,675 | |
7.25% Sr. Unsec. Nts., 7/15/222 | | | | | 370,000 | | | | 333,000 | |
| | | | | | | | | | |
| | | | | | | | | 4,337,451 | |
33 OPPENHEIMER GLOBAL ALLOCATION FUND
| | |
| |
| CONSOLIDATED STATEMENT OF INVESTMENTS Continued | | |
| | | | | | | | | | |
| | | | | Principal
Amount | | | Value | |
| |
Industrials—2.1% | | | | | | | | | | |
| |
Aerospace & Defense—0.4% | | | | | | | | | | |
| |
Aerojet Rocketdyne Holdings, Inc., 7.125% Sec. Nts., 3/15/21 | | | | $ | 1,080,000 | | | $ | 1,140,750 | |
| |
CBC Ammo LLC/CBC FinCo, Inc., 7.25% Sr. Unsec. Nts., 11/15/212 | | | | | 990,000 | | | | 930,600 | |
| |
DigitalGlobe, Inc., 5.25% Sr. Unsec. Nts., 2/1/212 | | | | | 250,000 | | | | 226,875 | |
| |
Erickson, Inc., 8.25% Sec. Nts., 5/1/20 | | | | | 896,000 | | | | 629,440 | |
| |
Huntington Ingalls Industries, Inc., 7.125% Sr. Unsec. Unsub. Nts., 3/15/21 | | | | | 460,000 | | | | 483,000 | |
| |
KLX, Inc., 5.875% Sr. Unsec. Nts., 12/1/222 | | | | | 705,000 | | | | 723,066 | |
| |
Kratos Defense & Security Solutions, Inc., 7% Sr. Sec. Nts., 5/15/19 | | | | | 413,000 | | | | 310,782 | |
| |
LMI Aerospace, Inc., 7.375% Sec. Nts., 7/15/19 | | | | | 495,000 | | | | 488,812 | |
| |
Sequa Corp., 7% Sr. Unsec. Nts., 12/15/174 | | | | | 550,000 | | | | 279,125 | |
| |
Spirit AeroSystems, Inc., 5.25% Sr. Unsec. Nts., 3/15/22 | | | | | 485,000 | | | | 503,794 | |
| |
TransDigm, Inc., 6% Sr. Sub. Nts., 7/15/22 | | | | | 485,000 | | | | 492,275 | |
| |
Triumph Group, Inc., 5.25% Sr. Unsec. Nts., 6/1/22 | | | | | 585,000 | | | | 528,694 | |
| | | | | | | | | | |
| | | | | | | | | 6,737,213 | |
|
| |
Air Freight & Couriers—0.1% | | | | | | | | | | |
| |
CEVA Group plc, 7% Sr. Sec. Nts., 3/1/212 | | | | | 725,000 | | | | 658,844 | |
| |
SPL Logistics Escrow LLC/SPL Logistics Finance Corp., 8.875% Sr. Sec. Nts., 8/1/202 | | | | | 685,000 | | | | 729,525 | |
| |
XPO Logistics, Inc., 7.875% Sr. Unsec. Nts., 9/1/192 | | | | | 415,000 | | | | 419,150 | |
| | | | | | | | | | |
| | | | | | | | | 1,807,519 | |
|
| |
Airlines—0.1% | | | | | | | | | | |
| |
Air Canada, 6.75% Sr. Sec. Nts., 10/1/192 | | | | | 915,000 | | | | 972,188 | |
| |
Air Medical Merger Sub Corp., 6.375% Sr. Unsec. Nts., 5/15/232 | | | | | 275,000 | | | | 251,625 | |
| |
US Airways 2011-1 Class A Pass Through Trust, 7.125% Pass-Through Certificates, 7.125%, 10/22/23 | | | | | 452,639 | | | | 527,890 | |
| | | | | | | | | | |
| | | | | | | | | 1,751,703 | |
|
| |
Building Products—0.1% | | | | | | | | | | |
| |
Building Materials Corp. of America, 5.375% Sr. Unsec. Nts., 11/15/242 | | | | | 410,000 | | | | 423,837 | |
| |
Nortek, Inc., 8.50% Sr. Unsec. Nts., 4/15/21 | | | | | 640,000 | | | | 681,600 | |
| |
USG Corp., 5.50% Sr. Unsec. Nts., 3/1/252 | | | | | 270,000 | | | | 278,775 | |
| | | | | | | | | | |
| | | | | | | | | 1,384,212 | |
|
| |
Commercial Services & Supplies—0.4% | | | | | | | | | | |
| |
ADT Corp. (The), 5.25% Sr. Unsec. Nts., 3/15/20 | | | | | 945,000 | | | | 1,006,425 | |
| |
Affinion Group, Inc., 7.875% Sr. Unsec. Nts., 12/15/18 | | | | | 880,000 | | | | 682,550 | |
| |
Cenveo Corp.: | | | | | | | | | | |
6.00% Sr. Sec. Nts., 8/1/192 | | | | | 525,000 | | | | 462,509 | |
8.50% Sec. Nts., 9/15/222 | | | | | 130,000 | | | | 96,200 | |
| |
Garda World Security Corp., 7.25% Sr. Unsec. Nts., 11/15/212 | | | | | 1,000,000 | | | | 917,500 | |
| |
Monitronics International, Inc., 9.125% Sr. Unsec. Nts., 4/1/20 | | | | | 1,480,000 | | | | 1,291,300 | |
| |
Quad/Graphics, Inc., 7% Sr. Unsec. Nts., 5/1/22 | | | | | 630,000 | | | | 576,450 | |
| |
R.R. Donnelley & Sons Co., 7.875% Sr. Unsec. Nts., 3/15/21 | | | | | 660,000 | | | | 691,020 | |
| |
West Corp., 5.375% Sr. Unsec. Nts., 7/15/222 | | | | | 970,000 | | | | 927,563 | |
| | | | | | | | | | |
| | | | | | | | | 6,651,517 | |
|
| |
Electrical Equipment—0.2% | | | | | | | | | | |
| |
EnerSys, 5% Sr. Unsec. Nts., 4/30/232 | | | | | 495,000 | | | | 503,662 | |
34 OPPENHEIMER GLOBAL ALLOCATION FUND
| | | | | | | | | | |
| | | | | Principal
Amount | | | Value | |
| |
Electrical Equipment (Continued) | | | | | | | | | | |
| |
General Cable Corp., 5.75% Sr. Unsec. Nts., 10/1/22 | | | | $ | 565,000 | | | $ | 488,725 | |
| |
Sensata Technologies BV, 5.625% Sr. Unsec. Nts., 11/1/242 | | | | | 680,000 | | | | 694,450 | |
| |
Stackpole International Intermediate Co., 7.75% Sr. Sec. Nts., 10/15/212 | | | | | 800,000 | | | | 900,000 | |
| | | | | | | | | | |
| | | | | | | | | 2,586,837 | |
|
| |
Machinery—0.3% | | | | | | | | | | |
| |
Amsted Industries, Inc., 5% Sr. Unsec. Nts., 3/15/222 | | | | | 700,000 | | | | 710,500 | |
| |
Cleaver-Brooks, Inc., 8.75% Sr. Sec. Nts., 12/15/192 | | | | | 850,000 | | | | 822,460 | |
| |
EnPro Industries, Inc., 5.875% Sr. Unsec. Nts., 9/15/22 | | | | | 475,000 | | | | 480,938 | |
| |
Meritor, Inc., 6.25% Sr. Unsec. Nts., 2/15/24 | | | | | 960,000 | | | | 921,600 | |
| |
Navistar International Corp., 8.25% Sr. Unsec. Nts., 11/1/21 | | | | | 785,000 | | | | 614,753 | |
| |
Terex Corp., 6% Sr. Unsec. Nts., 5/15/21 | | | | | 575,000 | | | | 572,125 | |
| |
Xerium Technologies, Inc., 8.875% Sr. Unsec. Nts., 6/15/18 | | | | | 430,000 | | | | 439,406 | |
| | | | | | | | | | |
| | | | | | | | | 4,561,782 | |
|
| |
Marine—0.0% | | | | | | | | | | |
| |
Navios Maritime Holdings, Inc./Navios Maritime Finance II US, Inc., 7.375% Sr. Nts., 1/15/222 | | | | | 395,000 | | | | 312,050 | |
|
| |
Professional Services—0.1% | | | | | | | | | | |
| |
FTI Consulting, Inc., 6% Sr. Unsec. Nts., 11/15/22 | | | | | 650,000 | | | | 691,437 | |
| |
Nielsen Finance LLC/Nielsen Finance Co., 5% Sr. Unsec. Nts., 4/15/222 | | | | | 685,000 | | | | 698,700 | |
| | | | | | | | | | |
| | | | | | | | | 1,390,137 | |
|
| |
Road & Rail—0.1% | | | | | | | | | | |
| |
Avis Budget Car Rental LLC/Avis Budget Finance, Inc., 5.25% Sr. Unsec. Nts., 3/15/252 | | | | | 500,000 | | | | 502,500 | |
|
| |
Trading Companies & Distributors—0.3% | | | | | | | | | | |
| |
American Builders & Contractors Supply Co., Inc., 5.625% Sr. Unsec. Nts., 4/15/212 | | | | | 600,000 | | | | 619,500 | |
| |
Building Materials Corp. of America, 6% Sr. Unsec. Nts., 10/15/252 | | | | | 465,000 | | | | 496,387 | |
| |
Fly Leasing Ltd.: | | | | | | | | | | |
6.375% Sr. Unsec. Nts., 10/15/21 | | | | | 500,000 | | | | 516,250 | |
6.75% Sr. Unsec. Nts., 12/15/20 | | | | | 400,000 | | | | 421,000 | |
| |
HD Supply, Inc.: | | | | | | | | | | |
5.25% Sr. Sec. Nts., 12/15/212 | | | | | 505,000 | | | | 532,144 | |
7.50% Sr. Unsec. Nts., 7/15/20 | | | | | 860,000 | | | | 920,200 | |
| |
Jurassic Holdings III, Inc., 6.875% Sec. Nts., 2/15/212 | | | | | 1,470,000 | | | | 1,065,750 | |
| |
United Rentals North America, Inc., 4.625% Sr. Sec. Nts., 7/15/23 | | | | | 480,000 | | | | 483,898 | |
| | | | | | | | | | |
| | | | | | | | | 5,055,129 | |
|
| |
Information Technology—0.7% | | | | | | | | | | |
| |
Communications Equipment—0.2% | | | | | | | | | | |
| |
Alcatel-Lucent USA, Inc., 6.75% Sr. Unsec. Nts., 11/15/202 | | | | | 584,000 | | | | 622,690 | |
| |
Avaya, Inc., 7% Sr. Sec. Nts., 4/1/192 | | | | | 610,000 | | | | 498,675 | |
| |
Blue Coat Holdings, Inc., 8.375% Sr. Unsec. Nts., 6/1/232 | | | | | 375,000 | | | | 390,000 | |
| |
CommScope Technologies Finance LLC, 6% Sr. Sec. Nts., 6/15/252 | | | | | 235,000 | | | | 239,112 | |
| |
Infor US, Inc.: | | | | | | | | | | |
5.75% Sr. Sec. Nts., 8/15/202 | | | | | 100,000 | | | | 102,250 | |
35 OPPENHEIMER GLOBAL ALLOCATION FUND
| | |
| |
| CONSOLIDATED STATEMENT OF INVESTMENTS Continued | | |
| | | | | | | | | | |
| | | | | Principal
Amount | | | Value | |
| |
Communications Equipment (Continued) | | | | | | | | | | |
| |
Infor US, Inc.: (Continued) | | | | | | | | | | |
6.50% Sr. Unsec. Nts., 5/15/222 | | | | $ | 390,000 | | | $ | 370,500 | |
| |
Plantronics, Inc., 5.50% Sr. Unsec. Nts., 5/31/232 | | | | | 175,000 | | | | 178,500 | |
| |
Riverbed Technology, Inc., 8.875% Sr. Unsec. Nts., 3/1/232 | | | | | 390,000 | | | | 368,063 | |
| |
ViaSat, Inc., 6.875% Sr. Unsec. Nts., 6/15/20 | | | | | 651,000 | | | | 682,736 | |
| | | | | | | | | | |
| | | | | | | | | 3,452,526 | |
|
| |
Electronic Equipment, Instruments, & Components—0.1% | | | | | | | | | | |
| |
Anixter, Inc., 5.625% Sr. Unsec. Nts., 5/1/19 | | | | | 470,000 | | | | 498,200 | |
| |
Belden, Inc., 5.50% Sr. Sub. Nts., 9/1/222 | | | | | 485,000 | | | | 483,787 | |
| |
CDW LLC/CDW Finance Corp., 5% Sr. Unsec. Nts., 9/1/23 | | | | | 160,000 | | | | 166,400 | |
| |
Zebra Technologies Corp., 7.25% Sr. Unsec. Nts., 10/15/22 | | | | | 450,000 | | | | 491,063 | |
| | | | | | | | | | |
| | | | | | | | | 1,639,450 | |
|
| |
Internet Software & Services—0.0% | | | | | | | | | | |
| |
EarthLink Holdings Corp., 7.375% Sr. Sec. Nts., 6/1/20 | | | | | 430,000 | | | | 449,350 | |
|
| |
IT Services—0.1% | | | | | | | | | | |
| |
Ceridian HCM Holding, Inc., 11% Sr. Unsec. Nts., 3/15/212 | | | | | 290,000 | | | | 256,288 | |
| |
Harland Clarke Holdings Corp., 6.875% Sr. Sec. Nts., 3/1/202 | | | | | 570,000 | | | | 517,275 | |
| | | | | | | | | | |
| | | | | | | | | 773,563 | |
|
| |
Semiconductors & Semiconductor Equipment—0.1% | | | | | | | | | | |
| |
Freescale Semiconductor, Inc., 6% Sr. Sec. Nts., 1/15/222 | | | | | 970,000 | | | | 1,035,475 | |
| |
Micron Technology, Inc.: | | | | | | | | | | |
5.25% Sr. Unsec. Nts., 8/1/232 | | | | | 595,000 | | | | 582,796 | |
5.50% Sr. Unsec. Nts., 2/1/25 | | | | | 160,000 | | | | 152,800 | |
5.875% Sr. Unsec. Nts., 2/15/22 | | | | | 135,000 | | | | 137,869 | |
| | | | | | | | | | |
| | | | | | | | | 1,908,940 | |
|
| |
Software—0.1% | | | | | | | | | | |
| |
Activision Blizzard, Inc., 5.625% Sr. Unsec. Nts., 9/15/212 | | | | | 180,000 | | | | 190,836 | |
| |
BMC Software Finance, Inc., 8.125% Sr. Unsec. Nts., 7/15/212 | | | | | 345,000 | | | | 268,237 | |
| |
Interactive Data Corp., 5.875% Sr. Unsec. Nts., 4/15/192 | | | | | 405,000 | | | | 412,594 | |
| |
Italics Merger Sub, Inc., 7.125% Sr. Unsec. Nts., 7/15/232 | | | | | 495,000 | | | | 492,273 | |
| |
TIBCO Software, Inc., 11.375% Sr. Unsec. Nts., 12/1/212 | | | | | 185,000 | | | | 179,219 | |
| | | | | | | | | | |
| | | | | | | | | 1,543,159 | |
|
| |
Technology Hardware, Storage & Peripherals—0.1% | | | | | | | | | | |
| |
Denali Borrower LLC/Denali Finance Corp., 5.625% Sr. Sec. Nts., 10/15/202 | | | | | 780,000 | | | | 831,675 | |
|
| |
Materials—0.9% | | | | | | | | | | |
| |
Chemicals—0.3% | | | | | | | | | | |
| |
ADS Waste Holdings, Inc., 8.25% Sr. Unsec. Nts., 10/1/20 | | | | | 265,000 | | | | 279,575 | |
| |
Blue Cube Spinco, Inc., 9.75% Sr. Unsec. Nts., 10/15/232 | | | | | 310,000 | | | | 335,575 | |
| |
Chemours Co.: | | | | | | | | | | |
6.625% Sr. Unsec. Nts., 5/15/232 | | | | | 275,000 | | | | 205,906 | |
7.00% Sr. Unsec. Nts., 5/15/252 | | | | | 200,000 | | | | 149,500 | |
| |
Hexion, Inc., 6.625% Sr. Sec. Nts., 4/15/20 | | | | | 575,000 | | | | 490,187 | |
| |
Huntsman International LLC, 5.125% Sr. Unsec. Nts., 11/15/222 | | | | | 330,000 | | | | 307,725 | |
36 OPPENHEIMER GLOBAL ALLOCATION FUND
| | | | | | | | | | |
| | | | | Principal
Amount | | | Value | |
| |
Chemicals (Continued) | | | | | | | | | | |
| |
INEOS Group Holdings SA: | | | | | | | | | | |
5.875% Sec. Nts., 2/15/192 | | | | $ | 270,000 | | | $ | 270,675 | |
6.125% Sr. Unsec. Nts., 8/15/182 | | | | | 430,000 | | | | 434,837 | |
| |
Momentive Performance Materials, Inc., 3.88% Sr. Sec. Nts., 10/24/21 | | | | | 430,000 | | | | 346,150 | |
| |
NOVA Chemicals Corp., 5% Sr. Unsec. Nts., 5/1/252 | | | | | 385,000 | | | | 385,963 | |
| |
Platform Specialty Products Corp., 6.50% Sr. Unsec. Nts., 2/1/222 | | | | | 265,000 | | | | 226,575 | |
| |
Techniplas LLC, 10% Sr. Sec. Nts., 5/1/202 | | | | | 555,000 | | | | 442,613 | |
| |
Tronox Finance LLC, 6.375% Sr. Unsec. Nts., 8/15/20 | | | | | 465,000 | | | | 333,498 | |
| | | | | | | | | | |
| | | | | | | | | 4,208,779 | |
|
| |
Containers & Packaging—0.3% | | | | | | | | | | |
| |
Ardagh Packaging Finance plc/Ardagh Holdings USA, Inc.: | | | | | | | | | | |
6.00% Sr. Unsec. Nts., 6/30/212 | | | | | 360,000 | | | | 354,600 | |
6.75% Sr. Unsec. Nts., 1/31/212 | | | | | 410,000 | | | | 422,300 | |
| |
Ardagh Packaging Finance plc/Ardagh MP Holdings USA, Inc., 7% Sr. Unsec. Nts., 11/15/202 | | | | | 126,176 | | | | 127,123 | |
| |
Berry Plastics Corp.: | | | | | | | | | | |
5.125% Sec. Nts., 7/15/23 | | | | | 525,000 | | | | 521,062 | |
5.50% Sec. Nts., 5/15/22 | | | | | 385,000 | | | | 397,031 | |
| |
BWAY Holding Co., 9.125% Sr. Unsec. Nts., 8/15/212 | | | | | 335,000 | | | | 327,463 | |
| |
Coveris Holdings SA, 7.875% Sr. Unsec. Nts., 11/1/192 | | | | | 595,000 | | | | 568,225 | |
| |
Crown Americas LLC/Crown Americas Capital Corp. IV, 4.50% Sr. Unsec. Nts., 1/15/23 | | | | | 150,000 | | | | 151,125 | |
| |
Owens-Brockway Glass Container, Inc., 5% Sr. Unsec. Nts., 1/15/222 | | | | | 210,000 | | | | 214,857 | |
| |
Reynolds Group Issuer, Inc./Reynolds Group Issuer LLC/Reynolds Group Issuer Luxembourg SA: | | | | | | | | | | |
5.75% Sr. Sec. Nts., 10/15/20 | | | | | 935,000 | | | | 974,738 | |
8.25% Sr. Unsec. Nts., 2/15/21 | | | | | 265,000 | | | | 276,594 | |
9.875% Sr. Unsec. Nts., 8/15/19 | | | | | 105,000 | | | | 110,644 | |
| |
Sealed Air Corp.: | | | | | | | | | | |
4.875% Sr. Unsec. Nts., 12/1/222 | | | | | 260,000 | | | | 268,125 | |
5.125% Sr. Unsec. Nts., 12/1/242 | | | | | 260,000 | | | | 268,450 | |
6.50% Sr. Unsec. Nts., 12/1/202 | | | | | 360,000 | | | | 404,100 | |
| | | | | | | | | | |
| | | | | | | | | 5,386,437 | |
|
| |
Metals & Mining—0.3% | | | | | | | | | | |
| |
AK Steel Corp., 7.625% Sr. Unsec. Nts., 5/15/20 | | | | | 400,000 | | | | 216,000 | |
| |
Alcoa, Inc., 5.125% Sr. Unsec. Nts., 10/1/24 | | | | | 535,000 | | | | 532,994 | |
| |
Aleris International, Inc.: | | | | | | | | | | |
7.625% Sr. Unsec. Nts., 2/15/18 | | | | | 592,000 | | | | 556,480 | |
7.875% Sr. Unsec. Nts., 11/1/20 | | | | | 612,000 | | | | 578,340 | |
| |
ArcelorMittal, 6.125% Sr. Unsec. Nts., 6/1/25 | | | | | 175,000 | | | | 151,319 | |
| |
Constellium NV, 5.75% Sr. Unsec. Nts., 5/15/242 | | | | | 265,000 | | | | 192,125 | |
| |
First Quantum Minerals Ltd., 7.25% Sr. Unsec. Nts., 5/15/222 | | | | | 465,000 | | | | 341,484 | |
| |
JMC Steel Group, Inc., 8.25% Sr. Nts., 3/15/182 | | | | | 375,000 | | | | 256,875 | |
| |
Novelis, Inc., 8.75% Sr. Unsec. Nts., 12/15/20 | | | | | 450,000 | | | | 453,375 | |
| |
Steel Dynamics, Inc., 5.125% Sr. Unsec. Nts., 10/1/21 | | | | | 290,000 | | | | 289,275 | |
| |
Thompson Creek Metals Co., Inc., 7.375% Sr. Unsec. Nts., 6/1/18 | | | | | 250,000 | | | | 106,250 | |
| |
Wise Metals Group LLC/Wise Alloys Finance Corp., 8.75% Sr. Sec. Nts., 12/15/182 | | | | | 365,000 | | | | 346,750 | |
| | | | | | | | | | |
| | | | | | | | | 4,021,267 | |
37 OPPENHEIMER GLOBAL ALLOCATION FUND
| | |
| |
| CONSOLIDATED STATEMENT OF INVESTMENTS Continued | | |
| | | | | | | | | | |
| | | | | Principal
Amount | | | Value | |
| |
Paper & Forest Products—0.0% | | | | | | | | | | |
| |
PaperWorks Industries, Inc., 9.50% Sr. Sec. Nts., 8/15/192 | | | | $ | 220,000 | | | $ | 220,000 | |
| |
Sappi Papier Holding GmbH, 6.625% Sr. Sec. Nts., 4/15/212 | | | | | 460,000 | | | | 464,600 | |
| | | | | | | | | | |
| | | | | | | | | 684,600 | |
|
| |
Telecommunication Services—0.5% | | | | | | | | | | |
| |
Diversified Telecommunication Services—0.4% | | | | | | | | | | |
| |
CenturyLink, Inc., 6.45% Sr. Unsec. Nts., 6/15/21 | | | | | 450,000 | | | | 455,625 | |
| |
Cequel Communications Holdings I LLC/Cequel Capital Corp., 6.375% Sr. Unsec. Nts., 9/15/202 | | | | | 1,840,000 | | | | 1,849,200 | |
| |
FairPoint Communications, Inc., 8.75% Sr. Sec. Nts., 8/15/192 | | | | | 1,015,000 | | | | 1,049,256 | |
| |
Frontier Communications Corp.: | | | | | | | | | | |
7.125% Sr. Unsec. Nts., 1/15/23 | | | | | 425,000 | | | | 381,437 | |
10.50% Sr. Unsec. Nts., 9/15/222 | | | | | 435,000 | | | | 452,400 | |
| |
Intelsat Luxembourg SA, 7.75% Sr. Unsec. Nts., 6/1/21 | | | | | 410,000 | | | | 243,950 | |
| |
Level 3 Financing, Inc.: | | | | | | | | | | |
5.375% Sr. Unsec. Nts., 8/15/22 | | | | | 1,330,000 | | | | 1,358,263 | |
5.625% Sr. Unsec. Nts., 2/1/23 | | | | | 140,000 | | | | 144,375 | |
| |
T-Mobile USA, Inc., 6.25% Sr. Unsec. Nts., 4/1/21 | | | | | 470,000 | | | | 486,403 | |
| |
Windstream Services LLC: | | | | | | | | | | |
6.375% Sr. Unsec. Nts., 8/1/23 | | | | | 300,000 | | | | 238,875 | |
7.75% Sr. Unsec. Nts., 10/1/21 | | | | | 350,000 | | | | 303,517 | |
| |
Zayo Group LLC/Zayo Capital, Inc., 6% Sr. Unsec. Nts., 4/1/232 | | | | | 475,000 | | | | 485,450 | |
| | | | | | | | | | |
| | | | | | | | | 7,448,751 | |
|
| |
Wireless Telecommunication Services—0.1% | | | | | | | | | | |
| |
Digicel Ltd., 6.75% Sr. Unsec. Nts., 3/1/232 | | | | | 495,000 | | | | 447,975 | |
| |
Sprint Corp., 7.875% Sr. Unsec. Nts., 9/15/23 | | | | | 925,000 | | | | 855,625 | |
| | | | | | | | | | |
| | | | | | | | | 1,303,600 | |
|
| |
Utilities—0.4% | | | | | | | | | | |
| |
Electric Utilities—0.0% | | | | | | | | | | |
| |
MMC Energy. Inc., 8.875% Sr. Unsec. Nts., 10/15/207,8 | | | | | 175,000 | | | | — | |
|
| |
Gas Utilities—0.1% | | | | | | | | | | |
| |
AmeriGas Finance LLC/AmeriGas Finance Corp., 6.75% Sr. Unsec. Nts., 5/20/20 | | | | | 270,000 | | | | 281,137 | |
| |
Ferrellgas LP/Ferrellgas Finance Corp., 6.50% Sr. Unsec. Nts., 5/1/21 | | | | | 375,000 | | | | 349,688 | |
| | | | | | | | | | |
| | | | | | | | | 630,825 | |
|
| |
Independent Power and Renewable Electricity Producers—0.3% | | | | | | | | | | |
| |
AES Corp.: | | | | | | | | | | |
5.50% Sr. Unsec. Nts., 3/15/24 | | | | | 440,000 | | | | 418,000 | |
7.375% Sr. Unsec. Nts., 7/1/21 | | | | | 205,000 | | | | 219,350 | |
| |
Calpine Corp.: | | | | | | | | | | |
5.375% Sr. Unsec. Nts., 1/15/23 | | | | | 450,000 | | | | 430,875 | |
7.875% Sr. Sec. Nts., 1/15/232 | | | | | 150,000 | | | | 161,812 | |
| |
Dynegy, Inc., 5.875% Sr. Unsec. Nts., 6/1/23 | | | | | 510,000 | | | | 479,400 | |
| |
Energy Future Intermediate Holding Co. LLC/EFIH Finance, Inc., 11.75% Sec. Nts., 3/1/222,7 | | | | | 357,042 | | | | 383,374 | |
| |
GenOn Energy, Inc., 9.50% Sr. Unsec. Nts., 10/15/18 | | | | | 700,000 | | | | 619,500 | |
| |
Miran Mid-Atlantic Trust, 10.06% Sec. Pass-Through Certificates, Series C, 10.06%, 12/30/28 | | | | | 370,232 | | | | 371,620 | |
38 OPPENHEIMER GLOBAL ALLOCATION FUND
| | | | | | | | | | | | | | | | | | | | | | | | |
| | | | | | | | | | | | | | | Principal
Amount | | | Value | |
| |
Independent Power and Renewable Electricity Producers (Continued) | | | | | | | | | | | | | |
| |
NRG Energy, Inc.: | | | | | | | | | | | | | |
6.25% Sr. Unsec. Nts., 7/15/22-5/1/24 | | | | | | | $ | 1,435,000 | | | $ | 1,302,900 | |
6.625% Sr. Unsec. Nts., 3/15/23 | | | | | | | | 135,000 | | | | 126,225 | |
| | | | | | | | | | | | | | | | | | | | | | | | |
| | | | | | | | | | | | | | | | | | | | | | | 4,513,056 | |
|
| |
Multi-Utilities—0.0% | | | | | | | | | | | | | |
| |
InterGen NV, 7% Sr. Sec. Nts., 6/30/232 | | | | | | | | 700,000 | | | | 607,250 | |
| | | | | | | | | | | | | | | | | | | | | | | | |
Total Non-Convertible Corporate Bonds and Notes (Cost $184,707,291) | | | | | | | | | | | | 176,236,585 | |
| | | |
| | | | | | | | | | | | | |
| |
Corporate Loans—0.3% | |
| |
Affinion Group, Inc., Sr. Sec. Credit Facilities 1st Lien Term Loan, Tranche B, 6.75%, 4/30/189 | | | | | | | | 187,770 | | | | 180,807 | |
| |
Asurion LLC, Sr. Sec. Credit Facilities 2nd Lien Term Loan, 8.50%, 3/3/219 | | | | | | | | 955,000 | | | | 863,797 | |
| |
Caesars Entertainment Operating Co., Inc., Sr. Sec. Credit Facilities 1st Lien Term Loan, Tranche B7, 1.50%, 1/29/189,10 | | | | | | | | 213,925 | | | | 191,864 | |
| |
Caesars Entertainment Resort Properties LLC, Sr. Sec. Credit Facilities 1st Lien Term Loan, Tranche B, 7.00%, 10/11/209 | | | | | | | | 624,679 | | | | 595,007 | |
| |
Caesars Growth Properties Holdings LLC, Sr. Sec. Credit Facilities 1st Lien Term Loan, 6.25%, 5/10/219 | | | | | | | | 241,938 | | | | 214,871 | |
| |
Clear Channel Communications, Inc., Extended Sr. Sec. Credit Facilities 1st Lien Term Loan, Tranche D, 6.944%, 1/30/196,9 | | | | | | | | 1,184,336 | | | | 995,265 | |
| |
Clear Channel Communications, Inc., Sr. Sec. Credit Facilities 1st Lien Term Loan, Tranche E, 7.694%, 7/30/199 | | | | | | | | 209,337 | | | | 177,936 | |
| |
Deluxe Entertainment Services, Sr. Sec. Credit Facilities 1st Lien Term Loan, Tranche B, 6.50%, 2/26/209 | | | | | | | | 346,202 | | | | 323,699 | |
| |
iStar Financial, Inc., Sr. Sec. Credit Facilities 1st Lien Term Loan, 7.00%, 3/19/179 | | | | | | | | 235,417 | | | | 241,302 | |
| |
NFR Energy LLC, Sr. Sec. Credit Facilities 2nd Lien Term Loan, 8.75%, 12/31/187,9 | | | | | | | | 265,000 | | | | 31,137 | |
| |
NTELOS, Inc., Sr. Sec. Credit Facilities 1st Lien Term Loan, Tranche B, 5.75%, 11/9/199 | | | | | | | | 54,812 | | | | 54,675 | |
| |
Quicksilver Resources, Inc., Sr. Sec. Credit Facilities 2nd Lien Term Loan, 7.00%, 6/21/197,9 | | | | | | | | 895,000 | | | | 317,725 | |
| |
Revel Entertainment, Inc., Sr. Sec. Credit Facilities 2nd Lien Exit Term Loan, 14.50%, 5/20/185,7,9 | | | | | | | | 326,143 | | | | 1,631 | |
| |
TWCC Holding Corp., Sr. Sec. Credit Facilities 2nd Lien Term Loan, 7.00%, 6/26/209 | | | | | | | | 545,000 | | | | 545,682 | |
| | | | | | | | | | | | | | | | | | | | | | | | |
Total Corporate Loans (Cost $6,108,714) | | | | | | | | | | | | | | | | | | | | | | | 4,735,398 | |
| | | | | | |
| | | | | | Exercise Price | | | Expiration Date | | | | | | | | | | |
| | | | | | | | | | | Contracts | | | | |
Exchange-Traded Option Purchased—0.2% | | | | | | | | | | | | | | | | | | | | | | | | |
S&P 500 Index Call1 | | | | | | | | | | | | | | | | | | | | | | | | |
(Cost $1,309,825) | | | USD | | | | 2,090.000 | | | | 1/15/16 | | | | USD | | | | 600 | | | | 2,733,000 | |
| | | | | | |
| | | | | | Exercise Price | | | Expiration Date | | | | | | | | | | |
| Counterparty | | | | | | | | | | Contracts | | | | |
Over-the-Counter Option Purchased—0.1% | | | | | | | | | | | | | | | | | | | | | | | | |
SX5E Index Call1 | | | | | | | | | | | | | | | | | | | | | | | | |
(Cost 2,372,113) | | | GSG EUR | | | | 3,550.000 | | | | 1/15/16 | | | | EUR | | | | 3,800 | | | | 2,290,578 | |
39 OPPENHEIMER GLOBAL ALLOCATION FUND
| | |
| |
| CONSOLIDATED STATEMENT OF INVESTMENTS Continued | | |
| | | | | | | | |
| | | Shares | | | Value | |
| |
Investment Companies—12.5% | | | | | | | | |
| |
Oppenheimer Institutional Money Market Fund, Cl. E, 0.18%11,12 | | | 26,662,924 | | | $ | 26,662,924 | |
| |
Oppenheimer Master Event-Linked Bond Fund, LLC11 | | | 5,734,430 | | | | 85,658,568 | |
| |
Oppenheimer Master Loan Fund, LLC11 | | | 5,674,937 | | | | 83,033,828 | |
| | | | | | | | |
Total Investment Companies (Cost $201,465,482) | | | | | | | 195,355,320 | |
|
| |
Total Investments, at Value (Cost $1,476,561,398) | | | 96.5 | % | | | 1,512,570,754 | |
| |
Net Other Assets (Liabilities) | | | 3.5 | | | | 54,515,470 | |
| | | | |
Net Assets | | | 100.0% | | | $ | 1,567,086,224 | |
| | | | |
Footnotes to Consolidated Statement of Investments
* October 30, 2015 represents the last business day of the Fund’s reporting period. See Note 2 of the accompanying Consolidated Notes.
|
| 1. Non-income producing security. |
| 2. Represents securities sold under Rule 144A, which are exempt from registration under the Securities Act of 1933, as amended. These securities have been determined to be liquid under guidelines established by the Board of Trustees. These securities amount to $79,812,434 or 5.09% of the Fund’s net assets at period end. |
| 3. Security is a Master Limited Partnership. |
| 4. Restricted security. The aggregate value of restricted securities at period end was $826,923, which represents 0.05% of the Fund’s net assets. See Note 4 of the accompanying Consolidated Notes. Information concerning restricted securities is as follows: |
| | | | | | | | | | | | | | | | |
| | | | | | | | | | | | Unrealized | |
| | | Acquisition | | | | | | | | | Appreciation/ | |
| Security | | Dates | | | Cost | | | Value | | | (Depreciation) | |
| LBC Tank Terminals Holding Netherlands BV, 6.875% Sr. Unsec. Nts., 5/15/23 | | | 5/8/13 - 11/13/14 | | | $ | 288,251 | | | $ | 288,400 | | | $ | 149 | |
Realogy Group LLC, 9% Sr. Sec. Nts., 1/15/20 | | | 2/1/12 | | | | 243,775 | | | | 259,394 | | | | 15,619 | |
Sequa Corp., 7% Sr. Unsec. Nts., 12/15/17 | | | 1/8/15 - 1/30/15 | | | | 505,009 | | | | 279,125 | | | | (225,884 | ) |
Wallace Theater Holdings, Inc. | | | 3/28/13 | | | | 4 | | | | 4 | | | | — | |
| | | | | | | | |
| | | | | | $ | 1,037,039 | | | $ | 826,923 | | | $ | (210,116 | ) |
| | | | | | | | |
5. Interest or dividend is paid-in-kind, when applicable.
6. All or a portion of the security position is when-issued or delayed delivery to be delivered and settled after period end. See Note 4 of the accompanying Consolidated Notes.
7. This security is not accruing income because the issuer has missed an interest payment on it and/or is not anticipated to make future interest and or principal payments. The rate shown is the contractual interest rate. See Note 4 of the accompanying Consolidated Notes.
8. Security received as the result of issuer reorganization.
9. Represents the current interest rate for a variable or increasing rate security.
10. Subject to a forbearance agreement. Rate shown is the contractual interest rate. See Note 4 of the accompanying Consolidated Notes.
11. Is or was an affiliate, as defined in the Investment Company Act of 1940, as amended, at or during the reporting period, by virtue of the Fund owning at least 5% of the voting securities of the issuer or as a result of the Fund and the issuer having the same investment adviser. Transactions during the reporting period in which the issuer was an affiliate are as follows:
40 OPPENHEIMER GLOBAL ALLOCATION FUND
Footnotes to Consolidated Statement of Investments (Continued)
| | | | | | | | | | | | | | | | |
| | | Shares
October 31,
2014 | | | Gross
Additions | | | Gross
Reductions | | | Shares
October 30, 2015 | |
| |
| Oppenheimer Institutional Money Market Fund, Cl. E | | | — | | | | 692,861,436 | | | | 666,198,512 | | | | 26,662,924 | |
| Oppenheimer Master Event-Linked Bond Fund, LLC | | | 9,092,652 | | | | — | | | | 3,358,222 | | | | 5,734,430 | |
| Oppenheimer Master Loan Fund, LLC | | | 11,380,561 | | | | — | | | | 5,705,624 | | | | 5,674,937 | |
| | | | |
| | | | | | Value | | | Income | | | Realized
Gain (Loss) | |
| |
Oppenheimer Institutional Money Market Fund, Cl. E | | | | | | $ | 26,662,924 | | | $ | 84,167 | | | $ | — | |
Oppenheimer Master Event-Linked Bond Fund, LLC | | | | | | | 85,658,568 | | | | 4,927,907 | a | | | 1,694,057 | a |
Oppenheimer Master Loan Fund, LLC | | | | | | | 83,033,828 | | | | 4,987,748 | b | | | (1,791,596 | )b |
| | | | | | | | |
Total | | | | | | $ | 195,355,320 | | | $ | 9,999,822 | | | $ | (97,539 | ) |
| | | | | | | | |
a. Represents the amount allocated to the Fund from Oppenheimer Master Event-Linked Bond Fund, LLC.
b. Represents the amount allocated to the Fund from Oppenheimer Master Loan Fund, LLC.
12. Rate shown is the 7-day yield at period end.
Distribution of investments representing geographic holdings, as a percentage of total investments at value, is as follows:
| | | | | | | | | | |
| Geographic Holdings (Unaudited) | | Value | | | Percent | | | |
United States | | $ | 972,762,838 | | | | 64.3 | % | | |
United Kingdom | | | 86,127,652 | | | | 5.7 | | | |
Japan | | | 62,819,184 | | | | 4.2 | | | |
France | | | 58,708,383 | | | | 3.9 | | | |
Germany | | | 56,624,595 | | | | 3.7 | | | |
Switzerland | | | 45,692,710 | | | | 3.0 | | | |
China | | | 33,080,709 | | | | 2.2 | | | |
Canada | | | 28,452,856 | | | | 1.9 | | | |
Netherlands | | | 27,212,768 | | | | 1.8 | | | |
India | | | 22,655,610 | | | | 1.5 | | | |
Spain | | | 16,785,142 | | | | 1.1 | | | |
Sweden | | | 15,109,449 | | | | 1.0 | | | |
Denmark | | | 7,960,149 | | | | 0.5 | | | |
Australia | | | 7,834,577 | | | | 0.5 | | | |
Brazil | | | 7,743,455 | | | | 0.5 | | | |
Mexico | | | 6,808,471 | | | | 0.5 | | | |
Italy | | | 5,732,937 | | | | 0.4 | | | |
Ireland | | | 5,135,611 | | | | 0.3 | | | |
Hong Kong | | | 5,036,317 | | | | 0.3 | | | |
South Korea | | | 4,937,526 | | | | 0.3 | | | |
Israel | | | 4,727,859 | | | | 0.3 | | | |
Russia | | | 3,985,986 | | | | 0.3 | | | |
Thailand | | | 2,814,907 | | | | 0.2 | | | |
Eurozone | | | 2,290,578 | | | | 0.2 | | | |
South Africa | | | 2,256,967 | | | | 0.2 | | | |
Indonesia | | | 2,193,486 | | | | 0.2 | | | |
Luxembourg | | | 2,131,755 | | | | 0.1 | | | |
Finland | | | 1,974,870 | | | | 0.1 | | | |
Philippines | | | 1,745,001 | | | | 0.1 | | | |
Colombia | | | 1,620,626 | | | | 0.1 | | | |
New Zealand | | | 1,514,012 | | | | 0.1 | | | |
41 OPPENHEIMER GLOBAL ALLOCATION FUND
| | |
| |
| CONSOLIDATED STATEMENT OF INVESTMENTS Continued | | |
| | | | | | | | | | |
| Geographic Holdings (Unaudited / Continued) | | Value | | | Percent | | | |
Taiwan | | $ | 1,267,970 | | | | 0.1 | % | | |
Turkey | | | 1,169,756 | | | | 0.1 | | | |
Malaysia | | | 1,015,463 | | | | 0.1 | | | |
United Arab Emirates | | | 858,043 | | | | 0.1 | | | |
Nigeria | | | 723,044 | | | | 0.1 | | | |
Greece | | | 539,663 | | | | 0.0 | | | |
Jersey, Channel Islands | | | 470,400 | | | | 0.0 | | | |
Jamaica | | | 447,975 | | | | 0.0 | | | |
Egypt | | | 374,694 | | | | 0.0 | | | |
Singapore | | | 370,448 | | | | 0.0 | | | |
Argentina | | | 305,931 | | | | 0.0 | | | |
Belgium | | | 288,400 | | | | 0.0 | | | |
Cayman Islands | | | 163,134 | | | | 0.0 | | | |
Bermuda | | | 98,847 | | | | 0.0 | | | |
| | | |
Total | | $ | 1,512,570,754 | | | | 100.0 | % | | |
| | | |
| | | | | | | | | | | | | | | | | | | | |
|
Forward Currency Exchange Contracts as of October 30, 2015 | | |
| Counterparty | | Settlement Month(s) | | | Currency
Purchased (000’s) | | | Currency
Sold (000’s) | | | Unrealized
Depreciation |
|
TDB | | | 02/2016 | | | USD | | | 49,951 | | | EUR | | | 45,500 | | | $ 183,880 |
| | | | | | | | | | | | | | | | | | | | | | | | |
Futures Contracts as of October 30, 2015 | | | | | | | | | | | | | | | | | | | | | |
| Description | | Exchange | | | Buy/Sell | | | Expiration
Date | | | Number of
Contracts | | | Value | | | Unrealized
Depreciation | |
Mini MSCI Emerging Markets Index | | | NYF | | | | Sell | | | | 12/18/15 | | | | 634 | | | $ | 26,745,290 | | | $ | 1,253,830 | |
S&P 500 E-Mini Index | | | CME | | | | Sell | | | | 12/18/15 | | | | 1,230 | | | | 127,532,550 | | | | 4,704,109 | |
STOXX Europe 600 Index | | | EUX | | | | Sell | | | | 12/18/15 | | | | 670 | | | | 13,784,882 | | | | 728,668 | |
| | | | | | | | | | | | | | | | | | | | | | | | |
| | | | | | | | | | | | | | | | | | | | | | $ | 6,686,607 | |
| | | | | | | | | | | | | | | | | | | | | | | | |
| | | | | | | | | | | | | | | | | | | | | | | | | | | | |
Centrally Cleared Interest Rate Swaps at October 30, 2015 | | | | | | | | | | | | | | | | | | | | | |
| Counterparty | | Pay/Receive
Floating
Rate | | | Floating
Rate | | | Fixed Rate | | | Maturity
Date | | | Notional Amount
(000’s) | | | Value | |
GSG | | | Pay | | |
| Three-
Month USD
BBA LIBOR |
| | | 2.611 | % | | | 10/13/45 | | | | USD | | | | 12,000 | | | $ | 202,305 | |
| | |
Glossary: | | |
Counterparty Abbreviations |
GSG | | Goldman Sachs Group, Inc. (The) |
TDB | | Toronto Dominion Bank |
|
Currency Abbreviations |
EUR | | Euro |
|
Definitions |
BBA LIBOR | | British Bankers’ Association London-Interbank Offered Rate |
MSCI | | Morgan Stanley Capital International |
SX5E | | The EURO STOXX 50 Index |
42 OPPENHEIMER GLOBAL ALLOCATION FUND
| | |
Exchange Abbreviations |
CME | | Chicago Mercantile Exchanges |
EUX | | European Stock Exchange |
NYF | | New York Futures Exchange |
See accompanying Notes to Consolidated Financial Statements.
43 OPPENHEIMER GLOBAL ALLOCATION FUND
| | |
| |
CONSOLIDATED STATEMENT OF ASSETS AND LIABILITIES October 30, 20151 | | |
| | | | | | |
Assets | | | | | | |
Investments, at value—see accompanying statement of investments: | | | | | | |
Unaffiliated companies (cost $1,275,095,916) | | $ | 1,317,215,434 | | | |
Affiliated companies (cost $201,465,482) | | | 195,355,320 | | | |
| | | |
| | | | 1,512,570,754 | | | |
Cash | | | 11,088,239 | | | |
Cash—foreign currencies (cost $5,038,297) | | | 5,026,373 | | | |
Cash used for collateral on futures | | | 30,761,000 | | | |
Cash used for collateral on centrally cleared swaps | | | 1,031,704 | | | |
Centrally cleared swaps, at value | | | 202,305 | | | |
Receivables and other assets: | | | | | | |
Investments sold (including $348,393 sold on a when-issued or delayed delivery basis) | | | 8,819,588 | | | |
Interest and dividends | | | 6,277,160 | | | |
Shares of beneficial interest sold | | | 639,810 | | | |
Variation margin receivable | | | 590,424 | | | |
Other | | | 251,765 | | | |
| | | |
Total assets | | | 1,577,259,122 | | | |
Liabilities | | | | | | |
Unrealized depreciation on forward currency exchange contracts | | | 183,880 | | | |
Payables and other liabilities: | | | | | | |
Investments purchased (including $690,000 purchased on a when-issued or delayed delivery basis) | | | 6,964,180 | | | |
Shares of beneficial interest redeemed | | | 1,703,817 | | | |
Trustees’ compensation | | | 696,263 | | | |
Distribution and service plan fees | | | 318,350 | | | |
Foreign capital gains tax | | | 77,179 | | | |
Variation margin payable | | | 76,080 | | | |
Shareholder communications | | | 23,191 | | | |
Other | | | 129,958 | | | |
| | | |
Total liabilities | | | 10,172,898 | | | |
|
|
Net Assets | | $ | 1,567,086,224 | | | |
| | | |
| | | | | | |
Composition of Net Assets | | | | | | |
Par value of shares of beneficial interest | | $ | 897,299 | | | |
Additional paid-in capital | | | 2,055,183,903 | | | |
Accumulated net investment income | | | 7,387,255 | | | |
Accumulated net realized loss on investments and foreign currency transactions | | | (525,952,826 | ) | | |
Net unrealized appreciation on investments and translation of assets and liabilities
denominated in foreign currencies | | | 29,570,593 | | | |
| | | |
Net Assets | | $ | 1,567,086,224 | | | |
| | | |
1. October 30, 2015 represents the last business day of the Fund’s reporting period. See Note 2 of the accompanying Consolidated Notes.
44 OPPENHEIMER GLOBAL ALLOCATION FUND
| | | | |
Net Asset Value Per Share | |
Class A Shares: | | | | |
| Net asset value and redemption price per share (based on net assets of $1,203,180,806 and 68,444,297 shares of beneficial interest outstanding) | | $ | 17.58 | |
Maximum offering price per share (net asset value plus sales charge of 5.75% of offering price) | | $ | 18.65 | |
| |
Class B Shares: | | | | |
| |
| Net asset value, redemption price (excludes applicable contingent deferred sales charge) and offering price per share (based on net assets of $33,477,412 and 1,970,988 shares of beneficial interest outstanding) | | $ | 16.99 | |
| |
Class C Shares: | | | | |
| |
| Net asset value, redemption price (excludes applicable contingent deferred sales charge) and offering price per share (based on net assets of $247,445,289 and 14,556,597 shares of beneficial interest outstanding) | | $ | 17.00 | |
| |
Class I Shares: | | | | |
| |
| Net asset value, redemption price and offering price per share (based on net assets of $747,325 and 42,560 shares of beneficial interest outstanding) | | $ | 17.56 | |
| |
Class R Shares: | | | | |
| |
| Net asset value, redemption price (excludes applicable contingent deferred sales charge) and offering price per share (based on net assets of $36,537,134 and 2,112,857 shares of beneficial interest outstanding) | | $ | 17.29 | |
| |
Class Y Shares: | | | | |
| |
| Net asset value, redemption price and offering price per share (based on net assets of $45,698,258 and 2,602,558 shares of beneficial interest outstanding) | | $ | 17.56 | |
See accompanying Notes to Consolidated Financial Statements.
45 OPPENHEIMER GLOBAL ALLOCATION FUND
| | |
| |
CONSOLIDATED STATEMENT
OF OPERATIONS For the Year Ended October 30, 20151 | | |
| | | | | | |
Allocation of Income and Expenses from Master Funds2 | | | | | | |
Net investment income allocated from Oppenheimer Master Event-Linked Bond Fund, LLC: | | | | | | |
Interest | | $ | 4,926,164 | | | |
Dividends | | | 1,743 | | | |
Net expenses | | | (372,651 | ) | | |
| | | |
Net investment income allocated from Oppenheimer Master Event-Linked Bond Fund, LLC | | | 4,555,256 | | | |
Net investment income allocated from Oppenheimer Master Loan Fund, LLC: | | | | | | |
Interest | | | 4,963,147 | | | |
Dividends | | | 24,601 | | | |
Net expenses | | | (312,855 | ) | | |
| | | |
Net investment income allocated from Oppenheimer Master Loan Fund, LLC | | | 4,674,893 | | | |
| | | |
Total allocation of net investment income from master funds | | | 9,230,149 | | | |
Investment Income | | | | | | |
Dividends: | | | | | | |
Unaffiliated companies (net of foreign withholding taxes of $1,210,791) | | | 20,763,102 | | | |
Affiliated companies | | | 84,167 | | | |
Interest (net of foreign withholding taxes of $1,101) | | | 12,579,648 | | | |
Portfolio lending fees | | | 92,754 | | | |
| | | |
Total investment income | | | 33,519,671 | | | |
| | | | | | |
Expenses | | | | | | |
Management fees | | | 12,826,195 | | | |
Distribution and service plan fees: | | | | | | |
Class A | | | 3,018,944 | | | |
Class B | | | 425,296 | | | |
Class C | | | 2,543,660 | | | |
Class R | | | 189,287 | | | |
Transfer and shareholder servicing agent fees: | | | | | | |
Class A | | | 2,729,280 | | | |
Class B | | | 93,981 | | | |
Class C | | | 561,624 | | | |
Class I | | | 260 | | | |
Class R | | | 84,033 | | | |
Class Y | | | 93,175 | | | |
Shareholder communications: | | | | | | |
Class A | | | 69,363 | | | |
Class B | | | 5,576 | | | |
Class C | | | 12,886 | | | |
Class I | | | 19 | | | |
Class R | | | 1,411 | | | |
Class Y | | | 603 | | | |
Custodian fees and expenses | | | 156,984 | | | |
Trustees’ compensation | | | 46,680 | | | |
Borrowing fees | | | 7,183 | | | |
1. October 30, 2015 represents the last business day of the Fund’s reporting period. See Note 2 of the accompanying Consolidated Notes.
2. The Fund invests in certain affiliated mutual funds that expect to be treated as partnerships for tax purposes. See Note 4 of the accompanying Consolidated Notes.
46 OPPENHEIMER GLOBAL ALLOCATION FUND
| | | | | | |
Expenses (Continued) | | | | | | |
Other | | $ | 323,669 | | | |
| | | |
Total expenses | | | 23,190,109 | | | |
Less waivers and reimbursements of expenses | | | (795,611 | ) | | |
| | | |
Net expenses | | | 22,394,498 | | | |
Net Investment Income | | | 20,355,322 | | | |
Realized and Unrealized Gain (Loss) | | | | | | |
Net realized gain (loss) on: | | | | | | |
Investments from unaffiliated companies (includes premiums on options exercised)(net of foreign capital gains tax of $166,978) | | | 177,836,927 | | | |
Closing and expiration of option contracts written | | | 2,239,362 | | | |
Closing and expiration of futures contracts | | | 12,493,894 | | | |
Foreign currency transactions | | | (980,935 | ) | | |
Swap contracts | | | 614,161 | | | |
Net realized gain (loss) allocated from: | | | | | | |
Oppenheimer Master Event-Linked Bond Fund, LLC | | | 1,694,057 | | | |
Oppenheimer Master Loan Fund, LLC | | | (1,791,596 | ) | | |
| | | |
Net realized gain | | | 192,105,870 | | | |
Net change in unrealized appreciation/depreciation on: | | | | | | |
Investments | | | (182,862,252 | ) | | |
Translation of assets and liabilities denominated in foreign currencies | | | (1,287,823 | ) | | |
Futures contracts | | | 12,461,487 | | | |
Option contracts written | | | (396,962 | ) | | |
Swap contracts | | | 202,305 | | | |
Net change in unrealized appreciation/depreciation allocated from: | | | | | | |
Oppenheimer Master Event-Linked Bond Fund, LLC | | | (3,616,262 | ) | | |
Oppenheimer Master Loan Fund, LLC | | | (3,009,848 | ) | | |
| | | |
Net change in unrealized appreciation/depreciation | | | (178,509,355 | ) | | |
Net Increase in Net Assets Resulting from Operations | | $ | 33,951,837 | | | |
| | | |
See accompanying Notes to Consolidated Financial Statements.
47 OPPENHEIMER GLOBAL ALLOCATION FUND
| | |
| |
| CONSOLIDATED STATEMENTS OF CHANGES IN NET ASSETS | | |
| | | | | | | | | | |
| | | Year Ended | | | Year Ended | | | |
| | | October 30, 20151 | | | October 31, 2014 | | | |
Operations | | | | | | | | | | |
Net investment income | | $ | 20,355,322 | | | $ | 25,208,498 | | | |
Net realized gain | | | 192,105,870 | | | | 71,466,961 | | | |
Net change in unrealized appreciation/depreciation | | | (178,509,355 | ) | | | (48,926,076 | ) | | |
| | | |
Net increase in net assets resulting from operations | | | 33,951,837 | | | | 47,749,383 | | | |
| | | | | | | | | | |
Dividends and/or Distributions to Shareholders | | | | | | | | | | |
Dividends from net investment income: | | | | | | | | | | |
Class A | | | (17,023,110 | ) | | | (25,302,052 | ) | | |
Class B | | | (341,539 | ) | | | (1,107,865 | ) | | |
Class C | | | (1,985,156 | ) | | | (4,103,782 | ) | | |
Class I | | | (13,008 | ) | | | (19,453 | ) | | |
Class R2 | | | (438,972 | ) | | | (727,916 | ) | | |
Class Y | | | (679,618 | ) | | | (830,701 | ) | | |
| | | |
| | | (20,481,403 | ) | | | (32,091,769 | ) | | |
| | | | | | | | | | | |
Beneficial Interest Transactions | | | | | | | | | | |
Net increase (decrease) in net assets resulting from beneficial interest transactions: | | | | | | | | | | |
Class A | | | (86,862,338 | ) | | | (102,831,852 | ) | | |
Class B | | | (23,313,213 | ) | | | (28,342,530 | ) | | |
Class C | | | (16,762,893 | ) | | | (20,551,374 | ) | | |
Class I | | | (2,296,278 | ) | | | 2,200,600 | | | |
Class R2 | | | (3,186,570 | ) | | | (4,563,303 | ) | | |
Class Y | | | 4,773,129 | | | | 3,037,082 | | | |
| | | |
| | | (127,648,163 | ) | | | (151,051,377 | ) | | |
| | | | | | | | | | | |
Net Assets | | | | | | | | | | |
Total decrease | | | (114,177,729 | ) | | | (135,393,763 | ) | | |
Beginning of period | | | 1,681,263,953 | | | | 1,816,657,716 | | | |
| | | |
End of period (including accumulated net investment income of $7,387,255 and $9,147,751, respectively) | | $ | 1,567,086,224 | | | $ | 1,681,263,953 | | | |
| | | |
1. October 30, 2015 represents the last business day of the Fund’s reporting period. See Note 2 of the accompanying Consolidated Notes.
2. Effective July 1, 2014, Class N shares were renamed Class R. See Note 1 of the accompanying Consolidated Notes.
See accompanying Notes to Consolidated Financial Statements.
48 OPPENHEIMER GLOBAL ALLOCATION FUND
| | |
| |
| CONSOLIDATED FINANCIAL HIGHLIGHTS | | |
| | | | | | | | | | | | | | | | | | | | |
| | | Year Ended | | | Year Ended | | | Year Ended | | | Year Ended | | | Year Ended | |
| | | October 30, | | | October 31, | | | October 31, | | | October 31, | | | October 31, | |
| Class A | | 20151 | | | 2014 | | | 2013 | | | 2012 | | | 2011 | |
| |
Per Share Operating Data | | | | | | | | | | | | | | | | | | | | |
| Net asset value, beginning of period | | $ | 17.43 | | | $ | 17.27 | | | $ | 14.70 | | | $ | 14.81 | | | $ | 15.08 | |
| |
| Income (loss) from investment operations: | | | | | | | | | | | | | | | | | | | | |
| Net investment income2 | | | 0.24 | | | | 0.27 | | | | 0.34 | | | | 0.33 | | | | 0.36 | |
| Net realized and unrealized gain (loss) | | | 0.15 | | | | 0.21 | | | | 2.41 | | | | (0.04) | | | | (0.41) | |
| | | | |
| Total from investment operations | | | 0.39 | | | | 0.48 | | | | 2.75 | | | | 0.29 | | | | (0.05) | |
| |
| Dividends and/or distributions to shareholders: | | | | | | | | | | | | | | | | | | | | |
| Dividends from net investment income | | | (0.24) | | | | (0.32) | | | | (0.18) | | | | (0.40) | | | | (0.22) | |
| |
| Net asset value, end of period | | $ | 17.58 | | | $ | 17.43 | | | $ | 17.27 | | | $ | 14.70 | | | $ | 14.81 | |
| | | | |
|
| |
Total Return, at Net Asset Value3 | | | 2.26 | % | | | 2.85 | % | | | 18.81 | % | | | 2.14% | | | | (0.37)% | |
|
| |
Ratios/Supplemental Data | | | | | | | | | | | | | | | | | | | | |
Net assets, end of period (in thousands) | | $ | 1,203,181 | | | $ | 1,279,187 | | | $ | 1,369,331 | | | $ | 1,294,433 | | | $ | 1,473,322 | |
| |
Average net assets (in thousands) | | $ | 1,247,197 | | | $ | 1,336,323 | | | $ | 1,327,442 | | | $ | 1,358,002 | | | $ | 1,589,726 | |
| |
| Ratios to average net assets:4,5 | | | | | | | | | | | | | | | | | | | | |
| Net investment income | | | 1.39% | | | | 1.58% | | | | 2.11% | | | | 2.29% | | | | 2.35% | |
| Expenses excluding interest and fees from borrowings | | | 1.33% | | | | 1.37% | | | | 1.43% | | | | 1.46% | | | | 1.44% | |
| Interest and fees from borrowings | | | 0.00% | 6 | | | 0.00% | | | | 0.00% | | | | 0.00% | | | | 0.00% | |
| |
| Total expenses7 | | | 1.33% | | | | 1.37% | | | | 1.43% | | | | 1.46% | | | | 1.44% | |
| Expenses after payments, waivers and/or reimbursements and reduction to custodian expenses | | | 1.28% | | | | 1.30% | | | | 1.35% | | | | 1.38% | | | | 1.36% | |
| |
Portfolio turnover rate | | | 83% | | | | 43% | | | | 37% | | | | 59% | | | | 82% | |
1. October 30, 2015 represents the last business day of the Fund’s reporting period. See Note 2 of the accompanying Consolidated Notes.
2. Per share amounts calculated based on the average shares outstanding during the period.
3. Assumes an initial investment on the business day before the first day of the fiscal period, with all dividends and distributions reinvested in additional shares on the reinvestment date, and redemption at the net asset value calculated on the last business day of the fiscal period. Sales charges are not reflected in the total returns. Total returns are not annualized for periods less than one full year. Returns do not reflect the deduction of taxes that a shareholder would pay on fund distributions or the redemption of fund shares. The returns do not include adjustments in accordance with generally accepted accounting principles required at the period end for financial reporting purposes.
4. Annualized for periods less than one full year.
5. Includes the Fund’s share of the allocated expenses and/or net investment income from the master funds.
6. Less than 0.005%.
7. Total expenses including indirect expenses from affiliated fund fees and expenses were as follows:
| | | | | | | | |
| | Year Ended October 30, 2015 | | | 1.33 | % | | |
| | Year Ended October 31, 2014 | | | 1.38 | % | | |
| | Year Ended October 31, 2013 | | | 1.44 | % | | |
| | Year Ended October 31, 2012 | | | 1.46 | % | | |
| | Year Ended October 31, 2011 | | | 1.44 | % | | |
See accompanying Notes to Consolidated Financial Statements.
49 OPPENHEIMER GLOBAL ALLOCATION FUND
| | |
| |
| CONSOLIDATED FINANCIAL HIGHLIGHTS Continued | | |
| | | | | | | | | | | | | | | | | | | | |
| | | Year Ended | | | Year Ended | | | Year Ended | | | Year Ended | | | Year Ended | |
| Class B | | October 30, | | | October 31, | | | October 31, | | | October 31, | | | October 31, | |
| | 20151 | | | 2014 | | | 2013 | | | 2012 | | | 2011 | |
| |
Per Share Operating Data | | | | | | | | | | | | | | | | | | | | |
| Net asset value, beginning of period | | $ | 16.86 | | | $ | 16.76 | | | $ | 14.30 | | | $ | 14.43 | | | $ | 14.73 | |
| |
| Income (loss) from investment operations: | | | | | | | | | | | | | | | | | | | | |
| Net investment income2 | | | 0.11 | | | | 0.13 | | | | 0.19 | | | | 0.20 | | | | 0.23 | |
| Net realized and unrealized gain (loss) | | | 0.14 | | | | 0.21 | | | | 2.34 | | | | (0.02) | | | | (0.41) | |
| | | | |
| Total from investment operations | | | 0.25 | | | | 0.34 | | | | 2.53 | | | | 0.18 | | | | (0.18) | |
| |
| Dividends and/or distributions to shareholders: | | | | | | | | | | | | | | | | | | | | |
| Dividends from net investment income | | | (0.12) | | | | (0.24) | | | | (0.07) | | | | (0.31) | | | | (0.12) | |
| |
| Net asset value, end of period | | $ | 16.99 | | | $ | 16.86 | | | $ | 16.76 | | | $ | 14.30 | | | $ | 14.43 | |
| | | | |
|
| |
Total Return, at Net Asset Value3 | | | 1.45% | | | | 2.05% | | | | 17.72% | | | | 1.36% | | | | (1.25)% | |
|
| |
Ratios/Supplemental Data | | | | | | | | | | | | | | | | | | | | |
| Net assets, end of period (in thousands) | | $ | 33,478 | | | $ | 56,317 | | | $ | 84,161 | | | $ | 102,131 | | | $ | 145,291 | |
| |
| Average net assets (in thousands) | | $ | 42,919 | | | $ | 69,381 | | | $ | 91,497 | | | $ | 119,580 | | | $ | 224,604 | |
| |
| Ratios to average net assets:4,5 | | | | | | | | | | | | | | | | | | | | |
| Net investment income | | | 0.63% | | | | 0.79% | | | | 1.24% | | | | 1.46% | | | | 1.52% | |
| Expenses excluding interest and fees from borrowings | | | 2.08% | | | | 2.21% | | | | 2.42% | | | | 2.41% | | | | 2.43% | |
| Interest and fees from borrowings | | | 0.00% | 6 | | | 0.00% | | | | 0.00% | | | | 0.00% | | | | 0.00% | |
| | | | |
| Total expenses7 | | | 2.08% | | | | 2.21% | | | | 2.42% | | | | 2.41% | | | | 2.43% | |
| Expenses after payments, waivers and/or reimbursements and reduction to custodian expenses | | | 2.03% | | | | 2.09% | | | | 2.22% | | | | 2.20% | | | | 2.21% | |
| |
| Portfolio turnover rate | | | 83% | | | | 43% | | | | 37% | | | | 59% | | | | 82% | |
1. October 30, 2015 represents the last business day of the Fund’s reporting period. See Note 2 of the accompanying Consolidated Notes.
2. Per share amounts calculated based on the average shares outstanding during the period.
3. Assumes an initial investment on the business day before the first day of the fiscal period, with all dividends and distributions reinvested in additional shares on the reinvestment date, and redemption at the net asset value calculated on the last business day of the fiscal period. Sales charges are not reflected in the total returns. Total returns are not annualized for periods less than one full year. Returns do not reflect the deduction of taxes that a shareholder would pay on fund distributions or the redemption of fund shares. The returns do not include adjustments in accordance with generally accepted accounting principles required at the period end for financial reporting purposes.
4. Annualized for periods less than one full year.
5. Includes the Fund’s share of the allocated expenses and/or net investment income from the master funds.
6. Less than 0.005%.
7. Total expenses including indirect expenses from affiliated fund fees and expenses were as follows:
| | | | | | | | |
| | Year Ended October 30, 2015 | | | 2.08% | | | |
| | Year Ended October 31, 2014 | | | 2.22% | | | |
| | Year Ended October 31, 2013 | | | 2.43% | | | |
| | Year Ended October 31, 2012 | | | 2.41% | | | |
| | Year Ended October 31, 2011 | | | 2.43% | | | |
See accompanying Notes to Consolidated Financial Statements.
50 OPPENHEIMER GLOBAL ALLOCATION FUND
| | | | | | | | | | | | | | | | | | | | |
| | | Year Ended | | | Year Ended | | | Year Ended | | | Year Ended | | | Year Ended | |
| Class C | | October 30, | | | October 31, | | | October 31, | | | October 31, | | | October 31, | |
| | 20151 | | | 2014 | | | 2013 | | | 2012 | | | 2011 | |
| |
Per Share Operating Data | | | | | | | | | | | | | | | | | | | | |
| Net asset value, beginning of period | | $ | 16.88 | | | $ | 16.78 | | | $ | 14.31 | | | $ | 14.44 | | | $ | 14.73 | |
| |
| Income (loss) from investment operations: | | | | | | | | | | | | | | | | | | | | |
| Net investment income2 | | | 0.11 | | | | 0.14 | | | | 0.22 | | | | 0.22 | | | | 0.25 | |
| Net realized and unrealized gain (loss) | | | 0.14 | | | | 0.21 | | | | 2.33 | | | | (0.03) | | | | (0.40) | |
| | | | |
| Total from investment operations | | | 0.25 | | | | 0.35 | | | | 2.55 | | | | 0.19 | | | | (0.15) | |
| |
| Dividends and/or distributions to shareholders: | | | | | | | | | | | | | | | | | | | | |
| Dividends from net investment income | | | (0.13) | | | | (0.25) | | | | (0.08) | | | | (0.32) | | | | (0.14) | |
| |
| Net asset value, end of period | | $ | 17.00 | | | $ | 16.88 | | | $ | 16.78 | | | $ | 14.31 | | | $ | 14.44 | |
| | | | |
|
| |
Total Return, at Net Asset Value3 | | | 1.50% | | | | 2.10% | | | | 17.90% | | | | 1.45% | | | | (1.08)% | |
|
| |
Ratios/Supplemental Data | | | | | | | | | | | | | | | | | | | | |
| Net assets, end of period (in thousands) | | $ | 247,445 | | | $ | 262,594 | | | $ | 281,444 | | | $ | 267,392 | | | $ | 313,963 | |
| |
| Average net assets (in thousands) | | $ | 256,637 | | | $ | 275,145 | | | $ | 273,813 | | | $ | 284,820 | | | $ | 350,372 | |
| |
| Ratios to average net assets:4,5 | | | | | | | | | | | | | | | | | | | | |
| Net investment income | | | 0.64% | | | | 0.83% | | | | 1.39% | | | | 1.58% | | | | 1.64% | |
| Expenses excluding interest and fees from borrowings | | | 2.08% | | | | 2.12% | | | | 2.14% | | | | 2.17% | | | | 2.15% | |
| Interest and fees from borrowings | | | 0.00% | 6 | | | 0.00% | | | | 0.00% | | | | 0.00% | | | | 0.00% | |
| | | | |
| Total expenses7 | | | 2.08% | | | | 2.12% | | | | 2.14% | | | | 2.17% | | | | 2.15% | |
| Expenses after payments, waivers and/or reimbursements and reduction to custodian expenses | | | 2.03% | | | | 2.05% | | | | 2.06% | | | | 2.09% | | | | 2.07% | |
| |
| Portfolio turnover rate | | | 83% | | | | 43% | | | | 37% | | | | 59% | | | | 82% | |
1. October 30, 2015 represents the last business day of the Fund’s reporting period. See Note 2 of the accompanying Consolidated Notes.
2. Per share amounts calculated based on the average shares outstanding during the period.
3. Assumes an initial investment on the business day before the first day of the fiscal period, with all dividends and distributions reinvested in additional shares on the reinvestment date, and redemption at the net asset value calculated on the last business day of the fiscal period. Sales charges are not reflected in the total returns. Total returns are not annualized for periods less than one full year. Returns do not reflect the deduction of taxes that a shareholder would pay on fund distributions or the redemption of fund shares. The returns do not include adjustments in accordance with generally accepted accounting principles required at the period end for financial reporting purposes.
4. Annualized for periods less than one full year.
5. Includes the Fund’s share of the allocated expenses and/or net investment income from the master funds.
6. Less than 0.005%.
7. Total expenses including indirect expenses from affiliated fund fees and expenses were as follows:
| | | | | | | | |
| | Year Ended October 30, 2015 | | | 2.08 | % | | |
| | Year Ended October 31, 2014 | | | 2.13 | % | | |
| | Year Ended October 31, 2013 | | | 2.15 | % | | |
| | Year Ended October 31, 2012 | | | 2.17 | % | | |
| | Year Ended October 31, 2011 | | | 2.15 | % | | |
See accompanying Notes to Consolidated Financial Statements.
51 OPPENHEIMER GLOBAL ALLOCATION FUND
| | |
| |
| CONSOLIDATED FINANCIAL HIGHLIGHTS Continued | | |
| | | | | | | | | | | | | | | | | | |
| | | Year Ended | | | Year Ended | | | Year Ended | | | Period Ended | | | |
| | | October 30, | | | October 31, | | | October 31, | | | October 31, | | | |
| Class I | | 20151 | | | 2014 | | | 2013 | | | 20122 | | | |
| | | |
Per Share Operating Data | | | | | | | | | | | | | | | | | | |
| Net asset value, beginning of period | | $ | 17.41 | | | $ | 17.25 | | | $ | 14.69 | | | $ | 14.98 | | | |
| | | |
| Income (loss) from investment operations: | | | | | | | | | | | | | | | | | | |
| Net investment income3 | | | 0.31 | | | | 0.32 | | | | 0.34 | | | | 0.37 | | | |
| Net realized and unrealized gain (loss) | | | 0.16 | | | | 0.24 | | | | 2.48 | | | | (0.53) | | | |
| | | | | | |
| Total from investment operations | | | 0.47 | | | | 0.56 | | | | 2.82 | | | | (0.16) | | | |
| | | |
| Dividends and/or distributions to shareholders: | | | | | | | | | | | | | | | | | | |
| Dividends from net investment income | | | (0.32) | | | | (0.40) | | | | (0.26) | | | | (0.13) | | | |
| | | |
| Net asset value, end of period | | $ | 17.56 | | | $ | 17.41 | | | $ | 17.25 | | | $ | 14.69 | | | |
| | | | | | |
| |
| | | |
Total Return, at Net Asset Value4 | | | 2.71% | | | | 3.32% | | | | 19.35% | | | | (1.04)% | | | |
| |
| | | |
Ratios/Supplemental Data | | | | | | | | | | | | | | | | | | |
| Net assets, end of period (in thousands) | | $ | 747 | | | $ | 3,031 | | | $ | 775 | | | $ | 10 | | | |
| | | |
| Average net assets (in thousands) | | $ | 877 | | | $ | 1,075 | | | $ | 147 | | | $ | 10 | | | |
| | | |
| Ratios to average net assets:5,6 | | | | | | | | | | | | | | | | | | |
| Net investment income | | | 1.74% | | | | 1.90% | | | | 2.01% | | | | 3.78% | | | |
| Expenses excluding interest and fees from borrowings | | | 0.88% | | | | 0.94% | | | | 0.92% | | | | 0.94% | | | |
| Interest and fees from borrowings | | | 0.00% | 7 | | | 0.00% | | | | 0.00% | | | | 0.00% | | | |
| | | | | | |
| Total expenses8 | | | 0.88% | | | | 0.94% | | | | 0.92% | | | | 0.94% | | | |
Expenses after payments, waivers and/or reimbursements and reduction to custodian
expenses | | | 0.83% | | | | 0.87% | | | | 0.84% | | | | 0.89% | | | |
| | | |
| Portfolio turnover rate | | | 83% | | | | 43% | | | | 37% | | | | 59% | | | |
1. October 30, 2015 represents the last business day of the Fund’s reporting period. See Note 2 of the accompanying Consolidated Notes.
2. For the period from February 28, 2012 (inception of offering) to October 31, 2012.
3. Per share amounts calculated based on the average shares outstanding during the period.
4. Assumes an initial investment on the business day before the first day of the fiscal period, with all dividends and distributions reinvested in additional shares on the reinvestment date, and redemption at the net asset value calculated on the last business day of the fiscal period. Sales charges are not reflected in the total returns. Total returns are not annualized for periods less than one full year. Returns do not reflect the deduction of taxes that a shareholder would pay on fund distributions or the redemption of fund shares. The returns do not include adjustments in accordance with generally accepted accounting principles required at the period end for financial reporting purposes.
5. Annualized for periods less than one full year.
6. Includes the Fund’s share of the allocated expenses and/or net investment income from the master funds.
7. Less than 0.005%.
8. Total expenses including indirect expenses from affiliated fund fees and expenses were as follows:
| | | | | | | | |
| | Year Ended October 30, 2015 | | | 0.88 | % | | |
| | Year Ended October 31, 2014 | | | 0.95 | % | | |
| | Year Ended October 31, 2013 | | | 0.93 | % | | |
| | Period Ended October 31, 2012 | | | 0.94 | % | | |
See accompanying Notes to Consolidated Financial Statements.
52 OPPENHEIMER GLOBAL ALLOCATION FUND
| | | | | | | | | | | | | | | | | | | | |
| | | Year Ended | | | Year Ended | | | Year Ended | | | Year Ended | | | Year Ended | |
| | | October 30, | | | October 31, | | | October 31, | | | October 31, | | | October 31, | |
| Class R | | 20151 | | | 2014 | | | 2013 | | | 2012 | | | 2011 | |
| |
Per Share Operating Data | | | | | | | | | | | | | | | | | | | | |
| Net asset value, beginning of period | | $ | 17.15 | | | $ | 17.01 | | | $ | 14.48 | | | $ | 14.60 | | | $ | 14.86 | |
| |
| Income (loss) from investment operations: | | | | | | | | | | | | | | | | | | | | |
| Net investment income2 | | | 0.20 | | | | 0.23 | | | | 0.29 | | | | 0.29 | | | | 0.32 | |
| Net realized and unrealized gain (loss) | | | 0.14 | | | | 0.20 | | | | 2.38 | | | | (0.04) | | | | (0.39) | |
| | | | |
| Total from investment operations | | | 0.34 | | | | 0.43 | | | | 2.67 | | | | 0.25 | | | | (0.07) | |
| |
| Dividends and/or distributions to shareholders: | | | | | | | | | | | | | | | | | | | | |
| Dividends from net investment income | | | (0.20) | | | | (0.29) | | | | (0.14) | | | | (0.37) | | | | (0.19) | |
| |
| Net asset value, end of period | | $ | 17.29 | | | $ | 17.15 | | | $ | 17.01 | | | $ | 14.48 | | | $ | 14.60 | |
| | | | |
|
| |
Total Return, at Net Asset Value3 | | | 1.98% | | | | 2.56% | | | | 18.52% | | | | 1.86% | | | | (0.55)% | |
|
| |
Ratios/Supplemental Data | | | | | | | | | | | | | | | | | | | | |
| Net assets, end of period (in thousands) | | $ | 36,537 | | | $ | 39,483 | | | $ | 43,683 | | | $ | 44,700 | | | $ | 56,284 | |
| |
| Average net assets (in thousands) | | $ | 38,398 | | | $ | 42,159 | | | $ | 44,174 | | | $ | 50,331 | | | $ | 63,592 | |
| |
| Ratios to average net assets:4,5 | | | | | | | | | | | | | | | | | | | | |
Net investment income | | | 1.14% | | | | 1.33% | | | | 1.86% | | | | 2.05% | | | | 2.12% | |
Expenses excluding interest and fees from borrowings | | | 1.58% | | | | 1.63% | | | | 1.68% | | | | 1.70% | | | | 1.67% | |
| Interest and fees from borrowings | | | 0.00% | 6 | | | 0.00% | | | | 0.00% | | | | 0.00% | | | | 0.00% | |
| | | | |
Total expenses7 | | | 1.58% | | | | 1.63% | | | | 1.68% | | | | 1.70% | | | | 1.67% | |
| Expenses after payments, waivers and/or reimbursements and reduction to custodian expenses | | | 1.53% | | | | 1.56% | | | | 1.60% | | | | 1.62% | | | | 1.59% | |
| |
| Portfolio turnover rate | | | 83% | | | | 43% | | | | 37% | | | | 59% | | | | 82% | |
1. October 30, 2015 represents the last business day of the Fund’s reporting period. See Note 2 of the accompanying Consolidated Notes.
2. Per share amounts calculated based on the average shares outstanding during the period.
3. Assumes an initial investment on the business day before the first day of the fiscal period, with all dividends and distributions reinvested in additional shares on the reinvestment date, and redemption at the net asset value calculated on the last business day of the fiscal period. Sales charges are not reflected in the total returns. Total returns are not annualized for periods less than one full year. Returns do not reflect the deduction of taxes that a shareholder would pay on fund distributions or the redemption of fund shares. The returns do not include adjustments in accordance with generally accepted accounting principles required at the period end for financial reporting purposes.
4. Annualized for periods less than one full year.
5. Includes the Fund’s share of the allocated expenses and/or net investment income from the master funds.
6. Less than 0.005%.
7. Total expenses including indirect expenses from affiliated fund fees and expenses were as follows:
| | | | | | | | |
| | Year Ended October 30, 2015 | | | 1.58 | % | | |
| | Year Ended October 31, 2014 | | | 1.64 | % | | |
| | Year Ended October 31, 2013 | | | 1.69 | % | | |
| | Year Ended October 31, 2012 | | | 1.70 | % | | |
| | Year Ended October 31, 2011 | | | 1.67 | % | | |
See accompanying Notes to Consolidated Financial Statements.
53 OPPENHEIMER GLOBAL ALLOCATION FUND
| | |
| |
| CONSOLIDATED FINANCIAL HIGHLIGHTS Continued | | |
| | | | | | | | | | | | | | | | | | | | |
| | | Year Ended | | | Year Ended | | | Year Ended | | | Year Ended | | | Year Ended | |
| | | October 30, | | | October 31, | | | October 31, | | | October 31, | | | October 31, | |
| Class Y | | 20151 | | | 2014 | | | 2013 | | | 2012 | | | 2011 | |
| |
Per Share Operating Data | | | | | | | | | | | | | | | | | | | | |
| Net asset value, beginning of period | | $ | 17.42 | | | $ | 17.26 | | | $ | 14.69 | | | $ | 14.80 | | | $ | 15.07 | |
| |
| Income (loss) from investment operations: | | | | | | | | | | | | | | | | | | | | |
| Net investment income2 | | | 0.29 | | | | 0.32 | | | | 0.40 | | | | 0.38 | | | | 0.42 | |
| Net realized and unrealized gain (loss) | | | 0.14 | | | | 0.22 | | | | 2.41 | | | | (0.03) | | | | (0.42) | |
| | | | |
| Total from investment operations | | | 0.43 | | | | 0.54 | | | | 2.81 | | | | 0.35 | | | | 0.00 | |
| |
| Dividends and/or distributions to shareholders: | | | | | | | | | | | | | | | | | | | | |
| Dividends from net investment income | | | (0.29) | | | | (0.38) | | | | (0.24) | | | | (0.46) | | | | (0.27) | |
| |
| Net asset value, end of period | | $ | 17.56 | | | $ | 17.42 | | | $ | 17.26 | | | $ | 14.69 | | | $ | 14.80 | |
| | | | |
|
| |
Total Return, at Net Asset Value3 | | | 2.47% | | | | 3.17% | | | | 19.26% | | | | 2.53% | | | | (0.04)% | |
|
| |
Ratios/Supplemental Data | | | | | | | | | | | | | | | | | | | | |
| Net assets, end of period (in thousands) | | $ | 45,698 | | | $ | 40,652 | | | $ | 37,264 | | | $ | 31,958 | | | $ | 36,291 | |
| |
| Average net assets (in thousands) | | $ | 42,596 | | | $ | 39,075 | | | $ | 33,958 | | | $ | 33,356 | | | $ | 38,475 | |
| |
| Ratios to average net assets:4,5 | | | | | | | | | | | | | | | | | | | | |
| Net investment income | | | 1.63% | | | | 1.86% | | | | 2.47% | | | | 2.65% | | | | 2.70% | |
| Expenses excluding interest and fees from borrowings | | | 1.08% | | | | 1.09% | | | | 1.06% | | | | 1.09% | | | | 1.11% | |
| Interest and fees from borrowings | | | 0.00% | 6 | | | 0.00% | | | | 0.00% | | | | 0.00% | | | | 0.00% | |
| Total expenses7 | | | 1.08% | | | | 1.09% | | | | 1.06% | | | | 1.09% | | | | 1.11% | |
| Expenses after payments, waivers and/or reimbursements and reduction to custodian expenses | | | 1.03% | | | | 1.02% | | | | 0.98% | | | | 1.01% | | | | 1.03% | |
| |
| Portfolio turnover rate | | | 83% | | | | 43% | | | | 37% | | | | 59% | | | | 82% | |
1. October 30, 2015 represents the last business day of the Fund’s reporting period. See Note 2 of the accompanying Consolidated Notes.
2. Per share amounts calculated based on the average shares outstanding during the period.
3. Assumes an initial investment on the business day before the first day of the fiscal period, with all dividends and distributions reinvested in additional shares on the reinvestment date, and redemption at the net asset value calculated on the last business day of the fiscal period. Sales charges are not reflected in the total returns. Total returns are not annualized for periods less than one full year. Returns do not reflect the deduction of taxes that a shareholder would pay on fund distributions or the redemption of fund shares. The returns do not include adjustments in accordance with generally accepted accounting principles required at the period end for financial reporting purposes.
4. Annualized for periods less than one full year.
5. Includes the Fund’s share of the allocated expenses and/or net investment income from the master funds.
6. Less than 0.005%.
7. Total expenses including indirect expenses from affiliated fund fees and expenses were as follows:
| | | | | | | | |
| | Year Ended October 30, 2015 | | | 1.08 | % | | |
| | Year Ended October 31, 2014 | | | 1.10 | % | | |
| | Year Ended October 31, 2013 | | | 1.07 | % | | |
| | Year Ended October 31, 2012 | | | 1.09 | % | | |
| | Year Ended October 31, 2011 | | | 1.11 | % | | |
See accompanying Notes to Consolidated Financial Statements.
54 OPPENHEIMER GLOBAL ALLOCATION FUND
| | |
| NOTES TO CONSOLIDATED FINANCIAL STATEMENTS October 30, 2015 | | |
1. Organization
Oppenheimer Global Allocation Fund (the “Fund”), a series of Oppenheimer Quest for Value Funds, is registered under the Investment Company Act of 1940 (“1940 Act”), as amended, as a diversified open-end management investment company. The Fund’s investment objective is to seek total return. The Fund’s investment adviser is OFI Global Asset Management, Inc. (“OFI Global” or the “Manager”), a wholly-owned subsidiary of OppenheimerFunds, Inc. (“OFI” or the “Sub-Adviser”). The Manager has entered into a sub-advisory agreement with OFI.
The Fund offers Class A, Class C, Class I, Class R and Class Y shares, and previously offered Class B shares for new purchase through June 29, 2012. Subsequent to that date, no new purchases of Class B shares are permitted, however reinvestment of dividend and/or capital gain distributions and exchanges of Class B shares into and from other Oppenheimer funds are allowed. As of July 1, 2014, Class N shares were renamed Class R shares. Class N shares subject to a contingent deferred sales charge (“CDSC”) on July 1, 2014, continue to be subject to a CDSC after the shares were renamed. Purchases of Class R shares occurring on or after July 1, 2014, are not subject to a CDSC upon redemption. Class A shares are sold at their offering price, which is normally net asset value plus a front-end sales charge. Class C and Class R shares are sold, and Class B shares were sold, without a front-end sales charge but may be subject to a contingent deferred sales charge (“CDSC”). Class R shares are sold only through retirement plans. Retirement plans that offer Class R shares may impose charges on those accounts. Class I and Class Y shares are sold to certain institutional investors or intermediaries without either a front-end sales charge or a CDSC, however, the intermediaries may impose charges on their accountholders who beneficially own Class I and Class Y shares. All classes of shares have identical rights and voting privileges with respect to the Fund in general and exclusive voting rights on matters that affect that class alone. Earnings, net assets and net asset value per share may differ due to each class having its own expenses, such as transfer and shareholder servicing agent fees and shareholder communications, directly attributable to that class. Class A, B, C and R shares have separate distribution and/or service plans under which they pay fees. Class I and Class Y shares do not pay such fees. Class B shares will automatically convert to Class A shares 72 months after the date of purchase.
The following is a summary of significant accounting policies followed in the Fund’s preparation of financial statements in accordance with accounting principles generally accepted in the United States (“U.S. GAAP”).
2. Significant Accounting Policies
Security Valuation. All investments in securities are recorded at their estimated fair value, as described in Note 3.
Reporting Period End Date. The last day of the Fund’s reporting period is the last day the New York Stock Exchange was open for trading during the period. The Fund’s financial statements have been presented through that date to maintain consistency with the Fund’s net asset value calculations used for shareholder transactions.
55 OPPENHEIMER GLOBAL ALLOCATION FUND
| | |
| NOTES TO CONSOLIDATED FINANCIAL STATEMENTS Continued | | |
2. Significant Accounting Policies (Continued)
Basis for Consolidation. The Fund has established a Cayman Islands exempted company, Oppenheimer Global Allocation Fund (Cayman) Ltd., which is wholly-owned and controlled by the Fund (the “Subsidiary”). The Fund and Subsidiary are both managed by the Manager. The Fund may invest up to 25% of its total assets in the Subsidiary. The Subsidiary invests primarily in commodity-linked derivatives (including commodity futures, financial futures, options and swap contracts) and certain fixed-income securities and other investments that may serve as margin or collateral for its derivatives positions. The Subsidiary is subject to the same investment restrictions and guidelines, and follows the same compliance policies and procedures, as the Fund.
The financial statements have been consolidated and include accounts of the Fund and the Subsidiary. Accordingly, all inter-company transactions and balances have been eliminated. At period end, the Fund owned 2,920 shares with net assets of $14,548,572 in the Subsidiary.
| | | | |
| Other financial information at period end: | | | | |
Total market value of investments* | | $ | — | |
Net assets | | $ | 14,548,572 | |
Net income (loss) | | $ | (148,097 | ) |
Net realized gain (loss) | | $ | — | |
Net change in unrealized appreciation/depreciation | | $ | — | |
| |
* At period end, the Subsidiary only held cash. | | | | |
Foreign Currency Translation. The Fund’s accounting records are maintained in U.S. dollars. The values of securities denominated in foreign currencies and amounts related to the purchase and sale of foreign securities and foreign investment income are translated into U.S. dollars as of the close of the New York Stock Exchange (the “Exchange”), normally 4:00 P.M. Eastern time, on each day the Exchange is open for trading. Foreign exchange rates may be valued primarily using a reliable bank, dealer or service authorized by the Board of Trustees.
Reported net realized gains and losses from foreign currency transactions arise from sales of portfolio securities, sales and maturities of short-term securities, sales of foreign currencies, exchange rate fluctuations between the trade and settlement dates on securities transactions, and the difference between the amounts of dividends, interest, and foreign withholding taxes recorded on the Fund’s books and the U.S. dollar equivalent of the amounts actually received or paid. Net unrealized appreciation and depreciation on the translation of assets and liabilities denominated in foreign currencies arise from changes in the values of assets and liabilities, including investments in securities at fiscal period end, resulting from changes in exchange rates.
The effect of changes in foreign currency exchange rates on investments is separately identified from the fluctuations arising from changes in market values of securities held and reported with all other foreign currency gains and losses in the Fund’s Consolidated Statement of Operations.
Allocation of Income, Expenses, Gains and Losses. Income, expenses (other than those attributable to a specific class), gains and losses are allocated on a daily basis to each class of
56 OPPENHEIMER GLOBAL ALLOCATION FUND
2. Significant Accounting Policies (Continued)
shares based upon the relative proportion of net assets represented by such class. Operating expenses directly attributable to a specific class are charged against the operations of that class.
Dividends and Distributions to Shareholders. Dividends and distributions to shareholders, which are determined in accordance with income tax regulations and may differ from U.S. generally accepted accounting principles, are recorded on the ex-dividend date. Income distributions, if any, are declared and paid quarterly. Capital gain distributions, if any, are declared and paid annually.
Investment Income. Dividend income is recorded on the ex-dividend date or upon ex-dividend notification in the case of certain foreign dividends where the ex-dividend date may have passed. Non-cash dividends included in dividend income, if any, are recorded at the fair market value of the securities received. Interest income is recognized on an accrual basis. Discount and premium, which are included in interest income on the Consolidated Statement of Operations, are amortized or accreted daily.
Return of Capital Estimates. Distributions received from the Fund’s investments in Master Limited Partnerships (MLPs) and Real Estate Investments Trusts (REITs), generally are comprised of income and return of capital. The Fund records investment income and return of capital based on estimates made at the time such distributions are received. Such estimates are based on historical information available from each MLP, REIT and other industry sources. These estimates may subsequently be revised based on information received from MLPs and REITs after their tax reporting periods are concluded.
Custodian Fees. “Custodian fees and expenses” in the Consolidated Statement of Operations may include interest expense incurred by the Fund on any cash overdrafts of its custodian account during the period. Such cash overdrafts may result from the effects of failed trades in portfolio securities and from cash outflows resulting from unanticipated shareholder redemption activity. The Fund pays interest to its custodian on such cash overdrafts, to the extent they are not offset by positive cash balances maintained by the Fund, based on the negative rolling average balance at an average Federal Funds Rate plus 0.50%. The “Reduction to custodian expenses” line item, if applicable, represents earnings on cash balances maintained by the Fund during the period. Such interest expense and other custodian fees may be paid with these earnings.
Security Transactions. Security transactions are recorded on the trade date. Realized gains and losses on securities sold (except for the investments in the Subsidiary) are determined on the basis of identified cost.
Indemnifications. The Fund’s organizational documents provide current and former Trustees and officers with a limited indemnification against liabilities arising in connection
57 OPPENHEIMER GLOBAL ALLOCATION FUND
| | |
| NOTES TO CONSOLIDATED FINANCIAL STATEMENTS Continued | | |
2. Significant Accounting Policies (Continued)
with the performance of their duties to the Fund. In the normal course of business, the Fund may also enter into contracts that provide general indemnifications. The Fund’s maximum exposure under these arrangements is unknown as this would be dependent on future claims that may be made against the Fund. The risk of material loss from such claims is considered remote.
Federal Taxes. The Fund intends to comply with provisions of the Internal Revenue Code applicable to regulated investment companies and to distribute substantially all of its investment company taxable income, including any net realized gain on investments not offset by capital loss carryforwards, if any, to shareholders. Therefore, no federal income or excise tax provision is required. The Fund files income tax returns in U.S. federal and applicable state jurisdictions. The statute of limitations on the Fund’s tax return filings generally remains open for the three preceding fiscal reporting period ends.
Subchapter M requires, among other things, that at least 90% of the Fund’s gross income be derived from securities or derived with respect to its business of investing in securities (typically referred to as “qualifying income”). Income from commodity-linked derivatives may not be treated as “qualifying income” for purposes of the 90% gross income requirement. The Internal Revenue Service (IRS) has previously issued a number of private letter rulings which conclude that income derived from commodity index-linked notes and investments in a wholly-owned subsidiary will be “qualifying income.” As a result, the Fund will gain exposure to commodities through commodity-linked notes and its wholly-owned subsidiary.
The IRS has suspended the granting of private letter rulings pending further review. As a result, there can be no assurance that the IRS will not change its position with respect to commodity-linked notes and wholly-owned subsidiaries. In addition, future legislation and guidance from the Treasury and the IRS may adversely affect the fund’s ability to gain exposure to commodities through commodity-linked notes and its wholly-owned subsidiary.
The Fund is required to include in income for federal income tax purposes all of the subsidiary’s net income and gains whether or not such income is distributed by the subsidiary. Net income and gains from the subsidiary are generally treated as ordinary income by the Fund, regardless of the character of the subsidiary’s underlying income. Net losses from the subsidiary do not pass through to the Fund for federal income tax purposes.
The tax components of capital shown in the following table represent distribution requirements the Fund must satisfy under the income tax regulations, losses the Fund may be able to offset against income and gains realized in future years and unrealized appreciation or depreciation of securities and other investments for federal income tax purposes.
| | | | | | | | | | | | |
| | | | | | | | | Net Unrealized | |
| | | | | | | | | Appreciation | |
| | | | | | | | | Based on cost of | |
| | | | | | | | | Securities and | |
| Undistributed | | Undistributed | | | Accumulated | | | Other Investments | |
| Net Investment | | Long-Term | | | Loss | | | for Federal Income | |
| Income | | Gain | | | Carryforward1,2,3 | | | Tax Purposes | |
| |
$15,637,548 | | | $— | | | | $534,985,919 | | | | $31,059,731 | |
58 OPPENHEIMER GLOBAL ALLOCATION FUND
2. Significant Accounting Policies (Continued)
1. At period end, the Fund had $534,985,919 of net capital loss carryforward available to offset future realized capital gains, if any, and thereby reduce future taxable gain distributions. Details of the capital loss carryforwards are included in the table below. Capital loss carryovers with no expiration, if any, must be utilized prior to those with expiration dates.
| | | | |
| Expiring | | | |
| |
2016 | | $ | 124,512,473 | |
2017 | | | 410,473,446 | |
| | | | |
Total | | $ | 534,985,919 | |
| | | | |
2. During the reporting period, the Fund utilized $204,227,463 of capital loss carryforward to offset capital gains realized in that fiscal year.
3. During the previous reporting period, the Fund utilized $52,586,313 of capital loss carryforward to offset capital gains realized in that fiscal year.
Net investment income (loss) and net realized gain (loss) may differ for financial statement and tax purposes. The character of dividends and distributions made during the fiscal year from net investment income or net realized gains are determined in accordance with federal income tax requirements, which may differ from the character of net investment income or net realized gains presented in those financial statements in accordance with GAAP. Also, due to timing of dividends and distributions, the fiscal year in which amounts are distributed may differ from the fiscal year in which the income or net realized gain was recorded by the Fund.
Accordingly, the following amounts have been reclassified for the reporting period. Net assets of the Fund were unaffected by the reclassifications.
| | | | | | | | |
Increase
to Paid-in Capital | | Reduction
to Accumulated
Net Investment
Income | | | Reduction
to Accumulated Net
Realized Loss
on Investments | |
| |
$1,354 | | | $1,634,415 | | | | $1,633,061 | |
The tax character of distributions paid during the reporting periods:
| | | | | | | | |
| | | Year Ended
October 31, 2015 | | | Year Ended
October 31, 2014 | |
| |
Distributions paid from: | | | | | | | | |
Ordinary income | | $ | 20,481,403 | | | $ | 32,091,769 | |
The aggregate cost of securities and other investments and the composition of unrealized appreciation and depreciation of securities and other investments for federal income tax purposes at period end are noted in the following table. The primary difference between book and tax appreciation or depreciation of securities and other investments, if applicable, is attributable to the tax deferral of losses or tax realization of financial statement unrealized gain or loss.
59 OPPENHEIMER GLOBAL ALLOCATION FUND
| | |
| NOTES TO CONSOLIDATED FINANCIAL STATEMENTS Continued | | |
2. Significant Accounting Policies (Continued)
| | | | | | |
Federal tax cost of securities | | $ | 1,478,159,387 | | | |
Federal tax cost of other investments | | | (159,424,950 | ) | | |
| | | |
Total federal tax cost | | $ | 1,318,734,437 | | | |
| | | |
Gross unrealized appreciation | | $ | 170,596,620 | | | |
Gross unrealized depreciation | | | (139,536,889 | ) | | |
| | | |
Net unrealized appreciation | | $ | 31,059,731 | | | |
| | | |
Certain foreign countries impose a tax on capital gains which is accrued by the Fund based on unrealized appreciation, if any, on affected securities. The tax is paid when the gain is realized.
Recent Accounting Pronouncement. In May 2015, Financial Accounting Standards Board (“FASB”) issued Accounting Standards Update (“ASU”), ASU 2015-07. This is an update to Fair Value Measurement Topic 820. Under the amendments in this ASU, investments for which fair value is measured at net asset value per share (or its equivalent) using the practical expedient should not be categorized in the fair value hierarchy. ASU 2015-17 is effective for financial statements issued for fiscal years beginning after December 15, 2015, and interim periods within those fiscal years. At period end, the Manager does not believe the adoption of the ASU will have a material effect on the financial statements or disclosures.
Use of Estimates. The preparation of financial statements in conformity with accounting principles generally accepted in the United States of America requires management to make estimates and assumptions that affect the reported amounts of assets and liabilities and disclosure of contingent assets and liabilities at the date of the financial statements and the reported amounts of increases and decreases in net assets from operations during the reporting period. Actual results could differ from those estimates.
3. Securities Valuation
The Fund calculates the net asset value of its shares as of the close of the New York Stock Exchange (the “Exchange”), normally 4:00 P.M. Eastern time, on each day the Exchange is open for trading, except in the case of a scheduled early closing of the Exchange, in which case the Fund will calculate net asset value of the shares as of the scheduled early closing time of the Exchange.
The Fund’s Board has adopted procedures for the valuation of the Fund’s securities and has delegated the day-to-day responsibility for valuation determinations under those procedures to the Manager. The Manager has established a Valuation Committee which is responsible for determining a “fair valuation” for any security for which market quotations are not “readily available.” The Valuation Committee’s fair valuation determinations are subject to review, approval and ratification by the Fund’s Board at its next regularly scheduled meeting covering the calendar quarter in which the fair valuation was determined.
60 OPPENHEIMER GLOBAL ALLOCATION FUND
3. Securities Valuation (Continued)
Valuation Methods and Inputs
Securities are valued using unadjusted quoted market prices, when available, as supplied primarily by third party pricing services or dealers.
The following methodologies are used to determine the market value or the fair value of the types of securities described below:
Securities traded on a registered U.S. securities exchange (including exchange-traded derivatives other than futures and futures options) are valued based on the last sale price of the security reported on the principal exchange on which it is traded, prior to the time when the Fund’s assets are valued. In the absence of a sale, the security is valued at the mean between the bid and asked price on the principal exchange or, if not available from the principal exchange, obtained from two dealers. If bid and asked prices are not available from either the exchange or two dealers, the security is valued by using one of the following methodologies (listed in order of priority): (1) using a bid from the principal exchange, (2) the mean between the bid and asked price as provided by a single dealer, or (3) a bid from a single dealer. A security of a foreign issuer traded on a foreign exchange, but not listed on a registered U.S. securities exchange, is valued based on the last sale price on the principal exchange on which the security is traded, as identified by the third party pricing service used by the Manager, prior to the time when the Fund’s assets are valued. If the last sale price is unavailable, the security is valued at the most recent official closing price on the principal exchange on which it is traded. If the last sales price or official closing price for a foreign security is not available, the security is valued at the mean between the bid and asked price per the exchange or, if not available from the exchange, obtained from two dealers. If bid and asked prices are not available from either the exchange or two dealers, the security is valued by using one of the following methodologies (listed in order of priority): (1) using a bid from the exchange, (2) the mean between the bid and asked price as provided by a single dealer, or (3) a bid from a single dealer.
Shares of a registered investment company that are not traded on an exchange are valued at that investment company’s net asset value per share.
Corporate and government debt securities (of U.S. or foreign issuers) and municipal debt securities, event-linked bonds, loans, mortgage-backed securities, collateralized mortgage obligations, and asset-backed securities are valued at the mean between the “bid” and “asked” prices utilizing evaluated prices obtained from third party pricing services or broker-dealers who may use matrix pricing methods to determine the evaluated prices.
Short-term money market type debt securities with a remaining maturity of sixty days or less are valued at cost adjusted by the amortization of discount or premium to maturity (amortized cost), which approximates market value. Short-term debt securities with a remaining maturity in excess of sixty days are valued at the mean between the “bid” and “asked” prices utilizing evaluated prices obtained from third party pricing services or broker-dealers.
Structured securities, swaps, swaptions, and other over-the-counter derivatives are valued utilizing evaluated prices obtained from third party pricing services or broker-dealers.
61 OPPENHEIMER GLOBAL ALLOCATION FUND
| | |
| NOTES TO CONSOLIDATED FINANCIAL STATEMENTS Continued | | |
3. Securities Valuation (Continued)
Forward foreign currency exchange contracts are valued utilizing current and forward currency rates obtained from third party pricing services. When the settlement date of a contract is an interim date for which a quotation is not available, interpolated values are derived using the nearest dated forward currency rate.
Futures contracts and futures options traded on a commodities or futures exchange will be valued at the final settlement price or official closing price on the principal exchange as reported by such principal exchange at its trading session ending at, or most recently prior to, the time when the Fund’s assets are valued.
A description of the standard inputs that may generally be considered by the third party pricing vendors in determining their evaluated prices is provided below.
| | |
Security Type | | Standard inputs generally considered by third-party
pricing vendors |
| Corporate debt, government debt, municipal, mortgage-backed and asset-backed securities | | Reported trade data, broker-dealer price quotations, benchmark yields, issuer spreads on comparable securities, the credit quality, yield, maturity, and other appropriate factors. |
Loans | | Information obtained from market participants regarding reported trade data and broker-dealer price quotations. |
Event-linked bonds | | Information obtained from market participants regarding reported trade data and broker-dealer price quotations. |
| Structured securities | | Relevant market information such as the price of underlying financial instruments, stock market indices, foreign currencies, interest rate spreads, commodities, or the occurrence of other specific events. |
Swaps | | Relevant market information, including underlying reference assets such as credit spreads, credit event probabilities, index values, individual security values, forward interest rates, variable interest rates, volatility measures, and forward currency rates. |
If a market value or price cannot be determined for a security using the methodologies described above, or if, in the “good faith” opinion of the Manager, the market value or price obtained does not constitute a “readily available market quotation,” or a significant event has occurred that would materially affect the value of the security, the security is fair valued either (i) by a standardized fair valuation methodology applicable to the security type or the significant event as previously approved by the Valuation Committee and the Fund’s Board or (ii) as determined in good faith by the Manager’s Valuation Committee. The Valuation Committee considers all relevant facts that are reasonably available, through either public information or information available to the Manager, when determining the fair value of a security. Fair value determinations by the Manager are subject to review, approval and ratification by the Fund’s Board at its next regularly scheduled meeting covering the calendar quarter in which the fair valuation was determined. Those fair valuation standardized methodologies include, but are not limited to, valuing securities at the last sale price or initially at cost and subsequently adjusting the value based on: changes in company specific fundamentals, changes in an appropriate securities index, or changes in the value of similar securities which may be further adjusted for any discounts related to security-specific resale
62 OPPENHEIMER GLOBAL ALLOCATION FUND
3. Securities Valuation (Continued)
restrictions. When possible, such methodologies use observable market inputs such as unadjusted quoted prices of similar securities, observable interest rates, currency rates and yield curves. The methodologies used for valuing securities are not necessarily an indication of the risks associated with investing in those securities nor can it be assured that the Fund can obtain the fair value assigned to a security if it were to sell the security.
To assess the continuing appropriateness of security valuations, the Manager, or its third party service provider who is subject to oversight by the Manager, regularly compares prior day prices, prices on comparable securities, and sale prices to the current day prices and challenges those prices exceeding certain tolerance levels with the third party pricing service or broker source. For those securities valued by fair valuations, whether through a standardized fair valuation methodology or a fair valuation determination, the Valuation Committee reviews and affirms the reasonableness of the valuations based on such methodologies and fair valuation determinations on a regular basis after considering all relevant information that is reasonably available.
Classifications
Each investment asset or liability of the Fund is assigned a level at measurement date based on the significance and source of the inputs to its valuation. Various data inputs are used in determining the value of each of the Fund’s investments as of the reporting period end. These data inputs are categorized in the following hierarchy under applicable financial accounting standards:
1) Level 1-unadjusted quoted prices in active markets for identical assets or liabilities (including securities actively traded on a securities exchange)
2) Level 2-inputs other than unadjusted quoted prices that are observable for the asset or liability (such as unadjusted quoted prices for similar assets and market corroborated inputs such as interest rates, prepayment speeds, credit risks, etc.)
3) Level 3-significant unobservable inputs (including the Manager’s own judgments about assumptions that market participants would use in pricing the asset or liability).
The inputs used for valuing securities are not necessarily an indication of the risks associated with investing in those securities.
The table below categorizes amounts that are included in the Fund’s Consolidated Statement of Assets and Liabilities at period end based on valuation input level:
| | | | | | | | | | | | | | | | |
| | | Level 1—
Unadjusted
Quoted Prices | | | Level 2—
Other Significant
Observable Inputs | | | Level 3—
Significant
Unobservable
Inputs | | | Value | |
Assets Table | | | | | | | | | | | | | | | | |
Investments, at Value: | | | | | | | | | | | | | | | | |
Common Stocks | | | | | | | | | | | | | | | | |
Consumer Discretionary | | $ | 75,300,826 | | | $ | 87,681,611 | | | $ | — | | | $ | 162,982,437 | |
Consumer Staples | | | 42,091,196 | | | | 54,605,924 | | | | — | | | | 96,697,120 | |
Energy | | | 25,973,234 | | | | 6,235,372 | | | | — | | | | 32,208,606 | |
Financials | | | 83,210,808 | | | | 63,215,064 | | | | 4 | | | | 146,425,876 | |
Health Care | | | 83,126,657 | | | | 31,617,769 | | | | — | | | | 114,744,426 | |
63 OPPENHEIMER GLOBAL ALLOCATION FUND
| | |
| NOTES TO CONSOLIDATED FINANCIAL STATEMENTS Continued | | |
3. Securities Valuation (Continued)
| | | | | | | | | | | | | | | | |
| | | Level 1—
Unadjusted
Quoted Prices | | | Level 2—
Other Significant
Observable Inputs | | | Level 3—
Significant
Unobservable
Inputs | | | Value | |
Common Stocks (Continued) | | | | | | | | | | | | | | | | |
Industrials | | $ | 48,623,962 | | | $ | 77,432,789 | | | $ | — | | | $ | 126,056,751 | |
Information Technology | | | 130,649,003 | | | | 65,987,726 | | | | — | | | | 196,636,729 | |
Materials | | | 7,995,587 | | | | 19,966,801 | | | | 352 | | | | 27,962,740 | |
Telecommunication Services | | | 7,767,191 | | | | 28,593,622 | | | | — | | | | 36,360,813 | |
Utilities | | | 10,144,716 | | | | — | | | | — | | | | 10,144,716 | |
Preferred Stocks | | | 1,674,550 | | | | 5,861,942 | | | | — | | | | 7,536,492 | |
Rights, Warrants and Certificates | | | 25,504 | | | | — | | | | — | | | | 25,504 | |
U.S. Government Obligation | | | — | | | | 173,437,663 | | | | — | | | | 173,437,663 | |
Non-Convertible Corporate Bonds and Notes | | | — | | | | 176,236,585 | | | | — | | | | 176,236,585 | |
Corporate Loans | | | — | | | | 4,733,767 | | | | 1,631 | | | | 4,735,398 | |
Exchange-Traded Option Purchased | | | 2,733,000 | | | | — | | | | — | | | | 2,733,000 | |
Over-the-Counter Option Purchased | | | — | | | | 2,290,578 | | | | — | | | | 2,290,578 | |
Investment Companies | | | 26,662,924 | | | | 168,692,396 | | | | — | | | | 195,355,320 | |
| | | | |
Total Investments, at Value | | | 545,979,158 | | | | 966,589,609 | | | | 1,987 | | | | 1,512,570,754 | |
Other Financial Instruments: | | | | | | | | | | | | | | | | |
Centrally cleared swaps, at value | | | — | | | | 202,305 | | | | — | | | | 202,305 | |
| | | | |
Total Assets | | $ | 545,979,158 | | | $ | 966,791,914 | | | $ | 1,987 | | | $ | 1,512,773,059 | |
| | | | |
| | | | |
Liabilities Table | | | | | | | | | | | | | | | | |
Other Financial Instruments: | | | | | | | | | | | | | | | | |
Futures contracts | | $ | (6,686,607 | ) | | $ | — | | | $ | — | | | $ | (6,686,607 | ) |
Forward currency exchange contracts | | | — | | | | (183,880 | ) | | | — | | | | (183,880 | ) |
| | | | |
Total Liabilities | | $ | (6,686,607 | ) | | $ | (183,880 | ) | | $ | — | | | $ | (6,870,487 | ) |
| | | | |
Forward currency exchange contracts and futures contracts, if any, are reported at their unrealized appreciation/depreciation at measurement date, which represents the change in the contract’s value from trade date. All additional assets and liabilities included in the above table are reported at their market value at measurement date.
The table below shows the transfers between Level 1 and Level 2. The Fund’s policy is to recognize transfers in and transfers out as of the beginning of the reporting period.
| | | | | | | | |
| | | Transfers out of
Level 1* | | | Transfers into Level 2* | |
Assets Table | | | | | | | | |
Investments, at Value: | | | | | | | | |
Common Stocks | | | | | | | | |
Consumer Staples | | $ | (6,153,587) | | | $ | 6,153,587 | |
Financials | | | (1,729,387) | | | | 1,729,387 | |
Healthcare | | | (1,047,836) | | | | 1,047,836 | |
Industrials | | | (1,549,048) | | | | 1,549,048 | |
| | | | |
Total Assets | | $ | (10,479,858) | | | $ | 10,479,858 | |
| | | | |
* Transferred from Level 1 to Level 2 due to the absence of a readily available unadjusted quoted market price.
64 OPPENHEIMER GLOBAL ALLOCATION FUND
4. Investments and Risks
Risks of Foreign Investing. The Fund may invest in foreign securities which are subject to special risks. Securities traded in foreign markets may be less liquid and more volatile than those traded in U.S. markets. Foreign issuers are usually not subject to the same accounting and disclosure requirements that U.S. companies are subject to, which may make it difficult for the Fund to evaluate a foreign company’s operations or financial condition. A change in the value of a foreign currency against the U.S. dollar will result in a change in the U.S. dollar value of investments denominated in that foreign currency and in the value of any income or distributions the Fund may receive on those investments. The value of foreign investments may be affected by exchange control regulations, foreign taxes, higher transaction and other costs, delays in the settlement of transactions, changes in economic or monetary policy in the United States or abroad, expropriation or nationalization of a company’s assets, or other political and economic factors. In addition, due to the inter-relationship of global economies and financial markets, changes in political and economic factors in one country or region could adversely affect conditions in another country or region. Investments in foreign securities may also expose the Fund to time-zone arbitrage risk. Foreign securities may trade on weekends or other days when the Fund does not price its shares. At times, the Fund may emphasize investments in a particular country or region and may be subject to greater risks from adverse events that occur in that country or region. Foreign securities and foreign currencies held in foreign banks and securities depositories may be subject to limited or no regulatory oversight.
Investments in Affiliated Funds. The Fund is permitted to invest in other mutual funds advised by the Manager (“Affiliated Funds”). Affiliated Funds are open-end management investment companies registered under the 1940 Act, as amended. The Manager is the investment adviser of, and the Sub-Adviser provides investment and related advisory services to, the Affiliated Funds. When applicable, the Fund’s investments in Affiliated Funds are included in the Consolidated Statement of Investments. Shares of Affiliated Funds are valued at their net asset value per share. As a shareholder, the Fund is subject to its proportional share of the Affiliated Funds’ expenses, including their management fee. The Manager will waive fees and/or reimburse Fund expenses in an amount equal to the indirect management fees incurred through the Fund’s investment in the Affiliated Funds.
Each of the Affiliated Funds in which the Fund invests has its own investment risks, and those risks can affect the value of the Fund’s investments and therefore the value of the Fund’s shares. To the extent that the Fund invests more of its assets in one Affiliated Fund than in another, the Fund will have greater exposure to the risks of that Affiliated Fund.
Investment in Oppenheimer Institutional Money Market Fund. The Fund is permitted to invest daily available cash balances in a money market Affiliated Fund. The Fund may invest the available cash in Class E shares of Oppenheimer Institutional Money Market Fund (“IMMF”) to seek current income while preserving liquidity or for defensive purposes. IMMF is regulated as a money market fund under the Investment Company Act of 1940, as amended.
65 OPPENHEIMER GLOBAL ALLOCATION FUND
| | |
| NOTES TO CONSOLIDATED FINANCIAL STATEMENTS Continued | | |
4. Investments and Risks (Continued)
Investment in Oppenheimer Master Funds. The Fund is permitted to invest in entities sponsored and/or advised by the Manager or an affiliate. Certain of these entities in which the Fund invests are mutual funds registered under the Investment Company Act of 1940 that expect to be treated as partnerships for tax purposes, specifically Oppenheimer Master Loan Fund, LLC (“Master Loan”) and Oppenheimer Master Event-Linked Bond Fund, LLC (“Master Event-Linked Bond”) (the “Master Funds”). Each Master Fund has its own investment risks, and those risks can affect the value of the Fund’s investments and therefore the value of the Fund’s shares. To the extent that the Fund invests more of its assets in one Master Fund than in another, the Fund will have greater exposure to the risks of that Master Fund.
The investment objective of Master Loan is to seek income. The investment objective of Master Event-Linked Bond is to seek total return. The Fund’s investments in the Master Funds are included in the Consolidated Statement of Investments. The Fund recognizes income and gain/(loss) on its investments in each Master Fund according to its allocated pro-rata share, based on its relative proportion of total outstanding Master Fund shares held, of the total net income earned and the net gain/(loss) realized on investments sold by the Master Funds. As a shareholder, the Fund is subject to its proportional share of the Master Funds’ expenses, including their management fee. The Manager will waive fees and/or reimburse Fund expenses in an amount equal to the indirect management fees incurred through the Fund’s investment in the Master Funds. The Fund owns 6.6% of Master Loan and 28.2% of Master Event-Linked Bond at period end.
Master Limited Partnerships (“MLPs”). MLPs issue common units that represent an equity ownership interest in a partnership and provide limited voting rights. MLP common units are registered with the Securities and Exchange Commission (“SEC”), and are freely tradable on securities exchanges such as the NYSE and the NASDAQ Stock Market (“NASDAQ”), or in the over-the-counter (“OTC”) market. An MLP consists of one or more general partners, who conduct the business, and one or more limited partners, who contribute capital. MLP common unit holders have a limited role in the partnership’s operations and management. The Fund, as a limited partner, normally would not be liable for the debts of the MLP beyond the amounts the Fund has contributed, but would not be shielded to the same extent that a shareholder of a corporation would be. In certain circumstances creditors of an MLP would have the right to seek return of capital distributed to a limited partner. This right of an MLP’s creditors would continue after the Fund sold its investment in the MLP.
Loans. The Fund invests in loans made to U.S. and foreign borrowers that are corporations, partnerships or other business entities. The Fund will do so directly as an original lender or by assignment or indirectly through participation agreements or certain derivative instruments. While many of these loans will be collateralized, the Fund can also invest in uncollateralized loans. Loans are often issued in connection with recapitalizations, acquisitions, leveraged buyouts, and refinancing of borrowers. The loans often pay interest at rates that float above (or are adjusted periodically based on) a benchmark that reflects current interest rates although the Fund can also invest in loans with fixed interest rates.
66 OPPENHEIMER GLOBAL ALLOCATION FUND
4. Investments and Risks (Continued)
Securities on a When-Issued or Delayed Delivery Basis. The Fund may purchase securities on a “when-issued” basis, and may purchase or sell securities on a “delayed delivery” basis. “When-issued” or “delayed delivery” refers to securities whose terms and indenture are available and for which a market exists, but which are not available for immediate delivery. Delivery and payment for securities that have been purchased by the Fund on a when-issued basis normally takes place within six months and possibly as long as two years or more after the trade date. During this period, such securities do not earn interest, are subject to market fluctuation and may increase or decrease in value prior to their delivery. The purchase of securities on a when-issued basis may increase the volatility of the Fund’s net asset value to the extent the Fund executes such transactions while remaining substantially fully invested. When the Fund engages in when-issued or delayed delivery transactions, it relies on the buyer or seller, as the case may be, to complete the transaction. Their failure to do so may cause the Fund to lose the opportunity to obtain or dispose of the security at a price and yield it considers advantageous. The Fund may also sell securities that it purchased on a when-issued basis or forward commitment prior to settlement of the original purchase.
At period end, the Fund had purchased securities issued on a when-issued or delayed delivery basis and sold securities issued on a delayed delivery basis as follows:
| | | | |
| | | When-Issued or
Delayed Delivery
Basis Transactions | |
| |
Purchased securities | | | $690,000 | |
Sold securities | | | 348,393 | |
Restricted Securities. At period end, investments in securities included issues that are restricted. A restricted security may have a contractual restriction on its resale and is valued under methods approved by the Board of Trustees as reflecting fair value. Securities that are restricted are marked with an applicable footnote on the Consolidated Statement of Investments. Restricted securities are reported on a schedule following the Consolidated Statement of Investments.
Equity Security Risk. Stocks and other equity securities fluctuate in price. The value of the Fund’s portfolio may be affected by changes in the equity markets generally. Equity markets may experience significant short-term volatility and may fall sharply at times. Different markets may behave differently from each other and U.S. equity markets may move in the opposite direction from one or more foreign stock markets. Adverse events in any part of the equity or fixed-income markets may have unexpected negative effects on other market segments.
The prices of individual equity securities generally do not all move in the same direction at the same time and a variety of factors can affect the price of a particular company’s securities. These factors may include, but are not limited to, poor earnings reports, a loss of customers, litigation against the company, general unfavorable performance of the company’s sector or industry, or changes in government regulations affecting the company or its industry.
67 OPPENHEIMER GLOBAL ALLOCATION FUND
| | |
| NOTES TO CONSOLIDATED FINANCIAL STATEMENTS Continued | | |
4. Investments and Risks (Continued)
Credit Risk. The Fund invests in high-yield, non-investment-grade bonds, which may be subject to a greater degree of credit risk. Credit risk relates to the ability of the issuer to meet interest or principal payments or both as they become due. The Fund may acquire securities that have missed an interest payment, and is not obligated to dispose of securities whose issuers or underlying obligors subsequently miss an interest payment.
Information concerning securities not accruing interest at period end is as follows:
| | | | |
Cost | | $ | 1,838,330 | |
Market Value | | | $733,867 | |
Market Value as % of Net Assets | | | 0.05% | |
The Fund has entered into forbearance agreements with certain obligors under which the Fund has agreed to temporarily forego receipt of the original principal or coupon interest rates. At period end, securities with an aggregate market value of $191,864, representing 0.01% of the Fund’s net assets, were subject to these forbearance agreements.
5. Market Risk Factors
The Fund’s investments in securities and/or financial derivatives may expose the fund to various market risk factors:
Commodity Risk. Commodity risk relates to the change in value of commodities or commodity indexes as they relate to increases or decreases in the commodities market. Commodities are physical assets that have tangible properties. Examples of these types of assets are crude oil, heating oil, metals, livestock, and agricultural products.
Credit Risk. Credit risk relates to the ability of the issuer of debt to meet interest and principal payments, or both, as they come due. In general, lower-grade, higher-yield debt securities are subject to credit risk to a greater extent than lower-yield, higher-quality securities.
Equity Risk. Equity risk relates to the change in value of equity securities as they relate to increases or decreases in the general market.
Foreign Exchange Rate Risk. Foreign exchange rate risk relates to the change in the U.S. dollar value of a security held that is denominated in a foreign currency. The U.S. dollar value of a foreign currency denominated security will decrease as the dollar appreciates against the currency, while the U.S. dollar value will increase as the dollar depreciates against the currency.
Interest Rate Risk. Interest rate risk refers to the fluctuations in value of fixed-income securities resulting from the inverse relationship between price and yield. For example, an increase in general interest rates will tend to reduce the market value of already issued fixed-income investments, and a decline in general interest rates will tend to increase their value. In addition, debt securities with longer maturities, which tend to have higher yields, are subject to potentially greater fluctuations in value from changes in interest rates than obligations with shorter maturities.
68 OPPENHEIMER GLOBAL ALLOCATION FUND
5. Market Risk Factors (Continued)
Volatility Risk. Volatility risk refers to the magnitude of the movement, but not the direction of the movement, in a financial instrument’s price over a defined time period. Large increases or decreases in a financial instrument’s price over a relative time period typically indicate greater volatility risk, while small increases or decreases in its price typically indicate lower volatility risk.
6. Use of Derivatives
The Fund’s investment objective not only permits the Fund to purchase investment securities, it also allows the Fund to enter into various types of derivatives contracts, including, but not limited to, futures contracts, forward currency exchange contracts, credit default swaps, interest rate swaps, total return swaps, variance swaps and purchased and written options. In doing so, the Fund will employ strategies in differing combinations to permit it to increase, decrease, or change the level or types of exposure to market risk factors. These instruments may allow the Fund to pursue its objectives more quickly and efficiently than if it were to make direct purchases or sales of securities capable of effecting a similar response to market factors. Such contracts may be entered into through a bilateral over-the-counter (“OTC”) transaction, or through a securities or futures exchange and cleared through a clearinghouse.
Derivatives may have little or no initial cash investment relative to their market value exposure and therefore can produce significant gains or losses in excess of their cost due to unanticipated changes in the market risk factors and the overall market. This use of embedded leverage allows the Fund to increase its market value exposure relative to its net assets and can substantially increase the volatility of the Fund’s performance. In instances where the Fund is using derivatives to decrease, or hedge, exposures to market risk factors for securities held by the Fund, there are also risks that those derivatives may not perform as expected resulting in losses for the combined or hedged positions. Some derivatives have the potential for unlimited loss, regardless of the size of the Fund’s initial investment.
Additional associated risks from investing in derivatives also exist and potentially could have significant effects on the valuation of the derivative and the Fund. Typically, the associated risks are not the risks that the Fund is attempting to increase or decrease exposure to, per its investment objectives, but are the additional risks from investing in derivatives. Examples of these associated risks are liquidity risk, which is the risk that the Fund will not be able to sell the derivative in the open market in a timely manner, and counterparty credit risk, which is the risk that the counterparty will not fulfill its obligation to the Fund.
The Fund’s actual exposures to these market risk factors and associated risks during the period are discussed in further detail, by derivative type, below.
Forward Currency Exchange Contracts
The Fund may enter into forward currency exchange contracts (“forward contracts”) for the purchase or sale of a foreign currency at a negotiated rate at a future date. Such contracts are traded in the OTC inter-bank currency dealer market.
Forward contracts are reported on a schedule following the Consolidated Statement of Investments. The unrealized appreciation (depreciation) is reported in the Consolidated Statement of Assets and Liabilities as a receivable (or payable) and in the Consolidated
69 OPPENHEIMER GLOBAL ALLOCATION FUND
| | |
| NOTES TO CONSOLIDATED FINANCIAL STATEMENTS Continued | | |
6. Use of Derivatives (Continued)
Statement of Operations within the change in unrealized appreciation (depreciation). At contract close, the difference between the original cost of the contract and the value at the close date is recorded as a realized gain (loss) in the Consolidated Statement of Operations.
The Fund has entered into forward contracts with the obligation to purchase specified foreign currencies in the future at a currently negotiated forward rate in order to decrease exposure to foreign exchange rate risk associated with foreign currency denominated securities held by the Fund.
The Fund has entered into forward contracts with the obligation to sell specified foreign currencies in the future at a currently negotiated forward rate in order to decrease exposure to foreign exchange rate risk associated with foreign currency denominated securities held by the Fund.
During the reporting period, the Fund had daily average contract amounts on forward contracts to buy and sell of $8,623 and $13,958,984, respectively.
Additional associated risk to the Fund includes counterparty credit risk. Counterparty credit risk arises from the possibility that the counterparty to a forward contract will default and fail to perform its obligations to the Fund.
Futures Contracts
A futures contract is a commitment to buy or sell a specific amount of a commodity, financial instrument or currency at a negotiated price on a stipulated future date. The Fund may buy and sell futures contracts and may also buy or write put or call options on these futures contracts. Futures contracts and options thereon are generally entered into on a regulated futures exchange and cleared through a clearinghouse associated with the exchange.
Upon entering into a futures contract, the Fund is required to deposit either cash or securities (initial margin) in an amount equal to a certain percentage of the contract value in an account registered in the futures commission merchant’s name. Subsequent payments (variation margin) are paid to or from the futures commission merchant each day equal to the daily changes in the contract value. Such payments are recorded as unrealized gains and losses. Should the Fund fail to make requested variation margin payments, the futures commission merchant can gain access to the initial margin to satisfy the Fund’s payment obligations.
Futures contracts are reported on a schedule following the Consolidated Statement of Investments. Securities held by a futures commission merchant to cover initial margin requirements on open futures contracts are noted in the Consolidated Statement of Investments. Cash held by a futures commission merchant to cover initial margin requirements on open futures contracts and the receivable and/or payable for the daily mark to market for the variation margin are noted in the Consolidated Statement of Assets and Liabilities. The net change in unrealized appreciation and depreciation is reported in the Consolidated Statement of Operations. Realized gains (losses) are reported in the Consolidated Statement of Operations at the closing or expiration of futures contracts.
The Fund has purchased futures contracts on various bonds and notes to increase exposure to interest rate risk.
70 OPPENHEIMER GLOBAL ALLOCATION FUND
6. Use of Derivatives (Continued)
The Fund has sold futures contracts on various bonds and notes to decrease exposure to interest rate risk.
The Fund has purchased futures contracts on various equity indexes to increase exposure to equity risk.
The Fund has sold futures contracts on various equity indexes to decrease exposure to equity risk.
The Fund has purchased futures contracts on various currencies to increase exposure to foreign exchange rate risk.
The Fund has purchased futures contracts, which have values that are linked to the price movement of the related volatility indexes, in order to increase exposure to volatility risk. The Fund has sold futures contracts, which have values that are linked to the price movement of the related volatility indexes, in order to decrease exposure to volatility risk.
During the reporting period, the Fund had an ending monthly average market value of $470,678,287 and $225,367,847 on futures contracts purchased and sold, respectively.
Additional associated risks of entering into futures contracts (and related options) include the possibility that there may be an illiquid market where the Fund is unable to liquidate the contract or enter into an offsetting position and, if used for hedging purposes, the risk that the price of the contract will correlate imperfectly with the prices of the Fund’s securities.
Option Activity
The Fund may buy and sell put and call options, or write put and call options. When an option is written, the Fund receives a premium and becomes obligated to sell or purchase the underlying security, currency or other underlying financial instrument at a fixed price, upon exercise of the option.
Options can be traded through an exchange or through a privately negotiated arrangement with a dealer in an OTC transaction. Options traded through an exchange are generally cleared through a clearinghouse (such as The Options Clearing Corporation). The difference between the premium received or paid, and market value of the option, is recorded as unrealized appreciation or depreciation. The net change in unrealized appreciation or depreciation is reported in the Consolidated Statement of Operations. When an option is exercised, the cost of the security purchased or the proceeds of the security sale are adjusted by the amount of premium received or paid. Upon the expiration or closing of the option transaction, a gain or loss is reported in the Consolidated Statement of Operations.
The Fund has purchased put options on currencies to decrease exposure to foreign exchange rate risk. A purchased put option becomes more valuable as the price of the underlying financial instrument depreciates relative to the strike price.
The Fund has purchased call options on individual equity securities and/or equity indexes to increase exposure to equity risk. A purchased call option becomes more valuable as the price of the underlying financial instrument appreciates relative to the strike price.
The Fund has purchased put options on individual equity securities and/or equity indexes to decrease exposure to equity risk. A purchased put option becomes more valuable as the price of the underlying financial instrument depreciates relative to the strike price.
71 OPPENHEIMER GLOBAL ALLOCATION FUND
| | |
| NOTES TO CONSOLIDATED FINANCIAL STATEMENTS Continued | | |
6. Use of Derivatives (Continued)
The Fund has purchased call options on volatility indexes to increase exposure to volatility risk. A purchased call option becomes more valuable as the level of the underlying volatility index increases relative to the strike price.
The Fund has purchased put options on volatility indexes to decrease exposure to volatility risk. A purchased put option becomes more valuable as the level of the underlying volatility index decreases relative to the strike price.
During the reporting period, the Fund had an ending monthly average market value of $3,067,988 and $5,685,083 on purchased call options and purchased put options, respectively.
Options written, if any, are reported in a schedule following the Consolidated Statement of Investments and as a liability in the Consolidated Statement of Assets and Liabilities. Securities held in collateral accounts to cover potential obligations with respect to outstanding written options are noted in the Consolidated Statement of Investments.
The risk in writing a call option is that the market price of the security increases and if the option is exercised, the Fund must either purchase the security at a higher price for delivery or, if the Fund owns the underlying security, give up the opportunity for profit.
The risk in writing a put option is that the Fund may incur a loss if the market price of the security decreases and the option is exercised. The risk in buying an option is that the Fund pays a premium whether or not the option is exercised. The Fund also has the additional risk that there may be an illiquid market where the Fund is unable to close the contract.
The Fund has written put options on currencies to increase exposure to foreign exchange rate risk. A written put option becomes more valuable as the price of the underlying financial instrument appreciates relative to the strike price.
The Fund has written call options on currencies to decrease exposure to foreign exchange rate risk. A written call option becomes more valuable as the price of the underlying financial instrument depreciates relative to the strike price.
The Fund has written put options on individual equity securities and/or equity indexes to increase exposure to equity risk. A written put option becomes more valuable as the price of the underlying financial instrument appreciates relative to the strike price.
The Fund has written call options on individual equity securities and/or equity indexes to decrease exposure to equity risk. A written call option becomes more valuable as the price of the underlying financial instrument depreciates relative to the strike price.
The Fund has written call options on volatility indexes to decrease exposure to volatility risk. A written call option becomes more valuable as the level of the underlying volatility index decreases relative to the strike price.
During the reporting period, the Fund had an ending monthly average market value of $200,000 and $990,968 on written call options and written put options, respectively. Additional associated risks to the Fund include counterparty credit risk and liquidity risk.
72 OPPENHEIMER GLOBAL ALLOCATION FUND
6. Use of Derivatives (Continued)
Written option activity for the reporting period was as follows:
| | | | | | | | |
| | | Number of
Contracts | | | Amount of
Premiums | |
| |
Options outstanding as of | | | | | | | | |
October 31, 2014 | | | 1,000 | | | $ | 996,962 | |
Options written | | | 250,779,349 | | | | 20,393,171 | |
Options closed or expired | | | (3,500) | | | | (2,239,362) | |
Options exercised | | | (250,776,849) | | | | (19,150,771) | |
| | | | |
Options outstanding as of October 30, 2015 | | | – | | | $ | – | |
| | | | |
Swap Contracts
The Fund may enter into swap contract agreements with a counterparty to exchange a series of cash flows based on either specified reference rates, the price or volatility of asset or non-asset references, or the occurrence of a credit event, over a specified period. Swaps can be executed in a bi-lateral privately negotiated arrangement with a dealer in an OTC transaction (“OTC swaps”) or executed on a regulated market. Certain swaps, regardless of the venue of their execution, are required to be cleared through a clearinghouse (“centrally cleared swaps”). Swap contracts may include interest rate, equity, debt, index, total return, credit default, currency, and volatility swaps.
Swap contracts are reported on a schedule following the Consolidated Statement of Investments. The values of centrally cleared swap and OTC swap contracts are aggregated by positive and negative values and disclosed separately on the Consolidated Statement of Assets and Liabilities. The unrealized appreciation (depreciation) related to the change in the valuation of the notional amount of the swap is combined with the accrued interest due to (owed by) the Fund, if any, at termination or settlement. The net change in this amount during the period is included on the Consolidated Statement of Operations. The Fund also records any periodic payments received from (paid to) the counterparty, including at termination, under such contracts as realized gain (loss) on the Consolidated Statement of Operations.
Swap contract agreements are exposed to the market risk factor of the specific underlying reference rate or asset. Swap contracts are typically more attractively priced compared to similar investments in related cash securities because they isolate the risk to one market risk factor and eliminate the other market risk factors. Investments in cash securities (for instance bonds) have exposure to multiple risk factors (credit and interest rate risk). Because swaps have embedded leverage, they can expose the Fund to substantial risk in the isolated market risk factor.
Interest Rate Swap Contracts. An interest rate swap is an agreement between counterparties to exchange periodic payments based on interest rates. One cash flow stream will typically be a floating rate payment based upon a specified floating interest rate while the other is typically a fixed interest rate.
The Fund has entered into interest rate swaps in which it pays a floating interest rate and receives a fixed interest rate in order to increase exposure to interest rate risk.
73 OPPENHEIMER GLOBAL ALLOCATION FUND
| | |
| NOTES TO CONSOLIDATED FINANCIAL STATEMENTS Continued | | |
6. Use of Derivatives (Continued)
Typically, if relative interest rates rise, payments made by the Fund under a swap agreement will be greater than the payments received by the Fund.
For the reporting period, the Fund had ending monthly average notional amounts of $20,028,670 receive a fixed rate.
Additional associated risks to the Fund include counterparty credit risk and liquidity risk.
Total Return Swap Contracts. A total return swap is an agreement between counterparties to exchange periodic payments based on the value of asset or non-asset references. One cash flow is typically based on a non-asset reference (such as an interest rate) and the other on the total return of a reference asset (such as a security or a basket of securities or securities index). The total return of the reference asset typically includes appreciation or depreciation on the reference asset, plus any interest or dividend payments.
Total return swap contracts are exposed to the market risk factor of the specific underlying financial instrument or index. Total return swaps are less standard in structure than other types of swaps and can isolate and/or include multiple types of market risk factors including equity risk, credit risk, and interest rate risk.
The Fund has entered into total return swaps on various equity securities or indexes to increase exposure to equity risk. These equity risk related total return swaps require the Fund to pay a floating reference interest rate, and an amount equal to the negative price movement of securities or an index (expressed as a percentage) multiplied by the notional amount of the contract. The Fund will receive payments equal to the positive price movement of the same securities or index (expressed as a percentage) multiplied by the notional amount of the contract and, in some cases, dividends paid on the securities.
At period end, the Fund has no such total return swap agreements outstanding.
Additional associated risks to the Fund include counterparty credit risk and liquidity risk.
Counterparty Credit Risk. Derivative positions are subject to the risk that the counterparty will not fulfill its obligation to the Fund. The Fund intends to enter into derivative transactions with counterparties that the Manager believes to be creditworthy at the time of the transaction.
The Fund’s risk of loss from counterparty credit risk on OTC derivatives is generally limited to the aggregate unrealized gain netted against any collateral held by the Fund. For OTC options purchased, the Fund bears the risk of loss of the amount of the premiums paid plus the positive change in market values net of any collateral held by the Fund should the counterparty fail to perform under the contracts. Options written by the Fund do not typically give rise to counterparty credit risk, as options written generally obligate the Fund and not the counterparty to perform.
To reduce counterparty risk with respect to OTC transactions, the Fund has entered into master netting arrangements, established within the Fund’s International Swap and Derivatives Association, Inc. (“ISDA”) master agreements, which allow the Fund to make (or to have an entitlement to receive) a single net payment in the event of default (close-out netting) for outstanding payables and receivables with respect to certain OTC positions in swaps, options, swaptions, and forward currency exchange contracts for each individual counterparty. In addition, the Fund may require that certain counterparties post cash and/or
74 OPPENHEIMER GLOBAL ALLOCATION FUND
6. Use of Derivatives (Continued)
securities in collateral accounts to cover their net payment obligations for those derivative contracts subject to ISDA master agreements. If the counterparty fails to perform under these contracts and agreements, the cash and/or securities will be made available to the Fund.
At period end, the Fund has required certain counterparties to post collateral of $2,612,141.
ISDA master agreements include credit related contingent features which allow counterparties to OTC derivatives to terminate derivative contracts prior to maturity in the event that, for example, the Fund’s net assets decline by a stated percentage or the Fund fails to meet the terms of its ISDA master agreements, which would cause the Fund to accelerate payment of any net liability owed to the counterparty.
For financial reporting purposes, the Fund does not offset derivative assets and derivative liabilities that are subject to netting arrangements in the Consolidated Statement of Assets and Liabilities. Bankruptcy or insolvency laws of a particular jurisdiction may impose restrictions on or prohibitions against the right of offset in bankruptcy, insolvency or other events.
The Fund’s risk of loss from counterparty credit risk on exchange-traded derivatives cleared through a clearinghouse and for centrally cleared swaps is generally considered lower than as compared to OTC derivatives. However, counterparty credit risk exists with respect to initial and variation margin deposited/paid by the Fund that is held in futures commission merchant, broker and/or clearinghouse accounts for such exchange-traded derivatives and for centrally cleared swaps.
With respect to centrally cleared swaps, such transactions will be submitted for clearing, and if cleared, will be held in accounts at futures commission merchants or brokers that are members of clearinghouses. While brokers, futures commission merchants and clearinghouses are required to segregate customer margin from their own assets, in the event that a broker, futures commission merchant or clearinghouse becomes insolvent or goes into bankruptcy and at that time there is a shortfall in the aggregate amount of margin held by the broker, futures commission merchant or clearinghouse for all its customers, U.S. bankruptcy laws will typically allocate that shortfall on a pro-rata basis across all the broker’s, futures commission merchant’s or clearinghouse’s customers, potentially resulting in losses to the Fund.
There is the risk that a broker, futures commission merchant or clearinghouse will decline to clear a transaction on the Fund’s behalf, and the Fund may be required to pay a termination fee to the executing broker with whom the Fund initially enters into the transaction. Clearinghouses may also be permitted to terminate centrally cleared swaps at any time. The Fund is also subject to the risk that the broker or futures commission merchant will improperly use the Fund’s assets deposited/paid as initial or variation margin to satisfy payment obligations of another customer. In the event of a default by another customer of the broker or futures commission merchant, the Fund might not receive its variation margin payments from the clearinghouse, due to the manner in which variation margin payments are aggregated for all customers of the broker/futures commission merchant.
Collateral and margin requirements differ by type of derivative. Margin requirements are established by the broker, futures commission merchant or clearinghouse for exchange-traded and cleared derivatives, including centrally cleared swaps. Brokers, futures commission
75 OPPENHEIMER GLOBAL ALLOCATION FUND
| | |
| NOTES TO CONSOLIDATED FINANCIAL STATEMENTS Continued | | |
6. Use of Derivatives (Continued)
merchants and clearinghouses can ask for margin in excess of the regulatory minimum, or increase the margin amount, in certain circumstances.
Collateral terms are contract specific for OTC derivatives. For derivatives traded under an ISDA master agreement, the collateral requirements are typically calculated by netting the mark to market amount for each transaction under such agreement and comparing that amount to the value of any collateral currently pledged by the Fund or the counterparty.
For financial reporting purposes, cash collateral that has been pledged to cover obligations of the Fund, if any, is reported separately on the Consolidated Statement of Assets and Liabilities as cash pledged as collateral. Non-cash collateral pledged by the Fund, if any, is noted in the Consolidated Statement of Investments. Generally, the amount of collateral due from or to a party must exceed a minimum transfer amount threshold (e.g. $250,000) before a transfer has to be made. To the extent amounts due to the Fund from its counterparties are not fully collateralized, contractually or otherwise, the Fund bears the risk of loss from counterparty nonperformance.
The following table presents by counterparty the Fund’s OTC derivative assets net of the related collateral pledged by the Fund at October 30, 2015:
| | | | | | | | | | | | | | | | | | |
| | | | | | Gross Amounts Not Offset in the Consolidated
Statement of Assets & Liabilities | | | | |
| Counterparty | | Gross Amounts
Not Offset in
the
Consolidated
Statement of
Assets &
Liabilities* | | | Financial
Instruments
Available for
Offset | | | Financial
Instruments
Collateral
Received** | | Cash Collateral
Received** | | | Net Amount | |
Goldman Sachs Group, | | | | | | | | | | | | | | | | | | |
Inc. (The) | | $ | 2,290,578 | | | $ | — | | | $ (2,290,578) | | $ | — | | | $ | — | |
*OTC derivatives are reported gross on the Consolidated Statement of Assets and Liabilities. Exchange traded options and margin related to centrally cleared swaps and futures are excluded from these reported amounts.
**Reported collateral posted for the benefit of the Fund within this table is limited to the net outstanding amount due from an individual counterparty. The collateral posted for the benefit of the Fund may exceed these amounts.
The following table presents by counterparty the Fund’s OTC derivative liabilities net of the related collateral pledged by the Fund at October 30, 2015:
| | | | | | | | | | | | | | | | | | | | |
| | | | | | Gross Amounts Not Offset in the Consolidated
Statement of Assets & Liabilities | | | | |
| Counterparty | | Gross Amounts
Not Offset in
the
Consolidated
Statement of
Assets &
Liabilities* | | | Financial
Instruments
Available for
Offset | | | Financial
Instruments
Collateral
Pledged** | | | Cash Collateral
Pledged** | | | Net Amount | |
Toronto Dominion Bank | | $ | (183,880) | | | $ | — | | | $ | — | | | $ | — | | | $ | (183,880) | |
*OTC derivatives are reported gross on the Consolidated Statement of Assets and Liabilities. Exchange traded options and margin related to centrally cleared swaps and futures are excluded from these reported amounts.
76 OPPENHEIMER GLOBAL ALLOCATION FUND
6. Use of Derivatives (Continued)
**Reported collateral pledged within this table is limited to the net outstanding amount due from the Fund. The securities pledged as collateral by the Fund as reported on the Consolidated Statements of Investments may exceed these amounts.
The following table presents the valuations of derivative instruments by risk exposure as reported within the Consolidated Statement of Assets and Liabilities at period end:
| | | | | | | | | | | | |
| | | Asset Derivatives | | | Liability Derivatives | |
Derivatives Not
Accounted for as
Hedging
Instruments | | Consolidated Statement
of Assets and Liabilities
Location | | Value | | | Consolidated Statement
of Assets and Liabilities
Location | | Value | |
Interest rate contracts | | Centrally cleared swaps, at value | | $ | 202,305 | | | | | | | |
Equity contracts | | Variation margin receivable | | | 590,424 | * | | Variation margin payable | | $ | 76,080 | * |
Forward currency exchange contracts | | | | | | | | Unrealized depreciation on forward currency exchange contracts | | | 183,880 | |
Equity contracts | | Investments, at value | | | 5,023,578 | ** | | | | | | |
| | | | | | | | | | | | |
Total | | | | $ | 5,816,307 | | | | | $ | 259,960 | |
| | | | | | | | | | | | |
*Includes only the current day’s variation margin. Prior variation margin movements have been reflected in cash on the Consolidated Statement of Assets and Liabilities upon receipt or payment.
**Amounts relate to purchased option contracts and purchased swaption contracts, if any.
The effect of derivative instruments on the Consolidated Statement of Operations is as follows:
| | | | | | | | | | | | | | | | | | | | | | | | |
| Amount of Realized Gain or (Loss) Recognized on Derivatives | |
Derivatives Not
Accounted for as
Hedging
Instruments | | Investment
from
unaffiliated
companies
(including
premiums on
options
exercised)* | | | Closing and
expiration of
option
contracts
written | | | Closing and
expiration of
futures
contracts | | | Foreign
currency
transactions | | | Swap
contracts | | | Total | |
Equity contracts | | $ | (8,420,562 | ) | | $ | 2,239,362 | | | $ | (2,583,651 | ) | | $ | — | | | $ | (213,627 | ) | | $ | (8,978,478 | ) |
Forward currency exchange contracts | | | 1,065,226 | | | | — | | | | (1,488,561 | ) | | | 12,977 | | | | — | | | | (410,358 | ) |
Interest rate contracts | | | — | | | | — | | | | 16,362,965 | | | | — | | | | 827,788 | | | | 17,190,753 | |
Volatility contracts | | | 394,144 | | | | — | | | | 203,141 | | | | — | | | | — | | | | 597,285 | |
| | | | |
Total | | $ | (6,961,192 | ) | | $ | 2,239,362 | | | $ | 12,493,894 | | | $ | 12,977 | | | $ | 614,161 | | | $ | 8,399,202 | |
| | | | |
* Includes purchased options contracts, purchased swaption contracts, written options contracts exercised and written swaption contracts exercised, if any.
77 OPPENHEIMER GLOBAL ALLOCATION FUND
| | |
| NOTES TO CONSOLIDATED FINANCIAL STATEMENTS Continued | | |
6. Use of Derivatives (Continued)
| | | | | | | | | | | | | | | | | | | | | | | | |
| Amount of Change in Unrealized Gain or (Loss) Recognized on Derivatives | |
Derivatives
Not
Accounted
for as
Hedging
Instruments | | Investments* | | | Option
contracts
written | | | Futures
contracts | | | Translation of
assets
denominated
in foreign
currencies | | | Swap
contracts | | | Total | |
Equity contracts | | $ | 1,660,989 | | | $ | (396,962 | ) | | $ | 14,715,628 | | | $ | — | | | $ | — | | | $ | 15,979,655 | |
Forward currency exchange contracts | | | — | | | | — | | | | — | | | | (195,794 | ) | | | — | | | | (195,794 | ) |
Interest rate contracts | | | — | | | | — | | | | (2,444,106 | ) | | | — | | | | 202,305 | | | | (2,241,801 | ) |
Volatility contracts | | | 1,001,128 | | | | — | | | | 189,965 | | | | — | | | | — | | | | 1,191,093 | |
| | | | |
Total | | $ | 2,662,117 | | | $ | (396,962 | ) | | $ | 12,461,487 | | | $ | (195,794 | ) | | $ | 202,305 | | | $ | 14,733,153 | |
| | | | |
* Includes purchased option contracts and purchased swaption contracts, if any.
7. Shares of Beneficial Interest
The Fund has authorized an unlimited number of $0.01 par value shares of beneficial interest of each class. Transactions in shares of beneficial interest were as follows:
| | | | | | | | | | | | | | | | |
| | | Year Ended October 30, 20151 | | | Year Ended October 31, 2014 | |
| | | Shares | | | Amount | | | Shares | | | Amount | |
| |
Class A | | | | | | | | | | | | | | | | |
Sold | | | 4,170,278 | | | $ | 73,756,543 | | | | 4,725,514 | | | $ | 81,989,635 | |
Dividends and/or distributions reinvested | | | 907,671 | | | | 15,732,481 | | | | 1,361,783 | | | | 23,274,224 | |
Redeemed | | | (10,011,504 | ) | | | (176,351,362 | ) | | | (11,997,612 | ) | | | (208,095,711 | ) |
| | | | |
Net decrease | | | (4,933,555 | ) | | $ | (86,862,338 | ) | | | (5,910,315 | ) | | $ | (102,831,852 | ) |
| | | | |
| | | | |
| | | | | | | | | | | | | | | | | |
Class B | | | | | | | | | | | | | | | | |
Sold | | | 30,331 | | | $ | 518,762 | | | | 64,944 | | | $ | 1,090,813 | |
Dividends and/or distributions reinvested | | | 20,063 | | | | 334,153 | | | | 65,832 | | | | 1,089,088 | |
Redeemed | | | (1,418,934 | ) | | | (24,166,128 | ) | | | (1,812,134 | ) | | | (30,522,431 | ) |
| | | | |
Net decrease | | | (1,368,540 | ) | | $ | (23,313,213 | ) | | | (1,681,358 | ) | | $ | (28,342,530 | ) |
| | | | |
| | | | |
| | | | | | | | | | | | | | | | | |
Class C | | | | | | | | | | | | | | | | |
Sold | | | 1,462,062 | | | $ | 25,116,258 | | | | 1,181,122 | | | $ | 19,864,976 | |
Dividends and/or distributions reinvested | | | 106,042 | | | | 1,774,699 | | | | 219,806 | | | | 3,642,988 | |
Redeemed | | | (2,565,044 | ) | | | (43,653,850 | ) | | | (2,616,808 | ) | | | (44,059,338 | ) |
| | | | |
Net decrease | | | (996,940 | ) | | $ | (16,762,893 | ) | | | (1,215,880 | ) | | $ | (20,551,374 | ) |
| | | | |
78 OPPENHEIMER GLOBAL ALLOCATION FUND
7. Shares of Beneficial Interest (Continued)
| | | | | | | | | | | | | | | | |
| | | Year Ended October 30, 20151 | | | Year Ended October 31, 2014 | |
| | | Shares | | | Amount | | | Shares | | | Amount | |
Class I | | | | | | | | | | | | | | | | |
Sold | | | 11,137 | | | $ | 194,426 | | | | 151,132 | | | $ | 2,581,973 | |
Dividends and/or distributions reinvested | | | 741 | | | | 12,797 | | | | 1,121 | | | | 19,184 | |
Redeemed | | | (143,372 | ) | | | (2,503,501 | ) | | | (23,126 | ) | | | (400,557 | ) |
| | | | |
Net increase (decrease) | | | (131,494 | ) | | $ | (2,296,278 | ) | | | 129,127 | | | $ | 2,200,600 | |
| | | | |
| | | | |
| | | | | | | | | | | | | | | | | |
Class R2 | | | | | | | | | | | | | | | | |
Sold | | | 302,088 | | | $ | 5,268,180 | | | | 279,679 | | | $ | 4,768,684 | |
Dividends and/or distributions reinvested | | | 24,645 | | | | 420,071 | | | | 41,128 | | | | 691,463 | |
Redeemed | | | (515,784 | ) | | | (8,874,821 | ) | | | (587,624 | ) | | | (10,023,450 | ) |
| | | | |
Net decrease | | | (189,051 | ) | | $ | (3,186,570 | ) | | | (266,817 | ) | | $ | (4,563,303 | ) |
| | | | |
| | | | |
| | | | | | | | | | | | | | | | | |
Class Y | | | | | | | | | | | | | | | | |
Sold | | | 745,110 | | | $ | 13,146,361 | | | | 566,540 | | | $ | 9,836,794 | |
Dividends and/or distributions reinvested | | | 36,217 | | | | 627,593 | | | | 45,107 | | | | 771,596 | |
Redeemed | | | (512,820 | ) | | | (9,000,825 | ) | | | (436,944 | ) | | | (7,571,308 | ) |
| | | | |
Net increase | | | 268,507 | | | $ | 4,773,129 | | | | 174,703 | | | $ | 3,037,082 | |
| | | | |
1. October 30, 2015 represents the last business day of the Fund’s reporting period. See Note 2.
2. Effective July 1, 2014, Class N shares were renamed Class R. See Note 1.
8. Purchased and Sales of Securities
The aggregate cost of purchases and proceeds from sales of securities, other than short-term obligations and investments in IMMF, for the reporting period were as follows:
| | | | | | | | |
| | | Purchases | | | Sales | |
Investment securities | | $ | 1,082,590,132 | | | $ | 1,397,088,634 | |
U.S. government and government agency obligations | | | 175,566,086 | | | | — | |
9. Fees and Other Transactions with Affiliates
Management Fees. Under the investment advisory agreement, the Fund pays the Manager a management fee based on the daily net assets of the Fund at an annual rate as shown in the following table:
| | | | |
| Fee Schedule | | | |
Up to $1.0 billion | | | 0.80 | % |
Next $2.0 billion | | | 0.76 | |
Next $1.0 billion | | | 0.71 | |
Next $1.0 billion | | | 0.66 | |
Next $1.0 billion | | | 0.60 | |
Next $1.0 billion | | | 0.55 | |
Next $2.0 billion | | | 0.50 | |
Over $9.0 billion | | | 0.48 | |
79 OPPENHEIMER GLOBAL ALLOCATION FUND
| | |
| NOTES TO CONSOLIDATED FINANCIAL STATEMENTS Continued | | |
9. Fees and Other Transactions with Affiliates (Continued)
The Manager also provides investment management related services to the Subsidiary. The Subsidiary pays the Manager a monthly management fee at an annual rate according to the above schedule. The Subsidiary also pays certain other expenses including custody and directors’ fees.
The Fund’s effective management fee for the reporting period was 0.78% of average annual net assets before any Subsidiary management fees or any applicable waivers.
Sub-Adviser Fees. The Manager has retained the Sub-Adviser to provide the day-to-day portfolio management of the Fund. Under the Sub-Advisory Agreement, the Manager pays the Sub-Adviser an annual fee in monthly installments, equal to a percentage of the investment management fee collected by the Manager from the Fund, which shall be calculated after any investment management fee waivers. The fee paid to the Sub-Adviser is paid by the Manager, not by the Fund.
Transfer Agent Fees. OFI Global (the “Transfer Agent”) serves as the transfer and shareholder servicing agent for the Fund. The Fund pays the Transfer Agent a fee based on annual net assets. Fees incurred and average net assets for each class with respect to these services are detailed in the Consolidated Statement of Operations and Consolidated Financial Highlights, respectively.
Sub-Transfer Agent Fees. The Transfer Agent has retained Shareholder Services, Inc., a wholly-owned subsidiary of OFI (the “Sub-Transfer Agent”), to provide the day-to-day transfer agent and shareholder servicing of the Fund. Under the Sub-Transfer Agency Agreement, the Transfer Agent pays the Sub-Transfer Agent an annual fee in monthly installments, equal to a percentage of the transfer agent fee collected by the Transfer Agent from the Fund, which shall be calculated after any applicable fee waivers. The fee paid to the Sub-Transfer Agent is paid by the Transfer Agent, not by the Fund.
Trustees’ Compensation. The Fund has adopted an unfunded retirement plan (the “Plan”) for the Fund’s Independent Trustees. Benefits are based on years of service and fees paid to each Trustee during their period of service. The Plan was frozen with respect to adding new participants effective December 31, 2006 (the “Freeze Date”) and existing Plan Participants as of the Freeze Date will continue to receive accrued benefits under the Plan. Active Independent Trustees as of the Freeze Date have each elected a distribution method with respect to their benefits under the Plan. During the reporting period, the Fund’s projected benefit obligations, payments to retired Trustees and accumulated liability were as follows:
| | | | |
Projected Benefit Obligations Increased | | $ | 9,185 | |
Payments Made to Retired Trustees | | | 99,623 | |
Accumulated Liability as of October 30, 2015 | | | 494,147 | |
The Fund’s Board of Trustees (“Board”) has adopted a compensation deferral plan for Independent Trustees that enables Trustees to elect to defer receipt of all or a portion of the annual compensation they are entitled to receive from the Fund. For purposes of determining the amount owed to the Trustee under the plan, deferred amounts are treated as though
80 OPPENHEIMER GLOBAL ALLOCATION FUND
9. Fees and Other Transactions with Affiliates (Continued)
equal dollar amounts had been invested in shares of the Fund or in other Oppenheimer funds selected by the Trustee. The Fund purchases shares of the funds selected for deferral by the Trustee in amounts equal to his or her deemed investment, resulting in a Fund asset equal to the deferred compensation liability. Such assets are included as a component of “Other” within the asset section of the Consolidated Statement of Assets and Liabilities. Deferral of Trustees’ fees under the plan will not affect the net assets of the Fund and will not materially affect the Fund’s assets, liabilities or net investment income per share. Amounts will be deferred until distributed in accordance with the compensation deferral plan.
Distribution and Service Plan (12b-1) Fees. Under its General Distributor’s Agreement with the Fund, OppenheimerFunds Distributor, Inc. (the “Distributor”) acts as the Fund’s principal underwriter in the continuous public offering of the Fund’s classes of shares.
Distribution and Service Plan for Class A Shares. The Fund has adopted a Distribution and Service Plan (the “Plan”) for Class A shares pursuant to Rule 12b-1 under the 1940 Act. Under the Plan, the Fund pays a service fee to the Distributor at an annual rate of 0.25% of the daily net assets of Class A shares. The Distributor currently uses all of those fees to pay dealers, brokers, banks and other financial institutions periodically for providing personal services and maintenance of accounts of their customers that hold Class A shares. Under the Plan, the Fund may also pay an asset-based sales charge to the Distributor. However, the Fund’s Board has currently set the rate at zero. Fees incurred by the Fund under the Plan are detailed in the Consolidated Statement of Operations.
Distribution and Service Plans for Class B, Class C and Class R Shares. The Fund has adopted Distribution and Service Plans (the “Plans”) for Class B, Class C and Class R shares pursuant to Rule 12b-1 under the 1940 Act to compensate the Distributor for distributing those share classes, maintaining accounts and providing shareholder services. Under the Plans, the Fund pays the Distributor an annual asset-based sales charge of 0.75% on Class B and Class C shares’ daily net assets and 0.25% on Class R shares’ daily net assets. The Fund also pays a service fee under the Plans at an annual rate of 0.25% of daily net assets. The Plans continue in effect from year to year only if the Fund’s Board of Trustees votes annually to approve their continuance at an in person meeting called for that purpose. Fees incurred by the Fund under the Plans are detailed in the Consolidated Statement of Operations.
Sales Charges. Front-end sales charges and CDSC do not represent expenses of the Fund. They are deducted from the proceeds of sales of Fund shares prior to investment or from redemption proceeds prior to remittance, as applicable. The sales charges retained by the Distributor from the sale of shares and the CDSC retained by the Distributor on the redemption of shares is shown in the following table for the period indicated.
81 OPPENHEIMER GLOBAL ALLOCATION FUND
| | |
| NOTES TO CONSOLIDATED FINANCIAL STATEMENTS Continued | | |
9. Fees and Other Transactions with Affiliates (Continued)
| | | | | | | | | | | | | | | | | | | | |
| Year Ended | | Class A
Front-End
Sales Charges
Retained by
Distributor | | | Class A
Contingent
Deferred Sales
Charges
Retained by
Distributor | | | Class B
Contingent
Deferred Sales
Charges
Retained by
Distributor | | | Class C
Contingent
Deferred Sales
Charges
Retained by
Distributor | | | Class R
Contingent
Deferred Sales
Charges
Retained by
Distributor | |
October 30, 2015 | | | $64,663 | | | | $— | | | | $42,791 | | | | $9,909 | | | | $4 | |
Waivers and Reimbursements of Expenses. The Manager has contractually agreed to waive the management fee it receives from the Fund in an amount equal to the management fee it receives from the Subsidiary. During the reporting period, the Manager waived $116,711.
The Manager will waive fees and/or reimburse Fund expenses in an amount equal to the indirect management fees incurred through the Fund’s investment in IMMF. During the reporting period, the Manager waived fees and/or reimbursed the Fund $678,900 for IMMF management fees.
Waivers and/or reimbursements may be modified or terminated as set forth according to the terms in the prospectus.
10. Borrowing and Other Financing
Joint Credit Facility. A number of mutual funds managed by the Manager participate in a $1.28 billion revolving credit facility (the “Facility”) intended to provide short-term financing, if necessary, subject to certain restrictions in connection with atypical redemption activity. Expenses and fees related to the Facility are paid by the participating funds and are disclosed separately or as other expenses on the Consolidated Statement of Operations. The Fund did not utilize the Facility during the reporting period.
Securities Lending. The Fund lends portfolio securities from time to time in order to earn additional income in the form of fees, or interest on cash or securities received as collateral. The loans are secured by collateral (either securities, letters of credit, or cash) in an amount of at least 102% of the market value of the loaned U.S. securities, and at least 105% of the market value of loaned foreign securities during the period of the loan. The market value of the loaned securities is determined at the close of each business day and any additional required collateral is delivered to the Fund on the next business day. If the borrower defaults on its obligation to return the securities loaned because of insolvency or other reasons, the Fund could experience delays and cost in recovering the securities loaned or in gaining access to the collateral. The Fund continues to receive the economic benefit of interest or dividends paid on the securities loaned in the form of a substitute payment received from the borrower and recognizes the change in the fair value of the securities loaned that may occur during the term of the loan. The Fund has the right under the lending agreement to recover the securities from the borrower on demand. As of October 30, 2015, the Fund had no securities on loan.
82 OPPENHEIMER GLOBAL ALLOCATION FUND
11. Pending Litigation
In 2009, several putative class action lawsuits were filed and later consolidated before the U.S. District Court for the District of Colorado against OppenheimerFunds, Inc. (“OFI”), OppenheimerFunds Distributor, Inc. (“OFDI”), and Oppenheimer Rochester California Municipal Fund, a fund advised by OFI Global Asset Management, Inc. and distributed by the Distributor (the “California Fund”), in connection with the California Fund’s investment performance. The plaintiffs asserted claims against OFI, OFDI and certain present and former trustees and officers of the California Fund under the federal securities laws, alleging, among other things, that the disclosure documents of the California Fund contained misrepresentations and omissions and the investment policies of the California Fund were not followed. Plaintiffs in the suit filed an amended complaint and defendants filed a motion to dismiss. In 2011, the court issued an order which granted in part and denied in part the defendants’ motion to dismiss. In 2012, plaintiffs filed a motion, which defendants opposed, to certify a class and appoint class representatives and class counsel. In March 2015, the court granted plaintiffs’ motion for class certification. In May 2015, the U.S. Court of Appeals for the Tenth Circuit vacated the class certification order and remanded the matter to the district court for further proceedings. In July 2015, the district court held an evidentiary hearing on plaintiffs’ motion for class certification. In October 2015, the district court reaffirmed its order granting plaintiffs’ motion for class certification. Defendants have filed a petition before the U.S. Court of Appeals for the Tenth Circuit for permission to appeal that order.
OFI and OFDI believe the suit is without merit; that it is premature to render any opinion as to the likelihood of an outcome unfavorable to them in the suit; and that no estimate can yet be made as to the amount or range of any potential loss. Furthermore, OFI believes that the suit should not impair the ability of OFI or OFDI to perform their respective duties to the Fund and that the outcome of the suit should not have any material effect on the operations of any of the Oppenheimer funds.
83 OPPENHEIMER GLOBAL ALLOCATION FUND
| | |
| REPORT OF INDEPENDENT REGISTERED PUBLIC ACCOUNTING FIRM | | |
The Board of Trustees and Shareholders of Oppenheimer Quest for Value Funds:
We have audited the accompanying consolidated statement of assets and liabilities of Oppenheimer Global Allocation Fund (a series of Oppenheimer Quest for Value Funds) and subsidiary, including the consolidated statement of investments, as of October 30, 2015, and the related consolidated statement of operations for the year then ended, the consolidated statements of changes in net assets for each of the years in the two-year period then ended, and the consolidated financial highlights for each of the years or periods in the five-year period then ended. These consolidated financial statements and consolidated financial highlights are the responsibility of the Fund’s management. Our responsibility is to express an opinion on these consolidated financial statements and consolidated financial highlights based on our audits.
We conducted our audits in accordance with the standards of the Public Company Accounting Oversight Board (United States). Those standards require that we plan and perform the audit to obtain reasonable assurance about whether the financial statements and financial highlights are free of material misstatement. An audit includes examining, on a test basis, evidence supporting the amounts and disclosures in the financial statements. Our procedures included confirmation of securities owned as of October 30, 2015, by correspondence with the custodian, transfer agent and brokers, or by other appropriate auditing procedures where replies from brokers were not received. An audit also includes assessing the accounting principles used and significant estimates made by management, as well as evaluating the overall financial statement presentation. We believe that our audits provide a reasonable basis for our opinion.
In our opinion, the consolidated financial statements and consolidated financial highlights referred to above present fairly, in all material respects, the financial position of Oppenheimer Global Allocation Fund and subsidiary as of October 30, 2015, the results of their operations for the year then ended, the changes in their net assets for each of the years in the two-year period then ended, and the consolidated financial highlights for each of the years or periods in the five-year period then ended, in conformity with U.S. generally accepted accounting principles.
KPMG LLP
Denver, Colorado
December 22, 2015
84 OPPENHEIMER GLOBAL ALLOCATION FUND
| | |
| FEDERAL INCOME TAX INFORMATION Unaudited | | |
In early 2015, if applicable, shareholders of record received information regarding all dividends and distributions paid to them by the Fund during calendar year 2014.
Dividends, if any, paid by the Fund during the reporting period which are not designated as capital gain distributions should be multiplied by the maximum amount allowable but not less than 28.32% to arrive at the amount eligible for the corporate dividend-received deduction.
A portion, if any, of the dividends paid by the Fund during the reporting period which are not designated as capital gain distributions are eligible for lower individual income tax rates to the extent that the Fund has received qualified dividend income as stipulated by recent tax legislation. The maximum amount allowable but not less than $19,496,821 of the Fund’s fiscal year taxable income may be eligible for the lower individual income tax rates. In early 2015, shareholders of record received information regarding the percentage of distributions that are eligible for lower individual income tax rates.
Recent tax legislation allows a regulated investment company to designate distributions not designated as capital gain distributions, as either interest related dividends or short-term capital gain dividends, both of which are exempt from the U.S. withholding tax applicable to non U.S. taxpayers. For the reporting period, the maximum amount allowable but not less than $8,553,704 of the ordinary distributions to be paid by the Fund qualifies as an interest related dividend.
The foregoing information is presented to assist shareholders in reporting distributions received from the Fund to the Internal Revenue Service. Because of the complexity of the federal regulations which may affect your individual tax return and the many variations in state and local tax regulations, we recommend that you consult your tax advisor for specific guidance.
85 OPPENHEIMER GLOBAL ALLOCATION FUND
| | |
BOARD APPROVAL OF THE FUND’S INVESTMENT ADVISORY AND SUB-ADVISORY AGREEMENTS Unaudited | | |
The Fund has entered into an investment advisory agreement with OFI Global Asset Management, Inc. (“OFI Global” or the “Adviser”), a wholly-owned subsidiary of OppenheimerFunds, Inc. (“OFI” or the “Sub-Adviser”) (“OFI Global” and “OFI” together the “Managers”) and OFI Global has entered into a sub-advisory agreement with OFI whereby OFI provides investment sub-advisory services to the Fund (collectively, the “Agreements”). Each year, the Board of Trustees (the “Board”), including a majority of the independent Trustees, is required to determine whether to approve the terms of the Agreements and the renewal thereof. The Investment Company Act of 1940, as amended, requires that the Board request and evaluate, and that the Managers provide, such information as may be reasonably necessary to evaluate the terms of the Agreements. The Board employs an independent consultant to prepare a report that provides information, including comparative information that the Board requests for that purpose. In addition to in-person meetings focused on this evaluation, the Board receives information throughout the year regarding Fund services, fees, expenses and performance.
The Adviser, Sub-Adviser and the independent consultant provided information to the Board on the following factors: (i) the nature, quality and extent of the Managers’ services, (ii) the comparative investment performance of the Fund and the Managers, (iii) the fees and expenses of the Fund, including comparative fee and expense information, (iv) the profitability of the Managers and their affiliates, including an analysis of the cost of providing services, (v) whether economies of scale are realized as the Fund grows and whether fee levels reflect these economies of scale for Fund investors and (vi) other benefits to the Managers from their relationship with the Fund. The Board was aware that there are alternatives to retaining the Managers.
Outlined below is a summary of the principal information considered by the Board as well as the Board’s conclusions.
Nature, Quality and Extent of Services. The Board considered information about the nature, quality and extent of the services provided to the Fund and information regarding the Managers’ key personnel who provide such services. The Managers’ duties include providing the Fund with the services of the portfolio managers and the Sub-Adviser’s investment team, who provide research, analysis and other advisory services in regard to the Fund’s investments; and securities trading services. OFI Global is responsible for oversight of third-party service providers; monitoring compliance with applicable Fund policies and procedures and adherence to the Fund’s investment restrictions; risk management; and oversight of the Sub-Adviser. OFI Global is also responsible for providing certain administrative services to the Fund as well. Those services include providing and supervising all administrative and clerical personnel who are necessary in order to provide effective corporate administration for the Fund; compiling and maintaining records with respect to the Fund’s operations; preparing and filing reports required by the U.S. Securities and Exchange Commission; preparing periodic reports regarding the operations of the Fund for its shareholders; preparing proxy materials for shareholder meetings; and preparing the registration statements required by federal and state securities laws for the sale of the Fund’s shares. OFI Global also provides the Fund with office space, facilities and equipment.
The Board also considered the quality of the services provided and the quality of the Managers’ resources that are available to the Fund. The Board took account of the fact that
86 OPPENHEIMER GLOBAL ALLOCATION FUND
the Sub-Adviser has had over fifty years of experience as an investment adviser and that its assets under management rank it among the top mutual fund managers in the United States. The Board evaluated the Managers’ advisory, administrative, accounting, legal, compliance services and risk management, and information the Board has received regarding the experience and professional qualifications of the Managers’ key personnel and the size and functions of its staff. In its evaluation of the quality of the portfolio management services provided, the Board considered the experience of Mark Hamilton, Benjamin Rockmuller, Dokyoung Lee and Alessio de Longis, the portfolio managers for the Fund, and the Sub-Adviser’s investment team and analysts. The Board members also considered the totality of their experiences with the Managers as directors or trustees of the Fund and other funds advised by the Managers. The Board considered information regarding the quality of services provided by affiliates of the Managers, which the Board members have become knowledgeable about through their experiences with the Managers and in connection with the renewal of the Fund’s service agreements. The Board concluded, in light of the Managers’ experience, reputation, personnel, operations and resources that the Fund benefits from the services provided under the Agreements.
Investment Performance of the Managers and the Fund. Throughout the year, the Managers provided information on the investment performance of the Fund, the Adviser and the Sub-Adviser, including comparative performance information. The Board also reviewed information, prepared by the Managers and by the independent consultant, comparing the Fund’s historical performance to relevant benchmarks or market indices and to the performance of other retail funds in the world allocation category. The Board noted that the Fund’s one-year, three-year, five-year and ten-year performance was below its category median.
Fees and Expenses of the Fund. The Board reviewed the fees paid to the Adviser and the other expenses borne by the Fund. The independent consultant provided comparative data in regard to the fees and expenses of the Fund and other retail front-end load world allocation funds with comparable asset levels and distribution features. The Board noted that the Fund’s contractual management fees were lower than its peer group median and category median. The Board also noted that the Fund’s total expenses were higher than its peer group median and category median.
Economies of Scale and Profits Realized by the Managers. The Board considered information regarding the Managers’ costs in serving as the Fund’s investment adviser and sub-adviser, including the costs associated with the personnel and systems necessary to manage the Fund, and information regarding the Managers’ profitability from their relationship with the Fund. The Board also considered that the Managers must be able to pay and retain experienced professional personnel at competitive rates to provide quality services to the Fund. The Board reviewed whether the Managers may realize economies of scale in managing and supporting the Fund. The Board noted that the Fund currently has management fee breakpoints, which are intended to share with Fund shareholders economies of scale that may exist as the Fund’s assets grow.
Other Benefits to the Managers. In addition to considering the profits realized by the Managers, the Board considered information that was provided regarding the direct and indirect benefits the Managers receive as a result of their relationship with the Fund, including
87 OPPENHEIMER GLOBAL ALLOCATION FUND
| | |
BOARD APPROVAL OF THE FUND’S INVESTMENT ADVISORY AND SUB-ADVISORY AGREEMENTS Unaudited / Continued | | |
compensation paid to the Managers’ affiliates and research provided to the Adviser in connection with permissible brokerage arrangements (soft dollar arrangements).
Conclusions. These factors were also considered by the independent Trustees meeting separately from the full Board, assisted by experienced counsel to the Fund and to the independent Trustees. Fund counsel and the independent Trustees’ counsel are independent of the Managers within the meaning and intent of the Securities and Exchange Commission Rules.
Based on its review of the information it received and its evaluations described above, the Board, including a majority of the independent Trustees, decided to continue the Agreements through September 30, 2016. In arriving at its decision, the Board did not identify any factor or factors as being more important than others, but considered all of the above information, and considered the terms and conditions of the Agreements, including the management fees, in light of all the surrounding circumstances.
88 OPPENHEIMER GLOBAL ALLOCATION FUND
| | |
PORTFOLIO PROXY VOTING POLICIES AND PROCEDURES; UPDATES TO STATEMENTS OF INVESTMENTS Unaudited | | |
The Fund has adopted Portfolio Proxy Voting Policies and Procedures under which the Fund votes proxies relating to securities (“portfolio proxies”) held by the Fund. A description of the Fund’s Portfolio Proxy Voting Policies and Procedures is available (i) without charge, upon request, by calling the Fund toll-free at 1.800.CALL OPP (225.5677), (ii) on the Fund’s website at www.oppenheimerfunds.com, and (iii) on the SEC’s website at www.sec.gov. In addition, the Fund is required to file Form N-PX, with its complete proxy voting record for the 12 months ended June 30th, no later than August 31st of each year. The Fund’s voting record is available (i) without charge, upon request, by calling the Fund toll-free at 1.800.CALL OPP (225.5677), and (ii) in the Form N-PX filing on the SEC’s website at www.sec.gov.
The Fund files its complete schedule of portfolio holdings with the SEC for the first quarter and the third quarter of each fiscal year on Form N-Q. The Fund’s Form N-Q filings are available on the SEC’s website at www.sec.gov. Those forms may be reviewed and copied at the SEC’s Public Reference Room in Washington, D.C. Information on the operation of the Public Reference Room may be obtained by calling 1-800-SEC-0330.
Householding—Delivery of Shareholder Documents
This is to inform you about OppenheimerFunds’ “householding” policy. If more than one member of your household maintains an account in a particular fund, OppenheimerFunds will mail only one copy of the fund’s prospectus (or, if available, the fund’s summary prospectus), annual and semiannual report and privacy policy. The consolidation of these mailings, called householding, benefits your fund through reduced mailing expense, and benefits you by reducing the volume of mail you receive from OppenheimerFunds. Householding does not affect the delivery of your account statements.
Please note that we will continue to household these mailings for as long as you remain an OppenheimerFunds shareholder, unless you request otherwise. If you prefer to receive multiple copies of these materials, please call us at 1.800.CALL-OPP (225-5677). You may also notify us in writing or via email. We will begin sending you individual copies of the prospectus (or, if available, the summary prospectus), reports and privacy policy within 30 days of receiving your request to stop householding.
89 OPPENHEIMER GLOBAL ALLOCATION FUND
| | |
| TRUSTEES AND OFFICERS Unaudited | | |
| | |
| | |
Name, Position(s) Held
with the Fund, Length of
Service, Year of Birth | | Principal Occupation(s) During the Past 5 Years; Other
Trusteeships/Directorships Held; Number of Portfolios in the Fund
Complex Currently Overseen |
| |
| INDEPENDENT TRUSTEES | | The address of each Trustee in the chart below is 6803 S. Tucson Way, Centennial, Colorado 80112-3924. Each Trustee serves for an indefinite term, or until his or her resignation, retirement, death or removal. |
| |
Brian F. Wruble,
Chairman of the Board of
Trustees (since 2009),
Trustee (since 2001) Year of Birth: 1943 | | Director and Vice Chairman of Community Foundation of the Florida Keys (non-profit) (since July 2012); Trustee of the Board of Trustees, The Jackson Laboratory (non-profit) (1991-2011 and since May 2014); Chairman Emeritus (since August 2011) of The Jackson Laboratory (non-profit); Director of Special Value Opportunities Fund, LLC (registered investment company) (affiliate of the Sub-Adviser’s parent company) (since September 2004); Member of Zurich Insurance Group’s Investment Management Advisory Council (insurance) (since 2004); Treasurer (since 2007) and Trustee of the Institute for Advanced Study (non-profit educational institute) (since May 1992); General Partner of Odyssey Partners, L.P. (hedge fund) (September 1995-December 2007); Special Limited Partner of Odyssey Investment Partners, LLC (private equity investment) (January 1999-September 2004). Oversees 52 portfolios in the OppenheimerFunds complex. Mr. Wruble has served on the Boards of certain Oppenheimer funds since April 2001, during which time he has become familiar with the Fund’s (and other Oppenheimer funds’) financial, accounting, regulatory and investment matters and has contributed to the Boards’ deliberations. |
| |
David K. Downes,
Trustee (since 2005) Year of Birth: 1940 | | Director of THL Credit Inc. (since June 2009); Chief Executive Officer and Board Member of Community Capital Management (investment management company) (since January 2004); President of The Community Reinvestment Act Qualified Investment Fund (investment management company) (since 2004); Director of Actua Corporation (information technology company) (since October 2003); formerly, Independent Chairman GSK Employee Benefit Trust (April 2006-June 2013); Director of Correctnet (January 2006-2007); Independent Chairman of the Board of Trustees of Quaker Investment Trust (registered investment company) (2004-2007); Chief Operating Officer and Chief Financial Officer of Lincoln National Investment Companies, Inc. (subsidiary of Lincoln National Corporation, a publicly traded company) and Delaware Investments U.S., Inc. (investment management subsidiary of Lincoln National Corporation) (1993-2003); President, Chief Executive Officer and Trustee of Delaware Investment Family of Funds (1993-2003); President and Board Member of Lincoln National Convertible Securities Funds, Inc. and the Lincoln National Income Funds, TDC (1993-2003); Chairman and Chief Executive Officer of Retirement Financial Services, Inc. (registered transfer agent and investment adviser and subsidiary of Delaware Investments U.S., Inc.) (1993-2003); President and Chief Executive Officer of Delaware Service Company, Inc. (1995-2003); Chief Administrative Officer, Chief Financial Officer, Vice Chairman and Director of Equitable Capital Management Corporation (investment subsidiary of Equitable Life Assurance Society) (1985-1992); Corporate Controller of Merrill Lynch Company (financial services holding company) (1977-1985); held the following positions at the Colonial Penn Group, Inc. (insurance company): Corporate Budget Director (1974-1977), Assistant Treasurer (1972-1974) and Director of Corporate Taxes (1969-1972); held the following positions at Price Waterhouse Company (financial services firm): Tax Manager (1967-1969), Tax Senior (1965-1967) and Staff Accountant (1963-1965); United States Marine Corps (1957-1959). |
90 OPPENHEIMER GLOBAL ALLOCATION FUND
| | |
David K. Downes,
Continued | | Oversees 52 portfolios in the OppenheimerFunds complex. Mr. Downes has served on the Boards of certain Oppenheimer funds since December 2005, during which time he has become familiar with the Fund’s (and other Oppenheimer funds’) financial, accounting, regulatory and investment matters and has contributed to the Boards’ deliberations. |
| |
Matthew P. Fink,
Trustee (since 2009) Year of Birth: 1941 | | Trustee of the Committee for Economic Development (policy research foundation) (2005-2011); Director of ICI Education Foundation (education foundation) (October 1991-August 2006); President of the Investment Company Institute (trade association) (October 1991-June 2004); Director of ICI Mutual Insurance Company (insurance company) (October 1991-June 2004); Author of The Rise of Mutual Funds: An Insider’s View published by Oxford University Press (second edition 2010). Oversees 52 portfolios in the OppenheimerFunds complex. Mr. Fink has served on the Boards of certain Oppenheimer funds since January 2005, during which time he has become familiar with the Fund’s (and other Oppenheimer funds’) financial, accounting, regulatory and investment matters and has contributed to the Boards’ deliberations. |
| |
Edmund P. Giambastiani, Jr.,
Trustee (since 2013) Year of Birth: 1948 | | Advisory Board Member of the Maxwell School of Citizenship and Public Affairs of Syracuse University (since April 2012); Director of Mercury Defense Systems Inc. (information technology) (August 2011-February 2013); Trustee of the U.S. Naval Academy Foundation (since November 2010); Advisory Board Member of the Massachusetts Institute of Technology Lincoln Laboratory (federally-funded research development center) (since May 2010); Director of The Boeing Company (aerospace and defense) (since October 2009); Trustee of MITRE Corporation (federally-funded research development center) (since September 2008); Independent Director of QinetiQ Group Plc (defense technology and security) (February 2008-August 2011); Director of Monster Worldwide, Inc. (on-line career services) (since January 2008, Lead Director since June 2011); Chairman of Alenia North America, Inc. (military and defense products) (January 2008-October 2009); Director of SRA International, Inc. (information technology and services) (January 2008-July 2011); President of Giambastiani Group LLC (national security and energy consulting) (since October 2007); United States Navy, career nuclear submarine officer (June 1970-October 2007), Vice Chairman of the Joint Chiefs of Staff (2005-October 2007), NATO Supreme Allied Commander Transformation (2003-2005), Commander, U.S. Joint Forces Command (2002-2005). Since his retirement from the U.S. Navy in October 2007, Admiral Giambastiani has also served on numerous U.S. Government advisory boards, investigations and task forces for the Secretaries of Defense, State and Interior and the Central Intelligence Agency. Oversees 52 portfolios in the OppenheimerFunds complex. Admiral Giambastiani has served on the Boards of certain Oppenheimer funds since February 2013, including as an Advisory Board Member for certain Oppenheimer funds, during which time he has become familiar with the Fund’s (and other Oppenheimer funds’) financial, accounting, regulatory and investment matters and has contributed to the Boards’ deliberations. For purposes of this report, Admiral Giambastiani is identified as a Trustee. |
| |
Elizabeth Krentzman,
Trustee (since 2014) Year of Birth: 1959 | | Advisory Board Member of the Securities and Exchange Commission Historical Society (since 2007); held the following positions at Deloitte & Touche LLP: Principal and Chief Regulatory Advisor for Asset Management Services (2007 - 2014) and U.S. Mutual Fund Leader (2011 - 2014); General Counsel of the Investment Company Institute (trade association) (June 2004 - April 2007); held |
91 OPPENHEIMER GLOBAL ALLOCATION FUND
| | |
| |
| TRUSTEES AND OFFICERS Unaudited / Continued | | |
| | |
Elizabeth Krentzman,
Continued | | the following positions at Deloitte & Touche LLP: National Director of the Investment Management Regulatory Consulting Practice (1997 - 2004), Principal (2003 - 2004), Director (1998 - 2003) and Senior Manager (1997 - 1998); Assistant Director of the Division of Investment Management-Office of Disclosure and Investment Adviser Regulation (1996 - 1997) and various positions with the Division of Investment Management – Office of Regulatory Policy (1991 - 1996) of the U.S. Securities and Exchange Commission; Associate at Ropes & Gray (1987 - 1991); former Chair of the Investment Management Subcommittee of the Washington, D.C. Bar. Oversees 52 portfolios in the OppenheimerFunds complex. Ms. Krentzman has served on the Boards of certain Oppenheimer funds since August 2014, during which time she has become familiar with the Fund’s (and other Oppenheimer funds’) financial, accounting, regulatory and investment matters and has contributed to the Boards’ deliberations. |
| |
Mary F. Miller,
Trustee (since 2009)
Year of Birth: 1942 | | Trustee of International House (not-for-profit) (since June 2007); Trustee of the American Symphony Orchestra (not-for-profit) (October 1998-November 2011); and Senior Vice President and General Auditor of American Express Company (financial services company) (July 1998-February 2003). Oversees 52 portfolios in the OppenheimerFunds complex. Ms. Miller has served on the Boards of certain Oppenheimer funds since August 2004, during which time she has become familiar with the Fund’s (and other Oppenheimer funds’) financial, accounting, regulatory and investment matters and has contributed to the Boards’ deliberations. |
| |
Joel W. Motley,
Trustee (since 2009)
Year of Birth: 1952 | | Member of the Vestry of Trinity Wall Street (since April 2012); Director of Southern Africa Legal Services Foundation (since March 2012); Board Member of Pulitzer Center for Crisis Reporting (non-profit journalism) (since December 2010); Managing Director of Public Capital Advisors, LLC (privately-held financial advisor) (since January 2006); Managing Director of Carmona Motley, Inc. (privately-held financial advisor) (since January 2002); Director of Columbia Equity Financial Corp. (privately-held financial advisor) (2002-2007); Managing Director of Carmona Motley Hoffman Inc. (privately-held financial advisor) (January 1998-December 2001); Member of the Finance and Budget Committee of the Council on Foreign Relations, Member of the Investment Committee and Board of Human Rights Watch and Member of the Investment Committee and Board of Historic Hudson Valley. Oversees 52 portfolios in the OppenheimerFunds complex. Mr. Motley has served on the Boards of certain Oppenheimer funds since October 2002, during which time he has become familiar with the Fund’s (and other Oppenheimer funds’) financial, accounting, regulatory and investment matters and has contributed to the Boards’ deliberations. |
| |
Joanne Pace,
Trustee (since 2012)
Year of Birth: 1958 | | Board Director of Horizon Blue Cross Blue Shield of New Jersey (since November 2012); Advisory Board Director of The Alberleen Group LLC (since March 2012); Advisory Board Director of The Agile Trading Group LLC (since March 2012); Advisory Council Member of 100 Women in Hedge Funds (non-profit) (since December 2012); Advisory Council Member of Morgan Stanley Children’s Hospital (non-profit) (since May 2012); Board Director of The Komera Project (non-profit) (since April 2012); New York Advisory Board Director of Peace First (non-profit) (since March 2010); Senior Advisor of SECOR Asset Management, LP (2010-2011); Managing Director and Chief Operating Officer of Morgan Stanley Investment Management (2006-2010); Partner and Chief Operating Officer of FrontPoint Partners, LLC (hedge fund) (2005-2006); held the following positions |
92 OPPENHEIMER GLOBAL ALLOCATION FUND
| | |
Joanne Pace,
Continued | | at Credit Suisse: Managing Director (2003-2005); Global Head of Human Resources and member of Executive Board and Operating Committee (2004-2005), Global Head of Operations and Product Control (2003-2004); held the following positions at Morgan Stanley: Managing Director (1997-2003), Controller and Principal Accounting Officer (1999-2003); Chief Financial Officer (temporary assignment) for the Oversight Committee, Long Term Capital Management (1998-1999). Lead Independent Director and Chair of the Audit and Nominating Committee of The Global Chartist Fund, LLC of Oppenheimer Asset Management (2011-2012); Board Director of Managed Funds Association (2008-2010); Board Director of Morgan Stanley Foundation (2007-2010) and Investment Committee Chair (2008-2010). Oversees 52 portfolios in the OppenheimerFunds complex. Ms. Pace has served on the Boards of certain Oppenheimer funds since November 2012, including as an Advisory Board Member for certain Oppenheimer funds, during which time she has become familiar with the Fund’s (and other Oppenheimer funds’) financial, accounting, regulatory and investment matters and has contributed to the Board’s deliberations. For purposes of this report, Ms. Pace is identified as a Trustee. |
| |
Daniel Vandivort,
Trustee (since 2014) Year of Birth: 1954 | | Chairman and Lead Independent Director/Trustee (March 2010-September 2014), Chairman of the Audit Committee (March 2009-September 2014) and Director/Trustee (December 2008-September 2014) of the Board of Directors/Trustees of Value Line Funds; Trustee, Board of Trustees of Huntington Disease Foundation of America (June 2007-December 2013): Trustee, Board of Trustees, RIM Retirement Savings Plan (2005-2007); President and Chief Investment Officer, Robeco Investment Management, formerly known as Weiss Peck and Greer (January 2005-June 2007); Member, Management Committee of Robeco Investment Management (2001-2007); Chairman and Trustee of the Board of Trustees of Weiss, Peck and Greer Funds (2004-2005); Managing Director and Head of Fixed Income, Weiss, Peck and Greer (November 1994-January 2005); Managing Director and Head of Fixed Income, CS First Boston Investment Management (January 1992-November 1994); Director, Global Product Development, First Boston Asset Management (November 1989-January 1992); Vice President, Fixed Income Sales, First Boston Corp. (May 1984-November 1989). Oversees 52 portfolios in the OppenheimerFunds complex. Mr. Vandivort has served on the Boards of certain Oppenheimer funds since 2014, during which time he has become familiar with the Fund’s (and other Oppenheimer funds’) financial, accounting, regulatory and investment matters and has contributed to the Boards’ deliberations. |
| |
| | | |
| |
| INTERESTED TRUSTEES | | Mr. Glavin is an “Interested Trustee” because he is affiliated with the Manager and the Sub-Adviser by virtue of his positions as director of the Sub-Adviser, and as a shareholder of the Sub-Adviser’s parent company. As a Trustee, he serves for an indefinite term, or until his resignation, retirement, death or removal. Mr. Glavin’s address is 225 Liberty Street, New York, New York 10281-1008. |
| |
| | Mr. Steinmetz is an “Interested Trustee” because he is affiliated with the Manager and the Sub-Adviser by virtue of his positions as Chairman of the Sub-Adviser and officer and director of the Manager. Both as a Trustee and as an officer, Mr. Steinmetz serves for an indefinite term, or until his resignation, retirement, death or removal. Mr. Steinmetz’s address is 225 Liberty Street, New York, New York 10281-1008. |
93 OPPENHEIMER GLOBAL ALLOCATION FUND
| | |
| |
| TRUSTEES AND OFFICERS Unaudited / Continued | | |
| | |
William F. Glavin, Jr.,
Trustee (since 2009)
Year of Birth: 1958 | | Chairman of the Sub-Adviser (since July 2014 and December 2009-December 2012) and Director of the Sub-Adviser (since January 2009); Chairman, Director and Chief Executive Officer (January 2013-June 2014) of the Manager; President of the Manager (January 2013-May 2013); Chief Executive Officer (January 2009-December 2012); President of the Sub-Adviser (May 2009-December 2012); Management Director (June 2009-June 2014), President (December 2009-June 2014) and Chief Executive Officer (January 2011-June 2014) of Oppenheimer Acquisition Corp. (“OAC”) (the Sub-Adviser’s parent holding company); Director of Oppenheimer Real Asset Management, Inc. (March 2010- June 2014); Executive Vice President (March 2006-February 2009) and Chief Operating Officer (July 2007-February 2009) of Massachusetts Mutual Life Insurance Company (OAC’s parent company); Director (May 2004-March 2006) and Chief Operating Officer and Chief Compliance Officer (May 2004-January 2005), President (January 2005-March 2006) and Chief Executive Officer (June 2005-March 2006) of Babson Capital Management LLC; Director (March 2005- March 2006), President (May 2003-March 2006) and Chief Compliance Officer (July 2005-March 2006) of Babson Capital Securities, Inc. (a broker-dealer); President (May 2003-March 2006) of Babson Investment Company, Inc.; Director (May 2004-August 2006) of Babson Capital Europe Limited; Director (May 2004- October 2006) of Babson Capital Guernsey Limited; Director (May 2004-March 2006) of Babson Capital Management LLC; Non-Executive Director (March 2005- March 2007) of Baring Asset Management Limited; Director (February 2005-June 2006) Baring Pension Trustees Limited; Director and Treasurer (December 2003- November 2006) of Charter Oak Capital Management, Inc.; Director (May 2006- September 2006) of C.M. Benefit Insurance Company; Director (May 2008-June 2009) and Executive Vice President (June 2007-July 2009) of C.M. Life Insurance Company; President (March 2006-May 2007) of MassMutual Assignment Company; Director (January 2005-December 2006), Deputy Chairman (March 2005-December 2006) and President (February 2005-March 2005) of MassMutual Holdings (Bermuda) Limited; Director (May 2008-June 2009) and Executive Vice President (June 2007-July 2009) of MML Bay State Life Insurance Company; Chief Executive Officer and President (April 2007-January 2009) of MML Distributors, LLC; and Chairman (March 2006-December 2008) and Chief Executive Officer (May 2007-December 2008) of MML Investors Services, Inc. An officer of 91 portfolios in the OppenheimerFunds complex. Mr. Glavin has served on the Boards of certain Oppenheimer funds since December 2009, during which time he has become familiar with the Fund’s (and other Oppenheimer funds’) financial, accounting, regulatory and investment matters and has contributed to the Boards’ deliberations. |
| |
Arthur P. Steinmetz,
Trustee (since 2015),
President and Principal
Executive Officer
(since 2014)
Year of Birth: 1958 | | Chairman of the Sub-Adviser (since January 2015); CEO and Chairman of the Manager (since July 2014), President of the Manager (since May 2013), a Director of the Manager (since January 2013), Director of the Sub-Adviser (since July 2014), President, Management Director and CEO of Oppenheimer Acquisition Corp. (the Sub-Adviser’s parent holding company) (since July 2014), and President and Director of OFI SteelPath, Inc. (since January 2013). Chief Investment Officer of the OppenheimerFunds advisory entities from (January 2013-December 2013); Executive Vice President of the Manager (January 2013- May 2013); Chief Investment Officer of the Sub-Adviser (October 2010-December 2012); Chief Investment Officer, Fixed-Income, of the Sub-Adviser (April 2009- October 2010); Executive Vice President of the Sub-Adviser (October 2009- December 2012); Director of Fixed Income of the Sub-Adviser (January 2009- April 2009); and a Senior Vice President of the Sub-Adviser (March 1993- September 2009). An officer of 91 portfolios in the OppenheimerFunds complex. |
94 OPPENHEIMER GLOBAL ALLOCATION FUND
| | |
| |
| | | |
| |
OTHER OFFICERS OF THE
FUND | | The addresses of the Officers in the chart below are as follows: for Messrs. Hamilton, Rockmuller, de Longis, Lee, Gabinet, Mss. Sexton and Picciotto, 225 Liberty Street, New York, New York 10281-1008, for Mr. Wixted, 6803 S. Tucson Way, Centennial, Colorado 80112-3924. Each Officer serves for an indefinite term or until his or her resignation, retirement, death or removal. |
| |
Mark Hamilton
Vice President (since 2013)
Year of Birth: 1965 | | Chief Investment Officer, Asset Allocation of the Sub-Adviser (since April 2013) and a Senior Vice President of the Sub-Adviser (since April 2013). Mr. Hamilton served at AllianceBernstein L.P. (from 1994-2013), as an Investment Director of Dynamic Asset Allocation (from 2010-2013), Head of North American Blend Team (from 2009-2010), and Senior Portfolio Manager of Blend Strategies (from 2006-2010). A portfolio manager and an officer of other portfolios in the OppenheimerFunds complex. |
| |
Benjamin H. Rockmuller,
Vice President (since 2011)
Year of Birth: 1979 | | Vice President of the Sub-Adviser (since September 2010); Assistant Vice President of the Sub-Adviser (January 2010-August 2010); Portfolio Manager of the Sub-Adviser (since July 2010); Senior Analyst of the Sub-Adviser for the Global Debt Team (January 2010-July 2010); Intermediate Analyst of the Sub- Adviser for the Global Debt Team (January 2007-January 2010); Junior Analyst of the Sub-Adviser for the Global Debt Team (April 2004-January 2007) and Junior Analyst of the Sub-Adviser for the High Yield Team (June 2003-April 2004). A portfolio manager and an officer in the OppenheimerFunds complex. |
| |
Alessio de Longis
Vice President (since 2015)
Year of Birth: 1978 | | Vice President of the Sub-Adviser (since June 2010); Assistant Vice President of the Sub-Adviser (May 2009-June 2010); Senior Research Analyst of the Sub- Adviser (January 2008-June 2010); Intermediate Research Analyst of the Sub- Adviser (January 2006-January 2008) Junior Analyst of the Sub-Adviser (February 2004-January 2006). ). A portfolio manager and an officer in the OppenheimerFunds complex. |
| |
Dokyoung Lee
Vice President (since 2015)
Year of Birth: 1965 | | Director of Research, Global Multi-Asset Group and a Senior Vice President of the Sub-Adviser (since October 2013). Mr. Lee served at Alliance Bernstein L.P. (1994-2013): Director of Research for Strategic Asset Allocation (2011-2013), Director of Research for Blend Strategies (2008-2011), Head of Asia Pacific Blend Strategies (2005-2008), Head of Quantitative Research and Senior Portfolio Manager for Japan Value Equities (2001-2005), Portfolio Manager for Emerging Markets Value Equities (1997-2001), and Quantitative Analyst for US Value Equities (1994-1997). A portfolio manager and an officer in the OppenheimerFunds complex. |
| |
Arthur S. Gabinet,
Secretary and Chief Legal
Officer (since 2011) Year of Birth: 1958 | | Executive Vice President, Secretary and General Counsel of the Manager (since January 2013); General Counsel OFI SteelPath, Inc. (since January 2013); Executive Vice President (May 2010-December 2012) and General Counsel (since January 2011) of the Sub-Adviser; General Counsel of the Distributor (since January 2011); General Counsel of Centennial Asset Management Corporation (January 2011-December 2012); Executive Vice President (January 2011- December 2012) and General Counsel of HarbourView Asset Management Corporation (since January 2011); Assistant Secretary (since January 2011) and Director (since January 2011) of OppenheimerFunds International Ltd. and OppenheimerFunds plc; Director of Oppenheimer Real Asset Management, Inc. (January 2011-December 2012) and General Counsel (since January 2011); Executive Vice President (January 2011-December 2011) and General Counsel of Shareholder Financial Services, Inc. and Shareholder Services, Inc. (since January |
95 OPPENHEIMER GLOBAL ALLOCATION FUND
| | |
| |
| TRUSTEES AND OFFICERS Unaudited / Continued | | |
| | |
| |
Arthur S. Gabinet,
Continued | | 2011); Executive Vice President (January 2011-December 2012) and General Counsel of OFI Private Investments Inc. (since January 2011); Vice President of OppenheimerFunds Legacy Program (January 2011-December 2011); Executive Vice President (January 2011-December 2012) and General Counsel of OFI Institutional Asset Management, Inc. (since January 2011); General Counsel, Asset Management of the Sub-Adviser (May 2010-December 2010); Principal, The Vanguard Group (November 2005-April 2010); District Administrator, U.S. Securities and Exchange Commission (January 2003-October 2005). An officer of 91 portfolios in the OppenheimerFunds complex. |
| |
Jennifer Sexton,
Vice President and
Chief Business
Officer (since 2014)
Year of Birth: 1969 | | Senior Vice President of OppenheimerFunds Distributor, Inc. (since June 2014); Vice President of OppenheimerFunds Distributor, Inc. (April 2006-June 2014); Vice President of the Sub-Adviser (January 1998-March 2006); Assistant Vice President of the Sub-Adviser (October 1991-December 1998). An officer of 91 portfolios in the OppenheimerFunds complex. |
| |
Mary Ann Picciotto,
Chief Compliance
Officer and Chief
Anti-Money
Laundering Officer
(since 2014) Year of Birth: 1973 | | Senior Vice President and Chief Compliance Officer of the Manager (since March 2014); Chief Compliance Officer of the Sub-Adviser, OFI SteelPath, Inc., OFI Global Trust Company, OFI Global Institutional, Inc., Oppenheimer Real Asset Management, Inc., OFI Private Investments, Inc., Harborview Asset Management Corporation, Trinity Investment Management Corporation, and Shareholder Services, Inc. (since March 2014); Managing Director of Morgan Stanley Investment Management Inc. and certain of its various affiliated entities; Chief Compliance Officer of various Morgan Stanley Funds (May 2010-January 2014); Chief Compliance Officer of Morgan Stanley Investment Management Inc. (April 2007-January 2014). An officer of 91 portfolios in the OppenheimerFunds complex. |
| |
Brian W. Wixted,
Treasurer and
Principal Financial &
Accounting Officer
(since 1999)
Year of Birth: 1959 | | Senior Vice President of the Manager (since January 2013); Treasurer of the Sub- Adviser, HarbourView Asset Management Corporation, Shareholder Financial Services, Inc., Shareholder Services, Inc., and Oppenheimer Real Asset Management, Inc. (March 1999-June 2008), OFI Private Investments, Inc. (March 2000-June 2008), OppenheimerFunds International Ltd. and OppenheimerFunds plc (since May 2000), OFI Institutional Asset Management, Inc. (November 2000- June 2008), and OppenheimerFunds Legacy Program (charitable trust program established by the Sub-Adviser) (June 2003-December 2011); Treasurer and Chief Financial Officer of OFI Trust Company (since May 2000); Assistant Treasurer of Oppenheimer Acquisition Corporation (March 1999-June 2008). An officer of 91 portfolios in the OppenheimerFunds complex. |
The Fund’s Statement of Additional Information contains additional information about the Fund’s Trustees and Officers and is available without charge upon request, by calling 1.800.CALL OPP (225.5677).
96 OPPENHEIMER GLOBAL ALLOCATION FUND
| | |
| |
| OPPENHEIMER GLOBAL ALLOCATION FUND | | |
| | |
| |
| Manager | | OFI Global Asset Management, Inc. |
| |
| Sub-Adviser | | OppenheimerFunds, Inc. |
| |
| Distributor | | OppenheimerFunds Distributor, Inc. |
| |
Transfer and Shareholder
Servicing Agent | | OFI Global Asset Management, Inc. |
| |
| Sub-Transfer Agent | | Shareholder Services, Inc. |
| | DBA OppenheimerFunds Services |
| |
Independent Registered
Public Accounting Firm | | KPMGLLP |
| |
| Legal Counsel | | Kramer Levin Naftalis & Frankel LLP |
© 2015 OppenheimerFunds, Inc. All rights reserved.
97 OPPENHEIMER GLOBAL ALLOCATION FUND
As an Oppenheimer fund shareholder, you are entitled to know how we protect your personal information and how we limit its disclosure.
Information Sources
We obtain nonpublic personal information about our shareholders from the following sources:
| ● | | Applications or other forms |
| ● | | When you create a user ID and password for online account access |
| ● | | When you enroll in eDocs Direct, our electronic document delivery service |
| ● | | Your transactions with us, our affiliates or others |
| ● | | A software program on our website, often referred to as a “cookie,” which indicates which parts of our site you’ve visited |
| ● | | When you set up challenge questions to reset your password online |
If you visit oppenheimerfunds.com and do not log on to the secure account information areas, we do not obtain any personal information about you. When you do log on to a secure area, we do obtain your user ID and password to identify you. We also use this information to provide you with products and services you have requested, to inform you about products and services that you may be interested in and assist you in other ways.
We do not collect personal information through our website unless you willingly provide it to us, either directly by email or in those areas of the website that request information. In order to update your personal information (including your mailing address, email address and phone number) you must first log on and visit your user profile.
If you have set your browser to warn you before accepting cookies, you will receive the warning message with each cookie. You can refuse cookies by turning them off in your browser. However, doing so may limit your access to certain sections of our website.
We use cookies to help us improve and manage our website. For example, cookies help us recognize new versus repeat visitors to the site, track the pages visited, and enable some special features on the website. This data helps us provide a better service for our website visitors.
Protection of Information
We do not disclose any non-public personal information (such as names on a customer list) about current or former customers to anyone, except as permitted by law.
Disclosure of Information
Copies of confirmations, account statements and other documents reporting activity in your fund accounts are made available to your financial advisor (as designated by you). We may also use details about you and your investments to help us, our financial service affiliates, or firms that jointly market their financial products and services with ours, to better serve your investment needs or suggest financial services or educational material that may be of interest to you. If this requires us to provide you with an opportunity to “opt in” or “opt out” of such information sharing with a firm not affiliated with us, you will receive notification on how to do so, before any such sharing takes place.
Right of Refusal
We will not disclose your personal information to unaffiliated third parties (except as permitted by law), unless we first offer you a reasonable opportunity to refuse or “opt out” of such disclosure.
98 OPPENHEIMER GLOBAL ALLOCATION FUND
Internet Security and Encryption
In general, the email services provided by our website are encrypted and provide a secure and private means of communication with us. To protect your own privacy, confidential and/or personal information should only be communicated via email when you are advised that you are using a secure website. As a security measure, we do not include personal or account information in non-secure emails, and we advise you not to send such information to us in non-secure emails. Instead, you may take advantage of the secure features of our website to encrypt your email correspondence. To do this, you will need to use a browser that supports Secure Sockets Layer (SSL) protocol.
We do not guarantee or warrant that any part of our website, including files available for download, are free of viruses or other harmful code. It is your responsibility to take appropriate precautions, such as use of an anti-virus software package, to protect your computer hardware and software.
| ● | | All transactions, including redemptions, exchanges and purchases, are secured by SSL and 256-bit encryption. SSL is used to establish a secure connection between your PC and OppenheimerFunds’ server. It transmits information in an encrypted and scrambled format. |
| ● | | Encryption is achieved through an electronic scrambling technology that uses a “key” to code and then decode the data. Encryption acts like the cable converter box you may have on your television set. It scrambles data with a secret code so that no one can make sense of it while it is being transmitted. When the data reaches its destination, the same software unscrambles the data. |
| ● | | You can exit the secure area by either closing your browser, or for added security, you can use the Log Out button before you close your browser. |
Other Security Measures
We maintain physical, electronic and procedural safeguards to protect your personal account information. Our employees and agents have access to that information only so that they may offer you products or provide services, for example, when responding to your account questions.
How You Can Help
You can also do your part to keep your account information private and to prevent unauthorized transactions. If you obtain a user ID and password for your account, do not allow it to be used by anyone else. Also, take special precautions when accessing your account on a computer used by others.
Who We Are
This joint notice describes the privacy policies of the Oppenheimer funds, OppenheimerFunds, Inc., each of its investment adviser subsidiaries, OppenheimerFunds Distributor, Inc. and OFI Global Trust Co. It applies to all Oppenheimer fund accounts you presently have, or may open in the future, using your Social Security number—whether or not you remain a shareholder of our funds. This notice was last updated March 2015. In the event it is updated or changed, we will post an updated notice on our website at oppenheimerfunds.com. If you have any questions about this privacy policy, write to us at P.O. Box 5270, Denver, CO 80217-5270, email us by clicking on the Contact Us section of our website at oppenheimerfunds.com or call us at 1.800.CALL OPP (225.5677).
99 OPPENHEIMER GLOBAL ALLOCATION FUND
THIS PAGE INTENTIONALLY LEFT BLANK.
100 OPPENHEIMER GLOBAL ALLOCATION FUND
THIS PAGE INTENTIONALLY LEFT BLANK.
101 OPPENHEIMER GLOBAL ALLOCATION FUND
THIS PAGE INTENTIONALLY LEFT BLANK.
102 OPPENHEIMER GLOBAL ALLOCATION FUND
THIS PAGE INTENTIONALLY LEFT BLANK.
103 OPPENHEIMER GLOBAL ALLOCATION FUND
Table of Contents
Class A Shares
AVERAGE ANNUAL TOTAL RETURNS AT 10/30/15*
| | | | | | | | | | |
| | | Class A Shares of the Fund | | | | | | |
| | | Without Sales Charge | | With Sales Charge | | HFRX Global
Hedge Fund
Index | | S&P 500 Index | | HFRI Fund
Weighted
Composite Index |
1-Year | | 3.18% | | -2.75% | | -2.05% | | 5.20% | | 0.60% |
|
5-Year | | 3.35 | | 2.14 | | 0.11 | | 14.33 | | 3.17 |
|
10-Year | | 3.69 | | 3.08 | | 0.58 | | 7.85 | | 4.55 |
|
Performance data quoted represents past performance, which does not guarantee future results. The investment return and principal value of an investment in the Fund will fluctuate so that an investor’s shares, when redeemed, may be worth more or less than their original cost. Fund returns include changes in share price, reinvested distributions, and a 5.75% maximum applicable sales charge except where “without sales charge” is indicated. Current performance may be lower or higher than the performance quoted. Returns do not consider capital gains or income taxes on an individual’s investment. For performance data current to the most recent month-end, visit oppenheimerfunds.com or call 1.800.CALL OPP (225.5677).
*October 30, 2015, was the last business day of the Fund’s fiscal year. See Note 2 of the accompanying Notes to Financial Statements. Index returns are calculated through October 31, 2015.
2 OPPENHEIMER FUNDAMENTAL ALTERNATIVES FUND
Fund Performance Discussion
The Fund’s Class A shares (without sales charge) produced a total return of 3.18% for the 12-month reporting period ending 10/31/15. The Fund outperformed its benchmark, the HFRX Global Hedge Fund Index (“Index”), which returned -2.05% during the same period, by 523 basis points (“bps”). The Fund also outperformed its peers in the Morningstar Multialternative Funds Category Average, which produced an average return of -1.86%, by 504 bps. The Fund’s Class A shares (without sales charge) ranked in the 14th percentile (57 out of 418 funds) in the Morningstar Multialternative Funds Category Average for total return during the one-year reporting period. Over the three-year, five-year and ten-year periods ended 10/31/15, the Fund ranked in the 8th (18 out of 222 funds), 41st (56 out of 135 funds) and 19th (6 out of 28 funds), respectively. Please note that Michelle Borré became the Fund’s portfolio manager on November 14, 2011, and was not involved in the management of the Fund for the full five- and ten-year periods.
Our Long and Short Equity strategy (called Equity Hedge in the Fund’s prospectus dated 2/27/15) generated strong positive returns and was the largest contributor to performance during the period. In fact, the Long and Short Equity strategy, which consists of long and short positions in equities, generated a total return of 3.85%,
outperforming the HFRX Equity Hedge Index (which represents the long and short equity portion of the Index), by 412 bps during the period. (These long and short equity returns are reported gross of fees and before any cash allocation. We report these numbers separately to provide some insight into how this part of the Fund performed as compared
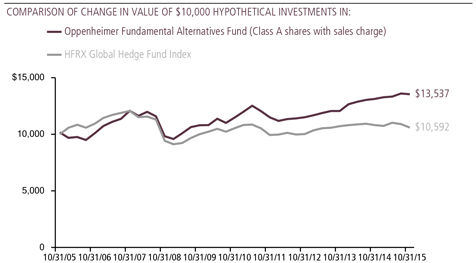
3 OPPENHEIMER FUNDAMENTAL ALTERNATIVES FUND
to the equity portion of the Index. All other performance numbers are reported net of fees.) The Long and Short Credit strategy also generated positive returns and contributed to performance. The Long and Short Macro strategy (called Global Macro in the Fund’s prospectus dated 2/27/15) was a marginal detractor from performance during the period.
The Fund offers the flexibility often associated with alternatives while providing the daily liquidity and transparency benefits of a mutual fund. It seeks to provide investors with strong risk-adjusted returns that have low sensitivity to traditional market factors over the long term. The investment team’s process has an underlying value philosophy that combines bottom-up and top-down fundamental analysis for security selection and portfolio construction. The Fund is able to invest both long and short across distinct alternative investment strategies including Long and Short Equity, Long and Short Credit and Long and Short Macro (including currencies, interest rates, sovereigns and commodities), making the Fund truly flexible. Although many investors focus on the short-term outlook when considering potential investments, the Fund utilizes a longer-term approach. We look at changing dynamics on both a macroeconomic and microeconomic basis over a multi-year time horizon to uncover investment opportunities which emerge from change. It is worth noting that the Fund had minimal exposure to the “Relative Value” strategy that is referenced in the prospectus
dated 2/27/15, and that it did not materially impact performance.
MARKET OVERVIEW
The global capital markets began to undergo several meaningful changes during the reporting period. Certain of these changes stem from the Federal Reserve’s (“Fed”) decision to end its purchases of U.S. government Treasuries and mortgage-backed securities (“MBS”) under the most recent quantitative easing (“QE”) program on 10/31/14. That decision has led to a divergence of monetary policy that investors have never faced before. The QE program was designed to help boost the U.S. economy by keeping mortgage rates and other long-term interest rates low, but a primary benefit to investors turned out to be its contribution to asset price inflation. As the Fed tapered and then ended that program, other central banks stepped in to pick up the monetary stimulus slack. For example, the Bank of Japan (“BoJ”) accelerated its own QE program on the same day that the Fed ended its program. The BoJ is currently executing open-ended QE by purchasing $56 billion per month of stocks and bonds. In addition, the European Central Bank (“ECB”) launched its own QE program in March 2015, and by doing so has moved its balance sheet from contraction to expansion. More specifically, the size of the ECB’s balance sheet contracted in 2014 as numerous borrowers under the Long-Term Refinancing Operation program repaid their funds early. In March, the ECB launched a program designed to expand its
4 OPPENHEIMER FUNDAMENTAL ALTERNATIVES FUND
balance sheet by €1.1 trillion through monthly purchases of €60 billion in sovereign and other debt. For purposes of comparison, the Fed expanded its balance sheet by $1.1 trillion in 2013 and by $463 billion in 2014. Although the Fed stopped purchases under its most recent program a year ago, the combination of the ECB’s new QE program and the BoJ’s acceleration of its existing QE program will more than make up for the cessation of the Fed’s purchases, further adding to global liquidity in 2015. We do not expect this year-on-year acceleration in total global QE to continue indefinitely. Moreover, the results in Japan and the Eurozone have not been particularly impressive so far. Inflation has remained well below target and economic growth has remained anemic in both regions. In fact, real GDP in Japan actually turned negative in the second and third quarters of 2015, which means that economy has slipped back into a technical recession for the fifth time in the last eight years.
As investors began to appreciate the broader implications of these changes in both monetary policy and liquidity, risk asset classes started to behave differently during the reporting period. For example, the S&P 500 Index delivered an average annual total return of 17.2% for the six years ending 12/31/14. However, for the past 12 months ending 10/31/15 (the reporting period), the S&P 500 delivered a total return of just 5.2%. Year to date through 10/31/15, the S&P 500 Index has generated a total return of just 2.7%.
Similarly, the MSCI Emerging Markets Index delivered an average annual total return of 11.6% for the six years ending 12/31/14. However, for the past 12 months ending 10/31/15, that index has declined 14.53%. Other risk asset classes have come under pressure during the reporting period as well, with the Bloomberg Commodity Index (comprising 22 commodities across 5 sectors) falling 25.72%, WTI crude oil collapsing 42.15%, the Alerian MLP Index falling 30.08% and gold declining 2.6%.
More broadly, the reporting period was bookended by sharp selloffs in risk assets combined with spikes in volatility. For example, the S&P 500 Index sold off sharply in both October 2014 and August 2015, while the Chicago Board Options Exchange SPX Volatility Index (“VIX Index”) spiked in those same two months. The VIX Index was created in 1990, and since that time has only had seven spikes above 40, one of which occurred on 8/24/15. Over the last five years, the VIX Index has typically hovered between 10 and 20. Similarly, the CBOE VVIX Index (“VVIX Index”), which measures the volatility of the VIX Index and was created in early 2012, spiked to its all-time high on 8/24/15. During the reporting period, the yield on the 10-year Treasury note oscillated widely between a high of 2.50% on 6/11/15 and a low of 1.64% on 1/30/15, but ended the period at 2.14% for a decline of just 19 bps. Against this backdrop, the Barclays U.S. Aggregate Bond Index (“Barclays Agg Index”) delivered a total return of 1.96% during the period while
5 OPPENHEIMER FUNDAMENTAL ALTERNATIVES FUND
the Credit Suisse Leveraged Loan Index had a total return of just 0.81% and the BofA Merrill Lynch U.S. High Yield Index delivered a total return of -2.05%. In other words, these bond indices delivered flat to negative returns with relatively high volatility. In our view, Treasuries could become less helpful to investors during market selloffs in part because they offer paltry yields, making the risk/reward tradeoff unattractive. Recent selloffs in the equity markets have seen less positive return associated with Treasuries than in the past.
One of the biggest surprises in the reporting period was the sharp rise of the U.S. dollar which started in mid-2014 as investors began to anticipate the end of QE3 and the resulting divergence of monetary policy in various countries. As the U.S. Dollar Index (“DXY Index”) climbed 11.54% during the period, commodities began falling, in part because a rising dollar makes commodities priced in U.S. dollars more expensive to foreign buyers. A rising dollar combined with slowing growth in China and the emerging markets, greater supply, falling demand and low inflation revealed the severity of the weakness in commodities. The Bloomberg Commodity Index fell 25.72% during the period while WTI crude oil (the most heavily traded commodity by dollar volume) collapsed 42.15%. In addition, a sharply rising dollar is a significant headwind for U.S. companies selling goods and services to foreign buyers, which is part of the reason why S&P 500 earnings have fallen
short of consensus expectations so far in 2015, and may do so again in 2016.
In our view, equity markets are exhibiting significantly increased volatility but are no longer rising consistently, and traditional fixed income investments are not providing as much ballast to diversified portfolios during a challenging market environment. Under these circumstances, we believe investors could benefit from a broader toolkit than was needed during the risk-on markets of the last six years and in some respects a different toolkit than has been effective in the past because of the unfavorable risk/reward in conservative fixed income. Part of this broader toolkit could include the ability to take positions with short exposure, which can actually profit from market declines. This kind of short exposure is available through the Long and Short Equity, Long and Short Credit and Long and Short Macro strategies of the Fund.
FUND REVIEW
Long and Short Equity Strategy. The top contributors to performance during the reporting period in the long equity component of the strategy were Juniper Networks and Alphabet (formerly Google). The top contributors in the short equity component of the strategy were Ensco and Transocean. In contrast, the biggest detractors in the long equity component of the strategy were Quanta Services and Qualcomm, while the biggest detractors in the short equity component were Kohl’s Corp. and Boeing.
6 OPPENHEIMER FUNDAMENTAL ALTERNATIVES FUND
Top Contributors in Long and Short Equity Strategy
Juniper Networks (JNPR) develops networking products including routers, switches, network management software and security products. Our long position in JNPR contributed to performance as the company has benefited from improving operations including the diversification of its customer mix. Historically, JNPR’s sales have been heavily skewed toward two carriers, AT&T and Verizon. This concentration introduced significant volatility into JNPR’s operating results and stock price. More recently, however, the company has been able to derive greater revenue from cloud providers, cable operators and international carriers. This has enabled JNPR to deliver more predictable results, and the stock price has benefited accordingly.
Our long position in Alphabet Inc. (GOOGL), formerly known as Google, also contributed to performance as a result of several factors. First, the company has been a prime beneficiary of the transition in advertising dollars from traditional media to online platforms. Alphabet has strong positions in both desktop and mobile search, digital display and video. The company’s operating and financial results have been bolstered by this shift, providing support to the shares. Second, the company recently hired a new CFO, Ruth Porat. She has brought improved cost discipline and a stronger focus on shareholder returns. Her
early decisions on capital allocation and improving transparency have been viewed very positively by investors.
Our short position in Ensco (ESV), a U.K. based offshore driller, was a positive contributor to performance during the period. This position, along with our short in Transocean (discussed below), are part of our short exposure in deepwater oilfield services. ESV’s stock was hurt by the extended downturn in the offshore rig market and a 42.28% decline in the price of Brent crude oil. The bleak industry outlook, the risk of further rig contract cancellations, and the 53% decline in the quarterly earnings run rate during the period put pressure on the stock. The company also has the fewest number of days contracted in its ultra-deepwater fleet verses any of its peers. In addition, during the period ESV disclosed an internal investigation into possible corruption related to a rig contract with Petrobras. As a result of these factors, the stock declined 57.1% during the reporting period.
Similarly, our short position in Transocean (RIG), a Swiss based deepwater offshore driller, was a positive contributor to performance. This position, along with our short in Ensco (discussed above), are part of our short exposure in deepwater oilfield services. RIG’s stock declined on the back of an 80% cut in the quarterly dividend (from $0.75 to $0.15/share) as the company sought to preserve its cash flow and balance sheet in light of a longer-than-expected downturn in
7 OPPENHEIMER FUNDAMENTAL ALTERNATIVES FUND
the offshore rig market. The company is struggling to perform in an oversupplied market as demand continues to decline due to depressed oil prices. RIG has approximately 31% of its floater fleet coming up for contract renewal in 2015. At the same time, approximately 63% of its fleet is without contracts for 2016, which puts next year’s earnings at risk.
Largest Detractors in Long and Short Equity Strategy
Quanta Services (PWR) is a pipeline and electric power engineering and construction company. Our long position in Quanta detracted from performance after the sharp drop in oil caused investors to reconsider potential risks in the company’s backlog as well as the future prospects for its energy pipeline construction business. The stock has also been under pressure after the company missed earnings expectations for three consecutive quarters as a result of adverse weather and permitting delays. These issues resulted in increased costs and pushed revenue recognition into 2016. We exited our position in Quanta during the reporting period.
Qualcomm (QCOM) is a digital wireless communications equipment manufacturer. Our long position in QCOM detracted from performance as the company faced headwinds after losing share in Samsung’s flagship smartphone franchise. In particular, the company’s semiconductor chip business has
suffered after QCOM miss-executed on a product cycle and got designed out of the Samsung Galaxy. We are optimistic that QCOM’s new chip, the Snapdragon 820, will be successful and help the company regain share in the high-end of the smartphone market. In addition, QCOM has faced challenges getting 4G licensing agreements signed and royalties collected in China. Management has signed an agreement with the Chinese government that should help on both fronts. It will take time, however, for QCOM to reach agreements with all of its licensees and so we don’t expect an immediate rebound in the royalty business.
Our short position in Kohl’s Corp. (KSS), a department store operator, detracted from performance during the period. KSS suffers from some of the secular pressures facing the department store industry. This includes share loss to both off-price and online retailers. For a while, management was able to offset these issues by improving merchandising in areas like beauty and apparel. This allowed the company to report better-than-expected results. These results, coupled with an attractive shareholder return strategy of dividends and share repurchases, have helped to support the shares.
Boeing (BA) is a U.S. based aerospace company that manufactures commercial jetliners as well as defense, space and security systems. Our short position detracted from performance as global air traffic growth continues to remain robust (up approximately
8 OPPENHEIMER FUNDAMENTAL ALTERNATIVES FUND
9% year over year) and the company has delivered strong free cash flow growth thus far ($6.7 billion in 2014, rising to approximately $7 billion in 2015 and approximately $7.4 billion in 2016). As a result, investors now expect BA to expand its buyback authorization by another $6 billion before the end of 2015. Some investors also believe that Boeing can overcome its 787 deferred production expenses, pension obligations, and start-up expenses for new programs, and still show free cash flow growth for the coming years. That, combined with the view that Boeing is insulated from volatility in the U.S. dollar and crude oil prices compared to other industrial companies, helped drive the stock price higher during the period.
Long and Short Credit & Long and Short Macro Strategies. The Fund’s opportunistic strategies include Long and Short Credit and Long and Short Macro. In terms of individual holdings, the top performers in the period were our short positions in the Australian dollar and euro, and our long position in Oppenheimer Master Loan Fund, LLC. The biggest detractors were our position in a credit default swap (“CDS”) on Italian sovereign debt, our position in Japanese interest rates and our position in gold.
Top Contributors in Long and Short Credit & Long and Short Macro Strategies
Long dollar / short AUD and EUR. We are short several different currencies relative to the U.S. dollar, including the Australian dollar (AUD) and euro (EUR), which contributed to performance during the period. The dollar strengthened relative to most other currencies as evidenced by the 11.54% rise in the DXY Index. A slowly improving U.S. economy resulted in the Fed’s tightening of monetary conditions by ending asset purchases under its most recent QE program in October 2014. The Fed also started preparing the markets for potential future rate hikes. Higher interest rates tend to attract capital to U.S. dollar assets and also tend to increase the value of the currency.
The AUD weakened relative to the U.S. dollar during the period for several reasons. Declining prices for Australia’s primary commodity exports (e.g., iron ore, metallurgical coal and natural gas) resulted in lower economic growth, a larger current account surplus, and declining investments in the natural resource sector. These factors reduced demand for the AUD. In response, the Australian central bank cut interest rates twice so far in 2015, thereby exacerbating the AUD’s weakness.
In Europe, stagnating economic growth and declining inflation expectations caused the ECB to ease monetary conditions by launching a new QE program in March. Simply put, the ECB is issuing euros to buy financial assets (mostly government bonds), which decreases the supply of those bonds, increases their
9 OPPENHEIMER FUNDAMENTAL ALTERNATIVES FUND
prices and reduces their yields. In addition, the QE program increases the supply of euros, thereby driving down the currency’s value. This combination of interest rate cuts in Australia, increased QE in Europe, the cessation of QE in the U.S. and expectations of rising rates in the U.S. drove the dollar up versus both the AUD and EUR.
Our position in Oppenheimer Master Loan Fund, LLC also contributed to performance during the period. Loans generated modest returns in what was a relatively volatile period for a typically low-volatility asset class. Spreads for the asset class ranged from 427 to 541 bps during the period as concerns about oil prices and global growth resulted in periods of wider spreads. Despite higher spreads, default rates remained modest at below 2% for the S&P/LSTA Leveraged Loan Index. Ultimately, low defaults allowed coupon payments to offset the impact of 95 bps of spread widening during the reporting period.
Largest Detractors in Long and Short Credit & Long and Short Macro Strategies
In contrast, our CDS on the sovereign debt of Italy detracted from performance during the period. This is functionally a short credit position on Italy. The ECB’s aggressive QE program has increased demand for European government bonds, which has driven credit spreads lower in peripheral
countries, thereby reducing the value of our CDS protection.
Our position in Japanese interest rates also detracted from performance. This position is a swaption that is designed to benefit from rising interest rates in Japan. Slow economic growth in that country caused the BoJ to conclude it could not reach its 2% inflation target without increasing its QE program significantly in late 2014. This program involves issuing Japanese yen to purchase financial assets in an effort to lower interest rates and stimulate economic activity. Despite a major effort to ease monetary conditions, the BoJ so far has been unable to stimulate substantial economic growth or drive inflation close to its 2% target. (In fact, real Japanese GDP in the second and third quarters of 2015 was negative, which means the economy slipped back into a technical recession, its fifth in the last eight years.) This has resulted in market expectations of low nominal growth and low inflation for the indefinite future. These expectations imply low long-term interest rates, which negatively impacted the price of our swaption.
Finally, our long position in gold also detracted from performance as the yellow metal fell by 2.63% (or $30) to $1,142 per troy ounce. Commodities in general were under pressure during the period with the Bloomberg Commodity Index falling 25.72%. Gold and the other precious metals were no exception. Investors wrestled with the expected timing of the Fed’s first rate hike in
10 OPPENHEIMER FUNDAMENTAL ALTERNATIVES FUND
nine years, while at the same time the ECB and BoJ have been aggressively executing their own QE programs, pumping more money into those economies. Partly as a result, the U.S. dollar rose during the period, with the DXY Index climbing 11.54%. At the same time, inflation expectations have remained well contained while economic growth in China, the emerging markets and many developed markets has slowed, and investors have become concerned about a potentially hawkish change in U.S. monetary policy. All of these factors tend to be bearish for gold, and they helped to put pressure on pricing during the period.
STRATEGY & OUTLOOK
The macro environment remains complex and we continue to see numerous cross currents. While equities look interesting versus bonds in the mid to longer term, we see a shorter term disconnect between the strong performance in equities (prior to the August selloff), softness in earnings growth, and negative earnings revisions for the S&P 500 in 2015 and possibly 2016. (Consensus estimates at the start of the year called for S&P 500 earnings growth of 7% - 8% in 2015, but actual growth will likely be closer to 0; consensus estimates two months ago called for approximately 10.5% earnings growth in 2016, but those estimates have since been reduced to 8.5%, which still may prove too high.) Simply put, the U.S. equity market moved meaningfully ahead of earnings growth in 2012-2014, and valuations climbed to the point where U.S. equities were no longer
inexpensive. As a result, security selection has become even more important. In our view, volatility was likely to increase, which it did with a vengeance starting in August. Extremely accommodative monetary policy around the world has impacted all asset classes, including equities, and has been an important driver of rising asset prices during the last several years. This exceptional accommodation has continued in 2015 with at least 35 central banks cutting rates so far this year, and with several of them doing so multiple times as discussed below.
Under these circumstances, we believe that any normalization of rates and/or the withdrawal of central bank stimulus could pressure risk asset prices significantly. We also believe that there is more risk lurking beneath the surface of the market than many investors recognize, but it has been masked by unusually accommodative monetary policy, unusually low interest rates, unusually low volatility and adequate market liquidity. Some of that risk became evident in the flare-up of the Greek debt crisis in April, the extraordinary backup in yields on German bunds during May/June, the 30% - 40% drop in Chinese equities (i.e., Shanghai Composite, Shenzhen Composite and ChiNext indices) in a matter of weeks in June, the Chinese yuan devaluation in August, the double digit drop in the S&P 500 during August, and sovereign debt downgrades in Brazil (to junk status) and Japan.
11 OPPENHEIMER FUNDAMENTAL ALTERNATIVES FUND
More broadly, Treasury rates seem range bound in the near term absent some exogenous shock, with yields oscillating between 1.5% to 3.0%, although a significant negative development in the emerging markets could push rates below the lower end of this range. In the longer run, however, we do not believe rates this low are sustainable. Over the past several quarters, economic growth has slowed and central banks around the world have resorted to increasingly aggressive and distorting monetary policy. This included large scale purchases of government bonds and other debt, which pushed the price of those securities up and the yield down. In addition, investors increasingly sought the safety of these securities, partly as a result of the macro risks they saw. As a result, zero interest rate policies morphed into negative interest rate policies. In fact, nominal rates were negative for several years out the yield curve in a host of countries, including Germany, Switzerland, Denmark and Sweden. However, we believe that these extreme conditions in rates markets may have finally bottomed and started to reverse.
Thus far in 2015, central banks around the world have resorted to more aggressive monetary policy, including a constant parade of surprise interest rate cuts. In fact, central banks have cut interest rates over 55 times collectively this year, and over 700 times since 2008. China and Russia have been the most aggressive, cutting rates five times each in 2015, followed by India (four times) and
Australia/Canada (twice each). Significantly, this means that three of the four BRICs have slashed rates a total of 14 times so far this year. In our view, these central banks are cutting rates because they are worried that growth may be slowing too much—and a low inflation environment gives them leeway to do so. China’s growth continues to slow and this is putting pressure on commodity prices due to demand weakness. The supply that is coming on was planned for a higher growth environment, but that supply will likely still come on due to its low cost nature.
In contrast, the Fed ended its latest QE program in October 2014, which has helped to send the dollar higher against many major currencies. Partly as a result of this, combined with slowing economies in China and numerous emerging markets as well as issues specific to the various regions in question, we hold positions that are long the U.S. dollar and short other currencies including the Australian dollar, euro and Japanese yen. We added several new positions during the period that are designed to protect against the risk of further slowing in the emerging markets. These include a short position in the Chinese yuan (added before the devaluation of the yuan in August), a short position in the Thai baht and a credit default swap on the sovereign debt of Malaysia. In our view, the markets face a new paradigm of slower economic growth in China, and investors need to adjust to it. We also believe this relative divergence in monetary policy could ultimately feed through to interest rates. Currently, the
12 OPPENHEIMER FUNDAMENTAL ALTERNATIVES FUND
moves that historically could have occurred in the rates markets are being pushed to the currency markets due to the central banks’ aggressive monetary policies holding rates low.
Although the U.S. economy remains stuck in first gear with average annual GDP growth of 1.2% over the last six years ending 12/31/14, that growth rate has been relatively attractive compared to certain other developed markets. We are mindful that economies around the world likely will not decouple so long as the engines of global growth are slowing. The yield on the 10-year Treasury at 2.14% (as of 10/31/15) is an order of magnitude higher than those in other parts of the developed world, with yields on 10-year German Bunds and 10-year Japanese Government Bonds at 0.52% and 0.30%, respectively, on that date. Japan is becoming more desperate as consumption falls and evidence mounts that Abenomics is not working as planned. That policy was designed to revive the Japanese economy with “three arrows.” The third arrow in the quiver—meaningful structural reform—is proving to be a significant challenge. The Japanese economy recently slipped into its fifth recession in eight years, with real GDP turning negative again in the second and third quarters of 2015. In addition, the economy has not bounced back as expected from an increase in the consumption tax. The rate of basic wage growth in Japan was actually negative year-over-year for 2014, and inflation has remained stubbornly below the BoJ’s target of 2%. In our view, early
evidence that the market is becoming disillusioned with Abenomics has centered on a weakening yen. (During the reporting period, the yen reached a 13-year low against the dollar.) Additional evidence will likely involve investors’ loss of faith in the supposed omnipotence of the BoJ and the efficacy of its continuing QE efforts. This could eventually lead investors to be less responsive to central bank talk and require more actions.
Against this backdrop, growth in parts of Europe is stagnating with numerous countries facing an increasing risk of deflation. Precisely because growth is so slow in the Eurozone, the ECB has now implemented its own form of QE six years after the U.S. first went down that path. Its recent Targeted Long Term Refinancing Operation program has not proved to be particularly effective thus far in restarting lending by banks. While we believe the ECB’s acceleration of QE and its balance sheet expansion could help inflate asset prices in the near term (precisely what occurred in early 2015), the real impediment to growth is the lack of meaningful structural reform over the past six years. Moreover, geopolitical risk remains elevated as evidenced by the flare-up of the debt crisis in Greece in April combined with election results favoring populist/separatist parties in Greece, Spain and Portugal. (In our view, Greece is still at risk of becoming the first member to exit the Eurozone, despite having received its third bailout in the last five years.) In short, political instability in the Eurozone appears to be contained for now but it is by no means
13 OPPENHEIMER FUNDAMENTAL ALTERNATIVES FUND
resolved. We believe a continuing wave of immigrants coming from the Middle East will only exacerbate tensions. More broadly, while a few economic green shoots are visible in the Eurozone, and that region likely has the best chance to demonstrate increasing momentum in the near term, we do not believe that positive developments in the Eurozone will be enough to offset slowing momentum in China, Japan and the emerging markets.
We believe the U.S. economy still has attractive growth potential in certain areas. A variety of changes in technology could create a host of winners and losers, and could drive growth for companies that are able to successfully implement and harness the power of new technologies. There are pockets of innovation in different industries including pharmaceuticals, consumer discretionary and technology. Nonetheless, we are mindful that U.S. equity valuations were pushing up against the edge of bubble territory after several years when S&P 500 Index performance ran well ahead of earnings growth, leading to significant multiple expansion. In fact, the only time in the last four decades when the S&P 500 Index has traded at a higher P/E multiple on next 12 months’ consensus earnings was during the Tech Bubble in 1997-2000. While valuations came down somewhat following the equity selloff in the third quarter of 2015, they have since climbed back up as earnings estimates have been reduced. Furthermore, volatility has been artificially restrained over the last several years by highly accommodative
monetary policy, but this started to change in August with sharp spikes in both the VIX and VVIX indices, and could remain elevated on a more sustained basis now that the Fed has ended its purchases under QE3 and monetary policy is diverging significantly. In the past few years, whenever equities sold off, buyers typically stepped in quickly because valuations were still relatively attractive. Since valuations are less attractive today, selloffs could be steeper and it could take longer for buyers to appear. Moreover, banking regulations are significantly stricter, the fixed income markets are a lot less liquid, and banks are taking on much less risk. Under these circumstances, we believe that any softness in the markets could lead to more volatility on the fixed income side than we have seen in recent years.
Accordingly, we continue to pick our spots, selecting securities that we believe offer attractive risk-adjusted returns. We remain focused, as always, on controlling volatility and mitigating downside risk. We expect to be in a low return world for a while. We believe that the ability to generate attractive returns efficiently and without taking on undue risk will be of greater value to investors in a low return world, and that is where our investment team’s efforts are focused.
| | |
 | | 
Michelle Borré, CFA Portfolio Manager |
14 OPPENHEIMER FUNDAMENTAL ALTERNATIVES FUND
Portfolio Positioning*
LONG AND SHORT CREDIT
| | | | | | | | | | | | |
| | | Long | | | Short | | | Net | |
Bank Loans | | | 16.3 | % | | | 0.0 | % | | | 16.3 | % |
Asset Backed Securities | | | 13.4 | | | | 0.0 | | | | 13.4 | |
Non-convertible Bonds | | | 2.8 | | | | 0.0 | | | | 2.8 | |
Non-convertible Preferred Stocks | | | 2.4 | | | | 0.0 | | | | 2.4 | |
Bond Futures | | | 0.0 | | | | -1.0 | | | | -1.0 | |
Credit Default Swaps | | | 5.4 | | | | -7.6 | | | | -2.2 | |
LONG AND SHORT EQUITY | |
| | | Long | | | Short | | | Net | |
Common Stocks | | | 47.0 | % | | | -20.9 | % | | | 26.1 | % |
Equity Total Return Swaps | | | 1.0 | | | | 0.0 | | | | 1.0 | |
Equity/Credit Structured Notes | | | 0.0 | | | | 0.0 | | | | 0.0 | |
Convertible Bonds | | | 0.4 | | | | 0.0 | | | | 0.4 | |
Private Securities | | | 0.1 | | | | 0.0 | | | | 0.1 | |
Currencies | | | 0.6 | | | | -3.0 | | | | -2.4 | |
LONG AND SHORT MACRO | |
| | | Long | | | Short | | | Net | |
Commodities | | | 2.7 | % | | | 0.0 | % | | | 2.7 | % |
Interest Rate Swaps | | | 1.8 | | | | 0.0 | | | | 1.8 | |
Bond Futures | | | 0.0 | | | | -0.8 | | | | -0.8 | |
Currency Derivatives | | | 0.0 | | | | -7.5 | | | | -7.5 | |
Swaptions | | | 0.0 | | | | -7.0 | | | | -7.0 | |
Credit Default Swaps | | | 0.0 | | | | -10.8 | | | | -10.8 | |
*October 30, 2015, was the last business day of the Fund’s fiscal year. See Note 2 of the accompanying Notes to Financial Statements. Index returns are calculated through October 31, 2015.
15 OPPENHEIMER FUNDAMENTAL ALTERNATIVES FUND
| | | | | | | | | | | | |
CASH | |
| | | Long | | | Short | | | Net | |
Collateral Cash | | | 22.5 | % | | | 0.0 | % | | | 22.5 | % |
Cash Net of Collateral Cash | | | 14.8 | | | | 0.0 | | | | 14.8 | |
TOTAL PORTFOLIO | |
| | | Long | | | Short | | | Net | |
Long and Short Credit | | | 40.3 | % | | | -8.6 | % | | | 31.7 | % |
Long and Short Equity | | | 49.1 | | | | -23.9 | | | | 25.2 | |
Long and Short Macro | | | 4.5 | | | | -26.1 | | | | -21.6 | |
Portfolio holdings are subject to change, and are dollar weighted based on total net assets. Percentages are as of October 30, 2015. Negative weightings may result from the use of leverage. Leverage involves the use of various financial instruments or borrowed capital in an attempt to increase investment return. Leverage risks include potential for higher volatility, greater decline of the Fund’s net asset value and fluctuations of dividends and distributions paid by the Fund.
16 OPPENHEIMER FUNDAMENTAL ALTERNATIVES FUND
Share Class Performance
AVERAGE ANNUAL TOTAL RETURNS WITHOUT SALES CHARGE AS OF 10/30/15
| | | | | | | | | | | | | | | | |
| | | Inception Date | | | 1-Year | | | 5-Year | | | 10-Year | |
Class A (QVOPX) | | | 1/3/89 | | | | 3.18% | | | | 3.35% | | | | 3.69% | |
Class B (QOPBX) | | | 9/1/93 | | | | 2.40% | | | | 2.48% | | | | 3.18% | |
Class C (QOPCX) | | | 9/1/93 | | | | 2.39% | | | | 2.57% | | | | 2.91% | |
Class I (QOPIX) | | | 2/28/13 | | | | 3.62% | | | | 5.97% | * | | | N/A | |
Class R (QOPNX) | | | 3/1/01 | | | | 2.92% | | | | 3.05% | | | | 3.36% | |
Class Y (QOPYX) | | | 12/16/96 | | | | 3.43% | | | | 3.62% | | | | 3.94% | |
AVERAGE ANNUAL TOTAL RETURNS WITH SALES CHARGE AS OF 10/30/15
| | | | | | | | | | | | | | | | |
| | | Inception Date | | | 1-Year | | | 5-Year | | | 10-Year | |
Class A (QVOPX) | | | 1/3/89 | | | | -2.75% | | | | 2.14% | | | | 3.08% | |
Class B (QOPBX) | | | 9/1/93 | | | | -2.60% | | | | 2.12% | | | | 3.18% | |
Class C (QOPCX) | | | 9/1/93 | | | | 1.39% | | | | 2.57% | | | | 2.91% | |
Class I (QOPIX) | | | 2/28/13 | | | | 3.62% | | | | 5.97% | * | | | N/A | |
Class R (QOPNX) | | | 3/1/01 | | | | 2.92% | | | | 3.05% | | | | 3.36% | |
Class Y (QOPYX) | | | 12/16/96 | | | | 3.43% | | | | 3.62% | | | | 3.94% | |
* Shows performance since inception.
Performance data quoted represents past performance, which does not guarantee future results. The investment return and principal value of an investment in the Fund will fluctuate so that an investor’s shares, when redeemed, may be worth more or less than their original cost. Current performance may be lower or higher than the performance quoted. Returns do not consider capital gains or income taxes on an individual’s investment. For performance data current to the most recent month-end, visit oppenheimerfunds.com or call 1.800.CALL OPP (225.5677). Fund returns include changes in share price, reinvested distributions, and the applicable sales charge: for Class A shares, the current maximum initial sales charge of 5.75%; for Class B shares, the contingent deferred sales charge of 5% (1-year) and 2% (5-year); and for Class C shares, the contingent deferred sales charge (“CDSC”) of 1% for the 1-year period. Prior to 7/1/14, Class R shares were named Class N shares. Beginning 7/1/14, new purchases of Class R shares will no longer be subject to a CDSC upon redemption (any CDSC will remain in effect for purchases prior to 7/1/14). There is no sales charge for Class I and Class Y shares. Because Class B shares convert to Class A shares 72 months after purchase, the 10-year return for Class B shares uses Class A performance for the period after conversion.
The Fund’s performance is compared to the performance of the HFRX Global Hedge Fund Index, the S&P 500 Index and the HFRI Fund Weighted Composite Index. The Fund has changed its benchmarks from the S&P 500 Index and the HFRI Fund Weighted Composite Index to the HFRX Global Hedge Fund Index, which it believes is a more appropriate measure of the Fund’s performance. The HFRX Global Hedge Fund Index is designed to be representative of the overall composition of the hedge fund universe. It is comprised of all eligible hedge fund strategies; including but not limited to convertible arbitrage, distressed securities, equity hedge, equity market neutral, event driven, macro, merger arbitrage, and relative value arbitrage. The strategies are asset weighted based on the distribution of assets
17 OPPENHEIMER FUNDAMENTAL ALTERNATIVES FUND
in the hedge fund industry. The S&P 500 Index is a capitalization-weighted index of 500 stocks intended to be a representative sample of leading companies in leading industries within the U.S. economy. The HFRI Fund Weighted Composite Index is a global, equal-weighted index of over 2,000 single-manager funds that report to the HFR Database. Constituent funds report monthly net of all fees performance in U.S. Dollars and have a minimum of $50 million under management or a twelve (12) month track record of active performance. The HFRI Fund Weighted Composite Index’s returns are calculated three times each month and are subject to periodic recalculation by Hedge Fund Research, Inc. As a result, the HFRI Fund Weighted Composite Index returns shown may differ from the same Index’s returns for the same period published elsewhere. If subsequent recalculations cause the Index’s returns to change, the Fund does not expect to update the Index returns. The indices are unmanaged and cannot be purchased directly by investors. While index comparisons may be useful to provide a benchmark for the Fund’s performance, it must be noted that the Fund’s investments are not limited to the investments comprising the indices. Index performance includes reinvestment of income, but does not reflect transaction costs, fees, expenses or taxes. Index performance is shown for illustrative purposes only as a benchmark for the Fund’s performance, and does not predict or depict performance of the Fund. The Fund’s performance reflects the effects of the Fund’s business and operating expenses.
The Morningstar Multialternative Funds Category Average is the average return of the mutual funds within the investment category as defined by Morningstar. Returns include the reinvestment of distributions but do not consider sales charges. The Morningstar Multialternative Funds Category Average performance is shown for illustrative purposes only and does not predict or depict the performance of the Fund.
Morningstar ranking is for Class A shares and ranking may include more than one share class of funds in the category, including other share classes of this Fund. Ranking is based on total return as of 10/31/15, without considering sales charges. Different share classes may have different expenses and performance characteristics. Fund rankings are subject to change monthly. The Fund’s total-return percentile rank is relative to all funds that are in the Multialternative Funds Category. The highest (or most favorable) percentile rank is 1 and the lowest (or least favorable) percentile rank is 100. The top-performing fund in a category will always receive a rank of 1.
The Fund’s investment strategy and focus can change over time. The mention of specific fund holdings does not constitute a recommendation by OppenheimerFunds, Inc. or its affiliates.
Before investing in any of the Oppenheimer funds, investors should carefully consider a fund’s investment objectives, risks, charges and expenses. Fund prospectuses and summary prospectuses contain this and other information about the funds, and may be obtained by asking your financial advisor, visiting oppenheimerfunds.com, or calling 1.800.CALL OPP (225.5677). Read prospectuses and summary prospectuses carefully before investing.
Shares of Oppenheimer funds are not deposits or obligations of any bank, are not guaranteed by any bank, are not insured by the FDIC or any other agency, and involve investment risks, including the possible loss of the principal amount invested.
18 OPPENHEIMER FUNDAMENTAL ALTERNATIVES FUND
Fund Expenses
Fund Expenses. As a shareholder of the Fund, you incur two types of costs: (1) transaction costs, which may include sales charges (loads) on purchase payments and/or contingent deferred sales charges on redemptions; and (2) ongoing costs, including management fees; distribution and service fees; and other Fund expenses. These examples are intended to help you understand your ongoing costs (in dollars) of investing in the Fund and to compare these costs with the ongoing costs of investing in other mutual funds.
The examples are based on an investment of $1,000.00 invested at the beginning of the period and held for the entire 6-month period ended October 30, 2015.
Actual Expenses. The first section of the table provides information about actual account values and actual expenses. You may use the information in this section for the class of shares you hold, together with the amount you invested, to estimate the expense that you paid over the period. Simply divide your account value by $1,000.00 (for example, an $8,600.00 account value divided by $1,000.00 = 8.60), then multiply the result by the number in the first section under the heading entitled “Expenses Paid During 6 Months Ended October 30, 2015” to estimate the expenses you paid on your account during this period.
Hypothetical Example for Comparison Purposes. The second section of the table provides information about hypothetical account values and hypothetical expenses based on the Fund’s actual expense ratio for each class of shares, and an assumed rate of return of 5% per year for each class before expenses, which is not the Fund’s actual return. The hypothetical account values and expenses may not be used to estimate the actual ending account balance or expenses you paid for the period. You may use this information to compare the ongoing costs of investing in the Fund and other funds. To do so, compare this 5% hypothetical example for the class of shares you hold with the 5% hypothetical examples that appear in the shareholder reports of the other funds.
Please note that the expenses shown in the table are meant to highlight your ongoing costs only and do not reflect any transactional costs, such as front-end or contingent deferred sales charges (loads). Therefore, the “hypothetical” section of the table is useful in comparing ongoing costs only, and will not help you determine the relative total costs of owning different funds. In addition, if these transactional costs were included, your costs would have been higher.
19 OPPENHEIMER FUNDAMENTAL ALTERNATIVES FUND
| | | | | | | | | | | | |
| Actual | | Beginning
Account
Value
May 1, 2015 | | | Ending Account Value
October 30, 2015 | | | Expenses
Paid During
6 Months Ended
October 30, 2015 | |
| |
Class A | | $ | 1,000.00 | | | $ | 1,015.80 | | | $ | 10.36 | |
| |
Class B | | | 1,000.00 | | | | 1,011.70 | | | | 14.27 | |
| |
Class C | | | 1,000.00 | | | | 1,011.70 | | | | 14.17 | |
| |
Class I | | | 1,000.00 | | | | 1,018.00 | | | | 7.87 | |
| |
Class R | | | 1,000.00 | | | | 1,014.50 | | | | 11.63 | |
| |
Class Y | | | 1,000.00 | | | | 1,017.30 | | | | 8.99 | |
| | | |
| Hypothetical | | | | | | | | | |
| (5% return before expenses) | | | | | | | | | |
| |
Class A | | | 1,000.00 | | | | 1,014.84 | | | | 10.36 | |
| |
Class B | | | 1,000.00 | | | | 1,010.98 | | | | 14.27 | |
| |
Class C | | | 1,000.00 | | | | 1,011.08 | | | | 14.16 | |
| |
Class I | | | 1,000.00 | | | | 1,017.30 | | | | 7.87 | |
| |
Class R | | | 1,000.00 | | | | 1,013.59 | | | | 11.63 | |
| |
Class Y | | | 1,000.00 | | | | 1,016.19 | | | | 8.99 | |
Expenses are equal to the Fund’s annualized expense ratio for that class, multiplied by the average account value over the period, multiplied by 183/365 (to reflect the one-half year period). Those annualized expense ratios, excluding indirect expenses from affiliated funds, based on the 6-month period ended October 30, 2015 are as follows:
| | | | |
| Class | | Expense Ratios | |
| |
Class A | | | 2.04% | |
| |
Class B | | | 2.81 | |
| |
Class C | | | 2.79 | |
| |
Class I | | | 1.55 | |
| |
Class R | | | 2.29 | |
| |
Class Y | | | 1.77 | |
The expense ratios reflect voluntary and/or contractual waivers and/or reimbursements of expenses by the Fund’s Manager. Some of these undertakings may be modified or terminated at any time, as indicated in the Fund’s prospectus. The “Financial Highlights” tables in the Fund’s financial statements, included in this report, also show the gross expense ratios, without such waivers or reimbursements and reduction to custodian expenses, if applicable.
20 OPPENHEIMER FUNDAMENTAL ALTERNATIVES FUND
CONSOLIDATED STATEMENT OF INVESTMENTS October 30, 2015*
| | | | | | | | |
| | | Shares | | | Value | |
| |
Common Stocks—47.1% | | | | | |
| |
Consumer Discretionary—3.7% | | | | | | | | |
| |
Hotels, Restaurants & Leisure—0.8% | | | | | | | | |
| |
Brinker International, Inc. | | | 154,866 | | | $ | 7,047,950 | |
|
| |
Household Durables—0.0% | | | | | | | | |
| |
Everyware Global, Inc.1 | | | 8,735 | | | | 73,592 | |
|
| |
Media—1.3% | | | | | | | | |
| |
Cinemark Holdings, Inc. | | | 162,430 | | | | 5,756,519 | |
| |
DISH Network Corp., Cl. A1 | | | 101,895 | | | | 6,416,328 | |
| | | | | | | | |
| | | | | | | 12,172,847 | |
|
| |
Multiline Retail—1.6% | | | | | | | | |
| |
Macy’s, Inc. | | | 122,550 | | | | 6,247,599 | |
| |
Target Corp. | | | 116,730 | | | | 9,009,222 | |
| | | | | | | | |
| | | | | | | 15,256,821 | |
|
| |
Consumer Staples—2.7% | | | | | | | | |
| |
Beverages—0.7% | | | | | | | | |
| |
Coca-Cola Co. (The) | | | 142,880 | | | | 6,050,968 | |
|
| |
Tobacco—2.0% | | | | | | | | |
| |
Altria Group, Inc. | | | 193,091 | | | | 11,676,213 | |
| |
Philip Morris International, Inc. | | | 82,240 | | | | 7,270,016 | |
| | | | | | | | |
| | | | | | | 18,946,229 | |
|
| |
Energy—2.8% | | | | | | | | |
| |
Energy Equipment & Services—0.4% | | | | | | | | |
| |
Schlumberger Ltd. | | | 52,110 | | | | 4,072,918 | |
|
| |
Oil, Gas & Consumable Fuels—2.4% | | | | | | | | |
| |
Canadian Natural Resources Ltd. | | | 82,340 | | | | 1,909,260 | |
| |
Chevron Corp. | | | 44,730 | | | | 4,065,063 | |
| |
ConocoPhillips | | | 60,280 | | | | 3,215,938 | |
| |
EOG Resources, Inc. | | | 51,720 | | | | 4,440,162 | |
| |
Noble Energy, Inc. | | | 161,560 | | | | 5,790,310 | |
| |
Valero Energy Corp. | | | 39,450 | | | | 2,600,544 | |
| | | | | | | | |
| | | | | | | 22,021,277 | |
|
| |
Financials—8.6% | | | | | | | | |
| |
Commercial Banks—2.5% | | | | | | | | |
| |
Citigroup, Inc. | | | 112,230 | | | | 5,967,269 | |
| |
First Niagara Financial Group, Inc. | | | 266,030 | | | | 2,753,411 | |
| |
JPMorgan Chase & Co. | | | 108,260 | | | | 6,955,705 | |
| |
M&T Bank Corp. | | | 46,900 | | | | 5,620,965 | |
| |
Wells Fargo & Co. | | | 43,280 | | | | 2,343,179 | |
| | | | | | | | |
| | | | | | | 23,640,529 | |
|
| |
Insurance—2.8% | | | | | | | | |
| |
ACE Ltd. | | | 114,260 | | | | 12,973,080 | |
| |
Allstate Corp. (The) | | | 68,330 | | | | 4,228,261 | |
21 OPPENHEIMER FUNDAMENTAL ALTERNATIVES FUND
CONSOLIDATED STATEMENT OF INVESTMENTS Continued
| | | | | | | | |
| | | Shares | | | Value | |
| |
Insurance (Continued) | | | | | | | | |
| |
Unum Group | | | 266,460 | | | $ | 9,232,839 | |
| | | | | | | | |
| | | | | | | 26,434,180 | |
|
| |
Real Estate Investment Trusts (REITs)—3.3% | | | | | | | | |
| |
American Assets Trust, Inc. | | | 71,928 | | | | 3,032,484 | |
| |
Blackstone Mortgage Trust, Inc., Cl. A | | | 298,000 | | | | 8,200,960 | |
| |
Macerich Co. (The) | | | 55,680 | | | | 4,718,323 | |
| |
Starwood Property Trust, Inc. | | | 750,140 | | | | 15,070,313 | |
| | | | | | | | |
| | | | | | | 31,022,080 | |
|
| |
Health Care—7.6% | | | | | | | | |
| |
Biotechnology—0.5% | | | | | | | | |
| |
Baxalta, Inc. | | | 128,960 | | | | 4,443,961 | |
|
| |
Health Care Equipment & Supplies—0.3% | | | | | | | | |
| |
Medtronic plc | | | 42,988 | | | | 3,177,673 | |
|
| |
Health Care Providers & Services—2.7% | | | | | | | | |
| |
Express Scripts Holding Co.1 | | | 44,150 | | | | 3,813,677 | |
| |
HCA Holdings, Inc.1 | | | 23,650 | | | | 1,626,883 | |
| |
UnitedHealth Group, Inc. | | | 119,660 | | | | 14,093,555 | |
| |
Universal Health Services, Inc., Cl. B | | | 48,840 | | | | 5,962,876 | |
| | | | | | | | |
| | | | | | | 25,496,991 | |
|
| |
Pharmaceuticals—4.1% | | | | | | | | |
| |
Allergan plc1 | | | 27,980 | | | | 8,630,991 | |
| |
Merck & Co., Inc. | | | 168,920 | | | | 9,233,167 | |
| |
Novartis AG, ADR | | | 107,090 | | | | 9,684,149 | |
| |
Roche Holding AG | | | 38,455 | | | | 10,416,001 | |
| | | | | | | | |
| | | | | | | 37,964,308 | |
|
| |
Industrials—7.8% | | | | | | | | |
| |
Aerospace & Defense—4.6% | | | | | | | | |
| |
Honeywell International, Inc. | | | 176,690 | | | | 18,248,543 | |
| |
Lockheed Martin Corp. | | | 75,070 | | | | 16,502,638 | |
| |
Northrop Grumman Corp. | | | 44,060 | | | | 8,272,265 | |
| | | | | | | | |
| | | | | | | 43,023,446 | |
|
| |
Airlines—0.3% | | | | | | | | |
| |
United Continental Holdings, Inc.1 | | | 47,926 | | | | 2,890,417 | |
|
| |
Commercial Services & Supplies—1.6% | | | | | | | | |
| |
Republic Services, Inc., Cl. A | | | 241,510 | | | | 10,563,648 | |
| |
Tyco International plc | | | 124,980 | | | | 4,554,271 | |
| | | | | | | | |
| | | | | | | 15,117,919 | |
|
| |
Machinery—0.5% | | | | | | | | |
| |
Flowserve Corp. | | | 95,660 | | | | 4,434,798 | |
|
| |
Road & Rail—0.4% | | | | | | | | |
| |
Union Pacific Corp. | | | 44,360 | | | | 3,963,566 | |
22 OPPENHEIMER FUNDAMENTAL ALTERNATIVES FUND
| | | | | | | | |
| | | Shares | | | Value | |
| |
Trading Companies & Distributors—0.4% | | | | | | | | |
| |
AerCap Holdings NV1 | | | 88,671 | | | $ | 3,679,846 | |
|
| |
Information Technology—6.6% | | | | | | | | |
| |
Communications Equipment—2.8% | | | | | | | | |
| |
Juniper Networks, Inc. | | | 409,140 | | | | 12,842,904 | |
| |
QUALCOMM, Inc. | | | 169,400 | | | | 10,065,748 | |
| |
Telefonaktiebolaget LM Ericsson, Cl. B | | | 294,503 | | | | 2,863,637 | |
| | | | | | | | |
| | | | | | | 25,772,289 | |
|
| |
Internet Software & Services—1.9% | | | | | | | | |
| |
Alphabet, Inc., Cl. A1 | | | 23,550 | | | | 17,365,535 | |
|
| |
Semiconductors & Semiconductor Equipment—0.9% | | | | | | | | |
| |
Xilinx, Inc. | | | 179,840 | | | | 8,563,981 | |
|
| |
Technology Hardware, Storage & Peripherals—1.0% | | | | | | | | |
| |
Apple, Inc.2 | | | 82,096 | | | | 9,810,472 | |
|
| |
Materials—3.4% | | | | | | | | |
| |
Chemicals—2.4% | | | | | | | | |
| |
Celanese Corp., Series A, Cl. A | | | 95,480 | | | | 6,783,854 | |
| |
LyondellBasell Industries NV, Cl. A | | | 107,186 | | | | 9,958,651 | |
| |
Methanex Corp. | | | 141,980 | | | | 5,669,262 | |
| | | | | | | | |
| | | | | | | 22,411,767 | |
|
| |
Containers & Packaging—1.0% | | | | | | | | |
| |
Packaging Corp. of America | | | 55,530 | | | | 3,801,028 | |
| |
Sonoco Products Co. | | | 136,730 | | | | 5,837,004 | |
| | | | | | | | |
| | | | | | | 9,638,032 | |
|
| |
Telecommunication Services—1.9% | | | | | | | | |
| |
Diversified Telecommunication Services—1.9% | | | | | | | | |
| |
AT&T, Inc. | | | 79,660 | | | | 2,669,406 | |
| |
BCE, Inc. | | | 357,870 | | | | 15,463,563 | |
| | | | | | | | |
| | | | | | | 18,132,969 | |
|
| |
Utilities—2.0% | | | | | | | | |
| |
Electric Utilities—1.7% | | | | | | | | |
| |
Edison International | | | 144,140 | | | | 8,723,353 | |
| |
PPL Corp. | | | 215,804 | | | | 7,423,657 | |
| | | | | | | | |
| | | | | | | 16,147,010 | |
|
| |
Multi-Utilities—0.3% | | | | | | | | |
| |
CMS Energy Corp. | | | 69,030 | | | | 2,489,912 | |
| | | | | | | | |
Total Common Stocks (Cost $384,391,371) | | | | | | | 441,264,283 | |
|
| |
Preferred Stocks—2.4% | | | | | |
| |
M&T Bank Corp., 6.375% Cum., Series A, Non-Vtg. | | | 5,167 | | | | 5,944,633 | |
| |
M&T Bank Corp., 6.375% Cum., Series C, Non-Vtg. | | | 7,500 | | | | 8,640,000 | |
| |
U.S. Bancorp, 6% Non-Cum., Series G, Non-Vtg.3 | | | 300,000 | | | | 8,040,000 | |
| | | | | | | | |
Total Preferred Stocks (Cost $20,387,098) | | | | | | | 22,624,633 | |
23 OPPENHEIMER FUNDAMENTAL ALTERNATIVES FUND
CONSOLIDATED STATEMENT OF INVESTMENTS Continued
| | | | | | | | |
| | | Principal Amount | | | Value | |
| |
Asset-Backed Securities—8.3% | | | | | |
| |
Airspeed Ltd.: | | | | | | | | |
Series 2007-1A, Cl. G1, 0.466%, 6/15/323,4 | | $ | 23,551,726 | | | $ | 19,076,898 | |
Series 2007-1A, Cl. G2, 0.476%, 6/15/323,4 | | | 6,771,121 | | | | 5,620,031 | |
| |
Blade Engine Securitization Ltd., Series 2006-1AW, Cl. A1, 0.496%, 9/15/413,4 | | | 28,486,836 | | | | 20,581,739 | |
| |
GSAMP Trust, Series 2005-HE4, Cl. M3, 0.717%, 7/25/453 | | | 3,300,000 | | | | 2,728,025 | |
| |
New Century Home Equity Loan Trust, Series 2005-2, Cl. M3, 0.687%, 6/25/353 | | | 5,500,000 | | | | 4,547,608 | |
| |
Park Place Securities, Inc., Series 2005-WCW3, Cl. M1, 0.677%, 8/25/353 | | | 5,000,000 | | | | 4,692,447 | |
| |
RAMP Trust, Series 2006-EFC1, Cl. M2, 0.597%, 2/25/363 | | | 5,490,000 | | | | 4,549,447 | |
| |
Saxon Asset Securities Trust, Series 2007-3, Cl. 2A4, 0.687%, 9/25/473 | | | 7,595,000 | | | | 5,156,619 | |
| |
Structured Asset Securities Corp. Mortgage Loan Trust, Series 2007-GEL2, Cl. A2, 0.517%, 5/25/373,5 | | | 11,702,375 | | | | 10,744,620 | |
| | | | | | | | |
Total Asset-Backed Securities (Cost $72,229,069) | | | | | | | 77,697,434 | |
|
| |
Mortgage-Backed Obligations—5.0% | | | | | |
| |
Ameriquest Mortgage Securities, Inc., Series 2004-R2, Cl. M1, 0.842%, 4/25/343 | | | 3,558,338 | | | | 2,999,267 | |
| |
Asset-Backed Funding Certificates Trust, Series 2005-HE2, Cl. M3, 0.977%, 6/25/353 | | | 4,000,000 | | | | 3,704,926 | |
| |
Bear Stearns Asset Backed Securities I Trust, Series 2004-HE9, Cl. M2, 1.997%, 11/25/343 | | | 5,373,975 | | | | 4,880,010 | |
| |
First NLC Trust, Series 2005-4, Cl. A4, 0.587%, 2/25/363 | | | 11,003,000 | | | | 9,566,891 | |
| |
Home Equity Asset Trust, Series 2005-5, Cl. M2, 0.707%, 11/25/353 | | | 1,888,088 | | | | 1,814,292 | |
| |
Home Equity Mortgage Loan Asset-Backed Trust, Series 2005-B, Cl. M3, 0.687%, 8/25/353 | | | 1,298,061 | | | | 1,193,698 | |
| |
MASTR Adjustable Rate Mortgages Trust, Series 2004-13, Cl. 2A2, 2.734%, 4/21/343 | | | 544,506 | | | | 556,719 | |
| |
RAMP Trust: | | | | | | | | |
Series 2005-RS2, Cl. M4, 0.917%, 2/25/353 | | | 4,469,000 | | | | 4,033,075 | |
Series 2005-RS6, Cl. M2, 0.707%, 6/25/353 | | | 944,044 | | | | 926,885 | |
Series 2006-NC3, Cl. A3, 0.467%, 3/25/363 | | | 16,698,000 | | | | 14,046,696 | |
| |
Structured Asset Securities Corp. Mortgage Loan Trust, Series 2007-GEL2, Cl. A3, 0.647%, 5/25/373,5 | | | 4,486,000 | | | | 3,582,609 | |
| | | | | | | | |
Total Mortgage-Backed Obligations (Cost $36,335,348) | | | | | | | 47,305,068 | |
|
| |
Non-Convertible Corporate Bonds and Notes—2.8% | | | | | |
| |
Goldman Sachs Capital II, 4% Jr. Sub. Perpetual Bonds3,6 | | | 999,000 | | | | 721,777 | |
| |
Lukoil International Finance BV, 6.125% Sr. Unsec. Nts., 11/9/205 | | | 14,000,000 | | | | 14,525,000 | |
| |
Wachovia Capital Trust III, 5.57% Jr. Sub. Perpetual Bonds3,6 | | | 11,000,000 | | | | 10,815,750 | |
| | | | | | | | |
Total Non-Convertible Corporate Bonds and Notes (Cost $25,042,805) | | | | | | | 26,062,527 | |
|
| |
Convertible Corporate Bond and Note—0.3% | | | | | |
| |
SEACOR Holdings, Inc., 2.50% Cv. Sr. Unsec. Nts., 12/15/27 (Cost $3,430,073) | | | 3,450,000 | | | | 3,324,938 | |
24 OPPENHEIMER FUNDAMENTAL ALTERNATIVES FUND
| | | | | | | | |
| | | Principal Amount | | | Value | |
| |
Corporate Loans—14.0% | | | | | |
| |
Consumer Discretionary—4.4% | | | | | | | | |
| |
Auto Components—0.2% | | | | | | | | |
| |
Affinia Group, Inc., Sr. Sec. Credit Facilities 1st Lien Term Loan, Tranche B2, 4.75%, 4/25/203 | | $ | 249,394 | | | $ | 249,780 | |
| |
Cooper Standard, Sr. Sec. Credit Facilities 1st Lien Term Loan, Tranche B, 4.00%, 3/26/213,7 | | | 249,684 | | | | 247,864 | |
| |
Fleetpride, Inc., Sr. Sec. Credit Facilities 1st Lien Term Loan, 5.25%, 11/19/193,7 | | | 160,000 | | | | 152,533 | |
| |
FleetPride, Inc., Sr. Sec. Credit Facilities 1st Lien Term Loan, 5.25%, 11/19/193 | | | 381,462 | | | | 363,661 | |
| |
Remy International, Inc., Sr. Sec. Credit Facilities 1st Lien Term Loan, Tranche B, 4.25%, 3/5/203 | | | 37,091 | | | | 37,149 | |
| |
Tower Automotive Holdings USA LLC, Sr. Sec. Credit Facilities 1st Lien Term Loan, Tranche B, 4.00%, 4/23/203 | | | 263,432 | | | | 261,675 | |
| |
Transtar Holding Co., Sr. Sec. Credit Facilities 1st Lien Term Loan, 5.75%, 10/9/183 | | | 234,652 | | | | 220,573 | |
| | | | | | | | |
| | | | | | | 1,533,235 | |
|
| |
Automobiles—0.1% | | | | | | | | |
| |
Federal-Mogul Holdings Corp., Sr. Sec. Credit Facilities 1st Lien Term Loan: | | | | | | | | |
Tranche B, 4.00%, 4/3/183,7 | | | 125,000 | | | | 115,234 | |
Tranche C, 4.75%, 4/15/213 | | | 805,488 | | | | 738,532 | |
| | | | | | | | |
| | | | | | | 853,766 | |
|
| |
Distributors—0.3% | | | | | | | | |
| |
Ascena Retail Group, Inc., Sr. Sec. Credit Facilities 1st Lien Term Loan, 5.25%, 7/29/223 | | | 575,000 | | | | 553,078 | |
| |
Bass Pro Group LLC, Sr. Sec. Credit Facilities 1st Lien Term Loan, Tranche B, 4.00%, 6/5/203 | | | 283,575 | | | | 282,039 | |
| |
BJ’s Wholesale Club, Inc., Sr. Sec. Credit Facilities 1st Lien Term Loan, Tranche B, 4.50%, 9/26/193 | | | 422,740 | | | | 419,012 | |
| |
Capital Automotive LP, Sr. Sec. Credit Facilities 1st Lien Term Loan, Tranche B, 4.00%, 4/10/193 | | | 67,753 | | | | 67,868 | |
| |
Capital Automotive LP, Sr. Sec. Credit Facilities 2nd Lien Term Loan, 6.00%, 4/30/203 | | | 596,672 | | | | 599,655 | |
| |
Gymboree Corp. (The), Sr. Sec. Credit Facilities 1st Lien Term Loan, 5.00%, 2/23/183 | | | 190,512 | | | | 124,627 | |
| |
Leslie’s Poolmart, Inc., Sr. Sec. Credit Facilities 1st Lien Term Loan, Tranche B, 4.25%, 10/16/193 | | | 227,165 | | | | 224,042 | |
| |
PetSmart, Inc., Sr. Sec. Credit Facilities 1st Lien Term Loan, Tranche B, 4.25%, 3/11/223 | | | 496,981 | | | | 497,711 | |
| |
Staples, Inc., Sr. Sec. Credit Facilities 1st Lien Term Loan, Tranche B, 3.50%, 4/24/213,7 | | | 560,000 | | | | 558,040 | |
| | | | | | | | |
| | | | | | | 3,326,072 | |
|
| |
Diversified Consumer Services—0.4% | | | | | | | | |
| |
4L Technologies, Inc., Sr. Sec. Credit Facilities 1st Lien Term Loan, 5.50%-6.75%, 5/8/203 | | | 149,688 | | | | 142,203 | |
| |
Affinion Group, Inc., Sr. Sec. Credit Facilities 1st Lien Term Loan, Tranche B, 6.75%, 4/30/183 | | | 474,998 | | | | 457,384 | |
| |
Interactive Data Corp., Sr. Sec. Credit Facilities 1st Lien Term Loan, Tranche B, 4.75%, 4/23/213 | | | 895,860 | | | | 896,790 | |
25 OPPENHEIMER FUNDAMENTAL ALTERNATIVES FUND
CONSOLIDATED STATEMENT OF INVESTMENTS Continued
| | | | | | | | | | |
| | | Principal Amount | | | | | Value | |
| Diversified Consumer Services (Continued) | | | | | | | | | | |
| IQOR US, Inc., Sr. Sec. Credit Facilities 1st Lien Term Loan, Tranche B, 6.00%, 4/1/213 | | $ | 319,584 | | | $ | | | 258,863 | |
| IQOR US, Inc., Sr. Sec. Credit Facilities 2nd Lien Term Loan, 9.75%, 4/1/223 | | | 89,964 | | | | | | 69,947 | |
| Koosharem LLC, Sr. Sec. Credit Facilities 1st Lien Exit Term Loan, 7.50%, 5/15/203,7 | | | 534,726 | | | | | | 525,368 | |
| Laureate Education, Inc., Sr. Sec. Credit Facilities 1st Lien Term Loan, Tranche B, 5.00%, 6/15/183 | | | 520,914 | | | | | | 449,940 | |
| Nord Anglia Education Finance, Sr. Sec. Credit Facilities 1st Lien Term Loan, Tranche B, 5.00%, 3/31/213,7 | | | 694,126 | | | | | | 678,508 | |
| ServiceMaster Co. LLC (The), Sr. Sec. Credit Facilities 1st Lien Term Loan, Tranche B, 4.25%, 7/1/213 | | | 374,783 | | | | | | 375,345 | |
| | | | | | | | | 3,854,348 | |
| | | | | | | | | | | |
| Hotels, Restaurants & Leisure—0.8% | | | | | | | | | | |
| Amaya Gaming, Sr. Sec. Credit Facilities 1st Lien Term Loan, 5.00%, 7/29/213 | | | 457,306 | | | | | | 447,969 | |
| American Casino & Entertainment Properties, Sr. Sec. Credit Facilities 1st Lien Term Loan, 5.00%, 7/7/223 | | | 99,750 | | | | | | 100,124 | |
| Bowlmor AMF, Sr. Sec. Credit Facilities 1st Lien Term Loan, Tranche B, 7.25%, 9/20/213 | | | 223,035 | | | | | | 222,199 | |
| Caesars Entertainment Operating Co., Inc., Extended Sr. Sec. Credit Facilities 1st Lien Term Loan, Tranche B5, 1.50%, 3/1/173,8 | | | 146,278 | | | | | | 132,162 | |
| Caesars Entertainment Operating Co., Inc., Sr. Sec. Credit Facilities 1st Lien Term Loan: | | | | | | | | | | |
| Tranche B4, 1.50%, 10/31/163,8 | | | 65,614 | | | | | | 60,488 | |
| Tranche B6, 1.50%, 3/1/173,7,8 | | | 306,497 | | | | | | 281,211 | |
| Tranche B7, 1.50%, 1/29/183,8 | | | 372,725 | | | | | | 334,288 | |
| Caesars Entertainment Resort Properties LLC, Sr. Sec. Credit Facilities 1st Lien Term Loan, Tranche B, 7.00%, 10/11/203 | | | 898,040 | | | | | | 855,383 | |
| Caesars Growth Properties Holdings LLC, Sr. Sec. Credit Facilities 1st Lien Term Loan, 6.25%, 5/10/213 | | | 414,410 | | | | | | 368,048 | |
| CEC Entertainment, Inc., Sr. Sec. Credit Facilities Term Loan, Tranche B, 4.00%, 2/14/213 | | | 263,982 | | | | | | 256,227 | |
| Cinemark USA, Inc., Sr. Sec. Credit Facilities 1st Lien Term Loan, 3.19%-3.32%, 5/6/223 | | | 24,872 | | | | | | 24,976 | |
| Corner Investment Propco LLC, Sr. Sec. Credit Facilities 1st Lien Term Loan, 11.00%, 11/2/193 | | | 289,960 | | | | | | 284,161 | |
| Del Monte Foods Co., Inc., Sr. Sec. Credit Facilities 1st Lien Term Loan, 4.25%-5.50%, 2/18/213 | | | 306,573 | | | | | | 300,250 | |
| Eldorado Resorts, Inc., Sr. Sec. Credit Facilities 1st Lien Term Loan, Tranche B, 4.25%, 7/25/223 | | | 204,488 | | | | | | 204,741 | |
| Equinox Holdings, Inc., Sr. Sec. Credit Facilities 1st Lien Term Loan, Tranche B, 5.00%, 1/31/203 | | | 326,103 | | | | | | 326,986 | |
| Golden Nugget, Inc., Sr. Sec. Credit Facilities 1st Lien Term Loan, 5.50%, 11/21/193,7 | | | 258,175 | | | | | | 259,595 | |
| Golden Nugget, Inc., Sr. Sec. Credit Facilities 1st Lien Term Loan, Delayed Draw, Tranche B, 5.50%, 11/21/193 | | | 195,662 | | | | | | 196,738 | |
| Jacobs Entertainment, Inc., Sr. Sec. Credit Facilities 1st Lien Term Loan, 5.25%, 10/29/183 | | | 271,831 | | | | | | 269,792 | |
| La Quinta Intermediate Holdings LLC, Sr. Sec. Credit Facilities 1st Lien Term Loan, Tranche B, 4.00%, 4/14/213 | | | 125,787 | | | | | | 124,883 | |
26 OPPENHEIMER FUNDAMENTAL ALTERNATIVES FUND
| | | | | | | | | | | | |
| | | Principal Amount | | | | | | Value | |
Hotels, Restaurants & Leisure (Continued) | | | | | | | | | | | | |
Landry’s, Inc., Sr. Sec. Credit Facilities 1st Lien Term Loan, Tranche B, 4.00%, 4/24/183 | | $ | 216,993 | | | $ | | | | | 217,500 | |
Peninsula Gaming LLC, Sr. Sec. Credit Facilities 1st Lien Term Loan, Tranche B, 4.25%, 11/20/173 | | | 249,176 | | | | | | | | 249,301 | |
Pinnacle Operating Corp., Sr. Sec. Credit Facilities 1st Lien Term Loan, Tranche B, 4.75%, 11/15/183 | | | 428,477 | | | | | | | | 425,263 | |
Regal Cinemas Corp., Sr. Sec. Credit Facilities 1st Lien Term Loan, 3.75%, 4/1/223 | | | 55,050 | | | | | | | | 55,256 | |
Revel Entertainment, Inc., Sr. Sec. Credit Facilities 2nd Lien Exit Term Loan, 14.50%, 5/20/183,9,12 | | | 280,573 | | | | | | | | 1,403 | |
Scientific Games International, Inc., Sr. Sec. Credit Facilities 1st Lien Term Loan: | | | | | | | | | | | | |
Tranche B1, 6.00%, 10/18/203 | | | 111,791 | | | | | | | | 109,520 | |
Tranche B2, 6.00%, 10/1/213 | | | 295,631 | | | | | | | | 289,487 | |
SeaWorld Parks & Entertainment, Inc., Sr. Sec. Credit Facilities 1st Lien Term Loan, Tranche B3, 4.00%, 5/14/203 | | | 97,998 | | | | | | | | 95,956 | |
US Foods, Inc., Sr. Sec. Credit Facilities 1st Lien Term Loan, Tranche B, 4.50%, 3/31/193 | | | 685,604 | | | | | | | | 686,601 | |
Weight Watchers International, Inc., Sr. Sec. Credit Facilities 1st Lien Term Loan, 4.00%, 4/2/203,7 | | | 644,586 | | | | | | | | 503,314 | |
| | | | | | | | | | | 7,683,822 | |
| | | | | | | | | | | | | |
Household Durables—0.1% | | | | | | | | | | | | |
SRAM LLC, Sr. Sec. Credit Facilities 1st Lien Term Loan, 4.00%- 5.25%, 4/10/203 | | | 348,654 | | | | | | | | 329,478 | |
Sun Products Corp. (The), Sr. Sec. Credit Facilities 1st Lien Term Loan, Tranche B, 5.50%, 3/23/203 | | | 405,479 | | | | | | | | 392,977 | |
Wilton Brands LLC, Sr. Sec. Credit Facilities 1st Lien Term Loan, 7.25%, 8/30/183 | | | 165,258 | | | | | | | | 160,920 | |
| | | | | | | | | | | 883,375 | |
| | | | | | | | | | | | | |
Internet & Catalog Retail—0.0% | | | | | | | | | | | | |
Camping World, Sr. Sec. Credit Facilities 1st Lien Term Loan, 5.25%, 2/20/203 | | | 368,068 | | | | | | | | 368,298 | |
| | | | | | | | | | | | | |
Leisure Products—0.2% | | | | | | | | | | | | |
Boyd Gaming Corp., Sr. Sec. Credit Facilities 1st Lien Term Loan, Tranche B, 4.00%, 8/14/203,7 | | | 332,813 | | | | | | | | 333,411 | |
Hilton Worldwide, Inc., Sr. Sec. Credit Facilities 1st Lien Term Loan, 3.50%, 10/26/203 | | | 125,452 | | | | | | | | 125,853 | |
Intrawest Operations Group LLC, Sr. Sec. Credit Facilities 1st Lien Term Loan, Tranche B, 4.75%, 12/9/203 | | | 258,113 | | | | | | | | 258,113 | |
Pinnacle Entertainment, Inc., Sr. Sec. Credit Facilities 1st Lien Term Loan, Tranche B2, 3.75%, 8/13/203 | | | 118,750 | | | | | | | | 118,749 | |
Playa Resorts Holding BV, Sr. Sec. Credit Facilities 1st Lien Term Loan, Tranche B, 4.00%, 8/9/193 | | | 185,220 | | | | | | | | 183,020 | |
Station Casinos LLC, Sr. Sec. Credit Facilities 1st Lien Term Loan, Tranche B, 4.25%, 3/2/203 | | | 698,457 | | | | | | | | 699,330 | |
| | | | | | | | | | | 1,718,476 | |
27 OPPENHEIMER FUNDAMENTAL ALTERNATIVES FUND
| | | | |
| CONSOLIDATED STATEMENT OF INVESTMENTS Continued | | |
| | | | | | | | | | | | |
| | | Principal Amount | | | | | | Value | |
Media—2.0% | | | | | | | | | | | | |
| Alpha Media Group, Inc., Sr. Sec. Credit Facilities Term Loan, Tranche B, 3.50%, 7/15/163,9,12 | | $ | 216,064 | | | $ | | | | | 22 | |
| Altice Financing SA, Sr. Sec. Credit Facilities 1st Lien Term Loan, Delayed Draw, 5.50%, 7/2/193 | | | 670,807 | | | | | | | | 673,407 | |
| Ancestry.com, Inc., Sr. Sec. Credit Facilities 1st Lien Term Loan, Tranche B, 5.00%, 8/29/223,7 | | | 40,000 | | | | | | | | 40,067 | |
| Catalina Marketing, Sr. Sec. Credit Facilities 1st Lien Term Loan, 4.50%, 4/1/213,7 | | | 372,285 | | | | | | | | 321,096 | |
| Catalina Marketing, Sr. Sec. Credit Facilities 2nd Lien Term Loan, 7.75%, 4/11/223 | | | 179,928 | | | | | | | | 119,238 | |
| CCO Safari III LLC, Sr. Sec. Credit Facilities 1st Lien Term Loan, Tranche I, 3.50%, 1/23/233 | | | 575,000 | | | | | | | | 575,180 | |
| Cinram International, Inc., Sr. Sec. Credit Facilities 2nd Lien Term Loan, 0.432%, 8/3/493,9,12 | | | 39,438 | | | | | | | | 100 | |
| Clear Channel Communications, Inc., Extended Sr. Sec. Credit Facilities 1st Lien Term Loan, Tranche D, 6.944%, 1/30/193,7 | | | 1,322,176 | | | | | | | | 1,111,100 | |
| Clear Channel Communications, Inc., Sr. Sec. Credit Facilities 1st Lien Term Loan, Tranche E, 7.694%, 7/30/193 | | | 57,373 | | | | | | | | 48,767 | |
| CSC Holdings LLC, Sr. Sec. Credit Facilities 1st Lien Term Loan, Tranche B, 5.00%, 9/25/223,7 | | | 1,000,000 | | | | | | | | 1,004,625 | |
| Cumulus Media Holdings, Inc., Sr. Sec. Credit Facilities 1st Lien Term Loan, Tranche B, 4.25%, 12/18/203 | | | 66,712 | | | | | | | | 56,914 | |
| Deluxe Entertainment Services, Sr. Sec. Credit Facilities 1st Lien Term Loan, Tranche B, 6.50%, 2/26/203 | | | 634,660 | | | | | | | | 593,407 | |
| Endemol, Sr. Sec. Credit Facilities 1st Lien Term Loan, 6.75%, 8/11/213,7 | | | 623,035 | | | | | | | | 600,710 | |
| Formula One, Sr. Sec. Credit Facilities 1st Lien Term Loan, Tranche B, 4.75%, 7/30/213 | | | 512,240 | | | | | | | | 504,620 | |
| Getty Images, Inc., Sr. Sec. Credit Facilities 1st Lien Term Loan, Tranche B, 4.75%, 10/18/193,7 | | | 179,480 | | | | | | | | 120,551 | |
| Gray Television, Inc., Sr. Sec. Credit Facilities 1st Lien Term Loan, 3.75%, 6/10/213 | | | 192,026 | | | | | | | | 191,886 | |
| Harland Clarke Holdings Corp., Sr. Sec. Credit Facilities 1st Lien Term Loan, 6.00%, 8/4/193,7 | | | 525,976 | | | | | | | | 524,494 | |
| Hoyts Group, Sr. Sec. Credit Facilities 1st Lien Term Loan, Tranche B, 4.00%, 5/29/203 | | | 41,383 | | | | | | | | 41,306 | |
| IMG Worldwide, Inc., Sr. Sec. Credit Facilities 1st Lien Term Loan, 5.25%, 5/6/213 | | | 443,731 | | | | | | | | 443,729 | |
| Intelsat Jackson Holdings SA, Sr. Sec. Credit Facilities 1st Lien Term Loan, Tranche B2, 3.75%, 6/30/193 | | | 4,350,000 | | | | | | | | 4,224,259 | |
| Internet Brands, Sr. Sec. Credit Facilities 1st Lien Term Loan, 4.75%, 6/30/213,7 | | | 325,181 | | | | | | | | 322,641 | |
| ION Media Networks, Inc., Sr. Sec. Credit Facilities 1st Lien Term Loan, Tranche B, 4.75%, 12/18/203,7 | | | 592,592 | | | | | | | | 590,863 | |
| Media General, Inc., Sr. Sec. Credit Facilities 1st Lien Term Loan, 4.00%-4.25%, 7/30/203,7 | | | 554,592 | | | | | | | | 553,896 | |
| Mergermarket USA, Inc., Sr. Sec. Credit Facilities 1st Lien Term Loan, 4.50%, 2/4/213 | | | 268,826 | | | | | | | | 260,761 | |
| Merrill Communications LLC, Sr. Sec. Credit Facilities 1st Lien Term Loan, 6.25%, 6/1/223 | | | 442,339 | | | | | | | | 434,598 | |
| NEP/NCP Holdco, Inc., Sr. Sec. Credit Facilities 1st Lien Term Loan, Tranche B, 4.25%, 1/22/203 | | | 598,556 | | | | | | | | 576,110 | |
28 OPPENHEIMER FUNDAMENTAL ALTERNATIVES FUND
| | | | | | | | | | | | |
| | | Principal Amount | | | | | | Value | |
Media (Continued) | | | | | | | | | | | | |
Numericable US LLC, Sr. Sec. Credit Facilities 1st Lien Term Loan, Tranche B, 4.00%, 7/29/223,7 | | $ | 410,000 | | | $ | | | | | 404,576 | |
Penton Business Media, Inc., Sr. Sec. Credit Facilities 1st Lien Term Loan, 5.00%, 10/3/193,7 | | | 521,933 | | | | | | | | 519,323 | |
Project Sunshine IV Pty Ltd., Sr. Sec. Credit Facilities 1st Lien Term Loan, Tranche B, 8.00%, 9/23/193 | | | 61,115 | | | | | | | | 60,733 | |
Salem Communications Corp., Sr. Sec. Credit Facilities 1st Lien Term Loan, Tranche B, 4.50%, 3/13/203 | | | 85,966 | | | | | | | | 85,464 | |
SuperMedia, Inc., Sr. Sec. Credit Facilities 1st Lien Term Loan, 11.60%, 12/30/163 | | | 180,954 | | | | | | | | 94,775 | |
Technicolor, Sr. Sec. Credit Facilities 1st Lien Term Loan, Tranche B, 5.00%, 7/11/203,7 | | | 739,506 | | | | | | | | 739,047 | |
Tribune Co., Sr. Sec. Credit Facilities 1st Lien Term Loan, Tranche B, 3.75%, 12/27/203 | | | 575,517 | | | | | | | | 575,150 | |
Univision Communications, Inc., Sr. Sec. Credit Facilities 1st Lien Term Loan: | | | | | | | | | | | | |
Tranche C2, 4.00%, 3/1/203 | | | 48,642 | | | | | | | | 48,380 | |
Tranche C4, 4.00%, 3/1/203 | | | 941,560 | | | | | | | | 935,806 | |
WaveDivision Holdings LLC, Sr. Sec. Credit Facilities 1st Lien Term Loan, 4.00%, 10/12/193 | | | 401,752 | | | | | | | | 401,413 | |
Yankee Cable Acquisition LLC, Sr. Sec. Credit Facilities 1st Lien Term Loan, Tranche B, 4.25%, 3/1/203 | | | 443,500 | | | | | | | | 441,975 | |
YP LLC, Sr. Sec. Credit Facilities 1st Lien Term Loan, Tranche B, 8.00%, 6/4/183 | | | 120,242 | | | | | | | | 119,039 | |
| | | | | | | | | | | 18,360,028 | |
| | | | | | | | | | | | | |
Multiline Retail—0.1% | | | | | | | | | | | | |
J.C. Penney Corp., Inc., Sr. Sec. Credit Facilities 1st Lien Term Loan, 6.00%, 5/22/183 | | | 530,790 | | | | | | | | 529,795 | |
J.C. Penney Corp., Inc., Sr. Sec. Credit Facilities 1st Lien Term Loan, 5.00%, 6/14/193 | | | 161,245 | | | | | | | | 160,740 | |
Neiman Marcus, Sr. Sec. Credit Facilities Term Loan, 4.25%, 10/25/203 | | | 779,522 | | | | | | | | 761,806 | |
| | | | | | | | | | | 1,452,341 | |
| | | | | | | | | | | | | |
Specialty Retail—0.2% | | | | | | | | | | | | |
Burlington Coat Factory Warehouse Corp., Sr. Sec. Credit Facilities 1st Lien Term Loan, 4.25%, 8/13/213 | | | 523,208 | | | | | | | | 524,562 | |
Harbor Freight Tools USA, Inc., Sr. Sec. Credit Facilities 1st Lien Term Loan, Tranche B, 4.75%, 7/26/193 | | | 482,687 | | | | | | | | 485,050 | |
Key Safety Systems, Inc., Sr. Sec. Credit Facilities 1st Lien Term Loan, 4.75%, 8/30/213 | | | 270,484 | | | | | | | | 268,117 | |
National Vision, Sr. Sec. Credit Facilities 1st Lien Term Loan, Tranche B, 4.00%, 3/5/213 | | | 184,084 | | | | | | | | 176,836 | |
| | | | | | | | | | | 1,454,565 | |
| | | | | | | | | | | | | |
Consumer Staples—0.4% | | | | | | | | | | | | |
Beverages—0.1% | | | | | | | | | | | | |
Burger King, Sr. Sec. Credit Facilities 1st Lien Term Loan, Tranche B2, 3.75%, 12/10/213 | | | 457,333 | | | | | | | | 458,068 | |
Hostess Brands LLC, Sr. Sec. Credit Facilities 1st Lien Term Loan, 4.50%, 8/3/223 | | | 495,000 | | | | | | | | 496,544 | |
| | | | | | | | | | | 954,612 | |
29 OPPENHEIMER FUNDAMENTAL ALTERNATIVES FUND
| | | | |
| CONSOLIDATED STATEMENT OF INVESTMENTS Continued | | |
| | | | | | | | | | | | |
| | | Principal Amount | | | | | | Value | |
Food & Staples Retailing—0.1% | | | | | | | | | | | | |
Albertsons Holdings LLC, Sr. Sec. Credit Facilities 1st Lien Term Loan: | | | | | | | | | | | | |
Tranche B2, 5.375%, 3/21/193 | | $ | 443,626 | | | $ | | | | | 443,737 | |
Tranche B4, 5.50%, 8/25/213 | | | 443,524 | | | | | | | | 444,106 | |
New Albertsons, Inc., Sr. Sec. Credit Facilities 1st Lien Term Loan, Tranche B, 4.75%, 6/25/213 | | | 320,145 | | | | | | | | 318,984 | |
Rite Aid Corp., Sr. Sec. Credit Facilities 2nd Lien Term Loan, Tranche 1, 5.75%, 8/21/203 | | | 63,202 | | | | | | | | 63,834 | |
| | | | | | | | | | | 1,270,661 | |
| | | | | | | | | | | | | |
Food Products—0.2% | | | | | | | | | | | | |
AdvancePierre Foods, Inc., Sr. Sec. Credit Facilities 1st Lien Term Loan, Tranche B, 5.75%, 7/10/173 | | | 338,131 | | | | | | | | 338,850 | |
CSM Bakery Supplies, Sr. Sec. Credit Facilities 1st Lien Term Loan, Tranche B, 5.00%, 7/3/203 | | | 518,456 | | | | | | | | 514,179 | |
CSM Bakery Supplies, Sr. Sec. Credit Facilities 2nd Lien Term Loan, 8.75%, 7/5/213 | | | 49,896 | | | | | | | | 47,277 | |
Dole Food Co., Inc., Sr. Sec. Credit Facilities 1st Lien Term Loan, 4.50%-5.75%, 11/1/183,7 | | | 544,248 | | | | | | | | 545,041 | |
JBS USA LLC, Sr. Sec. Credit Facilities 1st Lien Term Loan, Tranche B, 3.75%, 9/18/203 | | | 296,352 | | | | | | | | 296,463 | |
Performance Food Group, Inc., Sr. Sec. Credit Facilities 2nd Lien Term Loan, 6.25%, 11/14/193,7 | | | 241,464 | | | | | | | | 242,117 | |
| | | | | | | | | | | 1,983,927 | |
| | | | | | | | | | | | | |
Energy—0.2% | | | | | | | | | | | | |
Energy Equipment & Services—0.2% | | | | | | | | | | | | |
American Energy-Marcellus LLC, Sr. Sec. Credit Facilities 1st Lien Term Loan, 5.25%, 8/4/203 | | | 288,584 | | | | | | | | 136,115 | |
Ameriforge Group, Inc., Sr. Sec. Credit Facilities 1st Lien Term Loan, 5.00%, 12/19/193 | | | 110,149 | | | | | | | | 76,554 | |
ExGen Texas Power LLC, Sr. Sec. Credit Facilities 1st Lien Term Loan, Tranche B, 5.75%, 9/20/213 | | | 316,127 | | | | | | | | 263,176 | |
MEG Energy Corp., Sr. Sec. Credit Facilities 1st Lien Term Loan, Tranche B, 3.75%, 3/31/203,7 | | | 70,000 | | | | | | | | 65,986 | |
NFR Energy LLC, Sr. Sec. Credit Facilities 2nd Lien Term Loan, 8.75%, 12/31/183,9 | | | 205,632 | | | | | | | | 24,162 | |
Offshore Group Investment Ltd., Sr. Sec. Credit Facilities 1st Lien Term Loan: | | | | | | | | | | | | |
Tranche B, 5.00%, 10/25/173 | | | 160,021 | | | | | | | | 46,406 | |
Tranche B, 5.75%, 3/28/193 | | | 125,008 | | | | | | | | 37,294 | |
ProPetro Services, Inc., Sr. Sec. Credit Facilities 1st Lien Term Loan, Tranche B, 7.25%, 9/30/193 | | | 273,521 | | | | | | | | 175,053 | |
Templar Energy LLC, Sr. Sec. Credit Facilities 2nd Lien Term Loan, 8.50%, 11/25/203 | | | 396,494 | | | | | | | | 174,457 | |
TPF II Power LLC, Sr. Sec. Credit Facilities 1st Lien Term Loan, Tranche B, 5.50%, 10/4/213 | | | 525,217 | | | | | | | | 525,600 | |
| | | | | | | | | | | 1,524,803 | |
| | | | | | | | | | | | | |
Oil, Gas & Consumable Fuels—0.0% | | | | | | | | | | | | |
Southcross Energy Partners LP, Sr. Sec. Credit Facilities 1st Lien Term Loan, Tranche B, 5.25%, 7/29/213 | | | 194,476 | | | | | | | | 173,084 | |
30 OPPENHEIMER FUNDAMENTAL ALTERNATIVES FUND
| | | | | | | | | | | | |
| | | Principal Amount | | | | | | Value | |
| Financials—0.6% | | | | | | | | | | | | |
| Commercial Banks—0.2% | | | | | | | | | | | | |
| Acrisure LLC, Sr. Sec. Credit Facilities 1st Lien Term Loan, Tranche B, 5.25%, 5/13/223,7 | | $ | 506,988 | | | $ | | | | | 494,313 | |
| Acrisure LLC, Sr. Sec. Credit Facilities 1st Lien Term Loan, Delayed Draw, 2.125%-5.25%, 5/13/223 | | | 66,408 | | | | | | | | 64,748 | |
| Alliant Holdings I LLC, Sr. Sec. Credit Facilities 1st Lien Term Loan, Tranche B, 4.50%, 8/12/223 | | | 289,275 | | | | | | | | 286,654 | |
| HUB International Ltd., Sr. Sec. Credit Facilities 1st Lien Term Loan, Tranche B, 4.00%, 10/2/203 | | | 468,476 | | | | | | | | 458,228 | |
| Hyperion Insurance Group Ltd., Sr. Sec. Credit Facilities 1st Lien Term Loan, Tranche B, 5.50%, 4/9/223 | | | 214,383 | | | | | | | | 215,276 | |
| | | | | | | | | | | 1,519,219 | |
| | | | | | | | | | | | | |
| Consumer Finance—0.0% | | | | | | | | | | | | |
| PGX Holdings, Inc., Sr. Sec. Credit Facilities 1st Lien Term Loan, 6.25%, 9/29/203 | | | 142,549 | | | | | | | | 142,505 | |
| PGX Holdings, Inc., Sr. Sec. Credit Facilities 2nd Lien Term Loan, 10.00%, 9/29/213 | | | 79,734 | | | | | | | | 80,133 | |
| | | | | | | | | | | 222,638 | |
| | | | | | | | | | | | | |
| Diversified Financial Services—0.3% | | | | | | | | | | | | |
| Altisource Solutions Sarl, Sr. Sec. Credit Facilities 1st Lien Term Loan, Tranche B, 4.50%, 12/9/203 | | | 71,766 | | | | | | | | 64,410 | |
| Guggenheim Partners Investment Management, Sr. Sec. Credit Facilities 1st Lien Term Loan, Tranche B, 4.25%, 7/22/203 | | | 184,084 | | | | | | | | 184,314 | |
| International Lease Finance Corp., Sr. Sec. Credit Facilities Term Loan, Tranche B, 3.50%, 2/26/213 | | | 2,620,000 | | | | | | | | 2,623,002 | |
| RCS Capital, Sr. Sec. Credit Facilities 1st Lien Term Loan, 7.50%, 4/29/193 | | | 358,032 | | | | | | | | 340,131 | |
| | | | | | | | | | | 3,211,857 | |
| | | | | | | | | | | | | |
| Insurance—0.1% | | | | | | | | | | | | |
| Aqgen Liberty Management I, Inc., Sr. Sec. Credit Facilities 1st Lien Term Loan, 6.50%, 7/1/193 | | | 357,104 | | | | | | | | 351,747 | |
| National Financial Partners Corp., Sr. Sec. Credit Facilities 1st Lien Term Loan, Tranche B, 4.50%, 7/1/203 | | | 425,857 | | | | | | | | 420,867 | |
| | | | | | | | | | | 772,614 | |
| | | | | | | | | | | | | |
| Health Care—1.3% | | | | | | | | | | | | |
| Health Care Equipment & Supplies—1.0% | | | | | | | | | | | | |
| 21st Century Oncology, Inc., Sr. Sec. Credit Facilities 1st Lien Term Loan, Tranche B, 6.50%, 4/30/223 | | | 753,113 | | | | | | | | 722,988 | |
| Air Medical Group Holdings, Inc., Sr. Sec. Credit Facilities 1st Lien Term Loan, Tranche B, 4.50%, 4/28/223 | | | 486,608 | | | | | | | | 479,570 | |
| Akorn, Inc., Sr. Sec. Credit Facilities 1st Lien Term Loan, Tranche B, 5.50%, 4/16/213 | | | 605,862 | | | | | | | | 599,804 | |
| Alvogen Pharma US, Inc., Sr. Sec. Credit Facilities 1st Lien Term Loan, 6.00%, 4/1/223 | | | 296,317 | | | | | | | | 291,996 | |
| AMAG Pharmaceuticals, Inc., Sr. Sec. Credit Facilities 1st Lien Term Loan, Tranche B, 4.75%, 8/17/213 | | | 60,000 | | | | | | | | 58,800 | |
| Ardent Legacy Acquisitions, Inc., Sr. Sec. Credit Facilities 1st Lien Term Loan, Tranche B, 6.50%, 8/4/213 | | | 115,000 | | | | | | | | 115,144 | |
31 OPPENHEIMER FUNDAMENTAL ALTERNATIVES FUND
| | | | |
| CONSOLIDATED STATEMENT OF INVESTMENTS Continued | | |
| | | | | | | | | | | | |
| | | Principal Amount | | | | | | Value | |
| Health Care Equipment & Supplies (Continued) | | | | | | | | | | | | |
| CareCore National LLC, Sr. Sec. Credit Facilities 1st Lien Term Loan, 5.50%, 3/5/213 | | $ | 158,709 | | | $ | | | | | 142,838 | |
| Carestream Health, Inc., Sr. Sec. Credit Facilities 1st Lien Term Loan, Tranche B, 5.00%, 6/7/193 | | | 922,237 | | | | | | | | 880,737 | |
| CHS/Community Health Systems, Inc., Sr. Sec. Credit Facilities 1st Lien Term Loan: | | | | | | | | | | | | |
| Tranche G, 3.75%, 12/31/193 | | | 63,461 | | | | | | | | 63,272 | |
| Tranche H, 4.00%, 1/27/213 | | | 201,752 | | | | | | | | 201,486 | |
| Connolly Corp., Sr. Sec. Credit Facilities 1st Lien Term Loan, Tranche B, 4.50%, 5/14/213 | | | 338,287 | | | | | | | | 338,033 | |
| ConvaTec, Inc., Sr. Sec. Credit Facilities 1st Lien Term Loan, Tranche B, 4.25%, 6/15/203 | | | 334,413 | | | | | | | | 334,273 | |
| CT Technologies Intermediate Holdings, Inc., Sr. Sec. Credit Facilities 1st Lien Term Loan, Tranche B, 5.25%, 11/18/213,7 | | | 275,038 | | | | | | | | 275,038 | |
| DJO Finance LLC, Sr. Sec. Credit Facilities 1st Lien Term Loan, Tranche B, 4.25%, 6/8/203 | | | 304,238 | | | | | | | | 302,336 | |
| Drumm Investors LLC, Sr. Sec. Credit Facilities 1st Lien Term Loan, 6.75%, 5/4/183 | | | 361,990 | | | | | | | | 363,951 | |
| Endo Luxembourg Finance I Co. Sarl, Sr. Sec. Credit Facilities 1st Lien Term Loan, Tranche B, 3.75%, 9/26/223 | | | 75,000 | | | | | | | | 73,941 | |
| eResearchTechnology, Inc., Sr. Sec. Credit Facilities 1st Lien Term Loan, Tranche B, 5.50%, 5/8/223,7 | | | 140,725 | | | | | | | | 139,494 | |
| HCR ManorCare, Inc., Sr. Sec. Credit Facilities 1st Lien Term Loan, 5.00%, 4/6/183 | | | 191,474 | | | | | | | | 184,174 | |
| IASIS Healthcare LLC, Sr. Sec. Credit Facilities 1st Lien Term Loan, Tranche B2, 4.50%, 5/3/183 | | | 610,109 | | | | | | | | 612,079 | |
| Indivior Finance Sarl, Sr. Sec. Credit Facilities 1st Lien Term Loan, Tranche B, 7.00%, 12/19/193,7 | | | 303,440 | | | | | | | | 282,200 | |
| inVentiv Health, Inc., Sr. Sec. Credit Facilities 1st Lien Term Loan, Tranche B4, 7.75%, 5/15/183 | | | 213,985 | | | | | | | | 213,896 | |
| LHP Operations Co. LLC, Sr. Sec. Credit Facilities 1st Lien Term Loan, Tranche B, 9.00%, 7/3/183 | | | 79,084 | | | | | | | | 76,316 | |
| LifeCare Holdings LLC, Sr. Sec. Credit Facilities 1st Lien Exit Term Loan, Tranche A, 6.50%, 11/30/183 | | | 165,214 | | | | | | | | 161,910 | |
| Medpace, Sr. Sec. Credit Facilities 1st Lien Term Loan, Tranche B, 4.75%, 3/31/213 | | | 103,558 | | | | | | | | 103,126 | |
| National Mentor, Sr. Sec. Credit Facilities 1st Lien Term Loan, Tranche B, 4.25%, 1/31/213 | | | 382,826 | | | | | | | | 377,083 | |
| National Surgical Hospitals, Inc., Sr. Sec. Credit Facilities 1st Lien Term Loan, Tranche B, 4.50%, 6/1/223 | | | 59,850 | | | | | | | | 58,803 | |
| New Trident Holdcorp, Inc., Sr. Sec. Credit Facilities 1st Lien Term Loan, Tranche B, 6.50%, 7/31/193 | | | 111,913 | | | | | | | | 108,555 | |
| Opal Acquisition, Inc., Sr. Sec. Credit Facilities 1st Lien Term Loan, Tranche B, 5.00%, 11/27/203 | | | 566,877 | | | | | | | | 549,871 | |
| Ortho-Clinical Diagnostics, Inc., Sr. Sec. Credit Facilities 1st Lien Term Loan, Tranche B, 4.75%, 6/30/213,7 | | | 274,388 | | | | | | | | 271,061 | |
| P2 Lower Acquisition LLC, Sr. Sec. Credit Facilities 1st Lien Term Loan, 5.50%, 10/22/203 | | | 123,810 | | | | | | | | 124,429 | |
| Pharmaceutical Product Development LLC, Sr. Sec. Credit Facilities 1st Lien Term Loan, Tranche B, 4.25%, 8/18/223 | | | 458,850 | | | | | | | | 453,497 | |
| PRA Holdings, Inc., Sr. Sec. Credit Facilities 1st Lien Term Loan, 4.50%, 9/24/203 | | | 361,605 | | | | | | | | 362,418 | |
32 OPPENHEIMER FUNDAMENTAL ALTERNATIVES FUND
| | | | | | | | | | | | |
| | | Principal Amount | | | | | | Value | |
| Health Care Equipment & Supplies (Continued) | | | | | | | | | | | | |
| Sage Products Holdings III LLC, Sr. Sec. Credit Facilities 1st Lien Term Loan, 4.25%, 12/13/193 | | $ | 59,573 | | | $ | | | | | 59,611 | |
| Sterigenics-Nordion Holdings LLC, Sr. Sec. Credit Facilities 1st Lien Term Loan, Tranche B, 4.25%, 5/15/223 | | | 175,000 | | | | | | | | 174,125 | |
| US Renal Care, Inc., Sr. Sec. Credit Facilities 1st Lien Term Loan, Tranche B2, 4.25%, 7/3/193 | | | 318,940 | | | | | | | | 319,040 | |
| | | | | | | | | | | 9,875,895 | |
| | | | | | | | | | | | | |
Health Care Providers & Services—0.2% | | | | | | | | | | | | |
| American Renal Holdings, Inc., Sr. Sec. Credit Facilities 1st Lien Term Loan, Delayed Draw, Tranche B, 4.50%, 8/20/193 | | | 155,523 | | | | | | | | 155,393 | |
| Genesis Healthcare Corp., Sr. Sec. Credit Facilities 1st Lien Term Loan, Tranche B, 10.00%, 12/4/173 | | | 219,515 | | | | | | | | 224,546 | |
| Kindred Healthcare, Inc., Sr. Sec. Credit Facilities 1st Lien Term Loan, Tranche B, 4.25%, 4/9/213,7 | | | 440,000 | | | | | | | | 438,717 | |
| Millennium Laboratories LLC, Sr. Sec. Credit Facilities 1st Lien Term Loan, Tranche B, 5.25%, 4/14/213 | | | 773,258 | | | | | | | | 276,440 | |
| Steward Health Care System LLC, Sr. Sec. Credit Facilities 1st Lien Term Loan, 6.75%, 4/10/203 | | | 148,915 | | | | | | | | 147,750 | |
| Surgery Center Holdings LLC, Sr. Sec. Credit Facilities 1st Lien Term Loan, 5.25%, 11/3/203 | | | 390,922 | | | | | | | | 390,270 | |
| | | | | | | | | | | 1,633,116 | |
| | | | | | | | | | | | | |
Health Care Technology—0.0% | | | | | | | | | | | | |
| Vitera Healthcare Solutions LLC, Sr. Sec. Credit Facilities 1st Lien Term Loan, 6.00%, 11/4/203 | | | 20,426 | | | | | | | | 20,184 | |
| | | | | | | | | | | | | |
Life Sciences Tools & Services—0.1% | | | | | | | | | | | | |
| JLL/Delta Dutch Newco BV, Sr. Sec. Credit Facilities 1st Lien Term Loan, Tranche B, 4.25%, 3/11/213,7 | | | 602,971 | | | | | | | | 591,966 | |
| | | | | | | | | | | | | |
Pharmaceuticals—0.0% | | | | | | | | | | | | |
| Catalent Pharma Solutions, Inc., Sr. Sec. Credit Facilities 1st Lien Term Loan, Tranche B, 4.25%, 5/20/213,7 | | | 150,000 | | | | | | | | 150,034 | |
| | | | | | | | | | | | | |
Industrials—2.7% | | | | | | | | | | | | |
Aerospace & Defense—0.1% | | | | | | | | | | | | |
| AM General LLC, Sr. Sec. Credit Facilities 1st Lien Term Loan, Tranche B, 10.25%, 3/22/183 | | | 109,322 | | | | | | | | 92,650 | |
| Doncasters Group Ltd., Sr. Sec. Credit Facilities 1st Lien Term Loan, Tranche B, 4.50%, 4/9/203 | | | 484,009 | | | | | | | | 482,900 | |
| Landmark Aviation Canadian, Sr. Sec. Credit Facilities 1st Lien Term Loan, Tranche B, 4.75%, 10/25/193 | | | 17,127 | | | | | | | | 17,119 | |
| LM US Member LLC, Sr. Sec. Credit Facilities 1st Lien Term Loan, Tranche B, 4.75%, 10/25/193 | | | 431,544 | | | | | | | | 431,342 | |
| Sequa Corp., Sr. Sec. Credit Facilities 1st Lien Term Loan, Tranche B, 5.25%, 6/19/173 | | | 157,927 | | | | | | | | 131,869 | |
| TurboCombustor Technology, Inc., Sr. Sec. Credit Facilities 1st Lien Term Loan, Tranche B, 5.50%, 12/2/203 | | | 231,080 | | | | | | | | 222,992 | |
| | | | | | | | | | | 1,378,872 | |
33 OPPENHEIMER FUNDAMENTAL ALTERNATIVES FUND
| | | | |
| CONSOLIDATED STATEMENT OF INVESTMENTS Continued | | |
| | | | | | | | | | | | |
| | | Principal Amount | | | | | | Value | |
| Commercial Services & Supplies—1.0% | | | | | | | | | | | | |
| Access CIG LLC, Sr. Sec. Credit Facilities 1st Lien Term Loan, 6.00%-7.25%, 10/18/213 | | $ | 149,316 | | | $ | | | | | 149,378 | |
| Allied Security Holdings LLC, Sr. Sec. Credit Facilities 1st Lien Term Loan, Tranche B, 4.25%, 2/12/213 | | | 175,618 | | | | | | | | 172,326 | |
| Allied Security Holdings LLC, Sr. Sec. Credit Facilities 2nd Lien Term Loan, Tranche B, 8.00%, 8/12/213 | | | 21,911 | | | | | | | | 21,034 | |
| Ascend Learning LLC, Sr. Sec. Credit Facilities 1st Lien Term Loan, 5.50%-6.75%, 7/26/193 | | | 888,649 | | | | | | | | 889,760 | |
| Asurion LLC, Sr. Sec. Credit Facilities 1st Lien Term Loan: | | | | | | | | | | | | |
| Tranche B, 5.00%, 8/4/223,7 | | | 751,486 | | | | | | | | 712,409 | |
| Tranche B1, 5.00%, 5/24/193 | | | 435,234 | | | | | | | | 416,601 | |
| Asurion LLC, Sr. Sec. Credit Facilities 2nd Lien Term Loan, 8.50%, 3/3/213 | | | 30,000 | | | | | | | | 27,135 | |
| Audio Visual Services Corp., Sr. Sec. Credit Facilities 1st Lien Term Loan, 4.50%, 1/22/213 | | | 360,126 | | | | | | | | 354,724 | |
| Ceridan HCM Holding, Inc., Sr. Sec. Credit Facilities 1st Lien Exit Term Loan, Tranche B2, 4.50%, 9/15/203,7 | | | 475,663 | | | | | | | | 438,799 | |
| CEVA Group plc, Sr. Sec. Credit Facilities 1st Lien Term Loan, 6.50%, 3/19/213 | | | 68,971 | | | | | | | | 60,924 | |
| CEVA Group plc, Sr. Sec. Credit Facilities Letter of Credit 1st Lien Term Loan, 6.50%, 3/14/213 | | | 137,777 | | | | | | | | 121,703 | |
| EWT Holdings III Corp., Sr. Sec. Credit Facilities 1st Lien Term Loan, 4.75%, 1/15/213 | | | 231,001 | | | | | | | | 229,991 | |
| Expert Global Solutions, Inc., Sr. Sec. Credit Facilities 1st Lien Term Loan, 8.50%, 4/3/183 | | | 71,058 | | | | | | | | 70,570 | |
| First Advantage, Sr. Sec. Credit Facilities 1st Lien Term Loan, Tranche B, 6.25%, 6/30/223 | | | 227,904 | | | | | | | | 226,053 | |
| Garda World Security Co., Sr. Sec. Credit Facilities 1st Lien Term Loan, Delayed Draw, 4.00%-5.25%, 11/6/203 | | | 19,657 | | | | | | | | 19,190 | |
| Garda World Security Corp., Sr. Sec. Credit Facilities 1st Lien Term Loan, 4.00%-5.25%, 11/6/203 | | | 186,562 | | | | | | | | 182,131 | |
| GCA Services Group, Inc., Sr. Sec. Credit Facilities 1st Lien Term Loan, 4.25%-5.50%, 11/1/193 | | | 169,362 | | | | | | | | 169,045 | |
| IG Investments Holdings LLC, Sr. Sec. Credit Facilities 1st Lien Term Loan, Tranche B, 6.00%, 10/31/213 | | | 466,880 | | | | | | | | 466,734 | |
| Information Resources, Inc., Sr. Sec. Credit Facilities 1st Lien Term Loan, 4.75%, 9/30/203 | | | 82,608 | | | | | | | | 82,857 | |
| Inmar, Inc., Sr. Sec. Credit Facilities 1st Lien Term Loan, Tranche B, 4.25%, 1/27/213 | | | 156,776 | | | | | | | | 153,901 | |
| Knowledge Universe, Sr. Sec. Credit Facilities 1st Lien Term Loan, 6.00%, 8/12/223 | | | 290,000 | | | | | | | | 287,100 | |
| Leighton Services, Sr. Sec. Credit Facilities 1st Lien Term Loan, Tranche B, 5.50%, 5/23/223 | | | 231,875 | | | | | | | | 233,614 | |
| Livingston International, Inc., Sr. Sec. Credit Facilities 1st Lien Term Loan, Tranche B1, 5.00%, 4/18/193 | | | 103,459 | | | | | | | | 97,251 | |
| Livingston International, Inc., Sr. Sec. Credit Facilities 2nd Lien Term Loan, 9.00%, 4/17/203 | | | 45,073 | | | | | | | | 40,792 | |
| Novitex Acquisition LLC, Sr. Sec. Credit Facilities 1st Lien Term Loan, 7.50%, 7/1/203 | | | 166,643 | | | | | | | | 157,894 | |
| Ozburn-Hessey Holding Co. LLC, Sr. Sec. Credit Facilities 1st Lien Term Loan, Tranche B, 6.75%, 5/23/193 | | | 255,321 | | | | | | | | 254,204 | |
34 OPPENHEIMER FUNDAMENTAL ALTERNATIVES FUND
| | | | | | | | | | |
| | | Principal Amount | | | | | Value | |
| Commercial Services & Supplies (Continued) | | | | | | | | | | |
| Packers Holdings LLC, Sr. Sec. Credit Facilities 1st Lien Term Loan, Tranche B, 5.00%, 12/2/213 | | $ | 54,399 | | | $ | | | 54,535 | |
| Protection One, Inc., Sr. Sec. Credit Facilities 1st Lien Term Loan, 5.00%, 7/1/213 | | | 580,000 | | | | | | 577,608 | |
| Sabre, Inc., Sr. Sec. Credit Facilities 1st Lien Term Loan, Tranche B, 4.00%, 2/19/193 | | | 902,485 | | | | | | 903,500 | |
| Sabre, Inc., Sr. Sec. Credit Facilities Incremental 1st Lien Term Loan, Tranche B2, 4.00%, 2/19/193 | | | 114,836 | | | | | | 114,957 | |
| SourceHOV LLC, Sr. Sec. Credit Facilities 1st Lien Term Loan, Tranche B, 7.75%, 10/31/193 | | | 246,735 | | | | | | 224,529 | |
| TransFirst, Inc., Sr. Sec. Credit Facilities 1st Lien Term Loan, 4.75%, 11/12/213 | | | 909,242 | | | | | | 909,242 | |
| TransFirst, Inc., Sr. Sec. Credit Facilities 2nd Lien Term Loan, 9.00%, 11/11/223 | | | 51,320 | | | | | | 51,480 | |
| Universal Services, Sr. Sec. Credit Facilities 1st Lien Term Loan, 4.75%, 7/28/223 | | | 354,970 | | | | | | 347,279 | |
| Universal Services, Sr. Sec. Credit Facilities 1st Lien Term Loan, Delayed Draw, 1.875%-6.00%, 7/28/223 | | | 25,030 | | | | | | 24,488 | |
| | | | | | | | | 9,243,738 | |
| | | | | | | | | | | |
| Electrical Equipment—0.2% | | | | | | | | | | |
| Applied Systems, Inc., Sr. Sec. Credit Facilities 1st Lien Term Loan, Tranche B, 4.25%, 1/25/213,7 | | | 336,931 | | | | | | 335,276 | |
| First Data Corp., Sr. Sec. Credit Facilities 1st Lien Term Loan: | | | | | | | | | | |
| Tranche B, 4.196%, 3/24/213 | | | 423,476 | | | | | | 424,457 | |
| Tranche C1, 3.697%, 3/23/183 | | | 264,144 | | | | | | 262,631 | |
| Freescale Semiconductor, Inc., Sr. Sec. Credit Facilities 1st Lien Term Loan: | | | | | | | | | | |
| Tranche B4, 4.25%, 2/28/203 | | | 521,694 | | | | | | 521,876 | |
| Tranche B5, 5.00%, 1/15/213 | | | 377,849 | | | | | | 378,360 | |
| Internap Network Services Corp., Sr. Sec. Credit Facilities 1st Lien Term Loan, 6.00%, 11/22/193 | | | 112,158 | | | | | | 110,476 | |
| | | | | | | | | 2,033,076 | |
| | | | | | | | | | | |
| Industrial Conglomerates—0.7% | | | | | | | | | | |
| Apex Tool Group LLC, Sr. Sec. Credit Facilities 1st Lien Term Loan, Tranche B, 4.50%, 1/31/203 | | | 539,214 | | | | | | 527,531 | |
| Boyd Corp., Sr. Sec. Credit Facilities 1st Lien Term Loan, 5.25%, 4/15/223 | | | 184,850 | | | | | | 181,384 | |
| Calpine Corp., Sr. Sec. Credit Facilities 1st Lien Term Loan, Tranche B5, 3.50%, 5/27/223 | | | 154,613 | | | | | | 153,131 | |
| CPI Acquisition, Inc., Sr. Sec. Credit Facilities 1st Lien Term Loan, Tranche B, 6.75%, 8/17/223 | | | 185,345 | | | | | | 184,997 | |
| CST Brands, Sr. Sec. Credit Facilities 1st Lien Term Loan, Tranche B, 4.50%, 9/30/213 | | | 280,665 | | | | | | 280,314 | |
| Dayco Products LLC, Sr. Sec. Credit Facilities 1st Lien Term Loan, Tranche B, 5.25%, 12/12/193 | | | 250,295 | | | | | | 250,139 | |
| Doosan Bobcat, Sr. Sec. Credit Facilities 1st Lien Term Loan, Tranche B, 4.50%, 5/28/213 | | | 516,401 | | | | | | 518,122 | |
| Excelitas Technologies Corp., Sr. Sec. Credit Facilities 1st Lien Term Loan, 6.00%, 11/2/203,7 | | | 348,232 | | | | | | 336,044 | |
| Filtration Group, Inc., Sr. Sec. Credit Facilities 1st Lien Term Loan, Tranche B, 4.25%, 11/20/203 | | | 262,683 | | | | | | 262,880 | |
35 OPPENHEIMER FUNDAMENTAL ALTERNATIVES FUND
| | | | |
| CONSOLIDATED STATEMENT OF INVESTMENTS Continued | | |
| | | | | | | | | | | | |
| | | Principal Amount | | | | | | Value | |
Industrial Conglomerates (Continued) | | | | | | | | | | | | |
Gates Global LLC, Sr. Sec. Credit Facilities 1st Lien Term Loan, 4.25%, 7/5/213 | | $ | 595,036 | | | $ | | | | | 561,317 | |
Hillman Group, Inc. (The), Sr. Sec. Credit Facilities 1st Lien Term Loan, Tranche B, 4.50%, 6/30/213 | | | 309,404 | | | | | | | | 308,373 | |
Milacron LLC, Sr. Sec. Credit Facilities 1st Lien Term Loan, Tranche B, 4.50%, 9/28/203 | | | 648,627 | | | | | | | | 651,465 | |
Sensus USA, Inc., Sr. Sec. Credit Facilities 1st Lien Term Loan, Tranche B, 4.50%, 5/9/173 | | | 309,781 | | | | | | | | 309,006 | |
StandardAero, Sr. Sec. Credit Facilities 1st Lien Term Loan, 5.25%, 7/7/223 | | | 280,000 | | | | | | | | 279,650 | |
TransDigm, Sr. Sec. Credit Facilities 1st Lien Term Loan, Tranche E, 3.50%, 5/14/223 | | | 248,810 | | | | | | | | 244,560 | |
US Farathane LLC, Sr. Sec. Credit Facilities 1st Lien Term Loan, Tranche B, 6.75%, 12/23/213 | | | 370,057 | | | | | | | | 373,064 | |
Wencor Group, Sr. Sec. Credit Facilities 1st Lien Term Loan, 4.50%, 6/25/213 | | | 177,374 | | | | | | | | 168,394 | |
WP CPP Holdings LLC, Sr. Sec. Credit Facilities 1st Lien Term Loan, 4.50%, 12/28/193,7 | | | 582,981 | | | | | | | | 572,293 | |
| | | | | | | | | | | 6,162,664 | |
| | | | | | | | | | | | | |
Machinery—0.2% | | | | | | | | | | | | |
BWAY, Sr. Sec. Credit Facilities 1st Lien Term Loan, Tranche B, 5.50%, 8/14/203 | | | 613,664 | | | | | | | | 615,582 | |
International Equipment Solutions LLC, Sr. Sec. Credit Facilities 1st Lien Term Loan, 7.25%-7.75%, 8/16/193 | | | 135,553 | | | | | | | | 132,503 | |
Pelican Products, Inc., Sr. Sec. Credit Facilities 1st Lien Term Loan, Tranche B, 5.25%, 4/8/203 | | | 277,497 | | | | | | | | 273,334 | |
RBS Global, Inc., Sr. Sec. Credit Facilities 1st Lien Term Loan, 4.00%, 8/21/203 | | | 522,471 | | | | | | | | 517,246 | |
| | | | | | | | | | | 1,538,665 | |
| | | | | | | | | | | | | |
Marine—0.0% | | | | | | | | | | | | |
Commercial Barge Line Co., Sr. Sec. Credit Facilities 1st Lien Term Loan, Tranche B, 7.50%, 9/22/193 | | | 306,206 | | | | | | | | 304,866 | |
| | | | | | | | | | | | | |
Road & Rail—0.2% | | | | | | | | | | | | |
Wabash National Corp., Sr. Sec. Credit Facilities 1st Lien Term Loan, Tranche B, 4.25%, 3/18/223 | | | 104,935 | | | | | | | | 105,394 | |
Western Express, Inc., Sr. Sec. Credit Facilities 2nd Lien Term Loan, 8.532%, 2/23/223 | | | 982,800 | | | | | | | | 947,222 | |
YRC Worldwide, Inc., Sr. Sec. Credit Facilities 1st Lien Term Loan, 8.25%, 2/13/193 | | | 579,862 | | | | | | | | 556,668 | |
| | | | | | | | | | | 1,609,284 | |
| | | | | | | | | | | | | |
Trading Companies & Distributors—0.1% | | | | | | | | | | | | |
iStar Financial, Inc., Sr. Sec. Credit Facilities 1st Lien Term Loan, 7.00%, 3/19/173 | | | 131,385 | | | | | | | | 134,670 | |
Ocwen Financial Corp., Sr. Sec. Credit Facilities 1st Lien Term Loan, 5.50%, 2/15/183 | | | 42,634 | | | | | | | | 42,749 | |
Orchard Acquisition Co. LLC, Sr. Sec. Credit Facilities 1st Lien Term Loan, Tranche B, 7.00%, 2/8/193 | | | 361,682 | | | | | | | | 300,196 | |
36 OPPENHEIMER FUNDAMENTAL ALTERNATIVES FUND
| | | | | | | | | | | | |
| | | Principal Amount | | | | | | Value | |
Trading Companies & Distributors (Continued) | | | | | | | | | | | | |
Walter Investment Management Corp., Sr. Sec. Credit Facilities 1st Lien Term Loan, 4.75%, 12/11/203 | | $ | 525,142 | | | $ | | | | | 484,006 | |
| | | | | | | | | | | 961,621 | |
| | | | | | | | | | | | | |
Transportation Infrastructure—0.2% | | | | | | | | | | | | |
Goodyear Tire & Rubber Co. (The), Sr. Sec. Credit Facilities 2nd Lien Term Loan, Tranche B, 3.75%, 4/30/193 | | | 268,895 | | | | | | | | 269,843 | |
Metaldyne, Sr. Sec. Credit Facilities 1st Lien Term Loan, Tranche B, 6.00%, 10/20/213 | | | 236,122 | | | | | | | | 235,257 | |
Navistar, Inc., Sr. Sec. Credit Facilities 1st Lien Term Loan, Tranche B, 6.50%, 8/7/203 | | | 610,000 | | | | | | | | 592,463 | |
TI Group Automotive Systems LLC, Sr. Sec. Credit Facilities 1st Lien Term Loan, Tranche B, 4.50%, 6/30/223 | | | 650,000 | | | | | | | | 645,937 | |
| | | | | | | | | | | 1,743,500 | |
| | | | | | | | | | | | | |
Information Technology—1.0% | | | | | | | | | | | | |
Communications Equipment—0.0% | | | | | | | | | | | | |
Birch Communications, Inc., Sr. Sec. Credit Facilities 1st Lien Term Loan, Tranche B, 7.75%, 7/17/203 | | | 247,885 | | | | | | | | 246,646 | |
| | | | | | | | | | | | | |
Electronic Equipment, Instruments, & Components—0.1% | | | | | | | | | | | | |
Aricent Technologies, Sr. Sec. Credit Facilities 1st Lien Term Loan, 5.50%, 4/14/213 | | | 201,508 | | | | | | | | 199,619 | |
Kronos, Inc., Sr. Sec. Credit Facilities 1st Lien Term Loan, Tranche B, 4.50%, 10/30/193 | | | 635,785 | | | | | | | | 635,653 | |
| | | | | | | | | | | 835,272 | |
| | | | | | | | | | | | | |
Internet Software & Services—0.7% | | | | | | | | | | | | |
Active Network, Inc. (The), Sr. Sec. Credit Facilities 1st Lien Term Loan, 5.50%, 11/13/203 | | | 276,923 | | | | | | | | 274,673 | |
Avaya, Inc., Sr. Sec. Credit Facilities 1st Lien Term Loan, Tranche B7, 6.25%, 4/30/203 | | | 839,995 | | | | | | | | 650,996 | |
Blue Coat Systems, Inc., Sr. Sec. Credit Facilities 1st Lien Term Loan, Tranche B, 4.50%, 5/20/223,7 | | | 485,000 | | | | | | | | 481,262 | |
CommScope, Inc., Sr. Sec. Credit Facilities 1st Lien Term Loan, Tranche B, 4.00%, 12/29/223 | | | 105,000 | | | | | | | | 105,033 | |
Compuware Corp., Sr. Sec. Credit Facilities 1st Lien Term Loan, Tranche B2, 6.25%, 12/15/213 | | | 422,149 | | | | | | | | 402,976 | |
Dell International LLC, Sr. Sec. Credit Facilities 1st Lien Term Loan, Tranche B2, 4.00%, 4/29/203,7 | | | 546,434 | | | | | | | | 547,081 | |
Deltek, Inc., Sr. Sec. Credit Facilities 1st Lien Term Loan, 5.00%, 6/25/223 | | | 498,750 | | | | | | | | 498,958 | |
Epicor Software Corp., Sr. Sec. Credit Facilities 1st Lien Term Loan, 4.75%, 6/1/223,7 | | | 324,438 | | | | | | | | 322,468 | |
First Data Corp., Sr. Sec. Credit Facilities 1st Lien Term Loan, Tranche B, 3.947%, 7/8/223 | | | 100,000 | | | | | | | | 100,375 | |
Informatica Corp., Sr. Sec. Credit Facilities 1st Lien Term Loan, Tranche B, 4.50%, 8/5/223,7 | | | 515,040 | | | | | | | | 510,157 | |
Linxens France SA, Sr. Sec. Credit Facilities 1st Lien Term Loan, 5.00%, 10/14/223,7 | | | 115,000 | | | | | | | | 115,144 | |
Micro Focus US, Inc., Sr. Sec. Credit Facilities 1st Lien Term Loan, Tranche B, 5.25%, 11/19/213 | | | 513,931 | | | | | | | | 514,114 | |
37 OPPENHEIMER FUNDAMENTAL ALTERNATIVES FUND
| | | | |
| CONSOLIDATED STATEMENT OF INVESTMENTS Continued | | |
| | | | | | | | | | | | |
| | | Principal Amount | | | | | | Value | |
| Internet Software & Services (Continued) | | | | | | | | | | | | |
| Mitchell International, Inc., Sr. Sec. Credit Facilities 1st Lien Term Loan, Tranche B, 4.50%, 10/12/203 | | $ | 302,621 | | | $ | | | | | 302,116 | |
| Riverbed Technology, Inc., Sr. Sec. Credit Facilities 1st Lien Term Loan, Tranche B, 6.00%, 4/25/223 | | | 489,399 | | | | | | | | 490,623 | |
| TIBCO Software, Inc., Sr. Sec. Credit Facilities 1st Lien Term Loan, Tranche B, 6.50%, 12/4/203 | | | 601,776 | | | | | | | | 571,687 | |
| TTM Technologies, Inc., Sr. Sec. Credit Facilities 1st Lien Term Loan, Tranche B, 6.00%, 5/31/213,7 | | | 214,375 | | | | | | | | 200,441 | |
| Zebra Technologies Corp., Sr. Sec. Credit Facilities 1st Lien Term Loan, Tranche B, 4.75%, 10/27/213 | | | 33,698 | | | | | | | | 33,971 | |
| | | | | | | | | | | 6,122,075 | |
| | | | | | | | | | | | | |
| IT Services—0.1% | | | | | | | | | | | | |
| Vertafore, Inc., Sr. Sec. Credit Facilities 1st Lien Term Loan, 4.25%, 10/3/193,7 | | | 427,727 | | | | | | | | 428,217 | |
| | | | | | | | | | | | | |
| Office Electronics—0.0% | | | | | | | | | | | | |
| BMC Software, Inc., Sr. Sec. Credit Facilities 1st Lien Term Loan, 5.00%, 9/10/203 | | | 434,570 | | | | | | | | 392,522 | |
| | | | | | | | | | | | | |
| Software—0.1% | | | | | | | | | | | | |
| Aptean, Inc., Sr. Sec. Credit Facilities 1st Lien Term Loan, Tranche B, 5.25%, 2/21/203 | | | 145,953 | | | | | | | | 143,034 | |
| Blackboard, Inc., Sr. Sec. Credit Facilities 1st Lien Term Loan, Tranche B3, 4.75%, 10/4/183,7 | | | 376,793 | | | | | | | | 371,848 | |
| Infor US, Inc., Sr. Sec. Credit Facilities 1st Lien Term Loan, Tranche B5, 3.75%, 6/3/203,7 | | | 386,492 | | | | | | | | 376,884 | |
| RP Crown Parent LLC, Sr. Sec. Credit Facilities 1st Lien Term Loan, Tranche B, 6.00%, 12/21/183,7 | | | 361,710 | | | | | | | | 331,416 | |
| | | | | | | | | | | 1,223,182 | |
| | | | | | | | | | | | | |
| Materials—1.3% | | | | | | | | | | | | |
| Chemicals—0.8% | | | | | | | | | | | | |
| Allnex Luxembourg & CY SCA, Sr. Sec. Credit Facilities 1st Lien Term Loan: | | | | | | | | | | | | |
| Tranche B1, 4.50%, 10/4/193 | | | 78,727 | | | | | | | | 78,899 | |
| Tranche B2, 4.50%, 10/4/193 | | | 40,848 | | | | | | | | 40,937 | |
| American Pacific Corp., Sr. Sec. Credit Facilities 1st Lien Term Loan, Tranche B, 7.00%, 2/26/193 | | | 130,688 | | | | | | | | 130,034 | |
| AZ Chem US, Inc., Sr. Sec. Credit Facilities 1st Lien Term Loan, Tranche B, 4.50%, 6/10/213 | | | 2,939,246 | | | | | | | | 2,940,716 | |
| CeramTec Acquisition Corp., Sr. Sec. Credit Facilities 1st Lien Term Loan, Tranche B2, 4.25%, 8/28/203 | | | 31,703 | | | | | | | | 31,753 | |
| CeramTec Service GmbH, Sr. Sec. Credit Facilities 1st Lien Term Loan: | | | | | | | | | | | | |
| Tranche B1, 4.25%, 8/28/203 | | | 308,402 | | | | | | | | 308,884 | |
| Tranche B3, 4.25%, 8/28/203 | | | 93,341 | | | | | | | | 93,487 | |
| Cyanco Intermediate Corp., Sr. Sec. Credit Facilities 1st Lien Term Loan, Tranche B, 5.50%, 5/1/203 | | | 332,499 | | | | | | | | 320,446 | |
| Emerald Performance Materials LLC, Sr. Sec. Credit Facilities 1st Lien Term Loan, 4.50%, 7/23/213 | | | 194,594 | | | | | | | | 193,885 | |
| Ineos US Finance LLC, Sr. Sec. Credit Facilities 1st Lien Term Loan: Tranche B, 3.75%, 5/4/183,7 | | | 390,000 | | | | | | | | 386,506 | |
38 OPPENHEIMER FUNDAMENTAL ALTERNATIVES FUND
| | | | | | | | | | | | |
| | | Principal Amount | | | | | | Value | |
Chemicals (Continued) | | | | | | | | | | | | |
Ineos US Finance LLC, Sr. Sec. Credit Facilities 1st Lien Term Loan: (Continued)
Tranche B, 4.25%, 3/31/223 | | $ | 77,480 | | | $ | | | | | 75,954 | |
| Nusil Technology LLC, Sr. Sec. Credit Facilities 1st Lien Term Loan, Tranche B, 5.25%, 4/7/173 | | | 103,501 | | | | | | | | 103,070 | |
| OCI Beaumont LLC, Sr. Sec. Credit Facilities 1st Lien Term Loan, Tranche B3, 5.50%, 8/20/193 | | | 168,546 | | | | | | | | 171,706 | |
| PQ Corp., Sr. Sec. Credit Facilities 1st Lien Term Loan, 4.00%, 8/7/173,7 | | | 518,319 | | | | | | | | 517,591 | |
| Road Infrastructure Investment, Sr. Sec. Credit Facilities 1st Lien Term Loan, 4.25%, 3/31/213 | | | 281,414 | | | | | | | | 275,199 | |
| Royal Holdings, Inc., Sr. Sec. Credit Facilities 1st Lien Term Loan, 4.50%, 6/20/223 | | | 199,500 | | | | | | | | 198,303 | |
| Solenis International LP, Sr. Sec. Credit Facilities 1st Lien Term Loan, 4.25%, 8/2/213 | | | 223,035 | | | | | | | | 219,864 | |
| Styrolution Group GmbH, Sr. Sec. Credit Facilities 1st Lien Term Loan, 6.50%, 11/7/193 | | | 494,844 | | | | | | | | 499,792 | |
| Tronox Pigments BV, Sr. Sec. Credit Facilities 1st Lien Term Loan, 4.25%, 3/19/203 | | | 159,240 | | | | | | | | 146,871 | |
| Univar, Inc., Sr. Sec. Credit Facilities 1st Lien Term Loan, 4.25%, 7/1/223 | | | 785,000 | | | | | | | | 773,785 | |
| | | | | | | | | | | 7,507,682 | |
| | | | | | | | | | | | | |
Construction Materials—0.2% | | | | | | | | | | | | |
| Atkore, Sr. Sec. Credit Facilities 1st Lien Term Loan, 4.50%, 4/9/213 | | | 213,887 | | | | | | | | 201,588 | |
| Continental Building Products LLC, Sr. Sec. Credit Facilities 1st Lien Term Loan, Tranche B, 4.00%, 8/28/203 | | | 333,304 | | | | | | | | 332,888 | |
| CPG International, Inc., Sr. Sec. Credit Facilities Term Loan, Tranche B, 4.75%, 9/30/203 | | | 194,010 | | | | | | | | 192,676 | |
| GYP Holdings, Sr. Sec. Credit Facilities 1st Lien Term Loan, 4.75%, 3/27/213 | | | 201,058 | | | | | | | | 195,780 | |
| HD Supply, Inc., Sr. Sec. Credit Facilities 1st Lien Term Loan, 3.75%, 8/13/213 | | | 380,000 | | | | | | | | 379,407 | |
| Quikrete Holdings, Inc., Sr. Sec. Credit Facilities 1st Lien Term Loan, 4.00%, 9/28/203 | | | 229,964 | | | | | | | | 229,675 | |
| Quikrete Holdings, Inc., Sr. Sec. Credit Facilities 2nd Lien Term Loan, 7.00%, 3/26/213 | | | 262,132 | | | | | | | | 262,951 | |
| | | | | | | | | | | 1,794,965 | |
| | | | | | | | | | | | | |
Containers & Packaging—0.2% | | | | | | | | | | | | |
| Ardagh Holdings USA, Inc., Sr. Sec. Credit Facilities 1st Lien Term Loan, Delayed Draw, Tranche B, 4.00%, 12/17/193 | | | 365,549 | | | | | | | | 366,519 | |
| Consolidated Container Holdings LLC, Sr. Sec. Credit Facilities 1st Lien Term Loan, 5.00%, 7/3/193 | | | 258,025 | | | | | | | | 235,126 | |
| Exopack/Coveris, Sr. Sec. Credit Facilities 1st Lien Term Loan, Tranche B, 4.50%, 5/8/193 | | | 220,668 | | | | | | | | 220,530 | |
| KIK Custom Products, Inc., Sr. Sec. Credit Facilities 1st Lien Term Loan, 6.00%, 8/26/223 | | | 265,000 | | | | | | | | 259,617 | |
| Kloeckner Pentaplast of America, Inc., Sr. Sec. Credit Facilities 1st Lien Term Loan, 5.00%, 4/22/203 | | | 111,250 | | | | | | | | 111,528 | |
| Kloeckner Pentaplast of America, Inc., Sr. Sec. Credit Facilities 1st Lien Term Loan, 5.00%, 4/28/203 | | | 261,783 | | | | | | | | 262,438 | |
39 OPPENHEIMER FUNDAMENTAL ALTERNATIVES FUND
| | | | |
| CONSOLIDATED STATEMENT OF INVESTMENTS Continued | | |
| | | | | | | | | | | | |
| | | Principal Amount | | | | | | Value | |
| Containers & Packaging (Continued) | | | | | | | | | | | | |
| Reynolds Group Holdings, Inc., Sr. Sec. Credit Facilities 1st Lien Term Loan, 4.50%, 12/1/183 | | $ | 60,000 | | | $ | | | | | 60,165 | |
| Tekni-Plex, Inc., Sr. Sec. Credit Facilities 1st Lien Term Loan, Tranche B1, 4.50%, 6/1/223 | | | 274,314 | | | | | | | | 273,457 | |
| | | | | | | | | | | 1,789,380 | |
| | | | | | | | | | | | | |
| Metals & Mining—0.0% | | | | | | | | | | | | |
| Novelis, Inc., Sr. Sec. Credit Facilities 1st Lien Term Loan, Tranche B, 4.00%, 6/2/223 | | | 227,030 | | | | | | | | 222,684 | |
| | | | | | | | | | | | | |
| Paper & Forest Products—0.1% | | | | | | | | | | | | |
| Signode Industrial Group US, Inc., Sr. Sec. Credit Facilities 1st Lien Term Loan, 3.75%, 4/30/213 | | | 422,708 | | | | | | | | 416,720 | |
| | | | | | | | | | | | | |
| Telecommunication Services—0.5% | | | | | | | | | | | | |
| Diversified Telecommunication Services—0.5% | | | | | | | | | | | | |
| Cincinnati Bell, Inc., Sr. Sec. Credit Facilities 1st Lien Term Loan, 4.00%, 9/10/203 | | | 187,565 | | | | | | | | 185,642 | |
| Communications Sales & Leasing, Inc., Sr. Sec. Credit Facilities 1st Lien Term Loan, 5.00%, 10/14/223 | | | 791,602 | | | | | | | | 748,723 | |
| FairPoint Communications, Inc., Sr. Sec. Credit Facilities 1st Lien Term Loan, Tranche B, 7.50%, 2/14/193 | | | 134,504 | | | | | | | | 135,059 | |
| Global Tel*Link Corp., Sr. Sec. Credit Facilities 1st Lien Term Loan, 5.00%, 5/22/203 | | | 480,126 | | | | | | | | 396,104 | |
| IPC Corp., Sr. Sec. Credit Facilities 1st Lien Term Loan, Tranche B, 5.50%, 8/6/213 | | | 273,655 | | | | | | | | 270,576 | |
| IPC Corp., Sr. Sec. Credit Facilities 2nd Lien Term Loan, 10.50%, 2/4/223 | | | 161,028 | | | | | | | | 150,159 | |
| Level 3 Financing, Inc., Sr. Sec. Credit Facilities 1st Lien Term Loan: | | | | | | | | | | | | |
| Tranche BI, 4.00%, 1/15/203 | | | 712,152 | | | | | | | | 714,823 | |
| Tranche BII, 3.50%, 5/31/223 | | | 290,000 | | | | | | | | 290,136 | |
| LTS Buyer LLC, Sr. Sec. Credit Facilities 1st Lien Term Loan, Tranche B, 4.00%, 4/13/203 | | | 782,486 | | | | | | | | 773,067 | |
| Securus Technologies Holdings, Sr. Sec. Credit Facilities 1st Lien Term Loan, Tranche B2, 4.75%, 4/30/203 | | | 308,948 | | | | | | | | 240,979 | |
| Securus Technologies Holdings, Sr. Sec. Credit Facilities 2nd Lien Term Loan, 9.00%, 4/30/213 | | | 87,678 | | | | | | | | 56,991 | |
| US TelePacific Corp., Sr. Sec. Credit Facilities 1st Lien Term Loan, 6.00%, 11/25/203 | | | 256,613 | | | | | | | | 255,410 | |
| XO Communications, Sr. Sec. Credit Facilities 1st Lien Term Loan, 4.25%, 3/22/213 | | | 206,271 | | | | | | | | 205,798 | |
| Zayo Group LLC, Sr. Sec. Credit Facilities 1st Lien Term Loan, Tranche B, 3.75%, 5/6/213 | | | 549,810 | | | | | | | | 549,508 | |
| | | | | | | | | | | 4,972,975 | |
| | | | | | | | | | | | | |
| Wireless Telecommunication Services—0.0% | | | | | | | | | | | | |
| NTELOS, Inc., Sr. Sec. Credit Facilities 1st Lien Term Loan, Tranche B, 5.75%, 11/9/193 | | | 43,178 | | | | | | | | 43,070 | |
40 OPPENHEIMER FUNDAMENTAL ALTERNATIVES FUND
| | | | | | | | | | | | | | | | |
| | | | Principal Amount | | Value |
| Utilities—1.6% | | | | | |
| Electric Utilities—0.8% | | | | | |
| Alinta Energy Finance Pty Ltd., Sr. Sec. Credit Facilities 1st Lien Term Loan, Tranche B, 6.375%, 8/13/193 | | | $ 633,140 | | $ 630,964 |
| Alinta Energy Finance Pty Ltd., Sr. Sec. Credit Facilities 1st Lien Term Loan, Delayed Draw, 6.375%, 8/13/183 | | | 42,079 | | 41,934 |
| Atlantic Power LP, Sr. Sec. Credit Facilities 1st Lien Term Loan, 4.75%, 2/20/213 | | | 314,973 | | 315,170 |
| Energy Future Intermediate Holding Co. LLC, Sr. Sec. Credit Facilities 1st Lien Term Loan, Debtor in Possession, 4.25%, 6/20/163 | | | 5,335,806 | | 5,339,141 |
| Green Energy Partners/Stonewall LLC, Sr. Sec. Credit Facilities 1st Lien Term Loan, Tranche B1, 6.50%, 11/15/213 | | | 52,542 | | 51,229 |
| InterGen NV, Sr. Sec. Credit Facilities 1st Lien Term Loan, Tranche B, 5.50%, 6/15/203 | | | 300,097 | | 278,841 |
| LA Frontera Generation LLC, Sr. Sec. Credit Facilities 1st Lien Term Loan, 4.50%, 9/30/203 | | | 60,514 | | 49,319 |
| Moxie Patriot LLC, Sr. Sec. Credit Facilities 1st Lien Term Loan, Tranche B1, 6.75%, 12/19/203 | | | 518,994 | | 495,639 |
| NRG Energy, Inc., Sr. Sec. Credit Facilities 1st Lien Term Loan, Tranche B, 2.75%, 7/1/183 | | | 249,361 | | 242,951 |
| Sandy Creek Energy Associates LP, Sr. Sec. Credit Facilities 1st Lien Term Loan, Tranche B, 5.00%, 11/9/203 | | | 144,277 | | 117,045 |
| Wheelabrator, Sr. Sec. Credit Facilities 1st Lien Term Loan: | | | | | |
| Tranche B, 5.00%, 12/17/213 | | | 222,080 | | 217,361 |
| Tranche C, 5.00%, 12/17/213 | | | 9,845 | | 9,636 |
| | | | | 7,789,230 |
| | | | | | | | | | | | | | | | | |
Gas Utilities—0.1% | | | | | |
| Panda Temple Power II LLC, Sr. Sec. Credit Facilities 1st Lien Term Loan, Tranche B, 7.25%, 4/3/193 | | | 679,507 | | 611,556 |
| | | | | | | | | | | | | | | | | |
Independent Power and Renewable Electricity Producers—0.7% | | | | | |
| Dynegy, Inc., Sr. Sec. Credit Facilities 1st Lien Term Loan, Tranche B2, 4.00%, 4/23/203 | | | 7,016,609 | | 6,996,563 |
Total Corporate Loans (Cost $135,799,517) | | | | | 131,761,961 |
| | |
| | | | Shares | | |
| Structured Security—0.1% | | | | | |
Africa Telecommunications Media & Technology Fund 1 LLC4 (Cost $10,000,000) | | | 9,542,930 | | 895,986 |
| | | | | |
| | | | | | Exercise | | | Expiration | | | | | |
| Counterparty | | | Price | | | Date | | | Contracts | | |
Over-the-Counter Option Purchased—0.1% | | | | | | | | | | | | | | | | |
CNH Currency Put1(Cost $487,852) | | | GSG | | | CNH | 6.388 | | | | 7/13/16 | | | CNH 196,000,000 | | 749,896 |
41 OPPENHEIMER FUNDAMENTAL ALTERNATIVES FUND
| | | | |
| CONSOLIDATED STATEMENT OF INVESTMENTS Continued | | |
| | | | | | | | | | | | | | | | | | | | | | | | | | | | |
| | | | | | Pay/Receive | | | | | | | | | | | | | | | | |
| | | | | | Floating | | | Floating | | | Fixed | | | Expiration | | | Notional Amount | | | | |
| | | Counterparty | | | Rate | | | Rate | | | Rate | | | Date | | | (000’s) | | | Value | |
Over-the-Counter Interest Rate Swaptions Purchased—0.4% | | | | | |
| Interest Rate Swap maturing 1/25/26 Put1 | | | GSG | | | | Receive | | |
| Six-Month
JPY BBA
LIBOR |
| | | 1.870% | | | | 1/21/16 | JPY | | | 5,406,000 | | | $ | — | |
| Interest Rate Swap maturing 11/22/27 Call1 | | | GSG | | | | Receive | | |
| Six-Month
JPY BBA
LIBOR |
| | | 1.070 | | | | 11/20/17 | JPY | | | 8,024,000 | | | | 756,085 | |
| Interest Rate Swap maturing 3/21/28 Call1 | | | GSG | | | | Receive | | |
| Three-
Month USD
BBA LIBOR |
| | | 2.580 | | | | 3/19/18 | USD | | | 14,400 | | | | 651,916 | |
| Interest Rate Swap maturing 4/18/28 Call1 | | | GSG | | | | Receive | | |
| Three-
Month USD
BBA LIBOR |
| | | 2.505 | | | | 4/16/18 | USD | | | 36,000 | | | | 1,704,662 | |
| Interest Rate Swap maturing 7/25/28 Call1 | | | GSG | | | | Receive | | |
| Six-Month
JPY BBA
LIBOR |
| | | 1.050 | | | | 7/23/18 | JPY | | | 2,000,000 | | | | 289,379 | |
Total Over-the-Counter Interest Rate Swaptions Purchased
(Cost $6,322,466) | | | | | | | | | | | | | | | | 3,402,042 | |
| | | | | | | | |
| | | Shares | | | | |
Investment Companies—19.4% | | | | | | | | |
Oppenheimer Institutional Money Market Fund, Cl. E, 0.18%10,11 | | | 138,198,466 | | | | 138,198,466 | |
Oppenheimer Master Loan Fund, LLC10 | | | 1,370,520 | | | | 20,053,001 | |
SPDR Gold Trust Exchange Traded Fund1,13 | | | 215,400 | | | | 23,543,220 | |
Total Investment Companies (Cost $188,626,547) | | | | | | | 181,794,687 | |
| | | | | | | | | |
Total Investments, at Value (Cost $883,052,146) | | | 99 .9% | | | | 936,883,455 | |
Net Other Assets (Liabilities) | | | 0 .1 | | | | 743,871 | |
Net Assets | | | 100 .0% | | | $ | 937,627,326 | |
| | | | | | | | |
*October 30, 2015 represents the last business day of the Fund’s reporting period. See Note 2 of the accompanying Consolidated Notes.
Footnotes to Consolidated Statement of Investments
1. Non-income producing security.
2. All or portion of the security position is held in segregated accounts and pledged to cover margin requirements with respect to securities sold short. The aggregate market value of such securities is $4,780,000. See Note 10 of accompanying Consolidated Notes.
3. Represents the current interest rate for a variable or increasing rate security.
4. Restricted security. The aggregate value of restricted securities at period end was $46,174,654, which represents 4.92% of the Fund’s net assets. See Note 4 of the accompanying Consolidated Notes. Information concerning restricted securities is as follows:
42 OPPENHEIMER FUNDAMENTAL ALTERNATIVES FUND
Footnotes to Consolidated Statement of Investments (Continued)
| | | | | | | | | | | | | | | | |
| Security | | Acquisition Dates | | | Cost | | | Value | | | Unrealized Depreciation | |
| |
Africa Telecommunications Media & Technology Fund 1 LLC | | | 4/20/11 | | | $ | 10,000,000 | | | $ | 895,986 | | | $ | 9,104,014 | |
Airspeed Ltd., Series 2007-1A, Cl. G1, 0.466%, 6/15/32 | | | 1/9/13-7/10/13 | | | | 19,102,611 | | | | 19,076,898 | | | | 25,713 | |
Airspeed Ltd., Series 2007-1A, Cl. G2, 0.476%, 6/15/32 | | | 1/9/13-1/25/13 | | | | 5,693,682 | | | | 5,620,031 | | | | 73,651 | |
Blade Engine Securitization Ltd., Series 2006-1AW, Cl. A1, 0.496%, 9/15/41 | | | 4/19/13-5/29/13 | | | | 22,079,514 | | | | 20,581,739 | | | | 1,497,775 | |
| | | | | | | | |
| | | | | | $ | 56,875,807 | | | $ | 46,174,654 | | | $ | 10,701,153 | |
| | | | | | | | |
5. Represents securities sold under Rule 144A, which are exempt from registration under the Securities Act of 1933, as amended. These securities have been determined to be liquid under guidelines established by the Board of Trustees. These securities amount to $28,852,229 or 3.08% of the Fund’s net assets at period end.
6. This bond has no contractual maturity date, is not redeemable and contractually pays an indefinite stream of interest. Rate reported represents the current interest rate for this variable rate security.
7. All or a portion of the security position is when-issued or delayed delivery to be delivered and settled after period end. See Note 4 of the accompanying Consolidated Notes.
8. Subject to a forbearance agreement. Rate shown is the contractual interest rate. See Note 4 of the accompanying Notes.
9. This security is not accruing income because the issuer has missed an interest payment on it and/or is not anticipated to make future interest and or principal payments. The rate shown is the contractual interest rate. See Note 4 of the accompanying Notes.
10. Is or was an affiliate, as defined in the Investment Company Act of 1940, as amended, at or during the reporting period, by virtue of the Fund owning at least 5% of the voting securities of the issuer or as a result of the Fund and the issuer having the same investment adviser. Transactions during the reporting period in which the issuer was an affiliate are as follows:
| | | | | | | | | | | | | | | | |
| | | Shares October 31, 2014 | | | Gross Additions | | | Gross Reductions | | | Shares October 30, 2015 | |
| |
Oppenheimer Institutional Money Market Fund, Cl. E | | | 40,870,565 | | | | 309,552,822 | | | | 212,224,921 | | | | 138,198,466 | |
Oppenheimer Master Loan Fund, LLC | | | 8,288,014 | | | | — | | | | 6,917,494 | | | | 1,370,520 | |
| | | | |
| | | | | | Value | | | Income | | | Realized Gain | |
| |
Oppenheimer Institutional Money Market Fund, Cl. E | | | $ | 138,198,466 | | | $ | 71,427 | | | $ | — | |
Oppenheimer Master Loan Fund, LLC | | | | | | | 20,053,001 | | | | 3,635,162 | | | | 1,709,006 | |
| | | | | | | | |
Total | | | | | | $ | 158,251,467 | | | $ | 3,706,589 | | | $ | 1,709,006 | |
| | | | | | | | |
11. Rate shown is the 7-day yield at period end.
12. Interest or dividend is paid-in-kind, when applicable.
13. All or a portion of this security is owned by the subsidiary. See accompanying Consolidated Notes.
| | | | | | | | |
| | | Shares Sold
Short | | | Value | |
| |
Securities Sold Short—(21.1)% | | | | | | | | |
Common Stock Securities Sold Short—(21.1)% | | | | | | | | |
Aflac, Inc. | | | (166,400) | | | $ | (10,608,000) | |
| |
AGCO Corp. | | | (68,840) | | | | (3,331,168) | |
| |
Air Lease Corp., Cl. A | | | (348,080) | | | | (11,733,777) | |
43 OPPENHEIMER FUNDAMENTAL ALTERNATIVES FUND
CONSOLIDATED STATEMENT OF INVESTMENTS Continued
| | | | | | | | |
| | | Shares Sold
Short | | | Value | |
| |
Common Stock Securities Sold Short (Continued) | | | | | | | | |
| |
Aircastle Ltd. | | | (113,640) | | | $ | (2,575,082) | |
| |
Aker Solutions ASA | | | (427,921) | | | | (1,720,284) | |
| |
Assurant, Inc. | | | (76,020) | | | | (6,197,911) | |
| |
athenahealth, Inc. | | | (20,100) | | | | (3,064,245) | |
| |
BHP Billiton Ltd., Sponsored ADR | | | (140,730) | | | | (4,628,610) | |
| |
Boeing Co. (The) | | | (56,454) | | | | (8,359,144) | |
| |
Camden Property Trust | | | (71,830) | | | | (5,300,336) | |
| |
Caterpillar, Inc. | | | (105,770) | | | | (7,720,152) | |
| |
CBL & Associates Properties, Inc. | | | (253,000) | | | | (3,688,740) | |
| |
Charter Communications, Inc., Cl. A | | | (20,620) | | | | (3,937,183) | |
| |
Cheniere Energy, Inc. | | | (122,840) | | | | (6,083,037) | |
| |
Cie Financiere Richemont SA | | | (62,863) | | | | (5,376,791) | |
| |
ClubCorp Holdings, Inc. | | | (370,960) | | | | (7,582,422) | |
| |
CNH Industrial NV | | | (148,170) | | | | (1,006,074) | |
| |
Comcast Corp., Cl. A | | | (110,570) | | | | (6,923,894) | |
| |
Comerica, Inc. | | | (93,030) | | | | (4,037,502) | |
| |
Commerce Bancshares, Inc. | | | (87,309) | | | | (3,976,925) | |
| |
Deere & Co. | | | (66,280) | | | | (5,169,840) | |
| |
Ensco plc, Cl. A | | | (307,740) | | | | (5,117,716) | |
| |
Finish Line, Inc. (The), Cl. A | | | (174,110) | | | | (3,243,669) | |
| |
First Niagara Financial Group, Inc. | | | (266,030) | | | | (2,753,411) | |
| |
FirstMerit Corp. | | | (185,570) | | | | (3,486,860) | |
| |
Gulfmark Offshore, Inc., Cl. A | | | (254,310) | | | | (1,586,894) | |
| |
Nasdaq, Inc. | | | (48,960) | | | | (2,834,294) | |
| |
Nationstar Mortgage Holdings, Inc. | | | (119,720) | | | | (1,588,684) | |
| |
Oracle Corp. | | | (135,280) | | | | (5,254,275) | |
| |
Pennsylvania Real Estate Investment Trust | | | (514,760) | | | | (11,571,804) | |
| |
Rio Tinto plc, Sponsored ADR | | | (80,687) | | | | (2,945,882) | |
| |
RLJ Lodging Trust | | | (90,900) | | | | (2,280,681) | |
| |
Rouse Properties, Inc. | | | (243,482) | | | | (4,282,848) | |
| |
Southern Copper Corp. | | | (234,675) | | | | (6,514,578) | |
| |
Subsea 7 SA | | | (566,256) | | | | (4,441,495) | |
| |
Tidewater, Inc. | | | (282,850) | | | | (3,493,198) | |
| |
Tiffany & Co. | | | (75,985) | | | | (6,264,204) | |
| |
Time Warner, Inc. | | | (75,620) | | | | (5,697,211) | |
| |
Transocean Ltd. | | | (40,152) | | | | (635,606) | |
| |
Weingarten Realty Investors | | | (235,840) | | | | (8,433,638) | |
| |
Zions Bancorporation | | | (90,900) | | | | (2,615,193) | |
| | | | | | | | |
Total Securities Sold Short (Proceeds $196,060,352) | | | | | | $ | (198,063,258) | |
| | | | | | | | |
| | | | | | | | | | | | | | | | | | | | | | | | | | |
| |
Forward Currency Exchange Contracts as of October 30, 2015 | | | | | |
| Counterparty | | Settlement Month(s) | | | | | Currency Purchased (000’s) | | | | | | Currency Sold (000’s) | | | Unrealized
Appreciation | | | Unrealized Depreciation | |
| |
BOA | | 11/2015 | | | USD | | | | 12,532 | | | | CAD | | | | 15,620 | | | $ | 587,779 | | | $ | — | |
BOA | | 11/2015 | | | USD | | | | 2,629 | | | | EUR | | | | 2,400 | | | | — | | | | 10,212 | |
BOA | | 11/2015 | | | USD | | | | 9,875 | | | | JPY | | | | 1,183,000 | | | | 70,389 | | | | — | |
44 OPPENHEIMER FUNDAMENTAL ALTERNATIVES FUND
| | | | | | | | | | | | | | | | | | | | | | | | | | |
| |
Forward Currency Exchange Contracts (Continued) | | | | | | | | | | | | | |
| Counterparty | | Settlement
Month(s) | | | | | Currency
Purchased
(000’s) | | | | | | Currency Sold (000’s) | | | Unrealized Appreciation | | | Unrealized Depreciation | |
| |
BOA | | 11/2015 | | | USD | | | | 7,932 | | | | THB | | | | 290,000 | | | $ | — | | | $ | 216,436 | |
CITNA-B | | 11/2015 | | | USD | | | | 11,840 | | | | AUD | | | | 16,930 | | | | — | | | | 221,734 | |
DEU | | 11/2015 | | | NOK | | | | 14,380 | | | | USD | | | | 1,679 | | | | 13,264 | | | | — | |
GSCO-OT | | 11/2015 | | | USD | | | | 1,436 | | | | JPY | | | | 174,000 | | | | — | | | | 5,905 | |
JPM | | 11/2015 | | | USD | | | | 9,249 | | | | CHF | | | | 9,000 | | | | 139,433 | | | | — | |
JPM | | 11/2015 | | | USD | | | | 18,310 | | | | EUR | | | | 16,325 | | | | 353,995 | | | | — | |
JPM | | 11/2015 | | | USD | | | | 6,902 | | | | SEK | | | | 58,290 | | | | 76,817 | | | | — | |
JPM | | 11/2015 | | | USD | | | | 1,202 | | | | THB | | | | 43,000 | | | | — | | | | 5,916 | |
RBS | | 11/2015 | | | SEK | | | | 34,900 | | | | USD | | | | 4,130 | | | | — | | | | 43,829 | |
| | | | | | | | | | | | | | | | | | | | | | |
Total Unrealized Appreciation and Depreciation | | | | | | | | | | | $ | 1,241,677 | | | $ | 504,032 | |
| | | | | | | | | | | | | | | | | | | | | | |
| | | | | | | | | | | | | | | | | | | | | | | | |
| |
Futures Contracts as of October 30, 2015 | | | | | | | | | |
| Description | | Exchange | | | Buy/Sell | | | Expiration
Date | | | Number of
Contracts | | | Value | | | Unrealized
Depreciation | |
| |
Euro-BTP | | | EUX | | | | Sell | | | | 12/8/15 | | | | 49 | | | $ | 7,486,483 | | | $ | 241,528 | |
United States Treasury Nts., 10 yr. | | | CBT | | | | Sell | | | | 12/21/15 | | | | 75 | | | | 9,576,563 | | | | 23,906 | |
| | | | | | | | | | | | | | | | | | | | | | | | |
| | | | | | | | | | | | | | | | | | | | | | $ | 265,434 | |
| | | | | | | | | | | | | | | | | | | | | | | | |
| | | | | | | | | | | | | | | | | | | | | | | | | | | | |
| |
Centrally Cleared Credit Default Swaps at October 30, 2015 | | | | | | | | | | | | | |
| Reference Asset | | Buy/Sell Protection | | | Fixed
Rate | | | Maturity
Date | | | | | | Notional Amount (000’s) | | | Premiums
Received/(Paid) | | | Value | |
| |
CDX.HY.24 | | | Buy | | | | 5.000% | | | | 6/20/20 | | | | USD | | | | 19,206 | | | $ | 1,485,497 | | | $ | (1,098,719) | |
| |
CDX.IG.24 | | | Sell | | | | 1.000 | | | | 6/20/20 | | | | USD | | | | 25,000 | | | | (493,930) | | | | 286,761 | |
| |
CDX.IG.24 | | | Sell | | | | 1.000 | | | | 6/20/20 | | | | USD | | | | 25,000 | | | | (367,884) | | | | 286,761 | |
| |
iTraxx.Main.23 | | | Buy | | | | 1.000 | | | | 6/20/20 | | | | EUR | | | | 23,500 | | | | 589,610 | | | | (399,331) | |
| |
iTraxx.Main.23 | | | Buy | | | | 1.000 | | | | 6/20/20 | | | | EUR | | | | 21,500 | | | | 303,220 | | | | (365,345) | |
| | | | | | | | | | | | | | | | | | | | | | | | |
Total Centrally Cleared Credit Default Swaps | | | | | | | | | | | | | | | $ | 1,516,513 | | | $ | (1,289,873) | |
| | | | | | | | | | | | | | | | | | | | | | | | |
| | | | | | | | | | | | | | | | | | | | | | | | | | | | |
| |
Over-the-Counter Credit Default Swaps at October 30, 2015 | | | | | | | | | |
| Reference Asset | | Counterparty | | | Buy/Sell Protection | | | Fixed Rate | | | Maturity Date | | | Notional Amount (000’s) | | | Premiums Received/(Paid) | | | Value | |
| |
Kingdom of Spain | | | BOA | | | | Buy | | | | 1.000% | | | | 6/20/20 | USD | | | 25,000 | | | $ | 169,615 | | | $ | (158,213) | |
| |
Malaysia | | | BAC | | | | Buy | | | | 1.000 | | | | 12/20/20 | USD | | | 2,900 | | | | (136,197) | | | | 131,810 | |
| |
Malaysia | | | BNP | | | | Buy | | | | 1.000 | | | | 12/20/20 | USD | | | 10,000 | | | | (651,135) | | | | 455,817 | |
| |
Malaysia | | | MOS-A | | | | Buy | | | | 1.000 | | | | 12/20/20 | USD | | | 10,000 | | | | (502,319) | | | | 455,817 | |
| |
Portuguese Republic | | | GSG | | | | Buy | | | | 1.000 | | | | 6/20/20 | USD | | | 15,000 | | | | (304,084) | | | | 440,084 | |
| |
Republic of Austria | | | GSG | | | | Buy | | | | 1.000 | | | | 6/20/20 | USD | | | 8,500 | | | | 305,878 | | | | (300,556) | |
| |
Republic of Italy | | | GSG | | | | Buy | | | | 1.000 | | | | 6/20/20 | USD | | | 30,000 | | | | (133,466) | | | | (3,913) | |
| | | | | | | | | | | | | | | | | | | | | | | | |
Total Over-the-Counter Credit Default Swaps | | | | | | | | | | | $ | (1,251,708) | | | $ | 1,020,846 | |
| | | | | | | | | | | | | | | | | | | | | | | | |
45 OPPENHEIMER FUNDAMENTAL ALTERNATIVES FUND
CONSOLIDATED STATEMENT OF INVESTMENTS Continued
The table that follows shows the undiscounted maximum potential payment by the Fund related to selling credit protection in credit default swaps:
| | | | | | | | | | | | |
Type of Reference Asset on which the Fund Sold Protection | | Total Maximum Potential
Payments for Selling
Credit Protection
(Undiscounted) | | | Amount Recoverable* | | | Reference Asset Rating Range** | |
| |
Investment Grade Corporate Debt Indexes | | | $50,000,000 | | | | $— | | | | BBB+ | |
* The Fund has no amounts recoverable from related purchased protection. In addition, the Fund has no recourse provisions under the credit derivatives and holds no collateral which can offset or reduce potential payments under a triggering event.
** The period end reference asset security ratings, as rated by any rating organization, are included in the equivalent Standard & Poor’s rating category. The reference asset rating represents the likelihood of a potential credit event on the reference asset which would result in a related payment by the Fund.
| | | | | | | | | | | | | | | | | | | | | | | | | | | | |
| |
Over-the-Counter Interest Rate Swaps at October 30, 2015 | | | | | | | | | | | | | |
| Counterparty | | Pay/Receive
Floating
Rate | | | Floating
Rate | | | Fixed
Rate | | | Maturity
Date | | | Notional Amount (000’s) | | | Value | |
| |
| | | | | | | CNY | | | | | | | | | | | | | | | | | | | | | |
| | | | | | | CNREPOFIX | | | | | | | | | | | | | | | | | | | | | |
BOA | | | Pay | | | | =CFXS | | | | 2.900% | | | | 7/24/20 | | | | CNY | | | | 84,000 | | | $ | 55,533 | |
| |
| | | | | | | CNY | | | | | | | | | | | | | | | | | | | | | |
| | | | | | | CNREPOFIX | | | | | | | | | | | | | | | | | | | | | |
GSG | | | Pay | | | | =CFXS | | | | 2.830 | | | | 8/14/20 | | | | CNY | | | | 19,000 | | | | 5,736 | |
| | | | | | | | | | | | | | | | | | | | | | | | | | | | |
Total Over-the-Counter Interest Rate Swaps | | | | | | | | | | | | | | | | | | | $ | 61,269 | |
| | | | | | | | | | | | | | | | | | | | | | | | | | | | |
| | | | | | | | | | | | | | | | | | | | | | | | |
| |
Over-the-Counter Total Return Swaps at October 30, 2015 | | | | | | | | | |
| Reference Asset | | Counterparty | | | Pay/Receive Total Return* | | | Floating Rate | | | Maturity Date | | | Notional Amount
(000’s) | | | Value | |
| |
| | | | | | | | | | | Twelve-Month | | | | | | | | | | | | | |
| | | | | | | | | |
| USD BBA LIBOR
plus 74 basis |
| | | | | | | | | | | | |
Blackstone Group LP | | | GSG | | | | Receive | | | | points | | | | 7/22/16 | USD | | | 11,416 | | | $ | (2,203,077) | |
* Fund will pay or receive the total return of the reference asset depending on whether the return is positive or negative. For contracts where the Fund has elected to receive the total return of the reference asset if positive, it will be responsible for paying the floating rate and the total return of the reference asset if negative. If the Fund has elected to pay the total return of the reference asset if positive, it will receive the floating rate and the total return of the reference asset if negative.
| | |
Glossary: | | |
Counterparty Abbreviations |
BAC | | Barclays Bank plc |
BNP | | BNP Paribas |
BOA | | Bank of America NA |
CITNA-B | | Citibank NA |
DEU | | Deutsche Bank AG |
GSCO-OT | | Goldman Sachs Bank USA |
GSG | | Goldman Sachs Group, Inc. (The) |
JPM | | JPMorgan Chase Bank NA |
MOS-A | | Morgan Stanley |
RBS | | Royal Bank of Scotland plc (The) |
46 OPPENHEIMER FUNDAMENTAL ALTERNATIVES FUND
| | |
Currency abbreviations indicate amounts reporting in currencies |
AUD | | Australian Dollar |
CAD | | Canadian Dollar |
CHF | | Swiss Franc |
CNH | | Offshore Chinese Renminbi |
CNY | | Chinese Renminbi |
EUR | | Euro |
JPY | | Japanese Yen |
NOK | | Norwegian Krone |
SEK | | Swedish Krona |
THB | | Thailand Baht |
| |
Definitions | | |
BBA LIBOR | | British Bankers’ Association London - Interbank Offered Rate |
CNREPOFIX | | |
=CFXS | | Repurchase Fixing Rates |
CDX.HY.24 | | Markit CDX High Yield Index |
iTraxx.Main.23 | | Credit Default Swap Trading Index for a Specific Basket of Securities |
|
Exchange Abbreviations |
CBT | | Chicago Board of Trade |
EUX | | European Stock Exchange |
See accompanying Notes to Consolidated Financial Statements.
47 OPPENHEIMER FUNDAMENTAL ALTERNATIVES FUND
CONSOLIDATED STATEMENT OF
ASSETS AND LIABILITIES October 30, 20151
| | |
|
| Assets | | |
| Investments, at value—see accompanying statement of investments: | | |
| Unaffiliated companies (cost $720,110,093) | | $ 778,631,988 |
| Affiliated companies (cost $162,942,053) | | 158,251,467 |
| | |
| | 936,883,455 |
|
| Cash | | 8,061,306 |
|
| Cash used for collateral on futures | | 960,204 |
|
| Cash used for collateral on OTC derivatives | | 1,510,000 |
|
| Cash used for collateral on centrally cleared swaps | | 2,727,332 |
|
| Deposits with broker for securities sold short | | 213,785,785 |
|
| Deposits with broker for foreign securities sold short (cost $11,599,821) | | 11,100,897 |
|
| Unrealized appreciation on forward currency exchange contracts | | 1,241,677 |
|
| Swaps, at value (premiums received $1,593,735) | | 1,544,797 |
|
| Centrally cleared swaps, at value (premiums received $861,814 ) | | 573,522 |
|
| Receivables and other assets: | | |
| Redemption from Oppenheimer Master Loan Fund, LLC (cost $180,364) | | 64 |
| Investments sold (including $1,478,520 sold on a when-issued or delayed delivery basis) | | 12,779,641 |
| Shares of beneficial interest sold | | 5,543,659 |
| Interest and dividends | | 1,905,511 |
| Variation margin receivable | | 523 |
| Other | | 132,356 |
| | |
Total assets | | 1,198,750,729 |
|
| Liabilities | | |
| Securities sold short, at value (proceeds $196,060,352) - see accompanying statement of investments | | 198,063,258 |
|
| Unrealized depreciation on forward currency exchange contracts | | 504,032 |
|
| Swaps, at value (premiums received $342,027) | | 2,665,759 |
|
| Centrally cleared swaps, at value (premiums received $2,378,327) | | 1,863,395 |
|
| Payables and other liabilities: | | |
| Investments purchased (including $8,796,714 purchased on a when-issued or delayed delivery basis) | | 56,914,670 |
| Shares of beneficial interest redeemed | | 576,646 |
| Trustees’ compensation | | 232,844 |
| Distribution and service plan fees | | 165,645 |
| Dividends | | 87,295 |
| Shareholder communications | | 15,540 |
| Variation margin payable | | 5,859 |
| Other | | 28,460 |
| | |
Total liabilities | | 261,123,403 |
|
Net Assets | | $ 937,627,326 |
| | |
1. October 30, 2015 represents the last business day of the Fund’s reporting period. See Note 2 of the accompanying Consolidated Notes.
48 OPPENHEIMER FUNDAMENTAL ALTERNATIVES FUND
| | |
|
| Composition of Net Assets | | |
| Par value of shares of beneficial interest | | $ 351,911 |
|
| Additional paid-in capital | | 885,601,468 |
|
| Accumulated net investment income | | 4,080,475 |
|
| Accumulated net realized loss on investments and foreign currency transactions | | (1,851,295) |
|
| Net unrealized appreciation on investments and translation of assets and liabilities denominated in foreign currencies | | 49,444,767 |
| | |
Net Assets | | $ 937,627,326 |
| | |
|
|
| Net Asset Value Per Share | | |
Class A Shares: | | |
| Net asset value and redemption price per share (based on net assets of $642,669,901 and 23,806,178 shares of beneficial interest outstanding) | | $27.00 |
| Maximum offering price per share (net asset value plus sales charge of 5.75% of offering price) | | $28.65 |
|
Class B Shares: | | |
| Net asset value, redemption price (excludes applicable contingent deferred sales charge) and offering price per share (based on net assets of $14,201,337 and 588,124 shares of beneficial interest outstanding) | | $24.15 |
|
Class C Shares: | | |
| Net asset value, redemption price (excludes applicable contingent deferred sales charge) and offering price per share (based on net assets of $117,152,427 and 4,851,694 shares of beneficial interest outstanding) | | $24.15 |
|
Class I Shares: | | |
| Net asset value, redemption price and offering price per share (based on net assets of $59,213,623 and 2,131,020 shares of beneficial interest outstanding) | | $27.79 |
|
Class R Shares: | | |
| Net asset value, redemption price (excludes applicable contingent deferred sales charge) and offering price per share (based on net assets of $17,140,907 and 662,191 shares of beneficial interest outstanding) | | $25.89 |
|
Class Y Shares: | | |
| Net asset value, redemption price and offering price per share (based on net assets of $87,249,131 and 3,151,932 shares of beneficial interest outstanding) | | $27.68 |
See accompanying Notes to Consolidated Financial Statements.
49 OPPENHEIMER FUNDAMENTAL ALTERNATIVES FUND
CONSOLIDATED STATEMENT OF
OPERATIONS For the Year Ended October 30, 20151
| | |
|
| Allocation of Income and Expenses from Master Funds2 | | |
| Net investment income allocated from Oppenheimer Master Loan Fund, LLC: | | |
| Interest | | $ 3,603,246 |
| Dividends | | 31,916 |
| Net expenses | | (225,876) |
| | |
| Net investment income allocated from Oppenheimer Master Loan Fund, LLC | | 3,409,286 |
|
| Investment Income | | |
| Interest | | 12,144,962 |
|
| Dividends: | | |
| Unaffiliated companies (net of foreign withholding taxes of $198,345) | | 10,948,551 |
| Affiliated companies | | 71,427 |
| | |
Total investment income | | 23,164,940 |
|
| Expenses | | |
| Management fees | | 7,209,780 |
|
| Distribution and service plan fees: | | |
| Class A | | 1,525,870 |
| Class B | | 190,639 |
| Class C | | 1,099,307 |
| Class R | | 83,496 |
|
| Transfer and shareholder servicing agent fees: | | |
| Class A | | 1,392,796 |
| Class B | | 42,166 |
| Class C | | 242,966 |
| Class I | | 2,517 |
| Class R | | 37,073 |
| Class Y | | 75,335 |
|
| Shareholder communications: | | |
| Class A | | 45,565 |
| Class B | | 3,054 |
| Class C | | 7,434 |
| Class I | | 1 |
| Class R | | 1,131 |
| Class Y | | 1,731 |
|
| Dividends on short sales | | 4,920,400 |
|
| Financing expense from short sales | | 1,503,043 |
|
| Trustees’ compensation | | 29,920 |
|
| Custodian fees and expenses | | 8,043 |
|
| Borrowing fees | | 3,726 |
|
| Other | | 204,341 |
| | |
| Total expenses | | 18,630,334 |
1. October 30, 2015 represents the last business day of the Fund’s reporting period. See Note 2 of the accompanying Consolidated Notes.
2. The Fund invests in a certain affiliated mutual fund that expects to be treated as a partnership for tax purposes.
See Note 4 of the accompanying Consolidated Notes.
50 OPPENHEIMER FUNDAMENTAL ALTERNATIVES FUND
| | |
|
| Expenses (Continued) | | |
| Less reduction to custodian expenses | | $ (95) |
| Less waivers and reimbursements of expenses | | (472,106) |
| | |
Net expenses | | 18,158,133 |
|
Net Investment Income | | 8,416,093 |
|
| Realized and Unrealized Gain (Loss) | | |
| Net realized gain (loss) on: | | |
| Investments from unaffiliated companies (includes premiums on options exercised) | | 28,377,092 |
| Closing and expiration of futures contracts | | (3,726,573) |
| Foreign currency transactions | | 6,186,629 |
| Short positions | | 5,572,583 |
| Swap contracts | | (256,703) |
|
| Net realized gain allocated from Oppenheimer Master Loan Fund, LLC | | 1,709,006 |
| | |
| Net realized gain | | 37,862,034 |
|
| Net change in unrealized appreciation/depreciation on: | | |
| Investments | | (38,158,718) |
| Translation of assets and liabilities denominated in foreign currencies | | (1,184,392) |
| Futures contracts | | 2,021,599 |
| Short positions | | 20,775,703 |
| Swap contracts | | (1,404,407) |
|
| Net change in unrealized appreciation/depreciation allocated from Oppenheimer Master Loan Fund, LLC | | (3,497,135) |
| | |
Net change in unrealized appreciation/depreciation | | (21,447,350) |
|
Net Increase in Net Assets Resulting from Operations | | $ 24,830,777 |
| | |
See accompanying Notes to Consolidated Financial Statements.
51 OPPENHEIMER FUNDAMENTAL ALTERNATIVES FUND
CONSOLIDATED STATEMENTS OF CHANGES IN NET ASSETS
| | | | | | |
| | | Year Ended October 30, 20151 | | | Year Ended
October 31, 2014 |
|
| Operations | | | | | | |
| Net investment income | | $ | 8,416,093 | | | $ 8,245,385 |
|
| Net realized gain | | | 37,862,034 | | | 44,125,884 |
|
| Net change in unrealized appreciation/depreciation | | | (21,447,350) | | | 18,179,544 |
| | | | | | |
Net increase in net assets resulting from operations | | | 24,830,777 | | | 70,550,813 |
|
| Dividends and/or Distributions to Shareholders | | | | | | |
| Dividends from net investment income: | | | | | | |
| Class A | | | (11,377,733) | | | — |
| Class B | | | (264,034) | | | — |
| Class C | | | (1,406,772) | | | — |
| Class I | | | (245) | | | — |
| Class R2 | | | (264,122) | | | — |
| Class Y | | | (395,622) | | | — |
| | | |
| | | (13,708,528) | | | — |
|
| Beneficial Interest Transactions | | | | | | |
| Net increase (decrease) in net assets resulting from beneficial interest transactions: | | | | | | |
| Class A | | | (8,609,111) | | | (82,035,611) |
| Class B | | | (11,336,193) | | | (11,579,268) |
| Class C | | | 5,538,324 | | | (11,356,414) |
| Class I | | | 58,913,333 | | | — |
| Class R2 | | | (381,009) | | | (4,758,398) |
| Class Y | | | 67,220,726 | | | 7,106,738 |
| | | | | | |
| | | 111,346,070 | | | (102,622,953) |
|
| Net Assets | | | | | | |
| Total increase (decrease) | | | 122,468,319 | | | (32,072,140) |
|
| Beginning of period | | | 815,159,007 | | | 847,231,147 |
| | | | | | |
End of period (including accumulated net investment income of $4,080,475 and $11,413,762, respectively) | | $ | 937,627,326 | | | $ 815,159,007 |
| | | |
1. October 30, 2015 represents the last business day of the Fund’s reporting period. See Note 2 of the accompanying Consolidated Notes.
2. Effective July 1, 2014, Class N shares were renamed Class R. See Note 1 of the accompanying Consolidated Notes.
See accompanying Notes to Consolidated Financial Statements.
52 OPPENHEIMER FUNDAMENTAL ALTERNATIVES FUND
CONSOLIDATED FINANCIAL HIGHLIGHTS
| | | | | | | | | | | | | | | | | | |
| Class A | | Year Ended
October 30, 20151 | | | Year Ended
October 31, 2014 | | | Year Ended
October 31, 2013 | | | Year Ended
October 31, 2012 | | | Year Ended
October 31, 2011 |
|
| Per Share Operating Data | | | | | | | | | | | | | | | | | | |
| Net asset value, beginning of period | | $ | 26.64 | | | $ | 24.48 | | | $ | 23.35 | | | $ | 25.55 | | | $ 26.01 |
|
| Income (loss) from investment operations: | | | | | | | | | | | | | | | | | | |
| Net investment income (loss)2 | | | 0.30 | | | | 0.29 | | | | 0.30 | | | | 0.04 | | | (0.17) |
| Net realized and unrealized gain (loss) | | | 0.53 | | | | 1.87 | | | | 0.83 | | | | (0.10) | | | 0.22 |
| | | |
| Total from investment operations | | | 0.83 | | | | 2.16 | | | | 1.13 | | | | (0.06) | | | 0.05 |
|
| Dividends and/or distributions to shareholders: | | | | | | | | | | | | | | | | | | |
| Dividends from net investment income | | | (0.47) | | | | 0.00 | | | | 0.00 | | | | 0.00 | | | 0.00 |
| Distributions from net realized gain | | | 0.00 | | | | 0.00 | | | | 0.00 | | | | (2.13) | | | (0.51) |
| Tax return of capital distribution | | | 0.00 | | | | 0.00 | | | | 0.00 | | | | (0.01) | | | 0.00 |
| | | |
| Total dividends and/or distributions to shareholders | | | (0.47) | | | | 0.00 | | | | 0.00 | | | | (2.14) | | | (0.51) |
|
| Net asset value, end of period | | $ | 27.00 | | | $ | 26.64 | | | $ | 24.48 | | | $ | 23.35 | | | $ 25.55 |
| | | |
|
|
| Total Return, at Net Asset Value3 | | | 3.18% | | | | 8.82% | | | | 4.84% | | | | 0.03% | | | 0.14% |
|
|
| Ratios/Supplemental Data | | | | | | | | | | | | | | | | | | |
| Net assets, end of period (in thousands) | | $ | 642,670 | | | $ | 642,789 | | | $ | 668,235 | | | $ | 774,007 | | | $ 1,024,109 |
|
| Average net assets (in thousands) | | $ | 636,510 | | | $ | 662,351 | | | $ | 721,521 | | | $ | 870,856 | | | $ 1,165,257 |
|
| Ratios to average net assets:4 | | | | | | | | | | | | | | | | | | |
| Net investment income (loss) | | | 1.14%5 | | | | 1.12%5 | | | | 1.25%5 | | | | 0.19%5 | | | (0.65)% |
| Expenses excluding interest and fees from borrowings | | | 2.17%5,6 | | | | 2.39%5 | | | | 2.04%5 | | | | 1.85%5 | | | 1.57% |
| Interest and fees from borrowings | | | 0.00%7 | | | | 0.00% | | | | 0.00% | | | | 0.00% | | | 0.00% |
| | | |
| Total expenses8 | | | 2.17%5,6 | | | | 2.39%5 | | | | 2.04%5 | | | | 1.85%5 | | | 1.57% |
| Expenses after payments, waivers and/or reimbursements and reduction to custodian expenses | | | 2.12%5,6 | | | | 2.25%5 | | | | 1.97%5 | | | | 1.78%5 | | | 1.52% |
|
| Portfolio turnover rate | | | 62% | | | | 44% | | | | 76% | | | | 212% | | | 181% |
1. October 30, 2015 represents the last business day of the Fund’s reporting period. See Note 2 of the accompanying Consolidated Notes.
2. Per share amounts calculated based on the average shares outstanding during the period.
3. Assumes an initial investment on the business day before the first day of the fiscal period, with all dividends and distributions reinvested in additional shares on the reinvestment date, and redemption at the net asset value calculated on the last business day of the fiscal period. Sales charges are not reflected in the total returns. Total returns are not annualized for periods less than one full year. Returns do not reflect the deduction of taxes that a shareholder would pay on fund distributions or the redemption of fund shares. The returns do not include adjustments in accordance with generally accepted accounting principles required at the period end for financial reporting purposes.
4. Annualized for periods less than one full year.
5. Includes the Fund’s share of the allocated expenses and/or net investment income from the master funds.
6. Includes dividend and borrowing expense on securities sold short of 0.60% and 0.18%, respectively.
7. Less than 0.005%.
8. Total expenses including indirect expenses from affiliated fund fees and expenses were as follows:
| | | | |
Year Ended October 30, 2015 | | | 2.18 | % |
Year Ended October 31, 2014 | | | 2.40 | % |
Year Ended October 31, 2013 | | | 2.06 | % |
Year Ended October 31, 2012 | | | 1.90 | % |
Year Ended October 31, 2011 | | | 1.62 | % |
See accompanying Notes to Consolidated Financial Statements.
53 OPPENHEIMER FUNDAMENTAL ALTERNATIVES FUND
CONSOLIDATED FINANCIAL HIGHLIGHTS Continued
| | | | | | | | | | | | | | | | | | |
| Class B | | Year Ended
October 30, 20151 | | | Year Ended
October 31, 2014 | | | Year Ended
October 31, 2013 | | | Year Ended
October 31, 2012 | | | Year Ended
October 31, 2011 |
|
| Per Share Operating Data | | | | | | | | | | | | | | | | | | |
| Net asset value, beginning of period | | $ | 23.84 | | | $ | 22.08 | | | $ | 21.25 | | | $ | 23.63 | | | $ 24.32 |
|
| Income (loss) from investment operations: | | | | | | | | | | | | | | | | | | |
| Net investment income (loss)2 | | | 0.15 | | | | 0.08 | | | | 0.08 | | | | (0.15) | | | (0.38) |
| Net realized and unrealized gain (loss) | | | 0.42 | | | | 1.68 | | | | 0.75 | | | | (0.09) | | | 0.20 |
| | | |
| Total from investment operations | | | 0.57 | | | | 1.76 | | | | 0.83 | | | | (0.24) | | | (0.18) |
|
| Dividends and/or distributions to shareholders: | | | | | | | | | | | | | | | | | | |
| Dividends from net investment income | | | (0.26) | | | | 0.00 | | | | 0.00 | | | | 0.00 | | | 0.00 |
| Distributions from net realized gain | | | 0.00 | | | | 0.00 | | | | 0.00 | | | | (2.13) | | | (0.51) |
| Tax return of capital distribution | | | 0.00 | | | | 0.00 | | | | 0.00 | | | | (0.01) | | | 0.00 |
| | | |
| Total dividends and/or distributions to shareholders | | | (0.26) | | | | 0.00 | | | | 0.00 | | | | (2.14) | | | (0.51) |
|
| Net asset value, end of period | | $ | 24.15 | | | $ | 23.84 | | | $ | 22.08 | | | $ | 21.25 | | | $ 23.63 |
| | | |
| | | | | | | | | | | | | | | | | | |
|
| Total Return, at Net Asset Value3 | | | 2.40% | | | | 7.97% | | | | 3.91% | | | | (0.79)% | | | (0.81)% |
|
|
| Ratios/Supplemental Data | | | | | | | | | | | | | | | | | | |
| Net assets, end of period (in thousands) | | $ | 14,201 | | | $ | 25,296 | | | $ | 34,346 | | | $ | 46,780 | | | $ 68,426 |
|
| Average net assets (in thousands) | | $ | 19,249 | | | $ | 30,329 | | | $ | 40,057 | | | $ | 56,004 | | | $ 82,022 |
|
| Ratios to average net assets:4 | | | | | | | | | | | | | | | | | | |
| Net investment income (loss) | | | 0.61%5 | | | | 0.34%5 | | | | 0.35%5 | | | | (0.70)%5 | | | (1.55)% |
| Expenses excluding interest and fees from borrowings | | | 2.94%5,6 | | | | 3.26%5 | | | | 3.06%5 | | | | 2.85%5 | | | 2.57% |
| Interest and fees from borrowings | | | 0.00%7 | | | | 0.00% | | | | 0.00% | | | | 0.00% | | | 0.00% |
| | | |
| Total expenses8 | | | 2.94%5,6 | | | | 3.26%5 | | | | 3.06%5 | | | | 2.85%5 | | | 2.57% |
| Expenses after payments, waivers and/or reimbursements and reduction to custodian expenses | | | 2.89%5,6 | | | | 3.06%5 | | | | 2.86%5 | | | | 2.67%5 | | | 2.43% |
|
| Portfolio turnover rate | | | 62% | | | | 44% | | | | 76% | | | | 212% | | | 181% |
1. October 30, 2015 represents the last business day of the Fund’s reporting period. See Note 2 of the accompanying Consolidated Notes.
2. Per share amounts calculated based on the average shares outstanding during the period.
3. Assumes an initial investment on the business day before the first day of the fiscal period, with all dividends and distributions reinvested in additional shares on the reinvestment date, and redemption at the net asset value calculated on the last business day of the fiscal period. Sales charges are not reflected in the total returns. Total returns are not annualized for periods less than one full year. Returns do not reflect the deduction of taxes that a shareholder would pay on fund distributions or the redemption of fund shares. The returns do not include adjustments in accordance with generally accepted accounting principles required at the period end for financial reporting purposes.
4. Annualized for periods less than one full year.
5. Includes the Fund’s share of the allocated expenses and/or net investment income from the master funds.
6. Includes dividend and borrowing expense on securities sold short of 0.60% and 0.18%, respectively.
7. Less than 0.005%.
8. Total expenses including indirect expenses from affiliated fund fees and expenses were as follows:
| | | | |
Year Ended October 30, 2015 | | | 2.95 | % |
Year Ended October 31, 2014 | | | 3.27 | % |
Year Ended October 31, 2013 | | | 3.08 | % |
Year Ended October 31, 2012 | | | 2.90 | % |
Year Ended October 31, 2011 | | | 2.62 | % |
See accompanying Notes to Consolidated Financial Statements.
54 OPPENHEIMER FUNDAMENTAL ALTERNATIVES FUND
| | | | | | | | | | | | | | | | | | |
| Class C | | Year Ended
October 30, 20151 | | | Year Ended
October 31, 2014 | | | Year Ended
October 31, 2013 | | | Year Ended
October 31, 2012 | | | Year Ended
October 31, 2011 |
|
| Per Share Operating Data | | | | | | | | | | | | | | | | | | |
| Net asset value, beginning of period | | $ | 23 .89 | | | $ | 22 .12 | | | $ | 21 .26 | | | $ | 23 .62 | | | $ 24.27 |
|
| Income (loss) from investment operations: | | | | | | | | | | | | | | | | | | |
| Net investment income (loss)2 | | | 0.09 | | | | 0.08 | | | | 0.10 | | | | (0.12) | | | (0.35) |
| Net realized and unrealized gain (loss) | | | 0.47 | | | | 1.69 | | | | 0.76 | | | | (0.10) | | | 0.21 |
| | | |
| Total from investment operations | | | 0.56 | | | | 1.77 | | | | 0.86 | | | | (0.22) | | | (0.14) |
|
| Dividends and/or distributions to shareholders: | | | | | | | | | | | | | | | | | | |
| Dividends from net investment income | | | (0.30) | | | | 0.00 | | | | 0.00 | | | | 0.00 | | | 0.00 |
| Distributions from net realized gain | | | 0.00 | | | | 0.00 | | | | 0.00 | | | | (2.13) | | | (0.51) |
| Tax return of capital distribution | | | 0.00 | | | | 0.00 | | | | 0.00 | | | | (0.01) | | | 0.00 |
| | | |
| Total dividends and/or distributions to shareholders | | | (0.30) | | | | 0.00 | | | | 0.00 | | | | (2.14) | | | (0.51) |
|
| Net asset value, end of period | | $ | 24.15 | | | $ | 23.89 | | | $ | 22.12 | | | $ | 21.26 | | | $ 23.62 |
| | | |
| | | | | | | | | | | | | | | | | | |
|
| Total Return, at Net Asset Value3 | | | 2.39% | | | | 8.00% | | | | 4.05% | | | | (0.71)% | | | (0.64)% |
|
|
| Ratios/Supplemental Data | | | | | | | | | | | | | | | | | | |
| Net assets, end of period (in thousands) | | $ | 117,152 | | | $ | 110,383 | | | $ | 112,993 | | | $ | 135,750 | | | $ 199,765 |
|
| Average net assets (in thousands) | | $ | 111,050 | | | $ | 112,984 | | | $ | 122,514 | | | $ | 160,258 | | | $ 233,997 |
|
| Ratios to average net assets:4 | | | | | | | | | | | | | | | | | | |
| Net investment income (loss) | | | 0.38%5 | | | | 0.36%5 | | | | 0.48%5 | | | | (0.59)%5 | | | (1.40)% |
| Expenses excluding interest and fees from borrowings | | | 2.92%5,6 | | | | 3.16%5 | | | | 2.81%5 | | | | 2.62%5 | | | 2.32% |
| Interest and fees from borrowings | | | 0.00%7 | | | | 0.00% | | | | 0.00% | | | | 0.00% | | | 0.00% |
| | | |
| Total expenses8 | | | 2.92%5,6 | | | | 3.16%5 | | | | 2.81%5 | | | | 2.62%5 | | | 2.32% |
| Expenses after payments, waivers and/or reimbursements and reduction to custodian expenses | | | 2.87%5,6 | | | | 3.02%5 | | | | 2.74%5 | | | | 2.55%5 | | | 2.27% |
|
| Portfolio turnover rate | | | 62% | | | | 44% | | | | 76% | | | | 212% | | | 181% |
1. October 30, 2015 represents the last business day of the Fund’s reporting period. See Note 2 of the accompanying Consolidated Notes.
2. Per share amounts calculated based on the average shares outstanding during the period.
3. Assumes an initial investment on the business day before the first day of the fiscal period, with all dividends and distributions reinvested in additional shares on the reinvestment date, and redemption at the net asset value calculated on the last business day of the fiscal period. Sales charges are not reflected in the total returns. Total returns are not annualized for periods less than one full year. Returns do not reflect the deduction of taxes that a shareholder would pay on fund distributions or the redemption of fund shares. The returns do not include adjustments in accordance with generally accepted accounting principles required at the period end for financial reporting purposes.
4. Annualized for periods less than one full year.
5. Includes the Fund’s share of the allocated expenses and/or net investment income from the master funds.
6. Includes dividend and borrowing expense on securities sold short of 0.60% and 0.18%, respectively.
7. Less than 0.005%.
8. Total expenses including indirect expenses from affiliated fund fees and expenses were as follows:
| | | | |
Year Ended October 30, 2015 | | | 2.93 | % |
Year Ended October 31, 2014 | | | 3.17 | % |
Year Ended October 31, 2013 | | | 2.83 | % |
Year Ended October 31, 2012 | | | 2.67 | % |
Year Ended October 31, 2011 | | | 2.37 | % |
See accompanying Notes to Consolidated Financial Statements.
55 OPPENHEIMER FUNDAMENTAL ALTERNATIVES FUND
CONSOLIDATED FINANCIAL HIGHLIGHTS Continued
| | | | | | | | | | | | |
| Class I | | Year Ended
October 30,
20151 | | | Year Ended
October 31,
2014 | | | Period Ended
October 31,
20132 | |
| |
| Per Share Operating Data | | | | | | | | | | | | |
| Net asset value, beginning of period | | $ | 27.41 | | | $ | 25.09 | | | $ | 24.32 | |
| |
| Income (loss) from investment operations: | | | | | | | | | | | | |
| Net investment income3 | | | 0.28 | | | | 0.42 | | | | 0.34 | |
| Net realized and unrealized gain | | | 0.69 | | | | 1.90 | | | | 0.43 | |
| | | | |
| Total from investment operations | | | 0.97 | | | | 2.32 | | | | 0.77 | |
| |
| Dividends and/or distributions to shareholders: | | | | | | | | | | | | |
| Dividends from net investment income | | | (0.59) | | | | 0.00 | | | | 0.00 | |
| Distributions from net realized gain | | | 0.00 | | | | 0.00 | | | | 0.00 | |
| Tax return of capital distribution | | | 0.00 | | | | 0.00 | | | | 0.00 | |
| | | | |
| Total dividends and/or distributions to shareholders | | | (0.59) | | | | 0.00 | | | | 0.00 | |
| |
| Net asset value, end of period | | $ | 27.79 | | | $ | 27.41 | | | $ | 25.09 | |
| | | | |
|
| |
| Total Return, at Net Asset Value4 | | | 3.62% | | | | 9.25% | | | | 3.17% | |
|
| |
| Ratios/Supplemental Data | | | | | | | | | | | | |
| Net assets, end of period (in thousands) | | $ | 59,214 | | | $ | 11 | | | $ | 10 | |
| |
| Average net assets (in thousands) | | $ | 8,550 | | | $ | 11 | | | $ | 10 | |
| |
| Ratios to average net assets:5,6 | | | | | | | | | | | | |
| Net investment income | | | 1.06% | | | | 1.57% | | | | 2.07% | |
| Expenses excluding interest and fees from borrowings | | | 1.60% | 7 | | | 1.92% | | | | 1.86% | |
| Interest and fees from borrowings | | | 0.00% | 8 | | | 0.00% | | | | 0.00% | |
| | | | |
| Total expenses9 | | | 1.60% | 7 | | | 1.92% | | | | 1.86% | |
| Expenses after payments, waivers and/or reimbursements and reduction to custodian expenses | | | 1.55% | 7 | | | 1.79% | | | | 1.79% | |
| |
| Portfolio turnover rate | | | 62% | | | | 44% | | | | 76% | |
1. October 30, 2015 represents the last business day of the Fund’s reporting period. See Note 2 of the accompanying Consolidated Notes.
2. For the period from February 28, 2013 (inception of offering) to October 31, 2013.
3. Per share amounts calculated based on the average shares outstanding during the period.
4. Assumes an initial investment on the business day before the first day of the fiscal period, with all dividends and distributions reinvested in additional shares on the reinvestment date, and redemption at the net asset value calculated on the last business day of the fiscal period. Sales charges are not reflected in the total returns. Total returns are not annualized for periods less than one full year. Returns do not reflect the deduction of taxes that a shareholder would pay on fund distributions or the redemption of fund shares. The returns do not include adjustments in accordance with generally accepted accounting principles required at the period end for financial reporting purposes.
5. Annualized for periods less than one full year.
6. Includes the Fund’s share of the allocated expenses and/or net investment income from the master funds.
7. Includes dividend and borrowing expense on securities sold short of 0.60% and 0.18%, respectively.
8. Less than 0.005%.
9. Total expenses including indirect expenses from affiliated fund fees and expenses were as follows:
| | | | |
| | | | |
Year Ended October 30, 2015 | | | 1.61 | % |
Year Ended October 31, 2014 | | | 1.93 | % |
Period Ended October 31, 2013 | | | 1.88 | % |
See accompanying Notes to Consolidated Financial Statements.
56 OPPENHEIMER FUNDAMENTAL ALTERNATIVES FUND
| | | | | | | | | | | | | | | | | | | | |
| Class R | | Year Ended
October 30,
20151 | | | Year Ended
October 31,
2014 | | | Year Ended
October 31,
2013 | | | Year Ended
October 31,
2012 | | | Year Ended
October 31,
2011 | |
| |
| Per Share Operating Data | | | | | | | | | | | | | | | | | | | | |
| Net asset value, beginning of period | | $ | 25.55 | | | $ | 23.54 | | | $ | 22.53 | | | $ | 24.80 | | | $ | 25.34 | |
| |
| Income (loss) from investment operations: | | | | | | | | | | | | | | | | | | | | |
| Net investment income (loss)2 | | | 0.22 | | | | 0.21 | | | | 0.21 | | | | (0.03) | | | | (0.24) | |
| Net realized and unrealized gain (loss) | | | 0.52 | | | | 1.80 | | | | 0.80 | | | | (0.10) | | | | 0.21 | |
| | | | |
| Total from investment operations | | | 0.74 | | | | 2.01 | | | | 1.01 | | | | (0.13) | | | | (0.03) | |
| |
| Dividends and/or distributions to shareholders: | | | | | | | | | | | | | | | | | | | | |
| Dividends from net investment income | | | (0.40) | | | | 0.00 | | | | 0.00 | | | | 0.00 | | | | 0.00 | |
| Distributions from net realized gain | | | 0.00 | | | | 0.00 | | | | 0.00 | | | | (2.13) | | | | (0.51) | |
| Tax return of capital distribution | | | 0.00 | | | | 0.00 | | | | 0.00 | | | | (0.01) | | | | 0.00 | |
| | | | |
| Total dividends and/or distributions to shareholders | | | (0.40) | | | | 0.00 | | | | 0.00 | | | | (2.14) | | | | (0.51) | |
| |
| Net asset value, end of period | | $ | 25.89 | | | $ | 25.55 | | | $ | 23.54 | | | $ | 22.53 | | | $ | 24.80 | |
| | | | |
|
| |
| Total Return, at Net Asset Value3 | | | 2.92% | | | | 8.54% | | | | 4.48% | | | | (0.27)% | | | | (0.18)% | |
|
| |
| Ratios/Supplemental Data | | | | | | | | | | | | | | | | | | | | |
| Net assets, end of period (in thousands) | | $ | 17,141 | | | $ | 17,302 | | | $ | 20,410 | | | $ | 27,181 | | | $ | 39,916 | |
| |
| Average net assets (in thousands) | | $ | 16,942 | | | $ | 19,224 | | | $ | 23,822 | | | $ | 33,095 | | | $ | 45,004 | |
| |
| Ratios to average net assets:4 | | | | | | | | | | | | | | | | | | | | |
| Net investment income (loss) | | | 0.85%5 | | | | 0.85%5 | | | | 0.92%5 | | | | (0.14)%5 | | | | (0.95)% | |
| Expenses excluding interest and fees from borrowings | | | 2.42%5 | ,6 | | | 2.69%5 | | | | 2.36%5 | | | | 2.18%5 | | | | 1.87% | |
| Interest and fees from borrowings | | | 0.00%7 | | | | 0.00% | | | | 0.00% | | | | 0.00% | | | | 0.00% | |
| | | | |
| Total expenses8 | | | 2.42%5 | ,6 | | | 2.69%5 | | | | 2.36%5 | | | | 2.18%5 | | | | 1.87% | |
| Expenses after payments, waivers and/or reimbursements and reduction to custodian expenses | | | 2.37%5 | ,6 | | | 2.54%5 | | | | 2.29%5 | | | | 2.11%5 | | | | 1.82% | |
| |
| Portfolio turnover rate | | | 62% | | | | 44% | | | | 76% | | | | 212% | | | | 181% | |
1. October 30, 2015 represents the last business day of the Fund’s reporting period. See Note 2 of the accompanying Consolidated Notes.
2. Per share amounts calculated based on the average shares outstanding during the period.
3. Assumes an initial investment on the business day before the first day of the fiscal period, with all dividends and distributions reinvested in additional shares on the reinvestment date, and redemption at the net asset value calculated on the last business day of the fiscal period. Sales charges are not reflected in the total returns. Total returns are not annualized for periods less than one full year. Returns do not reflect the deduction of taxes that a shareholder would pay on fund distributions or the redemption of fund shares. The returns do not include adjustments in accordance with generally accepted accounting principles required at the period end for financial reporting purposes.
4. Annualized for periods less than one full year.
5. Includes the Fund’s share of the allocated expenses and/or net investment income from the master funds.
6. Includes dividend and borrowing expense on securities sold short of 0.60% and 0.18%, respectively.
7. Less than 0.005%.
8. Total expenses including indirect expenses from affiliated fund fees and expenses were as follows:
| | | | |
| | | | |
Year Ended October 30, 2015 | | | 2.43 | % |
Year Ended October 31, 2014 | | | 2.70 | % |
Year Ended October 31, 2013 | | | 2.38 | % |
Year Ended October 31, 2012 | | | 2.23 | % |
Year Ended October 31, 2011 | | | 1.92 | % |
See accompanying Notes to Consolidated Financial Statements.
57 OPPENHEIMER FUNDAMENTAL ALTERNATIVES FUND
CONSOLIDATED FINANCIAL HIGHLIGHTS Continued
| | | | | | | | | | | | | | | | | | | | |
| Class Y | | Year Ended
October 30,
20151 | | | Year Ended
October 31,
2014 | | | Year Ended
October 31,
2013 | | | Year Ended
October 31,
2012 | | | Year Ended
October 31,
2011 | |
| |
| Per Share Operating Data | | | | | | | | | | | | | | | | | | | | |
| Net asset value, beginning of period | | $ | 27.32 | | | $ | 25.05 | | | $ | 23.84 | | | $ | 25.97 | | | $ | 26.35 | |
| |
| Income (loss) from investment operations: | | | | | | | | | | | | | | | | | | | | |
| Net investment income (loss)2 | | | 0.31 | | | | 0.34 | | | | 0.38 | | | | 0.10 | | | | (0.09) | |
| Net realized and unrealized gain (loss) | | | 0.60 | | | | 1.93 | | | | 0.83 | | | | (0.09) | | | | 0.22 | |
| | | | |
| Total from investment operations | | | 0.91 | | | | 2.27 | | | | 1.21 | | | | 0.01 | | | | 0.13 | |
| |
| Dividends and/or distributions to shareholders: | | | | | | | | | | | | | | | | | | | | |
| Dividends from net investment income | | | (0.55) | | | | 0.00 | | | | 0.00 | | | | 0.00 | | | | 0.00 | |
| Distributions from net realized gain | | | 0.00 | | | | 0.00 | | | | 0.00 | | | | (2.13) | | | | (0.51) | |
| Tax return of capital distribution | | | 0.00 | | | | 0.00 | | | | 0.00 | | | | (0.01) | | | | 0.00 | |
| | | | |
| Total dividends and/or distributions to shareholders | | | (0.55) | | | | 0.00 | | | | 0.00 | | | | (2.14) | | | | (0.51) | |
| |
| Net asset value, end of period | | $ | 27.68 | | | $ | 27.32 | | | $ | 25.05 | | | $ | 23.84 | | | $ | 25.97 | |
| | | | |
|
| |
| Total Return, at Net Asset Value3 | | | 3.43% | | | | 9.06% | | | | 5.08% | | | | 0.32% | | | | 0.45% | |
|
| |
| Ratios/Supplemental Data | | | | | | | | | | | | | | | | | | | | |
| Net assets, end of period (in thousands) | | $ | 87,249 | | | $ | 19,378 | | | $ | 11,237 | | | $ | 16,234 | | | $ | 53,803 | |
| |
| Average net assets (in thousands) | | $ | 34,589 | | | $ | 14,096 | | | $ | 12,213 | | | $ | 28,561 | | | $ | 58,196 | |
| |
| Ratios to average net assets:4 | | | | | | | | | | | | | | | | | | | | |
| Net investment income (loss) | | | 1.13%5 | | | | 1.27% | 5 | | | 1.52% | 5 | | | 0.41% | 5 | | | (0.34)% | |
| Expenses excluding interest and fees from borrowings | | | 1.88%5 | ,6 | | | 2.75% | 5 | | | 1.79% | 5 | | | 1.60% | 5 | | | 1.25% | |
| Interest and fees from borrowings | | | 0.00%7 | | | | 0.00% | | | | 0.00% | | | | 0.00% | | | | 0.00% | |
| | | | |
| Total expenses8 | | | 1.88%5 | ,6 | | | 2.75% | 5 | | | 1.79% | 5 | | | 1.60% | 5 | | | 1.25% | |
| Expenses after payments, waivers and/or reimbursements and reduction to custodian expenses | | | 1.83%5 | ,6 | | | 2.04% | 5 | | | 1.72% | 5 | | | 1.53% | 5 | | | 1.20% | |
| |
| Portfolio turnover rate | | | 62% | | | | 44% | | | | 76% | | | | 212% | | | | 181% | |
1. October 30, 2015 represents the last business day of the Fund’s reporting period. See Note 2 of the accompanying Consolidated Notes.
2. Per share amounts calculated based on the average shares outstanding during the period.
3. Assumes an initial investment on the business day before the first day of the fiscal period, with all dividends and distributions reinvested in additional shares on the reinvestment date, and redemption at the net asset value calculated on the last business day of the fiscal period. Sales charges are not reflected in the total returns. Total returns are not annualized for periods less than one full year. Returns do not reflect the deduction of taxes that a shareholder would pay on fund distributions or the redemption of fund shares. The returns do not include adjustments in accordance with generally accepted accounting principles required at the period end for financial reporting purposes.
4. Annualized for periods less than one full year.
5. Includes the Fund’s share of the allocated expenses and/or net investment income from the master funds.
6. Includes dividend and borrowing expense on securities sold short of 0.60% and 0.18%, respectively.
7. Less than 0.005%.
8. Total expenses including indirect expenses from affiliated fund fees and expenses were as follows:
| | | | |
| | | | |
| | | | |
Year Ended October 30, 2015 | | | 1.89 | % |
Year Ended October 31, 2014 | | | 2.76 | % |
Year Ended October 31, 2013 | | | 1.81 | % |
Year Ended October 31, 2012 | | | 1.65 | % |
Year Ended October 31, 2011 | | | 1.30 | % |
See accompanying Notes to Consolidated Financial Statements.
58 OPPENHEIMER FUNDAMENTAL ALTERNATIVES FUND
NOTES TO CONSOLIDATED FINANCIAL STATEMENTS October 30, 2015
1. Organization
Oppenheimer Fundamental Alternatives Fund (the “Fund”), formerly known as Oppenheimer Flexible Strategies Fund, a series of Oppenheimer Quest for Value Funds, is registered under the Investment Company Act of 1940 (“1940 Act”), as amended, as a diversified open-end management investment company. The Fund’s investment objective is to seek total return. The Fund’s investment adviser is OFI Global Asset Management, Inc. (“OFI Global” or the “Manager”), a wholly-owned subsidiary of OppenheimerFunds, Inc. (“OFI” or the “Sub-Adviser”). The Manager has entered into a sub-advisory agreement with OFI.
The Fund offers Class A, Class C, Class I, Class R and Class Y shares, and previously offered Class B shares for new purchase through June 29, 2012. Subsequent to that date, no new purchases of Class B shares are permitted, however reinvestment of dividend and/or capital gain distributions and exchanges of Class B shares into and from other Oppenheimer funds are allowed. As of July 1, 2014, Class N shares were renamed Class R shares. Class N shares subject to a contingent deferred sales charge (“CDSC”) on July 1, 2014, continue to be subject to a CDSC after the shares were renamed. Purchases of Class R shares occurring on or after July 1, 2014, are not subject to a CDSC upon redemption. Class A shares are sold at their offering price, which is normally net asset value plus a front-end sales charge. Class C and Class R shares are sold, and Class B shares were sold, without a front-end sales charge but may be subject to a contingent deferred sales charge (“CDSC”). Class R shares are sold only through retirement plans. Retirement plans that offer Class R shares may impose charges on those accounts. Class I and Class Y shares are sold to certain institutional investors or intermediaries without either a front-end sales charge or a CDSC, however, the intermediaries may impose charges on their accountholders who beneficially own Class I and Class Y shares. All classes of shares have identical rights and voting privileges with respect to the Fund in general and exclusive voting rights on matters that affect that class alone. Earnings, net assets and net asset value per share may differ due to each class having its own expenses, such as transfer and shareholder servicing agent fees and shareholder communications, directly attributable to that class. Class A, B, C and R shares have separate distribution and/or service plans under which they pay fees. Class I and Class Y shares do not pay such fees. Class B shares will automatically convert to Class A shares 72 months after the date of purchase.
The following is a summary of significant accounting policies followed in the Fund’s preparation of financial statements in accordance with accounting principles generally accepted in the United States (“U.S. GAAP”).
2. Significant Accounting Policies
Security Valuation. All investments in securities are recorded at their estimated fair value, as described in Note 3.
Reporting Period End Date. The last day of the Fund’s reporting period is the last day the New York Stock Exchange was open for trading during the period. The Fund’s financial statements have been presented through that date to maintain consistency with the Fund’s net asset value calculations used for shareholder transactions.
59 OPPENHEIMER FUNDAMENTAL ALTERNATIVES FUND
NOTES TO CONSOLIDATED FINANCIAL STATEMENTS Continued
2. Significant Accounting Policies (Continued)
Basis for Consolidation. The Fund has established a Cayman Islands exempted company, Oppenheimer Fundamental Alternatives Fund (Cayman) Ltd., which is wholly-owned and controlled by the Fund (the “Subsidiary”). The Fund and Subsidiary are both managed by the Manager. The Fund may invest up to 25% of its total assets in the Subsidiary. The Subsidiary invests primarily in in commodity-linked derivatives (including commodity futures, financial futures, options and swap contracts) and certain fixed-income securities and other investments that may serve as margin or collateral for its derivatives positions. Investments in the Subsidiary are expected to provide the Fund with exposure to commodities markets within the limitations of the federal tax requirements that apply to the Fund. The Subsidiary is subject to the same investment restrictions and guidelines, and follows the same compliance policies and procedures, as the Fund.
The financial statements have been consolidated and include accounts of the Fund and the Subsidiary. Accordingly, all inter-company transactions and balances have been eliminated. At period end, the Fund owned 9,283 shares with net assets of $25,464,458 in the Subsidiary.
| | | | | | |
| Other financial information at period end: | | | |
Total market value of investments | | $ | 23,543,220 | | |
Net assets | | $ | 25,464,458 | | |
Net income (loss) | | $ | (251,512 | ) | |
Net realized gain (loss) | | $ | — | | |
Net change in unrealized appreciation/depreciation | | $ | (617,706 | ) | |
Foreign Currency Translation. The Fund’s accounting records are maintained in U.S. dollars. The values of securities denominated in foreign currencies and amounts related to the purchase and sale of foreign securities and foreign investment income are translated into U.S. dollars as of the close of the New York Stock Exchange (the “Exchange”), normally 4:00 P.M. Eastern time, on each day the Exchange is open for trading. Foreign exchange rates may be valued primarily using a reliable bank, dealer or service authorized by the Board of Trustees.
Reported net realized gains and losses from foreign currency transactions arise from sales of portfolio securities, sales and maturities of short-term securities, sales of foreign currencies, exchange rate fluctuations between the trade and settlement dates on securities transactions, and the difference between the amounts of dividends, interest, and foreign withholding taxes recorded on the Fund’s books and the U.S. dollar equivalent of the amounts actually received or paid. Net unrealized appreciation and depreciation on the translation of assets and liabilities denominated in foreign currencies arise from changes in the values of assets and liabilities, including investments in securities at fiscal period end, resulting from changes in exchange rates.
The effect of changes in foreign currency exchange rates on investments is separately identified from the fluctuations arising from changes in market values of securities held and reported with all other foreign currency gains and losses in the Fund’s Consolidated Statement of Operations.
60 OPPENHEIMER FUNDAMENTAL ALTERNATIVES FUND
2. Significant Accounting Policies (Continued)
Allocation of Income, Expenses, Gains and Losses. Income, expenses (other than those attributable to a specific class), gains and losses are allocated on a daily basis to each class of shares based upon the relative proportion of net assets represented by such class. Operating expenses directly attributable to a specific class are charged against the operations of that class.
Dividends and Distributions to Shareholders. Dividends and distributions to shareholders, which are determined in accordance with income tax regulations and may differ from U.S. generally accepted accounting principles, are recorded on the ex-dividend date. Income and capital gain distributions, if any, are declared and paid annually or at other times as deemed necessary by the Manager.
Investment Income. Dividend income is recorded on the ex-dividend date or upon ex-dividend notification in the case of certain foreign dividends where the ex-dividend date may have passed. Non-cash dividends included in dividend income, if any, are recorded at the fair market value of the securities received. Interest income is recognized on an accrual basis. Discount and premium, which are included in interest income on the Consolidated Statement of Operations, are amortized or accreted daily.
Return of Capital Estimates. Distributions received from the Fund’s investments in Real Estate Investments Trusts (REITs), generally are comprised of income and return of capital. The Fund records investment income and return of capital based on estimates made at the time such distributions are received. Such estimates are based on historical information available from each REIT and other industry sources. These estimates may subsequently be revised based on information received from REITs after their tax reporting periods are concluded.
Custodian Fees. “Custodian fees and expenses” in the Consolidated Statement of Operations may include interest expense incurred by the Fund on any cash overdrafts of its custodian account during the period. Such cash overdrafts may result from the effects of failed trades in portfolio securities and from cash outflows resulting from unanticipated shareholder redemption activity. The Fund pays interest to its custodian on such cash overdrafts, to the extent they are not offset by positive cash balances maintained by the Fund, based on the negative rolling average balance at an average Federal Funds Rate plus 0.50%. The “Reduction to custodian expenses” line item, if applicable, represents earnings on cash balances maintained by the Fund during the period. Such interest expense and other custodian fees may be paid with these earnings.
Security Transactions. Security transactions are recorded on the trade date. Realized gains and losses on securities sold (except for the investments in the Subsidiary) are determined on the basis of identified cost.
61 OPPENHEIMER FUNDAMENTAL ALTERNATIVES FUND
NOTES TO CONSOLIDATED FINANCIAL STATEMENTS Continued
2. Significant Accounting Policies (Continued)
Indemnifications. The Fund’s organizational documents provide current and former Trustees and officers with a limited indemnification against liabilities arising in connection with the performance of their duties to the Fund. In the normal course of business, the Fund may also enter into contracts that provide general indemnifications. The Fund’s maximum exposure under these arrangements is unknown as this would be dependent on future claims that may be made against the Fund. The risk of material loss from such claims is considered remote.
Federal Taxes. The Fund intends to comply with provisions of the Internal Revenue Code applicable to regulated investment companies and to distribute substantially all of its investment company taxable income, including any net realized gain on investments not offset by capital loss carryforwards, if any, to shareholders. Therefore, no federal income or excise tax provision is required. The Fund files income tax returns in U.S. federal and applicable state jurisdictions. The statute of limitations on the Fund’s tax return filings generally remains open for the three preceding fiscal reporting period ends.
Subchapter M requires, among other things, that at least 90% of the Fund’s gross income be derived from securities or derived with respect to its business of investing in securities (typically referred to as “qualifying income”). Income from commodity-linked derivatives may not be treated as “qualifying income” for purposes of the 90% gross income requirement. The Internal Revenue Service (IRS) has previously issued a number of private letter rulings which conclude that income derived from commodity index-linked notes and investments in a wholly-owned subsidiary will be “qualifying income.” As a result, the Fund will gain exposure to commodities through commodity-linked notes and its wholly-owned subsidiary.
The IRS has suspended the granting of private letter rulings pending further review. As a result, there can be no assurance that the IRS will not change its position with respect to commodity-linked notes and wholly-owned subsidiaries. In addition, future legislation and guidance from the Treasury and the IRS may adversely affect the fund’s ability to gain exposure to commodities through commodity-linked notes and its wholly-owned subsidiary.
The Fund is required to include in income for federal income tax purposes all of the subsidiary’s net income and gains whether or not such income is distributed by the subsidiary. Net income and gains from the subsidiary are generally treated as ordinary income by the Fund, regardless of the character of the subsidiary’s underlying income. Net losses from the subsidiary do not pass through to the Fund for federal income tax purposes.
The tax components of capital shown in the following table represent distribution requirements the Fund must satisfy under the income tax regulations, losses the Fund may be able to offset against income and gains realized in future years and unrealized appreciation or depreciation of securities and other investments for federal income tax purposes.
62 OPPENHEIMER FUNDAMENTAL ALTERNATIVES FUND
2. Significant Accounting Policies (Continued)
| | | | | | | | | | | | |
Undistributed Net Investment Income | | Undistributed
Long-Term
Gain | | | Accumulated
Loss
Carryforward1,2,3 | | | Net Unrealized
Appreciation
Based on cost of
Securities and
Other Investments
for Federal Income
Tax Purposes | |
| |
$5,634,566 | | | $— | | | | $2,012,388 | | | | $48,931,372 | |
1. At period end, the Fund had $2,012,388 of net capital loss carryforward available to offset future realized capital gains, if any, and thereby reduce future taxable gain distributions. Details of the capital loss carryforwards are included in the table below. Capital loss carryovers with no expiration, if any, must be utilized prior to those with expiration dates.
| | | | |
| Expiring | | | |
| |
No expiration | | $ | 2,012,388 | |
2. During the reporting period, the Fund utilized $38,791,182 of capital loss carryforward to offset capital gains realized in that fiscal year.
3. During the previous reporting period, the Fund utilized $47,967,282 of capital loss carryforward to offset capital gains realized in that fiscal year.
Net investment income (loss) and net realized gain (loss) may differ for financial statement and tax purposes. The character of dividends and distributions made during the fiscal year from net investment income or net realized gains are determined in accordance with federal income tax requirements, which may differ from the character of net investment income or net realized gains presented in those financial statements in accordance with GAAP. Also, due to timing of dividends and distributions, the fiscal year in which amounts are distributed may differ from the fiscal year in which the income or net realized gain was recorded by the Fund.
Accordingly, the following amounts have been reclassified for the reporting period. Net assets of the Fund were unaffected by the reclassifications.
| | | | |
Reduction to Accumulated Net Investment Income | | Reduction to Accumulated Net
Realized Loss on Investments | |
| |
$2,040,852 | | | $2,040,852 | |
The tax character of distributions paid during the reporting periods:
| | | | | | | | |
| | | Year Ended
October 31, 2015 | | | Year Ended
October 31, 2014 | |
| |
Distributions paid from: | | | | | | | | |
Ordinary income | | $ | 13,708,528 | | | $ | — | |
The aggregate cost of securities and other investments and the composition of unrealized appreciation and depreciation of securities and other investments for federal income tax purposes at period end are noted in the following table. The primary difference between book and tax appreciation or depreciation of securities and other investments, if applicable, is
63 OPPENHEIMER FUNDAMENTAL ALTERNATIVES FUND
NOTES TO CONSOLIDATED FINANCIAL STATEMENTS Continued
2. Significant Accounting Policies (Continued)
attributable to the tax deferral of losses or tax realization of financial statement unrealized gain or loss.
| | | | |
Federal tax cost of securities | | $ | 882,605,066 | |
Federal tax cost of other investments | | | (200,382,108) | |
| | | | |
Total federal tax cost | | $ | 682,222,958 | |
| | | | |
Gross unrealized appreciation | | $ | 126,419,370 | |
Gross unrealized depreciation | | | (77,487,998) | |
| | | | |
Net unrealized appreciation | | $ | 48,931,372 | |
| | | | |
Recent Accounting Pronouncement. In May 2015, Financial Accounting Standards Board (“FASB”) issued Accounting Standards Update (“ASU”), ASU 2015-07. This is an update to Fair Value Measurement Topic 820. Under the amendments in this ASU, investments for which fair value is measured at net asset value per share (or its equivalent) using the practical expedient should not be categorized in the fair value hierarchy. ASU 2015-17 is effective for financial statements issued for fiscal years beginning after December 15, 2015, and interim periods within those fiscal years. At period end, the Manager does not believe the adoption of the ASU will have a material effect on the financial statements or disclosures.
Use of Estimates. The preparation of financial statements in conformity with accounting principles generally accepted in the United States of America requires management to make estimates and assumptions that affect the reported amounts of assets and liabilities and disclosure of contingent assets and liabilities at the date of the financial statements and the reported amounts of increases and decreases in net assets from operations during the reporting period. Actual results could differ from those estimates.
3. Securities Valuation
The Fund calculates the net asset value of its shares as of the close of the New York Stock Exchange (the “Exchange”), normally 4:00 P.M. Eastern time, on each day the Exchange is open for trading, except in the case of a scheduled early closing of the Exchange, in which case the Fund will calculate net asset value of the shares as of the scheduled early closing time of the Exchange.
The Fund’s Board has adopted procedures for the valuation of the Fund’s securities and has delegated the day-to-day responsibility for valuation determinations under those procedures to the Manager. The Manager has established a Valuation Committee which is responsible for determining a “fair valuation” for any security for which market quotations are not “readily available.” The Valuation Committee’s fair valuation determinations are subject to review, approval and ratification by the Fund’s Board at its next regularly scheduled meeting covering the calendar quarter in which the fair valuation was determined.
Valuation Methods and Inputs
Securities are valued using unadjusted quoted market prices, when available, as supplied primarily by third party pricing services or dealers.
64 OPPENHEIMER FUNDAMENTAL ALTERNATIVES FUND
3. Securities Valuation (Continued)
The following methodologies are used to determine the market value or the fair value of the types of securities described below:
Securities traded on a registered U.S. securities exchange (including exchange-traded derivatives other than futures and futures options) are valued based on the last sale price of the security reported on the principal exchange on which it is traded, prior to the time when the Fund’s assets are valued. In the absence of a sale, the security is valued at the mean between the bid and asked price on the principal exchange or, if not available from the principal exchange, obtained from two dealers. If bid and asked prices are not available from either the exchange or two dealers, the security is valued by using one of the following methodologies (listed in order of priority): (1) using a bid from the principal exchange, (2) the mean between the bid and asked price as provided by a single dealer, or (3) a bid from a single dealer. A security of a foreign issuer traded on a foreign exchange, but not listed on a registered U.S. securities exchange, is valued based on the last sale price on the principal exchange on which the security is traded, as identified by the third party pricing service used by the Manager, prior to the time when the Fund’s assets are valued. If the last sale price is unavailable, the security is valued at the most recent official closing price on the principal exchange on which it is traded. If the last sales price or official closing price for a foreign security is not available, the security is valued at the mean between the bid and asked price per the exchange or, if not available from the exchange, obtained from two dealers. If bid and asked prices are not available from either the exchange or two dealers, the security is valued by using one of the following methodologies (listed in order of priority): (1) using a bid from the exchange, (2) the mean between the bid and asked price as provided by a single dealer, or (3) a bid from a single dealer.
Shares of a registered investment company that are not traded on an exchange are valued at that investment company’s net asset value per share.
Corporate and government debt securities (of U.S. or foreign issuers) and municipal debt securities, event-linked bonds, loans, mortgage-backed securities, collateralized mortgage obligations, and asset-backed securities are valued at the mean between the “bid” and “asked” prices utilizing evaluated prices obtained from third party pricing services or broker-dealers who may use matrix pricing methods to determine the evaluated prices.
Short-term money market type debt securities with a remaining maturity of sixty days or less are valued at cost adjusted by the amortization of discount or premium to maturity (amortized cost), which approximates market value. Short-term debt securities with a remaining maturity in excess of sixty days are valued at the mean between the “bid” and “asked” prices utilizing evaluated prices obtained from third party pricing services or broker-dealers.
Structured securities, swaps, swaptions, and other over-the-counter derivatives are valued utilizing evaluated prices obtained from third party pricing services or broker-dealers.
Forward foreign currency exchange contracts are valued utilizing current and forward currency rates obtained from third party pricing services. When the settlement date of a contract is an interim date for which a quotation is not available, interpolated values are derived using the nearest dated forward currency rate.
65 OPPENHEIMER FUNDAMENTAL ALTERNATIVES FUND
NOTES TO CONSOLIDATED FINANCIAL STATEMENTS Continued
3. Securities Valuation (Continued)
Futures contracts and futures options traded on a commodities or futures exchange will be valued at the final settlement price or official closing price on the principal exchange as reported by such principal exchange at its trading session ending at, or most recently prior to, the time when the Fund’s assets are valued.
A description of the standard inputs that may generally be considered by the third party pricing vendors in determining their evaluated prices is provided below.
| | | | | | |
| Security Type | | | | Standard inputs generally considered by third-party pricing vendors | | |
|
| Corporate debt, government debt, municipal, mortgage-backed and asset-backed securities | | | | Reported trade data, broker-dealer price quotations, benchmark yields, issuer spreads on comparable securities, the credit quality, yield, maturity, and other appropriate factors. | | |
|
| Loans | | | | Information obtained from market participants regarding reported trade data and broker-dealer price quotations. | | |
|
| Event-linked bonds | | | | Information obtained from market participants regarding reported trade data and broker-dealer price quotations. | | |
|
| Structured securities | | | | Relevant market information such as the price of underlying financial instruments, stock market indices, foreign currencies, interest rate spreads, commodities, or the occurrence of other specific events. | | |
|
| Swaps | | | | Relevant market information, including underlying reference assets such as credit spreads, credit event probabilities, index values, individual security values, forward interest rates, variable interest rates, volatility measures, and forward currency rates. | | |
If a market value or price cannot be determined for a security using the methodologies described above, or if, in the “good faith” opinion of the Manager, the market value or price obtained does not constitute a “readily available market quotation,” or a significant event has occurred that would materially affect the value of the security, the security is fair valued either (i) by a standardized fair valuation methodology applicable to the security type or the significant event as previously approved by the Valuation Committee and the Fund’s Board or (ii) as determined in good faith by the Manager’s Valuation Committee. The Valuation Committee considers all relevant facts that are reasonably available, through either public information or information available to the Manager, when determining the fair value of a security. Fair value determinations by the Manager are subject to review, approval and ratification by the Fund’s Board at its next regularly scheduled meeting covering the calendar quarter in which the fair valuation was determined. Those fair valuation standardized methodologies include, but are not limited to, valuing securities at the last sale price or initially at cost and subsequently adjusting the value based on: changes in company specific fundamentals, changes in an appropriate securities index, or changes in the value of similar securities which may be further adjusted for any discounts related to security-specific resale restrictions. When possible, such methodologies use observable market inputs such as unadjusted quoted prices of similar securities, observable interest rates, currency rates and yield curves. The methodologies used for valuing securities are not necessarily an indication of the risks associated with investing in those securities nor can it be assured that the Fund can obtain the fair value assigned to a security if it were to sell the security.
66 OPPENHEIMER FUNDAMENTAL ALTERNATIVES FUND
3. Securities Valuation (Continued)
To assess the continuing appropriateness of security valuations, the Manager, or its third party service provider who is subject to oversight by the Manager, regularly compares prior day prices, prices on comparable securities, and sale prices to the current day prices and challenges those prices exceeding certain tolerance levels with the third party pricing service or broker source. For those securities valued by fair valuations, whether through a standardized fair valuation methodology or a fair valuation determination, the Valuation Committee reviews and affirms the reasonableness of the valuations based on such methodologies and fair valuation determinations on a regular basis after considering all relevant information that is reasonably available.
Classifications
Each investment asset or liability of the Fund is assigned a level at measurement date based on the significance and source of the inputs to its valuation. Various data inputs are used in determining the value of each of the Fund’s investments as of the reporting period end. These data inputs are categorized in the following hierarchy under applicable financial accounting standards:
1) Level 1-unadjusted quoted prices in active markets for identical assets or liabilities (including securities actively traded on a securities exchange)
2) Level 2-inputs other than unadjusted quoted prices that are observable for the asset or liability (such as unadjusted quoted prices for similar assets and market corroborated inputs such as interest rates, prepayment speeds, credit risks, etc.)
3) Level 3-significant unobservable inputs (including the Manager’s own judgments about assumptions that market participants would use in pricing the asset or liability).
The inputs used for valuing securities are not necessarily an indication of the risks associated with investing in those securities.
The table below categorizes amounts that are included in the Fund’s Consolidated Statement of Assets and Liabilities at period end based on valuation input level:
| | | | | | | | | | | | | | | | |
| | | Level 1—
Unadjusted
Quoted Prices | | | Level 2—
Other Significant
Observable Inputs | | | Level 3—
Significant
Unobservable
Inputs | | | Value | |
| |
Assets Table | | | | | | | | | | | | | | | | |
Investments, at Value: | | | | | | | | | | | | | | | | |
Common Stocks | | | | | | | | | | | | | | | | |
Consumer Discretionary | | $ | 34,477,618 | | | $ | 73,592 | | | $ | — | | | $ | 34,551,210 | |
Consumer Staples | | | 24,997,197 | | | | — | | | | — | | | | 24,997,197 | |
Energy | | | 26,094,195 | | | | — | | | | — | | | | 26,094,195 | |
Financials | | | 81,096,789 | | | | — | | | | — | | | | 81,096,789 | |
Health Care | | | 60,666,932 | | | | 10,416,001 | | | | — | | | | 71,082,933 | |
Industrials | | | 73,109,992 | | | | — | | | | — | | | | 73,109,992 | |
Information Technology | | | 58,648,640 | | | | 2,863,637 | | | | — | | | | 61,512,277 | |
Materials | | | 32,049,799 | | | | — | | | | — | | | | 32,049,799 | |
Telecommunication Services | | | 18,132,969 | | | | — | | | | — | | | | 18,132,969 | |
Utilities | | | 18,636,922 | | | | — | | | | — | | | | 18,636,922 | |
Preferred Stocks | | | 8,040,000 | | | | 14,584,633 | | | | — | | | | 22,624,633 | |
67 OPPENHEIMER FUNDAMENTAL ALTERNATIVES FUND
NOTES TO CONSOLIDATED FINANCIAL STATEMENTS Continued
3. Securities Valuation (Continued)
| | | | | | | | | | | | | | | | |
| | | Level 1—
Unadjusted
Quoted Prices | | | Level 2—
Other Significant
Observable Inputs | | | Level 3—
Significant
Unobservable
Inputs | | | Value | |
| |
Investments, at Value: (Continued) | | | | | | | | | | | | | | | | |
Asset-Backed Securities | | $ | — | | | $ | 57,115,695 | | | $ | 20,581,739 | | | $ | 77,697,434 | |
Mortgage-Backed Obligations | | | — | | | | 47,305,068 | | | | — | | | | 47,305,068 | |
Non-Convertible Corporate Bonds and Notes | | | — | | | | 26,062,527 | | | | — | | | | 26,062,527 | |
Convertible Corporate Bond and Note | | | — | | | | 3,324,938 | | | | — | | | | 3,324,938 | |
Corporate Loans | | | — | | | | 131,509,167 | | | | 252,794 | | | | 131,761,961 | |
Structured Security | | | — | | | | — | | | | 895,986 | | | | 895,986 | |
Over-the-Counter Option Purchased | | | — | | | | 749,896 | | | | — | | | | 749,896 | |
Over-the-Counter Interest Rate | | | | | | | | | | | | | | | | |
Swaptions Purchased | | | — | | | | 3,402,042 | | | | — | | | | 3,402,042 | |
Investment Companies | | | 161,741,686 | | | | 20,053,001 | | | | — | | | | 181,794,687 | |
| | | | |
Total Investments, at Value | | | 597,692,739 | | | | 317,460,197 | | | | 21,730,519 | | | | 936,883,455 | |
Other Financial Instruments: | | | | | | | | | | | | | | | | |
Swaps, at value | | | — | | | | 1,544,797 | | | | — | | | | 1,544,797 | |
Centrally cleared swaps, at value | | | — | | | | 573,522 | | | | — | | | | 573,522 | |
Forward currency exchange contracts | | | — | | | | 1,241,677 | | | | — | | | | 1,241,677 | |
| | | | |
Total Assets | | $ | 597,692,739 | | | $ | 320,820,193 | | | $ | 21,730,519 | | | $ | 940,243,451 | |
| | | | |
| | | | |
Liabilities Table | | | | | | | | | | | | | | | | |
Other Financial Instruments: | | | | | | | | | | | | | | | | |
Common Stock Securities Sold Short | | $ | (186,524,688) | | | $ | (11,538,570) | | | $ | — | | | $ | (198,063,258) | |
Swaps, at value | | | — | | | | (2,665,759) | | | | — | | | | (2,665,759) | |
Centrally cleared swaps, at value | | | — | | | | (1,863,395) | | | | — | | | | (1,863,395) | |
Futures contracts | | | (265,434) | | | | — | | | | — | | | | (265,434) | |
Forward currency exchange contracts | | | — | | | | (504,032) | | | | — | | | | (504,032) | |
| | | | |
Total Liabilities | | $ | (186,790,122) | | | $ | (16,571,756) | | | $ | — | | | $ | (203,361,878) | |
| | | | |
Forward currency exchange contracts and futures contracts, if any, are reported at their unrealized appreciation/depreciation at measurement date, which represents the change in the contract’s value from trade date. All additional assets and liabilities included in the above table are reported at their market value at measurement date.
The table below shows the transfers between Level 1 and Level 2. The Fund’s policy is to recognize transfers in and transfers out as of the beginning of the reporting period.
| | | | | | | | |
| | | Transfers into Level 1* | | | Transfers out of Level 2* | |
| |
Assets Table | | | | | | | | |
Investments, at Value: | | | | | | | | |
Preferred Stocks | | $ | 8,118,000 | | | $ | (8,118,000) | |
| | | | |
Total Assets | | $ | 8,118,000 | | | $ | (8,118,000) | |
| | | | |
* Transferred from Level 2 to Level 1 due to the presence of a readily available unadjusted quoted market price.
The following is a reconciliation of assets in which significant unobservable inputs (level 3) were used in determining fair value:
68 OPPENHEIMER FUNDAMENTAL ALTERNATIVES FUND
3. Securities Valuation (Continued)
| | | | | | | | | | | | | | | | |
| | | Value as of
October 31,
2014 | | | Realized gain
(loss) | | | Change in
unrealized
appreciation/
depreciation | | | Accretion/
(amortization)
of premium/
discounta | |
| |
Assets Table | | | | | | | | | | | | | | | | |
Investments, at Value: | | | | | | | | | | | | | | | | |
Asset-Backed Securities | | $ | 24,450,850 | | | $ | 576,189 | | | $ | (4,896,928 | ) | | $ | 451,628 | |
Corporate Loans | | | — | | | | 206 | | | | (455,242 | ) | | | 518 | |
Structured Security | | | 895,986 | | | | — | | | | — | | | | — | |
| | | | |
Total Assets | | $ | 25,346,836 | | | $ | 576,395 | | | $ | (5,352,170 | ) | | $ | 452,146 | |
| | | | |
a. Included in net investment income.
| | | | | | | | | | | | |
| | | Purchases | | | Sales | | | Value as of
October 30,
2015 | |
| |
Assets Table (Continued) | | | | | | | | | | | | |
Investments, at Value: | | | | | | | | | | | | |
Asset-Backed Securities | | $ | — | | | $ | — | | | $ | 20,581,739 | |
Corporate Loans | | | 721,616 | | | | (14,304) | | | | 252,794 | |
Structured Security | | | — | | | | — | | | | 895,986 | |
| | | | |
Total Assets | | $ | 721,616 | | | $ | (14,304) | | | $ | 21,730,519 | |
| | | | |
The total change in unrealized appreciation/depreciation included in the Consolidated Statement of Operations attributable to Level 3 investments still held at period end:
| | | | |
| | | Change in unrealized
appreciation/depreciation | |
| |
Assets Table | �� | | | |
Investments, at Value: | | | | |
Asset-Backed Securities | | $ | (4,896,928) | |
Corporate Loans | | | (455,242) | |
| | | | |
Total | | $ | (5,352,170) | |
| | | | |
The following table summarizes the valuation techniques and significant unobservable inputs used in determining fair value measurements for those investments classified as Level 3 at period end:
| | | | | | | | | | | | | | |
| | | Value as of
October 31, 2015 | | | Valuation Technique | | Unobservable input | | Range of Unobservable Inputs | | Unobservable Input Used | |
| |
Assets Table | | | | | | | | | | | | | | |
Investments, at Value: | | | | | | | | | | | | | | |
Asset-Backed Securities | | $ | 20,581,739 | | | Pricing Service | | N/A | | N/A | | | N/A (a) | |
Corporate Loans | | | 252,772 | | | Pricing Service | | N/A | | N/A | | | N/A (a) | |
Corporate Loans | | | 22 | | | Estimated recovery
proceeds | | Nominal value | | N/A | | | 0.01% of par (b) | |
69 OPPENHEIMER FUNDAMENTAL ALTERNATIVES FUND
NOTES TO CONSOLIDATED FINANCIAL STATEMENTS Continued
3. Securities Valuation (Continued)
| | | | | | | | | | | | | | |
| | | Value as of
October 31, 2015 | | | Valuation Technique | | Unobservable input | | Range of Unobservable Inputs | | Unobservable Input Used | |
| |
Investments, at Value: | | | | | | | | | | | | | | |
| |
Structured Security | | | | | | Discount to
Capital Account | | | | | | | | |
| | $ | 895,986 | | | Balance | | Discount rate
Capital Account
Balance | | N/A
$5,572,570-
$6,416,773 | | | 84% (c) 5,572,570 (c) | |
| | | | | | | | | | | | | | |
Total | | $ | 21,730,519 | | | | | | | | | | | |
| | | | | | | | | | | | | | |
(a) Security classified as Level 3 whose unadjusted value was provided by a pricing service for which such inputs are unobservable. The Manager periodically reviews pricing vendor methodologies and inputs to confirm they are determined using unobservable inputs and have been appropriately classified. Such security’s fair valuation could change significantly based on changes in unobservable inputs used by the pricing service.
(b) The Fund fair values certain corporate loans using a nominal value to reflect the low probability of future recovery. The Manager monitors such investments for additional market information or the occurrence of a significant event which would warrant a re-evaluation of the security’s fair valuation. A significant increase (decrease) in the future distribution amount will result in a significant increase (decrease) to the fair value of the investment.
(c) The Fund fair values the structured security at a discount to the selected capital account balance to reflect uncertainty and illiquidity. A significant decrease (increase) to the discount rate, or a significant increase (decrease) to the capital account balance, will result in a significant increase (decrease) to the fair value of the investment.
4. Investments and Risks
Investments in Affiliated Funds. The Fund is permitted to invest in other mutual funds advised by the Manager (“Affiliated Funds”). Affiliated Funds are open-end management investment companies registered under the 1940 Act, as amended. The Manager is the investment adviser of, and the Sub-Adviser provides investment and related advisory services to, the Affiliated Funds. When applicable, the Fund’s investments in Affiliated Funds are included in the Consolidated Statement of Investments. Shares of Affiliated Funds are valued at their net asset value per share. As a shareholder, the Fund is subject to its proportional share of the Affiliated Funds’ expenses, including their management fee. The Manager will waive fees and/or reimburse Fund expenses in an amount equal to the indirect management fees incurred through the Fund’s investment in the Affiliated Funds.
Each of the Affiliated Funds in which the Fund invests has its own investment risks, and those risks can affect the value of the Fund’s investments and therefore the value of the Fund’s shares. To the extent that the Fund invests more of its assets in one Affiliated Fund than in another, the Fund will have greater exposure to the risks of that Affiliated Fund.
Investment in Oppenheimer Institutional Money Market Fund. The Fund is permitted to invest daily available cash balances in a money market Affiliated Fund. The Fund may invest the available cash in Class E shares of Oppenheimer Institutional Money Market Fund (“IMMF”) to seek current income while preserving liquidity or for defensive purposes. IMMF is regulated as a money market fund under the Investment Company Act of 1940, as amended.
70 OPPENHEIMER FUNDAMENTAL ALTERNATIVES FUND
4. Investments and Risks (Continued)
Investment in Oppenheimer Master Fund. The Fund is permitted to invest in entities sponsored and/or advised by the Manager or an affiliate. Certain of these entities in which the Fund invests are mutual funds registered under the Investment Company Act of 1940 that expect to be treated as partnerships for tax purposes, specifically Oppenheimer Master Loan Fund, LLC (the “Master Fund”). The Master Fund has its own investment risks, and those risks can affect the value of the Fund’s investments and therefore the value of the Fund’s shares. To the extent that the Fund invests more of its assets in the Master Fund, the Fund will have greater exposure to the risks of the Master Fund.
The investment objective of the Master Fund is to seek income. The Fund’s investment in the Master Fund is included in the Consolidated Statement of Investments. The Fund recognizes income and gain/(loss) on its investment in the master fund according to its allocated pro-rata share, based on its relative proportion of total outstanding Master Fund shares held, of the total net income earned and the net gain/(loss) realized on investments sold by the Master Fund. As a shareholder, the Fund is subject to its proportional share of the Master Fund’s expenses, including its management fee. The Manager will waive fees and/or reimburse Fund expenses in an amount equal to the indirect management fees incurred through the Fund’s investment in the Master Fund. The Fund owns 1.6% of the Master Fund at period end.
Structured Securities. The Fund invests in structured securities whose market values, interest rates and/or redemption prices are linked to the performance of underlying foreign currencies, interest rate spreads, stock market indices, prices of individual securities, commodities or other financial instruments or the occurrence of other specific events. The structured securities are often leveraged, increasing the volatility of each note’s market value relative to the change in the underlying linked financial element or event. Fluctuations in value of these securities are recorded as unrealized gains and losses in the accompanying Consolidated Statement of Operations. The Fund records a realized gain or loss when a structured security is sold or matures.
Loans. The Fund invests in loans made to U.S. and foreign borrowers that are corporations, partnerships or other business entities. The Fund will do so directly as an original lender or by assignment or indirectly through participation agreements or certain derivative instruments. While many of these loans will be collateralized, the Fund can also invest in uncollateralized loans. Loans are often issued in connection with recapitalizations, acquisitions, leveraged buyouts, and refinancing of borrowers. The loans often pay interest at rates that float above (or are adjusted periodically based on) a benchmark that reflects current interest rates although the Fund can also invest in loans with fixed interest rates.
Securities on a When-Issued or Delayed Delivery Basis. The Fund may purchase securities on a “when-issued” basis, and may purchase or sell securities on a “delayed delivery” basis. “When-issued” or “delayed delivery” refers to securities whose terms and indenture are available and for which a market exists, but which are not available for immediate delivery. Delivery and payment for securities that have been purchased by the Fund
71 OPPENHEIMER FUNDAMENTAL ALTERNATIVES FUND
NOTES TO CONSOLIDATED FINANCIAL STATEMENTS Continued
4. Investments and Risks (Continued)
on a when-issued basis normally takes place within six months and possibly as long as two years or more after the trade date. During this period, such securities do not earn interest, are subject to market fluctuation and may increase or decrease in value prior to their delivery. The purchase of securities on a when-issued basis may increase the volatility of the Fund’s net asset value to the extent the Fund executes such transactions while remaining substantially fully invested. When the Fund engages in when-issued or delayed delivery transactions, it relies on the buyer or seller, as the case may be, to complete the transaction. Their failure to do so may cause the Fund to lose the opportunity to obtain or dispose of the security at a price and yield it considers advantageous. The Fund may also sell securities that it purchased on a when-issued basis or forward commitment prior to settlement of the original purchase.
At period end, the Fund had purchased securities issued on a when-issued or delayed delivery basis and sold securities issued on a delayed delivery basis as follows:
| | | | |
| | | When-Issued or Delayed Delivery
Basis Transactions | |
| |
Purchased securities | | | $8,796,714 | |
Sold securities | | | 1,478,520 | |
Restricted Securities. At period end, investments in securities included issues that are restricted. A restricted security may have a contractual restriction on its resale and is valued under methods approved by the Board of Trustees as reflecting fair value. Securities that are restricted are marked with an applicable footnote on the Consolidated Statement of Investments. Restricted securities are reported on a schedule following the Consolidated Statement of Investments.
Equity Security Risk. Stocks and other equity securities fluctuate in price. The value of the Fund’s portfolio may be affected by changes in the equity markets generally. Equity markets may experience significant short-term volatility and may fall sharply at times. Different markets may behave differently from each other and U.S. equity markets may move in the opposite direction from one or more foreign stock markets. Adverse events in any part of the equity or fixed-income markets may have unexpected negative effects on other market segments.
The prices of individual equity securities generally do not all move in the same direction at the same time and a variety of factors can affect the price of a particular company’s securities. These factors may include, but are not limited to, poor earnings reports, a loss of customers, litigation against the company, general unfavorable performance of the company’s sector or industry, or changes in government regulations affecting the company or its industry.
Credit Risk. Loans and debt securities are subject to credit risk. Credit risk relates to the ability of the borrower under a loan or issuer of a debt to meet interest or principal payments
72 OPPENHEIMER FUNDAMENTAL ALTERNATIVES FUND
4. Investments and Risks (Continued)
or both as they become due. The Fund may acquire securities that have missed an interest payment, and is not obligated to dispose of securities whose issuers subsequently miss an interest payment. Information concerning securities not accruing income at period end is as follows:
| | | | |
Cost | | | $570,898 | |
Market Value | | | $25,687 | |
Market Value as % of Net Assets | | | Less than 0.005% | |
The Fund has entered into forbearance agreements with certain obligors under which the Fund has agreed to temporarily forego receipt of the original principal or coupon interest rates. At period end, securities with an aggregate market value of $808,149, representing 0.09% of the Fund’s net assets, were subject to these forbearance agreements.
5. Market Risk Factors
The Fund’s investments in securities and/or financial derivatives may expose the fund to various market risk factors:
Commodity Risk. Commodity risk relates to the change in value of commodities or commodity indexes as they relate to increases or decreases in the commodities market.
Commodities are physical assets that have tangible properties. Examples of these types of assets are crude oil, heating oil, metals, livestock, and agricultural products.
Credit Risk. Credit risk relates to the ability of the issuer of debt to meet interest and principal payments, or both, as they come due. In general, lower-grade, higher-yield debt securities are subject to credit risk to a greater extent than lower-yield, higher-quality securities.
Equity Risk. Equity risk relates to the change in value of equity securities as they relate to increases or decreases in the general market.
Foreign Exchange Rate Risk. Foreign exchange rate risk relates to the change in the U.S. dollar value of a security held that is denominated in a foreign currency. The U.S. dollar value of a foreign currency denominated security will decrease as the dollar appreciates against the currency, while the U.S. dollar value will increase as the dollar depreciates against the currency.
Interest Rate Risk. Interest rate risk refers to the fluctuations in value of fixed-income securities resulting from the inverse relationship between price and yield. For example, an increase in general interest rates will tend to reduce the market value of already issued fixed-income investments, and a decline in general interest rates will tend to increase their value. In addition, debt securities with longer maturities, which tend to have higher yields, are subject to potentially greater fluctuations in value from changes in interest rates than obligations with shorter maturities.
Volatility Risk. Volatility risk refers to the magnitude of the movement, but not the direction of the movement, in a financial instrument’s price over a defined time period. Large increases or decreases in a financial instrument’s price over a relative time period typically indicate greater volatility risk, while small increases or decreases in its price typically indicate lower volatility risk.
73 OPPENHEIMER FUNDAMENTAL ALTERNATIVES FUND
NOTES TO CONSOLIDATED FINANCIAL STATEMENTS Continued
6. Use of Derivatives
The Fund’s investment objective not only permits the Fund to purchase investment securities, it also allows the Fund to enter into various types of derivatives contracts, including, but not limited to, futures contracts, forward currency exchange contracts, credit default swaps, interest rate swaps, total return swaps, variance swaps and purchased and written options. In doing so, the Fund will employ strategies in differing combinations to permit it to increase, decrease, or change the level or types of exposure to market risk factors. These instruments may allow the Fund to pursue its objectives more quickly and efficiently than if it were to make direct purchases or sales of securities capable of effecting a similar response to market factors. Such contracts may be entered into through a bilateral over-the-counter (“OTC”) transaction, or through a securities or futures exchange and cleared through a clearinghouse.
Derivatives may have little or no initial cash investment relative to their market value exposure and therefore can produce significant gains or losses in excess of their cost due to unanticipated changes in the market risk factors and the overall market. This use of embedded leverage allows the Fund to increase its market value exposure relative to its net assets and can substantially increase the volatility of the Fund’s performance. In instances where the Fund is using derivatives to decrease, or hedge, exposures to market risk factors for securities held by the Fund, there are also risks that those derivatives may not perform as expected resulting in losses for the combined or hedged positions. Some derivatives have the potential for unlimited loss, regardless of the size of the Fund’s initial investment.
Additional associated risks from investing in derivatives also exist and potentially could have significant effects on the valuation of the derivative and the Fund. Typically, the associated risks are not the risks that the Fund is attempting to increase or decrease exposure to, per its investment objectives, but are the additional risks from investing in derivatives. Examples of these associated risks are liquidity risk, which is the risk that the Fund will not be able to sell the derivative in the open market in a timely manner, and counterparty credit risk, which is the risk that the counterparty will not fulfill its obligation to the Fund.
The Fund’s actual exposures to these market risk factors and associated risks during the period are discussed in further detail, by derivative type, below.
Forward Currency Exchange Contracts
The Fund may enter into forward currency exchange contracts (“forward contracts”) for the purchase or sale of a foreign currency at a negotiated rate at a future date. Such contracts are traded in the OTC inter-bank currency dealer market.
Forward contracts are reported on a schedule following the Consolidated Statement of Investments. The unrealized appreciation (depreciation) is reported in the Consolidated Statement of Assets and Liabilities as a receivable (or payable) and in the Consolidated Statement of Operations within the change in unrealized appreciation (depreciation). At contract close, the difference between the original cost of the contract and the value at the close date is recorded as a realized gain (loss) in the Consolidated Statement of Operations.
The Fund has entered into forward contracts with the obligation to purchase specified foreign currencies in the future at a currently negotiated forward rate in order to take a positive investment perspective on the related currency. These forward contracts seek to increase exposure to foreign exchange rate risk.
74 OPPENHEIMER FUNDAMENTAL ALTERNATIVES FUND
6. Use of Derivatives (Continued)
The Fund has entered into forward contracts with the obligation to purchase specified foreign currencies in the future at a currently negotiated forward rate in order to decrease exposure to foreign exchange rate risk associated with foreign currency denominated securities held by the Fund.
The Fund has entered into forward contracts with the obligation to sell specified foreign currencies in the future at a currently negotiated forward rate in order to take a negative investment perspective on the related currency. These forward contracts seek to increase exposure to foreign exchange rate risk.
The Fund has entered into forward contracts with the obligation to sell specified foreign currencies in the future at a currently negotiated forward rate in order to decrease exposure to foreign exchange rate risk associated with foreign currency denominated securities held by the Fund.
During the reporting period, the Fund had daily average contract amounts on forward contracts to buy and sell of $4,247,571 and $56,865,919, respectively.
Additional associated risk to the Fund includes counterparty credit risk. Counterparty credit risk arises from the possibility that the counterparty to a forward contract will default and fail to perform its obligations to the Fund.
Futures Contracts
A futures contract is a commitment to buy or sell a specific amount of a commodity, financial instrument or currency at a negotiated price on a stipulated future date. The Fund may buy and sell futures contracts and may also buy or write put or call options on these futures contracts. Futures contracts and options thereon are generally entered into on a regulated futures exchange and cleared through a clearinghouse associated with the exchange.
Upon entering into a futures contract, the Fund is required to deposit either cash or securities (initial margin) in an amount equal to a certain percentage of the contract value in an account registered in the futures commission merchant’s name. Subsequent payments (variation margin) are paid to or from the futures commission merchant each day equal to the daily changes in the contract value. Such payments are recorded as unrealized gains and losses. Should the Fund fail to make requested variation margin payments, the futures commission merchant can gain access to the initial margin to satisfy the Fund’s payment obligations.
Futures contracts are reported on a schedule following the Consolidated Statement of Investments. Securities held by a futures commission merchant to cover initial margin requirements on open futures contracts are noted in the Consolidated Statement of Investments. Cash held by a futures commission merchant to cover initial margin requirements on open futures contracts and the receivable and/or payable for the daily mark to market for the variation margin are noted in the Consolidated Statement of Assets and Liabilities. The net change in unrealized appreciation and depreciation is reported in the Consolidated Statement of Operations. Realized gains (losses) are reported in the Consolidated Statement of Operations at the closing or expiration of futures contracts.
75 OPPENHEIMER FUNDAMENTAL ALTERNATIVES FUND
NOTES TO CONSOLIDATED FINANCIAL STATEMENTS Continued
6. Use of Derivatives (Continued)
The Fund has sold futures contracts on various bonds and notes to decrease exposure to interest rate risk.
The Fund has sold futures contracts on various equity indexes to decrease exposure to equity risk.
During the reporting period, the Fund had an ending monthly average market value of $49,557,295 on futures contracts sold.
Additional associated risks of entering into futures contracts (and related options) include the possibility that there may be an illiquid market where the Fund is unable to liquidate the contract or enter into an offsetting position and, if used for hedging purposes, the risk that the price of the contract will correlate imperfectly with the prices of the Fund’s securities.
Option Activity
The Fund may buy and sell put and call options, or write put and call options. When an option is written, the Fund receives a premium and becomes obligated to sell or purchase the underlying security, currency or other underlying financial instrument at a fixed price, upon exercise of the option.
Options can be traded through an exchange or through a privately negotiated arrangement with a dealer in an OTC transaction. Options traded through an exchange are generally cleared through a clearinghouse (such as The Options Clearing Corporation). The difference between the premium received or paid, and market value of the option, is recorded as unrealized appreciation or depreciation. The net change in unrealized appreciation or depreciation is reported in the Consolidated Statement of Operations. When an option is exercised, the cost of the security purchased or the proceeds of the security sale are adjusted by the amount of premium received or paid. Upon the expiration or closing of the option transaction, a gain or loss is reported in the Consolidated Statement of Operations.
The Fund has purchased put options on currencies to decrease exposure to foreign exchange rate risk. A purchased put option becomes more valuable as the price of the underlying financial instrument depreciates relative to the strike price.
The Fund has purchased call options on treasury and/or euro futures to increase exposure to interest rate risk. A purchased call option becomes more valuable as the price of the underlying financial instrument appreciates relative to the strike price.
The Fund has purchased call options on individual equity securities and/or equity indexes to increase exposure to equity risk. A purchased call option becomes more valuable as the price of the underlying financial instrument appreciates relative to the strike price.
During the reporting period, the Fund had an ending monthly average market value of $427,173 and $255,765 on purchased call options and purchased put options, respectively.
Options written, if any, are reported in a schedule following the Consolidated Statement of Investments and as a liability in the Consolidated Statement of Assets and Liabilities. Securities held in collateral accounts to cover potential obligations with respect to outstanding written options are noted in the Consolidated Statement of Investments.
76 OPPENHEIMER FUNDAMENTAL ALTERNATIVES FUND
6. Use of Derivatives (Continued)
The risk in writing a call option is that the market price of the security increases and if the option is exercised, the Fund must either purchase the security at a higher price for delivery or, if the Fund owns the underlying security, give up the opportunity for profit. The risk in writing a put option is that the Fund may incur a loss if the market price of the security decreases and the option is exercised. The risk in buying an option is that the Fund pays a premium whether or not the option is exercised. The Fund also has the additional risk that there may be an illiquid market where the Fund is unable to close the contract.
Additional associated risks to the Fund include counterparty credit risk and liquidity risk.
At period end, the Fund had no written options outstanding.
Swap Contracts
The Fund may enter into swap contract agreements with a counterparty to exchange a series of cash flows based on either specified reference rates, the price or volatility of asset or non-asset references, or the occurrence of a credit event, over a specified period. Swaps can be executed in a bi-lateral privately negotiated arrangement with a dealer in an OTC transaction (“OTC swaps”) or executed on a regulated market. Certain swaps, regardless of the venue of their execution, are required to be cleared through a clearinghouse (“centrally cleared swaps”). Swap contracts may include interest rate, equity, debt, index, total return, credit default, currency, and volatility swaps.
Swap contracts are reported on a schedule following the Consolidated Statement of Investments. The values of centrally cleared swap and OTC swap contracts are aggregated by positive and negative values and disclosed separately on the Consolidated Statement of Assets and Liabilities. The unrealized appreciation (depreciation) related to the change in the valuation of the notional amount of the swap is combined with the accrued interest due to (owed by) the Fund, if any, at termination or settlement. The net change in this amount during the period is included on the Consolidated Statement of Operations. The Fund also records any periodic payments received from (paid to) the counterparty, including at termination, under such contracts as realized gain (loss) on the Consolidated Statement of Operations.
Swap contract agreements are exposed to the market risk factor of the specific underlying reference rate or asset. Swap contracts are typically more attractively priced compared to similar investments in related cash securities because they isolate the risk to one market risk factor and eliminate the other market risk factors. Investments in cash securities (for instance bonds) have exposure to multiple risk factors (credit and interest rate risk). Because swaps have embedded leverage, they can expose the Fund to substantial risk in the isolated market risk factor.
Credit Default Swap Contracts. A credit default swap is a contract that enables an investor to buy or sell protection against a defined-issuer credit event, such as the issuer’s failure to make timely payments of interest or principal on a debt security, bankruptcy or restructuring. The Fund may enter into credit default swaps either by buying or selling protection on a corporate issuer, sovereign issuer, or a basket or index of issuers (the “reference asset”).
77 OPPENHEIMER FUNDAMENTAL ALTERNATIVES FUND
NOTES TO CONSOLIDATED FINANCIAL STATEMENTS Continued
6. Use of Derivatives (Continued)
The buyer of protection pays a periodic fee to the seller of protection based on the notional amount of the swap contract. The seller of protection agrees to compensate the buyer of protection for future potential losses as a result of a credit event on the reference asset. The contract effectively transfers the credit event risk of the reference asset from the buyer of protection to the seller of protection.
The ongoing value of the contract will fluctuate throughout the term of the contract based primarily on the credit risk of the reference asset. If the credit quality of the reference asset improves relative to the credit quality at contract initiation, the buyer of protection may have an unrealized loss greater than the anticipated periodic fee owed. This unrealized loss would be the result of current credit protection being cheaper than the cost of credit protection at contract initiation. If the buyer elects to terminate the contract prior to its maturity, and there has been no credit event, this unrealized loss will become realized. If the contract is held to maturity, and there has been no credit event, the realized loss will be equal to the periodic fee paid over the life of the contract.
If there is a credit event, the buyer of protection can exercise its rights under the contract and receive a payment from the seller of protection equal to the notional amount of the swap less the market value of specified debt securities issued by the reference asset. Upon exercise of the contract the difference between such value and the notional amount is recorded as realized gain (loss) and is included on the Consolidated Statement of Operations.
The Fund has sold credit protection through credit default swaps to increase exposure to the credit risk of individual issuers and/or indexes of issuers that are either unavailable or considered to be less attractive in the bond market.
The Fund has purchased credit protection through credit default swaps to decrease exposure to the credit risk of individual issuers and/or indexes of issuers.
The Fund has purchased credit protection through credit default swaps to take an outright negative investment perspective on the credit risk of an individual issuer or basket or index of issuers as opposed to decreasing its credit risk exposure related to debt securities of such issuer(s) held by the Fund.
For the reporting period, the Fund had ending monthly average notional amounts of $146,701,188 and $32,692,308 on credit default swaps to buy protection and credit default swaps to sell protection, respectively.
Additional associated risks to the Fund include counterparty credit risk and liquidity risk.
Interest Rate Swap Contracts. An interest rate swap is an agreement between counterparties to exchange periodic payments based on interest rates. One cash flow stream will typically be a floating rate payment based upon a specified floating interest rate while the other is typically a fixed interest rate.
The Fund has entered into interest rate swaps in which it pays a floating interest rate and receives a fixed interest rate in order to increase exposure to interest rate risk. Typically, if relative interest rates rise, payments made by the Fund under a swap agreement will be greater than the payments received by the Fund.
78 OPPENHEIMER FUNDAMENTAL ALTERNATIVES FUND
6. Use of Derivatives (Continued)
For the reporting period, the Fund had ending monthly average notional amounts of $4,783,621 on interest rate swaps which receive a fixed rate.
Additional associated risks to the Fund include counterparty credit risk and liquidity risk.
Total Return Swap Contracts. A total return swap is an agreement between counterparties to exchange periodic payments based on the value of asset or non-asset references. One cash flow is typically based on a non-asset reference (such as an interest rate) and the other on the total return of a reference asset (such as a security or a basket of securities or securities index). The total return of the reference asset typically includes appreciation or depreciation on the reference asset, plus any interest or dividend payments.
Total return swap contracts are exposed to the market risk factor of the specific underlying financial instrument or index. Total return swaps are less standard in structure than other types of swaps and can isolate and/or include multiple types of market risk factors including equity risk, credit risk, and interest rate risk.
The Fund has entered into total return swaps on various equity securities or indexes to increase exposure to equity risk. These equity risk related total return swaps require the Fund to pay a floating reference interest rate, and an amount equal to the negative price movement of securities or an index (expressed as a percentage) multiplied by the notional amount of the contract. The Fund will receive payments equal to the positive price movement of the same securities or index (expressed as a percentage) multiplied by the notional amount of the contract and, in some cases, dividends paid on the securities.
For the reporting period, the Fund had ending monthly average notional amounts of $9,023,844 on total return swaps which are long the reference asset.
Additional associated risks to the Fund include counterparty credit risk and liquidity risk.
Swaption Transactions
The Fund may enter into a swaption contract which grants the purchaser the right, but not the obligation, to enter into a swap transaction at preset terms detailed in the underlying agreement within a specified period of time. The purchaser pays a premium to the swaption writer who bears the risk of unfavorable changes in the preset terms on the underlying swap.
Purchased swaptions are reported as a component of investments in the Consolidated Statement of Investments and the Consolidated Statement of Assets and Liabilities. Written swaptions are reported on a schedule following the Consolidated Statement of Investments and their value is reported as a separate asset or liability line item in the Consolidated Statement of Assets and Liabilities. The net change in unrealized appreciation or depreciation on written swaptions is separately reported in the Consolidated Statement of Operations. When a swaption is exercised, the cost of the swap is adjusted by the amount of premium paid or received. Upon the expiration or closing of an unexercised swaption contract, a gain or loss is reported in the Consolidated Statement of Operations for the amount of the premium paid or received.
The Fund generally will incur a greater risk when it writes a swaption than when it purchases a swaption. When the Fund writes a swaption it will become obligated, upon exercise of the swaption, according to the terms of the underlying agreement. Swaption contracts written by the Fund do not give rise to counterparty credit risk prior to exercise as they obligate the Fund, not its counterparty, to perform. When the Fund purchases a
79 OPPENHEIMER FUNDAMENTAL ALTERNATIVES FUND
NOTES TO CONSOLIDATED FINANCIAL STATEMENTS Continued
6. Use of Derivatives (Continued)
swaption it only risks losing the amount of the premium it paid if the swaption expires unexercised. However, when the Fund exercises a purchased swaption there is a risk that the counterparty will fail to perform or otherwise default on its obligations under the swaption contract.
The Fund has purchased swaptions which gives it the option to enter into an interest rate swap in which it pays a floating interest rate and receives a fixed interest rate in order to increase exposure to interest rate risk. A purchased swaption of this type becomes more valuable as the reference interest rate decreases relative to the preset interest rate.
The Fund has purchased swaptions which gives it the option to enter into an interest rate swap in which it pays a fixed interest rate and receives a floating interest rate in order to decrease exposure to interest rate risk. A purchased swaption of this type becomes more valuable as the reference interest rate increases relative to the preset interest rate.
During the reporting period, the Fund had an ending monthly average market value of $3,533,666 on purchased swaptions.
Counterparty Credit Risk. Derivative positions are subject to the risk that the counterparty will not fulfill its obligation to the Fund. The Fund intends to enter into derivative transactions with counterparties that the Manager believes to be creditworthy at the time of the transaction.
The Fund’s risk of loss from counterparty credit risk on OTC derivatives is generally limited to the aggregate unrealized gain netted against any collateral held by the Fund. For OTC options purchased, the Fund bears the risk of loss of the amount of the premiums paid plus the positive change in market values net of any collateral held by the Fund should the counterparty fail to perform under the contracts. Options written by the Fund do not typically give rise to counterparty credit risk, as options written generally obligate the Fund and not the counterparty to perform.
To reduce counterparty risk with respect to OTC transactions, the Fund has entered into master netting arrangements, established within the Fund’s International Swap and Derivatives Association, Inc. (“ISDA”) master agreements, which allow the Fund to make (or to have an entitlement to receive) a single net payment in the event of default (close-out netting) for outstanding payables and receivables with respect to certain OTC positions in swaps, options, swaptions, and forward currency exchange contracts for each individual counterparty. In addition, the Fund may require that certain counterparties post cash and/or securities in collateral accounts to cover their net payment obligations for those derivative contracts subject to ISDA master agreements. If the counterparty fails to perform under these contracts and agreements, the cash and/or securities will be made available to the Fund.
At period end, the Fund has required certain counterparties to post collateral of $5,615,810.
ISDA master agreements include credit related contingent features which allow counterparties to OTC derivatives to terminate derivative contracts prior to maturity in the event that, for example, the Fund’s net assets decline by a stated percentage or the Fund fails to meet the terms of its ISDA master agreements, which would cause the Fund to accelerate payment of any net liability owed to the counterparty.
80 OPPENHEIMER FUNDAMENTAL ALTERNATIVES FUND
6. Use of Derivatives (Continued)
For financial reporting purposes, the Fund does not offset derivative assets and derivative liabilities that are subject to netting arrangements in the Consolidated Statement of Assets and Liabilities. Bankruptcy or insolvency laws of a particular jurisdiction may impose restrictions on or prohibitions against the right of offset in bankruptcy, insolvency or other events.
The Fund’s risk of loss from counterparty credit risk on exchange-traded derivatives cleared through a clearinghouse and for centrally cleared swaps is generally considered lower than as compared to OTC derivatives. However, counterparty credit risk exists with respect to initial and variation margin deposited/paid by the Fund that is held in futures commission merchant, broker and/or clearinghouse accounts for such exchange-traded derivatives and for centrally cleared swaps.
With respect to centrally cleared swaps, such transactions will be submitted for clearing, and if cleared, will be held in accounts at futures commission merchants or brokers that are members of clearinghouses. While brokers, futures commission merchants and clearinghouses are required to segregate customer margin from their own assets, in the event that a broker, futures commission merchant or clearinghouse becomes insolvent or goes into bankruptcy and at that time there is a shortfall in the aggregate amount of margin held by the broker, futures commission merchant or clearinghouse for all its customers, U.S. bankruptcy laws will typically allocate that shortfall on a pro-rata basis across all the broker’s, futures commission merchant’s or clearinghouse’s customers, potentially resulting in losses to the Fund.
There is the risk that a broker, futures commission merchant or clearinghouse will decline to clear a transaction on the Fund’s behalf, and the Fund may be required to pay a termination fee to the executing broker with whom the Fund initially enters into the transaction. Clearinghouses may also be permitted to terminate centrally cleared swaps at any time. The Fund is also subject to the risk that the broker or futures commission merchant will improperly use the Fund’s assets deposited/paid as initial or variation margin to satisfy payment obligations of another customer. In the event of a default by another customer of the broker or futures commission merchant, the Fund might not receive its variation margin payments from the clearinghouse, due to the manner in which variation margin payments are aggregated for all customers of the broker/futures commission merchant.
Collateral and margin requirements differ by type of derivative. Margin requirements are established by the broker, futures commission merchant or clearinghouse for exchange-traded and cleared derivatives, including centrally cleared swaps. Brokers, futures commission merchants and clearinghouses can ask for margin in excess of the regulatory minimum, or increase the margin amount, in certain circumstances.
Collateral terms are contract specific for OTC derivatives. For derivatives traded under an ISDA master agreement, the collateral requirements are typically calculated by netting the mark to market amount for each transaction under such agreement and comparing that amount to the value of any collateral currently pledged by the Fund or the counterparty.
For financial reporting purposes, cash collateral that has been pledged to cover obligations of the Fund, if any, is reported separately on the Consolidated Statement of Assets and Liabilities as cash pledged as collateral. Non-cash collateral pledged by the Fund, if any, is noted in the Consolidated Statement of Investments. Generally, the amount of collateral due
81 OPPENHEIMER FUNDAMENTAL ALTERNATIVES FUND
NOTES TO CONSOLIDATED FINANCIAL STATEMENTS Continued
6. Use of Derivatives (Continued)
from or to a party must exceed a minimum transfer amount threshold (e.g. $250,000) before a transfer has to be made. To the extent amounts due to the Fund from its counterparties are not fully collateralized, contractually or otherwise, the Fund bears the risk of loss from counterparty nonperformance.
The following table presents by counterparty the Fund’s OTC derivative assets net of the related collateral pledged by the Fund at October 30, 2015:
| | | | | | | | | | | | | | | | | | | | |
| | | | | | Gross Amounts Not Offset in the Consolidated
Statement of Assets & Liabilities | | | | |
| Counterparty | | Gross Amounts
Not Offset in
the
Consolidated
Statement of
Assets &
Liabilities* | | | Financial
Instruments
Available for
Offset | | | Financial
Instruments
Collateral
Received** | | | Cash Collateral
Received** | | | Net Amount | |
| |
| Bank of America NA | | $ | 713,701 | | | $ | (384,861 | ) | | $ | (328,840 | ) | | $ | — | | | $ | — | |
| Barclays Bank plc | | | 131,810 | | | | — | | | | — | | | | — | | | | 131,810 | |
| BNP Paribas | | | 455,817 | | | | — | | | | (455,817 | ) | | | — | | | | — | |
| Deutsche Bank Securities, Inc. | | | 13,264 | | | | — | | | | — | | | | (13,264) | | | | — | |
| Goldman Sachs Group, Inc. (The) | | | 4,597,758 | | | | (2,507,546 | ) | | | (2,090,212 | ) | | | — | | | | — | |
| JPMorgan Chase Bank NA | | | 570,245 | | | | (5,916 | ) | | | (564,329 | ) | | | — | | | | — | |
| Morgan Stanley | | | 455,817 | | | | — | | | | — | | | | — | | | | 455,817 | |
| | | | |
| | $ | 6,938,412 | | | $ | (2,898,323 | ) | | $ | (3,439,198 | ) | | $ | (13,264) | | | $ | 587,627 | |
| | | | |
*OTC derivatives are reported gross on the Statement of Assets and Liabilities. Exchange traded options and margin related to centrally cleared swaps and futures are excluded from these reported amounts. **Reported collateral posted for the benefit of the Fund within this table is limited to the net outstanding amount due from an individual counterparty. The collateral posted for the benefit of the Fund may exceed these amounts. The following table presents by counterparty the Fund’s OTC derivative liabilities net of the related collateral pledged by the Fund at October 30, 2015: | |
| | | | | | Gross Amounts Not Offset in the Consolidated
Statement of Assets & Liabilities | | | | |
| Counterparty | | Gross Amounts
Not Offset in
the
Consolidated
Statement of
Assets &
Liabilities* | | | Financial
Instruments
Available for Offset | | | Financial
Instruments Collateral
Pledged** | | | Cash Collateral
Pledged** | | | Net Amount | |
| |
| Bank of America NA | | $ | (384,861) | | | $ | 384,861 | | | $ | — | | | $ | — | | | $ | — | |
| Citibank NA | | | (221,734) | | | | — | | | | — | | | | (320,000) | | | | (541,734) | |
| Goldman Sachs Bank USA | | | (5,905) | | | | — | | | | — | | | | (1,190,000) | | | | (1,195,905) | |
| Goldman Sachs Group, Inc. (The) | | | (2,507,546) | | | | 2,507,546 | | | | — | | | | — | | | | — | |
82 OPPENHEIMER FUNDAMENTAL ALTERNATIVES FUND
6. Use of Derivatives (Continued)
| | | | | | | | | | | | | | | | | | | | |
| | | | | | Gross Amounts Not Offset in the Consolidated
Statement of Assets & Liabilities (Continued) | | | | |
| | | | | | | | | | | | |
| Counterparty | | Gross Amounts
Not Offset in
the
Consolidated
Statement of
Assets &
Liabilities* | | | Financial
Instruments
Available for
Offset | | | Financial
Instruments
Collateral
Pledged** | | | Cash Collateral
Pledged** | | | Net Amount | |
| |
| JPMorgan Chase Bank NA | | $ | (5,916) | | | $ | 5,916 | | | $ | — | | | $ | — | | | $ | — | |
| Royal Bank of Scotland plc (The) | | | (43,829) | | | | — | | | | — | | | | — | | | | (43,829) | |
| | | | |
| | $ | (3,169,791) | | | $ | 2,898,323 | | | $ | — | | | $ | (1,510,000) | | | $ | (1,781,468) | |
| | | | |
*OTC derivatives are reported gross on the Consolidated Statement of Assets and Liabilities. Exchange traded options and margin related to centrally cleared swaps and futures are excluded from these reported amounts.
**Reported collateral pledged within this table is limited to the net outstanding amount due from the Fund. The securities pledged as collateral by the Fund as reported on the Consolidated Statements of Investments may exceed these amounts.
The following table presents the valuations of derivative instruments by risk exposure as reported within the Consolidated Statement of Assets and Liabilities at period end:
| | | | | | | | | | | | |
| | | Asset Derivatives | | | Liability Derivatives | |
| | | | | | |
Derivatives Not Accounted for as Hedging Instruments | | Consolidated Statement of Assets and Liabilities
Location | | Value | | | Consolidated Statement of Assets and Liabilities
Location | | Value | |
| |
| Credit contracts | | Swaps, at value | | | $ 1,483,528 | | | Swaps, at value | | | $ 462,682 | |
| Equity contracts | | | | | | | | Swaps, at value | | | 2,203,077 | |
| Interest rate contracts | | Swaps, at value | | | 61,269 | | | | | | | |
| Credit contracts | | Centrally cleared swaps, at value | | | 573,522 | | | Centrally cleared swaps, at value | | | 1,863,395 | |
| Interest rate contracts | | Variation margin receivable | | | 523 * | | | Variation margin payable | | | 5,859 * | |
| Forward currency exchange contracts | | Unrealized appreciation on forward currency exchange contracts | | | 1,241,677 | | | Unrealized depreciation on forward currency exchange contracts | | | 504,032 | |
| Forward currency exchange contracts | | Investments, at value | | | 749,896 ** | | | | | | | |
| Interest rate contracts | | Investments, at value | | | 3,402,042 ** | | | | | | | |
| | | | | | | | | | | | |
| Total | | | | | $ 7,512,457 | | | | | | $ 5,039,045 | |
| | | | | | | | | | | | |
*Includes only the current day’s variation margin. Prior variation margin movements have been reflected in cash on the Consolidated Statement of Assets and Liabilities upon receipt or payment.
**Amounts relate to purchased option contracts and purchased swaption contracts.
The effect of derivative instruments on the Consolidated Statement of Operations is as follows:
83 OPPENHEIMER FUNDAMENTAL ALTERNATIVES FUND
NOTES TO CONSOLIDATED FINANCIAL STATEMENTS Continued
6. Use of Derivatives (Continued)
| | | | | | | | | | | | | | | | | | | | |
| Amount of Realized Gain or (Loss) Recognized on Derivatives | |
| |
Derivatives Not Accounted for as Hedging Instruments | | Investment from
unaffiliated companies
(including premiums on options and swaptions exercised)* | | | Closing and
expiration of
futures contracts | | | Foreign
currency
transactions | | | Swap
contracts | | | Total | |
| |
| Credit contracts | | $ | — | | | $ | — | | | $ | — | | | $ | (2,693,194) | | | $ | (2,693,194) | |
| Equity contracts | | | (723,163) | | | | (2,552,182) | | | | — | | | | 2,353,628 | | | | (921,717) | |
| Forward currency exchange contracts | | | — | | | | — | | | | 6,666,422 | | | | — | | | | 6,666,422 | |
| Interest rate contracts | | | (5,940,375) | | | | (1,174,391) | | | | — | | | | 82,863 | | | | (7,031,903) | |
| | | | |
| Total | | $ | (6,663,538) | | | $ | (3,726,573) | | | $ | 6,666,422 | | | $ | (256,703) | | | $ | (3,980,392) | |
| | | | |
*Includes purchased option contracts, purchased swaption contracts, written option contracts exercised and written swaption contracts exercised, if any.
| | | | | | | | | | | | | | | | | | | | |
| Amount of Change in Unrealized Gain or (Loss) Recognized on Derivatives | |
| |
Derivatives Not Accounted for as Hedging Instruments | | Investments* | | | Futures
contracts | | | Translation of
assets and
liabilities
denominated in
foreign
currencies | | | Swap contracts | | | Total | |
| |
| Credit contracts | | $ | — | | | $ | — | | | $ | — | | | $ | 321,615 | | | $ | 321,615 | |
| Equity contracts | | | (360,393) | | | | 1,954,668 | | | | — | | | | (1,787,291) | | | | (193,016) | |
| Forward currency exchange contracts | | | 749,896 | | | | — | | | | 1,582,287 | | | | — | | | | 2,332,183 | |
| Interest rate contracts | | | 2,559,603 | | | | 66,931 | | | | — | | | | 61,269 | | | | 2,687,803 | |
| | | | |
| Total | | $ | 2,949,106 | | | $ | 2,021,599 | | | $ | 1,582,287 | | | $ | (1,404,407) | | | $ | 5,148,585 | |
| | | | |
*Includes purchased option contracts and purchased swaption contracts, if any.
7. Shares of Beneficial Interest
The Fund has authorized an unlimited number of $0.01 par value shares of beneficial interest of each class. Transactions in shares of beneficial interest were as follows:
| | | | | | | | | | | | | | | | |
| | | Year Ended October 30, 20151 | | | Year Ended October 31, 2014 | |
| | | Shares | | | Amount | | | Shares | | | Amount | |
| |
Class A | | | | | | | | | | | | | | | | |
| Sold | | | 2,747,796 | | | $ | 73,610,677 | | | | 1,674,826 | | | $ | 43,580,738 | |
| Dividends and/or distributions reinvested | | | 419,970 | | | | 11,036,800 | | | | — | | | | — | |
| Redeemed | | | (3,488,073) | | | | (93,256,588) | | | | (4,841,916) | | | | (125,616,349) | |
| | | | |
| Net decrease | | | (320,307) | | | $ | (8,609,111) | | | | (3,167,090) | | | $ | (82,035,611) | |
| | | | |
84 OPPENHEIMER FUNDAMENTAL ALTERNATIVES FUND
7. Shares of Beneficial Interest (Continued)
| | | | | | | | | | | | | | | | | | |
| | | Year Ended October 30, 20151 | | | | | Year Ended October 31, 2014 | |
| | | Shares | | | Amount | | | | | Shares | | | Amount | |
| |
Class B | | | | | | | | | | | | | | | | | | |
Sold | | | 15,739 | | | $ | 377,454 | | | | | | 15,376 | | | $ | 360,881 | |
Dividends and/or distributions reinvested | | | 10,988 | | | | 260,095 | | | | | | — | | | | — | |
Redeemed | | | (499,532) | | | | (11,973,742) | | | | | | (510,042) | | | | (11,940,149) | |
| | | | |
Net decrease | | | (472,805) | | | $ | (11,336,193) | | | | | | (494,666) | | | $ | (11,579,268) | |
| | | | |
| | | | | | | | | | | | | | | | | | |
| |
Class C | | | | | | | | | | | | | | | | | | |
Sold | | | 947,430 | | | $ | 22,745,866 | | | | | | 510,313 | | | $ | 12,012,240 | |
Dividends and/or distributions reinvested | | | 56,544 | | | | 1,338,398 | | | | | | — | | | | — | |
Redeemed | | | (773,115) | | | | (18,545,940) | | | | | | (998,059) | | | | (23,368,654) | |
| | | | |
Net increase (decrease) | | | 230,859 | | | $ | 5,538,324 | | | | | | (487,746) | | | $ | (11,356,414) | |
| | | | |
| | | | | | | | | | | | | | | | | | |
| |
Class I | | | | | | | | | | | | | | | | | | |
Sold | | | 2,344,685 | | | $ | 64,807,277 | | | | | | — | | | $ | — | |
Dividends and/or distributions reinvested | | | — | | | | — | | | | | | — | | | | — | |
Redeemed | | | (214,076) | | | | (5,893,944) | | | | | | — | | | | — | |
| | | | |
Net increase | | | 2,130,609 | | | $ | 58,913,333 | | | | | | — | | | $ | — | |
| | | | |
| | | | | | | | | | | | | | | | | | |
| |
Class R2 | | | | | | | | | | | | | | | | | | |
Sold | | | 126,438 | | | $ | 3,251,422 | | | | | | 90,119 | | | $ | 2,253,271 | |
Dividends and/or distributions reinvested | | | 10,202 | | | | 257,596 | | | | | | — | | | | — | |
Redeemed | | | (151,535) | | | | (3,890,027) | | | | | | (279,979) | | | | (7,011,669) | |
| | | | |
Net decrease | | | (14,895) | | | $ | (381,009) | | | | | | (189,860) | | | $ | (4,758,398) | |
| | | | |
| | | | | | | | | | | | | | | | | | |
| |
Class Y | | | | | | | | | | | | | | | | | | |
Sold | | | 3,035,636 | | | $ | 83,471,376 | | | | | | 527,470 | | | $ | 14,233,847 | |
Dividends and/or distributions reinvested | | | 13,913 | | | | 374,117 | | | | | | — | | | | — | |
Redeemed | | | (606,971) | | | | (16,624,767) | | | | | | (266,639) | | | | (7,127,109) | |
| | | | |
Net increase | | | 2,442,578 | | | $ | 67,220,726 | | | | | | 260,831 | | | $ | 7,106,738 | |
| | | | |
1. October 30, 2015 represents the last business day of the Fund’s reporting period. See Note 2.
2. Effective July 1, 2014, Class N shares were renamed Class R. See Note 1.
8. Purchases and Sales of Securities
The aggregate cost of purchases and proceeds from sales of securities, other than short-term obligations and investments in IMMF, for the reporting period were as follows:
| | | | |
| | | Purchases | | Sales |
|
| Investment securities | | $353,555,439 | | $344,312,837 |
85 OPPENHEIMER FUNDAMENTAL ALTERNATIVES FUND
NOTES TO CONSOLIDATED FINANCIAL STATEMENTS Continued
9. Fees and Other Transactions with Affiliates
Management Fees. Under the investment advisory agreement, the Fund pays the Manager a management fee based on the daily net assets of the Fund at an annual rate as shown in the following table:
| | | | |
| Fee Schedule | | | |
| |
Up to $1.0 billion | | | 0.85% | |
Next $500 million | | | 0.80 | |
Next $500 million | | | 0.75 | |
Next $500 million | | | 0.70 | |
Next $500 million | | | 0.65 | |
Next $500 million | | | 0.60 | |
Next $500 million | | | 0.55 | |
Over $4.0 billion | | | 0.50 | |
The Manager also provides investment management related services to the Subsidiary. The Subsidiary pays the Manager a monthly management fee at an annual rate according to the above schedule. The Subsidiary also pays certain other expenses including custody and directors’ fees.
The Fund’s effective management fee for the reporting period was 0.85% of average annual net assets before any Subsidiary management fees or any applicable waivers.
Sub-Adviser Fees. The Manager has retained the Sub-Adviser to provide the day-to-day portfolio management of the Fund and the Subsidiary. Under the Sub-Advisory Agreement, the Manager pays the Sub-Adviser an annual fee in monthly installments, equal to a percentage of the investment management fee collected by the Manager from the Fund and the Subsidiary, which shall be calculated after any investment management fee waivers. The fee paid to the Sub-Adviser is paid by the Manager, not by the Fund.
Transfer Agent Fees. OFI Global (the “Transfer Agent”) serves as the transfer and shareholder servicing agent for the Fund. The Fund pays the Transfer Agent a fee based on annual net assets. Fees incurred and average net assets for each class with respect to these services are detailed in the Consolidated Statement of Operations and Consolidated Financial Highlights, respectively.
Sub-Transfer Agent Fees. The Transfer Agent has retained Shareholder Services, Inc., a wholly-owned subsidiary of OFI (the “Sub-Transfer Agent”), to provide the day-to-day transfer agent and shareholder servicing of the Fund. Under the Sub-Transfer Agency Agreement, the Transfer Agent pays the Sub-Transfer Agent an annual fee in monthly installments, equal to a percentage of the transfer agent fee collected by the Transfer Agent from the Fund, which shall be calculated after any applicable fee waivers. The fee paid to the Sub-Transfer Agent is paid by the Transfer Agent, not by the Fund.
Trustees’ Compensation. The Fund has adopted an unfunded retirement plan (the “Plan”) for the Fund’s Independent Trustees. Benefits are based on years of service and fees paid to
86 OPPENHEIMER FUNDAMENTAL ALTERNATIVES FUND
9. Fees and Other Transactions with Affiliates (Continued)
each Trustee during their period of service. The Plan was frozen with respect to adding new participants effective December 31, 2006 (the “Freeze Date”) and existing Plan Participants as of the Freeze Date will continue to receive accrued benefits under the Plan. Active Independent Trustees as of the Freeze Date have each elected a distribution method with respect to their benefits under the Plan. During the reporting period, the Fund’s projected benefit obligations, payments to retired Trustees and accumulated liability were as follows:
| | | | |
Projected Benefit Obligations Increased | | $ | 4,586 | |
Payments Made to Retired Trustees | | | 28,951 | |
Accumulated Liability as of October 30, 2015 | | | 145,164 | |
The Fund’s Board of Trustees (“Board”) has adopted a compensation deferral plan for Independent Trustees that enables Trustees to elect to defer receipt of all or a portion of the annual compensation they are entitled to receive from the Fund. For purposes of determining the amount owed to the Trustee under the plan, deferred amounts are treated as though equal dollar amounts had been invested in shares of the Fund or in other Oppenheimer funds selected by the Trustee. The Fund purchases shares of the funds selected for deferral by the Trustee in amounts equal to his or her deemed investment, resulting in a Fund asset equal to the deferred compensation liability. Such assets are included as a component of “Other” within the asset section of the Consolidated Statement of Assets and Liabilities. Deferral of Trustees’ fees under the plan will not affect the net assets of the Fund and will not materially affect the Fund’s assets, liabilities or net investment income per share. Amounts will be deferred until distributed in accordance with the compensation deferral plan.
Distribution and Service Plan (12b-1) Fees. Under its General Distributor’s Agreement with the Fund, OppenheimerFunds Distributor, Inc. (the “Distributor”) acts as the Fund’s principal underwriter in the continuous public offering of the Fund’s classes of shares.
Distribution and Service Plan for Class A Shares. The Fund has adopted a Distribution and Service Plan (the “Plan”) for Class A shares pursuant to Rule 12b-1 under the 1940 Act. Under the Plan, the Fund pays a service fee to the Distributor at an annual rate of 0.25% of the daily net assets of Class A shares. The Distributor currently uses all of those fees to pay dealers, brokers, banks and other financial institutions periodically for providing personal services and maintenance of accounts of their customers that hold Class A shares. Under the Plan, the Fund may also pay an asset-based sales charge to the Distributor. However, the Fund’s Board has currently set the rate at zero. Fees incurred by the Fund under the Plan are detailed in the Consolidated Statement of Operations.
Distribution and Service Plans for Class B, Class C and Class R Shares. The Fund has adopted Distribution and Service Plans (the “Plans”) for Class B, Class C and Class R shares pursuant to Rule 12b-1 under the 1940 Act to compensate the Distributor for distributing those share classes, maintaining accounts and providing shareholder services. Under the Plans, the Fund pays the Distributor an annual asset-based sales charge of 0.75% on Class B and Class C shares’ daily net assets and 0.25% on Class R shares’ daily net assets. The Fund
87 OPPENHEIMER FUNDAMENTAL ALTERNATIVES FUND
NOTES TO CONSOLIDATED FINANCIAL STATEMENTS Continued
9. Fees and Other Transactions with Affiliates (Continued)
also pays a service fee under the Plans at an annual rate of 0.25% of daily net assets. The Plans continue in effect from year to year only if the Fund’s Board of Trustees votes annually to approve their continuance at an in person meeting called for that purpose. Fees incurred by the Fund under the Plans are detailed in the Consolidated Statement of Operations.
Sales Charges. Front-end sales charges and CDSC do not represent expenses of the Fund. They are deducted from the proceeds of sales of Fund shares prior to investment or from redemption proceeds prior to remittance, as applicable. The sales charges retained by the Distributor from the sale of shares and the CDSC retained by the Distributor on the redemption of shares is shown in the following table for the period indicated.
| | | | | | | | | | | | | | | | |
| Year Ended | | Class A
Front-End Sales
Charges Retained
by Distributor | | | Class B
Contingent
Deferred Sales
Charges Retained
by Distributor | | | Class C
Contingent
Deferred Sales
Charges Retained
by Distributor | | | Class R
Contingent
Deferred Sales
Charges Retained
by Distributor | |
| |
October 30, 2015 | | | $23,003 | | | | $21,196 | | | | $7,987 | | | | $8 | |
Waivers and Reimbursements of Expenses. The Manager has contractually agreed to waive the management fee it receives from the Fund in an amount equal to the management fee it receives from the Subsidiary. During the reporting period, the Manager waived $221,760.
The Manager will waive fees and/or reimburse Fund expenses in an amount equal to the indirect management fees incurred through the Fund’s investments in underlying funds managed by the Manager or its affiliates. During the reporting period, the Manager waived fees and/or reimbursed the Fund $250,346 for management fees.
Waivers and/or reimbursements may be modified or terminated as set forth according to the terms in the prospectus.
10. Borrowings and Other Financing
Securities Sold Short. The Fund sells securities that it does not own, and it will therefore be obligated to purchase such securities at a future date. Upon entering into a short position, the Fund is required to segregate cash or securities at its custodian which are pledged for the benefit of the lending broker and/or to deposit and pledge cash directly at the lending broker, with a value equal to a certain percentage, exceeding 100%, of the value of the securities that it sold short. Cash that has been segregated and pledged for this purpose will be disclosed on the Consolidated Statement of Assets and Liabilities; securities that have been segregated and pledged for this purpose are disclosed as such in the Consolidated Statement of Investments. The aggregate market value of such cash and securities at period end is $218,565,785. The value of the open short position is recorded as a liability, and the Fund records an unrealized gain or loss to the extent of the difference between the proceeds received and the change in value of the open short position. The Fund records a realized gain or loss when the short position is closed out. By entering into short sales, the Fund bears the
88 OPPENHEIMER FUNDAMENTAL ALTERNATIVES FUND
10. Borrowings and Other Financing (Continued)
market risk of increases in value of the security sold short in excess of the proceeds received. Until the security is replaced, the Fund is required to pay the lender any dividend or interest earned. Dividend expense on short sales is treated as an expense in the Consolidated Statement of Operations.
Joint Credit Facility. A number of mutual funds managed by the Manager participate in a $1.28 billion revolving credit facility (the “Facility”) intended to provide short-term financing, if necessary, subject to certain restrictions in connection with atypical redemption activity. Expenses and fees related to the Facility are paid by the participating funds and are disclosed separately or as other expenses on the Consolidated Statement of Operations. The Fund did not utilize the Facility during the reporting period.
Loan Commitments. Pursuant to the terms of certain credit agreements, the Fund has unfunded loan commitments of $23,545 at period end. The Fund generally will maintain with its custodian, liquid investments having an aggregate value at least equal to the par value of unfunded loan commitments. At period end, these commitments have a market value of $23,545 and have been included as Corporate Loans in the Statement of Investments.
11. Pending Litigation
In 2009, several putative class action lawsuits were filed and later consolidated before the U.S. District Court for the District of Colorado against OppenheimerFunds, Inc. (“OFI”), OppenheimerFunds Distributor, Inc. (“OFDI”), and Oppenheimer Rochester California Municipal Fund, a fund advised by OFI Global Asset Management, Inc. and distributed by the Distributor (the “California Fund”), in connection with the California Fund’s investment performance. The plaintiffs asserted claims against OFI, OFDI and certain present and former trustees and officers of the California Fund under the federal securities laws, alleging, among other things, that the disclosure documents of the California Fund contained misrepresentations and omissions and the investment policies of the California Fund were not followed. Plaintiffs in the suit filed an amended complaint and defendants filed a motion to dismiss. In 2011, the court issued an order which granted in part and denied in part the defendants’ motion to dismiss. In 2012, plaintiffs filed a motion, which defendants opposed, to certify a class and appoint class representatives and class counsel. In March 2015, the court granted plaintiffs’ motion for class certification. In May 2015, the U.S. Court of Appeals for the Tenth Circuit vacated the class certification order and remanded the matter to the district court for further proceedings. In July 2015, the district court held an evidentiary hearing on plaintiffs’ motion for class certification. In October 2015, the district court reaffirmed its order granting plaintiffs’ motion for class certification. Defendants have filed a petition before the U.S. Court of Appeals for the Tenth Circuit for permission to appeal that order.
89 OPPENHEIMER FUNDAMENTAL ALTERNATIVES FUND
NOTES TO CONSOLIDATED FINANCIAL STATEMENTS Continued
11. Pending Litigation (Continued)
OFI and OFDI believe the suit is without merit; that it is premature to render any opinion as to the likelihood of an outcome unfavorable to them in the suit; and that no estimate can yet be made as to the amount or range of any potential loss. Furthermore, OFI believes that the suit should not impair the ability of OFI or OFDI to perform their respective duties to the Fund and that the outcome of the suit should not have any material effect on the operations of any of the Oppenheimer funds.
90 OPPENHEIMER FUNDAMENTAL ALTERNATIVES FUND
REPORT OF INDEPENDENT REGISTERED PUBLIC ACCOUNTING FIRM
The Board of Trustees and Shareholders of Oppenheimer Quest for Value Funds:
We have audited the accompanying consolidated statement of assets and liabilities of Oppenheimer Fundamental Alternatives Fund (formerly Oppenheimer Flexible Strategies Fund) (a series of Oppenheimer Quest for Value Funds) and subsidiary, including the consolidated statement of investments, as of October 30, 2015, and the related consolidated statement of operations for the year then ended, the consolidated statements of changes in net assets for each of the years in the two-year period then ended, and the consolidated financial highlights for each of the years or periods in the five-year period then ended. These consolidated financial statements and consolidated financial highlights are the responsibility of the Fund’s management. Our responsibility is to express an opinion on these consolidated financial statements and consolidated financial highlights based on our audits.
We conducted our audits in accordance with the standards of the Public Company Accounting Oversight Board (United States). Those standards require that we plan and perform the audit to obtain reasonable assurance about whether the financial statements and financial highlights are free of material misstatement. An audit includes examining, on a test basis, evidence supporting the amounts and disclosures in the financial statements. Our procedures included confirmation of securities owned as of October 30, 2015, by correspondence with the custodian, transfer agent and brokers, or by other appropriate auditing procedures where replies from brokers were not received. An audit also includes assessing the accounting principles used and significant estimates made by management, as well as evaluating the overall financial statement presentation. We believe that our audits provide a reasonable basis for our opinion.
In our opinion, the consolidated financial statements and consolidated financial highlights referred to above present fairly, in all material respects, the financial position of Oppenheimer Fundamental Alternatives Fund and subsidiary as of October 30, 2015, the results of their operations for the year then ended, the changes in their net assets for each of the years in the two-year period then ended, and the consolidated financial highlights for each of the years or periods in the five-year period then ended, in conformity with U.S. generally accepted accounting principles.
KPMG LLP
Denver, Colorado
December 22, 2015
91 OPPENHEIMER FUNDAMENTAL ALTERNATIVES FUND
FEDERAL INCOME TAX INFORMATION Unaudited
In early 2015, if applicable, shareholders of record received information regarding all dividends and distributions paid to them by the Fund during calendar year 2014.
Dividends, if any, paid by the Fund during the reporting period which are not designated as capital gain distributions should be multiplied by the maximum amount allowable but not less than 92.61% to arrive at the amount eligible for the corporate dividend-received deduction.
A portion, if any, of the dividends paid by the Fund during the reporting period which are not designated as capital gain distributions are eligible for lower individual income tax rates to the extent that the Fund has received qualified dividend income as stipulated by recent tax legislation. The maximum amount allowable but not less than $ 9,723,942 of the Fund’s fiscal year taxable income may be eligible for the lower individual income tax rates. In early 2015, shareholders of record received information regarding the percentage of distributions that are eligible for lower individual income tax rates.
Recent tax legislation allows a regulated investment company to designate distributions not designated as capital gain distributions, as either interest related dividends or short-term capital gain dividends, both of which are exempt from the U.S. withholding tax applicable to non U.S. taxpayers. For the reporting period, the maximum amount allowable but not less than $3,667,787 of the ordinary distributions to be paid by the Fund qualifies as an interest related dividend.
The foregoing information is presented to assist shareholders in reporting distributions received from the Fund to the Internal Revenue Service. Because of the complexity of the federal regulations which may affect your individual tax return and the many variations in state and local tax regulations, we recommend that you consult your tax advisor for specific guidance.
92 OPPENHEIMER FUNDAMENTAL ALTERNATIVES FUND
BOARD APPROVAL OF THE FUND’S INVESTMENT ADVISORY AND SUB-ADVISORY AGREEMENTS Unaudited
The Fund has entered into an investment advisory agreement with OFI Global Asset Management, Inc. (“OFI Global” or the “Adviser”), a wholly-owned subsidiary of OppenheimerFunds, Inc. (“OFI” or the “Sub-Adviser”) (“OFI Global” and “OFI” together the “Managers”) and OFI Global has entered into a sub-advisory agreement with OFI whereby OFI provides investment sub-advisory services to the Fund (collectively, the “Agreements”). Each year, the Board of Trustees (the “Board”), including a majority of the independent Trustees, is required to determine whether to approve the terms of the Agreements and the renewal thereof. The Investment Company Act of 1940, as amended, requires that the Board request and evaluate, and that the Managers provide, such information as may be reasonably necessary to evaluate the terms of the Agreements. The Board employs an independent consultant to prepare a report that provides information, including comparative information that the Board requests for that purpose. In addition to in-person meetings focused on this evaluation, the Board receives information throughout the year regarding Fund services, fees, expenses and performance.
The Adviser, Sub-Adviser and the independent consultant provided information to the Board on the following factors: (i) the nature, quality and extent of the Managers’ services, (ii) the comparative investment performance of the Fund and the Managers, (iii) the fees and expenses of the Fund, including comparative fee and expense information, (iv) the profitability of the Managers and their affiliates, including an analysis of the cost of providing services, (v) whether economies of scale are realized as the Fund grows and whether fee levels reflect these economies of scale for Fund investors and (vi) other benefits to the Managers from their relationship with the Fund. The Board was aware that there are alternatives to retaining the Managers.
Outlined below is a summary of the principal information considered by the Board as well as the Board’s conclusions.
Nature, Quality and Extent of Services. The Board considered information about the nature, quality and extent of the services provided to the Fund and information regarding the Managers’ key personnel who provide such services. The Managers’ duties include providing the Fund with the services of the portfolio manager and the Sub-Adviser’s investment team, who provide research, analysis and other advisory services in regard to the Fund’s investments; and securities trading services. OFI Global is responsible for oversight of third-party service providers; monitoring compliance with applicable Fund policies and procedures and adherence to the Fund’s investment restrictions; risk management; and oversight of the Sub-Adviser. OFI Global is also responsible for providing certain administrative services to the Fund as well. Those services include providing and supervising all administrative and clerical personnel who are necessary in order to provide effective corporate administration for the Fund; compiling and maintaining records with respect to the Fund’s operations; preparing and filing reports required by the U.S. Securities and Exchange Commission; preparing periodic reports regarding the operations of the Fund for its shareholders; preparing proxy materials for shareholder meetings; and preparing the registration statements required by federal and state securities laws for the sale of the Fund’s shares. OFI Global also provides the Fund with office space, facilities and equipment.
The Board also considered the quality of the services provided and the quality of the Managers’ resources that are available to the Fund. The Board took account of the fact that
93 OPPENHEIMER FUNDAMENTAL ALTERNATIVES FUND
BOARD APPROVAL OF THE FUND’S INVESTMENT ADVISORY AND SUB-ADVISORY AGREEMENTS Unaudited / Continued
the Sub-Adviser has had over fifty years of experience as an investment adviser and that its assets under management rank it among the top mutual fund managers in the United States. The Board evaluated the Managers’ advisory, administrative, accounting, legal, compliance services and risk management, and information the Board has received regarding the experience and professional qualifications of the Managers’ key personnel and the size and functions of its staff. In its evaluation of the quality of the portfolio management services provided, the Board considered the experience of Michelle Borré, the portfolio manager for the Fund, and the Sub-Adviser’s investment team and analysts. The Board members also considered the totality of their experiences with the Managers as directors or trustees of the Fund and other funds advised by the Managers. The Board considered information regarding the quality of services provided by affiliates of the Managers, which the Board members have become knowledgeable about through their experiences with the Managers and in connection with the renewal of the Fund’s service agreements. The Board concluded, in light of the Managers’ experience, reputation, personnel, operations and resources that the Fund benefits from the services provided under the Agreements.
Investment Performance of the Managers and the Fund. Throughout the year, the Managers provided information on the investment performance of the Fund, the Adviser and the Sub-Adviser, including comparative performance information. The Board also reviewed information, prepared by the Managers and by the independent consultant, comparing the Fund’s historical performance to relevant benchmarks or market indices and to the performance of other retail funds in the multialternative category. The Board noted that the Fund’s one-year and three-year and ten-year performance was better than its category median although its five-year performance was below its category median and its ten-year performance was equal to its category median.
Fees and Expenses of the Fund. The Board reviewed the fees paid to the Adviser and the other expenses borne by the Fund. The independent consultant provided comparative data in regard to the fees and expenses of the Fund and other retail front-end load multialternative funds with comparable asset levels and distribution features. The Board noted that the Fund’s contractual management fees were lower than its peer group median and category median. The Board also noted that the Fund’s total expenses were higher than its peer group median and category median.
Economies of Scale and Profits Realized by the Managers. The Board considered information regarding the Managers’ costs in serving as the Fund’s investment adviser and sub-adviser, including the costs associated with the personnel and systems necessary to manage the Fund, and information regarding the Managers’ profitability from their relationship with the Fund. The Board also considered that the Managers must be able to pay and retain experienced professional personnel at competitive rates to provide quality services to the Fund. The Board reviewed whether the Managers may realize economies of scale in managing and supporting the Fund. The Board noted that the Fund currently has management fee breakpoints, which are intended to share with Fund shareholders economies of scale that may exist as the Fund’s assets grow.
Other Benefits to the Managers. In addition to considering the profits realized by the Managers, the Board considered information that was provided regarding the direct and indirect benefits the Managers receive as a result of their relationship with the Fund, including
94 OPPENHEIMER FUNDAMENTAL ALTERNATIVES FUND
compensation paid to the Managers’ affiliates and research provided to the Adviser in connection with permissible brokerage arrangements (soft dollar arrangements).
Conclusions. These factors were also considered by the independent Trustees meeting separately from the full Board, assisted by experienced counsel to the Fund and to the independent Trustees. Fund counsel and the independent Trustees’ counsel are independent of the Managers within the meaning and intent of the Securities and Exchange Commission Rules.
Based on its review of the information it received and its evaluations described above, the Board, including a majority of the independent Trustees, decided to continue the Agreements through September 30, 2016. In arriving at its decision, the Board did not identify any factor or factors as being more important than others, but considered all of the above information, and considered the terms and conditions of the Agreements, including the management fees, in light of all the surrounding circumstances.
95 OPPENHEIMER FUNDAMENTAL ALTERNATIVES FUND
PORTFOLIO PROXY VOTING POLICIES AND PROCEDURES; UPDATES TO CONSOLIDATED STATEMENTS OF INVESTMENTS Unaudited
The Fund has adopted Portfolio Proxy Voting Policies and Procedures under which the Fund votes proxies relating to securities (“portfolio proxies”) held by the Fund. A description of the Fund’s Portfolio Proxy Voting Policies and Procedures is available (i) without charge, upon request, by calling the Fund toll-free at 1.800.CALL OPP (225.5677), (ii) on the Fund’s website at www.oppenheimerfunds.com, and (iii) on the SEC’s website at www.sec.gov. In addition, the Fund is required to file Form N-PX, with its complete proxy voting record for the 12 months ended June 30th, no later than August 31st of each year. The Fund’s voting record is available (i) without charge, upon request, by calling the Fund toll-free at 1.800.CALL OPP (225.5677), and (ii) in the Form N-PX filing on the SEC’s website at www.sec.gov.
The Fund files its complete schedule of portfolio holdings with the SEC for the first quarter and the third quarter of each fiscal year on Form N-Q. The Fund’s Form N-Q filings are available on the SEC’s website at www.sec.gov. Those forms may be reviewed and copied at the SEC’s Public Reference Room in Washington, D.C. Information on the operation of the Public Reference Room may be obtained by calling 1-800-SEC-0330.
Householding—Delivery of Shareholder Documents
This is to inform you about OppenheimerFunds’ “householding” policy. If more than one member of your household maintains an account in a particular fund, OppenheimerFunds will mail only one copy of the fund’s prospectus (or, if available, the fund’s summary prospectus), annual and semiannual report and privacy policy. The consolidation of these mailings, called householding, benefits your fund through reduced mailing expense, and benefits you by reducing the volume of mail you receive from OppenheimerFunds. Householding does not affect the delivery of your account statements.
Please note that we will continue to household these mailings for as long as you remain an OppenheimerFunds shareholder, unless you request otherwise. If you prefer to receive multiple copies of these materials, please call us at 1.800.CALL-OPP (225-5677). You may also notify us in writing or via email. We will begin sending you individual copies of the prospectus (or, if available, the summary prospectus), reports and privacy policy within 30 days of receiving your request to stop householding.
96 OPPENHEIMER FUNDAMENTAL ALTERNATIVES FUND
TRUSTEES AND OFFICERS Unaudited
| | |
|
| |
Name, Position(s) Held with the Fund, Length of Service, Year of Birth | | Principal Occupation(s) During the Past 5 Years; Other Trusteeships/Directorships Held; Number of Portfolios in the Fund Complex Currently Overseen |
| |
INDEPENDENT TRUSTEES | | The address of each Trustee in the chart below is 6803 S. Tucson Way, Centennial, Colorado 80112-3924. Each Trustee serves for an indefinite term, or until his or her resignation, retirement, death or removal. |
| |
Brian F. Wruble, Chairman of the Board of Trustees (since 2009), Trustee (since 2001) Year of Birth: 1943 | | Director and Vice Chairman of Community Foundation of the Florida Keys (non-profit) (since July 2012); Trustee of the Board of Trustees, The Jackson Laboratory (non-profit) (1991-2011 and since May 2014); Chairman Emeritus (since August 2011) of The Jackson Laboratory (non-profit); Director of Special Value Opportunities Fund, LLC (registered investment company) (affiliate of the Sub-Adviser’s parent company) (since September 2004); Member of Zurich Insurance Group’s Investment Management Advisory Council (insurance) (since 2004); Treasurer (since 2007) and Trustee of the Institute for Advanced Study (non-profit educational institute) (since May 1992); General Partner of Odyssey Partners, L.P. (hedge fund) (September 1995-December 2007); Special Limited Partner of Odyssey Investment Partners, LLC (private equity investment) (January 1999-September 2004). Oversees 52 portfolios in the OppenheimerFunds complex. Mr. Wruble has served on the Boards of certain Oppenheimer funds since April 2001, during which time he has become familiar with the Fund’s (and other Oppenheimer funds’) financial, accounting, regulatory and investment matters and has contributed to the Boards’ deliberations. |
| |
David K. Downes, Trustee (since 2005) Year of Birth: 1940 | | Director of THL Credit Inc. (since June 2009); Chief Executive Officer and Board Member of Community Capital Management (investment management company) (since January 2004); President of The Community Reinvestment Act Qualified Investment Fund (investment management company) (since 2004); Director of Actua Corporation (information technology company) (since October 2003); formerly, Independent Chairman GSK Employee Benefit Trust (April 2006-June2013); Director of Correctnet (January 2006-2007); Independent Chairman of the Board of Trustees of Quaker Investment Trust (registered investment company) (2004-2007); Chief Operating Officer and Chief Financial Officer of Lincoln National Investment Companies, Inc. (subsidiary of Lincoln National Corporation, a publicly traded company) and Delaware Investments U.S., Inc. (investment management subsidiary of Lincoln National Corporation) (1993-2003); President, Chief Executive Officer and Trustee of Delaware Investment Family of Funds (1993-2003); President and Board Member of Lincoln National Convertible Securities Funds, Inc. and the Lincoln National Income Funds, TDC (1993-2003); Chairman and Chief Executive Officer of Retirement Financial Services, Inc. (registered transfer agent and investment adviser and subsidiary of Delaware Investments U.S., Inc.) (1993-2003); President and Chief Executive Officer of Delaware Service Company, Inc. (1995- 2003); Chief Administrative Officer, Chief Financial Officer, Vice Chairman and Director of Equitable Capital Management Corporation (investment subsidiary of Equitable Life Assurance Society) (1985-1992); Corporate Controller of Merrill Lynch Company (financial services holding company) (1977-1985); held the following positions at the Colonial Penn Group, Inc. (insurance company): Corporate Budget Director (1974-1977), Assistant Treasurer (1972-1974) and Director of Corporate Taxes (1969-1972); held the following positions at Price Waterhouse Company (financial services firm): Tax |
97 OPPENHEIMER FUNDAMENTAL ALTERNATIVES FUND
TRUSTEES AND OFFICERS Unaudited / Continued
| | |
David K. Downes, Continued | | Manager (1967-1969), Tax Senior (1965-1967) and Staff Accountant (1963-1965); United States Marine Corps (1957-1959). Oversees 52 portfolios in the OppenheimerFunds complex. Mr. Downes has served on the Boards of certain Oppenheimer funds since December 2005, during which time he has become familiar with the Fund’s (and other Oppenheimer funds’) financial, accounting, regulatory and investment matters and has contributed to the Boards’ deliberations. |
| |
Matthew P. Fink, Trustee (since 2009) Year of Birth: 1941 | | Trustee of the Committee for Economic Development (policy research foundation) (2005-2011); Director of ICI Education Foundation (education foundation) (October 1991-August 2006); President of the Investment Company Institute (trade association) (October 1991-June 2004); Director of ICI Mutual Insurance Company (insurance company) (October 1991-June 2004); Author of The Rise of Mutual Funds: An Insider’s View published by Oxford University Press (second edition 2010). Oversees 52 portfolios in the OppenheimerFunds complex. Mr. Fink has served on the Boards of certain Oppenheimer funds since January 2005, during which time he has become familiar with the Fund’s (and other Oppenheimer funds’) financial, accounting, regulatory and investment matters and has contributed to the Boards’ deliberations. |
| |
Edmund P. Giambastiani, Jr., Trustee (since 2013) Year of Birth: 1948 | | Advisory Board Member of the Maxwell School of Citizenship and Public Affairs of Syracuse University (since April 2012); Director of Mercury Defense Systems Inc. (information technology) (August 2011-February 2013); Trustee of the U.S. Naval Academy Foundation (since November 2010); Advisory Board Member of the Massachusetts Institute of Technology Lincoln Laboratory (federally-funded research development center) (since May 2010); Director of The Boeing Company (aerospace and defense) (since October 2009); Trustee of MITRE Corporation (federally-funded research development center) (since September 2008); Independent Director of QinetiQ Group Plc (defense technology and security) (February 2008-August 2011); Director of Monster Worldwide, Inc. (on-line career services) (since January 2008, Lead Director since June 2011); Chairman of Alenia North America, Inc. (military and defense products) (January 2008-October 2009); Director of SRA International, Inc. (information technology and services) (January 2008-July 2011); President of Giambastiani Group LLC (national security and energy consulting) (since October 2007); United States Navy, career nuclear submarine officer (June 1970-October 2007), Vice Chairman of the Joint Chiefs of Staff (2005-October 2007), NATO Supreme Allied Commander Transformation (2003-2005), Commander, U.S. Joint Forces Command (2002-2005). Since his retirement from the U.S. Navy in October 2007, Admiral Giambastiani has also served on numerous U.S. Government advisory boards, investigations and task forces for the Secretaries of Defense, State and Interior and the Central Intelligence Agency. Oversees 52 portfolios in the OppenheimerFunds complex. Admiral Giambastiani has served on the Boards of certain Oppenheimer funds since February 2013, including as an Advisory Board Member for certain Oppenheimer funds, during which time he has become familiar with the Fund’s (and other Oppenheimer funds’) financial, accounting, regulatory and investment matters and has contributed to the Boards’ deliberations. For purposes of this report, Admiral Giambastiani is identified as a Trustee. |
| |
Elizabeth Krentzman, Trustee (since 2014) Year of Birth: 1959 | | Advisory Board Member of the Securities and Exchange Commission Historical Society (since 2007); held the following positions at Deloitte & Touche LLP: Principal and Chief Regulatory Advisor for Asset Management Services (2007 - |
98 OPPENHEIMER FUNDAMENTAL ALTERNATIVES FUND
| | |
Elizabeth Krentzman, Continued | | 2014) and U.S. Mutual Fund Leader (2011 - 2014); General Counsel of the Investment Company Institute (trade association) (June 2004 - April 2007); held the following positions at Deloitte & Touche LLP: National Director of the Investment Management Regulatory Consulting Practice (1997 - 2004), Principal (2003 - 2004), Director (1998 - 2003) and Senior Manager (1997 - 1998); Assistant Director of the Division of Investment Management - Office of Disclosure and Investment Adviser Regulation (1996 - 1997) and various positions with the Division of Investment Management – Office of Regulatory Policy (1991 - 1996) of the U.S. Securities and Exchange Commission; Associate at Ropes & Gray (1987 - 1991); former Chair of the Investment Management Subcommittee of the Washington, D.C. Bar. Oversees 52 portfolios in the OppenheimerFunds complex. Ms. Krentzman has served on the Boards of certain Oppenheimer funds since August 2014, during which time she has become familiar with the Fund’s (and other Oppenheimer funds’) financial, accounting, regulatory and investment matters and has contributed to the Boards’ deliberations. |
| |
Mary F. Miller, Trustee (since 2009) Year of Birth: 1942 | | Trustee of International House (not-for-profit) (since June 2007); Trustee of the American Symphony Orchestra (not-for-profit) (October 1998-November 2011); and Senior Vice President and General Auditor of American Express Company (financial services company) (July 1998-February 2003). Oversees 52 portfolios in the OppenheimerFunds complex. Ms. Miller has served on the Boards of certain Oppenheimer funds since August 2004, during which time she has become familiar with the Fund’s (and other Oppenheimer funds’) financial, accounting, regulatory and investment matters and has contributed to the Boards’ deliberations. |
| |
Joel W. Motley, Trustee (since 2009) Year of Birth: 1952 | | Member of the Vestry of Trinity Wall Street (since April 2012); Director of Southern Africa Legal Services Foundation (since March 2012); Board Member of Pulitzer Center for Crisis Reporting (non-profit journalism) (since December 2010); Managing Director of Public Capital Advisors, LLC (privately-held financial advisor) (since January 2006); Managing Director of Carmona Motley, Inc. (privately-held financial advisor) (since January 2002); Director of Columbia Equity Financial Corp. (privately-held financial advisor) (2002-2007); Managing Director of Carmona Motley Hoffman Inc. (privately-held financial advisor) (January 1998-December 2001); Member of the Finance and Budget Committee of the Council on Foreign Relations, Member of the Investment Committee and Board of Human Rights Watch and Member of the Investment Committee and Board of Historic Hudson Valley. Oversees 52 portfolios in the OppenheimerFunds complex. Mr. Motley has served on the Boards of certain Oppenheimer funds since October 2002, during which time he has become familiar with the Fund’s (and other Oppenheimer funds’) financial, accounting, regulatory and investment matters and has contributed to the Boards’ deliberations. |
| |
Joanne Pace, Trustee (since 2012) Year of Birth: 1958 | | Board Director of Horizon Blue Cross Blue Shield of New Jersey (since November 2012); Advisory Board Director of The Alberleen Group LLC (since March 2012); Advisory Board Director of The Agile Trading Group LLC (since March 2012); Advisory Council Member of 100 Women in Hedge Funds (non- profit) (since December 2012); Advisory Council Member of Morgan Stanley Children’s Hospital (non-profit) (since May 2012); Board Director of The Komera Project (non-profit) (since April 2012); New York Advisory Board Director of Peace First (non-profit) (since March 2010); Senior Advisor of SECOR |
99 OPPENHEIMER FUNDAMENTAL ALTERNATIVES FUND
TRUSTEES AND OFFICERS Unaudited / Continued
| | |
Joanne Pace, Continued | | Asset Management, LP (2010-2011); Managing Director and Chief Operating Officer of Morgan Stanley Investment Management (2006-2010); Partner and Chief Operating Officer of FrontPoint Partners, LLC (hedge fund) (2005-2006); held the following positions at Credit Suisse: Managing Director (2003-2005); Global Head of Human Resources and member of Executive Board and Operating Committee (2004-2005), Global Head of Operations and Product Control (2003-2004); held the following positions at Morgan Stanley: Managing Director (1997-2003), Controller and Principal Accounting Officer (1999-2003); Chief Financial Officer (temporary assignment) for the Oversight Committee, Long Term Capital Management (1998-1999). Lead Independent Director and Chair of the Audit and Nominating Committee of The Global Chartist Fund, LLC of Oppenheimer Asset Management (2011-2012); Board Director of Managed Funds Association (2008-2010); Board Director of Morgan Stanley Foundation (2007-2010) and Investment Committee Chair (2008-2010). Oversees 52 portfolios in the OppenheimerFunds complex. Ms. Pace has served on the Boards of certain Oppenheimer funds since November 2012, including as an Advisory Board Member for certain Oppenheimer funds, during which time she has become familiar with the Fund’s (and other Oppenheimer funds’) financial, accounting, regulatory and investment matters and has contributed to the Board’s deliberations. For purposes of this report, Ms. Pace is identified as a Trustee. |
| |
Daniel Vandivort, Trustee (since 2014) Year of Birth: 1954 | | Chairman and Lead Independent Director/Trustee (March 2010-September 2014), Chairman of the Audit Committee (March 2009-September 2014) and Director/Trustee (December 2008-September 2014) of the Board of Directors/Trustees of Value Line Funds; Trustee, Board of Trustees of Huntington Disease Foundation of America (June 2007-December 2013): Trustee, Board of Trustees, RIM Retirement Savings Plan (2005-2007); President and Chief Investment Officer, Robeco Investment Management, formerly known as Weiss Peck and Greer (January 2005-June 2007); Member, Management Committee of Robeco Investment Management (2001-2007); Chairman and Trustee of the Board of Trustees of Weiss, Peck and Greer Funds (2004-2005); Managing Director and Head of Fixed Income, Weiss, Peck and Greer (November 1994-January 2005); Managing Director and Head of Fixed Income, CS First Boston Investment Management (January 1992-November 1994); Director, Global Product Development, First Boston Asset Management (November 1989-January 1992); Vice President, Fixed Income Sales, First Boston Corp. (May 1984-November 1989). Oversees 52 portfolios in the OppenheimerFunds complex. Mr. Vandivort has served on the Boards of certain Oppenheimer funds since 2014, during which time he has become familiar with the Fund’s (and other Oppenheimer funds’) financial, accounting, regulatory and investment matters and has contributed to the Boards’ deliberations. |
|
| |
INTERESTED TRUSTEES | | Mr. Glavin is an “Interested Trustee” because he is affiliated with the Manager and the Sub-Adviser by virtue of his positions as director of the Sub-Adviser, and as a shareholder of the Sub-Adviser’s parent company. As a Trustee, he serves for an indefinite term, or until his resignation, retirement, death or removal. Mr. Glavin’s address is 225 Liberty Street, New York, New York 10281-1008. |
100 OPPENHEIMER FUNDAMENTAL ALTERNATIVES FUND
| | |
|
| |
INTERESTED TRUSTEES Continued | | Mr. Steinmetz is an “Interested Trustee” because he is affiliated with the Manager and the Sub-Adviser by virtue of his positions as Chairman of the Sub-Adviser and officer and director of the Manager. Both as a Trustee and as an officer, Mr. Steinmetz serves for an indefinite term, or until his resignation, retirement, death or removal. Mr. Steinmetz’s address is 225 Liberty Street, New York, New York 10281-1008. |
| |
William F. Glavin, Jr., Trustee (since 2009) Year of Birth: 1958 | | Chairman of the Sub-Adviser (since July 2014 and December 2009-December 2012) and Director of the Sub-Adviser (since January 2009); Chairman, Director and Chief Executive Officer (January 2013-June 2014) of the Manager; President of the Manager (January 2013-May 2013); Chief Executive Officer (January 2009-December 2012); President of the Sub-Adviser (May 2009-December 2012); Management Director (June 2009-June 2014), President (December 2009-June 2014) and Chief Executive Officer (January 2011-June 2014) of Oppenheimer Acquisition Corp. (“OAC”) (the Sub-Adviser’s parent holding company); Director of Oppenheimer Real Asset Management, Inc. (March 2010-June 2014); Executive Vice President (March 2006-February 2009) and Chief Operating Officer (July 2007-February 2009) of Massachusetts Mutual Life Insurance Company (OAC’s parent company); Director (May 2004-March 2006) and Chief Operating Officer and Chief Compliance Officer (May 2004-January 2005), President (January 2005-March 2006) and Chief Executive Officer (June 2005-March 2006) of Babson Capital Management LLC; Director (March 2005-March 2006), President (May 2003-March 2006) and Chief Compliance Officer (July 2005-March 2006) of Babson Capital Securities, Inc. (a broker-dealer); President (May 2003-March 2006) of Babson Investment Company, Inc.; Director (May 2004-August 2006) of Babson Capital Europe Limited; Director (May 2004-October 2006) of Babson Capital Guernsey Limited; Director (May 2004-March 2006) of Babson Capital Management LLC; Non-Executive Director (March 2005-March 2007) of Baring Asset Management Limited; Director (February 2005-June 2006) Baring Pension Trustees Limited; Director and Treasurer (December 2003-November 2006) of Charter Oak Capital Management, Inc.; Director (May 2006-September 2006) of C.M. Benefit Insurance Company; Director (May 2008-June 2009) and Executive Vice President (June 2007-July 2009) of C.M. Life Insurance Company; President (March 2006-May 2007) of MassMutual Assignment Company; Director (January 2005-December 2006), Deputy Chairman (March 2005-December 2006) and President (February 2005-March 2005) of MassMutual Holdings (Bermuda) Limited; Director (May 2008-June 2009) and Executive Vice President (June 2007-July 2009) of MML Bay State Life Insurance Company; Chief Executive Officer and President (April 2007-January 2009) of MML Distributors, LLC; and Chairman (March 2006-December 2008) and Chief Executive Officer (May 2007-December 2008) of MML Investors Services, Inc. An officer of 91 portfolios in the OppenheimerFunds complex. Mr. Glavin has served on the Boards of certain Oppenheimer funds since December 2009, during which time he has become familiar with the Fund’s (and other Oppenheimer funds’) financial, accounting, regulatory and investment matters and has contributed to the Boards’ deliberations. |
| |
Arthur P. Steinmetz, Trustee (since 2015), President and Principal Executive Officer (since 2014) Year of Birth: 1958 | | Chairman of the Sub-Adviser (since January 2015); CEO and Chairman of the Manager (since July 2014), President of the Manager (since May 2013), a Director of the Manager (since January 2013), Director of the Sub-Adviser (since July 2014), President, Management Director and CEO of Oppenheimer Acquisition Corp. (the Sub-Adviser’s parent holding company) (since July 2014), |
101 OPPENHEIMER FUNDAMENTAL ALTERNATIVES FUND
TRUSTEES AND OFFICERS Unaudited / Continued
| | |
Arthur P. Steinmetz, Continued | | and President and Director of OFI SteelPath, Inc. (since January 2013). Chief Investment Officer of the OppenheimerFunds advisory entities from (January 2013-December 2013); Executive Vice President of the Manager (January 2013-May 2013); Chief Investment Officer of the Sub-Adviser (October 2010-December 2012); Chief Investment Officer, Fixed-Income, of the Sub-Adviser (April 2009-October 2010); Executive Vice President of the Sub-Adviser (October 2009-December 2012); Director of Fixed Income of the Sub-Adviser (January 2009-April 2009); and a Senior Vice President of the Sub-Adviser (March 1993-September 2009). An officer of 91 portfolios in the OppenheimerFunds complex. |
|
| |
OTHER OFFICERS OF THE FUND | | The addresses of the Officers in the chart below are as follows: for Messrs. Gabinet, Mss. Borré, Sexton and Picciotto, 225 Liberty Street, New York, New York 10281-1008, for Mr. Wixted, 6803 S. Tucson Way, Centennial, Colorado 80112-3924. Each Officer serves for an indefinite term or until his or her resignation, retirement, death or removal. |
| |
Michelle Borré, Vice President (since 2011) Year of Birth: 1967 | | Vice President of the Sub-Adviser (since April 2003); Senior Portfolio Manager of the Sub-Adviser (since April 2009); Senior Research Analyst of the Sub-Adviser (February 2003-April 2009). Ms. Borre held various positions, including Managing Director and Partner, at J&W Seligman (July 1996 –January 2003). Adjunct Professor of Finance and Economics at Columbia Business School; Served on the Executive Advisory Board at the Heilbrunn Center for Graham and Dodd Investing at Columbia Business School (from 2004 to 2005). A portfolio manager and an officer of other portfolios in the OppenheimerFunds complex. |
| |
Arthur S. Gabinet, Secretary and Chief Legal Officer (since 2011) Year of Birth: 1958 | | Executive Vice President, Secretary and General Counsel of the Manager (since January 2013); General Counsel OFI SteelPath, Inc. (since January 2013); Executive Vice President (May 2010-December 2012) and General Counsel (since January 2011) of the Sub-Adviser; General Counsel of the Distributor (since January 2011); General Counsel of Centennial Asset Management Corporation (January 2011-December 2012); Executive Vice President (January 2011-December 2012) and General Counsel of HarbourView Asset Management Corporation (since January 2011); Assistant Secretary (since January 2011) and Director (since January 2011) of OppenheimerFunds International Ltd. And OppenheimerFunds plc; Director of Oppenheimer Real Asset Management, Inc. (January 2011-December 2012) and General Counsel (since January 2011); Executive Vice President (January 2011-December 2011) and General Counsel of Shareholder Financial Services, Inc. and Shareholder Services, Inc. (since January 2011); Executive Vice President (January 2011-December 2012) and General Counsel of OFI Private Investments Inc. (since January 2011); Vice President of OppenheimerFunds Legacy Program (January 2011-December 2011); Executive Vice President (January 2011-December 2012) and General Counsel of OFI Institutional Asset Management, Inc. (since January 2011); General Counsel, Asset Management of the Sub-Adviser (May 2010-December 2010); Principal, The Vanguard Group (November 2005-April 2010); District Administrator, U.S. Securities and Exchange Commission (January 2003-October 2005). An officer of 91 portfolios in the OppenheimerFunds complex. |
102 OPPENHEIMER FUNDAMENTAL ALTERNATIVES FUND
| | |
Jennifer Sexton, Vice President and Chief Business Officer (since 2014) Year of Birth: 1969 | | Senior Vice President of OppenheimerFunds Distributor, Inc. (since June 2014); Vice President of OppenheimerFunds Distributor, Inc. (April 2006-June 2014); Vice President of the Sub-Adviser (January 1998-March 2006); Assistant Vice President of the Sub-Adviser (October 1991-December 1998). An officer of 91 portfolios in the OppenheimerFunds complex. |
| |
Mary Ann Picciotto, Chief Compliance Officer and Chief Anti-Money Laundering Officer (since 2014) Year of Birth: 1973 | | Senior Vice President and Chief Compliance Officer of the Manager (since March 2014); Chief Compliance Officer of the Sub-Adviser, OFI SteelPath, Inc., OFI Global Trust Company, OFI Global Institutional, Inc., Oppenheimer Real Asset Management, Inc., OFI Private Investments, Inc., Harborview Asset Management Corporation, Trinity Investment Management Corporation, and Shareholder Services, Inc. (since March 2014); Managing Director of Morgan Stanley Investment Management Inc. and certain of its various affiliated entities; Chief Compliance Officer of various Morgan Stanley Funds (May 2010- January 2014); Chief Compliance Officer of Morgan Stanley Investment Management Inc. (April 2007-January 2014). An officer of 91 portfolios in the OppenheimerFunds complex. |
| |
Brian W. Wixted, Treasurer and Principal Financial & Accounting Officer (since 1999) Year of Birth: 1959 | | Senior Vice President of the Manager (since January 2013); Treasurer of the Sub-Adviser, HarbourView Asset Management Corporation, Shareholder Financial Services, Inc., Shareholder Services, Inc., and Oppenheimer Real Asset Management, Inc. (March 1999-June 2008), OFI Private Investments, Inc. (March 2000-June 2008), OppenheimerFunds International Ltd. and OppenheimerFunds plc (since May 2000), OFI Institutional Asset Management, Inc. (November 2000-June 2008), and OppenheimerFunds Legacy Program (charitable trust program established by the Sub-Adviser) (June 2003-December 2011); Treasurer and Chief Financial Officer of OFI Trust Company (since May 2000); Assistant Treasurer of Oppenheimer Acquisition Corporation (March 1999-June 2008). An officer of 91 portfolios in the OppenheimerFunds complex. |
The Fund’s Statement of Additional Information contains additional information about the Fund’s Trustees and Officers and is available without charge upon request, by calling 1.800.CALL OPP (225.5677). |
103 OPPENHEIMER FUNDAMENTAL ALTERNATIVES FUND
OPPENHEIMER FUNDAMENTAL ALTERNATIVES FUND
| | | | |
| Manager | | OFI Global Asset Management, Inc. | | |
| | |
| Sub-Adviser | | OppenheimerFunds, Inc. | | |
| | |
| Distributor | | OppenheimerFunds Distributor, Inc. | | |
| | |
Transfer and Shareholder Servicing Agent | | OFI Global Asset Management, Inc. | | |
| | |
| Sub-Transfer Agent | | Shareholder Services, Inc. | | |
| | DBA OppenheimerFunds Services | | |
| | |
| Independent Registered Public Accounting Firm | | KPMG LLP | | |
| | |
| Legal Counsel | | Kramer Levin Naftalis & Frankel LLP | | |
© 2015 OppenheimerFunds, Inc. All rights reserved.
104 OPPENHEIMER FUNDAMENTAL ALTERNATIVES FUND
PRIVACY POLICY NOTICE
As an Oppenheimer fund shareholder, you are entitled to know how we protect your personal information and how we limit its disclosure.
Information Sources
We obtain nonpublic personal information about our shareholders from the following sources:
| ● | | Applications or other forms |
| ● | | When you create a user ID and password for online account access |
| ● | | When you enroll in eDocs Direct, our electronic document delivery service |
| ● | | Your transactions with us, our affiliates or others |
| ● | | A software program on our website, often referred to as a “cookie,” which indicates which parts of our site you’ve visited |
| ● | | When you set up challenge questions to reset your password online |
If you visit oppenheimerfunds.com and do not log on to the secure account information areas, we do not obtain any personal information about you. When you do log on to a secure area, we do obtain your user ID and password to identify you. We also use this information to provide you with products and services you have requested, to inform you about products and services that you may be interested in and assist you in other ways.
We do not collect personal information through our website unless you willingly provide it to us, either directly by email or in those areas of the website that request information. In order to update your personal information (including your mailing address, email address and phone number) you must first log on and visit your user profile.
If you have set your browser to warn you before accepting cookies, you will receive the warning message with each cookie. You can refuse cookies by turning them off in your browser. However, doing so may limit your access to certain sections of our website.
We use cookies to help us improve and manage our website. For example, cookies help us recognize new versus repeat visitors to the site, track the pages visited, and enable some special features on the website. This data helps us provide a better service for our website visitors.
Protection of Information
We do not disclose any non-public personal information (such as names on a customer list) about current or former customers to anyone, except as permitted by law.
Disclosure of Information
Copies of confirmations, account statements and other documents reporting activity in your fund accounts are made available to your financial advisor (as designated by you). We may also use details about you and your investments to help us, our financial service affiliates, or firms that jointly market their financial products and services with ours, to better serve your investment needs or suggest financial services or educational material that may be of interest to you. If this requires us to provide you with an opportunity to “opt in” or “opt out” of such information sharing with a firm not affiliated with us, you will receive notification on how to do so, before any such sharing takes place.
Right of Refusal
We will not disclose your personal information to unaffiliated third parties (except as permitted by law), unless we first offer you a reasonable opportunity to refuse or “opt out” of such disclosure.
105 OPPENHEIMER FUNDAMENTAL ALTERNATIVES FUND
PRIVACY POLICY NOTICE Continued
Internet Security and Encryption
In general, the email services provided by our website are encrypted and provide a secure and private means of communication with us. To protect your own privacy, confidential and/or personal information should only be communicated via email when you are advised that you are using a secure website. As a security measure, we do not include personal or account information in non-secure emails, and we advise you not to send such information to us in non-secure emails. Instead, you may take advantage of the secure features of our website to encrypt your email correspondence. To do this, you will need to use a browser that supports Secure Sockets Layer (SSL) protocol.
We do not guarantee or warrant that any part of our website, including files available for download, are free of viruses or other harmful code. It is your responsibility to take appropriate precautions, such as use of an anti-virus software package, to protect your computer hardware and software.
| ● | | All transactions, including redemptions, exchanges and purchases, are secured by SSL and 256-bit encryption. SSL is used to establish a secure connection between your PC and OppenheimerFunds’ server. It transmits information in an encrypted and scrambled format. |
| ● | | Encryption is achieved through an electronic scrambling technology that uses a “key” to code and then decode the data. Encryption acts like the cable converter box you may have on your television set. It scrambles data with a secret code so that no one can make sense of it while it is being transmitted. When the data reaches its destination, the same software unscrambles the data. |
| ● | | You can exit the secure area by either closing your browser, or for added security, you can use the Log Out button before you close your browser. |
Other Security Measures
We maintain physical, electronic and procedural safeguards to protect your personal account information. Our employees and agents have access to that information only so that they may offer you products or provide services, for example, when responding to your account questions.
How You Can Help
You can also do your part to keep your account information private and to prevent unauthorized transactions. If you obtain a user ID and password for your account, do not allow it to be used by anyone else. Also, take special precautions when accessing your account on a computer used by others.
Who We Are
This joint notice describes the privacy policies of the Oppenheimer funds, OppenheimerFunds, Inc., each of its investment adviser subsidiaries, OppenheimerFunds Distributor, Inc. and OFI Global Trust Co. It applies to all Oppenheimer fund accounts you presently have, or may open in the future, using your Social Security number—whether or not you remain a shareholder of our funds. This notice was last updated March 2015. In the event it is updated or changed, we will post an updated notice on our website at oppenheimerfunds.com. If you have any questions about this privacy policy, write to us at P.O. Box 5270, Denver, CO 80217-5270, email us by clicking on the Contact Us section of our website at oppenheimerfunds.com or call us at 1.800.CALL OPP (225.5677).
106 OPPENHEIMER FUNDAMENTAL ALTERNATIVES FUND
THIS PAGE INTENTIONALLY LEFT BLANK.
107 OPPENHEIMER FUNDAMENTAL ALTERNATIVES FUND
THIS PAGE INTENTIONALLY LEFT BLANK.
108 OPPENHEIMER FUNDAMENTAL ALTERNATIVES FUND
THIS PAGE INTENTIONALLY LEFT BLANK.
109 OPPENHEIMER FUNDAMENTAL ALTERNATIVES FUND
THIS PAGE INTENTIONALLY LEFT BLANK.
110 OPPENHEIMER FUNDAMENTAL ALTERNATIVES FUND
THIS PAGE INTENTIONALLY LEFT BLANK.
111 OPPENHEIMER FUNDAMENTAL ALTERNATIVES FUND
| | | | |
| | 
Visit us at oppenheimerfunds.com for 24-hr access to account information and transactions or call us at 800 CALL OPP (800 225 5677) for 24-hr automated information and automated transactions. Representatives also available Mon–Fri 8am–8pm ET. | | |
Visit Us oppenheimerfunds.com Call Us 800 225 5677 
| | Oppenheimer funds are distributed by OppenheimerFunds Distributor, Inc. 225 Liberty Street, New York, NY 10281-1008 © 2015 OppenheimerFunds Distributor, Inc. All rights reserved. RA0236.001.1015 December 22, 2015 | | |
| | |
| | |
| | |
Table of Contents
Class A Shares
AVERAGE ANNUAL TOTAL RETURNS AT 10/30/15*
| | | | | | | | |
| | | Class A Shares of the Fund | | | | |
| | | Without Sales Charge | | With Sales Charge | | Russell Midcap Value Index | | Russell 2500 Value Index |
1-Year | | -0.13% | | -5.87% | | 0.80% | | -1.06% |
|
5-Year | | 9.92 | | 8.63 | | 12.34 | | 11.92 |
|
10-Year | | 5.76 | | 5.13 | | 7.45 | | 7.25 |
|
Prior to September 1, 2015, the Fund was named Oppenheimer Small- & Mid- Cap Value Fund.
Performance data quoted represents past performance, which does not guarantee future results. The investment return and principal value of an investment in the Fund will fluctuate so that an investor’s shares, when redeemed, may be worth more or less than their original cost. Fund returns include changes in share price, reinvested distributions, and a 5.75% maximum applicable sales charge except where “without sales charge” is indicated. Current performance may be lower or higher than the performance quoted. Returns do not consider capital gains or income taxes on an individual’s investment. For performance data current to the most recent month-end, visit oppenheimerfunds.com or call 1.800.CALL OPP (225.5677).
*October 30, 2015, was the last business day of the Fund’s fiscal year. See Note 2 of the accompanying Notes to Financial Statements. Index returns are calculated through October 31, 2015.
2 OPPENHEIMER MID CAP VALUE FUND
Fund Performance Discussion
The Fund’s Class A shares (without sales charge) returned -0.13% during the reporting period. On a relative basis, the Russell Midcap Value Index (the “Index”) returned 0.80% and the Russell 2500 Value Index returned -1.06% during the same period.
As a reminder, prior to September 1, 2015, the Fund was named Oppenheimer Small- & Mid- Cap Value Fund. The new name better reflects the Fund’s investment focus in the mid-cap space.
MARKET OVERVIEW
Domestic equities finished 2014 with positive results, outperforming other developed and emerging market equities. However, the market environment shifted over the first half of 2015. The dollar continued to strengthen, which acted as a drag on growth. Businesses, especially U.S. firms with revenues dependent on exporting goods and services, cited this as a headwind. European Central Bank (“ECB”) President Mario Draghi announced the purchase of €60 billion a month in sovereign bonds from Eurozone countries for at least 19 months, a form of Quantitative Easing (“QE”)
that is projected to increase the ECB’s balance sheet by over €1 trillion. The announcement and implementation of these extraordinary monetary policies had a significant impact on financial markets.
Markets were particularly volatile over the summer of 2015 due to numerous concerns, including the impact of slowing Chinese growth on commodities prices and the global economy, Greece’s debt situation, the strength of the U.S. dollar, along with the timing and impact of U.S. interest rate hikes.
COMPARISON OF CHANGE IN VALUE OF $10,000 HYPOTHETICAL INVESTMENTS IN:
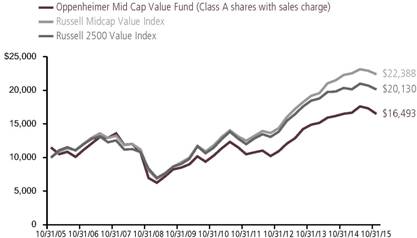
3 OPPENHEIMER MID CAP VALUE FUND
Against this backdrop, equity markets in the U.S. produced muted to slightly negative results, with value stocks underperforming growth stocks.
FUND REVIEW
Top performing stocks for the Fund this reporting period included Spansion, Inc., Newell Rubbermaid, Inc. and Humana, Inc. In December 2014, Spansion, Inc. agreed to merge with Cypress Semiconductors. Following the announcement of the merger, Spansion’s stock price performed well as investors expected significant synergies from the deal. The merger was completed in March 2015. Newell Rubbermaid is a producer of housewares, home furnishings, office items, and more. The company announced strong earnings results throughout the reporting period. Humana’s shares rallied after Aetna announced plans to acquire the company. The acquisition was completed during the reporting period.
Detractors from performance this reporting period included Whiting Petroleum Corp., Genworth Financial, Inc. and Western Digital Corp. Whiting Petroleum and Kodiak Oil & Gas, both portfolio positions at the beginning of the period, merged in December 2014, creating the largest oil and gas producer in the Bakken/Three Forks region in North Dakota and Montana. The combined company’s stock price was volatile this reporting period amid the volatility in the energy sector. We exited our position. Genworth Financial declined following management’s announcement that it was not
going to pursue a sale of Genworth Life and Annuity Insurance Company. Management’s view that a sale might jeopardize its credit ratings was unexpected. Western Digital is one of the largest independent makers of hard-disk drives. Its shares fell after announcing plans to acquire SanDisk, which was not viewed favorably by some investors.
STRATEGY & OUTLOOK
The U.S. equity market has continued to be impacted by “macro” forces. China’s devaluation of its currency in August appeared to be the final straw in a long term debate over how much slowing we would see in that market. The subsequent strength in the dollar put pressure on the valuations of U.S. companies doing business abroad. Further, the Federal Reserve’s reluctance to raise rates at the end of September seemed to raise doubts about the U.S. economy’s underlying strength.
We believe the current market environment is presenting a number of interesting opportunities for long-term value investors. With the uncertainty over exchange rates weighing on multinationals, we view select domestically focused businesses such as regional banks and housing as attractive. Recent volatility has also exposed high levels of pessimism within energy and certain technology firms.
While many investors focus on a short-term view when considering potential investments, the Fund utilizes in-depth fundamental research to identify companies that we
4 OPPENHEIMER MID CAP VALUE FUND
believe are poised for an unanticipated acceleration in return on invested capital over a multi-year time horizon. We believe this longer term approach provides a more comprehensive outlook of potential investments by focusing

on all three financial statements—income statement, balance sheet and statement of cash flows—and helps us uncover companies whose generation and use of free cash flow we deem as yet to be fully reflected in the current stock price.

5 OPPENHEIMER MID CAP VALUE FUND
Top Holdings and Allocations*
TOP TEN COMMON STOCK HOLDINGS
| | |
Lennar Corp., Cl. A | | 2.7% |
Reinsurance Group of America, Inc., Cl. A | | 2.4 |
Ally Financial, Inc. | | 2.0 |
Synopsys, Inc. | | 1.9 |
HD Supply Holdings, Inc. | | 1.8 |
Validus Holdings Ltd. | | 1.8 |
Associated Banc-Corp. | | 1.8 |
Deluxe Corp. | | 1.8 |
Louisiana-Pacific Corp. | | 1.7 |
Raymond James Financial, Inc. | | 1.7 |
Portfolio holdings and allocations are subject to change. Percentages are as of October 30, 2015, and are based on net assets. For more current Fund holdings, please visit oppenheimerfunds.com.
TOP TEN COMMON STOCK INDUSTRIES
| | |
Commercial Banks | | 8.0% |
Insurance | | 7.8 |
Oil, Gas & Consumable Fuels | | 4.9 |
Real Estate Investment Trusts (REITs) | | 4.9 |
Household Durables | | 4.2 |
Multi-Utilities | | 4.1 |
Software | | 3.8 |
Capital Markets | | 3.8 |
Health Care Equipment & Supplies | | 3.6 |
Chemicals | | 3.5 |
Portfolio holdings and allocations are subject to change. Percentages are as of October 30, 2015, and are based on net assets.
SECTOR ALLOCATION
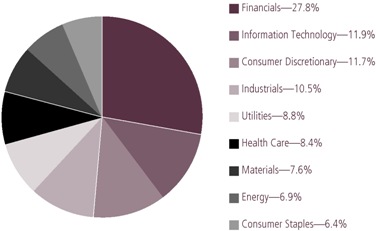
Portfolio holdings and allocations are subject to change. Percentages are as of October 30, 2015, and are based on the total market value of common stocks.
* October 30, 2015, was the last business day of the Fund’s fiscal year. See Note 2 of the accompanying Notes to Financial Statements.
6 OPPENHEIMER MID CAP VALUE FUND
Share Class Performance
AVERAGE ANNUAL TOTAL RETURNS WITHOUT SALES CHARGE AS OF 10/30/15
| | | | | | | | | | | | | | | | | | | | | | | | |
| | | Inception
Date | | | | | 1-Year | | | | | 5-Year | | | | | 10-Year | | | |
Class A (QVSCX) | | | 1/3/89 | | | | | | -0.13% | | | | | | 9.92% | | | | | | 5.76% | | | |
Class B (QSCBX) | | | 9/1/93 | | | | | | -0.89% | | | | | | 9.03% | | | | | | 5.25% | | | |
Class C (QSCCX) | | | 9/1/93 | | | | | | -0.87% | | | | | | 9.07% | | | | | | 4.95% | | | |
Class I (QSCIX) | | | 2/28/12 | | | | | | 0.31% | | | | | | 11.29% | * | | | | | N/A | | | |
Class R (QSCNX) | | | 3/1/01 | | | | | | -0.38% | | | | | | 9.62% | | | | | | 5.45% | | | |
Class Y (QSCYX) | | | 10/24/05 | | | | | | 0.12% | | | | | | 10.25% | | | | | | 6.13% | | | |
AVERAGE ANNUAL TOTAL RETURNS WITH SALES CHARGE AS OF 10/30/15 |
| | | Inception
Date | | | | | 1-Year | | | | | 5-Year | | | | | 10-Year | | | |
Class A (QVSCX) | | | 1/3/89 | | | | | | -5.87% | | | | | | 8.63% | | | | | | 5.13% | | | |
Class B (QSCBX) | | | 9/1/93 | | | | | | -5.85% | | | | | | 8.75% | | | | | | 5.25% | | | |
Class C (QSCCX) | | | 9/1/93 | | | | | | -1.86% | | | | | | 9.07% | | | | | | 4.95% | | | |
Class I (QSCIX) | | | 2/28/12 | | | | | | 0.31% | | | | | | 11.29% | * | | | | | N/A | | | |
Class R (QSCNX) | | | 3/1/01 | | | | | | -0.38% | | | | | | 9.62% | | | | | | 5.45% | | | |
Class Y (QSCYX) | | | 10/24/05 | | | | | | 0.12% | | | | | | 10.25% | | | | | | 6.13% | | | |
*Shows performance since inception
Performance data quoted represents past performance, which does not guarantee future results. The investment return and principal value of an investment in the Fund will fluctuate so that an investor’s shares, when redeemed, may be worth more or less than their original cost. Current performance may be lower or higher than the performance quoted. Returns do not consider capital gains or income taxes on an individual’s investment. For performance data current to the most recent month-end, visit oppenheimerfunds.com or call 1.800.CALL OPP (225.5677). Fund returns include changes in share price, reinvested distributions, and the applicable sales charge: for Class A shares, the current maximum initial sales charge of 5.75%; for Class B shares, the contingent deferred sales charge of 5% (1-year) and 2% (5-year); and for Class C shares, the contingent deferred sales charge (“CDSC”) of 1% for the 1-year period. Prior to 7/1/14, Class R shares were named Class N shares. Beginning 7/1/14, new purchases of Class R shares will no longer be subject to a CDSC upon redemption (any CDSC will remain in effect for purchases prior to 7/1/14). There is no sales charge for Class I and Class Y shares. Because Class B shares convert to Class A shares 72 months after purchase, the 10-year return for Class B shares uses Class A performance for the period after conversion.
The Fund’s performance is compared to that of the Russell Midcap Value Index and the Russell 2500 Value Index. The Russell Midcap Value Index measures the performance of the mid-cap value segment of the U.S. equity universe. It includes those Russell Midcap Index companies with lower price-to-book ratios and lower forecasted growth values. The Russell 2500 Value Index measures the performance of the small to mid-cap value segment of the U.S. equity universe. It includes those Russell 2500 Index companies with lower price-to-book ratios and lower forecasted growth values. The indices are unmanaged and cannot be
7 OPPENHEIMER MID CAP VALUE FUND
purchased directly by investors. While index comparisons may be useful to provide a benchmark for the Fund’s performance, it must be noted that the Fund’s investments are not limited to the investments comprising the indices. Index performance includes reinvestment of income, but does not reflect transaction costs, fees, expenses or taxes. Index performance is shown for illustrative purposes only as a benchmark for the Fund’s performance, and does not predict or depict performance of the Fund. The Fund’s performance reflects the effects of the Fund’s business and operating expenses.
The Fund’s investment strategy and focus can change over time. The mention of specific fund holdings does not constitute a recommendation by OppenheimerFunds, Inc. or its affiliates.
Before investing in any of the Oppenheimer funds, investors should carefully consider a fund’s investment objectives, risks, charges and expenses. Fund prospectuses and summary prospectuses contain this and other information about the funds, and may be obtained by asking your financial advisor, visiting oppenheimerfunds.com, or calling 1.800.CALL OPP (225.5677). Read prospectuses and summary prospectuses carefully before investing.
Shares of Oppenheimer funds are not deposits or obligations of any bank, are not guaranteed by any bank, are not insured by the FDIC or any other agency, and involve investment risks, including the possible loss of the principal amount invested.
8 OPPENHEIMER MID CAP VALUE FUND
Fund Expenses
Fund Expenses. As a shareholder of the Fund, you incur two types of costs: (1) transaction costs, which may include sales charges (loads) on purchase payments and/or contingent deferred sales charges on redemptions; and (2) ongoing costs, including management fees; distribution and service fees; and other Fund expenses. These examples are intended to help you understand your ongoing costs (in dollars) of investing in the Fund and to compare these costs with the ongoing costs of investing in other mutual funds.
The examples are based on an investment of $1,000.00 invested at the beginning of the period and held for the entire 6-month period ended October 30, 2015.
Actual Expenses. The first section of the table provides information about actual account values and actual expenses. You may use the information in this section for the class of shares you hold, together with the amount you invested, to estimate the expense that you paid over the period. Simply divide your account value by $1,000.00 (for example, an $8,600.00 account value divided by $1,000.00 = 8.60), then multiply the result by the number in the first section under the heading entitled “Expenses Paid During 6 Months Ended October 30, 2015” to estimate the expenses you paid on your account during this period.
Hypothetical Example for Comparison Purposes. The second section of the table provides information about hypothetical account values and hypothetical expenses based on the Fund’s actual expense ratio for each class of shares, and an assumed rate of return of 5% per year for each class before expenses, which is not the Fund’s actual return. The hypothetical account values and expenses may not be used to estimate the actual ending account balance or expenses you paid for the period. You may use this information to compare the ongoing costs of investing in the Fund and other funds. To do so, compare this 5% hypothetical example for the class of shares you hold with the 5% hypothetical examples that appear in the shareholder reports of the other funds.
Please note that the expenses shown in the table are meant to highlight your ongoing costs only and do not reflect any transactional costs, such as front-end or contingent deferred sales charges (loads). Therefore, the “hypothetical” section of the table is useful in comparing ongoing costs only, and will not help you determine the relative total costs of owning different funds. In addition, if these transactional costs were included, your costs would have been higher.
9 OPPENHEIMER MID CAP VALUE FUND
| | | | | | | | | | | | |
| Actual | | Beginning
Account
Value
May 1, 2015 | | | | Ending
Account
Value
October 30, 2015 | | | | Expenses
Paid During
6 Months Ended
October 30, 2015 | | |
Class A | | $ 1,000.00 | | | | $ 936.50 | | | | $ 5.75 | | |
Class B | | 1,000.00 | | | | 932.70 | | | | 9.45 | | |
Class C | | 1,000.00 | | | | 932.80 | | | | 9.40 | | |
Class I | | 1,000.00 | | | | 938.70 | | | | 3.60 | | |
Class R | | 1,000.00 | | | | 935.10 | | | | 6.96 | | |
Class Y | | 1,000.00 | | | | 937.60 | | | | 4.53 | | |
| | | | | | |
Hypothetical (5% return before expenses) | | | | | | | | | | | | |
Class A | | 1,000.00 | | | | 1,019.15 | | | | 5.99 | | |
Class B | | 1,000.00 | | | | 1,015.34 | | | | 9.85 | | |
Class C | | 1,000.00 | | | | 1,015.39 | | | | 9.80 | | |
Class I | | 1,000.00 | | | | 1,021.36 | | | | 3.76 | | |
Class R | | 1,000.00 | | | | 1,017.90 | | | | 7.26 | | |
Class Y | | 1,000.00 | | | | 1,020.41 | | | | 4.72 | | |
Expenses are equal to the Fund’s annualized expense ratio for that class, multiplied by the average account value over the period, multiplied by 183/365 (to reflect the one-half year period). Those annualized expense ratios, excluding indirect expenses from affiliated funds, based on the 6-month period ended October 30, 2015 are as follows:
| | | | | | |
| Class | | Expense Ratios | | | |
Class A | | | 1.18 | % | | |
Class B | | | 1.94 | | | |
Class C | | | 1.93 | | | |
Class I | | | 0.74 | | | |
Class R | | | 1.43 | | | |
Class Y | | | 0.93 | | | |
The expense ratios reflect voluntary and/or contractual waivers and/or reimbursements of expenses by the Fund’s Manager. Some of these undertakings may be modified or terminated at any time, as indicated in the Fund’s prospectus. The “Financial Highlights” tables in the Fund’s financial statements, included in this report, also show the gross expense ratios, without such waivers or reimbursements and reduction to custodian expenses, if applicable.
10 OPPENHEIMER MID CAP VALUE FUND
STATEMENT OF INVESTMENTS October 30, 2015*
| | | | | | | | |
| | | | | | | | |
| | | Shares | | | Value | |
| |
| Common Stocks—99.2% | |
| |
| Consumer Discretionary—11.6% | |
| |
| Auto Components—1.2% | |
| BorgWarner, Inc. | | | 400,790 | | | $ | 17,161,828 | |
|
| |
| Automobiles—0.8% | |
| Thor Industries, Inc. | | | 215,540 | | | | 11,656,403 | |
|
| |
| Hotels, Restaurants & Leisure—1.3% | |
| Norwegian Cruise Line Holdings Ltd.1 | | | 139,550 | | | | 8,878,171 | |
| |
| Royal Caribbean Cruises Ltd. | | | 90,230 | | | | 8,874,120 | |
| | | | | | | | |
| | | | | | | 17,752,291 | |
|
| |
| Household Durables—4.2% | |
| Lennar Corp., Cl. A | | | 757,100 | | | | 37,907,997 | |
| |
| Newell Rubbermaid, Inc. | | | 272,190 | | | | 11,549,022 | |
| |
| Whirlpool Corp. | | | 56,280 | | | | 9,012,679 | |
| | | | | | | | |
| | | | | | | 58,469,698 | |
|
| |
| Leisure Products—1.1% | |
| Arctic Cat, Inc. | | | 224,500 | | | | 4,611,230 | |
| |
| Mattel, Inc. | | | 402,400 | | | | 9,890,992 | |
| | | | | | | | |
| | | | | | | 14,502,222 | |
|
| |
| Media—2.0% | | | | | | | | |
| Cinemark Holdings, Inc. | | | 335,790 | | | | 11,900,398 | |
| |
| Regal Entertainment Group, Cl. A | | | 226,460 | | | | 4,388,795 | |
| |
| TEGNA, Inc. | | | 443,380 | | | | 11,988,995 | |
| | | | | | | | |
| | | | | | | 28,278,188 | |
|
| |
| Multiline Retail—0.5% | |
| Kohl’s Corp. | | | 136,980 | | | | 6,317,518 | |
|
| |
| Specialty Retail—0.5% | |
| Best Buy Co., Inc. | | | 182,070 | | | | 6,377,912 | |
|
| |
| Consumer Staples—6.4% | |
| |
| Beverages—1.0% | |
| Molson Coors Brewing Co., Cl. B | | | 153,670 | | | | 13,538,327 | |
|
| |
| Food & Staples Retailing—1.2% | |
| Rite Aid Corp.1 | | | 2,039,748 | | | | 16,073,214 | |
|
| |
| Food Products—1.5% | |
| B&G Foods, Inc. | | | 259,544 | | | | 9,418,851 | |
| | | | | | | | |
| | | | | | | | |
| | | Shares | | | Value | |
| |
| Food Products (Continued) | |
| |
| Tyson Foods, Inc., Cl. A | | | 259,680 | | | $ | 11,519,405 | |
| | | | | | | | |
| | | | | | | 20,938,256 | |
|
| |
| Household Products—1.0% | |
| Energizer Holdings, Inc. | | | 179,861 | | | | 7,703,447 | |
| |
| Spectrum Brands Holdings, Inc. | | | 71,180 | | | | 6,822,603 | |
| | | | | | | | |
| | | | | | | 14,526,050 | |
|
| |
| Personal Products—1.1% | |
| Edgewell Personal Care Co. | | | 183,911 | | | | 15,579,101 | |
|
| |
| Tobacco—0.6% | |
| Reynolds American, Inc. | | | 161,588 | | | | 7,807,932 | |
|
| |
| Energy—6.8% | |
| |
| Energy Equipment & Services—1.9% | |
| Diamond Offshore Drilling, Inc. | | | 105,600 | | | | 2,099,328 | |
| |
| FMC Technologies, Inc.1 | | | 204,020 | | | | 6,901,997 | |
| |
| Helmerich & Payne, Inc. | | | 111,050 | | | | 6,248,783 | |
| |
| Oceaneering International, Inc. | | | 105,625 | | | | 4,438,363 | |
| |
| Patterson-UTI Energy, Inc. | | | 409,380 | | | | 6,095,668 | |
| | | | | | | | |
| | | | | | | 25,784,139 | |
|
| |
| Oil, Gas & Consumable Fuels—4.9% | |
| Chesapeake Energy Corp. | | | 684,780 | | | | 4,882,481 | |
| |
| Cimarex Energy Co. | | | 143,130 | | | | 16,897,928 | |
| |
| Denbury Resources, Inc. | | | 643,900 | | | | 2,279,406 | |
| |
| EQT Corp. | | | 92,090 | | | | 6,084,386 | |
| |
| Hess Corp. | | | 69,420 | | | | 3,902,098 | |
| |
| HollyFrontier Corp. | | | 90,540 | | | | 4,433,744 | |
| |
| Newfield Exploration Co.1 | | | 139,950 | | | | 5,624,591 | |
| |
| PDC Energy, Inc.1 | | | 39,700 | | | | 2,395,498 | |
| |
| Sanchez Energy Corp.1 | | | 554,400 | | | | 3,298,680 | |
| |
| SM Energy Co. | | | 144,120 | | | | 4,806,402 | |
| |
| Tesoro Corp. | | | 72,750 | | | | 7,779,158 | |
| |
| WPX Energy, Inc.1 | | | 932,340 | | | | 6,395,852 | |
| | | | | | | | |
| | | | | | | 68,780,224 | |
11 OPPENHEIMER MID CAP VALUE FUND
STATEMENT OF INVESTMENTS Continued
| | | | | | | | |
| | | | | | | | |
| | | Shares | | | Value | |
| |
| Financials—27.5% | |
| |
| Capital Markets—3.8% | |
| Ares Management LP2 | | | 783,442 | | | $ | 12,683,926 | |
| |
| Invesco Ltd. | | | 264,924 | | | | 8,787,529 | |
| |
| Lazard Ltd., Cl. A2 | | | 173,450 | | | | 8,034,204 | |
| |
| Raymond James Financial, Inc. | | | 418,500 | | | | 23,063,535 | |
| | | | | | | | |
| | | | | | | 52,569,194 | |
|
| |
| Commercial Banks—8.0% | |
| Associated Banc- Corp. | | | 1,293,160 | | | | 25,009,714 | |
| |
| First NBC Bank Holding Co.1 | | | 391,190 | | | | 14,548,356 | |
| |
| Huntington Bancshares, Inc. | | | 1,850,280 | | | | 20,297,572 | |
| |
| SunTrust Banks, Inc. | | | 454,390 | | | | 18,866,273 | |
| |
| TCF Financial Corp. | | | 841,260 | | | | 12,946,991 | |
| |
| Zions Bancorporation | | | 709,717 | | | | 20,418,558 | |
| | | | | | | | |
| | | | | | | 112,087,464 | |
|
| |
| Consumer Finance—3.0% | |
| Ally Financial, Inc.1 | | | 1,420,330 | | | | 28,292,974 | |
| |
| Synchrony Financial1 | | | 433,800 | | | | 13,343,688 | |
| | | | | | | | |
| | | | | | | 41,636,662 | |
|
| |
| Insurance—7.8% | |
| CNO Financial Group, Inc. | | | 179,090 | | | | 3,440,319 | |
| |
| Everest Re Group Ltd. | | | 49,950 | | | | 8,889,601 | |
| |
| Genworth Financial, Inc., Cl. A1 | | | 1,939,870 | | | | 9,078,592 | |
| |
| Reinsurance Group of America, Inc., Cl. A | | | 366,810 | | | | 33,100,934 | |
| |
| Unum Group | | | 656,550 | | | | 22,749,457 | |
| |
| Validus Holdings Ltd. | | | 566,440 | | | | 25,093,292 | |
| |
| XL Group plc, Cl. A | | | 164,420 | | | | 6,261,114 | |
| | | | | | | | |
| | | | | | | 108,613,309 | |
|
| |
| Real Estate Investment Trusts (REITs)—4.9% | |
| Alexandria Real Estate Equities, Inc. | | | 58,640 | | | | 5,262,354 | |
| | | | | | | | |
| | | | | | | | |
| | | Shares | | | Value | |
| |
| Real Estate Investment Trusts (REITs) (Continued) | |
| |
| American Capital Agency Corp. | | | 398,580 | | | $ | 7,106,682 | |
| |
| Apartment Investment & Management Co., Cl. A | | | 108,610 | | | | 4,256,426 | |
| |
| CubeSmart | | | 494,690 | | | | 13,762,276 | |
| |
| Equity LifeStyle Properties, Inc. | | | 243,180 | | | | 14,707,526 | |
| |
| LaSalle Hotel Properties | | | 439,974 | | | | 12,939,635 | |
| |
| Omega Healthcare Investors, Inc. | | | 278,437 | | | | 9,611,645 | |
| | | | | | | | |
| | | | | | | 67,646,544 | |
|
| |
| Health Care—8.3% | |
| |
| Health Care Equipment & Supplies—3.6% | |
| Boston Scientific Corp.1 | | | 401,887 | | | | 7,346,494 | |
| |
| Cooper Cos., Inc. (The) | | | 76,590 | | | | 11,669,253 | |
| |
| Teleflex, Inc. | | | 128,437 | | | | 17,082,121 | |
| |
| Zimmer Biomet Holdings, Inc. | | | 131,970 | | | | 13,800,103 | |
| | | | | | | | |
| | | | | | | 49,897,971 | |
|
| |
| Health Care Technology—1.3% | |
| MedAssets, Inc.1 | | | 762,250 | | | | 18,050,080 | |
|
| |
| Life Sciences Tools & Services—1.3% | |
| Quintiles Transnational Holdings, Inc.1 | | | 282,931 | | | | 18,008,558 | |
|
| |
| Pharmaceuticals—2.1% | |
| Indivior plc, Sponsored ADR | | | 1,316,514 | | | | 21,261,701 | |
| |
| Jazz Pharmaceuticals plc1 | | | 61,990 | | | | 8,509,987 | |
| | | | | | | | |
| | | | | | | 29,771,688 | |
|
| |
| Industrials—10.4% | |
| |
| Aerospace & Defense—2.4% | |
| Esterline Technologies Corp.1 | | | 165,170 | | | | 12,726,349 | |
| |
| Huntington Ingalls Industries, Inc. | | | 76,010 | | | | 9,116,639 | |
| |
| Orbital ATK, Inc. | | | 134,380 | | | | 11,505,616 | |
| | | | | | | | |
| | | | | | | 33,348,604 | |
12 OPPENHEIMER MID CAP VALUE FUND
| | | | | | | | |
| | | | | | | | |
| | | Shares | | | Value | |
| |
| Airlines—0.9% | |
| Air Canada1 | | | 1,504,063 | | | $ | 12,420,703 | |
|
| |
| Commercial Services & Supplies—1.8% | |
| Deluxe Corp. | | | 419,490 | | | | 24,980,629 | |
|
| |
| Electrical Equipment—1.9% | |
| Eaton Corp. plc | | | 271,830 | | | | 15,198,015 | |
| |
| Hubbell, Inc., Cl. B | | | 109,860 | | | | 10,639,941 | |
| | | | | | | | |
| | | | | | | 25,837,956 | |
|
| |
| Machinery—0.5% | |
| Parker-Hannifin Corp. | | | 61,690 | | | | 6,458,943 | |
|
| |
| Professional Services—1.1% | |
| On Assignment, Inc.1 | | | 355,000 | | | | 16,014,050 | |
|
| |
| Trading Companies & Distributors—1.8% | |
| HD Supply Holdings, Inc.1 | | | 866,280 | | | | 25,806,481 | |
|
| |
| Information Technology—11.8% | |
| |
| Electronic Equipment, Instruments, & Components—2.6% | |
| Avnet, Inc. | | | 398,490 | | | | 18,103,401 | |
| |
| Dolby Laboratories, Inc., Cl. A | | | 268,850 | | | | 9,321,029 | |
| |
| Flextronics International Ltd.1 | | | 806,140 | | | | 9,181,935 | |
| | | | | | | | |
| | | | | | | 36,606,365 | |
|
| |
| IT Services—0.2% | |
| First Data Corp., Cl. A1 | | | 153,370 | | | | 2,429,381 | |
|
| |
| Semiconductors & Semiconductor Equipment—2.8% | |
| Applied Materials, Inc. | | | 582,830 | | | | 9,774,059 | |
| |
| Lam Research Corp. | | | 178,010 | | | | 13,633,786 | |
| |
| Micron Technology, Inc.1 | | | 199,290 | | | | 3,300,242 | |
| |
| Semtech Corp.1 | | | 679,290 | | | | 11,887,575 | |
| | | | | | | | |
| | | | | | | 38,595,662 | |
|
| |
| Software—3.8% | |
| Check Point | | | | | | | | |
| Software | | | | | | | | |
| Technologies Ltd.1 | | | 171,750 | | | | 14,588,445 | |
| |
| Synopsys, Inc.1 | | | 514,900 | | | | 25,734,702 | |
| | | | | | | | |
| | | | | | | | |
| | | Shares | | | Value | |
| |
| Software (Continued) | |
| |
| Verint Systems, Inc.1 | | | 266,840 | | | $ | 12,696,247 | |
| | | | | | | | |
| | | | | | | 53,019,394 | |
|
| |
| Technology Hardware, Storage & Peripherals—2.4% | |
| SanDisk Corp. | | | 227,310 | | | | 17,502,870 | |
| |
| Western Digital Corp. | | | 232,130 | | | | 15,510,927 | |
| | | | | | | | |
| | | | | | | 33,013,797 | |
|
| |
| Materials—7.6% | |
| |
| Chemicals—3.5% | |
| Eastman Chemical Co. | | | 88,760 | | | | 6,405,809 | |
| |
| International Flavors & Fragrances, Inc. | | | 103,440 | | | | 12,005,247 | |
| |
| PPG Industries, Inc. | | | 140,180 | | | | 14,615,167 | |
| |
| RPM International, Inc. | | | 189,140 | | | | 8,645,589 | |
| |
| Westlake Chemical Corp. | | | 110,910 | | | | 6,684,546 | |
| | | | | | | | |
| | | | | | | 48,356,358 | |
|
| |
| Containers & Packaging—2.4% | |
| Ball Corp. | | | 149,640 | | | | 10,250,340 | |
| |
| Owens-Illinois, Inc.1 | | | 513,980 | | | | 11,076,269 | |
| |
| WestRock Co. | | | 229,540 | | | | 12,340,070 | |
| | | | | | | | |
| | | | | | | 33,666,679 | |
|
| |
| Paper & Forest Products—1.7% | |
| Louisiana-Pacific Corp.1 | | | 1,310,900 | | | | 23,150,494 | |
| |
| Utilities—8.8% | | | | | | | | |
| |
| Electric Utilities—2.9% | |
| Emera, Inc. | | | 246,678 | | | | 8,081,742 | |
| |
| Portland General Electric Co. | | | 261,310 | | | | 9,689,375 | |
| |
| PPL Corp. | | | 225,400 | | | | 7,753,760 | |
| |
| UIL Holdings Corp. | | | 150,100 | | | | 7,653,599 | |
| |
| Xcel Energy, Inc. | | | 211,210 | | | | 7,525,412 | |
| | | | | | | | |
| | | | | | | 40,703,888 | |
|
| |
Independent Power and Renewable Electricity
Producers—0.6% | |
| AES Corp. | | | 743,430 | | | | 8,140,558 | |
|
| |
| Multi- Utilities—4.1% | | | | | | | | |
| Alliant Energy Corp. | | | 207,840 | | | | 12,266,717 | |
13 OPPENHEIMER MID CAP VALUE FUND
STATEMENT OF INVESTMENTS Continued
| | | | | | | | |
| | | | | | | | |
| | | Shares | | | Value | |
| |
Multi-Utilities (Continued) | |
| |
| Ameren Corp. | | | 448,110 | | | $ | 19,573,445 | |
| |
| Avista Corp. | | | 310,120 | | | | 10,497,562 | |
| |
| DTE Energy Co. | | | 126,850 | | | | 10,349,691 | |
| |
| MDU Resources Group, Inc. | | | 217,180 | | | | 4,096,015 | |
| | | | | | | | |
| | | | | | | 56,783,430 | |
|
| |
| Water Utilities—1.2% | | | | | | | | |
| American Water Works Co., Inc. | | | 281,410 | | | | 16,141,678 | |
| | | | | | | | |
Total Common Stocks
(Cost $1,246,017,532) | | | | | | | 1,377,299,823 | |
| | | | | | | | |
| | | | | | | | |
| | | Shares | | | Value | |
| |
Investment Company—1.3% | |
| |
| Oppenheimer Institutional Money Market Fund, Cl. E, 0.18%3,4 (Cost $18,716,295) | | | 18,716,295 | | | $ | 18,716,295 | |
| |
| Total Investments,at Value (Cost $1,264,733,827) | | | 100.5 | % | | | 1,396,016,118 | |
| |
| Net Other Assets (Liabilities) | | | (0.5 | ) | | | (6,942,075) | |
| | | | |
| Net Assets | | | 100.0 | % | | $ | 1,389,074,043 | |
| | | | |
Footnotes to Statement of Investments
* October 30, 2015 represents the last business day of the Fund’s reporting period. See Note 2 of the accompanying Notes.
1. Non-income producing security.
2. Security is a Master Limited Partnership.
3. Rate shown is the 7-day yield at period end.
4. Is or was an affiliate, as defined in the Investment Company Act of 1940, as amended, at or during the reporting period, by virtue of the Fund owning at least 5% of the voting securities of the issuer or as a result of the Fund and the issuer having the same investment adviser. Transactions during the reporting period in which the issuer was an affiliate are as follows:
| | | | | | | | | | | | | | | | |
| | | Shares
October 31,
2014 | | | Gross
Additions | | | Gross
Reductions | | | Shares October 30, 2015 | |
| | |
Oppenheimer Institutional Money Market Fund, Cl. E | | | 8,807,907 | | | | 356,538,888 | | | | 346,630,500 | | | | 18,716,295 | |
| | | | |
| | | | | | | | | Value | | | Income | |
| | |
Oppenheimer Institutional Money Market Fund, Cl. E | | | | | | | | | | $ | 18,716,295 | | | $ | 19,455 | |
See accompanying Notes to Financial Statements.
14 OPPENHEIMER MID CAP VALUE FUND
STATEMENT OF ASSETS AND LIABILITIES October 30, 20151
| | | | |
Assets | | | | |
Investments, at value—see accompanying statement of investments: | | | | |
Unaffiliated companies (cost $1,246,017,532) | | $ | 1,377,299,823 | |
Affiliated companies (cost $18,716,295) | | | 18,716,295 | |
| | | | 1,396,016,118 | |
Cash | | | 999,956 | |
Receivables and other assets: | | | | |
Investments sold | | | 11,037,627 | |
Dividends | | | 767,576 | |
Shares of beneficial interest sold | | | 460,190 | |
Other | | | 192,178 | |
Total assets | | | 1,409,473,645 | |
| | | | |
Liabilities | | | | |
Payables and other liabilities: | | | | |
Investments purchased | | | 18,178,453 | |
Shares of beneficial interest redeemed | | | 1,436,647 | |
Trustees’ compensation | | | 461,139 | |
Distribution and service plan fees | | | 282,091 | |
Shareholder communications | | | 13,519 | |
Other | | | 27,753 | |
Total liabilities | | | 20,399,602 | |
Net Assets | | $ | 1,389,074,043 | |
| | | | |
| | | | |
| |
| | | | |
Composition of Net Assets | | | | |
Par value of shares of beneficial interest | | $ | 311,014 | |
Additional paid-in capital | | | 1,339,958,955 | |
Accumulated net investment income | | | 521,706 | |
Accumulated net realized loss on investments and foreign currency transactions | | | (83,000,470 | ) |
Net unrealized appreciation on investments and translation of assets and liabilities denominated in foreign currencies | | | 131,282,838 | |
Net Assets | | $ | 1,389,074,043 | |
| | | | |
| | | | |
1. October 30, 2015 represents the last business day of the Fund’s reporting period. See Note 2 of the accompanying Notes.
15 OPPENHEIMER MID CAP VALUE FUND
STATEMENT OF ASSETS AND LIABILITIES Continued
| | |
Net Asset Value Per Share | | |
Class A Shares: | | |
| |
Net asset value and redemption price per share (based on net assets of $966,841,849 and
20,820,604 shares of beneficial interest outstanding) | | $46.44 |
| |
| Maximum offering price per share (net asset value plus sales charge of 5.75% of offering price) | | $49.27 |
|
| |
Class B Shares: | | |
| |
Net asset value, redemption price (excludes applicable contingent deferred sales charge) and
offering price per share (based on net assets of $20,774,025 and 533,427 shares of beneficial
interest outstanding) | | $38.94 |
|
| |
Class C Shares: | | |
| |
Net asset value, redemption price (excludes applicable contingent deferred sales charge) and
offering price per share (based on net assets of $253,446,104 and 6,498,736 shares of
beneficial interest outstanding) | | $39.00 |
|
| |
Class I Shares: | | |
| |
Net asset value, redemption price and offering price per share (based on net assets of
$788,063 and 16,698 shares of beneficial interest outstanding) | | $47.20 |
|
| |
Class R Shares: | | |
| |
Net asset value, redemption price (excludes applicable contingent deferred sales charge) and
offering price per share (based on net assets of $97,983,087 and 2,197,277 shares of
beneficial interest outstanding) | | $44.59 |
|
| |
Class Y Shares: | | |
| |
Net asset value, redemption price and offering price per share (based on net assets of
$49,240,915 and 1,034,658 shares of beneficial interest outstanding) | | $47.59 |
See accompanying Notes to Financial Statements.
16 OPPENHEIMER MID CAP VALUE FUND
STATEMENT OF OPERATIONS For the Year Ended October 30, 20151
| | | | |
Investment Income | | | | |
Dividends: | | | | |
Unaffiliated companies (net of foreign withholding taxes of $24,254) | | $ | 25,847,389 | |
Affiliated companies | | | 19,455 | |
Interest | | | 452 | |
Total investment income | | | 25,867,296 | |
| | | | |
Expenses | | | | |
Management fees | | | 10,714,510 | |
Distribution and service plan fees: | | | | |
Class A | | | 2,647,071 | |
Class B | | | 293,318 | |
Class C | | | 2,768,991 | |
Class R | | | 570,067 | |
Transfer and shareholder servicing agent fees: | | | | |
Class A | | | 2,376,428 | |
Class B | | | 64,700 | |
Class C | | | 610,663 | |
Class I | | | 185 | |
Class R | | | 251,430 | |
Class Y | | | 113,553 | |
Shareholder communications: | | | | |
Class A | | | 34,301 | |
Class B | | | 2,326 | |
Class C | | | 9,125 | |
Class I | | | 9 | |
Class R | | | 2,325 | |
Class Y | | | 1,542 | |
Trustees’ compensation | | | 32,442 | |
Custodian fees and expenses | | | 9,952 | |
Borrowing fees | | | 6,698 | |
Other | | | 173,506 | |
Total expenses | | | 20,683,142 | |
Less waivers and reimbursements of expenses | | | (13,143) | |
Net expenses | | | 20,669,999 | |
Net Investment Income | | | 5,197,297 | |
1. October 30, 2015 represents the last business day of the Fund’s reporting period. See Note 2 of the accompanying Notes.
17 OPPENHEIMER MID CAP VALUE FUND
STATEMENT OF OPERATIONS Continued
| | | | |
Realized and Unrealized Gain (Loss) | | | | |
Net realized gain on: | | | | |
Investments from unaffiliated companies | | $ | 150,680,907 | |
Foreign currency transactions | | | 5,404 | |
| | | | |
Net realized gain | | | 150,686,311 | |
| |
Net change in unrealized appreciation/depreciation on: | | | | |
Investments | | | (151,543,909) | |
Translation of assets and liabilities denominated in foreign currencies | | | (70,014) | |
| | | | |
Net change in unrealized appreciation/depreciation | | | (151,613,923) | |
| |
Net Increase in Net Assets Resulting from Operations | | $ | 4,269,685 | |
| | | | |
See accompanying Notes to Financial Statements.
18 OPPENHEIMER MID CAP VALUE FUND
STATEMENTS OF CHANGES IN NET ASSETS
| | | | | | | | | | |
| | | Year Ended
October 30, 20151 | | Year Ended
October 31, 2014 | |
Operations | | | | | | | | | | |
Net investment income | | $ | 5,197,297 | | | | | $ | 10,628,753 | |
Net realized gain | | | 150,686,311 | | | | | | 143,033,274 | |
Net change in unrealized appreciation/depreciation | | | (151,613,923 | ) | | | | | 14,924,621 | |
Net increase in net assets resulting from operations | | | 4,269,685 | | | | | | 168,586,648 | |
| | | | | | | | | | |
Dividends and/or Distributions to Shareholders | | | | | | | | | | |
Dividends from net investment income: | | | | | | | | | | |
Class A | | | (5,142,601 | ) | | | | | (13,504,460) | |
Class B | | | — | | | | | | (39,242) | |
Class C | | | — | | | | | | (661,974) | |
Class I | | | (5,660 | ) | | | | | (2,835) | |
Class R2 | | | (288,773 | ) | | | | | (938,463) | |
Class Y | | | (368,204 | ) | | | | | (917,484) | |
| | | (5,805,238 | ) | | | | | (16,064,458) | |
| | | | | | | | | | |
Beneficial Interest Transactions | | | | | | | | | | |
Net increase (decrease) in net assets resulting from beneficial interest transactions: | | | | | | | | | | |
Class A | | | (136,822,185 | ) | | | | | (163,106,871) | |
Class B | | | (16,687,522 | ) | | | | | (16,201,497) | |
Class C | | | (24,861,505 | ) | | | | | (23,054,913) | |
Class I | | | 370,030 | | | | | | 314,035 | |
Class R2 | | | (28,135,380 | ) | | | | | (16,759,062) | |
Class Y | | | (975,486 | ) | | | | | (4,001,224) | |
| | | (207,112,048 | ) | | | | | (222,809,532) | |
| | | | | | | | | | |
Net Assets | | | | | | | | | | |
Total decrease | | | (208,647,601 | ) | | | | | (70,287,342) | |
Beginning of period | | | 1,597,721,644 | | | | | | 1,668,008,986 | |
| End of period (including accumulated net investment income of $521,706 and $1,110,338, respectively) | | $ | 1,389,074,043 | | | | | $ | 1,597,721,644 | |
| | | | | | | | | | |
| | | | | | | | | | |
1. October 30, 2015 represents the last business day of the Fund’s reporting period. See Note 2 of the accompanying Notes.
2. Effective July 1, 2014, Class N shares were renamed Class R. See Note 1 of the accompanying Notes.
See accompanying Notes to Financial Statements.
19 OPPENHEIMER MID CAP VALUE FUND
FINANCIAL HIGHLIGHTS
| | | | | | | | | | | | | | | | | | | | |
| Class A | | Year Ended
October 30,
20151 | | | Year Ended
October 31,
2014 | | | Year Ended
October 31,
2013 | | | Year Ended
October 31,
2012 | | | Year Ended
October 31,
2011 | |
| |
Per Share Operating Data | | | | | | | | | | | | | | | | |
| Net asset value, beginning of period | | $ | 46.72 | | | $ | 42.63 | | | $ | 31.33 | | | $ | 30.05 | | | $ | 29.44 | |
| |
| Income (loss) from investment operations: | | | | | | | | | | | | | | | | |
| Net investment income2 | | | 0.24 | | | | 0.36 | | | | 0.24 | | | | 0.07 | | | | 0.03 | |
| Net realized and unrealized gain (loss) | | | (0.29) | | | | 4.25 | | | | 11.09 | | | | 1.21 | | | | 0.58 | |
| | | | |
| Total from investment operations | | | (0.05) | | | | 4.61 | | | | 11.33 | | | | 1.28 | | | | 0.61 | |
| |
| Dividends and/or distributions to shareholders: | | | | | | | | | | | | | | | | |
| Dividends from net investment income | | | (0.23) | | | | (0.52) | | | | (0.03) | | | | 0.00 | | | | 0.00 | |
| |
| Net asset value, end of period | | | $46.44 | | | | $46.72 | | | | $42.63 | | | | $31.33 | | | | $30.05 | |
| | | | |
|
| |
Total Return, at Net Asset Value3 | | | (0.13)% | | | | 10.91% | | | | 36.16% | | | | 4.26% | | | | 2.07% | |
|
| |
Ratios/Supplemental Data | | | | | | | | | | | | | | | | | | | | |
| Net assets, end of period (in thousands) | | $ | 966,842 | | | $ | 1,104,252 | | | $ | 1,162,455 | | | $ | 938,427 | | | $ | 1,250,055 | |
| |
| Average net assets (in thousands) | | $ | 1,085,463 | | | $ | 1,151,106 | | | $ | 1,013,781 | | | $ | 1,099,549 | | | $ | 1,527,052 | |
| |
| Ratios to average net assets:4 | | | | | | | | | | | | |
| Net investment income | | | 0.49% | | | | 0.80% | | | | 0.65% | | | | 0.24% | | | | 0.11% | |
| Expenses excluding interest and fees from borrowings | | | 1.17% | | | | 1.18% | | | | 1.27% | | | | 1.31% | | | | 1.26% | |
| Interest and fees from borrowings | | | 0.00%5 | | | | 0.00% | | | | 0.00% | | | | 0.00% | | | | 0.00% | |
| | | | |
| Total expenses 6 | | | 1.17% | | | | 1.18% | | | | 1.27% | | | | 1.31% | | | | 1.26% | |
| Expenses after payments, waivers and/or reimbursements and reduction to custodian expenses | | | 1.17% | | | | 1.18% | | | | 1.27% | | | | 1.26% | | | | 1.25% | |
| |
| Portfolio turnover rate | | | 47% | | | | 51% | | | | 128% | | | | 54% | | | | 89% | |
1. October 30, 2015 represents the last business day of the Fund’s reporting period. See Note 2 of the accompanying Notes.
2. Per share amounts calculated based on the average shares outstanding during the period.
3. Assumes an initial investment on the business day before the first day of the fiscal period, with all dividends and distributions reinvested in additional shares on the reinvestment date, and redemption at the net asset value calculated on the last business day of the fiscal period. Sales charges are not reflected in the total returns. Total returns are not annualized for periods less than one full year. Returns do not reflect the deduction of taxes that a shareholder would pay on fund distributions or the redemption of fund shares. The returns do not include adjustments in accordance with generally accepted accounting principles required at the period end for financial reporting purposes.
4. Annualized for periods less than one full year.
5. Less than 0.005%.
6. Total expenses including indirect expenses from affiliated fund fees and expenses were as follows:
| | | | | | |
| | Year Ended October 30, 2015 | | 1.17% | | |
| | Year Ended October 31, 2014 | | 1.18% | |
| | Year Ended October 31, 2013 | | 1.27% | |
| | Year Ended October 31, 2012 | | 1.31% | |
| | Year Ended October 31, 2011 | | 1.27% | |
See accompanying Notes to Financial Statements.
20 OPPENHEIMER MID CAP VALUE FUND
| | | | | | | | | | | | | | | | | | | | |
| Class B | | Year Ended
October 30,
20151 | | | Year Ended
October 31,
2014 | | | Year Ended
October 31,
2013 | | | Year Ended
October 31,
2012 | | | Year Ended
October 31,
2011 | |
| |
Per Share Operating Data | | | | | | | | | | | | | | | | |
| Net asset value, beginning of period | | | $ 39.29 | | | | $ 35.74 | | | | $ 26.48 | | | | $ 25.60 | | | | $ 25.29 | |
| |
| Income (loss) from investment operations: | | | | | | | | | | | | | | | | |
| Net investment income (loss)2 | | | (0.10) | | | | 0.01 | | | | (0.08) | | | | (0.15) | | | | (0.20) | |
| Net realized and unrealized gain (loss) | | | (0.25) | | | | 3.57 | | | | 9.34 | | | | 1.03 | | | | 0.51 | |
| | | | |
| Total from investment operations | | | (0.35) | | | | 3.58 | | | | 9.26 | | | | 0.88 | | | | 0.31 | |
| |
| Dividends and/or distributions to shareholders: | | | | | | | | | | | | | | | | |
| Dividends from net investment income | | | 0.00 | | | | (0.03) | | | | 0.00 | | | | 0.00 | | | | 0.00 | |
| |
| Net asset value, end of period | | | $38.94 | | | | $39.29 | | | | $35.74 | | | | $26.48 | | | | $25.60 | |
| | | | |
|
| |
Total Return, at Net Asset Value3 | | | (0.89)% | | | | 10.03% | | | | 34.97% | | | | 3.44% | | | | 1.23% | |
|
| |
Ratios/Supplemental Data | | | | | | | | | | | | | | | | | | | | |
| Net assets, end of period (in thousands) | | $ | 20,774 | | | $ | 37,092 | | | $ | 48,927 | | | $ | 53,204 | | | $ | 85,100 | |
| |
| Average net assets (in thousands) | | $ | 29,531 | | | $ | 43,889 | | | $ | 48,518 | | | $ | 67,022 | | | $ | 113,687 | |
| |
| Ratios to average net assets:4 | | | | | | | | | | | | |
| Net investment income (loss) | | | (0.23)% | | | | 0.04% | | | | (0.25)% | | | | (0.57)% | | | | (0.71)% | |
| Expenses excluding interest and fees from borrowings | | | 1.92% | | | | 2.01% | | | | 2.35% | | | | 2.37% | | | | 2.30% | |
| Interest and fees from borrowings | | | 0.00%5 | | | | 0.00% | | | | 0.00% | | | | 0.00% | | | | 0.00% | |
| | | | |
| Total expenses 6 | | | 1.92% | | | | 2.01% | | | | 2.35% | | | | 2.37% | | | | 2.30% | |
| Expenses after payments, waivers and/or reimbursements and reduction to custodian expenses | | | 1.92% | | | | 1.96% | | | | 2.15% | | | | 2.09% | | | | 2.08% | |
| |
| Portfolio turnover rate | | | 47% | | | | 51% | | | | 128% | | | | 54% | | | | 89% | |
1. October 30, 2015 represents the last business day of the Fund’s reporting period. See Note 2 of the accompanying Notes.
2. Per share amounts calculated based on the average shares outstanding during the period.
3. Assumes an initial investment on the business day before the first day of the fiscal period, with all dividends and distributions reinvested in additional shares on the reinvestment date, and redemption at the net asset value calculated on the last business day of the fiscal period. Sales charges are not reflected in the total returns. Total returns are not annualized for periods less than one full year. Returns do not reflect the deduction of taxes that a shareholder would pay on fund distributions or the redemption of fund shares. The returns do not include adjustments in accordance with generally accepted accounting principles required at the period end for financial reporting purposes.
4. Annualized for periods less than one full year.
5. Less than 0.005%.
6. Total expenses including indirect expenses from affiliated fund fees and expenses were as follows:
| | | | | | |
| | Year Ended October 30, 2015 | | 1.92% | | |
| | Year Ended October 31, 2014 | | 2.01% | |
| | Year Ended October 31, 2013 | | 2.35% | |
| | Year Ended October 31, 2012 | | 2.37% | |
| | Year Ended October 31, 2011 | | 2.31% | |
See accompanying Notes to Financial Statements.
21 OPPENHEIMER MID CAP VALUE FUND
FINANCIAL HIGHLIGHTS Continued
| | | | | | | | | | | | | | | | | | | | |
| Class C | | Year Ended
October 30,
20151 | | | Year Ended
October 31,
2014 | | | Year Ended
October 31,
2013 | | | Year Ended
October 31,
2012 | | | Year Ended
October 31,
2011 | |
| |
Per Share Operating Data | | | | | | | | | | | | | | | | |
| Net asset value, beginning of period | | | $39.35 | | | | $35.83 | | | | $26.52 | | | | $25.64 | | | | $25.32 | |
| |
| Income (loss) from investment operations: | | | | | | | | | | | | | | | | |
| Net investment income (loss)2 | | | (0.11) | | | | 0.02 | | | | (0.04) | | | | (0.14) | | | | (0.18) | |
| Net realized and unrealized gain (loss) | | | (0.24) | | | | 3.59 | | | | 9.35 | | | | 1.02 | | | | 0.50 | |
| | | | |
| Total from investment operations | | | (0.35) | | | | 3.61 | | | | 9.31 | | | | 0.88 | | | | 0.32 | |
| |
| Dividends and/or distributions to shareholders: | | | | | | | | | | | | | | | | |
| Dividends from net investment income | | | 0.00 | | | | (0.09) | | | | 0.00 | | | | 0.00 | | | | 0.00 | |
| |
| Net asset value, end of period | | | $39.00 | | | | $39.35 | | | | $35.83 | | | | $26.52 | | | | $25.64 | |
| | | | |
|
| |
Total Return, at Net Asset Value3 | | | (0.87)% | | | | 10.05% | | | | 35.10% | | | | 3.43% | | | | 1.26% | |
|
| |
Ratios/Supplemental Data | | | | | | | | | | | | | | | | | | | | |
| Net assets, end of period (in thousands) | | $ | 253,446 | | | $ | 279,925 | | | $ | 276,676 | | | $ | 234,237 | | | $ | 285,735 | |
| |
| Average net assets (in thousands) | | $ | 278,916 | | | $ | 283,792 | | | $ | 252,028 | | | $ | 258,974 | | | $ | 336,244 | |
| |
| Ratios to average net assets:4 | | | | | | | | | | | | |
| Net investment income (loss) | | | (0.26)% | | | | 0.05% | | | | (0.13)% | | | | (0.56)% | | | | (0.67)% | |
| Expenses excluding interest and fees from borrowings | | | 1.92% | | | | 1.93% | | | | 2.05% | | | | 2.08% | | | | 2.03% | |
| Interest and fees from borrowings | | | 0.00%5 | | | | 0.00% | | | | 0.00% | | | | 0.00% | | | | 0.00% | |
| | | | |
| Total expenses 6 | | | 1.92% | | | | 1.93% | | | | 2.05% | | | | 2.08% | | | | 2.03% | |
| Expenses after payments, waivers and/or reimbursements and reduction to custodian expenses | | | 1.92% | | | | 1.93% | | | | 2.05% | | | | 2.06% | | | | 2.02% | |
| |
| Portfolio turnover rate | | | 47% | | | | 51% | | | | 128% | | | | 54% | | | | 89% | |
1. October 30, 2015 represents the last business day of the Fund’s reporting period. See Note 2 of the accompanying Notes.
2. Per share amounts calculated based on the average shares outstanding during the period.
3. Assumes an initial investment on the business day before the first day of the fiscal period, with all dividends and distributions reinvested in additional shares on the reinvestment date, and redemption at the net asset value calculated on the last business day of the fiscal period. Sales charges are not reflected in the total returns. Total returns are not annualized for periods less than one full year. Returns do not reflect the deduction of taxes that a shareholder would pay on fund distributions or the redemption of fund shares. The returns do not include adjustments in accordance with generally accepted accounting principles required at the period end for financial reporting purposes.
4. Annualized for periods less than one full year.
5. Less than 0.005%.
6. Total expenses including indirect expenses from affiliated fund fees and expenses were as follows:
| | | | | | |
| | Year Ended October 30, 2015 | | 1.92% | | |
| | Year Ended October 31, 2014 | | 1.93% | |
| | Year Ended October 31, 2013 | | 2.05% | |
| | Year Ended October 31, 2012 | | 2.08% | |
| | Year Ended October 31, 2011 | | 2.04% | |
See accompanying Notes to Financial Statements.
22 OPPENHEIMER MID CAP VALUE FUND
| | | | | | | | | | | | | | | | |
| Class I | | Year Ended
October 30,
20151 | | | Year Ended
October 31,
2014 | | | Year Ended
October 31,
2013 | | | Period Ended
October 31,
20122 | |
| |
Per Share Operating Data | | | | | | | | | | | | | | | | |
Net asset value, beginning of period | | | $47.49 | | | | $43.64 | | | | $31.88 | | | | $32.90 | |
| |
Income (loss) from investment operations: | | | | | | | | | | | | | | | | |
Net investment income3 | | | 0.43 | | | | 0.47 | | | | 0.49 | | | | 0.21 | |
Net realized and unrealized gain (loss) | | | (0.27) | | | | 4.42 | | | | 11.27 | | | | (1.23) | |
| | | | |
Total from investment operations | | | 0.16 | | | | 4.89 | | | | 11.76 | | | | (1.02) | |
| |
Dividends and/or distributions to shareholders: | | | | | | | | | | | | | | | | |
Dividends from net investment income | | | (0.45) | | | | (1.04) | | | | 0.00 | | | | 0.00 | |
| |
Net asset value, end of period | | | $47.20 | | | | $47.49 | | | | $43.64 | | | | $31.88 | |
| | | | |
|
| |
Total Return, at Net Asset Value4 | | | 0.31% | | | | 11.36% | | | | 36.85% | | | | (3.07)% | |
|
| |
Ratios/Supplemental Data | | | | | | | | | | | | | | | | |
Net assets, end of period (in thousands) | | $ | 788 | | | $ | 427 | | | $ | 95 | | | $ | 10 | |
| |
Average net assets (in thousands) | | $ | 621 | | | $ | 178 | | | $ | 35 | | | $ | 422 | |
| |
Ratios to average net assets:5 | | | | | | | | | | | | | | | | |
Net investment income | | | 0.88% | | | | 1.02% | | | | 1.23% | | | | 0.99% | |
Expenses excluding interest and fees from borrowings | | | 0.73% | | | | 0.76% | | | | 0.77% | | | | 0.74% | |
Interest and fees from borrowings | | | 0.00%6 | | | | 0.00% | | | | 0.00% | | | | 0.00% | |
| | | | |
Total expenses 7 | | | 0.73% | | | | 0.76% | | | | 0.77% | | | | 0.74% | |
| Expenses after payments, waivers and/or reimbursements and reduction to custodian expenses | | | 0.73% | | | | 0.76% | | | | 0.77% | | | | 0.74% | |
| |
Portfolio turnover rate | | | 47% | | | | 51% | | | | 128% | | | | 54% | |
1. October 30, 2015 represents the last business day of the Fund’s reporting period. See Note 2 of the accompanying Notes.
2. For the period from February 28, 2012 (inception of offering) to October 31, 2012.
3. Per share amounts calculated based on the average shares outstanding during the period.
4. Assumes an initial investment on the business day before the first day of the fiscal period, with all dividends and distributions reinvested in additional shares on the reinvestment date, and redemption at the net asset value calculated on the last business day of the fiscal period. Sales charges are not reflected in the total returns. Total returns are not annualized for periods less than one full year. Returns do not reflect the deduction of taxes that a shareholder would pay on fund distributions or the redemption of fund shares. The returns do not include adjustments in accordance with generally accepted accounting principles required at the period end for financial reporting purposes.
5. Annualized for periods less than one full year.
6. Less than 0.005%.
7. Total expenses including indirect expenses from affiliated fund fees and expenses were as follows:
| | | | | | |
| | Year Ended October 30, 2015 | | 0.73% | | |
| | Year Ended October 31, 2014 | | 0.76% | |
| | Year Ended October 31, 2013 | | 0.77% | |
| | Period Ended October 31, 2012 | | 0.74% | |
See accompanying Notes to Financial Statements.
23 OPPENHEIMER MID CAP VALUE FUND
FINANCIAL HIGHLIGHTS Continued
| | | | | | | | | | | | | | | | | | | | |
| Class R | | Year Ended
October 30,
20151 | | | Year Ended
October 31,
2014 | | | Year Ended
October 31,
2013 | | | Year Ended
October 31,
2012 | | | Year Ended
October 31,
2011 | |
| |
Per Share Operating Data | | | | | | | | | | | | | | | | | | | | |
Net asset value, beginning of period | | | $44.88 | | | | $40.87 | | | | $30.09 | | | | $28.94 | | | | $28.44 | |
| |
Income (loss) from investment operations: | | | | | | | | | | | | | | | | | | | | |
Net investment income (loss)2 | | | 0.12 | | | | 0.23 | | | | 0.14 | | | | (0.02) | | | | (0.05) | |
Net realized and unrealized gain (loss) | | | (0.30) | | | | 4.09 | | | | 10.64 | | | | 1.17 | | | | 0.55 | |
| | | | |
Total from investment operations | | | (0.18) | | | | 4.32 | | | | 10.78 | | | | 1.15 | | | | 0.50 | |
| |
Dividends and/or distributions to shareholders: | | | | | | | | | | | | | | | | | | | | |
Dividends from net investment income | | | (0.11) | | | | (0.31) | | | | 0.00 | | | | 0.00 | | | | 0.00 | |
| |
Net asset value, end of period | | | $44.59 | | | | $44.88 | | | | $40.87 | | | | $30.09 | | | | $28.94 | |
| | | | |
|
| |
Total Return, at Net Asset Value3 | | | (0.38)% | | | | 10.61% | | | | 35.79% | | | | 3.97% | | | | 1.76% | |
| |
Ratios/Supplemental Data | | | | | | | | | | | | | | | | | | | | |
Net assets, end of period (in thousands) | | $ | 97,983 | | | $ | 125,703 | | | $ | 130,267 | | | $ | 132,365 | | | $ | 176,002 | |
| |
Average net assets (in thousands) | | $ | 114,811 | | | $ | 129,580 | | | $ | 129,674 | | | $ | 154,101 | | | $ | 213,872 | |
| |
Ratios to average net assets:4 | | | | | | | | | | | | | | | | | | | | |
Net investment income (loss) | | | 0.25% | | | | 0.53% | | | | 0.39% | | | | (0.05)% | | | | (0.17)% | |
Expenses excluding interest and fees on short-term floating rate notes issued and interest and fees from borrowings | | | 1.42% | | | | 1.45% | | | | 1.53% | | | | 1.59% | | | | 1.54% | |
Interest and fees from borrowings | | | 0.00%5 | | | | 0.00% | | | | 0.00% | | | | 0.00% | | | | 0.00% | |
| | | | |
Total expenses 6 | | | 1.42% | | | | 1.45% | | | | 1.53% | | | | 1.59% | | | | 1.54% | |
| Expenses after payments, waivers and/or reimbursements and reduction to custodian expenses | | | 1.42% | | | | 1.45% | | | | 1.53% | | | | 1.55% | | | | 1.53% | |
| |
Portfolio turnover rate | | | 47% | | | | 51% | | | | 128% | | | | 54% | | | | 89% | |
1. October 30, 2015 represents the last business day of the Fund’s reporting period. See Note 2 of the accompanying Notes.
2. Per share amounts calculated based on the average shares outstanding during the period.
3. Assumes an initial investment on the business day before the first day of the fiscal period, with all dividends and distributions reinvested in additional shares on the reinvestment date, and redemption at the net asset value calculated on the last business day of the fiscal period. Sales charges are not reflected in the total returns. Total returns are not annualized for periods less than one full year. Returns do not reflect the deduction of taxes that a shareholder would pay on fund distributions or the redemption of fund shares. The returns do not include adjustments in accordance with generally accepted accounting principles required at the period end for financial reporting purposes.
4. Annualized for periods less than one full year.
5. Less than 0.005%.
6. Total expenses including indirect expenses from affiliated fund fees and expenses were as follows:
| | | | | | |
| | Year Ended October 30, 2015 | | 1.42% | | |
| | Year Ended October 31, 2014 | | 1.45% | |
| | Year Ended October 31, 2013 | | 1.53% | |
| | Year Ended October 31, 2012 | | 1.59% | |
| | Year Ended October 31, 2011 | | 1.55% | |
See accompanying Notes to Financial Statements.
24 OPPENHEIMER MID CAP VALUE FUND
| | | | | | | | | | | | | | | | | | | | |
| Class Y | | Year Ended
October 30,
20151 | | | Year Ended
October 31,
2014 | | | Year Ended
October 31,
2013 | | | Year Ended
October 31,
2012 | | | Year Ended
October 31,
2011 | |
| |
Per Share Operating Data | | | | | | | | | | | | | | | | |
| Net asset value, beginning of period | | | $47.88 | | | | $43.81 | | | | $32.20 | | | | $30.78 | | | | $30.08 | |
| |
| Income (loss) from investment operations: | | | | | | | | | | | | | | | | |
| Net investment income2 | | | 0.36 | | | | 0.52 | | | | 0.34 | | | | 0.19 | | | | 0.12 | |
| Net realized and unrealized gain (loss) | | | (0.30) | | | | 4.37 | | | | 11.40 | | | | 1.23 | | | | 0.58 | |
| | | | |
| Total from investment operations | | | 0.06 | | | | 4.89 | | | | 11.74 | | | | 1.42 | | | | 0.70 | |
| |
| Dividends and/or distributions to shareholders: | | | | | | | | | | | | | | | | |
| Dividends from net investment income | | | (0.35) | | | | (0.82) | | | | (0.13) | | | | 0.00 | | | | 0.00 | |
| |
| Net asset value, end of period | | | $47.59 | | | | $47.88 | | | | $43.81 | | | | $32.20 | | | | $30.78 | |
| | | | |
|
| |
Total Return, at Net Asset Value3 | | | 0.12% | | | | 11.30% | | | | 36.55% | | | | 4.62% | | | | 2.33% | |
|
| |
Ratios/Supplemental Data | | | | | | | | | | | | | | | | | | | | |
| Net assets, end of period (in thousands) | | $ | 49,241 | | | $ | 50,323 | | | $ | 49,589 | | | $ | 63,259 | | | $ | 100,231 | |
| |
| Average net assets (in thousands) | | $ | 51,876 | | | $ | 50,290 | | | $ | 50,572 | | | $ | 85,178 | | | $ | 102,025 | |
| |
| Ratios to average net assets:4 | | | | | | | | | | | | |
| Net investment income | | | 0.73% | | | | 1.13% | | | | 0.91% | | | | 0.60% | | | | 0.35% | |
| Expenses excluding interest and fees from borrowings | | | 0.92% | | | | 0.84% | | | | 0.98% | | | | 0.92% | | | | 1.00% | |
| Interest and fees from borrowings | | | 0.00%5 | | | | 0.00% | | | | 0.00% | | | | 0.00% | | | | 0.00% | |
| | | | |
| Total expenses 6 | | | 0.92% | | | | 0.84% | | | | 0.98% | | | | 0.92% | | | | 1.00% | |
| Expenses after payments, waivers and/or reimbursements and reduction to custodian expenses | | | 0.92% | | | | 0.83% | | | | 0.98% | | | | 0.92% | | | | 0.99% | |
| |
| Portfolio turnover rate | | | 47% | | | | 51% | | | | 128% | | | | 54% | | | | 89% | |
1. October 30, 2015 represents the last business day of the Fund’s reporting period. See Note 2 of the accompanying Notes.
2. Per share amounts calculated based on the average shares outstanding during the period.
3. Assumes an initial investment on the business day before the first day of the fiscal period, with all dividends and distributions reinvested in additional shares on the reinvestment date, and redemption at the net asset value calculated on the last business day of the fiscal period. Sales charges are not reflected in the total returns. Total returns are not annualized for periods less than one full year. Returns do not reflect the deduction of taxes that a shareholder would pay on fund distributions or the redemption of fund shares. The returns do not include adjustments in accordance with generally accepted accounting principles required at the period end for financial reporting purposes.
4. Annualized for periods less than one full year.
5. Less than 0.005%.
6. Total expenses including indirect expenses from affiliated fund fees and expenses were as follows:
| | | | | | |
| | Year Ended October 30, 2015 | | 0.92% | | |
| | Year Ended October 31, 2014 | | 0.84% | |
| | Year Ended October 31, 2013 | | 0.98% | |
| | Year Ended October 31, 2012 | | 0.92% | |
| | Year Ended October 31, 2011 | | 1.01% | |
See accompanying Notes to Financial Statements.
25 OPPENHEIMER MID CAP VALUE FUND
NOTES TO FINANCIAL STATEMENTS October 30, 2015
1. Organization
Oppenheimer Mid Cap Value Fund (the “Fund”), formerly Oppenheimer Small- & Mid- Cap Value Fund, a series of Oppenheimer Quest for Value Funds, is registered under the Investment Company Act of 1940 (“1940 Act”), as amended, as a diversified open-end management investment company. The Fund’s investment objective is to seek capital appreciation. The Fund’s investment adviser is OFI Global Asset Management, Inc. (“OFI Global” or the “Manager”), a wholly-owned subsidiary of OppenheimerFunds, Inc. (“OFI” or the “Sub-Adviser”). The Manager has entered into a sub-advisory agreement with OFI.
The Fund offers Class A, Class C, Class I, Class R and Class Y shares, and previously offered Class B shares for new purchase through June 29, 2012. Subsequent to that date, no new purchases of Class B shares are permitted, however reinvestment of dividend and/or capital gain distributions and exchanges of Class B shares into and from other Oppenheimer funds are allowed. As of July 1, 2014, Class N shares were renamed Class R shares. Class N shares subject to a contingent deferred sales charge (“CDSC”) on July 1, 2014, continue to be subject to a CDSC after the shares were renamed. Purchases of Class R shares occurring on or after July 1, 2014, are not subject to a CDSC upon redemption. Class A shares are sold at their offering price, which is normally net asset value plus a front-end sales charge. Class C and Class R shares are sold, and Class B shares were sold, without a front-end sales charge but may be subject to a contingent deferred sales charge (“CDSC”). Class R shares are sold only through retirement plans. Retirement plans that offer Class R shares may impose charges on those accounts. Class I and Class Y shares are sold to certain institutional investors or intermediaries without either a front-end sales charge or a CDSC, however, the intermediaries may impose charges on their accountholders who beneficially own Class I and Class Y shares. All classes of shares have identical rights and voting privileges with respect to the Fund in general and exclusive voting rights on matters that affect that class alone. Earnings, net assets and net asset value per share may differ due to each class having its own expenses, such as transfer and shareholder servicing agent fees and shareholder communications, directly attributable to that class. Class A, B, C and R shares have separate distribution and/or service plans under which they pay fees. Class I and Class Y shares do not pay such fees. Class B shares will automatically convert to Class A shares 72 months after the date of purchase.
The following is a summary of significant accounting policies followed in the Fund’s preparation of financial statements in accordance with accounting principles generally accepted in the United States (“U.S. GAAP”).
2. Significant Accounting Policies
Security Valuation. All investments in securities are recorded at their estimated fair value, as described in Note 3.
Reporting Period End Date. The last day of the Fund’s reporting period is the last day the New York Stock Exchange was open for trading during the period. The Fund’s financial statements have been presented through that date to maintain consistency with the Fund’s net asset value calculations used for shareholder transactions.
26 OPPENHEIMER MID CAP VALUE FUND
2. Significant Accounting Policies (Continued)
Foreign Currency Translation. The Fund’s accounting records are maintained in U.S. dollars. The values of securities denominated in foreign currencies and amounts related to the purchase and sale of foreign securities and foreign investment income are translated into U.S. dollars as of the close of the New York Stock Exchange (the “Exchange”), normally 4:00 P.M. Eastern time, on each day the Exchange is open for trading. Foreign exchange rates may be valued primarily using a reliable bank, dealer or service authorized by the Board of Trustees.
Reported net realized gains and losses from foreign currency transactions arise from sales of portfolio securities, sales and maturities of short-term securities, sales of foreign currencies, exchange rate fluctuations between the trade and settlement dates on securities transactions, and the difference between the amounts of dividends, interest, and foreign withholding taxes recorded on the Fund’s books and the U.S. dollar equivalent of the amounts actually received or paid. Net unrealized appreciation and depreciation on the translation of assets and liabilities denominated in foreign currencies arise from changes in the values of assets and liabilities, including investments in securities at fiscal period end, resulting from changes in exchange rates.
The effect of changes in foreign currency exchange rates on investments is separately identified from the fluctuations arising from changes in market values of securities held and reported with all other foreign currency gains and losses in the Fund’s Statement of Operations.
Allocation of Income, Expenses, Gains and Losses. Income, expenses (other than those attributable to a specific class), gains and losses are allocated on a daily basis to each class of shares based upon the relative proportion of net assets represented by such class. Operating expenses directly attributable to a specific class are charged against the operations of that class.
Dividends and Distributions to Shareholders. Dividends and distributions to shareholders, which are determined in accordance with income tax regulations and may differ from U.S. generally accepted accounting principles, are recorded on the ex-dividend date. Income distributions, if any, are declared and paid quarterly. Capital gain distributions, if any, are declared and paid annually.
Investment Income. Dividend income is recorded on the ex-dividend date or upon ex-dividend notification in the case of certain foreign dividends where the ex-dividend date may have passed. Non-cash dividends included in dividend income, if any, are recorded at the fair market value of the securities received. Interest income is recognized on an accrual basis. Discount and premium, which are included in interest income on the Statement of Operations, are amortized or accreted daily.
Return of Capital Estimates. Distributions received from the Fund’s investments in Master Limited Partnerships (MLPs) and Real Estate Investments Trusts (REITs), generally are comprised of income and return of capital. The Fund records investment income and return of
27 OPPENHEIMER MID CAP VALUE FUND
NOTES TO FINANCIAL STATEMENTS Continued
2. Significant Accounting Policies (Continued)
capital based on estimates made at the time such distributions are received. Such estimates are based on historical information available from each MLP, REIT and other industry sources. These estimates may subsequently be revised based on information received from MLPs and REITs after their tax reporting periods are concluded.
Custodian Fees. “Custodian fees and expenses” in the Statement of Operations may include interest expense incurred by the Fund on any cash overdrafts of its custodian account during the period. Such cash overdrafts may result from the effects of failed trades in portfolio securities and from cash outflows resulting from unanticipated shareholder redemption activity. The Fund pays interest to its custodian on such cash overdrafts, to the extent they are not offset by positive cash balances maintained by the Fund, based on the negative rolling average balance at an average Federal Funds Rate plus 0.50%. The “Reduction to custodian expenses” line item, if applicable, represents earnings on cash balances maintained by the Fund during the period. Such interest expense and other custodian fees may be paid with these earnings.
Security Transactions. Security transactions are recorded on the trade date. Realized gains and losses on securities sold are determined on the basis of identified cost.
Indemnifications. The Fund’s organizational documents provide current and former Trustees and officers with a limited indemnification against liabilities arising in connection with the performance of their duties to the Fund. In the normal course of business, the Fund may also enter into contracts that provide general indemnifications. The Fund’s maximum exposure under these arrangements is unknown as this would be dependent on future claims that may be made against the Fund. The risk of material loss from such claims is considered remote.
Federal Taxes. The Fund intends to comply with provisions of the Internal Revenue Code applicable to regulated investment companies and to distribute substantially all of its investment company taxable income, including any net realized gain on investments not offset by capital loss carryforwards, if any, to shareholders. Therefore, no federal income or excise tax provision is required. The Fund files income tax returns in U.S. federal and applicable state jurisdictions. The statute of limitations on the Fund’s tax return filings generally remains open for the three preceding fiscal reporting period ends.
The tax components of capital shown in the following table represent distribution requirements the Fund must satisfy under the income tax regulations, losses the Fund may be able to offset against income and gains realized in future years and unrealized appreciation or depreciation of securities and other investments for federal income tax purposes.
28 OPPENHEIMER MID CAP VALUE FUND
2. Significant Accounting Policies (Continued)
| | | | | | | | | | | | |
Undistributed
Net Investment
Income | | Undistributed
Long-Term
Gain | | | Accumulated
Loss
Carryforward1,2,3 | | | Net Unrealized
Appreciation
Based on cost of
Securities and
Other Investments
for Federal Income
Tax Purposes | |
$1,131,627 | | | $— | | | | $80,242,236 | | | | $128,454,200 | |
1. At period end, the Fund had $80,242,236 of net capital loss carryforward available to offset future realized capital gains, if any, and thereby reduce future taxable gain distributions. Details of the capital loss carryforwards are included in the table below. Capital loss carryovers with no expiration, if any, must be utilized prior to those with expiration dates.
| | |
| Expiring | | |
2017 | | $ 80,242,236 |
2. During the reporting period, the Fund utilized $151,218,079 of capital loss carryforward to offset capital gains realized in that fiscal year.
3. During the previous reporting period, the Fund utilized $142,738,929 of capital loss carryforward to offset capital gains realized in that fiscal year.
Net investment income (loss) and net realized gain (loss) may differ for financial statement and tax purposes. The character of dividends and distributions made during the fiscal year from net investment income or net realized gains are determined in accordance with federal income tax requirements, which may differ from the character of net investment income or net realized gains presented in those financial statements in accordance with GAAP. Also, due to timing of dividends and distributions, the fiscal year in which amounts are distributed may differ from the fiscal year in which the income or net realized gain was recorded by the Fund.
Accordingly, the following amounts have been reclassified for the reporting period. Net assets of the Fund were unaffected by the reclassifications.
| | |
Increase
to Accumulated
Net Investment
Income | | Increase
to Accumulated Net
Realized Loss
on Investments |
$19,309 | | $19,309 |
The tax character of distributions paid during the reporting periods:
| | | | | | | | |
| | | Year Ended | | | Year Ended | |
| | | October 31, 2015 | | | October 31, 2014 | |
Distributions paid from: | | | | | | | | |
Ordinary income | | $ | 5,805,238 | | | $ | 16,064,458 | |
The aggregate cost of securities and other investments and the composition of unrealized appreciation and depreciation of securities and other investments for federal income tax purposes at period end are noted in the following table. The primary difference between book and tax appreciation or depreciation of securities and other investments, if applicable, is
29 OPPENHEIMER MID CAP VALUE FUND
NOTES TO FINANCIAL STATEMENTS Continued
2. Significant Accounting Policies (Continued)
attributable to the tax deferral of losses or tax realization of financial statement unrealized gain or loss.
| | | | |
Federal tax cost of securities | | $ | 1,267,562,465 | |
| | | | |
Gross unrealized appreciation | | $ | 184,315,778 | |
Gross unrealized depreciation | | | (55,861,578) | |
| | | | |
Net unrealized appreciation | | $ | 128,454,200 | |
| | | | |
Use of Estimates. The preparation of financial statements in conformity with accounting principles generally accepted in the United States of America requires management to make estimates and assumptions that affect the reported amounts of assets and liabilities and disclosure of contingent assets and liabilities at the date of the financial statements and the reported amounts of increases and decreases in net assets from operations during the reporting period. Actual results could differ from those estimates.
3. Securities Valuation
The Fund calculates the net asset value of its shares as of the close of the New York Stock Exchange (the “Exchange”), normally 4:00 P.M. Eastern time, on each day the Exchange is open for trading, except in the case of a scheduled early closing of the Exchange, in which case the Fund will calculate net asset value of the shares as of the scheduled early closing time of the Exchange.
The Fund’s Board has adopted procedures for the valuation of the Fund’s securities and has delegated the day-to-day responsibility for valuation determinations under those procedures to the Manager. The Manager has established a Valuation Committee which is responsible for determining a “fair valuation” for any security for which market quotations are not “readily available.” The Valuation Committee’s fair valuation determinations are subject to review, approval and ratification by the Fund’s Board at its next regularly scheduled meeting covering the calendar quarter in which the fair valuation was determined.
Valuation Methods and Inputs
Securities are valued using unadjusted quoted market prices, when available, as supplied primarily by third party pricing services or dealers.
The following methodologies are used to determine the market value or the fair value of the types of securities described below:
Securities traded on a registered U.S. securities exchange (including exchange-traded derivatives other than futures and futures options) are valued based on the last sale price of the security reported on the principal exchange on which it is traded, prior to the time when the Fund’s assets are valued. In the absence of a sale, the security is valued at the mean between the bid and asked price on the principal exchange or, if not available from the principal exchange, obtained from two dealers. If bid and asked prices are not available from either the exchange or two dealers, the security is valued by using one of the following methodologies (listed in order of priority): (1) using a bid from the principal exchange, (2) the mean between the bid and asked price as provided by a single dealer, or (3) a bid from a single dealer. A security of a foreign issuer traded on a foreign exchange, but not listed on a
30 OPPENHEIMER MID CAP VALUE FUND
3. Securities Valuation (Continued)
registered U.S. securities exchange, is valued based on the last sale price on the principal exchange on which the security is traded, as identified by the third party pricing service used by the Manager, prior to the time when the Fund’s assets are valued. If the last sale price is unavailable, the security is valued at the most recent official closing price on the principal exchange on which it is traded. If the last sales price or official closing price for a foreign security is not available, the security is valued at the mean between the bid and asked price per the exchange or, if not available from the exchange, obtained from two dealers. If bid and asked prices are not available from either the exchange or two dealers, the security is valued by using one of the following methodologies (listed in order of priority): (1) using a bid from the exchange, (2) the mean between the bid and asked price as provided by a single dealer, or (3) a bid from a single dealer.
Shares of a registered investment company that are not traded on an exchange are valued at that investment company’s net asset value per share.
Corporate and government debt securities (of U.S. or foreign issuers) and municipal debt securities, event-linked bonds, loans, mortgage-backed securities, collateralized mortgage obligations, and asset-backed securities are valued at the mean between the “bid” and “asked” prices utilizing evaluated prices obtained from third party pricing services or broker-dealers who may use matrix pricing methods to determine the evaluated prices.
Short-term money market type debt securities with a remaining maturity of sixty days or less are valued at cost adjusted by the amortization of discount or premium to maturity (amortized cost), which approximates market value. Short-term debt securities with a remaining maturity in excess of sixty days are valued at the mean between the “bid” and “asked” prices utilizing evaluated prices obtained from third party pricing services or broker-dealers.
A description of the standard inputs that may generally be considered by the third party pricing vendors in determining their evaluated prices is provided below.
| | |
| Security Type | | Standard inputs generally considered by third-party
pricing vendors |
| Corporate debt, government debt, municipal, mortgage-backed and asset-backed securities | | Reported trade data, broker-dealer price quotations, benchmark yields, issuer spreads on comparable securities, the credit quality, yield, maturity, and other appropriate factors. |
Loans | | Information obtained from market participants regarding reported trade data and broker-dealer price quotations. |
Event-linked bonds | | Information obtained from market participants regarding reported trade data and broker-dealer price quotations. |
If a market value or price cannot be determined for a security using the methodologies described above, or if, in the “good faith” opinion of the Manager, the market value or price obtained does not constitute a “readily available market quotation,” or a significant event has occurred that would materially affect the value of the security, the security is fair valued either (i) by a standardized fair valuation methodology applicable to the security type or the significant event as previously approved by the Valuation Committee and the Fund’s Board or (ii) as determined in good faith by the Manager’s Valuation Committee. The Valuation Committee considers all relevant facts that are reasonably available, through either public
31 OPPENHEIMER MID CAP VALUE FUND
NOTES TO FINANCIAL STATEMENTS Continued
3. Securities Valuation (Continued)
information or information available to the Manager, when determining the fair value of a security. Fair value determinations by the Manager are subject to review, approval and ratification by the Fund’s Board at its next regularly scheduled meeting covering the calendar quarter in which the fair valuation was determined. Those fair valuation standardized methodologies include, but are not limited to, valuing securities at the last sale price or initially at cost and subsequently adjusting the value based on: changes in company specific fundamentals, changes in an appropriate securities index, or changes in the value of similar securities which may be further adjusted for any discounts related to security-specific resale restrictions. When possible, such methodologies use observable market inputs such as unadjusted quoted prices of similar securities, observable interest rates, currency rates and yield curves. The methodologies used for valuing securities are not necessarily an indication of the risks associated with investing in those securities nor can it be assured that the Fund can obtain the fair value assigned to a security if it were to sell the security.
To assess the continuing appropriateness of security valuations, the Manager, or its third party service provider who is subject to oversight by the Manager, regularly compares prior day prices, prices on comparable securities, and sale prices to the current day prices and challenges those prices exceeding certain tolerance levels with the third party pricing service or broker source. For those securities valued by fair valuations, whether through a standardized fair valuation methodology or a fair valuation determination, the Valuation Committee reviews and affirms the reasonableness of the valuations based on such methodologies and fair valuation determinations on a regular basis after considering all relevant information that is reasonably available.
Classifications
Each investment asset or liability of the Fund is assigned a level at measurement date based on the significance and source of the inputs to its valuation. Various data inputs are used in determining the value of each of the Fund’s investments as of the reporting period end. These data inputs are categorized in the following hierarchy under applicable financial accounting standards:
1) Level 1-unadjusted quoted prices in active markets for identical assets or liabilities (including securities actively traded on a securities exchange)
2) Level 2-inputs other than unadjusted quoted prices that are observable for the asset or liability (such as unadjusted quoted prices for similar assets and market corroborated inputs such as interest rates, prepayment speeds, credit risks, etc.)
3) Level 3-significant unobservable inputs (including the Manager’s own judgments about assumptions that market participants would use in pricing the asset or liability).
The inputs used for valuing securities are not necessarily an indication of the risks associated with investing in those securities.
The table below categorizes amounts that are included in the Fund’s Statement of Assets and Liabilities at period end based on valuation input level:
32 OPPENHEIMER MID CAP VALUE FUND
3. Securities Valuation (Continued)
| | | | | | | | | | | | | | | | |
| | | | | | Level 2— | | | Level 3— | | | | |
| | | Level 1— | | | Other Significant | | | Significant | | | | |
| | | Unadjusted | | | Observable | | | Unobservable | | | | |
| | | Quoted Prices | | | Inputs | | | Inputs | | | Value | |
Assets Table | | | | | | | | | | | | | | | | |
Investments, at Value: | | | | | | | | | | | | | | | | |
Common Stocks | | | | | | | | | | | | | | | | |
Consumer Discretionary | | $ | 160,516,060 | | | $ | — | | | $ | — | | | $ | 160,516,060 | |
Consumer Staples | | | 88,462,880 | | | | — | | | | — | | | | 88,462,880 | |
Energy | | | 94,564,363 | | | | — | | | | — | | | | 94,564,363 | |
Financials | | | 382,553,173 | | | | — | | | | — | | | | 382,553,173 | |
Health Care | | | 115,728,297 | | | | — | | | | — | | | | 115,728,297 | |
Industrials | | | 144,867,366 | | | | — | | | | — | | | | 144,867,366 | |
Information Technology | | | 163,664,599 | | | | — | | | | — | | | | 163,664,599 | |
Materials | | | 105,173,531 | | | | — | | | | — | | | | 105,173,531 | |
Utilities | | | 121,769,554 | | | | — | | | | — | | | | 121,769,554 | |
Investment Company | | | 18,716,295 | | | | — | | | | — | | | | 18,716,295 | |
| | | | |
Total Assets | | $ | 1,396,016,118 | | | $ | — | | | $ | — | | | $ | 1,396,016,118 | |
| | | | |
Forward currency exchange contracts and futures contracts, if any, are reported at their unrealized appreciation/depreciation at measurement date, which represents the change in the contract’s value from trade date. All additional assets and liabilities included in the above table are reported at their market value at measurement date.
4. Investments and Risks
Investments in Affiliated Funds. The Fund is permitted to invest in other mutual funds advised by the Manager (“Affiliated Funds”). Affiliated Funds are open-end management investment companies registered under the 1940 Act, as amended. The Manager is the investment adviser of, and the Sub-Adviser provides investment and related advisory services to, the Affiliated Funds. When applicable, the Fund’s investments in Affiliated Funds are included in the Statement of Investments. Shares of Affiliated Funds are valued at their net asset value per share. As a shareholder, the Fund is subject to its proportional share of the Affiliated Funds’ expenses, including their management fee. The Manager will waive fees and/or reimburse Fund expenses in an amount equal to the indirect management fees incurred through the Fund’s investment in the Affiliated Funds.
Each of the Affiliated Funds in which the Fund invests has its own investment risks, and those risks can affect the value of the Fund’s investments and therefore the value of the Fund’s shares. To the extent that the Fund invests more of its assets in one Affiliated Fund than in another, the Fund will have greater exposure to the risks of that Affiliated Fund.
Investment in Oppenheimer Institutional Money Market Fund. The Fund is permitted to invest daily available cash balances in a money market Affiliated Fund. The Fund may invest the available cash in Class E shares of Oppenheimer Institutional Money Market Fund (“IMMF”) to seek current income while preserving liquidity or for defensive purposes. IMMF is regulated as a money market fund under the Investment Company Act of 1940, as amended.
33 OPPENHEIMER MID CAP VALUE FUND
NOTES TO FINANCIAL STATEMENTS Continued
4. Investments and Risks (Continued)
Master Limited Partnerships (“MLPs”). MLPs issue common units that represent an equity ownership interest in a partnership and provide limited voting rights. MLP common units are registered with the Securities and Exchange Commission (“SEC”), and are freely tradable on securities exchanges such as the NYSE and the NASDAQ Stock Market (“NASDAQ”), or in the over-the-counter (“OTC”) market. An MLP consists of one or more general partners, who conduct the business, and one or more limited partners, who contribute capital. MLP common unit holders have a limited role in the partnership’s operations and management. The Fund, as a limited partner, normally would not be liable for the debts of the MLP beyond the amounts the Fund has contributed, but would not be shielded to the same extent that a shareholder of a corporation would be. In certain circumstances creditors of an MLP would have the right to seek return of capital distributed to a limited partner. This right of an MLP’s creditors would continue after the Fund sold its investment in the MLP.
Equity Security Risk. Stocks and other equity securities fluctuate in price. The value of the Fund’s portfolio may be affected by changes in the equity markets generally. Equity markets may experience significant short-term volatility and may fall sharply at times. Different markets may behave differently from each other and U.S. equity markets may move in the opposite direction from one or more foreign stock markets. Adverse events in any part of the equity or fixed-income markets may have unexpected negative effects on other market segments.
The prices of individual equity securities generally do not all move in the same direction at the same time and a variety of factors can affect the price of a particular company’s securities. These factors may include, but are not limited to, poor earnings reports, a loss of customers, litigation against the company, general unfavorable performance of the company’s sector or industry, or changes in government regulations affecting the company or its industry.
5. Market Risk Factors
The Fund’s investments in securities and/or financial derivatives may expose the fund to various market risk factors:
Commodity Risk. Commodity risk relates to the change in value of commodities or commodity indexes as they relate to increases or decreases in the commodities market. Commodities are physical assets that have tangible properties. Examples of these types of assets are crude oil, heating oil, metals, livestock, and agricultural products.
Credit Risk. Credit risk relates to the ability of the issuer of debt to meet interest and principal payments, or both, as they come due. In general, lower-grade, higher-yield debt securities are subject to credit risk to a greater extent than lower-yield, higher-quality securities.
Equity Risk. Equity risk relates to the change in value of equity securities as they relate to increases or decreases in the general market.
34 OPPENHEIMER MID CAP VALUE FUND
5. Market Risk Factors (Continued)
Foreign Exchange Rate Risk. Foreign exchange rate risk relates to the change in the U.S. dollar value of a security held that is denominated in a foreign currency. The U.S. dollar value of a foreign currency denominated security will decrease as the dollar appreciates against the currency, while the U.S. dollar value will increase as the dollar depreciates against the currency.
Interest Rate Risk. Interest rate risk refers to the fluctuations in value of fixed-income securities resulting from the inverse relationship between price and yield. For example, an increase in general interest rates will tend to reduce the market value of already issued fixed-income investments, and a decline in general interest rates will tend to increase their value. In addition, debt securities with longer maturities, which tend to have higher yields, are subject to potentially greater fluctuations in value from changes in interest rates than obligations with shorter maturities.
Volatility Risk. Volatility risk refers to the magnitude of the movement, but not the direction of the movement, in a financial instrument’s price over a defined time period. Large increases or decreases in a financial instrument’s price over a relative time period typically indicate greater volatility risk, while small increases or decreases in its price typically indicate lower volatility risk.
6. Shares of Beneficial Interest
The Fund has authorized an unlimited number of $0.01 par value shares of beneficial interest of each class. Transactions in shares of beneficial interest were as follows:
| | | | | | | | | | | | | | | | | | |
| | | Year Ended October 30, 20151 | | | Year Ended October 31, 2014 | | | |
| | | Shares | | | Amount | | | Shares | | | Amount | | | |
|
Class A | | | | | | | | | | | | | | | | | | |
Sold | | | 2,255,940 | | | $ | 109,086,400 | | | | 3,187,950 | | | $ | 143,191,106 | | | |
Dividends and/or distributions reinvested | | | 101,546 | | | | 4,867,198 | | | | 288,729 | | | | 12,740,510 | | | |
Redeemed | | | (5,170,323) | | | | (250,775,783 | ) | | | (7,114,378 | ) | | | (319,038,487 | ) | | |
| | | |
Net decrease | | | (2,812,837 | ) | | $ | (136,822,185 | ) | | | (3,637,699 | ) | | $ | (163,106,871) | | | |
| | | |
|
|
Class B | | | | | | | | | | | | | | | | | | |
Sold | | | 17,119 | | | $ | 701,094 | | | | 39,064 | | | $ | 1,458,869 | | | |
Dividends and/or distributions reinvested | | | — | | | | — | | | | 981 | | | | 37,819 | | | |
Redeemed | | | (427,628) | | | | (17,388,616 | ) | | | (465,030 | ) | | | (17,698,185 | ) | | |
| | | |
Net decrease | | | (410,509 | ) | | $ | (16,687,522 | ) | | | (424,985 | ) | | $ | (16,201,497) | | | |
| | | |
35 OPPENHEIMER MID CAP VALUE FUND
|
| NOTES TO FINANCIAL STATEMENTS Continued |
6. Shares of Beneficial Interest (Continued)
| | | | | | | | | | | | | | | | | | |
| | | Year Ended October 30, 20151 | | | Year Ended October 31, 2014 | | | |
| | | Shares | | | Amount | | | Shares | | | Amount | | | |
|
Class C | | | | | | | | | | | | | | | | | | |
Sold | | | 739,635 | | | $ | 30,223,895 | | | | 854,974 | | | $ | 32,350,377 | | | |
Dividends and/or distributions reinvested | | | — | | | | — | | | | 15,096 | | | | 563,782 | | | |
Redeemed | | | (1,355,102 | ) | | | (55,085,400 | ) | | | (1,477,278 | ) | | | (55,969,072 | ) | | |
| | | |
Net decrease | | | (615,467 | ) | | $ | (24,861,505 | ) | | | (607,208 | ) | | $ | (23,054,913 | ) | | |
| | | |
|
|
Class I | | | | | | | | | | | | | | | | | | |
Sold | | | 9,008 | | | $ | 434,194 | | | | 8,445 | | | $ | 388,877 | | | |
Dividends and/or distributions reinvested | | | 114 | | | | 5,524 | | | | 55 | | | | 2,519 | | | |
Redeemed | | | (1,407 | ) | | | (69,688 | ) | | | (1,704 | ) | | | (77,361 | ) | | |
| | | |
Net increase | | | 7,715 | | | $ | 370,030 | | | | 6,796 | | | $ | 314,035 | | | |
| | | |
|
|
Class R2 | | | | | | | | | | | | | | | | | | |
Sold | | | 377,495 | | | $ | 17,567,746 | | | | 567,378 | | | $ | 24,430,423 | | | |
Dividends and/or distributions reinvested | | | 5,671 | | | | 262,387 | | | | 19,770 | | | | 841,931 | | | |
Redeemed | | | (986,856 | ) | | | (45,965,513 | ) | | | (973,378 | ) | | | (42,031,416 | ) | | |
| | | |
Net decrease | | | (603,690 | ) | | $ | (28,135,380 | ) | | | (386,230 | ) | | $ | (16,759,062 | ) | | |
| | | |
|
|
Class Y | | | | | | | | | | | | | | | | | | |
Sold | | | 282,520 | | | $ | 13,973,036 | | | | 503,843 | | | $ | 23,790,106 | | | |
Dividends and/or distributions reinvested | | | 6,385 | | | | 312,843 | | | | 16,712 | | | | 757,570 | | | |
Redeemed | | | (305,180 | ) | | | (15,261,365 | ) | | | (601,561 | ) | | | (28,548,900 | ) | | |
| | | |
Net decrease | | | (16,275 | ) | | $ | (975,486 | ) | | | (81,006 | ) | | $ | (4,001,224 | ) | | |
| | | |
1. October 30, 2015 represents the last business day of the Fund’s reporting period. See Note 2.
2. Effective July 1, 2014, Class N shares were renamed Class R. See Note 1.
7. Purchases and Sales of Securities
The aggregate cost of purchases and proceeds from sales of securities, other than short-term obligations and investments in IMMF, for the reporting period were as follows:
| | | | | | | | |
| | | Purchases | | | Sales | |
| |
Investment securities | | | $726,045,556 | | | | $916,614,527 | |
8. Fees and Other Transactions with Affiliates
Management Fees. Under the investment advisory agreement, the Fund pays the Manager a management fee based on the daily net assets of the Fund at an annual rate as shown in the following table:
36 OPPENHEIMER MID CAP VALUE FUND
8. Fees and Other Transactions with Affiliates (Continued)
| | | | | |
| Fee Schedule | | |
Up to $400 million | | | | 0.80 | % |
Next $400 million | | | | 0.75 | |
Next $1.2 billion | | | | 0.60 | |
Next $4.0 billion | | | | 0.58 | |
Over $6.0 billion | | | | 0.56 | |
The Fund’s effective management fee for the reporting period was 0.69% of average annual net assets before any applicable waivers.
Sub-Adviser Fees. The Manager has retained the Sub-Adviser to provide the day-to-day portfolio management of the Fund. Under the Sub-Advisory Agreement, the Manager pays the Sub-Adviser an annual fee in monthly installments, equal to a percentage of the investment management fee collected by the Manager from the Fund, which shall be calculated after any investment management fee waivers. The fee paid to the Sub-Adviser is paid by the Manager, not by the Fund.
Transfer Agent Fees. OFI Global (the “Transfer Agent”) serves as the transfer and shareholder servicing agent for the Fund. The Fund pays the Transfer Agent a fee based on annual net assets. Fees incurred and average net assets for each class with respect to these services are detailed in the Statement of Operations and Financial Highlights, respectively.
Sub-Transfer Agent Fees. The Transfer Agent has retained Shareholder Services, Inc., a wholly-owned subsidiary of OFI (the “Sub-Transfer Agent”), to provide the day-to-day transfer agent and shareholder servicing of the Fund. Under the Sub-Transfer Agency Agreement, the Transfer Agent pays the Sub-Transfer Agent an annual fee in monthly installments, equal to a percentage of the transfer agent fee collected by the Transfer Agent from the Fund, which shall be calculated after any applicable fee waivers. The fee paid to the Sub-Transfer Agent is paid by the Transfer Agent, not by the Fund.
Trustees’ Compensation. The Fund has adopted an unfunded retirement plan (the “Plan”) for the Fund’s Independent Trustees. Benefits are based on years of service and fees paid to each Trustee during their period of service. The Plan was frozen with respect to adding new participants effective December 31, 2006 (the “Freeze Date”) and existing Plan Participants as of the Freeze Date will continue to receive accrued benefits under the Plan. Active Independent Trustees as of the Freeze Date have each elected a distribution method with respect to their benefits under the Plan. During the reporting period, the Fund’s projected benefit obligations, payments to retired Trustees and accumulated liability were as follows:
| | | | |
Projected Benefit Obligations Increased | | $ | 8,797 | |
Payments Made to Retired Trustees | | | 62,027 | |
Accumulated Liability as of October 30, 2015 | | | 310,163 | |
The Fund’s Board of Trustees (“Board”) has adopted a compensation deferral plan for Independent Trustees that enables Trustees to elect to defer receipt of all or a portion of the
37 OPPENHEIMER MID CAP VALUE FUND
|
| NOTES TO FINANCIAL STATEMENTS Continued |
8. Fees and Other Transactions with Affiliates (Continued)
annual compensation they are entitled to receive from the Fund. For purposes of determining the amount owed to the Trustee under the plan, deferred amounts are treated as though equal dollar amounts had been invested in shares of the Fund or in other Oppenheimer funds selected by the Trustee. The Fund purchases shares of the funds selected for deferral by the Trustee in amounts equal to his or her deemed investment, resulting in a Fund asset equal to the deferred compensation liability. Such assets are included as a component of “Other” within the asset section of the Statement of Assets and Liabilities. Deferral of Trustees’ fees under the plan will not affect the net assets of the Fund and will not materially affect the Fund’s assets, liabilities or net investment income per share. Amounts will be deferred until distributed in accordance with the compensation deferral plan.
Distribution and Service Plan (12b-1) Fees. Under its General Distributor’s Agreement with the Fund, OppenheimerFunds Distributor, Inc. (the “Distributor”) acts as the Fund’s principal underwriter in the continuous public offering of the Fund’s classes of shares.
Distribution and Service Plan for Class A Shares. The Fund has adopted a Distribution and Service Plan (the “Plan”) for Class A shares pursuant to Rule 12b-1 under the 1940 Act. Under the Plan, the Fund pays a service fee to the Distributor at an annual rate of 0.25% of the daily net assets of Class A shares. The Distributor currently uses all of those fees to pay dealers, brokers, banks and other financial institutions periodically for providing personal services and maintenance of accounts of their customers that hold Class A shares. Under the Plan, the Fund may also pay an asset-based sales charge to the Distributor. However, the Fund’s Board has currently set the rate at zero. Fees incurred by the Fund under the Plan are detailed in the Statement of Operations.
Distribution and Service Plans for Class B, Class C and Class R Shares. The Fund has adopted Distribution and Service Plans (the “Plans”) for Class B, Class C and Class R shares pursuant to Rule 12b-1 under the 1940 Act to compensate the Distributor for distributing those share classes, maintaining accounts and providing shareholder services. Under the Plans, the Fund pays the Distributor an annual asset-based sales charge of 0.75% on Class B and Class C shares’ daily net assets and 0.25% on Class R shares’ daily net assets. The Fund also pays a service fee under the Plans at an annual rate of 0.25% of daily net assets. The Plans continue in effect from year to year only if the Fund’s Board of Trustees votes annually to approve their continuance at an in person meeting called for that purpose. Fees incurred by the Fund under the Plans are detailed in the Statement of Operations.
Sales Charges. Front-end sales charges and CDSC do not represent expenses of the Fund. They are deducted from the proceeds of sales of Fund shares prior to investment or from redemption proceeds prior to remittance, as applicable. The sales charges retained by the Distributor from the sale of shares and the CDSC retained by the Distributor on the redemption of shares is shown in the following table for the period indicated.
38 OPPENHEIMER MID CAP VALUE FUND
8. Fees and Other Transactions with Affiliates (Continued)
| | | | | | | | | | | | | | | | | | | | |
| Year Ended | | Class A Front-End Sales Charges
Retained by
Distributor | | | Class A Contingent Deferred Sales
Charges Retained by
Distributor | | | Class B Contingent Deferred Sales
Charges Retained by
Distributor | | | Class C Contingent Deferred Sales
Charges Retained by
Distributor | | | Class R Contingent Deferred Sales
Charges Retained by
Distributor | |
October 30, 2015 | | | $51,562 | | | | $715 | | | | $26,954 | | | | $11,666 | | | | $1,139 | |
Waivers and Reimbursements of Expenses. The Manager will waive fees and/or reimburse Fund expenses in an amount equal to the indirect management fees incurred through the Fund’s investment in IMMF. During the reporting period, the Manager waived fees and/or reimbursed the Fund $13,143 for IMMF management fees.
Waivers and/or reimbursements may be modified or terminated as set forth according to the terms in the prospectus.
9. Borrowings and Other Financing
Joint Credit Facility. A number of mutual funds managed by the Manager participate in a $1.28 billion revolving credit facility (the “Facility”) intended to provide short-term financing, if necessary, subject to certain restrictions in connection with atypical redemption activity.
Expenses and fees related to the Facility are paid by the participating funds and are disclosed separately or as other expenses on the Statement of Operations. The Fund did not utilize the Facility during the reporting period.
10. Pending Litigation
In 2009, several putative class action lawsuits were filed and later consolidated before the U.S. District Court for the District of Colorado against OppenheimerFunds, Inc. (“OFI”), OppenheimerFunds Distributor, Inc. (“OFDI”), and Oppenheimer Rochester California Municipal Fund, a fund advised by OFI Global Asset Management, Inc. and distributed by the Distributor (the “California Fund”), in connection with the California Fund’s investment performance. The plaintiffs asserted claims against OFI, OFDI and certain present and former trustees and officers of the California Fund under the federal securities laws, alleging, among other things, that the disclosure documents of the California Fund contained misrepresentations and omissions and the investment policies of the California Fund were not followed. Plaintiffs in the suit filed an amended complaint and defendants filed a motion to dismiss. In 2011, the court issued an order which granted in part and denied in part the defendants’ motion to dismiss. In 2012, plaintiffs filed a motion, which defendants opposed, to certify a class and appoint class representatives and class counsel. In March 2015, the court granted plaintiffs’ motion for class certification. In May 2015, the U.S. Court of Appeals for the Tenth Circuit vacated the class certification order and remanded the matter to the district court for further proceedings. In July 2015, the district court held an evidentiary hearing on plaintiffs’ motion for class certification. In October 2015, the district court reaffirmed its order granting plaintiffs’ motion for class certification. Defendants have filed a petition before the U.S. Court of Appeals for the Tenth Circuit for permission to appeal that order.
39 OPPENHEIMER MID CAP VALUE FUND
|
| NOTES TO FINANCIAL STATEMENTS Continued |
10. Pending Litigation (Continued)
OFI and OFDI believe the suit is without merit; that it is premature to render any opinion as to the likelihood of an outcome unfavorable to them in the suit; and that no estimate can yet be made as to the amount or range of any potential loss. Furthermore, OFI believes that the suit should not impair the ability of OFI or OFDI to perform their respective duties to the Fund and that the outcome of the suit should not have any material effect on the operations of any of the Oppenheimer funds.
40 OPPENHEIMER MID CAP VALUE FUND
REPORT OF INDEPENDENT REGISTERED PUBLIC ACCOUNTING FIRM
The Board of Trustees and Shareholders of Oppenheimer Quest for Value Funds:
We have audited the accompanying statement of assets and liabilities of Oppenheimer Mid Cap Value Fund (a series of Oppenheimer Quest for Value Funds), formerly Oppenheimer Small- & Mid- Cap Value Fund, including the statement of investments, as of October 30, 2015, and the related statement of operations for the year then ended, the statements of changes in net assets for each of the years in the two-year period then ended, and the financial highlights for each of the years or periods in the five-year period then ended. These financial statements and financial highlights are the responsibility of the Fund’s management. Our responsibility is to express an opinion on these financial statements and financial highlights based on our audits.
We conducted our audits in accordance with the standards of the Public Company Accounting Oversight Board (United States). Those standards require that we plan and perform the audit to obtain reasonable assurance about whether the financial statements and financial highlights are free of material misstatement. An audit includes examining, on a test basis, evidence supporting the amounts and disclosures in the financial statements. Our procedures included confirmation of securities owned as of October 30, 2015, by correspondence with the custodian, transfer agent and brokers, or by other appropriate auditing procedures where replies from brokers were not received. An audit also includes assessing the accounting principles used and significant estimates made by management, as well as evaluating the overall financial statement presentation. We believe that our audits provide a reasonable basis for our opinion.
In our opinion, the financial statements and financial highlights referred to above present fairly, in all material respects, the financial position of Oppenheimer Mid Cap Value Fund as of October 30, 2015, the results of its operations for the year then ended, the changes in its net assets for each of the years in the two-year period then ended, and the financial highlights for each of the years or periods in the five-year period then ended, in conformity with U.S. generally accepted accounting principles.
KPMG LLP
Denver, Colorado
December 22, 2015
41 OPPENHEIMER MID CAP VALUE FUND
FEDERAL INCOME TAX INFORMATION Unaudited
In early 2015, if applicable, shareholders of record received information regarding all dividends and distributions paid to them by the Fund during calendar year 2014.
Dividends, if any, paid by the Fund during the reporting period which are not designated as capital gain distributions should be multiplied by the maximum amount allowable but not less than 100% to arrive at the amount eligible for the corporate dividend-received deduction.
A portion, if any, of the dividends paid by the Fund during the reporting period which are not designated as capital gain distributions are eligible for lower individual income tax rates to the extent that the Fund has received qualified dividend income as stipulated by recent tax legislation. The maximum amount allowable but not less than $22,629,448 of the Fund’s fiscal year taxable income may be eligible for the lower individual income tax rates. In early 2015, shareholders of record received information regarding the percentage of distributions that are eligible for lower individual income tax rates.
Recent tax legislation allows a regulated investment company to designate distributions not designated as capital gain distributions, as either interest related dividends or short-term capital gain dividends, both of which are exempt from the U.S. withholding tax applicable to non U.S. taxpayers. For the reporting period, the maximum amount allowable but not less than $13,793 of the ordinary distributions to be paid by the Fund qualifies as an interest related dividend.
The foregoing information is presented to assist shareholders in reporting distributions received from the Fund to the Internal Revenue Service. Because of the complexity of the federal regulations which may affect your individual tax return and the many variations in state and local tax regulations, we recommend that you consult your tax advisor for specific guidance.
42 OPPENHEIMER MID CAP VALUE FUND
BOARD APPROVAL OF THE FUND’S INVESTMENT ADVISORY AND SUB-ADVISORY AGREEMENTS Unaudited
The Fund has entered into an investment advisory agreement with OFI Global Asset Management, Inc. (“OFI Global” or the “Adviser”), a wholly-owned subsidiary of OppenheimerFunds, Inc. (“OFI” or the “Sub-Adviser”) (“OFI Global” and “OFI” together the “Managers”) and OFI Global has entered into a sub-advisory agreement with OFI whereby OFI provides investment sub-advisory services to the Fund (collectively, the “Agreements”). Each year, the Board of Trustees (the “Board”), including a majority of the independent Trustees, is required to determine whether to approve the terms of the Agreements and the renewal thereof. The Investment Company Act of 1940, as amended, requires that the Board request and evaluate, and that the Managers provide, such information as may be reasonably necessary to evaluate the terms of the Agreements. The Board employs an independent consultant to prepare a report that provides information, including comparative information that the Board requests for that purpose. In addition to in-person meetings focused on this evaluation, the Board receives information throughout the year regarding Fund services, fees, expenses and performance.
The Adviser, Sub-Adviser and the independent consultant provided information to the Board on the following factors: (i) the nature, quality and extent of the Managers’ services, (ii) the comparative investment performance of the Fund and the Managers, (iii) the fees and expenses of the Fund, including comparative fee and expense information, (iv) the profitability of the Managers and their affiliates, including an analysis of the cost of providing services, (v) whether economies of scale are realized as the Fund grows and whether fee levels reflect these economies of scale for Fund investors and (vi) other benefits to the Managers from their relationship with the Fund. The Board was aware that there are alternatives to retaining the Managers.
Outlined below is a summary of the principal information considered by the Board as well as the Board’s conclusions.
Nature, Quality and Extent of Services. The Board considered information about the nature, quality and extent of the services provided to the Fund and information regarding the Managers’ key personnel who provide such services. The Managers’ duties include providing the Fund with the services of the portfolio managers and the Sub-Adviser’s investment team, who provide research, analysis and other advisory services in regard to the Fund’s investments; and securities trading services. OFI Global is responsible for oversight of third-party service providers; monitoring compliance with applicable Fund policies and procedures and adherence to the Fund’s investment restrictions; risk management; and oversight of the Sub-Adviser. OFI Global is also responsible for providing certain administrative services to the Fund as well. Those services include providing and supervising all administrative and clerical personnel who are necessary in order to provide effective corporate administration for the Fund; compiling and maintaining records with respect to the Fund’s operations; preparing and filing reports required by the U.S. Securities and Exchange Commission; preparing periodic reports regarding the operations of the Fund for its shareholders; preparing proxy materials for shareholder meetings; and preparing the registration statements required by federal and state securities laws for the sale of the Fund’s shares. OFI Global also provides the Fund with office space, facilities and equipment.
The Board also considered the quality of the services provided and the quality of the Managers’ resources that are available to the Fund. The Board took account of the fact that
43 OPPENHEIMER MID CAP VALUE FUND
|
| BOARD APPROVAL OF THE FUND’S INVESTMENT ADVISORY AND SUB-ADVISORY AGREEMENTS Unaudited / Continued |
the Sub-Adviser has had over fifty years of experience as an investment adviser and that its assets under management rank it among the top mutual fund managers in the United States. The Board evaluated the Managers’ advisory, administrative, accounting, legal, compliance services and risk management, and information the Board has received regarding the experience and professional qualifications of the Managers’ key personnel and the size and functions of its staff. In its evaluation of the quality of the portfolio management services provided, the Board considered the experience of Laton Spahr and Eric Hewitt, the portfolio managers for the Fund, and the Sub-Adviser’s investment team and analysts. The Board members also considered the totality of their experiences with the Managers as directors or trustees of the Fund and other funds advised by the Managers. The Board considered information regarding the quality of services provided by affiliates of the Managers, which the Board members have become knowledgeable about through their experiences with the Managers and in connection with the renewal of the Fund’s service agreements. The Board concluded, in light of the Managers’ experience, reputation, personnel, operations and resources that the Fund benefits from the services provided under the Agreements.
Investment Performance of the Managers and the Fund. Throughout the year, the Managers provided information on the investment performance of the Fund, the Adviser and the Sub-Adviser, including comparative performance information. The Board also reviewed information, prepared by the Managers and by the independent consultant, comparing the Fund’s historical performance to relevant benchmarks or market indices and to the performance of other retail funds in the mid-cap value category. The Board noted that the Fund’s one-year performance was better than its category median although its three-year, five-year and ten-year performance was below its category median.
Fees and Expenses of the Fund. The Board reviewed the fees paid to the Adviser and the other expenses borne by the Fund. The independent consultant provided comparative data in regard to the fees and expenses of the Fund and other retail front-end load mid-cap value funds with comparable asset levels and distribution features. The Board noted that the Fund’s contractual management fees and total expenses were lower than its peer group median and category median.
Economies of Scale and Profits Realized by the Managers. The Board considered information regarding the Managers’ costs in serving as the Fund’s investment adviser and sub-adviser, including the costs associated with the personnel and systems necessary to manage the Fund, and information regarding the Managers’ profitability from their relationship with the Fund. The Board also considered that the Managers must be able to pay and retain experienced professional personnel at competitive rates to provide quality services to the Fund. The Board reviewed whether the Managers may realize economies of scale in managing and supporting the Fund. The Board noted that the Fund currently has management fee breakpoints, which are intended to share with Fund shareholders economies of scale that may exist as the Fund’s assets grow.
Other Benefits to the Managers. In addition to considering the profits realized by the Managers, the Board considered information that was provided regarding the direct and indirect benefits the Managers receive as a result of their relationship with the Fund, including compensation paid to the Managers’ affiliates and research provided to the Adviser in connection with permissible brokerage arrangements (soft dollar arrangements).
44 OPPENHEIMER MID CAP VALUE FUND
Conclusions. These factors were also considered by the independent Trustees meeting separately from the full Board, assisted by experienced counsel to the Fund and to the independent Trustees. Fund counsel and the independent Trustees’ counsel are independent of the Managers within the meaning and intent of the Securities and Exchange Commission Rules.
Based on its review of the information it received and its evaluations described above, the Board, including a majority of the independent Trustees, decided to continue the Agreements through September 30, 2016. In arriving at its decision, the Board did not identify any factor or factors as being more important than others, but considered all of the above information, and considered the terms and conditions of the Agreements, including the management fees, in light of all the surrounding circumstances.
45 OPPENHEIMER MID CAP VALUE FUND
PORTFOLIO PROXY VOTING POLICIES AND PROCEDURES;
UPDATES TO STATEMENTS OF INVESTMENTS Unaudited
The Fund has adopted Portfolio Proxy Voting Policies and Procedures under which the Fund votes proxies relating to securities (“portfolio proxies”) held by the Fund. A description of the Fund’s Portfolio Proxy Voting Policies and Procedures is available (i) without charge, upon request, by calling the Fund toll-free at 1.800.CALL OPP (225.5677), (ii) on the Fund’s website at www.oppenheimerfunds.com, and (iii) on the SEC’s website at www.sec.gov. In addition, the Fund is required to file Form N-PX, with its complete proxy voting record for the 12 months ended June 30th, no later than August 31st of each year. The Fund’s voting record is available (i) without charge, upon request, by calling the Fund toll-free at 1.800.CALL OPP (225.5677), and (ii) in the Form N-PX filing on the SEC’s website at www.sec.gov.
The Fund files its complete schedule of portfolio holdings with the SEC for the first quarter and the third quarter of each fiscal year on Form N-Q. The Fund’s Form N-Q filings are available on the SEC’s website at www.sec.gov. Those forms may be reviewed and copied at the SEC’s Public Reference Room in Washington, D.C. Information on the operation of the Public Reference Room may be obtained by calling 1-800-SEC-0330.
Householding—Delivery of Shareholder Documents
This is to inform you about OppenheimerFunds’ “householding” policy. If more than one member of your household maintains an account in a particular fund, OppenheimerFunds will mail only one copy of the fund’s prospectus (or, if available, the fund’s summary prospectus), annual and semiannual report and privacy policy. The consolidation of these mailings, called householding, benefits your fund through reduced mailing expense, and benefits you by reducing the volume of mail you receive from OppenheimerFunds. Householding does not affect the delivery of your account statements.
Please note that we will continue to household these mailings for as long as you remain an OppenheimerFunds shareholder, unless you request otherwise. If you prefer to receive multiple copies of these materials, please call us at 1.800.CALL-OPP (225-5677). You may also notify us in writing or via email. We will begin sending you individual copies of the prospectus (or, if available, the summary prospectus), reports and privacy policy within 30 days of receiving your request to stop householding.
46 OPPENHEIMER MID CAP VALUE FUND
TRUSTEES AND OFFICERS Unaudited
| | |
Name, Position(s) Held with
the Fund, Length of Service,
Year of Birth | | Principal Occupation(s) During the Past 5 Years; Other Trusteeships/Directorships Held; Number of Portfolios in the Fund Complex Currently Overseen |
| |
| INDEPENDENT TRUSTEES | | The address of each Trustee in the chart below is 6803 S. Tucson Way, Centennial, Colorado 80112-3924. Each Trustee serves for an indefinite term, or until his or her resignation, retirement, death or removal. |
| |
Brian F. Wruble, Chairman of the Board of Trustees (since 2009), Trustee (since 2001) Year of Birth: 1943 | | Director and Vice Chairman of Community Foundation of the Florida Keys (non-profit) (since July 2012); Trustee of the Board of Trustees, The Jackson Laboratory (non-profit) (1991-2011 and since May 2014); Chairman Emeritus (since August 2011) of The Jackson Laboratory (non-profit); Director of Special Value Opportunities Fund, LLC (registered investment company) (affiliate of the Sub-Adviser’s parent company) (since September 2004); Member of Zurich Insurance Group’s Investment Management Advisory Council (insurance) (since 2004); Treasurer (since 2007) and Trustee of the Institute for Advanced Study (non-profit educational institute) (since May 1992); General Partner of Odyssey Partners, L.P. (hedge fund) (September 1995-December 2007); Special Limited Partner of Odyssey Investment Partners, LLC (private equity investment) (January 1999- September 2004). Oversees 52 portfolios in the OppenheimerFunds complex. Mr. Wruble has served on the Boards of certain Oppenheimer funds since April 2001, during which time he has become familiar with the Fund’s (and other Oppenheimer funds’) financial, accounting, regulatory and investment matters and has contributed to the Boards’ deliberations. |
| |
David K. Downes, Trustee (since 2005) Year of Birth: 1940 | | Director of THL Credit Inc. (since June 2009); Chief Executive Officer and Board Member of Community Capital Management (investment management company) (since January 2004); President of The Community Reinvestment Act Qualified Investment Fund (investment management company) (since 2004); Director of Actua Corporation (information technology company) (since October 2003); formerly, Independent Chairman GSK Employee Benefit Trust (April 2006-June2013); Director of Correctnet (January 2006-2007); Independent Chairman of the Board of Trustees of Quaker Investment Trust (registered investment company) (2004-2007); Chief Operating Officer and Chief Financial Officer of Lincoln National Investment Companies, Inc. (subsidiary of Lincoln National Corporation, a publicly traded company) and Delaware Investments U.S., Inc. (investment management subsidiary of Lincoln National Corporation) (1993-2003); President, Chief Executive Officer and Trustee of Delaware Investment Family of Funds (1993-2003); President and Board Member of Lincoln National Convertible Securities Funds, Inc. and the Lincoln National Income Funds, TDC (1993-2003); Chairman and Chief Executive Officer of Retirement Financial Services, Inc. (registered transfer agent and investment adviser and subsidiary of Delaware Investments U.S., Inc.) (1993-2003); President and Chief Executive Officer of Delaware Service Company, Inc. (1995-2003); Chief Administrative Officer, Chief Financial Officer, Vice Chairman and Director of Equitable Capital Management Corporation (investment subsidiary of Equitable Life Assurance Society) (1985-1992); Corporate Controller of Merrill Lynch Company (financial services holding company) (1977-1985); held the following positions at the Colonial Penn Group, Inc. (insurance company): Corporate Budget Director (1974-1977), Assistant Treasurer (1972-1974) and Director of Corporate Taxes (1969- |
47 OPPENHEIMER MID CAP VALUE FUND
|
| TRUSTEES AND OFFICERS Unaudited / Continued |
| | |
David K. Downes, Continued | | 1972); held the following positions at Price Waterhouse Company (financial services firm): Tax Manager (1967-1969), Tax Senior (1965-1967) and Staff Accountant (1963-1965); United States Marine Corps (1957-1959). Oversees 52 portfolios in the OppenheimerFunds complex. Mr. Downes has served on the Boards of certain Oppenheimer funds since December 2005, during which time he has become familiar with the Fund’s (and other Oppenheimer funds’) financial, accounting, regulatory and investment matters and has contributed to the Boards’ deliberations. |
| |
Matthew P. Fink, Trustee (since 2009) Year of Birth: 1941 | | Trustee of the Committee for Economic Development (policy research foundation) (2005-2011); Director of ICI Education Foundation (education foundation) (October 1991-August 2006); President of the Investment Company Institute (trade association) (October 1991-June 2004); Director of ICI Mutual Insurance Company (insurance company) (October 1991-June 2004); Author of The Rise of Mutual Funds: An Insider’s View published by Oxford University Press (second edition 2010). Oversees 52 portfolios in the OppenheimerFunds complex. Mr. Fink has served on the Boards of certain Oppenheimer funds since January 2005, during which time he has become familiar with the Fund’s (and other Oppenheimer funds’) financial, accounting, regulatory and investment matters and has contributed to the Boards’ deliberations. |
| |
Edmund P. Giambastiani, Jr., Trustee (since 2013) Year of Birth: 1948 | | Advisory Board Member of the Maxwell School of Citizenship and Public Affairs of Syracuse University (since April 2012); Director of Mercury Defense Systems Inc. (information technology) (August 2011-February 2013); Trustee of the U.S. Naval Academy Foundation (since November 2010); Advisory Board Member of the Massachusetts Institute of Technology Lincoln Laboratory (federally-funded research development center) (since May 2010); Director of The Boeing Company (aerospace and defense) (since October 2009); Trustee of MITRE Corporation (federally- funded research development center) (since September 2008); Independent Director of QinetiQ Group Plc (defense technology and security) (February 2008-August 2011); Director of Monster Worldwide, Inc. (on-line career services) (since January 2008, Lead Director since June 2011); Chairman of Alenia North America, Inc. (military and defense products) (January 2008- October 2009); Director of SRA International, Inc. (information technology and services) (January 2008-July 2011); President of Giambastiani Group LLC (national security and energy consulting) (since October 2007); United States Navy, career nuclear submarine officer (June 1970-October 2007), Vice Chairman of the Joint Chiefs of Staff (2005-October 2007), NATO Supreme Allied Commander Transformation (2003-2005), Commander, U.S. Joint Forces Command (2002-2005). Since his retirement from the U.S. Navy in October 2007, Admiral Giambastiani has also served on numerous U.S. Government advisory boards, investigations and task forces for the Secretaries of Defense, State and Interior and the Central Intelligence Agency. Oversees 52 portfolios in the OppenheimerFunds complex. Admiral Giambastiani has served on the Boards of certain Oppenheimer funds since February 2013, including as an Advisory Board Member for certain Oppenheimer funds, during which time he has become familiar with the Fund’s (and other Oppenheimer funds’) financial, accounting, regulatory and investment matters and has contributed to the Boards’ deliberations. For purposes of this report, Admiral Giambastiani is identified as a Trustee. |
48 OPPENHEIMER MID CAP VALUE FUND
| | |
Elizabeth Krentzman, Trustee (since 2014) Year of Birth: 1959 | | Advisory Board Member of the Securities and Exchange Commission Historical Society (since 2007); held the following positions at Deloitte & Touche LLP: Principal and Chief Regulatory Advisor for Asset Management Services (2007 - 2014) and U.S. Mutual Fund Leader (2011 - 2014); General Counsel of the Investment Company Institute (trade association) (June 2004 - April 2007); held the following positions at Deloitte & Touche LLP: National Director of the Investment Management Regulatory Consulting Practice (1997 - 2004), Principal (2003 - 2004), Director (1998 - 2003) and Senior Manager (1997 - 1998); Assistant Director of the Division of Investment Management – Office of Disclosure and Investment Adviser Regulation (1996 - 1997) and various positions with the Division of Investment Management – Office of Regulatory Policy (1991 - 1996) of the U.S. Securities and Exchange Commission; Associate at Ropes & Gray (1987 - 1991); former Chair of the Investment Management Subcommittee of the Washington, D.C. Bar. Oversees 52 portfolios in the OppenheimerFunds complex. Ms. Krentzman has served on the Boards of certain Oppenheimer funds since August 2014, during which time she has become familiar with the Fund’s (and other Oppenheimer funds’) financial, accounting, regulatory and investment matters and has contributed to the Boards’ deliberations. |
| |
Mary F. Miller, Trustee (since 2009) Year of Birth: 1942 | | Trustee of International House (not-for-profit) (since June 2007); Trustee of the American Symphony Orchestra (not-for-profit) (October 1998-November 2011); and Senior Vice President and General Auditor of American Express Company (financial services company) (July 1998-February 2003). Oversees 52 portfolios in the OppenheimerFunds complex. Ms. Miller has served on the Boards of certain Oppenheimer funds since August 2004, during which time she has become familiar with the Fund’s (and other Oppenheimer funds’) financial, accounting, regulatory and investment matters and has contributed to the Boards’ deliberations. |
| |
Joel W. Motley, Trustee (since 2009) Year of Birth: 1952 | | Member of the Vestry of Trinity Wall Street (since April 2012); Director of Southern Africa Legal Services Foundation (since March 2012); Board Member of Pulitzer Center for Crisis Reporting (non-profit journalism) (since December 2010); Managing Director of Public Capital Advisors, LLC (privately-held financial advisor) (since January 2006); Managing Director of Carmona Motley, Inc. (privately-held financial advisor) (since January 2002); Director of Columbia Equity Financial Corp. (privately-held financial advisor) (2002-2007); Managing Director of Carmona Motley Hoffman Inc. (privately-held financial advisor) (January 1998-December 2001); Member of the Finance and Budget Committee of the Council on Foreign Relations, Member of the Investment Committee and Board of Human Rights Watch and Member of the Investment Committee and Board of Historic Hudson Valley. Oversees 52 portfolios in the OppenheimerFunds complex. Mr. Motley has served on the Boards of certain Oppenheimer funds since October 2002, during which time he has become familiar with the Fund’s (and other Oppenheimer funds’) financial, accounting, regulatory and investment matters and has contributed to the Boards’ deliberations. |
| |
Joanne Pace, Trustee (since 2012) Year of Birth: 1958 | | Board Director of Horizon Blue Cross Blue Shield of New Jersey (since November 2012); Advisory Board Director of The Alberleen Group LLC (since March 2012); Advisory Board Director of The Agile Trading Group LLC (since March 2012); Advisory Council Member of 100 Women in Hedge Funds (non-profit) (since December 2012); Advisory Council Member of |
49 OPPENHEIMER MID CAP VALUE FUND
|
| TRUSTEES AND OFFICERS Unaudited / Continued |
| | |
Joanne Pace, Continued | | Morgan Stanley Children’s Hospital (non-profit) (since May 2012); Board Director of The Komera Project (non-profit) (since April 2012); New York Advisory Board Director of Peace First (non-profit) (since March 2010); Senior Advisor of SECOR Asset Management, LP (2010-2011); Managing Director and Chief Operating Officer of Morgan Stanley Investment Management (2006-2010); Partner and Chief Operating Officer of FrontPoint Partners, LLC (hedge fund) (2005-2006); held the following positions at Credit Suisse: Managing Director (2003-2005); Global Head of Human Resources and member of Executive Board and Operating Committee (2004-2005), Global Head of Operations and Product Control (2003-2004); held the following positions at Morgan Stanley: Managing Director (1997-2003), Controller and Principal Accounting Officer (1999- 2003); Chief Financial Officer (temporary assignment) for the Oversight Committee, Long Term Capital Management (1998-1999). Lead Independent Director and Chair of the Audit and Nominating Committee of The Global Chartist Fund, LLC of Oppenheimer Asset Management (2011- 2012); Board Director of Managed Funds Association (2008-2010); Board Director of Morgan Stanley Foundation (2007-2010) and Investment Committee Chair (2008-2010). Oversees 52 portfolios in the OppenheimerFunds complex. Ms. Pace has served on the Boards of certain Oppenheimer funds since November 2012, including as an Advisory Board Member for certain Oppenheimer funds, during which time she has become familiar with the Fund’s (and other Oppenheimer funds’) financial, accounting, regulatory and investment matters and has contributed to the Board’s deliberations. For purposes of this report, Ms. Pace is identified as a Trustee. |
| |
Daniel Vandivort, Trustee (since 2014) Year of Birth: 1954 | | Chairman and Lead Independent Director/Trustee (March 2010-September 2014), Chairman of the Audit Committee (March 2009-September 2014) and Director/Trustee (December 2008-September 2014) of the Board of Directors/Trustees of Value Line Funds; Trustee, Board of Trustees of Huntington Disease Foundation of America (June 2007-December 2013): Trustee, Board of Trustees, RIM Retirement Savings Plan (2005-2007); President and Chief Investment Officer, Robeco Investment Management, formerly known as Weiss Peck and Greer (January 2005-June 2007); Member, Management Committee of Robeco Investment Management (2001-2007); Chairman and Trustee of the Board of Trustees of Weiss, Peck and Greer Funds (2004-2005); Managing Director and Head of Fixed Income, Weiss, Peck and Greer (November 1994-January 2005); Managing Director and Head of Fixed Income, CS First Boston Investment Management (January 1992-November 1994); Director, Global Product Development, First Boston Asset Management (November 1989-January 1992); Vice President, Fixed Income Sales, First Boston Corp. (May 1984- November 1989). Oversees 52 portfolios in the OppenheimerFunds complex. Mr. Vandivort has served on the Boards of certain Oppenheimer funds since 2014, during which time he has become familiar with the Fund’s (and other Oppenheimer funds’) financial, accounting, regulatory and investment matters and has contributed to the Boards’ deliberations. |
50 OPPENHEIMER MID CAP VALUE FUND
| | |
| INTERESTED TRUSTEES | | Mr. Glavin is an “Interested Trustee” because he is affiliated with the Manager and the Sub-Adviser by virtue of his positions as director of the Sub-Adviser, and as a shareholder of the Sub-Adviser’s parent company. As a Trustee, he serves for an indefinite term, or until his resignation, retirement, death or removal. Mr. Glavin’s address is 225 Liberty Street, New York, New York 10281-1008. Mr. Steinmetz is an “Interested Trustee” because he is affiliated with the Manager and the Sub-Adviser by virtue of his positions as Chairman of the Sub-Adviser and officer and director of the Manager. Both as a Trustee and as an officer, Mr. Steinmetz serves for an indefinite term, or until his resignation, retirement, death or removal. Mr. Steinmetz’s address is 225 Liberty Street, New York, New York 10281-1008. |
| |
William F. Glavin, Jr., Trustee (since 2009) Year of Birth: 1958 | | Chairman of the Sub-Adviser (since July 2014 and December 2009- December 2012) and Director of the Sub-Adviser (since January 2009); Chairman, Director and Chief Executive Officer (January 2013-June 2014) of the Manager; President of the Manager (January 2013-May 2013); Chief Executive Officer (January 2009-December 2012); President of the Sub- Adviser (May 2009-December 2012); Management Director (June 2009- June 2014), President (December 2009-June 2014) and Chief Executive Officer (January 2011-June 2014) of Oppenheimer Acquisition Corp. (“OAC”) (the Sub-Adviser’s parent holding company); Director of Oppenheimer Real Asset Management, Inc. (March 2010-June 2014); Executive Vice President (March 2006-February 2009) and Chief Operating Officer (July 2007-February 2009) of Massachusetts Mutual Life Insurance Company (OAC’s parent company); Director (May 2004-March 2006) and Chief Operating Officer and Chief Compliance Officer (May 2004-January 2005), President (January 2005-March 2006) and Chief Executive Officer (June 2005-March 2006) of Babson Capital Management LLC; Director (March 2005-March 2006), President (May 2003-March 2006) and Chief Compliance Officer (July 2005-March 2006) of Babson Capital Securities, Inc. (a broker-dealer); President (May 2003-March 2006) of Babson Investment Company, Inc.; Director (May 2004-August 2006) of Babson Capital Europe Limited; Director (May 2004-October 2006) of Babson Capital Guernsey Limited; Director (May 2004-March 2006) of Babson Capital Management LLC; Non-Executive Director (March 2005-March 2007) of Baring Asset Management Limited; Director (February 2005-June 2006) Baring Pension Trustees Limited; Director and Treasurer (December 2003-November 2006) of Charter Oak Capital Management, Inc.; Director (May 2006-September 2006) of C.M. Benefit Insurance Company; Director (May 2008-June 2009) and Executive Vice President (June 2007-July 2009) of C.M. Life Insurance Company; President (March 2006-May 2007) of MassMutual Assignment Company; Director (January 2005-December 2006), Deputy Chairman (March 2005-December 2006) and President (February 2005-March 2005) of MassMutual Holdings (Bermuda) Limited; Director (May 2008-June 2009) and Executive Vice President (June 2007- July 2009) of MML Bay State Life Insurance Company; Chief Executive Officer and President (April 2007-January 2009) of MML Distributors, LLC; and Chairman (March 2006-December 2008) and Chief Executive Officer (May 2007-December 2008) of MML Investors Services, Inc. An officer of 91 portfolios in the OppenheimerFunds complex. Mr. Glavin has served on the Boards of certain Oppenheimer funds since December 2009, during which |
51 OPPENHEIMER MID CAP VALUE FUND
|
| TRUSTEES AND OFFICERS Unaudited / Continued |
| | |
William F. Glavin, Jr., Continued | | time he has become familiar with the Fund’s (and other Oppenheimer funds’) financial, accounting, regulatory and investment matters and has contributed to the Boards’ deliberations. |
| |
Arthur P. Steinmetz, Trustee (since 2015), President and Principal Executive Officer (since 2014) Year of Birth: 1958 | | Chairman of the Sub-Adviser (since January 2015); CEO and Chairman of the Manager (since July 2014), President of the Manager (since May 2013), a Director of the Manager (since January 2013), Director of the Sub-Adviser (since July 2014), President, Management Director and CEO of Oppenheimer Acquisition Corp. (the Sub-Adviser’s parent holding company) (since July 2014), and President and Director of OFI SteelPath, Inc. (since January 2013). Chief Investment Officer of the OppenheimerFunds advisory entities from (January 2013-December 2013); Executive Vice President of the Manager (January 2013-May 2013); Chief Investment Officer of the Sub-Adviser (October 2010-December 2012); Chief Investment Officer, Fixed-Income, of the Sub-Adviser (April 2009-October 2010); Executive Vice President of the Sub-Adviser (October 2009-December 2012); Director of Fixed Income of the Sub-Adviser (January 2009-April 2009); and a Senior Vice President of the Sub-Adviser (March 1993-September 2009). An officer of 91 portfolios in the OppenheimerFunds complex. |
|
|
| |
| OTHER OFFICERS OF THE FUND | | The addresses of the Officers in the chart below are as follows: for Mr. Gabinet, Mss. Sexton and Picciotto, 225 Liberty Street, New York, New York 10281-1008, for Messrs. Spahr, Hewitt and Wixted, 6803 S. Tucson Way, Centennial, Colorado 80112-3924. Each Officer serves for an indefinite term or until his or her resignation, retirement, death or removal. |
| |
Laton Spahr, Vice President (since 2013) Year of Birth: 1975 | | Senior Vice President of the Sub-Adviser (since March 2013). Senior portfolio manager (2003-2013) and equity analyst (2001-2002) for Columbia Management Investment Advisers, LLC. A portfolio manager and an officer of other portfolios in the OppenheimerFunds complex. |
| |
Eric Hewitt, Vice President (since 2013) Year of Birth: 1971 | | Vice President of the Sub-Adviser (since March 2013). Customer portfolio manager and product manager for Columbia Management Investment Advisors, LLC (2012-2013). Senior Equity Analyst with Diamondback/Harbor Watch Capital Management, LLC (2009–2012) and a Senior Equity Analyst and Portfolio Manager with AllianceBernstein LP (1999–2009). A portfolio manager and an officer in the OppenheimerFunds complex. |
| |
Arthur S. Gabinet, Secretary and Chief Legal Officer (since 2011) Year of Birth: 1958 | | Executive Vice President, Secretary and General Counsel of the Manager (since January 2013); General Counsel OFI SteelPath, Inc. (since January 2013); Executive Vice President (May 2010-December 2012) and General Counsel (since January 2011) of the Sub-Adviser; General Counsel of the Distributor (since January 2011); General Counsel of Centennial Asset Management Corporation (January 2011-December 2012); Executive Vice President (January 2011-December 2012) and General Counsel of HarbourView Asset Management Corporation (since January 2011); Assistant Secretary (since January 2011) and Director (since January 2011) of OppenheimerFunds International Ltd. and OppenheimerFunds plc; Director of Oppenheimer Real Asset Management, Inc. (January 2011- December 2012) and General Counsel (since January 2011); Executive Vice President (January 2011-December 2011) and General Counsel of Shareholder Financial Services, Inc. and Shareholder Services, Inc. (since |
52 OPPENHEIMER MID CAP VALUE FUND
| | |
Arthur S. Gabinet, Continued | | January 2011); Executive Vice President (January 2011-December 2012) and General Counsel of OFI Private Investments Inc. (since January 2011); Vice President of OppenheimerFunds Legacy Program (January 2011- December 2011); Executive Vice President (January 2011-December 2012) and General Counsel of OFI Institutional Asset Management, Inc. (since January 2011); General Counsel, Asset Management of the Sub-Adviser (May 2010-December 2010); Principal, The Vanguard Group (November 2005-April 2010); District Administrator, U.S. Securities and Exchange Commission (January 2003-October 2005). An officer of 91 portfolios in the OppenheimerFunds complex. |
| |
Jennifer Sexton, Vice President and Chief Business Officer (since 2014) Year of Birth: 1969 | | Senior Vice President of OppenheimerFunds Distributor, Inc. (since June 2014); Vice President of OppenheimerFunds Distributor, Inc. (April 2006- June 2014); Vice President of the Sub-Adviser (January 1998-March 2006); Assistant Vice President of the Sub-Adviser (October 1991-December 1998). An officer of 91 portfolios in the OppenheimerFunds complex. |
| |
Mary Ann Picciotto, Chief Compliance Officer and Chief Anti-Money Laundering Officer (since 2014) Year of Birth: 1973 | | Senior Vice President and Chief Compliance Officer of the Manager (since March 2014); Chief Compliance Officer of the Sub-Adviser, OFI SteelPath, Inc., OFI Global Trust Company, OFI Global Institutional, Inc., Oppenheimer Real Asset Management, Inc., OFI Private Investments, Inc., Harborview Asset Management Corporation, Trinity Investment Management Corporation, and Shareholder Services, Inc. (since March 2014); Managing Director of Morgan Stanley Investment Management Inc. and certain of its various affiliated entities; Chief Compliance Officer of various Morgan Stanley Funds (May 2010-January 2014); Chief Compliance Officer of Morgan Stanley Investment Management Inc. (April 2007-January 2014). An officer of 91 portfolios in the OppenheimerFunds complex. |
| |
Brian W. Wixted, Treasurer and Principal Financial & Accounting Officer (since 1999) Year of Birth: 1959 | | Senior Vice President of the Manager (since January 2013); Treasurer of the Sub-Adviser, HarbourView Asset Management Corporation, Shareholder Financial Services, Inc., Shareholder Services, Inc., and Oppenheimer Real Asset Management, Inc. (March 1999-June 2008), OFI Private Investments, Inc. (March 2000-June 2008), OppenheimerFunds International Ltd. and OppenheimerFunds plc (since May 2000), OFI Institutional Asset Management, Inc. (November 2000-June 2008), and OppenheimerFunds Legacy Program (charitable trust program established by the Sub-Adviser) (June 2003-December 2011); Treasurer and Chief Financial Officer of OFI Trust Company (since May 2000); Assistant Treasurer of Oppenheimer Acquisition Corporation (March 1999-June 2008). An officer of 91 portfolios in the OppenheimerFunds complex. |
The Fund’s Statement of Additional Information contains additional information about the Fund’s Trustees and Officers and is available without charge upon request, by calling 1.800.CALL OPP (225.5677).
53 OPPENHEIMER MID CAP VALUE FUND
OPPENHEIMER MID CAP VALUE FUND
| | |
Manager | | OFI Global Asset Management, Inc. |
| |
Sub-Adviser | | OppenheimerFunds, Inc. |
| |
Distributor | | OppenheimerFunds Distributor, Inc. |
| |
Transfer and Shareholder | | OFI Global Asset Management, Inc. |
Servicing Agent | | |
| |
Sub-Transfer Agent | | Shareholder Services, Inc. |
| | DBA OppenheimerFunds Services |
| |
Independent Registered | | KPMG LLP |
Public Accounting Firm | | |
| |
Legal Counsel | | Kramer Levin Naftalis & Frankel LLP |
© 2015 OppenheimerFunds, Inc. All rights reserved.
54 OPPENHEIMER MID CAP VALUE FUND
PRIVACY POLICY NOTICE
As an Oppenheimer fund shareholder, you are entitled to know how we protect your personal information and how we limit its disclosure.
Information Sources
We obtain nonpublic personal information about our shareholders from the following sources:
| ● | | Applications or other forms |
| ● | | When you create a user ID and password for online account access |
| ● | | When you enroll in eDocs Direct, our electronic document delivery service |
| ● | | Your transactions with us, our affiliates or others |
| ● | | A software program on our website, often referred to as a “cookie,” which indicates which parts of our site you’ve visited |
| ● | | When you set up challenge questions to reset your password online |
If you visit oppenheimerfunds.com and do not log on to the secure account information areas, we do not obtain any personal information about you. When you do log on to a secure area, we do obtain your user ID and password to identify you. We also use this information to provide you with products and services you have requested, to inform you about products and services that you may be interested in and assist you in other ways.
We do not collect personal information through our website unless you willingly provide it to us, either directly by email or in those areas of the website that request information. In order to update your personal information (including your mailing address, email address and phone number) you must first log on and visit your user profile.
If you have set your browser to warn you before accepting cookies, you will receive the warning message with each cookie. You can refuse cookies by turning them off in your browser. However, doing so may limit your access to certain sections of our website.
We use cookies to help us improve and manage our website. For example, cookies help us recognize new versus repeat visitors to the site, track the pages visited, and enable some special features on the website. This data helps us provide a better service for our website visitors.
Protection of Information
We do not disclose any non-public personal information (such as names on a customer list) about current or former customers to anyone, except as permitted by law.
Disclosure of Information
Copies of confirmations, account statements and other documents reporting activity in your fund accounts are made available to your financial advisor (as designated by you). We may also use details about you and your investments to help us, our financial service affiliates, or firms that jointly market their financial products and services with ours, to better serve your investment needs or suggest financial services or educational material that may be of interest to you. If this requires us to provide you with an opportunity to “opt in” or “opt out” of such information sharing with a firm not affiliated with us, you will receive notification on how to do so, before any such sharing takes place.
Right of Refusal
We will not disclose your personal information to unaffiliated third parties (except as permitted by law), unless we first offer you a reasonable opportunity to refuse or “opt out” of such disclosure.
55 OPPENHEIMER MID CAP VALUE FUND
|
| PRIVACY POLICY NOTICE Continued |
Internet Security and Encryption
In general, the email services provided by our website are encrypted and provide a secure and private means of communication with us. To protect your own privacy, confidential and/or personal information should only be communicated via email when you are advised that you are using a secure website. As a security measure, we do not include personal or account information in non-secure emails, and we advise you not to send such information to us in non-secure emails. Instead, you may take advantage of the secure features of our website to encrypt your email correspondence. To do this, you will need to use a browser that supports Secure Sockets Layer (SSL) protocol.
We do not guarantee or warrant that any part of our website, including files available for download, are free of viruses or other harmful code. It is your responsibility to take appropriate precautions, such as use of an anti-virus software package, to protect your computer hardware and software.
| ● | | All transactions, including redemptions, exchanges and purchases, are secured by SSL and 256-bit encryption. SSL is used to establish a secure connection between your PC and OppenheimerFunds’ server. It transmits information in an encrypted and scrambled format. |
| ● | | Encryption is achieved through an electronic scrambling technology that uses a “key” to code and then decode the data. Encryption acts like the cable converter box you may have on your television set. It scrambles data with a secret code so that no one can make sense of it while it is being transmitted. When the data reaches its destination, the same software unscrambles the data. |
| ● | | You can exit the secure area by either closing your browser, or for added security, you can use the Log Out button before you close your browser. |
Other Security Measures
We maintain physical, electronic and procedural safeguards to protect your personal account information. Our employees and agents have access to that information only so that they may offer you products or provide services, for example, when responding to your account questions.
How You Can Help
You can also do your part to keep your account information private and to prevent unauthorized transactions. If you obtain a user ID and password for your account, do not allow it to be used by anyone else. Also, take special precautions when accessing your account on a computer used by others.
Who We Are
This joint notice describes the privacy policies of the Oppenheimer funds, OppenheimerFunds, Inc., each of its investment adviser subsidiaries, OppenheimerFunds Distributor, Inc. and OFI Global Trust Co. It applies to all Oppenheimer fund accounts you presently have, or may open in the future, using your Social Security number—whether or not you remain a shareholder of our funds. This notice was last updated March 2015. In the event it is updated or changed, we will post an updated notice on our website at oppenheimerfunds.com. If you have any questions about this privacy policy, write to us at P.O. Box 5270, Denver, CO 80217-5270, email us by clicking on the Contact Us section of our website at oppenheimerfunds.com or call us at 1.800.CALL OPP (225.5677).
56 OPPENHEIMER MID CAP VALUE FUND
THIS PAGE INTENTIONALLY LEFT BLANK.
57 OPPENHEIMER MID CAP VALUE FUND
THIS PAGE INTENTIONALLY LEFT BLANK.
58 OPPENHEIMER MID CAP VALUE FUND
THIS PAGE INTENTIONALLY LEFT BLANK.
59 OPPENHEIMER MID CAP VALUE FUND
THIS PAGE INTENTIONALLY LEFT BLANK.
60 OPPENHEIMER MID CAP VALUE FUND
THIS PAGE INTENTIONALLY LEFT BLANK.
61 OPPENHEIMER MID CAP VALUE FUND
THIS PAGE INTENTIONALLY LEFT BLANK.
62 OPPENHEIMER MID CAP VALUE FUND
THIS PAGE INTENTIONALLY LEFT BLANK.
63 OPPENHEIMER MID CAP VALUE FUND
Item 2. Code of Ethics.
The registrant has adopted a code of ethics that applies to the registrant’s principal executive officer, principal financial officer, principal accounting officer or controller or persons performing similar functions.
Item 3. Audit Committee Financial Expert.
The Board of Trustees of the registrant has determined that David Downes, the Board’s Audit Committee Chairman, is an audit committee financial expert and that Mr. Downes is “independent” for purposes of this Item 3.
Item 4. Principal Accountant Fees and Services.
The principal accountant for the audit of the registrant’s annual financial statements billed $122,100 in fiscal 2015 and $92,400 in fiscal 2014.
The principal accountant for the audit of the registrant’s annual financial statements billed no such fees in fiscal 2015 and no such fees in fiscal 2014.
The principal accountant for the audit of the registrant’s annual financial statements billed $185,479 in fiscal 2015 and $1,042,959 in fiscal 2014 to the registrant’s investment adviser or any entity controlling, controlled by, or under common control with the adviser that provides ongoing services to the registrant.
Such services include: GIPS attestation procedures, system conversion testing, entity reorganization, and internal controls
The principal accountant for the audit of the registrant’s annual financial statements billed $67,856 in fiscal 2015 and $44,425 in fiscal 2014.
The principal accountant for the audit of the registrant’s annual financial statements billed $476,233 in fiscal 2015 and $467,462 in fiscal 2014 to the registrant’s investment adviser or any entity controlling, controlled by, or under common control with the adviser that provides ongoing services to the registrant.
Such services include: tax compliance, tax planning and tax advice. Tax compliance generally involves preparation of original and amended tax returns, claims for a refund and tax payment-planning services. Tax planning and tax advice includes assistance with tax audits and appeals, tax advice related to mergers and acquisitions and requests for rulings or technical advice from taxing authorities.
The principal accountant for the audit of the registrant’s annual financial statements billed no such fees in fiscal 2015 and no such fees in fiscal 2014.
The principal accountant for the audit of the registrant’s annual financial statements billed no such fees in fiscal 2015 and no such fees in fiscal 2014 to the registrant’s investment adviser or any entity controlling, controlled by, or under common control with the adviser that provides ongoing services to the registrant.
Such fees would include the cost to the principal accountant of attending audit committee meetings and consultations regarding the registrant’s retirement plan with respect to its Trustees.
| (e) | (1) During its regularly scheduled periodic meetings, the registrant’s audit committee will pre-approve all audit, audit-related, tax and other services to be provided by the principal accountants of the registrant. |
| | The audit committee has delegated pre-approval authority to its Chairman for any subsequent new engagements that arise between regularly scheduled meeting dates provided that any fees such pre-approved are presented to the audit committee at its next regularly scheduled meeting. |
| | Under applicable laws, pre-approval of non-audit services may be waived provided that: 1) the aggregate amount of all such services provided constitutes no more than five percent of the total amount of fees paid by the registrant to its principal accountant during the fiscal year in which services are provided 2) such services were not recognized by the registrant at the time of engagement as non-audit services and 3) such services are promptly brought to the attention of the audit committee of the registrant and approved prior to the completion of the audit. |
| (f) | Not applicable as less than 50%. |
| (g) | The principal accountant for the audit of the registrant’s annual financial statements billed $729,568 in fiscal 2015 and $1,554,846 in fiscal 2014 to the registrant and the registrant’s investment adviser or any entity controlling, controlled by, or under common control with the adviser that provides ongoing services to the registrant related to non-audit fees. Those billings did not include any prohibited non-audit services as defined by the Securities Exchange Act of 1934. |
| (h) | The registrant’s audit committee of the board of Trustees has considered whether the provision of non-audit services that were rendered to the registrant’s investment adviser, and any entity controlling, controlled by, or under common control with the investment adviser that provides ongoing services to the registrant that were not pre-approved pursuant to paragraph (c)(7)(ii) of Rule 2-01 of Regulation S-X is compatible with maintaining the principal accountant’s independence. No such services were rendered. |
Item 5. Audit Committee of Listed Registrants
Not applicable.
Item 6. Schedule of Investments.
a) Not applicable. The complete schedule of investments is included in Item 1 of this Form N-CSR.
b) Not applicable.
Item 7. Disclosure of Proxy Voting Policies and Procedures for Closed-End Management Investment Companies.
Not applicable.
Item 8. Portfolio Managers of Closed-End Management Investment Companies.
Not applicable.
Item 9. Purchases of Equity Securities by Closed-End Management Investment Company and Affiliated Purchasers.
Not applicable.
Item 10. Submission of Matters to a Vote of Security Holders.
The Fund’s Governance Committee Provisions with Respect to Nominations of Directors/Trustees to the Respective Boards
None
Item 11. Controls and Procedures.
Based on their evaluation of the registrant’s disclosure controls and procedures (as defined in rule 30a-3(c) under the Investment Company Act of 1940 (17 CFR 270.30a-3(c)) as of 10/30/2015, the registrant’s principal executive officer and principal financial officer found the registrant’s disclosure controls and procedures to provide reasonable assurances that information required to be disclosed by the registrant in the reports that it files under the Securities Exchange Act of 1934 (a) is accumulated and communicated to registrant’s management, including its principal executive officer and principal financial officer, to allow timely decisions regarding required disclosure, and (b) is recorded, processed, summarized and reported, within the time periods specified in the rules and forms adopted by the U.S. Securities and Exchange Commission.
There have been no changes in the registrant’s internal controls over financial reporting that occurred during the registrant’s second fiscal quarter of the period covered by this report that
have materially affected, or are reasonably likely to materially affect, the registrant’s internal control over financial reporting.
Item 12. Exhibits.
| (a) | (1) Exhibit attached hereto. |
| | (2) Exhibits attached hereto. |
| (b) | Exhibit attached hereto. |
SIGNATURES
Pursuant to the requirements of the Securities Exchange Act of 1934 and the Investment Company Act of 1940, the registrant has duly caused this report to be signed on its behalf by the undersigned, thereunto duly authorized.
Oppenheimer Quest for Value Funds
| | |
| By: | | /s/ Arthur P. Steinmetz |
| | Arthur P. Steinmetz |
| | Principal Executive Officer |
| Date: | | 12/9/2015 |
Pursuant to the requirements of the Securities Exchange Act of 1934 and the Investment Company Act of 1940, this report has been signed below by the following persons on behalf of the registrant and in the capacities and on the dates indicated.
| | |
| By: | | /s/ Arthur P. Steinmetz |
| | Arthur P. Steinmetz |
| | Principal Executive Officer |
| Date: | | 12/9/2015 |
| | |
| By: | | /s/ Brian W. Wixted |
| | Brian W. Wixted |
| | Principal Financial Officer |
| Date: | | 12/9/2015 |