UNITED STATES
SECURITIES AND EXCHANGE COMMISSION
WASHINGTON, D.C. 20549
FORM N-CSR
CERTIFIED SHAREHOLDER REPORT OF REGISTERED MANAGEMENT
INVESTMENT COMPANIES
Investment Company Act file number 811-5225
Oppenheimer Quest for Value Funds
(Exact name of registrant as specified in charter)
6803 South Tucson Way, Centennial, Colorado 80112-3924
(Address of principal executive offices) (Zip code)
Cynthia Lo Bessette
OFI Global Asset Management, Inc.
225 Liberty Street, New York, New York 10281-1008
(Name and address of agent for service)
Registrant’s telephone number, including area code: (303) 768-3200
Date of fiscal year end: October 31
Date of reporting period: 10/31/2017
Item 1. Reports to Stockholders.
Annual Report 10/31/2017 OppenheimerFunds® The Right Way to Invest Oppenheimer Global Allocation Fund
Table of Contents
Class A Shares
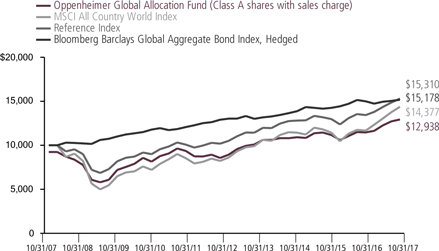
AVERAGE ANNUAL TOTAL RETURNS AT 10/31/17
| | | | | | | | | | | | |
| | | 1-Year | | | 5-Year | | | 10-Year | |
| | | |
Class A Shares of the Fund without Sales Charge | | | 12.84 | % | | | 7.69 | % | | | 3.22% | |
| | | |
Class A Shares of the Fund with Sales Charge | | | 6.35 | | | | 6.42 | | | | 2.61 | |
| | | |
MSCI All Country World Index | | | 23.20 | | | | 10.80 | | | | 3.70 | |
| | | |
Bloomberg Barclays Global Aggregate Bond Index, Hedged | | | 1.23 | | | | 3.10 | | | | 4.26 | |
| | | |
Reference Index | | | 13.96 | | | | 7.82 | | | | 4.35 | |
Performance data quoted represents past performance, which does not guarantee future results. The investment return and principal value of an investment in the Fund will fluctuate so that an investor’s shares, when redeemed, may be worth more or less than their original cost. Fund returns include changes in share price, reinvested distributions, and a 5.75% maximum applicable sales charge except where “without sales charge” is indicated. Current performance may be lower or higher than the performance quoted. Returns do not consider capital gains or income taxes on an individual’s investment. Returns for periods of less than one year are cumulative and not annualized. For performance data current to the most recent month-end, visit oppenheimerfunds.com or call 1.800.CALL OPP (225.5677). See Fund prospectuses and summary prospectuses for more information on share classes and sales charges.
2 OPPENHEIMER GLOBAL ALLOCATION FUND
Fund Performance Discussion
The Fund’s Class A shares (without sales charge) produced a return of 12.84% during the reporting period. The Fund underperformed its Reference Index (the “Reference Index”), a customized weighted index currently comprised of 60% of the MSCI All Country World Index and 40% of the Bloomberg Barclays Global Aggregate Bond Index, Hedged, which returned 13.96%.
MARKET OVERVIEW
Shortly after the reporting period began, markets turned to “risk-on” mode after the surprise election of Donald Trump. Equities climbed and U.S. Treasury yields rose to levels not experienced since 2014. The 10-year yield opened the reporting period on November 1, 2016 at 1.38% and ended 2016 at 2.44%.
Global economic data continued to improve during the reporting period. Business and consumer confidence are at cyclical highs in many countries. Monetary policy in the United
States tightened during the reporting period, with the Federal Reserve (the “Fed”) raising its benchmark interest rate in December 2016, March 2017 and June 2017, each time by one-quarter of 1 percentage point. The Fed also announced the beginning of its plan to passively reduce the size of its balance sheet in September 2017. While we do not expect this process to have meaningful impact on bond markets, we are more cautious on the potential for tax cuts and the upcoming appointment of a new Fed chair.
COMPARISON OF CHANGE IN VALUE OF $10,000 HYPOTHETICAL INVESTMENTS IN:
3 OPPENHEIMER GLOBAL ALLOCATION FUND
Against this backdrop, equity markets throughout the globe produced positive absolute returns. Emerging market equities outperformed other international and U.S. counterparts, with the MSCI Emerging Markets Index up 26.45% for the one-year ended October 31, 2017, the MSCI All Country World Index up 23.20%, and the S&P 500 Index up 23.63%. Year to date in 2017, U.S. Treasury rates fell overall from the close of 2016 and ended the reporting period at 2.38%. In this environment, the Bloomberg Barclays U.S. Aggregate Bond Index produced a muted return of 0.90% for the one-year ended October 31, 2017.
FUND REVIEW
With respect to asset allocation at the end of the reporting period, the portfolio was slightly overweight equity-focused strategies versus the Reference Index, with a preference for the international and emerging markets. This benefited performance during the reporting period. Our macroeconomic tools and research indicate positive global economic growth that is making a new cyclical high. The new peak is being driven by strong data in the western hemisphere, the continued expansion in Europe, and a recovery in emerging markets that continues to gain widespread traction. In our view, this macro backdrop has justified an overweight equity exposure in our portfolio and we believe it will continue to support this positioning in the near-term. In particular, we have a relative
value tilt to European equities, where the Euro area expansion looks to be holding firm, which is funded through an underweight to U.S. equities. In Europe, we see cheaper valuations by a number of metrics and with the election of Emmanuel Macron in France, political risk is receding. We continue to have a preference for emerging market equities given cheaper valuations and an economic cycle that is younger in comparison to the developed world.
During the period, the security selection component of the Fund’s investment process was a positive contributor to relative performance, driven mostly by outperformance across international equity strategies. In an effort to manage our style exposure, we exited out of our global developed equity strategy to reduce the portfolio’s underweight to the value factor. We completed this transition on the back of very strong stock selection from the global equity strategy. Our developed international core and international growth equity strategies were contributors during the period. The emerging market equity strategy had positive stock selection in the Consumer Discretionary sector.
On the credit side, we continue to see warning signs that we are in late cycle stages.Specifically, growing corporate leverage and the resulting tighter lending standards could increase credit market vulnerability. As a
4 OPPENHEIMER GLOBAL ALLOCATION FUND
result, we have no exposure to certain areas of the credit markets, particularly high yield bonds. We do have a preference for bank loans, where we see comparable spreads for less interest rate and energy sector risk. Our exposure to bank loans benefited performance during the reporting period. We also view the current business cycle as very extended, a fact that is reflected in the expensive valuations of several asset classes as well as the build-up of leverage in the corporate sector. In the credit cycle, corporate leverage typically follows a cyclical pattern that precedes changes in credit conditions by several quarters and is followed by a re-pricing of credit spreads. Today, the non-financial corporate credit cycle has reached cyclical highs, surpassing the 2008 peak and approaching the peaks of 1989 and 2000. All three of these episodes coincided with recessions.
We are neutral duration and we continue to see attractive income and total return opportunities in emerging markets local debt, given attractive real yields, stable inflation and cheap currency valuations in most high-yielding markets. During the period, our allocation to emerging markets local debt was a positive contributor to relative performance. This asset class did well during the period, outperforming other fixed income assets. We see value in this asset class in comparison to developed market bonds that have low or negative real yields. In addition, many
emerging markets have room to cut rates as inflation declines and we believe this will provide some capital appreciation.
The largest detractor from relative performance was our allocation to alternatives. We hold event-linked bonds because we believe they offer strong potential for diversified income. With the recent string of natural disasters—notably the earthquake in Mexico and Hurricanes Harvey and Irma—this market had been under considerable stress. However, damage estimates have dropped considerably from those initial fears after Irma veered west of Miami and weakened from its peak strength. During the period, we added exposure to Master Limited Partnerships (“MLPs”) because of their cheap valuations and attractive yields. Despite a move higher in energy prices, MLPs struggled during the period and did not outperform the Reference Index. In our view, we started to see the excess supply of oil start to normalize, which should provide some upside and stability to prices. We continue to be bullish on MLPs due to the attractive yield relative to other income sources.
One of our key market views at the turn of the year was that the U.S. dollar, though already significantly overvalued, would continue to appreciate in light of a shifting U.S. policy landscape. A united Republican Congress and presidency had increased the odds of fiscal stimulus which, coupled with monetary
5 OPPENHEIMER GLOBAL ALLOCATION FUND
tightening already underway, created the potential for meaningful fiscal and monetary policy divergence between the United States and other major developed countries. As we explained at the time, such a policy mix was likely to boost the greenback against other major currencies. Throughout the year, the U.S. dollar has fallen on a trade-weighted basis. This has been a headwind to our currency positioning and has been a detractor during the period.
With a few setbacks to the current administration’s agenda and tax reform still an open question, we have reduced our U.S. dollar long position to neutral and continue to express relative relative-value views in high-yielding emerging market currencies such as the Turkish lira, Russian ruble and Indian rupee versus their developed-market peers. We have also added long exposure to Japanese yen as a means of balancing risk in this strategy.
The Fund’s return shaping strategies, which are designed to improve our overall risk profile, detracted from performance during the reporting period. Under normal circumstances, we expect return shaping strategies to cost money, like any insurance premium, and commensurately enhance returns or partially protect principal in environments of extreme market volatility. These strategies are also often used as an efficient way to access upside market participation, especially when we are running lower levels of risk. During
the period, we utilized downside hedges to reduce tail risk and layer in some downside mitigation in the event we had a risk-off environment. In the absence of volatility during the period, the premium spent for downside hedges was a small detractor.
STRATEGY & OUTLOOK
Overall, we are slightly overweight equities and have a neutral duration posture relative to the Reference Index. We have modest return expectations given valuations in most asset classes and prefer relative value opportunities rather than large directional tilts in the portfolio. We see an accelerating growth picture abroad as a potential tailwind to risk assets in the near term. We do have a relative value preference for European and emerging market equities versus the U.S. equity market, where we see cheaper valuations and earlier stages of the business cycle. With that said, we have increased our equity exposure to an overweight relative to the Reference Index and continue to prefer diversified income sources with attractive real yields. We do see increasing vulnerabilities in credit markets with non-financial corporate leverage nearing previous cyclical peaks, which causes us to prefer bank loans to high yield corporate debt.
As always, we continue to closely monitor the developments in the credit cycle as well as the political and policy landscape to assess risks to the macro outlook and financial markets.
6 OPPENHEIMER GLOBAL ALLOCATION FUND
While some fundamental risks have increased, the current macro backdrop is quite favorable to risk assets in the near term and we don’t see a clear catalyst for increased volatility.
Should we see deterioration in economic data, or volatility spread to equities and credit, we stand ready to adapt to a changing environment.
| | | | | | | | | | |

| |  | | 
| |  |
| | Mark Hamilton Portfolio Manager | | | Benjamin Rockmuller, CFA Portfolio Manager |
| | | |

| |  | | 
| |  |
| | Alessio de Longis, CFA Portfolio Manager | | | Dokyoung Lee, CFA Portfolio Manager |
7 OPPENHEIMER GLOBAL ALLOCATION FUND
Top Holdings and Allocations
TOP TEN COMMON STOCK HOLDINGS
| | | | |
Apple, Inc. | | | 1.3% | |
Alphabet, Inc., Cl. C | | | 1.1 | |
SAP SE | | | 0.7 | |
Facebook, Inc., Cl. A | | | 0.7 | |
Alibaba Group Holding Ltd., Sponsored ADR | | | 0.7 | |
Citigroup, Inc. | | | 0.7 | |
Infineon Technologies AG | | | 0.6 | |
Comcast Corp., Cl. A | | | 0.6 | |
UnitedHealth Group, Inc. | | | 0.6 | |
Nippon Telegraph & Telephone Corp. | | | 0.5 | |
Portfolio holdings and allocations are subject to change. Percentages are as of October 31, 2017, and are based on net assets. For more current Fund holdings, please visit oppenheimerfunds. com.
TOP TEN COMMON STOCK INDUSTRIES
| | | | |
Internet Software & Services | | | 3.8% | |
Oil, Gas & Consumable Fuels | | | 3.5 | |
Commercial Banks | | | 3.2 | |
Semiconductors & Semiconductor Equipment | | | 2.6 | |
Capital Markets | | | 2.0 | |
Hotels, Restaurants & Leisure | | | 2.0 | |
Food Products | | | 1.9 | |
Insurance | | | 1.9 | |
Beverages | | | 1.8 | |
Software | | | 1.8 | |
Portfolio holdings and allocations are subject to change. Percentages are as of October 31, 2017, and are based on net assets.
PORTFOLIO ALLOCATION
| | | | |
| Common Stocks | | | 62.0% | |
| Investment Companies | | | | |
Oppenheimer Institutional Government Money Market Fund | | | 11.0 | |
Oppenheimer Master Event- Linked Bond Fund, LLC | | | 4.3 | |
Oppenheimer Master Loan Fund, LLC | | | 7.4 | |
Oppenheimer Senior Floating Rate Fund | | | 2.2 | |
PowerShares Senior Loan Portfolio Exchange Traded Fund | | | 4.8 | |
| Foreign Government Obligations | | | 4.8 | |
| U.S. Government Obligations | | | 3.3 | |
| Preferred Stocks | | | 0.1 | |
| Short-Term Notes | | | 0.1 | |
| Over-the-Counter Options Purchased | | | —* | |
| Rights, Warrants and Certificates | | | —* | |
| Non-Convertible Corporate Bonds and Notes | | | —* | |
* Represents a value of less than 0.05%.
Portfolio holdings and allocations are subject to change. Percentages are as of October 31, 2017, and are based on the total market value of investments.
8 OPPENHEIMER GLOBAL ALLOCATION FUND
TOP TEN GEOGRAPHICAL HOLDINGS
| | | | |
United States | | | 59.5% | |
Japan | | | 5.7 | |
France | | | 5.1 | |
United Kingdom | | | 3.8 | |
Germany | | | 3.0 | |
China | | | 2.8 | |
Switzerland | | | 2.5 | |
Canada | | | 1.9 | |
India | | | 1.4 | |
Netherlands | | | 1.3 | |
Portfolio holdings and allocation are subject to change. Percentages are as of October 31, 2017, and are based on total market value of investments.
REGIONAL ALLOCATION
| | | | |
U.S./Canada | | | 61.4% | |
Europe | | | 18.1 | |
Asia | | | 14.6 | |
Latin & South America | | | 2.9 | |
Emerging Europe | | | 1.8 | |
Middle East/Africa | | | 1.2 | |
Portfolio holdings and allocation are subject to change. Percentages are as of October 31, 2017, and are based on total market value of investments.
9 OPPENHEIMER GLOBAL ALLOCATION FUND
Share Class Performance
AVERAGE ANNUAL TOTAL RETURNS WITHOUT SALES CHARGE AS OF 10/31/17
| | | | | | | | | | |
| | | Inception
Date | | 1-Year | | 5-Year | | 10-Year | | |
Class A (QVGIX) | | 11/1/91 | | 12.84% | | 7.69% | | 3.22% | | |
Class B (QGRBX) | | 9/1/93 | | 11.95 | | 6.83 | | 2.72 | | |
Class C (QGRCX) | | 9/1/93 | | 11.99 | | 6.89 | | 2.47 | | |
Class I (QGRIX) | | 2/28/12 | | 13.33 | | 8.17 | | 6.97* | | |
Class R (QGRNX) | | 3/1/01 | | 12.55 | | 7.42 | | 2.97 | | |
Class Y (QGRYX) | | 5/1/00 | | 13.13 | | 7.99 | | 3.56 | | |
AVERAGE ANNUAL TOTAL RETURNS WITH SALES CHARGE AS OF 10/31/17
| | | | | | | | | | |
| | | Inception Date | | 1-Year | | 5-Year | | 10-Year | | |
Class A (QVGIX) | | 11/1/91 | | 6.35% | | 6.42% | | 2.61% | | |
Class B (QGRBX) | | 9/1/93 | | 6.95 | | 6.52 | | 2.72 | | |
Class C (QGRCX) | | 9/1/93 | | 10.99 | | 6.89 | | 2.47 | | |
Class I (QGRIX) | | 2/28/12 | | 13.33 | | 8.17 | | 6.97* | | |
Class R (QGRNX) | | 3/1/01 | | 12.55 | | 7.42 | | 2.97 | | |
Class Y (QGRYX) | | 5/1/00 | | 13.13 | | 7.99 | | 3.56 | | |
| | | | |
| * Shows performance since inception. | | | | | | | | |
Performance data quoted represents past performance, which does not guarantee future results. The investment return and principal value of an investment in the Fund will fluctuate so that an investor’s shares, when redeemed, may be worth more or less than their original cost. Current performance may be lower or higher than the performance quoted. For performance data current to the most recent month-end, visit oppenheimerfunds.com or call 1.800. CALL OPP (225.5677). Fund returns include changes in share price, reinvested distributions, and the applicable sales charge: for Class A shares, the current maximum initial sales charge of 5.75%; for Class B shares, the contingent deferred sales charge of 5% (1-year) and 2% (5-year); and for Class C shares, the contingent deferred sales charge (“CDSC”) of 1% for the 1-year period. There is no sales charge for Class I, Class R and Class Y shares. Because Class B shares convert to Class A shares 72 months after purchase, the 10-year return for Class B shares uses Class A performance for the period after conversion. Returns for periods of less than one year are cumulative and not annualized. See Fund prospectuses and summary prospectuses for more information on share classes and sales charges.
The Fund’s performance is compared to the performance of the MSCI All Country World Index, the S&P 500 Index, the Reference Index (60% MSCI All Country World Index / 40% Bloomberg Barclays Global Aggregate Bond Index, Hedged), and the Bloomberg Barclays Global Aggregate Bond Index, Hedged. The MSCI All Country World Index is a free float-adjusted market capitalization weighted index that is designed to measure the equity market performance of developed and emerging markets. The S&P 500 Index is a broad-based measure of domestic stock performance. The Bloomberg Barclays Global Aggregate Bond Index provides a broad-based measure of global investment grade fixed-rate debt markets.
10 OPPENHEIMER GLOBAL ALLOCATION FUND
The index is comprised of several other Bloomberg Barclays indexes that measure fixed income performance of regions around the world while hedging the currency back to the U.S. dollar. While index comparisons may be useful to provide a benchmark for the Fund’s performance, it must be noted that the Fund’s investments are not limited to the investments comprising the indices. Index performance includes reinvestment of income, but does not reflect transaction costs, fees, expenses or taxes. Index performance is shown for illustrative purposes only as a benchmark for the Fund’s performance, and does not predict or depict performance of the Fund. The Fund’s performance reflects the effects of the Fund’s business and operating expenses.
The Fund’s investment strategy and focus can change over time. The mention of specific fund holdings does not constitute a recommendation by OppenheimerFunds, Inc. or its affiliates.
Before investing in any of the Oppenheimer funds, investors should carefully consider a fund’s investment objectives, risks, charges and expenses. Fund prospectuses and summary prospectuses contain this and other information about the funds, and may be obtained by asking your financial advisor, visiting oppenheimerfunds.com, or calling 1.800.CALL OPP (225.5677). Read prospectuses and summary prospectuses carefully before investing.
Shares of Oppenheimer funds are not deposits or obligations of any bank, are not guaranteed by any bank, are not insured by the FDIC or any other agency, and involve investment risks, including the possible loss of the principal amount invested.
11 OPPENHEIMER GLOBAL ALLOCATION FUND
Fund Expenses
Fund Expenses. As a shareholder of the Fund, you incur two types of costs: (1) transaction costs, which may include sales charges (loads) on purchase payments and/or contingent deferred sales charges on redemptions; and (2) ongoing costs, including management fees; distribution and service fees; and other Fund expenses. These examples are intended to help you understand your ongoing costs (in dollars) of investing in the Fund and to compare these costs with the ongoing costs of investing in other mutual funds.
The examples are based on an investment of $1,000.00 invested at the beginning of the period and held for the entire 6-month period ended October 31, 2017.
Actual Expenses. The first section of the table provides information about actual account values and actual expenses. You may use the information in this section for the class of shares you hold, together with the amount you invested, to estimate the expense that you paid over the period. Simply divide your account value by $1,000.00 (for example, an $8,600.00 account value divided by $1,000.00 = 8.60), then multiply the result by the number in the first section under the heading entitled “Expenses Paid During 6 Months Ended October 31, 2017” to estimate the expenses you paid on your account during this period.
Hypothetical Example for Comparison Purposes. The second section of the table provides information about hypothetical account values and hypothetical expenses based on the Fund’s actual expense ratio for each class of shares, and an assumed rate of return of 5% per year for each class before expenses, which is not the Fund’s actual return. The hypothetical account values and expenses may not be used to estimate the actual ending account balance or expenses you paid for the period. You may use this information to compare the ongoing costs of investing in the Fund and other funds. To do so, compare this 5% hypothetical example for the class of shares you hold with the 5% hypothetical examples that appear in the shareholder reports of the other funds.
Please note that the expenses shown in the table are meant to highlight your ongoing costs only and do not reflect any transactional costs, such as front-end or contingent deferred sales charges (loads). Therefore, the “hypothetical” section of the table is useful in comparing ongoing costs only, and will not help you determine the relative total costs of owning different funds. In addition, if these transactional costs were included, your costs would have been higher.
12 OPPENHEIMER GLOBAL ALLOCATION FUND
| | | | | | | | | | | | | | | | | | | | | | | | |
| Actual | | Beginning Account Value May 1, 2017 | | | | | | Ending Account Value October 31, 2017 | | | Expenses Paid During 6 Months Ended
October 31, 2017 | |
Class A | | $ | 1,000.00 | | | | | | | $ | 1,055.20 | | | | | | | $ | 6.60 | | | | | |
Class B | | | 1,000.00 | | | | | | | | 1,051.20 | | | | | | | | 10.65 | | | | | |
Class C | | | 1,000.00 | | | | | | | | 1,051.20 | | | | | | | | 10.50 | | | | | |
Class I | | | 1,000.00 | | | | | | | | 1,057.40 | | | | | | | | 4.37 | | | | | |
Class R | | | 1,000.00 | | | | | | | | 1,053.90 | | | | | | | | 7.85 | | | | | |
Class Y | | | 1,000.00 | | | | | | | | 1,056.50 | | | | | | | | 5.30 | | | | | |
| | | | | | |
| Hypothetical | | | | | | | | | | | | | | | | | | | | | | | | |
(5% return before expenses) | | | | | | | | | | | | | | | | | | | | | | | | |
Class A | | | 1,000.00 | | | | | | | | 1,018.80 | | | | | | | | 6.48 | | | | | |
Class B | | | 1,000.00 | | | | | | | | 1,014.87 | | | | | | | | 10.46 | | | | | |
Class C | | | 1,000.00 | | | | | | | | 1,015.02 | | | | | | | | 10.31 | | | | | |
Class I | | | 1,000.00 | | | | | | | | 1,020.97 | | | | | | | | 4.29 | | | | | |
Class R | | | 1,000.00 | | | | | | | | 1,017.59 | | | | | | | | 7.71 | | | | | |
Class Y | | | 1,000.00 | | | | | | | | 1,020.06 | | | | | | | | 5.21 | | | | | |
Expenses are equal to the Fund’s annualized expense ratio for that class, multiplied by the average account value over the period, multiplied by 184/365 (to reflect the one-half year period). Those annualized expense ratios, excluding indirect expenses from affiliated funds, based on the 6-month period ended October 31, 2017 are as follows:
| | | | | | | | |
| Class | | Expense Ratios | | | | |
Class A | | | 1.27 | % | | | | |
Class B | | | 2.05 | | | | | |
Class C | | | 2.02 | | | | | |
Class I | | | 0.84 | | | | | |
Class R | | | 1.51 | | | | | |
Class Y | | | 1.02 | | | | | |
The expense ratios reflect voluntary and/or contractual waivers and/or reimbursements of expenses by the Fund’s Manager and Transfer Agent. Some of these undertakings may be modified or terminated at any time, as indicated in the Fund’s prospectus. The “Consolidated Financial Highlights” tables in the Fund’s financial statements, included in this report, also show the gross expense ratios, without such waivers or reimbursements and reduction to custodian expenses, if applicable.
13 OPPENHEIMER GLOBAL ALLOCATION FUND
CONSOLIDATED STATEMENT OF INVESTMENTS October 31, 2017
| | | | | | | | |
| | | Shares | | | Value | |
Common Stocks—61.6% | | | | | | | | |
Consumer Discretionary—9.8% | | | | | | | | |
Auto Components—1.4% | | | | | | | | |
Bridgestone Corp. | | | 101,600 | | | $ | 4,851,856 | |
Continental AG | | | 24,392 | | | | 6,191,234 | |
Delphi Automotive plc | | | 34,670 | | | | 3,445,505 | |
Koito Manufacturing Co. Ltd. | | | 41,000 | | | | 2,736,337 | |
Valeo SA | | | 81,727 | | | | 5,529,863 | |
| | | | | | | 22,754,795 | |
| | | | | | | | | |
Automobiles—0.6% | | | | | | | | |
Astra International Tbk PT | | | 1,435,000 | | | | 846,490 | |
Bayerische Motoren Werke AG | | | 17,542 | | | | 1,787,977 | |
Hero MotoCorp Ltd. | | | 57,543 | | | | 3,420,264 | |
Subaru Corp. | | | 62,500 | | | | 2,152,757 | |
Suzuki Motor Corp. | | | 37,200 | | | | 2,036,077 | |
| | | | | | | 10,243,565 | |
| | | | | | | | | |
Diversified Consumer Services—0.2% | | | | | | | | |
Dignity plc | | | 38,581 | | | | 1,241,949 | |
Estacio Participacoes SA | | | 53,800 | | | | 482,363 | |
New Oriental Education & Technology Group, Inc., Sponsored ADR | | | 9,220 | | | | 767,473 | |
| | | | | | | 2,491,785 | |
| | | | | | | | | |
Hotels, Restaurants & Leisure—2.0% | | | | | | | | |
Accor SA | | | 36,730 | | | | 1,833,250 | |
Carnival Corp. | | | 81,060 | | | | 5,381,573 | |
Cedar Fair LP1 | | | 16,418 | | | | 1,027,767 | |
China Lodging Group Ltd., Sponsored ADR2 | | | 15,548 | | | | 2,081,722 | |
Domino’s Pizza Group plc | | | 399,870 | | | | 1,783,850 | |
Galaxy Entertainment Group Ltd. | | | 323,000 | | | | 2,200,405 | |
Genting Bhd | | | 1,394,500 | | | | 2,981,118 | |
Genting Malaysia Bhd | | | 321,800 | | | | 382,349 | |
Jollibee Foods Corp. | | | 135,080 | | | | 651,538 | |
McDonald’s Corp. | | | 28,660 | | | | 4,783,641 | |
Sands China Ltd. | | | 900,800 | | | | 4,247,784 | |
Starbucks Corp. | | | 22,640 | | | | 1,241,578 | |
Whitbread plc | | | 28,301 | | | | 1,387,953 | |
Wyndham Worldwide Corp. | | | 7,960 | | | | 850,526 | |
Yum China Holdings, Inc.2 | | | 38,770 | | | | 1,564,369 | |
| | | | | | | 32,399,423 | |
| | | | | | | | | |
Household Durables—0.9% | | | | | | | | |
Newell Brands, Inc. | | | 11,460 | | | | 467,339 | |
SEB SA | | | 13,050 | | | | 2,432,754 | |
Sony Corp. | | | 160,300 | | | | 6,723,408 | |
Whirlpool Corp. | | | 26,690 | | | | 4,375,292 | |
| | | | | | | 13,998,793 | |
|
| 14 OPPENHEIMER GLOBAL ALLOCATION FUND |
| | | | | | | | |
| | | Shares | | | Value | |
Internet & Catalog Retail—0.5% | | | | | | | | |
Amazon.com, Inc.2 | | | 2,796 | | | $ | 3,090,363 | |
Ctrip.com International Ltd., ADR2 | | | 39,750 | | | | 1,903,627 | |
Priceline Group, Inc. (The)2 | | | 730 | | | | 1,395,731 | |
Rakuten, Inc. | | | 228,800 | | | | 2,435,422 | |
| | | | | | | 8,825,143 | |
| | | | | | | | | |
Leisure Products—0.3% | | | | | | | | |
Nintendo Co. Ltd. | | | 13,600 | | | | 5,296,918 | |
| | | | | | | | | |
Media—1.0% | | | | | | | | |
Comcast Corp., Cl. A | | | 257,014 | | | | 9,260,214 | |
DISH Network Corp., Cl. A2 | | | 11,880 | | | | 576,655 | |
ProSiebenSat.1 Media SE | | | 46,424 | | | | 1,619,355 | |
SES SA, Cl. A, FDR | | | 83,400 | | | | 1,356,372 | |
Technicolor SA | | | 264,210 | | | | 936,861 | |
Walt Disney Co. (The) | | | 6,840 | | | | 669,020 | |
Zee Entertainment Enterprises Ltd. | | | 209,371 | | | | 1,753,211 | |
| | | | | | | 16,171,688 | |
| | | | | | | | | |
Multiline Retail—0.2% | | | | | | | | |
Dollarama, Inc. | | | 25,902 | | | | 2,883,332 | |
Target Corp. | | | 17,660 | | | | 1,042,646 | |
| | | | | | | 3,925,978 | |
| | | | | | | | | |
Specialty Retail—1.2% | | | | | | | | |
AutoNation, Inc.2 | | | 30,200 | | | | 1,431,480 | |
AutoZone, Inc.2 | | | 7,820 | | | | 4,609,890 | |
Dufry AG2 | | | 15,316 | | | | 2,280,778 | |
Industria de Diseno Textil SA | | | 49,173 | | | | 1,838,070 | |
Lowe’s Cos., Inc. | | | 68,060 | | | | 5,441,397 | |
Nitori Holdings Co. Ltd. | | | 4,600 | | | | 666,124 | |
O’Reilly Automotive, Inc.2 | | | 6,240 | | | | 1,316,328 | |
Steinhoff International Holdings NV | | | 303,311 | | | | 1,319,610 | |
| | | | | | | 18,903,677 | |
| | | | | | | | | |
Textiles, Apparel & Luxury Goods—1.5% | | | | | | | | |
adidas AG | | | 5,261 | | | | 1,170,772 | |
Burberry Group plc | | | 21,688 | | | | 547,746 | |
Christian Dior SE | | | 4,810 | | | | 1,651,906 | |
Cie Financiere Richemont SA | | | 26,145 | | | | 2,413,251 | |
Hanesbrands, Inc. | | | 40,920 | | | | 920,700 | |
Hermes International | | | 4,771 | | | | 2,476,723 | |
Kering | | | 11,508 | | | | 5,276,613 | |
LVMH Moet Hennessy Louis Vuitton SE | | | 21,940 | | | | 6,547,795 | |
Pandora AS | | | 20,291 | | | | 1,918,209 | |
PRADA SpA | | | 367,500 | | | | 1,271,939 | |
Tapestry, Inc.2 | | | 16,390 | | | | 671,170 | |
| | | | | | | 24,866,824 | |
15 OPPENHEIMER GLOBAL ALLOCATION FUND
| | |
| CONSOLIDATED STATEMENT OF INVESTMENTS Continued | | |
| | | |
| | | | | | | | |
| | | Shares | | | Value | |
Consumer Staples—5.5% | | | | | | | | |
Beverages—1.8% | | | | | | | | |
Anadolu Efes Biracilik Ve Malt Sanayii AS | | | 87,304 | | | $ | 505,601 | |
Anheuser-Busch InBev SA/NV | | | 12,409 | | | | 1,521,190 | |
Coca-Cola Co. (The) | | | 20,690 | | | | 951,326 | |
Coca-Cola European Partners plc | | | 67,140 | | | | 2,743,340 | |
Constellation Brands, Inc., Cl. A | | | 4,820 | | | | 1,056,014 | |
Dr Pepper Snapple Group, Inc. | | | 10,220 | | | | 875,445 | |
Fomento Economico Mexicano SAB de CV | | | 138,131 | | | | 1,205,888 | |
Fomento Economico Mexicano SAB de CV, Sponsored ADR | | | 6,910 | | | | 606,353 | |
Heineken NV | | | 28,086 | | | | 2,736,570 | |
Kweichow Moutai Co. Ltd., Cl. A | | | 12,269 | | | | 1,144,718 | |
Molson Coors Brewing Co., Cl. B | | | 11,750 | | | | 950,223 | |
Nigerian Breweries plc | | | 698,342 | | | | 291,521 | |
PepsiCo, Inc. | | | 65,070 | | | | 7,172,666 | |
Pernod Ricard SA | | | 50,040 | | | | 7,507,280 | |
| | | | | | | 29,268,135 | |
| | | | | | | | | |
Food & Staples Retailing—0.7% | | | | | | | | |
Alimentation Couche-Tard, Inc., Cl. B | | | 38,673 | | | | 1,813,293 | |
Atacadao Distribuicao Comercio e Industria Ltda2 | | | 140,300 | | | | 689,641 | |
BIM Birlesik Magazalar AS | | | 33,139 | | | | 676,399 | |
CP ALL PCL | | | 1,037,800 | | | | 2,187,393 | |
Jeronimo Martins SGPS SA | | | 4,913 | | | | 89,281 | |
Magnit PJSC | | | 15,693 | | | | 2,069,007 | |
Shoprite Holdings Ltd. | | | 43,599 | | | | 623,745 | |
SPAR Group Ltd. (The) | | | 118,131 | | | | 1,393,222 | |
Walgreens Boots Alliance, Inc. | | | 7,120 | | | | 471,842 | |
Wal-Mart Stores, Inc. | | | 19,180 | | | | 1,674,606 | |
| | | | | | | 11,688,429 | |
| | | | | | | | | |
Food Products—1.9% | | | | | | | | |
Barry Callebaut AG2 | | | 1,457 | | | | 2,274,791 | |
Danone SA | | | 68,310 | | | | 5,583,313 | |
Kraft Heinz Co. (The) | | | 63,250 | | | | 4,891,122 | |
Mondelez International, Inc., Cl. A | | | 103,610 | | | | 4,292,562 | |
Nestle SA | | | 62,787 | | | | 5,282,572 | |
Saputo, Inc. | | | 72,391 | | | | 2,613,730 | |
Unilever plc | | | 52,454 | | | | 2,975,036 | |
Vietnam Dairy Products JSC | | | 22,200 | | | | 147,600 | |
Want Want China Holdings Ltd. | | | 681,000 | | | | 557,123 | |
WH Group Ltd.3 | | | 2,338,000 | | | | 2,367,810 | |
| | | | | | | 30,985,659 | |
| | | | | | | | | |
Household Products—0.4% | | | | | | | | |
HRG Group, Inc.2 | | | 12,270 | | | | 199,019 | |
Kimberly-Clark de Mexico SAB de CV, Cl. A | | | 236,907 | | | | 407,908 | |
Procter & Gamble Co. (The) | | | 12,620 | | | | 1,089,611 | |
Reckitt Benckiser Group plc | | | 34,897 | | | | 3,121,153 | |
Spectrum Brands Holdings, Inc. | | | 7,120 | | | | 782,630 | |
16 OPPENHEIMER GLOBAL ALLOCATION FUND
| | | | | | | | |
| | | Shares | | | Value | |
Household Products (Continued) | | | | | | | | |
Weatherford International plc2 | | | 211,930 | | | $ | 735,397 | |
| | | | | | | 6,335,718 | |
| | | | | | | | | |
Personal Products—0.2% | | | | | | | | |
Amorepacific Corp. | | | 2,280 | | | | 640,010 | |
AMOREPACIFIC Group | | | 1,526 | | | | 195,152 | |
Beiersdorf AG | | | 6,943 | | | | 778,838 | |
LG Household & Health Care Ltd. | | | 2,314 | | | | 2,430,260 | |
Natura Cosmeticos SA | | | 7,600 | | | | 71,950 | |
| | | | | | | 4,116,210 | |
| | | | | | | | | |
Tobacco—0.5% | | | | | | | | |
Philip Morris International, Inc. | | | 54,710 | | | | 5,724,855 | |
Swedish Match AB | | | 46,610 | | | | 1,754,867 | |
| | | | | | | 7,479,722 | |
| | | | | | | | | |
Energy—3.8% | | | | | | | | |
Energy Equipment & Services—0.3% | | | | | | | | |
Halliburton Co. | | | 18,623 | | | | 795,947 | |
Schlumberger Ltd. | | | 60,860 | | | | 3,895,040 | |
TechnipFMC plc2 | | | 36,296 | | | | 987,302 | |
| | | | | | | 5,678,289 | |
| | | | | | | | | |
Oil, Gas & Consumable Fuels—3.5% | | | | | | | | |
Antero Midstream GP LP | | | 39,900 | | | | 746,529 | |
Buckeye Partners LP1 | | | 33,900 | | | | 1,800,429 | |
Chevron Corp. | | | 28,511 | | | | 3,304,140 | |
ConocoPhillips | | | 14,641 | | | | 748,887 | |
Enbridge, Inc. | | | 21,137 | | | | 812,929 | |
Energy Transfer Equity LP1 | | | 170,100 | | | | 3,019,275 | |
Energy Transfer Partners LP1 | | | 180,900 | | | | 3,149,469 | |
Enterprise Products Partners LP1 | | | 105,400 | | | | 2,582,300 | |
EQT Midstream Partners LP1 | | | 12,200 | | | | 891,332 | |
Genesis Energy LP1 | | | 22,600 | | | | 526,354 | |
Husky Energy, Inc.2 | | | 65,583 | | | | 849,971 | |
Koninklijke Vopak NV | | | 28,062 | | | | 1,214,858 | |
Magellan Midstream Partners LP1 | | | 120,530 | | | | 8,281,616 | |
MPLX LP1 | | | 65,000 | | | | 2,291,900 | |
Novatek PJSC, Sponsored GDR | | | 23,500 | | | | 2,682,450 | |
Phillips 66 | | | 6,539 | | | | 595,572 | |
Phillips 66 Partners LP1 | | | 18,700 | | | | 942,667 | |
Plains All American Pipeline LP1 | | | 36,500 | | | | 728,905 | |
Plains GP Holdings LP, Cl. A | | | 35,900 | | | | 732,360 | |
Rice Midstream Partners LP1 | | | 47,300 | | | | 981,002 | |
Suncor Energy, Inc. | | | 227,620 | | | | 7,729,975 | |
Tallgrass Energy GP LP, Cl. A | | | 57,600 | | | | 1,440,000 | |
Tallgrass Energy Partners LP1 | | | 6,700 | | | | 292,388 | |
Targa Resources Corp. | | | 49,400 | | | | 2,050,100 | |
TC PipeLines LP1 | | | 45,500 | | | | 2,424,695 | |
17 OPPENHEIMER GLOBAL ALLOCATION FUND
| | |
| CONSOLIDATED STATEMENT OF INVESTMENTS Continued | | |
| | | |
| | | | | | | | |
| | | Shares | | | Value | |
Oil, Gas & Consumable Fuels (Continued) | | | | | | | | |
TOTAL SA | | | 57,610 | | | $ | 3,213,360 | |
Western Gas Partners LP1 | | | 14,200 | | | | 680,038 | |
Williams Cos., Inc. (The) | | | 26,500 | | | | 755,250 | |
Williams Partners LP1 | | | 40,800 | | | | 1,511,232 | |
| | | | | | | 56,979,983 | |
| | | | | | | | | |
Financials—9.7% | | | | | | | | |
Capital Markets—2.0% | | | | | | | | |
Ameriprise Financial, Inc. | | | 6,180 | | | | 967,417 | |
Bank of New York Mellon Corp. (The) | | | 85,390 | | | | 4,393,316 | |
BlackRock, Inc., Cl. A | | | 2,380 | | | | 1,120,575 | |
Charles Schwab Corp. (The) | | | 23,460 | | | | 1,051,946 | |
China International Capital Corp. Ltd., Cl. H3 | | | 172,000 | | | | 358,180 | |
CME Group, Inc., Cl. A | | | 33,910 | | | | 4,651,435 | |
Intercontinental Exchange, Inc. | | | 75,360 | | | | 4,981,296 | |
Morgan Stanley | | | 20,360 | | | | 1,018,000 | |
Nasdaq, Inc. | | | 20,910 | | | | 1,519,112 | |
NEX Group plc | | | 186,481 | | | | 1,570,814 | |
S&P Global, Inc. | | | 22,820 | | | | 3,570,645 | |
TP ICAP plc | | | 245,168 | | | | 1,772,759 | |
UBS Group AG2 | | | 347,743 | | | | 5,923,734 | |
| | | | | | | 32,899,229 | |
| | | | | | | | | |
Commercial Banks—3.2% | | | | | | | | |
Banco de Chile | | | 734,506 | | | | 112,671 | |
Banco Santander SA | | | 520,298 | | | | 3,530,965 | |
Bank Mandiri Persero Tbk PT | | | 1,396,000 | | | | 726,841 | |
Bank of America Corp. | | | 188,020 | | | | 5,149,868 | |
Bank of the Philippine Islands | | | 13,080 | | | | 24,848 | |
Bank Pekao SA | | | 4,257 | | | | 139,206 | |
Bank Rakyat Indonesia Persero Tbk PT | | | 408,000 | | | | 470,184 | |
Citigroup, Inc. | | | 144,030 | | | | 10,586,205 | |
Commercial International Bank Egypt SAE | | | 123,370 | | | | 551,420 | |
Credicorp Ltd. | | | 3,340 | | | | 699,530 | |
FirstRand Ltd. | | | 281,592 | | | | 1,020,747 | |
Grupo Aval Acciones y Valores SA, ADR | | | 83,160 | | | | 691,891 | |
Grupo Financiero Banorte SAB de CV, Cl. O | | | 55,350 | | | | 328,490 | |
Grupo Financiero Inbursa SAB de CV, Cl. O | | | 565,091 | | | | 971,207 | |
HSBC Holdings plc | | | 572,060 | | | | 5,578,311 | |
ICICI Bank Ltd., Sponsored ADR | | | 333,583 | | | | 3,052,284 | |
JPMorgan Chase & Co. | | | 46,520 | | | | 4,680,377 | |
KeyCorp | | | 65,940 | | | | 1,203,405 | |
Kotak Mahindra Bank Ltd. | | | 86,168 | | | | 1,363,668 | |
Lloyds Banking Group plc | | | 1,618,290 | | | | 1,467,480 | |
Sberbank of Russia PJSC, Sponsored ADR | | | 56,410 | | | | 809,324 | |
SunTrust Banks, Inc. | | | 45,590 | | | | 2,744,974 | |
US Bancorp | | | 66,840 | | | | 3,634,759 | |
Zenith Bank plc | | | 4,354,538 | | | | 308,652 | |
18 OPPENHEIMER GLOBAL ALLOCATION FUND
| | | | | | | | |
| | | Shares | | | Value | |
Commercial Banks (Continued) | | | | | | | | |
Zions Bancorporation | | | 32,780 | | | $ | 1,522,959 | |
| | | | | | | 51,370,266 | |
| | | | | | | | | |
Consumer Finance—0.6% | | | | | | | | |
American Express Co. | | | 56,950 | | | | 5,439,864 | |
Cholamandalam Investment & Finance Co. Ltd. | | | 15,348 | | | | 273,029 | |
Discover Financial Services | | | 35,500 | | | | 2,361,815 | |
Prosegur Cash SA2,3 | | | 575,614 | | | | 1,880,851 | |
| | | | | | | 9,955,559 | |
| | | | | | | | | |
Diversified Financial Services—1.1% | | | | | | | | |
Ayala Corp. | | | 11,470 | | | | 228,908 | |
B3 SA-Brasil Bolsa Balcao | | | 310,400 | | | | 2,267,771 | |
Berkshire Hathaway, Inc., Cl. B2 | | | 35,520 | | | | 6,640,109 | |
Grupo de Inversiones Suramericana SA | | | 40,892 | | | | 519,140 | |
Hong Kong Exchanges & Clearing Ltd. | | | 17,286 | | | | 481,412 | |
ING Groep NV | | | 208,737 | | | | 3,855,067 | |
Moscow Exchange (The) | | | 284,787 | | | | 575,941 | |
ORIX Corp. | | | 189,800 | | | | 3,270,092 | |
| | | | | | | 17,838,440 | |
| | | | | | | | | |
Insurance—1.9% | | | | | | | | |
AIA Group Ltd. | | | 377,000 | | | | 2,837,296 | |
American International Group, Inc. | | | 31,340 | | | | 2,024,877 | |
Aon plc | | | 7,990 | | | | 1,146,006 | |
Brighthouse Financial, Inc.2 | | | 4,952 | | | | 307,915 | |
Hartford Financial Services Group, Inc. (The) | | | 19,220 | | | | 1,058,061 | |
Marsh & McLennan Cos., Inc. | | | 35,510 | | | | 2,873,824 | |
MetLife, Inc. | | | 78,310 | | | | 4,195,850 | |
Ping An Insurance Group Co. of China Ltd., Cl. H | | | 322,500 | | | | 2,832,363 | |
Progressive Corp. (The) | | | 70,390 | | | | 3,424,474 | |
Prudential plc | | | 336,754 | | | | 8,289,356 | |
Sul America SA | | | 107,649 | | | | 590,024 | |
XL Group Ltd. | | | 31,070 | | | | 1,257,403 | |
| | | | | | | 30,837,449 | |
| | | | | | | | | |
Real Estate Investment Trusts (REITs)—0.4% | | | | | | | | |
Crown Castle International Corp. | | | 8,670 | | | | 928,384 | |
Digital Realty Trust, Inc. | | | 5,230 | | | | 619,441 | |
Invitation Homes, Inc. | | | 17,900 | | | | 404,003 | |
Mid-America Apartment Communities, Inc. | | | 22,660 | | | | 2,319,251 | |
Prologis, Inc. | | | 19,500 | | | | 1,259,310 | |
Ventas, Inc. | | | 21,880 | | | | 1,372,970 | |
| | | | | | | 6,903,359 | |
Real Estate Management & Development—0.2% | | | | | | | | |
Ayala Land, Inc. | | | 705,000 | | | | 589,723 | |
Emaar Properties PJSC | | | 255,089 | | | | 577,361 | |
Hang Lung Group Ltd. | | | 56,000 | | | | 196,690 | |
19 OPPENHEIMER GLOBAL ALLOCATION FUND
| | |
| CONSOLIDATED STATEMENT OF INVESTMENTS Continued | | |
| | | |
| | | | | | | | |
| | | Shares | | | Value | |
Real Estate Management & Development (Continued) | | | | | | | | |
Scout24 AG3 | | | 37,771 | | | $ | 1,513,813 | |
SM Prime Holdings, Inc. | | | 1,532,103 | | | | 1,099,274 | |
| | | | | | | 3,976,861 | |
| | | | | | | | | |
Thrifts & Mortgage Finance—0.3% | | | | | | | | |
Housing Development Finance Corp. Ltd. | | | 167,921 | | | | 4,428,042 | |
| | | | | | | | | |
Health Care—5.6% | | | | | | | | |
Biotechnology—1.2% | | | | | | | | |
3SBio, Inc.2,3 | | | 210,000 | | | | 375,832 | |
Amgen, Inc. | | | 5,270 | | | | 923,409 | |
Biocon Ltd. | | | 46,917 | | | | 260,682 | |
Biogen, Inc.2 | | | 4,140 | | | | 1,290,272 | |
Celgene Corp.2 | | | 55,446 | | | | 5,598,383 | |
Celltrion Healthcare Co. Ltd.2 | | | 5,136 | | | | 270,413 | |
CSL Ltd. | | | 22,400 | | | | 2,389,030 | |
Galapagos NV2 | | | 2,723 | | | | 264,128 | |
Gilead Sciences, Inc. | | | 58,010 | | | | 4,348,430 | |
Grifols SA | | | 103,103 | | | | 3,228,549 | |
Wuxi Biologics Cayman, Inc.2,3 | | | 23,000 | | | | 130,398 | |
| | | | | | | 19,079,526 | |
| | | | | | | | | |
Health Care Equipment & Supplies—1.0% | | | | | | | | |
Boston Scientific Corp.2 | | | 76,660 | | | | 2,157,212 | |
Coloplast AS, Cl. B | | | 3,995 | | | | 351,293 | |
Danaher Corp. | | | 16,314 | | | | 1,505,293 | |
Essilor International SA | | | 17,134 | | | | 2,170,255 | |
Intuitive Surgical, Inc.2 | | | 1,980 | | | | 743,213 | |
Medtronic plc | | | 8,750 | | | | 704,550 | |
Sonova Holding AG | | | 12,045 | | | | 2,176,210 | |
Stryker Corp. | | | 21,620 | | | | 3,348,289 | |
William Demant Holding AS2 | | | 69,845 | | | | 2,017,901 | |
Zimmer Biomet Holdings, Inc. | | | 9,990 | | | | 1,214,984 | |
| | | | | | | 16,389,200 | |
| | | | | | | | | |
Health Care Providers & Services—1.1% | | | | | | | | |
Apollo Hospitals Enterprise Ltd. | | | 38,315 | | | | 614,347 | |
Express Scripts Holding Co.2 | | | 47,400 | | | | 2,905,146 | |
Humana, Inc. | | | 2,840 | | | | 725,194 | |
Laboratory Corp. of America Holdings2 | | | 7,030 | | | | 1,080,581 | |
Mediclinic International plc | | | 41,120 | | | | 317,639 | |
Sinopharm Group Co. Ltd., Cl. H | | | 444,600 | | | | 1,990,574 | |
Sonic Healthcare Ltd. | | | 33,848 | | | | 564,380 | |
UnitedHealth Group, Inc. | | | 43,780 | | | | 9,203,432 | |
| | | | | | | 17,401,293 | |
| | | | | | | | | |
Health Care Technology—0.3% | | | | | | | | |
Bharti Infratel Ltd. | | | 449,817 | | | | 3,077,180 | |
20 OPPENHEIMER GLOBAL ALLOCATION FUND
| | | | | | | | |
| | | Shares | | | Value | |
Health Care Technology (Continued) | | | | | | | | |
Cerner Corp.2 | | | 37,500 | | | $ | 2,532,000 | |
| | | | | | | 5,609,180 | |
| | | | | | | | | |
Life Sciences Tools & Services—0.4% | | | | | | | | |
Agilent Technologies, Inc. | | | 25,670 | | | | 1,746,330 | |
Lonza Group AG2 | | | 10,727 | | | | 2,852,206 | |
Samsung Biologics Co. Ltd.2,3 | | | 2,753 | | | | 951,813 | |
Thermo Fisher Scientific, Inc. | | | 4,170 | | | | 808,271 | |
| | | | | | | 6,358,620 | |
| | | | | | | | | |
Pharmaceuticals—1.6% | | | | | | | | |
Allergan plc | | | 5,560 | | | | 985,399 | |
Bayer AG | | | 29,359 | | | | 3,834,609 | |
Bristol-Myers Squibb Co. | | | 19,710 | | | | 1,215,319 | |
Celltrion, Inc.2 | | | 2,867 | | | | 446,235 | |
Dr. Reddy’s Laboratories Ltd. | | | 16,420 | | | | 615,062 | |
GlaxoSmithKline plc, Sponsored ADR | | | 26,730 | | | | 973,774 | |
Glenmark Pharmaceuticals Ltd. | | | 14,727 | | | | 140,764 | |
Hutchison China MediTech Ltd., ADR2 | | | 3,720 | | | | 113,274 | |
Jiangsu Hengrui Medicine Co. Ltd., Cl. A | | | 183,980 | | | | 1,865,325 | |
Merck & Co., Inc. | | | 129,670 | | | | 7,143,520 | |
Mylan NV2 | | | 47,480 | | | | 1,695,511 | |
Novo Nordisk AS, Cl. B | | | 56,384 | | | | 2,805,775 | |
Pfizer, Inc. | | | 59,630 | | | | 2,090,628 | |
Roche Holding AG | | | 8,623 | | | | 1,993,634 | |
Valeant Pharmaceuticals International, Inc.2 | | | 65,220 | | | | 762,422 | |
| | | | | | | 26,681,251 | |
| | | | | | | | | |
Industrials—8.8% | | | | | | | | |
Aerospace & Defense—1.0% | | | | | | | | |
Airbus SE | | | 75,630 | | | | 7,735,938 | |
Lockheed Martin Corp. | | | 22,146 | | | | 6,824,511 | |
MTU Aero Engines AG | | | 4,662 | | | | 787,245 | |
Spirit AeroSystems Holdings, Inc., Cl. A | | | 9,300 | | | | 744,930 | |
| | | | | | | 16,092,624 | |
| | | | | | | | | |
Air Freight & Couriers—0.1% | | | | | | | | |
FedEx Corp. | | | 2,410 | | | | 544,202 | |
XPO Logistics, Inc.2 | | | 15,470 | | | | 1,072,845 | |
ZTO Express Cayman, Inc., ADR2 | | | 24,880 | | | | 397,831 | |
| | | | | | | 2,014,878 | |
| | | | | | | | | |
Airlines—0.4% | | | | | | | | |
Alaska Air Group, Inc. | | | 21,140 | | | | 1,395,874 | |
Japan Airlines Co. Ltd. | | | 98,300 | | | | 3,365,561 | |
Southwest Airlines Co. | | | 9,200 | | | | 495,512 | |
Spirit Airlines, Inc.2 | | | 25,580 | | | | 948,762 | |
| | | | | | | 6,205,709 | |
21 OPPENHEIMER GLOBAL ALLOCATION FUND
| | |
| CONSOLIDATED STATEMENT OF INVESTMENTS Continued | | |
| | | |
| | | | | | | | |
| | | Shares | | | Value | |
Building Products—0.3% | | | | | | | | |
SMC Corp. | | | 11,700 | | | $ | 4,489,400 | |
| | | | | | | | | |
Commercial Services & Supplies—0.7% | | | | | | | | |
Edenred | | | 68,380 | | | | 1,971,092 | |
Johnson Controls International plc | | | 72,509 | | | | 3,001,148 | |
KAR Auction Services, Inc. | | | 29,350 | | | | 1,389,135 | |
Prosegur Cia de Seguridad SA | | | 300,321 | | | | 2,291,643 | |
Republic Services, Inc., Cl. A | | | 10,850 | | | | 706,010 | |
Waste Connections, Inc. | | | 15,848 | | | | 1,119,978 | |
Waste Management, Inc. | | | 12,740 | | | | 1,046,846 | |
| | | | | | | 11,525,852 | |
| | | | | | | | | |
Construction & Engineering—0.7% | | | | | | | | |
Boskalis Westminster | | | 41,435 | | | | 1,481,216 | |
Ferrovial SA | | | 174,193 | | | | 3,785,398 | |
Vinci SA | | | 54,790 | | | | 5,366,466 | |
| | | | | | | 10,633,080 | |
Electrical Equipment—1.1% | | | | | | | | |
Legrand SA | | | 29,640 | | | | 2,202,578 | |
Mitsubishi Electric Corp. | | | 242,100 | | | | 4,158,772 | |
Nidec Corp. | | | 25,100 | | | | 3,322,443 | |
Philips Lighting NV3 | | | 120,243 | | | | 4,548,787 | |
Schneider Electric SE | | | 42,370 | | | | 3,716,632 | |
| | | | | | | 17,949,212 | |
| | | | | | | | | |
Industrial Conglomerates—0.7% | | | | | | | | |
General Electric Co. | | | 226,800 | | | | 4,572,288 | |
Jardine Strategic Holdings Ltd. | | | 42,572 | | | | 1,786,834 | |
Seibu Holdings, Inc. | | | 165,200 | | | | 2,955,986 | |
Siemens AG, Sponsored ADR | | | 9,140 | | | | 658,263 | |
SM Investments Corp. | | | 89,494 | | | | 1,657,929 | |
| | | | | | | 11,631,300 | |
| | | | | | | | | |
Machinery—0.8% | | | | | | | | |
Aalberts Industries NV | | | 49,695 | | | | 2,446,937 | |
Atlas Copco AB, Cl. A | | | 58,504 | | | | 2,559,395 | |
Caterpillar, Inc. | | | 10,790 | | | | 1,465,282 | |
Deere & Co. | | | 3,970 | | | | 527,534 | |
Kubota Corp. | | | 123,000 | | | | 2,318,662 | |
PACCAR, Inc. | | | 7,990 | | | | 573,123 | |
Parker-Hannifin Corp. | | | 7,630 | | | | 1,393,314 | |
Stanley Black & Decker, Inc. | | | 2,810 | | | | 453,956 | |
Wabtec Corp. | | | 11,580 | | | | 885,870 | |
Weir Group plc (The) | | | 32,753 | | | | 849,107 | |
| | | | | | | 13,473,180 | |
| | | | | | | | | |
Professional Services—1.1% | | | | | | | | |
Bureau Veritas SA | | | 101,990 | | | | 2,732,985 | |
22 OPPENHEIMER GLOBAL ALLOCATION FUND
| | | | | | | | |
| | | Shares | | | Value | |
Professional Services (Continued) | | | | | | | | |
Equifax, Inc. | | | 7,080 | | | $ | 768,392 | |
Experian plc | | | 78,858 | | | | 1,659,870 | |
Intertek Group plc | | | 28,580 | | | | 2,057,440 | |
Nielsen Holdings plc | | | 90,380 | | | | 3,350,387 | |
Recruit Holdings Co. Ltd. | | | 305,200 | | | | 7,471,578 | |
| | | | | | | 18,040,652 | |
| | | | | | | | | |
Road & Rail—0.4% | | | | | | | | |
Canadian National Railway Co. | | | 47,330 | | | | 3,809,592 | |
Canadian Pacific Railway Ltd. | | | 15,010 | | | | 2,603,334 | |
Kansas City Southern | | | 5,480 | | | | 571,126 | |
| | | | | | | 6,984,052 | |
| | | | | | | | | |
Trading Companies & Distributors—1.1% | | | | | | | | |
Brenntag AG | | | 75,567 | | | | 4,279,336 | |
Bunzl plc | | | 86,272 | | | | 2,688,421 | |
Fastenal Co. | | | 43,340 | | | | 2,035,680 | |
Ferguson plc | | | 16,343 | | | | 1,139,678 | |
ITOCHU Corp. | | | 280,900 | | | | 4,928,809 | |
Travis Perkins plc | | | 100,848 | | | | 2,036,308 | |
| | | | | | | 17,108,232 | |
| | | | | | | | | |
Transportation Infrastructure—0.4% | | | | | | | | |
Beijing Capital International Airport Co. Ltd., Cl. H | | | 2,156,000 | | | | 3,538,697 | |
DP World Ltd. | | | 67,925 | | | | 1,613,215 | |
Grupo Aeroportuario del Sureste SAB de CV, Cl. B | | | 33,044 | | | | 589,326 | |
Malaysia Airports Holdings Bhd | | | 530,300 | | | | 1,038,077 | |
| | | | | | | 6,779,315 | |
| | | | | | | | | |
Information Technology—12.8% | | | | | | | | |
Communications Equipment—0.4% | | | | | | | | |
Cisco Systems, Inc. | | | 85,410 | | | | 2,916,752 | |
Motorola Solutions, Inc. | | | 11,270 | | | | 1,020,386 | |
Nokia OYJ | | | 376,734 | | | | 1,850,221 | |
| | | | | | | 5,787,359 | |
| | | | | | | | | |
Electronic Equipment, Instruments, & Components—1.2% | | | | | | | | |
Hitachi Ltd. | | | 290,000 | | | | 2,307,631 | |
Hoya Corp. | | | 76,900 | | | | 4,156,360 | |
Keyence Corp. | | | 7,200 | | | | 3,983,483 | |
Spectris plc | | | 45,128 | | | | 1,534,588 | |
TDK Corp. | | | 34,800 | | | | 2,686,094 | |
TE Connectivity Ltd. | | | 35,050 | | | | 3,188,499 | |
Zebra Technologies Corp., Cl. A2 | | | 5,160 | | | | 598,508 | |
| | | | | | | 18,455,163 | |
| | | | | | | | | |
Internet Software & Services—3.8% | | | | | | | | |
Alibaba Group Holding Ltd., Sponsored ADR2 | | | 59,664 | | | | 11,031,277 | |
Alphabet, Inc., Cl. A2 | | | 730 | | | | 754,119 | |
23 OPPENHEIMER GLOBAL ALLOCATION FUND
| | |
| CONSOLIDATED STATEMENT OF INVESTMENTS Continued | | |
| | | |
| | | | | | | | |
| | | Shares | | | Value | |
Internet Software & Services (Continued) | | | | | | | | |
Alphabet, Inc., Cl. C2 | | | 17,280 | | | $ | 17,567,539 | |
Baidu, Inc., Sponsored ADR2 | | | 28,480 | | | | 6,947,411 | |
China Literature Ltd.2 | | | 105 | | | | 740 | |
eBay, Inc.2 | | | 81,620 | | | | 3,072,177 | |
Facebook, Inc., Cl. A2 | | | 64,410 | | | | 11,597,665 | |
MercadoLibre, Inc. | | | 180 | | | | 43,256 | |
NAVER Corp. | | | 2,842 | | | | 2,276,429 | |
NetEase, Inc., ADR | | | 3,990 | | | | 1,124,861 | |
Tencent Holdings Ltd. | | | 131,885 | | | | 5,940,374 | |
United Internet AG | | | 29,641 | | | | 1,875,098 | |
| | | | | | | 62,230,946 | |
| | | | | | | | | |
IT Services—1.3% | | | | | | | | |
Amadeus IT Group SA | | | 28,705 | | | | 1,947,329 | |
Amdocs Ltd. | | | 58,570 | | | | 3,812,907 | |
Atos SE | | | 19,980 | | | | 3,105,628 | |
First Data Corp., Cl. A2 | | | 57,330 | | | | 1,021,047 | |
Infosys Ltd. | | | 83,370 | | | | 1,186,555 | |
Mastercard, Inc., Cl. A | | | 25,990 | | | | 3,866,532 | |
PayPal Holdings, Inc.2 | | | 77,640 | | | | 5,633,558 | |
Tata Consultancy Services Ltd. | | | 21,634 | | | | 877,288 | |
| | | | | | | 21,450,844 | |
| | | | | | | | | |
Semiconductors & Semiconductor Equipment—2.6% | | | | | | | | |
Applied Materials, Inc. | | | 66,080 | | | | 3,728,894 | |
ASML Holding NV | | | 17,606 | | | | 3,176,216 | |
Broadcom Ltd. | | | 9,077 | | | | 2,395,511 | |
Infineon Technologies AG | | | 362,521 | | | | 9,925,504 | |
Marvell Technology Group Ltd. | | | 71,700 | | | | 1,324,299 | |
Maxim Integrated Products, Inc. | | | 28,020 | | | | 1,472,171 | |
Renesas Electronics Corp.2 | | | 212,800 | | | | 2,747,721 | |
SK Hynix, Inc. | | | 43,679 | | | | 3,211,792 | |
STMicroelectronics NV | | | 143,950 | | | | 3,389,470 | |
Taiwan Semiconductor Manufacturing Co. Ltd. | | | 803,000 | | | | 6,485,973 | |
Texas Instruments, Inc. | | | 20,190 | | | | 1,952,171 | |
Tokyo Electron Ltd. | | | 16,200 | | | | 3,058,598 | |
| | | | | | | 42,868,320 | |
| | | | | | | | | |
Software—1.8% | | | | | | | | |
Activision Blizzard, Inc. | | | 14,410 | | | | 943,711 | |
Check Point Software Technologies Ltd.2 | | | 3,790 | | | | 446,121 | |
Dassault Systemes SE | | | 18,540 | | | | 1,969,360 | |
Microsoft Corp. | | | 77,440 | | | | 6,441,459 | |
Oracle Corp. | | | 28,470 | | | | 1,449,123 | |
SAP SE | | | 105,274 | | | | 11,975,867 | |
Snap, Inc., Cl. A2 | | | 70,550 | | | | 1,082,237 | |
Synopsys, Inc.2 | | | 14,730 | | | | 1,274,439 | |
24 OPPENHEIMER GLOBAL ALLOCATION FUND
| | | | | | | | |
| | | Shares | | | Value | |
Software (Continued) | | | | | | | | |
Temenos Group AG | | | 31,857 | | | $ | 3,679,881 | |
| | | | | | | 29,262,198 | |
| | | | | | | | | |
Technology Hardware, Storage & Peripherals—1.7% | | | | | | | | |
Apple, Inc. | | | 123,711 | | | | 20,912,107 | |
HP, Inc. | | | 49,480 | | | | 1,066,294 | |
Samsung Electronics Co. Ltd. | | | 1,404 | | | | 3,456,189 | |
Western Digital Corp. | | | 26,940 | | | | 2,404,934 | |
| | | | | | | 27,839,524 | |
| | | | | | | | | |
Materials—2.8% | | | | | | | | |
Chemicals—1.4% | | | | | | | | |
Air Liquide SA | | | 37,337 | | | | 4,755,530 | |
Akzo Nobel NV | | | 15,895 | | | | 1,439,203 | |
Albemarle Corp. | | | 3,710 | | | | 522,702 | |
DowDuPont, Inc. | | | 38,139 | | | | 2,757,831 | |
Eastman Chemical Co. | | | 16,900 | | | | 1,534,689 | |
Essentra plc | | | 176,040 | | | | 1,244,262 | |
Linde AG2 | | | 10,104 | | | | 2,169,665 | |
Novozymes AS, Cl. B | | | 43,017 | | | | 2,375,937 | |
PPG Industries, Inc. | | | 28,280 | | | | 3,287,267 | |
Sika AG | | | 263 | | | | 1,948,763 | |
Westlake Chemical Partners LP1 | | | 32,300 | | | | 718,675 | |
| | | | | | | 22,754,524 | |
| | | | | | | | | |
Construction Materials—0.3% | | | | | | | | |
Indocement Tunggal Prakarsa Tbk PT | | | 387,500 | | | | 643,327 | |
James Hardie Industries plc | | | 68,000 | | | | 1,038,850 | |
UltraTech Cement Ltd. | | | 13,428 | | | | 912,400 | |
Vulcan Materials Co. | | | 16,350 | | | | 1,990,613 | |
| | | | | | | 4,585,190 | |
| | | | | | | | | |
Containers & Packaging—0.2% | | | | | | | | |
CCL Industries, Inc., Cl. B | | | 58,378 | | | | 2,813,692 | |
WestRock Co. | | | 16,060 | | | | 984,960 | |
| | | | | | | 3,798,652 | |
| | | | | | | | | |
Metals & Mining—0.9% | | | | | | | | |
Agnico Eagle Mines Ltd. | | | 15,910 | | | | 710,063 | |
Alrosa PJSC | | | 462,362 | | | | 596,537 | |
Anglo American plc | | | 183,800 | | | | 3,463,080 | |
Compass Minerals International, Inc. | | | 7,550 | | | | 495,280 | |
Glencore plc2 | | | 549,320 | | | | 2,644,846 | |
Grupo Mexico SAB de CV | | | 318,773 | | | | 1,036,541 | |
Korea Zinc Co. Ltd. | | | 3,627 | | | | 1,659,591 | |
Newcrest Mining Ltd. | | | 113,700 | | | | 1,939,701 | |
Polyus PJSC, GDR3 | | | 6,900 | | | | 283,245 | |
Real Gold Mining Ltd.2,4 | | | 273,000 | | | | 350 | |
25 OPPENHEIMER GLOBAL ALLOCATION FUND
| | |
| CONSOLIDATED STATEMENT OF INVESTMENTS Continued | | |
| | | |
| | | | | | | | |
| | | Shares | | | Value | |
Metals & Mining (Continued) | | | | | | | | |
Zhaojin Mining Industry Co. Ltd., Cl. H | | | 1,132,500 | | | $ | 922,580 | |
| | | | | | | 13,751,814 | |
| | | | | | | | | |
Telecommunication Services—1.9% | | | | | | | | |
Diversified Telecommunication Services—1.3% | | | | | | | | |
AT&T, Inc. | | | 36,040 | | | | 1,212,746 | |
BT Group plc, Cl. A | | | 281,702 | | | | 974,110 | |
Iliad SA | | | 7,340 | | | | 1,833,209 | |
Inmarsat plc | | | 119,800 | | | | 988,209 | |
Nippon Telegraph & Telephone Corp. | | | 180,000 | | | | 8,721,354 | |
Spark New Zealand Ltd. | | | 1,114,291 | | | | 2,806,921 | |
Verizon Communications, Inc. | | | 91,310 | | | | 4,371,010 | |
| | | | | | | 20,907,559 | |
| | | | | | | | | |
Wireless Telecommunication Services—0.6% | | | | | | | | |
China Mobile Ltd. | | | 104,500 | | | | 1,050,324 | |
Rogers Communications, Inc., Cl. B | | | 51,272 | | | | 2,660,373 | |
SK Telecom Co. Ltd. | | | 11,598 | | | | 2,733,821 | |
SoftBank Group Corp. | | | 22,000 | | | | 1,946,977 | |
Vodafone Group plc | | | 489,960 | | | | 1,401,812 | |
| | | | | | | 9,793,307 | |
| | | | | | | | | |
Utilities—0.9% | | | | | | | | |
Electric Utilities—0.6% | | | | | | | | |
Edison International | | | 31,310 | | | | 2,503,234 | |
Entergy Corp. | | | 12,660 | | | | 1,092,052 | |
NextEra Energy, Inc. | | | 2,971 | | | | 460,713 | |
PG&E Corp. | | | 102,880 | | | | 5,943,378 | |
| | | | | | | 9,999,377 | |
| | | | | | | | | |
Gas Utilities—0.1% | | | | | | | | |
AmeriGas Partners LP1 | | | 23,945 | | | | 1,083,511 | |
| | | | | | | | | |
Multi-Utilities—0.2% | | | | | | | | |
National Grid plc | | | 247,110 | | | | 2,973,793 | |
SCANA Corp. | | | 6,170 | | | | 266,174 | |
| | | | | | | 3,239,967 | |
Total Common Stocks (Cost $864,657,267) | | | | | | | 1,002,874,750 | |
| | | | | | | | |
Preferred Stocks—0.1% | | | | | | | | |
Lojas Americanas SA, Preference | | | 229,614 | | | | 1,233,948 | |
Zee Entertainment Enterprises Ltd., 6% Cum. Non-Cv. | | | 629,697 | | | | 96,344 | |
Total Preferred Stocks (Cost $1,246,203) | | | | | | | 1,330,292 | |
| | | | | | | | |
| | | Units | | | | |
Rights, Warrants and Certificates—0.0% | | | | | | | | |
Banco Santander SA Rts., Strike Price 1EUR, Exp. 11/15/172 | | | 520,298 | | | | 24,849 | |
Ferrovial SA Rts., Strike Price 1EUR, Exp. 11/13/172 | | | 174,193 | | | | 83,801 | |
Total Rights, Warrants and Certificates (Cost $106,336) | | | | | | | 108,650 | |
26 OPPENHEIMER GLOBAL ALLOCATION FUND
| | | | | | | | | | | | |
| | | | | | Principal Amount | | | Value | |
U.S. Government Obligations—3.3% | | | | | | | | | | | | |
United States Treasury Bonds, 2.875%, 8/15/45 | | | | | | $ | 17,022,000 | | | $ | 17,036,629 | |
United States Treasury Nts., 1.625%, 2/15/265,6 | | | | | | | 38,920,000 | | | | 36,882,021 | |
Total U.S. Government Obligations (Cost $55,663,093) | | | | | | | | | | | 53,918,650 | |
| | | | | | | | | | | | |
Foreign Government Obligations—4.7% | | | | | | | | | | | | |
Arab Republic of Egypt, 15.00% Unsec. Nts., 10/3/20 | | | EGP | | | | 4,250,000 | | | | 237,839 | |
Argentine Republic: | | | | | | | | | | | | |
16.00% Bonds, 10/17/23 | | | ARS | | | | 4,825,000 | | | | 277,979 | |
24.756% [BADLARPP+325] Sr. Unsec. Nts., 3/1/207 | | | ARS | | | | 16,346,000 | | | | 975,419 | |
27.146% [ARPP7DRR] Unsec. Nts., 6/21/207 | | | ARS | | | | 1,600,000 | | | | 97,144 | |
Federative Republic of Brazil: | | | | | | | | | | | | |
10.00% Unsec. Nts., 1/1/19 | | | BRL | | | | 9,420,000 | | | | 2,963,414 | |
10.00% Unsec. Nts., 1/1/21 | | | BRL | | | | 18,465,000 | | | | 5,793,617 | |
10.00% Unsec. Nts., 1/1/23 | | | BRL | | | | 3,930,000 | | | | 1,222,153 | |
17.517% Unsec. Nts., 5/15/458 | | | BRL | | | | 495,000 | | | | 502,523 | |
18.077% Unsec. Nts., 8/15/228 | | | BRL | | | | 1,200,000 | | | | 1,170,474 | |
Hungary: | | | | | | | | | | | | |
Series 20/A, 7.50% Bonds, 11/12/20 | | | HUF | | | | 116,700,000 | | | | 527,451 | |
Series 25/B, 5.50% Bonds, 6/24/25 | | | HUF | | | | 575,000,000 | | | | 2,663,000 | |
Series 27/A, 3.00% Bonds, 10/27/27 | | | HUF | | | | 70,000,000 | | | | 275,075 | |
Kingdom of Thailand, 1.875% Sr. Unsec. Nts., 6/17/22 | | | THB | | | | 80,500,000 | | | | 2,428,173 | |
Malaysia: | | | | | | | | | | | | |
3.26% Sr. Unsec. Nts., 3/1/18 | | | MYR | | | | 2,170,000 | | | | 513,027 | |
4.24% Sr. Unsec. Nts., 2/7/18 | | | MYR | | | | 1,660,000 | | | | 393,354 | |
4.378% Sr. Unsec. Nts., 11/29/19 | | | MYR | | | | 3,000,000 | | | | 723,530 | |
Oriental Republic of Uruguay, 9.875% Sr. Unsec. Nts., 6/20/223 | | | UYU | | | | 29,910,000 | | | | 1,094,505 | |
Republic of Chile: | | | | | | | | | | | | |
4.50% Unsec. Nts., 2/28/21 | | | CLP | | | | 1,220,000,000 | | | | 1,968,551 | |
4.50% Bonds, 3/1/26 | | | CLP | | | | 200,000,000 | | | | 316,123 | |
Republic of Colombia: | | | | | | | | | | | | |
Series B, 7.00% Bonds, 5/4/22 | | | COP | | | | 3,390,000,000 | | | | 1,164,413 | |
Series B, 7.50% Bonds, 8/26/26 | | | COP | | | | 3,650,000,000 | | | | 1,274,039 | |
Series B, 10.00% Bonds, 7/24/24 | | | COP | | | | 2,400,000,000 | | | | 946,062 | |
Republic of Indonesia: | | | | | | | | | | | | |
Series FR61, 7.00% Sr. Unsec. Nts., 5/15/22 | | | IDR | | | | 19,900,000,000 | | | | 1,500,207 | |
Series FR71, 9.00% Sr. Unsec. Nts., 3/15/29 | | | IDR | | | | 20,700,000,000 | | | | 1,739,945 | |
Series FR72, 8.25% Sr. Unsec. Nts., 5/15/36 | | | IDR | | | | 28,900,000,000 | | | | 2,323,839 | |
Series FR73, 8.75% Sr. Unsec. Nts., 5/15/31 | | | IDR | | | | 29,650,000,000 | | | | 2,459,447 | |
Republic of Peru: | | | | | | | | | | | | |
6.35% Sr. Unsec. Nts., 8/12/283 | | | PEN | | | | 5,945,000 | | | | 1,968,509 | |
6.95% Sr. Unsec. Nts., 8/12/313 | | | PEN | | | | 760,000 | | | | 262,877 | |
7.84% Sr. Unsec. Nts., 8/12/203 | | | PEN | | | | 2,180,000 | | | | 743,481 | |
8.20% Sr. Unsec. Nts., 8/12/263 | | | PEN | | | | 2,255,000 | | | | 851,693 | |
Republic of Poland: | | | | | | | | | | | | |
Series 0721, 1.75% Bonds, 7/25/21 | | | PLN | | | | 8,010,000 | | | | 2,155,908 | |
Series 0726, 2.50% Bonds, 7/25/26 | | | PLN | | | | 6,960,000 | | | | 1,789,888 | |
Series 0922, 5.75% Bonds, 9/23/22 | | | PLN | | | | 1,225,000 | | | | 383,750 | |
Republic of South Africa: | | | | | | | | | | | | |
Series 2023, 7.75% Bonds, 2/28/23 | | | ZAR | | | | 4,700,000 | | | | 323,164 | |
|
| 27 OPPENHEIMER GLOBAL ALLOCATION FUND |
CONSOLIDATED STATEMENT OF INVESTMENTS Continued
| | | | | | | | | | | | |
| | | | | | Principal Amount | | | Value | |
Foreign Government Obligations (Continued) | | | | | | | | | | | | |
Republic of South Africa: (Continued) | | | | | | | | | | | | |
Series 2030, 8.00% Bonds, 1/31/30 | | | ZAR | | | | 18,640,000 | | | $ | 1,167,649 | |
Series 2037, 8.50% Bonds, 1/31/37 | | | ZAR | | | | 16,550,000 | | | | 1,020,815 | |
Series R186, 10.50% Bonds, 12/21/26 | | | ZAR | | | | 16,975,000 | | | | 1,301,781 | |
Series R208, 6.75% Sr. Unsec. Nts., 3/31/21 | | | ZAR | | | | 42,700,000 | | | | 2,900,359 | |
Series R214, 6.50% Bonds, 2/28/41 | | | ZAR | | | | 9,140,000 | | | | 439,591 | |
Republic of Turkey: | | | | | | | | | | | | |
8.50% Bonds, 7/10/19 | | | TRY | | | | 1,165,000 | | | | 289,918 | |
8.80% Bonds, 11/14/18 | | | TRY | | | | 1,100,000 | | | | 280,397 | |
10.70% Bonds, 2/17/21 | | | TRY | | | | 2,670,000 | | | | 673,200 | |
11.00% Bonds, 2/24/27 | | | TRY | | | | 7,820,000 | | | | 2,003,675 | |
Romania, 5.95% Bonds, 6/11/21 | | | RON | | | | 5,640,000 | | | | 1,572,784 | |
Russian Federation: | | | | | | | | | | | | |
Series 6209, 7.60% Bonds, 7/20/22 | | | RUB | | | | 88,675,000 | | | | 1,535,027 | |
Series 6210, 6.80% Bonds, 12/11/19 | | | RUB | | | | 126,800,000 | | | | 2,147,794 | |
Series 6211, 7.00% Bonds, 1/25/23 | | | RUB | | | | 154,200,000 | | | | 2,602,494 | |
Series 6212, 7.05% Bonds, 1/19/28 | | | RUB | | | | 18,000,000 | | | | 298,796 | |
Series 6216, 6.70% Bonds, 5/15/19 | | | RUB | | | | 338,600,000 | | | | 5,740,220 | |
United Mexican States: | | | | | | | | | | | | |
Series M, 5.75% Bonds, 3/5/26 | | | MXN | | | | 45,000,000 | | | | 2,133,843 | |
Series M, 8.00% Bonds, 6/11/20 | | | MXN | | | | 10,000,000 | | | | 534,049 | |
Series M, 8.00% Sr. Unsec. Nts., 12/7/23 | | | MXN | | | | 3,800,000 | | | | 207,153 | |
Series M10, 8.50% Bonds, 12/13/18 | | | MXN | | | | 48,250,000 | | | | 2,555,657 | |
Series M20, 8.50% Sr. Unsec. Nts., 5/31/29 | | | MXN | | | | 17,020,000 | | | | 969,439 | |
Series M20, 10.00% Bonds, 12/5/24 | | | MXN | | | | 33,450,000 | | | | 2,025,268 | |
Series M30, 8.50% Sr. Unsec. Nts., 11/18/38 | | | MXN | | | | 5,880,000 | | | | 338,821 | |
Series M30, 10.00% Bonds, 11/20/36 | | | MXN | | | | 2,750,000 | | | | 179,855 | |
Total Foreign Government Obligations (Cost $76,652,403) | | | | | | | | | | | 76,949,158 | |
| | | | | | | | | | | | |
Non-Convertible Corporate Bond and Note—0.0% | | | | | | | | | | | | |
Omnicare, Inc., 4.75% Sr. Unsec. Nts., 12/1/22 (Cost $211,042) | | | | | | | 210,000 | | | | 224,753 | |
| | | | | | | | | | | | | | | | | | | | | | | | |
| | | | | | | | | | | | | | | Notional | | | | | | | | | |
| | | Counter- | | | | Exercise | | | | Expiration | | | | Amount | | | | Contracts | | | | | |
| | | party | | | | Price | | | | Date | | | | (000’s) | | | | (000’s) | | | | | |
Over-the-Counter Option Purchased—0.0% | | | | | | | | | | | | | | | | | | | | | | | | |
CLP Currency Put2 (Cost $24,039) | | | GSCO-OT | | | | CLP637.000 | | | | 1/12/18 | | | | CLP 5,096,000 | | | | CLP 1,130,000 | | | | 29,380 | |
| | | | | | | | | | | | |
| | | | | | Principal Amount | | | | |
Short-Term Notes—0.1% | | | | | | | | | | | | |
Arab Republic of Egypt Treasury Bills, 17.25%, 7/3/189 | | | EGP | | | | 16,000,000 | | | | 809,963 | |
Arab Republic of Egypt Treasury Bills, 17.946%, 4/3/189 | | | EGP | | | | 11,000,000 | | | | 582,117 | |
Argentine Republic Treasury Bills, 26.906%, 6/21/189 | | | ARS | | | | 6,100,000 | | | | 292,848 | |
Total Short-Term Notes (Cost $1,690,472) | | | | | | | | | | | 1,684,928 | |
| | | |
| | | | | | Shares | | | | |
Investment Companies—29.5% | | | | | | | | | | | | |
Oppenheimer Institutional Government Money Market Fund, Cl. E, 1.01%10,11 | | | | | | | 178,062,806 | | | | 178,062,806 | |
|
| 28 OPPENHEIMER GLOBAL ALLOCATION FUND |
| | | | | | | | | | | | |
| | | | | | | Shares | | | | Value | |
Investment Companies (Continued) | | | | | | | | | | | | |
Oppenheimer Master Event-Linked Bond Fund, LLC10 | | | | | | | 4,616,016 | | | $ | 68,756,417 | |
Oppenheimer Master Loan Fund, LLC10 | | | | | | | 7,213,775 | | | | 120,382,841 | |
Oppenheimer Senior Floating Rate Fund, Cl. I10 | | | | | | | 4,392,376 | | | | 35,534,323 | |
PowerShares Senior Loan Portfolio Exchange Traded Fund | | | | | | | 3,351,165 | | | | 77,478,935 | |
Total Investment Companies (Cost $487,651,277) | | | | | | | | | | | 480,215,322 | |
| | | | | | | | | | | | | |
Total Investments, at Value (Cost $1,487,902,132) | | | | | | | 99.3% | | | | 1,617,335,883 | |
Net Other Assets (Liabilities) | | | | | | | 0.7 | | | | 12,076,266 | |
Net Assets | | | | | | | 100.0% | | | $ | 1,629,412,149 | |
| | | | | | | | |
Footnotes to Consolidated Statement of Investments
1. Security is a Master Limited Partnership.
2. Non-income producing security.
3. Represents securities sold under Rule 144A, which are exempt from registration under the Securities Act of 1933, as amended. These securities have been determined to be liquid under guidelines established by the Board of Trustees. These securities amount to $17,331,794 or 1.06% of the Fund’s net assets at period end.
4. The value of this security was determined using significant unobservable inputs. See Note 3 of the accompanying
Consolidated Notes.
5. All or a portion of the security position is held in accounts at a futures clearing merchant and pledged to cover margin requirements on open futures contracts and written options on futures, if applicable. The aggregate market value of such securities is $7,757,354. See Note 6 of the accompanying Consolidated Notes.
6. All or a portion of the security position is held in segregated accounts and pledged to cover margin requirements under certain derivative contracts. The aggregate market value of such securities is $3,344,210. See Note 6 of the accompanying Consolidated Notes.
7. Represents the current interest rate for a variable or increasing rate security, determined as [Referenced Rate + Basis-point spread].
8. Denotes an inflation-indexed security: coupon or principal are indexed to a consumer price index.
9. Zero coupon bond reflects effective yield on the original acquisition date.
10. Is or was an affiliate, as defined in the Investment Company Act of 1940, as amended, at or during the reporting period, by virtue of the Fund owning at least 5% of the voting securities of the issuer or as a result of the Fund and the issuer having the same investment adviser. Transactions during the reporting period in which the issuer was an affiliate are as follows:
| | | | | | | | | | | | | | | | |
| | | Shares | | | Gross | | | Gross | | | Shares | |
| | | October 31, 2016 | | | Additions | | | Reductions | | | October 31, 2017 | |
| Oppenheimer Institutional Government Money Market Fund, Cl. E | | | 23,914,591 | | | | 528,837,739 | | | | 374,689,524 | | | | 178,062,806 | |
| Oppenheimer Master Event-Linked Bond Fund, LLC | | | 4,921,101 | | | | — | | | | 305,085 | | | | 4,616,016 | |
| Oppenheimer Master Loan Fund, LLC | | | 7,213,775 | | | | — | | | | — | | | | 7,213,775 | |
| Oppenheimer Senior Floating Rate Fund, Cl. I | | | 4,985,986 | | | | 194,466 | | | | 788,076 | | | | 4,392,376 | |
| | | | |
| | | | | | | | | | | | Change in | |
| | | | | | | | | Realized | | | Unrealized | |
| | | Value | | | Income | | | Gain (Loss) | | | Gain (Loss) | |
| Oppenheimer Institutional Government Money Market Fund, Cl. E | | $ | 178,062,806 | | | $ | 460,780 | | | $ | — | | | $ | — | |
29 OPPENHEIMER GLOBAL ALLOCATION FUND
| | |
| CONSOLIDATED STATEMENT OF INVESTMENTS Continued | | |
| Footnotes to Consolidated Statement of Investments (Continued) | | |
| | | | | | | | | | | | | | |
| | | | | | | | | | | Change in | |
| | | | | | | | Realized | | | Unrealized | |
| | | Value | | Income | | | Gain (Loss) | | | Gain (Loss) | |
| |
Oppenheimer Master Event-Linked Bond Fund, LLC | | $68,756,417 | | $ | 4,791,351 | a | | $ | (488,901 | )a | | $ | (9,079,810)a | |
Oppenheimer Master Loan Fund, LLC | | 120,382,841 | | | 7,008,693 | b | | | (85,233 | )b | | | (236,550)b | |
Oppenheimer Senior Floating Rate Fund, Cl. I | | 35,534,323 | | | 1,575,974 | | | | 149,734 | | | | 47,666 | |
| | | |
Total | | $ 402,736,387 | | $ | 13,836,798 | | | $ | (424,400) | | | $ | (9,268,694) | |
| | | |
a. Represents the amount allocated to the Fund from Oppenheimer Master Event-linked Bond Fund, LLC.
b. Represents the amount allocated to the Fund from Oppenheimer Master Loan Fund, LLC.
11. Rate shown is the 7-day yield at period end.
Distribution of investments representing geographic holdings, as a percentage of total investments at value, is as follows:
| | | | | | | | | | | | | | | | |
| Geographic Holdings (Unaudited) | | Value | | | | | | Percent | | | | |
United States | | $ | 962,991,671 | | | | | | | | 59.5% | | | | | |
Japan | | | 92,788,420 | | | | | | | | 5.7 | | | | | |
France | | | 81,905,763 | | | | | | | | 5.1 | | | | | |
United Kingdom | | | 60,897,006 | | | | | | | | 3.8 | | | | | |
Germany | | | 48,567,576 | | | | | | | | 3.0 | | | | | |
China | | | 44,961,781 | | | | | | | | 2.8 | | | | | |
Switzerland | | | 40,048,633 | | | | | | | | 2.5 | | | | | |
Canada | | | 30,420,263 | | | | | | | | 1.9 | | | | | |
India | | | 22,071,122 | | | | | | | | 1.4 | | | | | |
Netherlands | | | 20,898,854 | | | | | | | | 1.3 | | | | | |
Russia | | | 19,340,834 | | | | | | | | 1.2 | | | | | |
Spain | | | 18,611,454 | | | | | | | | 1.1 | | | | | |
South Korea | | | 18,271,705 | | | | | | | | 1.1 | | | | | |
Brazil | | | 16,987,880 | | | | | | | | 1.0 | | | | | |
Hong Kong | | | 14,231,504 | | | | | | | | 0.9 | | | | | |
Mexico | | | 14,089,797 | | | | | | | | 0.9 | | | | | |
South Africa | | | 11,828,322 | | | | | | | | 0.7 | | | | | |
Indonesia | | | 10,710,280 | | | | | | | | 0.7 | | | | | |
Denmark | | | 9,469,115 | | | | | | | | 0.6 | | | | | |
Taiwan | | | 6,485,973 | | | | | | | | 0.4 | | | | | |
Malaysia | | | 6,031,457 | | | | | | | | 0.4 | | | | | |
Australia | | | 4,893,111 | | | | | | | | 0.3 | | | | | |
Thailand | | | 4,615,565 | | | | | | | | 0.3 | | | | | |
Colombia | | | 4,595,545 | | | | | | | | 0.3 | | | | | |
Peru | | | 4,526,090 | | | | | | | | 0.3 | | | | | |
Poland | | | 4,468,751 | | | | | | | | 0.3 | | | | | |
Turkey | | | 4,429,190 | | | | | | | | 0.3 | | | | | |
Sweden | | | 4,314,263 | | | | | | | | 0.3 | | | | | |
Philippines | | | 4,252,219 | | | | | | | | 0.3 | | | | | |
Hungary | | | 3,465,526 | | | | | | | | 0.2 | | | | | |
New Zealand | | | 2,806,921 | | | | | | | | 0.2 | | | | | |
30 OPPENHEIMER GLOBAL ALLOCATION FUND
| | | | | | | | | | | | | | | | |
| Geographic Holdings (Unaudited) (Continued) | | Value | | | | | Percent | | | |
Chile | | $ | 2,426,726 | | | | | | | | 0.1 | % | | | | |
Singapore | | | 2,395,511 | | | | | | | | 0.1 | | | | | |
Ireland | | | 2,296,253 | | | | | | | | 0.1 | | | | | |
United Arab Emirates | | | 2,190,577 | | | | | | | | 0.1 | | | | | |
Egypt | | | 2,181,340 | | | | | | | | 0.1 | | | | | |
Finland | | | 1,850,221 | | | | | | | | 0.1 | | | | | |
Belgium | | | 1,785,317 | | | | | | | | 0.1 | | | | | |
Argentina | | | 1,686,646 | | | | | | | | 0.1 | | | | | |
Romania | | | 1,572,784 | | | | | | | | 0.1 | | | | | |
Bermuda | | | 1,324,299 | | | | | | | | 0.1 | | | | | |
Italy | | | 1,271,939 | | | | | | | | 0.1 | | | | | |
Uruguay | | | 1,094,505 | | | | | | | | 0.1 | | | | | |
Nigeria | | | 600,172 | | | | | | | | 0.0 | | | | | |
Israel | | | 446,121 | | | | | | | | 0.0 | | | | | |
Vietnam | | | 147,600 | | | | | | | | 0.0 | | | | | |
Portugal | | | 89,281 | | | | | | | | 0.0 | | | | | |
| | | | |
Total | | $ | 1,617,335,883 | | | | | | | | 100.0 | % | | | | |
| | | | |
| | | | | | | | | | | | | | | | | | | | | | | | |
Forward Currency Exchange Contracts as of October 31, 2017 | | | | | |
| Counter- party | | Settlement
Month(s) | | | | | Currency Purchased (000’s) | | | | | Currency Sold
(000’s) | | | Unrealized
Appreciation | | | Unrealized Depreciation | |
BAC | | | 11/2017 | | | BRL | | | 270 | | | USD | | | 83 | | | $ | — | | | $ | 868 | |
BAC | | | 12/2017 | | | CLP | | | 6,699,200 | | | USD | | | 10,865 | | | | — | | | | 343,937 | |
BAC | | | 12/2017 | | | MYR | | | 73,030 | | | USD | | | 17,347 | | | | 58,135 | | | | 129,438 | |
BAC | | | 12/2017 | | | RUB | | | 914,800 | | | USD | | | 15,799 | | | | — | | | | 231,172 | |
BAC | | | 12/2017 | | | TRY | | | 200 | | | USD | | | 54 | | | | — | | | | 1,624 | |
BAC | | | 11/2017 | | | USD | | | 82 | | | BRL | | | 270 | | | | — | | | | 127 | |
BAC | | | 12/2017 | | | USD | | | 917 | | | CLP | | | 577,100 | | | | 10,409 | | | | — | |
BAC | | | 12/2017 | | | USD | | | 16,142 | | | EUR | | | 13,670 | | | | 180,456 | | | | — | |
BAC | | | 12/2017 | | | USD | | | 761 | | | MYR | | | 3,185 | | | | 7,005 | | | | — | |
BAC | | | 12/2017 | | | USD | | | 1,107 | | | RUB | | | 64,800 | | | | 5,625 | | | | — | |
BOA | | | 11/2017 | | | BRL | | | 470 | | | USD | | | 149 | | | | — | | | | 5,714 | |
BOA | | | 12/2017 | | | CLP | | | 5,008,000 | | | USD | | | 8,131 | | | | — | | | | 265,896 | |
BOA | | | 12/2017 | | | COP | | | 33,494,000 | | | USD | | | 11,323 | | | | — | | | | 355,979 | |
BOA | | | 03/2018 | | | CZK | | | 8,700 | | | USD | | | 405 | | | | — | | | | 6,988 | |
BOA | | | 12/2017 | | | HUF | | | 27,800 | | | USD | | | 107 | | | | — | | | | 2,277 | |
BOA | | | 12/2017 | | | IDR | | | 109,905,000 | | | USD | | | 8,132 | | | | — | | | | 61,645 | |
BOA | | | 12/2017 | | | INR | | | 176,000 | | | USD | | | 2,726 | | | | — | | | | 19,950 | |
BOA | | | 12/2017 | | | KRW | | | 18,323,000 | | | USD | | | 16,247 | | | | 143,952 | | | | — | |
BOA | | | 12/2017 | | | MXN | | | 2,300 | | | USD | | | 124 | | | | — | | | | 5,342 | |
BOA | | | 12/2017 | | | NOK | | | 125,720 | | | USD | | | 16,100 | | | | — | | | | 692,170 | |
BOA | | | 12/2017 | | | PLN | | | 260 | | | USD | | | 71 | | | | 622 | | | | — | |
BOA | | | 12/2017 | | | SEK | | | 253,830 | | | USD | | | 31,870 | | | | — | | | | 1,472,431 | |
BOA | | | 12/2017 | | | THB | | | 14,400 | | | USD | | | 433 | | | | 333 | | | | — | |
BOA | | | 12/2017 | | | TWD | | | 246,000 | | | USD | | | 8,203 | | | | — | | | | 18,920 | |
BOA | | | 11/2017 | | | USD | | | 143 | | | BRL | | | 470 | | | | — | | | | 221 | |
BOA | | | 12/2017 | | | USD | | | 31,382 | | | CAD | | | 38,160 | | | | 1,791,017 | | | | — | |
BOA | | | 12/2017 | | | USD | | | 31,910 | | | EUR | | | 26,550 | | | | 910,025 | | | | — | |
BOA | | | 12/2017 | | | USD | | | 1,019 | | | IDR | | | 13,791,100 | | | | 5,261 | | | | — | |
BOA | | | 12/2017 | | | USD | | | 1,622 | | | INR | | | 106,500 | | | | — | | | | 14,942 | |
31 OPPENHEIMER GLOBAL ALLOCATION FUND
| | |
| CONSOLIDATED STATEMENT OF INVESTMENTS Continued | | |
| | | |
| | | | | | | | | | | | | | | | | | | | | | | | |
| |
Forward Currency Exchange Contracts (Continued) | | | | | |
Counter -party | | Settlement Month(s) | | | | | Currency Purchased (000’s) | | | | | Currency Sold (000’s) | | | Unrealized
Appreciation | | | Unrealized Depreciation | |
| |
BOA | | | 12/2017 | | | USD | | | 13,486 | | | JPY | | | 1,532,000 | | | $ | — | | | $ | 22,507 | |
BOA | | | 12/2017 | | | USD | | | 14,612 | | | KRW | | | 16,475,000 | | | | — | | | | 125,158 | |
BOA | | | 12/2017 | | | USD | | | 19 | | | PLN | | | 70 | | | | 247 | | | | — | |
BOA | | | 12/2017 | | | USD | | | 17 | | | RON | | | 65 | | | | 496 | | | | — | |
BOA | | | 12/2017 | | | USD | | | 31,791 | | | SEK | | | 258,230 | | | | 867,038 | | | | — | |
BOA | | | 12/2017 | | | USD | | | 99 | | | THB | | | 3,300 | | | | — | | | | 534 | |
BOA | | | 12/2017 | | | USD | | | 21 | | | TRY | | | 80 | | | | 663 | | | | — | |
BOA | | | 12/2017 | | | USD | | | 2,598 | | | ZAR | | | 34,620 | | | | 170,344 | | | | — | |
BOA | | | 12/2017 | | | ZAR | | | 540 | | | USD | | | 40 | | | | — | | | | 1,875 | |
CITNA-B | | | 12/2017 | | | BRL | | | 230 | | | USD | | | 70 | | | | 99 | | | | — | |
CITNA-B | | | 12/2017 | | | EUR | | | 42,170 | | | USD | | | 49,930 | | | | — | | | | 690,940 | |
CITNA-B | | | 12/2017 | | | JPY | | | 3,577,000 | | | USD | | | 33,204 | | | | — | | | | 1,681,325 | |
CITNA-B | | | 12/2017 | | | MXN | | | 6,900 | | | USD | | | 383 | | | | — | | | | 26,525 | |
CITNA-B | | | 12/2017 | | | PLN | | | 760 | | | USD | | | 207 | | | | 2,139 | | | | — | |
CITNA-B | | | 12/2017 | | | SEK | | | 177,480 | | | USD | | | 22,284 | | | | — | | | | 1,029,816 | |
CITNA-B | | | 12/2017 | | | TRY | | | 170 | | | USD | | | 44 | | | | — | | | | 52 | |
CITNA-B | | | 12/2017 | | | USD | | | 1,487 | | | ARS | | | 26,980 | | | | — | | | | 3,186 | |
CITNA-B | | | 12/2017 | | | USD | | | 14 | | | CZK | | | 300 | | | | 267 | | | | — | |
CITNA-B | | | 12/2017 | | | USD | | | 22,425 | | | JPY | | | 2,505,000 | | | | 336,095 | | | | — | |
CITNA-B | | | 12/2017 | | | USD | | | 10,974 | | | MXN | | | 206,500 | | | | 285,034 | | | | — | |
CITNA-B | | | 12/2017 | | | USD | | | 17,478 | | | NOK | | | 139,730 | | | | 353,306 | | | | — | |
CITNA-B | | | 12/2017 | | | USD | | | 2,238 | | | PEN | | | 7,260 | | | | 9,548 | | | | — | |
CITNA-B | | | 12/2017 | | | USD | | | 6,230 | | | TRY | | | 23,750 | | | | 68,351 | | | | 23,169 | |
CITNA-B | | | 12/2017 | | | USD | | | 2,560 | | | ZAR | | | 33,330 | | | | 220,091 | | | | — | |
CITNA-B | | | 12/2017 | | | ZAR | | | 710 | | | USD | | | 51 | | | | — | | | | 1,431 | |
DEU | | | 12/2017 | | | NOK | | | 14,010 | | | USD | | | 1,812 | | | | — | | | | 95,005 | |
DEU | | | 12/2017 | | | PLN | | | 96,960 | | | USD | | | 27,280 | | | | — | | | | 638,647 | |
DEU | | | 12/2017 | | | TRY | | | 115,000 | | | USD | | | 32,783 | | | | — | | | | 2,836,752 | |
DEU | | | 12/2017 | | | USD | | | 36,646 | | | CHF | | | 34,705 | | | | 1,758,022 | | | | — | |
DEU | | | 12/2017 | | | USD | | | 85,461 | | | EUR | | | 70,960 | | | | 2,605,905 | | | | — | |
DEU | | | 12/2017 | | | USD | | | 3,271 | | | GBP | | | 2,455 | | | | 6,289 | | | | — | |
DEU | | | 12/2017 | | | USD | | | 2,669 | | | HUF | | | 675,000 | | | | 138,642 | | | | — | |
DEU | | | 12/2017 | | | USD | | | 1,627 | | | RON | | | 6,215 | | | | 54,460 | | | | — | |
GSCO-OT | | | 11/2017 | | | BRL | | | 190 | | | USD | | | 60 | | | | — | | | | 1,737 | |
GSCO-OT | | | 12/2017 | | | COP | | | 166,000 | | | USD | | | 56 | | | | — | | | | 1,587 | |
GSCO-OT | | | 12/2017 | | | IDR | | | 3,366,000 | | | USD | | | 247 | | | | 249 | | | | 179 | |
GSCO-OT | | | 12/2017 | | | INR | | | 113,600 | | | USD | | | 1,711 | | | | 35,605 | | | | — | |
GSCO-OT | | | 12/2017 | | | MXN | | | 10,100 | | | USD | | | 540 | | | | 650 | | | | 18,565 | |
GSCO-OT | | | 12/2017 | | | MYR | | | 565 | | | USD | | | 134 | | | | 46 | | | | 307 | |
GSCO-OT | | | 12/2017 | | | PHP | | | 1,000 | | | USD | | | 19 | | | | — | | | | 63 | |
GSCO-OT | | | 12/2017 | | | PLN | | | 420 | | | USD | | | 115 | | | | 886 | | | | 34 | |
GSCO-OT | | | 12/2017 | | | RON | | | 195 | | | USD | | | 50 | | | | — | | | | 955 | |
GSCO-OT | | | 12/2017 | | | RUB | | | 96,800 | | | USD | | | 1,665 | | | | — | | | | 19,885 | |
GSCO-OT | | | 12/2017 | | | TRY | | | 1,390 | | | USD | | | 372 | | | | — | | | | 10,670 | |
GSCO-OT | | | 11/2017 - 12/2017 | | | USD | | | 1,464 | | | BRL | | | 4,820 | | | | — | | | | 3,707 | |
GSCO-OT | | | 12/2017 | | | USD | | | 42 | | | COP | | | 125,000 | | | | 1,514 | | | | — | |
GSCO-OT | | | 12/2017 | | | USD | | | 23 | | | HUF | | | 6,000 | | | | 203 | | | | — | |
GSCO-OT | | | 12/2017 | | | USD | | | 94 | | | IDR | | | 1,275,000 | | | | 489 | | | | — | |
32 OPPENHEIMER GLOBAL ALLOCATION FUND
| | | | | | | | | | | | | | | | | | | | | | | | |
| |
Forward Currency Exchange Contracts (Continued) | | | | | |
Counter -party | | Settlement Month(s) | | | | | Currency Purchased (000’s) | | | | | Currency Sold
(000’s) | | | Unrealized
Appreciation | | | Unrealized Depreciation | |
| |
GSCO-OT | | | 12/2017 | | | USD | | | 67 | | | INR | | | 4,400 | | | $ | — | | | $ | 585 | |
GSCO-OT | | | 12/2017 | | | USD | | | 157 | | | MXN | | | 2,900 | | | | 7,021 | | | | — | |
GSCO-OT | | | 12/2017 | | | USD | | | 9,582 | | | MYR | | | 40,190 | | | | 79,274 | | | | 3,434 | |
GSCO-OT | | | 12/2017 | | | USD | | | 43 | | | PEN | | | 140 | | | | — | | | | 82 | |
GSCO-OT | | | 12/2017 | | | USD | | | 47 | | | TRY | | | 170 | | | | 2,382 | | | | — | |
GSCO-OT | | | 12/2017 | | | USD | | | 41 | | | ZAR | | | 570 | | | | 1,348 | | | | — | |
HSBC | | | 12/2017 | | | CNH | | | 9,520 | | | USD | | | 1,427 | | | | 4,318 | | | | — | |
HSBC | | | 12/2017 | | | COP | | | 27,658,000 | | | USD | | | 9,392 | | | | — | | | | 335,714 | |
HSBC | | | 12/2017 | | | HUF | | | 11,000 | | | USD | | | 41 | | | | 78 | | | | — | |
HSBC | | | 12/2017 | | | MXN | | | 1,700 | | | USD | | | 90 | | | | — | | | | 1,755 | |
HSBC | | | 12/2017 | | | PLN | | | 270 | | | USD | | | 74 | | | | 301 | | | | — | |
HSBC | | | 12/2017 | | | THB | | | 600 | | | USD | | | 18 | | | | — | | | | 103 | |
HSBC | | | 12/2017 | | | USD | | | 3,494 | | | DKK | | | 21,515 | | | | 117,093 | | | | — | |
HSBC | | | 12/2017 | | | USD | | | 56,257 | | | GBP | | | 42,841 | | | | — | | | | 715,239 | |
HSBC | | | 12/2017 | | | USD | | | 18,035 | | | HKD | | | 140,570 | | | | 5,170 | | | | — | |
HSBC | | | 12/2017 | | | USD | | | 6,710 | | | NZD | | | 9,285 | | | | 360,953 | | | | — | |
HSBC | | | 12/2017 | | | USD | | | 1,562 | | | PEN | | | 5,080 | | | | 2,641 | | | | — | |
HSBC | | | 12/2017 | | | USD | | | 7,923 | | | PLN | | | 29,110 | | | | — | | | | 75,298 | |
HSBC | | | 12/2017 | | | USD | | | 18,745 | | | SEK | | | 148,210 | | | | 996,391 | | | | — | |
JPM | | | 12/2017 | | | CLP | | | 5,344,000 | | | USD | | | 8,561 | | | | 1,474 | | | | 169,766 | |
JPM | | | 12/2017 | | | COP | | | 7,321,000 | | | USD | | | 2,465 | | | | — | | | | 69,290 | |
JPM | | | 12/2017 - 03/2018 | | | EUR | | | 7,195 | | | USD | | | 8,512 | | | | 1,782 | | | | 110,901 | |
JPM | | | 12/2017 | | | IDR | | | 138,887,000 | | | USD | | | 10,355 | | | | — | | | | 156,050 | |
JPM | | | 12/2017 | | | INR | | | 650,200 | | | USD | | | 10,076 | | | | 149 | | | | 72,205 | |
JPM | | | 12/2017 | | | JPY | | | 914,000 | | | USD | | | 8,188 | | | | — | | | | 133,056 | |
JPM | | | 12/2017 | | | MXN | | | 164,800 | | | USD | | | 9,184 | | | | — | | | | 650,367 | |
JPM | | | 12/2017 | | | PHP | | | 32,700 | | | USD | | | 636 | | | | — | | | | 5,717 | |
JPM | | | 12/2017 | | | RUB | | | 499,500 | | | USD | | | 8,528 | | | | — | | | | 28,326 | |
JPM | | | 12/2017 | | | THB | | | 66,900 | | | USD | | | 2,024 | | | | — | | | | 10,037 | |
JPM | | | 12/2017 | | | TRY | | | 6,790 | | | USD | | | 1,917 | | | | — | | | | 152,374 | |
JPM | | | 12/2017 | | | TWD | | | 527,000 | | | USD | | | 17,717 | | | | 13,432 | | | | 198,866 | |
JPM | | | 12/2017 | | | USD | | | 39,903 | | | CNH | | | 260,140 | | | | 787,181 | | | | — | |
JPM | | | 03/2018 | | | USD | | | 345 | | | EUR | | | 285 | | | | 10,789 | | | | — | |
JPM | | | 12/2017 | | | USD | | | 7,985 | | | IDR | | | 107,152,000 | | | | 116,821 | | | | — | |
JPM | | | 12/2017 | | | USD | | | 5,052 | | | ILS | | | 17,700 | | | | 18,438 | | | | — | |
JPM | | | 12/2017 | | | USD | | | 7,986 | | | INR | | | 515,000 | | | | 61,930 | | | | — | |
JPM | | | 12/2017 | | | USD | | | 4,744 | | | KRW | | | 5,422,000 | | | | — | | | | 105,908 | |
JPM | | | 12/2017 | | | USD | | | 8,702 | | | MXN | | | 164,800 | | | | 168,646 | | | | — | |
JPM | | | 12/2017 | | | USD | | | 4,407 | | | PHP | | | 225,000 | | | | 69,426 | | | | — | |
JPM | | | 12/2017 | | | USD | | | 52 | | | RON | | | 200 | | | | 1,138 | | | | — | |
JPM | | | 12/2017 | | | USD | | | 7,404 | | | RUB | | | 433,800 | | | | 32,544 | | | | — | |
JPM | | | 12/2017 | | | USD | | | 1,718 | | | SGD | | | 2,300 | | | | 29,636 | | | | — | |
JPM | | | 12/2017 | | | USD | | | 6,596 | | | THB | | | 218,000 | | | | 32,961 | | | | — | |
TDB | | | 11/2017 - 12/2017 | | | BRL | | | 16,580 | | | USD | | | 5,104 | | | | 436 | | | | 43,199 | |
TDB | | | 12/2017 | | | PLN | | | 9,610 | | | USD | | | 2,670 | | | | — | | | | 28,784 | |
TDB | | | 12/2017 | | | USD | | | 12,717 | | | AUD | | | 15,843 | | | | 596,981 | | | | — | |
TDB | | | 11/2017 - 12/2017 | | | USD | | | 7,099 | | | BRL | | | 22,970 | | | | 92,132 | | | | — | |
TDB | | | 12/2017 | | | USD | | | 44 | | | HUF | | | 11,400 | | | | 1,400 | | | | — | |
33 OPPENHEIMER GLOBAL ALLOCATION FUND
| | |
| CONSOLIDATED STATEMENT OF INVESTMENTS Continued | | |
| | | |
| | | | | | | | | | | | | | | | | | | | | | | | | | |
Forward Currency Exchange Contracts (Continued) | | | | | |
Counter -party | | Settlement
Month(s) | | | Currency Purchased (000’s) | | | Currency Sold (000’s) | | | Unrealized Appreciation | | | Unrealized Depreciation | |
| |
TDB | | | 12/2017 | | | USD | | | 23,782 | | | | TRY | | | | 91,250 | | | $ | 20,177 | | | $ | — | |
| | | | | | | | | | | | | | | | | | | | | | |
Total Unrealized Appreciation and Depreciation | | | | | | | | | | | $ | 13,663,961 | | | $ | 13,931,308 | |
| | | | | | | | | | | | | | | | | | | | | | |
| | | | | | | | | | | | | | | | | | | | | | | | |
Futures Contracts as of October 31, 2017 | | | | | |
| Description | | Buy/Sell | | | Expiration
Date | | | Number of Contracts | | | Notional Amount
(000’s) | | | Value | | | Unrealized Appreciation (Depreciation) | |
| |
Canadian Bonds, 10 yr. | | | Buy | | | | 12/18/17 | | | | 130 | | | | CAD 13,622 | | | $ | 13,848,461 | | | $ | 226,817 | |
Euro-BUND | | | Buy | | | | 12/7/17 | | | | 577 | | | | EUR 108,083 | | | | 109,387,276 | | | | 1,303,826 | |
Japanese Bonds, 10 yr. | | | Buy | | | | 12/13/17 | | | | 89 | | | | JPY 117,674 | | | | 117,776,967 | | | | 102,924 | |
MSCI Emerging Market Index | | | Buy | | | | 12/15/17 | | | | 198 | | | | USD 10,945 | | | | 11,129,580 | | | | 185,070 | |
Nikkei 225 Index | | | Sell | | | | 12/7/17 | | | | 39 | | | | JPY 6,572 | | | | 7,528,693 | | | | (956,686) | |
S&P 500 E-Mini Index | | | Sell | | | | 12/15/17 | | | | 339 | | | | USD 41,935 | | | | 43,608,113 | | | | (1,673,531) | |
SPI 200 Index | | | Buy | | | | 12/21/17 | | | | 142 | | | | AUD 15,509 | | | | 15,997,651 | | | | 488,800 | |
STOXX Europe 600 Index | | | Sell | | | | 12/15/17 | | | | 318 | | | | EUR 6,909 | | | | 7,312,136 | | | | (403,283) | |
United Kingdom Long Bonds, 10 yr. | | | Buy | | | | 12/27/17 | | | | 227 | | | | GBP 37,282 | | | | 37,484,257 | | | | 202,408 | |
United States Treasury Long Bonds | | | Buy | | | | 12/19/17 | | | | 85 | | | | USD 13,222 | | | | 12,959,844 | | | | (262,450) | |
United States Treasury Nts., 10 yr. | | | Buy | | | | 12/19/17 | | | | 13 | | | | USD 1,647 | | | | 1,624,188 | | | | (23,279) | |
United States Treasury Nts., 5 yr. | | | Buy | | | | 12/29/17 | | | | 589 | | | | USD 69,729 | | | | 69,023,438 | | | | (706,045) | |
United States Ultra Bonds | | | Buy | | | | 12/19/17 | | | | 98 | | | | USD 16,480 | | | | 16,148,563 | | | | (331,688) | |
| | | | | | | | | | | | | | | | | | | | | | | | |
| | | | | | | | | | | | | | | | | | | | | | $ | (1,847,117) | |
| | | | | | | | | | | | | | | | | | | | | | | | |
| | | | | | | | | | | | | | | | | | | | | | | | | | | | |
Over-the-Counter Options Written at October 31, 2017 | | | | | |
| Description | | Counter -party | | | Exercise
Price | | | Expiration Date | | | Number of
Contracts
(000’s) | | | Notional Amount (000’s) | | | Premiums Received | | | Value | |
| |
CLP Currency Put | | | GSCO-OT | | | | CLP 662.000 | | | | 1/12/18 | | | | CLP (1,175,000) | | | | CLP 5,296,000 | | | $ | 7,286 | | | $ | (8,225) | |
| |
CLP Currency Call | | | GSCO-OT | | | | CLP 615.000 | | | | 1/12/18 | | | | CLP (1,091,000) | | | | CLP 4,920,000 | | | | 9,941 | | | | (5,455) | |
| | | | | | | | | | | | | | | | | | | | | | | | |
Total Over-the-Counter Options Written | | | | | | | | | | | $ | 17,227 | | | $ | (13,680) | |
| | | | | | | | | | | | | | | | | | | | | | | | |
34 OPPENHEIMER GLOBAL ALLOCATION FUND
| | | | | | | | | | | | | | | | | | | | | | | | | | | | |
| |
Centrally Cleared Interest Rate Swaps at October 31, 2017 | | | | | |
Counter- party | | Pay/Receive
Floating
Rate | | | Floating Rate | | | Fixed
Rate | | | Maturity
Date | | | Notional Amount (000’s) | | | Value | | | Unrealized
Appreciation (Depreciation) | |
| |
GSCOI | | | Pay | | |
| MXN TIIE
BANXICO |
| | | 7.350% | | | | 3/11/22 | | | | MXN 41,358 | | | $ | 10,316 | | | $ | 10,316 | |
| |
JPM | | | Receive | | | | BZDI | | | | 9.395 | | | | 1/2/23 | | | | BRL 7,075 | | | | 27,700 | | | | 27,700 | |
| |
JPM | | | Pay | | | | BZDI | | | | 8.840 | | | | 1/4/21 | | | | BRL 19,130 | | | | (37,038 | ) | | | (37,038) | |
| |
JPM | | | Receive | | | | BZDI | | | | 7.535 | | | | 1/2/19 | | | | BRL 20,580 | | | | (9,220 | ) | | | (9,220) | |
| |
JPM | | | Receive | | | | BZDI | | | | 7.720 | | | | 7/2/18 | | | | BRL 48,270 | | | | (52,546 | ) | | | (52,546) | |
| |
JPM | | | Pay | | | | BZDI | | | | 10.500 | | | | 7/1/20 | | | | BRL 58,285 | | | | (22,168 | ) | | | (22,168) | |
| |
JPM | | | Receive | | |
| Three-Month USD
BBA LIBOR |
| | | 2.118 | | | | 3/20/22 | | | | USD 1,965 | | | | (8,226 | ) | | | (8,226) | |
| |
SIB | | | Pay | | | | BZDI | | | | 9.465 | | | | 1/2/25 | | | | BRL 3,765 | | | | (26,170 | ) | | | (26,170) | |
| |
SIB | | | Pay | | | | BZDI | | | | 10.000 | | | | 1/2/25 | | | | BRL 4,145 | | | | (4,312 | ) | | | (4,312) | |
| |
UBS | | | Pay | | |
| MXN TIIE
BANXICO |
| | | 6.860 | | | | 7/21/22 | | | | MXN 67,600 | | | | (52,898 | ) | | | (52,898) | |
| | | | | | | | | | | | | | | | | | | | | | | | |
Total Centrally Cleared Interest Rate Swaps | | | | | | | | | | | | | | | $ | (174,562 | ) | | $ | (174,562) | |
| | | | | | | | | | | | | | | | | | | | | | | | |
| | | | | | | | | | | | | | | | | | | | | | |
| |
Over-the-Counter Interest Rate Swaps at October 31, 2017 | | | | | |
Counter- party | | Pay/Receive
Floating
Rate | | | Floating Rate | | | Fixed
Rate | | | Maturity
Date | | | Notional Amount (000’s) | | | Value | | | Unrealized
Appreciation (Depreciation) | |
| |
BOA | | | Pay | | |
| Six-Month INR
FBIL MIBOR OIS
Compound |
| | | 6.250 | % | | | 9/29/22 | | | | INR 93,800 | | | $ | (1,735 | ) | | $ | (1,735) | |
| |
BOA | | | Pay | | |
| Six-Month INR
FBIL MIBOR OIS
Compound |
| | | 6.350 | | | | 6/5/22 | | | | INR 247,500 | | | | 18,318 | | | | 18,318 | |
| |
BOA | | | Pay | | |
| Six-Month INR
FBIL MIBOR OIS
Compound |
| | | 6.290 | | | | 9/28/22 | | | | INR 199,500 | | | | 2,998 | | | | 2,998 | |
| |
BOA | | | Pay | | |
| Three-Month MYR
KLIBOR BNM |
| | | 3.290 | | | | 10/27/18 | | | | MYR 10,430 | | | | (6,139 | ) | | | (6,139) | |
| |
BOA | | | Pay | | |
| Three-Month MYR
KLIBOR BNM |
| | | 3.470 | | | | 10/27/21 | | | | MYR 17,050 | | | | (38,333 | ) | | | (38,333) | |
| |
CITNA-B | | | Pay | | |
| Six-Month CLP
TNA |
| | | 3.410 | | | | 9/20/22 | | | | CLP 807,000 | | | | (3,124 | ) | | | (3,124) | |
| |
GSCOI | | | Pay | | |
| Three-Month
KRW CD KSDA |
| | | 2.090 | | | | 10/25/19 | | | | KRW 3,858,000 | | | | (2,742 | ) | | | (2,742) | |
| |
GSCOI | | | Receive | | |
| Three-Month
KRW CD KSDA |
| | | 2.088 | | | | 10/25/22 | | | | KRW 798,000 | | | | 2,602 | | | | 2,602 | |
| |
GSCOI | | | Receive | | |
| Three-Month
COP IBR OIS
Compound |
| | | 5.175 | | | | 4/20/20 | | | | COP 9,387,500 | | | | 30,537 | | | | 30,537 | |
| |
GSCOI | | | Receive | | |
| 1 Time COP IBR
OIS Compound |
| | | 5.010 | | | | 7/14/18 | | | | COP 29,471,500 | | | | (28,231 | ) | | | (28,231) | |
| |
GSCOI | | | Pay | | |
| Three-Month
COP IBR OIS
Compound |
| | | 6.260 | | | | 7/14/27 | | | | COP 3,648,800 | | | | 23,118 | | | | 23,118 | |
35 OPPENHEIMER GLOBAL ALLOCATION FUND
| | |
| CONSOLIDATED STATEMENT OF INVESTMENTS Continued | | |
| | | |
| | | | | | | | | | | | | | | | | | | | | | | | | | | | |
| |
Over-the-Counter Interest Rate Swaps (Continued) | | | | | |
Counter- party | | Pay/Receive Floating Rate | | | Floating Rate | | | Fixed
Rate | | | Maturity
Date | | | Notional Amount (000’s) | | | Value | | | Unrealized
Appreciation (Depreciation) | |
| |
| | | | | | | Three-Month | | | | | | | | | | | | | | | | | | | | | |
| | | | | | | COP IBR OIS | | | | | | | | | | | | COP | | | | | | | | | |
JPM | | | Pay | | | | Compound | | | | 5.700% | | | | 3/8/19 | | | | 14,175,000 | | | $ | 72,714 | | | $ | 72,714 | |
| |
JPM | | | Pay | | | | BZDI | | | | 10.130 | | | | 7/1/19 | | | | BRL 35,205 | | | | 39,243 | | | | 39,243 | |
| | | | | | | | | | | | | | | | | | | | | | | | |
Total Over-the-Counter Interest Rate Swaps | | | | | | | | | | | $ | 109,226 | | | $ | 109,226 | |
| | | | | | | | | | | | | | | | | | | | | | | | |
| | | | | | | | | | | | | | | | | | | | | | | | | | | | | | |
| |
Over-the-Counter Interest Rate Swaptions Written at October 31, 2017 | | | | | |
| Description | | Counter-
party | | Pay/
Receive
Floating Rate | | | Floating Rate | | | Fixed Rate | | | Expiration Date | | | Notional Amount
(000’s) | | | Premiums
Received | | | Value | |
| | | | | | | | | Six- | | | | | | | | | | | | | | | | | | | | | |
| | | | | | | | | Month | | | | | | | | | | | | | | | | | | | | | |
Interest Rate | | | | | | | | | PLN | | | | | | | | | | | | | | | | | | | | | |
Swap Maturing | | | | | | | | | WIBOR | | | | | | | | | | | | | | | | | | | | | |
2/6/23 Call | | GSCOI | | | Pay | | | | WIBO | | | | 2.580% | | | | 2/2/18 | | | PLN | 13,850 | | | $ | 19,602 | | | $ | (19,596) | |
| | |
| Glossary: | | |
| Counterparty Abbreviations |
| BAC | | Barclays Bank plc |
| BOA | | Bank of America NA |
| CITNA-B | | Citibank NA |
| DEU | | Deutsche Bank AG |
| GSCOI | | Goldman Sachs International |
| GSCO-OT | | Goldman Sachs Bank USA |
| HSBC | | HSBC Bank USA NA |
| JPM | | JPMorgan Chase Bank NA |
| SIB | | Banco Santander SA |
| TDB | | Toronto Dominion Bank |
| UBS | | UBS AG |
|
| Currency abbreviations indicate amounts reporting in currencies |
| ARS | | Argentine Peso |
| AUD | | Australian Dollar |
| BRL | | Brazilian Real |
| CAD | | Canadian Dollar |
| CHF | | Swiss Franc |
| CLP | | Chilean Peso |
| CNH | | Offshore Chinese Renminbi |
| COP | | Colombian Peso |
| CZK | | Czech Koruna |
| DKK | | Danish Krone |
| EGP | | Egyptian Pounds |
| EUR | | Euro |
| GBP | | British Pound Sterling |
| HKD | | Hong Kong Dollar |
| HUF | | Hungarian Forint |
| IDR | | Indonesian Rupiah |
36 OPPENHEIMER GLOBAL ALLOCATION FUND
Currency abbreviations indicate amounts reporting in currencies (Continued)
| | |
| ILS | | Israeli Shekel |
| INR | | Indian Rupee |
| JPY | | Japanese Yen |
| KRW | | South Korean Won |
| MXN | | Mexican Nuevo Peso |
| MYR | | Malaysian Ringgit |
| NOK | | Norwegian Krone |
| NZD | | New Zealand Dollar |
| PEN | | Peruvian New Sol |
| PHP | | Philippine Peso |
| PLN | | Polish Zloty |
| RON | | New Romanian Leu |
| RUB | | Russian Ruble |
| SEK | | Swedish Krona |
| SGD | | Singapore Dollar |
| THB | | Thailand Baht |
| TRY | | New Turkish Lira |
| TWD | | New Taiwan Dollar |
| UYU | | Uruguay Peso |
| ZAR | | South African Rand |
|
| Definitions |
| ARPP7DRR | | Argentina Central Bank 7 Day Repo Reference Rate |
| BADLARPP | | Argentina Deposit Rates Badlar Private Banks ARS 30 to 35 Days |
| BANXICO | | Banco de Mexico |
| BBA LIBOR | | British Bankers’ Association London - Interbank Offered Rate |
| BNM | | Bank Negara Malaysia |
| BUND | | German Federal Obligation |
| BZDI | | Brazil Interbank Deposit Rate |
| CD | | Certificate of Deposit |
| FBIL | | Financial Benchmarks India Private Ltd. |
| IBR | | Indicador Bancario de Referencia |
| KLIBOR | | Kuala Lumpur Interbank Offered Rate |
| KSDA | | Korean Securities Dealers Assn. |
| MIBOR | | Mumbai Interbank Offered Rate |
| MSCI | | Morgan Stanley Capital International |
| NIKKEI 225 | | 225 top-rated Japanese Companies listed on the Tokyo Stock Exchange |
| OIS | | Overnight Index Swap |
| S&P | | Standard & Poor’s |
| TIIE | | Interbank Equilibrium Interest Rate |
| TNA | | Non-Deliverable CLP Camara |
| WIBOR WIBO | | Poland Warsaw Interbank Offer Bid Rate |
See accompanying Notes to Consolidated Financial Statements.
37 OPPENHEIMER GLOBAL ALLOCATION FUND
| | |
| CONSOLIDATED STATEMENT OF | | |
| ASSETS AND LIABILITIES October 31, 2017 | | |
| | | | |
Assets | | | | |
Investments, at value—see accompanying consolidated statement of investments: | | | | |
Unaffiliated companies (cost $1,078,397,006) | | $ | 1,214,599,496 | |
Affiliated companies (cost $409,505,126) | | | 402,736,387 | |
| | | | 1,617,335,883 | |
Cash | | | 5,310,751 | |
Cash—foreign currencies (cost $838,344) | | | 838,999 | |
Cash used for collateral on centrally cleared swaps | | | 475,199 | |
Unrealized appreciation on forward currency exchange contracts | | | 13,663,961 | |
Swaps, at value | | | 189,530 | |
Centrally cleared swaps, at value | | | 38,016 | |
Receivables and other assets: | | | | |
Investments sold | | | 5,328,166 | |
Interest and dividends | | | 4,064,888 | |
Shares of beneficial interest sold | | | 983,720 | |
Variation margin receivable | | | 202,860 | |
Other | | | 375,480 | |
Total assets | | | 1,648,807,453 | |
Liabilities | | | | |
Unrealized depreciation on forward currency exchange contracts | | | 13,931,308 | |
Options written, at value (premiums received $17,227) | | | 13,680 | |
Swaps, at value | | | 80,304 | |
Centrally cleared swaps, at value | | | 212,578 | |
Swaptions written, at value (premiums received $19,602) | | | 19,596 | |
Payables and other liabilities: | | | | |
Investments purchased | | | 2,573,161 | |
Shares of beneficial interest redeemed | | | 1,102,455 | |
Trustees’ compensation | | | 528,244 | |
Distribution and service plan fees | | | 314,304 | |
Foreign capital gains tax | | | 227,040 | |
Variation margin payable | | | 207,753 | |
Shareholder communications | | | 30,754 | |
Other | | | 154,127 | |
Total liabilities | | | 19,395,304 | |
Net Assets | | $ | 1,629,412,149 | |
| | | | |
| | | | |
Composition of Net Assets | | | | |
Par value of shares of beneficial interest | | $ | 842,323 | |
Additional paid-in capital | | | 1,501,337,377 | |
Accumulated net investment loss | | | (7,499,337 | ) |
Accumulated net realized gain on investments and foreign currency transactions | | | 6,969,948 | |
Net unrealized appreciation on investments and translation of assets and liabilities denominated in foreign currencies | | | 127,761,838 | |
Net Assets | | $ | 1,629,412,149 | |
| | | | |
38 OPPENHEIMER GLOBAL ALLOCATION FUND
| | | | |
Net Asset Value Per Share | |
Class A Shares: | | | | |
| |
| Net asset value and redemption price per share (based on net assets of $1,193,012,509 and 61,242,209 shares of beneficial interest outstanding) | | $ | 19.48 | |
| |
Maximum offering price per share (net asset value plus sales charge of 5.75% of offering price) | | $ | 20.67 | |
| |
Class B Shares: | | | | |
| |
| Net asset value, redemption price (excludes applicable contingent deferred sales charge) and offering price per share (based on net assets of $7,271,572 and 389,530 shares of beneficial interest outstanding) | | $ | 18.67 | |
| |
Class C Shares: | | | | |
| |
| Net asset value, redemption price (excludes applicable contingent deferred sales charge) and offering price per share (based on net assets of $237,072,481 and 12,694,693 shares of beneficial interest outstanding) | | $ | 18.67 | |
| |
Class I Shares: | | | | |
| |
| Net asset value, redemption price and offering price per share (based on net assets of $28,162,795 and 1,446,089 shares of beneficial interest outstanding) | | $ | 19.48 | |
| |
Class R Shares: | | | | |
| |
| Net asset value, redemption price (excludes applicable contingent deferred sales charge) and offering price per share (based on net assets of $42,853,730 and 2,241,611 shares of beneficial interest outstanding) | | $ | 19.12 | |
| |
Class Y Shares: | | | | |
| |
| Net asset value, redemption price and offering price per share (based on net assets of $121,039,062 and 6,218,198 shares of beneficial interest outstanding) | | $ | 19.47 | |
See accompanying Notes to Consolidated Financial Statements.
39 OPPENHEIMER GLOBAL ALLOCATION FUND
| | |
| CONSOLIDATED STATEMENT OF | | |
| OPERATIONS For the Year Ended October 31, 2017 | | |
| | | | | | |
Allocation of Income and Expenses from Master Funds1 | | | | | | |
Net investment income allocated from Oppenheimer Master Event-Linked Bond Fund, LLC: | | | | | | |
Interest | | $ | 4,783,799 | | | |
Dividends | | | 7,552 | | | |
Net expenses | | | (339,557 | ) | | |
Net investment income allocated from Oppenheimer Master Event-Linked Bond Fund, LLC | | | 4,451,794 | | | |
Net investment income allocated from Oppenheimer Master Loan Fund, LLC: | | | | | | |
Interest | | | 6,726,214 | | | |
Dividends | | | 282,479 | | | |
Net expenses | | | (415,608 | ) | | |
Net investment income allocated from Oppenheimer Master Loan Fund, LLC | | | 6,593,085 | | | |
Total allocation of net investment income from master funds | | | 11,044,879 | | | |
Investment Income | | | | | | |
Dividends: | | | | | | |
Unaffiliated companies (net of foreign withholding taxes of $1,326,632) | | | 20,935,211 | | | |
Affiliated companies (net of foreign withholding taxes of $6,878) | | | 2,036,754 | | | |
Interest (net of foreign withholding taxes of $189,749) | | | 8,320,668 | | | |
Total investment income | | | 31,292,633 | | | |
Expenses | | | | | | |
Management fees | | | 12,229,336 | | | |
Distribution and service plan fees: | | | | | | |
Class A | | | 2,797,595 | | | |
Class B | | | 119,242 | | | |
Class C | | | 2,349,189 | | | |
Class R | | | 191,716 | | | |
Transfer and shareholder servicing agent fees: | | | | | | |
Class A | | | 2,544,485 | | | |
Class B | | | 26,396 | | | |
Class C | | | 519,636 | | | |
Class I | | | 7,609 | | | |
Class R | | | 85,846 | | | |
Class Y | | | 181,955 | | | |
Shareholder communications: | | | | | | |
Class A | | | 57,434 | | | |
Class B | | | 3,613 | | | |
Class C | | | 11,680 | | | |
Class I | | | 207 | | | |
Class R | | | 1,418 | | | |
Class Y | | | 1,833 | | | |
Custodian fees and expenses | | | 145,035 | | | |
Borrowing fees | | | 36,996 | | | |
Trustees’ compensation | | | 35,780 | | | |
Other | | | 368,472 | | | |
Total expenses | | | 21,715,473 | | | |
40 OPPENHEIMER GLOBAL ALLOCATION FUND
| | | | |
Expenses (Continued) | | | | |
Less waivers and reimbursements of expenses | | $ | (1,142,592) | |
Net expenses | | | 20,572,881 | |
Net Investment Income | | | 21,764,631 | |
Realized and Unrealized Gain (Loss) | | | | |
Net realized gain (loss) on: | | | | |
Investment transactions in: | | | | |
Unaffiliated companies (net of foreign capital gains tax of $8,979) | | | 129,129,852 | |
Affiliated companies | | | 149,734 | |
Option contracts written | | | (868,393) | |
Futures contracts | | | (20,536,498) | |
Foreign currency transactions | | | (170,592) | |
Forward currency exchange contracts | | | (11,723,197) | |
Swap contracts | | | 5,258,961 | |
Swaption contracts written | | | 29,263 | |
Net realized gain (loss) allocated from: | | | | |
Oppenheimer Master Event-Linked Bond Fund, LLC | | | (488,901) | |
Oppenheimer Master Loan Fund, LLC | | | (85,233) | |
Net realized gain | | | 100,694,996 | |
Net change in unrealized appreciation/depreciation on: | | | | |
Investment transactions in: | | | | |
Unaffiliated companies | | | 79,010,964 | |
Affiliated companies | | | 47,666 | |
Translation of assets and liabilities denominated in foreign currencies | | | 290,341 | |
Forward currency exchange contracts | | | (7,444,173) | |
Futures contracts | | | 1,075,039 | |
Option contracts written | | | 3,547 | |
Swap contracts | | | (1,174,867) | |
Swaption contracts written | | | 6 | |
Net change in unrealized appreciation/depreciation allocated from: | | | | |
Oppenheimer Master Event-Linked Bond Fund, LLC | | | (9,079,810) | |
Oppenheimer Master Loan Fund, LLC | | | (236,550) | |
Net change in unrealized appreciation/depreciation | | | 62,492,163 | |
Net Increase in Net Assets Resulting from Operations | | $ | 184,951,790 | |
| | | | |
1. The Fund invests in certain affiliated mutual funds that expect to be treated as partnerships for tax purposes. See Note 4 of the accompanying Consolidated Notes.
See accompanying Notes to Consolidated Financial Statements.
41 OPPENHEIMER GLOBAL ALLOCATION FUND
| | |
| |
| CONSOLIDATED STATEMENTS OF CHANGES IN NET ASSETS | | |
| | | | | | | | |
| | | Year Ended | | | Year Ended | |
| | | October 31, 2017 | | | October 31, 2016 | |
Operations | | | | | | | | |
Net investment income | | $ | 21,764,631 | | | $ | 18,273,225 | |
Net realized gain (loss) | | | 100,694,996 | | | | (15,866,802 | ) |
Net change in unrealized appreciation/depreciation | | | 62,492,163 | | | | 35,699,082 | |
Net increase in net assets resulting from operations | | | 184,951,790 | | | | 38,105,505 | |
| | | | | | | | |
Dividends and/or Distributions to Shareholders | | | | | | | | |
Dividends from net investment income: | | | | | | | | |
Class A | | | (31,957,138 | ) | | | (18,412,487 | ) |
Class B | | | (409,300 | ) | | | (321,701 | ) |
Class C | | | (6,145,060 | ) | | | (2,844,253 | ) |
Class I | | | (744,944 | ) | | | (180,458 | ) |
Class R | | | (1,026,798 | ) | | | (512,956 | ) |
Class Y | | | (2,079,058 | ) | | | (849,669 | ) |
| | | (42,362,298 | ) | | | (23,121,524 | ) |
Beneficial Interest Transactions | | | | | | | | |
Net increase (decrease) in net assets resulting from beneficial interest transactions: | | | | | | | | |
Class A | | | (53,432,818 | ) | | | (75,162,877 | ) |
Class B | | | (12,049,760 | ) | | | (14,955,147 | ) |
Class C | | | (22,478,232 | ) | | | (10,506,659 | ) |
Class I | | | 2,304,081 | | | | 21,912,567 | |
Class R | | | 1,975,345 | | | | 323,979 | |
Class Y | | | 52,486,258 | | | | 14,335,715 | |
| | | (31,195,126 | ) | | | (64,052,422 | ) |
Net Assets | | | | | | | | |
Total increase (decrease) | | | 111,394,366 | | | | (49,068,441 | ) |
Beginning of period | | | 1,518,017,783 | | | | 1,567,086,224 | |
End of period (including accumulated net investment income (loss) of $(7,499,337) and $22,943,380, respectively) | | $ | 1,629,412,149 | | | $ | 1,518,017,783 | |
| | | | | | | | |
See accompanying Notes to Consolidated Financial Statements.
42 OPPENHEIMER GLOBAL ALLOCATION FUND
| | |
| |
| CONSOLIDATED FINANCIAL HIGHLIGHTS | | |
| | | | | | | | | | | | | | | | | | | | |
| | | Year Ended | | | Year Ended | | | Year Ended | | | Year Ended | | | Year Ended | |
Class A | | October 31, | | | October 31, | | | October 30, | | | October 31, | | | October 31, | |
| | 2017 | | | 2016 | | | 20151 | | | 2014 | | | 2013 | |
| |
Per Share Operating Data | | | | | | | | | | | | | | | | | | | | |
Net asset value, beginning of period | | | $17.77 | | | | $17.58 | | | | $17.43 | | | | $17.27 | | | | $14.70 | |
| |
| Income (loss) from investment operations: | | | | | | | | | | | | | | | | | | | | |
| Net investment income2 | | | 0.28 | | | | 0.23 | | | | 0.24 | | | | 0.27 | | | | 0.34 | |
| Net realized and unrealized gain | | | 1.94 | | | | 0.23 | | | | 0.15 | | | | 0.21 | | | | 2.41 | |
| | | | |
Total from investment operations | | | 2.22 | | | | 0.46 | | | | 0.39 | | | | 0.48 | | | | 2.75 | |
| |
| Dividends and/or distributions to shareholders: | | | | | | | | | | | | | | | | | | | | |
Dividends from net investment income | | | (0.51) | | | | (0.27) | | | | (0.24) | | | | (0.32) | | | | (0.18) | |
| |
| Net asset value, end of period | | | $19.48 | | | | $17.77 | | | | $17.58 | | | | $17.43 | | | | $17.27 | |
| | | | |
| | | | |
| |
Total Return, at Net Asset Value3 | | | 12.84% | | | | 2.72% | | | | 2.26% | | | | 2.85% | | | | 18.81% | |
| | | | | | | | | | | | | | | | | | | | |
| |
Ratios/Supplemental Data | | | | | | | | | | | | | | | | | | | | |
Net assets, end of period (in thousands) | | | $1,193,012 | | | | $1,139,315 | | | | $1,203,181 | | | | $1,279,187 | | | | $1,369,331 | |
| |
Average net assets (in thousands) | | | $1,157,102 | | | | $1,150,095 | | | | $1,247,197 | | | | $1,336,323 | | | | $1,327,442 | |
| |
| Ratios to average net assets:4,5 | | | | | | | | | | | | | | | | | | | | |
| Net investment income | | | 1.51% | | | | 1.33% | | | | 1.39% | | | | 1.58% | | | | 2.11% | |
| Expenses excluding specific expenses listed below | | | 1.34% | | | | 1.34% | | | | 1.33% | | | | 1.37% | | | | 1.43% | |
| Interest and fees from borrowings | | | 0.00%6 | | | | 0.00%6 | | | | 0.00%6 | | | | 0.00% | | | | 0.00% | |
| | | | |
| Total expenses7 | | | 1.34% | | | | 1.34% | | | | 1.33% | | | | 1.37% | | | | 1.43% | |
| Expenses after payments, waivers and/or reimbursements and reduction to custodian expenses | | | 1.27% | | | | 1.28% | | | | 1.28% | | | | 1.30% | | | | 1.35% | |
| |
Portfolio turnover rate | | | 40% | | | | 84% | | | | 83% | | | | 43% | | | | 37% | |
1. Represents the last business day of the Fund’s reporting period.
2. Per share amounts calculated based on the average shares outstanding during the period.
3. Assumes an initial investment on the business day before the first day of the fiscal period, with all dividends and distributions reinvested in additional shares on the reinvestment date, and redemption at the net asset value calculated on the last business day of the fiscal period. Sales charges are not reflected in the total returns. Total returns are not annualized for periods less than one full year. Returns do not reflect the deduction of taxes that a shareholder would pay on fund distributions or the redemption of fund shares.
4. Annualized for periods less than one full year.
5. Includes the Fund’s share of the allocated expenses and/or net investment income from the master funds.
6. Less than 0.005%.
7. Total expenses including indirect expenses from affiliated fund fees and expenses were as follows:
| | | | | | | | | | | | |
Year Ended October 31, 2017 | | | 1.36 | % | | | | | | | | |
Year Ended October 31, 2016 | | | 1.35 | % | | | | | | | | |
Year Ended October 30, 2015 | | | 1.33 | % | | | | | | | | |
Year Ended October 31, 2014 | | | 1.38 | % | | | | | | | | |
Year Ended October 31, 2013 | | | 1.44 | % | | | | | | | | |
See accompanying Notes to Consolidated Financial Statements.
43 OPPENHEIMER GLOBAL ALLOCATION FUND
| | |
| CONSOLIDATED FINANCIAL HIGHLIGHTS Continued | | |
| | | |
| | | | | | | | | | | | | | | | | | | | |
| | | Year Ended | | | Year Ended | | | Year Ended | | | Year Ended | | | Year Ended | |
| Class B | | October 31, | | | October 31, | | | October 30, | | | October 31, | | | October 31, | |
| | 2017 | | | 2016 | | | 20151 | | | 2014 | | | 2013 | |
| |
Per Share Operating Data | | | | | | | | | | | | | | | | | | | | |
Net asset value, beginning of period | | | $17.12 | | | | $16.99 | | | | $16.86 | | | | $16.76 | | | | $14.30 | |
| |
| Income (loss) from investment operations: | | | | | | | | | | | | | | | | | | | | |
| Net investment income2 | | | 0.13 | | | | 0.09 | | | | 0.11 | | | | 0.13 | | | | 0.19 | |
| Net realized and unrealized gain | | | 1.86 | | | | 0.23 | | | | 0.14 | | | | 0.21 | | | | 2.34 | |
Total from investment operations | | | 1.99 | | | | 0.32 | | | | 0.25 | | | | 0.34 | | | | 2.53 | |
| |
| Dividends and/or distributions to shareholders: | | | | | | | | | | | | | | | | | | | | |
Dividends from net investment income | | | (0.44) | | | | (0.19) | | | | (0.12) | | | | (0.24) | | | | (0.07) | |
| |
| Net asset value, end of period | | | $18.67 | | | | $17.12 | | | | $16.99 | | | | $16.86 | | | | $16.76 | |
| | | | | | | | | | | | | | | | | | | | |
| | | | |
Total Return, at Net Asset Value3 | | | 11.95% | | | | 1.99% | | | | 1.45% | | | | 2.05% | | | | 17.72% | |
| | | | | | | | | | | | | | | | | | | | |
Ratios/Supplemental Data | | | | | | | | | | | | | | | | | | | | |
Net assets, end of period (in thousands) | | | $7,272 | | | | $18,396 | | | | $33,478 | | | | $56,317 | | | | $84,161 | |
| |
Average net assets (in thousands) | | | $11,960 | | | | $24,510 | | | | $42,919 | | | | $69,381 | | | | $91,497 | |
| |
| Ratios to average net assets:4,5 | | | | | | | | | | | | | | | | | | | | |
| Net investment income | | | 0.76% | | | | 0.54% | | | | 0.63% | | | | 0.79% | | | | 1.24% | |
| Expenses excluding specific expenses listed below | | | 2.12% | | | | 2.12% | | | | 2.08% | | | | 2.21% | | | | 2.42% | |
| Interest and fees from borrowings | | | 0.00%6 | | | | 0.00%6 | | | | 0.00%6 | | | | 0.00% | | | | 0.00% | |
| | | | |
| Total expenses7 | | | 2.12% | | | | 2.12% | | | | 2.08% | | | | 2.21% | | | | 2.42% | |
| Expenses after payments, waivers and/or reimbursements and reduction to custodian expenses | | | 2.05% | | | | 2.06% | | | | 2.03% | | | | 2.09% | | | | 2.22% | |
| |
Portfolio turnover rate | | | 40% | | | | 84% | | | | 83% | | | | 43% | | | | 37% | |
1. Represents the last business day of the Fund’s reporting period.
2. Per share amounts calculated based on the average shares outstanding during the period.
3. Assumes an initial investment on the business day before the first day of the fiscal period, with all dividends and distributions reinvested in additional shares on the reinvestment date, and redemption at the net asset value calculated on the last business day of the fiscal period. Sales charges are not reflected in the total returns. Total returns are not annualized for periods less than one full year. Returns do not reflect the deduction of taxes that a shareholder would pay on fund distributions or the redemption of fund shares.
4. Annualized for periods less than one full year.
5. Includes the Fund’s share of the allocated expenses and/or net investment income from the master funds.
6. Less than 0.005%.
7. Total expenses including indirect expenses from affiliated fund fees and expenses were as follows:
| | | | | | | | | | | | |
Year Ended October 31, 2017 | | | 2.14 | % | | | | | | | | |
Year Ended October 31, 2016 | | | 2.13 | % | | | | | | | | |
Year Ended October 30, 2015 | | | 2.08 | % | | | | | | | | |
Year Ended October 31, 2014 | | | 2.22 | % | | | | | | | | |
Year Ended October 31, 2013 | | | 2.43 | % | | | | | | | | |
See accompanying Notes to Consolidated Financial Statements.
44 OPPENHEIMER GLOBAL ALLOCATION FUND
| | | | | | | | | | | | | | | | | | | | |
| | | Year Ended | | | Year Ended | | | Year Ended | | | Year Ended | | | Year Ended | |
| Class C | | October 31, | | | October 31, | | | October 30, | | | October 31, | | | October 31, | |
| | 2017 | | | 2016 | | | 20151 | | | 2014 | | | 2013 | |
| |
Per Share Operating Data | | | | | | | | | | | | | | | | | | | | |
Net asset value, beginning of period | | | $17.13 | | | | $17.00 | | | | $16.88 | | | | $16.78 | | | | $14.31 | |
| |
| Income (loss) from investment operations: | | | | | | | | | | | | | | | | | | | | |
| Net investment income2 | | | 0.14 | | | | 0.10 | | | | 0.11 | | | | 0.14 | | | | 0.22 | |
| Net realized and unrealized gain | | | 1.85 | | | | 0.23 | | | | 0.14 | | | | 0.21 | | | | 2.33 | |
| | | | |
| Total from investment operations | | | 1.99 | | | | 0.33 | | | | 0.25 | | | | 0.35 | | | | 2.55 | |
| |
| Dividends and/or distributions to shareholders: | | | | | | | | | | | | | | | | | | | | |
Dividends from net investment income | | | (0.45) | | | | (0.20) | | | | (0.13) | | | | (0.25) | | | | (0.08) | |
| |
| Net asset value, end of period | | | $18.67 | | | | $17.13 | | | | $17.00 | | | | $16.88 | | | | $16.78 | |
| | | | |
| | | | |
| |
Total Return, at Net Asset Value3 | | | 11.99% | | | | 1.97% | | | | 1.50% | | | | 2.10% | | | | 17.90% | |
|
| |
Ratios/Supplemental Data | | | | | | | | | | | | | | | | | | | | |
Net assets, end of period (in thousands) | | | $237,072 | | | | $238,771 | | | | $247,445 | | | | $262,594 | | | | $281,444 | |
| |
Average net assets (in thousands) | | | $236,259 | | | | $240,948 | | | | $256,637 | | | | $275,145 | | | | $273,813 | |
| |
| Ratios to average net assets:4,5 | | | | | | | | | | | | | | | | | | | | |
| Net investment income | | | 0.77% | | | | 0.58% | | | | 0.64% | | | | 0.83% | | | | 1.39% | |
| Expenses excluding specific expenses listed below | | | 2.09% | | | | 2.09% | | | | 2.08% | | | | 2.12% | | | | 2.14% | |
| Interest and fees from borrowings | | | 0.00%6 | | | | 0.00%6 | | | | 0.00%6 | | | | 0.00% | | | | 0.00% | |
| | | | |
| Total expenses7 | | | 2.09% | | | | 2.09% | | | | 2.08% | | | | 2.12% | | | | 2.14% | |
| Expenses after payments, waivers and/or reimbursements and reduction to custodian expenses | | | 2.02% | | | | 2.03% | | | | 2.03% | | | | 2.05% | | | | 2.06% | |
| |
| Portfolio turnover rate | | | 40% | | | | 84% | | | | 83% | | | | 43% | | | | 37% | |
1. Represents the last business day of the Fund’s reporting period.
2. Per share amounts calculated based on the average shares outstanding during the period.
3. Assumes an initial investment on the business day before the first day of the fiscal period, with all dividends and distributions reinvested in additional shares on the reinvestment date, and redemption at the net asset value calculated on the last business day of the fiscal period. Sales charges are not reflected in the total returns. Total returns are not annualized for periods less than one full year. Returns do not reflect the deduction of taxes that a shareholder would pay on fund distributions or the redemption of fund shares.
4. Annualized for periods less than one full year.
5. Includes the Fund’s share of the allocated expenses and/or net investment income from the master funds.
6. Less than 0.005%.
7. Total expenses including indirect expenses from affiliated fund fees and expenses were as follows:
| | | | | | | | | | | | |
Year Ended October 31, 2017 | | | 2.11 | % | | | | | | | | |
Year Ended October 31, 2016 | | | 2.10 | % | | | | | | | | |
Year Ended October 30, 2015 | | | 2.08 | % | | | | | | | | |
Year Ended October 31, 2014 | | | 2.13 | % | | | | | | | | |
Year Ended October 31, 2013 | | | 2.15 | % | | | | | | | | |
See accompanying Notes to Consolidated Financial Statements.
45 OPPENHEIMER GLOBAL ALLOCATION FUND
| | |
| CONSOLIDATED FINANCIAL HIGHLIGHTS Continued | | |
| | |
| | | | | | | | | | | | | | | | | | | | |
| | | Year Ended | | | Year Ended | | | Year Ended | | | Year Ended | | | Year Ended | |
| | | October 31, | | | October 31, | | | October 30, | | | October 31, | | | October 31, | |
| Class I | | 2017 | | | 2016 | | | 20151 | | | 2014 | | | 2013 | |
| |
Per Share Operating Data | | | | | | | | | | | | | | | | | | | | |
Net asset value, beginning of period | | | $17.75 | | | | $17.56 | | | | $17.41 | | | | $17.25 | | | | $14.69 | |
| |
Income (loss) from investment operations: | | | | | | | | | | | | | | | | | | | | |
Net investment income2 | | | 0.36 | | | | 0.29 | | | | 0.31 | | | | 0.32 | | | | 0.34 | |
Net realized and unrealized gain | | | 1.93 | | | | 0.25 | | | | 0.16 | | | | 0.24 | | | | 2.48 | |
| | | | |
Total from investment operations | | | 2.29 | | | | 0.54 | | | | 0.47 | | | | 0.56 | | | | 2.82 | |
| |
Dividends and/or distributions to shareholders: | | | | | | | | | | | | | | | | | | | | |
Dividends from net investment income | | | (0.56) | | | | (0.35) | | | | (0.32) | | | | (0.40) | | | | (0.26) | |
| |
Net asset value, end of period | | | $19.48 | | | | $17.75 | | | | $17.56 | | | | $17.41 | | | | $17.25 | |
| | | | |
| | | | |
| |
Total Return, at Net Asset Value3 | | | 13.33% | | | | 3.18% | | | | 2.71% | | | | 3.32% | | | | 19.35% | |
|
| |
Ratios/Supplemental Data | | | | | | | | | | | | | | | | | | | | |
Net assets, end of period (in thousands) | | | $28,163 | | | | $23,444 | | | | $747 | | | | $3,031 | | | | $775 | |
| |
Average net assets (in thousands) | | | $25,390 | | | | $9,808 | | | | $877 | | | | $1,075 | | | | $147 | |
| |
Ratios to average net assets:4,5 | | | | | | | | | | | | | | | | | | | | |
Net investment income | | | 1.93% | | | | 1.66% | | | | 1.74% | | | | 1.90% | | | | 2.01% | |
Expenses excluding specific expenses listed below | | | 0.90% | | | | 0.85% | | | | 0.88% | | | | 0.94% | | | | 0.92% | |
Interest and fees from borrowings | | | 0.00%6 | | | | 0.00%6 | | | | 0.00%6 | | | | 0.00% | | | | 0.00% | |
| | | | |
Total expenses7 | | | 0.90% | | | | 0.85% | | | | 0.88% | | | | 0.94% | | | | 0.92% | |
| Expenses after payments, waivers and/or reimbursements and reduction to custodian expenses | | | 0.84% | | | | 0.79% | | | | 0.83% | | | | 0.87% | | | | 0.84% | |
| |
Portfolio turnover rate | | | 40% | | | | 84% | | | | 83% | | | | 43% | | | | 37% | |
1. Represents the last business day of the Fund’s reporting period.
2. Per share amounts calculated based on the average shares outstanding during the period.
3. Assumes an initial investment on the business day before the first day of the fiscal period, with all dividends and distributions reinvested in additional shares on the reinvestment date, and redemption at the net asset value calculated on the last business day of the fiscal period. Sales charges are not reflected in the total returns. Total returns are not annualized for periods less than one full year. Returns do not reflect the deduction of taxes that a shareholder would pay on fund distributions or the redemption of fund shares.
4. Annualized for periods less than one full year.
5. Includes the Fund’s share of the allocated expenses and/or net investment income from the master funds.
6. Less than 0.005%.
7. Total expenses including indirect expenses from affiliated fund fees and expenses were as follows:
| | | | | | | | | | | | |
Year Ended October 31, 2017 | | | 0.92 | % | | | | | | | | |
Year Ended October 31, 2016 | | | 0.86 | % | | | | | | | | |
Year Ended October 30, 2015 | | | 0.88 | % | | | | | | | | |
Year Ended October 31, 2014 | | | 0.95 | % | | | | | | | | |
Year Ended October 31, 2013 | | | 0.93 | % | | | | | | | | |
See accompanying Notes to Consolidated Financial Statements.
46 OPPENHEIMER GLOBAL ALLOCATION FUND
| | | | | | | | | | | | | | | | | | | | |
| | | Year Ended | | | Year Ended | | | Year Ended | | | Year Ended | | | Year Ended | |
| | | October 31, | | | October 31, | | | October 30, | | | October 31, | | | October 31, | |
| Class R | | 2017 | | | 2016 | | | 20151 | | | 2014 | | | 2013 | |
| |
Per Share Operating Data | | | | | | | | | | | | | | | | | | | | |
Net asset value, beginning of period | | | $17.47 | | | | $17.29 | | | | $17.15 | | | | $17.01 | | | | $14.48 | |
| |
Income (loss) from investment operations: | | | | | | | | | | | | | | | | | | | | |
Net investment income2 | | | 0.23 | | | | 0.18 | | | | 0.20 | | | | 0.23 | | | | 0.29 | |
Net realized and unrealized gain | | | 1.90 | | | | 0.24 | | | | 0.14 | | | | 0.20 | | | | 2.38 | |
| | | | |
Total from investment operations | | | 2.13 | | | | 0.42 | | | | 0.34 | | | | 0.43 | | | | 2.67 | |
| |
Dividends and/or distributions to shareholders: | | | | | | | | | | | | | | | | | | | | |
Dividends from net investment income | | | (0.48) | | | | (0.24) | | | | (0.20) | | | | (0.29) | | | | (0.14) | |
| |
| Net asset value, end of period | | | $19.12 | | | | $17.47 | | | | $17.29 | | | | $17.15 | | | | $17.01 | |
| | | | |
| | | | |
| |
Total Return, at Net Asset Value3 | | | 12.55% | | | | 2.51% | | | | 1.98% | | | | 2.56% | | | | 18.52% | |
|
| |
Ratios/Supplemental Data | | | | | | | | | | | | | | | | | | | | |
Net assets, end of period (in thousands) | | | $42,854 | | | | $37,321 | | | | $36,537 | | | | $39,483 | | | | $43,683 | |
| |
Average net assets (in thousands) | | | $39,052 | | | | $36,498 | | | | $38,398 | | | | $42,159 | | | | $44,174 | |
| |
Ratios to average net assets:4,5 | | | | | | | | | | | | | | | | | | | | |
Net investment income | | | 1.26% | | | | 1.09% | | | | 1.14% | | | | 1.33% | | | | 1.86% | |
Expenses excluding specific expenses listed below | | | 1.59% | | | | 1.59% | | | | 1.58% | | | | 1.63% | | | | 1.68% | |
Interest and fees from borrowings | | | 0.00%6 | | | | 0.00%6 | | | | 0.00%6 | | | | 0.00% | | | | 0.00% | |
| | | | |
Total expenses7 | | | 1.59% | | | | 1.59% | | | | 1.58% | | | | 1.63% | | | | 1.68% | |
| Expenses after payments, waivers and/or reimbursements and reduction to custodian expenses | | | 1.52% | | | | 1.53% | | | | 1.53% | | | | 1.56% | | | | 1.60% | |
| |
Portfolio turnover rate | | | 40% | | | | 84% | | | | 83% | | | | 43% | | | | 37% | |
1. Represents the last business day of the Fund’s reporting period.
2. Per share amounts calculated based on the average shares outstanding during the period.
3. Assumes an initial investment on the business day before the first day of the fiscal period, with all dividends and distributions reinvested in additional shares on the reinvestment date, and redemption at the net asset value calculated on the last business day of the fiscal period. Sales charges are not reflected in the total returns. Total returns are not annualized for periods less than one full year. Returns do not reflect the deduction of taxes that a shareholder would pay on fund distributions or the redemption of fund shares.
4. Annualized for periods less than one full year.
5. Includes the Fund’s share of the allocated expenses and/or net investment income from the master funds.
6. Less than 0.005%.
7. Total expenses including indirect expenses from affiliated fund fees and expenses were as follows:
| | | | | | | | | | | | |
Year Ended October 31, 2017 | | | 1.61 | % | | | | | | | | |
Year Ended October 31, 2016 | | | 1.60 | % | | | | | | | | |
Year Ended October 30, 2015 | | | 1.58 | % | | | | | | | | |
Year Ended October 31, 2014 | | | 1.64 | % | | | | | | | | |
Year Ended October 31, 2013 | | | 1.69 | % | | | | | | | | |
See accompanying Notes to Consolidated Financial Statements.
47 OPPENHEIMER GLOBAL ALLOCATION FUND
| | |
| CONSOLIDATED FINANCIAL HIGHLIGHTS Continued | | |
| | |
| | | | | | | | | | | | | | | | | | | | |
| | | Year Ended | | | Year Ended | | | Year Ended | | | Year Ended | | | Year Ended | |
Class Y | | October 31, | | | October 31, | | | October 30, | | | October 31, | | | October 31, | |
| | 2017 | | | 2016 | | | 20151 | | | 2014 | | | 2013 | |
| |
Per Share Operating Data | | | | | | | | | | | | | | | | | | | | |
Net asset value, beginning of period | | | $17.75 | | | | $17.56 | | | | $17.42 | | | | $17.26 | | | | $14.69 | |
| |
Income (loss) from investment operations: | | | | | | | | | | | | | | | | | | | | |
Net investment income2 | | | 0.32 | | | | 0.28 | | | | 0.29 | | | | 0.32 | | | | 0.40 | |
Net realized and unrealized gain | | | 1.94 | | | | 0.23 | | | | 0.14 | | | | 0.22 | | | | 2.41 | |
| | | | |
Total from investment operations | | | 2.26 | | | | 0.51 | | | | 0.43 | | | | 0.54 | | | | 2.81 | |
| |
Dividends and/or distributions to shareholders: | | | | | | | | | | | | | | | | | | | | |
Dividends from net investment income | | | (0.54) | | | | (0.32) | | | | (0.29) | | | | (0.38) | | | | (0.24) | |
| |
Net asset value, end of period | | | $19.47 | | | | $17.75 | | | | $17.56 | | | | $17.42 | | | | $17.26 | |
| | | | |
| | | | |
| |
Total Return, at Net Asset Value3 | | | 13.13% | | | | 2.97% | | | | 2.47% | | | | 3.17% | | | | 19.26% | |
|
| |
Ratios/Supplemental Data | | | | | | | | | | | | | | | | | | | | |
Net assets, end of period (in thousands) | | | $121,039 | | | | $60,771 | | | | $45,698 | | | | $40,652 | | | | $37,264 | |
| |
Average net assets (in thousands) | | | $82,959 | | | | $52,148 | | | | $42,596 | | | | $39,075 | | | | $33,958 | |
| |
Ratios to average net assets:4,5 | | | | | | | | | | | | | | | | | | | | |
Net investment income | | | 1.72% | | | | 1.63% | | | | 1.63% | | | | 1.86% | | | | 2.47% | |
Expenses excluding specific expenses listed below | | | 1.10% | | | | 1.09% | | | | 1.08% | | | | 1.09% | | | | 1.06% | |
Interest and fees from borrowings | | | 0.00%6 | | | | 0.00%6 | | | | 0.00%6 | | | | 0.00% | | | | 0.00% | |
| | | | |
Total expenses7 | | | 1.10% | | | | 1.09% | | | | 1.08% | | | | 1.09% | | | | 1.06% | |
| Expenses after payments, waivers and/or reimbursements and reduction to custodian expenses | | | 1.03% | | | | 1.03% | | | | 1.03% | | | | 1.02% | | | | 0.98% | |
| |
Portfolio turnover rate | | | 40% | | | | 84% | | | | 83% | | | | 43% | | | | 37% | |
1. Represents the last business day of the Fund’s reporting period.
2. Per share amounts calculated based on the average shares outstanding during the period.
3. Assumes an initial investment on the business day before the first day of the fiscal period, with all dividends and distributions reinvested in additional shares on the reinvestment date, and redemption at the net asset value calculated on the last business day of the fiscal period. Sales charges are not reflected in the total returns. Total returns are not annualized for periods less than one full year. Returns do not reflect the deduction of taxes that a shareholder would pay on fund distributions or the redemption of fund shares.
4. Annualized for periods less than one full year.
5. Includes the Fund’s share of the allocated expenses and/or net investment income from the master funds.
6. Less than 0.005%.
7. Total expenses including indirect expenses from affiliated fund fees and expenses were as follows:
| | | | | | | | | | | | |
Year Ended October 31, 2017 | | | 1.12 | % | | | | | | | | |
Year Ended October 31, 2016 | | | 1.10 | % | | | | | | | | |
Year Ended October 30, 2015 | | | 1.08 | % | | | | | | | | |
Year Ended October 31, 2014 | | | 1.10 | % | | | | | | | | |
Year Ended October 31, 2013 | | | 1.07 | % | | | | | | | | |
See accompanying Notes to Consolidated Financial Statements.
48 OPPENHEIMER GLOBAL ALLOCATION FUND
| | |
NOTES TO CONSOLIDATED FINANCIAL STATEMENTS October 31, 2017 | | |
1. Organization
Oppenheimer Global Allocation Fund (the “Fund”), a series of Oppenheimer Quest for Value Funds, is registered under the Investment Company Act of 1940 (“1940 Act”), as amended, as a diversified open-end management investment company. The Fund’s investment objective is to seek total return. The Fund’s investment adviser is OFI Global Asset Management, Inc. (“OFI Global” or the “Manager”), a wholly-owned subsidiary of OppenheimerFunds, Inc. (“OFI” or the “Sub-Adviser”). The Manager has entered into a sub-advisory agreement with OFI.
The Fund offers Class A, Class C, Class I, Class R and Class Y shares, and previously offered Class B shares for new purchase through June 29, 2012. Subsequent to that date, no new purchases of Class B shares are permitted, however reinvestment of dividend and/or capital gain distributions and exchanges of Class B shares into and from other Oppenheimer funds are allowed. Class A shares are sold at their offering price, which is normally net asset value plus a front-end sales charge. Class C and Class R shares are sold, and Class B shares were sold, without a front-end sales charge but may be subject to a CDSC. Class R shares are sold only through retirement plans. Retirement plans that offer Class R shares may impose charges on those accounts. Class I and Class Y shares are sold to certain institutional investors or intermediaries without either a front-end sales charge or a CDSC, however, the intermediaries may impose charges on their accountholders who beneficially own Class I and Class Y shares. All classes of shares have identical rights and voting privileges with respect to the Fund in general and exclusive voting rights on matters that affect that class alone. Earnings, net assets and net asset value per share may differ due to each class having its own expenses, such as transfer and shareholder servicing agent fees and shareholder communications, directly attributable to that class. Class A, B, C and R shares have separate distribution and/or service plans under which they pay fees. Class I and Class Y shares do not pay such fees. Class B shares will automatically convert to Class A shares 72 months after the date of purchase.
The following is a summary of significant accounting policies followed in the Fund’s preparation of financial statements in accordance with accounting principles generally accepted in the United States (“U.S. GAAP”).
2. Significant Accounting Policies
Security Valuation. All investments in securities are recorded at their estimated fair value, as described in Note 3.
Basis for Consolidation. The Fund has established a Cayman Islands exempted company, Oppenheimer Global Allocation Fund (Cayman) Ltd., which is wholly-owned and controlled by the Fund (the “Subsidiary”). The Fund and Subsidiary are both managed by the Manager. The Fund may invest up to 25% of its total assets in the Subsidiary. The Subsidiary invests primarily in commodity-linked derivatives (including commodity futures, financial futures, options and swap contracts) and exchange traded funds related to gold or other special minerals (“Gold ETFs”). The Subsidiary may also invest in certain fixed-income securities and other investments that may serve as margin or collateral for its derivatives positions. The Fund applies its investment restrictions and compliance policies and procedures, on a look-through
49 OPPENHEIMER GLOBAL ALLOCATION FUND
| | |
NOTES TO CONSOLIDATED FINANCIAL STATEMENTS Continued | | |
2. Significant Accounting Policies (Continued)
basis, to the Subsidiary.
The financial statements have been consolidated and include accounts of the Fund and the Subsidiary. Accordingly, all inter-company transactions and balances have been eliminated. At period end, the Fund owned 899 shares with net assets of $4,360,690 in the Subsidiary.
Other financial information at period end:
| | | | |
Total market value of investments* | | $ | — | |
Net assets | | $ | 4,360,690 | |
Net income (loss) | | $ | (61,700 | ) |
Net realized gain (loss) | | $ | — | |
Net change in unrealized appreciation/depreciation | | $ | — | |
*At period end, the Subsidiary only held cash.
Foreign Currency Translation. The books and records of the Fund are maintained in U.S. dollars. Any foreign currency amounts are translated into U.S. dollars on the following basis:
(1) Value of investment securities, other assets and liabilities — at the exchange rates prevailing at Market Close as described in Note 3.
(2) Purchases and sales of investment securities, income and expenses — at the rates of exchange prevailing on the respective dates of such transactions.
Although the net assets and the values are presented at the foreign exchange rates at Market Close, the Fund does not isolate the portion of the results of operations resulting from changes in foreign exchange rates on investments from the fluctuations arising from changes in prices of securities held. Such fluctuations are included with the net realized and unrealized gains or losses from investments shown in the Consolidated Statement of Operations.
For securities, which are subject to foreign withholding tax upon disposition, realized gains or losses on such securities are recorded net of foreign withholding tax.
Reported net realized foreign exchange gains or losses arise from sales of foreign currencies, currency gains or losses realized between the trade and settlement dates on securities transactions, the difference between the amounts of dividends, interest, and foreign withholding tax reclaims recorded on the Fund’s books, and the U.S. dollar equivalent of the amounts actually received or paid. Net unrealized foreign exchange gains and losses arise from changes in the value of assets and liabilities other than investments in securities, resulting from changes in the exchange rate.
Allocation of Income, Expenses, Gains and Losses. Income, expenses (other than those attributable to a specific class), gains and losses are allocated on a daily basis to each class of shares based upon the relative proportion of net assets represented by such class. Operating expenses directly attributable to a specific class are charged against the operations of that class.
Dividends and Distributions to Shareholders. Dividends and distributions to
50 OPPENHEIMER GLOBAL ALLOCATION FUND
2. Significant Accounting Policies (Continued)
shareholders, which are determined in accordance with income tax regulations and may differ from U.S. GAAP, are recorded on the ex-dividend date. Income distributions, if any, are declared and paid quarterly. Capital gain distributions, if any, are declared and paid annually or at other times as deemed necessary by the Manager.
Investment Income. Dividend income is recorded on the ex-dividend date or upon ex-dividend notification in the case of certain foreign dividends where the ex-dividend date may have passed. Non-cash dividends included in dividend income, if any, are recorded at the fair value of the securities received. Withholding taxes on foreign dividends, if any, and capital gains taxes on foreign investments, if any, have been provided for in accordance with the Fund’s understanding of the applicable tax rules and regulations. Interest income is recognized on an accrual basis. Discount and premium, which are included in interest income on the Consolidated Statement of Operations, are amortized or accreted daily.
Return of Capital Estimates. Distributions received from the Fund’s investments in Master Limited Partnerships (MLPs) and Real Estate Investments Trusts (REITs), generally are comprised of income and return of capital. The Fund records investment income and return of capital based on estimates. Such estimates are based on historical information available from each MLP, REIT and other industry sources. These estimates may subsequently be revised based on information received from MLPs and REITs after their tax reporting periods are concluded.
Custodian Fees. “Custodian fees and expenses” in the Statement of Operations may include interest expense incurred by the Fund on any cash overdrafts of its custodian account during the period. Such cash overdrafts may result from the effects of failed trades in portfolio securities and from cash outflows resulting from unanticipated shareholder redemption activity. Prior to July 17, 2017, the Fund paid interest to its custodian on such cash overdrafts, to the extent they were not offset by positive cash balances maintained by the Fund, when applicable, at a rate equal to the negative rolling average balance at an average Federal Funds Rate plus 0.50%. This rate increased to the Federal Funds Rate plus 2.00% effective July 17, 2017. The “Reduction to custodian expenses” line item, if applicable, represents earnings on cash balances maintained by the Fund during the period. Such interest expense and other custodian fees may be paid with these earnings.
Security Transactions. Security transactions are recorded on the trade date. Realized gains and losses on securities sold are determined on the basis of identified cost.
Indemnifications. The Fund’s organizational documents provide current and former Trustees and officers with a limited indemnification against liabilities arising in connection with the performance of their duties to the Fund. In the normal course of business, the Fund may also enter into contracts that provide general indemnifications. The Fund’s maximum exposure under these arrangements is unknown as this would be dependent on future claims that may
51 OPPENHEIMER GLOBAL ALLOCATION FUND
| | |
NOTES TO CONSOLIDATED FINANCIAL STATEMENTS Continued | | |
2. Significant Accounting Policies (Continued)
be made against the Fund. The risk of material loss from such claims is considered remote.
Federal Taxes. The Fund intends to comply with provisions of the Internal Revenue Code applicable to regulated investment companies and to distribute substantially all of its investment company taxable income, including any net realized gain on investments not offset by capital loss carryforwards, if any, to shareholders. Therefore, no federal income or excise tax provision is required. The Fund files income tax returns in U.S. federal and applicable state jurisdictions. The statute of limitations on the Fund’s tax return filings generally remains open for the three preceding fiscal reporting period ends. The Fund has analyzed its tax positions for the fiscal year ended October 31, 2017, including open tax years, and does not believe there are any uncertain tax positions requiring recognition in the Fund’s financial statements.
Subchapter M requires, among other things, that at least 90% of the Fund’s gross income be derived from securities or derived with respect to its business of investing in securities (typically referred to as “qualifying income”). Income from commodity-linked derivatives may not be treated as “qualifying income” for purposes of the 90% gross income requirement. The Internal Revenue Service (IRS) has previously issued a number of private letter rulings which conclude that income derived from commodity index-linked notes and investments in a wholly-owned subsidiary will be “qualifying income.” As a result, the Fund will gain exposure to commodities through commodity-linked notes and its wholly-owned subsidiary.
The IRS has suspended the granting of private letter rulings pending further review. As a result, there can be no assurance that the IRS will not change its position with respect to commodity-linked notes and wholly-owned subsidiaries. In addition, future legislation and guidance from the Treasury and the IRS may adversely affect the Fund’s ability to gain exposure to commodities through commodity-linked notes and its wholly-owned subsidiary.
The Fund is required to include in income for federal income tax purposes all of the subsidiary’s net income and gains whether or not such income is distributed by the subsidiary. Net income and gains from the subsidiary are generally treated as ordinary income by the Fund, regardless of the character of the subsidiary’s underlying income. Net losses from the subsidiary do not pass through to the Fund for federal income tax purposes.
The tax components of capital shown in the following table represent distribution requirements the Fund must satisfy under the income tax regulations, losses the Fund may be able to offset against income and gains realized in future years and unrealized appreciation or depreciation of securities and other investments for federal income tax purposes.
| | | | | | | | | | | | |
Undistributed Net Investment Income | | Undistributed
Long-Term
Gain | | | Accumulated
Loss
Carryforward1,2,3 | | | Net Unrealized
Appreciation
Based on cost of
Securities and
Other Investments
for Federal Income
Tax Purposes | |
$439,569 | | | $— | | | | $— | | | | $127,325,015 | |
52 OPPENHEIMER GLOBAL ALLOCATION FUND
2. Significant Accounting Policies (Continued)
1. During the reporting period, the Fund utilized $111,062,368 of capital loss carryforward to offset capital gains realized in that fiscal year.
2. During the previous reporting period, the Fund did not utilize any capital loss carryforward.
3. During the reporting period, $334,230,963 of unused capital loss carryforward expired.
Net investment income (loss) and net realized gain (loss) may differ for financial statement and tax purposes. The character of dividends and distributions made during the fiscal year from net investment income or net realized gains are determined in accordance with federal income tax requirements, which may differ from the character of net investment income or net realized gains presented in those financial statements in accordance with U.S. GAAP. Also, due to timing of dividends and distributions, the fiscal year in which amounts are distributed may differ from the fiscal year in which the income or net realized gain was recorded by the Fund.
Accordingly, the following amounts have been reclassified for the reporting period. Net assets of the Fund were unaffected by the reclassifications.
| | | | | | | | |
Reduction to Paid-in Capital | | Reduction to Accumulated
Net Investment
Income | | | Reduction to Accumulated Net
Realized Loss on Investments | |
| |
$334,224,493 | | | $9,845,050 | | | | $344,069,543 | |
The tax character of distributions paid during the reporting periods:
| | | | | | | | |
| | | Year Ended
October 31, 2017 | | | Year Ended
October 31, 2016 | |
| |
Distributions paid from: | | | | | | | | |
Ordinary income | | $ | 42,362,298 | | | $ | 23,121,524 | |
The aggregate cost of securities and other investments and the composition of unrealized appreciation and depreciation of securities and other investments for federal income tax purposes at period end are noted in the following table. The primary difference between book and tax appreciation or depreciation of securities and other investments, if applicable, is attributable to the tax deferral of losses or tax realization of financial statement unrealized gain or loss.
| | | | |
Federal tax cost of securities | | | $ 1,487,772,735 | |
Federal tax cost of other investments | | | (343,716,430) | |
| | | | |
Total federal tax cost | | | $ 1,144,056,305 | |
| | | | |
Gross unrealized appreciation | | | $ 240,225,021 | |
Gross unrealized depreciation | | | (112,900,006) | |
| | | | |
Net unrealized appreciation | | | $ 127,325,015 | |
| | | | |
Certain foreign countries impose a tax on capital gains which is accrued by the Fund based on unrealized appreciation, if any, on affected securities. The tax is paid when the gain is realized.
Use of Estimates. The preparation of financial statements in conformity with U.S. GAAP
53 OPPENHEIMER GLOBAL ALLOCATION FUND
| | |
NOTES TO CONSOLIDATED FINANCIAL STATEMENTS Continued | | |
2. Significant Accounting Policies (Continued)
requires management to make estimates and assumptions that affect the reported amounts of assets and liabilities and disclosure of contingent assets and liabilities at the date of the financial statements and the reported amounts of increases and decreases in net assets from operations during the reporting period. Actual results could differ from those estimates.
3. Securities Valuation
The Fund calculates the net asset value of its shares as of 4:00 P.M. Eastern time, on each day the New York Stock Exchange (the “Exchange”) is open for trading, except in the case of a scheduled early closing of the Exchange, in which case the Fund will calculate net asset value of the shares as of the scheduled early closing time of the Exchange.
The Fund’s Board has adopted procedures for the valuation of the Fund’s securities and has delegated the day-to-day responsibility for valuation determinations under those procedures to the Manager. The Manager has established a Valuation Committee which is responsible for determining a fair valuation for any security for which market quotations are not readily available. The Valuation Committee’s fair valuation determinations are subject to review, approval and ratification by the Fund’s Board at least quarterly or more frequently, if necessary.
Valuation Methods and Inputs
Securities are valued primarily using unadjusted quoted market prices, when available, as supplied by third party pricing services or broker-dealers.
The following methodologies are used to determine the market value or the fair value of the types of securities described below:
Equity securities traded on a securities exchange (including exchange-traded derivatives other than futures and futures options) are valued based on the official closing price on the principal exchange on which the security is traded, as identified by the Manager, prior to the time when the Fund’s assets are valued. If the official closing price is unavailable, the security is valued at the last sale price on the principal exchange on which it is traded, or if no sales occurred, the security is valued at the mean between the quoted bid and asked prices. Over-the-counter equity securities are valued at the last published sale price, or if no sales occurred, at the mean between the quoted bid and asked prices. Events occurring after the close of trading on foreign exchanges may result in adjustments to the valuation of foreign securities to more accurately reflect their fair value as of the time when the Fund’s assets are valued.
Shares of a registered investment company that are not traded on an exchange are valued at that investment company’s net asset value per share.
Corporate and government debt securities (of U.S. or foreign issuers) and municipal debt securities, short-term notes, mortgage-backed securities, collateralized mortgage obligations, and asset-backed securities are valued at the mean between the bid and asked prices utilizing evaluated prices obtained from third party pricing services or broker-dealers who may use matrix pricing methods to determine the evaluated prices. Pricing services generally price debt securities assuming orderly transactions of an institutional “round lot” size, but some trades
54 OPPENHEIMER GLOBAL ALLOCATION FUND
3. Securities Valuation (Continued)
may occur in smaller, “odd lot” sizes, sometimes at lower prices than institutional round lot trades. Standard inputs generally considered by third-party pricing vendors include reported trade data, broker-dealer price quotations, benchmark yields, issuer spreads on comparable securities, the credit quality, yield, maturity, as well as other appropriate factors.
Structured securities, swaps, swaptions, and other over-the-counter derivatives are valued utilizing evaluated prices obtained from third party pricing services or broker-dealers. Standard inputs generally considered by third-party pricing vendors include market information relevant to the underlying reference asset such as the price of financial instruments, stock market indices, foreign currencies, interest rate spreads, commodities, credit spreads, credit event probabilities, index values, individual security values, forward interest rates, variable interest rates, volatility measures, and forward currency rates, or the occurrence of other specific events.
Forward foreign currency exchange contracts are valued utilizing current and forward currency rates obtained from third party pricing services. When the settlement date of a contract is an interim date for which a quotation is not available, interpolated values are derived using the nearest dated forward currency rate.
Futures contracts and futures options traded on a commodities or futures exchange will be valued at the final settlement price or official closing price on the principal exchange as reported by such principal exchange at its trading session ending at, or most recently prior to, the time when the Fund’s assets are valued.
Securities for which market quotations are not readily available or a significant event has occurred that would materially affect the value of the security, the security is fair valued either (i) by a standardized fair valuation methodology applicable to the security type or the significant event as previously approved by the Valuation Committee and the Fund’s Board or (ii) as determined in good faith by the Manager’s Valuation Committee. The Valuation Committee considers all relevant facts that are reasonably available, through either public information or information available to the Manager, when determining the fair value of a security. Those standardized fair valuation methodologies include, but are not limited to, valuing securities at the last sale price or initially at cost and subsequently adjusting the value based on: changes in company specific fundamentals, changes in an appropriate securities index, or changes in the value of similar securities which may be further adjusted for any discounts related to security-specific resale restrictions. When possible, such methodologies use observable market inputs such as unadjusted quoted prices of similar securities, observable interest rates, currency rates and yield curves. The methodologies used for valuing securities are not necessarily an indication of the risks associated with investing in those securities nor can it be assured that the Fund can obtain the fair value assigned to a security if it were to sell the security.
To assess the continuing appropriateness of security valuations, the Manager regularly compares prior day prices and sale prices to the current day prices and challenges those prices exceeding certain tolerance levels with the third party pricing service or broker source. For those securities valued by fair valuations, whether through a standardized fair valuation methodology or a fair valuation determination, the Valuation Committee reviews and affirms
55 OPPENHEIMER GLOBAL ALLOCATION FUND
| | |
NOTES TO CONSOLIDATED FINANCIAL STATEMENTS Continued | | |
3. Securities Valuation (Continued)
the reasonableness of the valuations based on such methodologies and fair valuation determinations on a regular basis after considering all relevant information that is reasonably available.
Classifications
Each investment asset or liability of the Fund is assigned a level at measurement date based on the significance and source of the inputs to its valuation. Various data inputs may be used in determining the value of each of the Fund’s investments as of the reporting period end.
These data inputs are categorized in the following hierarchy under applicable financial accounting standards:
1) Level 1-unadjusted quoted prices in active markets for identical assets or liabilities (including securities actively traded on a securities exchange)
2) Level 2-inputs other than unadjusted quoted prices that are observable for the asset or liability (such as unadjusted quoted prices for similar assets and market corroborated inputs such as interest rates, prepayment speeds, credit risks, etc.)
3) Level 3-significant unobservable inputs (including the Manager’s own judgments about assumptions that market participants would use in pricing the asset or liability).
The inputs used for valuing securities are not necessarily an indication of the risks associated with investing in those securities.
The Fund classifies each of its investments in investment companies which are publicly offered as Level 1. Investment companies that are not publicly offered, if any, are classified as Level 2 in the fair value hierarchy.
The table below categorizes amounts that are included in the Fund’s Consolidated Statement of Assets and Liabilities at period end based on valuation input level:
| | | | | | | | | | | | | | | | |
| | | Level 1—
Unadjusted
Quoted Prices | | | Level 2—
Other Significant
Observable Inputs | | | Level 3—
Significant Unobservable
Inputs | | | Value | |
Assets Table | | | | | | | | | | | | | | | | |
Investments, at Value: | | | | | | | | | | | | | | | | |
Common Stocks | | | | | | | | | | | | | | | | |
Consumer Discretionary | | $ | 65,101,965 | | | $ | 94,776,624 | | | | $ — | | | $ | 159,878,589 | |
Consumer Staples | | | 41,019,421 | | | | 48,854,452 | | | | — | | | | 89,873,873 | |
Energy | | | 54,560,302 | | | | 8,097,970 | | | | — | | | | 62,658,272 | |
Financials | | | 101,577,942 | | | | 56,631,263 | | | | — | | | | 158,209,205 | |
Health Care | | | 56,429,183 | | | | 35,089,887 | | | | — | | | | 91,519,070 | |
Industrials | | | 43,945,051 | | | | 98,982,435 | | | | — | | | | 142,927,486 | |
Information Technology | | | 122,276,520 | | | | 85,617,834 | | | | — | | | | 207,894,354 | |
Materials | | | 17,764,713 | | | | 27,125,117 | | | | 350 | | | | 44,890,180 | |
Telecommunication Services | | | 8,244,129 | | | | 22,456,737 | | | | — | | | | 30,700,866 | |
Utilities | | | 11,349,062 | | | | 2,973,793 | | | | — | | | | 14,322,855 | |
Preferred Stocks | | | 1,330,292 | | | | — | | | | — | | | | 1,330,292 | |
Rights, Warrants and Certificates | | | 24,849 | | | | 83,801 | | | | — | | | | 108,650 | |
56 OPPENHEIMER GLOBAL ALLOCATION FUND
3. Securities Valuation (Continued)
| | | | | | | | | | | | | | | | |
| | | Level 1—
Unadjusted
Quoted Prices | | | Level 2— Other Significant
Observable Inputs | | | Level 3—
Significant Unobservable
Inputs | | | Value | |
Investments, at Value: (Continued) | | | | | | | | | | | | | |
U.S. Government Obligations | | $ | — | | | $ | 53,918,650 | | | $ | — | | | $ | 53,918,650 | |
Foreign Government Obligations | | | — | | | | 76,949,158 | | | | — | | | | 76,949,158 | |
Non-Convertible Corporate Bond and Note | | | — | | | | 224,753 | | | | — | | | | 224,753 | |
Over-the-Counter Option Purchased | | | — | | | | 29,380 | | | | — | | | | 29,380 | |
Short-Term Notes | | | — | | | | 1,684,928 | | | | — | | | | 1,684,928 | |
Investment Companies | | | 291,076,064 | | | | 189,139,258 | | | | — | | | | 480,215,322 | |
Total Investments, at Value | | | 814,699,493 | | | | 802,636,040 | | | | 350 | | | | 1,617,335,883 | |
Other Financial Instruments: | | | | | | | | | | | | | | | | |
Swaps, at value | | | — | | | | 189,530 | | | | — | | | | 189,530 | |
Centrally cleared swaps, at value | | | — | | | | 38,016 | | | | — | | | | 38,016 | |
Futures contracts | | | 2,509,845 | | | | — | | | | — | | | | 2,509,845 | |
Forward currency exchange contracts | | | — | | | | 13,663,961 | | | | — | | | | 13,663,961 | |
Total Assets | | $ | 817,209,338 | | | $ | 816,527,547 | | | $ | 350 | | | $ | 1,633,737,235 | |
| | | | |
Liabilities Table | | | | | | | | | | | | | | | | |
Other Financial Instruments: | | | | | | | | | | | | | | | | |
Swaps, at value | | $ | — | | | $ | (80,304 | ) | | $ | — | | | $ | (80,304 | ) |
Centrally cleared swaps, at value | | | — | | | | (212,578 | ) | | | — | | | | (212,578 | ) |
Options written, at value | | | — | | | | (13,680 | ) | | | — | | | | (13,680 | ) |
Futures contracts | | | (4,356,962 | ) | | | — | | | | — | | | | (4,356,962 | ) |
Forward currency exchange contracts | | | — | | | | (13,931,308 | ) | | | — | | | | (13,931,308 | ) |
Swaptions written, at value | | | — | | | | (19,596 | ) | | | — | | | | (19,596 | ) |
| Total Liabilities | | $ | (4,356,962 | ) | | $ | (14,257,466 | ) | | $ | — | | | $ | (18,614,428) | |
Forward currency exchange contracts and futures contracts, if any, are reported at their unrealized appreciation/depreciation at measurement date, which represents the change in the contract’s value from trade date. All additional assets and liabilities included in the above table are reported at their market value at measurement date.
The table below shows the transfers between Level 1 and Level 2. The Fund’s policy is to recognize transfers in and transfers out as of the beginning of the reporting period.
| | | | | | | | | | | | | | | | |
| | | Transfers into
Level 1* | | | Transfers out
of Level 1** | | | Transfers into
Level 2** | | | Transfers out of
Level 2* | |
Assets Table Investments, at Value: | | | | | | | | | | | | | | | | |
Common Stocks | | | | | | | | | | | | | | | | |
Consumer | | | | | | | | | | | | | | | | |
Discretionary | | $ | 3,228,048 | | | $ | – | | | $ | – | | | $ | (3,228,048 | ) |
Consumer | | | | | | | | | | | | | | | | |
Staples | | | 1,077,540 | | | | (1,424,178 | ) | | | 1,424,178 | | | | (1,077,540 | ) |
Financials | | | 5,873,767 | | | | – | | | | – | | | | (5,873,767 | ) |
Health Care | | | 766,844 | | | | – | | | | – | | | | (766,844 | ) |
57 OPPENHEIMER GLOBAL ALLOCATION FUND
| | |
NOTES TO CONSOLIDATED FINANCIAL STATEMENTS Continued | | |
3. Securities Valuation (Continued)
| | | | | | | | | | | | | | | | |
| | | Transfers into
Level 1* | | | Transfers out of Level 1** | | | Transfers into
Level 2** | | | Transfers out
of Level 2* | |
Investments, at Value: (Continued) | | | | | | | | | | | | | | | | |
Common Stocks (Continued) | | | | | | | | | | | | | | | | |
Industrials | | $ | 506,122 | | | $ | – | | | $ | – | | | $ | (506,122 | ) |
Information | | | | | | | | | | | | | | | | |
Technology | | | 2,201,479 | | | | – | | | | – | | | | (2,201,479 | ) |
Materials | | | 799,099 | | | | – | | | | – | | | | (799,099 | ) |
Preferred Stocks | | | 2,600,561 | | | | – | | | | – | | | | (2,600,561 | ) |
Total Assets | | $ | 17,053,460 | | | $ | (1,424,178 | ) | | $ | 1,424,178 | | | $ | (17,053,460 | ) |
* Transfers from Level 2 to Level 1 are a result of the availability of quoted prices from an active market which were not available and have become available.
** Transfers from Level 1 to Level 2 are a result of a change in pricing methodology to the use of a valuation determined based on observable market information other than quoted prices from an active market due to a lack of available unadjusted quoted prices.
4. Investments and Risks
Risks of Foreign Investing. The Fund may invest in foreign securities which are subject to special risks. Securities traded in foreign markets may be less liquid and more volatile than those traded in U.S. markets. Foreign issuers are usually not subject to the same accounting and disclosure requirements that U.S. companies are subject to, which may make it difficult for the Fund to evaluate a foreign company’s operations or financial condition. A change in the value of a foreign currency against the U.S. dollar will result in a change in the U.S. dollar value of investments denominated in that foreign currency and in the value of any income or distributions the Fund may receive on those investments. The value of foreign investments may be affected by exchange control regulations, foreign taxes, higher transaction and other costs, delays in the settlement of transactions, changes in economic or monetary policy in the United States or abroad, expropriation or nationalization of a company’s assets, or other political and economic factors. In addition, due to the inter-relationship of global economies and financial markets, changes in political and economic factors in one country or region could adversely affect conditions in another country or region. Investments in foreign securities may also expose the Fund to time-zone arbitrage risk. Foreign securities may trade on weekends or other days when the Fund does not price its shares. At times, the Fund may emphasize investments in a particular country or region and may be subject to greater risks from adverse events that occur in that country or region. Foreign securities and foreign currencies held in foreign banks and securities depositories may be subject to limited or no regulatory oversight.
Investments in Affiliated Funds. The Fund is permitted to invest in other mutual funds advised by the Manager (“Affiliated Funds”). Affiliated Funds are open-end management investment companies registered under the 1940 Act, as amended. The Manager is the investment adviser of, and the Sub-Adviser provides investment and related advisory services to, the Affiliated Funds. When applicable, the Fund’s investments in Affiliated Funds are
58 OPPENHEIMER GLOBAL ALLOCATION FUND
4. Investments and Risks (Continued)
included in the Consolidated Statement of Investments. Shares of Affiliated Funds are valued at their net asset value per share. As a shareholder, the Fund is subject to its proportional share of the Affiliated Funds’ expenses, including their management fee. The Manager will waive fees and/or reimburse Fund expenses in an amount equal to the indirect management fees incurred through the Fund’s investment in the Affiliated Funds.
Each of the Affiliated Funds in which the Fund invests has its own investment risks, and those risks can affect the value of the Fund’s investments and therefore the value of the Fund’s shares. To the extent that the Fund invests more of its assets in one Affiliated Fund than in another, the Fund will have greater exposure to the risks of that Affiliated Fund.
Investments in Money Market Instruments. The Fund is permitted to invest its free cash balances in money market instruments to provide liquidity or for defensive purposes. The Fund may invest in money market instruments by investing in Class E shares of Oppenheimer Institutional Government Money Market Fund (“IGMMF”), which is an Affiliated Fund. IGMMF is regulated as a money market fund under the 1940 Act, as amended. The Fund may also invest in money market instruments directly or in other affiliated or unaffiliated money market funds.
Investment in Oppenheimer Master Funds. The Fund is permitted to invest in entities sponsored and/or advised by the Manager or an affiliate. Certain of these entities in which the Fund invests are mutual funds registered under the 1940 Act, as amended, that expect to be treated as partnerships for tax purposes, specifically Oppenheimer Master Loan Fund, LLC (“Master Loan”) and Oppenheimer Master Event-Linked Bond Fund, LLC (“Master Event-Linked Bond”) (the “Master Funds”). Each Master Fund has its own investment risks, and those risks can affect the value of the Fund’s investments and therefore the value of the Fund’s shares. To the extent that the Fund invests more of its assets in one Master Fund than in another, the Fund will have greater exposure to the risks of that Master Fund.
The investment objective of Master Loan is to seek income. The investment objective of Master Event-Linked Bond is to seek total return. The Fund’s investments in the Master Funds are included in the Consolidated Statement of Investments. The Fund recognizes income and gain/(loss) on its investments in each Master Fund according to its allocated pro-rata share, based on its relative proportion of total outstanding Master Fund shares held, of the total net income earned and the net gain/(loss) realized on investments sold by the Master Funds. As a shareholder, the Fund is subject to its proportional share of the Master Funds’ expenses, including their management fee. The Manager will waive fees and/or reimburse Fund expenses in an amount equal to the indirect management fees incurred through the Fund’s investment in the Master Funds. The Fund owns 7.7% of Master Loan and 27.1% of Master Event-Linked Bond at period end.
Master Limited Partnerships (“MLPs”). MLPs issue common units that represent an equity ownership interest in a partnership and provide limited voting rights. MLP common units are registered with the Securities and Exchange Commission (“SEC”), and are
59 OPPENHEIMER GLOBAL ALLOCATION FUND
| | |
NOTES TO CONSOLIDATED FINANCIAL STATEMENTS Continued | | |
4. Investments and Risks (Continued)
freely tradable on securities exchanges such as the NYSE and the NASDAQ Stock Market (“NASDAQ”), or in the over-the-counter (“OTC”) market. An MLP consists of one or more general partners, who conduct the business, and one or more limited partners, who contribute capital. MLP common unit holders have a limited role in the partnership’s operations and management. The Fund, as a limited partner, normally would not be liable for the debts of the MLP beyond the amounts the Fund has contributed, but would not be shielded to the same extent that a shareholder of a corporation would be. In certain circumstances creditors of an MLP would have the right to seek return of capital distributed to a limited partner. This right of an MLP’s creditors would continue after the Fund sold its investment in the MLP.
Equity Security Risk. Stocks and other equity securities fluctuate in price. The value of the Fund’s portfolio may be affected by changes in the equity markets generally. Equity markets may experience significant short-term volatility and may fall sharply at times. Different markets may behave differently from each other and U.S. equity markets may move in the opposite direction from one or more foreign stock markets. Adverse events in any part of the equity or fixed-income markets may have unexpected negative effects on other market segments.
The prices of individual equity securities generally do not all move in the same direction at the same time and a variety of factors can affect the price of a particular company’s securities. These factors may include, but are not limited to, poor earnings reports, a loss of customers, litigation against the company, general unfavorable performance of the company’s sector or industry, or changes in government regulations affecting the company or its industry.
Sovereign Debt Risk. The Fund invests in sovereign debt securities, which are subject to certain special risks. These risks include, but are not limited to, the risk that a governmental entity may delay or refuse, or otherwise be unable, to pay interest or repay the principal on its sovereign debt. There may also be no legal process for collecting sovereign debt that a government does not pay or bankruptcy proceedings through which all or part of such sovereign debt may be collected. In addition, a restructuring or default of sovereign debt may also cause additional impacts to the financial markets, such as downgrades to credit ratings, reduced liquidity and increased volatility, among others.
5. Market Risk Factors
The Fund’s investments in securities and/or financial derivatives may expose the Fund to various market risk factors:
Commodity Risk. Commodity risk relates to the change in value of commodities or commodity indexes as they relate to increases or decreases in the commodities market. Commodities are physical assets that have tangible properties. Examples of these types of assets are crude oil, heating oil, metals, livestock, and agricultural products.
Credit Risk. Credit risk relates to the ability of the issuer of debt to meet interest and principal payments, or both, as they come due. In general, lower-grade, higher-yield debt securities are subject to credit risk to a greater extent than lower-yield, higher-quality
60 OPPENHEIMER GLOBAL ALLOCATION FUND
5. Market Risk Factors (Continued)
securities.
Equity Risk. Equity risk relates to the change in value of equity securities as they relate to increases or decreases in the general market.
Foreign Exchange Rate Risk. Foreign exchange rate risk relates to the change in the U.S. dollar value of a security held that is denominated in a foreign currency. The U.S. dollar value of a foreign currency denominated security will decrease as the dollar appreciates against the currency, while the U.S. dollar value will increase as the dollar depreciates against the currency.
Interest Rate Risk. Interest rate risk refers to the fluctuations in value of fixed-income securities resulting from the inverse relationship between price and yield. For example, an increase in general interest rates will tend to reduce the market value of already issued fixed-income investments, and a decline in general interest rates will tend to increase their value. In addition, debt securities with longer maturities, which tend to have higher yields, are subject to potentially greater fluctuations in value from changes in interest rates than obligations with shorter maturities.
Volatility Risk. Volatility risk refers to the magnitude of the movement, but not the direction of the movement, in a financial instrument’s price over a defined time period. Large increases or decreases in a financial instrument’s price over a relative time period typically indicate greater volatility risk, while small increases or decreases in its price typically indicate lower volatility risk.
6. Use of Derivatives
The Fund’s investment objective not only permits the Fund to purchase investment securities, it also allows the Fund to enter into various types of derivatives contracts, including, but not limited to, futures contracts, forward currency exchange contracts, credit default swaps, interest rate swaps, total return swaps, variance swaps and purchased and written options. In doing so, the Fund will employ strategies in differing combinations to permit it to increase, decrease, or change the level or types of exposure to market risk factors. These instruments may allow the Fund to pursue its objectives more quickly and efficiently than if it were to make direct purchases or sales of securities capable of effecting a similar response to market factors. Such contracts may be entered into through a bilateral over-the-counter (“OTC”) transaction, or through a securities or futures exchange and cleared through a clearinghouse.
Derivatives may have little or no initial cash investment relative to their market value exposure and therefore can produce significant gains or losses in excess of their cost due to changes in the market risk factors and the overall market. This use of embedded leverage allows the Fund to increase its market value exposure relative to its net assets and can substantially increase the volatility of the Fund’s performance. In instances where the Fund is using derivatives to decrease, or hedge, exposures to market risk factors for securities held by the Fund, there are also risks that those derivatives may not perform as expected resulting in losses for the combined or hedged positions. Some derivatives have the potential for unlimited loss, regardless of the size of the Fund’s initial investment.
61 OPPENHEIMER GLOBAL ALLOCATION FUND
| | |
NOTES TO CONSOLIDATED FINANCIAL STATEMENTS Continued | | |
6. Use of Derivatives (Continued)
Additional associated risks from investing in derivatives also exist and potentially could have significant effects on the valuation of the derivative and the Fund. Typically, the associated risks are not the risks that the Fund is attempting to increase or decrease exposure to, per its investment objectives, but are the additional risks from investing in derivatives. Examples of these associated risks are liquidity risk, which is the risk that the Fund will not be able to sell the derivative in the open market in a timely manner, and counterparty credit risk, which is the risk that the counterparty will not fulfill its obligation to the Fund.
The Fund’s actual exposures to these market risk factors and associated risks during the period are discussed in further detail, by derivative type, below.
Forward Currency Exchange Contracts
The Fund may enter into forward currency exchange contracts (“forward contracts”) for the purchase or sale of a foreign currency at a negotiated rate at a future date. Such contracts are traded in the OTC inter-bank currency dealer market.
Forward contracts are reported on a schedule following the Consolidated Statement of Investments. The unrealized appreciation (depreciation) is reported in the Consolidated Statement of Assets and Liabilities as a receivable (or payable) and in the Consolidated Statement of Operations within the change in unrealized appreciation (depreciation). At contract close, the difference between the original cost of the contract and the value at the close date is recorded as a realized gain (loss) in the Consolidated Statement of Operations.
The Fund may enter into forward foreign currency exchange contracts in order to decrease exposure to foreign exchange rate risk associated with either specific transactions or portfolio instruments or to increase exposure to foreign exchange rate risk.
During the reporting period, the Fund had daily average contract amounts on forward contracts to buy and sell of $366,191,011 and $591,938,773, respectively.
Additional associated risk to the Fund includes counterparty credit risk. Counterparty credit risk arises from the possibility that the counterparty to a forward contract will default and fail to perform its obligations to the Fund.
Futures Contracts
A futures contract is a commitment to buy or sell a specific amount of a commodity, financial instrument or currency at a negotiated price on a stipulated future date. The Fund may buy and sell futures contracts and may also buy or write put or call options on these futures contracts. Futures contracts and options thereon are generally entered into on a regulated futures exchange and cleared through a clearinghouse associated with the exchange.
Upon entering into a futures contract, the Fund is required to deposit either cash or securities (initial margin) in an amount equal to a certain percentage of the contract value in an account registered in the futures commission merchant’s name. Subsequent payments (variation margin) are paid to or from the futures commission merchant each day equal to the daily changes in the contract value. Such payments are recorded as unrealized gains and losses. Should the Fund fail to make requested variation margin payments, the futures commission merchant can gain access to the initial margin to satisfy the Fund’s payment
62 OPPENHEIMER GLOBAL ALLOCATION FUND
6. Use of Derivatives (Continued)
obligations.
Futures contracts are reported on a schedule following the Consolidated Statement of Investments. Securities held by a futures commission merchant to cover initial margin requirements on open futures contracts are noted in the Consolidated Statement of Investments. Cash held by a futures commission merchant to cover initial margin requirements on open futures contracts and the receivable and/or payable for the daily mark to market for the variation margin are noted in the Consolidated Statement of Assets and Liabilities. The net change in unrealized appreciation and depreciation is reported in the Consolidated Statement of Operations. Realized gains (losses) are reported in the Consolidated Statement of Operations at the closing or expiration of futures contracts.
The Fund may purchase and/or sell financial futures contracts and options on futures contracts to gain exposure to, or decrease exposure to interest rate risk, equity risk, foreign exchange rate risk, volatility risk, or commodity risk.
During the reporting period, the Fund had an ending monthly average market value of $318,972,233 and $169,177,518 on futures contracts purchased and sold, respectively.
Additional associated risks of entering into futures contracts (and related options) include the possibility that there may be an illiquid market where the Fund is unable to liquidate the contract or enter into an offsetting position and, if used for hedging purposes, the risk that the price of the contract will correlate imperfectly with the prices of the Fund’s securities.
Option Activity
The Fund may buy and sell put and call options, or write put and call options. When an option is written, the Fund receives a premium and becomes obligated to sell or purchase the underlying security, currency or other underlying financial instrument at a fixed price, upon exercise of the option.
Options can be traded through an exchange or through a privately negotiated arrangement with a dealer in an OTC transaction. Options traded through an exchange are generally cleared through a clearinghouse (such as The Options Clearing Corporation). The difference between the premium received or paid, and market value of the option, is recorded as unrealized appreciation or depreciation. The net change in unrealized appreciation or depreciation is reported in the Consolidated Statement of Operations. When an option is exercised, the cost of the security purchased or the proceeds of the security sale are adjusted by the amount of premium received or paid. Upon the expiration or closing of the option transaction, a gain or loss is reported in the Consolidated Statement of Operations.
Foreign Currency Options. The Fund may purchase or write call and put options on currencies to increase or decrease exposure to foreign exchange rate risk. A purchased call, or written put option becomes more valuable as the price of the underlying financial instrument appreciates relative to the strike price. A purchased put, or written call option becomes more valuable as the price of the underlying financial instrument depreciates relative to the strike price.
Index/Security Options. The Fund may purchase or write call and put options on individual equity securities and/or equity indexes to increase or decrease exposure to equity risk. A
63 OPPENHEIMER GLOBAL ALLOCATION FUND
| | |
NOTES TO CONSOLIDATED FINANCIAL STATEMENTS Continued | | |
6. Use of Derivatives (Continued)
purchased call or written put option becomes more valuable as the price of the underlying financial instrument appreciates relative to the strike price. A purchased put or written call option becomes more valuable as the price of the underlying financial instrument depreciates relative to the strike price.
During the reporting period, the Fund had an ending monthly average market value of $235,893 on purchased put options.
Options written, if any, are reported in a schedule following the Consolidated Statement of Investments and as a liability in the Consolidated Statement of Assets and Liabilities. Securities held in collateral accounts to cover potential obligations with respect to outstanding written options are noted in the Consolidated Statement of Investments.
The risk in writing a call option is the market price of the underlying security increasing above the strike price and the option being exercised. The Fund must then purchase the underlying security at the higher market price and deliver it for the strike price or, if it owns the underlying security, deliver it at the strike price and forego any benefit from the increase in the price of the underlying security above the strike price. The risk in writing a put option is the market price of the underlying security decreasing below the strike price and the option being exercised. The Fund must then purchase the underlying security at the strike price when the market price of the underlying security is below the strike price. Alternatively, the Fund could also close out a written option position, in which case the risk is that the closing transaction will require a premium to be paid by the Fund that is greater than the premium the Fund received. When writing options, the Fund has the additional risk that there may be an illiquid market where the Fund is unable to close the contact. The risk in buying an option is that the Fund pays a premium for the option, and the option may be worth less than the premium paid or expire worthless.
During the reporting period, the Fund had an ending monthly average market value of $420 and $3,691 on written call options and written put options, respectively.
Additional associated risks to the Fund include counterparty credit risk and liquidity risk.
Swap Contracts
The Fund may enter into swap contract agreements with a counterparty to exchange a series of cash flows based on either specified reference rates, the price or volatility of asset or non-asset references, or the occurrence of a credit event, over a specified period. Swaps can be executed in a bi-lateral privately negotiated arrangement with a dealer in an OTC transaction (“OTC swaps”) or executed on a regulated market. Certain swaps, regardless of the venue of their execution, are required to be cleared through a clearinghouse (“centrally cleared swaps”). Swap contracts may include interest rate, equity, debt, index, total return, credit default, currency, and volatility swaps.
Swap contracts are reported on a schedule following the Consolidated Statement of Investments. The values of centrally cleared swap and OTC swap contracts are aggregated by positive and negative values and disclosed separately on the Consolidated Statement of Assets and Liabilities. The unrealized appreciation (depreciation) related to the change in the valuation of the notional amount of the swap is combined with the accrued interest due to
64 OPPENHEIMER GLOBAL ALLOCATION FUND
6. Use of Derivatives (Continued)
(owed by) the Fund, if any, at termination or settlement. The net change in this amount during the period is included on the Consolidated Statement of Operations. The Fund also records any periodic payments received from (paid to) the counterparty, including at termination, under such contracts as realized gain (loss) on the Consolidated Statement of Operations.
Swap contract agreements are exposed to the market risk factor of the specific underlying reference rate or asset. Swap contracts are typically more attractively priced compared to similar investments in related cash securities because they isolate the risk to one market risk factor and eliminate the other market risk factors. Investments in cash securities (for instance bonds) have exposure to multiple risk factors (credit and interest rate risk). Because swaps have embedded leverage, they can expose the Fund to substantial risk in the isolated market risk factor.
Currency Swap Contracts. A currency swap contract is an agreement between counterparties to exchange different currencies at contract inception that are equivalent to a notional value. The exchange at contract inception is made at the current spot rate. The contract also includes an agreement to reverse the exchange of the same notional values of those currencies at contract termination. The re-exchange at contract termination may take place at the same exchange rate, a specified rate or the then current spot rate. Certain currency swap contracts provide for exchanging the currencies only at contract termination and can provide for only a net payment in the settlement currency, typically USD. A currency swap contract may also include the exchange of periodic payments, between the counterparties, that are based on interest rates available in the respective currencies at contract inception. Other currency swap contracts may not provide for exchanging the different currencies at all, and only for exchanging interest cash flows based on the notional value in the contract.
The Fund has entered into currency swap contracts with the obligation to pay an interest rate on the dollar notional amount and receive an interest rate on the various foreign currency notional amounts. These currency swap contracts increase exposure to, or decrease exposure away from, foreign exchange and interest rate risk.
For the reporting period, the Fund had ending monthly average notional amounts of $505,615 on currency swaps which receive a fixed rate.
Additional associated risks to the Fund include counterparty credit risk and liquidity risk.
At period end, the Fund had no currency swap agreements outstanding.
Interest Rate Swap Contracts. An interest rate swap is an agreement between counterparties to exchange periodic payments based on interest rates. One cash flow stream will typically be a floating rate payment based upon a specified floating interest rate while the other is typically a fixed interest rate.
The Fund may enter into interest rate swaps in which it pays the fixed or floating interest rate in order to increase or decrease exposure to interest rate risk. Typically, if relative interest rates rise, floating payments under a swap agreement will be greater than the fixed payments.
For the reporting period, the Fund had ending monthly average notional amounts of $16,732,055 and $38,404,410 on interest rate swaps which pay a fixed rate and interest
65 OPPENHEIMER GLOBAL ALLOCATION FUND
| | |
NOTES TO CONSOLIDATED FINANCIAL STATEMENTS Continued | | |
6. Use of Derivatives (Continued)
rate swaps which receive a fixed rate, respectively.
Additional associated risks to the Fund include counterparty credit risk and liquidity risk.
Total Return Swap Contracts. A total return swap is an agreement between counterparties to exchange periodic payments based on the value of asset or non-asset references. One cash flow is typically based on a non-asset reference (such as an interest rate) and the other on the total return of a reference asset (such as a security or a basket of securities or securities index). The total return of the reference asset typically includes appreciation or depreciation on the reference asset, plus any interest or dividend payments.
Total return swap contracts are exposed to the market risk factor of the specific underlying financial instrument or index. Total return swaps are less standard in structure than other types of swaps and can isolate and/or include multiple types of market risk factors including equity risk, credit risk, and interest rate risk.
The Fund may enter into total return swaps on various equity securities or indexes to increase or decrease exposure to equity risk. These equity risk related total return swaps require the Fund to pay or receive a floating reference interest rate, and an amount equal to the opposite price movement of securities or an index (expressed as a percentage) multiplied by the notional amount of the contract. Equity leg payments equal to the positive price movement of the same securities or index (expressed as a percentage) multiplied by the notional amount of the contract and, in some cases, dividends paid on the securities.
Reference leg payments equal a floating reference interest rate and an amount equal to the negative price movement of the same securities or index (expressed as a percentage) multiplied by the notional amount of the contract.
The Fund may enter into total return swaps to increase or decrease exposure to the credit risk of various indexes or basket of securities. These credit risk related total return swaps require the Fund to pay to, or receive payments from, the counterparty based on the movement of credit spreads of the related indexes or securities.
For the reporting period, the Fund had ending monthly average notional amounts of $42,309,469 on total return swaps which are long the reference asset.
Additional associated risks to the Fund include counterparty credit risk and liquidity risk.
At period end, the Fund had no total return swap agreements outstanding.
Swaption Transactions
The Fund may enter into a swaption contract which grants the purchaser the right, but not the obligation, to enter into a swap transaction at preset terms detailed in the underlying agreement within a specified period of time. The purchaser pays a premium to the swaption writer who bears the risk of unfavorable changes in the preset terms on the underlying swap.
Purchased swaptions are reported as a component of investments in the Consolidated Statement of Investments and the Consolidated Statement of Assets and Liabilities. Written swaptions are reported on a schedule following the Consolidated Statement of Investments and their value is reported as a separate asset or liability line item in the Consolidated Statement of Assets and Liabilities. The net change in unrealized appreciation or depreciation on written swaptions is separately reported in the Consolidated Statement of Operations.
66 OPPENHEIMER GLOBAL ALLOCATION FUND
6. Use of Derivatives (Continued)
When a swaption is exercised, the cost of the swap is adjusted by the amount of premium paid or received. Upon the expiration or closing of an unexercised swaption contract, a gain or loss is reported in the Consolidated Statement of Operations for the amount of the premium paid or received.
The Fund generally will incur a greater risk when it writes a swaption than when it purchases a swaption. When the Fund writes a swaption it will become obligated, upon exercise of the swaption, according to the terms of the underlying agreement. Swaption contracts written by the Fund do not give rise to counterparty credit risk prior to exercise as they obligate the Fund, not its counterparty, to perform. When the Fund purchases a swaption it only risks losing the amount of the premium it paid if the swaption expires unexercised. However, when the Fund exercises a purchased swaption there is a risk that the counterparty will fail to perform or otherwise default on its obligations under the swaption contract.
At period end, the Fund had no purchased swaption contracts outstanding.
The Fund may write swaptions which give it the obligation, if exercised by the purchaser, to enter into an interest rate swap in which it pays a fixed or floating interest rate and receives a floating or fixed interest rate in order to increase or decrease exposure to interest rate risk. A written swaption paying a fixed rate becomes more valuable as the reference interest rate increases relative to the preset interest rate. A written swaption paying a floating rate becomes more valuable as the reference interest rate decreases relative to the preset interest rate.
The Fund may enter into currency swaption contracts with the obligation to pay an interest rate on the US dollar notional amount or various foreign currency notional amounts and receive an interest rate on various foreign currency notional amounts or US dollar notional amounts, with an option to replace the contractual currency as disclosed in the Consolidated Statement of Investments. This is done in order to take a positive investment perspective on the related currencies for which the Fund receives a payment. The US dollar swaption contracts seek to increase exposure to foreign exchange rate risk. The foreign currency swaption contracts seek to decrease exposure to foreign exchange rate risk.
During the reporting period, the Fund had an ending monthly average market value of $5,910 on written swaptions.
Counterparty Credit Risk. Derivative positions are subject to the risk that the counterparty will not fulfill its obligation to the Fund. The Fund intends to enter into derivative transactions with counterparties that the Manager believes to be creditworthy at the time of the transaction.
The Fund’s risk of loss from counterparty credit risk on OTC derivatives is generally limited to the aggregate unrealized gain netted against any collateral held by the Fund. For OTC options purchased, the Fund bears the risk of loss of the amount of the premiums paid plus the positive change in market values net of any collateral held by the Fund should the counterparty fail to perform under the contracts. Options written by the Fund do not typically give rise to counterparty credit risk, as options written generally obligate the Fund and not the counterparty to perform.
67 OPPENHEIMER GLOBAL ALLOCATION FUND
| | |
NOTES TO CONSOLIDATED FINANCIAL STATEMENTS Continued | | |
6. Use of Derivatives (Continued)
To reduce counterparty risk with respect to OTC transactions, the Fund has entered into master netting arrangements, established within the Fund’s International Swap and Derivatives Association, Inc. (“ISDA”) master agreements, which allow the Fund to make (or to have an entitlement to receive) a single net payment in the event of default (close-out netting) for outstanding payables and receivables with respect to certain OTC positions in swaps, options, swaptions, and forward currency exchange contracts for each individual counterparty. In addition, the Fund may require that certain counterparties post cash and/or securities in collateral accounts to cover their net payment obligations for those derivative contracts subject to ISDA master agreements. If the counterparty fails to perform under these contracts and agreements, the cash and/or securities will be made available to the Fund.
At period end, the Fund has required certain counterparties to post collateral of $3,551,826.
ISDA master agreements include credit related contingent features which allow counterparties to OTC derivatives to terminate derivative contracts prior to maturity in the event that, for example, the Fund’s net assets decline by a stated percentage or the Fund fails to meet the terms of its ISDA master agreements, which would cause the Fund to accelerate payment of any net liability owed to the counterparty.
For financial reporting purposes, the Fund does not offset derivative assets and derivative liabilities that are subject to netting arrangements in the Consolidated Statement of Assets and Liabilities. Bankruptcy or insolvency laws of a particular jurisdiction may impose restrictions on or prohibitions against the right of offset in bankruptcy, insolvency or other events.
The Fund’s risk of loss from counterparty credit risk on exchange-traded derivatives cleared through a clearinghouse and for centrally cleared swaps is generally considered lower than as compared to OTC derivatives. However, counterparty credit risk exists with respect to initial and variation margin deposited/paid by the Fund that is held in futures commission merchant, broker and/or clearinghouse accounts for such exchange-traded derivatives and for centrally cleared swaps.
With respect to centrally cleared swaps, such transactions will be submitted for clearing, and if cleared, will be held in accounts at futures commission merchants or brokers that are members of clearinghouses. While brokers, futures commission merchants and clearinghouses are required to segregate customer margin from their own assets, in the event that a broker, futures commission merchant or clearinghouse becomes insolvent or goes into bankruptcy and at that time there is a shortfall in the aggregate amount of margin held by the broker, futures commission merchant or clearinghouse for all its customers, U.S. bankruptcy laws will typically allocate that shortfall on a pro-rata basis across all the broker’s, futures commission merchant’s or clearinghouse’s customers, potentially resulting in losses to the Fund.
There is the risk that a broker, futures commission merchant or clearinghouse will decline to clear a transaction on the Fund’s behalf, and the Fund may be required to pay a termination fee to the executing broker with whom the Fund initially enters into the transaction. Clearinghouses may also be permitted to terminate centrally cleared swaps at any time. The Fund is also subject to the risk that the broker or futures commission merchant will improperly
68 OPPENHEIMER GLOBAL ALLOCATION FUND
6. Use of Derivatives (Continued)
use the Fund’s assets deposited/paid as initial or variation margin to satisfy payment obligations of another customer. In the event of a default by another customer of the broker or futures commission merchant, the Fund might not receive its variation margin payments from the clearinghouse, due to the manner in which variation margin payments are aggregated for all customers of the broker/futures commission merchant.
Collateral and margin requirements differ by type of derivative. Margin requirements are established by the broker, futures commission merchant or clearinghouse for exchange-traded and cleared derivatives, including centrally cleared swaps. Brokers, futures commission merchants and clearinghouses can ask for margin in excess of the regulatory minimum, or increase the margin amount, in certain circumstances.
Collateral terms are contract specific for OTC derivatives. For derivatives traded under an ISDA master agreement, the collateral requirements are typically calculated by netting the mark to market amount for each transaction under such agreement and comparing that amount to the value of any collateral currently pledged by the Fund or the counterparty.
For financial reporting purposes, cash collateral that has been pledged to cover obligations of the Fund, if any, is reported separately on the Consolidated Statement of Assets and Liabilities as cash pledged as collateral. Non-cash collateral pledged by the Fund, if any, is noted in the Consolidated Statement of Investments. Generally, the amount of collateral due from or to a party must exceed a minimum transfer amount threshold (e.g. $250,000) before a transfer has to be made. To the extent amounts due to the Fund from its counterparties are not fully collateralized, contractually or otherwise, the Fund bears the risk of loss from counterparty nonperformance.
The following table presents by counterparty the Fund’s OTC derivative assets net of the related collateral pledged by the Fund at period end:
| | | | | | | | | | | | | | | | | | | | |
| | | | | | Gross Amounts Not Offset in the Consolidated Statement of Assets & Liabilities | | | | |
| Counterparty | | Gross Amounts
Not Offset in the
Consolidated
Statement
of Assets &
Liabilities* | | | Financial
Instruments
Available for
Offset | | | Financial
Instruments
Collateral
Received** | | | Cash Collateral
Received** | | | Net Amount | |
Bank of America NA | | $ | 3,911,314 | | | $ | (3,118,756 | ) | | $ | (781,826 | ) | | $ | – | | | $ | 10,732 | |
Barclays Bank plc | | | 261,630 | | | | (261,630 | ) | | | – | | | | – | | | | – | |
Citibank NA | | | 1,274,930 | | | | (1,274,930 | ) | | | – | | | | – | | | | – | |
Deutsche Bank AG | | | 4,563,318 | | | | (3,570,404 | ) | | | – | | | | (992,914 | ) | | | – | |
Goldman Sachs Bank USA | | | 159,047 | | | | (75,470 | ) | | | – | | | | – | | | | 83,577 | |
Goldman Sachs International | | | 56,257 | | | | (50,569 | ) | | | – | | | | (5,688 | ) | | | – | |
HSBC Bank USA NA | | | 1,486,945 | | | | (1,128,109 | ) | | | – | | | | – | | | | 358,836 | |
JPMorgan Chase Bank NA | | | 1,458,304 | | | | (1,458,304 | ) | | | – | | | | – | | | | – | |
69 OPPENHEIMER GLOBAL ALLOCATION FUND
| | |
NOTES TO CONSOLIDATED FINANCIAL STATEMENTS Continued | | |
6. Use of Derivatives (Continued)
| | | | | | | | | | | | | | | | | | | | |
| | | | | | Gross Amounts Not Offset in��the Consolidated Statement of Assets & Liabilities | | | | |
| Counterparty | | Gross Amounts Not Offset in the
Consolidated
Statement of Assets &
Liabilities* | | | Financial
Instruments
Available for
Offset | | | Financial
Instruments
Collateral
Received** | | | Cash Collateral
Received** | | | Net Amount | |
Toronto Dominion Bank | | $ | 711,126 | | | $ | (71,983) | | | $ | – | | | $ | (560,000) | | | $ | 79,143 | |
| | | | |
| | $ | 13,882,871 | | | $ | (11,010,155) | | | $ | (781,826) | | | $ | (1,558,602) | | | $ | 532,288 | |
| | | | |
*OTC derivatives are reported gross on the Consolidated Statement of Assets and Liabilities. Exchange traded options and margin related to centrally cleared swaps and futures, if any, are excluded from these reported amounts.
**Reported collateral posted for the benefit of the Fund within this table is limited to the net outstanding amount due from an individual counterparty. The collateral posted for the benefit of the Fund may exceed these amounts.
The following table presents by counterparty the Fund’s OTC derivative liabilities net of the related collateral pledged by the Fund at period end:
| | | | | | | | | | | | | | | | | | | | |
| | | | | | Gross Amounts Not Offset in the Consolidated
Statement of Assets & Liabilities | | | | |
| Counterparty | | Gross Amounts
Not Offset in the
Consolidated
Statement
of Assets &
Liabilities* | | | Financial
Instruments
Available for
Offset | | | Financial
Instruments
Collateral
Pledged** | | | Cash Collateral
Pledged** | | | Net Amount | |
Bank of America NA | | $ | (3,118,756) | | | $ | 3,118,756 | | | $ | – | | | $ | – | | | $ | – | |
Barclays Bank plc | | | (707,166) | | | | 261,630 | | | | 445,536 | | | | – | | | | – | |
Citibank NA | | | (3,459,568) | | | | 1,274,930 | | | | 2,184,638 | | | | – | | | | – | |
Deutsche Bank AG | | | (3,570,404) | | | | 3,570,404 | | | | – | | | | – | | | | – | |
Goldman Sachs Bank USA | | | (75,470) | | | | 75,470 | | | | – | | | | – | | | | – | |
Goldman Sachs International | | | (50,569) | | | | 50,569 | | | | – | | | | – | | | | – | |
HSBC Bank USA NA | | | (1,128,109) | | | | 1,128,109 | | | | – | | | | – | | | | – | |
JPMorgan Chase Bank NA | | | (1,862,863) | | | | 1,458,304 | | | | 347,783 | | | | – | | | | (56,776) | |
Toronto Dominion Bank | | | (71,983) | | | | 71,983 | | | | – | | | | – | | | | – | |
| | | | |
| | $ | (14,044,888) | | | $ | 11,010,155 | | | $ | 2,977,957 | | | $ | – | | | $ | (56,776) | |
| | | | |
*OTC derivatives are reported gross on the Consolidated Statement of Assets and Liabilities. Exchange traded options and margin related to centrally cleared swaps and futures, if any, are excluded from these reported amounts.
**Reported collateral pledged within this table is limited to the net outstanding amount due from the Fund. The securities pledged as collateral by the Fund as reported on the Consolidated Statements of Investments may exceed these amounts.
The following table presents the valuations of derivative instruments by risk exposure as reported within the Consolidated Statement of Assets and Liabilities at period end:
70 OPPENHEIMER GLOBAL ALLOCATION FUND
6. Use of Derivatives (Continued)
| | | | | | | | | | | | |
| | | Asset Derivatives | | | Liability Derivatives | |
Derivatives
Not Accounted
for as Hedging Instruments | | Consolidated
Statement of Assets
and Liabilities Location | | Value | | | Consolidated Statement of Assets
and Liabilities Location | | Value | |
Interest rate contracts | | Swaps, at value | | $ | 189,530 | | | Swaps, at value | | $ | 80,304 | |
Interest rate contracts | | Centrally cleared swaps, at value | | | 38,016 | | | Centrally cleared swaps, at value | | | 212,578 | |
Equity contracts | | Variation margin receivable | | | 120,038* | | | Variation margin payable | | | 144,221* | |
Interest rate contracts | | Variation margin receivable | | | 82,822* | | | Variation margin payable | | | 63,532* | |
| Forward currency exchange contracts | | Unrealized appreciation on forward currency exchange contracts | | | 13,663,961 | | | Unrealized depreciation on foreign currency exchange contracts | | | 13,931,308 | |
| Forward currency exchange contracts | | | | | | | | Options written, at value | | | 13,680 | |
Interest rate contracts | | | | | | | | Swaptions written, at value | | | 19,596 | |
| Forward currency exchange contracts | | Investments, at value | | | 29,380** | | | | | | | |
| | | | | | | | | | | | |
Total | | | | $ | 14,123,747 | | | | | $ | 14,465,219 | |
| | | | | | | | | | | | |
*Includes only the current day’s variation margin. Prior variation margin movements have been reflected in cash on the Consolidated Statement of Assets and Liabilities upon receipt or payment.
**Amounts relate to purchased option contracts and purchased swaption contracts, if any.
The effect of derivative instruments on the Consolidated Statement of Operations is as follows:
| | | | | | | | | | | | | | | | |
| Amount of Realized Gain or (Loss) Recognized on Derivatives | |
Derivatives Not Accounted for as
Hedging Instruments | | Investment
transactions
in unaffiliated
companies* | | | Swaption
contracts
written | | | Option contracts written | | | Futures contracts | |
Credit contracts | | $ | — | | | $ | — | | | $ | — | | | $ | — | |
Equity contracts | | | (378,287) | | | | — | | | | — | | | | (11,947,965) | |
Forward currency exchange contracts | | | (2,138,717) | | | | — | | | | (868,393) | | | | — | |
Interest rate contracts | | | — | | | | 29,263 | | | | — | | | | (4,235,253) | |
Volatility contracts | | | — | | | | — | | | | — | | | | (4,353,280) | |
| | | | |
Total | | $ | (2,517,004) | | | $ | 29,263 | | | $ | (868,393) | | | $ | (20,536,498) | |
| | | | |
| | | | | | | | | | | | |
|
| Amount of Realized Gain or (Loss) Recognized on Derivatives (Continued) | |
Derivatives Not Accounted for as
Hedging Instruments | | Forward
currency
exchange
contracts | | | Swap contracts | | | Total | |
Credit contracts | | $ | — | | | $ | 1,183,556 | | | $ | 1,183,556 | |
Equity contracts | | | — | | | | 3,967,322 | | | | (8,358,930) | |
Forward currency exchange contracts | | | (11,723,197 | ) | | | 91,413 | | | | (14,638,894) | |
Interest rate contracts | | | — | | | | 16,670 | | | | (4,189,320) | |
Volatility contracts | | | — | | | | — | | | | (4,353,280) | |
| | | | |
Total | | $ | (11,723,197 | ) | | $ | 5,258,961 | | | $ | (30,356,868) | |
| | | | |
*Includes purchased option contracts and purchased swaption contracts, if any.
71 OPPENHEIMER GLOBAL ALLOCATION FUND
| | |
NOTES TO CONSOLIDATED FINANCIAL STATEMENTS Continued | | |
6. Use of Derivatives (Continued)
| | | | | | | | | | | | | | | | |
| Amount of Change in Unrealized Gain or (Loss) Recognized on Derivatives | |
Derivatives Not Accounted for as
Hedging Instruments | | Investment
transactions
in unaffiliated
companies * | | | Option
contracts
written | | | Swaption
contracts
written | | | Futures
contracts | |
Credit contracts | | $ | — | | | $ | – | | | $ | — | | | $ | — | |
Equity contracts | | | — | | | | – | | | | — | | | | (1,932,599) | |
Forward currency exchange contracts | | | 29,380 | | | | 3,547 | | | | — | | | | — | |
Interest rate contracts | | | — | | | | – | | | | 6 | | | | 3,007,638 | |
| | | | |
Total | | $ | 29,380 | | | $ | 3,547 | | | $ | 6 | | | $ | 1,075,039 | |
| | | | |
| | | | | | | | | | | | |
| Amount of Change in Unrealized Gain or (Loss) Recognized on Derivatives (Continued) | |
Derivatives Not Accounted for as Hedging Instruments | | Forward
currency
exchange
contracts | | | Swap contracts | | | Total | |
Credit contracts | | $ | — | | | $ | 613,486 | | | $ | 613,486 | |
Equity contracts | | | — | | | | (1,846,121 | ) | | | (3,778,720) | |
Forward currency exchange contracts | | | (7,444,173 | ) | | | — | | | | (7,411,246) | |
Interest rate contracts | | | — | | | | 57,768 | | | | 3,065,412 | |
| | | | |
Total | | $ | (7,444,173 | ) | | $ | (1,174,867 | ) | | $ | (7,511,068) | |
| | | | |
*Includes purchased option contracts and purchased swaption contracts, if any.
7. Shares of Beneficial Interest
The Fund has authorized an unlimited number of $0.01 par value shares of beneficial interest of each class. Transactions in shares of beneficial interest were as follows:
| | | | | | | | | | | | | | | | |
| | | Year Ended October 31, 2017 | | | Year Ended October 31, 2016 | |
| | | Shares | | | Amount | | | Shares | | | Amount | |
| |
Class A | | | | | | | | | | | | | | | | |
Sold | | | 5,154,234 | | | $ | 95,608,718 | | | | 4,318,037 | | | $ | 74,457,689 | |
Dividends and/or distributions reinvested | | | 1,712,064 | | | | 29,581,846 | | | | 1,005,177 | | | | 17,069,106 | |
Redeemed | | | (9,731,041 | ) | | | (178,623,382 | ) | | | (9,660,559 | ) | | | (166,689,672) | |
| | | | |
Net decrease | | | (2,864,743 | ) | | $ | (53,432,818 | ) | | | (4,337,345 | ) | | $ | (75,162,877) | |
| | | | |
| | | | | | | | | | | | | | | | | |
Class B | | | | | | | | | | | | | | | | |
Sold | | | 12,873 | | | $ | 227,380 | | | | 24,548 | | | $ | 409,075 | |
Dividends and/or distributions reinvested | | | 24,311 | | | | 403,325 | | | | 19,189 | | | | 313,734 | |
Redeemed | | | (722,308 | ) | | | (12,680,465 | ) | | | (940,071 | ) | | | (15,677,956) | |
| | | | |
Net decrease | | | (685,124 | ) | | $ | (12,049,760 | ) | | | (896,334 | ) | | $ | (14,955,147) | |
| | | | |
72 OPPENHEIMER GLOBAL ALLOCATION FUND
7. Shares of Beneficial Interest (Continued)
| | | | | | | | | | | | | | | | |
| | | Year Ended October 31, 2017 | | | Year Ended October 31, 2016 | |
| | | Shares | | | Amount | | | Shares | | | Amount | |
| |
Class C | | | | | | | | | | | | | | | | |
Sold | | | 1,750,056 | | | $ | 31,150,274 | | | | 1,699,806 | | | $ | 28,178,400 | |
Dividends and/or distributions reinvested | | | 333,508 | | | | 5,532,894 | | | | 155,174 | | | | 2,541,264 | |
Redeemed | | | (3,329,805 | ) | | | (59,161,400 | ) | | | (2,470,643 | ) | | | (41,226,323) | |
| | | | |
Net decrease | | | (1,246,241 | ) | | $ | (22,478,232 | ) | | | (615,663 | ) | | $ | (10,506,659) | |
| | | | |
| | | | | | | | | | | | | | | | | |
Class I | | | | | | | | | | | | | | | | |
Sold | | | 233,115 | | | $ | 4,345,192 | | | | 1,332,114 | | | $ | 22,846,875 | |
Dividends and/or distributions reinvested | | | 42,957 | | | | 744,567 | | | | 10,439 | | | | 180,223 | |
Redeemed | | | (150,802 | ) | | | (2,785,678 | ) | | | (64,294 | ) | | | (1,114,531) | |
| | | | |
Net increase | | | 125,270 | | | $ | 2,304,081 | | | | 1,278,259 | | | $ | 21,912,567 | |
| | | | |
| | | | | | | | | | | | | | | | | |
Class R | | | | | | | | | | | | | | | | |
Sold | | | 619,381 | | | $ | 11,315,722 | | | | 455,469 | | | $ | 7,700,149 | |
Dividends and/or distributions reinvested | | | 57,150 | | | | 968,474 | | | | 29,342 | | | | 489,318 | |
Redeemed | | | (571,515 | ) | | | (10,308,851 | ) | | | (461,073 | ) | | | (7,865,488) | |
| | | | |
Net increase | | | 105,016 | | | $ | 1,975,345 | | | | 23,738 | | | $ | 323,979 | |
| | | | |
| | | | | | | | | | | | | | | | | |
Class Y | | | | | | | | | | | | | | | | |
Sold | | | 4,104,270 | | | $ | 76,565,697 | | | | 2,947,398 | | | $ | 51,042,862 | |
Dividends and/or distributions reinvested | | | 103,417 | | | | 1,791,705 | | | | 42,758 | | | | 726,535 | |
Redeemed | | | (1,413,141 | ) | | | (25,871,144 | ) | | | (2,169,062 | ) | | | (37,433,682) | |
| | | | |
Net increase | | | 2,794,546 | | | $ | 52,486,258 | | | | 821,094 | | | $ | 14,335,715 | |
| | | | |
8. Purchases and Sales of Securities
The aggregate cost of purchases and proceeds from sales of securities, other than short-term obligations and investments in IGMMF, for the reporting period were as follows:
| | | | | | | | |
| | | Purchases | | | Sales | |
Investment securities | | $ | 578,381,203 | | | $ | 705,762,236 | |
U.S. government and government agency obligations | | | 11,395,145 | | | | 114,982,075 | |
9. Fees and Other Transactions with Affiliates
Management Fees. Under the investment advisory agreement, the Fund pays the Manager a management fee based on the daily net assets of the Fund at an annual rate as shown in the following table:
73 OPPENHEIMER GLOBAL ALLOCATION FUND
| | |
NOTES TO CONSOLIDATED FINANCIAL STATEMENTS Continued | | |
9. Fees and Other Transactions with Affiliates (Continued)
| | | | |
| Fee Schedule | | | |
Up to $1.0 billion | | | 0.80 | % |
Next $2.0 billion | | | 0.76 | |
Next $1.0 billion | | | 0.71 | |
Next $1.0 billion | | | 0.66 | |
Next $1.0 billion | | | 0.60 | |
Next $1.0 billion | | | 0.55 | |
Next $2.0 billion | | | 0.50 | |
Over $9.0 billion | | | 0.48 | |
The Manager also provides investment management related services to the Subsidiary. The Subsidiary pays the Manager a monthly management fee at an annual rate according to the above schedule. The Subsidiary also pays certain other expenses including custody and directors’ fees.
The Fund’s effective management fee for the reporting period was 0.79% of average annual net assets before any Subsidiary management fees or any applicable waivers.
Sub-Adviser Fees. The Manager has retained the Sub-Adviser to provide the day-to-day portfolio management of the Fund and the Subsidiary. Under the Sub-Advisory Agreement, the Manager pays the Sub-Adviser an annual fee in monthly installments, equal to a percentage of the investment management fee collected by the Manager from the Fund and the Subsidiary, which shall be calculated after any investment management fee waivers. The fee paid to the Sub-Adviser is paid by the Manager, not by the Fund.
Transfer Agent Fees. OFI Global (the “Transfer Agent”) serves as the transfer and shareholder servicing agent for the Fund. The Fund pays the Transfer Agent a fee based on annual net assets, which shall be calculated after any applicable fee waivers. Fees incurred and average net assets for each class with respect to these services are detailed in the Consolidated Statement of Operations and Consolidated Financial Highlights, respectively.
Sub-Transfer Agent Fees. The Transfer Agent has retained Shareholder Services, Inc., a wholly-owned subsidiary of OFI (the “Sub-Transfer Agent”), to provide the day-to-day transfer agent and shareholder servicing of the Fund. Under the Sub-Transfer Agency Agreement, the Transfer Agent pays the Sub-Transfer Agent an annual fee in monthly installments, equal to a percentage of the transfer agent fee collected by the Transfer Agent from the Fund, which shall be calculated after any applicable fee waivers. The fee paid to the Sub-Transfer Agent is paid by the Transfer Agent, not by the Fund.
Trustees’ Compensation. The Fund has adopted an unfunded retirement plan (the “Plan”) for the Fund’s Independent Trustees. Benefits are based on years of service and fees paid to each Trustee during their period of service. The Plan was frozen with respect to adding new participants effective December 31, 2006 (the “Freeze Date”) and existing Plan Participants as of the Freeze Date will continue to receive accrued benefits under the Plan. Active Independent Trustees as of the Freeze Date have each elected a distribution method with
74 OPPENHEIMER GLOBAL ALLOCATION FUND
9. Fees and Other Transactions with Affiliates (Continued)
respect to their benefits under the Plan. During the reporting period, the Fund’s projected benefit obligations, payments to retired Trustees and accumulated liability were as follows:
| | | | |
Projected Benefit Obligations Increased | | $ | — | |
Payments Made to Retired Trustees | | | 89,130 | |
Accumulated Liability as of October 31, 2017 | | | 305,984 | |
The Fund’s Board of Trustees (“Board”) has adopted a compensation deferral plan for Independent Trustees that enables Trustees to elect to defer receipt of all or a portion of the annual compensation they are entitled to receive from the Fund. For purposes of determining the amount owed to the Trustee under the plan, deferred amounts are treated as though equal dollar amounts had been invested in shares of the Fund or in other Oppenheimer funds selected by the Trustee. The Fund purchases shares of the funds selected for deferral by the Trustee in amounts equal to his or her deemed investment, resulting in a Fund asset equal to the deferred compensation liability. Such assets are included as a component of “Other” within the asset section of the Consolidated Statement of Assets and Liabilities. Deferral of Trustees’ fees under the plan will not affect the net assets of the Fund and will not materially affect the Fund’s assets, liabilities or net investment income per share. Amounts will be deferred until distributed in accordance with the compensation deferral plan.
Distribution and Service Plan (12b-1) Fees. Under its General Distributor’s Agreement with the Fund, OppenheimerFunds Distributor, Inc. (the “Distributor”) acts as the Fund’s principal underwriter in the continuous public offering of the Fund’s classes of shares.
Distribution and Service Plan for Class A Shares. The Fund has adopted a Distribution and Service Plan (the “Plan”) for Class A shares pursuant to Rule 12b-1 under the 1940 Act. Under the Plan, the Fund pays a service fee to the Distributor at an annual rate of 0.25% of the daily net assets of Class A shares. The Distributor currently uses all of those fees to pay dealers, brokers, banks and other financial institutions periodically for providing personal services and maintenance of accounts of their customers that hold Class A shares. Under the Plan, the Fund may also pay an asset-based sales charge to the Distributor. However, the Fund’s Board has currently set the rate at zero. Fees incurred by the Fund under the Plan are detailed in the Consolidated Statement of Operations.
Distribution and Service Plans for Class B, Class C and Class R Shares. The Fund has adopted Distribution and Service Plans (the “Plans”) for Class B, Class C and Class R shares pursuant to Rule 12b-1 under the 1940 Act to compensate the Distributor for distributing those share classes, maintaining accounts and providing shareholder services. Under the Plans, the Fund pays the Distributor an annual asset-based sales charge of 0.75% on Class B and Class C shares’ daily net assets and 0.25% on Class R shares’ daily net assets. The Fund also pays a service fee under the Plans at an annual rate of 0.25% of daily net assets. The Plans continue in effect from year to year only if the Fund’s Board of Trustees votes annually to approve their continuance at an in person meeting called for that purpose. Fees incurred by
75 OPPENHEIMER GLOBAL ALLOCATION FUND
| | |
NOTES TO CONSOLIDATED FINANCIAL STATEMENTS Continued | | |
9. Fees and Other Transactions with Affiliates (Continued)
the Fund under the Plans are detailed in the Consolidated Statement of Operations.
Sales Charges. Front-end sales charges and CDSC do not represent expenses of the Fund. They are deducted from the proceeds of sales of Fund shares prior to investment or from redemption proceeds prior to remittance, as applicable. The sales charges retained by the Distributor from the sale of shares and the CDSC retained by the Distributor on the redemption of shares is shown in the following table for the period indicated.
| | | | | | | | | | | | | | | | | | | | |
| | | | | | Class A | | | Class B | | | Class C | | | Class R | |
| | | Class A | | | Contingent | | | Contingent | | | Contingent | | | Contingent | |
| | | Front-End | | | Deferred | | | Deferred | | | Deferred | | | Deferred | |
| | | Sales Charges | | | Sales Charges | | | Sales Charges | | | Sales Charges | | | Sales Charges | |
| | | Retained by | | | Retained by | | | Retained by | | | Retained by | | | Retained by | |
| Year Ended | | Distributor | | | Distributor | | | Distributor | | | Distributor | | | Distributor | |
October 31, 2017 | | | $262,553 | | | | $541 | | | | $9,197 | | | | $18,083 | | | | $— | |
Waivers and Reimbursements of Expenses. The Manager has contractually agreed to waive the management fee it receives from the Fund in an amount equal to the management fee it receives from the Subsidiary. During the reporting period, the Manager waived $35,109. This fee waiver and/or expense reimbursement may not be amended or withdrawn for one year from the date of the Fund’s prospectus, unless approved by the Board.
Effective January 1, 2017, the Transfer Agent has voluntarily agreed to waive fees and/or reimburse Fund expenses in an amount equal to 0.015% of average annual net assets for Classes A, B, C, R and Y.
During the reporting period, the Transfer Agent waived fees and/or reimbursed the Fund for transfer agent and shareholder servicing agent fees as follows:
| | | | |
Class A | | $ | 145,527 | |
Class B | | | 1,385 | |
Class C | | | 29,574 | |
Class R | | | 4,927 | |
Class Y | | | 10,831 | |
This fee waiver and/or reimbursement may be terminated at any time.
The Manager will waive fees and/or reimburse Fund expenses in an amount equal to the indirect management fees incurred through the Fund’s investments in Affiliated Funds. During the reporting period, the Manager waived fees and/or reimbursed the Fund $915,239 for these management fees. This fee waiver and/or expense reimbursement may not be amended or withdrawn for one year from the date of the Fund’s prospectus, unless approved by the Board.
10. Borrowings and Other Financing
Joint Credit Facility. A number of mutual funds managed by the Manager participate in a $1.875 billion revolving credit facility (the “Facility”) intended to provide short-term financing,
76 OPPENHEIMER GLOBAL ALLOCATION FUND
10. Borrowings and Other Financing (Continued)
if necessary, subject to certain restrictions in connection with atypical redemption activity. Expenses and fees related to the Facility are paid by the participating funds and are disclosed separately or as other expenses on the Consolidated Statement of Operations. The Fund did not utilize the Facility during the reporting period.
77 OPPENHEIMER GLOBAL ALLOCATION FUND
| | |
| REPORT OF INDEPENDENT REGISTERED PUBLIC ACCOUNTING FIRM | | |
| | | |
The Board of Trustees and Shareholders of Oppenheimer Quest for Value Funds:
We have audited the accompanying consolidated statement of assets and liabilities of Oppenheimer Global Allocation Fund (the Fund), a series of Oppenheimer Quest for Value Funds, and subsidiary, including the consolidated statement of investments, as of October 31, 2017, and the related consolidated statement of operations for the year then ended, the consolidated statements of changes in net assets for each of the years in the two-year period then ended, and the consolidated financial highlights for each of the years in the five-year period then ended. These consolidated financial statements and consolidated financial highlights are the responsibility of the Fund’s management. Our responsibility is to express an opinion on these consolidated financial statements and consolidated financial highlights based on our audits.
We conducted our audits in accordance with the standards of the Public Company Accounting Oversight Board (United States). Those standards require that we plan and perform the audit to obtain reasonable assurance about whether the financial statements and financial highlights are free of material misstatement. An audit includes examining, on a test basis, evidence supporting the amounts and disclosures in the financial statements. Our procedures included confirmation of securities owned as of October 31, 2017, by correspondence with the custodian, transfer agent and brokers, or by other appropriate auditing procedures where replies from brokers were not received. An audit also includes assessing the accounting principles used and significant estimates made by management, as well as evaluating the overall financial statement presentation. We believe that our audits provide a reasonable basis for our opinion.
In our opinion, the consolidated financial statements and consolidated financial highlights referred to above present fairly, in all material respects, the financial position of Oppenheimer Global Allocation Fund and subsidiary as of October 31, 2017, the results of their operations for the year then ended, the changes in their net assets for each of the years in the two-year period then ended, and the consolidated financial highlights for each of the years in the five-year period then ended, in conformity with U.S. generally accepted accounting principles.
KPMG LLP
Denver, Colorado
December 22, 2017
78 OPPENHEIMER GLOBAL ALLOCATION FUND
| | |
| FEDERAL INCOME TAX INFORMATION Unaudited | | |
| | | |
In early 2017, if applicable, shareholders of record received information regarding all dividends and distributions paid to them by the Fund during calendar year 2016.
Dividends, if any, paid by the Fund during the reporting period which are not designated as capital gain distributions should be multiplied by the maximum amount allowable but not less than 100% to arrive at the amount eligible for the corporate dividend-received deduction.
A portion, if any, of the dividends paid by the Fund during the reporting period which are not designated as capital gain distributions are eligible for lower individual income tax rates to the extent that the Fund has received qualified dividend income as stipulated by recent tax legislation. The maximum amount allowable but not less than $21,590,533 of the Fund’s fiscal year taxable income may be eligible for the lower individual income tax rates. In early 2017, shareholders of record received information regarding the percentage of distributions that are eligible for lower individual income tax rates.
Recent tax legislation allows a regulated investment company to designate distributions not designated as capital gain distributions, as either interest related dividends or short-term capital gain dividends, both of which are exempt from the U.S. withholding tax applicable to non U.S. taxpayers. For the reporting period, the maximum amount allowable but not less than $1,705,835 of the ordinary distributions to be paid by the Fund qualifies as an interest related dividend.
The foregoing information is presented to assist shareholders in reporting distributions received from the Fund to the Internal Revenue Service. Because of the complexity of the federal regulations which may affect your individual tax return and the many variations in state and local tax regulations, we recommend that you consult your tax advisor for specific guidance.
79 OPPENHEIMER GLOBAL ALLOCATION FUND
| | |
BOARD APPROVAL OF THE FUND’S INVESTMENT ADVISORY AND SUB-ADVISORY AGREEMENTS Unaudited | | |
The Fund has entered into an investment advisory agreement with OFI Global Asset Management, Inc. (“OFI Global” or the “Adviser”), a wholly-owned subsidiary of OppenheimerFunds, Inc. (“OFI” or the “Sub-Adviser”) (“OFI Global” and “OFI” together the “Managers”) and OFI Global has entered into a sub-advisory agreement with OFI whereby OFI provides investment sub-advisory services to the Fund (collectively, the “Agreements”).Each year, the Board of Trustees (the “Board”), including a majority of the independent Trustees, is required to determine whether to approve the terms of the Agreements and the renewal thereof. The Investment Company Act of 1940, as amended, requires that the Board request and evaluate, and that the Managers provide, such information as may be reasonably necessary to evaluate the terms of the Agreements. The Board employs an independent consultant to prepare a report that provides information, including comparative information that the Board requests for that purpose. In addition to in-person meetings focused on this evaluation, the Board receives information throughout the year regarding Fund services, fees, expenses and performance.
The Managers and the independent consultant provided information to the Board on the following factors: (i) the nature, quality and extent of the Managers’ services, (ii) the comparative investment performance of the Fund and the Managers, (iii) the fees and expenses of the Fund, including comparative fee and expense information, (iv) the profitability of the Managers and their affiliates, including an analysis of the cost of providing services, (v) whether economies of scale are realized as the Fund grows and whether fee levels reflect these economies of scale for Fund investors and (vi) other benefits to the Managers from their relationship with the Fund. The Board was aware that there are alternatives to retaining the Managers.
Outlined below is a summary of the principal information considered by the Board as well as the Board’s conclusions.
Nature, Quality and Extent of Services. The Board considered information about the nature, quality and extent of the services provided to the Fund and information regarding the Managers’ key personnel who provide such services. The Managers’ duties include providing the Fund with the services of the portfolio managers and the Sub-Adviser’s investment team, who provide research, analysis and other advisory services in regard to the Fund’s investments; and securities trading services. OFI Global is responsible for oversight of third-party service providers; monitoring compliance with applicable Fund policies and procedures and adherence to the Fund’s investment restrictions; risk management; and oversight of the Sub-Adviser. OFI Global is also responsible for providing certain administrative services to the Fund. Those services include providing and supervising all administrative and clerical personnel who are necessary in order to provide effective corporate administration for the Fund; compiling and maintaining records with respect to the Fund’s operations; preparing and filing reports required by the U.S. Securities and Exchange Commission; preparing periodic reports regarding the operations of the Fund for its shareholders; preparing proxy materials for shareholder meetings; and preparing the registration statements required by federal and state securities laws for the sale of the Fund’s shares. OFI Global also provides the Fund with office space, facilities and equipment.
80 OPPENHEIMER GLOBAL ALLOCATION FUND
The Board also considered the quality of the services provided and the quality of the Managers’ resources that are available to the Fund. The Board took account of the fact that the Sub-Adviser has over fifty years of experience as an investment adviser and that its assets under management rank it among the top mutual fund managers in the United States. The Board evaluated the Managers’ advisory, administrative, accounting, legal, compliance and risk management services, among other services, and information the Board has received regarding the experience and professional qualifications of the Managers’ key personnel and the size and functions of its staff. In its evaluation of the quality of the portfolio management services provided, the Board considered the experience of Mark Hamilton, Dokyoung Lee, Alessio de Longis, and Benjamin Rockmuller, the portfolio managers for the Fund, and the Sub-Adviser’s investment team and analysts. The Board members also considered the totality of their experiences with the Managers as directors or trustees of the Fund and other funds advised by the Managers. The Board considered information regarding the quality of services provided by affiliates of the Managers, which the Board members have become knowledgeable about through their experiences with the Managers and in connection with the review or renewal of the Fund’s service agreements or service providers. The Board concluded, in light of the Managers’ experience, reputation, personnel, operations and resources that the Fund benefits from the services provided under the Agreements.
Investment Performance of the Managers and the Fund. Throughout the year, the Managers provided information on the investment performance of the Fund, the Adviser and the Sub-Adviser, including comparative performance information. The Board also reviewed information, prepared by the Managers and by the independent consultant, comparing the Fund’s historical performance to relevant benchmarks or market indices and to the performance of other retail funds in the world allocation category. The Board noted that the Fund’s five-year performance was better than its category median and its three-year performance equaled the category median although its one-year and ten-year performance was below its category median.
Fees and Expenses of the Fund. The Board reviewed the fees paid to the Adviser and the other expenses borne by the Fund. The independent consultant provided comparative data in regard to the fees and expenses of the Fund and other retail front-end load world allocation funds with comparable asset levels and distribution features. The Board noted that the Fund’s contractual management fee and total expenses were higher than its peer group median and category median.
Economies of Scale and Profits Realized by the Managers. The Board considered information regarding the Managers’ costs in serving as the Fund’s investment adviser and sub-adviser, including the costs associated with the personnel and systems necessary to manage the Fund, and information regarding the Managers’ profitability from their relationship with the Fund. The Board also considered that the Managers must be able to pay and retain experienced professional personnel at competitive rates to provide quality services to the Fund. The Board reviewed whether the Managers may realize economies of scale in managing and supporting the Fund. The Board noted that the Fund currently has management fee breakpoints, which are intended to share with Fund shareholders economies of scale that may exist as the Fund’s assets grow.
81 OPPENHEIMER GLOBAL ALLOCATION FUND
| | |
BOARD APPROVAL OF THE FUND’S INVESTMENT ADVISORY AND SUB-ADVISORY AGREEMENTS Unaudited / Continued | | |
Other Benefits to the Managers. In addition to considering the profits realized by the Managers, the Board considered information that was provided regarding the direct and indirect benefits the Managers receive as a result of their relationship with the Fund, including compensation paid to the Managers’ affiliates and research provided to the Adviser in connection with permissible brokerage arrangements (soft dollar arrangements).
Conclusions. These factors were also considered by the independent Trustees meeting separately from the full Board, assisted by experienced counsel to the Fund and to the independent Trustees. Fund counsel and the independent Trustees’ counsel are independent of the Managers within the meaning and intent of the Securities and Exchange Commission Rules.
Based on its review of the information it received and its evaluations described above, the Board, including a majority of the independent Trustees, decided to continue the Agreements through September 30, 2018. In arriving at its decision, the Board did not identify any factor or factors as being more important than others, but considered all of the above information, and considered the terms and conditions of the Agreements, including the management fees, in light of all the surrounding circumstances.
82 OPPENHEIMER GLOBAL ALLOCATION FUND
| | |
PORTFOLIO PROXY VOTING POLICIES AND PROCEDURES; UPDATES TO STATEMENTS OF INVESTMENTS Unaudited | | |
The Fund has adopted Portfolio Proxy Voting Policies and Guidelines under which the Fund votes proxies relating to securities (“portfolio proxies”) held by the Fund. A description of the Fund’s Portfolio Proxy Voting Policies and Guidelines is available (i) without charge, upon request, by calling the Fund toll-free at 1.800.CALL OPP (225.5677), (ii) on the Fund’s website at www.oppenheimerfunds.com, and (iii) on the SEC’s website at www.sec.gov. In addition, the Fund is required to file Form N-PX, with its complete proxy voting record for the 12 months ended June 30th, no later than August 31st of each year. The Fund’s voting record is available (i) without charge, upon request, by calling the Fund toll-free at 1.800.CALL OPP (225.5677), and (ii) in the Form N-PX filing on the SEC’s website at www.sec.gov.
The Fund files its complete schedule of portfolio holdings with the SEC for the first quarter and the third quarter of each fiscal year on Form N-Q. The Fund’s Form N-Q filings are available on the SEC’s website at www.sec.gov. Those forms may be reviewed and copied at the SEC’s Public Reference Room in Washington, D.C. Information on the operation of the Public Reference Room may be obtained by calling 1-800-SEC-0330.
Householding—Delivery of Shareholder Documents
This is to inform you about OppenheimerFunds’ “householding” policy. If more than one member of your household maintains an account in a particular fund, OppenheimerFunds will mail only one copy of the fund’s prospectus (or, if available, the fund’s summary prospectus), annual and semiannual report and privacy policy. The consolidation of these mailings, called householding, benefits your fund through reduced mailing expense, and benefits you by reducing the volume of mail you receive from OppenheimerFunds. Householding does not affect the delivery of your account statements.
Please note that we will continue to household these mailings for as long as you remain an OppenheimerFunds shareholder, unless you request otherwise. If you prefer to receive multiple copies of these materials, please call us at 1.800.CALL-OPP (225-5677). You may also notify us in writing or via email. We will begin sending you individual copies of the prospectus (or, if available, the summary prospectus), reports and privacy policy within 30 days of receiving your request to stop householding.
83 OPPENHEIMER GLOBAL ALLOCATION FUND
| | |
| TRUSTEES AND OFFICERS Unaudited | | |
| | |
Name, Position(s) Held with the
Fund, Length of Service, Year of
Birth | | Principal Occupation(s) During the Past 5 Years; Other Trusteeships/ Directorships Held; Number of Portfolios in the Fund Complex Currently Overseen |
| |
| INDEPENDENT TRUSTEES | | The address of each Trustee in the chart below is 6803 S. Tucson Way, Centennial, Colorado 80112-3924. Each Trustee serves for an indefinite term, or until his or her resignation, retirement, death or removal. |
| |
Brian F. Wruble,
Chairman of the Board of Trustees
(since 2009), Trustee (since 2001) Year of Birth: 1943 | | Governor of Community Foundation of the Florida Keys (non-profit) (since July 2012); Director of TCP Capital, Inc. (since November 2015); Chairman Emeritus of the Board of Trustees (since August 2011), Chairman of the Board of Trustees (August 2007-August 2011), Trustee of the Board of Trustees (since August 1991) of The Jackson Laboratory (non-profit); Member of Zurich Insurance Group’s Investment Management Advisory Council (insurance) (October 2004-February 2017); Treasurer (since 2007) and Trustee (since May 1992) of the Institute for Advanced Study (non-profit educational institute); Director of Special Value Opportunities Fund, LLC (registered investment company) (affiliate of the Sub- Adviser’s parent company) (September 2004-June 2015); General Partner of Odyssey Partners, L.P. (hedge fund) (September 1995-December 2007); Special Limited Partner of Odyssey Investment Partners, LLC (private equity investment) (January 1999-September 2004). Oversees 57 portfolios in the OppenheimerFunds complex. Mr. Wruble has served on the Boards of certain Oppenheimer funds since April 2001, during which time he has become familiar with the Fund’s (and other Oppenheimer funds’) financial, accounting, regulatory and investment matters and has contributed to the Boards’ deliberations. |
| |
Beth Ann Brown,
Trustee (since 2016) Year of Birth: 1968 | | Advisor, Board of Advisors of Caron Engineering Inc. (since December 2014); Independent Consultant (since September 2012); held the following positions at Columbia Management Investment Advisers LLC: Head of Intermediary Distribution (2008-2012), Managing Director, Strategic Relations (2005-2008), Managing Director, Head of National Accounts (2004-2005); Senior Vice President, National Account Manager (2002-2004), Senior Vice President, Key Account Manager (1999-2002) and Vice President, Key Account Manager (1996-1999) of Liberty Funds Distributor, Inc.; President and Director, of Acton Shapleigh Youth Conservation Corps (non-profit) (since 2012); and Vice President and Director of Grahamtastic Connection (non-profit) (since May 2013). Oversees 57 portfolios in the OppenheimerFunds complex. Ms. Brown has served on the Boards of certain Oppenheimer funds since January 2016, during which time she has become familiar with the Fund’s (and other Oppenheimer funds’) financial, accounting, regulatory and investment matters and has contributed to the Board’s deliberations. |
| |
Edmund P. Giambastiani, Jr.,
Trustee (since 2013) Year of Birth: 1948 | | Advisory Board Member of the Maxwell School of Citizenship and Public Affairs of Syracuse University (since April 2012); Director of Mercury Defense Systems Inc. (information technology) (August 2011-February 2013); Trustee of the U.S. Naval Academy Foundation Athletic & Scholarship Program (since November 2010); Advisory Board Member of the Massachusetts Institute of Technology Lincoln Laboratory (federally-funded research development center) (since May 2010); Director of The Boeing Company (aerospace and defense) (since October 2009); Trustee of MITRE Corporation (federally-funded research development center) (since September 2008); Independent Director of QinetiQ Group Plc (defense technology and security) (February 2008-August 2011); Chairman of Monster Worldwide, Inc. (on-line career services) (March 2015-November 2016), Director of |
84 OPPENHEIMER GLOBAL ALLOCATION FUND
| | |
Edmund P. Giambastiani, Jr.,
Continued | | Monster Worldwide, Inc. (on-line career services) (February 2008-June 2011); Lead Director (June 2011-March 2015); Chairman of Alenia North America, Inc. (military and defense products) (January 2008-October 2009); Director of SRA International, Inc. (information technology and services) (January 2008-July 2011); President of Giambastiani Group LLC (national security and energy consulting) (since October 2007); United States Navy, career nuclear submarine officer (June 1970-October 2007), Vice Chairman of the Joint Chiefs of Staff (2005-October 2007), Supreme Allied Commander of NATO Commander Transformation (2003-2005), Commander, U.S. Joint Forces Command (2002-2005). Since his retirement from the U.S. Navy in October 2007, Admiral Giambastiani has also served on numerous U.S. Government advisory boards, investigations and task forces for the Secretaries of Defense, State and Interior and the Central Intelligence Agency. He recently completed serving as a federal commissioner on the Military Compensation and Retirement Modernization Commission. Oversees 57 portfolios in the OppenheimerFunds complex. Admiral Giambastiani has served on the Boards of certain Oppenheimer funds since February 2013, including as an Advisory Board Member for certain Oppenheimer funds, during which time he has become familiar with the Fund’s (and other Oppenheimer funds’) financial, accounting, regulatory and investment matters and has contributed to the Boards’ deliberations. For purposes of this report, Admiral Giambastiani is identified as a Trustee. |
| |
Elizabeth Krentzman,
Trustee (since 2014) Year of Birth: 1959 | | Member of the University of Florida National Board Foundation (since September 2017); Member of the Cartica Funds Board of Directors (private investment funds) (since January 2017); Member of the University of Florida College of Law Association Board of Trustees and Audit Committee Member (since April 2016); Member of University of Florida Law Advisory Board, Washington, DC Alumni Group (since 2015); Advisory Board Member of the Securities and Exchange Commission Historical Society (since 2007); held the following positions at Deloitte & Touche LLP: Principal and Chief Regulatory Advisor for Asset Management Services (2007 - 2014) and U.S. Mutual Fund Leader (2011 - 2014); General Counsel of the Investment Company Institute (trade association) (June 2004 - April 2007); held the following positions at Deloitte & Touche LLP: National Director of the Investment Management Regulatory Consulting Practice (1997 - 2004), Principal (2003 - 2004), Director (1998 - 2003) and Senior Manager (1997 - 1998); Assistant Director of the Division of Investment Management - Office of Disclosure and Investment Adviser Regulation of the U.S. Securities and Exchange Commission (1996 - 1997) and various positions with the Division of Investment Management – Office of Regulatory Policy (1991 - 1996) of the U.S. Securities and Exchange Commission; Associate at Ropes & Gray LLP (1987 – 1991). Oversees 57 portfolios in the OppenheimerFunds complex. Ms. Krentzman has served on the Boards of certain Oppenheimer funds since August 2014, during which time she has become familiar with the Fund’s (and other Oppenheimer funds’) financial, accounting, regulatory and investment matters and has contributed to the Boards’ deliberations. |
| |
Mary F. Miller,
Trustee (since 2009) Year of Birth: 1942 | | Trustee of International House (not-for-profit) (since June 2007); Trustee of the American Symphony Orchestra (not-for-profit) (October 1998-November 2011); and Senior Vice President and General Auditor of American Express Company (financial services company) (July 1998-February 2003). Oversees 57 portfolios in the OppenheimerFunds complex. Ms. Miller has served on the Boards of certain Oppenheimer funds since August 2004, during which time she has become familiar with the Fund’s (and other Oppenheimer funds’) financial, accounting, regulatory and investment matters and has contributed to the Boards’ deliberations. |
85 OPPENHEIMER GLOBAL ALLOCATION FUND
| | |
| TRUSTEES AND OFFICERS Unaudited / Continued | | |
| | | |
| | |
Joel W. Motley, Trustee (since 2009) Year of Birth: 1952 | | Director of Office of Finance Federal Home Loan Bank (since September 2016); Director of Greenwall Foundation (since October 2013); Member of Board and Investment Committee of The Greenwall Foundation (since April 2013); Member of the Vestry of Trinity Wall Street (since April 2012); Director of Southern Africa Legal Services Foundation (since March 2012); Board Member of Pulitzer Center for Crisis Reporting (non-profit journalism) (since March 2011); Managing Director of Public Capital Advisors, LLC (privately-held financial advisor) (since January 2006); Managing Director of Carmona Motley, Inc. (privately-held financial advisor) (since January 2002); Director of Columbia Equity Financial Corp. (privately-held financial advisor) (2002-2007); Managing Director of Carmona Motley Hoffman Inc. (privately-held financial advisor) (January 1998-December 2001); Member of the Finance and Budget Committee of the Council on Foreign Relations, Member of the Investment Committee and Board of Human Rights Watch (since July 2000) and Member of the Investment Committee and Board of Historic Hudson Valley (since February 2010). Oversees 57 portfolios in the OppenheimerFunds complex. Mr. Motley has served on the Boards of certain Oppenheimer funds since October 2002, during which time he has become familiar with the Fund’s (and other Oppenheimer funds’) financial, accounting, regulatory and investment matters and has contributed to the Boards’ deliberations. |
| |
Joanne Pace, Trustee (since 2012) Year of Birth: 1958 | | Advisory Board Director of Massey Quick and Company, LLC (since October 2014); Board Director of Horizon Blue Cross Blue Shield of New Jersey (since November 2012); Advisory Board Director of The Alberleen Group LLC (since March, 2012); Board Member (since January 2015), Board Member of 100 Women in Hedge Funds (non-profit) (since January 2015); Advisory Council Member of Morgan Stanley Children’s Hospital (non-profit) (since May, 2012); Senior Advisor of SECOR Asset Management, LP (2010-2011); Managing Director and Chief Operating Officer of Morgan Stanley Investment Management (2006-2010); Partner and Chief Operating Officer of FrontPoint Partners, LLC (hedge fund) (2005-2006); held the following positions at Credit Suisse: Managing Director (2003-2005); Global Head of Human Resources and member of Executive Board and Operating Committee (2004-2005), Global Head of Operations and Product Control (2003- 2004); held the following positions at Morgan Stanley: Managing Director (1997- 2003), Controller and Principal Accounting Officer (1999-2003); Chief Financial Officer (temporary assignment) for the Oversight Committee, Long Term Capital Management (1998-1999). Lead Independent Director and Chair of the Audit and Nominating Committee of The Global Chartist Fund, LLC of Oppenheimer Asset Management (2011-2012); Board Director of Managed Funds Association (2008- 2010); Board Director of Morgan Stanley Foundation (2007-2010) and Investment Committee Chair (2008-2010). Oversees 57 portfolios in the OppenheimerFunds complex. Ms. Pace has served on the Boards of certain Oppenheimer funds since November 2012, including as an Advisory Board Member for certain Oppenheimer funds, during which time she has become familiar with the Fund’s (and other Oppenheimer funds’) financial, accounting, regulatory and investment matters and has contributed to the Board’s deliberations. For purposes of this report, Ms. Pace is identified as a Trustee. |
86 OPPENHEIMER GLOBAL ALLOCATION FUND
| | |
Daniel Vandivort, Trustee (since 2014) Year of Birth: 1954 | | Chairman and Lead Independent Director/Trustee (March 2010-September 2014), Chairman of the Audit Committee (March 2009-September 2014) and Director/ Trustee (December 2008-September 2014) of the Board of Directors/Trustees of Value Line Funds; Trustee, Board of Trustees of Huntington Disease Foundation of America (since January 2015 and June 2007-December 2013) and Treasurer, Chairman of the Audit and Finance Committee (since January 2016); Trustee, Board of Trustees, RIM Retirement Savings Plan (2005-2007); President and Chief Investment Officer, Robeco Investment Management, formerly known as Weiss Peck and Greer (January 2005-June 2007); Member, Management Committee of Robeco Investment Management (2001-2007); Chairman and Trustee of the Board of Trustees of Weiss, Peck and Greer Funds (2004-2005); Managing Director and Head of Fixed Income, Weiss, Peck and Greer (November 1994-January 2005); Managing Director and Head of Fixed Income, CS First Boston Investment Management (January 1992-November 1994); Director, Global Product Development, First Boston Asset Management (November 1989 to January 1992); Vice President, Fixed Income Sales, First Boston Corp. (May 1984-November 1989). Oversees 57 portfolios in the OppenheimerFunds complex. Mr. Vandivort has served on the Boards of certain Oppenheimer funds since 2014, during which time he has become familiar with the Fund’s (and other Oppenheimer funds’) financial, accounting, regulatory and investment matters and has contributed to the Boards’ deliberations. |
| INTERESTED TRUSTEE AND OFFICER | | Mr. Steinmetz is an “Interested Trustee” because he is affiliated with the Manager and the Sub-Adviser by virtue of his positions as Chairman of the Sub-Adviser and officer and director of the Manager. Both as a Trustee and as an officer, Mr. Steinmetz serves for an indefinite term, or until his resignation, retirement, death or removal. Mr. Steinmetz’s address is 225 Liberty Street, New York, New York 10281-1008. |
| |
Arthur P. Steinmetz, Trustee (since 2015), President and Principal Executive Officer (since 2014) Year of Birth: 1958 | | Chairman of the Sub-Adviser (since January 2015); CEO and Chairman of the Manager (since July 2014), President of the Manager (since May 2013), a Director of the Manager (since January 2013), Director of the Sub-Adviser (since July 2014), President, Management Director and CEO of Oppenheimer Acquisition Corp. (the Sub-Adviser’s parent holding company) (since July 2014), and President and Director of OFI SteelPath, Inc. (since January 2013). Chief Investment Officer of the OppenheimerFunds advisory entities from (January 2013-December 2013); Executive Vice President of the Manager (January 2013-May 2013); Chief Investment Officer of the Sub-Adviser (October 2010-December 2012); Chief Investment Officer, Fixed-Income, of the Sub-Adviser (April 2009-October 2010); Executive Vice President of the Sub-Adviser (October 2009-December 2012); Director of Fixed Income of the Sub-Adviser (January 2009-April 2009); and a Senior Vice President of the Sub-Adviser (March 1993-September 2009). An officer of 101 portfolios in the OppenheimerFunds complex. |
| OTHER OFFICERS OF THE FUND | | The addresses of the Officers in the chart below are as follows: for Messrs. Hamilton, Rockmuller, de Longis, Lee, Mss. Lo Bessette, Foxson and Picciotto, 225 Liberty Street, New York, New York 10281-1008, for Mr. Petersen, 6803 S. Tucson Way, Centennial, Colorado 80112-3924. Each Officer serves for an indefinite term or until his or her resignation, retirement, death or removal. |
87 OPPENHEIMER GLOBAL ALLOCATION FUND
| | |
| TRUSTEES AND OFFICERS Unaudited / Continued | | |
| | | |
| | |
| |
Mark Hamilton, Vice President (since 2013) Year of Birth: 1965 | | Chief Investment Officer, Asset Allocation of the Sub-Adviser (since April 2013) and a Senior Vice President of the Sub-Adviser (since April 2013). Mr. Hamilton served at AllianceBernstein L.P. (from 1994-2013), as an Investment Director of Dynamic Asset Allocation (from 2010-2013), Head of North American Blend Team (from 2009-2010), and Senior Portfolio Manager of Blend Strategies (from 2006-2010). A portfolio manager and an officer of other portfolios in the OppenheimerFunds complex. |
| |
Benjamin H. Rockmuller, Vice President (since 2011) Year of Birth: 1979 | | Vice President of the Sub-Adviser (since September 2010); Assistant Vice President of the Sub-Adviser (January 2010-August 2010); Portfolio Manager of the Sub- Adviser (since July 2010); Senior Analyst of the Sub-Adviser for the Global Debt Team (January 2010-July 2010); Intermediate Analyst of the Sub-Adviser for the Global Debt Team (January 2007-January 2010); Junior Analyst of the Sub-Adviser for the Global Debt Team (April 2004-January 2007) and Junior Analyst of the Sub- Adviser for the High Yield Team (June 2003-April 2004). A portfolio manager and an officer in the OppenheimerFunds complex. |
| |
Alessio de Longis, Vice President (since 2015) Year of Birth: 1978 | | Vice President of the Sub-Adviser (since June 2010); Assistant Vice President of the Sub-Adviser (May 2009-June 2010); Senior Research Analyst of the Sub-Adviser (January 2008-June 2010); Intermediate Research Analyst of the Sub-Adviser (January 2006-January 2008) Junior Analyst of the Sub-Adviser (February 2004-January 2006). A portfolio manager and an officer in the OppenheimerFunds complex. |
| |
Dokyoung Lee, Vice President (since 2015) Year of Birth: 1965 | | Director of Research, Global Multi-Asset Group and a Senior Vice President of the Sub-Adviser (since October 2013). Mr. Lee served at Alliance Bernstein L.P. (1994- 2013): Director of Research for Strategic Asset Allocation (2011-2013), Director of Research for Blend Strategies (2008-2011), Head of Asia Pacific Blend Strategies (2005-2008), Head of Quantitative Research and Senior Portfolio Manager for Japan Value Equities (2001-2005), Portfolio Manager for Emerging Markets Value Equities (1997-2001), and Quantitative Analyst for US Value Equities (1994-1997). A portfolio manager and an officer in the OppenheimerFunds complex. |
| |
Cynthia Lo Bessette, Secretary and Chief Legal Officer (since 2016) Year of Birth: 1969 | | Executive Vice President, General Counsel and Secretary of the Manager (since February 2016); Senior Vice President and Deputy General Counsel of the Manager (March 2015-February 2016); Chief Legal Officer of the Sub-Adviser and the Distributor (since February 2016); Vice President, General Counsel and Secretary of Oppenheimer Acquisition Corp. (since February 2016); General Counsel of OFI SteelPath, Inc., VTL Associates, LLC and Index Management Solutions, LLC (since February 2016); Chief Legal Officer of OFI Global Institutional, Inc., HarbourView Asset Management Corporation, OFI Global Trust Company, Oppenheimer Real Asset Management, Inc., OFI Private Investments Inc., Shareholder Services, Inc. and Trinity Investment Management Corporation (since February 2016); Corporate Counsel (February 2012-March 2015) and Deputy Chief Legal Officer (April 2013-March 2015) of Jennison Associates LLC; Assistant General Counsel (April 2008-September 2009) and Deputy General Counsel (October 2009-February 2012) of Lord Abbett & Co. LLC. An officer of 101 portfolios in the OppenheimerFunds complex. |
| |
Jennifer Foxson, Vice President and Chief Business Officer (since 2014) Year of Birth: 1969 | | Senior Vice President of OppenheimerFunds Distributor, Inc. (since June 2014); Vice President of OppenheimerFunds Distributor, Inc. (April 2006-June 2014); Vice President of the Sub-Adviser (January 1998-March 2006); Assistant Vice President of the Sub-Adviser (October 1991-December 1998). An officer of 101 portfolios in the OppenheimerFunds complex. |
88 OPPENHEIMER GLOBAL ALLOCATION FUND
| | |
| |
Mary Ann Picciotto, Chief Compliance Officer and Chief Anti-Money Laundering Officer (since 2014) Year of Birth: 1973 | | Senior Vice President and Chief Compliance Officer of the Manager (since March 2014); Chief Compliance Officer of the Sub-Adviser, OFI SteelPath, Inc., OFI Global Trust Company, OFI Global Institutional, Inc., Oppenheimer Real Asset Management, Inc., OFI Private Investments, Inc., Harborview Asset Management Corporation, Trinity Investment Management Corporation, and Shareholder Services, Inc. (since March 2014); Managing Director of Morgan Stanley Investment Management Inc. and certain of its various affiliated entities; Chief Compliance Officer of various Morgan Stanley Funds (May 2010-January 2014); Chief Compliance Officer of Morgan Stanley Investment Management Inc. (April 2007-January 2014). An officer of 101 portfolios in the OppenheimerFunds complex. |
| |
Brian S. Petersen, Treasurer and Principal Financial & Accounting Officer (since 2016) Year of Birth: 1970 | | Senior Vice President of the Manager (since January 2017); Vice President of the Manager (January 2013-January 2017); Vice President of the Sub-Adviser (February 2007-December 2012); Assistant Vice President of the Sub-Adviser (August 2002- 2007). An officer of 101 portfolios in the OppenheimerFunds complex. |
The Fund’s Statement of Additional Information contains additional information about the Fund’s Trustees and Officers and is available without charge upon request, by calling 1.800.CALL OPP (225.5677).
89 OPPENHEIMER GLOBAL ALLOCATION FUND
| | |
| OPPENHEIMER GLOBAL ALLOCATION FUND | | |
| | | |
| | |
| |
| Manager | | OFI Global Asset Management, Inc. |
| |
| Sub-Adviser | | OppenheimerFunds, Inc. |
| |
| Distributor | | OppenheimerFunds Distributor, Inc. |
| |
Transfer and Shareholder
Servicing Agent | | OFI Global Asset Management, Inc. |
| |
| Sub-Transfer Agent | | Shareholder Services, Inc. |
| | DBA OppenheimerFunds Services |
| |
Independent Registered
Public Accounting Firm | | KPMG LLP |
| |
| Legal Counsel | | Kramer Levin Naftalis & Frankel LLP |
© 2017 OppenheimerFunds, Inc. All rights reserved.
90 OPPENHEIMER GLOBAL ALLOCATION FUND
As an Oppenheimer fund shareholder, you are entitled to know how we protect your personal information and how we limit its disclosure.
Information Sources
We obtain non-public personal information about our shareholders from the following sources:
| ● | | Applications or other forms. |
| ● | | When you create a user ID and password for online account access. |
| ● | | When you enroll in eDocs Direct,SM our electronic document delivery service. |
| ● | | Your transactions with us, our affiliates or others. |
| ● | | Technologies on our website, including: “cookies” and web beacons, which are used to collect data on the pages you visit and the features you use. |
If you visit oppenheimerfunds.com and do not log on to the secure account information areas, we do not obtain any personal information about you. When you do log on to a secure area, we do obtain your user ID and password to identify you. We also use this information to provide you with products and services you have requested, to inform you about products and services that you may be interested in and assist you in other ways.
We do not collect personal information through our website unless you willingly provide it to us, either directly by email or in those areas of the website that request information. In order to update your personal information (including your mailing address, email address and phone number) you must first log on and visit your user profile.
If you have set your browser to warn you before accepting cookies, you will receive the warning message with each cookie. You can refuse cookies by turning them off in your browser. However, doing so may limit your access to certain sections of our website.
We use cookies to help us improve and manage our website. For example, cookies help us recognize new versus repeat visitors to the site, track the pages visited, and enable some special features on the website. This data helps us provide better service for our website visitors.
Protection of Information
We do not disclose any non-public personal information (such as names on a customer list) about current or former customers to anyone, except as permitted by law.
Disclosure of Information
Copies of confirmations, account statements and other documents reporting activity in your fund accounts are made available to your financial advisor (as designated by you). We may also use details about you and your investments to help us, our financial service affiliates, or firms that jointly market their financial products and services with ours, to better serve your investment needs or suggest educational material that may be of interest to you. If this requires us to provide you with an opportunity to “opt in” or “opt out” of such information sharing with a firm not affiliated with us, you will receive notification on how to do so, before any such sharing takes place.
Right of Refusal
We will not disclose your personal information to unaffiliated third parties (except as permitted by law), unless we first offer you a reasonable opportunity to refuse or “opt out” of such disclosure.
91 OPPENHEIMER GLOBAL ALLOCATION FUND
Internet Security and Encryption
In general, the email services provided by our website are encrypted and provide a secure and private means of communication with us. To protect your own privacy, confidential and/ or personal information should only be communicated via email when you are advised that you are using a secure website.
As a security measure, we do not include personal or account information in non-secure emails, and we advise you not to send such information to us in non-secure emails. Instead, you may take advantage of the secure features of our website to encrypt your email correspondence. To do this, you will need to use a browser that supports Secure Sockets Layer (SSL) protocol.
| ● | | All transactions conducted via our websites, including redemptions, exchanges and purchases, are secured by the highest encryption standards available. SSL is used to establish a secure connection between your PC and OppenheimerFunds’ server. It transmits information in an encrypted and scrambled format. |
| ● | | Encryption is achieved through an electronic scrambling technology that uses a “key” to code and then decode the data. Encryption acts like the cable converter box you may have on your television set. It scrambles data with a secret code so that no one can make sense of it while it is being transmitted. When the data reaches its destination, the same software unscrambles the data. |
| ● | | You can exit the secure area by closing your browser or, for added security, you can use the Log Out button before you close your browser. |
Other Security Measures
We maintain physical, electronic and procedural safeguards to protect your personal account information. Our employees and agents have access to that information only so that they may offer you products or provide services, for example, when responding to your account questions.
How You Can Help
You can also do your part to keep your account information private and to prevent unauthorized transactions. If you obtain a user ID and password for your account, safeguard that information. Strengthening your online credentials–your online security profile–typically your user name, password, and security questions and answers, can be one of your most important lines of defense on the Internet. For additional information on how you can help prevent identity theft, visit https://www. oppenheimerfunds.com/security.
Who We Are
This joint notice describes the privacy policies of the Oppenheimer funds, OppenheimerFunds, Inc., each of its investment adviser subsidiaries, OppenheimerFunds Distributor, Inc. and OFI Global Trust Co. It applies to all Oppenheimer fund accounts you presently have, or may open in the future, using your Social Security number—whether or not you remain a shareholder of our funds. This notice was last updated as of November 2017. In the event it is updated or changed, we will post an updated notice on our website at oppenheimerfunds.com. If you have any questions about this privacy policy, email us by clicking on the Contact Us section of our website at oppenheimerfunds.com, write to us at P.O. Box 5270, Denver, CO 80217-5270, or call us at 800 CALL OPP (225 5677).
92 OPPENHEIMER GLOBAL ALLOCATION FUND
THIS PAGE INTENTIONALLY LEFT BLANK.
93 OPPENHEIMER GLOBAL ALLOCATION FUND
THIS PAGE INTENTIONALLY LEFT BLANK.
94 OPPENHEIMER GLOBAL ALLOCATION FUND
THIS PAGE INTENTIONALLY LEFT BLANK.
95 OPPENHEIMER GLOBAL ALLOCATION FUND
| | | | |
| |  | | |
| | |
| | Visit us at oppenheimerfunds.com for 24-hr access to account information and transactions or call us at 800.CALL OPP (800.225.5677) for 24-hr automated information and automated transactions. Representatives also available Mon–Fri 8am-8pm ET. | | |
| | |
| | | | |
| Visit Us | | | | |
| oppenheimerfunds.com | | | | |
| | |
| Call Us | | | | |
| 800 225 5677 | | | | |
| | |
| Follow Us | | | | |
 | | Oppenheimer funds are distributed by OppenheimerFunds Distributor, Inc. 225 Liberty Street, New York, NY 10281-1008 © 2017 OppenheimerFunds Distributor, Inc. All rights reserved. | | |
| | RA0257.001.1017 December 21, 2017 | | |
Annual Report 10/31/2017 Oppenheimer Fundamental Alternatives Fund
Table of Contents
Class A Shares
AVERAGE ANNUAL TOTAL RETURNS AT 10/31/17
| | | | | | |
| | | Class A Shares of the Fund | | |
| | | Without Sales Charge | | With Sales Charge | | HFRX Global Hedge
Fund Index |
1-Year | | 1.79% | | -4.06% | | 6.98% |
5-Year | | 3.65 | | 2.43 | | 2.23 |
10-Year | | 1.32 | | 0.72 | | -0.75 |
Performance data quoted represents past performance, which does not guarantee future results. The investment return and principal value of an investment in the Fund will fluctuate so that an investor’s shares, when redeemed, may be worth more or less than their original cost. Fund returns include changes in share price, reinvested distributions, and a 5.75% maximum applicable sales charge except where “without sales charge” is indicated. Current performance may be lower or higher than the performance quoted. Returns do not consider capital gains or income taxes on an individual’s investment. Returns for periods of less than one year are cumulative and not annualized. For performance data current to the most recent month-end, visit oppenheimerfunds.com or call 1.800.CALL OPP (225.5677). See Fund prospectuses and summary prospectuses for more information on share classes and sales charges.
2 OPPENHEIMER FUNDAMENTAL ALTERNATIVES FUND
Fund Performance Discussion
The Fund’s Class A shares (without sales charge) produced a total return of 1.79% for the 12-month reporting period ending 10/31/17. The Fund underperformed its benchmark, the HFRX Global Hedge Fund Index (“Index”), which returned 6.98% during the same period, by 519 basis points (“bps”). The Fund also underperformed the Morningstar Multialternative Fund category average, which produced a return of 5.08%, by 329 bps. Our Long/Short Credit strategy generated healthy returns while Long/Short Equity generated low but positive returns and Long/ Short Macro generated slightly negative returns. The underperformance of the Fund versus its peer group was largely the result of underperformance in the equity strategy, where security selection was a detractor. In addition, during the reporting period, growth equities substantially outperformed value equities, and the strong performance was driven by a very narrow handful of stocks. Given these dynamics, it is not surprising that a core equity portfolio with a conservative tilt underperformed.
The Fund offers the flexibility often associated with alternatives while providing the daily liquidity and transparency benefits of a mutual fund. It seeks to provide investors
with strong risk-adjusted returns that have low sensitivity to traditional market factors over the long term. The investment team’s process has an underlying value philosophy
COMPARISON OF CHANGE IN VALUE OF $10,000 HYPOTHETICAL INVESTMENTS IN:
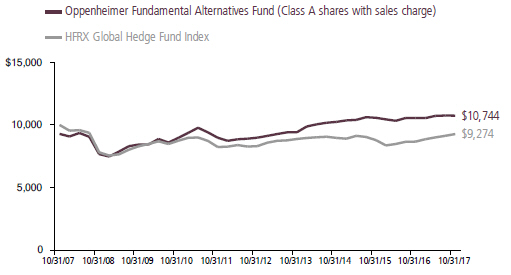
3 OPPENHEIMER FUNDAMENTAL ALTERNATIVES FUND
that combines bottom-up and top-down fundamental analysis for security selection and portfolio construction. The Fund is able to invest both long and short across distinct alternative investment strategies including Long/Short Equity, Long/Short Credit and Long/Short Macro (including currencies, interest rates, sovereign debt and commodities), making the Fund truly flexible. Although many investors focus on the short-term outlook when considering potential investments, the Fund utilizes a longer-term approach. We look at changing dynamics on both a macroeconomic and microeconomic basis over a multi-year time horizon to uncover investment opportunities that emerge from change.
The Fund continues to deliver on its value proposition of effective diversification combined with low volatility (2.60% standard deviation during the reporting period, which was 65% lower than that of the S&P 500), good downside risk mitigation and high risk-adjusted returns. Two key measures of these risk-adjusted returns are the Sharpe ratio (which penalizes both upside and downside volatility) and the Sortino ratio (which penalizes only downside volatility). For the period from April 2012 to October 2017 (the time that Michelle Borré has managed the strategy), the Fund has been ranked in the 6th percentile of the Morningstar Multialternative peer group for Sharpe ratio and the 4th percentile for Sortino ratio. The Fund’s standard deviation ranks in the 9th percentile of its peer group and its maximum drawdown ranks in the 1st percentile for
the same period. Moreover, we believe that upside/downside capture ratios provide a good measure of the Fund’s downside protection. The upside capture ratio is the cumulative performance of the Fund in all up months of positive return divided by the cumulative performance of an index in those months. The downside capture ratio is the cumulative performance of the Fund in all down months of negative return divided by the cumulative performance of the index in those months. For the period from April 2012 to October 2017, the Fund’s upside capture has been 75% of the Index and its downside capture has been just 22%. This level of asymmetry means that the Fund has delivered significantly more upside than downside during that period. In contrast, the Morningstar Multialternative peer group average captured 80% of the upside of the Index but also 79% of the downside over the same period. In our view, these risk-adjusted returns and upside/downside capture ratios are a testament to the Fund’s intelligent blending of multiple strategies across multiple asset classes.
MARKET OVERVIEW
Risk assets around the world have rallied since Trump’s election victory in November 2016. For example, the S&P 500 has generated a total return of 21.38% from 11/9/16 to 10/31/17 while the FTSE 100 Index has climbed 12.70%, the Nikkei 225 Index has risen 37.98% and the MSCI Emerging Market Index has risen 30.46% over the same period. Significantly, this
4 OPPENHEIMER FUNDAMENTAL ALTERNATIVES FUND
means that valuations have become even more stretched. Against this backdrop, interest rates have climbed higher, with the yield on the 10-year Treasury note rising from 1.85% on election day to 2.38% by the end of the reporting period for an increase of 53 bps. In addition, as the yield on the 10-year Treasury backed up in the fourth quarter of 2016, fixed income came under pressure, with the Bloomberg Barclays U.S. Aggregate Bond Index falling 2.98%. In our view, Treasuries could become less helpful to investors during market selloffs or rising rate environments, in part because they offer paltry yields, making the risk/reward tradeoff unattractive. This is especially true as the Federal Reserve (the “Fed”) continues to normalize rates and shrink its massive $4.4 trillion balance sheet.
Regarding geopolitical risks, the Trump administration has injected a level of policy uncertainty into the markets that investors have not seen in quite a while. At the same time, structural flaws in both Europe and Japan remain unresolved. China and other emerging markets are facing slower long-term growth that, in our view, is overly reliant on excessive credit growth. In fact, China may be approaching an inflection point in its rate of credit growth that could have broad implications for its economy. Many developed markets are stuck in low gear, and numerous countries in the Eurozone face persistently slow growth combined with structural issues that are proving difficult to resolve.
Moreover, we believe that in a number of countries there has been a meaningful
change in the relationship between elected representatives and voters, or stated differently, between those who make policies and those who actually pay for those policies. This change was typified by Brexit where voters in the UK surprised the capital markets by electing to leave the European Union (“EU”). In other countries, voter dissatisfaction with ruling parties is also apparent. For example, although German Chancellor Angela Merkel won a fourth term in September, a far right party won seats in parliament for the first time in six decades, due in part to voter anger over Germany’s acceptance of approximately one million refugees from the Middle East and Africa. In addition, Chancellor Merkel has had difficulty forming a coalition government, which has clouded the outlook for her Christian Democratic Union party. Joining the EU opened the door to new problems like immigration and the need to bail out peripheral nations. However, the EU does not seem capable of solving these issues, which has caused significant internal tension. In short, the chasm between politicians who decide social and fiscal policies and the voters who actually pay for those policies is growing. Austria came close to electing a far right candidate in its presidential election last December, and in October 2017, the anti-immigrant and Euro-skeptic People’s Party won a surprising victory in Parliamentary elections. Voters in Italy rejected a constitutional referendum, causing Prime Minister Matteo Renzi to resign last December. Although France elected the more centrist candidate Emmanuel Macron
5 OPPENHEIMER FUNDAMENTAL ALTERNATIVES FUND
as President in May, he does not represent a mainstream political party. Catalan voters on October 1 overwhelmingly approved a referendum on independence. However, the government of Spain opposed that referendum and has deemed it illegal. Italy, which still has an unemployment rate above 11%, will hold a national election in 2018. We do not know what the outcome of this or other upcoming elections will be, but we believe the results have the potential to create additional stress on the EU. Simply put, we believe the EU in its current form is unsustainable, although we do not know what specific catalysts might cause changes in its structure or when those changes might occur.
Meanwhile, voter dissatisfaction was on full display in the U.S. as Donald Trump won the presidential election with a campaign to effect radical change in Washington and the
Republicans swept Congress for the first time in 15 years. Each of these elections had the potential to create significant geopolitical change that could increase volatility in the capital markets. Under these circumstances, we believe investors could benefit from a broader toolkit than was needed during the risk-on, quantitative easing (“QE”) supported market of the past several years and a different toolkit than has been effective in the past because of potential future unfavorable risk/reward in conservative fixed income. Part of this broader toolkit could include the ability to take positions with short exposure that can actually profit from market declines. This kind of short exposure is available through the
Fund. Its multi-asset class approach offers the flexibility to navigate what we see as a dynamic, unpredictable and still challenging environment.
FUND REVIEW
Long/Short Equity Strategy. This strategy generated low but positive returns during the reporting period. The top contributors in the long equity component of the strategy were Apple and UnitedHealth Group. The top contributors in the short equity component of the strategy were Penn Real Estate Investment Trust and CBL & Associates. In contrast, the biggest detractors in the long equity component of the strategy were General Electric and Brinker, while the biggest detractors in the short equity component were Boeing and Subsea 7.
Top Contributors
Our long position in Apple Inc. (AAPL) contributed to performance as the company benefited from a solid product cycle for the iPhone. This success was enhanced by domestic carrier marketing support for that product as well as the lack of effective competition from Samsung. We expect the momentum to continue as there is significant customer interest surrounding the company’s release of its iPhone X, which could drive meaningful upgrades in the installed base and upside to average phone prices. Furthermore, AAPL’s management team continues to execute well on its capital allocation strategy, which has helped return cash to shareholders.
6 OPPENHEIMER FUNDAMENTAL ALTERNATIVES FUND
To the extent that corporate tax reform allows repatriation of “stranded” cash held overseas, Apple could be a significant beneficiary as well.
Our long position in UnitedHealth Group (UNH) contributed to performance as well. UNH is the largest health insurer in the U.S. with a diversified business model that serves commercial customers, government programs such as Medicare Advantage and Medicaid, and international customers. UNH also owns a fast-growing services business, Optum, which has increasingly become an earnings driver for the company. UNH outperformed on the back of strong growth in its insurance and healthcare services units, as well as an improved outlook for earnings growth in 2017 and beyond.
Our short position in Penn Real Estate Investment Trust (PEI), a shopping center REIT, also contributed to performance. As an operator of many B-quality shopping malls, PEI has been disproportionately affected by store closures, as retailers continue to focus their resources on A-quality malls. Higher levels of store vacancies have adversely affected the company’s rental income. In addition, PEI’s financial flexibility is limited because the firm has a relatively high level of debt. Consequently, management has sold lower quality malls at fire sale prices to generate cash to invest in several ongoing development projects. These sales have diluted PEI’s earnings power, as assets were sold at very high capitalization rates compared to the returns that management is
expected to generate from these projects.
Our short position in CBL & Associates Properties (CBL), another shopping mall REIT, also contributed to performance. As an operator of B-quality malls in secondary markets, CBL is poorly positioned for retail shifts toward online purchases, off price retail and luxury goods. Consequently, CBL has been adversely affected by store closures, as retailers are focusing their remaining resources on higher quality locations while online purchases have reduced demand for goods sold through brick and mortar locations. Higher levels of store vacancies have adversely affected the company’s rental income. CBL’s properties are also being affected by its high dependence on struggling department store operators like Sears and JC Penney. As these retailers close stores, CBL is making significant capital expenditures to reposition these sites. The company’s high level of financial leverage has also affected its earnings power, as management has sold lower quality properties to fund the redevelopment of vacant department store locations.
Largest Detractors
Our long position in General Electric (GE), an industrial conglomerate focused on aviation, power, energy and healthcare, underperformed in part due to investors’ concerns about the magnitude of revisions to the earnings outlook for 2017-2018. The concerns stem from a weaker global gas power generation outlook, a longer recovery
7 OPPENHEIMER FUNDAMENTAL ALTERNATIVES FUND
period for the Oil & Gas business and a slowing wide-body aerospace cycle. The market has also been penalizing GE’s lower free cash flow conversion rate of 65% versus its historical rate of 80%. Moreover, the stock has been under pressure since mid-2017 due to an information vacuum, as GE had been quiet about its new restructuring strategy and outlook for dividends. That made the stock vulnerable to random speculation that has magnified the selloff. The eventual unveiling of GE’s restructuring plan and the 2018 earnings reset ended up disappointing the market. However, new CEO John Flannery is expected to focus aggressively on cost reduction, leverage the company’s leadership position in additive manufacturing and digital industrial software, and set more realistic earnings expectations that should position the company to beat and raise earnings going forward. These actions should translate into improved free cash flow generation. On a longer-term basis, GE as an equipment manufacturer has an interesting opportunity to embed technologies that could help customers manage their equipment servicing needs more efficiently, which could translate into increased market share in both equipment sales and servicing.
Our long position in Brinker International (EAT), a casual dining restaurant company, also detracted from performance. The company has suffered from overall weakness in the restaurant industry, which has pressured customer traffic trends. EAT has implemented a number of new initiatives around menu, beverages and advertising
that are expected to play out over time, but so far, none have been able to overcome the sector’s headwinds. We have since exited this position.
Our short position in Boeing (BA), a U.S.-based manufacturer of commercial jets and defense, space, and security systems, was also a detractor. The stock moved higher due to a series of earnings beats in the first half of 2017 as well as increased guidance by management on free cash flow, driven in part by better than expected plane orders and operational execution. That gave investors greater confidence about the sustainability of the current commercial aerospace cycle, backed by continued growth in global passenger air traffic, and therefore greater confidence in the sustainability of free cash flow generation. The market believes that the commercial aerospace cycle is now less cyclical than it has been historically.
Similarly, our short position in Subsea 7 (SUBC NO), a U.K.-based offshore engineering and construction services company, detracted from performance. The stock moved higher during the period due to three consecutive quarters of upside surprise in earnings before interest, taxes and depreciation. The financial outperformance resulted from the timing of project completions combined with strong execution. This upside surprise offset investor concerns that the company could face cancellation without recourse of 20% of its vessel contracts by Brazil this year, which could hurt vessel backlog significantly. Management’s
8 OPPENHEIMER FUNDAMENTAL ALTERNATIVES FUND
announcement of a special dividend of NOK 5.00 per share earlier in 2017 also helped support the share price. However, in its most recent quarterly results, the company missed EBITDA expectations and guided for 2018 margins to be “significantly” lower than they were in 2017 as large project completions have run their course.
Long/Short Credit and Long/Short Macro Strategies. The Fund’s Long/Short Credit strategy generated healthy returns during the reporting period while the Long/ Short Macro strategy generated slightly negative returns. In terms of individual holdings, the top performers were our long positions in an asset-backed security (“ABS”) backed by airplane engines, a subprime nonagency mortgage-backed security (“MBS”), and a non-agency residential mortgage-backed security (“RMBS”) backed by subprime mortgages. The top three detractors were a long/short position in European credit spreads, a swaption that benefits from rising
U.S. interest rates and a short position in the Thai baht.
Top Contributors
Our long position in Blade, an ABS backed by a portfolio of aircraft engines, contributed to performance. This bond benefits from a credit support provided by Assured Guaranty. During the reporting period, several of the engines that back the bond were re-leased, which resulted in increased rental revenue and accelerated principal repayments. Furthermore, the credit spread on the bond
insurer (Assured Guaranty) tightened due to perceptions of decreased credit risk. The lower credit spread suggested that the present value of any wrap recovery would be larger, which supported the value of the bond. These factors combined to provide an opportunity to exit this position at an attractive price, and this position is now closed.
Our long position in RASC 2006, a subprime non-agency MBS, also contributed to performance. This MBS is likely to be repaid fully over the next several years. Voluntary prepayments in the mortgages backing the bond have been sustained at a rapid pace, increasing investor confidence that the MBS will be repaid more rapidly than expected, which supported the price of the bond.
Our long position in RAMP 2006, a second pay non-agency RMBS backed by a pool of subprime mortgages, also contributed to performance. This security is likely to begin receiving principal payments in mid-2018. Accelerating voluntary repayment rates on loans in this pool supported the bond price. Faster loan repayments imply a shorter maturity on the bond, which implies a higher return for investors.
Largest Detractors
In contrast, our long/short position in European credit spreads detracted from performance. This position benefits from wider spreads between Germany and less credit worthy European sovereigns (i.e.,
9 OPPENHEIMER FUNDAMENTAL ALTERNATIVES FUND
France, Italy and Spain). Spreads narrowed in the period as the defeat of Marine Le Pen in the French election reduced the chance of a near term political crisis in Europe. Furthermore, additional bank bailouts in Italy reduced the risk of near term economic problems in that country, and the overall recovery in Europe has supported credit spreads while the continuation of QE maintained support for asset prices.
Similarly, our position in a swaption that benefits from higher U.S. interest rates detracted from performance. A decline in long-term rates combined with declining interest rate volatility resulted in a negative return for this security. U.S. rates have declined as inflation data has disappointed for several quarters.
Finally, our currency position that was long U.S. dollar / short Thai baht hurt performance as well. We are short several different currencies relative to the U.S. dollar, including the Thai baht. Thailand’s economy is tied to the Chinese economy in that Thailand is both an exporter to, and a competitor with, China. Improvements in the Chinese economy, in part due to rapid credit growth in 2016, have also benefited the Thai economy and supported demand for the baht. In addition, falling expectations of another Chinese currency devaluation are reducing the risk of a dramatic drop in the baht in response to such a devaluation, which has hurt our short position. Finally, the U.S. dollar has been quite weak in 2017 on a trade-weighted basis versus a variety of foreign currencies,
which has also negatively impacted our position.
STRATEGY AND OUTLOOK
The macro environment remains complex. In the wake of Trump’s election victory, and the chaotic nature of his administration thus far, we expect to see cross currents throughout 2017-2018. Although Republicans swept the White House, Senate and House of Representatives, legislative action still requires the approval of Congress. Since Republicans hold only a slim majority in the Senate, this has proven to be a very challenging task.
Trump has discussed providing fiscal stimulus through a combination of corporate, personal and offshore cash tax cuts. If the new administration reduces the corporate tax rate, we believe this could help domestic companies much more than international companies (many of which already take advantage of lower tax rates in other jurisdictions). In particular, a reduction in the tax rate to 20% (a level the Trump administration has proposed) could boost earnings for certain companies by 10% or more. In addition, a tax cut on cash held offshore could incentivize companies to repatriate that capital and put it to work in the U.S. or pay it out to shareholders through buybacks or dividends. The Fund already had a home bias before the election, and we continued that in the aftermath of Trump’s victory.
10 OPPENHEIMER FUNDAMENTAL ALTERNATIVES FUND
More broadly, if this stimulus were to occur it would be late in the economic cycle and during a tight labor market, which is unusual. As a result, it could cause wage pressures to build further, which in turn could cause inflation to rise more than expected. It has proven to be more difficult than we expected for the Trump administration to get legislation passed and with mid-term elections approaching in 2018, the window could close.
President Trump has repeatedly expressed antipathy toward what he considers to be bad trade deals (e.g., NAFTA, Trans-Pacific Partnership, etc.). While no one knows precisely what the new administration’s trade policies will be, we do know that trade barriers tend to make goods and services more expensive, and on a longer-term basis, they tend to slow economic growth, although the impact may not be apparent for some time. Moreover, we believe the kinds of changes to immigration policy that Trump has discussed would tend to be negative for growth in the long run, although the impact might not be apparent immediately. In particular, population growth is an important driver of economic growth, so restricting immigration could be a drag on GDP. Recent experiences in Japan and Europe make clear that it is difficult to generate robust economic growth with little to no population growth.
Finally, there are three open seats on the Federal Reserve Open Market Committee (“FOMC”) today, and President Trump has nominated Fed Governor Jerome Powell to replace Chairperson Janet Yellen when her
term expires in February 2018. (Powell has indicated that he will likely continue many of the policies implemented during Yellen’s tenure.) Vice Chairperson Stanley Fischer, whose term was set to expire in June 2018, resigned his position in October. New York Fed President William Dudley, whose term was set to expire in January 2019, recently announced that he will resign about six months early, although he did not provide a specific date. In light of the recent addition of Fed Governor Randal Quarles, this means Trump will get to appoint at least three more people to the Fed, including the Vice Chair, in the next several months. (The successor to Dudley will be selected by the directors of the New York Fed.) On November 29, Trump nominated Marvin Goodfriend for a position as a Fed Governor. If a newly reconstituted Federal Reserve is more hawkish than investors currently expect, then the Trump administration could ultimately shift the tide away from the current “easy money forever” policies of central banks around the world. The Fed has raised rates by 25 bps four times since December 2015. The Fed may raise rates again later this year, and it started to normalize its $4.4 trillion balance sheet in October, which is effectively additional monetary policy tightening. Moreover, the European Central Bank, the Bank of England, the Bank of Japan and other central banks will ultimately need to taper off negative rates and/or QE just as the Fed did, but the path to rate normalization may not be as smooth. We could see the first reduction of QE on a global basis in 2018 as the ECB follows the U.S. in decreasing stimulus. This could be significant
11 OPPENHEIMER FUNDAMENTAL ALTERNATIVES FUND
because central bank buying of assets globally has impacted interest rates around the world. We have constructed the portfolio with an eye toward delivering low volatility, effective diversification, strong downside risk mitigation and high risk-adjusted returns in a variety of market conditions.
In our view, the U.S. equity market moved meaningfully ahead of earnings growth in 2015-2016, and valuations climbed to the point where U.S. equities were no longer inexpensive. In addition, late cycle warning signs started to flash yellow in 2016. Default rates on both prime and subprime auto loans, senior bank loans, high yield bonds and consumer debt started to tick up. Profit margins for the S&P 500 had peaked and were starting to decline. But the outlook changed when Trump won the election. Underlying earnings were weak, although they have started to improve in the first three quarters of 2017. A reduction in the corporate tax rate could boost those earnings significantly. The timing of any potential tax cut or other stimulus is uncertain, and may not occur until 2018 or later, if at all. The question for investors is whether earnings growth will durably accelerate as the Trump administration’s policies are formulated and eventually implemented. Today that is an unknown.
We also recognize that Trump’s victory has caused a meaningful change in the outlook for fixed income. Treasury rates had been range bound for some time, with yields oscillating between 1.25% to 3.0%. In the
longer run, however, we did not believe rates this low were sustainable. Trump’s election victory sent rates higher as the 10-year yield jumped from 1.85% on election day to 2.38% by 10/31/17. Against this backdrop, equities and other risk assets have rallied sharply, while bonds have participated to a lesser extent. We have become more bearish on fixed income after the election.
We believe the U.S. economy still has attractive growth potential in certain areas, and are waiting to see what new pro-growth policies the Trump administration can actually implement. We recognize that there are pockets of innovation and disruption in different industries including consumer packaged goods, pharmaceuticals, consumer discretionary, real estate and technology. Nonetheless, we are mindful that U.S. equity valuations are pushing up against the edge of bubble territory after several years when S&P 500 Index performance ran well ahead of earnings growth, leading to significant multiple expansion. (Since the S&P 500 bottomed in March 2009, it has climbed by more than 285% in the last eight years while S&P earnings have grown by less than one third of that figure.) In fact, the only time in the last four decades when the S&P 500 Index has traded at a higher price-earnings multiple on next 12 months’ consensus earnings was during the Tech Bubble in 1997-2000.
Accordingly, we continue to pick our spots, selecting securities that we believe offer attractive risk-adjusted returns. We remain focused, as always, on controlling volatility
12 OPPENHEIMER FUNDAMENTAL ALTERNATIVES FUND
and mitigating downside risk. We expect to be in a cross-current heavy world for a while. We believe that the ability to generate attractive returns efficiently and without taking on undue risk, controlling volatility and limiting drawdowns will be of greater value to investors in this kind of environment, and that is where our investment team’s efforts are focused.
| | |
 | | 
Michelle Borré, CFA Portfolio Manager |
13 OPPENHEIMER FUNDAMENTAL ALTERNATIVES FUND
Portfolio Positioning
LONG/SHORT CREDIT
| | | | | | | | | | | | | | | |
| | | Long | | Short | | Net |
Corporate Bonds & Hybrid Securities | | 10.4% | | 0.0% | | 10.4% |
Asset Backed Securities | | 9.1 | | 0.0 | | 9.1 |
Bank Loans | | 7.8 | | 0.0 | | 7.8 |
Relative Value | | 6.8 | | -8.1 | | -1.3 |
Duration Hedges (Bond Futures) | | -1.5 | | 0.0 | | -1.5 |
| | | |
| LONG/SHORT EQUITY | | | | | | |
| | | Long | | Short | | Net |
Common Stocks | | 55.3% | | -28.7% | | 26.6% |
Equity Like (Private Securities, Swaps) | | 11.1 | | -1.6 | | 9.5 |
FX Hedges for Equities | | -1.0 | | 1.1 | | 0.1 |
| | | |
| LONG/SHORT MACRO | | | | | | |
| | | Long | | Short | | Net |
Commodities | | 3.1% | | 0.0% | | 3.1% |
Rates | | 0.0 | | -2.8 | | -2.8 |
Sovereign Debt | | 4.9 | | -8.3 | | -3.4 |
Currency | | 0.0 | | -5.5 | | -5.5 |
| | | |
| CASH | | | | | | |
| | | Long | | Short | | Net |
Collateral Cash | | 24.2% | | 0.0% | | 24.2% |
Cash & Cash-Like Net of Collateral Cash | | 12.3 | | 0.0 | | 12.3 |
| | | |
| TOTAL PORTFOLIO | | | | | | |
| | | Long | | Short | | Net |
Long/Short Credit | | 32.6% | | -8.1% | | 24.5% |
Long/Short Equity | | 65.4 | | -29.2 | | 36.2 |
Long/Short Macro | | 8.0 | | -16.6 | | -8.6 |
Portfolio holdings are subject to change, and are dollar weighted based on total net assets. Percentages are as of October 31, 2017. Negative weightings may result from the use of leverage. Leverage involves the use of various financial instruments or borrowed capital in an attempt to increase investment return. Leverage risks include potential for higher volatility, greater decline of the Fund’s net asset value and fluctuations of dividends and distributions paid by the Fund.
14 OPPENHEIMER FUNDAMENTAL ALTERNATIVES FUND
Share Class Performance
AVERAGE ANNUAL TOTAL RETURNS WITHOUT SALES CHARGE AS OF 10/31/17
| | | | | | | | | | | | | | | | |
| | | Inception Date | | | 1-Year | | | 5-Year | | | 10-Year | |
Class A (QVOPX) | | | 1/3/89 | | | | 1.79% | | | | 3.65% | | | | 1.32% | |
Class B (QOPBX) | | | 9/1/93 | | | | 0.92 | | | | 2.81 | | | | 0.80 | |
Class C (QOPCX) | | | 9/1/93 | | | | 0.96 | | | | 2.85 | | | | 0.55 | |
Class I (QOPIX) | | | 2/28/13 | | | | 2.18 | | | | 3.92* | | | | N/A | |
Class R (QOPNX) | | | 3/1/01 | | | | 1.51 | | | | 3.36 | | | | 1.01 | |
Class Y (QOPYX) | | | 12/16/96 | | | | 1.98 | | | | 3.88 | | | | 1.58 | |
AVERAGE ANNUAL TOTAL RETURNS WITH SALES CHARGE AS OF 10/31/17
| | | | | | | | | | | | | | | | |
| | | Inception Date | | | 1-Year | | | 5-Year | | | 10-Year | |
Class A (QVOPX) | | | 1/3/89 | | | | -4.06% | | | | 2.43% | | | | 0.72% | |
Class B (QOPBX) | | | 9/1/93 | | | | -4.09 | | | | 2.45 | | | | 0.80 | |
Class C (QOPCX) | | | 9/1/93 | | | | -0.04 | | | | 2.85 | | | | 0.55 | |
Class I (QOPIX) | | | 2/28/13 | | | | 2.18 | | | | 3.92* | | | | N/A | |
Class R (QOPNX) | | | 3/1/01 | | | | 1.51 | | | | 3.36 | | | | 1.01 | |
Class Y (QOPYX) | | | 12/16/96 | | | | 1.98 | | | | 3.88 | | | | 1.58 | |
* Shows performance since inception.
Performance data quoted represents past performance, which does not guarantee future results. The investment return and principal value of an investment in the Fund will fluctuate so that an investor’s shares, when redeemed, may be worth more or less than their original cost. Current performance may be lower or higher than the performance quoted. Returns do not consider capital gains or income taxes on an individual’s investment. For performance data current to the most recent month-end, visit oppenheimerfunds.com or call 1.800. CALL OPP (225.5677). Fund returns include changes in share price, reinvested distributions, and the applicable sales charge: for Class A shares, the current maximum initial sales charge of 5.75%; for Class B shares, the contingent deferred sales charge of 5% (1-year) and 2% (5-year); and for Class C shares, the contingent deferred sales charge of 1% for the 1-year period. There is no sales charge for Class I, Class R and Class Y shares. Because Class B shares convert to Class A shares 72 months after purchase, the 10-year return for Class B shares uses Class A performance for the period after conversion. Returns for periods of less than one year are cumulative and not annualized. See Fund prospectuses and summary prospectuses for more information on share classes and sales charges.
The Fund’s performance is compared to the performance of the HFRX Global Hedge Fund Index. The HFRX Global Hedge Fund Index is designed to be representative of the overall composition of the hedge fund universe. The Index is unmanaged and cannot be purchased directly by investors. While index comparisons may be useful to provide a benchmark for the Fund’s performance, it must be noted that the Fund’s investments are not limited to the investments comprising the Index. Index performance includes reinvestment of income, but does not reflect transaction costs, fees, expenses or taxes. Index performance is shown for illustrative purposes only as a benchmark for the Fund’s performance, and does not predict
15 OPPENHEIMER FUNDAMENTAL ALTERNATIVES FUND
or depict performance of the Fund. The Fund’s performance reflects the effects of the Fund’s business and operating expenses.
The Morningstar Multialternative Funds Category Average is the average return of the mutual funds within the investment category as defined by Morningstar. Returns include the reinvestment of distributions but do not consider sales charges. The Morningstar Multialternative Category Average performance is shown for illustrative purposes only and does not predict or depict the performance of the Fund.
Morningstar ranking is for Class A shares and ranking may include more than one share class of funds in the category, including other share classes of this Fund. Ranking is based on total return as of 10/31/17, without considering sales charges. Different share classes may have different expenses and performance characteristics. Fund rankings are subject to change monthly. The Fund’s total-return percentile rank is relative to all funds that are in the Small Growth Funds category. The highest (or most favorable) percentile rank is 1 and the lowest (or least favorable) percentile rank is 100. The top-performing fund in a category will always receive a rank of 1.
The Fund’s investment strategy and focus can change over time. The mention of specific fund holdings does not constitute a recommendation by OppenheimerFunds, Inc. or its affiliates.
Before investing in any of the Oppenheimer funds, investors should carefully consider a fund’s investment objectives, risks, charges and expenses. Fund prospectuses and summary prospectuses contain this and other information about the funds, and may be obtained by asking your financial advisor, visiting oppenheimerfunds.com, or calling 1.800.CALL OPP (225.5677). Read prospectuses and summary prospectuses carefully before investing.
Shares of Oppenheimer funds are not deposits or obligations of any bank, are not guaranteed by any bank, are not insured by the FDIC or any other agency, and involve investment risks, including the possible loss of the principal amount invested.
.
16 OPPENHEIMER FUNDAMENTAL ALTERNATIVES FUND
Fund Expenses
Fund Expenses. As a shareholder of the Fund, you incur two types of costs: (1) transaction costs, which may include sales charges (loads) on purchase payments and/or contingent deferred sales charges on redemptions; and (2) ongoing costs, including management fees; distribution and service fees; and other Fund expenses. These examples are intended to help you understand your ongoing costs (in dollars) of investing in the Fund and to compare these costs with the ongoing costs of investing in other mutual funds.
The examples are based on an investment of $1,000.00 invested at the beginning of the period and held for the entire 6-month period ended October 31, 2017.
Actual Expenses. The first section of the table provides information about actual account values and actual expenses. You may use the information in this section for the class of shares you hold, together with the amount you invested, to estimate the expense that you paid over the period. Simply divide your account value by $1,000.00 (for example, an $8,600.00 account value divided by $1,000.00 = 8.60), then multiply the result by the number in the first section under the heading entitled “Expenses Paid During 6 Months Ended October 31, 2017” to estimate the expenses you paid on your account during this period.
Hypothetical Example for Comparison Purposes. The second section of the table provides information about hypothetical account values and hypothetical expenses based on the Fund’s actual expense ratio for each class of shares, and an assumed rate of return of 5% per year for each class before expenses, which is not the Fund’s actual return. The hypothetical account values and expenses may not be used to estimate the actual ending account balance or expenses you paid for the period. You may use this information to compare the ongoing costs of investing in the Fund and other funds. To do so, compare this 5% hypothetical example for the class of shares you hold with the 5% hypothetical examples that appear in the shareholder reports of the other funds.
Please note that the expenses shown in the table are meant to highlight your ongoing costs only and do not reflect any transactional costs, such as front-end or contingent deferred sales charges (loads). Therefore, the “hypothetical” section of the table is useful in comparing ongoing costs only, and will not help you determine the relative total costs of owning different funds. In addition, if these transactional costs were included, your costs would have been higher.
17 OPPENHEIMER FUNDAMENTAL ALTERNATIVES FUND
| | | | | | | | | | | | |
| Actual | | Beginning
Account
Value
May 1, 2017 | | | Ending Account Value
October 31, 2017 | | | Expenses
Paid During 6 Months Ended
October 31, 2017 | |
Class A | | $ | 1,000.00 | | | | $ 1,001.50 | | | | $ 8.46 | |
Class B | | | 1,000.00 | | | | 996.70 | | | | 12.51 | |
Class C | | | 1,000.00 | | | | 997.10 | | | | 12.41 | |
Class I | | | 1,000.00 | | | | 1,003.20 | | | | 6.38 | |
Class R | | | 1,000.00 | | | | 999.60 | | | | 9.93 | |
Class Y | | | 1,000.00 | | | | 1,002.20 | | | | 7.40 | |
| | | |
Hypothetical | | | | | | | | | | | | |
(5% return before expenses) | | | | | | | | | |
Class A | | | 1,000.00 | | | | 1,016.79 | | | | 8.52 | |
Class B | | | 1,000.00 | | | | 1,012.75 | | | | 12.61 | |
Class C | | | 1,000.00 | | | | 1,012.85 | | | | 12.51 | |
Class I | | | 1,000.00 | | | | 1,018.85 | | | | 6.43 | |
Class R | | | 1,000.00 | | | | 1,015.32 | | | | 10.01 | |
Class Y | | | 1,000.00 | | | | 1,017.85 | | | | 7.45 | |
Expenses are equal to the Fund’s annualized expense ratio for that class, multiplied by the average account value over the period, multiplied by 184/365 (to reflect the one-half year period). Those annualized expense ratios, excluding indirect expenses from affiliated funds, based on the 6-month period ended October 31, 2017 are as follows:
| | | | |
| Class | | Expense Ratios | |
Class A | | | 1.67% | |
Class B | | | 2.47 | |
Class C | | | 2.45 | |
Class I | | | 1.26 | |
Class R | | | 1.96 | |
Class Y | | | 1.46 | |
The expense ratios reflect voluntary and/or contractual waivers and/or reimbursements of expenses by the Fund’s Manager and Transfer Agent. Some of these undertakings may be modified or terminated at any time, as indicated in the Fund’s prospectus. The “Consolidated Financial Highlights” tables in the Fund’s financial statements, included in this report, also show the gross expense ratios, without such waivers or reimbursements and reduction to custodian expenses, if applicable.
18 OPPENHEIMER FUNDAMENTAL ALTERNATIVES FUND
CONSOLIDATED STATEMENT OF INVESTMENTS October 31, 2017
| | | | | | | | |
| | | Shares | | | Value | |
Common Stocks—55.4% | | | | | | | | |
Consumer Discretionary—1.2% | | | | | | | | |
Hotels, Restaurants & Leisure—0.0% | | | | | | | | |
Caesars Entertainment Corp.1 | | | 3,397 | | | $ | 43,991 | |
Household Durables—0.0% | | | | | | | | |
Everyware Global, Inc.1,2 | | | 8,735 | | | | 63,875 | |
Media—1.2% | | | | | | | | |
DISH Network Corp., Cl. A1 | | | 180,705 | | | | 8,771,421 | |
Live Nation Entertainment, Inc.1 | | | 134,390 | | | | 5,883,594 | |
| | | | | | | | 14,655,015 | |
Specialty Retail—0.0% | | | | | | | | |
Gymboree Corp. (The)1 | | | 4,118 | | | | 105,524 | |
Gymboree Corp. (The)1 | | | 11,737 | | | | 300,760 | |
| | | | | | | | 406,284 | |
Consumer Staples—3.7% | | | | | | | | |
Beverages—0.9% | | | | | | | | |
Coca-Cola Co. (The) | | | 253,370 | | | | 11,649,953 | |
Tobacco—2.8% | | | | | | | | |
Altria Group, Inc.3 | | | 296,101 | | | | 19,015,606 | |
Philip Morris International, Inc. | | | 150,100 | | | | 15,696,543 | |
| | | | | | | | 34,712,149 | |
Energy—5.6% | | | | | | | | |
Energy Equipment & Services—0.8% | | | | | | | | |
Halliburton Co. | | | 94,292 | | | | 4,030,040 | |
Ocean Rig UDW, Inc.1 | | | 16,398 | | | | 439,139 | |
Schlumberger Ltd. | | | 85,890 | | | | 5,496,960 | |
| | | | | | | | 9,966,139 | |
Oil, Gas & Consumable Fuels—4.8% | | | | | | | | |
Arch Coal, Inc., Cl. A | | | 436 | | | | 33,319 | |
Canadian Natural Resources Ltd. | | | 135,847 | | | | 4,740,588 | |
Chevron Corp. | | | 77,071 | | | | 8,931,758 | |
ConocoPhillips | | | 155,424 | | | | 7,949,938 | |
EOG Resources, Inc. | | | 78,663 | | | | 7,856,074 | |
Newfield Exploration Co.1 | | | 99,217 | | | | 3,054,891 | |
Noble Energy, Inc.3 | | | 216,091 | | | | 6,022,456 | |
Occidental Petroleum Corp. | | | 124,822 | | | | 8,059,757 | |
Sabine Oil1 | | | 113 | | | | 5,198 | |
Templar Energy, Cl. A1 | | | 9,620 | | | | 26,454 | |
TOTAL SA, Sponsored ADR | | | 142,210 | | | | 7,923,941 | |
Valero Energy Corp. | | | 65,406 | | | | 5,159,879 | |
| | | | | | | 59,764,253 | |
19 OPPENHEIMER FUNDAMENTAL ALTERNATIVES FUND
CONSOLIDATED STATEMENT OF INVESTMENTS Continued
| | | | | | |
| | | Shares | | | Value |
Financials—9.6% | | | | | | |
Capital Markets—1.1% | | | | | | |
Aretec Group, Inc.1 | | | 3,448 | | | $ 107,750 |
Goldman Sachs Group, Inc. (The) | | | 36,720 | | | 8,903,866 |
Raymond James Financial, Inc. | | | 51,150 | | | 4,336,497 |
| | | | | | |
| | | | | | | 13,348,113 |
Commercial Banks—2.8% | | | | | | |
JPMorgan Chase & Co. | | | 66,060 | | | 6,646,297 |
M&T Bank Corp. | | | 148,150 | | | 24,706,975 |
PNC Financial Services Group, Inc. (The) | | | 32,470 | | | 4,441,571 |
| | | | | | |
| | | | | | | 35,794,843 |
Insurance—3.9% | | | | | | |
Allstate Corp. (The) | | | 189,880 | | | 17,822,137 |
Chubb Ltd. | | | 202,630 | | | 30,560,656 |
| | | | | | |
| | | | | | | 48,382,793 |
Real Estate Investment Trusts (REITs)—1.8% | | | | | | |
American Assets Trust, Inc. | | | 93,668 | | | 3,633,382 |
Blackstone Mortgage Trust, Inc., Cl. A | | | 407,120 | | | 12,958,630 |
Starwood Property Trust, Inc. | | | 270,350 | | | 5,815,228 |
| | | | | | |
| | | | | | | 22,407,240 |
Real Estate Management & Development—0.0% | | | | | | |
VICI Properties, Inc.1 | | | 4,922 | | | 91,057 |
Health Care—8.8% | | | | | | |
Biotechnology—0.7% | | | | | | |
Shire plc, ADR | | | 56,620 | | | 8,358,811 |
Health Care Equipment & Supplies—1.3% | | | | | | |
Abbott Laboratories | | | 78,130 | | | 4,236,990 |
Medtronic plc | | | 153,358 | | | 12,348,386 |
New Millennium Holdco, Inc.1,2 | | | 7,733 | | | 77 |
| | | | | | |
| | | | | | | 16,585,453 |
Health Care Providers & Services—3.5% | | | | | | |
Cigna Corp. | | | 72,230 | | | 14,245,201 |
HCA Healthcare, Inc.1 | | | 69,590 | | | 5,264,483 |
Millennium Corporate Claim Litigation Trust1,2 | | | 441 | | | 4 |
Millennium Lender Claim Litigation Trust1,2 | | | 882 | | | 9 |
UnitedHealth Group, Inc. | | | 118,140 | | | 24,835,391 |
| | | | | | |
| | | | | | | 44,345,088 |
Pharmaceuticals—3.3% | | | | | | |
Allergan plc | | | 44,410 | | | 7,870,784 |
Bristol-Myers Squibb Co. | | | 64,720 | | | 3,990,635 |
Merck & Co., Inc.3 | | | 163,630 | | | 9,014,377 |
Novartis AG, Sponsored ADR | | | 127,490 | | | 10,528,124 |
20 OPPENHEIMER FUNDAMENTAL ALTERNATIVES FUND
| | | | | | |
| | | Shares | | | Value |
Pharmaceuticals (Continued) | | | | | | |
Roche Holding AG | | | 40,089 | | | $ 9,268,561 |
| | | | | | |
| | | | | | 40,672,481 |
Industrials—10.4% | | | | | | |
Aerospace & Defense—4.9% | | | | | | |
L3 Technologies, Inc. | | | 54,390 | | | 10,180,720 |
Lockheed Martin Corp.3 | | | 69,970 | | | 21,561,955 |
Northrop Grumman Corp. | | | 52,720 | | | 15,580,342 |
Raytheon Co. | | | 78,670 | | | 14,176,334 |
| | | | | | |
| | | | | | 61,499,351 |
Airlines—0.2% | | | | | | |
United Continental Holdings, Inc.1 | | | 51,886 | | | 3,034,293 |
Commercial Services & Supplies—2.2% | | | | | | |
Johnson Controls International plc | | | 295,871 | | | 12,246,100 |
Republic Services, Inc., Cl. A3 | | | 247,040 | | | 16,074,893 |
| | | | | | |
| | | | | | 28,320,993 |
Construction & Engineering—0.4% | | | | | | |
Granite Construction, Inc. | | | 75,290 | | | 4,795,220 |
Industrial Conglomerates—2.4% | | | | | | |
General Electric Co. | | | 610,920 | | | 12,316,147 |
Honeywell International, Inc.3 | | | 121,530 | | | 17,519,765 |
| | | | | | |
| | | | | | 29,835,912 |
Road & Rail—0.3% | | | | | | |
Union Pacific Corp. | | | 29,740 | | | 3,443,595 |
Information Technology—8.3% | | | | | | |
Communications Equipment—1.4% | | | | | | |
Cisco Systems, Inc. | | | 433,480 | | | 14,803,342 |
CommScope Holding Co., Inc.1 | | | 99,350 | | | 3,193,109 |
| | | | | | |
| | | | | | 17,996,451 |
Internet Software & Services—2.6% | | | | | | |
Alphabet, Inc., Cl. A1,3 | | | 32,090 | | | 33,150,254 |
Semiconductors & Semiconductor Equipment—2.3% | | | | | | |
QUALCOMM, Inc.3 | | | 105,980 | | | 5,406,040 |
Xilinx, Inc.3 | | | 310,490 | | | 22,880,008 |
| | | | | | |
| | | | | | 28,286,048 |
Technology Hardware, Storage & Peripherals—2.0% | | | | | | |
Apple, Inc. | | | 146,686 | | | 24,795,801 |
21 OPPENHEIMER FUNDAMENTAL ALTERNATIVES FUND
CONSOLIDATED STATEMENT OF INVESTMENTS Continued
| | | | |
| | | Shares | | Value |
Materials—3.3% | | | | |
Chemicals—1.5% | | | | |
Celanese Corp., Cl. A | | 137,760 | | $ 14,369,746 |
Methanex Corp. | | 85,436 | | 4,165,005 |
| | | | |
| | | | 18,534,751 |
Containers & Packaging—1.8% | | | | |
Packaging Corp. of America | | 99,630 | | 11,583,980 |
Sonoco Products Co. | | 224,820 | | 11,643,428 |
| | | | |
| | | | 23,227,408 |
Telecommunication Services—2.6% | | | | |
Diversified Telecommunication Services—2.6% | | | | |
AT&T, Inc. | | 277,530 | | 9,338,885 |
BCE, Inc. | | 271,380 | | 12,526,901 |
Verizon Communications, Inc. | | 213,260 | | 10,208,756 |
| | | | |
| | | | 32,074,542 |
Utilities—1.9% | | | | |
Electric Utilities—1.3% | | | | |
Edison International | | 146,230 | | 11,691,089 |
PG&E Corp. | | 78,990 | | 4,563,252 |
| | | | |
| | | | 16,254,341 |
Multi-Utilities—0.6% | | | | |
CMS Energy Corp. | | 152,070 | | 7,355,626 |
| | | | |
Total Common Stocks (Cost $534,366,379) | | | | 693,852,124 |
Preferred Stocks—1.0% | | | | |
M&T Bank Corp., 6.375% Cum., Series A, Non-Vtg. | | 5,167 | | 5,270,340 |
M&T Bank Corp., 6.375% Cum., Series C, Non-Vtg. | | 7,500 | | 7,650,075 |
| | | | |
Total Preferred Stocks (Cost $12,684,599) | | | | 12,920,415 |
| | | Units | | |
Rights, Warrants and Certificates—0.0% | | | | |
Sabine Oil Tranche 1 Wts., Strike Price $4.49, Exp. 8/11/261 | | 361 | | 2,437 |
Sabine Oil Tranche 2 Wts., Strike Price $2.72, Exp. 8/11/261 | | 64 | | 368 |
| | | | |
Total Rights, Warrants and Certificates (Cost $48,285) | | | | 2,805 |
| | | Principal Amount | | |
Asset-Backed Securities—4.7% | | | | |
GSAMP Trust: | | | | |
Series 2005-HE4, Cl. M3, 2.018% [US0001M+78], 7/25/454 | | $ 3,300,000 | | 3,275,667 |
Series 2005-HE5, Cl. M3, 1.698% [US0001M+46], 11/25/354 | | 8,121,777 | | 7,789,297 |
Series 2007-HS1, Cl. M4, 3.488% [US0001M+225], 2/25/474 | | 6,600,000 | | 6,848,959 |
JP Morgan Mortgage Acquisition Corp., Series 2005-OPT2, Cl. M2, 1.688% | | | | |
[US0001M+45], 12/25/354 | | 1,836,000 | | 1,835,595 |
New Century Home Equity Loan Trust, Series 2005-2, Cl. M3, 1.973% | | | | |
[US0001M+73.5], 6/25/354 | | 5,500,000 | | 5,489,416 |
Park Place Securities, Inc., Series 2005-WCW3, Cl. M1, 1.718% | | | | |
[US0001M+48], 8/25/354 | | 4,265,153 | | 4,258,081 |
22 OPPENHEIMER FUNDAMENTAL ALTERNATIVES FUND
| | | | |
| | | Principal Amount | | Value |
Asset-Backed Securities (Continued) | | | | |
RASC Series Trust: | | | | |
Series 2005-KS8, Cl. M5, 1.878% [US0001M+64], 8/25/354 | | $ 2,993,634 | | $ 2,864,020 |
Series 2006-KS2, Cl. M2, 1.628% [US0001M+39], 3/25/364 | | 14,625,000 | | 14,225,748 |
Raspro Trust, Series 2005-1A, Cl. G, 1.725% [LIBOR03M+40], 3/23/244,5 | | 12,261,649 | | 12,061,494 |
| | | | |
Total Asset-Backed Securities (Cost $51,198,033) | | | | 58,648,277 |
Mortgage-Backed Obligations—4.4% | | | | |
Ameriquest Mortgage Securities, Inc., Series 2004-R2, Cl. M1, 1.883% | | | | |
[US0001M+64.5], 4/25/344 | | 3,558,338 | | 3,472,581 |
Asset-Backed Funding Certificates Trust, Series 2005-HE2, Cl. M3, 2.018% | | | | |
[US0001M+78], 6/25/354 | | 4,000,000 | | 4,026,571 |
Citigroup Mortgage Loan Trust, Inc., Series 2004-OPT1, Cl. M3, 2.183% | | | | |
[US0001M+94.5], 10/25/344 | | 1,250,000 | | 1,247,784 |
First NLC Trust, Series 2005-4, Cl. A4, 1.628% [US0001M+39], 2/25/364 | | 10,676,347 | | 10,195,823 |
Home Equity Asset Trust, Series 2005-5, Cl. M2, 2.003% [US0001M+76.5], 11/25/354 | | 1,527,347 | | 1,535,456 |
Home Equity Mortgage Loan Asset-Backed Trust, Series 2005-B, Cl. M3, 1.728% [US0001M+49], 8/25/354 | | 1,298,061 | | 1,298,203 |
MASTR Adjustable Rate Mortgages Trust, Series 2004-13, Cl. 2A2, 3.464%, 4/21/346 | | 287,221 | | 293,656 |
RAMP Trust: | | | | |
Series 2005-RS2, Cl. M4, 1.958% [US0001M+72], 2/25/354 | | 4,469,000 | | 4,471,475 |
Series 2005-RS6, Cl. M2, 2.003% [US0001M+76.5], 6/25/354 | | 376,307 | | 377,323 |
Series 2006-EFC1, Cl. M2, 1.638% [US0001M+40], 2/25/364 | | 5,490,000 | | 5,411,173 |
Series 2006-NC3, Cl. A3, 1.508% [US0001M+27], 3/25/364 | | 16,698,000 | | 16,359,415 |
Structured Asset Securities Corp. Mortgage Loan Trust, Series 2007-GEL2, | | | | |
Cl. A2, 1.558% [US0001M+32], 5/25/374,7 | | 6,445,054 | | 6,408,218 |
| | | | |
Total Mortgage-Backed Obligations (Cost $42,045,453) | | | | 55,097,678 |
Non-Convertible Corporate Bonds and Notes—12.6% | | | | |
Consumer Discretionary—0.4% | | | | |
Automobiles—0.4% | | | | |
American Honda Finance Corp., 1.50% Sr. Unsec. Nts., 11/19/18 | | 2,000,000 | | 1,997,216 |
Daimler Finance North America LLC: | | | | |
1.875% Sr. Unsec. Nts., 1/11/187 | | 1,500,000 | | 1,500,808 |
2.00% Sr. Unsec. Nts., 8/3/187 | | 1,000,000 | | 1,001,913 |
| | | | |
| | | | 4,499,937 |
Media—0.0% | | | | |
Altice US Finance I Corp., 5.50% Sr. Sec. Nts., 5/15/267 | | 223,000 | | 232,477 |
Consumer Staples—0.2% | | | | |
Beverages—0.2% | | | | |
PepsiCo, Inc., 1.35% Sr. Unsec. Nts., 10/4/19 | | 2,000,000 | | 1,985,803 |
Tobacco—0.0% | | | | |
BAT International Finance plc, 1.85% Sr. Unsec. Nts., 6/15/187 | | 500,000 | | 500,114 |
23 OPPENHEIMER FUNDAMENTAL ALTERNATIVES FUND
CONSOLIDATED STATEMENT OF INVESTMENTS Continued
| | | | |
| | | Principal Amount | | Value |
Energy—2.6% | | | | |
Energy Equipment & Services—0.1% | | | | |
Schlumberger Holdings Corp., 2.35% Sr. Unsec. Nts., 12/21/187 | | $ 2,000,000 | | $ 2,010,153 |
Oil, Gas & Consumable Fuels—2.5% | | | | |
BP Capital Markets plc, 1.768% Sr. Unsec. Nts., 9/19/19 | | 500,000 | | 499,684 |
Lukoil International Finance BV, 6.125% Sr. Unsec. Nts., 11/9/207 | | 25,415,000 | | 27,661,305 |
TransCanada PipeLines Ltd., 1.625% Sr. Unsec. Nts., 11/9/17 | | 1,310,000 | | 1,310,056 |
Valero Energy Corp., 9.375% Sr. Unsec. Nts., 3/15/19 | | 1,300,000 | | 1,426,320 |
| | | | |
| | | | 30,897,365 |
Financials—8.5% | | | | |
Capital Markets—1.5% | | | | |
Goldman Sachs Capital II, 4% [US0003M+76.75] Jr. Sub. Perpetual | | | | |
Bonds4,8 | | 54,000 | | 47,971 |
Goldman Sachs Group, Inc. (The): | | | | |
6.15% Sr. Unsec. Nts., 4/1/18 | | 2,000,000 | | 2,036,087 |
5.70% [US0003M+388.4] Jr. Sub. Perpetual Bonds, Series L4,8 | | 13,700,000 | | 14,162,375 |
Morgan Stanley: | | | | |
2.125% Sr. Unsec. Nts., 4/25/18 | | 1,000,000 | | 1,001,953 |
6.625% Sr. Unsec. Nts., 4/1/18 | | 1,350,000 | | 1,377,005 |
| | | | |
| | | | 18,625,391 |
Commercial Banks—6.6% | | | | |
Bank of America Corp.: | | | | |
2.00% Sr. Unsec. Nts., 1/11/18 | | 2,000,000 | | 2,001,636 |
6.25% [US0003M+370.5] Jr. Sub. Perpetual Bonds4,8 | | 2,520,000 | | 2,809,800 |
8.00% [US0003M+363] Jr. Sub. Perpetual Bonds, Series K4,8 | | 11,396,000 | | 11,567,510 |
Bank of Montreal: | | | | |
1.91% [US0003M+60] Sr. Unsec. Nts., 12/12/194 | | 800,000 | | 805,989 |
2.10% Sr. Unsec. Nts., 12/12/19 | | 1,200,000 | | 1,203,474 |
Bank of Nova Scotia (The), 1.65% Sr. Unsec. Nts., 6/14/19 | | 2,000,000 | | 1,991,811 |
Citigroup, Inc.: | | | | |
2.15% Sr. Unsec. Nts., 7/30/18 | | 1,500,000 | | 1,503,930 |
5.875% [US0003M+405.9] Jr. Sub. Perpetual Bonds4,8 | | 16,543,000 | | 17,339,546 |
Commonwealth Bank of Australia, 1.375% Sr. Unsec. Nts., 9/6/187 | | 2,000,000 | | 1,995,171 |
JPMorgan Chase & Co.: | | | | |
6.00% Sr. Unsec. Nts., 1/15/18 | | 3,000,000 | | 3,026,973 |
6.10% [US0003M+333] Jr. Sub. Perpetual Bonds4,8 | | 5,133,000 | | 5,729,711 |
7.90% [US0003M+347] Jr. Sub. Perpetual Bonds, Series 14,8 | | 8,438,000 | | 8,663,717 |
Nordea Bank AB, 1.625% Sr. Unsec. Nts., 9/30/197 | | 1,000,000 | | 993,290 |
Royal Bank of Canada, 1.625% Sr. Unsec. Nts., 4/15/19 | | 2,000,000 | | 1,994,604 |
Skandinaviska Enskilda Banken AB, 1.887% [US0003M+57] Sr. | | | | |
Unsec. Nts., 9/13/194,7 | | 1,300,000 | | 1,308,869 |
Societe Generale SA: | | | | |
2.415% [US0003M+108] Sr. Unsec. Nts., 10/1/184 | | 1,000,000 | | 1,007,829 |
2.625% Sr. Unsec. Nts., 10/1/18 | | 1,000,000 | | 1,007,669 |
Sumitomo Mitsui Banking Corp., 1.966% Sr. Unsec. Nts., 1/11/19 | | 750,000 | | 750,342 |
Svenska Handelsbanken AB, 1.50% Sr. Unsec. Nts., 9/6/19 | | 1,500,000 | | 1,487,798 |
24 OPPENHEIMER FUNDAMENTAL ALTERNATIVES FUND
| | | | |
| | | Principal Amount | | Value |
Commercial Banks (Continued) | | | | |
Toronto-Dominion Bank (The): | | | | |
1.774% [US0003M+42] Sr. Unsec. Nts., 1/18/194 | | $ 1,200,000 | | $ 1,203,865 |
1.90% Sr. Unsec. Nts., 10/24/19 | | 500,000 | | 499,634 |
Wells Fargo & Co.: | | | | |
5.625% Sr. Unsec. Nts., 12/11/17 | | 1,000,000 | | 1,004,367 |
5.90% [US0003M+311] Jr. Sub. Perpetual Bonds, Series S4,8 | | 11,730,000 | | 12,877,194 |
| | | | |
| | | | 82,774,729 |
Consumer Finance—0.2% | | | | |
American Express Co.: | | | | |
1.708% [US0003M+33] Sr. Unsec. Nts., 10/30/204 | | 500,000 | | 499,737 |
2.20% Sr. Unsec. Nts., 10/30/20 | | 500,000 | | 499,365 |
7.00% Sr. Unsec. Nts., 3/19/18 | | 1,700,000 | | 1,734,631 |
| | | | |
| | | | 2,733,733 |
Insurance—0.2% | | | | |
MetLife, Inc., 7.717% Sr. Unsec. Nts., 2/15/19 | | 2,000,000 | | 2,150,160 |
Industrials—0.0% | | | | |
Electrical Equipment—0.0% | | | | |
Avaya, Inc., 9.25%, 4/24/25 | | 285,000 | | 285,000 |
Information Technology—0.1% | | | | |
Technology Hardware, Storage & Peripherals—0.1% | | | | |
Apple, Inc., 1.90% Sr. Unsec. Nts., 2/7/20 | | 1,000,000 | | 1,001,597 |
Materials—0.6% | | | | |
Metals & Mining—0.6% | | | | |
Freeport-McMoRan, Inc., 2.375% Sr. Unsec. Nts., 3/15/18 | | 7,550,000 | | 7,568,875 |
Telecommunication Services—0.2% | | | | |
Diversified Telecommunication Services—0.2% | | | | |
AT&T, Inc.: | | | | |
5.50% Sr. Unsec. Nts., 2/1/18 | | 1,000,000 | | 1,009,546 |
5.875% Sr. Unsec. Nts., 10/1/19 | | 1,200,000 | | 1,285,408 |
| | | | |
| | | | 2,294,954 |
Utilities—0.0% | | | | |
Electric Utilities—0.0% | | | | |
Duke Energy Corp., 6.25% Sr. Unsec. Nts., 6/15/18 | | 500,000 | | 514,365 |
| | | | |
Total Non-Convertible Corporate Bonds and Notes (Cost $154,280,847) | | | | 158,074,653 |
Convertible Corporate Bond and Note—0.5% | | | | |
Clearwire Communications LLC/Clearwire Finance, Inc., 8.25% Cv. Sr. | | | | |
Unsec. Nts., 12/1/40 (Cost $6,575,827)5 | | 6,550,000 | | 6,615,500 |
Corporate Loans—9.6% | | | | |
1011778 BC ULC, Sr. Sec. Credit Facilities 1st Lien Term Loan, | | | | |
Tranche B, 3.397%-3.492% [LIBOR4+225], 2/16/244 | | 223,873 | | 224,199 |
25 OPPENHEIMER FUNDAMENTAL ALTERNATIVES FUND
CONSOLIDATED STATEMENT OF INVESTMENTS Continued
| | | | |
| | | Principal Amount | | Value |
Corporate Loans (Continued) | | | | |
21st Century Oncology, Inc., Sr. Sec. Credit Facilities 1st Lien Term Loan, Tranche B, 7.275% [LIBOR4+612.5], 4/30/224 | | $ 64,737 | | $ 61,501 |
4L Technologies, Inc., Sr. Sec. Credit Facilities 1st Lien Term Loan, Tranche B, 5.739% [LIBOR4+450], 5/8/204 | | 217,215 | | 156,214 |
Acadia Healthcare Co., Inc., Sr. Sec. Credit Facilities 1st Lien Term Loan, Tranche B2, 3.988% [LIBOR12+275], 2/16/234 | | 61,165 | | 61,636 |
Access CIG LLC, Sr. Sec. Credit Facilities 1st Lien Term Loan, Tranche B, 6.238% [LIBOR12+500], 10/18/214 | | 91,891 | | 92,734 |
Acosta, Inc., Sr. Sec. Credit Facilities 1st Lien Term Loan, Tranche B, 4.492% [LIBOR4+325], 9/26/214 | | 172,500 | | 151,988 |
Air Canada, Sr. Sec. Credit Facilities 1st Lien Term Loan, Tranche B, 3.46% [LIBOR4+225], 10/6/234 | | 95,000 | | 95,693 |
Air Medical Group Holdings, Inc., Sr. Sec. Credit Facilities 1st Lien Term Loan, Tranche B, 4.492% [LIBOR12+325], 4/28/224 | | 92,620 | | 92,523 |
Akorn, Inc., Sr. Sec. Credit Facilities 1st Lien Term Loan, Tranche B, 5.50% [LIBOR12+425], 4/16/214 | | 182,206 | | 183,912 |
Albertson’s LLC, Sr. Sec. Credit Facilities 1st Lien Term Loan: Tranche B4, 3.992%, [LIBOR12+275], 8/25/214 | | 294,975 | | 286,678 |
Tranche B6, 4.317%, [LIBOR4+300], 6/22/234 | | 260,154 | | 252,581 |
Alliance HealthCare Services, Inc., Sr. Sec. Credit Facilities 1st Lien Term Loan, 5.575% [LIBOR4+425], 10/3/234,9 | | 110,000 | | 110,412 |
Alliant Holdings Intermediate LLC, Sr. Sec. Credit Facilities 1st Lien Term Loan, Tranche B, 4.49% [LIBOR4+325], 8/12/224 | | 106,010 | | 106,871 |
Allied Universal Holdco LLC, Sr. Sec. Credit Facilities 1st Lien Term Loan, 5.083% [LIBOR4+375], 7/28/224 | | 313,938 | | 313,321 |
Almonde, Inc., Sr. Sec. Credit Facilities 1st Lien Term Loan, Tranche B, 4.736%-4.817% [LIBOR4+350], 6/13/244 | | 355,000 | | 354,467 |
Alphabet Holdings Co., Inc., Sr. Sec. Credit Facilities 1st Lien Term Loan, 4.833% [LIBOR4+350], 9/26/244 | | 185,000 | | 181,271 |
Altice Financing SA, Sr. Sec. Credit Facilities 1st Lien Term Loan, Tranche B, 4.109% [LIBOR4+275], 7/15/254 | | 228,850 | | 229,013 |
Altice US Finance I Corp., Sr. Sec. Credit Facilities 1st Lien Term Loan, Tranche B, 3.492% [LIBOR12+225], 7/28/254 | | 184,675 | | 184,820 |
Amaya Holdings BV, Sr. Sec. Credit Facilities 1st Lien Term Loan, Tranche B, 4.833% [LIBOR4+350], 8/1/214 | | 218,363 | | 220,055 |
American Airlines, Inc., Sr. Sec. Credit Facilities 1st Lien Term Loan: Tranche B, 3.742%, [LIBOR12+250], 4/28/234 | | 123,750 | | 124,128 |
Tranche B, 3.739%, [LIBOR12+250], 12/14/234 | | 260,000 | | 260,921 |
American Axle & Manufacturing, Inc., Sr. Sec. Credit Facilities 1st Lien Term Loan, Tranche B, 3.49% [LIBOR12+225], 4/6/244 | | 237,000 | | 237,420 |
American Builders & Contractors Supply Co., Inc., Sr. Sec. Credit | | | | |
Facilities 1st Lien Term Loan, Tranche B, 3.742% [LIBOR12+250], 10/31/234 | | 89,550 | | 90,184 |
American Energy-Marcellus LLC, Sr. Sec. Credit Facilities 1st Lien Term Loan, 5.474% [LIBOR12+425], 8/4/204,10 | | 239,526 | | 179,046 |
AmWINS Group, Inc., Sr. Sec. Credit Facilities 1st Lien Term Loan, 3.985%-3.992% [LIBOR12+275], 1/25/244 | | 114,711 | | 115,237 |
Arctic LNG Carriers Ltd., Sr. Sec. Credit Facilities 1st Lien Term Loan, Tranche B, 5.742% [LIBOR12+450], 5/18/234 | | 169,575 | | 171,430 |
26 OPPENHEIMER FUNDAMENTAL ALTERNATIVES FUND
| | | | |
| | | Principal Amount | | Value |
Corporate Loans (Continued) | | | | |
Ardent Legacy Acquisitions, Inc., Sr. Sec. Credit Facilities 1st Lien Term Loan, Tranche B, 6.833% [LIBOR4+550], 8/4/214 | | $ 101,777 | | $ 102,286 |
Aretec Group, Inc., Sr. Sec. Credit Facilities 1st Lien Exit Term Loan, 5.485% [LIBOR12+425], 11/23/204 | | 211,984 | | 212,249 |
Aretec Group, Inc., Sr. Sec. Credit Facilities 2nd Lien Term Loan, 6.742% [PRIME4+450], 5/23/214,11 | | 494,374 | | 492,212 |
Aretec Group, Inc., Sr. Sec. Credit Facilities 2nd Lien Term Loan, 6.742% [PRIME4+450], 5/23/214,9,11 | | 60,000 | | 59,737 |
Aricent Technologies, Sr. Sec. Credit Facilities 1st Lien Term Loan, 5.739% [LIBOR12+450], 4/14/214 | | 167,031 | | 167,988 |
Ascena Retail Group, Inc., Sr. Sec. Credit Facilities 1st Lien Term Loan, Tranche B, 5.75% [LIBOR12+450], 8/21/224 | | 253,903 | | 221,451 |
ASP AMC Merger Sub, Inc., Sr. Sec. Credit Facilities 1st Lien Term Loan, 4.833% [LIBOR4+350], 4/22/244 | | 299,949 | | 299,424 |
Asurion LLC, Sr. Sec. Credit Facilities 1st Lien Term Loan: Tranche B4, 3.992%, [LIBOR12+275], 8/4/224 | | 712,897 | | 718,944 |
Tranche B5, 4.242%, [LIBOR12+300], 11/3/234 | | 211,221 | | 213,126 |
ATS Consolidated, Inc., Sr. Sec. Credit Facilities 1st Lien Term Loan, Tranche B, 5.742% [LIBOR12+450], 5/31/244 | | 124,688 | | 125,934 |
Avantor Performance Materials Holdings LLC, Sr. Sec. Credit Facilities 1st Lien Term Loan, 5.24% [LIBOR12+400], 3/11/244 | | 90,909 | | 91,236 |
Avaya, Inc., Sr. Sec. Credit Facilities 1st Lien Term Loan, Tranche B7, 6.621% [LIBOR4+525], 5/29/204,9,10 | | 1,582,323 | | 1,331,789 |
Avaya, Inc., Sr. Sec. Credit Facilities 1st Lien Term Loan, Debtor in Possession, 8.739%-8.742% [LIBOR12+750], 1/24/184 | | 215,000 | | 217,419 |
Avolon TLB Borrower 1 US LLC, Sr. Sec. Credit Facilities 1st Lien Term Loan, Tranche B2, 3.488% [LIBOR12+225], 3/21/224 | | 957,600 | | 965,432 |
AVSC Holding Corp., Sr. Sec. Credit Facilities 1st Lien Term Loan, Tranche B, 4.674%-4.853% [LIBOR4+350], 4/29/244 | | 189,525 | | 190,946 |
Axalta Coating Systems US Holdings, Inc., Sr. Sec. Credit Facilities 1st Lien Term Loan, 3.333% [LIBOR4+200], 6/1/244 | | 7,881,119 | | 7,933,662 |
Bass Pro Group LLC, Sr. Sec. Credit Facilities 1st Lien Term Loan, Tranche B, 6.242% [LIBOR12+500], 12/15/234 | | 490,000 | | 477,444 |
BCP Renaissance Parent LLC, Sr. Sec. Credit Facilities 1st Lien Term Loan, Tranche B, 5.317% [LIBOR4+400], 9/20/244,9 | | 270,000 | | 273,417 |
Belron Finance US LLC, Sr. Sec. Credit Facilities 1st Lien Term Loan, Tranche B, 3.857% [LIBOR4+250], 10/26/244,9 | | 165,000 | | 166,444 |
Berry Global, Inc., Sr. Sec. Credit Facilities 1st Lien Term Loan, Tranche M, 3.488%-3.492% [LIBOR12+225], 10/1/224 | | 387,534 | | 389,229 |
Birch Communications, Inc., Sr. Sec. Credit Facilities 1st Lien Term Loan, 8.60% [LIBOR4+725], 7/17/204 | | 411,981 | | 383,142 |
BJ’s Wholesale Club, Inc., Sr. Sec. Credit Facilities 1st Lien Term Loan, Tranche B, 4.988% [LIBOR12+375], 2/3/244 | | 83,319 | | 81,425 |
Blackboard, Inc., Sr. Sec. Credit Facilities 1st Lien Term Loan, Tranche B4, 6.354% [LIBOR4+500], 6/30/214 | | 240,419 | | 231,479 |
Blucora, Inc., Sr. Sec. Credit Facilities 1st Lien Term Loan, 5.073% [LIBOR4+375], 5/22/244 | | 102,667 | | 103,437 |
BMC Foreign Holding Co., Sr. Sec. Credit Facilities 1st Lien Term Loan, Tranche B, 5.333% [LIBOR4+400], 9/10/224 | | 39,131 | | 39,058 |
27 OPPENHEIMER FUNDAMENTAL ALTERNATIVES FUND
CONSOLIDATED STATEMENT OF INVESTMENTS Continued
| | | | |
| | | Principal Amount | | Value |
Corporate Loans (Continued) | | | | |
BMC Software Finance, Inc., Sr. Sec. Credit Facilities 1st Lien Term Loan, 5.242% [LIBOR12+400], 9/10/224 | | $ 364,886 | | $ �� 367,727 |
Boyd Gaming Corp., Sr. Sec. Credit Facilities 1st Lien Term Loan, Tranche B, 3.702% [LIBOR52+250], 9/15/234 | | 165,364 | | 166,340 |
BRP US, Inc., Sr. Sec. Credit Facilities 1st Lien Term Loan, Tranche B, 3.586% [LIBOR4+225], 6/30/234,9 | | 80,000 | | 80,600 |
Burlington Coat Factory Warehouse Corp., Sr. Sec. Credit Facilities 1st Lien Term Loan, Tranche B3, 3.99% [LIBOR12+275], 8/13/214 | | 130,000 | | 130,545 |
BWAY Corp., Sr. Sec. Credit Facilities 1st Lien Term Loan, 4.599% [LIBOR12+325], 4/3/244 | | 234,413 | | 235,396 |
Caesars Entertainment Operating Co., Inc., Sr. Sec. Credit Facilities 1st Lien Exit Term Loan, Tranche B, 3.742% [LIBOR4+250], 10/7/244,9 | | 390,000 | | 390,822 |
Caesars Entertainment Resort Properties LLC, Sr. Sec. Credit Facilities 1st Lien Term Loan, Tranche B, 4.735% [LIBOR12+350], 10/11/204 | | 815,898 | | 817,428 |
Caesars Growth Properties Holdings LLC, Sr. Sec. Credit Facilities 1st Lien Term Loan, 4.242% [LIBOR12+300], 5/8/214 | | 722,846 | | 724,201 |
Caesars Growth Properties Holdings LLC, Sr. Sec. Credit Facilities 1st Lien Term Loan, 4.075% [LIBOR4+275], 9/28/244,9 | | 1,430,000 | | 1,437,686 |
California Resources Corp., Sr. Sec. Credit Facilities 1st Lien Term Loan, 11.612% [LIBOR12+1037.5], 12/31/214 | | 115,000 | | 123,433 |
Calpine Corp., Sr. Sec. Credit Facilities 1st Lien Term Loan: Tranche B5, 4.09%, [LIBOR4+275], 1/15/244 | | 309,892 | | 311,378 |
Tranche B7, 4.09%, [LIBOR4+275], 5/31/234 | | 34,649 | | 34,833 |
Camelot Finance LP, Sr. Sec. Credit Facilities 1st Lien Term Loan, Tranche B, 4.742% [LIBOR12+350], 10/3/234 | | 202,955 | | 204,509 |
Capital Automotive LP, Sr. Sec. Credit Facilities 1st Lien Term Loan, Tranche B, 4.25% [LIBOR12+300], 3/25/244 | | 82,960 | | 83,435 |
Carestream Health, Inc., Sr. Sec. Credit Facilities 1st Lien Term Loan, Tranche B, 5.333% [LIBOR4+400], 6/7/194 | | 58,967 | | 58,939 |
Casmar Australia Pty Ltd., Sr. Sec. Credit Facilities 1st Lien Term Loan, Tranche B, 5.647%-5.677% [LIBOR4+450], 12/8/234 | | 124,063 | | 125,613 |
Cavium, Inc., Sr. Sec. Credit Facilities 1st Lien Term Loan, Tranche B, 3.488% [LIBOR12+225], 8/16/224 | | 130,868 | | 131,601 |
CBS Radio, Inc., Sr. Sec. Credit Facilities 1st Lien Term Loan, Tranche B, 3.803% [LIBOR4+275], 10/17/234,9 | | 105,000 | | 105,866 |
CEC Entertainment, Inc., Sr. Sec. Credit Facilities 1st Lien Term Loan, Tranche B, 4.242% [LIBOR12+300], 2/12/214 | | 148,271 | | 148,063 |
CenturyLink, Inc., Sr. Sec. Credit Facilities 1st Lien Term Loan, Tranche B, 3.993% [LIBOR4+275], 1/31/254 | | 955,000 | | 943,560 |
CeramTec Acquisition Corp., Sr. Sec. Credit Facilities 1st Lien Term Loan, Tranche B2, 4.067% [LIBOR4+275], 8/30/204 | | 17,645 | | 17,662 |
CeramTec Service GmbH, Sr. Sec. Credit Facilities 1st Lien Term Loan: Tranche B1, 4.067%, [LIBOR4+275], 8/30/204 | | 141,942 | | 142,075 |
Tranche B3, 4.067%, [LIBOR4+275], 8/30/204 | | 42,583 | | 42,623 |
Ceridian HCM Holdings, Inc., Extended Sr. Sec. Credit Facilities 1st Lien Term Loan, Tranche B, 4.739% [LIBOR12+350], 9/15/204 | | 208,998 | | 209,325 |
CEVA Group plc, Sr. Sec. Credit Facilities 1st Lien Term Loan, 6.878% [LIBOR4+550], 3/19/214 | | 53,293 | | 51,801 |
28 OPPENHEIMER FUNDAMENTAL ALTERNATIVES FUND
| | | | |
| | | Principal Amount | | Value |
Corporate Loans (Continued) | | | | |
CEVA Group plc, Sr. Sec. Credit Facilities Letter of Credit 1st Lien Term Loan, 6.50%-6.878% [LIBOR4+550], 3/19/214 | | $ 107,411 | | $ 104,403 |
Change Healthcare Holdings LLC, Sr. Sec. Credit Facilities 1st Lien Term Loan, Tranche B, 3.992% [LIBOR12+275], 3/1/244 | | 716,400 | | 721,077 |
Charter Communications Operating LLC, Sr. Sec. Credit Facilities 1st Lien Term Loan: | | | | |
Tranche H, 3.25%, [LIBOR12+200], 1/15/224 | | 89,095 | | 89,603 |
Tranche I, 3.50%, [LIBOR12+225], 1/15/244 | | 566,375 | | 571,016 |
Checkout Holdings, Inc., Sr. Sec. Credit Facilities 1st Lien Term Loan, Tranche B, 4.742% [LIBOR12+350], 4/9/214 | | 505,834 | | 420,352 |
Chesapeake Energy Corp., Sr. Sec. Credit Facilities 1st Lien Term Loan, 8.814% [LIBOR4+750], 8/23/214 | | 135,000 | | 145,361 |
CHS/Community Health Systems, Inc., Sr. Sec. Credit Facilities 1st Lien Term Loan: | | | | |
Tranche G, 4.067%, [LIBOR4+275], 12/31/194 | | 87,617 | | 86,248 |
Tranche H, 4.202%, [LIBOR4+300], 1/27/214 | | 305,717 | | 296,573 |
Tranche H, 4.317%, [LIBOR4+300], 1/27/214,9 | | 89,831 | | 87,144 |
Cincinnati Bell, Inc., Sr. Sec. Credit Facilities 1st Lien Term Loan, Tranche B, 4.985% [LIBOR4+375], 10/2/244 | | 185,000 | | 187,891 |
CityCenter Holdings LLC, Sr. Sec. Credit Facilities 1st Lien Term Loan, Tranche B, 3.742% [LIBOR12+250], 4/18/244 | | 164,588 | | 165,475 |
Clark Equipment Co., Sr. Sec. Credit Facilities 1st Lien Term Loan, Tranche B, 3.929% [LIBOR4+275], 5/18/244 | | 149,250 | | 150,525 |
Clear Channel Communications, Inc., Extended Sr. Sec. Credit Facilities 1st Lien Term Loan, Tranche D, 7.989% [LIBOR4+675], 1/30/194 | | 2,681,691 | | 2,016,296 |
Clear Channel Communications, Inc., Sr. Sec. Credit Facilities 1st Lien Term Loan, Tranche E, 8.739% [LIBOR4+750], 7/30/194 | | 57,055 | | 43,112 |
Colorado Buyer, Inc., Sr. Sec. Credit Facilities 1st Lien Term Loan, 4.31% [LIBOR4+300], 5/1/244 | | 208,478 | | 210,354 |
Commercial Barge Line Co., Sr. Sec. Credit Facilities 1st Lien Term Loan, Tranche B, 9.992% [LIBOR12+875], 11/12/204 | | 162,485 | | 125,790 |
Compass Group Diversified Holdings LLC, Sr. Sec. Credit Facilities 1st Lien Term Loan, Tranche B, 3.492% [LIBOR12+275], 6/4/214 | | 138,250 | | 138,984 |
Compuware Corp., Sr. Sec. Credit Facilities 1st Lien Term Loan, Tranche B2, 5.63% [LIBOR12+425], 12/15/214 | | 163,125 | | 165,215 |
Consolidated Communications, Inc., Sr. Sec. Credit Facilities 1st Lien | | | | |
Term Loan, Tranche B, 4.25% [LIBOR12+300], 10/5/234 | | 248,932 | | 245,354 |
Continental Building Products Operating Co. LLC, Sr. Sec. Credit Facilities 1st Lien Term Loan, Tranche B, 3.742%-3.833% [LIBOR4+250], 8/18/234 | | 237,173 | | 239,278 |
Cooper-Standard Automotive, Inc., Sr. Sec. Credit Facilities 1st Lien Term Loan, Tranche B, 3.583% [LIBOR4+225], 11/2/234 | | 100,494 | | 101,229 |
Coty, Inc., Sr. Sec. Credit Facilities 1st Lien Term Loan, Tranche B, 3.732% [LIBOR12+250], 10/27/224 | | 69,300 | | 69,256 |
CPI Acquisition, Inc., Sr. Sec. Credit Facilities 1st Lien Term Loan, Tranche B, 5.962% [LIBOR4+450], 8/17/224 | | 88,939 | | 65,074 |
Crossmark Holdings, Inc., Sr. Sec. Credit Facilities 1st Lien Term Loan, 4.833% [LIBOR4+350], 12/20/194 | | 237,714 | | 159,031 |
CSC Holdings LLC, Sr. Sec. Credit Facilities 1st Lien Term Loan, Tranche B, 3.489% [LIBOR12+225], 7/17/254 | | 173,938 | | 173,720 |
29 OPPENHEIMER FUNDAMENTAL ALTERNATIVES FUND
CONSOLIDATED STATEMENT OF INVESTMENTS Continued
| | | | |
| | | Principal Amount | | Value |
Corporate Loans (Continued) | | | | |
CWGS Group LLC, Sr. Sec. Credit Facilities 1st Lien Term Loan, Tranche B, 4.238%-4.242% [LIBOR12+300], 11/8/234 | | $ 159,065 | | $ 160,688 |
Cypress Semiconductor Corp., Sr. Sec. Credit Facilities 1st Lien Term Loan, Tranche B, 3.99% [LIBOR12+275], 7/5/214 | | 138,158 | | 139,324 |
Dayco Products LLC, Sr. Sec. Credit Facilities 1st Lien Term Loan, Tranche B, 6.234% [LIBOR4+500], 5/19/234 | | 119,700 | | 120,897 |
Dayton Power & Light Co. (The), Sr. Sec. Credit Facilities 1st Lien Term Loan, Tranche B, 4.50% [LIBOR12+325], 8/24/224 | | 198,500 | | 201,540 |
Delos Finance Sarl, Sr. Sec. Credit Facilities 1st Lien Term Loan, Tranche B, 3.333% [LIBOR4+200], 10/6/234 | | 9,020,000 | | 9,098,925 |
Delta 2 Lux Sarl, Sr. Sec. Credit Facilities 1st Lien Term Loan, Tranche B, 4.242% [LIBOR12+300], 2/1/244 | | 434,814 | | 438,256 |
Deluxe Entertainment Services Group, Inc., Sr. Sec. Credit Facilities 1st Lien Term Loan, Tranche B, 6.88% [LIBOR4+550], 2/28/204 | | 251,788 | | 254,620 |
Digicel International Finance Ltd., Sr. Sec. Credit Facilities 1st Lien Term Loan, Tranche B, 5.07% [LIBOR4+375], 5/27/244 | | 165,000 | | 166,341 |
DJO Finance LLC, Sr. Sec. Credit Facilities 1st Lien Term Loan, Tranche B, 4.492%-4.585% [LIBOR12+325], 6/8/204 | | 384,139 | | 384,955 |
Dole Food Co., Inc., Sr. Sec. Credit Facilities 1st Lien Term Loan, Tranche B, 3.988%-6.00% [LIBOR6+275], 4/6/244 | | 283,219 | | 284,831 |
Doncasters US Finance LLC, Sr. Sec. Credit Facilities 1st Lien Term Loan, Tranche B, 4.647% [LIBOR4+350], 4/9/204 | | 114,436 | | 111,384 |
Drillship Kithira Owners, Inc., Sr. Sec. Credit Facilities 1st Lien Exit Term Loan, 8.00% [LIBOR4+800], 9/20/244,9 | | 235,795 | | 239,332 |
DTZ US Borrower LLC, Sr. Sec. Credit Facilities 1st Lien Term Loan, Tranche B, 4.25% [LIBOR4+325], 11/4/214,9 | | 29,923 | | 30,115 |
DTZ US Borrower LLC, Sr. Sec. Credit Facilities 1st Lien Term Loan, Tranche B, 4.397%-4.63% [LIBOR4+325], 11/4/214 | | 169,211 | | 170,295 |
Dynegy, Inc., Sr. Sec. Credit Facilities 1st Lien Term Loan, Tranche C, 4.492% [LIBOR12+325], 2/7/244 | | 363,029 | | 365,575 |
Eastern Power LLC, Sr. Sec. Credit Facilities 1st Lien Term Loan, Tranche B, 4.992% [LIBOR12+375], 10/2/234 | | 484,289 | | 487,662 |
EFS Cogen Holdings I LLC, Sr. Sec. Credit Facilities 1st Lien Term Loan, Tranche B, 4.363% [LIBOR4+325], 6/28/234,9 | | 95,000 | | 95,796 |
EFS Cogen Holdings I LLC, Sr. Sec. Credit Facilities 1st Lien Term Loan, Tranche B, 4.84% [LIBOR4+350], 6/28/234 | | 116,093 | | 117,109 |
Eldorado Resorts, Inc., Sr. Sec. Credit Facilities 1st Lien Term Loan, Tranche B, 3.50% [LIBOR4+225], 4/17/244 | | 192,965 | | 193,568 |
Emerald Performance Materials LLC, Sr. Sec. Credit Facilities 1st Lien Term Loan, 4.742% [LIBOR12+350], 7/30/214 | | 188,813 | | 190,206 |
Encapsys LLC, Sr. Sec. Credit Facilities 1st Lien Term Loan, Tranche B, 4.607% [LIBOR4+325], 10/26/244,9 | | 30,000 | | 30,262 |
Endemol, Sr. Sec. Credit Facilities 1st Lien Term Loan, 7.085% [LIBOR4+575], 8/13/214 | | 721 | | 697 |
Engility Corp., Sr. Sec. Credit Facilities 1st Lien Term Loan: Tranche B1, 3.985%, [LIBOR12+275], 8/12/204 Tranche B2, 4.492%, [LIBOR12+325], 8/14/234 | | 76,500 189,037 | | 77,179 191,589 |
Epicor Software Corp., Sr. Sec. Credit Facilities 1st Lien Term Loan, 5.00% [LIBOR12+375], 6/1/224 | | 128,571 | | 129,386 |
30 OPPENHEIMER FUNDAMENTAL ALTERNATIVES FUND
| | | | |
| | | Principal Amount | | Value |
Corporate Loans (Continued) | | | | |
ESH Hospitality, Inc., Sr. Sec. Credit Facilities 1st Lien Term Loan, Tranche B, 3.742% [LIBOR12+250], 8/30/234 | | $ 69,475 | | $ 70,006 |
Everi Payments, Inc., Sr. Sec. Credit Facilities 1st Lien Term Loan, 5.742% [LIBOR12+450], 5/9/244 | | 209,475 | | 210,784 |
ExGen Texas Power LLC, Sr. Sec. Credit Facilities 1st Lien Term Loan, Tranche B, 5.897% [LIBOR4+475], 9/18/214 | | 312,850 | | 198,138 |
Federal-Mogul Holdings LLC, Sr. Sec. Credit Facilities 1st Lien Term Loan, Tranche C, 4.99% [LIBOR12+375], 4/15/214 | | 837,756 | | 844,301 |
Ferro Corp., Sr. Sec. Credit Facilities 1st Lien Term Loan, Tranche B, 3.742% [LIBOR12+250], 2/14/244 | | 84,575 | | 85,117 |
Fieldwood Energy LLC, Sr. Sec. Credit Facilities 1st Lien Term Loan, Tranche B, 8.045% [LIBOR4+700], 8/31/204 | | 48,000 | | 43,480 |
First Advantage, Sr. Sec. Credit Facilities 1st Lien Term Loan, Tranche B, 6.397% [LIBOR4+525], 6/30/224 | | 97,904 | | 95,457 |
First American Payment Systems LP, Sr. Sec. Credit Facilities 1st Lien Term Loan, 6.988% [LIBOR12+575], 1/5/244 | | 105,896 | | 106,161 |
First Data Corp., Sr. Sec. Credit Facilities 1st Lien Term Loan: Tranche B, 3.488%, [LIBOR12+225], 7/8/224 Tranche B, 3.738%, [LIBOR12+250], 4/26/244 | | 137,429 369,782 | | 137,996 372,055 |
Floatel International Ltd., Sr. Sec. Credit Facilities 1st Lien Term Loan, Tranche B, 6.147% [LIBOR4+500], 6/27/204 | | 63,293 | | 49,526 |
Focus Financial Partners LLC, Sr. Sec. Credit Facilities 1st Lien Term Loan, 4.574% [LIBOR4+325], 7/3/244 | | 55,000 | | 55,564 |
Four Seasons Hotels Ltd., Sr. Sec. Credit Facilities 1st Lien Term Loan, 3.742% [LIBOR12+250], 11/30/234 | | 79,400 | | 80,033 |
FPC Holdings, Inc., Sr. Sec. Credit Facilities 1st Lien Term Loan, 5.25% [LIBOR4+400], 11/19/194 | | 65,354 | | 64,891 |
Frontier Communications Corp., Sr. Sec. Credit Facilities 1st Lien Term Loan, Tranche B, 4.99% [LIBOR12+375], 6/15/244 | | 279,300 | | 266,426 |
Garda World Security Corp., Sr. Sec. Credit Facilities 1st Lien Term Loan, Tranche B, 5.311% [PRIME4+300], 5/24/244 | | 323,829 | | 327,067 |
Gardner Denver, Inc., Sr. Sec. Credit Facilities 1st Lien Term Loan, Tranche B, 4.083% [LIBOR12+275], 7/30/244 | | 104,149 | | 104,649 |
Gates Global LLC, Sr. Sec. Credit Facilities 1st Lien Term Loan, Tranche B, 4.408% [LIBOR4+325], 4/1/244 | | 281,528 | | 283,511 |
Gateway Casinos & Entertainment Ltd., Sr. Sec. Credit Facilities 1st Lien Term Loan, Tranche B, 4.794% [LIBOR4+375], 2/22/234 | | 64,838 | | 65,716 |
Generac Power Systems, Inc., Sr. Sec. Credit Facilities 1st Lien Term Loan, Tranche B, 3.585% [LIBOR4+225], 5/31/234 | | 134,000 | | 134,726 |
Genesys Telecommunications Laboratories, Inc., Sr. Sec. Credit Facilities 1st Lien Term Loan, Tranche B2, 5.083% [LIBOR4+375], 12/1/234 | | 104,388 | | 105,050 |
Genoa a Qol Healthcare Co. LLC, Sr. Sec. Credit Facilities 1st Lien Term Loan, 4.492% [LIBOR12+325], 10/30/234 | | 84,152 | | 84,901 |
Getty Images, Inc., Sr. Sec. Credit Facilities 1st Lien Term Loan, Tranche B, 4.75% [LIBOR4+350], 10/18/194 | | 145,948 | | 128,069 |
Global Tel*Link Corp., Sr. Sec. Credit Facilities 1st Lien Term Loan, 5.00% [LIBOR4+400], 5/23/204 | | 257,026 | | 260,199 |
Go Daddy Operating Co. LLC, Sr. Sec. Credit Facilities 1st Lien Term Loan, Tranche B, 3.742% [LIBOR12+250], 2/15/244 | | 251,511 | | 252,910 |
31 OPPENHEIMER FUNDAMENTAL ALTERNATIVES FUND
CONSOLIDATED STATEMENT OF INVESTMENTS Continued
| | | | |
| | | Principal Amount | | Value |
Corporate Loans (Continued) | | | | |
Gray Television, Inc., Sr. Sec. Credit Facilities 1st Lien Term Loan, Tranche B, 3.735% [LIBOR12+250], 2/7/244 | | $ 184,850 | | $ 186,500 |
Gulf Finance LLC, Sr. Sec. Credit Facilities 1st Lien Term Loan, | | | | |
Tranche B, 6.30% [LIBOR4+525], 8/25/234 | | 234,073 | | 227,343 |
H.B. Fuller Co., Sr. Sec. Credit Facilities 1st Lien Term Loan, Tranche | | | | |
B, 3.489% [LIBOR4+225], 10/20/244 | | 365,000 | | 367,542 |
Harbor Freight Tools USA, Inc., Sr. Sec. Credit Facilities 1st Lien Term | | | | |
Loan, 4.492% [LIBOR12+325], 8/18/234 | | 246,185 | | 247,775 |
Harland Clarke Holdings Corp., Sr. Sec. Credit Facilities 1st Lien Term Loan: | | | | |
Tranche B5, 7.147%, [LIBOR4+600], 12/31/214 | | 173,070 | | 174,260 |
Tranche B6, 6.647%, [LIBOR4+550], 2/9/224 | | 289,341 | | 290,271 |
Harsco Corp., Sr. Sec. Credit Facilities 1st Lien Term Loan, Tranche B, 6.25% [LIBOR12+500], 11/2/234 | | 99,250 | | 101,070 |
HCA, Inc., Sr. Sec. Credit Facilities 1st Lien Term Loan, Tranche B8, 3.492% [LIBOR12+225], 2/15/244 | | 114,425 | | 115,310 |
Hearthside Group Holdings LLC, Sr. Sec. Credit Facilities 1st Lien | | | | |
Term Loan, Tranche B, 4.242% [LIBOR12+300], 6/2/214 | | 58,546 | | 58,930 |
Helix Gen Funding LLC, Sr. Sec. Credit Facilities 1st Lien Term Loan, | | | | |
Tranche B, 5.083% [LIBOR4+375], 6/3/244 | | 171,296 | | 173,351 |
HGIM Corp., Sr. Sec. Credit Facilities 1st Lien Term Loan, Tranche B, 5.75% [LIBOR4+450], 6/18/204 | | 198,414 | | 71,594 |
Hillman Group, Inc. (The), Sr. Sec. Credit Facilities 1st Lien Term | | | | |
Loan, Tranche B, 4.65% [LIBOR4+350], 6/30/214 | | 182,049 | | 183,642 |
HLF Financing Sarl, Sr. Sec. Credit Facilities 1st Lien Term Loan, | | | | |
Tranche B, 6.742% [LIBOR12+550], 2/15/234 | | 192,500 | | 194,997 |
Hostess Brands LLC, Sr. Sec. Credit Facilities 1st Lien Term Loan, 3.742% [LIBOR12+250], 8/3/224 | | 266,914 | | 268,694 |
HUB International Ltd., Sr. Sec. Credit Facilities 1st Lien Term Loan, | | | | |
Tranche B, 4.312% [LIBOR4+300], 10/2/204 | | 195,936 | | 197,724 |
Huntsman International LLC, Sr. Sec. Credit Facilities 1st Lien Term | | | | |
Loan, Tranche B, 4.242% [LIBOR12+300], 4/1/234 | | 108,121 | | 108,898 |
Hyperion Insurance Group Ltd., Sr. Sec. Credit Facilities 1st Lien Term | | | | |
Loan, Tranche B, 5.25% [LIBOR12+400], 4/29/224 | | 245,404 | | 248,395 |
IG Investments Holdings LLC, Sr. Sec. Credit Facilities 1st Lien Term | | | | |
Loan, 5.078% [LIBOR4+400], 10/31/214 | | 278,600 | | 282,258 |
Ineos Styrolution US Holding LLC, Sr. Sec. Credit Facilities 1st Lien | | | | |
Term Loan, Tranche B, 4.083% [LIBOR4+275], 3/29/244 | | 158,802 | | 159,546 |
Ineos US Finance LLC, Sr. Sec. Credit Facilities 1st Lien Term Loan: | | | | |
Tranche B, 3.941%, [LIBOR12+275], 3/31/224 | | 122,617 | | 123,084 |
Tranche B, 3.941%, [LIBOR12+275], 4/1/244 | | 99,250 | | 99,684 |
Infor US, Inc., Sr. Sec. Credit Facilities 1st Lien Term Loan, Tranche B, 3.897% [LIBOR4+275], 2/1/224 | | 421,786 | | 423,104 |
Informatica Corp., Sr. Sec. Credit Facilities 1st Lien Term Loan, | | | | |
Tranche B, 4.647% [LIBOR4+350], 8/5/224 | | 249,409 | | 250,255 |
Inmar, Inc., Sr. Sec. Credit Facilities 1st Lien Term Loan, 4.67% | | | | |
[LIBOR6+350], 5/1/244 | | 314,213 | | 314,900 |
Intelsat Jackson Holdings SA, Sr. Sec. Credit Facilities 1st Lien Term | | | | |
Loan, Tranche B2, 4.00% [LIBOR4+275], 6/30/194 | | 240,000 | | 239,725 |
InterGen NV, Sr. Sec. Credit Facilities 1st Lien Term Loan, Tranche B, 5.65% [LIBOR4+450], 6/12/204 | | 293,957 | | 294,417 |
32 OPPENHEIMER FUNDAMENTAL ALTERNATIVES FUND
| | | | |
| | | Principal Amount | | Value |
Corporate Loans (Continued) | | | | |
Internap Corp., Sr. Sec. Credit Facilities 1st Lien Term Loan, 8.24% | | | | |
[LIBOR12+700], 4/6/224 | | $ 79,800 | | $ 81,047 |
International Car Wash Group Ltd., Sr. Sec. Credit Facilities 1st Lien | | | | |
Term Loan, 5.06% [LIBOR4+375], 10/3/244,9 | | 85,000 | | 85,956 |
Intrawest Resorts Holdings, Inc., Sr. Sec. Credit Facilities 1st Lien | | | | |
Term Loan, Tranche B1, 4.492% [LIBOR4+325], 7/31/244 | | 20,000 | | 20,153 |
ION Media Networks, Inc., Sr. Sec. Credit Facilities 1st Lien Term | | | | |
Loan, Tranche B, 4.25% [LIBOR12+300], 12/18/204 | | 847,109 | | 853,859 |
iPayment, Inc., Sr. Sec. Credit Facilities 1st Lien Term Loan, Tranche | | | �� | |
B, 7.305% [LIBOR4+600], 4/11/234 | | 144,638 | | 146,445 |
IPC Corp., Sr. Sec. Credit Facilities 1st Lien Term Loan, Tranche B, 5.89% [LIBOR4+450], 8/6/214 | | 513,746 | | 502,187 |
IPC Corp., Sr. Sec. Credit Facilities 2nd Lien Term Loan, 10.89% | | | | |
[LIBOR4+950], 2/4/224 | | 161,028 | | 144,120 |
IQOR US, Inc., Sr. Sec. Credit Facilities 1st Lien Term Loan, Tranche B, 6.335% [LIBOR4+500], 4/1/214 | | 268,294 | | 267,582 |
IQOR US, Inc., Sr. Sec. Credit Facilities 2nd Lien Term Loan, 10.085% | | | | |
[LIBOR4+875], 4/1/224 | | 44,964 | | 43,559 |
iStar, Inc., Sr. Sec. Credit Facilities 1st Lien Term Loan, Tranche B, 4.238%-4.239% [LIBOR4+300], 10/1/214 | | 189,525 | | 191,894 |
Ivanti Software, Inc., Sr. Sec. Credit Facilities 1st Lien Term Loan, | | | | |
Tranche B, 5.50% [LIBOR12+425], 1/20/244 | | 109,434 | | 107,245 |
Jacobs Douwe Egberts International BV, Sr. Sec. Credit Facilities 1st | | | | |
Lien Term Loan, Tranche B, 3.563% [LIBOR4+225], 7/4/224 | | 85,000 | | 85,611 |
Jaguar Holding Co. II, Sr. Sec. Credit Facilities 1st Lien Term Loan, 3.992%-4.083% [LIBOR12+275], 8/18/224 | | 317,000 | | 319,143 |
JC Penney Corp., Inc., Sr. Sec. Credit Facilities 1st Lien Term Loan, | | | | |
Tranche B, 5.568% [LIBOR4+425], 6/23/234 | | 339,063 | | 312,856 |
Kenan Advantage Group, Inc. (The), Sr. Sec. Credit Facilities 1st Lien Term Loan: | | | | |
Tranche B1, 4.242%, [LIBOR12+300], 7/29/224 | | 208,113 | | 208,569 |
Tranche B2, 4.242%, [LIBOR12+300], 7/29/224 | | 61,163 | | 61,297 |
Key Safety Systems, Inc., Sr. Sec. Credit Facilities 1st Lien Term Loan, 5.89% [LIBOR4+450], 8/29/214 | | 279,714 | | 281,672 |
KFC Holding Co., Sr. Sec. Credit Facilities 1st Lien Term Loan, Tranche | | | | |
B, 3.237% [LIBOR12+200], 6/16/234 | | 243,784 | | 245,438 |
KIK Custom Products, Inc., Sr. Sec. Credit Facilities 1st Lien Term | | | | |
Loan, Tranche B, 5.74% [LIBOR12+450], 8/26/224 | | 49,129 | | 49,743 |
Kindred Healthcare, Inc., Sr. Sec. Credit Facilities 1st Lien Term Loan, | | | | |
Tranche B, 4.875% [LIBOR4+350], 4/9/214 | | 459,548 | | 461,750 |
Kinetic Concepts, Inc., Sr. Sec. Credit Facilities 1st Lien Term Loan, | | | | |
Tranche B, 4.583% [LIBOR4+325], 2/2/244 | | 104,738 | | 104,759 |
KUEHG Corp., Sr. Sec. Credit Facilities 1st Lien Term Loan, 4.917% | | | | |
[LIBOR4+375], 8/12/224,9 | | 213,869 | | 214,832 |
La Quinta Intermediate Holdings LLC, Sr. Sec. Credit Facilities 1st | | | | |
Lien Term Loan, Tranche B, 4.109% [LIBOR4+275], 4/14/214 | | 231,134 | | 232,903 |
Landry’s, Inc., Sr. Sec. Credit Facilities 1st Lien Term Loan, 4.49%- 4.554% [LIBOR4+275], 10/4/234 | | 642,050 | | 649,173 |
Laureate Education, Inc., Sr. Sec. Credit Facilities 1st Lien Term Loan, | | | | |
Tranche B, 5.742% [LIBOR12+450], 4/26/244 | | 288,475 | | 290,218 |
33 OPPENHEIMER FUNDAMENTAL ALTERNATIVES FUND
CONSOLIDATED STATEMENT OF INVESTMENTS Continued
| | | | |
| | | Principal Amount | | Value |
Corporate Loans (Continued) | | | | |
Legendary Pictures, Inc., Sr. Sec. Credit Facilities 1st Lien Term Loan, | | | | |
Tranche B, 7.333% [LIBOR4+600], 4/22/202,4 | | $ 465,000 | | $ 460,931 |
Leslie’s Poolmart, Inc., Sr. Sec. Credit Facilities 1st Lien Term Loan, | | | | |
Tranche B, 5.064% [LIBOR4+375], 8/16/234 | | 94,050 | | 94,351 |
Level 3 Financing, Inc., Sr. Sec. Credit Facilities 1st Lien Term Loan, | | | | |
Tranche B, 3.489% [LIBOR12+225], 2/22/244 | | 240,000 | | 240,943 |
Liberty Cablevision of Puerto Rico LLC, Sr. Sec. Credit Facilities 1st | | | | |
Lien Term Loan, 4.859% [LIBOR4+350], 1/7/224 | | 305,000 | | 284,794 |
LifeCare Holdings LLC, Sr. Sec. Credit Facilities 1st Lien Exit Term | | | | |
Loan, Tranche A, 6.583% [LIBOR4+525], 11/30/184 | | 141,409 | | 119,491 |
Limetree Bay Terminals LLC, Sr. Sec. Credit Facilities 1st Lien Term | | | | |
Loan, 5.237% [LIBOR12+400], 2/15/244 | | 203,975 | | 204,230 |
Lions Gate Entertainment Corp., Sr. Sec. Credit Facilities 1st Lien | | | | |
Term Loan, Tranche B, 4.242% [LIBOR12+300], 12/8/234 | | 217,375 | | 219,060 |
Livingston International, Inc., Sr. Sec. Credit Facilities 1st Lien Term | | | | |
Loan, Tranche B1, 5.583% [LIBOR4+425], 4/18/194 | | 101,342 | | 97,288 |
Livingston International, Inc., Sr. Sec. Credit Facilities 2nd Lien Term | | | | |
Loan, 9.583% [LIBOR4+825], 4/17/204 | | 45,073 | | 42,468 |
LS Deco LLC, Sr. Sec. Credit Facilities 1st Lien Term Loan, Tranche B, 4.833% [LIBOR4+350], 5/21/224 | | 181,790 | | 183,835 |
LTS Buyer LLC, Sr. Sec. Credit Facilities 1st Lien Term Loan, Tranche B, 4.485% [LIBOR12+325], 4/13/204 | | 766,476 | | 769,347 |
MA FinanceCo LLC, Sr. Sec. Credit Facilities 1st Lien Term Loan: | | | | |
Tranche B, 3.989%, [LIBOR12+275], 6/21/244 | | 82,823 | | 82,993 |
Tranche B2, 3.742%, [LIBOR4+250], 11/19/214 | | 165,000 | | 165,223 |
MacDermid, Inc., Sr. Sec. Credit Facilities 1st Lien Term Loan: | | | | |
Tranche B6, 4.242%, [LIBOR12+300], 6/7/234,9 | | 94,587 | | 95,230 |
Tranche B7, 3.742%, [LIBOR4+275], 6/7/204,9 | | 95,000 | | 95,679 |
MacDonald Dettwiler & Associates Ltd., Sr. Sec. Credit Facilities 1st | | | | |
Lien Term Loan, Tranche B, 4.10% [LIBOR4+250], 10/4/244 | | 130,000 | | 130,929 |
MACOM Technology Solutions Holdings, Inc., Sr. Sec. Credit Facilities 1st Lien Term Loan, Tranche B, 3.489% [LIBOR12+225], 5/17/244 | | 149,625 | | 150,030 |
Mallinckrodt International Finance SA, Sr. Sec. Credit Facilities 1st | | | | |
Lien Term Loan, Tranche B, 4.083% [LIBOR4+275], 9/24/244,9 | | 84,787 | | 85,070 |
MaxLinear, Inc., Sr. Sec. Credit Facilities 1st Lien Term Loan, Tranche | | | | |
B, 3.739% [LIBOR12+250], 5/13/244 | | 88,235 | | 88,787 |
McAfee LLC, Sr. Sec. Credit Facilities 1st Lien Term Loan, Tranche B, 5.833% [LIBOR4+450], 9/30/244 | | 325,000 | | 327,565 |
Mediacom Illinois LLC, Sr. Sec. Credit Facilities 1st Lien Term Loan, | | | | |
Tranche K, 3.46% [LIBOR52+225], 2/15/244 | | 34,825 | | 34,990 |
MediArena Acquisition BV, Sr. Sec. Credit Facilities 1st Lien Term | | | | |
Loan, 7.085% [LIBOR4+575], 8/13/214 | | 278,983 | | 269,767 |
MEG Energy Corp., Sr. Sec. Credit Facilities 1st Lien Term Loan, | | | | |
Tranche B, 4.833% [LIBOR4+350], 12/31/234 | | 182,099 | | 182,977 |
Men’s Wearhouse, Inc. (The), Sr. Sec. Credit Facilities 1st Lien Term | | | | |
Loan, Tranche B, 4.688%-4.75% [LIBOR4+350], 6/18/214 | | 152,075 | | 151,268 |
MGM Growth Properties Operating Partnership LP, Sr. Sec. Credit | | | | |
Facilities 1st Lien Term Loan, Tranche B, 3.492% [LIBOR12+225], 4/25/234 | | 84,571 | | 85,099 |
34 OPPENHEIMER FUNDAMENTAL ALTERNATIVES FUND
| | | | |
| | | Principal Amount | | Value |
Corporate Loans (Continued) | | | | |
Michaels Stores, Inc., Sr. Sec. Credit Facilities 1st Lien Term Loan, | | | | |
Tranche B1, 3.987%-3.992% [LIBOR12+275], 1/30/234 | | $ 163,848 | | $ 164,079 |
Milacron LLC, Sr. Sec. Credit Facilities 1st Lien Term Loan, Tranche B, 4.242% [LIBOR12+300], 9/28/234 | | 94,213 | | 94,841 |
Mission Broadcasting, Inc., Sr. Sec. Credit Facilities 1st Lien Term | | | | |
Loan, Tranche B, 3.735% [LIBOR12+250], 1/17/244 | | 88,734 | | 89,336 |
Monarchy Enterprises Holdings BV, Sr. Sec. Credit Facilities 1st Lien | | | | |
Term Loan, 7.742% [LIBOR4+650], 10/13/222,4 | | 700,000 | | 696,500 |
Monitronics International, Inc., Sr. Sec. Credit Facilities 1st Lien Term | | | | |
Loan, Tranche B2, 6.833% [LIBOR4+550], 9/30/224 | | 271,205 | | 269,375 |
MPH Acquisition Holdings LLC, Sr. Sec. Credit Facilities 1st Lien Term | | | | |
Loan, Tranche B, 4.333% [LIBOR4+300], 6/7/234 | | 325,404 | | 328,292 |
MRP Generation Holdings LLC, Sr. Sec. Credit Facilities 1st Lien Term | | | | |
Loan, Tranche B, 8.333% [LIBOR4+700], 10/18/224 | | 74,250 | | 69,795 |
Multi-Color Corp., Sr. Sec. Credit Facilities 1st Lien Term Loan, | | | | |
Tranche B, 3.57% [LIBOR4+225], 9/20/244,9 | | 25,000 | | 25,211 |
Murray Energy Corp., Sr. Sec. Credit Facilities 1st Lien Term Loan: | | | | |
Tranche B2, 8.583%, [LIBOR4+725], 4/16/204,9 | | 1,322,595 | | 1,187,029 |
Tranche B3, 9.083%, [LIBOR4+775], 4/17/204 | | 506,164 | | 465,460 |
National Mentor Holdings, Inc., Sr. Sec. Credit Facilities 1st Lien Term | | | | |
Loan, Tranche B, 4.147% [LIBOR4+300], 1/31/214 | | 207,706 | | 209,815 |
Navistar, Inc., Sr. Sec. Credit Facilities 1st Lien Term Loan, Tranche B, 5.24% [LIBOR12+400], 8/7/204 | | 585,519 | | 590,642 |
Neiman Marcus Group Ltd. LLC, Sr. Sec. Credit Facilities 1st Lien | | | | |
Term Loan, 4.488% [LIBOR12+325], 10/25/204 | | 6,902,994 | | 5,467,172 |
NEP/NCP Holdco, Inc., Sr. Sec. Credit Facilities 1st Lien Term Loan, | | | | |
Tranche B, 4.492% [LIBOR12+325], 7/21/224 | | 194,012 | | 195,144 |
New Arclin US Holding Corp., Sr. Sec. Credit Facilities 1st Lien Term | | | | |
Loan, 5.583% [LIBOR4+425], 2/14/244,9 | | 109,938 | | 110,968 |
New Trident Holdcorp, Inc., Sr. Sec. Credit Facilities 1st Lien Term | | | | |
Loan, Tranche B, 7.083% [LIBOR4+575], 7/31/194 | | 109,403 | | 78,041 |
Nexstar Broadcasting, Inc., Sr. Sec. Credit Facilities 1st Lien Term | | | | |
Loan, Tranche B, 3.735% [LIBOR12+250], 1/17/244 | | 706,740 | | 711,531 |
NFP Corp., Sr. Sec. Credit Facilities 1st Lien Term Loan, Tranche B, 4.742% [LIBOR12+350], 1/8/244 | | 307,351 | | 310,589 |
Nomad Foods Europe Midco Ltd., Sr. Sec. Credit Facilities 1st Lien | | | | |
Term Loan, Tranche B, 3.989% [LIBOR12+275], 5/15/244 | | 140,000 | | 141,137 |
NPC International, Inc., Sr. Sec. Credit Facilities 1st Lien Term Loan, 4.742% [LIBOR12+350], 4/19/244 | | 54,863 | | 55,274 |
NRG Energy, Inc., Sr. Sec. Credit Facilities 1st Lien Term Loan, | | | | |
Tranche B, 3.583% [LIBOR4+225], 6/30/234,9 | | 700,238 | | 702,429 |
OCI Beaumont LLC, Sr. Sec. Credit Facilities 1st Lien Term Loan, | | | | |
Tranche B, 8.064% [LIBOR4+675], 8/20/194 | | 144,424 | | 146,651 |
ON Semiconductor Corp., Sr. Sec. Credit Facilities 1st Lien Term | | | | |
Loan, Tranche B, 3.492% [LIBOR12+225], 3/31/234 | | 68,105 | | 68,485 |
Opal Acquisition, Inc., Sr. Sec. Credit Facilities 1st Lien Term Loan, | | | | |
Tranche B, 5.147%-5.335% [LIBOR4+400], 11/27/204 | | 258,702 | | 249,971 |
Orchard Acquisition Co. LLC, Sr. Sec. Credit Facilities 1st Lien Term | | | | |
Loan, Tranche B, 7.313% [LIBOR4+600], 2/8/194 | | 406,682 | | 194,529 |
35 OPPENHEIMER FUNDAMENTAL ALTERNATIVES FUND
CONSOLIDATED STATEMENT OF INVESTMENTS Continued
| | | | |
| | | Principal Amount | | Value |
Corporate Loans (Continued) | | | | |
Ortho-Clinical Diagnostics, Inc., Sr. Sec Credit Facilities 1st Lien Term | | | | |
Loan, Tranche B, 4.783% [LIBOR4+375], 6/30/214 | | $ 213,058 | | $ 214,145 |
Outfront Media Capital LLC, Sr. Sec. Credit Facilities 1st Lien Term | | | | |
Loan, Tranche B, 3.489% [LIBOR4+225], 3/18/244,9 | | 95,000 | | 95,806 |
PAREXEL International Corp., Sr. Sec. Credit Facilities 1st Lien Term | | | | |
Loan, Tranche B, 4.311% [LIBOR4+300], 9/27/244,9 | | 15,000 | | 15,165 |
Party City Holdings, Inc., Sr. Sec. Credit Facilities 1st Lien Term Loan, | | | | |
Tranche B, 4.05%-4.58% [LIBOR4+300], 8/19/224 | | 298,650 | | 299,770 |
Peabody Energy Corp., Sr. Sec. Credit Facilities 1st Lien Exit Term | | | | |
Loan, 4.742% [LIBOR12+350], 3/31/224 | | 156,401 | | 157,672 |
Penn National Gaming, Inc., Sr. Sec. Credit Facilities 1st Lien Term | | | | |
Loan, Tranche B, 3.742% [LIBOR12+250], 1/19/244 | | 49,750 | | 50,065 |
Petco Animal Supplies, Inc., Sr. Sec. Credit Facilities 1st Lien Term | | | | |
Loan, Tranche B1, 4.38% [LIBOR4+300], 1/26/234 | | 346,019 | | 285,811 |
PetSmart, Inc., Sr. Sec. Credit Facilities 1st Lien Term Loan, Tranche B, 4.24% [LIBOR12+300], 3/11/224 | | 560,923 | | 483,358 |
PGX Holdings, Inc., Sr. Sec. Credit Facilities 1st Lien Term Loan, 6.50% [LIBOR12+525], 9/29/204 | | 191,279 | | 191,279 |
PGX Holdings, Inc., Sr. Sec. Credit Facilities 2nd Lien Term Loan, 10.23% [LIBOR12+900], 9/29/212,4 | | 71,202 | | 70,490 |
Pinnacle Foods Finance LLC, Sr. Sec. Credit Facilities 1st Lien Term | | | | |
Loan, Tranche B, 3.232% [LIBOR12+200], 2/2/244,9 | | 370,000 | | 372,243 |
Plastipak Holdings, Inc., Sr. Sec. Credit Facilities 1st Lien Term Loan, | | | | |
Tranche B, 4.08% [LIBOR4+275], 10/5/244,9 | | 110,000 | | 110,940 |
Polycom, Inc., Sr. Sec. Credit Facilities 1st Lien Term Loan, 6.487% -6.492% [LIBOR12+525], 9/27/234 | | 137,653 | | 139,489 |
Post Holdings, Inc., Sr. Sec. Credit Facilities 1st Lien Term Loan, | | | | |
Tranche B, 3.492% [LIBOR12+225], 5/24/244 | | 389,025 | | 391,189 |
Premiere Global Services, Inc., Sr. Sec. Credit Facilities 1st Lien Term | | | | |
Loan, 7.50% [LIBOR6+650], 12/8/214 | | 67,899 | | 65,438 |
Prestige Brands, Inc., Sr. Sec. Credit Facilities 1st Lien Term Loan, | | | | |
Tranche B4, 3.992% [LIBOR12+275], 1/26/244 | | 140,000 | | 141,039 |
Quest Software US Holdings, Inc., Sr. Sec. Credit Facilities 1st Lien | | | | |
Term Loan, 7.38% [LIBOR12+600], 10/31/224 | | 222,982 | | 225,816 |
Quikrete Holdings, Inc., Sr. Sec. Credit Facilities 1st Lien Term Loan, 3.992% [LIBOR12+275], 11/15/234 | | 471,487 | | 472,666 |
Radiate Holdco LLC, Sr. Sec. Credit Facilities 1st Lien Term Loan, 4.242% [LIBOR12+300], 2/1/244 | | 477,600 | | 473,458 |
RBS Global, Inc., Sr. Sec. Credit Facilities 1st Lien Term Loan, Tranche | | | | |
B, 3.903%-4.115% [LIBOR4+275], 8/21/234 | | 216,365 | | 217,930 |
Realogy Group LLC, Sr. Sec. Credit Facilities 1st Lien Term Loan, | | | | |
Tranche B, 3.492% [LIBOR12+225], 7/20/224 | | 227,134 | | 228,719 |
Red Ventures LLC, Sr. Sec. Credit Facilities 1st Lien Term Loan, | | | | |
Tranche B, 5.328% [LIBOR4+400], 10/18/244,9 | | 285,000 | | 283,397 |
Refresco Group NV, Sr. Sec. Credit Facilities 1st Lien Term Loan, | | | | |
Tranche B, 4.067% [LIBOR4+275], 9/26/244,9 | | 60,000 | | 60,450 |
Revlon Consumer Products Corp., Sr. Sec. Credit Facilities 1st Lien | | | | |
Term Loan, Tranche B, 4.742% [LIBOR12+350], 9/7/234 | | 410,850 | | 356,156 |
Reynolds Group Holdings, Inc., Sr. Sec. Credit Facilities 1st Lien Term | | | | |
Loan, 3.992% [LIBOR12+300], 2/5/234 | | 411,807 | | 414,588 |
36 OPPENHEIMER FUNDAMENTAL ALTERNATIVES FUND
| | | | |
| | | Principal Amount | | Value |
Corporate Loans (Continued) | | | | |
RHP Hotel Properties LP, Sr. Sec. Credit Facilities 1st Lien Term Loan, | | | | |
Tranche B, 3.56% [LIBOR4+225], 5/11/244 | | $ 54,725 | | $ 55,183 |
Rite Aid Corp., Sr. Sec. Credit Facilities 2nd Lien Term Loan, Tranche 1, 6.00% [LIBOR12+475], 8/21/204 | | 63,202 | | 63,992 |
Riverbed Technology, Inc., Sr. Sec. Credit Facilities 1st Lien Term | | | | |
Loan, Tranche B, 4.50% [LIBOR12+325], 4/24/224 | | 243,750 | | 236,220 |
Road Infrastructure Investment LLC, Sr. Sec. Credit Facilities 1st Lien | | | | |
Term Loan, Tranche B, 4.739% [LIBOR12+350], 6/13/234 | | 99,000 | | 99,907 |
Sable International Finance Ltd., Sr. Sec. Credit Facilities 1st Lien | | | | |
Term Loan, Tranche B3, 4.742% [LIBOR12+350], 1/31/254 | | 170,000 | | 170,651 |
Sabre GLBL, Inc., Sr. Sec. Credit Facilities 1st Lien Term Loan, Tranche | | | | |
B, 3.492% [LIBOR12+225], 2/22/244 | | 421,593 | | 424,096 |
Sandy Creek Energy Associates LP, Sr. Sec. Credit Facilities 1st Lien | | | | |
Term Loan, Tranche B, 5.333% [LIBOR4+400], 11/9/204 | | 442,254 | | 382,550 |
SBA Senior Finance II LLC, Sr. Sec. Credit Facilities 1st Lien Term | | | | |
Loan, 3.50% [LIBOR12+225], 3/24/214 | | 148,846 | | 149,673 |
SBA Senior Finance II LLC, Sr. Sec. Credit Facilities 1st Lien Term | | | | |
Loan, 3.49% [LIBOR12+225], 6/10/224 | | 119,086 | | 119,641 |
Science Applications International Corp., Sr. Sec. Credit Facilities 1st | | | | |
Lien Term Loan, Tranche B, 3.813% [LIBOR4+250], 5/4/224 | | 135,000 | | 136,139 |
Scientific Games International, Inc., Sr. Sec. Credit Facilities 1st Lien | | | | |
Term Loan, Tranche B4, 4.814% [LIBOR4+350], 8/14/244,9 | | 450,000 | | 455,766 |
Seadrill Operating LP, Sr. Sec. Credit Facilities 1st Lien Term Loan, | | | | |
Tranche B, 4.333% [LIBOR4+300], 2/21/214 | | 452,891 | | 346,272 |
Seattle SpinCo, Inc., Sr. Sec. Credit Facilities 1st Lien Term Loan, | | | | |
Tranche B, 3.988% [LIBOR12+275], 6/21/244 | | 549,888 | | 551,017 |
SeaWorld Parks & Entertainment, Inc., Sr. Sec. Credit Facilities 1st | | | | |
Lien Term Loan, Tranche B5, 4.333% [LIBOR4+300], 4/1/244 | | 95,752 | | 94,455 |
Securus Technologies Holdings, Inc., Sr. Sec. Credit Facilities 1st Lien Term Loan: | | |
Tranche B, 4.75%, [LIBOR52+350], 4/30/204 | | 194,704 | | 194,948 |
Tranche B2, 5.453%, [LIBOR52+425], 4/30/204 | | 9,624 | | 9,636 |
Select Medical Corp., Sr. Sec. Credit Facilities 1st Lien Term Loan, | | | | |
Tranche B, 4.78%-6.75% [LIBOR4+350], 3/1/214 | | 84,575 | | 85,592 |
Serta Simmons Bedding LLC, Sr. Sec. Credit Facilities 1st Lien Term | | | | |
Loan, 4.679%-4.835% [LIBOR4+350], 11/8/234 | | 466,251 | | 461,200 |
SFR Group SA, Sr. Sec. Credit Facilities 1st Lien Term Loan: | | | | |
Tranche B, 4.13%, [LIBOR4+275], 7/31/254 | | 49,750 | | 49,773 |
Tranche B12, 4.336%, [LIBOR4+300], 1/5/264,9 | | 412,940 | | 413,902 |
Sheridan Investment Partners II LP, Sr. Sec. Credit Facilities 1st Lien | | | | |
Term Loan, Tranche B, 4.82% [LIBOR4+350], 12/16/204 | | 102,658 | | 87,259 |
Sheridan Production Partners II-A LP, Sr. Sec. Credit Facilities 1st Lien | | | | |
Term Loan, Tranche B, 4.82% [LIBOR4+350], 12/16/204 | | 14,330 | | 12,180 |
Sheridan Production Partners II-M LP, Sr. Sec. Credit Facilities 1st | | | | |
Lien Term Loan, Tranche B, 4.82% [LIBOR4+350], 12/16/204 | | 5,318 | | 4,520 |
SIG Combibloc US Acquisition, Inc., Sr. Sec. Credit Facilities 1st Lien | | | | |
Term Loan, Tranche B, 4.242% [LIBOR12+300], 3/11/224 | | 268,549 | | 270,365 |
Signode Industrial Group US, Inc., Sr. Sec. Credit Facilities 1st Lien | | | | |
Term Loan, Tranche B, 3.897%-3.992% [LIBOR4+275], 5/1/214 | | 202,480 | | 204,505 |
Sinclair Television Group, Inc., Sr. Sec. Credit Facilities 1st Lien Term | | | | |
Loan, Tranche B2, 3.50% [LIBOR12+225], 1/3/244 | | 463,705 | | 465,444 |
37 OPPENHEIMER FUNDAMENTAL ALTERNATIVES FUND
CONSOLIDATED STATEMENT OF INVESTMENTS Continued
| | | | |
| | | Principal Amount | | Value |
Corporate Loans (Continued) | | | | |
SolarWinds Holdings, Inc., Sr. Sec. Credit Facilities 1st Lien Term | | | | |
Loan, 4.742% [LIBOR4+350], 2/3/234,9 | | $ 140,000 | | $ 140,984 |
Solera LLC, Sr. Sec. Credit Facilities 1st Lien Term Loan, Tranche B, 4.492% [LIBOR12+325], 3/3/234 | | 74,433 | | 75,043 |
Southcross Energy Partners LP, Sr. Sec. Credit Facilities 1st Lien Term | | | | |
Loan, Tranche B, 5.583% [LIBOR4+425], 8/4/214 | | 199,914 | | 174,175 |
Sprint Communications, Inc.,Sr. Sec. Credit Facilities 1st Lien Term | | | | |
Loan, Tranche B, 3.75% [LIBOR4+250], 2/2/244 | | 280,000 | | 281,150 |
Staples, Inc., Sr. Sec. Credit Facilities 1st Lien Term Loan, 5.31% | | | | |
[LIBOR4+400], 9/12/244,9 | | 525,000 | | 496,542 |
Station Casinos LLC, Sr. Sec. Credit Facilities 1st Lien Term Loan, | | | | |
Tranche B, 3.74% [LIBOR12+250], 6/8/234 | | 420,934 | | 422,776 |
Superior Industries International, Inc., Sr. Sec. Credit Facilities 1st | | | | |
Lien Term Loan, Tranche B, 5.739% [LIBOR12+450], 3/22/244 | | 184,524 | | 186,139 |
SUPERVALU, Inc., Sr. Sec. Credit Facilities 1st Lien Term Loan, | | | | |
Tranche B, 4.742% [LIBOR12+350], 6/8/244 | | 164,175 | | 159,496 |
Surgery Center Holdings, Inc., Sr. Sec. Credit Facilities 1st Lien Term | | | | |
Loan, 4.50% [LIBOR4+325], 9/2/244,9 | | 125,000 | | 124,344 |
Synchronoss Technologies, Inc., Sr. Sec. Credit Facilities 1st Lien Term | | | | |
Loan, Tranche B, 5.742% [LIBOR12+450], 1/19/244 | | 169,113 | | 169,192 |
Talen Energy Supply LLC, Sr. Sec. Credit Facilities 1st Lien Term Loan, | | | | |
Tranche B, 5.242% [LIBOR12+400], 7/15/234 | | 287,567 | | 287,477 |
Team Health Holdings, Inc., Sr. Sec. Credit Facilities 1st Lien Term | | | | |
Loan, Tranche B, 3.992% [LIBOR12+275], 2/6/244 | | 238,800 | | 236,810 |
Technicolor SA, Sr. Sec. Credit Facilities 1st Lien Term Loan, Tranche | | | | |
B, 4.067% [LIBOR4+275], 12/6/234 | | 129,350 | | 129,876 |
Telenet Financing USD LLC, Sr. Sec. Credit Facilities 1st Lien Term | | | | |
Loan, Tranche AI, 3.989% [LIBOR12+275], 6/30/254 | | 385,000 | | 386,978 |
Telesat Canada, Sr. Sec. Credit Facilities 1st Lien Term Loan, Tranche | | | | |
B, 4.32% [LIBOR4+300], 11/17/234 | | 90,000 | | 90,884 |
Tempo Acquisition LLC, Sr. Sec. Credit Facilities 1st Lien Term Loan, | | | | |
Tranche B, 4.235% [LIBOR12+300], 5/1/244 | | 417,953 | | 419,824 |
Tessera Holding Corp., Sr. Sec. Credit Facilities 1st Lien Term Loan, | | | | |
Tranche B, 4.492% [LIBOR12+325], 12/1/234 | | 297,750 | | 300,666 |
TI Group Automotive Systems LLC, Sr. Sec. Credit Facilities 1st Lien | | | | |
Term Loan, Tranche B, 3.992% [LIBOR12+275], 6/30/224 | | 458,306 | | 460,455 |
Tower Automotive Holdings USA LLC, Sr. Sec. Credit Facilities 1st | | | | |
Lien Term Loan, Tranche B, 4.00% [LIBOR12+275], 3/7/244 | | 279,328 | | 281,074 |
TransDigm, Inc., Sr. Sec. Credit Facilities 1st Lien Term Loan, Tranche | | | | |
F, 4.242% [LIBOR12+300], 6/9/234 | | 10,976,914 | | 11,037,166 |
Travelport Finance Luxembourg Sarl, Sr. Sec. Credit Facilities 1st Lien | | | | |
Term Loan, Tranche D, 4.061% [LIBOR4+275], 9/2/214 | | 710,225 | | 712,076 |
Traverse Midstream Partners LLC, Sr. Sec. Credit Facilities 1st Lien | | | | |
Term Loan, 5.33% [LIBOR4+400], 9/27/244 | | 105,000 | | 106,719 |
Tribune Media Co., Sr. Sec. Credit Facilities 1st Lien Term Loan, | | | | |
Tranche B, 4.242% [LIBOR12+300], 1/26/244 | | 354,132 | | 355,755 |
Trinseo Materials Operating SCA, Sr. Sec. Credit Facilities 1st Lien | | | | |
Term Loan, 3.742% [LIBOR4+250], 9/6/244 | | 35,000 | | 35,335 |
Tronox Blocked Borrower LLC, Sr. Sec. Credit Facilities 1st Lien Term | | | | |
Loan, Tranche B, 4.328% [LIBOR4+300], 9/23/244,9 | | 154,567 | | 155,605 |
38 OPPENHEIMER FUNDAMENTAL ALTERNATIVES FUND
| | | | |
| | | Principal Amount | | Value |
Corporate Loans (Continued) | | | | |
Tronox Finance LLC, Sr. Sec. Credit Facilities 1st Lien Term Loan, Tranche B, 4.328% [LIBOR4+300], 9/23/244,9 | | $ 356,850 | | $ 359,248 |
TTM Technologies, Inc., Sr. Sec. Credit Facilities 1st Lien Term Loan, 3.742% [LIBOR4+250], 9/28/244 | | 75,000 | | 75,750 |
Tumi Holdings, Inc., Sr. Sec. Credit Facilities 1st Lien Term Loan, Tranche B, 3.492% [LIBOR12+225], 8/1/234,9 | | 230,000 | | 231,833 |
Ultra Resources, Inc., Sr. Sec. Credit Facilities 1st Lien Exit Term Loan, 4.309% [LIBOR4+300], 4/12/244 | | 170,000 | | 170,496 |
United Airlines, Inc., Sr. Sec. Credit Facilities 1st Lien Term Loan, Tranche B, 3.63% [LIBOR4+225], 4/1/244 | | 134,325 | | 135,114 |
Uniti Group, Inc., Sr. Sec. Credit Facilities 1st Lien Term Loan, 4.242% [LIBOR12+300], 10/24/224 | | 411,888 | | 396,054 |
Unitymedia Finance LLC, Sr. Sec. Credit Facilities 1st Lien Term Loan, Tranche D, 3.604% [LIBOR4+225], 10/19/264,9 | | 200,000 | | 199,729 |
Univar USA, Inc., Sr. Sec. Credit Facilities 1st Lien Term Loan, Tranche B, 3.992% [LIBOR12+275], 7/1/224 | | 410,954 | | 413,202 |
Univision Communications, Inc., Sr. Sec. Credit Facilities 1st Lien Term Loan, Tranche C5, 3.992% [LIBOR12+275], 3/15/244 | | 628,442 | | 626,228 |
UPC Financing Partnership, Sr. Sec. Credit Facilities 1st Lien Term Loan, Tranche AR, 3.857% [LIBOR4+250], 1/15/264,9 | | 381,000 | | 382,714 |
USI, Inc., Sr. Sec. Credit Facilities 1st Lien Term Loan, Tranche B, 4.18% [LIBOR4+300], 5/16/244 | | 205,000 | | 205,487 |
Valeant Pharmaceuticals International, Inc., Sr. Sec. Credit Facilities 1st Lien Term Loan, Tranche BF1, 5.99% [LIBOR4+475], 4/1/224,9 | | 75,677 | | 77,228 |
VC GB Holdings, Inc., Sr. Sec. Credit Facilities 1st Lien Term Loan, 4.992% [LIBOR12+375], 2/28/244 | | 139,314 | | 140,359 |
Veritas US, Inc., Sr. Sec. Credit Facilities 1st Lien Term Loan, Tranche B1, 5.833% [LIBOR4+450], 1/27/234 | | 276,407 | | 279,949 |
Vertiv Intermediate Holding II Corp., Sr. Sec. Credit Facilities 1st Lien Term Loan, Tranche B, 5.242% [LIBOR12+400], 11/30/234 | | 362,877 | | 364,574 |
VICI Properties 1 LLC, Sr. Sec. Credit Facilities 1st Lien Term Loan, 4.738% [LIBOR4+350], 10/15/224 | | 100,112 | | 100,310 |
Virgin Media Bristol LLC, Sr. Sec. Credit Facilities 1st Lien Term Loan, Tranche I, 3.989% [LIBOR12+275], 1/31/254 | | 450,000 | | 452,215 |
Visteon Corp., Sr. Sec. Credit Facilities 1st Lien Term Loan, Tranche B, 3.279%-3.407% [LIBOR4+225], 3/24/244 | | 95,307 | | 95,923 |
Vistra Operations Co. LLC, Sr. Sec. Credit Facilities 1st Lien Term Loan: Tranche B, 3.992%-4.084% [LIBOR12+275], 8/4/234 | | 378,673 | | 380,383 |
Tranche C, 4.084%, [LIBOR12+275], 8/4/234 | | 87,073 | | 87,454 |
WaveDivision Holdings LLC, Sr. Sec. Credit Facilities 1st Lien Term Loan, 4.14% [LIBOR6+275], 10/15/194 | | 354,079 | | 354,787 |
Weight Watchers International, Inc., Sr. Sec. Credit Facilities 1st Lien Term Loan, Tranche B2, 4.49%-4.59% [LIBOR12+325], 4/2/204 | | 1,445,622 | | 1,435,141 |
Wencor Group, Sr. Sec. Credit Facilities 1st Lien Term Loan, 4.833% [LIBOR4+350], 6/19/214 | | 59,981 | | 58,669 |
Western Digital Corp., Sr. Sec. Credit Facilities 1st Lien Term Loan, Tranche B, 3.99% [LIBOR12+275], 4/29/234 | | 414,766 | | 417,747 |
Western Express, Inc., Sr. Sec. Credit Facilities 2nd Lien Term Loan, 9.567% [LIBOR4+825], 2/23/222,4 | | 982,800 | | 997,444 |
39 OPPENHEIMER FUNDAMENTAL ALTERNATIVES FUND
CONSOLIDATED STATEMENT OF INVESTMENTS Continued
| | | | | | | | |
| | | Principal Amount | | | Value | |
Corporate Loans (Continued) | | | | | | | | |
WideOpenWest Finance LLC, Sr. Sec. Credit Facilities 1st Lien Term Loan, Tranche B, 4.487% [LIBOR12+325], 8/18/234 | | $ | 405,000 | | | $ | 405,976 | |
William Morris Endeavor Entertainment LLC, Sr. Sec. Credit Facilities 1st Lien Term Loan, 4.64% [LIBOR12+325], 5/6/214 | | | 302,712 | | | | 305,297 | |
Windstream Services LLC, Sr. Sec. Credit Facilities 1st Lien Term Loan, Tranche B6, 5.24% [LIBOR12+400], 3/29/214 | | | 163,836 | | | | 153,955 | |
WMG Acquisition Corp., Sr. Sec. Credit Facilities 1st Lien Term Loan, 3.738% [LIBOR12+250], 11/1/234 | | | 224,697 | | | | 226,001 | |
WP CPP Holdings LLC, Sr. Sec. Credit Facilities 1st Lien Term Loan, 4.88% [LIBOR4+350], 12/28/194 | | | 98,205 | | | | 96,118 | |
XPO Logistics, Inc., Sr. Sec. Credit Facilities 1st Lien Term Loan, Tranche B, 3.599% [LIBOR4+225], 11/1/214 | | | 709,000 | | | | 713,876 | |
Ziggo Secured Finance Partnership, Sr. Sec. Credit Facilities 1st Lien Term Loan, Tranche E, 3.739% [LIBOR12+250], 4/15/254 | | | 235,000 | | | | 235,783 | |
Total Corporate Loans (Cost $121,115,117) | | | | | | | 119,811,723 | |
| | | | | | | | |
| | | Shares | | | | |
Structured Security—–% | | | | | | | | |
Africa Telecommunications Media & Technology Fund 1 LLC1,5 (Cost $10,000,000) | | | 9,542,930 | | | | — | |
| | | | | | | | | | | | | | | | | | | | | | | | |
| | | | | | | Exercise Price | | | Expiration Date | | | Notional
Amount
(000’s) | | | Contracts
(000’s) | | | | |
Exchange-Traded Option Purchased—0.4% | | | | | | | | | | | | | | | | | |
S&P 500 Index Call1 (Cost $2,209,862) | | | | | USD 2,575.000 | | | | 1/19/18 | | | | USD 274,523 | | | | USD 1 | | | | 4,583,800 | |
| | | | | Counter- party | | | | | | | | | | | | | | | |
| | | | | | | | | | | | | | | | | | |
Over-the-Counter Option Purchased—0.0% | | | |
CNH Currency Put1 (Cost $1,886,660) | | | CITNA-B | | | | CNH7.300 | | | 11/29/17 | | CNH 2,133,100 | | | CNH 608,600 | | | 1,217 |
| | | | | | | | | | | | | | | | | | | | | | | | | | | | | | | | |
| | | | | | Pay/Receive
Floating
Rate | | | Floating
Rate | | | Fixed
Rate | | | Expiration
Date | | | | | | Notional
Amount
(000’s) | | | | |
Over-the-Counter Interest Rate Swaptions Purchased—0.2% | | | | | | | | | | | | | |
Interest | | | | | | | | | | | | | | | | | | | | | | | | | | | | | | | | |
Rate Swap | | | | | | | | | | | Six-Month | | | | | | | | | | | | | | | | | | | | | |
maturing | | | | | | | | | | | JPY BBA | | | | | | | | | | | | | | | | | | | | | |
1/24/29 Call1 | | | GSCOI | | | | Receive | | | | LIBOR | | | | 0.708 | % | | | 1/22/19 | | | | JPY | | | | 795,000 | | | | 24,222 | |
Interest | | | | | | | | | | | | | | | | | | | | | | | | | | | | | | | | |
Rate Swap | | | | | | | | | | | Three- | | | | | | | | | | | | | | | | | | | | | |
maturing | | | | | | | | | | | Month USD | | | | | | | | | | | | | | | | | | | | | |
1/28/30 Call1 | | | GSCOI | | | | Receive | | | | BBA LIBOR | | | | 2.974 | | | | 1/24/20 | | | | USD | | | | 94,000 | | | | 2,376,268 | |
Interest | | | | | | | | | | | | | | | | | | | | | | | | | | | | | | | | |
Rate Swap | | | | | | | | | | | Six-Month | | | | | | | | | | | | | | | | | | | | | |
maturing | | | | | | | | | | | JPY BBA | | | | | | | | | | | | | | | | | | | | | |
11/21/28 Call1 | | | GSCOI | | | | Receive | | | | LIBOR | | | | 0.850 | | | | 11/19/18 | | | | JPY | | | | 749,000 | | | | 9,662 | |
40 OPPENHEIMER FUNDAMENTAL ALTERNATIVES FUND
| | | | | | | | | | | | | | | | |
| | | Counter-
party | | Pay/Receive
Floating
Rate | | Floating
Rate | | Fixed Rate | | Expiration
Date | | | | Notional Amount (000’s) | | Value |
Over-the-Counter Interest Rate Swaptions Purchased (Continued) |
Interest | | | | | | | | | | | | | | | | |
Rate Swap | | | | | | Six-Month | | | | | | | | | | |
maturing | | | | | | JPY BBA | | | | | | | | | | |
11/22/27 Call1 | | GSCOI | | Receive | | LIBOR | | 1.070% | | 11/20/17 | | JPY | | 8,024,000 | | $ — |
Interest | | | | | | | | | | | | | | | | |
Rate Swap | | | | | | Six-Month | | | | | | | | | | |
maturing | | | | | | JPY BBA | | | | | | | | | | |
7/25/28 Call1 | | GSCOI | | Receive | | LIBOR | | 1.050 | | 7/23/18 | | JPY | | 2,000,000 | | 2,306 |
| | | | | | | | | | | | | | | | |
Total Over-the-Counter Interest Rate Swaptions Purchased (Cost $6,409,136) | | | | | | | | 2,412,458 |
| | | | |
| | | Principal Amount | | |
Short-Term Notes—6.3% | | | | |
Agrium, Inc., 1.534%, 12/12/1712,13 | | $ 2,500,000 | | 2,495,873 |
Air Liquide US LLC, 1.453%, 12/22/177,12,13 | | 2,700,000 | | 2,695,449 |
Ameren Illinois Co., 1.412%, 11/2/1713 | | 2,500,000 | | 2,499,812 |
Assa Abloy Financial AB, 1.482%, 11/20/177,12,13 | | 2,400,000 | | 2,398,149 |
Bell Canada, 1.506%, 11/29/1712,13 | | 1,700,000 | | 1,697,995 |
Bell Canada, 1.538%, 1/18/1812,13 | | 1,000,000 | | 996,623 |
CenterPoint Energy Resources Corp., 1.536%, 1/18/187,12,13 | | 2,700,000 | | 2,691,065 |
Deutsche Telekom International Finance BV, 1.573%, 1/25/1813 | | 1,100,000 | | 1,095,648 |
Dollar General Corp., 1.501%, 11/3/177,12,13 | | 2,500,000 | | 2,499,688 |
Duke Energy Corp., 1.475%, 1/2/187,12,13 | | 1,900,000 | | 1,895,162 |
Eni Finance USA, Inc., 1.968%, 10/5/1812,13 | | 2,500,000 | | 2,455,789 |
ERAC USA Finance LLC, 1.422%, 11/8/1712,13 | | 2,500,000 | | 2,499,241 |
Ford Motor Credit Co. LLC, 1.989%, 8/20/1812,13 | | 2,300,000 | | 2,263,329 |
Glencore Funding LLC, 1.617%, 1/18/1812,13 | | 2,700,000 | | 2,690,230 |
Hitachi Capital America Corp., 1.532%, 11/27/1713 | | 2,700,000 | | 2,697,177 |
HP, Inc., 1.715%, 3/22/1813 | | 2,400,000 | | 2,387,277 |
Interpublic Group of Cos., Inc., 1.473%, 12/11/177,12,13 | | 2,600,000 | | 2,595,816 |
Leggett & Platt, Inc., 1.402%, 11/13/177,12,13 | | 2,500,000 | | 2,498,754 |
Marriott International, 1.493%, 12/13/177,12,13 | | 2,700,000 | | 2,695,430 |
McKesson Corp., 1.402%, 11/2/177,12,13 | | 2,500,000 | | 2,499,812 |
Mondelez International, Inc., 1.495%, 1/9/1812,13 | | 2,700,000 | | 2,692,240 |
Omnicom Capital, Inc., 1.452%, 11/13/1712,13 | | 2,300,000 | | 2,298,854 |
Puget Sound Energy, Inc, 1.463%, 11/8/1713 | | 2,700,000 | | 2,699,180 |
Reckitt Benckiser Treasury Services plc, 1.403%, 11/30/1712,13 | | 2,600,000 | | 2,597,368 |
Sempra Energy, 1.443%, 11/8/1712,13 | | 600,000 | | 599,818 |
Southern Co. (The), 1.432%, 11/2/177,12,13 | | 2,500,000 | | 2,499,812 |
Telus Corp., 1.526%, 2/1/187,13 | | 2,489,000 | | 2,479,008 |
Thomson Reuters Corp., 1.454%, 11/13/1713 | | 2,400,000 | | 2,398,749 |
Toyota Motor Credit Corp., 1.671%, 7/23/1813 | | 2,600,000 | | 2,569,435 |
TransCanada PipeLines Ltd., 1.454%, 12/27/177,12,13 | | 1,200,000 | | 1,197,264 |
United Technologies Corp., 1.412%, 11/6/177,12,13 | | 2,300,000 | | 2,299,477 |
Vodafone Group plc, 1.749%, 9/13/1813 | | 2,600,000 | | 2,556,386 |
Whirlpool Corp., 1.403%, 11/27/1713 | | 2,700,000 | | 2,697,177 |
41 OPPENHEIMER FUNDAMENTAL ALTERNATIVES FUND
CONSOLIDATED STATEMENT OF INVESTMENTS Continued
| | | | |
| | | Principal Amount | | Value |
Short-Term Notes (Continued) | | | | |
WPP CP Finance plc, 1.714%, 2/12/187,12,13 | | $ 2,700,000 | | $ 2,687,621 |
| | | | |
Total Short-Term Notes (Cost $78,519,488) | | | | 78,520,708 |
| | | Shares | | |
Investment Companies—5.2% | | | | |
Oppenheimer Institutional Government Money Market Fund, Cl. E, 1.01%14,15 | | 25,711,488 | | 25,711,488 |
SPDR Gold Trust Exchange Traded Fund1,16 | | 324,890 | | 39,204,476 |
| | | | |
Total Investment Companies (Cost $64,428,298) | | | | 64,915,964 |
Total Investments, at Value (Cost $1,085,767,984) | | 100.3% | | 1,255,457,322 |
Net Other Assets (Liabilities) | | (0.3) | | (3,918,705) |
| | |
Net Assets | | 100.0% | | $ 1,251,538,617 |
| | |
Footnotes to Consolidated Statement of Investments
1. Non-income producing security.
2. The value of this security was determined using significant unobservable inputs. See Note 3 of the accompanying Consolidated Notes.
3. All or portion of the security position is held in segregated accounts and pledged to cover margin requirements with respect to securities sold short. The aggregate market value of such securities is $72,563,840. See Note 4 of accompanying Consolidated Notes.
4. Represents the current interest rate for a variable or increasing rate security, determined as [Referenced Rate + Basis-point spread].
5. Restricted security. The aggregate value of restricted securities at period end was $18,676,994, which represents 1.49% of the Fund’s net assets. See Note 4 of the accompanying Consolidated Notes. Information concerning restricted securities is as follows:
| | | | | | | | |
| Security | | Acquisition Dates | | Cost | | Value | | Unrealized
Appreciation/
(Depreciation) |
Africa Telecommunications Media & | | | | | | | | |
Technology Fund 1 LLC | | 4/20/11 | | $ 10,000,000 | | $ — | | $ (10,000,000) |
Clearwire Communications | | | | | | | | |
LLC/Clearwire Finance, Inc., 8.25% Cv. | | | | | | | | |
Sr. Unsec. Nts., 12/1/40 | | 12/20/16 | | 6,575,827 | | 6,615,500 | | 39,673 |
Raspro Trust, Series 2005-1A, Cl. G, 1.725% [LIBOR03M+40], 3/23/24 | | 2/9/16 | | 11,928,926 | | 12,061,494 | | 132,568 |
| | | | |
| | | | $ 28,504,753 | | $ 18,676,994 | | $ (9,827,759) |
| | | | |
6. This interest rate resets periodically. Interest rate shown reflects the rate in effect at period end. The rate on this variable rate security is not based on a published reference rate and spread but is determined by the issuer or agent based on current market conditions.
7. Represents securities sold under Rule 144A, which are exempt from registration under the Securities Act of 1933, as amended. These securities have been determined to be liquid under guidelines established by the Board of Trustees. These securities amount to $77,244,825 or 6.17% of the Fund’s net assets at period end.
8. This bond has no contractual maturity date, is not redeemable and contractually pays an indefinite stream of interest.
9. All or a portion of the security position is when-issued or delayed delivery to be delivered and settled after period end. See Note 4 of the accompanying Consolidated Notes.
10. This security is not accruing income because its issuer has missed or is expected to miss interest and/or principal payments. The rate shown is the contractual interest rate. See Note 4 of the accompanying Consolidated Notes.
11. Interest or dividend is paid-in-kind, when applicable.
42 OPPENHEIMER FUNDAMENTAL ALTERNATIVES FUND
Footnotes to Consolidated Statement of Investments (Continued)
12. Security issued in an exempt transaction without registration under the Securities Act of 1933. Such securities amount to $54,440,859 or 4.35% of the Fund’s net assets, and have been determined to be liquid pursuant to guidelines adopted by the Board of Trustees.
13. Current yield as of period end.
14. Is or was an affiliate, as defined in the Investment Company Act of 1940, as amended, at or during the reporting period, by virtue of the Fund owning at least 5% of the voting securities of the issuer or as a result of the Fund and the issuer having the same investment adviser. Transactions during the reporting period in which the issuer was an affiliate are as follows:
| | | | | | | | |
| | | Shares October 31, 2016 | | Gross Additions | | Gross Reductions | | Shares October 31, 2017 |
Oppenheimer Institutional | | | | | | | | |
Government Money Market Fund, | | | | | | | | |
Cl. E | | 149,404,417 | | 720,077,834 | | 843,770,763 | | 25,711,488 |
| | | Value | | Income | | Realized
Gain (Loss) | | Change in
Unrealized
Gain (Loss) |
Oppenheimer Institutional | | | | | | | | |
Government Money Market Fund, | | | | | | | | |
Cl. E | | $ 25,711,488 | | $ 194,525 | | $ — | | $ — |
15. Rate shown is the 7-day yield at period end.
16. All or a portion of this security is owned by the subsidiary. See Note 2 of the accompanying Consolidated Notes.
| | | | |
| | | Shares Sold
Short | | Value |
Securities Sold Short—(28.8)% | | | | |
Common Stock Securities Sold Short—(28.8)% | | | | |
AGCO Corp. | | (142,130) | | $ (9,745,854) |
Air Lease Corp., Cl. A | | (128,322) | | (5,575,591) |
Aircastle Ltd. | | (262,765) | | (6,111,914) |
Aker Solutions ASA1 | | (702,200) | | (3,850,701) |
Ally Financial, Inc. | | (527,940) | | (13,795,072) |
AvalonBay Communities, Inc. | | (20,010) | | (3,628,413) |
Boeing Co. (The) | | (17,158) | | (4,426,421) |
Camden Property Trust | | (39,480) | | (3,602,155) |
Caterpillar, Inc. | | (58,720) | | (7,974,176) |
Church & Dwight Co., Inc. | | (100,420) | | (4,535,971) |
Cie Financiere Richemont SA | | (106,809) | | (9,858,744) |
CNH Industrial NV | | (387,640) | | (4,923,028) |
Colgate-Palmolive Co. | | (207,640) | | (14,628,238) |
Corning, Inc. | | (142,201) | | (4,452,313) |
Digital Realty Trust, Inc. | | (99,940) | | (11,836,894) |
Dril-Quip, Inc.1 | | (62,050) | | (2,612,305) |
Fastenal Co. | | (120,430) | | (5,656,597) |
Federal Realty Investment Trust | | (87,160) | | (10,504,523) |
Franklin Resources, Inc. | | (269,560) | | (11,356,563) |
General Mills, Inc. | | (165,640) | | (8,600,029) |
GlaxoSmithKline plc, Sponsored ADR | | (49,050) | | (1,786,891) |
HP, Inc. | | (558,440) | | (12,034,382) |
Intel Corp. | | (366,429) | | (16,668,855) |
43 OPPENHEIMER FUNDAMENTAL ALTERNATIVES FUND
CONSOLIDATED STATEMENT OF INVESTMENTS Continued
| | | | |
| | | Shares Sold
Short | | Value |
Common Stock Securities Sold Short (Continued) | | | | |
International Business Machines Corp. | | (82,050) | | $ (12,640,623) |
Jones Lang LaSalle, Inc. | | (97,810) | | (12,665,417) |
Kirby Corp.1 | | (87,910) | | (6,228,424) |
Koninklijke Ahold Delhaize NV | | (753,205) | | (14,167,533) |
Neste OYJ | | (113,515) | | (6,323,818) |
Novo Nordisk AS, Sponsored ADR | | (52,730) | | (2,625,427) |
Pennsylvania Real Estate Investment Trust | | (1,164,930) | | (11,323,120) |
Procter & Gamble Co. (The) | | (163,270) | | (14,096,732) |
ResMed, Inc. | | (107,120) | | (9,017,362) |
Rio Tinto plc, Sponsored ADR | | (113,940) | | (5,461,144) |
RLJ Lodging Trust | | (158,684) | | (3,437,095) |
Rowan Cos. plc, Cl. A1 | | (216,600) | | (3,103,878) |
Sanofi, ADR | | (115,300) | | (5,451,384) |
SAP SE, Sponsored ADR | | (96,287) | | (10,995,975) |
Southern Copper Corp. | | (235,290) | | (10,105,706) |
Subsea 7 SA | | (250,453) | | (4,216,410) |
Transocean Ltd.1 | | (364,175) | | (3,823,838) |
W.W. Grainger, Inc. | | (27,705) | | (5,477,279) |
Wacker Chemie AG | | (51,497) | | (8,064,932) |
Weingarten Realty Investors | | (376,325) | | (11,459,096) |
Western Union Co. (The) | | (714,060) | | (14,181,232) |
William Demant Holding AS1 | | (237,346) | | (6,857,193) |
| | | | |
Total Securities Sold Short (Proceeds $335,524,220) | | | | $ (359,889,248) |
| | | | |
| | | | | | | | | | | | | | | | | | |
Forward Currency Exchange Contracts as of October 31, 2017 | | | | | |
Counter -party | | Settlement Month(s) | | Currency Purchased (000’s) | | Currency Sold (000’s) | | | Unrealized Appreciation | | Unrealized
Depreciation |
BOA | | 12/2017 | | USD | | 13,117 | | | CAD | | | | 15,950 | | | $ 748,604 | | $ — |
CITNA-B | | 11/2017 | | USD | | 197 | | | CNH | | | | 1,360 | | | — | | 7,711 |
CITNA-B | | 12/2017 | | USD | | 16,245 | | | JPY | | | | 1,750,000 | | | 822,566 | | — |
DEU | | 12/2017 | | EUR | | 8,570 | | | USD | | | | 10,351 | | | — | | 344,916 |
DEU | | 12/2017 | | NOK | | 26,900 | | | USD | | | | 3,479 | | | — | | 182,416 |
JPM | | 11/2017 | | USD | | 13,381 | | | CNH | | | | 95,000 | | | — | | 919,064 |
JPM | | 12/2017 | | USD | | 22,663 | | | THB | | | | 749,000 | | | 113,247 | | — |
TDB | | 12/2017 | | USD | | 17,246 | | | AUD | | | | 21,485 | | | 809,578 | | — |
| | | | | | | | | | | | | | | | |
Total Unrealized Appreciation and Depreciation | | | | | | | | | | $ 2,493,995 | | $ 1,454,107 |
| | | | | | | | | | | | | | | | |
| | | | | | | | | | | | |
Futures Contracts as of October 31, 2017 | | | | | | |
| Description | | Buy/Sell | | Expiration Date | | Number
of Contracts | | Notional Amount
(000’s) | | Value | | Unrealized
Appreciation
(Depreciation) |
Euro-BONO | | Sell | | 12/7/17 | | 116 | | EUR 18,663 | | $ 18,844,197 | | $ (181,517) |
Euro-BTP | | Sell | | 12/7/17 | | 195 | | EUR 30,790 | | 31,707,275 | | (917,005) |
Euro-BUND | | Buy | | 12/7/17 | | 326 | | EUR 61,655 | | 61,802,863 | | 147,604 |
Euro-OAT | | Sell | | 12/7/17 | | 84 | | EUR 15,278 | | 15,407,051 | | (129,252) |
44 OPPENHEIMER FUNDAMENTAL ALTERNATIVES FUND
| | | | | | | | | | | | | | |
Futures Contracts (Continued) | | | | | | | | | | |
| Description | | Buy/Sell | | Expiration
Date | | Number
of Contracts | | Notional Amount (000’s) | | Value | | | | Unrealized
Appreciation (Depreciation) |
United States Treasury Nts., 5 yr. | | Sell | | 12/29/17 | | 158 | | USD18,704 | | $ 18,515,625 | | $ | | 188,613 |
| | | | | | | | | | | | |
| | | | | | | | | | | | $ | | (891,557) |
| | | | | | | | | | | | |
| | | | | | | | | | | | | | |
Over-the-Counter Options Written at October 31, 2017 | | | | | | | | | | |
| Description | | Counter
-party | | Exercise
Price | | Expiration Date | | Number of
Contracts
(000’s) | | Notional
Amount (000’s) | | Premiums
Received | | Value |
| | | | CNH | | | | CNH | | | | | | |
CNH Currency Put | | CITNA-B | | 8.000 | | 11/29/17 | | (667,000) | | CNH 2,337,600 | | $ 693,680 | | $ — |
| | | | | | | | | | | | | | |
Centrally Cleared Credit Default Swaps at October 31, 2017 | | | | | | |
| Reference Asset | | Buy/Sell
Protection | | Fixed
Rate | | Maturity Date | | Notional
Amount
(000’s) | | Premiums
Received/
(Paid) | | Value | | Unrealized
Appreciation (Depreciation) |
CDX.HY.28 | | Buy | | 5.000% | | 6/20/22 | | USD 18,968 | | $ 1,324,837 | | $ (1,782,725) | | $ (457,888) |
CDX.IG.28 | | Sell | | 1.000 | | 6/20/22 | | USD 740 | | (13,473) | | 16,924 | | 3,451 |
CDX.IG.28 | | Sell | | 1.000 | | 6/20/22 | | USD 51,615 | | (935,396) | | 1,180,483 | | 245,087 |
CDX.IG.28 | | Sell | | 1.000 | | 6/20/22 | | USD 3,000 | | (53,766) | | 68,613 | | 14,847 |
iTraxx.Main.27 | | Buy | | 1.000 | | 6/20/22 | | EUR 46,010 | | 979,105 | | (1,428,809) | | (449,704) |
iTraxx.Main.27 | | Buy | | 1.000 | | 6/20/22 | | EUR 890 | | 21,902 | | (27,638) | | (5,736) |
Neiman Marcus | | | | | | | | | | | | | | |
Group LLC (The) | | Buy | | 5.000 | | 12/20/20 | | USD 6,190 | | 358,683 | | 1,241,851 | | 1,600,534 |
| | | | | | | | | | |
Total Centrally Cleared Credit Default Swaps | | | | | | | | $ 1,681,892 | | $ (731,301) | | $ 950,591 |
| | | | | | | | | | |
| | | | | | | | | | | | | | | | |
Over-the-Counter Credit Default Swaps at October 31, 2017 | | | | |
Reference Asset | | Counter-
party | | Buy/Sell Protection | | Fixed
Rate | | Maturity
Date | | Notional
Amount
(000’s) | | Premiums
Received/
(Paid) | | Value | | Unrealized
Appreciation (Depreciation) |
CDX.HY.21 | | CITNA-B | | Buy | | 5.000 | | 12/20/18 | | USD 1,407 | | $ 74,649 | | $ (84,298) | | $ (9,649) |
CDX.HY.25 | | CITNA-B | | Buy | | 5.000 | | 12/20/20 | | USD 936 | | (109,330) | | (91,940) | | (201,270) |
CDX.HY.25 | | CITNA-B | | Buy | | 5.000 | | 12/20/20 | | USD 471 | | (48,278) | | (46,265) | | (94,543) |
CDX.HY.25 | | CITNA-B | | Sell | | 5.000 | | 12/20/20 | | USD 133 | | 82,577 | | (49,359) | | 33,218 |
CDX.HY.25 | | CITNA-B | | Sell | | 5.000 | | 12/20/18 | | USD 413 | | 157,382 | | (54,138) | | 103,244 |
CDX.HY.25 | | CITNA-B | | Sell | | 5.000 | | 12/20/20 | | USD 265 | | 171,858 | | (98,089) | | 73,769 |
CDX.NA.HY.21 | | CITNA-B | | Buy | | 5.000 | | 12/20/18 | | USD 7,500 | | (230,208) | | (449,350) | | (679,558) |
CDX.NA.HY.21 | | CITNA-B | | Sell | | 5.000 | | 12/20/18 | | USD 1,689 | | 942,651 | | (221,153) | | 721,498 |
CDX.NA.HY.21 | | GSCOI | | Sell | | 5.000 | | 12/20/18 | | USD 513 | | 280,576 | | (67,231) | | 213,345 |
CDX.NA.HY.25 | | GSCOI | | Buy | | 5.000 | | 12/20/20 | | USD 7,500 | | (1,297,917) | | (736,698) | | (2,034,615) |
CDX.NA.HY.25 | | GSCOI | | Sell | | 5.000 | | 12/20/20 | | USD 2,121 | | 1,407,556 | | (785,971) | | 621,585 |
Malaysia | | BAC | | Buy | | 1.000 | | 12/20/20 | | USD 2,900 | | (136,197) | | (58,564) | | (194,761) |
Malaysia | | BAC | | Buy | | 1.000 | | 12/20/20 | | USD 854 | | (35,261) | | (17,247) | | (52,508) |
Malaysia | | BNP | | Buy | | 1.000 | | 12/20/20 | | USD 761 | | (26,351) | | (15,368) | | (41,719) |
Malaysia | | BNP | | Buy | | 1.000 | | 6/20/21 | | USD 3,820 | | (112,656) | | (78,851) | | (191,507) |
Malaysia | | BNP | | Buy | | 1.000 | | 6/20/21 | | USD 3,000 | | (85,450) | | (61,925) | | (147,375) |
Malaysia | | BNP | | Buy | | 1.000 | | 12/20/20 | | USD 10,000 | | (651,135) | | (201,940) | | (853,075) |
45 OPPENHEIMER FUNDAMENTAL ALTERNATIVES FUND
CONSOLIDATED STATEMENT OF INVESTMENTS Continued
| | | | | | | | | | | | | | | | | | | | | | | | | | |
Over-the-Counter Credit Default Swaps (Continued) | | | | | | | | | | | |
Reference Asset | | Counter-
party | | | Buy/Sell Protection | | | Fixed
Rate | | | Maturity
Date | | | Notional
Amount
(000’s) | | | Premiums
Received/
(Paid) | | Value | | Unrealized
Appreciation (Depreciation) |
Malaysia | | | BNP | | | | Buy | | | | 1.000% | | | | 12/20/20 | | | | USD 1,811 | | | $ (51,082) | | $ (36,571) | | $ (87,653) |
Malaysia | | | CITNA-B | | | | Buy | | | | 1.000 | | | | 12/20/20 | | | | USD 4,295 | | | (209,624) | | (86,733) | | (296,357) |
Malaysia | | | MOS-A | | | | Buy | | | | 1.000 | | | | 12/20/20 | | | | USD 10,000 | | | (502,319) | | (201,940) | | (704,259) |
Total Over-the-Counter Credit Default Swaps | | | | | | | | | | | $ (378,559) | | $ (3,443,631) | | $ (3,822,190) |
| | | | | | | | | | | |
| | | | | | |
Type of Reference Asset on which the Fund Sold Protection | | Total Maximum
Potential Payments for
Selling Credit Protection
(Undiscounted) | | Amount
Recoverable* | | Reference
Asset Rating
Range** |
Investment Grade Corporate Debt | | $55,355,000 | | $— | | BBB |
Indexes | | | | | | |
Non-Investment Grade Corporate Debt | | 5,134,238 | | 17,814,000 | | BB |
Indexes | | | | | | |
| | |
Total | | $60,489,238 | | $17,814,000 | | |
| | |
*Amounts recoverable includes potential payments from related purchased protection for instances where the Fund is the seller of protection. In addition, the Fund has no recourse provisions under the credit derivatives and holds no collateral which can offset or reduce potential payments under a triggering event.
** The period end reference asset security ratings, as rated by any rating organization, are included in the equivalent Standard & Poor’s rating category. The reference asset rating represents the likelihood of a potential credit event on the reference asset which would result in a related payment by the Fund.
| | | | | | | | | | | | | | | | | | | | | | | | | | |
Over-the-Counter Total Return Swaps at October 31, 2017 | | | | | | | | | | | | | |
| Reference Asset | | Counter-
party | | | Pay/Receive
Total
Return* | | | Floating Rate | | Maturity
Date | | | Notional Amount
(000’s) | | | Value | | | Unrealized
Appreciation/ (Depreciation) | |
0998.HK-China Citic Bank Corp. Ltd., ORD H | | | GSCOI | | | | Pay | | | One-Month HKD HIBOR HKAB minus 50 basis points | | | 5/24/18 | | | | HKD 1,994 | | | $ | (13,784 | ) $ | | | (13,784 | ) |
0998.HK-China Citic Bank Corp. Ltd., ORD H | | | GSCOI | | | | Pay | | | One-Month HKD HIBOR HKAB minus 50 basis points | | | 5/24/18 | | | | HKD 27,332 | | | | (215,171 | ) | | | (215,171 | ) |
1988.HK-China Ninsheng Banking Corp. Ltd., ORD H | | | GSCOI | | | | Pay | | | One-Month HKD HIBOR HKAB minus 50 basis points | | | 5/24/18 | | | | HKD 28,149 | | | | (41,892 | ) | | | (41,892 | ) |
3328.HK-Bank of Communications Co. Ltd., ORD H | | | GSCOI | | | | Pay | | | One-Month HKD HIBOR HKAB minus 50 basis points | | | 5/24/18 | | | | HKD 33,202 | | | | (278,964 | ) | | | (278,964 | ) |
3968.HK-China Merchants Bank, ORD H | | | GSCOI | | | | Pay | | | One-Month HKD HIBOR HKAB minus 50 basis points | | | 5/24/18 | | | | HKD 36,981 | | | | (1,570,012 | ) | | | (1,570,012 | ) |
46 OPPENHEIMER FUNDAMENTAL ALTERNATIVES FUND
| | | | | | | | | | | | | | | | | | | | | | |
Over-the-Counter Total Return Swaps (Continued) | | | | | | | | | |
| Reference Asset | | Counter-
party | | | Pay/Receive
Total
Return* | | | Floating Rate | | Maturity
Date | | | Notional Amount
(000’s) | | | Value | | Unrealized
Appreciation/ (Depreciation) |
6818.HK-China Everbright Bank, ORD H | | | GSCOI | | | | Pay | | | One-Month HKD HIBOR HKAB minus 50 basis points | | | 5/24/18 | | | | HKD 14,419 | | | $ (93,401) | | $ (93,401) |
| | | | | | | | | | | | | | | | | | | | |
Total Over-the-Counter Total Return Swaps | | | | | | | | | | | | | $ (2,213,224) | | $ (2,213,224) |
| | | | | | | | | | | | | |
* Fund will pay or receive the total return of the reference asset depending on whether the return is positive or negative. For contracts where the Fund has elected to receive the total return of the reference asset if positive, it will be responsible for paying the floating rate and the total return of the reference asset if negative. If the Fund has elected to pay the total return of the reference asset if positive, it will receive the floating rate and the total return of the reference asset if negative.
| | |
Glossary: |
Counterparty Abbreviations |
| BAC | | Barclays Bank plc |
| BNP | | BNP Paribas |
| BOA | | Bank of America NA |
| CITNA-B | | Citibank NA |
| DEU | | Deutsche Bank AG |
| GSCOI | | Goldman Sachs International |
| JPM | | JPMorgan Chase Bank NA |
| MOS-A | | Morgan Stanley |
| TDB | | Toronto Dominion Bank |
|
Currency abbreviations indicate amounts reporting in currencies |
| AUD | | Australian Dollar |
| CAD | | Canadian Dollar |
| CNH | | Offshore Chinese Renminbi |
| EUR | | Euro |
| HKD | | Hong Kong Dollar |
| JPY | | Japanese Yen |
| NOK | | Norwegian Krone |
| THB | | Thailand Baht |
|
Definitions |
| BBA LIBOR | | British Bankers’ Association London - Interbank Offered Rate |
| BONO | | Spanish Government Bonds |
| BTP | | Italian Treasury Bonds |
| BUND | | German Federal Obligation |
| CDX.HY.21 | | Markit CDX High Yield Index |
| CDX.HY.25 | | Markit CDX High Yield Index |
| CDX.HY.28 | | Markit CDX High Yield Index |
| CDX.IG.28 | | Markit CDX Investment Grade Index |
| CDX.NA.HY.21 | | Markit CDX North American High Yield |
| CDX.NA.HY.25 | | Markit CDX North American High Yield |
| HIBOR | | Hong Kong Interbank Offered Rate |
| HKAB | | Hong Kong Association of Banks |
| iTraxx.Main.27 | | Credit Default Swap Trading Index for a Specific Basket of Securities |
47 OPPENHEIMER FUNDAMENTAL ALTERNATIVES FUND
CONSOLIDATED STATEMENT OF INVESTMENTS Continued
| | |
Definitions (Continued) |
| LIBOR01M | | ICE LIBOR USD 1 Month |
| LIBOR03M | | ICE LIBOR USD 3 Month |
| LIBOR12 | | London Interbank Offered Rate-Monthly |
| LIBOR4 | | London Interbank Offered Rate-Quarterly |
| LIBOR52 | | London Interbank Offered Rate-Weekly |
| LIBOR6 | | London Interbank Offered Rate-Bi-Monthly |
| OAT | | French Government Bonds |
| PRIME4 | | United States Prime Rate-Quarterly |
| S&P | | Standard & Poor’s |
| US0001M | | ICE LIBOR USD 1 Month |
| US0003M | | ICE LIBOR USD 3 Month |
See accompanying Notes to Consolidated Financial Statements.
48 OPPENHEIMER FUNDAMENTAL ALTERNATIVES FUND
CONSOLIDATED STATEMENT OF
ASSETS AND LIABILITIES October 31, 2017
| | |
Assets | | |
Investments, at value—see accompanying consolidated statement of investments: | | |
Unaffiliated companies (cost $1,060,056,496) | | $ 1,229,745,834 |
Affiliated companies (cost $25,711,488) | | 25,711,488 |
| | |
| | | 1,255,457,322 |
Cash used for collateral on futures | | 2,934,800 |
Cash used for collateral on OTC derivatives | | 4,572,000 |
Cash used for collateral on centrally cleared swaps | | 2,788,194 |
Deposits with broker for securities sold short | | 302,151,164 |
Deposits with broker for foreign securities sold short (cost $50,148,781) | | 51,634,700 |
Unrealized appreciation on forward currency exchange contracts | | 2,493,995 |
Centrally cleared swaps, at value (net premiums paid $643,952) | | 2,507,871 |
Receivables and other assets: | | |
Investments sold (including $189,655 sold on a when-issued or delayed delivery basis) | | 7,817,478 |
Interest and dividends | | 3,747,560 |
Shares of beneficial interest sold | | 704,464 |
Variation margin receivable | | 26,292 |
Other | | 155,393 |
| | |
Total assets | | 1,636,991,233 |
Liabilities | | |
Securities sold short, at value (proceeds $335,524,220)—see accompanying consolidated statement of investments | | 359,889,248 |
Bank overdraft | | 2,935,617 |
Unrealized depreciation on forward currency exchange contracts | | 1,454,107 |
Options written, at value (premiums received $693,680) | | — |
Swaps, at value (net premiums paid $378,559) | | 5,656,855 |
Centrally cleared swaps, at value (premiums received $2,325,844) | | 3,239,172 |
Payables and other liabilities: | | |
Investments purchased (including $6,339,357 purchased on a when-issued or delayed delivery basis) | | 9,193,594 |
Shares of beneficial interest redeemed | | 2,040,445 |
Dividends on short sales | | 320,411 |
Trustees’ compensation | | 189,648 |
Distribution and service plan fees | | 149,452 |
Variation margin payable | | 119,993 |
Shareholder communications | | 29,879 |
Other | | 234,195 |
| | |
Total liabilities | | 385,452,616 |
Net Assets | | $ 1,251,538,617 |
| | |
49 OPPENHEIMER FUNDAMENTAL ALTERNATIVES FUND
CONSOLIDATED STATEMENT OF
ASSETS AND LIABILITIES Continued
| | |
Composition of Net Assets | | |
Par value of shares of beneficial interest | | $ 460,729 |
Additional paid-in capital | | 1,184,994,229 |
Accumulated net investment income | | 18,444,134 |
Accumulated net realized loss on investments and foreign currency transactions | | (94,975,324) |
Net unrealized appreciation on investments and translation of assets and liabilities denominated in foreign currencies | | 142,614,849 |
| | |
Net Assets | | $ 1,251,538,617 |
| | |
| | |
Net Asset Value Per Share | | |
Class A Shares: | | |
Net asset value and redemption price per share (based on net assets of $560,358,934 and 20,590,160 shares of beneficial interest outstanding) | | $27.21 |
Maximum offering price per share (net asset value plus sales charge of 5.75% of offering price) | | $28.87 |
Class B Shares: | | |
Net asset value, redemption price (excludes applicable contingent deferred sales charge) and offering price per share (based on net assets of $2,571,391 and 107,031 shares of beneficial interest outstanding) | | $24.02 |
Class C Shares: | | |
Net asset value, redemption price (excludes applicable contingent deferred sales charge) and offering price per share (based on net assets of $110,630,249 and 4,602,945 shares of beneficial interest outstanding) | | $24.03 |
Class I Shares: | | |
Net asset value, redemption price and offering price per share (based on net assets of $151,696,665 and 5,418,265 shares of beneficial interest outstanding) | | $28.00 |
Class R Shares: | | |
Net asset value, redemption price (excludes applicable contingent deferred sales charge) and offering price per share (based on net assets of $21,057,545 and 809,328 shares of beneficial interest outstanding) | | $26.02 |
Class Y Shares: | | |
Net asset value, redemption price and offering price per share (based on net assets of $405,223,833 and 14,545,198 shares of beneficial interest outstanding) | | $27.86 |
See accompanying Notes to Consolidated Financial Statements.
50 OPPENHEIMER FUNDAMENTAL ALTERNATIVES FUND
CONSOLIDATED STATEMENT OF
OPERATIONS For the Year Ended October 31, 2017
| | |
Investment Income | | |
Interest | | $ 21,652,208 |
Dividends: | | |
Unaffiliated companies (net of foreign withholding taxes of $305,933) | | 18,128,620 |
Affiliated companies | | 194,525 |
Other income | | 677,014 |
| | |
Total investment income | | 40,652,367 |
Expenses | | |
Management fees | | 11,317,276 |
Distribution and service plan fees: | | |
Class A | | 1,494,493 |
Class B | | 45,844 |
Class C | | 1,232,419 |
Class R | | 104,585 |
Transfer and shareholder servicing agent fees: | | |
Class A | | 1,366,438 |
Class B | | 10,166 |
Class C | | 272,765 |
Class I | | 42,929 |
Class R | | 46,452 |
Class Y | | 875,035 |
Shareholder communications: | | |
Class A | | 26,822 |
Class B | | 2,342 |
Class C | | 19,554 |
Class I | | 3,410 |
Class R | | 3,595 |
Class Y | | 48,269 |
Dividends on short sales | | 5,152,425 |
Financing expense from short sales | | 105,349 |
Trustees’ compensation | | 32,317 |
Borrowing fees | | 31,397 |
Custodian fees and expenses | | 26,608 |
Other | | 288,642 |
| | |
Total expenses | | 22,549,132 |
Less reduction to custodian expenses | | (92) |
Less waivers and reimbursements of expenses | | (498,199) |
| | |
Net expenses | | 22,050,841 |
Net Investment Income | | 18,601,526 |
51 OPPENHEIMER FUNDAMENTAL ALTERNATIVES FUND
CONSOLIDATED STATEMENT OF
OPERATIONS Continued
| | |
Realized and Unrealized Gain (Loss) | | |
Net realized gain (loss) on: | | |
Investment transactions in unaffiliated companies | | $ 15,916,727 |
Option contracts written | | 383,210 |
Futures contracts | | 544,435 |
Foreign currency transactions | | 100,146 |
Forward currency exchange contracts | | 515,500 |
Short positions | | (83,305,038) |
Swap contracts | | (8,057,066) |
| | |
Net realized loss | | (73,902,086) |
Net change in unrealized appreciation/depreciation on: | | |
Investment transactions in unaffiliated companies | | 88,284,749 |
Translation of assets and liabilities denominated in foreign currencies | | 1,182,182 |
Forward currency exchange contracts | | (977,076) |
Futures contracts | | (1,584,737) |
Option contracts written | | (44,970) |
Short positions | | (10,221,901) |
Swap contracts | | 2,376,599 |
| | |
Net change in unrealized appreciation/depreciation | | 79,014,846 |
Net Increase in Net Assets Resulting from Operations | | $ 23,714,286 |
| | |
See accompanying Notes to Consolidated Financial Statements.
52 OPPENHEIMER FUNDAMENTAL ALTERNATIVES FUND
CONSOLIDATED STATEMENTS OF CHANGES IN NET ASSETS
| | | | |
| | | Year Ended
October 31, 2017 | | Year Ended
October 31, 2016 |
Operations | | | | |
Net investment income | | $ 18,601,526 | | $ 11,976,330 |
Net realized loss | | (73,902,086) | | (23,544,189) |
Net change in unrealized appreciation/depreciation | | 79,014,846 | | 14,155,236 |
| | |
Net increase in net assets resulting from operations | | 23,714,286 | | 2,587,377 |
Dividends and/or Distributions to Shareholders | | | | |
Dividends from net investment income: | | | | |
Class A | | (1,722,321) | | (3,490,406) |
Class B | | (12,416) | | (41,676) |
Class C | | (273,777) | | (422,888) |
Class I | | (985,054) | | (587,576) |
Class R | | (44,000) | | (58,448) |
Class Y | | (2,169,190) | | (1,050,986) |
| | |
| | (5,206,758) | | (5,651,980) |
Beneficial Interest Transactions | | | | |
Net increase (decrease) in net assets resulting from beneficial interest transactions: | | | | |
Class A | | (125,165,191) | | 36,883,516 |
Class B | | (4,833,789) | | (6,679,262) |
Class C | | (29,837,699) | | 23,668,449 |
Class I | | 18,932,679 | | 71,247,215 |
Class R | | 235,487 | | 3,542,247 |
Class Y | | 1,358,274 | | 309,116,440 |
| | |
| | (139,310,239) | | 437,778,605 |
Net Assets | | | | |
Total increase (decrease) | | (120,802,711) | | 434,714,002 |
Beginning of period | | 1,372,341,328 | | 937,627,326 |
| | |
End of period (including accumulated net investment income of | | | | |
$18,444,134 and $6,942,613, respectively) | | $ 1,251,538,617 | | $ 1,372,341,328 |
| | |
See accompanying Notes to Consolidated Financial Statements.
53 OPPENHEIMER FUNDAMENTAL ALTERNATIVES FUND
CONSOLIDATED FINANCIAL HIGHLIGHTS
| | | | | | | | | | |
| Class A | | Year Ended
October 31,
2017 | | Year Ended
October 31,
2016 | | Year Ended
October 30,
20151 | | Year Ended
October 31,
2014 | | Year Ended
October 31,
2013 |
Per Share Operating Data | | | | | | | | | | |
Net asset value, beginning of period | | $26.81 | | $27.00 | | $26.64 | | $24.48 | | $23.35 |
Income (loss) from investment operations: | | | | | | | | | | |
Net investment income2 | | 0.38 | | 0.27 | | 0.30 | | 0.29 | | 0.30 |
Net realized and unrealized gain (loss) | | 0.09 | | (0.32) | | 0.53 | | 1.87 | | 0.83 |
| | |
Total from investment operations | | 0.47 | | (0.05) | | 0.83 | | 2.16 | | 1.13 |
Dividends and/or distributions to shareholders: | | | | | | | | | | |
Dividends from net investment income | | (0.07) | | (0.14) | | (0.47) | | 0.00 | | 0.00 |
Net asset value, end of period | | $27.21 | | $26.81 | | $27.00 | | $26.64 | | $24.48 |
| | |
| | | | | | | | | | |
Total Return, at Net Asset Value3 | | 1.79% | | (0.18)% | | 3.18% | | 8.82% | | 4.84% |
| | | | | | | | | | |
Ratios/Supplemental Data | | | | | | | | | | |
Net assets, end of period (in thousands) | | $560,359 | | $675,558 | | $642,670 | | $642,789 | | $668,235 |
Average net assets (in thousands) | | $620,775 | | $679,471 | | $636,510 | | $662,351 | | $721,521 |
Ratios to average net assets:4 | | | | | | | | | | |
Net investment income | | 1.39% | | 1.02%5 | | 1.14%5 | | 1.12%5 | | 1.25%5 |
Expenses excluding specific expenses listed below | | 1.36% | | 1.35%5 | | 1.39%5 | | 1.42%5 | | 1.44%5 |
Dividends and/or interest expense on securities sold short | | 0.39% | | 0.59% | | 0.60% | | 0.55% | | 0.58% |
Borrowing expenses on securities sold short | | 0.01% | | 0.09% | | 0.18% | | 0.42% | | 0.02% |
Interest and fees from borrowings | | 0.00%6 | | 0.00%6 | | 0.00%6 | | 0.00% | | 0.00% |
| | |
Total expenses7 | | 1.76% | | 2.03%5 | | 2.17%5 | | 2.39%5 | | 2.04%5 |
| Expenses after payments, waivers and/or reimbursements and reduction to custodian expenses | | 1.72% | | 1.99%5 | | 2.12%5 | | 2.25%5 | | 1.97%5 |
Portfolio turnover rate | | 168% | | 131% | | 62% | | 44% | | 76% |
54 OPPENHEIMER FUNDAMENTAL ALTERNATIVES FUND
1. Represents the last business day of the Fund’s reporting period.
2. Per share amounts calculated based on the average shares outstanding during the period.
3. Assumes an initial investment on the business day before the first day of the fiscal period, with all dividends and distributions reinvested in additional shares on the reinvestment date, and redemption at the net asset value calculated on the last business day of the fiscal period. Sales charges are not reflected in the total returns. Total returns are not annualized for periods less than one full year. Returns do not reflect the deduction of taxes that a shareholder would pay on fund distributions or the redemption of fund shares.
4. Annualized for periods less than one full year.
5. Includes the Fund’s share of the allocated expenses and/or net investment income from Oppenheimer Master Loan Fund, LLC.
6. Less than 0.005%.
7. Total expenses including indirect expenses from affiliated fund fees and expenses were as follows:
| | | | | | | | | | | | |
| | | | Year Ended October 31, 2017 | | 1.76% | | | | | | |
| | | | Year Ended October 31, 2016 | | 2.05% | | | | | | |
| | | | Year Ended October 30, 2015 | | 2.18% | | | | | | |
| | | | Year Ended October 31, 2014 | | 2.40% | | | | | | |
| | | | Year Ended October 31, 2013 | | 2.06% | | | | | | |
See accompanying Notes to Consolidated Financial Statements.
55 OPPENHEIMER FUNDAMENTAL ALTERNATIVES FUND
CONSOLIDATED FINANCIAL HIGHLIGHTS Continued
| | | | | | | | | | |
| Class B | | Year Ended
October 31,
2017 | | Year Ended
October 31,
2016 | | Year Ended
October 30,
20151 | | Year Ended
October 31,
2014 | | Year Ended
October 31,
2013 |
Per Share Operating Data | | | | | | | | | | |
Net asset value, beginning of period | | $23.85 | | $24.15 | | $23.84 | | $22.08 | | $21.25 |
Income (loss) from investment operations: | | | | | | | | | | |
Net investment income2 | | 0.15 | | 0.08 | | 0.15 | | 0.08 | | 0.08 |
Net realized and unrealized gain (loss) | | 0.07 | | (0.30) | | 0.42 | | 1.68 | | 0.75 |
| | |
Total from investment operations | | 0.22 | | (0.22) | | 0.57 | | 1.76 | | 0.83 |
Dividends and/or distributions to shareholders: | | | | | | | | | | |
Dividends from net investment income | | (0.05) | | (0.08) | | (0.26) | | 0.00 | | 0.00 |
Net asset value, end of period | | $24.02 | | $23.85 | | $24.15 | | $23.84 | | $22.08 |
| | |
| | | | | | | | | | |
Total Return, at Net Asset Value3 | | 0.92% | | (0.92)% | | 2.40% | | 7.97% | | 3.91% |
| | | | | | | | | | |
Ratios/Supplemental Data | | | | | | | | | | |
Net assets, end of period (in thousands) | | $2,571 | | $7,344 | | $14,201 | | $25,296 | | $34,346 |
Average net assets (in thousands) | | $4,603 | | $10,159 | | $19,249 | | $30,329 | | $40,057 |
Ratios to average net assets:4 | | | | | | | | | | |
Net investment income | | 0.62% | | 0.34%5 | | 0.61%5 | | 0.34%5 | | 0.35%5 |
Expenses excluding specific expenses listed below | | 2.17% | | 2.10%5 | | 2.16%5 | | 2.29%5 | | 2.46%5 |
Dividends and/or interest expense on securities sold short | | 0.39% | | 0.59% | | 0.60% | | 0.55% | | 0.58% |
Borrowing expenses on securities sold short | | 0.01% | | 0.09% | | 0.18% | | 0.42% | | 0.02% |
Interest and fees from borrowings | | 0.00%6 | | 0.00%6 | | 0.00%6 | | 0.00% | | 0.00% |
| | |
Total expenses7 | | 2.57% | | 2.78%5 | | 2.94%5 | | 3.26%5 | | 3.06%5 |
| Expenses after payments, waivers and/or reimbursements and reduction to custodian expenses | | 2.53% | | 2.74%5 | | 2.89%5 | | 3.06%5 | | 2.86%5 |
Portfolio turnover rate | | 168% | | 131% | | 62% | | 44% | | 76% |
56 OPPENHEIMER FUNDAMENTAL ALTERNATIVES FUND
1. Represents the last business day of the Fund’s reporting period.
2. Per share amounts calculated based on the average shares outstanding during the period.
3. Assumes an initial investment on the business day before the first day of the fiscal period, with all dividends and distributions reinvested in additional shares on the reinvestment date, and redemption at the net asset value calculated on the last business day of the fiscal period. Sales charges are not reflected in the total returns. Total returns are not annualized for periods less than one full year. Returns do not reflect the deduction of taxes that a shareholder would pay on fund distributions or the redemption of fund shares.
4. Annualized for periods less than one full year.
5. Includes the Fund’s share of the allocated expenses and/or net investment income from Oppenheimer Master Loan Fund, LLC.
6. Less than 0.005%.
7. Total expenses including indirect expenses from affiliated fund fees and expenses were as follows:
| | | | | | | | | | | | |
| | | | Year Ended October 31, 2017 | | 2.57% | | | | | | |
| | | | Year Ended October 31, 2016 | | 2.80% | | | | | | |
| | | | Year Ended October 30, 2015 | | 2.95% | | | | | | |
| | | | Year Ended October 31, 2014 | | 3.27% | | | | | | |
| | | | Year Ended October 31, 2013 | | 3.08% | | | | | | |
See accompanying Notes to Consolidated Financial Statements.
57 OPPENHEIMER FUNDAMENTAL ALTERNATIVES FUND
CONSOLIDATED FINANCIAL HIGHLIGHTS Continued
| | | | | | | | | | |
| Class C | | Year Ended
October 31,
2017 | | Year Ended
October 31,
2016 | | Year Ended
October 30,
20151 | | Year Ended
October 31,
2014 | | Year Ended
October 31,
2013 |
Per Share Operating Data | | | | | | | | | | |
Net asset value, beginning of period | | $23.85 | | $24.15 | | $23.89 | | $22.12 | | $21.26 |
Income (loss) from investment operations: | | | | | | | | | | |
Net investment income2 | | 0.15 | | 0.06 | | 0.09 | | 0.08 | | 0.10 |
Net realized and unrealized gain (loss) | | 0.08 | | (0.28) | | 0.47 | | 1.69 | | 0.76 |
| | |
Total from investment operations | | 0.23 | | (0.22) | | 0.56 | | 1.77 | | 0.86 |
Dividends and/or distributions to shareholders: | | | | | | | | | | |
Dividends from net investment income | | (0.05) | | (0.08) | | (0.30) | | 0.00 | | 0.00 |
Net asset value, end of period | | $24.03 | | $23.85 | | $24.15 | | $23.89 | | $22.12 |
| | |
| | | | | | | | | | |
Total Return, at Net Asset Value3 | | 0.96% | | (0.91)% | | 2.39% | | 8.00% | | 4.05% |
| | | | | | | | | | |
Ratios/Supplemental Data | | | | | | | | | | |
Net assets, end of period (in thousands) | | $110,630 | | $139,374 | | $117,152 | | $110,383 | | $112,993 |
Average net assets (in thousands) | | $123,884 | | $136,400 | | $111,050 | | $112,984 | | $122,514 |
Ratios to average net assets:4 | | | | | | | | | | |
Net investment income | | 0.62% | | 0.25%5 | | 0.38%5 | | 0.36%5 | | 0.48%5 |
Expenses excluding specific expenses listed below | | 2.13% | | 2.11%5 | | 2.14%5 | | 2.19%5 | | 2.21%5 |
Dividends and/or interest expense on securities sold short | | 0.39% | | 0.59% | | 0.60% | | 0.55% | | 0.58% |
Borrowing expenses on securities sold short | | 0.01% | | 0.09% | | 0.18% | | 0.42% | | 0.02% |
Interest and fees from borrowings | | 0.00%6 | | 0.00%6 | | 0.00%6 | | 0.00% | | 0.00% |
| | |
Total expenses7 | | 2.53% | | 2.79%5 | | 2.92%5 | | 3.16%5 | | 2.81%5 |
| Expenses after payments, waivers and/or reimbursements and reduction to custodian expenses | | 2.49% | | 2.75%5 | | 2.87%5 | | 3.02%5 | | 2.74%5 |
Portfolio turnover rate | | 168% | | 131% | | 62% | | 44% | | 76% |
58 OPPENHEIMER FUNDAMENTAL ALTERNATIVES FUND
1. Represents the last business day of the Fund’s reporting period.
2. Per share amounts calculated based on the average shares outstanding during the period.
3. Assumes an initial investment on the business day before the first day of the fiscal period, with all dividends and distributions reinvested in additional shares on the reinvestment date, and redemption at the net asset value calculated on the last business day of the fiscal period. Sales charges are not reflected in the total returns. Total returns are not annualized for periods less than one full year. Returns do not reflect the deduction of taxes that a shareholder would pay on fund distributions or the redemption of fund shares.
4. Annualized for periods less than one full year.
5. Includes the Fund’s share of the allocated expenses and/or net investment income from Oppenheimer Master Loan Fund, LLC.
6. Less than 0.005%.
7. Total expenses including indirect expenses from affiliated fund fees and expenses were as follows:
| | | | | | | | | | | | |
| | | | Year Ended October 31, 2017 | | 2.53% | | | | | | |
| | | | Year Ended October 31, 2016 | | 2.81% | | | | | | |
| | | | Year Ended October 30, 2015 | | 2.93% | | | | | | |
| | | | Year Ended October 31, 2014 | | 3.17% | | | | | | |
| | | | Year Ended October 31, 2013 | | 2.83% | | | | | | |
See accompanying Notes to Consolidated Financial Statements.
59 OPPENHEIMER FUNDAMENTAL ALTERNATIVES FUND
CONSOLIDATED FINANCIAL HIGHLIGHTS Continued
| | | | | | | | | | |
| Class I | | Year Ended
October 31,
2017 | | Year Ended
October 31,
2016 | | Year Ended
October 30,
20151 | | Year Ended
October 31,
2014 | | Period
Ended
October 31,
20132 |
Per Share Operating Data | | | | | | | | | | |
Net asset value, beginning of period | | $27.60 | | $27.79 | | $27.41 | | $25.09 | | $24.32 |
Income (loss) from investment operations: | | | | | | | | | | |
Net investment income3 | | 0.50 | | 0.37 | | 0.28 | | 0.42 | | 0.34 |
Net realized and unrealized gain (loss) | | 0.10 | | (0.29) | | 0.69 | | 1.90 | | 0.43 |
| | |
Total from investment operations | | 0.60 | | 0.08 | | 0.97 | | 2.32 | | 0.77 |
Dividends and/or distributions to shareholders: | | | | | | | | | | |
Dividends from net investment income | | (0.20) | | (0.27) | | (0.59) | | 0.00 | | 0.00 |
Net asset value, end of period | | $28.00 | | $27.60 | | $27.79 | | $27.41 | | $25.09 |
| | |
| | | | | | | | | | |
Total Return, at Net Asset Value4 | | 2.18% | | 0.29% | | 3.62% | | 9.25% | | 3.17% |
| | | | | | | | | | |
Ratios/Supplemental Data | | | | | | | | | | |
Net assets, end of period (in thousands) | | $151,697 | | $130,790 | | $59,214 | | $11 | | $10 |
Average net assets (in thousands) | | $143,209 | | $96,611 | | $8,550 | | $11 | | $10 |
Ratios to average net assets:5 | | | | | | | | | | |
Net investment income | | 1.80% | | 1.35%6 | | 1.06%6 | | 1.57%6 | | 2.07%6 |
Expenses excluding specific expenses listed below | | 0.92% | | 0.97%6 | | 0.82%6 | | 0.95%6 | | 1.26%6 |
Dividends and/or interest expense on securities sold short | | 0.39% | | 0.59% | | 0.60% | | 0.55% | | 0.58% |
Borrowing expenses on securities sold short | | 0.01% | | 0.09% | | 0.18% | | 0.42% | | 0.02% |
Interest and fees from borrowings | | 0.00%7 | | 0.00%7 | | 0.00%7 | | 0.00% | | 0.00% |
| | |
Total expenses8 | | 1.32% | | 1.65%6 | | 1.60%6 | | 1.92%6 | | 1.86%6 |
| Expenses after payments, waivers and/or reimbursements and reduction to custodian expenses | | 1.29% | | 1.61%6 | | 1.55%6 | | 1.79%6 | | 1.79%6 |
Portfolio turnover rate | | 168% | | 131% | | 62% | | 44% | | 76% |
60 OPPENHEIMER FUNDAMENTAL ALTERNATIVES FUND
1. Represents the last business day of the Fund’s reporting period.
2. For the period from February 28, 2013 (inception of offering) to October 31, 2013.
3. Per share amounts calculated based on the average shares outstanding during the period.
4. Assumes an initial investment on the business day before the first day of the fiscal period, with all dividends and distributions reinvested in additional shares on the reinvestment date, and redemption at the net asset value calculated on the last business day of the fiscal period. Sales charges are not reflected in the total returns. Total returns are not annualized for periods less than one full year. Returns do not reflect the deduction of taxes that a shareholder would pay on fund distributions or the redemption of fund shares.
5. Annualized for periods less than one full year.
6. Includes the Fund’s share of the allocated expenses and/or net investment income from Oppenheimer Master Loan Fund, LLC.
7. Less than 0.005%.
8. Total expenses including indirect expenses from affiliated fund fees and expenses were as follows:
| | | | | | | | | | |
| | Year Ended October 31, 2017 | | 1.32% | | | | | | |
| | Year Ended October 31, 2016 | | 1.67% | | | | | | |
| | Year Ended October 30, 2015 | | 1.61% | | | | | | |
| | Year Ended October 31, 2014 | | 1.93% | | | | | | |
| | Period Ended October 31, 2013 | | 1.88% | | | | | | |
See accompanying Notes to Consolidated Financial Statements.
61 OPPENHEIMER FUNDAMENTAL ALTERNATIVES FUND
CONSOLIDATED FINANCIAL HIGHLIGHTS Continued
| | | | | | | | | | |
| Class R | | Year Ended
October 31,
2017 | | Year Ended
October 31,
2016 | | Year Ended
October 30,
20151 | | Year Ended
October 31,
2014 | | Year Ended
October 31,
2013 |
Per Share Operating Data | | | | | | | | | | |
Net asset value, beginning of period | | $25.69 | | $25.89 | | $25.55 | | $23.54 | | $22.53 |
Income (loss) from investment operations: | | | | | | | | | | |
Net investment income2 | | 0.29 | | 0.19 | | 0.22 | | 0.21 | | 0.21 |
Net realized and unrealized gain (loss) | | 0.10 | | (0.30) | | 0.52 | | 1.80 | | 0.80 |
| | |
Total from investment operations | | 0.39 | | (0.11) | | 0.74 | | 2.01 | | 1.01 |
Dividends and/or distributions to shareholders: | | | | | | | | | | |
Dividends from net investment income | | (0.06) | | (0.09) | | (0.40) | | 0.00 | | 0.00 |
Net asset value, end of period | | $26.02 | | $25.69 | | $25.89 | | $25.55 | | $23.54 |
| | |
| | | | | | | | | | |
Total Return, at Net Asset Value3 | | 1.51% | | (0.44)% | | 2.92% | | 8.54% | | 4.48% |
| | | | | | | | | | |
Ratios/Supplemental Data | | | | | | | | | | |
Net assets, end of period (in thousands) | | $21,058 | | $20,567 | | $17,141 | | $17,302 | | $20,410 |
Average net assets (in thousands) | | $21,118 | | $18,565 | | $16,942 | | $19,224 | | $23,822 |
Ratios to average net assets:4 | | | | | | | | | | |
Net investment income | | 1.12% | | 0.75%5 | | 0.85%5 | | 0.85%5 | | 0.92%5 |
Expenses excluding specific expenses listed below | | 1.62% | | 1.62%5 | | 1.64%5 | | 1.72%5 | | 1.76%5 |
Dividends and/or interest expense on securities sold short | | 0.39% | | 0.59% | | 0.60% | | 0.55% | | 0.58% |
Borrowing expenses on securities sold short | | 0.01% | | 0.09% | | 0.18% | | 0.42% | | 0.02% |
Interest and fees from borrowings | | 0.00%6 | | 0.00%6 | | 0.00%6 | | 0.00% | | 0.00% |
| | |
Total expenses7 | | 2.02% | | 2.30%5 | | 2.42%5 | | 2.69%5 | | 2.36%5 |
| Expenses after payments, waivers and/or reimbursements and reduction to custodian expenses | | 1.98% | | 2.26%5 | | 2.37%5 | | 2.54%5 | | 2.29%5 |
Portfolio turnover rate | | 168% | | 131% | | 62% | | 44% | | 76% |
62 OPPENHEIMER FUNDAMENTAL ALTERNATIVES FUND
1. Represents the last business day of the Fund’s reporting period.
2. Per share amounts calculated based on the average shares outstanding during the period.
3. Assumes an initial investment on the business day before the first day of the fiscal period, with all dividends and distributions reinvested in additional shares on the reinvestment date, and redemption at the net asset value calculated on the last business day of the fiscal period. Sales charges are not reflected in the total returns. Total returns are not annualized for periods less than one full year. Returns do not reflect the deduction of taxes that a shareholder would pay on fund distributions or the redemption of fund shares.
4. Annualized for periods less than one full year.
5. Includes the Fund’s share of the allocated expenses and/or net investment income from Oppenheimer Master Loan Fund, LLC.
6. Less than 0.005%.
7. Total expenses including indirect expenses from affiliated fund fees and expenses were as follows:
| | | | | | | | | | |
| | Year Ended October 31, 2017 | | 2.02% | | | | | | |
| | Year Ended October 31, 2016 | | 2.32% | | | | | | |
| | Year Ended October 30, 2015 | | 2.43% | | | | | | |
| | Year Ended October 31, 2014 | | 2.70% | | | | | | |
| | Year Ended October 31, 2013 | | 2.38% | | | | | | |
See accompanying Notes to Consolidated Financial Statements.
63 OPPENHEIMER FUNDAMENTAL ALTERNATIVES FUND
CONSOLIDATED FINANCIAL HIGHLIGHTS Continued
| | | | | | | | | | |
| Class Y | | Year Ended
October 31,
2017 | | Year Ended
October 31,
2016 | | Year Ended
October 30,
20151 | | Year Ended
October 31,
2014 | | Year Ended
October 31,
2013 |
Per Share Operating Data | | | | | | | | | | |
Net asset value, beginning of period | | $27.47 | | $27.68 | | $27.32 | | $25.05 | | $23.84 |
Income (loss) from investment operations: | | | | | | | | | | |
Net investment income2 | | 0.45 | | 0.32 | | 0.31 | | 0.34 | | 0.38 |
Net realized and unrealized gain (loss) | | 0.09 | | (0.29) | | 0.60 | | 1.93 | | 0.83 |
| | |
Total from investment operations | | 0.54 | | 0.03 | | 0.91 | | 2.27 | | 1.21 |
Dividends and/or distributions to shareholders: | | | | | | | | | | |
Dividends from net investment income | | (0.15) | | (0.24) | | (0.55) | | 0.00 | | 0.00 |
Net asset value, end of period | | $27.86 | | $27.47 | | $27.68 | | $27.32 | | $25.05 |
| | |
| | | | | | | | | | |
Total Return, at Net Asset Value3 | | 1.98% | | 0.08% | | 3.43% | | 9.06% | | 5.08% |
| | | | | | | | | | |
Ratios/Supplemental Data | | | | | | | | | | |
Net assets, end of period (in thousands) | | $405,224 | | $398,708 | | $87,249 | | $19,378 | | $11,237 |
Average net assets (in thousands) | | $397,699 | | $278,002 | | $34,589 | | $14,096 | | $12,213 |
Ratios to average net assets:4 | | | | | | | | | | |
Net investment income | | 1.61% | | 1.16%5 | | 1.13%5 | | 1.27%5 | | 1.52%5 |
Expenses excluding specific expenses listed below | | 1.13% | | 1.17%5 | | 1.10%5 | | 1.78%5 | | 1.19%5 |
Dividends and/or interest expense on securities sold short | | 0.39% | | 0.59% | | 0.60% | | 0.55% | | 0.58% |
Borrowing expenses on securities sold short | | 0.01% | | 0.09% | | 0.18% | | 0.42% | | 0.02% |
Interest and fees from borrowings | | 0.00%6 | | 0.00%6 | | 0.00%6 | | 0.00% | | 0.00% |
| | |
Total expenses7 | | 1.53% | | 1.85%5 | | 1.88%5 | | 2.75%5 | | 1.79%5 |
Expenses after payments, waivers and/or reimbursements and reduction to custodian expenses | | 1.49% | | 1.81%5 | | 1.83%5 | | 2.04%5 | | 1.72%5 |
Portfolio turnover rate | | 168% | | 131% | | 62% | | 44% | | 76% |
64 OPPENHEIMER FUNDAMENTAL ALTERNATIVES FUND
1. Represents the last business day of the Fund’s reporting period.
2. Per share amounts calculated based on the average shares outstanding during the period.
3. Assumes an initial investment on the business day before the first day of the fiscal period, with all dividends and distributions reinvested in additional shares on the reinvestment date, and redemption at the net asset value calculated on the last business day of the fiscal period. Sales charges are not reflected in the total returns. Total returns are not annualized for periods less than one full year. Returns do not reflect the deduction of taxes that a shareholder would pay on fund distributions or the redemption of fund shares.
4. Annualized for periods less than one full year.
5. Includes the Fund’s share of the allocated expenses and/or net investment income from Oppenheimer Master Loan Fund, LLC.
6. Less than 0.005%.
7. Total expenses including indirect expenses from affiliated fund fees and expenses were as follows:
| | | | | | | | | | |
| | Year Ended October 31, 2017 | | 1.53% | | | | | | |
| | Year Ended October 31, 2016 | | 1.87% | | | | | | |
| | Year Ended October 30, 2015 | | 1.89% | | | | | | |
| | Year Ended October 31, 2014 | | 2.76% | | | | | | |
| | Year Ended October 31, 2013 | | 1.81% | | | | | | |
See accompanying Notes to Consolidated Financial Statements.
65 OPPENHEIMER FUNDAMENTAL ALTERNATIVES FUND
NOTES TO
CONSOLIDATED FINANCIAL STATEMENTS October 31, 2017
1. Organization
Oppenheimer Fundamental Alternatives Fund (the “Fund”), a series of Oppenheimer Quest for Value Funds, is registered under the Investment Company Act of 1940 (“1940 Act”), as amended, as a diversified open-end management investment company. The Fund’s investment objective is to seek total return. The Fund’s investment adviser is OFI Global Asset Management, Inc. (“OFI Global” or the “Manager”), a wholly-owned subsidiary of OppenheimerFunds, Inc. (“OFI” or the “Sub-Adviser”). The Manager has entered into a sub-advisory agreement with OFI.
The Fund offers Class A, Class C, Class I, Class R and Class Y shares, and previously offered Class B shares for new purchase through June 29, 2012. Subsequent to that date, no new purchases of Class B shares are permitted, however reinvestment of dividend and/or capital gain distributions and exchanges of Class B shares into and from other Oppenheimer funds are allowed. Class A shares are sold at their offering price, which is normally net asset value plus a front-end sales charge. Class C and Class R shares are sold, and Class B shares were sold, without a front-end sales charge but may be subject to a CDSC. Class R shares are sold only through retirement plans. Retirement plans that offer Class R shares may impose charges on those accounts. Class I and Class Y shares are sold to certain institutional investors or intermediaries without either a front-end sales charge or a CDSC, however, the intermediaries may impose charges on their accountholders who beneficially own Class I and Class Y shares. All classes of shares have identical rights and voting privileges with respect to the Fund in general and exclusive voting rights on matters that affect that class alone. Earnings, net assets and net asset value per share may differ due to each class having its own expenses, such as transfer and shareholder servicing agent fees and shareholder communications, directly attributable to that class. Class A, B, C and R shares have separate distribution and/or service plans under which they pay fees. Class I and Class Y shares do not pay such fees. Class B shares will automatically convert to Class A shares 72 months after the date of purchase.
The following is a summary of significant accounting policies followed in the Fund’s preparation of financial statements in accordance with accounting principles generally accepted in the United States (“U.S. GAAP”).
2. Significant Accounting Policies
Security Valuation. All investments in securities are recorded at their estimated fair value, as described in Note 3.
Basis for Consolidation. The Fund has established a Cayman Islands exempted company, Oppenheimer Fundamental Alternatives Fund (Cayman) Ltd., which is wholly-owned and controlled by the Fund (the “Subsidiary”). The Fund and Subsidiary are both managed by the Manager. The Fund may invest up to 25% of its total assets in the Subsidiary. The Subsidiary invests primarily in commodity-linked derivatives (including commodity futures, financial futures, options and swap contracts) and certain fixed-income securities and other investments that may serve as margin or collateral for its derivatives positions. The Fund applies its investment restrictions and compliance policies and procedures, on a look-through basis, to
66 OPPENHEIMER FUNDAMENTAL ALTERNATIVES FUND
2. Significant Accounting Policies (Continued)
the Subsidiary.
The financial statements have been consolidated and include accounts of the Fund and the Subsidiary. Accordingly, all inter-company transactions and balances have been eliminated. At period end, the Fund owned 13,307 shares with net assets of $39,200,500 in the Subsidiary.
Other financial information at period end:
| | | | | | | | |
Total market value of investments | | $ | | | | | 39,204,476 | |
Net assets | | $ | | | | | 39,200,500 | |
Net income (loss) | | $ | | | | | (353,967) | |
Net realized gain (loss) | | $ | | | | | — | |
Net change in unrealized appreciation/depreciation | | $ | | | | | (396,784) | |
Foreign Currency Translation. The books and records of the Fund are maintained in U.S. dollars. Any foreign currency amounts are translated into U.S. dollars on the following basis:
(1) Value of investment securities, other assets and liabilities — at the exchange rates prevailing at Market Close as described in Note 3.
(2) Purchases and sales of investment securities, income and expenses — at the rates of exchange prevailing on the respective dates of such transactions.
Although the net assets and the values are presented at the foreign exchange rates at Market Close, the Fund does not isolate the portion of the results of operations resulting from changes in foreign exchange rates on investments from the fluctuations arising from changes in prices of securities held. Such fluctuations are included with the net realized and unrealized gains or losses from investments shown in the Consolidated Statement of Operations.
For securities, which are subject to foreign withholding tax upon disposition, realized gains or losses on such securities are recorded net of foreign withholding tax.
Reported net realized foreign exchange gains or losses arise from sales of foreign currencies, currency gains or losses realized between the trade and settlement dates on securities transactions, the difference between the amounts of dividends, interest, and foreign withholding tax reclaims recorded on the Fund’s books, and the U.S. dollar equivalent of the amounts actually received or paid. Net unrealized foreign exchange gains and losses arise from changes in the value of assets and liabilities other than investments in securities, resulting from changes in the exchange rate.
Allocation of Income, Expenses, Gains and Losses. Income, expenses (other than those attributable to a specific class), gains and losses are allocated on a daily basis to each class of shares based upon the relative proportion of net assets represented by such class. Operating expenses directly attributable to a specific class are charged against the operations of that class.
Dividends and Distributions to Shareholders. Dividends and distributions to shareholders, which are determined in accordance with income tax regulations and may differ from U.S. GAAP, are recorded on the ex-dividend date. Income and capital gain distributions, if any, are declared and paid annually or at other times as deemed necessary by the Manager.
67 OPPENHEIMER FUNDAMENTAL ALTERNATIVES FUND
NOTES TO
CONSOLIDATED FINANCIAL STATEMENTS Continued
2. Significant Accounting Policies (Continued)
Investment Income. Dividend income is recorded on the ex-dividend date or upon ex-dividend notification in the case of certain foreign dividends where the ex-dividend date may have passed. Non-cash dividends included in dividend income, if any, are recorded at the fair value of the securities received. Withholding taxes on foreign dividends, if any, and capital gains taxes on foreign investments, if any, have been provided for in accordance with the Fund’s understanding of the applicable tax rules and regulations. Interest income is recognized on an accrual basis. Discount and premium, which are included in interest income on the Consolidated Statement of Operations, are amortized or accreted daily.
Return of Capital Estimates. Distributions received from the Fund’s investments in Real Estate Investments Trusts (REITs), generally are comprised of income and return of capital. The Fund records investment income and return of capital based on estimates. Such estimates are based on historical information available from each REIT and other industry sources. These estimates may subsequently be revised based on information received from REITs after their tax reporting periods are concluded.
Custodian Fees. “Custodian fees and expenses” in the Statement of Operations may include interest expense incurred by the Fund on any cash overdrafts of its custodian account during the period. Such cash overdrafts may result from the effects of failed trades in portfolio securities and from cash outflows resulting from unanticipated shareholder redemption activity. Prior to July 17, 2017, the Fund paid interest to its custodian on such cash overdrafts, to the extent they were not offset by positive cash balances maintained by the Fund, when applicable, at a rate equal to the negative rolling average balance at an average Federal Funds Rate plus 0.50%. This rate increased to the Federal Funds Rate plus 2.00% effective July 17, 2017. The “Reduction to custodian expenses” line item, if applicable, represents earnings on cash balances maintained by the Fund during the period. Such interest expense and other custodian fees may be paid with these earnings.
Security Transactions. Security transactions are recorded on the trade date. Realized gains and losses on securities sold are determined on the basis of identified cost.
Indemnifications. The Fund’s organizational documents provide current and former Trustees and officers with a limited indemnification against liabilities arising in connection with the performance of their duties to the Fund. In the normal course of business, the Fund may also enter into contracts that provide general indemnifications. The Fund’s maximum exposure under these arrangements is unknown as this would be dependent on future claims that may be made against the Fund. The risk of material loss from such claims is considered remote.
Federal Taxes. The Fund intends to comply with provisions of the Internal Revenue Code applicable to regulated investment companies and to distribute substantially all of its investment company taxable income, including any net realized gain on investments not offset by capital loss carryforwards, if any, to shareholders. Therefore, no federal income or excise
68 OPPENHEIMER FUNDAMENTAL ALTERNATIVES FUND
2. Significant Accounting Policies (Continued)
tax provision is required, however, during the reporting period, the Fund paid federal excise tax of $1. The Fund files income tax returns in U.S. federal and applicable state jurisdictions. The statute of limitations on the Fund’s tax return filings generally remains open for the three preceding fiscal reporting period ends. The Fund has analyzed its tax positions for the fiscal year ended October 31, 2017, including open tax years, and does not believe there are any uncertain tax positions requiring recognition in the Fund’s financial statements.
Subchapter M requires, among other things, that at least 90% of the Fund’s gross income be derived from securities or derived with respect to its business of investing in securities (typically referred to as “qualifying income”). Income from commodity-linked derivatives may not be treated as “qualifying income” for purposes of the 90% gross income requirement. The Internal Revenue Service (IRS) has previously issued a number of private letter rulings which conclude that income derived from commodity index-linked notes and investments in a wholly-owned subsidiary will be “qualifying income.” As a result, the Fund will gain exposure to commodities through commodity-linked notes and its wholly-owned subsidiary.
The IRS has suspended the granting of private letter rulings pending further review. As a result, there can be no assurance that the IRS will not change its position with respect to commodity-linked notes and wholly-owned subsidiaries. In addition, future legislation and guidance from the Treasury and the IRS may adversely affect the Fund’s ability to gain exposure to commodities through commodity-linked notes and its wholly-owned subsidiary.
The Fund is required to include in income for federal income tax purposes all of the subsidiary’s net income and gains whether or not such income is distributed by the subsidiary. Net income and gains from the subsidiary are generally treated as ordinary income by the Fund, regardless of the character of the subsidiary’s underlying income. Net losses from the subsidiary do not pass through to the Fund for federal income tax purposes.
The tax components of capital shown in the following table represent distribution requirements the Fund must satisfy under the income tax regulations, losses the Fund may be able to offset against income and gains realized in future years and unrealized appreciation or depreciation of securities and other investments for federal income tax purposes.
| | | | | | | | | | | | |
Undistributed Net Investment Income | | Undistributed
Long-Term
Gain | | | Accumulated
Loss
Carryforward1,2,3 | | | Net Unrealized
Appreciation
Based on cost of
Securities and
Other Investments
for Federal Income
Tax Purposes | |
$17,260,133 | | | $— | | | | $67,146,270 | | | | $116,304,363 | |
1. At period end, the Fund had $67,146,270 of net capital loss carryforward available to offset future realized capital gains, if any, and thereby reduce future taxable gain distributions. Details of the capital loss carryforwards are included in the table below. Capital loss carryovers with no expiration, if any, must be utilized prior to those with expiration dates.
| | | | |
| Expiring | |
No expiration | | $ | 67,146,270 | |
69 OPPENHEIMER FUNDAMENTAL ALTERNATIVES FUND
NOTES TO
CONSOLIDATED FINANCIAL STATEMENTS Continued
2. Significant Accounting Policies (Continued)
2. During the reporting period, the Fund did not utilize any capital loss carryforward.
3. During the previous reporting period, the Fund did not utilize any capital loss carryforward.
Net investment income (loss) and net realized gain (loss) may differ for financial statement and tax purposes. The character of dividends and distributions made during the fiscal year from net investment income or net realized gains are determined in accordance with federal income tax requirements, which may differ from the character of net investment income or net realized gains presented in those financial statements in accordance with U.S. GAAP. Also, due to timing of dividends and distributions, the fiscal year in which amounts are distributed may differ from the fiscal year in which the income or net realized gain was recorded by the Fund.
Accordingly, the following amounts have been reclassified for the reporting period. Net assets of the Fund were unaffected by the reclassifications.
| | | | | | | | |
Increase to Paid-in Capital | | Reduction to Accumulated Net Investment
Income | | | Reduction to Accumulated Net
Realized Loss on Investments | |
$1,031,307 | | | $1,893,247 | | | | $861,940 | |
The tax character of distributions paid during the reporting periods:
| | | | | | | | |
| | | Year Ended
October 31, 2017 | | | Year Ended
October 31, 2016 | |
Distributions paid from: | | | | | | | | |
Ordinary income | | $ | 5,206,758 | | | $ | 5,651,980 | |
The aggregate cost of securities and other investments and the composition of unrealized appreciation and depreciation of securities and other investments for federal income tax purposes at period end are noted in the following table. The primary difference between book and tax appreciation or depreciation of securities and other investments, if applicable, is attributable to the tax deferral of losses or tax realization of financial statement unrealized gain or loss.
| | | | |
Federal tax cost of securities | | $ | 1,112,980,254 | |
Federal tax cost of other investments | | | (310,053,964) | |
| | | | |
Total federal tax cost | | $ | 802,926,290 | |
| | | | |
Gross unrealized appreciation | | $ | 196,299,781 | |
Gross unrealized depreciation | | | (79,995,418) | |
| | | | |
Net unrealized appreciation | | $ | 116,304,363 | |
| | | | |
Use of Estimates. The preparation of financial statements in conformity with U.S. GAAP requires management to make estimates and assumptions that affect the reported amounts of assets and liabilities and disclosure of contingent assets and liabilities at the date of the financial statements and the reported amounts of increases and decreases in net assets from operations during the reporting period. Actual results could differ from those estimates.
70 OPPENHEIMER FUNDAMENTAL ALTERNATIVES FUND
3. Securities Valuation
The Fund calculates the net asset value of its shares as of 4:00 P.M. Eastern time, on each day the New York Stock Exchange (the “Exchange”) is open for trading, except in the case of a scheduled early closing of the Exchange, in which case the Fund will calculate net asset value of the shares as of the scheduled early closing time of the Exchange.
The Fund’s Board has adopted procedures for the valuation of the Fund’s securities and has delegated the day-to-day responsibility for valuation determinations under those procedures to the Manager. The Manager has established a Valuation Committee which is responsible for determining a fair valuation for any security for which market quotations are not readily available. The Valuation Committee’s fair valuation determinations are subject to review, approval and ratification by the Fund’s Board at least quarterly or more frequently, if necessary.
Valuation Methods and Inputs
Securities are valued primarily using unadjusted quoted market prices, when available, as supplied by third party pricing services or broker-dealers.
The following methodologies are used to determine the market value or the fair value of the types of securities described below:
Equity securities traded on a securities exchange (including exchange-traded derivatives other than futures and futures options) are valued based on the official closing price on the principal exchange on which the security is traded, as identified by the Manager, prior to the time when the Fund’s assets are valued. If the official closing price is unavailable, the security is valued at the last sale price on the principal exchange on which it is traded, or if no sales occurred, the security is valued at the mean between the quoted bid and asked prices. Over-the-counter equity securities are valued at the last published sale price, or if no sales occurred, at the mean between the quoted bid and asked prices. Events occurring after the close of trading on foreign exchanges may result in adjustments to the valuation of foreign securities to more accurately reflect their fair value as of the time when the Fund’s assets are valued.
Shares of a registered investment company that are not traded on an exchange are valued at that investment company’s net asset value per share.
Corporate and government debt securities (of U.S. or foreign issuers) and municipal debt securities, short-term notes, mortgage-backed securities, collateralized mortgage obligations, and asset-backed securities are valued at the mean between the bid and asked prices utilizing evaluated prices obtained from third party pricing services or broker-dealers who may use matrix pricing methods to determine the evaluated prices. Pricing services generally price debt securities assuming orderly transactions of an institutional “round lot” size, but some trades may occur in smaller, “odd lot” sizes, sometimes at lower prices than institutional round lot trades. Standard inputs generally considered by third-party pricing vendors include reported trade data, broker-dealer price quotations, benchmark yields, issuer spreads on comparable securities, the credit quality, yield, maturity, as well as other appropriate factors.
Loans are valued at the mean between the bid and asked prices utilizing evaluated prices obtained from third party pricing services or broker-dealers. Standard inputs generally considered by third-party pricing vendors include information obtained from market
71 OPPENHEIMER FUNDAMENTAL ALTERNATIVES FUND
NOTES TO
CONSOLIDATED FINANCIAL STATEMENTS Continued
3. Securities Valuation (Continued)
participants regarding broker-dealer price quotations.
Structured securities, swaps, swaptions, and other over-the-counter derivatives are valued utilizing evaluated prices obtained from third party pricing services or broker-dealers. Standard inputs generally considered by third-party pricing vendors include market information relevant to the underlying reference asset such as the price of financial instruments, stock market indices, foreign currencies, interest rate spreads, commodities, credit spreads, credit event probabilities, index values, individual security values, forward interest rates, variable interest rates, volatility measures, and forward currency rates, or the occurrence of other specific events.
Forward foreign currency exchange contracts are valued utilizing current and forward currency rates obtained from third party pricing services. When the settlement date of a contract is an interim date for which a quotation is not available, interpolated values are derived using the nearest dated forward currency rate.
Futures contracts and futures options traded on a commodities or futures exchange will be valued at the final settlement price or official closing price on the principal exchange as reported by such principal exchange at its trading session ending at, or most recently prior to, the time when the Fund’s assets are valued.
Securities for which market quotations are not readily available or a significant event has occurred that would materially affect the value of the security, the security is fair valued either (i) by a standardized fair valuation methodology applicable to the security type or the significant event as previously approved by the Valuation Committee and the Fund’s Board or (ii) as determined in good faith by the Manager’s Valuation Committee. The Valuation Committee considers all relevant facts that are reasonably available, through either public information or information available to the Manager, when determining the fair value of a security. Those standardized fair valuation methodologies include, but are not limited to, valuing securities at the last sale price or initially at cost and subsequently adjusting the value based on: changes in company specific fundamentals, changes in an appropriate securities index, or changes in the value of similar securities which may be further adjusted for any discounts related to security-specific resale restrictions. When possible, such methodologies use observable market inputs such as unadjusted quoted prices of similar securities, observable interest rates, currency rates and yield curves. The methodologies used for valuing securities are not necessarily an indication of the risks associated with investing in those securities nor can it be assured that the Fund can obtain the fair value assigned to a security if it were to sell the security.
To assess the continuing appropriateness of security valuations, the Manager regularly compares prior day prices and sale prices to the current day prices and challenges those prices exceeding certain tolerance levels with the third party pricing service or broker source. For those securities valued by fair valuations, whether through a standardized fair valuation methodology or a fair valuation determination, the Valuation Committee reviews and affirms the reasonableness of the valuations based on such methodologies and fair valuation determinations on a regular basis after considering all relevant information that is reasonably available.
72 OPPENHEIMER FUNDAMENTAL ALTERNATIVES FUND
3. Securities Valuation (Continued)
Classifications
Each investment asset or liability of the Fund is assigned a level at measurement date based on the significance and source of the inputs to its valuation. Various data inputs may be used in determining the value of each of the Fund’s investments as of the reporting period end. These data inputs are categorized in the following hierarchy under applicable financial accounting standards:
1) Level 1-unadjusted quoted prices in active markets for identical assets or liabilities (including securities actively traded on a securities exchange)
2) Level 2-inputs other than unadjusted quoted prices that are observable for the asset or liability (such as unadjusted quoted prices for similar assets and market corroborated inputs such as interest rates, prepayment speeds, credit risks, etc.)
3) Level 3-significant unobservable inputs (including the Manager’s own judgments about assumptions that market participants would use in pricing the asset or liability).
The inputs used for valuing securities are not necessarily an indication of the risks associated with investing in those securities.
The Fund classifies each of its investments in investment companies which are publicly offered as Level 1. Investment companies that are not publicly offered, if any, are classified as Level 2 in the fair value hierarchy.
The table below categorizes amounts that are included in the Fund’s Consolidated Statement of Assets and Liabilities at period end based on valuation input level:
| | | | | | | | | | | | | | | | |
| | | Level 1— Unadjusted Quoted Prices | | | Level 2— Other Significant Observable Inputs | | | Level 3— Significant Unobservable Inputs | | | Value | |
Assets Table | | | | | | | | | | | | | | | | |
Investments, at Value: | | | | | | | | | | | | | | | | |
Common Stocks | | | | | | | | | | | | | | | | |
Consumer Discretionary | | $ | 14,699,006 | | | $ | 406,284 | | | $ | 63,875 | | | $ | 15,169,165 | |
Consumer Staples | | | 46,362,102 | | | | — | | | | — | | | | 46,362,102 | |
Energy | | | 69,698,740 | | | | 31,652 | | | | — | | | | 69,730,392 | |
Financials | | | 119,916,296 | | | | 107,750 | | | | — | | | | 120,024,046 | |
Health Care | | | 100,693,182 | | | | 9,268,561 | | | | 90 | | | | 109,961,833 | |
Industrials | | | 130,929,364 | | | | — | | | | — | | | | 130,929,364 | |
Information Technology | | | 104,228,554 | | | | — | | | | — | | | | 104,228,554 | |
Materials | | | 41,762,159 | | | | — | | | | — | | | | 41,762,159 | |
Telecommunication Services | | | 32,074,542 | | | | — | | | | — | | | | 32,074,542 | |
Utilities | | | 23,609,967 | | | | — | | | | — | | | | 23,609,967 | |
Preferred Stocks | | | — | | | | 12,920,415 | | | | — | | | | 12,920,415 | |
Rights, Warrants and Certificates | | | — | | | | 2,805 | | | | — | | | | 2,805 | |
Asset-Backed Securities | | | — | | | | 58,648,277 | | | | — | | | | 58,648,277 | |
Mortgage-Backed Obligations | | | — | | | | 55,097,678 | | | | — | | | | 55,097,678 | |
Non-Convertible Corporate Bonds and Notes | | | — | | | | 158,074,653 | | | | — | | | | 158,074,653 | |
73 OPPENHEIMER FUNDAMENTAL ALTERNATIVES FUND
NOTES TO
CONSOLIDATED FINANCIAL STATEMENTS Continued
3. Securities Valuation (Continued)
| | | | | | | | | | | | | | | | |
| | | Level 1— Unadjusted Quoted Prices | | | Level 2— Other Significant Observable Inputs | | | Level 3—
Significant Unobservable Inputs | | | Value | |
Investments, at Value: (Continued) | | | | | | | | | | | | | |
Convertible Corporate Bond and Note | | $ | — | | | $ | 6,615,500 | | | $ | — | | | $ | 6,615,500 | |
Corporate Loans | | | — | | | | 117,586,358 | | | | 2,225,365 | | | | 119,811,723 | |
Structured Security | | | — | | | | — | | | | — | | | | — | |
Exchange-Traded Option Purchased | | | 4,583,800 | | | | — | | | | — | | | | 4,583,800 | |
Over-the-Counter Option Purchased | | | — | | | | 1,217 | | | | — | | | | 1,217 | |
Over-the-Counter Interest Rate | | | | | | | | | | | | | | | | |
Swaptions Purchased | | | — | | | | 2,412,458 | | | | — | | | | 2,412,458 | |
Short-Term Notes | | | — | | | | 78,520,708 | | | | — | | | | 78,520,708 | |
Investment Companies | | | 64,915,964 | | | | — | | | | — | | | | 64,915,964 | |
| | | | |
Total Investments, at Value | | | 753,473,676 | | | | 499,694,316 | | | | 2,289,330 | | | | 1,255,457,322 | |
Other Financial Instruments: | | | | | | | | | | | | | | | | |
Centrally cleared swaps, at value | | | — | | | | 2,507,871 | | | | — | | | | 2,507,871 | |
Futures contracts | | | 336,217 | | | | — | | | | — | | | | 336,217 | |
Forward currency exchange contracts | | | — | | | | 2,493,995 | | | | — | | | | 2,493,995 | |
| | | | |
Total Assets | | $ | 753,809,893 | | | $ | 504,696,182 | | | $ | 2,289,330 | | | $ | 1,260,795,405 | |
| | | | |
| | | | |
Liabilities Table | | | | | | | | | | | | | | | | |
Other Financial Instruments: | | | | | | | | | | | | | | | | |
Common Stock Securities Sold Short | | $ | (306,549,917 | ) | | $ | (53,339,331 | ) | | $ | — | | | $ | (359,889,248) | |
Swaps, at value | | | — | | | | (5,656,855 | ) | | | — | | | | (5,656,855) | |
Centrally cleared swaps, at value | | | — | | | | (3,239,172 | ) | | | — | | | | (3,239,172) | |
Options written, at value | | | — | | | | — | | | | — | | | | — | |
Futures contracts | | | (1,227,774 | ) | | | — | | | | — | | | | (1,227,774) | |
Forward currency exchange contracts | | | — | | | | (1,454,107 | ) | | | — | | | | (1,454,107) | |
| | | | |
Total Liabilities | | $ | (307,777,691 | ) | | $ | (63,689,465 | ) | | $ | — | | | $ | (371,467,156) | |
| | | | |
Forward currency exchange contracts and futures contracts, if any, are reported at their unrealized appreciation/depreciation at measurement date, which represents the change in the contract’s value from trade date. All additional assets and liabilities included in the above table are reported at their market value at measurement date.
The table below shows the transfers between Level 2 and Level 3. The Fund’s policy is to recognize transfers in and transfers out as of the beginning of the reporting period.
| | | | | | | | | | | | | | | | |
| | | Transfers into Level 2* | | | Transfers out of Level 2** | | | Transfers into Level 3** | | | Transfers out of Level 3* | |
Assets Table | | | | | | | | | | | | | | | | |
Investments, at Value: | | | | | | | | | | | | | | | | |
Corporate Loans | | $ | 136,165 | | | $ | (1,066,547 | ) | | $ | 1,066,547 | | | $ | (136,165) | |
| | | | | | | | | | | | | | | | |
Total Assets | | $ | 136,165 | | | $ | (1,066,547 | ) | | $ | 1,066,547 | | | $ | (136,165) | |
| | | | | | | | | | | | | | | | |
* Transferred from Level 3 to Level 2 due to the availability of market data for this security.
** Transferred from Level 2 to Level 3 because of the lack of observable market data.
74 OPPENHEIMER FUNDAMENTAL ALTERNATIVES FUND
4. Investments and Risks
Investments in Affiliated Funds. The Fund is permitted to invest in other mutual funds advised by the Manager (“Affiliated Funds”). Affiliated Funds are open-end management investment companies registered under the 1940 Act, as amended. The Manager is the investment adviser of, and the Sub-Adviser provides investment and related advisory services to, the Affiliated Funds. When applicable, the Fund’s investments in Affiliated Funds are included in the Consolidated Statement of Investments. Shares of Affiliated Funds are valued at their net asset value per share. As a shareholder, the Fund is subject to its proportional share of the Affiliated Funds’ expenses, including their management fee. The Manager will waive fees and/or reimburse Fund expenses in an amount equal to the indirect management fees incurred through the Fund’s investment in the Affiliated Funds.
Each of the Affiliated Funds in which the Fund invests has its own investment risks, and those risks can affect the value of the Fund’s investments and therefore the value of the Fund’s shares. To the extent that the Fund invests more of its assets in one Affiliated Fund than in another, the Fund will have greater exposure to the risks of that Affiliated Fund.
Investments in Money Market Instruments. The Fund is permitted to invest its free cash balances in money market instruments to provide liquidity or for defensive purposes. The Fund may invest in money market instruments by investing in Class E shares of Oppenheimer Institutional Government Money Market Fund (“IGMMF”), which is an Affiliated Fund. IGMMF is regulated as a money market fund under the 1940 Act, as amended. The Fund may also invest in money market instruments directly or in other affiliated or unaffiliated money market funds.
Structured Securities. The Fund invests in structured securities whose market values, interest rates and/or redemption prices are linked to the performance of underlying foreign currencies, interest rate spreads, stock market indices, prices of individual securities, commodities or other financial instruments or the occurrence of other specific events. The structured securities are often leveraged, increasing the volatility of each note’s market value relative to the change in the underlying linked financial element or event. Fluctuations in value of these securities are recorded as unrealized gains and losses in the accompanying Statement of Operations in the annual and semiannual reports. The Fund records a realized gain or loss when a structured security is sold or matures.
Loans. The Fund invests in loans made to U.S. and foreign borrowers that are corporations, partnerships or other business entities. The Fund will do so directly as an original lender or by assignment or indirectly through participation agreements or certain derivative instruments. While many of these loans will be collateralized, the Fund can also invest in uncollateralized loans. Loans are often issued in connection with recapitalizations, acquisitions, leveraged buyouts, and refinancing of borrowers. The loans often pay interest at rates that float above (or are adjusted periodically based on) a benchmark that reflects current interest rates although the Fund can also invest in loans with fixed interest rates.
75 OPPENHEIMER FUNDAMENTAL ALTERNATIVES FUND
NOTES TO
CONSOLIDATED FINANCIAL STATEMENTS Continued
4. Investments and Risks (Continued)
Securities on a When-Issued or Delayed Delivery Basis. The Fund may purchase securities on a “when-issued” basis, and may purchase or sell securities on a “delayed delivery” basis. “When-issued” or “delayed delivery” refers to securities whose terms and indenture are available and for which a market exists, but which are not available for immediate delivery. Delivery and payment for securities that have been purchased by the Fund on a when-issued basis normally takes place within six months and possibly as long as two years or more after the trade date. During this period, such securities do not earn interest, are subject to market fluctuation and may increase or decrease in value prior to their delivery. The purchase of securities on a when-issued basis may increase the volatility of the Fund’s net asset value to the extent the Fund executes such transactions while remaining substantially fully invested. When the Fund engages in when-issued or delayed delivery transactions, it relies on the buyer or seller, as the case may be, to complete the transaction. Their failure to do so may cause the Fund to lose the opportunity to obtain or dispose of the security at a price and yield it considers advantageous. The Fund may also sell securities that it purchased on a when-issued basis or forward commitment prior to settlement of the original purchase.
At period end, the Fund had purchased securities issued on a when-issued or delayed delivery basis and sold securities issued on a delayed delivery basis as follows:
| | | | |
| | | When-Issued or
Delayed Delivery
Basis Transactions | |
Purchased securities | | | $6,339,357 | |
| |
Sold securities | | | 189,655 | |
Restricted Securities. At period end, investments in securities included issues that are restricted. A restricted security may have a contractual restriction on its resale and is valued under methods approved by the Board of Trustees as reflecting fair value. Securities that are restricted are marked with an applicable footnote on the Consolidated Statement of Investments. Restricted securities are reported on a schedule following the Consolidated Statement of Investments.
Equity Security Risk. Stocks and other equity securities fluctuate in price. The value of the Fund’s portfolio may be affected by changes in the equity markets generally. Equity markets may experience significant short-term volatility and may fall sharply at times. Different markets may behave differently from each other and U.S. equity markets may move in the opposite direction from one or more foreign stock markets. Adverse events in any part of the equity or fixed-income markets may have unexpected negative effects on other market segments.
The prices of individual equity securities generally do not all move in the same direction at the same time and a variety of factors can affect the price of a particular company’s securities. These factors may include, but are not limited to, poor earnings reports, a loss of customers, litigation against the company, general unfavorable performance of the company’s sector or industry, or changes in government regulations affecting the company or its industry.
76 OPPENHEIMER FUNDAMENTAL ALTERNATIVES FUND
4. Investments and Risks (Continued)
Credit Risk. Loans and debt securities are subject to credit risk. Credit risk relates to the ability of the borrower under a loan or issuer of a debt to meet interest or principal payments or both as they become due. The Fund may acquire securities that have missed an interest payment, and is not obligated to dispose of securities whose issuers subsequently miss an interest and/or principal payment.
Information concerning securities not accruing income at period end is as follows:
| | | | |
Cost | | $ | 1,476,690 | |
Market Value | | $ | 1,510,835 | |
Market Value as % of Net Assets | | | 0.12% | |
5. Market Risk Factors
The Fund’s investments in securities and/or financial derivatives may expose the Fund to various market risk factors:
Commodity Risk. Commodity risk relates to the change in value of commodities or commodity indexes as they relate to increases or decreases in the commodities market.
Commodities are physical assets that have tangible properties. Examples of these types of assets are crude oil, heating oil, metals, livestock, and agricultural products.
Credit Risk. Credit risk relates to the ability of the issuer of debt to meet interest and principal payments, or both, as they come due. In general, lower-grade, higher-yield debt securities are subject to credit risk to a greater extent than lower-yield, higher-quality securities.
Equity Risk. Equity risk relates to the change in value of equity securities as they relate to increases or decreases in the general market.
Foreign Exchange Rate Risk. Foreign exchange rate risk relates to the change in the U.S. dollar value of a security held that is denominated in a foreign currency. The U.S. dollar value of a foreign currency denominated security will decrease as the dollar appreciates against the currency, while the U.S. dollar value will increase as the dollar depreciates against the currency.
Interest Rate Risk. Interest rate risk refers to the fluctuations in value of fixed-income securities resulting from the inverse relationship between price and yield. For example, an increase in general interest rates will tend to reduce the market value of already issued fixed-income investments, and a decline in general interest rates will tend to increase their value. In addition, debt securities with longer maturities, which tend to have higher yields, are subject to potentially greater fluctuations in value from changes in interest rates than obligations with shorter maturities.
Volatility Risk. Volatility risk refers to the magnitude of the movement, but not the direction of the movement, in a financial instrument’s price over a defined time period. Large increases or decreases in a financial instrument’s price over a relative time period typically indicate greater volatility risk, while small increases or decreases in its price typically indicate lower volatility risk.
77 OPPENHEIMER FUNDAMENTAL ALTERNATIVES FUND
NOTES TO
CONSOLIDATED FINANCIAL STATEMENTS Continued
6. Use of Derivatives
The Fund’s investment objective not only permits the Fund to purchase investment securities, it also allows the Fund to enter into various types of derivatives contracts, including, but not limited to, futures contracts, forward currency exchange contracts, credit default swaps, interest rate swaps, total return swaps, variance swaps and purchased and written options. In doing so, the Fund will employ strategies in differing combinations to permit it to increase, decrease, or change the level or types of exposure to market risk factors. These instruments may allow the Fund to pursue its objectives more quickly and efficiently than if it were to make direct purchases or sales of securities capable of effecting a similar response to market factors. Such contracts may be entered into through a bilateral over-the-counter (“OTC”) transaction, or through a securities or futures exchange and cleared through a clearinghouse.
Derivatives may have little or no initial cash investment relative to their market value exposure and therefore can produce significant gains or losses in excess of their cost due to changes in the market risk factors and the overall market. This use of embedded leverage allows the Fund to increase its market value exposure relative to its net assets and can substantially increase the volatility of the Fund’s performance. In instances where the Fund is using derivatives to decrease, or hedge, exposures to market risk factors for securities held by the Fund, there are also risks that those derivatives may not perform as expected resulting in losses for the combined or hedged positions. Some derivatives have the potential for unlimited loss, regardless of the size of the Fund’s initial investment.
Additional associated risks from investing in derivatives also exist and potentially could have significant effects on the valuation of the derivative and the Fund. Typically, the associated risks are not the risks that the Fund is attempting to increase or decrease exposure to, per its investment objectives, but are the additional risks from investing in derivatives. Examples of these associated risks are liquidity risk, which is the risk that the Fund will not be able to sell the derivative in the open market in a timely manner, and counterparty credit risk, which is the risk that the counterparty will not fulfill its obligation to the Fund.
The Fund’s actual exposures to these market risk factors and associated risks during the period are discussed in further detail, by derivative type, below.
Forward Currency Exchange Contracts
The Fund may enter into forward currency exchange contracts (“forward contracts”) for the purchase or sale of a foreign currency at a negotiated rate at a future date. Such contracts are traded in the OTC inter-bank currency dealer market.
Forward contracts are reported on a schedule following the Consolidated Statement of Investments. The unrealized appreciation (depreciation) is reported in the Consolidated Statement of Assets and Liabilities as a receivable (or payable) and in the Consolidated Statement of Operations within the change in unrealized appreciation (depreciation). At contract close, the difference between the original cost of the contract and the value at the close date is recorded as a realized gain (loss) in the Consolidated Statement of Operations.
The Fund may enter into forward foreign currency exchange contracts in order to decrease exposure to foreign exchange rate risk associated with either specific transactions or portfolio instruments or to increase exposure to foreign exchange rate risk.
78 OPPENHEIMER FUNDAMENTAL ALTERNATIVES FUND
6. Use of Derivatives (Continued)
During the reporting period, the Fund had daily average contract amounts on forward contracts to buy and sell of $54,727,500 and $125,427,344, respectively.
Additional associated risk to the Fund includes counterparty credit risk. Counterparty credit risk arises from the possibility that the counterparty to a forward contract will default and fail to perform its obligations to the Fund.
Futures Contracts
A futures contract is a commitment to buy or sell a specific amount of a commodity, financial instrument or currency at a negotiated price on a stipulated future date. The Fund may buy and sell futures contracts and may also buy or write put or call options on these futures contracts. Futures contracts and options thereon are generally entered into on a regulated futures exchange and cleared through a clearinghouse associated with the exchange.
Upon entering into a futures contract, the Fund is required to deposit either cash or securities (initial margin) in an amount equal to a certain percentage of the contract value in an account registered in the futures commission merchant’s name. Subsequent payments (variation margin) are paid to or from the futures commission merchant each day equal to the daily changes in the contract value. Such payments are recorded as unrealized gains and losses. Should the Fund fail to make requested variation margin payments, the futures commission merchant can gain access to the initial margin to satisfy the Fund’s payment obligations.
Futures contracts are reported on a schedule following the Consolidated Statement of Investments. Securities held by a futures commission merchant to cover initial margin requirements on open futures contracts are noted in the Consolidated Statement of Investments. Cash held by a futures commission merchant to cover initial margin requirements on open futures contracts and the receivable and/or payable for the daily mark to market for the variation margin are noted in the Consolidated Statement of Assets and Liabilities. The net change in unrealized appreciation and depreciation is reported in the Consolidated Statement of Operations. Realized gains (losses) are reported in the Consolidated Statement of Operations at the closing or expiration of futures contracts.
The Fund may purchase and/or sell financial futures contracts and options on futures contracts to gain exposure to, or decrease exposure to interest rate risk, equity risk, foreign exchange rate risk, volatility risk, or commodity risk.
During the reporting period, the Fund had an ending monthly average market value of $58,304,637 and $86,076,511 on futures contracts purchased and sold, respectively.
Additional associated risks of entering into futures contracts (and related options) include the possibility that there may be an illiquid market where the Fund is unable to liquidate the contract or enter into an offsetting position and, if used for hedging purposes, the risk that the price of the contract will correlate imperfectly with the prices of the Fund’s securities.
Option Activity
The Fund may buy and sell put and call options, or write put and call options. When an option is written, the Fund receives a premium and becomes obligated to sell or purchase the
79 OPPENHEIMER FUNDAMENTAL ALTERNATIVES FUND
NOTES TO
CONSOLIDATED FINANCIAL STATEMENTS Continued
6. Use of Derivatives (Continued)
underlying security, currency or other underlying financial instrument at a fixed price, upon exercise of the option.
Options can be traded through an exchange or through a privately negotiated arrangement with a dealer in an OTC transaction. Options traded through an exchange are generally cleared through a clearinghouse (such as The Options Clearing Corporation). The difference between the premium received or paid, and market value of the option, is recorded as unrealized appreciation or depreciation. The net change in unrealized appreciation or depreciation is reported in the Consolidated Statement of Operations. When an option is exercised, the cost of the security purchased or the proceeds of the security sale are adjusted by the amount of premium received or paid. Upon the expiration or closing of the option transaction, a gain or loss is reported in the Consolidated Statement of Operations.
Foreign Currency Options. The Fund may purchase or write call and put options on currencies to increase or decrease exposure to foreign exchange rate risk. A purchased call, or written put option becomes more valuable as the price of the underlying financial instrument appreciates relative to the strike price. A purchased put, or written call option becomes more valuable as the price of the underlying financial instrument depreciates relative to the strike price.
Index/Security Options. The Fund may purchase or write call and put options on individual equity securities and/or equity indexes to increase or decrease exposure to equity risk. A purchased call or written put option becomes more valuable as the price of the underlying financial instrument appreciates relative to the strike price. A purchased put or written call option becomes more valuable as the price of the underlying financial instrument depreciates relative to the strike price.
During the reporting period, the Fund had an ending monthly average market value of $885,552 and $965,987 on purchased call options and purchased put options, respectively.
Options written, if any, are reported in a schedule following the Consolidated Statement of Investments and as a liability in the Consolidated Statement of Assets and Liabilities. Securities held in collateral accounts to cover potential obligations with respect to outstanding written options are noted in the Consolidated Statement of Investments.
The risk in writing a call option is the market price of the underlying security increasing above the strike price and the option being exercised. The Fund must then purchase the underlying security at the higher market price and deliver it for the strike price or, if it owns the underlying security, deliver it at the strike price and forego any benefit from the increase in the price of the underlying security above the strike price. The risk in writing a put option is the market price of the underlying security decreasing below the strike price and the option being exercised. The Fund must then purchase the underlying security at the strike price when the market price of the underlying security is below the strike price. Alternatively, the Fund could also close out a written option position, in which case the risk is that the closing transaction will require a premium to be paid by the Fund that is greater than the premium the Fund received. When writing options, the Fund has the additional risk that there may be an illiquid market where the Fund is unable to close the contact. The risk in buying an option is that the Fund pays a premium for the option, and the option may be worth less than the premium paid
80 OPPENHEIMER FUNDAMENTAL ALTERNATIVES FUND
6. Use of Derivatives (Continued)
or expire worthless.
During the reporting period, the Fund had an ending monthly average market value of $193,999 on written put options.
Additional associated risks to the Fund include counterparty credit risk and liquidity risk.
Swap Contracts
The Fund may enter into swap contract agreements with a counterparty to exchange a series of cash flows based on either specified reference rates, the price or volatility of asset or non-asset references, or the occurrence of a credit event, over a specified period. Swaps can be executed in a bi-lateral privately negotiated arrangement with a dealer in an OTC transaction (“OTC swaps”) or executed on a regulated market. Certain swaps, regardless of the venue of their execution, are required to be cleared through a clearinghouse (“centrally cleared swaps”). Swap contracts may include interest rate, equity, debt, index, total return, credit default, currency, and volatility swaps.
Swap contracts are reported on a schedule following the Consolidated Statement of Investments. The values of centrally cleared swap and OTC swap contracts are aggregated by positive and negative values and disclosed separately on the Consolidated Statement of Assets and Liabilities. The unrealized appreciation (depreciation) related to the change in the valuation of the notional amount of the swap is combined with the accrued interest due to (owed by) the Fund, if any, at termination or settlement. The net change in this amount during the period is included on the Consolidated Statement of Operations. The Fund also records any periodic payments received from (paid to) the counterparty, including at termination, under such contracts as realized gain (loss) on the Consolidated Statement of Operations.
Swap contract agreements are exposed to the market risk factor of the specific underlying reference rate or asset. Swap contracts are typically more attractively priced compared to similar investments in related cash securities because they isolate the risk to one market risk factor and eliminate the other market risk factors. Investments in cash securities (for instance bonds) have exposure to multiple risk factors (credit and interest rate risk). Because swaps have embedded leverage, they can expose the Fund to substantial risk in the isolated market risk factor.
Credit Default Swap Contracts. A credit default swap is a contract that enables an investor to buy or sell protection against a defined-issuer credit event, such as the issuer’s failure to make timely payments of interest or principal on a debt security, bankruptcy or restructuring. The Fund may enter into credit default swaps either by buying or selling protection on a corporate issuer, sovereign issuer, or a basket or index of issuers (the “reference asset”).
The buyer of protection pays a periodic fee to the seller of protection based on the notional amount of the swap contract. The seller of protection agrees to compensate the buyer of protection for future potential losses as a result of a credit event on the reference asset. The contract effectively transfers the credit event risk of the reference asset from the buyer of protection to the seller of protection.
The ongoing value of the contract will fluctuate throughout the term of the contract
81 OPPENHEIMER FUNDAMENTAL ALTERNATIVES FUND
NOTES TO
CONSOLIDATED FINANCIAL STATEMENTS Continued
6. Use of Derivatives (Continued)
based primarily on the credit risk of the reference asset. If the credit quality of the reference asset improves relative to the credit quality at contract initiation, the buyer of protection may have an unrealized loss greater than the anticipated periodic fee owed. This unrealized loss would be the result of current credit protection being cheaper than the cost of credit protection at contract initiation. If the buyer elects to terminate the contract prior to its maturity, and there has been no credit event, this unrealized loss will become realized. If the contract is held to maturity, and there has been no credit event, the realized loss will be equal to the periodic fee paid over the life of the contract.
If there is a credit event, the buyer of protection can exercise its rights under the contract and receive a payment from the seller of protection equal to the notional amount of the swap less the market value of specified debt securities issued by the reference asset.
Upon exercise of the contract the difference between such value and the notional amount is recorded as realized gain (loss) and is included on the Consolidated Statement of Operations.
The Fund may purchase or sell credit protection through credit default swaps to increase or decrease exposure to the credit risk of individual issuers and/or indexes of issuers that are either unavailable or considered to be less attractive in the bond market.
The Fund has engaged in spread curve trades by simultaneously purchasing and selling protection through credit default swaps referenced to the same reference asset but with different maturities. Spread curve trades attempt to gain exposure to credit risk on a forward basis by realizing gains on the expected differences in spreads.
The Fund has purchased credit protection through credit default swaps to take an outright negative investment perspective on the credit risk of an individual issuer or basket or index of issuers as opposed to decreasing its credit risk exposure related to debt securities of such issuer(s) held by the Fund.
For the reporting period, the Fund had ending monthly average notional amounts of $144,835,472 and $58,128,200 on credit default swaps to buy protection and credit default swaps to sell protection, respectively.
Additional associated risks to the Fund include counterparty credit risk and liquidity risk.
Interest Rate Swap Contracts. An interest rate swap is an agreement between counterparties to exchange periodic payments based on interest rates. One cash flow stream will typically be a floating rate payment based upon a specified floating interest rate while the other is typically a fixed interest rate.
The Fund may enter into interest rate swaps in which it pays the fixed or floating interest rate in order to increase or decrease exposure to interest rate risk. Typically, if relative interest rates rise, floating payments under a swap agreement will be greater than the fixed payments.
For the reporting period, the Fund had ending monthly average notional amounts of $4,264,764 on interest rate swaps which pay a fixed rate.
Additional associated risks to the Fund include counterparty credit risk and liquidity risk.
At period end, the Fund had no interest rate swap agreements outstanding.
Total Return Swap Contracts. A total return swap is an agreement between
82 OPPENHEIMER FUNDAMENTAL ALTERNATIVES FUND
6. Use of Derivatives (Continued)
counterparties to exchange periodic payments based on the value of asset or non-asset references. One cash flow is typically based on a non-asset reference (such as an interest rate) and the other on the total return of a reference asset (such as a security or a basket of securities or securities index). The total return of the reference asset typically includes appreciation or depreciation on the reference asset, plus any interest or dividend payments.
Total return swap contracts are exposed to the market risk factor of the specific underlying financial instrument or index. Total return swaps are less standard in structure than other types of swaps and can isolate and/or include multiple types of market risk factors including equity risk, credit risk, and interest rate risk.
The Fund may enter into total return swaps on various equity securities or indexes to increase or decrease exposure to equity risk. These equity risk related total return swaps require the Fund to pay or receive a floating reference interest rate, and an amount equal to the opposite price movement of securities or an index (expressed as a percentage) multiplied by the notional amount of the contract. Equity leg payments equal to the positive price movement of the same securities or index (expressed as a percentage) multiplied by the notional amount of the contract and, in some cases, dividends paid on the securities.
Reference leg payments equal a floating reference interest rate and an amount equal to the negative price movement of the same securities or index (expressed as a percentage) multiplied by the notional amount of the contract.
For the reporting period, the Fund had ending monthly average notional amounts of $16,991,456 on total return swaps which are short the reference asset.
Additional associated risks to the Fund include counterparty credit risk and liquidity risk.
Swaption Transactions
The Fund may enter into a swaption contract which grants the purchaser the right, but not the obligation, to enter into a swap transaction at preset terms detailed in the underlying agreement within a specified period of time. The purchaser pays a premium to the swaption writer who bears the risk of unfavorable changes in the preset terms on the underlying swap.
Purchased swaptions are reported as a component of investments in the Consolidated Statement of Investments and the Consolidated Statement of Assets and Liabilities. Written swaptions are reported on a schedule following the Consolidated Statement of Investments and their value is reported as a separate asset or liability line item in the Consolidated Statement of Assets and Liabilities. The net change in unrealized appreciation or depreciation on written swaptions is separately reported in the Consolidated Statement of Operations. When a swaption is exercised, the cost of the swap is adjusted by the amount of premium paid or received. Upon the expiration or closing of an unexercised swaption contract, a gain or loss is reported in the Consolidated Statement of Operations for the amount of the premium paid or received.
The Fund generally will incur a greater risk when it writes a swaption than when it purchases a swaption. When the Fund writes a swaption it will become obligated, upon exercise of the swaption, according to the terms of the underlying agreement. Swaption contracts written by the Fund do not give rise to counterparty credit risk prior to exercise as
83 OPPENHEIMER FUNDAMENTAL ALTERNATIVES FUND
NOTES TO
CONSOLIDATED FINANCIAL STATEMENTS Continued
6. Use of Derivatives (Continued)
they obligate the Fund, not its counterparty, to perform. When the Fund purchases a swaption it only risks losing the amount of the premium it paid if the swaption expires unexercised. However, when the Fund exercises a purchased swaption there is a risk that the counterparty will fail to perform or otherwise default on its obligations under the swaption contract.
The Fund may purchase swaptions which give it the option to enter into an interest rate swap in which it pays a floating or fixed interest rate and receives a fixed or floating interest rate in order to increase or decrease exposure to interest rate risk. Purchasing the fixed portion of this swaption becomes more valuable as the reference interest rate decreases relative to the preset interest rate. Purchasing the floating portion of this swaption becomes more valuable as the reference interest rate increases relative to the preset interest rate.
The Fund may write swaptions which give it the obligation, if exercised by the purchaser, to enter into an interest rate swap in which it pays a fixed or floating interest rate and receives a floating or fixed interest rate in order to increase or decrease exposure to interest rate risk. A written swaption paying a fixed rate becomes more valuable as the reference interest rate increases relative to the preset interest rate. A written swaption paying a floating rate becomes more valuable as the reference interest rate decreases relative to the preset interest rate.
During the reporting period, the Fund had an ending monthly average market value of $2,982,284 on purchased swaptions.
At period end, the Fund had no written swaption contracts outstanding.
Counterparty Credit Risk. Derivative positions are subject to the risk that the counterparty will not fulfill its obligation to the Fund. The Fund intends to enter into derivative transactions with counterparties that the Manager believes to be creditworthy at the time of the transaction.
The Fund’s risk of loss from counterparty credit risk on OTC derivatives is generally limited to the aggregate unrealized gain netted against any collateral held by the Fund. For OTC options purchased, the Fund bears the risk of loss of the amount of the premiums paid plus the positive change in market values net of any collateral held by the Fund should the counterparty fail to perform under the contracts. Options written by the Fund do not typically give rise to counterparty credit risk, as options written generally obligate the Fund and not the counterparty to perform.
To reduce counterparty risk with respect to OTC transactions, the Fund has entered into master netting arrangements, established within the Fund’s International Swap and Derivatives Association, Inc. (“ISDA”) master agreements, which allow the Fund to make (or to have an entitlement to receive) a single net payment in the event of default (close-out netting) for outstanding payables and receivables with respect to certain OTC positions in swaps, options, swaptions, and forward currency exchange contracts for each individual counterparty. In addition, the Fund may require that certain counterparties post cash and/or securities in collateral accounts to cover their net payment obligations for those derivative contracts subject to ISDA master agreements. If the counterparty fails to perform under these contracts and agreements, the cash and/or securities will be made available to the Fund.
84 OPPENHEIMER FUNDAMENTAL ALTERNATIVES FUND
6. Use of Derivatives (Continued)
At period end, the Fund has required certain counterparties to post collateral of $1,689,760.
ISDA master agreements include credit related contingent features which allow counterparties to OTC derivatives to terminate derivative contracts prior to maturity in the event that, for example, the Fund’s net assets decline by a stated percentage or the Fund fails to meet the terms of its ISDA master agreements, which would cause the Fund to accelerate payment of any net liability owed to the counterparty.
For financial reporting purposes, the Fund does not offset derivative assets and derivative liabilities that are subject to netting arrangements in the Consolidated Statement of Assets and Liabilities. Bankruptcy or insolvency laws of a particular jurisdiction may impose restrictions on or prohibitions against the right of offset in bankruptcy, insolvency or other events.
The Fund’s risk of loss from counterparty credit risk on exchange-traded derivatives cleared through a clearinghouse and for centrally cleared swaps is generally considered lower than as compared to OTC derivatives. However, counterparty credit risk exists with respect to initial and variation margin deposited/paid by the Fund that is held in futures commission merchant, broker and/or clearinghouse accounts for such exchange-traded derivatives and for centrally cleared swaps.
With respect to centrally cleared swaps, such transactions will be submitted for clearing, and if cleared, will be held in accounts at futures commission merchants or brokers that are members of clearinghouses. While brokers, futures commission merchants and clearinghouses are required to segregate customer margin from their own assets, in the event that a broker, futures commission merchant or clearinghouse becomes insolvent or goes into bankruptcy and at that time there is a shortfall in the aggregate amount of margin held by the broker, futures commission merchant or clearinghouse for all its customers, U.S. bankruptcy laws will typically allocate that shortfall on a pro-rata basis across all the broker’s, futures commission merchant’s or clearinghouse’s customers, potentially resulting in losses to the Fund.
There is the risk that a broker, futures commission merchant or clearinghouse will decline to clear a transaction on the Fund’s behalf, and the Fund may be required to pay a termination fee to the executing broker with whom the Fund initially enters into the transaction.
Clearinghouses may also be permitted to terminate centrally cleared swaps at any time. The Fund is also subject to the risk that the broker or futures commission merchant will improperly use the Fund’s assets deposited/paid as initial or variation margin to satisfy payment obligations of another customer. In the event of a default by another customer of the broker or futures commission merchant, the Fund might not receive its variation margin payments from the clearinghouse, due to the manner in which variation margin payments are aggregated for all customers of the broker/futures commission merchant.
Collateral and margin requirements differ by type of derivative. Margin requirements are established by the broker, futures commission merchant or clearinghouse for exchange-traded and cleared derivatives, including centrally cleared swaps. Brokers, futures commission merchants and clearinghouses can ask for margin in excess of the regulatory minimum, or increase the margin amount, in certain circumstances.
85 OPPENHEIMER FUNDAMENTAL ALTERNATIVES FUND
NOTES TO
CONSOLIDATED FINANCIAL STATEMENTS Continued
6. Use of Derivatives (Continued)
Collateral terms are contract specific for OTC derivatives. For derivatives traded under an
ISDA master agreement, the collateral requirements are typically calculated by netting the mark to market amount for each transaction under such agreement and comparing that amount to the value of any collateral currently pledged by the Fund or the counterparty.
For financial reporting purposes, cash collateral that has been pledged to cover obligations of the Fund, if any, is reported separately on the Consolidated Statement of Assets and Liabilities as cash pledged as collateral. Non-cash collateral pledged by the Fund, if any, is noted in the Consolidated Statement of Investments. Generally, the amount of collateral due from or to a party must exceed a minimum transfer amount threshold (e.g. $250,000) before a transfer has to be made. To the extent amounts due to the Fund from its counterparties are not fully collateralized, contractually or otherwise, the Fund bears the risk of loss from counterparty nonperformance.
The following table presents by counterparty the Fund’s OTC derivative assets net of the related collateral pledged by the Fund at period end:
| | | | | | | | | | | | | | | | | | |
| | | | | | Gross Amounts Not Offset in the Consolidated Statement of Assets & Liabilities | | | |
Counterparty | | Gross Amounts Not Offset in the
Consolidated
Statement of Assets &
Liabilities* | | | Financial
Instruments
Available for
Offset | | | Financial
Instruments
Collateral
Received** | | | Cash Collateral Received** | | | Net Amount |
Bank of America NA $ | | | 748,604 | | | $ | – | | | $ | (733,724) | | | $ | – | | | $ 14,880 |
Citibank NA | | | 823,783 | | | | (823,783) | | | | – | | | | – | | | – |
Goldman Sachs | | | | | | | | | | | | | | | | | | |
International | | | 2,412,458 | | | | (2,412,458) | | | | – | | | | – | | | – |
JPMorgan Chase Bank | | | | | | | | | | | | | | | | | | |
NA | | | 113,247 | | | | (113,247) | | | | – | | | | – | | | – |
Toronto Dominion | | | | | | | | | | | | | | | | | | |
Bank | | | 809,578 | | | | – | | | | – | | | | – | | | 809,578 |
| | | |
| | $ | 4,907,670 | | | $ | (3,349,488) | | | $ | (733,724) | | | $ | – | | | $ 824,458 |
| | | |
*OTC derivatives are reported gross on the Consolidated Statement of Assets and Liabilities. Exchange traded options and margin related to centrally cleared swaps and futures, if any, are excluded from these reported amounts.
**Reported collateral posted for the benefit of the Fund within this table is limited to the net outstanding amount due from an individual counterparty. The collateral posted for the benefit of the Fund may exceed these amounts.
The following table presents by counterparty the Fund’s OTC derivative liabilities net of the related collateral pledged by the Fund at period end:
86 OPPENHEIMER FUNDAMENTAL ALTERNATIVES FUND
6. Use of Derivatives (Continued)
| | | | | | | | | | | | | | | | | | | | |
| | | | | | Gross Amounts Not Offset in the Consolidated Statement of Assets & Liabilities | | | | |
| Counterparty | | Gross Amounts Not Offset in the Consolidated
Statement of Assets &
Liabilities* | | | Financial
Instruments
Available for
Offset | | | Financial
Instruments
Collateral
Pledged** | | | Cash Collateral Pledged** | | | Net Amount | |
Barclays Bank plc | | $ | (75,811) | | | $ | – | | | $ | – | | | $ | 75,811 | | | $ | – | |
BNP Paribas | | | (394,655) | | | | – | | | | – | | | | 260,000 | | | | (134,655) | |
Citibank NA | | | (1,189,036) | | | | 823,783 | | | | – | | | | 365,253 | | | | – | |
Deutsche Bank AG | | | (527,332) | | | | – | | | | – | | | | 527,332 | | | | – | |
Goldman Sachs | | | | | | | | | | | | | | | | | | | | |
International | | | (3,803,124) | | | | 2,412,458 | | | | – | | | | 1,390,666 | | | | – | |
JPMorgan Chase Bank NA | | | (919,064) | | | | 113,247 | | | | – | | | | 805,817 | | | | – | |
Morgan Stanley | | | (201,940) | | | | – | | | | – | | | | – | | | | (201,940) | |
| | | | |
| | $ | (7,110,962) | | | $ | 3,349,488 | | | $ | – | | | $ | 3,424,879 | | | $ | (336,595) | |
| | | | |
*OTC derivatives are reported gross on the Consolidated Statement of Assets and Liabilities. Exchange traded options and margin related to centrally cleared swaps and futures, if any, are excluded from these reported amounts.
**Reported collateral pledged within this table is limited to the net outstanding amount due from the Fund. The securities pledged as collateral by the Fund as reported on the Consolidated Statement of Investments may exceed these amounts.
The following table presents the valuations of derivative instruments by risk exposure as reported within the Consolidated Statement of Assets and Liabilities at period end:
| | | | | | | | | | | | | | |
| | | Asset Derivatives | | | | | Liability Derivatives | |
Derivatives Not Accounted for as Hedging Instruments | | Consolidated Statement of Assets and Liabilities Location | | Value | | | | | Consolidated Statement of Assets and Liabilities Location | | Value | |
| Credit contracts | | | | | | | | | | Swaps, at value | | $ | 3,443,631 | |
| Equity contracts | | | | | | | | | | Swaps, at value | | | 2,213,224 | |
| Credit contracts | | Centrally cleared swaps, at value | | $ | 2,507,871 | | | | | Centrally cleared swaps, at value | | | 3,239,172 | |
| Interest rate contracts | | Variation margin receivable | | | 26,292 | * | | | | Variation margin payable | | | 119,993* | |
| Forward currency exchange contracts | | Unrealized appreciation on forward currency exchange contracts | | | 2,493,995 | | | | | Unrealized depreciation on forward currency exchange contracts | | | 1,454,107 | |
| Equity contracts | | Investments, at value | | | 4,583,800 | ** | | | | | | | | |
| Forward currency exchange contracts | | Investments, at value | | | 1,217 | ** | | | | | | | | |
| Interest rate contracts Investments, at value | | | 2,412,458 | ** | | | | | | | | |
| | | | | | | | | | | | | | |
| Total | | | | $ | 12,025,633 | | | | | | | $ | 10,470,127 | |
| | | | | | | | | | | | | | |
*Includes only the current day’s variation margin. Prior variation margin movements have been reflected in cash on
the Consolidated Statement of Assets and Liabilities upon receipt or payment.
**Amounts relate to purchased option contracts and purchased swaption contracts, if any.
87 OPPENHEIMER FUNDAMENTAL ALTERNATIVES FUND
NOTES TO
CONSOLIDATED FINANCIAL STATEMENTS Continued
6. Use of Derivatives (Continued)
The effect of derivative instruments on the Consolidated Statement of Operations is as follows:
| | | | | | | | | | | | |
Amount of Realized Gain or (Loss) Recognized on Derivatives | |
Derivatives Not Accounted for as Hedging Instruments | | Investment
transactions
in unaffiliated
companies* | | | Option
contracts
written | | | Futures
contracts | |
| |
Credit contracts | | $ | — | | | $ | — | | | $ | — | |
Equity contracts | | | (1,439,446 | ) | | | — | | | | — | |
Forward currency exchange contracts | | | 819,541 | | | | 383,210 | | | | — | |
Interest rate contracts | | | 1,788,442 | | | | — | | | | 544,435 | |
| | | | |
Total | | $ | 1,168,537 | | | $ | 383,210 | | | $ | 544,435 | |
| | | | |
| Amount of Realized Gain or (Loss) Recognized on Derivatives | |
| |
Derivatives Not Accounted for as Hedging Instruments | | Forward
currency
exchange
contracts | | | Swap contracts | | | Total | |
| |
Credit contracts | | $ | — | | | $ | (2,937,487 | ) | | $ | (2,937,487) | |
Equity contracts | | | — | | | | (3,685,725 | ) | | | (5,125,171) | |
Forward currency exchange contracts | | | 515,500 | | | | — | | | | 1,718,251 | |
Interest rate contracts | | | — | | | | (1,433,854 | ) | | | 899,023 | |
| | | | |
Total | | $ | 515,500 | | | $ | (8,057,066 | ) | | $ | (5,445,384) | |
| | | | |
| | | |
*Includes purchased option contracts and purchased swaption contracts, if any. | | | | | | | | | | | | |
| Amount of Change in Unrealized Gain or (Loss) Recognized on Derivatives | |
| |
Derivatives Not Accounted for as Hedging Instruments | | Investment
transactions
in unaffiliated
companies* | | | Option
contracts
written | | | Futures
contracts | |
| |
Credit contracts | | $ | — | | | $ | — | | | $ | — | |
Equity contracts | | | 2,363,154 | | | | — | | | | — | |
Forward currency exchange contracts | | | (1,107,080 | ) | | | (44,970 | ) | | | — | |
Interest rate contracts | | | (1,975,904 | ) | | | — | | | | (1,584,737) | |
| | | | |
Total | | $ | (719,830 | ) | | $ | (44,970 | ) | | $ | (1,584,737) | |
| | | | |
|
| Amount of Change in Unrealized Gain or (Loss) Recognized on Derivatives | |
| |
Derivatives Not Accounted for as Hedging Instruments | | Forward
currency
exchange
contracts | | | Swap contracts | | | Total | |
| |
Credit contracts | | $ | — | | | $ | 278,049 | | | $ | 278,049 | |
Equity contracts | | | — | | | | 1,989,379 | | | | 4,352,533 | |
Forward currency exchange contracts | | | (977,076 | ) | | | — | | | | (2,129,126) | |
Interest rate contracts | | | — | | | | 109,171 | | | | (3,451,470) | |
| | | | |
Total | | $ | (977,076 | ) | | $ | 2,376,599 | | | $ | (950,014) | |
| | | | |
*Includes purchased option contracts and purchased swaption contracts, if any.
88 OPPENHEIMER FUNDAMENTAL ALTERNATIVES FUND
7. Shares of Beneficial Interest
The Fund has authorized an unlimited number of $0.01 par value shares of beneficial interest of each class. Transactions in shares of beneficial interest were as follows:
| | | | | | | | | | | | | | | | | | |
| | | Year Ended October 31, 2017 | | | | | Year Ended October 31, 2016 | |
| | | Shares | | | Amount | | | | | Shares | | | Amount | |
| |
Class A | | | | | | | | | | | | | | | | | | |
Sold | | | 2,271,267 | | | $ | 61,514,476 | | | | | | 6,402,109 | | | $ | 170,647,881 | |
Dividends and/or distributions reinvested | | | 61,361 | | | | 1,651,467 | | | | | | 126,225 | | | | 3,386,154 | |
Redeemed | | | (6,936,544 | ) | | | (188,331,134 | ) | | | | | (5,140,436 | ) | | | (137,150,519) | |
| | | | |
Net increase (decrease) | | | (4,603,916 | ) | | $ | (125,165,191 | ) | | | | | 1,387,898 | | | $ | 36,883,516 | |
| | | | |
| | | | | | | | | | | | | | | | | | |
| |
Class B | | | | | | | | | | | | | | | | | | |
Sold | | | 3,176 | | | $ | 76,279 | | | | | | 25,484 | | | $ | 605,272 | |
Dividends and/or distributions reinvested | | | 536 | | | | 12,416 | | | | | | 1,728 | | | | 41,404 | |
Redeemed | | | (204,657 | ) | | | (4,922,484 | ) | | | | | (307,360 | ) | | | (7,325,938) | |
| | | | |
Net decrease | | | (200,945 | ) | | $ | (4,833,789 | ) | | | | | (280,148 | ) | | $ | (6,679,262) | |
| | | | |
| | | | | | | | | | | | | | | | | | |
| |
Class C | | | | | | | | | | | | | | | | | | |
Sold | | | 415,840 | | | $ | 9,987,969 | | | | | | 2,234,739 | | | $ | 53,218,927 | |
Dividends and/or distributions reinvested | | | 10,755 | | | | 257,477 | | | | | | 16,779 | | | | 402,017 | |
Redeemed | | | (1,667,506 | ) | | | (40,083,145 | ) | | | | | (1,259,356 | ) | | | (29,952,495) | |
| | | | |
Net increase (decrease) | | | (1,240,911 | ) | | $ | (29,837,699 | ) | | | | | 992,162 | | | $ | 23,668,449 | |
| | | | |
| | | | | | | | | | | | | | | | | | |
| |
Class I | | | | | | | | | | | | | | | | | | |
Sold | | | 1,960,703 | | | $ | 54,741,876 | | | | | | 3,768,914 | | | $ | 103,127,543 | |
Dividends and/or distributions reinvested | | | 34,326 | | | | 943,643 | | | | | | 18,652 | | | | 513,881 | |
Redeemed | | | (1,316,046 | ) | | | (36,752,840 | ) | | | | | (1,179,304 | ) | | | (32,394,209) | |
| | | | |
Net increase | | | 678,983 | | | $ | 18,932,679 | | | | | | 2,608,262 | | | $ | 71,247,215 | |
| | | | |
| | | | | | | | | | | | | | | | | | |
| |
Class R | | | | | | | | | | | | | | | | | | |
Sold | | | 251,739 | | | $ | 6,538,991 | | | | | | 308,286 | | | $ | 7,886,480 | |
Dividends and/or distributions reinvested | | | 1,616 | | | | 41,710 | | | | | | 2,175 | | | | 55,891 | |
Redeemed | | | (244,512 | ) | | | (6,345,214 | ) | | | | | (172,167 | ) | | | (4,400,124) | |
| | | | |
Net increase | | | 8,843 | | | $ | 235,487 | | | | | | 138,294 | | | $ | 3,542,247 | |
| | | | |
| | | | | | | | | | | | | | | | | | |
| |
Class Y | | | | | | | | | | | | | | | | | | |
Sold | | | 9,794,238 | | | $ | 272,149,034 | | | | | | 16,851,836 | | | $ | 458,803,009 | |
Dividends and/or distributions reinvested | | | 59,982 | | | | 1,644,210 | | | | | | 29,335 | | | | 805,201 | |
Redeemed | | | (9,825,658 | ) | | | (272,434,970 | ) | | | | | (5,516,467 | ) | | | (150,491,770) | |
| | | | |
Net increase | | | 28,562 | | | $ | 1,358,274 | | | | | | 11,364,704 | | | $ | 309,116,440 | |
| | | | |
8. Purchases and Sales of Securities
The aggregate cost of purchases and proceeds from sales of securities, other than short-term obligations and investments in IGMMF, for the reporting period were as follows:
89 OPPENHEIMER FUNDAMENTAL ALTERNATIVES FUND
NOTES TO
CONSOLIDATED FINANCIAL STATEMENTS Continued
8. Purchases and Sales of Securities (Continued)
| | | | | | | | |
| | | Purchases | | | Sales | |
Investment securities | | | $1,428,811,385 | | | | $1,408,077,815 | |
9. Fees and Other Transactions with Affiliates
Management Fees. Under the investment advisory agreement, the Fund pays the Manager a management fee based on the daily net assets of the Fund at an annual rate as shown in the following table:
| | | | |
| Fee Schedule | | | |
Up to $1.0 billion | | | 0.85 | % |
Next $500 million | | | 0.80 | |
Next $500 million | | | 0.75 | |
Next $500 million | | | 0.70 | |
Next $500 million | | | 0.65 | |
Next $500 million | | | 0.60 | |
Next $500 million | | | 0.55 | |
Over $4.0 billion | | | 0.50 | |
The Manager also provides investment management related services to the Subsidiary. The Subsidiary pays the Manager a monthly management fee at an annual rate according to the above schedule. The Subsidiary also pays certain other expenses including custody and directors’ fees.
The Fund’s effective management fee for the reporting period was 0.84% of average annual net assets before any Subsidiary management fees or any applicable waivers.
Sub-Adviser Fees. The Manager has retained the Sub-Adviser to provide the day-to-day portfolio management of the Fund and the Subsidiary. Under the Sub-Advisory Agreement, the Manager pays the Sub-Adviser an annual fee in monthly installments, equal to a percentage of the investment management fee collected by the Manager from the Fund and the Subsidiary, which shall be calculated after any investment management fee waivers. The fee paid to the Sub-Adviser is paid by the Manager, not by the Fund.
Transfer Agent Fees. OFI Global (the “Transfer Agent”) serves as the transfer and shareholder servicing agent for the Fund. The Fund pays the Transfer Agent a fee based on annual net assets, which shall be calculated after any applicable fee waivers. Fees incurred and average net assets for each class with respect to these services are detailed in the Consolidated Statement of Operations and Consolidated Financial Highlights, respectively.
Sub-Transfer Agent Fees. The Transfer Agent has retained Shareholder Services, Inc., a wholly-owned subsidiary of OFI (the “Sub-Transfer Agent”), to provide the day-to-day transfer agent and shareholder servicing of the Fund. Under the Sub-Transfer Agency Agreement, the Transfer Agent pays the Sub-Transfer Agent an annual fee in monthly installments, equal to a percentage of the transfer agent fee collected by the Transfer Agent from the Fund, which shall be calculated after any applicable fee waivers. The fee paid to the Sub-Transfer Agent is paid by the Transfer Agent, not by the Fund.
90 OPPENHEIMER FUNDAMENTAL ALTERNATIVES FUND
9. Fees and Other Transactions with Affiliates (Continued)
Trustees’ Compensation. The Fund has adopted an unfunded retirement plan (the “Plan”) for the Fund’s Independent Trustees. Benefits are based on years of service and fees paid to each Trustee during their period of service. The Plan was frozen with respect to adding new participants effective December 31, 2006 (the “Freeze Date”) and existing Plan Participants as of the Freeze Date will continue to receive accrued benefits under the Plan. Active Independent Trustees as of the Freeze Date have each elected a distribution method with respect to their benefits under the Plan. During the reporting period, the Fund’s projected benefit obligations, payments to retired Trustees and accumulated liability were as follows:
| | | | |
Projected Benefit Obligations Increased | | $ | — | |
Payments Made to Retired Trustees | | | 26,298 | |
Accumulated Liability as of October 31, 2017 | | | 90,280 | |
The Fund’s Board of Trustees (“Board”) has adopted a compensation deferral plan for Independent Trustees that enables Trustees to elect to defer receipt of all or a portion of the annual compensation they are entitled to receive from the Fund. For purposes of determining the amount owed to the Trustee under the plan, deferred amounts are treated as though equal dollar amounts had been invested in shares of the Fund or in other Oppenheimer funds selected by the Trustee. The Fund purchases shares of the funds selected for deferral by the Trustee in amounts equal to his or her deemed investment, resulting in a Fund asset equal to the deferred compensation liability. Such assets are included as a component of “Other” within the asset section of the Consolidated Statement of Assets and Liabilities. Deferral of Trustees’ fees under the plan will not affect the net assets of the Fund and will not materially affect the Fund’s assets, liabilities or net investment income per share. Amounts will be deferred until distributed in accordance with the compensation deferral plan.
Distribution and Service Plan (12b-1) Fees. Under its General Distributor’s Agreement with the Fund, OppenheimerFunds Distributor, Inc. (the “Distributor”) acts as the Fund’s principal underwriter in the continuous public offering of the Fund’s classes of shares.
Distribution and Service Plan for Class A Shares. The Fund has adopted a Distribution and Service Plan (the “Plan”) for Class A shares pursuant to Rule 12b-1 under the 1940 Act. Under the Plan, the Fund pays a service fee to the Distributor at an annual rate of 0.25% of the daily net assets of Class A shares. The Distributor currently uses all of those fees to pay dealers, brokers, banks and other financial institutions periodically for providing personal services and maintenance of accounts of their customers that hold Class A shares. Under the Plan, the Fund may also pay an asset-based sales charge to the Distributor. However, the Fund’s Board has currently set the rate at zero. Fees incurred by the Fund under the Plan are detailed in the Consolidated Statement of Operations.
Distribution and Service Plans for Class B, Class C and Class R Shares. The Fund has adopted Distribution and Service Plans (the “Plans”) for Class B, Class C and Class R shares pursuant to Rule 12b-1 under the 1940 Act to compensate the Distributor for distributing
91 OPPENHEIMER FUNDAMENTAL ALTERNATIVES FUND
NOTES TO
CONSOLIDATED FINANCIAL STATEMENTS Continued
9. Fees and Other Transactions with Affiliates (Continued)
those share classes, maintaining accounts and providing shareholder services. Under the Plans, the Fund pays the Distributor an annual asset-based sales charge of 0.75% on Class B and Class C shares’ daily net assets and 0.25% on Class R shares’ daily net assets. The Fund also pays a service fee under the Plans at an annual rate of 0.25% of daily net assets. The Plans continue in effect from year to year only if the Fund’s Board of Trustees votes annually to approve their continuance at an in person meeting called for that purpose. Fees incurred by the Fund under the Plans are detailed in the Consolidated Statement of Operations.
Sales Charges. Front-end sales charges and CDSC do not represent expenses of the Fund. They are deducted from the proceeds of sales of Fund shares prior to investment or from redemption proceeds prior to remittance, as applicable. The sales charges retained by the Distributor from the sale of shares and the CDSC retained by the Distributor on the redemption of shares is shown in the following table for the period indicated.
| | | | | | | | | | | | | | | | | | | | |
| Year Ended | | Class A Front-End
Sales Charges Retained by Distributor | | | Class A Contingent Deferred Sales Charges Retained by Distributor | | | Class B Contingent Deferred Sales Charges Retained by
Distributor | | | Class C
Contingent
Deferred
Sales Charges
Retained by
Distributor | | | Class R Contingent Deferred
Sales Charges Retained by
Distributor | |
October 31, 2017 | | | $106,541 | | | | $2,227 | | | | $4,702 | | | | $16,862 | | | | $— | |
Waivers and Reimbursements of Expenses. The Manager has contractually agreed to waive the management fee it receives from the Fund in an amount equal to the management fee it receives from the Subsidiary. During the reporting period, the Manager waived $323,986. This fee waiver and/or expense reimbursement may not be amended or withdrawn for one year from the date of the Fund’s prospectus, unless approved by the Board.
Effective January 1, 2017, the Transfer Agent has voluntarily agreed to waive fees and/or reimburse Fund expenses in an amount equal to 0.015% of average annual net assets for Classes A, B, C, R and Y.
During the reporting period, the Transfer Agent waived fees and/or reimbursed the Fund for transfer agent and shareholder servicing agent fees as follows:
| | | | |
Class A | | $ | 76,356 | |
Class B | | | 525 | |
Class C | | | 15,164 | |
Class R | | | 2,664 | |
Class Y | | | 49,738 | |
This fee waiver and/or reimbursement may be terminated at any time.
The Manager will waive fees and/or reimburse Fund expenses in an amount equal to the indirect management fees incurred through the Fund’s investment in IGMMF. During the reporting period, the Manager waived fees and/or reimbursed the Fund $29,766 for IGMMF management fees. This fee waiver and/or expense reimbursement may not be amended or
92 OPPENHEIMER FUNDAMENTAL ALTERNATIVES FUND
9. Fees and Other Transactions with Affiliates (Continued)
withdrawn for one year from the date of the Fund’s prospectus, unless approved by the Board.
10. Borrowings and Other Financing
Securities Sold Short. The Fund sells securities that it does not own, and it will therefore be obligated to purchase such securities at a future date. Upon entering into a short position, the Fund is required to segregate cash or securities at its custodian which are pledged for the benefit of the lending broker and/or to deposit and pledge cash directly at the lending broker, with a value equal to a certain percentage, exceeding 100%, of the value of the securities that it sold short. Cash that has been segregated and pledged for this purpose will be disclosed on the Consolidated Statement of Assets and Liabilities; securities that have been segregated and pledged for this purpose are disclosed as such in the Consolidated Statement of Investments. The aggregate market value of such cash and securities at period end is $426,349,704. The value of the open short position is recorded as a liability, and the Fund records an unrealized gain or loss to the extent of the difference between the proceeds received and the change in value of the open short position. The Fund records a realized gain or loss when the short position is closed out. By entering into short sales, the Fund bears the market risk of increases in value of the security sold short in excess of the proceeds received. Until the security is replaced, the Fund is required to pay the lender any dividend or interest earned. Dividend expense on short sales is treated as an expense in the Consolidated Statement of Operations.
Joint Credit Facility. A number of mutual funds managed by the Manager participate in a $1.875 billion revolving credit facility (the “Facility”) intended to provide short-term financing, if necessary, subject to certain restrictions in connection with atypical redemption activity. Expenses and fees related to the Facility are paid by the participating funds and are disclosed separately or as other expenses on the Consolidated Statement of Operations. The Fund did not utilize the Facility during the reporting period.
93 OPPENHEIMER FUNDAMENTAL ALTERNATIVES FUND
REPORT OF INDEPENDENT REGISTERED PUBLIC ACCOUNTING FIRM
The Board of Trustees and Shareholders of Oppenheimer Quest For Value Funds:
We have audited the accompanying consolidated statement of assets and liabilities of Oppenheimer Fundamental Alternatives Fund (the Fund), a series of Oppenheimer Quest For Value Funds, and subsidiary, including the consolidated statement of investments, as of October 31, 2017, and the related consolidated statement of operations for the year then ended, the consolidated statements of changes in net assets for each of the years in the two-year period then ended, and the consolidated financial highlights for each of the years or periods in the five-year period then ended. These consolidated financial statements and consolidated financial highlights are the responsibility of the Fund’s management. Our responsibility is to express an opinion on these consolidated financial statements and consolidated financial highlights based on our audits.
We conducted our audits in accordance with the standards of the Public Company Accounting Oversight Board (United States). Those standards require that we plan and perform the audit to obtain reasonable assurance about whether the financial statements and financial highlights are free of material misstatement. An audit includes examining, on a test basis, evidence supporting the amounts and disclosures in the financial statements. Our procedures included confirmation of securities owned as of October 31, 2017, by correspondence with the custodian, transfer agent and brokers, or by other appropriate auditing procedures where replies from brokers were not received. An audit also includes assessing the accounting principles used and significant estimates made by management, as well as evaluating the overall financial statement presentation. We believe that our audits provide a reasonable basis for our opinion.
In our opinion, the consolidated financial statements and consolidated financial highlights referred to above present fairly, in all material respects, the financial position of Oppenheimer Fundamental Alternatives Fund and subsidiary as of October 31, 2017, the results of their operations for the year then ended, the changes in their net assets for each of the years in the two-year period then ended, and the consolidated financial highlights for each of the years or periods in the five-year period then ended, in conformity with U.S. generally accepted accounting principles.
KPMG LLP
Denver, Colorado
December 22, 2017
94 OPPENHEIMER FUNDAMENTAL ALTERNATIVES FUND
FEDERAL INCOME TAX INFORMATION Unaudited
In early 2017, if applicable, shareholders of record received information regarding all dividends and distributions paid to them by the Fund during calendar year 2016.
Dividends, if any, paid by the Fund during the reporting period which are not designated as capital gain distributions should be multiplied by the maximum amount allowable but not less than 98.73% to arrive at the amount eligible for the corporate dividend-received deduction.
A portion, if any, of the dividends paid by the Fund during the reporting period which are not designated as capital gain distributions are eligible for lower individual income tax rates to the extent that the Fund has received qualified dividend income as stipulated by recent tax legislation. The maximum amount allowable but not less than $20,653,168 of the Fund’s fiscal year taxable income may be eligible for the lower individual income tax rates. In early 2017, shareholders of record received information regarding the percentage of distributions that are eligible for lower individual income tax rates.
Recent tax legislation allows a regulated investment company to designate distributions not designated as capital gain distributions, as either interest related dividends or short-term capital gain dividends, both of which are exempt from the U.S. withholding tax applicable to non U.S. taxpayers. For the reporting period, the maximum amount allowable but not less than $5,409,934 of the ordinary distributions to be paid by the Fund qualifies as an interest related dividend.
The foregoing information is presented to assist shareholders in reporting distributions received from the Fund to the Internal Revenue Service. Because of the complexity of the federal regulations which may affect your individual tax return and the many variations in state and local tax regulations, we recommend that you consult your tax advisor for specific guidance.
95 OPPENHEIMER FUNDAMENTAL ALTERNATIVES FUND
BOARD APPROVAL OF THE FUND’S INVESTMENT ADVISORY
AND SUB-ADVISORY AGREEMENTS Unaudited
The Fund has entered into an investment advisory agreement with OFI Global Asset Management, Inc. (“OFI Global” or the “Adviser”), a wholly-owned subsidiary of OppenheimerFunds, Inc. (“OFI” or the “Sub-Adviser”) (“OFI Global” and “OFI” together the “Managers”) and OFI Global has entered into a sub-advisory agreement with OFI whereby OFI provides investment sub-advisory services to the Fund (collectively, the “Agreements”). Each year, the Board of Trustees (the “Board”), including a majority of the independent Trustees, is required to determine whether to approve the terms of the Agreements and the renewal thereof. The Investment Company Act of 1940, as amended, requires that the Board request and evaluate, and that the Managers provide, such information as may be reasonably necessary to evaluate the terms of the Agreements. The Board employs an independent consultant to prepare a report that provides information, including comparative information that the Board requests for that purpose. In addition to in-person meetings focused on this evaluation, the Board receives information throughout the year regarding Fund services, fees, expenses and performance.
The Managers and the independent consultant provided information to the Board on the following factors: (i) the nature, quality and extent of the Managers’ services, (ii) the comparative investment performance of the Fund and the Managers, (iii) the fees and expenses of the Fund, including comparative fee and expense information, (iv) the profitability of the Managers and their affiliates, including an analysis of the cost of providing services, (v) whether economies of scale are realized as the Fund grows and whether fee levels reflect these economies of scale for Fund investors and (vi) other benefits to the Managers from their relationship with the Fund. The Board was aware that there are alternatives to retaining the Managers.
Outlined below is a summary of the principal information considered by the Board as well as the Board’s conclusions.
Nature, Quality and Extent of Services. The Board considered information about the nature, quality and extent of the services provided to the Fund and information regarding the Managers’ key personnel who provide such services. The Managers’ duties include providing the Fund with the services of the portfolio manager and the Sub-Adviser’s investment team, who provide research, analysis and other advisory services in regard to the Fund’s investments; and securities trading services. OFI Global is responsible for oversight of third-party service providers; monitoring compliance with applicable Fund policies and procedures and adherence to the Fund’s investment restrictions; risk management; and oversight of the Sub-Adviser. OFI Global is also responsible for providing certain administrative services to the Fund. Those services include providing and supervising all administrative and clerical personnel who are necessary in order to provide effective corporate administration for the Fund; compiling and maintaining records with respect to the Fund’s operations; preparing and filing reports required by the U.S. Securities and Exchange Commission; preparing periodic reports regarding the operations of the Fund for its shareholders; preparing proxy materials for shareholder meetings; and preparing the registration statements required by federal and state securities laws for the sale of the Fund’s shares. OFI Global also provides the Fund with office space, facilities and equipment.
96 OPPENHEIMER FUNDAMENTAL ALTERNATIVES FUND
The Board also considered the quality of the services provided and the quality of the Managers’ resources that are available to the Fund. The Board took account of the fact that the Sub-Adviser has over fifty years of experience as an investment adviser and that its assets under management rank it among the top mutual fund managers in the United States. The Board evaluated the Managers’ advisory, administrative, accounting, legal, compliance and risk management services, among other services, and information the Board has received regarding the experience and professional qualifications of the Managers’ key personnel and the size and functions of its staff. In its evaluation of the quality of the portfolio management services provided, the Board considered the experience of Michelle Borré, the portfolio manager for the Fund, and the Sub-Adviser’s investment team and analysts. The Board members also considered the totality of their experiences with the Managers as directors or trustees of the Fund and other funds advised by the Managers. The Board considered information regarding the quality of services provided by affiliates of the Managers, which the Board members have become knowledgeable about through their experiences with the Managers and in connection with the review or renewal of the Fund’s service agreements or service providers. The Board concluded, in light of the Managers’ experience, reputation, personnel, operations and resources that the Fund benefits from the services provided under the Agreements.
Investment Performance of the Managers and the Fund. Throughout the year, the Managers provided information on the investment performance of the Fund, the Adviser and the Sub-Adviser, including comparative performance information. The Board also reviewed information, prepared by the Managers and by the independent consultant, comparing the Fund’s historical performance to relevant benchmarks or market indices and to the performance of other retail funds in the multialternative category. The Board noted that the Fund’s three-year, five-year and ten-year performance was better than its category median although its one-year performance was below its category median.
Fees and Expenses of the Fund. The Board reviewed the fees paid to the Adviser and the other expenses borne by the Fund. The independent consultant provided comparative data in regard to the fees and expenses of the Fund and other retail front-end load multialternative funds with comparable asset levels and distribution features. The Board noted that the Fund’s contractual management fee and total expenses were lower than its peer group median and category median.
Economies of Scale and Profits Realized by the Managers. The Board considered information regarding the Managers’ costs in serving as the Fund’s investment adviser and sub-adviser, including the costs associated with the personnel and systems necessary to manage the Fund, and information regarding the Managers’ profitability from their relationship with the Fund. The Board also considered that the Managers must be able to pay and retain experienced professional personnel at competitive rates to provide quality services to the Fund. The Board reviewed whether the Managers may realize economies of scale in managing and supporting the Fund. The Board noted that the Fund currently has management fee breakpoints, which are intended to share with Fund shareholders economies of scale that may exist as the Fund’s assets grow.
97 OPPENHEIMER FUNDAMENTAL ALTERNATIVES FUND
BOARD APPROVAL OF THE FUND’S INVESTMENT ADVISORY
AND SUB-ADVISORY AGREEMENTS Unaudited / Continued
Other Benefits to the Managers. In addition to considering the profits realized by the Managers, the Board considered information that was provided regarding the direct and indirect benefits the Managers receive as a result of their relationship with the Fund, including compensation paid to the Managers’ affiliates and research provided to the Adviser in connection with permissible brokerage arrangements (soft dollar arrangements).
Conclusions. These factors were also considered by the independent Trustees meeting separately from the full Board, assisted by experienced counsel to the Fund and to the independent Trustees. Fund counsel and the independent Trustees’ counsel are independent of the Managers within the meaning and intent of the Securities and Exchange Commission Rules.
Based on its review of the information it received and its evaluations described above, the Board, including a majority of the independent Trustees, decided to continue the Agreements through September 30, 2018. In arriving at its decision, the Board did not identify any factor or factors as being more important than others, but considered all of the above information, and considered the terms and conditions of the Agreements, including the management fees, in light of all the surrounding circumstances.
98 OPPENHEIMER FUNDAMENTAL ALTERNATIVES FUND
PORTFOLIO PROXY VOTING POLICIES AND GUIDELINES;
UPDATES TO STATEMENTS OF INVESTMENTS Unaudited
The Fund has adopted Portfolio Proxy Voting Policies and Guidelines under which the Fund votes proxies relating to securities (“portfolio proxies”) held by the Fund. A description of the Fund’s Portfolio Proxy Voting Policies and Guidelines is available (i) without charge, upon request, by calling the Fund toll-free at 1.800.CALL OPP (225.5677), (ii) on the Fund’s website at www.oppenheimerfunds.com, and (iii) on the SEC’s website at www.sec.gov. In addition, the Fund is required to file Form N-PX, with its complete proxy voting record for the 12 months ended June 30th, no later than August 31st of each year. The Fund’s voting record is available (i) without charge, upon request, by calling the Fund toll-free at 1.800.CALL OPP (225.5677), and (ii) in the Form N-PX filing on the SEC’s website at www.sec.gov.
The Fund files its complete schedule of portfolio holdings with the SEC for the first quarter and the third quarter of each fiscal year on Form N-Q. The Fund’s Form N-Q filings are available on the SEC’s website at www.sec.gov. Those forms may be reviewed and copied at the SEC’s Public Reference Room in Washington, D.C. Information on the operation of the Public Reference Room may be obtained by calling 1-800-SEC-0330.
Householding—Delivery of Shareholder Documents
This is to inform you about OppenheimerFunds’ “householding” policy. If more than one member of your household maintains an account in a particular fund, OppenheimerFunds will mail only one copy of the fund’s prospectus (or, if available, the fund’s summary prospectus), annual and semiannual report and privacy policy. The consolidation of these mailings, called householding, benefits your fund through reduced mailing expense, and benefits you by reducing the volume of mail you receive from OppenheimerFunds. Householding does not affect the delivery of your account statements.
Please note that we will continue to household these mailings for as long as you remain an OppenheimerFunds shareholder, unless you request otherwise. If you prefer to receive multiple copies of these materials, please call us at 1.800.CALL-OPP (225-5677). You may also notify us in writing or via email. We will begin sending you individual copies of the prospectus (or, if available, the summary prospectus), reports and privacy policy within 30 days of receiving your request to stop householding.
99 OPPENHEIMER FUNDAMENTAL ALTERNATIVES FUND
TRUSTEES AND OFFICERS Unaudited
| | |
Name, Position(s) Held with the Fund, Length of Service, Year of Birth | | Principal Occupation(s) During the Past 5 Years; Other Trusteeships/ Directorships Held; Number of Portfolios in the Fund Complex Currently Overseen |
| |
| INDEPENDENT TRUSTEES | | The address of each Trustee in the chart below is 6803 S. Tucson Way, Centennial, Colorado 80112-3924. Each Trustee serves for an indefinite term, or until his or her resignation, retirement, death or removal. |
| |
Brian F. Wruble, Chairman of the Board of Trustees (since 2009), Trustee (since 2001) Year of Birth: 1943 | | Governor of Community Foundation of the Florida Keys (non-profit) (since July 2012); Director of TCP Capital, Inc. (since November 2015); Chairman Emeritus of the Board of Trustees (since August 2011), Chairman of the Board of Trustees (August 2007-August 2011), Trustee of the Board of Trustees (since August 1991) of The Jackson Laboratory (non-profit); Member of Zurich Insurance Group’s Investment Management Advisory Council (insurance) (October 2004-February 2017); Treasurer (since 2007) and Trustee (since May 1992) of the Institute for Advanced Study (non-profit educational institute); Director of Special Value Opportunities Fund, LLC (registered investment company) (affiliate of the Sub- Adviser’s parent company) (September 2004-June 2015); General Partner of Odyssey Partners, L.P. (hedge fund) (September 1995-December 2007); Special Limited Partner of Odyssey Investment Partners, LLC (private equity investment) (January 1999-September 2004). Oversees 57 portfolios in the OppenheimerFunds complex. Mr. Wruble has served on the Boards of certain Oppenheimer funds since April 2001, during which time he has become familiar with the Fund’s (and other Oppenheimer funds’) financial, accounting, regulatory and investment matters and has contributed to the Boards’ deliberations. |
| |
Beth Ann Brown, Trustee (since 2016) Year of Birth: 1968 | | Advisor, Board of Advisors of Caron Engineering Inc. (since December 2014); Independent Consultant (since September 2012); held the following positions at Columbia Management Investment Advisers LLC: Head of Intermediary Distribution (2008-2012), Managing Director, Strategic Relations (2005-2008), Managing Director, Head of National Accounts (2004-2005); Senior Vice President, National Account Manager (2002-2004), Senior Vice President, Key Account Manager (1999-2002) and Vice President, Key Account Manager (1996-1999) of Liberty Funds Distributor, Inc.; President and Director, of Acton Shapleigh Youth Conservation Corps (non-profit) (since 2012); and Vice President and Director of Grahamtastic Connection (non-profit) (since May 2013). Oversees 57 portfolios in the OppenheimerFunds complex. Ms. Brown has served on the Boards of certain Oppenheimer funds since January 2016, during which time she has become familiar with the Fund’s (and other Oppenheimer funds’) financial, accounting, regulatory and investment matters and has contributed to the Board’s deliberations. |
| |
Edmund P. Giambastiani, Jr., Trustee (since 2013) Year of Birth: 1948 | | Advisory Board Member of the Maxwell School of Citizenship and Public Affairs of Syracuse University (since April 2012); Director of Mercury Defense Systems Inc. (information technology) (August 2011-February 2013); Trustee of the U.S. Naval Academy Foundation Athletic & Scholarship Program (since November 2010); Advisory Board Member of the Massachusetts Institute of Technology Lincoln Laboratory (federally-funded research development center) (since May 2010); Director of The Boeing Company (aerospace and defense) (since October 2009); Trustee of MITRE Corporation (federally-funded research development center) |
100 OPPENHEIMER FUNDAMENTAL ALTERNATIVES FUND
| | |
Edmund P. Giambastiani, Jr., Continued | | (since September 2008); Independent Director of QinetiQ Group Plc (defense technology and security) (February 2008-August 2011); Chairman of Monster Worldwide, Inc. (on-line career services) (March 2015-November 2016), Director of Monster Worldwide, Inc. (on-line career services) (February 2008-June 2011); Lead Director (June 2011-March 2015); Chairman of Alenia North America, Inc. (military and defense products) (January 2008-October 2009); Director of SRA International, Inc. (information technology and services) (January 2008-July 2011); President of Giambastiani Group LLC (national security and energy consulting) (since October 2007); United States Navy, career nuclear submarine officer (June 1970-October 2007), Vice Chairman of the Joint Chiefs of Staff (2005-October 2007), Supreme Allied Commander of NATO Commander Transformation (2003-2005), Commander, U.S. Joint Forces Command (2002-2005). Since his retirement from the U.S. Navy in October 2007, Admiral Giambastiani has also served on numerous U.S. Government advisory boards, investigations and task forces for the Secretaries of Defense, State and Interior and the Central Intelligence Agency. He recently completed serving as a federal commissioner on the Military Compensation and Retirement Modernization Commission. Oversees 57 portfolios in the OppenheimerFunds complex. Admiral Giambastiani has served on the Boards of certain Oppenheimer funds since February 2013, including as an Advisory Board Member for certain Oppenheimer funds, during which time he has become familiar with the Fund’s (and other Oppenheimer funds’) financial, accounting, regulatory and investment matters and has contributed to the Boards’ deliberations. For purposes of this report, Admiral Giambastiani is identified as a Trustee. |
| |
Elizabeth Krentzman, Trustee (since 2014) Year of Birth: 1959 | | Member of the University of Florida National Board Foundation (since September 2017); Member of the Cartica Funds Board of Directors (private investment funds) (since January 2017); Member of the University of Florida College of Law Association Board of Trustees and Audit Committee Member (since April 2016); Member of University of Florida Law Advisory Board, Washington, DC Alumni Group (since 2015); Advisory Board Member of the Securities and Exchange Commission Historical Society (since 2007); held the following positions at Deloitte & Touche LLP: Principal and Chief Regulatory Advisor for Asset Management Services (2007 - 2014) and U.S. Mutual Fund Leader (2011 - 2014); General Counsel of the Investment Company Institute (trade association) (June 2004 - April 2007); held the following positions at Deloitte & Touche LLP: National Director of the Investment Management Regulatory Consulting Practice (1997 - 2004), Principal (2003 - 2004), Director (1998 - 2003) and Senior Manager (1997 - 1998); Assistant Director of the Division of Investment Management – Office of Disclosure and Investment Adviser Regulation of the U.S. Securities and Exchange Commission (1996 - 1997) and various positions with the Division of Investment Management – Office of Regulatory Policy (1991 - 1996) of the U.S. Securities and Exchange Commission; Associate at Ropes & Gray LLP (1987 – 1991). Oversees 57 portfolios in the OppenheimerFunds complex. Ms. Krentzman has served on the Boards of certain Oppenheimer funds since August 2014, during which time she has become familiar with the Fund’s (and other Oppenheimer funds’) financial, accounting, regulatory and investment matters and has contributed to the Boards’ deliberations. |
101 OPPENHEIMER FUNDAMENTAL ALTERNATIVES FUND
TRUSTEES AND OFFICERS Unaudited / Continued
| | |
Mary F. Miller, Trustee (since 2009) Year of Birth: 1942 | | Trustee of International House (not-for-profit) (since June 2007); Trustee of the American Symphony Orchestra (not-for-profit) (October 1998-November 2011); and Senior Vice President and General Auditor of American Express Company (financial services company) (July 1998-February 2003). Oversees 57 portfolios in the OppenheimerFunds complex. Ms. Miller has served on the Boards of certain Oppenheimer funds since August 2004, during which time she has become familiar with the Fund’s (and other Oppenheimer funds’) financial, accounting, regulatory and investment matters and has contributed to the Boards’ deliberations. |
| |
Joel W. Motley, Trustee (since 2009) Year of Birth: 1952 | | Director of Office of Finance Federal Home Loan Bank (since September 2016); Director of Greenwall Foundation (since October 2013); Member of Board and Investment Committee of The Greenwall Foundation (since April 2013); Member of the Vestry of Trinity Wall Street (since April 2012); Director of Southern Africa Legal Services Foundation (since March 2012); Board Member of Pulitzer Center for Crisis Reporting (non-profit journalism) (since March 2011); Managing Director of Public Capital Advisors, LLC (privately-held financial advisor) (since January 2006); Managing Director of Carmona Motley, Inc. (privately-held financial advisor) (since January 2002); Director of Columbia Equity Financial Corp. (privately-held financial advisor) (2002-2007); Managing Director of Carmona Motley Hoffman Inc. (privately-held financial advisor) (January 1998-December 2001); Member of the Finance and Budget Committee of the Council on Foreign Relations, Member of the Investment Committee and Board of Human Rights Watch (since July 2000) and Member of the Investment Committee and Board of Historic Hudson Valley (since February 2010). Oversees 57 portfolios in the OppenheimerFunds complex. Mr. Motley has served on the Boards of certain Oppenheimer funds since October 2002, during which time he has become familiar with the Fund’s (and other Oppenheimer funds’) financial, accounting, regulatory and investment matters and has contributed to the Boards’ deliberations. |
| |
Joanne Pace, Trustee (since 2012) Year of Birth: 1958 | | Advisory Board Director of Massey Quick and Company, LLC (since October 2014); Board Director of Horizon Blue Cross Blue Shield of New Jersey (since November 2012); Advisory Board Director of The Alberleen Group LLC (since March, 2012); Board Member (since January 2015), Board Member of 100 Women in Hedge Funds (non-profit) (since January 2015); Advisory Council Member of Morgan Stanley Children’s Hospital (non-profit) (since May, 2012); Senior Advisor of SECOR Asset Management, LP (2010-2011); Managing Director and Chief Operating Officer of Morgan Stanley Investment Management (2006-2010); Partner and Chief Operating Officer of FrontPoint Partners, LLC (hedge fund) (2005-2006); held the following positions at Credit Suisse: Managing Director (2003-2005); Global Head of Human Resources and member of Executive Board and Operating Committee (2004-2005), Global Head of Operations and Product Control (2003- 2004); held the following positions at Morgan Stanley: Managing Director (1997- 2003), Controller and Principal Accounting Officer (1999-2003); Chief Financial Officer (temporary assignment) for the Oversight Committee, Long Term Capital Management (1998-1999). Lead Independent Director and Chair of the Audit and Nominating Committee of The Global Chartist Fund, LLC of Oppenheimer Asset Management (2011-2012); Board Director of Managed Funds Association (2008- 2010); Board Director of Morgan Stanley Foundation (2007-2010) and Investment |
102 OPPENHEIMER FUNDAMENTAL ALTERNATIVES FUND
| | |
Joanne Pace, Continued | | Committee Chair (2008-2010). Oversees 57 portfolios in the OppenheimerFunds complex. Ms. Pace has served on the Boards of certain Oppenheimer funds since November 2012, including as an Advisory Board Member for certain Oppenheimer funds, during which time she has become familiar with the Fund’s (and other Oppenheimer funds’) financial, accounting, regulatory and investment matters and has contributed to the Board’s deliberations. For purposes of this report, Ms. Pace is identified as a Trustee. |
| |
Daniel Vandivort, Trustee (since 2014) Year of Birth: 1954 | | Chairman and Lead Independent Director/Trustee (March 2010-September 2014), Chairman of the Audit Committee (March 2009-September 2014) and Director/ Trustee (December 2008-September 2014) of the Board of Directors/Trustees of Value Line Funds; Trustee, Board of Trustees of Huntington Disease Foundation of America (since January 2015 and June 2007-December 2013) and Treasurer, Chairman of the Audit and Finance Committee (since January 2016); Trustee, Board of Trustees, RIM Retirement Savings Plan (2005-2007); President and Chief Investment Officer, Robeco Investment Management, formerly known as Weiss Peck and Greer (January 2005-June 2007); Member, Management Committee of Robeco Investment Management (2001-2007); Chairman and Trustee of the Board of Trustees of Weiss, Peck and Greer Funds (2004-2005); Managing Director and Head of Fixed Income, Weiss, Peck and Greer (November 1994-January 2005); Managing Director and Head of Fixed Income, CS First Boston Investment Management (January 1992-November 1994); Director, Global Product Development, First Boston Asset Management (November 1989 to January 1992); Vice President, Fixed Income Sales, First Boston Corp. (May 1984-November 1989). Oversees 57 portfolios in the OppenheimerFunds complex. Mr. Vandivort has served on the Boards of certain Oppenheimer funds since 2014, during which time he has become familiar with the Fund’s (and other Oppenheimer funds’) financial, accounting, regulatory and investment matters and has contributed to the Boards’ deliberations. |
| |
INTERESTED TRUSTEE AND OFFICER | | Mr. Steinmetz is an “Interested Trustee” because he is affiliated with the Manager and the Sub-Adviser by virtue of his positions as Chairman of the Sub-Adviser and officer and director of the Manager. Both as a Trustee and as an officer, Mr. Steinmetz serves for an indefinite term, or until his resignation, retirement, death or removal. Mr. Steinmetz’s address is 225 Liberty Street, New York, New York 10281-1008. |
| |
Arthur P. Steinmetz, Trustee (since 2015), President and Principal Executive Officer (since 2014) Year of Birth: 1958 | | Chairman of the Sub-Adviser (since January 2015); CEO and Chairman of the Manager (since July 2014), President of the Manager (since May 2013), a Director of the Manager (since January 2013), Director of the Sub-Adviser (since July 2014), President, Management Director and CEO of Oppenheimer Acquisition Corp. (the Sub-Adviser’s parent holding company) (since July 2014), and President and Director of OFI SteelPath, Inc. (since January 2013). Chief Investment Officer of the OppenheimerFunds advisory entities from (January 2013-December 2013); Executive Vice President of the Manager (January 2013-May 2013); Chief Investment Officer of the Sub-Adviser (October 2010-December 2012); Chief Investment Officer, Fixed-Income, of the Sub-Adviser (April 2009-October 2010); Executive Vice President of the Sub-Adviser (October 2009-December 2012); Director of Fixed Income of the Sub-Adviser (January 2009-April 2009); and a Senior Vice President of the Sub-Adviser (March 1993-September 2009). An officer of 101 portfolios in the OppenheimerFunds complex. |
| |
| OTHER OFFICERS OF THE FUND | | The addresses of the Officers in the chart below are as follows: for Mss. Borré, Lo Bessette, Foxson and Picciotto, 225 Liberty Street, New York, New York 10281-1008, for Mr. Petersen, 6803 S. Tucson Way, Centennial, Colorado 80112-3924. Each Officer serves for an indefinite term or until his or her resignation, retirement, death or removal. |
103 OPPENHEIMER FUNDAMENTAL ALTERNATIVES FUND
TRUSTEES AND OFFICERS Unaudited / Continued
| | |
Michelle Borré, Vice President (since 2011) Year of Birth: 1967 | | Senior Vice President of the Sub-Adviser (since January 2016); Senior Portfolio Manager of the Sub-Adviser (since April 2009);Vice President of the Sub-Adviser (April 2003-January 2016); Senior Research Analyst of the Sub-Adviser (February 2003-April 2009). Ms. Borre held various positions, including Managing Director and Partner, at J&W Seligman (July 1996 -January 2003); Adjunct Professor of Finance and Economics at Columbia Business School (2003-2013); Served on the Executive Advisory Board at the Heilbrunn Center for Graham and Dodd Investing at Columbia Business School (from 2004 to 2005). A portfolio manager and an officer of other portfolios in the OppenheimerFunds complex. |
| |
Cynthia Lo Bessette, Secretary and Chief Legal Officer (since 2016) Year of Birth: 1969 | | Executive Vice President, General Counsel and Secretary of the Manager (since February 2016); Senior Vice President and Deputy General Counsel of the Manager (March 2015-February 2016); Chief Legal Officer of the Sub-Adviser and the Distributor (since February 2016); Vice President, General Counsel and Secretary of Oppenheimer Acquisition Corp. (since February 2016); General Counsel of OFI SteelPath, Inc., VTL Associates, LLC and Index Management Solutions, LLC (since February 2016); Chief Legal Officer of OFI Global Institutional, Inc., HarbourView Asset Management Corporation, OFI Global Trust Company, Oppenheimer Real Asset Management, Inc., OFI Private Investments Inc., Shareholder Services, Inc. and Trinity Investment Management Corporation (since February 2016); Corporate Counsel (February 2012-March 2015) and Deputy Chief Legal Officer (April 2013-March 2015) of Jennison Associates LLC; Assistant General Counsel (April 2008-September 2009) and Deputy General Counsel (October 2009-February 2012) of Lord Abbett & Co. LLC. An officer of 101 portfolios in the OppenheimerFunds complex. |
| |
Jennifer Foxson, Vice President and Chief Business Officer (since 2014) Year of Birth: 1969 | | Senior Vice President of OppenheimerFunds Distributor, Inc. (since June 2014); Vice President of OppenheimerFunds Distributor, Inc. (April 2006-June 2014); Vice President of the Sub-Adviser (January 1998-March 2006); Assistant Vice President of the Sub-Adviser (October 1991-December 1998). An officer of 101 portfolios in the OppenheimerFunds complex. |
| |
Mary Ann Picciotto, Chief Compliance Officer and Chief Anti-Money Laundering Officer (since 2014) Year of Birth: 1973 | | Senior Vice President and Chief Compliance Officer of the Manager (since March 2014); Chief Compliance Officer of the Sub-Adviser, OFI SteelPath, Inc., OFI Global Trust Company, OFI Global Institutional, Inc., Oppenheimer Real Asset Management, Inc., OFI Private Investments, Inc., Harborview Asset Management Corporation, Trinity Investment Management Corporation, and Shareholder Services, Inc. (since March 2014); Managing Director of Morgan Stanley Investment Management Inc. and certain of its various affiliated entities; Chief Compliance Officer of various Morgan Stanley Funds (May 2010-January 2014); Chief Compliance Officer of Morgan Stanley Investment Management Inc. (April 2007-January 2014). An officer of 101 portfolios in the OppenheimerFunds complex. |
| |
Brian S. Petersen, Treasurer and Principal Financial & Accounting Officer (since 2016) Year of Birth: 1970 | | Senior Vice President of the Manager (since January 2017); Vice President of the Manager (January 2013-January 2017); Vice President of the Sub-Adviser (February 2007-December 2012); Assistant Vice President of the Sub-Adviser (August 2002- 2007). An officer of 101 portfolios in the OppenheimerFunds complex. |
The Fund’s Statement of Additional Information contains additional information about the Fund’s Trustees and Officers and is available without charge upon request by calling 1.800.CALL OPP (225.5677).
104 OPPENHEIMER FUNDAMENTAL ALTERNATIVES FUND
OPPENHEIMER FUNDAMENTAL ALTERNATIVES FUND
| | |
| Manager | | OFI Global Asset Management, Inc. |
| |
| Sub-Adviser | | OppenheimerFunds, Inc. |
| |
| Distributor | | OppenheimerFunds Distributor, Inc. |
| |
| Transfer and Shareholder Servicing Agent | | OFI Global Asset Management, Inc. |
| |
| Sub-Transfer Agent | | Shareholder Services, Inc. |
| | DBA OppenheimerFunds Services |
| |
| Independent Registered | | KPMG LLP |
| Public Accounting Firm | | |
| |
| Legal Counsel | | Kramer Levin Naftalis & Frankel LLP |
© 2017 OppenheimerFunds, Inc. All rights reserved.
105 OPPENHEIMER FUNDAMENTAL ALTERNATIVES FUND
PRIVACY NOTICE
As an Oppenheimer fund shareholder, you are entitled to know how we protect your personal information and how we limit its disclosure.
Information Sources
We obtain non-public personal information about our shareholders from the following sources:
| ● | | Applications or other forms. |
| ● | | When you create a user ID and password for online account access. |
| ● | | When you enroll in eDocs Direct,SM our electronic document delivery service. |
| ● | | Your transactions with us, our affiliates or others. |
| ● | | Technologies on our website, including: “cookies” and web beacons, which are used to collect data on the pages you visit and the features you use. |
If you visit oppenheimerfunds.com and do not log on to the secure account information areas, we do not obtain any personal information about you. When you do log on to a secure area, we do obtain your user ID and password to identify you. We also use this information to provide you with products and services you have requested, to inform you about products and services that you may be interested in and assist you in other ways.
We do not collect personal information through our website unless you willingly provide it to us, either directly by email or in those areas of the website that request information. In order to update your personal information (including your mailing address, email address and phone number) you must first log on and visit your user profile.
If you have set your browser to warn you before accepting cookies, you will receive the warning message with each cookie. You can refuse cookies by turning them off in your browser. However, doing so may limit your access to certain sections of our website.
We use cookies to help us improve and manage our website. For example, cookies help us recognize new versus repeat visitors to the site, track the pages visited, and enable some special features on the website. This data helps us provide better service for our website visitors.
Protection of Information
We do not disclose any non-public personal information (such as names on a customer list) about current or former customers to anyone, except as permitted by law.
Disclosure of Information
Copies of confirmations, account statements and other documents reporting activity in your fund accounts are made available to your financial advisor (as designated by you). We may also use details about you and your investments to help us, our financial service affiliates, or firms that jointly market their financial products and services with ours, to better serve your investment needs or suggest educational material that may be of interest to you. If this requires us to provide you with an opportunity to “opt in” or “opt out” of such information sharing with a firm not affiliated with us, you will receive notification on how to do so, before any such sharing takes place.
Right of Refusal
We will not disclose your personal information to unaffiliated third parties (except as permitted by law), unless we first offer you a reasonable opportunity to refuse or “opt out” of such disclosure.
106 OPPENHEIMER FUNDAMENTAL ALTERNATIVES FUND
Internet Security and Encryption
In general, the email services provided by our website are encrypted and provide a secure and private means of communication with us. To protect your own privacy, confidential and/ or personal information should only be communicated via email when you are advised that you are using a secure website.
As a security measure, we do not include personal or account information in non-secure emails, and we advise you not to send such information to us in non-secure emails. Instead, you may take advantage of the secure features of our website to encrypt your email correspondence. To do this, you will need to use a browser that supports Secure Sockets Layer (SSL) protocol.
| ● | | All transactions conducted via our websites, including redemptions, exchanges and purchases, are secured by the highest encryption standards available. SSL is used to establish a secure connection between your PC and OppenheimerFunds’ server. It transmits information in an encrypted and scrambled format. |
| ● | | Encryption is achieved through an electronic scrambling technology that uses a “key” to code and then decode the data. Encryption acts like the cable converter box you may have on your television set. It scrambles data with a secret code so that no one can make sense of it while it is being transmitted. When the data reaches its destination, the same software unscrambles the data. |
| ● | | You can exit the secure area by closing your browser or, for added security, you can use the Log Out button before you close your browser. |
Other Security Measures
We maintain physical, electronic and procedural safeguards to protect your personal account information. Our employees and agents have access to that information only so that they may offer you products or provide services, for example, when responding to your account questions.
How You Can Help
You can also do your part to keep your account information private and to prevent unauthorized transactions. If you obtain a user ID and password for your account, safeguard that information. Strengthening your online credentials–your online security profile–typically your user name, password, and security questions and answers, can be one of your most important lines of defense on the Internet. For additional information on how you can help prevent identity theft, visit https://www. oppenheimerfunds.com/security.
Who We Are
This joint notice describes the privacy policies of the Oppenheimer funds, OppenheimerFunds, Inc., each of its investment adviser subsidiaries, OppenheimerFunds Distributor, Inc. and OFI Global Trust Co. It applies to all Oppenheimer fund accounts you presently have, or may open in the future, using your Social Security number—whether or not you remain a shareholder of our funds. This notice was last updated as of November 2017. In the event it is updated or changed, we will post an updated notice on our website at oppenheimerfunds.com. If you have any questions about this privacy policy, email us by clicking on the Contact Us section of our website at oppenheimerfunds.com, write to us at P.O. Box 5270, Denver, CO 80217-5270, or call us at 800 CALL OPP (225 5677).
107 OPPENHEIMER FUNDAMENTAL ALTERNATIVES FUND
THIS PAGE INTENTIONALLY LEFT BLANK.
108 OPPENHEIMER FUNDAMENTAL ALTERNATIVES FUND
THIS PAGE INTENTIONALLY LEFT BLANK.
109 OPPENHEIMER FUNDAMENTAL ALTERNATIVES FUND
THIS PAGE INTENTIONALLY LEFT BLANK.
110 OPPENHEIMER FUNDAMENTAL ALTERNATIVES FUND
THIS PAGE INTENTIONALLY LEFT BLANK.
111 OPPENHEIMER FUNDAMENTAL ALTERNATIVES FUND
| | | | |
| | 
| | |
| | Visit us at oppenheimerfunds.com for 24-hr access to account information and transactions or call us at 800.CALL OPP (800.225.5677) for 24-hr automated information and automated transactions. Representatives also available Mon–Fri 8am-8pm ET. | | |
Visit Us oppenheimerfunds.com Call Us 800 225 5677 Follow Us | | | | |

| | Oppenheimer funds are distributed by OppenheimerFunds Distributor, Inc. 225 Liberty Street, New York, NY 10281-1008 © 2017 OppenheimerFunds Distributor, Inc. All rights reserved. RA0236.001.1017 December 21, 2017 | | |
Table of Contents
Class A Shares
AVERAGE ANNUAL TOTAL RETURNS AT 10/31/17
| | | | | | |
| | | Class A Shares of the Fund | | |
| | | Without Sales Charge | | With Sales Charge | | Russell MidCap Value
Index |
1-Year | | 20.20% | | 13.29% | | 17.12% |
|
5-Year | | 14.09 | | 12.75 | | 14.49 |
|
10-Year | | 4.51 | | 3.90 | | 7.90 |
|
Performance data quoted represents past performance, which does not guarantee future results. The investment return and principal value of an investment in the Fund will fluctuate so that an investor’s shares, when redeemed, may be worth more or less than their original cost. Fund returns include changes in share price, reinvested distributions, and a 5.75% maximum applicable sales charge except where “without sales charge” is indicated. Current performance may be lower or higher than the performance quoted. Returns do not consider capital gains or income taxes on an individual’s investment. Returns for periods of less than one year are cumulative and not annualized. For performance data current to the most recent month-end, visit oppenheimerfunds.com or call 1.800.CALL OPP (225.5677). See Fund prospectuses and summary prospectuses for more information on share classes and sales charges.
2 OPPENHEIMER MID CAP VALUE FUND
Fund Performance Discussion
The Fund’s Class A shares (without sales charge) returned 20.20% during the reporting period. On a relative basis, the Russell MidCap Value Index (the “Index”) returned 17.12%. The Fund outperformed the Index in 8 out of 11 sectors, led by stock selection in the Industrials and Information Technology sectors and an underweight position in the Real Estate sector. The Fund underperformed the Index primarily within the consumer staples, energy and materials sectors due to stock selection.
MARKET OVERVIEW
It would be an understatement to refer to 2016 as an eventful year, and the fourth quarter provided an exclamation point. Not only did the Chicago Cubs win their first world series in 108 years, the results of the
Presidential election marked a significant change in market sentiment that was widely unexpected. Similar to the surprise Brexit vote in June, expectations of a negative market reaction proved to be
overly pessimistic, and the U.S. equity market reacted in a positive manner.
Markets continued to rally throughout 2017 and the big story in the U.S. equity market has been the performance of growth stocks. For the one-year reporting period ended October 31, 2017, the Russell 1000 Growth Index returned 29.71%, while the Russell 1000 Value Index was up 17.78%. This
COMPARISON OF CHANGE IN VALUE OF $10,000 HYPOTHETICAL INVESTMENTS IN:
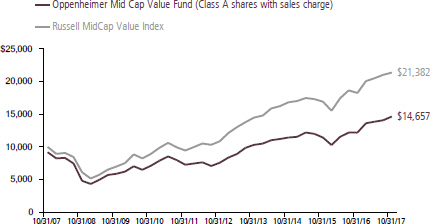
3 OPPENHEIMER MID CAP VALUE FUND
performance continued a trend of growth stocks outperforming that has largely been in place for the past 10 years.
Most sectors of the Index performed positively in this environment, with Information Technology, Financials and Materials leading the way. The only negative performing sectors of the Index were Telecommunication Services and Energy.
FUND REVIEW
Top performing stocks for the Fund this reporting period included Lam Research Corp., Reinsurance Group of America, Inc., and Air Canada. Lam Research, a semiconductor equipment company, reported strong financial results during the year. Over the third quarter of 2017, its results were driven by strength in the memory segment of the semiconductor market. Reinsurance Group of America is a global life and health reinsurance company. The life reinsurance business is dominated by five major firms, which has led to stable pricing within the industry. The company has a leading market position and presence across global markets such as North America, Latin America, Europe and Asia. The stock also rallied with the Financials sector during the reporting period. Over the third quarter of 2017, Canadian national airline Air Canada reported quarterly results that were significantly better than expected, sending the shares up strongly.
Detractors from performance this reporting period included Rite Aid Corp,
Weatherford International plc and Chico’s FAS, Inc. Drugstore operator Rite-Aid has been the target of an acquisition by Walgreen Boots Alliance Inc. After a long process, it appears the company will complete the sale of a number of stores to Walgreens after regulators blocked a sale of the whole company. We exited our position. Weatherford provides drilling services to energy companies globally, and underperformed as revenues were lower than expected. The company is in the process of restructuring its balance sheet, and plans to divest non-core assets in order to reduce its debt load. Chico’s FAS is a specialty retailer of brands serving the lifestyle needs of fashion-savvy women 30 years and older. Shares of the company experienced declines after it reported earnings that came in below analysts’ expectations and weak sales results. We exited our position.
STRATEGY & OUTLOOK
Overall, 2017 has so far been another strong year for U.S. equities. The major equity market indexes have continued their steady advance that has largely been in place for the past several years. As a result, valuations are above normal levels for the market as a whole, but in our view there are attractively valued opportunities we can still take advantage of.
This year has been characterized by improving global economic activity, and we believe those trends will continue through the end of the year. As bottom up value investors, we believe
4 OPPENHEIMER MID CAP VALUE FUND
there are attractively valued stocks that can benefit from these positive trends.
While many investors focus on a short-term view when considering potential investments, the Fund utilizes in-depth fundamental research to identify companies that are poised for an unanticipated acceleration in return on invested capital over a multi-year time
| | |
 | | 
Laton Spahr, CFA Portfolio Manager |
horizon. We believe this longer term approach provides a more comprehensive outlook of potential investments by focusing on all three financial statements – income statement, balance sheet and statement of cash flows – and helps us uncover companies whose generation and use of free cash flow we deem as yet to be fully reflected in the current stock price.
| | |
 | | 
Eric Hewitt Portfolio Manager |
5 OPPENHEIMER MID CAP VALUE FUND
Top Holdings and Allocations
TOP TEN COMMON STOCK HOLDINGS
| | | | |
| Reinsurance Group of America, Inc., Cl. A | | | 2.3% | |
| Hess Corp. | | | 2.1 | |
| Synopsys, Inc. | | | 2.0 | |
| Celanese Corp., Cl. A | | | 1.9 | |
| Parker-Hannifin Corp. | | | 1.9 | |
| XL Group Ltd. | | | 1.8 | |
| Xylem, Inc. | | | 1.7 | |
| Zions Bancorporation | | | 1.7 | |
| SunTrust Banks, Inc. | | | 1.7 | |
| Huntington Ingalls Industries, Inc. | | | 1.6 | |
Portfolio holdings and allocations are subject to change. Percentages are as of October 31, 2017, and are based on net assets. For more current Fund holdings, please visit oppenheimerfunds. com.
TOP TEN COMMON STOCK INDUSTRIES
| | | | |
| Commercial Banks | | | 8.3% | |
| Insurance | | | 7.0 | |
| Machinery | | | 6.9 | |
| Real Estate Investment Trusts (REITs) | | | 6.8 | |
| Electronic Equipment, Instruments, & Components | | | 5.4 | |
| Electric Utilities | | | 4.8 | |
| Oil, Gas & Consumable Fuels | | | 4.8 | |
| Capital Markets | | | 4.4 | |
| Semiconductors & Semiconductor Equipment | | | 3.9 | |
| Pharmaceuticals | | | 3.0 | |
Portfolio holdings and allocations are subject to change. Percentages are as of October 31, 2017, and are based on net assets.
SECTOR ALLOCATION
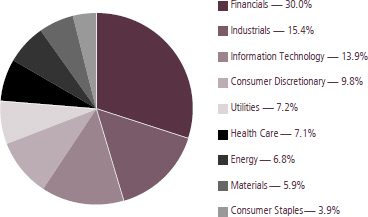
Portfolio holdings and allocations are subject to change. Percentages are as of October 31, 2017, and are based on the total market value of common stocks.
6 OPPENHEIMER MID CAP VALUE FUND
Share Class Performance
AVERAGE ANNUAL TOTAL RETURNS WITHOUT SALES CHARGE AS OF 10/31/17
| | | | | | | | | | | | | | | | | | | | |
| | | Inception
Date | | | 1-Year | | | 5-Year | | | 10-Year | | | | |
| Class A (QVSCX) | | | 1/3/89 | | | | 20.20 | % | | | 14.09 | % | | | 4.51 | % | | | | |
| Class B (QSCBX) | | | 9/1/93 | | | | 19.27 | | | | 13.19 | | | | 4.01 | | | | | |
| Class C (QSCCX) | | | 9/1/93 | | | | 19.30 | | | | 13.23 | | | | 3.72 | | | | | |
| Class I (QSCIX) | | | 2/28/12 | | | | 20.69 | | | | 14.59 | | | | 12.13 | * | | | | |
| Class R (QSCNX) | | | 3/1/01 | | | | 19.90 | | | | 13.80 | | | | 4.24 | | | | | |
| Class Y (QSCYX) | | | 10/24/05 | | | | 20.47 | | | | 14.40 | | | | 4.84 | | | | | |
AVERAGE ANNUAL TOTAL RETURNS WITH SALES CHARGE AS OF 10/31/17
| | | | | | | | | | | | | | | | | | | | |
| | | Inception
Date | | | 1-Year | | | 5-Year | | | 10-Year | | | | |
| Class A (QVSCX) | | | 1/3/89 | | | | 13.29 | % | | | 12.75 | % | | | 3.90 | % | | | | |
| Class B (QSCBX) | | | 9/1/93 | | | | 14.27 | | | | 12.95 | | | | 4.01 | | | | | |
| Class C (QSCCX) | | | 9/1/93 | | | | 18.30 | | | | 13.23 | | | | 3.72 | | | | | |
| Class I (QSCIX) | | | 2/28/12 | | | | 20.69 | | | | 14.59 | | | | 12.13 | * | | | | |
| Class R (QSCNX) | | | 3/1/01 | | | | 19.90 | | | | 13.80 | | | | 4.24 | | | | | |
| Class Y (QSCYX) | | | 10/24/05 | | | | 20.47 | | | | 14.40 | | | | 4.84 | | | | | |
| * | Shows performance since inception. |
Performance data quoted represents past performance, which does not guarantee future results. The investment return and principal value of an investment in the Fund will fluctuate so that an investor’s shares, when redeemed, may be worth more or less than their original cost. Current performance may be lower or higher than the performance quoted. Returns do not consider capital gains or income taxes on an individual’s investment. For performance data current to the most recent month-end, visit oppenheimerfunds.com or call 1.800. CALL OPP (225.5677). Fund returns include changes in share price, reinvested distributions, and the applicable sales charge: for Class A shares, the current maximum initial sales charge of 5.75%; for Class B shares, the contingent deferred sales charge of 5% (1-year) and 2% (5-year); and for Class C shares, the contingent deferred sales charge of 1% for the 1-year period. There is no sales charge for Class I, Class R and Class Y shares. Because Class B shares convert to Class A shares 72 months after purchase, the 10-year return for Class B shares uses Class A performance for the period after conversion. Returns for periods of less than one year are cumulative and not annualized. See Fund prospectuses and summary prospectuses for more information on share classes and sales charges.
The Fund’s performance is compared to that of the Russell MidCap Value Index. The Russell MidCap Value Index measures the performance of the mid-cap value segment of the U.S. equity universe. It includes those Russell MidCap Index companies with lower price-to-book ratios and lower forecasted growth values. The Index is unmanaged and cannot be purchased directly by investors. While index comparisons may be useful to provide a benchmark for the Fund’s performance, it must be noted that the Fund’s investments are not limited to the investments comprising the Index. Index performance includes reinvestment of income, but does not reflect transaction costs, fees, expenses or taxes. Index performance is shown for
7 OPPENHEIMER MID CAP VALUE FUND
illustrative purposes only as a benchmark for the Fund’s performance, and does not predict or depict performance of the Fund. The Fund’s performance reflects the effects of the Fund’s business and operating expenses.
The Fund’s investment strategy and focus can change over time. The mention of specific fund holdings does not constitute a recommendation by OppenheimerFunds, Inc. or its affiliates.
Before investing in any of the Oppenheimer funds, investors should carefully consider a fund’s investment objectives, risks, charges and expenses. Fund prospectuses and summary prospectuses contain this and other information about the funds, and may be obtained by asking your financial advisor, visiting oppenheimerfunds.com, or calling 1.800.CALL OPP (225.5677). Read prospectuses and summary prospectuses carefully before investing.
Shares of Oppenheimer funds are not deposits or obligations of any bank, are not guaranteed by any bank, are not insured by the FDIC or any other agency, and involve investment risks, including the possible loss of the principal amount invested.
8 OPPENHEIMER MID CAP VALUE FUND
Fund Expenses
Fund Expenses. As a shareholder of the Fund, you incur two types of costs: (1) transaction costs, which may include sales charges (loads) on purchase payments and/or contingent deferred sales charges on redemptions; and (2) ongoing costs, including management fees; distribution and service fees; and other Fund expenses. These examples are intended to help you understand your ongoing costs (in dollars) of investing in the Fund and to compare these costs with the ongoing costs of investing in other mutual funds.
The examples are based on an investment of $1,000.00 invested at the beginning of the period and held for the entire 6-month period ended October 31, 2017.
Actual Expenses. The first section of the table provides information about actual account values and actual expenses. You may use the information in this section for the class of shares you hold, together with the amount you invested, to estimate the expense that you paid over the period. Simply divide your account value by $1,000.00 (for example, an $8,600.00 account value divided by $1,000.00 = 8.60), then multiply the result by the number in the first section under the heading entitled “Expenses Paid During 6 Months Ended October 31, 2017” to estimate the expenses you paid on your account during this period.
Hypothetical Example for Comparison Purposes. The second section of the table provides information about hypothetical account values and hypothetical expenses based on the Fund’s actual expense ratio for each class of shares, and an assumed rate of return of 5% per year for each class before expenses, which is not the Fund’s actual return. The hypothetical account values and expenses may not be used to estimate the actual ending account balance or expenses you paid for the period. You may use this information to compare the ongoing costs of investing in the Fund and other funds. To do so, compare this 5% hypothetical example for the class of shares you hold with the 5% hypothetical examples that appear in the shareholder reports of the other funds.
Please note that the expenses shown in the table are meant to highlight your ongoing costs only and do not reflect any transactional costs, such as front-end or contingent deferred sales charges (loads). Therefore, the “hypothetical” section of the table is useful in comparing ongoing costs only, and will not help you determine the relative total costs of owning different funds. In addition, if these transactional costs were included, your costs would have been higher.
9 OPPENHEIMER MID CAP VALUE FUND
| | | | | | | | |
| Actual | | Beginning
Account
Value
May 1, 2017 | | Ending
Account
Value
October 31, 2017 | | Expenses
Paid During
6 Months Ended
October 31, 2017 | | |
Class A | | $ 1,000.00 | | $ 1,057.30 | | $ 6.08 | | |
Class B | | 1,000.00 | | 1,053.10 | | 10.03 | | |
Class C | | 1,000.00 | | 1,053.30 | | 10.04 | | |
Class I | | 1,000.00 | | 1,059.70 | | 3.90 | | |
Class R | | 1,000.00 | | 1,056.00 | | 7.38 | | |
Class Y | | 1,000.00 | | 1,058.60 | | 4.84 | | |
| | | | |
| Hypothetical | | | | | | | | |
| (5% return before expenses) | | | | | | | | |
Class A | | 1,000.00 | | 1,019.31 | | 5.97 | | |
Class B | | 1,000.00 | | 1,015.48 | | 9.85 | | |
Class C | | 1,000.00 | | 1,015.48 | | 9.85 | | |
Class I | | 1,000.00 | | 1,021.42 | | 3.83 | | |
Class R | | 1,000.00 | | 1,018.05 | | 7.25 | | |
Class Y | | 1,000.00 | | 1,020.52 | | 4.75 | | |
Expenses are equal to the Fund’s annualized expense ratio for that class, multiplied by the average account value over the period, multiplied by 184/365 (to reflect the one-half year period). Those annualized expense ratios, excluding indirect expenses from affiliated funds, based on the 6-month period ended October 31, 2017 are as follows:
| | | | | | |
| Class | | Expense Ratios | | | |
Class A | | | 1.17 | % | | |
Class B | | | 1.93 | | | |
Class C | | | 1.93 | | | |
Class I | | | 0.75 | | | |
Class R | | | 1.42 | | | |
Class Y | | | 0.93 | | | |
The expense ratios reflect voluntary and/or contractual waivers and/or reimbursements of expenses by the Fund’s Manager and Transfer Agent. Some of these undertakings may be modified or terminated at any time, as indicated in the Fund’s prospectus. The “Financial Highlights” tables in the Fund’s financial statements, included in this report, also show the gross expense ratios, without such waivers or reimbursements and reduction to custodian expenses, if applicable.
10 OPPENHEIMER MID CAP VALUE FUND
STATEMENT OF INVESTMENTS October 31, 2017
| | | | | | | | |
| | | Shares | | | Value | |
| |
| Common Stocks—96.7% | | | | | | | | |
| |
Consumer Discretionary—9.5% | | | | | |
| |
Automobiles—1.1% | | | | | | | | |
Thor Industries, Inc. | | | 110,610 | | | $ | 15,067,294 | |
|
| |
Hotels, Restaurants & Leisure—2.3% | | | | | |
| Royal Caribbean Cruises Ltd. | | | 142,010 | | | | 17,576,578 | |
| |
| Wyndham Worldwide Corp. | | | 131,880 | | | | 14,091,378 | |
| | | | | | | | |
| | | | | | | 31,667,956 | |
|
| |
Household Durables—1.8% | | | | | |
Helen of Troy Ltd.1 | | | 120,740 | | | | 11,216,746 | |
| |
Whirlpool Corp. | | | 85,110 | | | | 13,952,082 | |
| | | | | | | | |
| | | | | | | 25,168,828 | |
|
| |
Media—0.8% | | | | | | | | |
Cinemark Holdings, Inc. | | | 310,520 | | | | 11,284,297 | |
|
| |
Specialty Retail—1.2% | | | | | | | | |
Ross Stores, Inc. | | | 270,090 | | | | 17,148,014 | |
|
| |
Textiles, Apparel & Luxury Goods—2.3% | | | | | |
Hanesbrands, Inc. | | | 768,930 | | | | 17,300,925 | |
|
| |
Tapestry, Inc.1 | | | 337,140 | | | | 13,805,883 | |
| | | | | | | | |
| | | | | | | 31,106,808 | |
|
| |
Consumer Staples—3.7% | | | | | |
| |
Beverages—1.3% | | | | | | | | |
| Coca-Cola European Partners plc | | | 430,200 | | | | 17,577,972 | |
|
| |
Household Products—2.4% | | | | | |
| Spectrum Brands Holdings, Inc. | | | 187,700 | | | | 20,631,984 | |
| |
Weatherford International plc1 | | | 3,821,070 | | | | 13,259,113 | |
| | | | | | | | |
| | | | | | | 33,891,097 | |
|
| |
Energy—6.5% | | | | | | | | |
| |
Energy Equipment & Services—1.7% | | | | | |
Helmerich & Payne, Inc. | | | 236,299 | | | | 12,833,399 | |
| |
Patterson-UTI Energy, Inc. | | | 581,676 | | | | 11,505,551 | |
| | | | | | | | |
| | | | | | | 24,338,950 | |
|
| |
Oil, Gas & Consumable Fuels—4.8% | | | | | |
Cimarex Energy Co. | | | 191,591 | | | | 22,402,736 | |
| |
Hess Corp. | | | 649,590 | | | | 28,685,894 | |
| | | | | | | | |
| | | Shares | | | Value | |
| |
Oil, Gas & Consumable Fuels (Continued) | |
| |
Newfield | | | | | | | | |
Exploration Co.1 | | | 481,410 | | | $ | 14,822,614 | |
| | | | | | | | |
| | | | | | | 65,911,244 | |
|
| |
Financials—29.0% | | | | | | | | |
| |
Capital Markets—4.4% | | | | | |
Ameriprise | | | | | | | | |
Financial, Inc. | | | 83,170 | | | | 13,019,432 | |
| |
Ares Management LP2 | | | 1,097,034 | | | | 20,130,574 | |
| |
Legg Mason, Inc. | | | 360,370 | | | | 13,758,927 | |
| |
Nasdaq, Inc. | | | 200,010 | | | | 14,530,726 | |
| | | | | | | | |
| | | | | | | 61,439,659 | |
|
| |
Commercial Banks—8.3% | | | | | |
BOK Financial Corp. | | | 122,470 | | | | 10,589,981 | |
| |
Glacier Bancorp, Inc. | | | 199,580 | | | | 7,576,057 | |
| |
KeyCorp | | | 1,031,300 | | | | 18,821,225 | |
| |
SunTrust Banks, Inc. | | | 385,400 | | | | 23,204,934 | |
| |
| Synovus Financial Corp. | | | 444,500 | | | | 20,824,825 | |
| |
Wintrust Financial Corp. | | | 127,342 | | | | 10,351,631 | |
| |
Zions Bancorporation | | | 506,340 | | | | 23,524,556 | |
| | | | | | | | |
| | | | | | | 114,893,209 | |
|
| |
Diversified Financial Services—1.4% | | | | | |
Voya Financial, Inc. | | | 462,930 | | | | 18,591,269 | |
|
| |
Insurance—7.0% | | | | | | | | |
| Arthur J. Gallagher & Co. | | | 198,680 | | | | 12,582,404 | |
| |
| CNO Financial Group, Inc. | | | 754,210 | | | | 18,078,414 | |
| |
Everest Re Group Ltd. | | | 38,510 | | | | 9,144,200 | |
| |
| Reinsurance Group of America, Inc., Cl. A | | | 217,040 | | | | 32,421,435 | |
| |
XL Group Ltd. | | | 612,140 | | | | 24,773,306 | |
| | | | | | | | |
| | | | | | | 96,999,759 | |
|
| |
Real Estate Investment Trusts (REITs)—6.8% | |
| Alexandria Real Estate Equities, Inc. | | | 103,740 | | | | 12,859,611 | |
| |
DCT Industrial Trust, Inc. | | | 321,160 | | | | 18,633,703 | |
| |
Digital Realty Trust, Inc. | | | 137,260 | | | | 16,257,074 | |
| |
Equity LifeStyle Properties, Inc. | | | 130,740 | | | | 11,567,875 | |
11 OPPENHEIMER MID CAP VALUE FUND
STATEMENT OF INVESTMENTS Continued
| | | | | | | | |
| | | Shares | | | Value | |
| |
Real Estate Investment Trusts (REITs) (Continued) | |
| |
Highwoods Properties, Inc. | | | 242,680 | | | $ | 12,388,814 | |
| |
Invitation Homes, Inc. | | | 379,790 | | | | 8,571,860 | |
| |
Uniti Group, Inc. | | | 801,040 | | | | 14,018,200 | |
| | | | | | | | |
| | | | | | | 94,297,137 | |
|
| |
Thrifts & Mortgage Finance—1.1% | | | | | |
Radian Group, Inc. | | | 732,980 | | | | 15,363,261 | |
|
| |
Health Care—6.9% | | | | | | | | |
| |
Health Care Equipment & Supplies—2.7% | |
Boston Scientific Corp.1 | | | 583,637 | | | | 16,423,545 | |
| |
Hologic, Inc.1 | | | 98,840 | | | | 3,741,094 | |
| |
| Zimmer Biomet Holdings, Inc. | | | 141,770 | | | | 17,242,067 | |
| | | | | | | | |
| | | | | | | 37,406,706 | |
|
| |
Life Sciences Tools & Services—1.2% | | | | | |
Quintiles IMS Holdings, Inc.1 | | | 149,491 | | | | 16,159,977 | |
|
| |
Pharmaceuticals—3.0% | | | | | | | | |
Indivior plc, Sponsored ADR1 | | | 812,564 | | | | 20,614,749 | |
| |
Jazz Pharmaceuticals plc1 | | | 150,840 | | | | 21,348,385 | |
| | | | | | | | |
| | | | | | | 41,963,134 | |
|
| |
Industrials—14.9% | | | | | | | | |
| |
Aerospace & Defense—1.6% | | | | | |
| Huntington Ingalls Industries, Inc. | | | 96,290 | | | | 22,419,201 | |
|
| |
Air Freight & Couriers—1.5% | | | | | |
XPO Logistics, Inc.1 | | | 301,860 | | | | 20,933,991 | |
|
| |
Airlines—0.9% | | | | | | | | |
Air Canada1 | | | 607,143 | | | | 12,021,492 | |
|
| |
Building Products—0.8% | | | | | |
JELD-WEN Holding, Inc.1 | | | 288,562 | | | | 10,642,166 | |
|
| |
Electrical Equipment—0.9% | | | | | |
Eaton Corp. plc | | | 160,090 | | | | 12,810,402 | |
|
| |
Machinery—6.9% | | | | | | | | |
ITT, Inc. | | | 200,000 | | | | 9,328,000 | |
| |
Kennametal, Inc. | | | 454,780 | | | | 19,851,147 | |
| |
PACCAR, Inc. | | | 227,780 | | | | 16,338,659 | |
| |
Parker-Hannifin Corp. | | | 142,380 | | | | 26,000,012 | |
| | | | | | | | |
| | | Shares | | | Value | |
| |
Machinery (Continued) | | | | | | | | |
| |
Xylem, Inc. | | | 361,490 | | | $ | 24,049,930 | |
| | | | | | | | |
| | | | | | | 95,567,748 | |
|
| |
Marine—1.1% | | | | | | | | |
Kirby Corp.1 | | | 209,640 | | | | 14,852,994 | |
|
| |
Road & Rail—1.2% | | | | | | | | |
Kansas City Southern | | | 167,250 | | | | 17,430,795 | |
|
| |
Information Technology—13.5% | | | | | |
| |
Electronic Equipment, Instruments, & Components—5.4% | |
| Dolby Laboratories, Inc., Cl. A | | | 155,290 | | | | 8,997,502 | |
| |
Flex Ltd.1 | | | 530,080 | | | | 9,435,424 | |
| |
FLIR Systems, Inc. | | | 253,050 | | | | 11,847,801 | |
| |
Orbotech Ltd.1 | | | 327,200 | | | | 14,632,384 | |
| |
VeriFone Systems, Inc.1 | | | 693,060 | | | | 13,223,585 | |
| |
| Zebra Technologies Corp., Cl. A1 | | | 136,830 | | | | 15,870,912 | |
| | | | | | | | |
| | | | | | | 74,007,608 | |
|
| |
IT Services—1.3% | | | | | | | | |
First Data Corp., Cl. A1 | | | 1,038,900 | | | | 18,502,809 | |
|
| |
Semiconductors & Semiconductor Equipment—3.9% | |
First Solar, Inc.1 | | | 113,800 | | | | 6,238,516 | |
| |
Lam Research Corp. | | | 87,090 | | | | 18,164,361 | |
| |
| Marvell Technology Group Ltd. | | | 1,012,000 | | | | 18,691,640 | |
| |
Tower Semiconductor Ltd.1 | | | 331,130 | | | | 10,947,158 | |
| | | | | | | | |
| | | | | | | 54,041,675 | |
|
| |
Software—2.9% | | | | | | | | |
| Check Point Software Technologies Ltd.1 | | | 102,860 | | | | 12,107,650 | |
| |
Synopsys, Inc.1 | | | 318,140 | | | | 27,525,473 | |
| | | | | | | | |
| | | | | | | 39,633,123 | |
|
| |
Materials—5.7% | | | | | | | | |
| |
Chemicals—1.9% | | | | | | | | |
Celanese Corp., Cl. A | | | 251,820 | | | | 26,267,344 | |
|
| |
Construction Materials—1.2% | | | | | |
Eagle Materials, Inc. | | | 158,390 | | | | 16,721,232 | |
|
| |
Containers & Packaging—2.6% | | | | | |
Ball Corp. | | | 313,000 | | | | 13,437,090 | |
12 OPPENHEIMER MID CAP VALUE FUND
| | | | | | | | |
| | | Shares | | | Value | |
| |
Containers & Packaging (Continued) | | | | | |
| |
WestRock Co. | | | 363,580 | | | $ | 22,298,362 | |
| | | | | | | | |
| | | | | | | 35,735,452 | |
|
| |
Utilities—7.0% | | | | | | | | |
| |
Electric Utilities—4.8% | | | | | | | | |
ALLETE, Inc. | | | 124,070 | | | | 9,720,884 | |
| |
Alliant Energy Corp. | | | 281,830 | | | | 12,191,966 | |
| |
Avangrid, Inc. | | | 217,600 | | | | 11,256,448 | |
| |
Emera, Inc. | | | 363,889 | | | | 13,708,244 | |
| |
Entergy Corp. | | | 225,610 | | | | 19,461,119 | |
| | | | | | | | |
| | | | | | | 66,338,661 | |
|
| |
Multi-Utilities—1.1% | | | | | | | | |
Ameren Corp. | | | 236,220 | | | | 14,643,278 | |
|
| |
Water Utilities—1.1% | | | | | | | | |
American Water | | | | | | | | |
Works Co., Inc. | | | 177,120 | | | | 15,544,051 | |
| | | | | | | | |
| Total Common Stocks (Cost $1,060,396,154) | | | | | | | 1,338,390,593 | |
| | | | | | | | |
| | | Shares | | | Value | |
| |
| Investment Company—0.0% | | | | | |
| |
| Oppenheimer Institutional Government Money Market Fund, Cl. E, 1.01%3,4 (Cost $199,690) | | | 199,690 | | | $ | 199,690 | |
|
| |
| Total Investments, at Value (Cost $1,060,595,844) | | | 96.7% | | | | 1,338,590,283 | |
| |
Net Other Assets (Liabilities) | | | 3.3 | | | | 45,057,975 | |
| | | | |
Net Assets | | | 100.0% | | | $ | 1,383,648,258 | |
| | | | |
Footnotes to Statement of Investments
1. Non-income producing security.
2. Security is a Master Limited Partnership.
3. Rate shown is the 7-day yield at period end.
4. Is or was an affiliate, as defined in the Investment Company Act of 1940, as amended, at or during the reporting period, by virtue of the Fund owning at least 5% of the voting securities of the issuer or as a result of the Fund and the issuer having the same investment adviser. Transactions during the reporting period in which the issuer was an affiliate are as follows:
| | | | | | | | | | | | | | | | |
| | | Shares
October 31, 2016 | | | Gross
Additions | | | Gross
Reductions | | | Shares
October 31, 2017 | |
| |
| Oppenheimer Institutional Government Money Market Fund, Cl. E | | | 23,638,621 | | | | 332,998,998 | | | | 356,437,929 | | | | 199,690 | |
| | | | |
| | | Value | | | Income | | | Realized
Gain (Loss) | | | Change in
Unrealized Gain (Loss) | |
| |
| Oppenheimer Institutional Government Money Market Fund, Cl. E | | $ | 199,690 | | | $ | 126,224 | | | $ | — | | | $ | — | |
See accompanying Notes to Financial Statements.
13 OPPENHEIMER MID CAP VALUE FUND
STATEMENT OF ASSETS AND LIABILITIES October 31, 2017
| | | | |
| |
| Assets | | | | |
Investments, at value—see accompanying statement of investments: | | | | |
Unaffiliated companies (cost $1,060,396,154) | | | $ 1,338,390,593 | |
Affiliated companies (cost $199,690) | | | 199,690 | |
| | | | |
| | | 1,338,590,283 | |
| |
Cash | | | 48,628,371 | |
| |
Receivables and other assets: | | | | |
Investments sold | | | 8,782,376 | |
Shares of beneficial interest sold | | | 621,511 | |
Dividends | | | 425,559 | |
Other | | | 223,265 | |
| | | | |
Total assets | | | 1,397,271,365 | |
|
| |
| Liabilities | | | | |
Bank overdraft-foreign | | | 5,850 | |
| |
Payables and other liabilities: | | | | |
Investments purchased | | | 11,274,725 | |
Shares of beneficial interest redeemed | | | 1,672,316 | |
Trustees’ compensation | | | 358,502 | |
Distribution and service plan fees | | | 269,200 | |
Shareholder communications | | | 11,927 | |
Other | | | 30,587 | |
| | | | |
Total liabilities | | | 13,623,107 | |
|
| |
Net Assets | | | $ 1,383,648,258 | |
| | | | |
|
| |
| Composition of Net Assets | | | | |
Par value of shares of beneficial interest | | | $ 242,267 | |
| |
Additional paid-in capital | | | 1,025,292,997 | |
| |
Accumulated net investment loss | | | (686,504) | |
| |
Accumulated net realized gain on investments and foreign currency transactions | | | 80,805,164 | |
| |
Net unrealized appreciation on investments and translation of assets and liabilities denominated in foreign currencies | | | 277,994,334 | |
| | | | |
Net Assets | | | $ 1,383,648,258 | |
| | | | |
14 OPPENHEIMER MID CAP VALUE FUND
| | | | |
| |
| Net Asset Value Per Share | | | | |
| Class A Shares: | | | | |
| |
| Net asset value and redemption price per share (based on net assets of $965,887,295 and 16,374,137 shares of beneficial interest outstanding) | | $ | 58.99 | |
| |
| Maximum offering price per share (net asset value plus sales charge of 5.75% of offering price) | | $ | 62.59 | |
| |
| |
| Class B Shares: | | | | |
| |
| Net asset value, redemption price (excludes applicable contingent deferred sales charge) and offering price per share (based on net assets of $4,497,521 and 91,520 shares of beneficial interest outstanding) | | $ | 49.14 | |
| |
| |
| Class C Shares: | | | | |
| |
| Net asset value, redemption price (excludes applicable contingent deferred sales charge) and offering price per share (based on net assets of $220,393,635 and 4,479,403 shares of beneficial interest outstanding) | | $ | 49.20 | |
| |
| |
| Class I Shares: | | | | |
| |
| Net asset value, redemption price and offering price per share (based on net assets of $2,522,341 and 42,059 shares of beneficial interest outstanding) | | $ | 59.97 | |
| |
| |
| Class R Shares: | | | | |
| |
| Net asset value, redemption price (excludes applicable contingent deferred sales charge) and offering price per share (based on net assets of $81,351,002 and 1,437,098 shares of beneficial interest outstanding) | | $ | 56.61 | |
| |
| |
| Class Y Shares: | | | | |
| |
| Net asset value, redemption price and offering price per share (based on net assets of $108,996,464 and 1,802,465 shares of beneficial interest outstanding) | | $ | 60.47 | |
See accompanying Notes to Financial Statements.
15 OPPENHEIMER MID CAP VALUE FUND
STATEMENT OF OPERATIONS For the Year Ended October 31, 2017
| | | | |
| |
| Investment Income | | | | |
Dividends: | | | | |
Unaffiliated companies (net of foreign withholding taxes of $80,991) | | $ | 20,643,799 | |
Affiliated companies | | | 126,224 | |
| |
Interest | | | 38,502 | |
| | | | |
Total investment income | | | 20,808,525 | |
|
| |
| Expenses | | | | |
Management fees | | | 9,828,082 | |
| |
Distribution and service plan fees: | | | | |
Class A | | | 2,398,569 | |
Class B | | | 79,939 | |
Class C | | | 2,328,791 | |
Class R | | | 417,951 | |
| |
Transfer and shareholder servicing agent fees: | | | | |
Class A | | | 2,168,672 | |
Class B | | | 17,692 | |
Class C | | | 514,194 | |
Class I | | | 411 | |
Class R | | | 185,193 | |
Class Y | | | 201,532 | |
| |
Shareholder communications: | | | | |
Class A | | | 33,748 | |
Class B | | | 1,056 | |
Class C | | | 7,767 | |
Class I | | | 24 | |
Class R | | | 1,434 | |
Class Y | | | 2,723 | |
| |
Borrowing fees | | | 33,042 | |
| |
Trustees’ compensation | | | 20,707 | |
| |
Custodian fees and expenses | | | 10,103 | |
| |
Other | | | 183,491 | |
| | | | |
Total expenses | | | 18,435,121 | |
Less waivers and reimbursements of expenses | | | (196,550) | |
| | | | |
Net expenses | | | 18,238,571 | |
|
| |
Net Investment Income | | | 2,569,954 | |
16 OPPENHEIMER MID CAP VALUE FUND
| | | | |
| |
| Realized and Unrealized Gain | | | | |
Net realized gain on: | | | | |
Investment transactions in unaffiliated companies | | $ | 158,003,084 | |
Foreign currency transactions | | | 992 | |
| | | | |
Net realized gain | | | 158,004,076 | |
| |
Net change in unrealized appreciation/depreciation on: | | | | |
Investment transactions in unaffiliated companies | | | 91,002,076 | |
Translation of assets and liabilities denominated in foreign currencies | | | 88 | |
| | | | |
Net change in unrealized appreciation/depreciation | | | 91,002,164 | |
|
| |
Net Increase in Net Assets Resulting from Operations | | $ | 251,576,194 | |
| | | | |
See accompanying Notes to Financial Statements.
17 OPPENHEIMER MID CAP VALUE FUND
STATEMENTS OF CHANGES IN NET ASSETS
| | | | | | | | |
| | | Year Ended
October 31, 2017 | | | Year Ended
October 31, 2016 | |
| |
| Operations | | | | | | | | |
Net investment income | | $ | 2,569,954 | | | $ | 4,892,742 | |
| |
Net realized gain | | | 158,004,076 | | | | 17,048,341 | |
| |
Net change in unrealized appreciation/depreciation | | | 91,002,164 | | | | 55,709,332 | |
| | | | |
Net increase in net assets resulting from operations | | | 251,576,194 | | | | 77,650,415 | |
|
| |
| Dividends and/or Distributions to Shareholders | | | | | | | | |
Dividends from net investment income: | | | | | | | | |
Class A | | | (3,971,241) | | | | (4,445,239) | |
Class B | | | — | | | | (2,657) | |
Class C | | | (53,393) | | | | (92,283) | |
Class I | | | (10,505) | | | | (7,219) | |
Class R | | | (160,512) | | | | (224,750) | |
Class Y | | | (566,163) | | | | (369,015) | |
| | | | |
| | | (4,761,814) | | | | (5,141,163) | |
|
| |
| Beneficial Interest Transactions | | | | | | | | |
Net increase (decrease) in net assets resulting from beneficial interest transactions: | | | | | | | | |
Class A | | | (129,209,683) | | | | (98,528,211) | |
Class B | | | (8,498,380) | | | | (10,024,065) | |
Class C | | | (47,007,458) | | | | (39,228,116) | |
Class I | | | 1,350,862 | | | | 112,173 | |
Class R | | | (16,559,746) | | | | (20,417,502) | |
Class Y | | | 33,091,139 | | | | 10,169,570 | |
| | | | |
| | | (166,833,266) | | | | (157,916,151) | |
|
| |
| Net Assets | | | | | | | | |
Total increase (decrease) | | | 79,981,114 | | | | (85,406,899) | |
| |
Beginning of period | | | 1,303,667,144 | | | | 1,389,074,043 | |
| | | | |
| End of period (including accumulated net investment income (loss) of $(686,504) and $352,870, respectively) | | $ | 1,383,648,258 | | | $ | 1,303,667,144 | |
| | | | |
See accompanying Notes to Financial Statements.
18 OPPENHEIMER MID CAP VALUE FUND
FINANCIAL HIGHLIGHTS
| | | | | | | | | | | | | | | | | | | | |
| Class A | | Year Ended
October 31,
2017 | | | Year Ended
October 31,
2016 | | | Year Ended
October 30,
20151 | | | Year Ended
October 31,
2014 | | | Year Ended
October 31,
2013 | |
| |
| Per Share Operating Data | | | | | | | | | | | | | | | | | | | | |
| Net asset value, beginning of period | | | $49.28 | | | | $46.44 | | | | $46.72 | | | | $42.63 | | | | $31.33 | |
| |
| Income (loss) from investment operations: | | | | | | | | | | | | | | | | | | | | |
| Net investment income2 | | | 0.17 | | | | 0.24 | | | | 0.24 | | | | 0.36 | | | | 0.24 | |
| Net realized and unrealized gain (loss) | | | 9.76 | | | | 2.83 | | | | (0.29) | | | | 4.25 | | | | 11.09 | |
| | | | |
| Total from investment operations | | | 9.93 | | | | 3.07 | | | | (0.05) | | | | 4.61 | | | | 11.33 | |
| |
| Dividends and/or distributions to shareholders: | | | | | | | | | | | | | | | | | | | | |
| Dividends from net investment income | | | (0.22) | | | | (0.23) | | | | (0.23) | | | | (0.52) | | | | (0.03) | |
| |
| Net asset value, end of period | | | $58.99 | | | | $49.28 | | | | $46.44 | | | | $46.72 | | | | $42.63 | |
| | | | |
| | | | | | | | | | | | | | | | | | | | |
| |
| Total Return, at Net Asset Value3 | | | 20.20% | | | | 6.62% | | | | (0.13)% | | | | 10.91% | | | | 36.16% | |
| | | | | | | | | | | | | | | | | | | | |
| |
| Ratios/Supplemental Data | | | | | | | | | | | | | | | | | | | | |
| Net assets, end of period (in thousands) | | | $965,887 | | | | $920,277 | | | | $966,842 | | | | $1,104,252 | | | | $1,162,455 | |
| |
| Average net assets (in thousands) | | | $986,140 | | | | $916,503 | | | | $1,085,463 | | | | $1,151,106 | | | | $1,013,781 | |
| |
| Ratios to average net assets:4 | | | | | | | | | | | | | | | | | | | | |
| Net investment income | | | 0.31% | | | | 0.53% | | | | 0.49% | | | | 0.80% | | | | 0.65% | |
| Expenses excluding specific expenses listed below | | | 1.18% | | | | 1.19% | | | | 1.17% | | | | 1.18% | | | | 1.27% | |
| Interest and fees from borrowings | | | 0.00%5 | | | | 0.00%5 | | | | 0.00%5 | | | | 0.00% | | | | 0.00% | |
| | | | |
| Total expenses6 | | | 1.18% | | | | 1.19% | | | | 1.17% | | | | 1.18% | | | | 1.27% | |
| Expenses after payments, waivers and/or reimbursements and reduction to custodian expenses | | | 1.17% | | | | 1.19%7 | | | | 1.17%7 | | | | 1.18%7 | | | | 1.27%7 | |
| |
| Portfolio turnover rate | | | 63% | | | | 34% | | | | 47% | | | | 51% | | | | 128% | |
1. Represents the last business day of the Fund’s reporting period.
2. Per share amounts calculated based on the average shares outstanding during the period.
3. Assumes an initial investment on the business day before the first day of the fiscal period, with all dividends and distributions reinvested in additional shares on the reinvestment date, and redemption at the net asset value calculated on the last business day of the fiscal period. Sales charges are not reflected in the total returns. Total returns are not annualized for periods less than one full year. Returns do not reflect the deduction of taxes that a shareholder would pay on fund distributions or the redemption of fund shares.
4. Annualized for periods less than one full year.
5. Less than 0.005%.
6. Total expenses including indirect expenses from affiliated fund fees and expenses were as follows:
| | | | |
| Year Ended October 31, 2017 | | 1.18% | |
| Year Ended October 31, 2016 | | 1.19% | |
| Year Ended October 30, 2015 | | 1.17% | |
| Year Ended October 31, 2014 | | 1.18% | |
| Year Ended October 31, 2013 | | 1.27% | |
7. Waiver was less than 0.005%.
See accompanying Notes to Financial Statements.
19 OPPENHEIMER MID CAP VALUE FUND
FINANCIAL HIGHLIGHTS Continued
| | | | | | | | | | | | | | | | | | | | |
| Class B | | Year Ended
October 31,
2017 | | | Year Ended
October 31,
2016 | | | Year Ended
October 30,
20151 | | | Year Ended
October 31,
2014 | | | Year Ended
October 31,
2013 | |
| |
| Per Share Operating Data | | | | | | | | | | | | | | | | | | | | |
| Net asset value, beginning of period | | | $41.21 | | | | $38.94 | | | | $39.29 | | | | $35.74 | | | | $26.48 | |
| |
| Income (loss) from investment operations: | | | | | | | | | | | | | | | | | | | | |
| Net investment income (loss)2 | | | (0.17) | | | | (0.07) | | | | (0.10) | | | | 0.01 | | | | (0.08) | |
| Net realized and unrealized gain (loss) | | | 8.10 | | | | 2.35 | | | | (0.25) | | | | 3.57 | | | | 9.34 | |
| | | | |
| Total from investment operations | | | 7.93 | | | | 2.28 | | | | (0.35) | | | | 3.58 | | | | 9.26 | |
| |
| Dividends and/or distributions to shareholders: | | | | | | | | | | | | | | | | | | | | |
| Dividends from net investment income | | | 0.00 | | | | (0.01) | | | | 0.00 | | | | (0.03) | | | | 0.00 | |
| |
| Net asset value, end of period | | | $49.14 | | | | $41.21 | | | | $38.94 | | | | $39.29 | | | | $35.74 | |
| | | | |
| | | | | | | | | | | | | | | | | | | | |
| |
| Total Return, at Net Asset Value3 | | | 19.27% | | | | 5.85% | | | | (0.89)% | | | | 10.03% | | | | 34.97% | |
| | | | | | | | | | | | | | | | | | | | |
| |
| Ratios/Supplemental Data | | | | | | | | | | | | | | | | | | | | |
| Net assets, end of period (in thousands) | | | $4,498 | | | | $11,360 | | | | $20,774 | | | | $37,092 | | | | $48,927 | |
| |
| Average net assets (in thousands) | | | $8,018 | | | | $14,935 | | | | $29,531 | | | | $43,889 | | | | $48,518 | |
| |
| Ratios to average net assets:4 | | | | | | | | | | | | | | | | | | | | |
| Net investment income (loss) | | | (0.36)% | | | | (0.18)% | | | | (0.23)% | | | | 0.04% | | | | (0.25)% | |
| Expenses excluding specific expenses listed below | | | 1.94% | | | | 1.95% | | | | 1.92% | | | | 2.01% | | | | 2.35% | |
| Interest and fees from borrowings | | | 0.00%5 | | | | 0.00%5 | | | | 0.00%5 | | | | 0.00% | | | | 0.00% | |
| | | | |
| Total expenses6 | | | 1.94% | | | | 1.95% | | | | 1.92% | | | | 2.01% | | | | 2.35% | |
| Expenses after payments, waivers and/or reimbursements and reduction to custodian expenses | | | 1.93% | | | | 1.95%7 | | | | 1.92%7 | | | | 1.96% | | | | 2.15% | |
| |
| Portfolio turnover rate | | | 63% | | | | 34% | | | | 47% | | | | 51% | | | | 128% | |
1. Represents the last business day of the Fund’s reporting period.
2. Per share amounts calculated based on the average shares outstanding during the period.
3. Assumes an initial investment on the business day before the first day of the fiscal period, with all dividends and distributions reinvested in additional shares on the reinvestment date, and redemption at the net asset value calculated on the last business day of the fiscal period. Sales charges are not reflected in the total returns. Total returns are not annualized for periods less than one full year. Returns do not reflect the deduction of taxes that a shareholder would pay on fund distributions or the redemption of fund shares.
4. Annualized for periods less than one full year.
5. Less than 0.005%.
6. Total expenses including indirect expenses from affiliated fund fees and expenses were as follows:
| | | | |
| Year Ended October 31, 2017 | | 1.94% | |
| Year Ended October 31, 2016 | | 1.95% | |
| Year Ended October 30, 2015 | | 1.92% | |
| Year Ended October 31, 2014 | | 2.01% | |
| Year Ended October 31, 2013 | | 2.35% | |
7. Waiver was less than 0.005%.
See accompanying Notes to Financial Statements.
20 OPPENHEIMER MID CAP VALUE FUND
| | | | | | | | | | | | | | | | | | | | |
| Class C | | Year Ended
October 31,
2017 | | | Year Ended
October 31,
2016 | | | Year Ended
October 30,
20151 | | | Year Ended
October 31,
2014 | | | Year Ended
October 31,
2013 | |
| |
| Per Share Operating Data | | | | | | | | | | | | | | | | | | | | |
| Net asset value, beginning of period | | | $41.26 | | | | $39.00 | | | | $39.35 | | | | $35.83 | | | | $26.52 | |
| |
| Income (loss) from investment operations: | | | | | | | | | | | | | | | | | | | | |
| Net investment income (loss)2 | | | (0.20) | | | | (0.09) | | | | (0.11) | | | | 0.02 | | | | (0.04) | |
| Net realized and unrealized gain (loss) | | | 8.15 | | | | 2.37 | | | | (0.24) | | | | 3.59 | | | | 9.35 | |
| | | | |
| Total from investment operations | | | 7.95 | | | | 2.28 | | | | (0.35) | | | | 3.61 | | | | 9.31 | |
| |
| Dividends and/or distributions to shareholders: | | | | | | | | | | | | | | | | | | | | |
| Dividends from net investment income | | | (0.01) | | | | (0.02) | | | | 0.00 | | | | (0.09) | | | | 0.00 | |
| |
| Net asset value, end of period | | | $49.20 | | | | $41.26 | | | | $39.00 | | | | $39.35 | | | | $35.83 | |
| | | | |
| | | | | | | | | | | | | | | | | | | | |
| |
| Total Return, at Net Asset Value3 | | | 19.30% | | | | 5.84% | | | | (0.87)% | | | | 10.05% | | | | 35.10% | |
| | | | | | | | | | | | | | | | | | | | |
| |
| Ratios/Supplemental Data | | | | | | | | | | | | | | | | | | | | |
| Net assets, end of period (in thousands) | | | $220,394 | | | | $226,455 | | | | $253,446 | | | | $279,925 | | | | $276,676 | |
| |
| Average net assets (in thousands) | | | $233,758 | | | | $233,067 | | | | $278,916 | | | | $283,792 | | | | $252,028 | |
| |
| Ratios to average net assets:4 | | | | | | | | | | | | | | | | | | | | |
| Net investment income (loss) | | | (0.44)% | | | | (0.23)% | | | | (0.26)% | | | | 0.05% | | | | (0.13)% | |
| Expenses excluding specific expenses listed below | | | 1.93% | | | | 1.95% | | | | 1.92% | | | | 1.93% | | | | 2.05% | |
| Interest and fees from borrowings | | | 0.00%5 | | | | 0.00%5 | | | | 0.00%5 | | | | 0.00% | | | | 0.00% | |
| | | | |
| Total expenses6 | | | 1.93% | | | | 1.95% | | | | 1.92% | | | | 1.93% | | | | 2.05% | |
| Expenses after payments, waivers and/or reimbursements and reduction to custodian expenses | | | 1.92% | | | | 1.95%7 | | | | 1.92%7 | | | | 1.93%7 | | | | 2.05%7 | |
| |
| Portfolio turnover rate | | | 63% | | | | 34% | | | | 47% | | | | 51% | | | | 128% | |
1. Represents the last business day of the Fund’s reporting period.
2. Per share amounts calculated based on the average shares outstanding during the period.
3. Assumes an initial investment on the business day before the first day of the fiscal period, with all dividends and distributions reinvested in additional shares on the reinvestment date, and redemption at the net asset value calculated on the last business day of the fiscal period. Sales charges are not reflected in the total returns. Total returns are not annualized for periods less than one full year. Returns do not reflect the deduction of taxes that a shareholder would pay on fund distributions or the redemption of fund shares.
4. Annualized for periods less than one full year.
5. Less than 0.005%.
6. Total expenses including indirect expenses from affiliated fund fees and expenses were as follows:
| | | | |
| Year Ended October 31, 2017 | | 1.93% | |
| Year Ended October 31, 2016 | | 1.95% | |
| Year Ended October 30, 2015 | | 1.92% | |
| Year Ended October 31, 2014 | | 1.93% | |
| Year Ended October 31, 2013 | | 2.05% | |
7. Waiver was less than 0.005%.
See accompanying Notes to Financial Statements.
21 OPPENHEIMER MID CAP VALUE FUND
FINANCIAL HIGHLIGHTS Continued
| | | | | | | | | | | | | | | | | | | | |
| Class I | | Year Ended
October 31,
2017 | | | Year Ended
October 31,
2016 | | | Year Ended
October 30,
20151 | | | Year Ended
October 31,
2014 | | | Year Ended
October 31,
2013 | |
| |
| Per Share Operating Data | | | | | | | | | | | | | | | | | | | | |
| Net asset value, beginning of period | | | $50.10 | | | | $47.20 | | | | $47.49 | | | | $43.64 | | | | $31.88 | |
| |
| Income (loss) from investment operations: | | | | | | | | | | | | | | | | | | | | |
| Net investment income2 | | | 0.39 | | | | 0.44 | | | | 0.43 | | | | 0.47 | | | | 0.49 | |
| Net realized and unrealized gain (loss) | | | 9.94 | | | | 2.89 | | | | (0.27) | | | | 4.42 | | | | 11.27 | |
| | | | |
| Total from investment operations | | | 10.33 | | | | 3.33 | | | | 0.16 | | | | 4.89 | | | | 11.76 | |
| |
| Dividends and/or distributions to shareholders: | | | | | | | | | | | | | | | | | | | | |
| Dividends from net investment income | | | (0.46) | | | | (0.43) | | | | (0.45) | | | | (1.04) | | | | 0.00 | |
| |
| Net asset value, end of period | | | $59.97 | | | | $50.10 | | | | $47.20 | | | | $47.49 | | | | $43.64 | |
| | | | |
| | | | | | | | | | | | | | | | | | | | |
| |
| Total Return, at Net Asset Value3 | | | 20.69% | | | | 7.10% | | | | 0.31% | | | | 11.36% | | | | 36.85% | |
| | | | | | | | | | | | | | | | | | | | |
| |
| Ratios/Supplemental Data | | | | | | | | | | | | | | | | | | | | |
| Net assets, end of period (in thousands) | | | $2,522 | | | | $950 | | | | $788 | | | | $427 | | | | $95 | |
| |
| Average net assets (in thousands) | | | $1,375 | | | | $803 | | | | $621 | | | | $178 | | | | $35 | |
| |
| Ratios to average net assets:4 | | | | | | | | | | | | | | | | | | | | |
| Net investment income | | | 0.69% | | | | 0.93% | | | | 0.88% | | | | 1.02% | | | | 1.23% | |
| Expenses excluding specific expenses listed below | | | 0.75% | | | | 0.76% | | | | 0.73% | | | | 0.76% | | | | 0.77% | |
| Interest and fees from borrowings | | | 0.00%5 | | | | 0.00%5 | | | | 0.00%5 | | | | 0.00% | | | | 0.00% | |
| | | | |
| Total expenses6 | | | 0.75% | | | | 0.76% | | | | 0.73% | | | | 0.76% | | | | 0.77% | |
| Expenses after payments, waivers and/or reimbursements and reduction to custodian expenses | | | 0.75%7 | | | | 0.76%7 | | | | 0.73%7 | | | | 0.76%7 | | | | 0.77%7 | |
| |
| Portfolio turnover rate | | | 63% | | | | 34% | | | | 47% | | | | 51% | | | | 128% | |
1. Represents the last business day of the Fund’s reporting period.
2. Per share amounts calculated based on the average shares outstanding during the period.
3. Assumes an initial investment on the business day before the first day of the fiscal period, with all dividends and distributions reinvested in additional shares on the reinvestment date, and redemption at the net asset value calculated on the last business day of the fiscal period. Sales charges are not reflected in the total returns. Total returns are not annualized for periods less than one full year. Returns do not reflect the deduction of taxes that a shareholder would pay on fund distributions or the redemption of fund shares.
4. Annualized for periods less than one full year.
5. Less than 0.005%.
6. Total expenses including indirect expenses from affiliated fund fees and expenses were as follows:
| | | | |
| Year Ended October 31, 2017 | | 0.75% | |
| Year Ended October 31, 2016 | | 0.76% | |
| Year Ended October 30, 2015 | | 0.73% | |
| Year Ended October 31, 2014 | | 0.76% | |
| Year Ended October 31, 2013 | | 0.77% | |
7. Waiver was less than 0.005%.
See accompanying Notes to Financial Statements.
22 OPPENHEIMER MID CAP VALUE FUND
| | | | | | | | | | | | | | | | | | | | |
| Class R | | Year Ended
October 31,
2017 | | | Year Ended
October 31,
2016 | | | Year Ended
October 30,
20151 | | | Year Ended
October 31,
2014 | | | Year Ended
October 31,
2013 | |
| |
| Per Share Operating Data | | | | | | | | | | | | | | | | | | | | |
| Net asset value, beginning of period | | | $47.31 | | | | $44.59 | | | | $44.88 | | | | $40.87 | | | | $30.09 | |
| |
| Income (loss) from investment operations: | | | | | | | | | | | | | | | | | | | | |
| Net investment income2 | | | 0.04 | | | | 0.13 | | | | 0.12 | | | | 0.23 | | | | 0.14 | |
| Net realized and unrealized gain (loss) | | | 9.36 | | | | 2.71 | | | | (0.30) | | | | 4.09 | | | | 10.64 | |
| | | | |
| Total from investment operations | | | 9.40 | | | | 2.84 | | | | (0.18) | | | | 4.32 | | | | 10.78 | |
| |
| Dividends and/or distributions to shareholders: | | | | | | | | | | | | | | | | | | | | |
| Dividends from net investment income | | | (0.10) | | | | (0.12) | | | | (0.11) | | | | (0.31) | | | | 0.00 | |
| |
| Net asset value, end of period | | | $56.61 | | | | $47.31 | | | | $44.59 | | | | $44.88 | | | | $40.87 | |
| | | | |
| | | | | | | | | | | | | | | | | | | | |
| |
| Total Return, at Net Asset Value3 | | | 19.90% | | | | 6.38% | | | | (0.38)% | | | | 10.61% | | | | 35.79% | |
| | | | | | | | | | | | | | | | | | | | |
| |
| Ratios/Supplemental Data | | | | | | | | | | | | | | | | | | | | |
| Net assets, end of period (in thousands) | | | $81,351 | | | | $82,661 | | | | $97,983 | | | | $125,703 | | | | $130,267 | |
| |
| Average net assets (in thousands) | | | $84,193 | | | | $85,721 | | | | $114,811 | | | | $129,580 | | | | $129,674 | |
| |
| Ratios to average net assets:4 | | | | | | | | | | | | | | | | | | | | |
| Net investment income | | | 0.07% | | | | 0.28% | | | | 0.25% | | | | 0.53% | | | | 0.39% | |
| Expenses excluding specific expenses listed below | | | 1.43% | | | | 1.45% | | | | 1.42% | | | | 1.45% | | | | 1.53% | |
| Interest and fees from borrowings | | | 0.00%5 | | | | 0.00%5 | | | | 0.00%5 | | | | 0.00% | | | | 0.00% | |
| | | | |
| Total expenses6 | | | 1.43% | | | | 1.45% | | | | 1.42% | | | | 1.45% | | | | 1.53% | |
| Expenses after payments, waivers and/or reimbursements and reduction to custodian expenses | | | 1.42% | | | | 1.45%7 | | | | 1.42%7 | | | | 1.45%7 | | | | 1.53%7 | |
| |
| Portfolio turnover rate | | | 63% | | | | 34% | | | | 47% | | | | 51% | | | | 128% | |
1. Represents the last business day of the Fund’s reporting period.
2. Per share amounts calculated based on the average shares outstanding during the period.
3. Assumes an initial investment on the business day before the first day of the fiscal period, with all dividends and distributions reinvested in additional shares on the reinvestment date, and redemption at the net asset value calculated on the last business day of the fiscal period. Sales charges are not reflected in the total returns. Total returns are not annualized for periods less than one full year. Returns do not reflect the deduction of taxes that a shareholder would pay on fund distributions or the redemption of fund shares.
4. Annualized for periods less than one full year.
5. Less than 0.005%.
6. Total expenses including indirect expenses from affiliated fund fees and expenses were as follows:
| | | | |
| Year Ended October 31, 2017 | | 1.43% | |
| Year Ended October 31, 2016 | | 1.45% | |
| Year Ended October 30, 2015 | | 1.42% | |
| Year Ended October 31, 2014 | | 1.45% | |
| Year Ended October 31, 2013 | | 1.53% | |
7. Waiver was less than 0.005%.
See accompanying Notes to Financial Statements.
23 OPPENHEIMER MID CAP VALUE FUND
FINANCIAL HIGHLIGHTS Continued
| | | | | | | | | | | | | | | | | | | | |
| Class Y | | Year Ended
October 31,
2017 | | | Year Ended
October 31,
2016 | | | Year Ended
October 30,
20151 | | | Year Ended
October 31,
2014 | | | Year Ended
October 31,
2013 | |
| |
| Per Share Operating Data | | | | | | | | | | | | | | | | | | | | |
| Net asset value, beginning of period | | | $50.52 | | | | $47.59 | | | | $47.88 | | | | $43.81 | | | | $32.20 | |
| |
| Income (loss) from investment operations: | | | | | | | | | | | | | | | | | | | | |
| Net investment income2 | | | 0.30 | | | | 0.36 | | | | 0.36 | | | | 0.52 | | | | 0.34 | |
| Net realized and unrealized gain (loss) | | | 10.01 | | | | 2.91 | | | | (0.30) | | | | 4.37 | | | | 11.40 | |
| | | | |
| Total from investment operations | | | 10.31 | | | | 3.27 | | | | 0.06 | | | | 4.89 | | | | 11.74 | |
| |
| Dividends and/or distributions to shareholders: | | | | | | | | | | | | | | | | | | | | |
| Dividends from net investment income | | | (0.36) | | | | (0.34) | | | | (0.35) | | | | (0.82) | | | | (0.13) | |
| |
| Net asset value, end of period | | | $60.47 | | | | $50.52 | | | | $47.59 | | | | $47.88 | | | | $43.81 | |
| | | | |
| | | | | | | | | | | | | | | | | | | | |
| |
| Total Return, at Net Asset Value3 | | | 20.47% | | | | 6.92% | | | | 0.12% | | | | 11.30% | | | | 36.55% | |
| | | | | | | | | | | | | | | | | | | | |
| |
| Ratios/Supplemental Data | | | | | | | | | | | | | | | | | | | | |
| Net assets, end of period (in thousands) | | | $108,996 | | | | $61,964 | | | | $49,241 | | | | $50,323 | | | | $49,589 | |
| |
| Average net assets (in thousands) | | | $91,745 | | | | $49,957 | | | | $51,876 | | | | $50,290 | | | | $50,572 | |
| |
| Ratios to average net assets:4 | | | | | | | | | | | | | | | | | | | | |
| Net investment income | | | 0.53% | | | | 0.74% | | | | 0.73% | | | | 1.13% | | | | 0.91% | |
| Expenses excluding specific expenses listed below | | | 0.94% | | | | 0.95% | | | | 0.92% | | | | 0.84% | | | | 0.98% | |
| Interest and fees from borrowings | | | 0.00%5 | | | | 0.00%5 | | | | 0.00%5 | | | | 0.00% | | | | 0.00% | |
| | | | |
| Total expenses6 | | | 0.94% | | | | 0.95% | | | | 0.92% | | | | 0.84% | | | | 0.98% | |
| Expenses after payments, waivers and/or reimbursements and reduction to custodian expenses | | | 0.93% | | | | 0.95%7 | | | | 0.92%7 | | | | 0.83% | | | | 0.98%7 | |
| |
| Portfolio turnover rate | | | 63% | | | | 34% | | | | 47% | | | | 51% | | | | 128% | |
1. Represents the last business day of the Fund’s reporting period.
2. Per share amounts calculated based on the average shares outstanding during the period.
3. Assumes an initial investment on the business day before the first day of the fiscal period, with all dividends and distributions reinvested in additional shares on the reinvestment date, and redemption at the net asset value calculated on the last business day of the fiscal period. Sales charges are not reflected in the total returns. Total returns are not annualized for periods less than one full year. Returns do not reflect the deduction of taxes that a shareholder would pay on fund distributions or the redemption of fund shares.
4. Annualized for periods less than one full year.
5. Less than 0.005%.
6. Total expenses including indirect expenses from affiliated fund fees and expenses were as follows:
| | | | |
| Year Ended October 31, 2017 | | 0.94% | |
| Year Ended October 31, 2016 | | 0.95% | |
| Year Ended October 30, 2015 | | 0.92% | |
| Year Ended October 31, 2014 | | 0.84% | |
| Year Ended October 31, 2013 | | 0.98% | |
7. Waiver was less than 0.005%.
See accompanying Notes to Financial Statements.
24 OPPENHEIMER MID CAP VALUE FUND
NOTES TO FINANCIAL STATEMENTS October 31, 2017
1. Organization
Oppenheimer Mid Cap Value Fund (the “Fund”), a series of Oppenheimer Quest for Value Funds, is registered under the Investment Company Act of 1940 (“1940 Act”), as amended, as a diversified open-end management investment company. The Fund’s investment objective is to seek capital appreciation. The Fund’s investment adviser is OFI Global Asset Management, Inc. (“OFI Global” or the “Manager”), a wholly-owned subsidiary of OppenheimerFunds, Inc. (“OFI” or the “Sub-Adviser”). The Manager has entered into a sub-advisory agreement with OFI.
The Fund offers Class A, Class C, Class I, Class R and Class Y shares, and previously offered Class B shares for new purchase through June 29, 2012. Subsequent to that date, no new purchases of Class B shares are permitted, however reinvestment of dividend and/or capital gain distributions and exchanges of Class B shares into and from other Oppenheimer funds are allowed. Class A shares are sold at their offering price, which is normally net asset value plus a front-end sales charge. Class C and Class R shares are sold, and Class B shares were sold, without a front-end sales charge but may be subject to a CDSC. Class R shares are sold only through retirement plans. Retirement plans that offer Class R shares may impose charges on those accounts. Class I and Class Y shares are sold to certain institutional investors or intermediaries without either a front-end sales charge or a CDSC, however, the intermediaries may impose charges on their accountholders who beneficially own Class I and Class Y shares. All classes of shares have identical rights and voting privileges with respect to the Fund in general and exclusive voting rights on matters that affect that class alone. Earnings, net assets and net asset value per share may differ due to each class having its own expenses, such as transfer and shareholder servicing agent fees and shareholder communications, directly attributable to that class. Class A, B, C and R shares have separate distribution and/or service plans under which they pay fees. Class I and Class Y shares do not pay such fees. Class B shares will automatically convert to Class A shares 72 months after the date of purchase.
The following is a summary of significant accounting policies followed in the Fund’s preparation of financial statements in accordance with accounting principles generally accepted in the United States (“U.S. GAAP”).
2. Significant Accounting Policies
Security Valuation. All investments in securities are recorded at their estimated fair value, as described in Note 3.
Foreign Currency Translation. The books and records of the Fund are maintained in U.S. dollars. Any foreign currency amounts are translated into U.S. dollars on the following basis:
(1) Value of investment securities, other assets and liabilities — at the exchange rates prevailing at Market Close as described in Note 3.
(2) Purchases and sales of investment securities, income and expenses — at the rates of exchange prevailing on the respective dates of such transactions.
Although the net assets and the values are presented at the foreign exchange rates at Market Close, the Fund does not isolate the portion of the results of operations resulting from
25 OPPENHEIMER MID CAP VALUE FUND
NOTES TO FINANCIAL STATEMENTS Continued
2. Significant Accounting Policies (Continued)
changes in foreign exchange rates on investments from the fluctuations arising from changes in prices of securities held. Such fluctuations are included with the net realized and unrealized gains or losses from investments shown in the Statement of Operations.
For securities, which are subject to foreign withholding tax upon disposition, realized gains or losses on such securities are recorded net of foreign withholding tax.
Reported net realized foreign exchange gains or losses arise from sales of foreign currencies, currency gains or losses realized between the trade and settlement dates on securities transactions, the difference between the amounts of dividends, interest, and foreign withholding tax reclaims recorded on the Fund’s books, and the U.S. dollar equivalent of the amounts actually received or paid. Net unrealized foreign exchange gains and losses arise from changes in the value of assets and liabilities other than investments in securities, resulting from changes in the exchange rate.
Allocation of Income, Expenses, Gains and Losses. Income, expenses (other than those attributable to a specific class), gains and losses are allocated on a daily basis to each class of shares based upon the relative proportion of net assets represented by such class. Operating expenses directly attributable to a specific class are charged against the operations of that class.
Dividends and Distributions to Shareholders. Dividends and distributions to shareholders, which are determined in accordance with income tax regulations and may differ from U.S. GAAP, are recorded on the ex-dividend date. Income distributions, if any, are declared and paid quarterly. Capital gain distributions, if any, are declared and paid annually or at other times as deemed necessary by the Manager.
Investment Income. Dividend income is recorded on the ex-dividend date or upon ex-dividend notification in the case of certain foreign dividends where the ex-dividend date may have passed. Non-cash dividends included in dividend income, if any, are recorded at the fair value of the securities received. Withholding taxes on foreign dividends, if any, and capital gains taxes on foreign investments, if any, have been provided for in accordance with the Fund’s understanding of the applicable tax rules and regulations. Interest income is recognized on an accrual basis. Discount and premium, which are included in interest income on the Statement of Operations, are amortized or accreted daily.
Return of Capital Estimates. Distributions received from the Fund’s investments in Master Limited Partnerships (MLPs) and Real Estate Investments Trusts (REITs), generally are comprised of income and return of capital. The Fund records investment income and return of capital based on estimates. Such estimates are based on historical information available from each MLP, REIT and other industry sources. These estimates may subsequently be revised based on information received from MLPs and REITs after their tax reporting periods are concluded.
26 OPPENHEIMER MID CAP VALUE FUND
2. Significant Accounting Policies (Continued)
Custodian Fees. “Custodian fees and expenses” in the Statement of Operations may include interest expense incurred by the Fund on any cash overdrafts of its custodian account during the period. Such cash overdrafts may result from the effects of failed trades in portfolio securities and from cash outflows resulting from unanticipated shareholder redemption activity. Prior to July 17, 2017, the Fund paid interest to its custodian on such cash overdrafts, to the extent they were not offset by positive cash balances maintained by the Fund, when applicable, at a rate equal to the negative rolling average balance at an average Federal Funds Rate plus 0.50%. This rate increased to the Prime Rate plus 0.35% effective July 17, 2017. The “Reduction to custodian expenses” line item, if applicable, represents earnings on cash balances maintained by the Fund during the period. Such interest expense and other custodian fees may be paid with these earnings.
Security Transactions. Security transactions are recorded on the trade date. Realized gains and losses on securities sold are determined on the basis of identified cost.
Indemnifications. The Fund’s organizational documents provide current and former Trustees and officers with a limited indemnification against liabilities arising in connection with the performance of their duties to the Fund. In the normal course of business, the Fund may also enter into contracts that provide general indemnifications. The Fund’s maximum exposure under these arrangements is unknown as this would be dependent on future claims that may be made against the Fund. The risk of material loss from such claims is considered remote.
Federal Taxes. The Fund intends to comply with provisions of the Internal Revenue Code applicable to regulated investment companies and to distribute substantially all of its investment company taxable income, including any net realized gain on investments not offset by capital loss carryforwards, if any, to shareholders. Therefore, no federal income or excise tax provision is required. The Fund files income tax returns in U.S. federal and applicable state jurisdictions. The statute of limitations on the Fund’s tax return filings generally remains open for the three preceding fiscal reporting period ends. The Fund has analyzed its tax positions for the fiscal year ended October 31, 2017, including open tax years, and does not believe there are any uncertain tax positions requiring recognition in the Fund’s financial statements.
The tax components of capital shown in the following table represent distribution requirements the Fund must satisfy under the income tax regulations, losses the Fund may be able to offset against income and gains realized in future years and unrealized appreciation or depreciation of securities and other investments for federal income tax purposes.
27 OPPENHEIMER MID CAP VALUE FUND
NOTES TO FINANCIAL STATEMENTS Continued
2. Significant Accounting Policies (Continued)
| | | | | | | | | | | | |
Undistributed Net Investment Income | | Undistributed
Long-Term
Gain | | | Accumulated
Loss
Carryforward1,2 | | | Net Unrealized
Appreciation
Based on cost of
Securities and
Other Investments
for Federal Income
Tax Purposes | |
| |
$— | | | $82,365,632 | | | | $— | | | | $276,208,119 | |
1. During the reporting period, the Fund utilized $64,627,129 of capital loss carryforward to offset capital gains realized in that fiscal year.
2. During the previous reporting period, the Fund utilized $15,695,567 of capital loss carryforward to offset capital gains realized in that fiscal year.
Net investment income (loss) and net realized gain (loss) may differ for financial statement and tax purposes. The character of dividends and distributions made during the fiscal year from net investment income or net realized gains are determined in accordance with federal income tax requirements, which may differ from the character of net investment income or net realized gains presented in those financial statements in accordance with U.S. GAAP. Also, due to timing of dividends and distributions, the fiscal year in which amounts are distributed may differ from the fiscal year in which the income or net realized gain was recorded by the Fund. Accordingly, the following amounts have been reclassified for the reporting period. Net assets of the Fund were unaffected by the reclassifications.
| | | | | | | | |
Increase to Paid-in Capital | | Reduction
to Accumulated
Net Investment
Loss | | | Reduction
to Accumulated Net
Realized Gain
on Investments3 | |
| |
$10,014,712 | | | $1,152,486 | | | | $11,167,198 | |
3. $10,014,712, all of which was long-term capital gain, was distributed in connection with Fund share redemptions.
The tax character of distributions paid during the reporting periods:
| | | | | | | | |
| | | Year Ended
October 31, 2017 | | | Year Ended
October 31, 2016 | |
| |
Distributions paid from: | | | | | | | | |
Ordinary income | | $ | 4,444,010 | | | $ | 5,141,163 | |
Long-term capital gain | | | 317,804 | | | | — | |
| | | | |
Total | | $ | 4,761,814 | | | $ | 5,141,163 | |
| | | | |
The aggregate cost of securities and other investments and the composition of unrealized appreciation and depreciation of securities and other investments for federal income tax purposes at period end are noted in the following table. The primary difference between book and tax appreciation or depreciation of securities and other investments, if applicable, is attributable to the tax deferral of losses or tax realization of financial statement unrealized gain or loss.
28 OPPENHEIMER MID CAP VALUE FUND
2. Significant Accounting Policies (Continued)
| | | | |
Federal tax cost of securities | | $ | 1,062,382,059 | |
| | | | |
Gross unrealized appreciation | | $ | 294,501,193 | |
Gross unrealized depreciation | | | (18,293,074) | |
| | | | |
Net unrealized appreciation | | $ | 276,208,119 | |
| | | | |
Use of Estimates. The preparation of financial statements in conformity with U.S. GAAP requires management to make estimates and assumptions that affect the reported amounts of assets and liabilities and disclosure of contingent assets and liabilities at the date of the financial statements and the reported amounts of increases and decreases in net assets from operations during the reporting period. Actual results could differ from those estimates.
3. Securities Valuation
The Fund calculates the net asset value of its shares as of 4:00 P.M. Eastern time, on each day the New York Stock Exchange (the “Exchange”) is open for trading, except in the case of a scheduled early closing of the Exchange, in which case the Fund will calculate net asset value of the shares as of the scheduled early closing time of the Exchange.
The Fund’s Board has adopted procedures for the valuation of the Fund’s securities and has delegated the day-to-day responsibility for valuation determinations under those procedures to the Manager. The Manager has established a Valuation Committee which is responsible for determining a fair valuation for any security for which market quotations are not readily available. The Valuation Committee’s fair valuation determinations are subject to review, approval and ratification by the Fund’s Board at least quarterly or more frequently, if necessary.
Valuation Methods and Inputs
Securities are valued primarily using unadjusted quoted market prices, when available, as supplied by third party pricing services or broker-dealers.
The following methodologies are used to determine the market value or the fair value of the types of securities described below:
Equity securities traded on a securities exchange (including exchange-traded derivatives other than futures and futures options) are valued based on the official closing price on the principal exchange on which the security is traded, as identified by the Manager, prior to the time when the Fund’s assets are valued. If the official closing price is unavailable, the security is valued at the last sale price on the principal exchange on which it is traded, or if no sales occurred, the security is valued at the mean between the quoted bid and asked prices. Over-the-counter equity securities are valued at the last published sale price, or if no sales occurred, at the mean between the quoted bid and asked prices. Events occurring after the close of trading on foreign exchanges may result in adjustments to the valuation of foreign securities to more accurately reflect their fair value as of the time when the Fund’s assets are valued.
Shares of a registered investment company that are not traded on an exchange are valued at that investment company’s net asset value per share.
29 OPPENHEIMER MID CAP VALUE FUND
NOTES TO FINANCIAL STATEMENTS Continued
3. Securities Valuation (Continued)
Securities for which market quotations are not readily available or a significant event has occurred that would materially affect the value of the security, the security is fair valued either (i) by a standardized fair valuation methodology applicable to the security type or the significant event as previously approved by the Valuation Committee and the Fund’s Board or (ii) as determined in good faith by the Manager’s Valuation Committee. The Valuation Committee considers all relevant facts that are reasonably available, through either public information or information available to the Manager, when determining the fair value of a security. Those standardized fair valuation methodologies include, but are not limited to, valuing securities at the last sale price or initially at cost and subsequently adjusting the value based on: changes in company specific fundamentals, changes in an appropriate securities index, or changes in the value of similar securities which may be further adjusted for any discounts related to security-specific resale restrictions. When possible, such methodologies use observable market inputs such as unadjusted quoted prices of similar securities, observable interest rates, currency rates and yield curves. The methodologies used for valuing securities are not necessarily an indication of the risks associated with investing in those securities nor can it be assured that the Fund can obtain the fair value assigned to a security if it were to sell the security.
Classifications
Each investment asset or liability of the Fund is assigned a level at measurement date based on the significance and source of the inputs to its valuation. Various data inputs may be used in determining the value of each of the Fund’s investments as of the reporting period end. These data inputs are categorized in the following hierarchy under applicable financial accounting standards:
1) Level 1-unadjusted quoted prices in active markets for identical assets or liabilities (including securities actively traded on a securities exchange)
2) Level 2-inputs other than unadjusted quoted prices that are observable for the asset or liability (such as unadjusted quoted prices for similar assets and market corroborated inputs such as interest rates, prepayment speeds, credit risks, etc.)
3) Level 3-significant unobservable inputs (including the Manager’s own judgments about assumptions that market participants would use in pricing the asset or liability).
The inputs used for valuing securities are not necessarily an indication of the risks associated with investing in those securities.
The Fund classifies each of its investments in investment companies which are publicly offered as Level 1. Investment companies that are not publicly offered, if any, are classified as Level 2 in the fair value hierarchy.
The table below categorizes amounts that are included in the Fund’s Statement of Assets and Liabilities at period end based on valuation input level:
30 OPPENHEIMER MID CAP VALUE FUND
3. Securities Valuation (Continued)
| | | | | | | | | | | | | | | | |
| | | Level 1—
Unadjusted
Quoted Prices | | | Level 2—
Other Significant
Observable Inputs | | | Level 3—
Significant
Unobservable
Inputs | | | Value | |
| |
Assets Table | | | | | | | | | | | | | | | | |
Investments, at Value: | | | | | | | | | | | | | | | | |
Common Stocks | | | | | | | | | | | | | | | | |
Consumer Discretionary | | $ | 131,443,197 | | | $ | — | | | $ | — | | | $ | 131,443,197 | |
Consumer Staples | | | 51,469,069 | | | | — | | | | — | | | | 51,469,069 | |
Energy | | | 90,250,194 | | | | — | | | | — | | | | 90,250,194 | |
Financials | | | 401,584,294 | | | | — | | | | — | | | | 401,584,294 | |
Health Care | | | 95,529,817 | | | | — | | | | — | | | | 95,529,817 | |
Industrials | | | 206,678,789 | | | | — | | | | — | | | | 206,678,789 | |
Information Technology | | | 186,185,215 | | | | — | | | | — | | | | 186,185,215 | |
Materials | | | 78,724,028 | | | | — | | | | — | | | | 78,724,028 | |
Utilities | | | 96,525,990 | | | | — | | | | — | | | | 96,525,990 | |
Investment Company | | | 199,690 | | | | — | | | | — | | | | 199,690 | |
| | | | |
Total Assets | | $ | 1,338,590,283 | | | $ | — | | | $ | — | | | $ | 1,338,590,283 | |
| | | | |
Forward currency exchange contracts and futures contracts, if any, are reported at their unrealized appreciation/depreciation at measurement date, which represents the change in the contract’s value from trade date. All additional assets and liabilities included in the above table are reported at their market value at measurement date.
4. Investments and Risks
Investments in Affiliated Funds. The Fund is permitted to invest in other mutual funds advised by the Manager (“Affiliated Funds”). Affiliated Funds are open-end management investment companies registered under the 1940 Act, as amended. The Manager is the investment adviser of, and the Sub-Adviser provides investment and related advisory services to, the Affiliated Funds. When applicable, the Fund’s investments in Affiliated Funds are included in the Statement of Investments. Shares of Affiliated Funds are valued at their net asset value per share. As a shareholder, the Fund is subject to its proportional share of the Affiliated Funds’ expenses, including their management fee. The Manager will waive fees and/ or reimburse Fund expenses in an amount equal to the indirect management fees incurred through the Fund’s investment in the Affiliated Funds.
Each of the Affiliated Funds in which the Fund invests has its own investment risks, and those risks can affect the value of the Fund’s investments and therefore the value of the Fund’s shares. To the extent that the Fund invests more of its assets in one Affiliated Fund than in another, the Fund will have greater exposure to the risks of that Affiliated Fund.
Investments in Money Market Instruments. The Fund is permitted to invest its free cash balances in money market instruments to provide liquidity or for defensive purposes. The Fund may invest in money market instruments by investing in Class E shares of Oppenheimer Institutional Government Money Market Fund (“IGMMF”), which is an Affiliated Fund. IGMMF is regulated as a money market fund under the 1940 Act, as amended. The Fund may also
31 OPPENHEIMER MID CAP VALUE FUND
NOTES TO FINANCIAL STATEMENTS Continued
4. Investments and Risks (Continued)
invest in money market instruments directly or in other affiliated or unaffiliated money market funds.
Master Limited Partnerships (“MLPs”). MLPs issue common units that represent an equity ownership interest in a partnership and provide limited voting rights. MLP common units are registered with the Securities and Exchange Commission (“SEC”), and are freely tradable on securities exchanges such as the NYSE and the NASDAQ Stock Market (“NASDAQ”), or in the over-the-counter (“OTC”) market. An MLP consists of one or more general partners, who conduct the business, and one or more limited partners, who contribute capital. MLP common unit holders have a limited role in the partnership’s operations and management. The Fund, as a limited partner, normally would not be liable for the debts of the MLP beyond the amounts the Fund has contributed, but would not be shielded to the same extent that a shareholder of a corporation would be. In certain circumstances creditors of an MLP would have the right to seek return of capital distributed to a limited partner. This right of an MLP’s creditors would continue after the Fund sold its investment in the MLP.
Equity Security Risk. Stocks and other equity securities fluctuate in price. The value of the Fund’s portfolio may be affected by changes in the equity markets generally. Equity markets may experience significant short-term volatility and may fall sharply at times. Different markets may behave differently from each other and U.S. equity markets may move in the opposite direction from one or more foreign stock markets. Adverse events in any part of the equity or fixed-income markets may have unexpected negative effects on other market segments.
The prices of individual equity securities generally do not all move in the same direction at the same time and a variety of factors can affect the price of a particular company’s securities. These factors may include, but are not limited to, poor earnings reports, a loss of customers, litigation against the company, general unfavorable performance of the company’s sector or industry, or changes in government regulations affecting the company or its industry.
5. Market Risk Factors
The Fund’s investments in securities and/or financial derivatives may expose the Fund to various market risk factors:
Commodity Risk. Commodity risk relates to the change in value of commodities or commodity indexes as they relate to increases or decreases in the commodities market. Commodities are physical assets that have tangible properties. Examples of these types of assets are crude oil, heating oil, metals, livestock, and agricultural products.
Credit Risk. Credit risk relates to the ability of the issuer of debt to meet interest and principal payments, or both, as they come due. In general, lower-grade, higher-yield debt securities are subject to credit risk to a greater extent than lower-yield, higher-quality securities.
Equity Risk. Equity risk relates to the change in value of equity securities as they relate to increases or decreases in the general market.
32 OPPENHEIMER MID CAP VALUE FUND
5. Market Risk Factors (Continued)
Foreign Exchange Rate Risk. Foreign exchange rate risk relates to the change in the U.S. dollar value of a security held that is denominated in a foreign currency. The U.S. dollar value of a foreign currency denominated security will decrease as the dollar appreciates against the currency, while the U.S. dollar value will increase as the dollar depreciates against the currency.
Interest Rate Risk. Interest rate risk refers to the fluctuations in value of fixed-income securities resulting from the inverse relationship between price and yield. For example, an increase in general interest rates will tend to reduce the market value of already issued fixed-income investments, and a decline in general interest rates will tend to increase their value. In addition, debt securities with longer maturities, which tend to have higher yields, are subject to potentially greater fluctuations in value from changes in interest rates than obligations with shorter maturities.
Volatility Risk. Volatility risk refers to the magnitude of the movement, but not the direction of the movement, in a financial instrument’s price over a defined time period. Large increases or decreases in a financial instrument’s price over a relative time period typically indicate greater volatility risk, while small increases or decreases in its price typically indicate lower volatility risk.
6. Shares of Beneficial Interest
The Fund has authorized an unlimited number of $0.01 par value shares of beneficial interest of each class. Transactions in shares of beneficial interest were as follows:
| | | | | | | | | | | | | | | | |
| | | Year Ended October 31, 2017 | | | Year Ended October 31, 2016 | |
| | | Shares | | | Amount | | | Shares | | | Amount | |
| |
Class A | | | | | | | | | | | | | | | | |
Sold | | | 2,085,580 | | | $ | 114,516,764 | | | | 1,851,803 | | | $ | 86,644,637 | |
| Dividends and/or distributions reinvested | | | 68,093 | | | | 3,780,709 | | | | 89,358 | | | | 4,213,612 | |
Redeemed | | | (4,452,720) | | | | (247,507,156) | | | | (4,088,581) | | | | (189,386,460) | |
| | | | |
Net decrease | | | (2,299,047) | | | $ | (129,209,683) | | | | (2,147,420) | | | $ | (98,528,211) | |
| | | | |
|
| |
Class B | | | | | | | | | | | | | | | | |
Sold | | | 14,889 | | | $ | 672,298 | | | | 10,608 | | | $ | 420,083 | |
| Dividends and/or distributions reinvested | | | — | | | | — | | | | 66 | | | | 2,602 | |
Redeemed | | | (199,037) | | | | (9,170,678) | | | | (268,433) | | | | (10,446,750) | |
| | | | |
Net decrease | | | (184,148) | | | $ | (8,498,380) | | | | (257,759) | | | $ | (10,024,065) | |
| | | | |
|
| |
Class C | | | | | | | | | | | | | | | | |
Sold | | | 601,510 | | | $ | 27,693,457 | | | | 474,878 | | | $ | 18,404,532 | |
| Dividends and/or distributions reinvested | | | 1,034 | | | | 47,577 | | | | 2,043 | | | | 81,782 | |
Redeemed | | | (1,611,515) | | | | (74,748,492) | | | | (1,487,283) | | | | (57,714,430) | |
| | | | |
Net decrease | | | (1,008,971) | | | $ | (47,007,458) | | | | (1,010,362) | | | $ | (39,228,116) | |
| | | | |
33 OPPENHEIMER MID CAP VALUE FUND
NOTES TO FINANCIAL STATEMENTS Continued
6. Shares of Beneficial Interest (Continued)
| | | | | | | | | | | | | | | | |
| | | Year Ended October 31, 2017 | | | Year Ended October 31, 2016 | |
| | | Shares | | | Amount | | | Shares | | | Amount | |
| |
Class I | | | | | | | | | | | | | | | | |
Sold | | | 33,192 | | | $ | 1,907,541 | | | | 4,994 | | | $ | 239,851 | |
Dividends and/or distributions reinvested | | | 183 | | | | 10,366 | | | | 148 | | | | 7,088 | |
Redeemed | | | (10,287) | | | | (567,045) | | | | (2,869) | | | | (134,766) | |
| | | | |
Net increase | | | 23,088 | | | $ | 1,350,862 | | | | 2,273 | | | $ | 112,173 | |
| | | | |
|
| |
Class R | | | | | | | | | | | | | | | | |
Sold | | | 287,317 | | | $ | 15,267,863 | | | | 291,716 | | | $ | 12,963,141 | |
Dividends and/or distributions reinvested | | | 2,722 | | | | 144,816 | | | | 4,454 | | | | 203,088 | |
Redeemed | | | (600,102) | | | | (31,972,425) | | | | (746,286) | | | | (33,583,731) | |
| | | | |
Net decrease | | | (310,063) | | | $ | (16,559,746) | | | | (450,116) | | | $ | (20,417,502) | |
| | | | |
|
| |
Class Y | | | | | | | | | | | | | | | | |
Sold | | | 1,436,742 | | | $ | 82,380,165 | | | | 549,994 | | | $ | 27,281,166 | |
Dividends and/or distributions reinvested | | | 8,647 | | | | 493,970 | | | | 6,580 | | | | 318,941 | |
Redeemed | | | (869,522) | | | | (49,782,996) | | | | (364,634) | | | | (17,430,537) | |
| | | | |
Net increase | | | 575,867 | | | $ | 33,091,139 | | | | 191,940 | | | $ | 10,169,570 | |
| | | | |
7. Purchases and Sales of Securities
The aggregate cost of purchases and proceeds from sales of securities, other than short-term obligations and investments in IGMMF, for the reporting period were as follows:
| | | | | | | | |
| | | Purchases | | | Sales | |
| |
Investment securities | | $ | 857,121,556 | | | $ | 1,046,635,207 | |
8. Fees and Other Transactions with Affiliates
Management Fees. Under the investment advisory agreement, the Fund pays the Manager a management fee based on the daily net assets of the Fund at an annual rate as shown in the following table:
| | |
| Fee Schedule | | |
|
Up to $400 million | | 0.80% |
Next $400 million | | 0.75 |
Next $1.2 billion | | 0.60 |
Next $4 billion | | 0.58 |
Over $6 billion | | 0.56 |
The Fund’s effective management fee for the reporting period was 0.70% of average annual net assets before any applicable waivers.
Sub-Adviser Fees. The Manager has retained the Sub-Adviser to provide the day-to-day portfolio management of the Fund. Under the Sub-Advisory Agreement, the Manager pays the Sub-Adviser an annual fee in monthly installments, equal to a percentage of the investment management fee collected by the Manager from the Fund, which shall be calculated after any
34 OPPENHEIMER MID CAP VALUE FUND
8. Fees and Other Transactions with Affiliates (Continued)
investment management fee waivers. The fee paid to the Sub-Adviser is paid by the Manager, not by the Fund.
Transfer Agent Fees. OFI Global (the “Transfer Agent”) serves as the transfer and shareholder servicing agent for the Fund. The Fund pays the Transfer Agent a fee based on annual net assets, which shall be calculated after any applicable fee waivers. Fees incurred and average net assets for each class with respect to these services are detailed in the Statement of Operations and Financial Highlights, respectively.
Sub-Transfer Agent Fees. The Transfer Agent has retained Shareholder Services, Inc., a wholly-owned subsidiary of OFI (the “Sub-Transfer Agent”), to provide the day-to-day transfer agent and shareholder servicing of the Fund. Under the Sub-Transfer Agency Agreement, the Transfer Agent pays the Sub-Transfer Agent an annual fee in monthly installments, equal to a percentage of the transfer agent fee collected by the Transfer Agent from the Fund, which shall be calculated after any applicable fee waivers. The fee paid to the Sub-Transfer Agent is paid by the Transfer Agent, not by the Fund.
Trustees’ Compensation. The Fund has adopted an unfunded retirement plan (the “Plan”) for the Fund’s Independent Trustees. Benefits are based on years of service and fees paid to each Trustee during their period of service. The Plan was frozen with respect to adding new participants effective December 31, 2006 (the “Freeze Date”) and existing Plan Participants as of the Freeze Date will continue to receive accrued benefits under the Plan. Active Independent Trustees as of the Freeze Date have each elected a distribution method with respect to their benefits under the Plan. During the reporting period, the Fund’s projected benefit obligations, payments to retired Trustees and accumulated liability were as follows:
| | | | |
Projected Benefit Obligations Increased | | $ | — | |
Payments Made to Retired Trustees | | | 56,098 | |
Accumulated Liability as of October 31, 2017 | | | 192,585 | |
The Fund’s Board of Trustees (“Board”) has adopted a compensation deferral plan for Independent Trustees that enables Trustees to elect to defer receipt of all or a portion of the annual compensation they are entitled to receive from the Fund. For purposes of determining the amount owed to the Trustee under the plan, deferred amounts are treated as though equal dollar amounts had been invested in shares of the Fund or in other Oppenheimer funds selected by the Trustee. The Fund purchases shares of the funds selected for deferral by the Trustee in amounts equal to his or her deemed investment, resulting in a Fund asset equal to the deferred compensation liability. Such assets are included as a component of “Other” within the asset section of the Statement of Assets and Liabilities. Deferral of Trustees’ fees under the plan will not affect the net assets of the Fund and will not materially affect the Fund’s assets, liabilities or net investment income per share. Amounts will be deferred until distributed in accordance with the compensation deferral plan.
35 OPPENHEIMER MID CAP VALUE FUND
NOTES TO FINANCIAL STATEMENTS Continued
8. Fees and Other Transactions with Affiliates (Continued)
Distribution and Service Plan (12b-1) Fees. Under its General Distributor’s Agreement with the Fund, OppenheimerFunds Distributor, Inc. (the “Distributor”) acts as the Fund’s principal underwriter in the continuous public offering of the Fund’s classes of shares.
Distribution and Service Plan for Class A Shares. The Fund has adopted a Distribution and Service Plan (the “Plan”) for Class A shares pursuant to Rule 12b-1 under the 1940 Act. Under the Plan, the Fund pays a service fee to the Distributor at an annual rate of 0.25% of the daily net assets of Class A shares. The Distributor currently uses all of those fees to pay dealers, brokers, banks and other financial institutions periodically for providing personal services and maintenance of accounts of their customers that hold Class A shares. Under the Plan, the Fund may also pay an asset-based sales charge to the Distributor. However, the Fund’s Board has currently set the rate at zero. Fees incurred by the Fund under the Plan are detailed in the Statement of Operations.
Distribution and Service Plans for Class B, Class C and Class R Shares. The Fund has adopted Distribution and Service Plans (the “Plans”) for Class B, Class C and Class R shares pursuant to Rule 12b-1 under the 1940 Act to compensate the Distributor for distributing those share classes, maintaining accounts and providing shareholder services. Under the Plans, the Fund pays the Distributor an annual asset-based sales charge of 0.75% on Class B and Class C shares’ daily net assets and 0.25% on Class R shares’ daily net assets. The Fund also pays a service fee under the Plans at an annual rate of 0.25% of daily net assets. The Plans continue in effect from year to year only if the Fund’s Board of Trustees votes annually to approve their continuance at an in person meeting called for that purpose. Fees incurred by the Fund under the Plans are detailed in the Statement of Operations.
Sales Charges. Front-end sales charges and CDSC do not represent expenses of the Fund. They are deducted from the proceeds of sales of Fund shares prior to investment or from redemption proceeds prior to remittance, as applicable. The sales charges retained by the Distributor from the sale of shares and the CDSC retained by the Distributor on the redemption of shares is shown in the following table for the period indicated.
| | | | | | | | | | | | | | | | | | | | |
| Year Ended | | Class A
Front-End
Sales Charges
Retained by
Distributor | | | Class A
Contingent
Deferred
Sales Charges
Retained by
Distributor | | | Class B
Contingent
Deferred
Sales Charges
Retained by
Distributor | | | Class C
Contingent
Deferred
Sales Charges
Retained by
Distributor | | | Class R
Contingent
Deferred
Sales Charges
Retained by
Distributor | |
October 31, 2017 | | | $225,337 | | | | $419 | | | | $5,568 | | | | $9,822 | | | | $— | |
Waivers and Reimbursements of Expenses. Effective January 1, 2017, the Transfer Agent has voluntarily agreed to waive fees and/or reimburse Fund expenses in an amount equal to 0.015% of average annual net assets for Classes A, B, C, R and Y.
During the reporting period, the Transfer Agent waived fees and/or reimbursed the Fund for
36 OPPENHEIMER MID CAP VALUE FUND
8. Fees and Other Transactions with Affiliates (Continued) transfer agent and shareholder servicing agent fees as follows:
| | | | | | | | | | |
| | | | Class A | | $ | 123,145 | | | |
| | | | Class B | | | 925 | | | |
| | | | Class C | | | 29,040 | | | |
| | | | Class R | | | 10,451 | | | |
| | | | Class Y | | | 12,065 | | | |
This fee waiver and/or reimbursement may be terminated at any time.
The Manager will waive fees and/or reimburse Fund expenses in an amount equal to the indirect management fees incurred through the Fund’s investment in IGMMF. During the reporting period, the Manager waived fees and/or reimbursed the Fund $20,924 for IGMMF management fees. This fee waiver and/or expense reimbursement may not be amended or withdrawn for one year from the date of the Fund’s prospectus, unless approved by the Board.
9. Borrowings and Other Financing
Joint Credit Facility. A number of mutual funds managed by the Manager participate in a $1.875 billion revolving credit facility (the “Facility”) intended to provide short-term financing, if necessary, subject to certain restrictions in connection with atypical redemption activity. Expenses and fees related to the Facility are paid by the participating funds and are disclosed separately or as other expenses on the Statement of Operations. The Fund did not utilize the Facility during the reporting period.
37 OPPENHEIMER MID CAP VALUE FUND
REPORT OF INDEPENDENT REGISTERED PUBLIC ACCOUNTING FIRM
The Board of Trustees and Shareholders of Oppenheimer Quest For Value Funds:
We have audited the accompanying statement of assets and liabilities of Oppenheimer Mid Cap Value Fund (the Fund), a series of Oppenheimer Quest For Value Funds, including the statement of investments, as of October 31, 2017, and the related statement of operations for the year then ended, the statements of changes in net assets for each of the years in the two-year period then ended, and the financial highlights for each of the years in the five-year period then ended. These financial statements and financial highlights are the responsibility of the Fund’s management. Our responsibility is to express an opinion on these financial statements and financial highlights based on our audits.
We conducted our audits in accordance with the standards of the Public Company Accounting Oversight Board (United States). Those standards require that we plan and perform the audit to obtain reasonable assurance about whether the financial statements and financial highlights are free of material misstatement. An audit includes examining, on a test basis, evidence supporting the amounts and disclosures in the financial statements. Our procedures included confirmation of securities owned as of October 31, 2017, by correspondence with the custodian, transfer agent and brokers, or by other appropriate auditing procedures where replies from brokers were not received. An audit also includes assessing the accounting principles used and significant estimates made by management, as well as evaluating the overall financial statement presentation. We believe that our audits provide a reasonable basis for our opinion.
In our opinion, the financial statements and financial highlights referred to above present fairly, in all material respects, the financial position of Oppenheimer Mid Cap Value Fund as of October 31, 2017, the results of its operations for the year then ended, the changes in its net assets for each of the years in the two-year period then ended, and the financial highlights for each of the years in the five-year period then ended, in conformity with U.S. generally accepted accounting principles.
KPMGLLP
Denver, Colorado
December 21, 2017
38 OPPENHEIMER MID CAP VALUE FUND
FEDERAL INCOME TAX INFORMATION Unaudited
In early 2017, if applicable, shareholders of record received information regarding all dividends and distributions paid to them by the Fund during calendar year 2016.
Dividends, if any, paid by the Fund during the reporting period which are not designated as capital gain distributions should be multiplied by the maximum amount allowable but not less than 100% to arrive at the amount eligible for the corporate dividend-received deduction.
A portion, if any, of the dividends paid by the Fund during the reporting period which are not designated as capital gain distributions are eligible for lower individual income tax rates to the extent that the Fund has received qualified dividend income as stipulated by recent tax legislation. The maximum amount allowable but not less than $17,698,319 of the Fund’s fiscal year taxable income may be eligible for the lower individual income tax rates. In early 2017, shareholders of record received information regarding the percentage of distributions that are eligible for lower individual income tax rates.
Recent tax legislation allows a regulated investment company to designate distributions not designated as capital gain distributions, as either interest related dividends or short-term capital gain dividends, both of which are exempt from the U.S. withholding tax applicable to non U.S. taxpayers. For the reporting period, the maximum amount allowable but not less than $47,579 of the ordinary distributions to be paid by the Fund qualifies as an interest related dividend.
The foregoing information is presented to assist shareholders in reporting distributions received from the Fund to the Internal Revenue Service. Because of the complexity of the federal regulations which may affect your individual tax return and the many variations in state and local tax regulations, we recommend that you consult your tax advisor for specific guidance.
39 OPPENHEIMER MID CAP VALUE FUND
BOARD APPROVAL OF THE FUND’S INVESTMENT ADVISORY
AND SUB-ADVISORY AGREEMENTS Unaudited
The Fund has entered into an investment advisory agreement with OFI Global Asset Management, Inc. (“OFI Global” or the “Adviser”), a wholly-owned subsidiary of OppenheimerFunds, Inc. (“OFI” or the “Sub-Adviser”) (“OFI Global” and “OFI” together the “Managers”) and OFI Global has entered into a sub-advisory agreement with OFI whereby OFI provides investment sub-advisory services to the Fund (collectively, the “Agreements”). Each year, the Board of Trustees (the “Board”), including a majority of the independent Trustees, is required to determine whether to approve the terms of the Agreements and the renewal thereof. The Investment Company Act of 1940, as amended, requires that the Board request and evaluate, and that the Managers provide, such information as may be reasonably necessary to evaluate the terms of the Agreements. The Board employs an independent consultant to prepare a report that provides information, including comparative information that the Board requests for that purpose. In addition to in-person meetings focused on this evaluation, the Board receives information throughout the year regarding Fund services, fees, expenses and performance.
The Managers and the independent consultant provided information to the Board on the following factors: (i) the nature, quality and extent of the Managers’ services, (ii) the comparative investment performance of the Fund and the Managers, (iii) the fees and expenses of the Fund, including comparative fee and expense information, (iv) the profitability of the Managers and their affiliates, including an analysis of the cost of providing services, (v) whether economies of scale are realized as the Fund grows and whether fee levels reflect these economies of scale for Fund investors and (vi) other benefits to the Managers from their relationship with the Fund. The Board was aware that there are alternatives to retaining the Managers.
Outlined below is a summary of the principal information considered by the Board as well as the Board’s conclusions.
Nature, Quality and Extent of Services. The Board considered information about the nature, quality and extent of the services provided to the Fund and information regarding the Managers’ key personnel who provide such services. The Managers’ duties include providing the Fund with the services of the portfolio managers and the Sub-Adviser’s investment team, who provide research, analysis and other advisory services in regard to the Fund’s investments; and securities trading services. OFI Global is responsible for oversight of third-party service providers; monitoring compliance with applicable Fund policies and procedures and adherence to the Fund’s investment restrictions; risk management; and oversight of the Sub-Adviser. OFI Global is also responsible for providing certain administrative services to the Fund. Those services include providing and supervising all administrative and clerical personnel who are necessary in order to provide effective corporate administration for the Fund; compiling and maintaining records with respect to the Fund’s operations; preparing and filing reports required by the U.S. Securities and Exchange Commission; preparing periodic reports regarding the operations of the Fund for its shareholders; preparing proxy materials for shareholder meetings; and preparing the registration statements required by federal and state securities laws for the sale of the Fund’s shares. OFI Global also provides the Fund with office space, facilities and equipment.
40 OPPENHEIMER MID CAP VALUE FUND
The Board also considered the quality of the services provided and the quality of the Managers’ resources that are available to the Fund. The Board took account of the fact that the Sub-Adviser has over fifty years of experience as an investment adviser and that its assets under management rank it among the top mutual fund managers in the United States. The Board evaluated the Managers’ advisory, administrative, accounting, legal, compliance and risk management services, among other services, and information the Board has received regarding the experience and professional qualifications of the Managers’ key personnel and the size and functions of its staff. In its evaluation of the quality of the portfolio management services provided, the Board considered the experience of Laton Spahr and Eric Hewitt, the portfolio managers for the Fund, and the Sub-Adviser’s investment team and analysts. The Board members also considered the totality of their experiences with the Managers as directors or trustees of the Fund and other funds advised by the Managers. The Board considered information regarding the quality of services provided by affiliates of the Managers, which the Board members have become knowledgeable about through their experiences with the Managers and in connection with the review or renewal of the Fund’s service agreements or service providers. The Board concluded, in light of the Managers’ experience, reputation, personnel, operations and resources that the Fund benefits from the services provided under the Agreements.
Investment Performance of the Managers and the Fund. Throughout the year, the Managers provided information on the investment performance of the Fund, the Adviser and the Sub-Adviser, including comparative performance information. The Board also reviewed information, prepared by the Managers and by the independent consultant, comparing the Fund’s historical performance to relevant benchmarks or market indices and to the performance of other retail funds in the mid-cap value category. The Board noted that the Fund’s one-year and three-year performance was better than its category median although its five-year and ten-year performance was below its category median.
Fees and Expenses of the Fund. The Board reviewed the fees paid to the Adviser and the other expenses borne by the Fund. The independent consultant provided comparative data in regard to the fees and expenses of the Fund and other retail front-end load mid-cap value funds with comparable asset levels and distribution features. The Board noted that the Fund’s contractual management fee and total expenses were higher than its peer group median and lower than its category median.
Economies of Scale and Profits Realized by the Managers. The Board considered information regarding the Managers’ costs in serving as the Fund’s investment adviser and sub-adviser, including the costs associated with the personnel and systems necessary to manage the Fund, and information regarding the Managers’ profitability from their relationship with the Fund. The Board also considered that the Managers must be able to pay and retain experienced professional personnel at competitive rates to provide quality services to the Fund. The Board reviewed whether the Managers may realize economies of scale in managing and supporting the Fund. The Board noted that the Fund currently has management fee breakpoints, which are intended to share with Fund shareholders economies of scale that may exist as the Fund’s assets grow.
41 OPPENHEIMER MID CAP VALUE FUND
BOARD APPROVAL OF THE FUND’S INVESTMENT ADVISORY
AND SUB-ADVISORY AGREEMENTS Unaudited / Continued
Other Benefits to the Managers. In addition to considering the profits realized by the Managers, the Board considered information that was provided regarding the direct and indirect benefits the Managers receive as a result of their relationship with the Fund, including compensation paid to the Managers’ affiliates and research provided to the Adviser in connection with permissible brokerage arrangements (soft dollar arrangements).
Conclusions. These factors were also considered by the independent Trustees meeting separately from the full Board, assisted by experienced counsel to the Fund and to the independent Trustees. Fund counsel and the independent Trustees’ counsel are independent of the Managers within the meaning and intent of the Securities and Exchange Commission Rules.
Based on its review of the information it received and its evaluations described above, the
Board, including a majority of the independent Trustees, decided to continue the Agreements through September 30, 2018. In arriving at its decision, the Board did not identify any factor or factors as being more important than others, but considered all of the above information, and considered the terms and conditions of the Agreements, including the management fees, in light of all the surrounding circumstances.
42 OPPENHEIMER MID CAP VALUE FUND
PORTFOLIO PROXY VOTING POLICIES AND GUIDELINES;
UPDATES TO STATEMENTS OF INVESTMENTS Unaudited
The Fund has adopted Portfolio Proxy Voting Policies and Guidelines under which the Fund votes proxies relating to securities (“portfolio proxies”) held by the Fund. A description of the Fund’s Portfolio Proxy Voting Policies and Guidelines is available (i) without charge, upon request, by calling the Fund toll-free at 1.800.CALL OPP (225.5677), (ii) on the Fund’s website at www.oppenheimerfunds.com, and (iii) on the SEC’s website at www.sec.gov. In addition, the Fund is required to file Form N-PX, with its complete proxy voting record for the 12 months ended June 30th, no later than August 31st of each year. The Fund’s voting record is available (i) without charge, upon request, by calling the Fund toll-free at 1.800.CALL OPP (225.5677), and (ii) in the Form N-PX filing on the SEC’s website at www.sec.gov.
The Fund files its complete schedule of portfolio holdings with the SEC for the first quarter and the third quarter of each fiscal year on Form N-Q. The Fund’s Form N-Q filings are available on the SEC’s website at www.sec.gov. Those forms may be reviewed and copied at the SEC’s Public Reference Room in Washington, D.C. Information on the operation of the Public Reference Room may be obtained by calling 1-800-SEC-0330.
Householding—Delivery of Shareholder Documents
This is to inform you about OppenheimerFunds’ “householding” policy. If more than one member of your household maintains an account in a particular fund, OppenheimerFunds will mail only one copy of the fund’s prospectus (or, if available, the fund’s summary prospectus), annual and semiannual report and privacy policy. The consolidation of these mailings, called householding, benefits your fund through reduced mailing expense, and benefits you by reducing the volume of mail you receive from OppenheimerFunds. Householding does not affect the delivery of your account statements.
Please note that we will continue to household these mailings for as long as you remain an OppenheimerFunds shareholder, unless you request otherwise. If you prefer to receive multiple copies of these materials, please call us at 1.800.CALL-OPP (225-5677). You may also notify us in writing or via email. We will begin sending you individual copies of the prospectus (or, if available, the summary prospectus), reports and privacy policy within 30 days of receiving your request to stop householding.
43 OPPENHEIMER MID CAP VALUE FUND
DISTRIBUTION SOURCES Unaudited
For any distribution that took place over the last six months of the Fund’s reporting period, the table below details on a per-share basis the percentage of the Fund’s total distribution payment amount that was derived from the following sources: net income, net profit from the sale of securities, and other capital sources. Other capital sources represent a return of capital. A return of capital may occur, for example, when some or all of the money that you invested in the Fund is paid back to you. A return of capital distribution does not necessarily reflect the Fund’s investment performance and should not be confused with “yield” or “income.” You should not draw any conclusions about each Fund’s investment performance from the amounts of these distributions. This information is based upon income and capital gains using generally accepted accounting principles as of the date of each distribution. For certain securities, such as Master Limited Partnerships (“MLPs”) and Real Estate Investment Trusts (“REITs”), the percentages attributed to each category (net income, net profit from sale and other capital sources) are estimated using historical information because the character of the amounts received from the MLPs and REITs in which the fund invests is unknown until after the end of the calendar year. Because the Fund is actively managed, the relative amount of the Fund’s total distributions derived from various sources over the calendar year may change. Please note that this information should not be used for tax reporting purposes as the tax character of distributable income may differ from the amounts used for this notification. You will receive IRS tax forms in the first quarter of each calendar year detailing the actual amount of the taxable and non-taxable portion of distributions paid to you during the tax year.
For the most current information, please go to oppenheimerfunds.com. Select your Fund, and scroll down to the ‘Dividends’ table under ‘Analytics’. The Fund’s latest distribution information will be followed by the sources of any distribution, updated daily.
| | | | | | | | | | | | | | | | |
| Fund Name | | Pay
Date | | | Net Income | | | Net Profit
from Sale | | | Other
Capital
Sources | |
| |
Oppenheimer Mid Cap Value Fund | | | 6/20/17 | | | | 59.5% | | | | 0.0% | | | | 40.5% | |
| |
Oppenheimer Mid Cap Value Fund | | | 9/19/17 | | | | 59.5% | | | | 0.0% | | | | 40.5% | |
| |
44 OPPENHEIMER MID CAP VALUE FUND
TRUSTEES AND OFFICERS Unaudited
| | |
Name, Position(s) Held with the
Fund, Length of Service, Year of
Birth | | Principal Occupation(s) During the Past 5 Years; Other Trusteeships/Directorships Held; Number of
Portfolios in the Fund Complex Currently Overseen |
| |
| INDEPENDENT TRUSTEES | | The address of each Trustee in the chart below is 6803 S. Tucson Way, Centennial, Colorado 80112-3924. Each Trustee serves for an indefinite term, or until his or her resignation, retirement, death or removal. |
| |
Brian F. Wruble, Chairman of the Board of Trustees (since 2009), Trustee (since 2001) Year of Birth: 1943 | | Governor of Community Foundation of the Florida Keys (non-profit) (since July 2012); Director of TCP Capital, Inc. (since November 2015); Chairman Emeritus of the Board of Trustees (since August 2011), Chairman of the Board of Trustees (August 2007-August 2011), Trustee of the Board of Trustees (since August 1991) of The Jackson Laboratory (non-profit); Member of Zurich Insurance Group’s Investment Management Advisory Council (insurance) (October 2004-February 2017); Treasurer (since 2007) and Trustee (since May 1992) of the Institute for Advanced Study (non-profit educational institute); Director of Special Value Opportunities Fund, LLC (registered investment company) (affiliate of the Sub- Adviser’s parent company) (September 2004-June 2015); General Partner of Odyssey Partners, L.P. (hedge fund) (September 1995-December 2007); Special Limited Partner of Odyssey Investment Partners, LLC (private equity investment) (January 1999-September 2004). Oversees 57 portfolios in the OppenheimerFunds complex. Mr. Wruble has served on the Boards of certain Oppenheimer funds since April 2001, during which time he has become familiar with the Fund’s (and other Oppenheimer funds’) financial, accounting, regulatory and investment matters and has contributed to the Boards’ deliberations. |
| |
Beth Ann Brown, Trustee (since 2016) Year of Birth: 1968 | | Advisor, Board of Advisors of Caron Engineering Inc. (since December 2014); Independent Consultant (since September 2012); held the following positions at Columbia Management Investment Advisers LLC: Head of Intermediary Distribution (2008-2012), Managing Director, Strategic Relations (2005-2008), Managing Director, Head of National Accounts (2004-2005); Senior Vice President, National Account Manager (2002-2004), Senior Vice President, Key Account Manager (1999-2002) and Vice President, Key Account Manager (1996-1999) of Liberty Funds Distributor, Inc.; President and Director, of Acton Shapleigh Youth Conservation Corps (non-profit) (since 2012); and Vice President and Director of Grahamtastic Connection (non-profit) (since May 2013). Oversees 57 portfolios in the OppenheimerFunds complex. Ms. Brown has served on the Boards of certain Oppenheimer funds since January 2016, during which time she has become familiar with the Fund’s (and other Oppenheimer funds’) financial, accounting, regulatory and investment matters and has contributed to the Board’s deliberations. |
| |
Edmund P. Giambastiani, Jr., Trustee (since 2013) Year of Birth: 1948 | | Advisory Board Member of the Maxwell School of Citizenship and Public Affairs of Syracuse University (since April 2012); Director of Mercury Defense Systems Inc. (information technology) (August 2011-February 2013); Trustee of the U.S. Naval Academy Foundation Athletic & Scholarship Program (since November 2010); Advisory Board Member of the Massachusetts Institute of Technology Lincoln Laboratory (federally-funded research development center) (since May 2010); Director of The Boeing Company (aerospace and defense) (since October 2009); Trustee of MITRE Corporation (federally-funded research development center) (since September 2008); Independent Director of QinetiQ Group Plc (defense technology and security) (February 2008-August 2011); Chairman of Monster Worldwide, Inc. (on-line career services) (March 2015-November 2016), Director of |
45 OPPENHEIMER MID CAP VALUE FUND
TRUSTEES AND OFFICERS Unaudited / Continued
| | |
| |
Edmund P. Giambastiani, Jr., Continued | | Monster Worldwide, Inc. (on-line career services) (February 2008-June 2011); Lead Director (June 2011-March 2015); Chairman of Alenia North America, Inc. (military and defense products) (January 2008-October 2009); Director of SRA International, Inc. (information technology and services) (January 2008-July 2011); President of Giambastiani Group LLC (national security and energy consulting) (since October 2007); United States Navy, career nuclear submarine officer (June 1970-October 2007), Vice Chairman of the Joint Chiefs of Staff (2005-October 2007), Supreme Allied Commander of NATO Commander Transformation (2003-2005), Commander, U.S. Joint Forces Command (2002-2005). Since his retirement from the U.S. Navy in October 2007, Admiral Giambastiani has also served on numerous U.S. Government advisory boards, investigations and task forces for the Secretaries of Defense, State and Interior and the Central Intelligence Agency. He recently completed serving as a federal commissioner on the Military Compensation and Retirement Modernization Commission. Oversees 57 portfolios in the OppenheimerFunds complex. Admiral Giambastiani has served on the Boards of certain Oppenheimer funds since February 2013, including as an Advisory Board Member for certain Oppenheimer funds, during which time he has become familiar with the Fund’s (and other Oppenheimer funds’) financial, accounting, regulatory and investment matters and has contributed to the Boards’ deliberations. For purposes of this report, Admiral Giambastiani is identified as a Trustee. |
| |
Elizabeth Krentzman, Trustee (since 2014) Year of Birth: 1959 | | Member of the University of Florida National Board Foundation (since September 2017); Member of the Cartica Funds Board of Directors (private investment funds) (since January 2017); Member of the University of Florida College of Law Association Board of Trustees and Audit Committee Member (since April 2016); Member of University of Florida Law Advisory Board, Washington, DC Alumni Group (since 2015); Advisory Board Member of the Securities and Exchange Commission Historical Society (since 2007); held the following positions at Deloitte & Touche LLP: Principal and Chief Regulatory Advisor for Asset Management Services (2007 - 2014) and U.S. Mutual Fund Leader (2011 - 2014); General Counsel of the Investment Company Institute (trade association) (June 2004 - April 2007); held the following positions at Deloitte & Touche LLP: National Director of the Investment Management Regulatory Consulting Practice (1997 - 2004), Principal (2003 - 2004), Director (1998 - 2003) and Senior Manager (1997 - 1998); Assistant Director of the Division of Investment Management – Office of Disclosure and Investment Adviser Regulation of the U.S. Securities and Exchange Commission (1996 - 1997) and various positions with the Division of Investment Management – Office of Regulatory Policy (1991 - 1996) of the U.S. Securities and Exchange Commission; Associate at Ropes & Gray LLP (1987 – 1991). Oversees 57 portfolios in the OppenheimerFunds complex. Ms. Krentzman has served on the Boards of certain Oppenheimer funds since August 2014, during which time she has become familiar with the Fund’s (and other Oppenheimer funds’) financial, accounting, regulatory and investment matters and has contributed to the Boards’ deliberations. |
| |
Mary F. Miller, Trustee (since 2009) Year of Birth: 1942 | | Trustee of International House (not-for-profit) (since June 2007); Trustee of the American Symphony Orchestra (not-for-profit) (October 1998-November 2011); and Senior Vice President and General Auditor of American Express Company (financial services company) (July 1998-February 2003). Oversees 57 portfolios in the OppenheimerFunds complex. Ms. Miller has served on the Boards of certain Oppenheimer funds since August 2004, during which time she has become familiar with the Fund’s (and other Oppenheimer funds’) financial, accounting, regulatory and investment matters and has contributed to the Boards’ deliberations. |
46 OPPENHEIMER MID CAP VALUE FUND
| | |
| |
Joel W. Motley, Trustee (since 2009) Year of Birth: 1952 | | Director of Office of Finance Federal Home Loan Bank (since September 2016); Director of Greenwall Foundation (since October 2013); Member of Board and Investment Committee of The Greenwall Foundation (since April 2013); Member of the Vestry of Trinity Wall Street (since April 2012); Director of Southern Africa Legal Services Foundation (since March 2012); Board Member of Pulitzer Center for Crisis Reporting (non-profit journalism) (since March 2011); Managing Director of Public Capital Advisors, LLC (privately-held financial advisor) (since January 2006); Managing Director of Carmona Motley, Inc. (privately-held financial advisor) (since January 2002); Director of Columbia Equity Financial Corp. (privately-held financial advisor) (2002-2007); Managing Director of Carmona Motley Hoffman Inc. (privately-held financial advisor) (January 1998-December 2001); Member of the Finance and Budget Committee of the Council on Foreign Relations, Member of the Investment Committee and Board of Human Rights Watch (since July 2000) and Member of the Investment Committee and Board of Historic Hudson Valley (since February 2010). Oversees 57 portfolios in the OppenheimerFunds complex. Mr. Motley has served on the Boards of certain Oppenheimer funds since October 2002, during which time he has become familiar with the Fund’s (and other Oppenheimer funds’) financial, accounting, regulatory and investment matters and has contributed to the Boards’ deliberations. |
| |
Joanne Pace, Trustee (since 2012) Year of Birth: 1958 | | Advisory Board Director of Massey Quick and Company, LLC (since October 2014); Board Director of Horizon Blue Cross Blue Shield of New Jersey (since November 2012); Advisory Board Director of The Alberleen Group LLC (since March, 2012); Board Member (since January 2015), Board Member of 100 Women in Hedge Funds (non-profit) (since January 2015); Advisory Council Member of Morgan Stanley Children’s Hospital (non-profit) (since May, 2012); Senior Advisor of SECOR Asset Management, LP (2010-2011); Managing Director and Chief Operating Officer of Morgan Stanley Investment Management (2006-2010); Partner and Chief Operating Officer of FrontPoint Partners, LLC (hedge fund) (2005-2006); held the following positions at Credit Suisse: Managing Director (2003-2005); Global Head of Human Resources and member of Executive Board and Operating Committee (2004-2005), Global Head of Operations and Product Control (2003- 2004); held the following positions at Morgan Stanley: Managing Director (1997- 2003), Controller and Principal Accounting Officer (1999-2003); Chief Financial Officer (temporary assignment) for the Oversight Committee, Long Term Capital Management (1998-1999). Lead Independent Director and Chair of the Audit and Nominating Committee of The Global Chartist Fund, LLC of Oppenheimer Asset Management (2011-2012); Board Director of Managed Funds Association (2008- 2010); Board Director of Morgan Stanley Foundation (2007-2010) and Investment Committee Chair (2008-2010). Oversees 57 portfolios in the OppenheimerFunds complex. Ms. Pace has served on the Boards of certain Oppenheimer funds since November 2012, including as an Advisory Board Member for certain Oppenheimer funds, during which time she has become familiar with the Fund’s (and other Oppenheimer funds’) financial, accounting, regulatory and investment matters and has contributed to the Board’s deliberations. For purposes of this report, Ms. Pace is identified as a Trustee. |
47 OPPENHEIMER MID CAP VALUE FUND
TRUSTEES AND OFFICERS Unaudited / Continued
| | |
| |
Daniel Vandivort, Trustee (since 2014) Year of Birth: 1954 | | Chairman and Lead Independent Director/Trustee (March 2010-September 2014), Chairman of the Audit Committee (March 2009-September 2014) and Director/ Trustee (December 2008-September 2014) of the Board of Directors/Trustees of Value Line Funds; Trustee, Board of Trustees of Huntington Disease Foundation of America (since January 2015 and June 2007-December 2013) and Treasurer, Chairman of the Audit and Finance Committee (since January 2016); Trustee, Board of Trustees, RIM Retirement Savings Plan (2005-2007); President and Chief Investment Officer, Robeco Investment Management, formerly known as Weiss Peck and Greer (January 2005-June 2007); Member, Management Committee of Robeco Investment Management (2001-2007); Chairman and Trustee of the Board of Trustees of Weiss, Peck and Greer Funds (2004-2005); Managing Director and Head of Fixed Income, Weiss, Peck and Greer (November 1994-January 2005); Managing Director and Head of Fixed Income, CS First Boston Investment Management (January 1992-November 1994); Director, Global Product Development, First Boston Asset Management (November 1989 to January 1992); Vice President, Fixed Income Sales, First Boston Corp. (May 1984-November 1989). Oversees 57 portfolios in the OppenheimerFunds complex. Mr. Vandivort has served on the Boards of certain Oppenheimer funds since 2014, during which time he has become familiar with the Fund’s (and other Oppenheimer funds’) financial, accounting, regulatory and investment matters and has contributed to the Boards’ deliberations. |
|
| INTERESTED TRUSTEE AND OFFICER | | Mr. Steinmetz is an “Interested Trustee” because he is affiliated with the Manager and the Sub-Adviser by virtue of his positions as Chairman of the Sub-Adviser and officer and director of the Manager. Both as a Trustee and as an officer, Mr. Steinmetz serves for an indefinite term, or until his resignation, retirement, death or removal. Mr. Steinmetz’s address is 225 Liberty Street, New York, New York 10281-1008. |
| |
Arthur P. Steinmetz, Trustee (since 2015), President and Principal Executive Officer (since 2014) Year of Birth: 1958 | | Chairman of the Sub-Adviser (since January 2015); CEO and Chairman of the Manager (since July 2014), President of the Manager (since May 2013), a Director of the Manager (since January 2013), Director of the Sub-Adviser (since July 2014), President, Management Director and CEO of Oppenheimer Acquisition Corp. (the Sub-Adviser’s parent holding company) (since July 2014), and President and Director of OFI SteelPath, Inc. (since January 2013). Chief Investment Officer of the OppenheimerFunds advisory entities from (January 2013-December 2013); Executive Vice President of the Manager (January 2013-May 2013); Chief Investment Officer of the Sub-Adviser (October 2010-December 2012); Chief Investment Officer, Fixed-Income, of the Sub-Adviser (April 2009-October 2010); Executive Vice President of the Sub-Adviser (October 2009-December 2012); Director of Fixed Income of the Sub-Adviser (January 2009-April 2009); and a Senior Vice President of the Sub-Adviser (March 1993-September 2009). An officer of 101 portfolios in the OppenheimerFunds complex. |
|
| OTHER OFFICERS OF THE FUND | | The addresses of the Officers in the chart below are as follows: for Mss. Lo Bessette, Foxson and Picciotto, 225 Liberty Street, New York, New York 10281-1008, for Messrs. Spahr, Hewitt and Petersen, 6803 S. Tucson Way, Centennial, Colorado 80112-3924. Each Officer serves for an indefinite term or until his or her resignation, retirement, death or removal. |
| |
Laton Spahr, Vice President (since 2013) Year of Birth: 1975 | | Senior Vice President of the Sub-Adviser since March 2013. Senior portfolio manager (2003-2013) and equity analyst (2001-2002) for Columbia Management Investment Advisers, LLC. A portfolio manager and an officer of other portfolios in the OppenheimerFunds complex. |
48 OPPENHEIMER MID CAP VALUE FUND
| | |
| |
Eric Hewitt, Vice President (since 2013) Year of Birth: 1971 | | Senior Portfolio Manager of the Sub-Adviser (since January 2017); Vice President of the Sub-Adviser (since March 2013). Product Manager for Columbia Management Investment Advisors, LLC (2012–2013); Senior Equity Analyst and Portfolio Manager with Diamondback/Harbor Watch Capital Management, LLC (2009–2012); Senior Equity Analyst and Portfolio Manager with AllianceBernstein LP (1999–2009). A portfolio manager and an officer in the OppenheimerFunds complex. |
| |
Cynthia Lo Bessette, Secretary and Chief Legal Officer (since 2016) Year of Birth: 1969 | | Executive Vice President, General Counsel and Secretary of the Manager (since February 2016); Senior Vice President and Deputy General Counsel of the Manager (March 2015-February 2016); Chief Legal Officer of the Sub-Adviser and the Distributor (since February 2016); Vice President, General Counsel and Secretary of Oppenheimer Acquisition Corp. (since February 2016); General Counsel of OFI SteelPath, Inc., VTL Associates, LLC and Index Management Solutions, LLC (since February 2016); Chief Legal Officer of OFI Global Institutional, Inc., HarbourView Asset Management Corporation, OFI Global Trust Company, Oppenheimer Real Asset Management, Inc., OFI Private Investments Inc., Shareholder Services, Inc. and Trinity Investment Management Corporation (since February 2016); Corporate Counsel (February 2012-March 2015) and Deputy Chief Legal Officer (April 2013-March 2015) of Jennison Associates LLC; Assistant General Counsel (April 2008-September 2009) and Deputy General Counsel (October 2009-February 2012) of Lord Abbett & Co. LLC. An officer of 101 portfolios in the OppenheimerFunds complex. |
| |
Jennifer Foxson, Vice President and Chief Business Officer (since 2014) Year of Birth: 1969 | | Senior Vice President of OppenheimerFunds Distributor, Inc. (since June 2014); Vice President of OppenheimerFunds Distributor, Inc. (April 2006-June 2014); Vice President of the Sub-Adviser (January 1998-March 2006); Assistant Vice President of the Sub-Adviser (October 1991-December 1998). An officer of 101 portfolios in the OppenheimerFunds complex. |
| |
Mary Ann Picciotto, Chief Compliance Officer and Chief Anti-Money Laundering Officer (since 2014) Year of Birth: 1973 | | Senior Vice President and Chief Compliance Officer of the Manager (since March 2014); Chief Compliance Officer of the Sub-Adviser, OFI SteelPath, Inc., OFI Global Trust Company, OFI Global Institutional, Inc., Oppenheimer Real Asset Management, Inc., OFI Private Investments, Inc., Harborview Asset Management Corporation, Trinity Investment Management Corporation, and Shareholder Services, Inc. (since March 2014); Managing Director of Morgan Stanley Investment Management Inc. and certain of its various affiliated entities; Chief Compliance Officer of various Morgan Stanley Funds (May 2010-January 2014); Chief Compliance Officer of Morgan Stanley Investment Management Inc. (April 2007-January 2014). An officer of 101 portfolios in the OppenheimerFunds complex. |
| |
Brian S. Petersen, Treasurer and Principal Financial & Accounting Officer (since 2016) Year of Birth: 1970 | | Senior Vice President of the Manager (since January 2017); Vice President of the Manager (January 2013-January 2017); Vice President of the Sub-Adviser (February 2007-December 2012); Assistant Vice President of the Sub-Adviser (August 2002- 2007). An officer of 101 portfolios in the OppenheimerFunds complex. |
The Fund’s Statement of Additional Information contains additional information about the Fund’s Trustees and Officers and is available without charge upon request by calling 1.800.CALL OPP (225.5677).
49 OPPENHEIMER MID CAP VALUE FUND
OPPENHEIMER MID CAP VALUE FUND
| | |
| Manager | | OFI Global Asset Management, Inc. |
| |
| Sub-Adviser | | OppenheimerFunds, Inc. |
| |
| Distributor | | OppenheimerFunds Distributor, Inc. |
| |
| Transfer and Shareholder Servicing Agent | | OFI Global Asset Management, Inc. |
| |
| Sub-Transfer Agent | | Shareholder Services, Inc. DBA OppenheimerFunds Services |
| |
| Independent Registered Public Accounting Firm | | KPMG LLP |
| |
| Legal Counsel | | Kramer Levin Naftalis & Frankel LLP |
© 2017 OppenheimerFunds, Inc. All rights reserved.
50 OPPENHEIMER MID CAP VALUE FUND
PRIVACY NOTICE
As an Oppenheimer fund shareholder, you are entitled to know how we protect your personal information and how we limit its disclosure.
Information Sources
We obtain non-public personal information about our shareholders from the following sources:
● Applications or other forms.
● When you create a user ID and password for online account access.
● When you enroll in eDocs Direct,SM our electronic document delivery service.
● Your transactions with us, our affiliates or others.
● Technologies on our website, including: “cookies” and web beacons, which are used to collect data on the pages you visit and the features you use.
If you visit oppenheimerfunds.com and do not log on to the secure account information areas, we do not obtain any personal information about you. When you do log on to a secure area, we do obtain your user ID and password to identify you. We also use this information to provide you with products and services you have requested, to inform you about products and services that you may be interested in and assist you in other ways.
We do not collect personal information through our website unless you willingly provide it to us, either directly by email or in those areas of the website that request information. In order to update your personal information (including your mailing address, email address and phone number) you must first log on and visit your user profile.
If you have set your browser to warn you before accepting cookies, you will receive the warning message with each cookie. You can refuse cookies by turning them off in your browser. However, doing so may limit your access to certain sections of our website.
We use cookies to help us improve and manage our website. For example, cookies help us recognize new versus repeat visitors to the site, track the pages visited, and enable some special features on the website. This data helps us provide better service for our website visitors.
Protection of Information
We do not disclose any non-public personal information (such as names on a customer list) about current or former customers to anyone, except as permitted by law.
Disclosure of Information
Copies of confirmations, account statements and other documents reporting activity in your fund accounts are made available to your financial advisor (as designated by you). We may also use details about you and your investments to help us, our financial service affiliates, or firms that jointly market their financial products and services with ours, to better serve your investment needs or suggest educational material that may be of interest to you. If this requires us to provide you with an opportunity to “opt in” or “opt out” of such information sharing with a firm not affiliated with us, you will receive notification on how to do so, before any such sharing takes place.
Right of Refusal
We will not disclose your personal information to unaffiliated third parties (except as permitted by law), unless we first offer you a reasonable opportunity to refuse or “opt out” of such disclosure.
51 OPPENHEIMER MID CAP VALUE FUND
PRIVACY NOTICE Continued
Internet Security and Encryption
In general, the email services provided by our website are encrypted and provide a secure and private means of communication with us. To protect your own privacy, confidential and/ or personal information should only be communicated via email when you are advised that you are using a secure website.
As a security measure, we do not include personal or account information in non-secure emails, and we advise you not to send such information to us in non-secure emails. Instead, you may take advantage of the secure features of our website to encrypt your email correspondence. To do this, you will need to use a browser that supports Secure Sockets Layer (SSL) protocol.
● All transactions conducted via our websites, including redemptions, exchanges and purchases, are secured by the highest encryption standards available. SSL is used to establish a secure connection between your PC and OppenheimerFunds’ server. It transmits information in an encrypted and scrambled format.
● Encryption is achieved through an electronic scrambling technology that uses a “key” to code and then decode the data. Encryption acts like the cable converter box you may have on your television set. It scrambles data with a secret code so that no one can make sense of it while it is being transmitted. When the data reaches its destination, the same software unscrambles the data.
● You can exit the secure area by closing your browser or, for added security, you can use the Log Out button before you close your browser.
Other Security Measures
We maintain physical, electronic and procedural safeguards to protect your personal account information. Our employees and agents have access to that information only so that they may offer you products or provide services, for example, when responding to your account questions.
How You Can Help
You can also do your part to keep your account information private and to prevent unauthorized transactions. If you obtain a user ID and password for your account, safeguard that information. Strengthening your online credentials–your online security profile–typically your user name, password, and security questions and answers, can be one of your most important lines of defense on the Internet. For additional information on how you can help prevent identity theft, visit https://www. oppenheimerfunds.com/security.
Who We Are
This joint notice describes the privacy policies of the Oppenheimer funds, OppenheimerFunds, Inc., each of its investment adviser subsidiaries, OppenheimerFunds Distributor, Inc. and OFI Global Trust Co. It applies to all Oppenheimer fund accounts you presently have, or may open in the future, using your Social Security number—whether or not you remain a shareholder of our funds. This notice was last updated as of November 2017. In the event it is updated or changed, we will post an updated notice on our website at oppenheimerfunds.com. If you have any questions about this privacy policy, email us by clicking on the Contact Us section of our website at oppenheimerfunds.com, write to us at P.O. Box 5270, Denver, CO 80217-5270, or call us at 800 CALL OPP (225 5677).
52 OPPENHEIMER MID CAP VALUE FUND
THIS PAGE INTENTIONALLY LEFT BLANK.
53 OPPENHEIMER MID CAP VALUE FUND
THIS PAGE INTENTIONALLY LEFT BLANK.
54 OPPENHEIMER MID CAP VALUE FUND
THIS PAGE INTENTIONALLY LEFT BLANK.
55 OPPENHEIMER MID CAP VALUE FUND
| | | | |
| |  | | |
| | |
| | Visit us at oppenheimerfunds.com for 24-hr access to account information and transactions or call us at 800.CALL OPP (800.225.5677) for 24-hr automated information and automated transactions. Representatives also available Mon–Fri 8am-8pm ET. | | |
| | |
| | | | |
| | |
| | | | |
Visit Us oppenheimerfunds.com | | | | |
| | |
Call Us 800 225 5677 | | | | |
Follow Us | | | | |
 | | Oppenheimer funds are distributed by OppenheimerFunds Distributor, Inc. 225 Liberty Street, New York, NY 10281-1008 © 2017 OppenheimerFunds Distributor, Inc. All rights reserved. RA0251.001.1017 December 21, 2017 | | |
Item 2. Code of Ethics.
The registrant has adopted a code of ethics that applies to the registrant’s principal executive officer, principal financial officer, principal accounting officer or controller or persons performing similar functions.
Item 3. Audit Committee Financial Expert.
The Board of Trustees of the registrant has determined that Joanne Pace, the Board’s Audit Committee Chairwoman, is an audit committee financial expert and that Ms. Pace is “independent” for purposes of this Item 3.
Item 4. Principal Accountant Fees and Services.
The principal accountant for the audit of the registrant’s annual financial statements billed $179,700 in fiscal 2017 and $152,800 in fiscal 2016.
The principal accountant for the audit of the registrant’s annual financial statements billed $15,500 in fiscal 2017 and $21,147 in fiscal 2016.
The principal accountant for the audit of the registrant’s annual financial statements billed $386,986 in fiscal 2017 and $598,285 in fiscal 2016 to the registrant’s investment adviser or any entity controlling, controlled by, or under common control with the adviser that provides ongoing services to the registrant.
Such services include: GIPS attestation procedures, internal controls, custody audits and additional audit services
The principal accountant for the audit of the registrant’s annual financial statements billed $33,000 in fiscal 2017 and $29,440 in fiscal 2016.
The principal accountant for the audit of the registrant’s annual financial statements billed $286,402 in fiscal 2017 and $690,716 in fiscal 2016 to the registrant’s investment adviser or any entity controlling, controlled by, or under common control with the adviser that provides ongoing services to the registrant.
Such services include: tax compliance, tax planning and tax advice. Tax compliance generally involves preparation of original and amended tax returns, claims for a refund and tax payment-planning services. Tax planning and tax advice includes assistance with tax audits and appeals, tax advice related to mergers and acquisitions and requests for rulings or technical advice from taxing authorities.
The principal accountant for the audit of the registrant’s annual financial statements billed no such fees in fiscal 2017 and no such fees in fiscal 2016.
The principal accountant for the audit of the registrant’s annual financial statements billed no such fees in fiscal 2017 and no such fees in fiscal 2016 to the registrant’s investment adviser or any entity controlling, controlled by, or under common control with the adviser that provides ongoing services to the registrant.
Such fees would include the cost to the principal accountant of attending audit committee meetings and consultations regarding the registrant’s retirement plan with respect to its Trustees.
| (e) | (1) During its regularly scheduled periodic meetings, the registrant’s audit committee will pre-approve all audit, audit-related, tax and other services to be provided by the principal accountants of the registrant. |
The audit committee has delegated pre-approval authority to its Chairwoman for any subsequent new engagements that arise between regularly scheduled meeting dates provided that any fees such pre-approved are presented to the audit committee at its next regularly scheduled meeting.
Under applicable laws, pre-approval of non-audit services may be waived provided that: 1) the aggregate amount of all such services provided constitutes no more than five percent of the total amount of fees paid by the registrant to its principal accountant during the fiscal year in which services are provided 2) such services were not recognized by the registrant at the time of engagement as non-audit services and 3) such services are promptly brought to the attention of the audit committee of the registrant and approved prior to the completion of the audit.
(2) 0%
| (f) | Not applicable as less than 50%. |
| (g) | The principal accountant for the audit of the registrant’s annual financial statements billed $721,888 in fiscal 2017 and $1,339,588 in fiscal 2016 to the registrant and the registrant’s investment adviser or any entity controlling, controlled by, or under common control with the adviser that provides ongoing services to the registrant related to non-audit fees. Those billings did not include any prohibited non-audit services as defined by the Securities Exchange Act of 1934. |
| (h) | The registrant’s audit committee of the board of Trustees has considered whether the provision of non-audit services that were rendered to the registrant’s investment adviser, and any entity controlling, controlled by, or under common control with the investment adviser that provides ongoing services to the registrant that were not pre-approved pursuant to paragraph (c)(7)(ii) of Rule 2-01 of Regulation S-X is compatible with maintaining the principal accountant’s independence. No such services were rendered. |
Item 5. Audit Committee of Listed Registrants
Not applicable.
Item 6. Schedule of Investments.
a) Not applicable. The complete schedule of investments is included in Item 1 of this Form N-CSR.
b) Not applicable.
Item 7. Disclosure of Proxy Voting Policies and Procedures for Closed-End Management Investment Companies.
Not applicable.
Item 8. Portfolio Managers of Closed-End Management Investment Companies.
Not applicable.
Item 9. Purchases of Equity Securities by Closed-End Management Investment Company and Affiliated Purchasers.
Not applicable.
Item 10. Submission of Matters to a Vote of Security Holders.
The Fund’s Governance Committee Provisions with Respect to Nominations of Directors/Trustees to the Respective Boards
None
Item 11. Controls and Procedures.
Based on their evaluation of the registrant’s disclosure controls and procedures (as defined in rule 30a-3(c) under the Investment Company Act of 1940 (17 CFR 270.30a-3(c)) as of 10/31/2017, the registrant’s principal executive officer and principal financial officer found the registrant’s disclosure controls and procedures to provide reasonable assurances that information required to be disclosed by the registrant in the reports that it files under the Securities Exchange Act of 1934 (a) is accumulated and communicated to registrant’s management, including its principal executive officer and principal financial officer, to allow timely decisions regarding required disclosure, and (b) is recorded, processed, summarized and reported, within the time periods specified in the rules and forms adopted by the U.S. Securities and Exchange Commission.
There have been no changes in the registrant’s internal controls over financial reporting that occurred during the registrant’s second fiscal quarter of the period covered by this report that have materially affected, or are reasonably likely to materially affect, the registrant’s internal control over financial reporting.
Item 12. Disclosure of Securities Lending Activities for Closed-End Management Investment Companies.
Not applicable.
Item 13. Exhibits.
| (a) | (1) Exhibit attached hereto. |
| | (2) Exhibits attached hereto. |
SIGNATURES
Pursuant to the requirements of the Securities Exchange Act of 1934 and the Investment Company Act of 1940, the registrant has duly caused this report to be signed on its behalf by the undersigned, thereunto duly authorized.
| | |
| Oppenheimer Quest for Value Funds |
| |
| By: | | /s/ Arthur P. Steinmetz |
| | | Arthur P. Steinmetz |
| | | Principal Executive Officer |
| Date: | | 12/11/2017 |
Pursuant to the requirements of the Securities Exchange Act of 1934 and the Investment Company Act of 1940, this report has been signed below by the following persons on behalf of the registrant and in the capacities and on the dates indicated.
| | |
| By: | | /s/ Arthur P. Steinmetz |
| | | Arthur P. Steinmetz |
| | | Principal Executive Officer |
| Date: | | 12/11/2017 |
| | |
| By: | | /s/ Brian S. Petersen |
| | | Brian S. Petersen |
| | | Principal Financial Officer |
| Date: | | 12/11/2017 |