UNITED STATES
SECURITIES AND EXCHANGE COMMISSION
WASHINGTON, D.C. 20549
FORM N-CSR
CERTIFIED SHAREHOLDER REPORT OF REGISTERED MANAGEMENT
INVESTMENT COMPANIES
Investment Company Act file number 811-5225
Oppenheimer Quest for Value Funds
(Exact name of registrant as specified in charter)
6803 South Tucson Way, Centennial, Colorado 80112-3924
(Address of principal executive offices) (Zip code)
Cynthia Lo Bessette
OFI Global Asset Management, Inc.
225 Liberty Street, New York, New York 10281-1008
(Name and address of agent for service)
Registrant’s telephone number, including area code: (303) 768-3200
Date of fiscal year end: October 31
Date of reporting period: 10/31/2018
Item 1. Reports to Stockholders.
An Important Update
On October 18, 2018, Massachusetts Mutual Life Insurance Company, an indirect corporate parent of OppenheimerFunds, Inc. and its subsidiaries OFI Global Asset Management, Inc., OFI SteelPath, Inc. and OFI Advisors, LLC, announced that it has entered into an agreement whereby Invesco Ltd., a global investment management company, will acquire OppenheimerFunds, Inc. As of the date of this report, the transaction is expected to close in the second quarter of 2019, pending necessary regulatory and other third-party approvals. This is subject to change.
Class A Shares
AVERAGE ANNUAL TOTAL RETURNS AT 10/31/18
| 1-Year | 5-Year | 10-Year | ||||||||||
Class A Shares of the Fund without Sales Charge | -5.12 | % | 2.95 | % | 7.28% | |||||||
Class A Shares of the Fund with Sales Charge | -10.58 | 1.74 | 6.65 | |||||||||
MSCI All Country World Index | -0.52 | 6.15 | 9.75 | |||||||||
Bloomberg Barclays Global Aggregate Bond Index, Hedged | 0.20 | 2.91 | 4.12 | |||||||||
Reference Index | -0.08 | 5.00 | 7.80 | |||||||||
Performance data quoted represents past performance, which does not guarantee future results. The investment return and principal value of an investment in the Fund will fluctuate so that an investor’s shares, when redeemed, may be worth more or less than their original cost. Fund returns include changes in share price, reinvested distributions, and a 5.75% maximum applicable sales charge except where “without sales charge” is indicated. Current performance may be lower or higher than the performance quoted. Returns do not consider capital gains or income taxes on an individual’s investment. Returns for periods of less than one year are cumulative and not annualized. For performance data current to the most recent month-end, visit oppenheimerfunds.com or call 1.800.CALL OPP (225.5677). See Fund prospectuses and summary prospectuses for more information on share classes and sales charges.
3 OPPENHEIMER GLOBAL ALLOCATION FUND
The Fund’s Class A shares (without sales charge) returned -5.12% in the one-year reporting period ended October 31, 2018. The Fund underperformed its Reference Index (the “Reference Index”), a customized weighted index currently comprised of 60% of the MSCI All Country World Index and 40% of the Bloomberg Barclays Global Aggregate Bond Index, Hedged, which returned -0.08% during the same period.
MARKET OVERVIEW
President Trump’s tax bill passed very late in December 2017, finalizing a process that had moved in fits and starts for much of the year. The final bill was mostly in line with earlier expectations, with key changes being a much lower corporate tax rate, small cuts to individual tax rates, and some changes to deductibility of mortgage payments and state taxes. These tax cuts along with high optimism of
synchronized global growth helped move market sentiment up significantly to start 2018. Equity markets were up strongly in January as earnings reports were positive and expectations for future growth continued to be priced in.
After reaching record highs, markets saw a sell-off in February as market volatility returned and sentiment for risk assets turned negative during the month. The U.S. equity
COMPARISON OF CHANGE IN VALUE OF $10,000 HYPOTHETICAL INVESTMENTS IN:
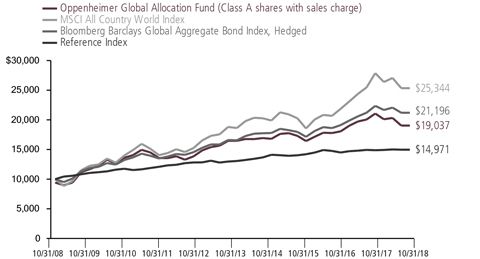
4 OPPENHEIMER GLOBAL ALLOCATION FUND
market declined on concerns over stretched valuations, an increase in inflation expectations, and less accommodation from global central banks.
Throughout the period, activity from central banks around the world was closely monitored as the liquidity they have been providing has been a key backstop to market sentiment over the past decade. The U.S. Federal Reserve (Fed) increasingly tapered its re-investment program for both government and mortgage-backed securities. The Fed raised rates four times during the period, bringing the total number of rate increases to eight since December 2015. Other central banks around the world also signaled a slowdown of liquidity support. While the European Central Bank (ECB) announcement in June was accepted as ‘dovish,’ it did commit to ending its purchase program by year-end.
Later in the year, the Trump administration initiated aggressive U.S policies toward global trade relations, triggering fears of global trade wars. Particularly in focus was the application of tariffs and counter tariffs on a wide variety of goods traded between the U.S. and China. The concerns of strained trade relations caused by U.S. policy expanded to traditionally friendly trade partners: Canada, Mexico, and the European Union. While there were periods of respite from the negative sentiment of global trade wars, particularly when a reformed NAFTA agreement was signed by the three North American countries, fears of full blown global trade wars weighed on markets.
Negative volatility again entered the markets in October as investors were concerned over rising interest rates, global trade wars, and weakness in the outlook for global growth. Equity markets lost most of the gains they had made since the February sell off.
FUND REVIEW
During the period, the security selection component of the Fund’s investment process was the largest detractor from relative performance, driven mostly by underperformance in domestic equity strategies and international strategies. Our large-cap core strategy, which has historically outperformed in periods of volatility, was the largest detractor to performance due to poor stock selection. In particular, the underperformance was mainly driven by company-specific issues with some of our larger holdings within the Industrials, Utilities, and Health Care sectors. Within the international strategies the global strategy and the international growth strategy were the largest detractors. The global equity strategy experienced underperformance driven mostly by poor stock selection in the Information Technology and the Consumer Discretionary sectors. This negative performance was partially offset by positive performance in our developing market strategy.
With respect to asset allocation at the end of the reporting period, the portfolio was underweight equity-focused strategies. We hold a modest underweight to U.S. equities
5 OPPENHEIMER GLOBAL ALLOCATION FUND
as part of our underweight to global equities, and this detracted from performance as the U.S. equity market outpaced other regions. Within U.S. equities, we are overweight small-caps and mid-caps versus large-caps, overweight quality and underweight value. Our leading indicators suggested the U.S. economy is likely to slow over the next few quarters, after experiencing strong growth acceleration in the first half of the year. Monetary conditions continue to tighten, albeit at a gradual pace, while activity in the construction and industrial sector is peaking. We expected growth to decelerate, but to remain solidly above trend. We expected small-caps and mid-caps to outperform large-caps, benefiting from domestic fiscal expansion, and stable credit markets, while being more insulated from weakening growth outside the U.S.
We hold a modest underweight to European equities as part of our underweight to global equities. European growth continues to decelerate, and this slowdown is widespread across all major Euro Area economies.
We held a modest underweight to emerging market equities as part of our underweight to global equities. This was a positive contributor to performance as emerging market equities continued to fall on U.S.-China trade tensions. Our leading indicators suggested emerging markets growth should continue to decelerate, with risks of falling below trend, therefore registering a “contraction” in our macro regime framework. Manufacturing surveys indicated an inventory cycle that has not fully adjusted yet, as
orders-to-inventories ratios are still falling. China’s renewed fiscal policy efforts are partially a reaction to this macro picture, aimed at stabilizing downside risks.
Tensions in global trade policy continue to drift higher, as exemplified by the threat of additional tariffs on as much as $200bln in U.S. imports from China, bringing the total to nearly 60% of all Chinese imports into the U.S. Together with tightening financial conditions, global trade uncertainty is weighing negatively on emerging market sentiment. On the back of this our global risk appetite framework signaled very weak market sentiment, down to levels last seen in mid-2015, warranting a defensive stance on emerging market equities despite attractive valuations.
Our allocation to emerging market local debt was a detractor to performance - during the period, we cut our exposure to the asset class. Many of the emerging market economies are nearing a contraction phase of the business cycle, where growth is below trend and decelerating. Given the macro backdrop, we plan to wait for a few catalysts before returning to the asset class, such as a re-acceleration in emerging market growth, a dovish turn in Fed policy, or a meaningful resolution in U.S.-China trade policy.
Throughout the period, active currency management was a detractor to relative performance. In particular, our recent overweight positions to safe-haven currencies like the Swiss Franc and underweight
6 OPPENHEIMER GLOBAL ALLOCATION FUND
positions to emerging market currencies like the Brazilian Real detracted from performance. In terms of positioning, we are partially hedged versus the Reference Index, with underweight positions in the Euro and a few emerging market currencies. We continue to hold an overweight to the Japanese Yen. Ongoing weakness outside the U.S. argues for a modest overweight to the U.S. Dollar, as domestic equities remain more attractive than foreign equity markets, encouraging equity capital to stay in the U.S. We plan to wait for positive economic surprises in foreign markets to re-establish a bearish position in the greenback.
In terms of our government bond positioning, we are overweight duration via U.S. and developed markets sovereign fixed income, with a curve flattening bias. Particularly in the U.S., this detracted from performance as yields moved higher on positive economic data. In our view, slowing global growth outside of the U.S., fragile risk appetite, and stable inflation continue to justify our overweight duration stance. While we believe the Fed will continue to tighten one more time this year, interest rates seem fairly priced at this stage, which should leave the long-end of the curve less exposed to Fed rate hikes. Also, our interest rate relative value trades, which have less directional risk and capitalize on cyclical and market dislocations across different countries, have detracted during the period.
During the period, alternatives exposure was a positive contributor to relative performance. We continue to hold a
meaningful position in catastrophe bonds at the expense of investment grade credit, given attractive loss-adjusted yields and the potential for low correlation with other asset classes, especially as the credit and business cycles extend further. Our alternative exposure to master limited partnerships (MLPs) was a detractor to relative performance. Despite a move higher in energy prices earlier in the period, MLPs struggled during the period and underperformed. We believe they are increasingly supported by crude and natural gas volume increases, stable energy markets, and cheap valuations. Furthermore, the restructuring of the sector (incentive distribution rights elimination or simplification) should improve prospects for distributable cash flow.
OUTLOOK
Global growth has peaked, and the deceleration in economic activity, while not severe, is broad based. Our leading indicators suggest the U.S. is entering a slowdown regime, joining the deceleration experienced by Europe and emerging markets. Market sentiment remains weak, particularly in non-U.S. markets. With over 30% of revenue exposure to emerging markets, Europe is likely to see a marginal drag from external demand given recent growth disappointments in Asia and the negative impact from trade policy uncertainty. In the second quarter of 2018, we flagged Italy as one of the key risks to watch. So far, the Italian government has delivered a more constructive rhetoric than we initially feared on upcoming budget
7 OPPENHEIMER GLOBAL ALLOCATION FUND
proposals. However, no details have been revealed yet and the new proposal, while below the 3% Maastricht limit, is likely to bring into question debt sustainability in the face of slowing GDP growth and the end of quantitative easing by the ECB.
Our overall stance remains slightly defensive, with a modest underweight to global equities and overweight to duration. We maintain a significant exposure to alternative assets such as event-linked bonds and MLPs, at the expense of investment-grade and core U.S. equities, and have no exposure to emerging market local debt.
As always, we continue to closely monitor the developments in financial conditions as well as the political and policy landscape to assess risks to the macro
outlook and financial markets. We are paying close attention to the policy backdrop and the inflation picture; both are potential headwinds to derail the advanced cycle. The main risk, in our view, is a dovish shift in the Fed’s rhetoric. While we expect the Fed to continue hiking rates through at least mid-2019, a dovish shift in communication is likely to provide substantial relief to risky assets, particularly in emerging markets, while weakening the dollar. A signaling that monetary policy has reached a neutral stance would indicate the approaching end of the tightening cycle, extending the current market cycle even further. If that were to happen and leading economic indicators were to re-accelerate, we would adjust our exposures accordingly. On the contrary, should we see further deterioration in economic data, or volatility pickup in equities or credit, we stand ready to adapt to a slowing macro environment and could reduce risk further.
 |  |
8 OPPENHEIMER GLOBAL ALLOCATION FUND
TOP TEN COMMON STOCK HOLDINGS
Airbus SE | 1.0% | |||
Alphabet, Inc., Cl. A | 0.9 | |||
LVMH Moet Hennessy Louis Vuitton SE | 0.8 | |||
SAP SE | 0.8 | |||
Alibaba Group Holding Ltd., Sponsored ADR | 0.7 | |||
Prudential plc | 0.6 | |||
Energy Transfer LP | 0.6 | |||
Murata Manufacturing Co. Ltd. | 0.5 | |||
Kering SA | 0.5 | |||
Nidec Corp. | 0.5 |
Portfolio holdings and allocations are subject to change. Percentages are as of October 31, 2018, and are based on net assets.
TOP TEN COMMON STOCK INDUSTRIES
Oil, Gas & Consumable Fuels | 3.9% | |||
Software | 2.8 | |||
Commercial Banks | 2.0 | |||
Semiconductors & Semiconductor Equipment | 1.8 | |||
Textiles, Apparel & Luxury Goods | 1.8 | |||
Interactive Media & Services | 1.8 | |||
Electronic Equipment, Instruments, & Components | 1.7 | |||
Insurance | 1.6 | |||
Biotechnology | 1.5 | |||
Hotels, Restaurants & Leisure | 1.4 |
Portfolio holdings and allocations are subject to change. Percentages are as of October 31, 2018, and are based on net assets.
For more current Fund holdings, please visit oppenheimerfunds.com.
PORTFOLIO ALLOCATION
| Common Stocks | 48.3% | |||
| Investment Companies | ||||
iShares JP Morgan USD Emerging Markets Bond Exchange Traded Fund | 5.4 | |||
Oppenheimer Institutional Government Money Market Fund | 2.0 | |||
Oppenheimer Master Event- Linked Bond Fund, LLC | 11.9 | |||
Oppenheimer Russell 1000 Dynamic Multifactor Exchange Traded Fund | 15.6 | |||
| Foreign Government Obligations | 11.5 | |||
| U.S. Government Obligations | 5.2 | |||
| Over-the-Counter Options Purchased | 0.1 | |||
| Non-Convertible Corporate Bonds and Notes | —* | |||
| Preferred Stocks | —* |
* Represents a value of less than 0.05%.
Portfolio holdings and allocations are subject to change. Percentages are as of October 31, 2018, and are based on the total market value of investments.
9 OPPENHEIMER GLOBAL ALLOCATION FUND
TOP TEN GEOGRAPHICAL HOLDINGS
United States | 55.2% | |||
France | 6.7 | |||
United Kingdom | 6.3 | |||
Japan | 6.3 | |||
Germany | 5.6 | |||
China | 2.7 | |||
Canada | 2.5 | |||
Switzerland | 1.8 | |||
Spain | 1.7 | |||
India | 1.4 |
Portfolio holdings and allocation are subject to change. Percentages are as of October 31, 2018, and are based on total market value of investments.
REGIONAL ALLOCATION
U.S./Canada | 57.7% | |||
Europe | 26.5 | |||
Asia | 13.7 | |||
Latin & South America | 1.0 | |||
Middle East/Africa | 0.6 | |||
Emerging Europe | 0.5 |
Portfolio holdings and allocation are subject to change. Percentages are as of October 31, 2018, and are based on total market value of investments.
10 OPPENHEIMER GLOBAL ALLOCATION FUND
Share Class Performance
AVERAGE ANNUAL TOTAL RETURNS WITHOUT SALES CHARGE AS OF 10/31/18
Inception Date | 1-Year | 5-Year | 10-Year | |||||
Class A (QVGIX) | 11/1/91 | -5.12% | 2.95% | 7.28% | ||||
Class C (QGRCX) | 9/1/93 | -5.84 | 2.19 | 6.50 | ||||
Class I (QGRIX) | 2/28/12 | -4.75 | 3.40 | 5.12* | ||||
Class R (QGRNX) | 3/1/01 | -5.34 | 2.70 | 7.03 | ||||
Class Y (QGRYX) | 5/1/00 | -4.88 | 3.21 | 7.64 |
AVERAGE ANNUAL TOTAL RETURNS WITH SALES CHARGE AS OF 10/31/18
Inception Date | 1-Year | 5-Year | 10-Year | |||||
Class A (QVGIX) | 11/1/91 | -10.58% | 1.74% | 6.65% | ||||
Class C (QGRCX) | 9/1/93 | -6.78 | 2.19 | 6.50 | ||||
Class I (QGRIX) | 2/28/12 | -4.75 | 3.40 | 5.12* | ||||
Class R (QGRNX) | 3/1/01 | -5.34 | 2.70 | 7.03 | ||||
Class Y (QGRYX) | 5/1/00 | -4.88 | 3.21 | 7.64 | ||||
| * Shows performance since inception. | ||||||||
Performance data quoted represents past performance, which does not guarantee future results. The investment return and principal value of an investment in the Fund will fluctuate so that an investor’s shares, when redeemed, may be worth more or less than their original cost. Current performance may be lower or higher than the performance quoted. Returns do not consider capital gains or income taxes on an individual’s investment. For performance data current to the most recent month-end, visit oppenheimerfunds.com or call 1.800. CALL OPP (225.5677). Fund returns include changes in share price, reinvested distributions, and the applicable sales charge: for Class A shares, the current maximum initial sales charge of 5.75% and for Class C shares, the contingent deferred sales charge of 1% for the 1-year period. There is no sales charge for Class I, Class R and Class Y shares. Returns for periods of less than one year are cumulative and not annualized. See Fund prospectuses and summary prospectuses for more information on share classes and sales charges.
The Fund’s performance is compared to the performance of the MSCI All Country World Index, the Reference Index (60% MSCI All Country World Index / 40% Bloomberg Barclays Global Aggregate Bond Index, Hedged), and the Bloomberg Barclays Global Aggregate Bond Index, Hedged. The MSCI All Country World Index is a free float-adjusted market capitalization weighted index that is designed to measure the equity market performance of developed and emerging markets. The Fund’s Reference Index is a customized weighted index currently comprised of 60% MSCI All Country World Index and 40% Barclays Global Aggregate Bond Index, Hedged. The Bloomberg Barclays Global Aggregate Bond Index provides a broad-based measure of global investment grade fixed-rate debt markets. The index is comprised of several other Barclays indexes that measure fixed income performance of regions around the world while hedging the currency back to the US dollar. The indices are unmanaged and cannot be purchased directly by investors. While index comparisons may be useful to provide a benchmark for the Fund’s performance, it must be noted that the Fund’s investments are not
11 OPPENHEIMER GLOBAL ALLOCATION FUND
limited to the investments comprising the indices. Index performance includes reinvestment of income, but does not reflect transaction costs, fees, expenses or taxes. Index performance is shown for illustrative purposes only as a benchmark for the Fund’s performance, and does not predict or depict performance of the Fund. The Fund’s performance reflects the effects of the Fund’s business and operating expenses.
The views in the Fund Performance Discussion represent the opinions of this Fund’s portfolio manager(s) and are not intended as investment advice or to predict or depict the performance of any investment. These views are as of the close of business on October 31, 2018, and are subject to change based on subsequent developments. The Fund’s portfolio and strategies are subject to change.
Before investing in any of the Oppenheimer funds, investors should carefully consider a fund’s investment objectives, risks, charges and expenses. Fund prospectuses and summary prospectuses contain this and other information about the funds, and may be obtained by asking your financial advisor, visiting oppenheimerfunds.com, or calling 1.800.CALL OPP (225.5677). Read prospectuses and summary prospectuses carefully before investing.
Shares of Oppenheimer funds are not deposits or obligations of any bank, are not guaranteed by any bank, are not insured by the FDIC or any other agency, and involve investment risks, including the possible loss of the principal amount invested.
12 OPPENHEIMER GLOBAL ALLOCATION FUND
Fund Expenses. As a shareholder of the Fund, you incur two types of costs: (1) transaction costs, which may include sales charges (loads) on purchase payments and/or contingent deferred sales charges on redemptions; and (2) ongoing costs, including management fees; distribution and service fees; and other Fund expenses. These examples are intended to help you understand your ongoing costs (in dollars) of investing in the Fund and to compare these costs with the ongoing costs of investing in other mutual funds.
The examples are based on an investment of $1,000.00 invested at the beginning of the period and held for the entire 6-month period ended October 31, 2018.
Actual Expenses. The first section of the table provides information about actual account values and actual expenses. You may use the information in this section for the class of shares you hold, together with the amount you invested, to estimate the expense that you paid over the period. Simply divide your account value by $1,000.00 (for example, an $8,600.00 account value divided by $1,000.00 = 8.60), then multiply the result by the number in the first section under the heading entitled “Expenses Paid During 6 Months Ended October 31, 2018” to estimate the expenses you paid on your account during this period.
Hypothetical Example for Comparison Purposes. The second section of the table provides information about hypothetical account values and hypothetical expenses based on the Fund’s actual expense ratio for each class of shares, and an assumed rate of return of 5% per year for each class before expenses, which is not the Fund’s actual return. The hypothetical account values and expenses may not be used to estimate the actual ending account balance or expenses you paid for the period. You may use this information to compare the ongoing costs of investing in the Fund and other funds. To do so, compare this 5% hypothetical example for the class of shares you hold with the 5% hypothetical examples that appear in the shareholder reports of the other funds.
Please note that the expenses shown in the table are meant to highlight your ongoing costs only and do not reflect any transactional costs, such as front-end or contingent deferred sales charges (loads). Therefore, the “hypothetical” section of the table is useful in comparing ongoing costs only, and will not help you determine the relative total costs of owning different funds. In addition, if these transactional costs were included, your costs would have been higher.
13 OPPENHEIMER GLOBAL ALLOCATION FUND
| Actual | Beginning Account Value May 1, 2018 | Ending Account Value October 31, 2018 | Expenses Paid During 6 Months Ended | |||||||||||||||||||||
Class A | $ | 1,000.00 | $ | 947.20 | $ | 6.20 | ||||||||||||||||||
Class C | 1,000.00 | 943.70 | 9.90 | |||||||||||||||||||||
Class I | 1,000.00 | 949.20 | 4.14 | |||||||||||||||||||||
Class R | 1,000.00 | 946.60 | 7.44 | |||||||||||||||||||||
Class Y | 1,000.00 | 948.70 | 4.97 | |||||||||||||||||||||
| Hypothetical | ||||||||||||||||||||||||
(5% return before expenses) | ||||||||||||||||||||||||
Class A | 1,000.00 | 1,018.85 | 6.43 | |||||||||||||||||||||
Class C | 1,000.00 | 1,015.07 | 10.26 | |||||||||||||||||||||
Class I | 1,000.00 | 1,020.97 | 4.29 | |||||||||||||||||||||
Class R | 1,000.00 | 1,017.59 | 7.71 | |||||||||||||||||||||
Class Y | 1,000.00 | 1,020.11 | 5.16 | |||||||||||||||||||||
Expenses are equal to the Fund’s annualized expense ratio for that class, multiplied by the average account value over the period, multiplied by 184/365 (to reflect the one-half year period). Those annualized expense ratios, excluding indirect expenses from affiliated funds, based on the 6-month period ended October 31, 2018 are as follows:
| Class | Expense Ratios | |||||||
Class A | 1.26 | % | ||||||
Class C | 2.01 | |||||||
Class I | 0.84 | |||||||
Class R | 1.51 | |||||||
Class Y | 1.01 | |||||||
The expense ratios reflect voluntary and/or contractual waivers and/or reimbursements of expenses by the Fund’s Manager and Transfer Agent. Some of these undertakings may be modified or terminated at any time, as indicated in the Fund’s prospectus. The “Consolidated Financial Highlights” tables in the Fund’s financial statements, included in this report, also show the gross expense ratios, without such waivers or reimbursements and reduction to custodian expenses, if applicable.
14 OPPENHEIMER GLOBAL ALLOCATION FUND
CONSOLIDATED STATEMENT OF INVESTMENTS October 31, 2018
| Shares | Value | |||||||
Common Stocks—46.7% | ||||||||
Consumer Discretionary—10.3% | ||||||||
Auto Components—0.4% | ||||||||
Bridgestone Corp. | 44,300 | $ | 1,706,710 | |||||
Continental AG | 8,956 | 1,480,504 | ||||||
Koito Manufacturing Co. Ltd. | 31,400 | 1,509,008 | ||||||
Valeo SA | 35,247 | 1,137,935 | ||||||
| 5,834,157 | ||||||||
Automobiles—0.9% | ||||||||
Bayerische Motoren Werke (BMW) AG | 43,100 | 3,253,516 | ||||||
Bayerische Motoren Werke AG | 15,386 | 1,327,189 | ||||||
Hero MotoCorp Ltd. | 42,137 | 1,576,016 | ||||||
Subaru Corp. | 54,600 | 1,472,667 | ||||||
Suzuki Motor Corp. | 43,300 | 2,160,380 | ||||||
Volkswagen AG | 18,939 | 3,189,723 | ||||||
| 12,979,491 | ||||||||
Distributors—0.0% | ||||||||
Pool Corp. | 5,680 | 827,860 | ||||||
Diversified Consumer Services—0.1% | ||||||||
Bright Horizons Family Solutions, Inc.1 | 7,340 | 843,439 | ||||||
New Oriental Education & Technology Group, Inc., Sponsored ADR1 | 8,770 | 513,133 | ||||||
| 1,356,572 | ||||||||
Entertainment—0.3% | ||||||||
Take-Two Interactive Software, Inc.1 | 7,640 | 984,567 | ||||||
Walt Disney Co. (The) | 29,120 | 3,343,849 | ||||||
| 4,328,416 | ||||||||
Hotels, Restaurants & Leisure—1.4% | ||||||||
Carnival Corp. | 61,090 | 3,423,484 | ||||||
Chipotle Mexican Grill, Inc., Cl. A1 | 870 | 400,487 | ||||||
Domino’s Pizza Group plc | 259,100 | 937,325 | ||||||
Domino’s Pizza, Inc. | 3,590 | 964,956 | ||||||
Genting Bhd | 371,960 | 651,961 | ||||||
Huazhu Group Ltd., ADR | 62,192 | 1,626,943 | ||||||
International Game Technology plc | 68,470 | 1,270,118 | ||||||
Jollibee Foods Corp. | 135,080 | 696,129 | ||||||
Kangwon Land, Inc. | 47,200 | 1,191,324 | ||||||
Planet Fitness, Inc., Cl. A1 | 12,110 | 594,480 | ||||||
Sands China Ltd. | 263,200 | 1,043,856 | ||||||
Vail Resorts, Inc. | 3,610 | 907,265 | ||||||
Whitbread plc | 61,869 | 3,477,328 | ||||||
Yum China Holdings, Inc. | 84,070 | 3,033,246 | ||||||
| 20,218,902 | ||||||||
Household Durables—0.6% | ||||||||
Newell Brands, Inc. | 94,500 | 1,500,660 | ||||||
15 OPPENHEIMER GLOBAL ALLOCATION FUND
CONSOLIDATED STATEMENT OF INVESTMENTS Continued
| Shares | Value | |||||||
Household Durables (Continued) | ||||||||
SEB SA2 | 8,210 | $ | 1,175,016 | |||||
SEB SA2 | 2,490 | 356,369 | ||||||
Sony Corp. | 99,200 | 5,338,955 | ||||||
| 8,371,000 | ||||||||
Interactive Media & Services—1.8% | ||||||||
58.com, Inc., ADR1 | 15,200 | 996,968 | ||||||
Alphabet, Inc., Cl. A1 | 12,370 | 13,490,475 | ||||||
Baidu, Inc., Sponsored ADR1 | 27,990 | 5,319,779 | ||||||
Facebook, Inc., Cl. A1 | 34,010 | 5,162,378 | ||||||
IAC/InterActiveCorp1 | 4,120 | 809,951 | ||||||
| 25,779,551 | ||||||||
Internet & Catalog Retail—1.3% | ||||||||
Alibaba Group Holding Ltd., Sponsored ADR1 | 74,311 | 10,572,969 | ||||||
Amazon.com, Inc.1 | 390 | 623,224 | ||||||
Farfetch Ltd., Cl. A1 | 19,800 | 406,692 | ||||||
GrubHub, Inc.1 | 6,790 | 629,705 | ||||||
JD.com, Inc., ADR1 | 191,516 | 4,504,456 | ||||||
Meituan Dianping, Cl. B1,2 | 13,800 | 89,220 | ||||||
Meituan Dianping, Cl. B1,2 | 120,000 | 737,036 | ||||||
MercadoLibre, Inc. | 1,884 | 611,358 | ||||||
Pinduoduo, Inc., ADR1 | 30,300 | 534,795 | ||||||
| 18,709,455 | ||||||||
Leisure Products—0.2% | ||||||||
Bandai Namco Holdings, Inc. | 65,600 | 2,328,330 | ||||||
Media—0.3% | ||||||||
ProSiebenSat.1 Media SE | 40,821 | 943,731 | ||||||
SES SA, Cl. A, FDR | 102,840 | 2,209,640 | ||||||
Zee Entertainment Enterprises Ltd. | 209,371 | 1,280,887 | ||||||
| 4,434,258 | ||||||||
Multiline Retail—0.2% | ||||||||
Dollarama, Inc. | 35,745 | 988,625 | ||||||
Lojas Americanas SA | 254,214 | 1,284,220 | ||||||
Ollie’s Bargain Outlet Holdings, Inc.1 | 8,550 | 794,295 | ||||||
SACI Falabella | 77,094 | 581,535 | ||||||
| 3,648,675 | ||||||||
Specialty Retail—1.0% | ||||||||
Burlington Stores, Inc.1 | 6,200 | 1,063,238 | ||||||
Dufry AG1 | 15,757 | 1,771,691 | ||||||
Industria de Diseno Textil SA | 161,923 | 4,566,901 | ||||||
Nitori Holdings Co. Ltd. | 10,100 | 1,324,626 | ||||||
O’Reilly Automotive, Inc.1 | 3,000 | 962,250 | ||||||
Ross Stores, Inc. | 10,620 | 1,051,380 | ||||||
Steinhoff International Holdings NV1 | 303,311 | 36,927 | ||||||
16 OPPENHEIMER GLOBAL ALLOCATION FUND
| Shares | Value | |||||||
Specialty Retail (Continued) | ||||||||
Tiffany & Co. | 25,630 | $ | 2,852,619 | |||||
Tractor Supply Co. | 3,980 | 365,722 | ||||||
Urban Outfitters, Inc.1 | 8,760 | 345,670 | ||||||
| 14,341,024 | ||||||||
Textiles, Apparel & Luxury Goods—1.8% | ||||||||
Brunello Cucinelli SpA | 15,307 | 524,337 | ||||||
Canada Goose Holdings, Inc.1 | 4,960 | 270,667 | ||||||
Cie Financiere Richemont SA | 15,256 | 1,112,541 | ||||||
Hermes International | 3,571 | 2,035,168 | ||||||
Kering SA | 16,758 | 7,430,640 | ||||||
lululemon athletica, Inc.1 | 7,590 | 1,068,141 | ||||||
LVMH Moet Hennessy Louis Vuitton SE | 39,540 | 11,978,902 | ||||||
PRADA SpA | 278,800 | 989,794 | ||||||
Puma SE | 819 | 421,046 | ||||||
| 25,831,236 | ||||||||
Consumer Staples—3.5% | ||||||||
Beverages—1.0% | ||||||||
Anadolu Efes Biracilik Ve Malt Sanayii AS | 98,473 | 330,831 | ||||||
Coca-Cola European Partners plc | 77,960 | 3,546,400 | ||||||
Diageo plc | 91,820 | 3,175,793 | ||||||
Fomento Economico Mexicano SAB de CV | 168,194 | 1,429,876 | ||||||
Fomento Economico Mexicano SAB de CV, Sponsored ADR | 8,310 | 706,932 | ||||||
Heineken NV | 14,242 | 1,283,506 | ||||||
Pernod Ricard SA | 21,510 | 3,282,137 | ||||||
Tsingtao Brewery Co. Ltd., Cl. H | 220,000 | 865,763 | ||||||
| 14,621,238 | ||||||||
Food & Staples Retailing—0.3% | ||||||||
Alimentation Couche-Tard, Inc., Cl. B | 31,791 | 1,518,250 | ||||||
Atacadao Distribuicao Comercio e Industria Ltda | 252,300 | 1,033,199 | ||||||
BIM Birlesik Magazalar AS | 16,770 | 238,198 | ||||||
CP ALL PCL | 543,600 | 1,102,795 | ||||||
Shoprite Holdings Ltd. | 55,522 | 677,451 | ||||||
SPAR Group Ltd. (The) | 44,106 | 524,443 | ||||||
| 5,094,336 | ||||||||
Food Products—1.1% | ||||||||
Archer-Daniels-Midland Co. | 11,320 | 534,870 | ||||||
Barry Callebaut AG | 694 | 1,353,921 | ||||||
Danone SA | 53,060 | 3,759,348 | ||||||
Lamb Weston Holdings, Inc. | 17,480 | 1,366,237 | ||||||
McCormick & Co., Inc. | 5,120 | 737,280 | ||||||
Saputo, Inc. | 42,468 | 1,293,928 | ||||||
Unilever plc | 80,210 | 4,247,404 | ||||||
Vietnam Dairy Products JSC | 30,756 | 153,543 | ||||||
17 OPPENHEIMER GLOBAL ALLOCATION FUND
| CONSOLIDATED STATEMENT OF INVESTMENTS Continued | ||
| Shares | Value | |||||||
Food Products (Continued) | ||||||||
WH Group Ltd.3 | 3,411,500 | $ | 2,383,516 | |||||
| 15,830,047 | ||||||||
Household Products—0.6% | ||||||||
Church & Dwight Co., Inc. | 5,990 | 355,626 | ||||||
Colgate-Palmolive Co. | 61,270 | 3,648,629 | ||||||
Reckitt Benckiser Group plc | 56,670 | 4,582,259 | ||||||
| 8,586,514 | ||||||||
Personal Products—0.3% | ||||||||
Amorepacific Corp. | 3,132 | 419,014 | ||||||
AMOREPACIFIC Group | 1,526 | 83,560 | ||||||
Beiersdorf AG | 12,744 | 1,319,125 | ||||||
LG Household & Health Care Ltd. | 2,764 | 2,544,452 | ||||||
| 4,366,151 | ||||||||
Tobacco—0.2% | ||||||||
Philip Morris International, Inc. | 19,490 | 1,716,484 | ||||||
Swedish Match AB | 21,648 | 1,103,572 | ||||||
| 2,820,056 | ||||||||
Energy—4.3% | ||||||||
Energy Equipment & Services—0.4% | ||||||||
TechnipFMC plc | 207,556 | 5,534,310 | ||||||
USA Compression Partners LP4 | 52,922 | 775,307 | ||||||
| 6,309,617 | ||||||||
Oil, Gas & Consumable Fuels—3.9% | ||||||||
Antero Midstream GP LP | 76,780 | 1,236,926 | ||||||
BP plc | 419,410 | 3,038,005 | ||||||
Buckeye Partners LP4 | 64,962 | 2,131,403 | ||||||
Centennial Resource Development, Inc., Cl. A1 | 21,350 | 409,066 | ||||||
CNOOC Ltd. | 932,000 | 1,578,876 | ||||||
Continental Resources, Inc.1 | 9,380 | 494,138 | ||||||
DCP Midstream LP4 | 22,500 | 809,775 | ||||||
Diamondback Energy, Inc. | 5,390 | 605,620 | ||||||
Encana Corp. | 99,760 | 1,021,542 | ||||||
Energy Transfer LP4 | 522,702 | 8,122,789 | ||||||
Enterprise Products Partners LP4 | 181,789 | 4,875,581 | ||||||
EQM Midstream Partners LP4 | 42,555 | 1,953,700 | ||||||
Kunlun Energy Co. Ltd. | 648,000 | 734,280 | ||||||
LUKOIL PJSC, Sponsored ADR | 11,235 | 838,913 | ||||||
Magellan Midstream Partners LP4 | 43,689 | 2,694,738 | ||||||
MPLX LP4 | 101,002 | 3,394,677 | ||||||
Novatek PJSC, Sponsored GDR | 23,900 | 4,041,725 | ||||||
Phillips 66 Partners LP4 | 12,591 | 615,826 | ||||||
Plains All American Pipeline LP4 | 23,444 | 510,376 | ||||||
Plains GP Holdings LP, Cl. A1 | 21,390 | 457,104 | ||||||
Sunoco LP4 | 9,355 | 255,766 | ||||||
18 OPPENHEIMER GLOBAL ALLOCATION FUND
| Shares | Value | |||||||
Oil, Gas & Consumable Fuels (Continued) | ||||||||
Tallgrass Energy LP, Cl. A | 145,015 | $ | 3,155,526 | |||||
Targa Resources Corp. | 43,587 | 2,252,140 | ||||||
TC PipeLines LP4 | 62,300 | 1,915,725 | ||||||
TOTAL SA | 83,460 | 4,898,199 | ||||||
Western Gas Partners LP4 | 19,319 | 764,260 | ||||||
Williams Cos., Inc. (The) | 163,564 | 3,979,512 | ||||||
| 56,786,188 | ||||||||
Financials—6.1% | ||||||||
Capital Markets—1.1% | ||||||||
China International Capital Corp. Ltd., Cl. H3 | 205,200 | 338,287 | ||||||
Credit Suisse Group AG1 | 151,997 | 1,980,952 | ||||||
E*TRADE Financial Corp. | 5,200 | 256,984 | ||||||
Goldman Sachs Group, Inc. (The) | 14,660 | 3,303,924 | ||||||
KKR & Co., Inc., Cl. A | 19,100 | 451,715 | ||||||
MSCI, Inc., Cl. A | 6,470 | 972,959 | ||||||
Raymond James Financial, Inc. | 4,760 | 365,044 | ||||||
S&P Global, Inc. | 31,330 | 5,712,086 | ||||||
UBS Group AG1 | 198,841 | 2,774,519 | ||||||
| 16,156,470 | ||||||||
Commercial Banks—2.0% | ||||||||
Akbank TAS | 156,318 | 185,903 | ||||||
Banco Bilbao Vizcaya Argentaria SA | 153,313 | 846,334 | ||||||
Banco de Chile | 1,094,718 | 151,639 | ||||||
Banco Santander Mexico SA Institucion de Banca Multiple Grupo Financiero Santand, Cl. B | 249,081 | 310,596 | ||||||
Bank Central Asia Tbk PT | 301,500 | 469,478 | ||||||
BDO Unibank, Inc. | 41,560 | 95,041 | ||||||
BNP Paribas SA | 24,630 | 1,284,312 | ||||||
Citigroup, Inc. | 75,170 | 4,920,628 | ||||||
Commercial International Bank Egypt SAE | 123,370 | 552,755 | ||||||
Credicorp Ltd. | 5,330 | 1,203,034 | ||||||
FirstRand Ltd. | 351,208 | 1,526,730 | ||||||
Grupo Aval Acciones y Valores SA, ADR | 83,160 | 584,615 | ||||||
Grupo Financiero Inbursa SAB de CV, Cl. O | 546,218 | 708,007 | ||||||
HSBC Holdings plc | 221,450 | 1,824,360 | ||||||
ICICI Bank Ltd., Sponsored ADR | 547,790 | 5,198,527 | ||||||
Itau Unibanco Holding SA, ADR | 41,660 | 548,662 | ||||||
Kotak Mahindra Bank Ltd. | 172,529 | 2,611,478 | ||||||
Lloyds Banking Group plc | 2,509,720 | 1,834,827 | ||||||
Sberbank of Russia PJSC | 247,537 | 714,367 | ||||||
Siam Commercial Bank PCL (The) | 116,100 | 482,659 | ||||||
Societe Generale SA | 51,050 | 1,875,210 | ||||||
SVB Financial Group1 | 3,450 | 818,443 | ||||||
| 28,747,605 | ||||||||
19 OPPENHEIMER GLOBAL ALLOCATION FUND
| CONSOLIDATED STATEMENT OF INVESTMENTS Continued | ||
| Shares | Value | |||||||
Consumer Finance—0.0% | ||||||||
Cholamandalam Investment & Finance Co. Ltd.
|
| 17,688
|
| $
| 305,023
|
| ||
Diversified Financial Services—0.7% | ||||||||
Ayala Corp. | 19,370 | 332,866 | ||||||
B3 SA-Brasil Bolsa Balcao | 310,400 | 2,213,628 | ||||||
Grupo de Inversiones Suramericana SA | 10,070 | 98,213 | ||||||
Hong Kong Exchanges & Clearing Ltd. | 55,569 | 1,481,790 | ||||||
ING Groep NV | 171,134 | 2,024,676 | ||||||
ORIX Corp. | 181,300 | 2,947,387 | ||||||
| 9,098,560 | ||||||||
Insurance—1.6% | ||||||||
AIA Group Ltd. | 331,600 | 2,522,157 | ||||||
Allianz SE | 18,325 | 3,826,555 | ||||||
Arthur J. Gallagher & Co. | 8,230 | 609,102 | ||||||
Dai-ichi Life Holdings, Inc. | 76,600 | 1,442,042 | ||||||
Japan Post Insurance Co. Ltd. | 58,700 | 1,396,930 | ||||||
Legal & General Group plc | 374,914 | 1,204,191 | ||||||
Progressive Corp. (The) | 16,850 | 1,174,445 | ||||||
Prudential plc | 434,571 | 8,717,494 | ||||||
Samsung Life Insurance Co. Ltd. | 17,719 | 1,434,540 | ||||||
Standard Life Aberdeen plc | 309,006 | 1,067,370 | ||||||
| 23,394,826 | ||||||||
Real Estate Investment Trusts (REITs)—0.1% | ||||||||
Unibail-Rodamco-Westfield
|
| 6,894
|
|
| 1,250,456
|
| ||
Real Estate Management & Development—0.4% | ||||||||
Ayala Land, Inc. | 824,400 | 611,851 | ||||||
CBRE Group, Inc., Cl. A1 | 13,320 | 536,663 | ||||||
DLF Ltd. | 1,573,951 | 3,525,588 | ||||||
Emaar Properties PJSC | 322,727 | 448,775 | ||||||
Oberoi Realty Ltd. | 3,590 | 20,558 | ||||||
SM Prime Holdings, Inc. | 1,077,103 | 680,229 | ||||||
|
| 5,823,664
|
| ||||||
Thrifts & Mortgage Finance—0.2% | ||||||||
Housing Development Finance Corp. Ltd.
|
| 123,395
|
|
| 2,958,415
|
| ||
Health Care—4.5% | ||||||||
Biotechnology—1.5% | ||||||||
ACADIA Pharmaceuticals, Inc.1 | 38,030 | �� | 740,825 | |||||
AnaptysBio, Inc.1 | 11,650 | 870,488 | ||||||
Biocon Ltd. | 69,432 | 618,842 | ||||||
Biogen, Inc.1 | 6,160 | 1,874,303 | ||||||
Bluebird Bio, Inc.1 | 8,570 | 982,979 | ||||||
Blueprint Medicines Corp.1 | 17,740 | 1,078,060 | ||||||
Circassia Pharmaceuticals plc1 | 348,450 | 249,346 | ||||||
CSL Ltd. | 13,604 | 1,824,491 | ||||||
20 OPPENHEIMER GLOBAL ALLOCATION FUND
| Shares | Value | |||||||
Biotechnology (Continued) | ||||||||
Gilead Sciences, Inc. | 23,210 | $ | 1,582,458 | |||||
GlycoMimetics, Inc.1 | 45,980 | 578,428 | ||||||
Grifols SA | 71,961 | 2,052,571 | ||||||
Incyte Corp.1 | 18,150 | 1,176,483 | ||||||
Innovent Biologics, Inc.1,3 | 34,000 | 71,885 | ||||||
Ionis Pharmaceuticals, Inc.1 | 21,250 | 1,052,938 | ||||||
Loxo Oncology, Inc.1 | 9,590 | 1,464,009 | ||||||
MacroGenics, Inc.1 | 45,020 | 741,029 | ||||||
Mirati Therapeutics, Inc.1 | 8,659 | 323,587 | ||||||
Neurocrine Biosciences, Inc.1 | 4,940 | 529,321 | ||||||
Sage Therapeutics, Inc.1 | 14,790 | 1,903,177 | ||||||
Sarepta Therapeutics, Inc.1 | 2,020 | 270,195 | ||||||
Shire plc | 18,800 | 1,124,493 | ||||||
uniQure NV1 | 15,000 | 385,950 | ||||||
Wuxi Biologics Cayman, Inc.1,3 | 50,500 | 361,740 | ||||||
| 21,857,598 | ||||||||
Health Care Equipment & Supplies—1.0% | ||||||||
ABIOMED, Inc.1 | 1,320 | 450,384 | ||||||
Align Technology, Inc.1 | 1,880 | 415,856 | ||||||
Cooper Cos., Inc. (The) | 2,940 | 759,431 | ||||||
DexCom, Inc.1 | 4,180 | 554,979 | ||||||
Edwards Lifesciences Corp.1 | 3,870 | 571,212 | ||||||
EssilorLuxottica SA | 8,384 | 1,146,214 | ||||||
Hoya Corp. | 38,300 | 2,169,111 | ||||||
ICU Medical, Inc.1 | 2,710 | 690,318 | ||||||
IDEXX Laboratories, Inc.1 | 4,410 | 935,449 | ||||||
Insulet Corp.1 | 9,060 | 799,183 | ||||||
Siemens Healthineers AG1,3 | 32,034 | 1,327,331 | ||||||
Sonova Holding AG | 7,096 | 1,157,401 | ||||||
West Pharmaceutical Services, Inc. | 2,730 | 289,162 | ||||||
William Demant Holding AS1 | 35,093 | 1,153,534 | ||||||
Zimmer Biomet Holdings, Inc. | 13,000 | 1,476,670 | ||||||
| 13,896,235 | ||||||||
Health Care Providers & Services—0.8% | ||||||||
Anthem, Inc. | 20,920 | 5,764,925 | ||||||
Apollo Hospitals Enterprise Ltd. | 18,227 | 281,802 | ||||||
Centene Corp.1 | 14,250 | 1,857,060 | ||||||
Encompass Health Corp. | 4,910 | 330,443 | ||||||
Mediclinic International plc | 56,380 | 271,139 | ||||||
Sinopharm Group Co. Ltd., Cl. H | 385,800 | 1,868,922 | ||||||
WellCare Health Plans, Inc.1 | 5,030 | 1,388,230 | ||||||
| 11,762,521 | ||||||||
Health Care Technology—0.0% | ||||||||
Ping An Healthcare & Technology Co. Ltd.1,3 | 6,496 | 31,271 | ||||||
21 OPPENHEIMER GLOBAL ALLOCATION FUND
| CONSOLIDATED STATEMENT OF INVESTMENTS Continued | ||
| Shares | Value | |||||||
Life Sciences Tools & Services—0.6% | ||||||||
Agilent Technologies, Inc. | 51,010 | $ | 3,304,938 | |||||
Bio-Rad Laboratories, Inc., Cl. A1 | 2,720 | 742,152 | ||||||
ICON plc1 | 6,380 | 880,951 | ||||||
IQVIA Holdings, Inc.1 | 3,010 | 370,019 | ||||||
Lonza Group AG1 | 7,017 | 2,200,265 | ||||||
Samsung Biologics Co. Ltd.1,3 | 2,627 | 898,868 | ||||||
| 8,397,193 | ||||||||
Pharmaceuticals—0.6% | ||||||||
Bayer AG | 50,296 | 3,861,534 | ||||||
Dong-E-E-Jiao Co. Ltd., Cl. A | 67,499 | 379,385 | ||||||
Hutchison China MediTech Ltd., ADR1 | 9,630 | 315,575 | ||||||
Jiangsu Hengrui Medicine Co. Ltd., Cl. A | 147,674 | 1,301,610 | ||||||
Novo Nordisk AS, Cl. B | 44,952 | 1,941,456 | ||||||
Roche Holding AG | 6,020 | 1,460,742 | ||||||
| 9,260,302 | ||||||||
Industrials—6.6% | ||||||||
Aerospace & Defense—1.2% | ||||||||
Airbus SE | 127,870 | 14,093,409 | ||||||
HEICO Corp. | 4,360 | 365,499 | ||||||
Rolls-Royce Holdings plc1 | 171,550 | 1,837,596 | ||||||
Textron, Inc. | 11,160 | 598,511 | ||||||
| 16,895,015 | ||||||||
Air Freight & Couriers—0.3% | ||||||||
BEST, Inc., ADR1 | 11,121 | 69,951 | ||||||
United Parcel Service, Inc., Cl. B | 22,950 | 2,445,093 | ||||||
XPO Logistics, Inc.1 | 10,200 | 911,676 | ||||||
ZTO Express Cayman, Inc., ADR | 57,942 | 939,819 | ||||||
| 4,366,539 | ||||||||
Airlines—0.1% | ||||||||
International Consolidated Airlines Group SA | 229,650 | 1,769,552 | ||||||
Building Products—0.3% | ||||||||
Assa Abloy AB, Cl. B | 128,800 | 2,567,588 | ||||||
SMC Corp. | 4,600 | 1,463,212 | ||||||
| 4,030,800 | ||||||||
Commercial Services & Supplies—0.5% | ||||||||
Cintas Corp. | 5,350 | 973,004 | ||||||
Copart, Inc.1 | 15,190 | 742,943 | ||||||
Edenred | 46,620 | 1,766,518 | ||||||
Prosegur Cash SA3 | 292,568 | 579,086 | ||||||
Prosegur Cia de Seguridad SA | 184,640 | 1,025,956 | ||||||
Rentokil Initial plc | 158,850 | 641,277 | ||||||
22 OPPENHEIMER GLOBAL ALLOCATION FUND
| Shares | Value | |||||||
Commercial Services & Supplies (Continued) | ||||||||
Waste Connections, Inc. | 19,230 | $ | 1,469,941 | |||||
| 7,198,725 | ||||||||
Construction & Engineering—0.2% | ||||||||
Boskalis Westminster | 60,157 | 1,734,522 | ||||||
FLSmidth & Co. AS | 23,162 | 1,216,192 | ||||||
| 2,950,714 | ||||||||
Electrical Equipment—0.8% | ||||||||
Legrand SA | 23,140 | 1,512,522 | ||||||
Melrose Industries plc | 323,688 | 696,540 | ||||||
Mitsubishi Electric Corp. | 189,500 | 2,396,675 | ||||||
Nidec Corp. | 50,900 | 6,587,650 | ||||||
| 11,193,387 | ||||||||
Industrial Conglomerates—0.8% | ||||||||
3M Co. | 15,870 | 3,019,426 | ||||||
Jardine Strategic Holdings Ltd. | 42,691 | 1,432,689 | ||||||
Roper Technologies, Inc. | 4,340 | 1,227,786 | ||||||
Seibu Holdings, Inc. | 150,200 | 2,716,627 | ||||||
Siemens AG | 19,650 | 2,264,298 | ||||||
SM Investments Corp. | 89,494 | 1,507,743 | ||||||
| 12,168,569 | ||||||||
Machinery—0.9% | ||||||||
Aalberts Industries NV | 27,547 | 1,011,945 | ||||||
Atlas Copco AB, Cl. A | 45,807 | 1,132,375 | ||||||
Epiroc AB, Cl. A1 | 90,784 | 796,263 | ||||||
FANUC Corp. | 11,800 | 2,050,706 | ||||||
IDEX Corp. | 8,890 | 1,127,430 | ||||||
Komatsu Ltd. | 51,800 | 1,343,176 | ||||||
Kubota Corp. | 98,200 | 1,543,637 | ||||||
Minebea Mitsumi, Inc. | 73,000 | 1,109,913 | ||||||
VAT Group AG1,3 | 13,339 | 1,337,029 | ||||||
Weir Group plc (The) | 42,507 | 861,020 | ||||||
| 12,313,494 | ||||||||
Professional Services—0.9% | ||||||||
Bureau Veritas SA | 59,920 | 1,353,875 | ||||||
CoStar Group, Inc.1 | 3,490 | 1,261,356 | ||||||
Equifax, Inc. | 16,680 | 1,692,019 | ||||||
IHS Markit Ltd.1 | 16,690 | 876,726 | ||||||
Intertek Group plc | 14,260 | 853,738 | ||||||
Recruit Holdings Co. Ltd. | 200,900 | 5,384,346 | ||||||
TransUnion | 19,660 | 1,292,645 | ||||||
| 12,714,705 | ||||||||
Trading Companies & Distributors—0.5% | ||||||||
Brenntag AG | 36,743 | 1,921,074 | ||||||
23 OPPENHEIMER GLOBAL ALLOCATION FUND
| CONSOLIDATED STATEMENT OF INVESTMENTS Continued | ||
| Shares | Value | |||||||
Trading Companies & Distributors (Continued) | ||||||||
Bunzl plc | 75,142 | $ | 2,217,817 | |||||
Ferguson plc | 13,176 | 889,032 | ||||||
ITOCHU Corp. | 111,400 | 2,060,406 | ||||||
SiteOne Landscape Supply, Inc.1 | 5,330 | 362,653 | ||||||
United Rentals, Inc.1 | 2,650 | 318,186 | ||||||
| 7,769,168 | ||||||||
Transportation Infrastructure—0.1% | ||||||||
DP World Ltd. | 67,925 | 1,222,878 | ||||||
Grupo Aeroportuario del Sureste SAB de CV, Cl. B | 33,044 | 549,246 | ||||||
| 1,772,124 | ||||||||
Information Technology—8.6% | ||||||||
Communications Equipment—0.3% | ||||||||
Nokia OYJ | 393,465 | 2,217,550 | ||||||
Palo Alto Networks, Inc.1 | 3,830 | 701,043 | ||||||
Xero Ltd.1 | 33,983 | 970,441 | ||||||
| 3,889,034 | ||||||||
Electronic Equipment, Instruments, & Components—1.7% | ||||||||
CDW Corp. | 12,480 | 1,123,325 | ||||||
FLIR Systems, Inc. | 14,560 | 674,273 | ||||||
Hitachi Ltd. | 60,000 | 1,832,500 | ||||||
Keyence Corp. | 10,400 | 5,066,923 | ||||||
Keysight Technologies, Inc.1 | 7,660 | 437,233 | ||||||
Murata Manufacturing Co. Ltd. | 48,100 | 7,463,678 | ||||||
Omron Corp. | 39,800 | 1,607,808 | ||||||
Samsung Electro-Mechanics Co. Ltd. | 14,210 | 1,483,559 | ||||||
Sunny Optical Technology Group Co. Ltd. | 44,000 | 385,048 | ||||||
TDK Corp. | 54,200 | �� | 4,645,456 | |||||
| 24,719,803 | ||||||||
Internet Software & Services—0.7% | ||||||||
Kakao Corp. | 3,270 | 261,993 | ||||||
NAVER Corp. | 8,348 | 842,492 | ||||||
Scout24 AG3 | 36,793 | 1,527,571 | ||||||
Tencent Holdings Ltd. | 130,185 | 4,412,627 | ||||||
United Internet AG | 26,460 | 1,096,832 | ||||||
Yahoo Japan Corp. | 242,100 | 759,120 | ||||||
Yandex NV, Cl. A1 | 41,361 | 1,246,207 | ||||||
| 10,146,842 | ||||||||
IT Services—1.1% | ||||||||
Amadeus IT Group SA | 17,137 | 1,381,805 | ||||||
Atos SE | 25,440 | 2,177,626 | ||||||
Booz Allen Hamilton Holding Corp., Cl. A | 10,370 | 513,730 | ||||||
Broadridge Financial Solutions, Inc. | 6,350 | 742,569 | ||||||
DXC Technology Co. | 7,870 | 573,172 | ||||||
Earthport plc1 | 1,169,320 | 114,548 | ||||||
24 OPPENHEIMER GLOBAL ALLOCATION FUND
| Shares | Value | |||||||
IT Services (Continued) | ||||||||
EPAM Systems, Inc.1 | 7,350 | $ | 878,104 | |||||
Fiserv, Inc.1 | 10,570 | 838,201 | ||||||
Global Payments, Inc. | 9,470 | 1,081,758 | ||||||
PayPal Holdings, Inc.1 | 44,920 | 3,781,815 | ||||||
Tata Consultancy Services Ltd. | 37,772 | 991,578 | ||||||
Total System Services, Inc. | 16,950 | 1,544,992 | ||||||
Twilio, Inc., Cl. A1 | 4,490 | 337,738 | ||||||
WEX, Inc.1 | 4,910 | 863,963 | ||||||
| 15,821,599 | ||||||||
Semiconductors & Semiconductor Equipment—1.8% | ||||||||
Advanced Micro Devices, Inc.1 | 6,020 | 109,624 | ||||||
ams AG | 29,095 | 1,132,125 | ||||||
ASML Holding NV | 12,632 | 2,160,001 | ||||||
Infineon Technologies AG | 221,693 | 4,444,314 | ||||||
Maxim Integrated Products, Inc. | 84,910 | 4,247,198 | ||||||
Monolithic Power Systems, Inc. | 6,450 | 761,874 | ||||||
Renesas Electronics Corp.1 | 393,000 | 2,070,464 | ||||||
Rohm Co. Ltd. | 15,100 | 1,073,265 | ||||||
STMicroelectronics NV2 | 117,120 | 1,780,672 | ||||||
STMicroelectronics NV2 | 59,550 | 906,947 | ||||||
Taiwan Semiconductor Manufacturing Co. Ltd. | 676,000 | 5,022,433 | ||||||
Taiwan Semiconductor Manufacturing Co. Ltd., Sponsored ADR | 49,860 | 1,899,666 | ||||||
Xilinx, Inc. | 4,860 | 414,898 | ||||||
| 26,023,481 | ||||||||
Software—2.8% | ||||||||
Adobe, Inc.1 | 23,820 | 5,854,003 | ||||||
Atlassian Corp. plc, Cl. A1 | 11,880 | 901,811 | ||||||
Capcom Co. Ltd. | 57,500 | 1,200,865 | ||||||
Dassault Systemes SE | 7,633 | 954,467 | ||||||
Fair Isaac Corp.1 | 2,870 | 553,078 | ||||||
Intuit, Inc. | 26,720 | 5,637,920 | ||||||
Nintendo Co. Ltd. | 20,200 | 6,262,051 | ||||||
PTC, Inc.1 | 8,040 | 662,576 | ||||||
RealPage, Inc.1 | 12,380 | 656,140 | ||||||
RingCentral, Inc., Cl. A1 | 10,340 | 803,728 | ||||||
SAP SE | 107,286 | 11,497,853 | ||||||
ServiceNow, Inc.1 | 6,410 | 1,160,466 | ||||||
Splunk, Inc.1 | 5,860 | 585,062 | ||||||
Synopsys, Inc.1 | 10,900 | 975,877 | ||||||
Temenos AG1 | 17,193 | 2,348,875 | ||||||
Ultimate Software Group, Inc. (The)1 | 1,260 | 335,954 | ||||||
Zendesk, Inc.1 | 10,510 | 577,735 | ||||||
| 40,968,461 | ||||||||
Technology Hardware, Storage & Peripherals—0.2% | ||||||||
Samsung Electronics Co. Ltd. | 71,278 | 2,665,770 | ||||||
25 OPPENHEIMER GLOBAL ALLOCATION FUND
| CONSOLIDATED STATEMENT OF INVESTMENTS Continued | ||
| Shares | Value | |||||||
Materials—1.9% | ||||||||
Chemicals—0.8% | ||||||||
Air Liquide SA | 32,727 | $ | 3,964,330 | |||||
Akzo Nobel NV | 27,557 | 2,317,669 | ||||||
Ashland Global Holdings, Inc. | 4,630 | 342,527 | ||||||
Celanese Corp., Cl. A | 4,590 | 444,954 | ||||||
Essentra plc | 5,155 | 25,146 | ||||||
Ingevity Corp.1 | 3,970 | 361,588 | ||||||
Novozymes AS, Cl. B | 22,159 | 1,094,521 | ||||||
Sika AG | 11,514 | 1,476,311 | ||||||
Westlake Chemical Partners LP4 | 38,992 | 902,665 | ||||||
| 10,929,711 | ||||||||
Construction Materials—0.1% | ||||||||
Dalmia Bharat Ltd.1 | 3,757 | 106,930 | ||||||
Indocement Tunggal Prakarsa Tbk PT | 387,500 | 440,021 | ||||||
James Hardie Industries plc | 54,500 | 726,023 | ||||||
UltraTech Cement Ltd. | 9,837 | 465,592 | ||||||
| 1,738,566 | ||||||||
Containers & Packaging—0.1% | ||||||||
Avery Dennison Corp. | 6,940 | 629,597 | ||||||
CCL Industries, Inc., Cl. B | 36,461 | 1,533,830 | ||||||
| 2,163,427 | ||||||||
Metals & Mining—0.9% | ||||||||
Agnico Eagle Mines Ltd. | 40,640 | 1,437,030 | ||||||
Anglo American plc | 104,795 | 2,241,209 | ||||||
Glencore plc1 | 928,560 | 3,779,620 | ||||||
Grupo Mexico SAB de CV | 425,392 | 981,533 | ||||||
Korea Zinc Co. Ltd. | 1,301 | 434,291 | ||||||
Polyus PJSC, GDR3 | 6,900 | 211,465 | ||||||
Real Gold Mining Ltd.1,5 | 273,000 | — | ||||||
Vale SA, Cl. B, Sponsored ADR | 67,420 | 1,018,042 | ||||||
Wheaton Precious Metals Corp. | 137,790 | 2,263,890 | ||||||
| 12,367,080 | ||||||||
Telecommunication Services—0.9% | ||||||||
Diversified Telecommunication Services—0.5% | ||||||||
Nippon Telegraph & Telephone Corp. | 104,200 | 4,376,071 | ||||||
Spark New Zealand Ltd. | 1,040,318 | 2,687,086 | ||||||
| 7,063,157 | ||||||||
Wireless Telecommunication Services—0.4% | ||||||||
Rogers Communications, Inc., Cl. B | 33,313 | 1,715,438 | ||||||
SK Telecom Co. Ltd. | 16,006 | 3,762,252 | ||||||
SoftBank Group Corp. | 7,800 | 632,412 | ||||||
| 6,110,102 | ||||||||
Total Common Stocks (Cost $717,166,753) | 676,093,038 | |||||||
26 OPPENHEIMER GLOBAL ALLOCATION FUND
| Shares | Value | |||||||||||
Preferred Stock—0.0% | ||||||||||||
Zee Entertainment Enterprises Ltd., 6% Cum. Non-Cv. (Cost $32,853) | 629,697 | $ | 65,401 | |||||||||
| Principal Amount | ||||||||||||
U.S. Government Obligations—5.0% | ||||||||||||
United States Treasury Bonds, 2.875%, 8/15/456,7 | $ | 17,022,000 | 15,479,714 | |||||||||
United States Treasury Nts.: | ||||||||||||
1.625%, 2/15/266,7 | 38,920,000 | 35,231,722 | ||||||||||
2.75%, 2/15/286,7 | 22,488,000 | 21,781,736 | ||||||||||
Total U.S. Government Obligations (Cost $77,964,623) | 72,493,172 | |||||||||||
Foreign Government Obligations—11.1% | ||||||||||||
Belgium—0.4% | ||||||||||||
Kingdom of Belgium, Series 85, 0.80% Sr. Unsec. Nts., 6/22/283,8 | EUR | 5,560,000 | 6,310,248 | |||||||||
Canada—1.4% | ||||||||||||
Canada, 1.00% Bonds, 6/1/27 | CAD | 30,815,000 | 20,749,009 | |||||||||
France—1.9% | ||||||||||||
French Republic, 0.75% Bonds, 5/25/288 | EUR | 23,610,000 | 26,901,701 | |||||||||
Germany—2.5% | ||||||||||||
Bundesrepublik Deutschland Bundesanleihe, 0.50% Bonds, 8/15/278 | EUR | 30,525,000 | 35,281,008 | |||||||||
Italy—1.2% | ||||||||||||
Italian Republic, 2.00% Bonds, 2/1/28 | EUR | 16,990,000 | 17,350,448 | |||||||||
Netherlands—0.4% | ||||||||||||
Kingdom of Netherlands, 0.75% Bonds, 7/15/283,8 | EUR | 5,330,000 | 6,170,666 | |||||||||
Spain—0.9% | ||||||||||||
Kingdom of Spain, 1.40% Sr. Unsec. Nts., 4/30/283,8 | EUR | 11,510,000 | 12,937,109 | |||||||||
United Kingdom—2.4% | ||||||||||||
United Kingdom Gilt, 4.25% Bonds, 12/7/278 | GBP | 21,710,000 | 34,751,864 | |||||||||
Total Foreign Government Obligations (Cost $174,067,553) | 160,452,053 | |||||||||||
Non-Convertible Corporate Bond and Note—0.0% | ||||||||||||
Omnicare, Inc., 4.75% Sr. Unsec. Nts., 12/1/22 (Cost $210,844) | 210,000 | 216,768 | ||||||||||
| Notional | ||||||||||||||||||||||||
| Counter- | Exercise | Expiration | Amount | Contracts | ||||||||||||||||||||
| party | Price | Date | (000’s) | (000’s) | ||||||||||||||||||||
Over-the-Counter Options Purchased—0.1% | ||||||||||||||||||||||||
EUR Currency Put1,11 | BOA | JPY127.500 | 11/7/18 | EUR 200,000 | EUR 140,000 | 444,548 | ||||||||||||||||||
GBP Currency Put1,12 | BOA | JPY145.000 | 11/13/18 | GBP 70,000 | GBP 49,000 | 391,819 | ||||||||||||||||||
27 OPPENHEIMER GLOBAL ALLOCATION FUND
CONSOLIDATED STATEMENT OF INVESTMENTS Continued
| ||
| Notional | ||||||||||||||||||||||||
| Counter- | Exercise | Expiration | Amount | Contracts | ||||||||||||||||||||
| party | Price | Date | (000’s | ) | (000’s | ) | Value | |||||||||||||||||
Over-the-Counter Options Purchased (Continued) | ||||||||||||||||||||||||
TRY Currency Call1 | CITNA-B | TRY4.700 | 11/28/18 | TRY 94,000 | TRY 17,700 | $ | 2,513 | |||||||||||||||||
ZAR Currency Put1,13 | BOA | ZAR14.600 | 11/21/18 | ZAR 1,460,000 | ZAR 1,022,000 | 440,482 | ||||||||||||||||||
Total Over-the-Counter Options Purchased (Cost $821,333) | 1,279,362 |
| Shares | ||||||||||||
Investment Companies—33.7% | ||||||||||||
iShares JP Morgan USD Emerging Markets Bond Exchange Traded Fund | 729,180 | 76,315,978 | ||||||||||
Oppenheimer Institutional Government Money Market Fund, Cl. E, 2.12%9,10 | 27,748,502 | 27,748,502 | ||||||||||
Oppenheimer Master Event-Linked Bond Fund, LLC9 | 10,590,407 | 166,699,869 | ||||||||||
Oppenheimer Russell 1000 Dynamic Multifactor Exchange Traded Fund9 | 7,885,813 | 217,648,439 | ||||||||||
Total Investment Companies (Cost $495,200,020) | 488,412,788 | |||||||||||
Total Investments, at Value (Cost $1,465,463,979) | 96.6% | 1,399,012,582 | ||||||||||
Net Other Assets (Liabilities) | 3.4 | 48,674,318 | ||||||||||
Net Assets | 100.0% | $ | 1,447,686,900 | |||||||||
Footnotes to Consolidated Statement of Investments
1. Non-income producing security.
2. The Fund holds securities which have been issued by the same entity and that trade on separate exchanges.
3. Represents securities sold under Rule 144A, which are exempt from registration under the Securities Act of 1933, as amended. These securities have been determined to be liquid under guidelines established by the Board of Trustees. These securities amount to $34,486,072 or 2.38% of the Fund’s net assets at period end.
4. Security is a Master Limited Partnership.
5. The value of this security was determined using significant unobservable inputs. See Note 3 of the accompanying Consolidated Notes.
6. All or a portion of the security position is held in accounts at a futures clearing merchant and pledged to cover margin requirements on open futures contracts and written options on futures, if applicable. The aggregate market value of such securities is $58,588,371. See Note 6 of the accompanying Consolidated Notes.
7. All or a portion of the security position is held in segregated accounts and pledged to cover margin requirements under certain derivative contracts. The aggregate market value of such securities is $1,547,395. See Note 6 of the accompanying Consolidated Notes.
8. Represents securities sold under Regulation S, which are exempt from registration under the Securities Act of 1933, as amended. These securities may not be offered or sold in the United States without and exemption from, or in a transaction not subject to, the registration requirements of the Securities Act of 1933. These securities amount to $122,352,596 or 8.45% of the Fund’s net assets at period end.
9. Is or was an affiliate, as defined in the Investment Company Act of 1940, as amended, at or during the reporting period, by virtue of the Fund owning at least 5% of the voting securities of the issuer or as a result of the Fund and the issuer having the same investment adviser. Transactions during the reporting period in which the issuer was an affiliate are as follows:
| Shares | Gross | Gross | Shares | |||||||||||||
| October 31, 2017 | Additions | Reductions | October 31, 2018 | |||||||||||||
Investment Company | ||||||||||||||||
Oppenheimer Institutional Government Money Market Fund, Cl. E | 178,062,806 | 979,350,488 | 1,129,664,792 | 27,748,502 | ||||||||||||
28 OPPENHEIMER GLOBAL ALLOCATION FUND
| Footnotes to Consolidated Statement of Investments (Continued) |
| Shares | Gross | Gross | Shares | |||||||||||||
| October 31, 2017 | Additions | Reductions | October 31, 2018 | |||||||||||||
| Oppenheimer Master Event-Linked Bond Fund, LLC | 4,616,016 | 5,974,391 | — | 10,590,407 | ||||||||||||
| Oppenheimer Master Loan Fund, LLC | 7,213,775 | — | 7,213,775 | — | ||||||||||||
| Oppenheimer Russell 1000 Dynamic Multifactor Exchange Traded Fund | — | 8,431,078 | 545,265 | 7,885,813 | ||||||||||||
| Oppenheimer Senior Floating Rate Fund, Cl. I | 4,392,376 | — | 4,392,376 | — | ||||||||||||
| Oppenheimer Ultra-Short Duration Fund, Cl. Y | — | 23,699,827 | 23,699,827 | — | ||||||||||||
| Change in | ||||||||||||||||
| Realized | Unrealized | |||||||||||||||
| Value | Income | Gain (Loss) | Gain (Loss) | |||||||||||||
| ||||||||||||||||
Investment Company | ||||||||||||||||
| Oppenheimer Institutional Government Money Market Fund, Cl. E | $ | 27,748,502 | $ | 904,717 | $ | — | $ | — | ||||||||
| Oppenheimer Master Event-Linked Bond Fund, LLC | 166,699,869 | 9,248,685a | (3,070,198)a | 468,246a | ||||||||||||
| Oppenheimer Master Loan Fund, LLC | — | 426,339b | (838,598)b | 85,021b | ||||||||||||
| Oppenheimer Russell 1000 Dynamic Multifactor Exchange Traded Fund | 217,648,439 | 718,052 | 954,118 | 2,647,632 | ||||||||||||
| Oppenheimer Senior Floating Rate Fund, Cl. I | — | 60,108 | 860,678 | (1,036,373) | ||||||||||||
| Oppenheimer Ultra-Short Duration Fund, Cl. Y | — | 649,372 | (406,010) | — | ||||||||||||
|
| |||||||||||||||
Total | $ | 412,096,810 | $ | 12,007,273 | $ | (2,500,010) | $ | 2,164,526 | ||||||||
|
| |||||||||||||||
a. Represents the amount allocated to the Fund from Oppenheimer Master Event-linked Bond Fund, LLC
b. Represents the amount allocated to the Fund from Oppenheimer Master Loan Fund, LLC.
10. Rate shown is the 7-day yield at period end.
11. Knock-out option becomes ineligible for exercise if at any time spot rates are less than or equal to 124 JPY per 1 EUR
12. Knock-out option becomes ineligible for exercise if at any time spot rates are less than or equal to 139.5 JPY per 1 GBP
13. Knock-out option becomes ineligible for exercise if at any time spot rates are greater than or equal to 15.4 ZAR per 1 USD
Distribution of investments representing geographic holdings, as a percentage of total investments at value, is as follows:
| Geographic Holdings (Unaudited) | Value | Percent | ||||||||||||||
United States | $ | 772,290,270 | 55.2% | |||||||||||||
France | 94,334,355 | 6.7 | ||||||||||||||
United Kingdom | 88,004,021 | 6.3 | ||||||||||||||
Japan | 87,443,105 | 6.3 | ||||||||||||||
29 OPPENHEIMER GLOBAL ALLOCATION FUND
| CONSOLIDATED STATEMENT OF INVESTMENTS Continued | ||
| Geographic Holdings (Unaudited) (Continued) | Value | Percent | ||||||||||||||
Germany | $ | 78,983,206 | 5.6% | |||||||||||||
China | 38,234,765 | 2.7 | ||||||||||||||
Canada | 34,262,150 | 2.5 | ||||||||||||||
Switzerland | 25,441,486 | 1.8 | ||||||||||||||
Spain | 23,389,761 | 1.7 | ||||||||||||||
India | 20,006,637 | 1.4 | ||||||||||||||
Italy | 18,864,579 | 1.3 | ||||||||||||||
Netherlands | 17,088,936 | 1.2 | ||||||||||||||
South Korea | 16,022,116 | 1.1 | ||||||||||||||
Hong Kong | 9,179,582 | 0.7 | ||||||||||||||
Russia | 7,052,676 | 0.5 | ||||||||||||||
Taiwan | 6,922,099 | 0.5 | ||||||||||||||
Belgium | 6,310,248 | 0.5 | ||||||||||||||
Brazil | 6,097,751 | 0.4 | ||||||||||||||
South Africa | 5,718,381 | 0.4 | ||||||||||||||
Sweden | 5,599,798 | 0.4 | ||||||||||||||
Denmark | 5,405,703 | 0.4 | ||||||||||||||
Mexico | 4,686,190 | 0.3 | ||||||||||||||
Philippines | 3,923,858 | 0.3 | ||||||||||||||
New Zealand | 3,657,526 | 0.3 | ||||||||||||||
Australia | 2,726,302 | 0.2 | ||||||||||||||
Finland | 2,217,550 | 0.2 | ||||||||||||||
Luxembourg | 2,209,640 | 0.2 | ||||||||||||||
Ireland | 1,850,516 | 0.1 | ||||||||||||||
United Arab Emirates | 1,671,652 | 0.1 | ||||||||||||||
Thailand | 1,585,453 | 0.1 | ||||||||||||||
Peru | 1,203,034 | 0.1 | ||||||||||||||
Austria | 1,132,124 | 0.1 | ||||||||||||||
Indonesia | 909,499 | 0.1 | ||||||||||||||
Turkey | 757,446 | 0.1 | ||||||||||||||
Chile | 733,174 | 0.1 | ||||||||||||||
Colombia | 682,828 | 0.1 | ||||||||||||||
Malaysia | 651,962 | 0.0 | ||||||||||||||
Argentina | 611,358 | 0.0 | ||||||||||||||
Egypt | 552,755 | 0.0 | ||||||||||||||
Eurozone | 444,547 | 0.0 | ||||||||||||||
Vietnam | 153,543 | 0.0 | ||||||||||||||
|
| |||||||||||||||
Total | $ | 1,399,012,582 | 100.0% | |||||||||||||
|
| |||||||||||||||
Forward Currency Exchange Contracts as of October 31, 2018 |
| |||||||||||||||||||||||
Counter -party | Settlement Month(s) | Currency Purchased (000’s) | Currency Sold (000’s) | Unrealized Appreciation | Unrealized Depreciation | |||||||||||||||||||
BAC | 04/2019 | BRL | 1,220 | USD | 286 | $ | 36,945 | $ | — | |||||||||||||||
BAC | 01/2019 | CHF | 15,595 | USD | 16,445 | — | 832,126 | |||||||||||||||||
BAC | 01/2019 | MYR | 9,760 | USD | 2,360 | — | 29,924 | |||||||||||||||||
BAC | 01/2019 | THB | 79,000 | USD | 2,444 | — | 53,859 | |||||||||||||||||
BAC | 01/2019 | TRY | 13,970 | USD | 2,174 | 211,595 | — | |||||||||||||||||
BAC | 01/2019 | USD | 646 | ARS | 26,980 | — | 35,269 | |||||||||||||||||
BAC | 01/2019 | USD | 1,421 | CLP | 944,800 | 61,729 | — | |||||||||||||||||
BOA | 11/2018 | BRL | 24,780 | USD | 6,191 | 464,624 | — | |||||||||||||||||
30 OPPENHEIMER GLOBAL ALLOCATION FUND
Forward Currency Exchange Contracts (Continued) |
| |||||||||||||||||||||||
Counter -party | Settlement Month(s) | Currency Purchased (000’s) | Currency Sold (000’s) | Unrealized Appreciation | Unrealized Depreciation | |||||||||||||||||||
BOA | 02/2019 | EUR | 885 | USD | 1,021 | $ | — | $ | 8,853 | |||||||||||||||
BOA | 11/2018 | JPY | 1,561,000 | USD | 13,981 | — | 132,695 | |||||||||||||||||
BOA | 11/2018 | USD | 6,665 | BRL | 24,780 | 9,566 | — | |||||||||||||||||
BOA | 01/2019 | USD | 4,924 | IDR | 74,413,000 | 99,415 | — | |||||||||||||||||
BOA | 01/2019 | USD | 8,554 | INR | 628,000 | 161,321 | — | |||||||||||||||||
BOA | 11/2018 | USD | 14,165 | JPY | 1,561,000 | 316,971 | — | |||||||||||||||||
CITNA-B | 01/2019 | AUD | 23,132 | USD | 16,847 | — | 451,149 | |||||||||||||||||
CITNA-B | 11/2018 -12/2018 | BRL | 34,660 | USD | 9,318 | — | 15,757 | |||||||||||||||||
CITNA-B | 01/2019 | CAD | 15,230 | USD | 11,816 | — | 227,775 | |||||||||||||||||
CITNA-B | 01/2019 | DKK | 19,750 | USD | 3,126 | — | 104,426 | |||||||||||||||||
CITNA-B | 01/2019 | GBP | 1,114 | USD | 1,465 | — | 35,069 | |||||||||||||||||
CITNA-B | 01/2019 | HUF | 92,000 | USD | 336 | — | 13,246 | |||||||||||||||||
CITNA-B | 01/2019 | NOK | 18,230 | USD | 2,246 | — | 75,053 | |||||||||||||||||
CITNA-B | 01/2019 | PLN | 7,170 | USD | 1,962 | — | 88,879 | |||||||||||||||||
CITNA-B | 01/2019 | SEK | 21,020 | USD | 2,415 | — | 100,538 | |||||||||||||||||
CITNA-B | 11/2018 - 04/2019 | USD | 6,666 | BRL | 26,000 | 23,099 | 336,395 | |||||||||||||||||
CITNA-B | 01/2019 | USD | 14,014 | CHF | 13,510 | 488,480 | — | |||||||||||||||||
CITNA-B | 01/2019 | USD | 3,421 | DKK | 21,515 | 129,098 | — | |||||||||||||||||
CITNA-B | 01/2019 | USD | 1,789 | TRY | 11,970 | — | 255,300 | |||||||||||||||||
DEU | 01/2019 | JPY | 9,250,000 | USD | 82,632 | — | 75,344 | |||||||||||||||||
DEU | 01/2019 | USD | 21,350 | CAD | 27,520 | 410,881 | — | |||||||||||||||||
DEU | 01/2019 | USD | 161,194 | EUR | 135,985 | 6,038,699 | — | |||||||||||||||||
DEU | 01/2019 | USD | 7,434 | JPY | 833,000 | — | 274 | |||||||||||||||||
GSCO-OT | 01/2019 | CLP | 2,079,000 | USD | 3,153 | — | 162,719 | |||||||||||||||||
GSCO-OT | 01/2019 | INR | 189,000 | USD | 2,567 | — | 41,732 | |||||||||||||||||
GSCO-OT | 06/2019 | USD | 2,358 | RUB | 152,470 | 104,245 | — | |||||||||||||||||
HSBC | 01/2019 | ILS | 6,010 | USD | 1,697 | — | 70,813 | |||||||||||||||||
HSBC | 01/2019 | USD | 1,929 | CNH | 13,280 | 32,281 | — | |||||||||||||||||
HSBC | 02/2019 | USD | 1,025 | EUR | 885 | 12,697 | — | |||||||||||||||||
HSBC | 01/2019 | USD | 40,086 | GBP | 30,460 | 988,173 | — | |||||||||||||||||
HSBC | 01/2019 | USD | 3,044 | HKD | 23,760 | 8,490 | — | |||||||||||||||||
HSBC | 01/2019 | USD | 91,565 | JPY | 10,215,000 | 395,812 | — | |||||||||||||||||
HSBC | 01/2019 | USD | 524 | KRW | 583,000 | 12,289 | — | |||||||||||||||||
HSBC | 01/2019 | USD | 209 | MXN | 4,000 | 14,623 | — | |||||||||||||||||
HSBC | 01/2019 | USD | 1,456 | NZD | 2,180 | 32,073 | — | |||||||||||||||||
HSBC | 01/2019 | USD | 3,174 | PHP | 174,000 | — | 68,912 | |||||||||||||||||
HSBC | 01/2019 | USD | 1,564 | RON | 6,215 | 56,134 | — | |||||||||||||||||
JPM | 12/2018 | BRL | 2,500 | USD | 595 | 75,120 | — | |||||||||||||||||
JPM | 01/2019 | IDR | 126,194,000 | USD | 8,319 | — | 137,220 | |||||||||||||||||
JPM | 06/2019 | RUB | 152,470 | USD | 2,188 | 66,024 | — | |||||||||||||||||
JPM | 01/2019 | SGD | 5,290 | USD | 3,885 | — | 58,935 | |||||||||||||||||
JPM | 01/2019 | TWD | 285,000 | USD | 9,396 | — | 133,417 | |||||||||||||||||
JPM | 12/2018 | USD | 662 | BRL | 2,500 | — | 7,763 | |||||||||||||||||
JPM | 01/2019 | USD | 15,593 | EUR | 13,215 | 514,624 | — | |||||||||||||||||
JPM | 01/2019 | USD | 1,535 | PEN | 5,080 | 32,604 | — | |||||||||||||||||
JPM | 01/2019 | USD | 817 | RUB | 55,000 | — | 10,729 | |||||||||||||||||
JPM | 01/2019 | ZAR | 87,980 | USD | 6,179 | — | 273,679 | |||||||||||||||||
|
| |||||||||||||||||||||||
Total Unrealized Appreciation and Depreciation | $ | 10,797,612 | $ | 3,837,850 | ||||||||||||||||||||
|
| |||||||||||||||||||||||
31 OPPENHEIMER GLOBAL ALLOCATION FUND
| CONSOLIDATED STATEMENT OF INVESTMENTS Continued | ||
Futures Contracts as of October 31, 2018 |
| |||||||||||||||||||||||
| Description | Buy/Sell | Expiration Date | Number of Contracts | Notional Amount (000’s) | Value | Unrealized Appreciation/ (Depreciation) | ||||||||||||||||||
Canadian Bonds, 10 yr. | Buy | 12/18/18 | 119 | CAD 12,152 | $ | 11,945,649 | $ | (206,282) | ||||||||||||||||
Euro-BUND | Buy | 12/6/18 | 161 | EUR 29,278 | 29,224,475 | (53,064) | ||||||||||||||||||
Japanese Bonds, 10 yr. | Buy | 12/13/18 | 83 | JPY 110,430 | 110,801,524 | 371,157 | ||||||||||||||||||
Long Gilt | Buy | 12/27/18 | 169 | GBP 26,419 | 26,442,493 | 23,556 | ||||||||||||||||||
MSCI Emerging | ||||||||||||||||||||||||
Market Index | Sell | 12/21/18 | 886 | USD 45,423 | 42,381,810 | 3,040,956 | ||||||||||||||||||
Nikkei 225 Index | Sell | 12/13/18 | 122 | JPY 24,198 | 23,657,199 | 540,317 | ||||||||||||||||||
S&P 500 E-Mini | ||||||||||||||||||||||||
Index | Buy | 12/21/18 | 1,782 | USD 249,408 | 241,550,100 | (7,858,147) | ||||||||||||||||||
S&P/TSX 60 Index | Buy | 12/20/18 | 68 | CAD 9,811 | 9,237,814 | (573,662) | ||||||||||||||||||
SPI 200 Index | Buy | 12/20/18 | 151 | AUD 16,502 | 15,499,597 | (1,002,731) | ||||||||||||||||||
Stoxx Europe 600 | ||||||||||||||||||||||||
Index | Sell | 12/21/18 | 7,302 | EUR 156,917 | 149,119,096 | 7,798,277 | ||||||||||||||||||
United States | ||||||||||||||||||||||||
Treasury Nts., 10 yr. | Buy | 12/19/18 | 536 | USD 64,240 | 63,482,500 | (757,299) | ||||||||||||||||||
United States | ||||||||||||||||||||||||
Treasury Nts., 5 yr. | Buy | 12/31/18 | 1,718 | USD 194,556 | 193,073,673 | (1,482,717) | ||||||||||||||||||
|
| |||||||||||||||||||||||
| $ | (159,639) | |||||||||||||||||||||||
|
| |||||||||||||||||||||||
Over-the-Counter Options Written at October 31, 2018 |
| |||||||||||||||||||||||||||
| Description | Counter -party | Exercise Price | Expiration Date | Number of Contracts (000’s) | Notional Amount (000’s) | Premiums Received | Value | |||||||||||||||||||||
| ||||||||||||||||||||||||||||
| TRY | TRY | |||||||||||||||||||||||||||
TRY Currency Call | CITNA-B | 4.400 | 11/28/18 | (24,850 | ) | TRY 132,000 | $ | 40,147 | $ | (2,982) | ||||||||||||||||||
Centrally Cleared Credit Default Swaps at October 31, 2018 |
| |||||||||||||||||||||||||||
| Reference Asset | Buy/Sell Protection | Fixed Rate | Maturity Date | Notional Amount (000’s) | Premiums Received/ (Paid) | Value | Unrealized Appreciation/ (Depreciation) | |||||||||||||||||||||
CDX.HY.30 | Buy | 5.000% | 6/20/23 | USD 50,950 | $ | 3,741,230 | $ | (3,398,885 | ) | $ | 342,345 | |||||||||||||||||
CDX.IG.31 | Buy | 1.000 | 12/20/23 | USD 50,950 | 936,226 | (823,319 | ) | 112,907 | ||||||||||||||||||||
|
| |||||||||||||||||||||||||||
Total Centrally Cleared Credit Default Swaps |
| $ | 4,677,456 | $ | (4,222,204 | ) | $ | 455,252 | ||||||||||||||||||||
|
| |||||||||||||||||||||||||||
Over-the-Counter Total Return Swaps at October 31, 2018 |
| |||||||||||||||||||||||||||
| Reference Asset | Counter- party | Pay/Receive Total Return* | Floating Rate | Maturity Date | Notional (000’s) | Value | Unrealized Appreciation/ (Depreciation) | |||||||||||||||||||||
Russell 1000 | One-Month USD | |||||||||||||||||||||||||||
Growth Total | BBA LIBOR Plus | |||||||||||||||||||||||||||
Return Index | JPM | Pay | 51 bps | 4/16/19 | USD 50,204 | $ | 420,588 | $ | 420,588 | |||||||||||||||||||
32 OPPENHEIMER GLOBAL ALLOCATION FUND
Over-the-Counter Total Return Swaps (Continued) |
| |||||||||||||||||||||||||||
Reference Asset
| Counter-
| Pay/Receive
| Floating Rate
| Maturity
| Notional
| Value
| Unrealized (Depreciation)
| |||||||||||||||||||||
Russell Midcap | One-Month USD | |||||||||||||||||||||||||||
Growth Total | BBA LIBOR Plus | |||||||||||||||||||||||||||
Return Index | JPM | Pay | 43 bps | 4/16/19 | USD 67,860 | $ | (45,193) | $ | (45,193) | |||||||||||||||||||
|
| |||||||||||||||||||||||||||
Total Over-the-Counter Total Return Swaps | $ | 375,395 | $ | 375,395 | ||||||||||||||||||||||||
|
| |||||||||||||||||||||||||||
* Fund will pay or receive the total return of the reference asset depending on whether the return is positive or negative. For contracts where the Fund has elected to receive the total return of the reference asset if positive, it will be responsible for paying the floating rate and the total return of the reference asset if negative. If the Fund has elected to pay the total return of the reference asset if positive, it will receive the floating rate and the total return of the reference asset if negative.
Glossary: | ||
Counterparty Abbreviations | ||
BAC | Barclays Bank plc | |
BOA | Bank of America NA | |
CITNA-B | Citibank NA | |
DEU | Deutsche Bank AG | |
GSCO-OT | Goldman Sachs Bank USA | |
HSBC | HSBC Bank USA NA | |
JPM | JPMorgan Chase Bank NA | |
| Currency abbreviations indicate amounts reporting in currencies | ||
ARS | Argentine Peso | |
AUD | Australian Dollar | |
BRL | Brazilian Real | |
CAD | Canadian Dollar | |
CHF | Swiss Franc | |
CLP | Chilean Peso | |
CNH | Offshore Chinese Renminbi | |
DKK | Danish Krone | |
EUR | Euro | |
GBP | British Pound Sterling | |
HKD | Hong Kong Dollar | |
HUF | Hungarian Forint | |
IDR | Indonesian Rupiah | |
ILS | Israeli Shekel | |
INR | Indian Rupee | |
JPY | Japanese Yen | |
KRW | South Korean Won | |
MXN | Mexican Nuevo Peso | |
MYR | Malaysian Ringgit | |
NOK | Norwegian Krone | |
NZD | New Zealand Dollar | |
PEN | Peruvian New Sol | |
PHP | Philippine Peso | |
PLN | Polish Zloty | |
RON | New Romanian Leu | |
33 OPPENHEIMER GLOBAL ALLOCATION FUND
| CONSOLIDATED STATEMENT OF INVESTMENTS Continued | ||
Currency abbreviations indicate amounts reporting in currencies (Continued) | ||
| RUB | Russian Ruble | |
| SEK | Swedish Krona | |
| SGD | Singapore Dollar | |
| THB | Thailand Baht | |
| TRY | New Turkish Lira | |
| TWD | New Taiwan Dollar | |
| ZAR | South African Rand | |
Definitions | ||
| BBA LIBOR | British Bankers’ Association London - Interbank Offered Rate | |
| BUND | German Federal Obligation | |
| CDX.HY.30 | Markit CDX High Yield Index | |
| CDX.IG.31 | Markit CDX Investment Grade Index | |
| MSCI | Morgan Stanley Capital International | |
| NIKKEI 225 | 225 top-rated Japanese Companies listed on the Tokyo Stock Exchange | |
| S&P | Standard & Poor’s | |
| TSX 60 | 60 largest companies on the Toronto Stock Exchange | |
See accompanying Notes to Consolidated Financial Statements.
34 OPPENHEIMER GLOBAL ALLOCATION FUND
ASSETS AND LIABILITIES October 31, 2018 |
Assets | ||||||
Investments, at value—see accompanying consolidated statement of investments: | ||||||
Unaffiliated companies (cost $1,048,762,956) | $ 986,915,772 | |||||
Affiliated companies (cost $416,701,023) | 412,096,810 | |||||
|
| |||||
| 1,399,012,582 | ||||||
Cash | 34,441,455 | |||||
Cash—foreign currencies (cost $1,099,053) | 1,092,993 | |||||
Cash used for collateral on futures | 4,962,000 | |||||
Cash used for collateral on centrally cleared swaps | 6,043,377 | |||||
Unrealized appreciation on forward currency exchange contracts | 10,797,612 | |||||
Swaps, at value | 420,588 | |||||
Receivables and other assets: | ||||||
Interest and dividends | 3,277,817 | |||||
Investments sold | 2,820,974 | |||||
Variation margin receivable | 2,446,968 | |||||
Shares of beneficial interest sold | 330,855 | |||||
Other | 425,351 | |||||
|
| |||||
Total assets
| 1,466,072,572 | |||||
Liabilities | ||||||
Unrealized depreciation on forward currency exchange contracts | 3,837,850 | |||||
Options written, at value (premiums received $40,147) | 2,982 | |||||
Swaps, at value | 45,193 | |||||
Centrally cleared swaps, at value (premiums received $4,677,456) | 4,222,204 | |||||
Payables and other liabilities: | ||||||
Variation margin payable | 4,034,623 | |||||
Investments purchased | 3,774,482 | |||||
Shares of beneficial interest redeemed | 1,452,809 | |||||
Trustees’ compensation | 437,822 | |||||
Distribution and service plan fees | 282,694 | |||||
Foreign capital gains tax | 56,454 | |||||
Shareholder communications | 22,000 | |||||
Other | 216,559 | |||||
|
| |||||
Total liabilities
|
| 18,385,672
|
| |||
Net Assets | $ 1,447,686,900 | |||||
|
| |||||
Composition of Net Assets | ||||||
Par value of shares of beneficial interest | $ 789,486 | |||||
Additional paid-in capital | 1,408,350,260 | |||||
Total distributable earnings | 38,547,154 | |||||
|
| |||||
Net Assets | $ 1,447,686,900 | |||||
|
| |||||
35 OPPENHEIMER GLOBAL ALLOCATION FUND
CONSOLIDATED STATEMENT OF ASSETS AND LIABILITIES Continued |
Net Asset Value Per Share | ||||
Class A Shares: | ||||
| Net asset value and redemption price per share (based on net assets of $1,050,081,528 and 56,815,947 shares of beneficial interest outstanding) | $ | 18.48 | ||
Maximum offering price per share (net asset value plus sales charge of 5.75% of offering price)
| $
| 19.61
|
| |
Class C Shares: | ||||
Net asset value, redemption price (excludes applicable contingent deferred sales charge) and offering price per share (based on net assets of $209,903,334 and 11,934,753 shares of beneficial interest outstanding)
| $
| 17.59
|
| |
Class I Shares: | ||||
Net asset value, redemption price and offering price per share (based on net assets of $33,299,601 and 1,798,746 shares of beneficial interest outstanding)
| $
| 18.51
|
| |
Class R Shares: | ||||
Net asset value, redemption price (excludes applicable contingent deferred sales charge) and offering price per share (based on net assets of $39,909,146 and 2,205,497 shares of beneficial interest outstanding)
| $
| 18.10
|
| |
Class Y Shares: | ||||
| Net asset value, redemption price and offering price per share (based on net assets of $114,493,291 and 6,193,631 shares of beneficial interest outstanding) | $ | 18.49 | ||
See accompanying Notes to Consolidated Financial Statements.
36 OPPENHEIMER GLOBAL ALLOCATION FUND
OPERATIONS For the Year Ended October 31, 2018 |
Allocation of Income and Expenses from Master Funds1 | ||||||
Net investment income allocated from Oppenheimer Master Event-Linked Bond Fund, LLC: | ||||||
Interest | $ 9,171,648 | |||||
Dividends | 77,037 | |||||
Net expenses | (569,292 | ) | ||||
|
| |||||
Net investment income allocated from Oppenheimer Master Event-Linked Bond Fund, LLC |
| 8,679,393
|
| |||
Net investment income allocated from Oppenheimer Master Loan Fund, LLC: | ||||||
Interest | 420,670 | |||||
Dividends | 5,669 | |||||
Net expenses | (18,381 | ) | ||||
|
| |||||
Net investment income allocated from Oppenheimer Master Loan Fund, LLC |
| 407,958
|
| |||
|
| |||||
Total allocation of net investment income from master funds |
| 9,087,351
|
| |||
Investment Income | ||||||
Dividends: | ||||||
Unaffiliated companies (net of foreign withholding taxes of $1,508,248) | 17,454,748 | |||||
Affiliated companies | 2,332,249 | |||||
Interest (net of foreign withholding taxes of $124,524) | 8,148,350 | |||||
|
| |||||
Total investment income |
| 27,935,347
|
| |||
Expenses | ||||||
Management fees | 12,952,620 | |||||
Distribution and service plan fees: | ||||||
Class A | 2,830,696 | |||||
Class B2 | 20,599 | |||||
Class C | 2,361,675 | |||||
Class R | 214,397 | |||||
Transfer and shareholder servicing agent fees: | ||||||
Class A | 2,336,885 | |||||
Class B2 | 4,304 | |||||
Class C | 472,695 | |||||
Class I | 9,901 | |||||
Class R | 87,146 | |||||
Class Y | 265,960 | |||||
Shareholder communications: | ||||||
Class A | 69,787 | |||||
Class B2 | 1,843 | |||||
Class C | 11,305 | |||||
Class I | 559 | |||||
Class R | 2,391 | |||||
Class Y | 4,551 | |||||
Custodian fees and expenses | 257,077 | |||||
Borrowing fees | 53,801 | |||||
Trustees’ compensation | 37,736 | |||||
Other | 334,499 | |||||
|
| |||||
Total expenses | 22,330,427 | |||||
37 OPPENHEIMER GLOBAL ALLOCATION FUND
CONSOLIDATED STATEMENT OF OPERATIONS Continued |
Expenses (Continued) | ||||||
Less reduction to custodian expenses | $ (1,779 | ) | ||||
Less waivers and reimbursements of expenses | (1,100,011 | ) | ||||
|
| |||||
Net expenses |
| 21,228,637
|
| |||
Net Investment Income |
| 15,794,061
|
| |||
Realized and Unrealized Gain (Loss) | ||||||
Net realized gain (loss) on: | ||||||
Investment transactions in: | ||||||
Unaffiliated companies (net of foreign capital gains tax of $90,462) | 96,429,391 | |||||
Affiliated companies | 1,408,786 | |||||
Option contracts written | (103,313 | ) | ||||
Futures contracts | 881,678 | |||||
Foreign currency transactions | (276,111 | ) | ||||
Forward currency exchange contracts | (571,034 | ) | ||||
Swap contracts | (3,217,400 | ) | ||||
Swaption contracts written | 28,894 | |||||
Net realized loss allocated from: | ||||||
Oppenheimer Master Event-Linked Bond Fund, LLC | (3,070,198 | ) | ||||
Oppenheimer Master Loan Fund, LLC | (838,598 | ) | ||||
|
| |||||
Net realized gain | 90,672,095 | |||||
Net change in unrealized appreciation/(depreciation) on: | ||||||
Investment transactions in: | ||||||
Unaffiliated companies | (197,879,165 | ) | ||||
Affiliated companies | 1,611,259 | |||||
Translation of assets and liabilities denominated in foreign currencies | (79,845 | ) | ||||
Forward currency exchange contracts | 7,227,109 | |||||
Futures contracts | 1,687,478 | |||||
Option contracts written | 33,618 | |||||
Swap contracts | 895,983 | |||||
Swaption contracts written | (6 | ) | ||||
Net change in unrealized appreciation/(depreciation) allocated from: | ||||||
Oppenheimer Master Event-Linked Bond Fund, LLC | 468,246 | |||||
Oppenheimer Master Loan Fund, LLC | 85,021 | |||||
|
| |||||
Net change in unrealized appreciation/(depreciation) |
| (185,950,302
| )
| |||
Net Decrease in Net Assets Resulting from Operations | $ (79,484,146 | ) | ||||
|
| |||||
1. The Fund invests in certain affiliated mutual funds that expect to be treated as partnerships for tax purposes. See Note 4 of the accompanying Consolidated Notes.
2. Effective June 1, 2018, all Class B shares converted to Class A shares.
See accompanying Notes to Consolidated Financial Statements.
38 OPPENHEIMER GLOBAL ALLOCATION FUND
| CONSOLIDATED STATEMENTS OF CHANGES IN NET ASSETS | ||
| Year Ended October 31, 2018 | Year Ended October 31, 20171 | |||||||
Operations | ||||||||
Net investment income | $ | 15,794,061 | $ | 21,764,631 | ||||
Net realized gain | 90,672,095 | 100,694,996 | ||||||
Net change in unrealized appreciation/(depreciation) | (185,950,302 | ) | 62,492,163 | |||||
|
| |||||||
Net increase (decrease) in net assets resulting from operations |
| (79,484,146
| )
|
| 184,951,790
|
| ||
Dividends and/or Distributions to Shareholders | ||||||||
Dividends and distributions declared: | ||||||||
Class A | (155,726 | ) | (31,957,138 | ) | ||||
Class B2 | — | (409,300 | ) | |||||
Class C | — | (6,145,060 | ) | |||||
Class I | (71,643 | ) | (744,944 | ) | ||||
Class R | — | (1,026,798 | ) | |||||
Class Y | (214,639 | ) | (2,079,058 | ) | ||||
|
| |||||||
Total dividends and distributions declared
|
| (442,008
| )
|
| (42,362,298
| )
| ||
Beneficial Interest Transactions | ||||||||
Net increase (decrease) in net assets resulting from beneficial interest transactions: | ||||||||
Class A | (86,572,720 | ) | (53,432,818 | ) | ||||
Class B2 | (7,337,776 | ) | (12,049,760 | ) | ||||
Class C | (14,053,128 | ) | (22,478,232 | ) | ||||
Class I | 6,986,325 | 2,304,081 | ||||||
Class R | (681,442 | ) | 1,975,345 | |||||
Class Y | (140,354 | ) | 52,486,258 | |||||
|
| |||||||
Total beneficial interest transactions
|
| (101,799,095
| )
|
| (31,195,126
| )
| ||
Net Assets | ||||||||
Total increase (decrease) | (181,725,249 | ) | 111,394,366 | |||||
Beginning of period | 1,629,412,149 | 1,518,017,783 | ||||||
|
| |||||||
End of period | $ | 1,447,686,900 | $ | 1,629,412,149 | ||||
|
| |||||||
1. Prior period amounts have been conformed to current year presentation. See Notes to Consolidated Financial Statements, Note 2– New Accounting Pronouncements for further details.
2. Effective June 1, 2018, all Class B shares converted to Class A shares.
See accompanying Notes to Consolidated Financial Statements.
39 OPPENHEIMER GLOBAL ALLOCATION FUND
| CONSOLIDATED FINANCIAL HIGHLIGHTS | ||
| Class A | Year Ended October 31, 2018 | Year Ended October 31, 2017 | Year Ended October 31, 2016 | Year Ended October 30, 20151 | Year Ended October 31, 2014 | |||||
| ||||||||||
Per Share Operating Data | ||||||||||
Net asset value, beginning of period | $19.48 | $17.77 | $17.58 | $17.43 | $17.27 | |||||
Income (loss) from investment operations: | ||||||||||
Net investment income2 | 0.21 | 0.28 | 0.23 | 0.24 | 0.27 | |||||
Net realized and unrealized gain (loss) | (1.21) | 1.94 | 0.23 | 0.15 | 0.21 | |||||
| ||||||||||
Total from investment operations | (1.00) | 2.22 | 0.46 | 0.39 | 0.48 | |||||
| ||||||||||
Dividends and/or distributions to shareholders: | ||||||||||
Dividends from net investment income | (0.00)3 | (0.51) | (0.27) | (0.24) | (0.32) | |||||
| ||||||||||
Net asset value, end of period | $18.48 | $19.48 | $17.77 | $17.58 | $17.43 | |||||
| ||||||||||
| ||||||||||
Total Return, at Net Asset Value4 | (5.12)% | 12.84% | 2.72% | 2.26% | 2.85% | |||||
| ||||||||||
Ratios/Supplemental Data | ||||||||||
Net assets, end of period (in thousands) | $1,050,082 | $1,193,012 | $1,139,315 | $1,203,181 | $1,279,187 | |||||
| ||||||||||
Average net assets (in thousands) | $1,172,491 | $1,157,102 | $1,150,095 | $1,247,197 | $1,336,323 | |||||
| ||||||||||
Ratios to average net assets:5,6 | ||||||||||
Net investment income | 1.06% | 1.51% | 1.33% | 1.39% | 1.58% | |||||
Expenses excluding specific expenses listed below | 1.32% | 1.34% | 1.34% | 1.33% | 1.37% | |||||
Interest and fees from borrowings | 0.00%7 | 0.00%7 | 0.00%7 | 0.00%7 | 0.00% | |||||
| ||||||||||
Total expenses8 | 1.32% | 1.34% | 1.34% | 1.33% | 1.37% | |||||
| Expenses after payments, waivers and/or reimbursements and reduction to custodian expenses | 1.25% | 1.27% | 1.28% | 1.28% | 1.30% | |||||
| ||||||||||
Portfolio turnover rate | 151% | 40% | 84% | 83% | 43% | |||||
1. Represents the last business day of the Fund’s reporting period.
2. Per share amounts calculated based on the average shares outstanding during the period.
3. Less than $0.005.
4. Assumes an initial investment on the business day before the first day of the fiscal period, with all dividends and distributions reinvested in additional shares on the reinvestment date, and redemption at the net asset value calculated on the last business day of the fiscal period. Sales charges are not reflected in the total returns. Total returns are not annualized for periods less than one full year. Returns do not reflect the deduction of taxes that a shareholder would pay on fund distributions or the redemption of fund shares.
5. Annualized for periods less than one full year.
6. Includes the Fund’s share of the allocated expenses and/or net investment income from the master funds.
7. Less than 0.005%.
8. Total expenses including indirect expenses from affiliated fund fees and expenses were as follows:
Year Ended October 31, 2018 | 1.34 | % | ||||||||||
Year Ended October 31, 2017 | 1.36 | % | ||||||||||
Year Ended October 31, 2016 | 1.35 | % | ||||||||||
Year Ended October 30, 2015 | 1.33 | % | ||||||||||
Year Ended October 31, 2014 | 1.38 | % |
See accompanying Notes to Consolidated Financial Statements.
40 OPPENHEIMER GLOBAL ALLOCATION FUND
| Class C | Year Ended October 31, 2018 | Year Ended October 31, 2017 | Year Ended October 31, 2016 | Year Ended October 30, 20151 | Year Ended October 31, 2014 | |||||
| ||||||||||
Per Share Operating Data | ||||||||||
Net asset value, beginning of period | $18.67 | $17.13 | $17.00 | $16.88 | $16.78 | |||||
Income (loss) from investment operations: | ||||||||||
Net investment income2 | 0.06 | 0.14 | 0.10 | 0.11 | 0.14 | |||||
Net realized and unrealized gain (loss) | (1.14) | 1.85 | 0.23 | 0.14 | 0.21 | |||||
| ||||||||||
Total from investment operations | (1.08) | 1.99 | 0.33 | 0.25 | 0.35 | |||||
| ||||||||||
Dividends and/or distributions to shareholders: | ||||||||||
Dividends from net investment income | 0.00 | (0.45) | (0.20) | (0.13) | (0.25) | |||||
| ||||||||||
Net asset value, end of period | $17.59 | $18.67 | $17.13 | $17.00 | $16.88 | |||||
| ||||||||||
| ||||||||||
Total Return, at Net Asset Value3 | (5.84)% | 11.99% | 1.97% | 1.50% | 2.10% | |||||
| ||||||||||
Ratios/Supplemental Data | ||||||||||
Net assets, end of period (in thousands) | $209,903 | $237,072 | $238,771 | $247,445 | $262,594 | |||||
| ||||||||||
Average net assets (in thousands) | $237,237 | $236,259 | $240,948 | $256,637 | $275,145 | |||||
| ||||||||||
Ratios to average net assets:4,5 | ||||||||||
Net investment income | 0.31% | 0.77% | 0.58% | 0.64% | 0.83% | |||||
Expenses excluding specific expenses listed below | 2.08% | 2.09% | 2.09% | 2.08% | 2.12% | |||||
Interest and fees from borrowings | 0.00%6 | 0.00%6 | 0.00%6 | 0.00%6 | 0.00% | |||||
| ||||||||||
Total expenses7 | 2.08% | 2.09% | 2.09% | 2.08% | 2.12% | |||||
| Expenses after payments, waivers and/or reimbursements and reduction to custodian expenses | 2.01% | 2.02% | 2.03% | 2.03% | 2.05% | |||||
| ||||||||||
Portfolio turnover rate | 151% | 40% | 84% | 83% | 43% | |||||
1. Represents the last business day of the Fund’s reporting period.
2. Per share amounts calculated based on the average shares outstanding during the period.
3. Assumes an initial investment on the business day before the first day of the fiscal period, with all dividends and distributions reinvested in additional shares on the reinvestment date, and redemption at the net asset value calculated on the last business day of the fiscal period. Sales charges are not reflected in the total returns. Total returns are not annualized for periods less than one full year. Returns do not reflect the deduction of taxes that a shareholder would pay on fund distributions or the redemption of fund shares.
4. Annualized for periods less than one full year.
5. Includes the Fund’s share of the allocated expenses and/or net investment income from the master funds.
6. Less than 0.005%.
7. Total expenses including indirect expenses from affiliated fund fees and expenses were as follows:
Year Ended October 31, 2018 | 2.10 | % | ||||||||||
Year Ended October 31, 2017 | 2.11 | % | ||||||||||
Year Ended October 31, 2016 | 2.10 | % | ||||||||||
Year Ended October 30, 2015 | 2.08 | % | ||||||||||
Year Ended October 31, 2014 | 2.13 | % |
See accompanying Notes to Consolidated Financial Statements.
41 OPPENHEIMER GLOBAL ALLOCATION FUND
| CONSOLIDATED FINANCIAL HIGHLIGHTS Continued |
| Class I | Year Ended October 31, 2018 | Year Ended October 31, 2017 | Year Ended October 31, 2016 | Year Ended October 30, 20151 | Year Ended October 31, 2014 | |||||
| ||||||||||
Per Share Operating Data | ||||||||||
Net asset value, beginning of period | $19.48 | $17.75 | $17.56 | $17.41 | $17.25 | |||||
Income (loss) from investment operations: | ||||||||||
Net investment income2 | 0.29 | 0.36 | 0.29 | 0.31 | 0.32 | |||||
Net realized and unrealized gain (loss) | (1.21) | 1.93 | 0.25 | 0.16 | 0.24 | |||||
| ||||||||||
Total from investment operations | (0.92) | 2.29 | 0.54 | 0.47 | 0.56 | |||||
| ||||||||||
Dividends and/or distributions to shareholders: | ||||||||||
Dividends from net investment income
| (0.05) | (0.56) | (0.35) | (0.32) | (0.40) | |||||
| ||||||||||
Net asset value, end of period | $18.51 | $19.48 | $17.75 | $17.56 | $17.41 | |||||
| ||||||||||
| ||||||||||
Total Return, at Net Asset Value3 | (4.75)% | 13.33% | 3.18% | 2.71% | 3.32% | |||||
| ||||||||||
Ratios/Supplemental Data | ||||||||||
Net assets, end of period (in thousands) | $33,300 | $28,163 | $23,444 | $747 | $3,031 | |||||
| ||||||||||
Average net assets (in thousands) | $33,025 | $25,390 | $9,808 | $877 | $1,075 | |||||
| ||||||||||
Ratios to average net assets:4,5 | ||||||||||
Net investment income | 1.48% | 1.93% | 1.66% | 1.74% | 1.90% | |||||
Expenses excluding specific expenses listed below | 0.91% | 0.90% | 0.85% | 0.88% | 0.94% | |||||
Interest and fees from borrowings | 0.00%6 | 0.00%6 | 0.00%6 | 0.00%6 | 0.00% | |||||
| ||||||||||
Total expenses7 | 0.91% | 0.90% | 0.85% | 0.88% | 0.94% | |||||
| Expenses after payments, waivers and/or reimbursements and reduction to custodian expenses | 0.84% | 0.84% | 0.79% | 0.83% | 0.87% | |||||
| ||||||||||
Portfolio turnover rate | 151% | 40% | 84% | 83% | 43% | |||||
1. Represents the last business day of the Fund’s reporting period.
2. Per share amounts calculated based on the average shares outstanding during the period.
3. Assumes an initial investment on the business day before the first day of the fiscal period, with all dividends and distributions reinvested in additional shares on the reinvestment date, and redemption at the net asset value calculated on the last business day of the fiscal period. Sales charges are not reflected in the total returns. Total returns are not annualized for periods less than one full year. Returns do not reflect the deduction of taxes that a shareholder would pay on fund distributions or the redemption of fund shares.
4. Annualized for periods less than one full year.
5. Includes the Fund’s share of the allocated expenses and/or net investment income from the master funds.
6. Less than 0.005%.
7. Total expenses including indirect expenses from affiliated fund fees and expenses were as follows:
Year Ended October 31, 2018 | 0.93 | % | ||||||||||
Year Ended October 31, 2017 | 0.92 | % | ||||||||||
Year Ended October 31, 2016 | 0.86 | % | ||||||||||
Year Ended October 30, 2015 | 0.88 | % | ||||||||||
Year Ended October 31, 2014 | 0.95 | % |
See accompanying Notes to Consolidated Financial Statements.
42 OPPENHEIMER GLOBAL ALLOCATION FUND
Year Ended October 31, 2018 | Year Ended October 31, 2017 | Year Ended October 31, 2016 | Year Ended October 30, 20151 | Year Ended October 31, 2014 | ||||||||||||||||
| Class R | ||||||||||||||||||||
Per Share Operating Data | ||||||||||||||||||||
Net asset value, beginning of period | $19.12 | $17.47 | $17.29 | $17.15 | $17.01 | |||||||||||||||
| ||||||||||||||||||||
Income (loss) from investment operations: | ||||||||||||||||||||
Net investment income2 | 0.16 | 0.23 | 0.18 | 0.20 | 0.23 | |||||||||||||||
Net realized and unrealized gain (loss) | (1.18) | 1.90 | 0.24 | 0.14 | 0.20 | |||||||||||||||
|
| |||||||||||||||||||
Total from investment operations | (1.02) | 2.13 | 0.42 | 0.34 | 0.43 | |||||||||||||||
| ||||||||||||||||||||
Dividends and/or distributions to shareholders: | ||||||||||||||||||||
Dividends from net investment income | 0.00 | (0.48) | (0.24) | (0.20) | (0.29) | |||||||||||||||
| ||||||||||||||||||||
| Net asset value, end of period | $18.10 | $19.12 | $17.47 | $17.29 | $17.15 | |||||||||||||||
|
| |||||||||||||||||||
Total Return, at Net Asset Value3 | (5.34)% | 12.55% | 2.51% | 1.98% | 2.56% | |||||||||||||||
Ratios/Supplemental Data | ||||||||||||||||||||
Net assets, end of period (in thousands) | $39,909 | $42,854 | $37,321 | $36,537 | $39,483 | |||||||||||||||
| ||||||||||||||||||||
Average net assets (in thousands) | $43,762 | $39,052 | $36,498 | $38,398 | $42,159 | |||||||||||||||
| ||||||||||||||||||||
Ratios to average net assets:4,5 | ||||||||||||||||||||
Net investment income | 0.82% | 1.26% | 1.09% | 1.14% | 1.33% | |||||||||||||||
Expenses excluding specific expenses listed below | 1.57% | 1.59% | 1.59% | 1.58% | 1.63% | |||||||||||||||
Interest and fees from borrowings | 0.00%6 | 0.00%6 | 0.00%6 | 0.00%6 | 0.00% | |||||||||||||||
|
| |||||||||||||||||||
Total expenses7 | 1.57% | 1.59% | 1.59% | 1.58% | 1.63% | |||||||||||||||
| Expenses after payments, waivers and/or reimbursements and reduction to custodian expenses | 1.50% | 1.52% | 1.53% | 1.53% | 1.56% | |||||||||||||||
| ||||||||||||||||||||
Portfolio turnover rate | 151% | 40% | 84% | 83% | 43% | |||||||||||||||
1. Represents the last business day of the Fund’s reporting period.
2. Per share amounts calculated based on the average shares outstanding during the period.
3. Assumes an initial investment on the business day before the first day of the fiscal period, with all dividends and distributions reinvested in additional shares on the reinvestment date, and redemption at the net asset value calculated on the last business day of the fiscal period. Sales charges are not reflected in the total returns. Total returns are not annualized for periods less than one full year. Returns do not reflect the deduction of taxes that a shareholder would pay on fund distributions or the redemption of fund shares.
4. Annualized for periods less than one full year.
5. Includes the Fund’s share of the allocated expenses and/or net investment income from the master funds.
6. Less than 0.005%.
7. Total expenses including indirect expenses from affiliated fund fees and expenses were as follows:
Year Ended October 31, 2018 | 1.59 | % | ||
Year Ended October 31, 2017 | 1.61 | % | ||
Year Ended October 31, 2016 | 1.60 | % | ||
Year Ended October 30, 2015 | 1.58 | % | ||
Year Ended October 31, 2014 | 1.64 | % |
See accompanying Notes to Consolidated Financial Statements.
43 OPPENHEIMER GLOBAL ALLOCATION FUND
| CONSOLIDATED FINANCIAL HIGHLIGHTS Continued | ||
Year Ended October 31, 2018 | Year Ended October 31, 2017 | Year Ended October 31, 2016 | Year Ended October 30, 20151 | Year Ended October 31, 2014 | ||||||||||||||||
| Class Y | ||||||||||||||||||||
Per Share Operating Data | ||||||||||||||||||||
Net asset value, beginning of period | $19.47 | $17.75 | $17.56 | $17.42 | $17.26 | |||||||||||||||
| ||||||||||||||||||||
Income (loss) from investment operations: | ||||||||||||||||||||
Net investment income2 | 0.26 | 0.32 | 0.28 | 0.29 | 0.32 | |||||||||||||||
Net realized and unrealized gain (loss) | (1.21) | 1.94 | 0.23 | 0.14 | 0.22 | |||||||||||||||
|
| |||||||||||||||||||
Total from investment operations | (0.95) | 2.26 | 0.51 | 0.43 | 0.54 | |||||||||||||||
| ||||||||||||||||||||
Dividends and/or distributions to shareholders: | ||||||||||||||||||||
Dividends from net investment income | (0.03) | (0.54) | (0.32) | (0.29) | (0.38) | |||||||||||||||
| ||||||||||||||||||||
Net asset value, end of period | $18.49 | $19.47 | $17.75 | $17.56 | $17.42 | |||||||||||||||
|
| |||||||||||||||||||
Total Return, at Net Asset Value3 | (4.88)% | 13.13% | 2.97% | 2.47% | 3.17% | |||||||||||||||
Ratios/Supplemental Data | ||||||||||||||||||||
Net assets, end of period (in thousands) | $114,493 | $121,039 | $60,771 | $45,698 | $40,652 | |||||||||||||||
| ||||||||||||||||||||
Average net assets (in thousands) | $133,677 | $82,959 | $52,148 | $42,596 | $39,075 | |||||||||||||||
| ||||||||||||||||||||
Ratios to average net assets:4,5 | ||||||||||||||||||||
Net investment income | 1.31% | 1.72% | 1.63% | 1.63% | 1.86% | |||||||||||||||
Expenses excluding specific expenses listed below | 1.08% | 1.10% | 1.09% | 1.08% | 1.09% | |||||||||||||||
Interest and fees from borrowings | 0.00%6 | 0.00%6 | 0.00%6 | 0.00%6 | 0.00% | |||||||||||||||
|
| |||||||||||||||||||
Total expenses7 | 1.08% | 1.10% | 1.09% | 1.08% | 1.09% | |||||||||||||||
| Expenses after payments, waivers and/or reimbursements and reduction to custodian expenses | 1.01% | 1.03% | 1.03% | 1.03% | 1.02% | |||||||||||||||
| ||||||||||||||||||||
Portfolio turnover rate | 151% | 40% | 84% | 83% | 43% | |||||||||||||||
1. Represents the last business day of the Fund’s reporting period.
2. Per share amounts calculated based on the average shares outstanding during the period.
3. Assumes an initial investment on the business day before the first day of the fiscal period, with all dividends and distributions reinvested in additional shares on the reinvestment date, and redemption at the net asset value calculated on the last business day of the fiscal period. Sales charges are not reflected in the total returns. Total returns are not annualized for periods less than one full year. Returns do not reflect the deduction of taxes that a shareholder would pay on fund distributions or the redemption of fund shares.
4. Annualized for periods less than one full year.
5. Includes the Fund’s share of the allocated expenses and/or net investment income from the master funds.
6. Less than 0.005%.
7. Total expenses including indirect expenses from affiliated fund fees and expenses were as follows:
Year Ended October 31, 2018 | 1.10 | % | ||
Year Ended October 31, 2017 | 1.12 | % | ||
Year Ended October 31, 2016 | 1.10 | % | ||
Year Ended October 30, 2015 | 1.08 | % | ||
Year Ended October 31, 2014 | 1.10 | % |
See accompanying Notes to Consolidated Financial Statements.
44 OPPENHEIMER GLOBAL ALLOCATION FUND
FINANCIAL STATEMENTS October 31, 2018
1. Organization
Oppenheimer Global Allocation Fund (the “Fund”), a series of Oppenheimer Quest for Value Funds, is registered under the Investment Company Act of 1940 (“1940 Act”), as amended, as a diversified open-end management investment company. The Fund’s investment objective is to seek total return. The Fund’s investment adviser is OFI Global Asset Management, Inc. (“OFI Global” or the “Manager”), a wholly-owned subsidiary of OppenheimerFunds, Inc. (“OFI” or the “Sub-Adviser”). The Manager has entered into a sub-advisory agreement with OFI.
The Fund offers Class A, Class C, Class I, Class R and Class Y shares, and previously offered Class B shares for new purchase through June 29, 2012. Subsequent to that date, no new purchases of Class B shares were permitted. Reinvestment of dividend and/or capital gain distributions and exchanges of Class B shares into and from other Oppenheimer funds were permitted through May 31, 2018. Effective June 1, 2018 (the “Conversion Date”), all Class B shares converted to Class A shares. Class A shares are sold at their offering price, which is normally net asset value plus a front-end sales charge. Class C and Class R shares are sold, and Class B shares were sold, without a front-end sales charge but may be subject to a contingent deferred sales charge (“CDSC”). Class R shares are sold only through retirement plans. Retirement plans that offer Class R shares may impose charges on those accounts. Class I and Class Y shares are sold to certain institutional investors or intermediaries without either a front-end sales charge or a CDSC, however, the intermediaries may impose charges on their accountholders who beneficially own Class I and Class Y shares. All classes of shares have identical rights and voting privileges with respect to the Fund in general and exclusive voting rights on matters that affect that class alone. Earnings, net assets and net asset value per share may differ due to each class having its own expenses, such as transfer and shareholder servicing agent fees and shareholder communications, directly attributable to that class. Class A, C and R shares have, and Class B shares had, separate distribution and/or service plans under which they pay, and Class B shares paid, fees. Class I and Class Y shares do not pay such fees. Previously issued Class B shares automatically converted to Class A shares 72 months after the date of purchase.
The following is a summary of significant accounting policies followed in the Fund’s preparation of financial statements in accordance with accounting principles generally accepted in the United States (“U.S. GAAP”).
2. Significant Accounting Policies
Security Valuation. All investments in securities are recorded at their estimated fair value, as described in Note 3.
Basis for Consolidation. The Fund has established a Cayman Islands exempted company, Oppenheimer Global Allocation Fund (Cayman) Ltd. (the “Subsidiary”), which is wholly-owned and controlled by the Fund. The Fund and Subsidiary are both managed by the Manager. The Fund may invest up to 25% of its total assets in the Subsidiary. The Subsidiary invests primarily in commodity-linked derivatives (including commodity futures, financial futures, options and
45 OPPENHEIMER GLOBAL ALLOCATION FUND
NOTES TO CONSOLIDATED
FINANCIAL STATEMENTS Continued
2. Significant Accounting Policies (Continued)
swap contracts) and exchange traded funds related to gold or other special minerals (“Gold ETFs”). The Fund applies its investment restrictions and compliance policies and procedures, on a look-through basis, to the Subsidiary.
The financial statements have been consolidated and include accounts of the Fund and the Subsidiary. Accordingly, all inter-company transactions and balances have been eliminated. At period end, the Fund owned 5,651 shares with net assets of $37,587,981 in the Subsidiary.
Other financial information at period end:
Total market value of investments* | $ | — | ||
Net assets | $ | 37,587,981 | ||
Net income (loss) | $ | 69,742 | ||
Net realized gain (loss) | $ | 4,349,736 | ||
Net change in unrealized appreciation/depreciation | $ | — |
*At period end, the Subsidiary only held cash.
Foreign Currency Translation. The books and records of the Fund are maintained in U.S. dollars. Any foreign currency amounts are translated into U.S. dollars on the following basis:
(1) Value of investment securities, other assets and liabilities — at the exchange rates prevailing at market close as described in Note 3.
(2) Purchases and sales of investment securities, income and expenses — at the rates of exchange prevailing on the respective dates of such transactions.
Although the net assets and the values are presented at the foreign exchange rates at market close, the Fund does not isolate the portion of the results of operations resulting from changes in foreign exchange rates on investments from the fluctuations arising from changes in prices of securities held. Such fluctuations are included with the net realized and unrealized gains or losses from investments shown in the Consolidated Statement of Operations.
For securities, which are subject to foreign withholding tax upon disposition, realized and unrealized gains or losses on such securities are recorded net of foreign withholding tax.
Reported net realized foreign exchange gains or losses arise from sales of foreign currencies, currency gains or losses realized between the trade and settlement dates on securities transactions, the difference between the amounts of dividends, interest, and foreign withholding tax reclaims recorded on the Fund’s books, and the U.S. dollar equivalent of the amounts actually received or paid. Net unrealized foreign exchange gains and losses arise from changes in the value of assets and liabilities other than investments in securities, resulting from changes in the exchange rate.
Allocation of Income, Expenses, Gains and Losses. Income, expenses (other than those attributable to a specific class), gains and losses are allocated on a daily basis to each class of shares based upon the relative proportion of net assets represented by such class. Operating expenses directly attributable to a specific class are charged against the operations of that class.
46 OPPENHEIMER GLOBAL ALLOCATION FUND
2. Significant Accounting Policies (Continued)
Dividends and Distributions to Shareholders. Dividends and distributions to shareholders, which are determined in accordance with income tax regulations and may differ from U.S. GAAP, are recorded on the ex-dividend date. Income distributions, if any, are declared and paid quarterly. Capital gain distributions, if any, are declared and paid annually or at other times as determined necessary by the Manager.
Investment Income. Dividend income is recorded on the ex-dividend date or upon ex-dividend notification in the case of certain foreign dividends where the ex-dividend date may have passed. Non-cash dividends included in dividend income, if any, are recorded at the fair value of the securities received. Withholding taxes on foreign dividends, if any, and capital gains taxes on foreign investments, if any, have been provided for in accordance with the Fund’s understanding of the applicable tax rules and regulations. Interest income, if any, is recognized on an accrual basis. Discount and premium, which are included in interest income on the Consolidated Statement of Operations, are amortized or accreted daily.
Return of Capital Estimates. Distributions received from the Fund’s investments in Master Limited Partnerships (MLPs) and Real Estate Investments Trusts (REITs), generally are comprised of income and return of capital. The Fund records investment income and return of capital based on estimates. Such estimates are based on historical information available from each MLP, REIT and other industry sources. These estimates may subsequently be revised based on information received from MLPs and REITs after their tax reporting periods are concluded.
Custodian Fees. “Custodian fees and expenses” in the Consolidated Statement of Operations may include interest expense incurred by the Fund on any cash overdrafts of its custodian account during the period. Such cash overdrafts may result from the effects of failed trades in portfolio securities and from cash outflows resulting from unanticipated shareholder redemption activity. The Fund pays interest to its custodian on such cash overdrafts, to the extent they are not offset by positive cash balances maintained by the Fund, at a rate equal to the Federal Funds Rate plus 2.00%. The “Reduction to custodian expenses” line item, if applicable, represents earnings on cash balances maintained by the Fund during the period. Such interest expense and other custodian fees may be paid with these earnings.
Security Transactions. Security transactions are recorded on the trade date. Realized gains and losses on securities sold are determined on the basis of identified cost.
Indemnifications. The Fund’s organizational documents provide current and former Trustees and officers with a limited indemnification against liabilities arising in connection with the performance of their duties to the Fund. In the normal course of business, the Fund may also enter into contracts that provide general indemnifications. The Fund’s maximum exposure under these arrangements is unknown as this would be dependent on future claims that may be made against the Fund. The risk of material loss from such claims is considered remote.
47 OPPENHEIMER GLOBAL ALLOCATION FUND
NOTES TO CONSOLIDATED FINANCIAL STATEMENTS Continued |
2. Significant Accounting Policies (Continued)
Federal Taxes. The Fund intends to comply with provisions of the Internal Revenue Code applicable to regulated investment companies and to distribute substantially all of its investment company taxable income, including any net realized gain on investments not offset by capital loss carryforwards, if any, to shareholders. Therefore, no federal income or excise tax provision is required. The Fund files income tax returns in U.S. federal and applicable state jurisdictions. The statute of limitations on the Fund’s tax return filings generally remains open for the three preceding fiscal reporting period ends. The Fund has analyzed its tax positions for the fiscal year ended October 31, 2018, including open tax years, and does not believe there are any uncertain tax positions requiring recognition in the Fund’s financial statements.
Subchapter M requires, among other things, that at least 90% of the Fund’s gross income be derived from securities or derived with respect to its business of investing in securities (typically referred to as “qualifying income”). Income from commodity-linked derivatives may not be treated as “qualifying income” for purposes of the 90% gross income requirement. The Internal Revenue Service (IRS) has previously issued a number of private letter rulings which conclude that income derived from commodity index-linked notes and investments in a wholly-owned subsidiary will be “qualifying income.” As a result, the Fund will gain exposure to commodities through commodity-linked notes and its wholly-owned subsidiary.
The IRS has suspended the granting of private letter rulings pending further review. As a result, there can be no assurance that the IRS will not change its position with respect to commodity-linked notes and wholly-owned subsidiaries. In addition, future legislation and guidance from the Treasury and the IRS may adversely affect the Fund’s ability to gain exposure to commodities through commodity-linked notes and its wholly-owned subsidiary.
The Fund is required to include in income for federal income tax purposes all of the subsidiary’s net income and gains whether or not such income is distributed by the subsidiary. Net income and gains from the subsidiary are generally treated as ordinary income by the Fund, regardless of the character of the subsidiary’s underlying income. Net losses from the subsidiary do not pass through to the Fund for federal income tax purposes.
The tax components of capital shown in the following table represent distribution requirements the Fund must satisfy under the income tax regulations, losses the Fund may be able to offset against income and gains realized in future years and unrealized appreciation or depreciation of securities and other investments for federal income tax purposes.
Total Distributable Earnings | Accumulated Loss Carryforward1,2,3 | Net Unrealized Depreciation Based on cost of Securities and Other Investments for Federal Income Tax Purposes | ||||||
$110,413,639 | $308,069 | $71,121,221 | ||||||
1. The Fund had $308,069 of straddle losses which were deferred.
2. During the reporting period, the Fund did not utilize any capital loss carryforward.
3. During the previous reporting period, the Fund utilized $111,062,368 of capital loss carryforward to offset capital
48 OPPENHEIMER GLOBAL ALLOCATION FUND
2. Significant Accounting Policies (Continued)
gains realized in that fiscal year.
Net investment income (loss) and net realized gain (loss) may differ for financial statement and tax purposes. The character of dividends and distributions made during the fiscal year from net investment income or net realized gains are determined in accordance with federal income tax requirements, which may differ from the character of net investment income or net realized gains presented in those financial statements in accordance with U.S. GAAP. Also, due to timing of dividends and distributions, the fiscal year in which amounts are distributed may differ from the fiscal year in which the income or net realized gain was recorded by the Fund.
Accordingly, the following amounts have been reclassified for the reporting period. Net assets of the Fund were unaffected by the reclassifications.
Increase to Paid-in Capital | Reduction to Accumulated | |||
$8,759,141 | $8,759,141 | |||
4. $8,522,658, including $8,418,017 of long-term capital gain, was distributed in connection with Fund share redemptions.
The tax character of distributions paid during the reporting periods:
| Year Ended October 31, 2018 | Year Ended October 31, 2017 | |||||||
Distributions paid from: | ||||||||
Ordinary income | $ | 442,008 | $ | 42,362,298 | ||||
The aggregate cost of securities and other investments and the composition of unrealized appreciation and depreciation of securities and other investments for federal income tax purposes at period end are noted in the following table. The primary difference between book and tax appreciation or depreciation of securities and other investments, if applicable, is attributable to the tax deferral of losses or tax realization of financial statement unrealized gain or loss.
Federal tax cost of securities | $ | 1,467,085,656 | ||
Federal tax cost of other investments | 493,951,889 | |||
|
| |||
Total federal tax cost | $ | 1,961,037,545 | ||
|
| |||
Gross unrealized appreciation | $ | 54,959,546 | ||
Gross unrealized depreciation | (126,080,767) | |||
|
| |||
Net unrealized depreciation | $ | (71,121,221) | ||
|
|
Certain foreign countries impose a tax on capital gains which is accrued by the Fund based on unrealized appreciation, if any, on affected securities. The tax is paid when the gain is realized.
Use of Estimates. The preparation of financial statements in conformity with U.S. GAAP
49 OPPENHEIMER GLOBAL ALLOCATION FUND
NOTES TO CONSOLIDATED FINANCIAL STATEMENTS Continued |
2. Significant Accounting Policies (Continued)
requires management to make estimates and assumptions that affect the reported amounts of assets and liabilities and disclosure of contingent assets and liabilities at the date of the financial statements and the reported amounts of increases and decreases in net assets from operations during the reporting period. Actual results could differ from those estimates.
New Accounting Pronouncements. In March 2017, Financial Accounting Standards Board (“FASB”) issued Accounting Standards Update (“ASU”), ASU 2017-08. This provides guidance related to the amortization period for certain purchased callable debt securities held at a premium. The ASU is effective for annual periods beginning after December 15, 2018, and interim periods within those annual periods. The Manager is evaluating the impacts of these changes on the financial statements.
During August 2018, the Securities and Exchange Commission (the “SEC”) issued Final Rule Release No. 33-10532 (the “Rule”), Disclosure Update and Simplification. The rule amends certain financial statement disclosure requirements to conform to U.S. GAAP. The amendments to Rule 6-04.17 of Regulation S-X (balance sheet) remove the requirement to separately state the book basis components of net assets: undistributed (over-distribution of) net investment income (“UNII”), accumulated undistributed net realized gains (losses), and net unrealized appreciation (depreciation) at the balance sheet date. Instead, consistent with U.S. GAAP, funds will be required to disclose total distributable earnings. The amendments to Rule 6-09 of Regulation S-X (statement of changes in net assets) remove the requirement to separately state the sources of distributions paid. Instead, consistent with U.S. GAAP, funds will be required to disclose the total amount of distributions paid, except that any tax return of capital must be separately disclosed. The amendments also remove the requirement to parenthetically state the book basis amount of UNII on the statement of changes in net assets. The requirements of the Rule are effective November 5, 2018, and the Funds’ Statement of Assets and Liabilities and Statement of Changes in Net Assets for the current reporting period have been modified accordingly. In addition, certain amounts within each Fund’s Statement of Changes in Net Assets for the prior fiscal period have been modified to conform to the Rule.
3. Securities Valuation
The Fund calculates the net asset value of its shares as of 4:00 P.M. Eastern Time, on each day the New York Stock Exchange (the “Exchange”) is open for trading, except in the case of a scheduled early closing of the Exchange, in which case the Fund will calculate net asset value of the shares as of the scheduled early closing time of the Exchange.
The Fund’s Board has adopted procedures for the valuation of the Fund’s securities and has delegated the day-to-day responsibility for valuation determinations under those procedures to the Manager. The Manager has established a Valuation Committee which is responsible for determining a fair valuation for any security for which market quotations are not readily available. The Valuation Committee’s fair valuation determinations are subject to review, approval and ratification by the Fund’s Board at least quarterly or more frequently, if necessary.
50 OPPENHEIMER GLOBAL ALLOCATION FUND
3. Securities Valuation (Continued)
Valuation Methods and Inputs
Securities are valued primarily using unadjusted quoted market prices, when available, as supplied by third party pricing services or broker-dealers.
The following methodologies are used to determine the market value or the fair value of the types of securities described below:
Equity securities traded on a securities exchange (including exchange-traded derivatives other than futures and futures options) are valued based on the official closing price on the principal exchange on which the security is traded, as identified by the Manager, prior to the time when the Fund’s assets are valued. If the official closing price is unavailable, the security is valued at the last sale price on the principal exchange on which it is traded, or if no sales occurred, the security is valued at the mean between the quoted bid and asked prices. Over-the-counter equity securities are valued at the last published sale price, or if no sales occurred, at the mean between the quoted bid and asked prices. Events occurring after the close of trading on foreign exchanges may result in adjustments to the valuation of foreign securities to more accurately reflect their fair value as of the time when the Fund’s assets are valued.
Shares of a registered investment company that are not traded on an exchange are valued at that investment company’s net asset value per share.
Corporate and government debt securities (of U.S. or foreign issuers) and municipal debt securities, short-term notes, mortgage-backed securities, collateralized mortgage obligations, and asset-backed securities are valued at the mean between the bid and asked prices utilizing evaluated prices obtained from third party pricing services or broker-dealers who may use matrix pricing methods to determine the evaluated prices. Pricing services generally price debt securities assuming orderly transactions of an institutional “round lot” size, but some trades may occur in smaller, “odd lot” sizes, sometimes at lower prices than institutional round lot trades. Standard inputs generally considered by third-party pricing vendors include reported trade data, broker-dealer price quotations, benchmark yields, issuer spreads on comparable securities, the credit quality, yield, maturity, as well as other appropriate factors.
Structured securities, swaps, swaptions, and other over-the-counter derivatives are valued utilizing evaluated prices obtained from third party pricing services or broker-dealers. Standard inputs generally considered by third-party pricing vendors include market information relevant to the underlying reference asset such as the price of financial instruments, stock market indices, foreign currencies, interest rate spreads, commodities, credit spreads, credit event probabilities, index values, individual security values, forward interest rates, variable interest rates, volatility measures, and forward currency rates, or the occurrence of other specific events.
Forward foreign currency exchange contracts are valued utilizing current and forward currency rates obtained from third party pricing services. When the settlement date of a contract is an interim date for which a quotation is not available, interpolated values are derived using the nearest dated forward currency rate.
Futures contracts and futures options traded on a commodities or futures exchange will be valued at the final settlement price or official closing price on the principal exchange as reported by such principal exchange at its trading session ending at, or most recently prior to,
51 OPPENHEIMER GLOBAL ALLOCATION FUND
NOTES TO CONSOLIDATED FINANCIAL STATEMENTS Continued |
3. Securities Valuation (Continued)
the time when the Fund’s assets are valued.
Securities for which market quotations are not readily available, or when a significant event has occurred that would materially affect the value of the security, are fair valued either (i) by a standardized fair valuation methodology applicable to the security type or the significant event as previously approved by the Valuation Committee and the Fund’s Board or (ii) as determined in good faith by the Manager’s Valuation Committee. The Valuation Committee considers all relevant facts that are reasonably available, through either public information or information available to the Manager, when determining the fair value of a security. Those standardized fair valuation methodologies include, but are not limited to, valuing securities at the last sale price or initially at cost and subsequently adjusting the value based on: changes in company specific fundamentals, changes in an appropriate securities index, or changes in the value of similar securities which may be further adjusted for any discounts related to security-specific resale restrictions. When possible, such methodologies use observable market inputs such as unadjusted quoted prices of similar securities, observable interest rates, currency rates and yield curves. The methodologies used for valuing securities are not necessarily an indication of the risks associated with investing in those securities nor can it be assured that the Fund can obtain the fair value assigned to a security if it were to sell the security.
To assess the continuing appropriateness of security valuations, the Manager regularly compares prior day prices and sale prices to the current day prices and challenges those prices exceeding certain tolerance levels with the third party pricing service or broker source. For those securities valued by fair valuations, whether through a standardized fair valuation methodology or a fair valuation determination, the Valuation Committee reviews and affirms the reasonableness of the valuations based on such methodologies and fair valuation determinations on a regular basis after considering all relevant information that is reasonably available.
Classifications
Each investment asset or liability of the Fund is assigned a level at measurement date based on the significance and source of the inputs to its valuation. Various data inputs may be used in determining the value of each of the Fund’s investments as of the reporting period end. These data inputs are categorized in the following hierarchy under applicable financial accounting standards:
1) Level 1-unadjusted quoted prices in active markets for identical assets or liabilities (including securities actively traded on a securities exchange)
2) Level 2-inputs other than unadjusted quoted prices that are observable for the asset or liability (such as unadjusted quoted prices for similar assets and market corroborated inputs such as interest rates, prepayment speeds, credit risks, etc.)
3) Level 3-significant unobservable inputs (including the Manager’s own judgments about assumptions that market participants would use in pricing the asset or liability).
The inputs used for valuing securities are not necessarily an indication of the risks associated
52 OPPENHEIMER GLOBAL ALLOCATION FUND
3. Securities Valuation (Continued)
with investing in those securities.
The Fund classifies each of its investments in investment companies which are publicly offered as Level 1. Investment companies that are not publicly offered, if any, are classified as Level 2 in the fair value hierarchy.
The table below categorizes amounts that are included in the Fund’s Consolidated Statement of Assets and Liabilities at period end based on valuation input level:
| Level 1— Unadjusted Quoted Prices | Level 2— Other Significant Observable Inputs | Level 3— Significant Unobservable Inputs | Value | |||||||||||||
Assets Table | ||||||||||||||||
Investments, at Value: | ||||||||||||||||
Common Stocks | ||||||||||||||||
Consumer Discretionary | $ | 75,525,599 | $ | 73,463,328 | $ | — | $ | 148,988,927 | ||||||||
Consumer Staples | 17,887,711 | 33,430,631 | — | 51,318,342 | ||||||||||||
Energy | 42,431,497 | 20,664,308 | — | 63,095,805 | ||||||||||||
Financials | 30,138,914 | 57,596,105 | — | 87,735,019 | ||||||||||||
Health Care | 37,523,052 | 27,682,068 | — | 65,205,120 | ||||||||||||
Industrials | 20,243,910 | 74,898,882 | — | 95,142,792 | ||||||||||||
Information Technology | 42,382,680 | 81,852,310 | — | 124,234,990 | ||||||||||||
Materials | 9,915,656 | 17,283,128 | — | 27,198,784 | ||||||||||||
Telecommunication Services | 1,715,438 | 11,457,821 | — | 13,173,259 | ||||||||||||
Preferred Stock | 65,401 | — | — | 65,401 | ||||||||||||
U.S. Government Obligations | — | 72,493,172 | — | 72,493,172 | ||||||||||||
Foreign Government Obligations | — | 160,452,053 | — | 160,452,053 | ||||||||||||
Non-Convertible Corporate Bond and Note | — | 216,768 | — | 216,768 | ||||||||||||
Over-the-Counter Options Purchased | — | 1,279,362 | — | 1,279,362 | ||||||||||||
Investment Companies | 321,712,919 | 166,699,869 | — | 488,412,788 | ||||||||||||
|
| |||||||||||||||
Total Investments, at Value | 599,542,777 | 799,469,805 | — | 1,399,012,582 | ||||||||||||
Other Financial Instruments: | ||||||||||||||||
Swaps, at value | — | 420,588 | — | 420,588 | ||||||||||||
Futures contracts | 11,774,263 | — | — | �� | 11,774,263 | |||||||||||
Forward currency exchange contracts | — | 10,797,612 | — | 10,797,612 | ||||||||||||
|
| |||||||||||||||
Total Assets | $ | 611,317,040 | $ | 810,688,005 | $ | — | $ | 1,422,005,045 | ||||||||
|
| |||||||||||||||
Liabilities Table | ||||||||||||||||
Other Financial Instruments: | ||||||||||||||||
Swaps, at value | $ | — | $ | (45,193 | ) | $ | — | $ | (45,193) | |||||||
Centrally cleared swaps, at value | — | (4,222,204 | ) | — | (4,222,204) | |||||||||||
Options written, at value | — | (2,982 | ) | — | (2,982) | |||||||||||
Futures contracts | (11,933,902 | ) | — | — | (11,933,902) | |||||||||||
Forward currency exchange contracts | — | (3,837,850 | ) | — | (3,837,850) | |||||||||||
|
| |||||||||||||||
Total Liabilities | $ | (11,933,902 | ) | $ | (8,108,229 | ) | $ | — | $ | (20,042,131) | ||||||
|
| |||||||||||||||
Forward currency exchange contracts and futures contracts, if any, are reported at their unrealized appreciation/depreciation at measurement date, which represents the change in the contract’s value from trade date. All additional assets and liabilities included in the above
53 OPPENHEIMER GLOBAL ALLOCATION FUND
NOTES TO CONSOLIDATED FINANCIAL STATEMENTS Continued |
3. Securities Valuation (Continued)
table are reported at their market value at measurement date.
The table below shows the transfers between Level 1 and Level 2. The Fund’s policy is to recognize transfers in and transfers out as of the beginning of the reporting period.
| Transfers out of Level 1* | Transfers into Level 2* | |||||||||||
Assets Table | ||||||||||||
Investments, at Value: | ||||||||||||
Common Stocks | ||||||||||||
Consumer Discretionary | $ | (3,420,264 | ) | $ | 3,420,264 | |||||||
Financials | (1,915,088 | ) | 1,915,088 | |||||||||
Health Care | (614,347 | ) | 614,347 | |||||||||
Materials | (912,400 | ) | 912,400 | |||||||||
|
| |||||||||||
Total Assets | $ | (6,862,099 | ) | $ | 6,862,099 | |||||||
|
| |||||||||||
* Transfers from Level 1 to Level 2 are a result of a change in pricing methodology to the use of a valuation determined based on observable market information other than quoted prices from an active market due to a lack of available unadjusted quoted prices.
4. Investments and Risks
Risks of Foreign Investing. The Fund may invest in foreign securities which are subject to special risks. Securities traded in foreign markets may be less liquid and more volatile than those traded in U.S. markets. Foreign issuers are usually not subject to the same accounting and disclosure requirements that U.S. companies are subject to, which may make it difficult for the Fund to evaluate a foreign company’s operations or financial condition. A change in the value of a foreign currency against the U.S. dollar will result in a change in the U.S. dollar value of investments denominated in that foreign currency and in the value of any income or distributions the Fund may receive on those investments. The value of foreign investments may be affected by exchange control regulations, foreign taxes, higher transaction and other costs, delays in the settlement of transactions, changes in economic or monetary policy in the United States or abroad, expropriation or nationalization of a company’s assets, or other political and economic factors. In addition, due to the inter-relationship of global economies and financial markets, changes in political and economic factors in one country or region could adversely affect conditions in another country or region. Investments in foreign securities may also expose the Fund to time-zone arbitrage risk. Foreign securities may trade on weekends or other days when the Fund does not price its shares. At times, the Fund may emphasize investments in a particular country or region and may be subject to greater risks from adverse events that occur in that country or region. Foreign securities and foreign currencies held in foreign banks and securities depositories may be subject to limited or no regulatory oversight.
Investments in Affiliated Funds. The Fund is permitted to invest in other mutual funds advised by the Manager (“Affiliated Funds”). Affiliated Funds are open-end management investment companies registered under the 1940 Act, as amended. The Manager is the
54 OPPENHEIMER GLOBAL ALLOCATION FUND
4. Investments and Risks (Continued)
investment adviser of, and the Sub-Adviser provides investment and related advisory services to, the Affiliated Funds. When applicable, the Fund’s investments in Affiliated Funds are included in the Consolidated Statement of Investments. Shares of Affiliated Funds are valued at their net asset value per share. As a shareholder, the Fund is subject to its proportional share of the Affiliated Funds’ expenses, including their management fee.
The Manager will waive fees and/or reimburse Fund expenses in an amount equal to the indirect management fees incurred through the Fund’s investment in the Affiliated Funds.
Each of the Affiliated Funds in which the Fund invests has its own investment risks, and those risks can affect the value of the Fund’s investments and therefore the value of the Fund’s shares. To the extent that the Fund invests more of its assets in one Affiliated Fund than in another, the Fund will have greater exposure to the risks of that Affiliated Fund.
Investments in Money Market Instruments. The Fund is permitted to invest its free cash balances in money market instruments to provide liquidity or for defensive purposes. The Fund may invest in money market instruments by investing in Class E shares of Oppenheimer Institutional Government Money Market Fund (“IGMMF”), which is an Affiliated Fund. IGMMF is regulated as a money market fund under the 1940 Act, as amended. The Fund may also invest in money market instruments directly or in other affiliated or unaffiliated money market funds.
Investment in Oppenheimer Master Funds. The Fund is permitted to invest in entities sponsored and/or advised by the Manager or an affiliate. Certain of these entities in which the Fund invests are mutual funds registered under the 1940 Act, as amended, that expect to be treated as partnerships for tax purposes, specifically Oppenheimer Master Loan Fund,
LLC (“Master Loan”) and Oppenheimer Master Event-Linked Bond Fund, LLC (“Master Event-Linked Bond”) (the “Master Funds”). Each Master Fund has its own investment risks, and those risks can affect the value of the Fund’s investments and therefore the value of the Fund’s shares. To the extent that the Fund invests more of its assets in one Master Fund than in another, the Fund will have greater exposure to the risks of that Master Fund.
The investment objective of Master Loan is to seek income. The investment objective of Master Event-Linked Bond is to seek total return. The Fund’s investments in the Master Funds are included in the Consolidated Statement of Investments. The Fund recognizes income and gain/(loss) on its investments in each Master Fund according to its allocated pro-rata share, based on its relative proportion of total outstanding Master Fund shares held, of the total net income earned and the net gain/(loss) realized on investments sold by the Master Funds. As a shareholder, the Fund is subject to its proportional share of the Master Funds’ expenses, including their management fee. The Manager will waive fees and/or reimburse Fund expenses in an amount equal to the indirect management fees incurred through the Fund’s investment in the Master Funds. The Fund owns 45.0% of Master Event-Linked Bond and no longer held Master Loan at period end.
Master Limited Partnerships (“MLPs”). MLPs issue common units that represent an
55 OPPENHEIMER GLOBAL ALLOCATION FUND
NOTES TO CONSOLIDATED FINANCIAL STATEMENTS Continued |
4. Investments and Risks (Continued)
equity ownership interest in a partnership and provide limited voting rights. MLP common units are registered with the Securities and Exchange Commission (“SEC”), and are freely tradable on securities exchanges such as the NYSE and the NASDAQ Stock Market (“NASDAQ”), or in the over-the-counter (“OTC”) market. An MLP consists of one or more general partners, who conduct the business, and one or more limited partners, who contribute capital. MLP common unit holders have a limited role in the partnership’s operations and management. The Fund, as a limited partner, normally would not be liable for the debts of the MLP beyond the amounts the Fund has contributed, but would not be shielded to the same extent that a shareholder of a corporation would be. In certain circumstances creditors of an MLP would have the right to seek return of capital distributed to a limited partner. This right of an MLP’s creditors would continue after the Fund sold its investment in the MLP.
Equity Security Risk. Stocks and other equity securities fluctuate in price. The value of the Fund’s portfolio may be affected by changes in the equity markets generally. Equity markets may experience significant short-term volatility and may fall sharply at times. Different markets may behave differently from each other and U.S. equity markets may move in the opposite direction from one or more foreign stock markets. Adverse events in any part of the equity or fixed-income markets may have unexpected negative effects on other market segments.
The prices of individual equity securities generally do not all move in the same direction at the same time and a variety of factors can affect the price of a particular company’s securities. These factors may include, but are not limited to, poor earnings reports, a loss of customers, litigation against the company, general unfavorable performance of the company’s sector or industry, or changes in government regulations affecting the company or its industry.
Sovereign Debt Risk. The Fund invests in sovereign debt securities, which are subject to certain special risks. These risks include, but are not limited to, the risk that a governmental entity may delay or refuse, or otherwise be unable, to pay interest or repay the principal on its sovereign debt. There may also be no legal process for collecting sovereign debt that a government does not pay or bankruptcy proceedings through which all or part of such sovereign debt may be collected. In addition, a restructuring or default of sovereign debt may also cause additional impacts to the financial markets, such as downgrades to credit ratings, reduced liquidity and increased volatility, among others.
5. Market Risk Factors
The Fund’s investments in securities and/or financial derivatives may expose the Fund to various market risk factors:
Commodity Risk. Commodity risk relates to the change in value of commodities or commodity indexes as they relate to increases or decreases in the commodities market. Commodities are physical assets that have tangible properties. Examples of these types of assets are crude oil, heating oil, metals, livestock, and agricultural products.
Credit Risk. Credit risk relates to the ability of the issuer of debt to meet interest and
56 OPPENHEIMER GLOBAL ALLOCATION FUND
5. Market Risk Factors (Continued)
principal payments, or both, as they come due. In general, lower-grade, higher-yield debt securities are subject to credit risk to a greater extent than lower-yield, higher-quality securities.
Equity Risk. Equity risk relates to the change in value of equity securities as they relate to increases or decreases in the general market.
Foreign Exchange Rate Risk. Foreign exchange rate risk relates to the change in the U.S. dollar value of a security held that is denominated in a foreign currency. The U.S. dollar value of a foreign currency denominated security will decrease as the dollar appreciates against the currency, while the U.S. dollar value will increase as the dollar depreciates against the currency.
Interest Rate Risk. Interest rate risk refers to the fluctuations in value of fixed-income securities resulting from the inverse relationship between price and yield. For example, an increase in general interest rates will tend to reduce the market value of already issued fixed-income investments, and a decline in general interest rates will tend to increase their value. In addition, debt securities with longer maturities, which tend to have higher yields, are subject to potentially greater fluctuations in value from changes in interest rates than obligations with shorter maturities.
Volatility Risk. Volatility risk refers to the magnitude of the movement, but not the direction of the movement, in a financial instrument’s price over a defined time period. Large increases or decreases in a financial instrument’s price over a relative time period typically indicate greater volatility risk, while small increases or decreases in its price typically indicate lower volatility risk.
6. Use of Derivatives
The Fund’s investment objective not only permits the Fund to purchase investment securities, it also allows the Fund to enter into various types of derivatives contracts, including, but not limited to, futures contracts, forward currency exchange contracts, credit default swaps, interest rate swaps, total return swaps, variance swaps and purchased and written options. In doing so, the Fund will employ strategies in differing combinations to permit it to increase, decrease, or change the level or types of exposure to market risk factors. These instruments may allow the Fund to pursue its objectives more quickly and efficiently than if it were to make direct purchases or sales of securities capable of effecting a similar response to market factors. Such contracts may be entered into through a bilateral over-the-counter (“OTC”) transaction, or through a securities or futures exchange and cleared through a clearinghouse.
Derivatives may have little or no initial cash investment relative to their market value exposure and therefore can produce significant gains or losses in excess of their cost due to changes in the market risk factors and the overall market. This use of embedded leverage allows the Fund to increase its market value exposure relative to its net assets and can substantially increase the volatility of the Fund’s performance. In instances where the Fund is using derivatives to decrease, or hedge, exposures to market risk factors for securities held by the Fund, there are also risks that those derivatives may not perform as expected resulting in
57 OPPENHEIMER GLOBAL ALLOCATION FUND
NOTES TO CONSOLIDATED FINANCIAL STATEMENTS Continued |
6. Use of Derivatives (Continued)
losses for the combined or hedged positions. Some derivatives have the potential for unlimited loss, regardless of the size of the Fund’s initial investment.
Additional associated risks from investing in derivatives also exist and potentially could have significant effects on the valuation of the derivative and the Fund. Typically, the associated risks are not the risks that the Fund is attempting to increase or decrease exposure to, per its investment objectives, but are the additional risks from investing in derivatives. Examples of these associated risks are liquidity risk, which is the risk that the Fund will not be able to sell the derivative in the open market in a timely manner, and counterparty credit risk, which is the risk that the counterparty will not fulfill its obligation to the Fund.
The Fund’s actual exposures to these market risk factors and associated risks during the period are discussed in further detail, by derivative type, below.
Forward Currency Exchange Contracts
The Fund may enter into forward currency exchange contracts (“forward contracts”) for the purchase or sale of a foreign currency at a negotiated rate at a future date. Such contracts are traded in the OTC inter-bank currency dealer market.
Forward contracts are reported on a schedule following the Consolidated Statement of Investments. The unrealized appreciation (depreciation) is reported in the Consolidated Statement of Assets and Liabilities as a receivable (or payable) and in the Consolidated Statement of Operations within the change in unrealized appreciation (depreciation). At contract close, the difference between the original cost of the contract and the value at the close date is recorded as a realized gain (loss) in the Consolidated Statement of Operations.
The Fund may enter into forward foreign currency exchange contracts in order to decrease exposure to foreign exchange rate risk associated with either specific transactions or portfolio instruments or to increase exposure to foreign exchange rate risk.
During the reporting period, the Fund had daily average contract amounts on forward contracts to buy and sell of $675,588,672 and $1,025,631,086, respectively.
Additional associated risk to the Fund includes counterparty credit risk. Counterparty credit risk arises from the possibility that the counterparty to a forward contract will default and fail to perform its obligations to the Fund.
Futures Contracts
A futures contract is a commitment to buy or sell a specific amount of a commodity, financial instrument or currency at a negotiated price on a stipulated future date. The Fund may buy and sell futures contracts and may also buy or write put or call options on these futures contracts. Futures contracts and options thereon are generally entered into on a regulated futures exchange and cleared through a clearinghouse associated with the exchange.
Upon entering into a futures contract, the Fund is required to deposit either cash or securities (initial margin) in an amount equal to a certain percentage of the contract value in an account registered in the futures commission merchant’s name. Subsequent payments (variation margin) are paid to or from the futures commission merchant each day equal to the daily changes in the contract value. Such payments are recorded as unrealized gains
58 OPPENHEIMER GLOBAL ALLOCATION FUND
6. Use of Derivatives (Continued)
and losses. Should the Fund fail to make requested variation margin payments, the futures commission merchant can gain access to the initial margin to satisfy the Fund’s payment obligations.
Futures contracts are reported on a schedule following the Consolidated Statement of Investments. Securities held by a futures commission merchant to cover initial margin requirements on open futures contracts are noted in the Consolidated Statement of Investments. Cash held by a futures commission merchant to cover initial margin requirements on open futures contracts and the receivable and/or payable for the daily mark to market for the variation margin are noted in the Consolidated Statement of Assets and Liabilities. The net change in unrealized appreciation and depreciation is reported in the Consolidated Statement of Operations. Realized gains (losses) are reported in the Consolidated Statement of Operations at the closing or expiration of futures contracts.
The Fund may purchase and/or sell financial futures contracts and options on futures contracts to gain exposure to, or decrease exposure to interest rate risk, equity risk, foreign exchange rate risk, volatility risk, or commodity risk.
During the reporting period, the Fund had an ending monthly average market value of $463,292,897 and $119,422,527 on futures contracts purchased and sold, respectively.
Additional associated risks of entering into futures contracts (and related options) include the possibility that there may be an illiquid market where the Fund is unable to liquidate the contract or enter into an offsetting position and, if used for hedging purposes, the risk that the price of the contract will correlate imperfectly with the prices of the Fund’s securities.
Option Activity
The Fund may buy and sell put and call options, or write put and call options. When an option is written, the Fund receives a premium and becomes obligated to sell or purchase the underlying security, currency or other underlying financial instrument at a fixed price, upon exercise of the option.
Options can be traded through an exchange or through a privately negotiated arrangement with a dealer in an OTC transaction. Options traded through an exchange are generally cleared through a clearinghouse (such as The Options Clearing Corporation). The difference between the premium received or paid, and market value of the option, is recorded as unrealized appreciation or depreciation. The net change in unrealized appreciation or depreciation is reported in the Consolidated Statement of Operations. When an option is exercised, the cost of the security purchased or the proceeds of the security sale are adjusted by the amount of premium received or paid. Upon the expiration or closing of the option transaction, a gain or loss is reported in the Consolidated Statement of Operations.
Foreign Currency Options. The Fund may purchase or write call and put options on currencies to increase or decrease exposure to foreign exchange rate risk. A purchased call, or written put option becomes more valuable as the price of the underlying financial instrument appreciates relative to the strike price. A purchased put, or written call option becomes more valuable as the price of the underlying financial instrument depreciates relative to the strike price.
59 OPPENHEIMER GLOBAL ALLOCATION FUND
NOTES TO CONSOLIDATED FINANCIAL STATEMENTS Continued |
6. Use of Derivatives (Continued)
Index/Security Options. The Fund may purchase or write call and put options on individual equity securities and/or equity indexes to increase or decrease exposure to equity risk. A purchased call or written put option becomes more valuable as the price of the underlying financial instrument appreciates relative to the strike price. A purchased put or written call option becomes more valuable as the price of the underlying financial instrument depreciates relative to the strike price.
During the reporting period, the Fund had an ending monthly average market value of $135,109 and $115,966 on purchased call options and purchased put options, respectively.
Options written, if any, are reported in a schedule following the Consolidated Statement of Investments and as a liability in the Consolidated Statement of Assets and Liabilities. Securities held in collateral accounts to cover potential obligations with respect to outstanding written options are noted in the Consolidated Statement of Investments.
The risk in writing a call option is the market price of the underlying security increasing above the strike price and the option being exercised. The Fund must then purchase the underlying security at the higher market price and deliver it for the strike price or, if it owns the underlying security, deliver it at the strike price and forego any benefit from the increase in the price of the underlying security above the strike price. The risk in writing a put option is the market price of the underlying security decreasing below the strike price and the option being exercised. The Fund must then purchase the underlying security at the strike price when the market price of the underlying security is below the strike price. Alternatively, the Fund could also close out a written option position, in which case the risk is that the closing transaction will require a premium to be paid by the Fund that is greater than the premium the Fund received. When writing options, the Fund has the additional risk that there may be an illiquid market where the Fund is unable to close the contract. The risk in buying an option is that the Fund pays a premium for the option, and the option may be worth less than the premium paid or expire worthless.
During the reporting period, the Fund had an ending monthly average market value of $265,120 and $468,069 on written call options and written put options, respectively.
Additional associated risks to the Fund include counterparty credit risk and liquidity risk.
Swap Contracts
The Fund may enter into swap contract agreements with a counterparty to exchange a series of cash flows based on either specified reference rates, the price or volatility of asset or non-asset references, or the occurrence of a credit event, over a specified period. Swaps can be executed in a bi-lateral privately negotiated arrangement with a dealer in an OTC transaction (“OTC swaps”) or executed on a regulated market. Certain swaps, regardless of the venue of their execution, are required to be cleared through a clearinghouse (“centrally cleared swaps”). Swap contracts may include interest rate, equity, debt, index, total return, credit default, currency, and volatility swaps.
Swap contracts are reported on a schedule following the Consolidated Statement of Investments. The values of centrally cleared swap and OTC swap contracts are aggregated by positive and negative values and disclosed separately on the Consolidated Statement of
60 OPPENHEIMER GLOBAL ALLOCATION FUND
6. Use of Derivatives (Continued)
Assets and Liabilities. The unrealized appreciation (depreciation) related to the change in the valuation of the notional amount of the swap is combined with the accrued interest due to (owed by) the Fund, if any, at termination or settlement. The net change in this amount during the period is included on the Consolidated Statement of Operations. The Fund also records any periodic payments received from (paid to) the counterparty, including at termination, under such contracts as realized gain (loss) on the Consolidated Statement of Operations.
Swap contract agreements are exposed to the market risk factor of the specific underlying reference rate or asset. Swap contracts are typically more attractively priced compared to similar investments in related cash securities because they isolate the risk to one market risk factor and eliminate the other market risk factors. Investments in cash securities (for instance bonds) have exposure to multiple risk factors (credit and interest rate risk). Because swaps have embedded leverage, they can expose the Fund to substantial risk in the isolated market risk factor.
Credit Default Swap Contracts. A credit default swap is a contract that enables an investor to buy or sell protection against a defined-issuer credit event, such as the issuer’s failure to make timely payments of interest or principal on a debt security, bankruptcy or restructuring. The Fund may enter into credit default swaps either by buying or selling protection on a corporate issuer, sovereign issuer, or a basket or index of issuers (the “reference asset”).
The buyer of protection pays a periodic fee to the seller of protection based on the notional amount of the swap contract. The seller of protection agrees to compensate the buyer of protection for future potential losses as a result of a credit event on the reference asset. The contract effectively transfers the credit event risk of the reference asset from the buyer of protection to the seller of protection.
The ongoing value of the contract will fluctuate throughout the term of the contract based primarily on the credit risk of the reference asset. If the credit quality of the reference asset improves relative to the credit quality at contract initiation, the buyer of protection may have an unrealized loss greater than the anticipated periodic fee owed. This unrealized loss would be the result of current credit protection being cheaper than the cost of credit protection at contract initiation. If the buyer elects to terminate the contract prior to its maturity, and there has been no credit event, this unrealized loss will become realized. If the contract is held to maturity, and there has been no credit event, the realized loss will be equal to the periodic fee paid over the life of the contract.
If there is a credit event, the buyer of protection can exercise its rights under the contract and receive a payment from the seller of protection equal to the notional amount of the swap less the market value of specified debt securities issued by the reference asset. Upon exercise of the contract the difference between such value and the notional amount is recorded as realized gain (loss) and is included on the Consolidated Statement of Operations.
The Fund may purchase or sell credit protection through credit default swaps to increase or decrease exposure to the credit risk of individual issuers and/or indexes of issuers that are either unavailable or considered to be less attractive in the bond market.
61 OPPENHEIMER GLOBAL ALLOCATION FUND
NOTES TO CONSOLIDATED FINANCIAL STATEMENTS Continued |
6. Use of Derivatives (Continued)
For the reporting period, the Fund had ending monthly average notional amounts of $23,770,769 on credit default swaps to buy protection.
Additional associated risks to the Fund include counterparty credit risk and liquidity risk.
Interest Rate Swap Contracts. An interest rate swap is an agreement between counterparties to exchange periodic payments based on interest rates. One cash flow stream will typically be a floating rate payment based upon a specified floating interest rate while the other is typically a fixed interest rate.
The Fund may enter into interest rate swaps in which it pays the fixed or floating interest rate in order to increase or decrease exposure to interest rate risk. Typically, if relative interest rates rise, floating payments under a swap agreement will be greater than the fixed payments.
For the reporting period, the Fund had ending monthly average notional amounts of $98,322,095 and $129,947,417 on interest rate swaps which pay a fixed rate and interest rate swaps which receive a fixed rate, respectively.
At period end, the Fund had no interest rate swap agreements outstanding.
Additional associated risks to the Fund include counterparty credit risk and liquidity risk.
Total Return Swap Contracts. A total return swap is an agreement between counterparties to exchange periodic payments based on the value of asset or non-asset references. One cash flow is typically based on a non-asset reference (such as an interest rate) and the other on the total return of a reference asset (such as a security or a basket of securities or securities index). The total return of the reference asset typically includes appreciation or depreciation on the reference asset, plus any interest or dividend payments.
Total return swap contracts are exposed to the market risk factor of the specific underlying financial instrument or index. Total return swaps are less standard in structure than other types of swaps and can isolate and/or include multiple types of market risk factors including equity risk, credit risk, and interest rate risk.
The Fund may enter into total return swaps on various equity securities or indexes to increase or decrease exposure to equity risk. These equity risk related total return swaps require the Fund to pay or receive a floating reference interest rate, and an amount equal to the opposite price movement of securities or an index (expressed as a percentage) multiplied by the notional amount of the contract. Equity leg payments equal to the positive price movement of the same securities or index (expressed as a percentage) multiplied by the notional amount of the contract and, in some cases, dividends paid on the securities. Reference leg payments equal a floating reference interest rate and an amount equal to the negative price movement of the same securities or index (expressed as a percentage) multiplied by the notional amount of the contract.
The Fund may enter into total return swaps to increase or decrease exposure to the credit risk of various indexes or basket of securities. These credit risk related total return swaps require the Fund to pay to, or receive payments from, the counterparty based on the movement of credit spreads of the related indexes or securities.
For the reporting period, the Fund had ending monthly average notional amounts of $9,081,845 on total return swaps which are short the reference asset.
62 OPPENHEIMER GLOBAL ALLOCATION FUND
6. Use of Derivatives (Continued)
Additional associated risks to the Fund include counterparty credit risk and liquidity risk.
Swaption Transactions
The Fund may enter into a swaption contract which grants the purchaser the right, but not the obligation, to enter into a swap transaction at preset terms detailed in the underlying agreement within a specified period of time. The purchaser pays a premium to the swaption writer who bears the risk of unfavorable changes in the preset terms on the underlying swap.
Purchased swaptions are reported as a component of investments in the Consolidated Statement of Investments and the Consolidated Statement of Assets and Liabilities. Written swaptions are reported on a schedule following the Consolidated Statement of Investments and their value is reported as a separate asset or liability line item in the Consolidated Statement of Assets and Liabilities. The net change in unrealized appreciation or depreciation on written swaptions is separately reported in the Consolidated Statement of Operations. When a swaption is exercised, the cost of the swap is adjusted by the amount of premium paid or received. Upon the expiration or closing of an unexercised swaption contract, a gain or loss is reported in the Consolidated Statement of Operations for the amount of the premium paid or received.
The Fund generally will incur a greater risk when it writes a swaption than when it purchases a swaption. When the Fund writes a swaption it will become obligated, upon exercise of the swaption, according to the terms of the underlying agreement. Swaption contracts written by the Fund do not give rise to counterparty credit risk prior to exercise as they obligate the Fund, not its counterparty, to perform. When the Fund purchases a swaption it only risks losing the amount of the premium it paid if the swaption expires unexercised. However, when the Fund exercises a purchased swaption there is a risk that the counterparty will fail to perform or otherwise default on its obligations under the swaption contract.
The Fund may purchase swaptions which give it the option to enter into an interest rate swap in which it pays a floating or fixed interest rate and receives a fixed or floating interest rate in order to increase or decrease exposure to interest rate risk. Purchasing the fixed portion of this swaption becomes more valuable as the reference interest rate decreases relative to the preset interest rate. Purchasing the floating portion of this swaption becomes more valuable as the reference interest rate increases relative to the preset interest rate.
At period end, the Fund had no purchased swaption contracts outstanding.
The Fund may write swaptions which give it the obligation, if exercised by the purchaser, to enter into an interest rate swap in which it pays a fixed or floating interest rate and receives a floating or fixed interest rate in order to increase or decrease exposure to interest rate risk. A written swaption paying a fixed rate becomes more valuable as the reference interest rate increases relative to the preset interest rate. A written swaption paying a floating rate becomes more valuable as the reference interest rate decreases relative to the preset interest rate.
During the reporting period, the Fund had an ending monthly average market value of $3,520 and $6,493 on purchased and written swaptions, respectively.
At period end, the Fund had no written swaption contracts outstanding.
63 OPPENHEIMER GLOBAL ALLOCATION FUND
NOTES TO CONSOLIDATED FINANCIAL STATEMENTS Continued |
6. Use of Derivatives (Continued)
Counterparty Credit Risk. Derivative positions are subject to the risk that the counterparty will not fulfill its obligation to the Fund. The Fund intends to enter into derivative transactions with counterparties that the Manager believes to be creditworthy at the time of the transaction.
The Fund’s risk of loss from counterparty credit risk on OTC derivatives is generally limited to the aggregate unrealized gain netted against any collateral held by the Fund. For OTC options purchased, the Fund bears the risk of loss of the amount of the premiums paid plus the positive change in market values net of any collateral held by the Fund should the counterparty fail to perform under the contracts. Options written by the Fund do not typically give rise to counterparty credit risk, as options written generally obligate the Fund and not the counterparty to perform.
To reduce counterparty risk with respect to OTC transactions, the Fund has entered into master netting arrangements, established within the Fund’s International Swap and Derivatives Association, Inc. (“ISDA”) master agreements, which allow the Fund to make (or to have an entitlement to receive) a single net payment in the event of default (close-out netting) for outstanding payables and receivables with respect to certain OTC positions in swaps, options, swaptions, and forward currency exchange contracts for each individual counterparty. In addition, the Fund may require that certain counterparties post cash and/or securities in collateral accounts to cover their net payment obligations for those derivative contracts subject to ISDA master agreements. If the counterparty fails to perform under these contracts and agreements, the cash and/or securities will be made available to the Fund.
At period end, the Fund has required certain counterparties to post collateral of $12,739,517.
ISDA master agreements include credit related contingent features which allow counterparties to OTC derivatives to terminate derivative contracts prior to maturity in the event that, for example, the Fund’s net assets decline by a stated percentage or the Fund fails to meet the terms of its ISDA master agreements, which would cause the Fund to accelerate payment of any net liability owed to the counterparty.
For financial reporting purposes, the Fund does not offset derivative assets and derivative liabilities that are subject to netting arrangements in the Consolidated Statement of Assets and Liabilities. Bankruptcy or insolvency laws of a particular jurisdiction may impose restrictions on or prohibitions against the right of offset in bankruptcy, insolvency or other events.
The Fund’s risk of loss from counterparty credit risk on exchange-traded derivatives cleared through a clearinghouse and for centrally cleared swaps is generally considered lower than as compared to OTC derivatives. However, counterparty credit risk exists with respect to initial and variation margin deposited/paid by the Fund that is held in futures commission merchant, broker and/or clearinghouse accounts for such exchange-traded derivatives and for centrally cleared swaps.
With respect to centrally cleared swaps, such transactions will be submitted for clearing, and if cleared, will be held in accounts at futures commission merchants or brokers that are members of clearinghouses. While brokers, futures commission merchants and clearinghouses
64 OPPENHEIMER GLOBAL ALLOCATION FUND
6. Use of Derivatives (Continued)
are required to segregate customer margin from their own assets, in the event that a broker, futures commission merchant or clearinghouse becomes insolvent or goes into bankruptcy and at that time there is a shortfall in the aggregate amount of margin held by the broker, futures commission merchant or clearinghouse for all its customers, U.S. bankruptcy laws will typically allocate that shortfall on a pro-rata basis across all the broker’s, futures commission merchant’s or clearinghouse’s customers, potentially resulting in losses to the Fund.
There is the risk that a broker, futures commission merchant or clearinghouse will decline to clear a transaction on the Fund’s behalf, and the Fund may be required to pay a termination fee to the executing broker with whom the Fund initially enters into the transaction. Clearinghouses may also be permitted to terminate centrally cleared swaps at any time. The Fund is also subject to the risk that the broker or futures commission merchant will improperly use the Fund’s assets deposited/paid as initial or variation margin to satisfy payment obligations of another customer. In the event of a default by another customer of the broker or futures commission merchant, the Fund might not receive its variation margin payments from the clearinghouse, due to the manner in which variation margin payments are aggregated for all customers of the broker/futures commission merchant.
Collateral and margin requirements differ by type of derivative. Margin requirements are established by the broker, futures commission merchant or clearinghouse for exchange-traded and cleared derivatives, including centrally cleared swaps. Brokers, futures commission merchants and clearinghouses can ask for margin in excess of the regulatory minimum, or increase the margin amount, in certain circumstances.
Collateral terms are contract specific for OTC derivatives. For derivatives traded under an ISDA master agreement, the collateral requirements are typically calculated by netting the mark to market amount for each transaction under such agreement and comparing that amount to the value of any collateral currently pledged by the Fund or the counterparty.
For financial reporting purposes, cash collateral that has been pledged to cover obligations of the Fund, if any, is reported separately on the Consolidated Statement of Assets and Liabilities as cash pledged as collateral. Non-cash collateral pledged by the Fund, if any, is noted in the Consolidated Statement of Investments. Generally, the amount of collateral due from or to a party must exceed a minimum transfer amount threshold (e.g., $250,000) before a transfer has to be made. To the extent amounts due to the Fund from its counterparties are not fully collateralized, contractually or otherwise, the Fund bears the risk of loss from counterparty nonperformance.
The following table presents by counterparty the Fund’s OTC derivative assets net of the related collateral pledged by the Fund at period end:
65 OPPENHEIMER GLOBAL ALLOCATION FUND
NOTES TO CONSOLIDATED FINANCIAL STATEMENTS Continued |
6. Use of Derivatives (Continued)
| Gross Amounts Not Offset in the Consolidated Statement of Assets & Liabilities | ||||||||||||||||||||
| Counterparty | Gross Amounts Not Offset in the Consolidated Statement of Assets & Liabilities* | Financial Instruments Available for Offset | Financial Instruments Collateral Received** | Cash Collateral Received** | Net Amount | |||||||||||||||
Bank of America NA | $ | 2,328,746 | $ | (141,548) | $ | (2,187,198) | $ | – | $ | – | ||||||||||
Barclays Bank plc | 310,269 | (310,269) | – | – | – | |||||||||||||||
Citibank NA | 643,190 | (643,190) | – | – | – | |||||||||||||||
Deutsche Bank AG | 6,449,580 | (75,618) | (3,610,033) | (2,315,000) | 448,929 | |||||||||||||||
Goldman Sachs Bank | ||||||||||||||||||||
USA | 104,245 | (104,245) | – | – | – | |||||||||||||||
HSBC Bank USA NA | 1,552,572 | (139,725) | (1,412,847) | – | – | |||||||||||||||
JPMorgan Chase Bank | ||||||||||||||||||||
NA |
| 1,108,960
|
|
| (666,936)
|
|
| (442,024)
|
|
| –
|
|
| –
|
| |||||
|
| |||||||||||||||||||
$ |
12,497,562 |
|
$ |
(2,081,531) |
|
$ |
(7,652,102) |
|
$ |
(2,315,000) |
|
$ |
448,929 |
| ||||||
|
| |||||||||||||||||||
*OTC derivatives are reported gross on the Consolidated Statement of Assets and Liabilities. Exchange traded options and margin related to centrally cleared swaps and futures, if any, are excluded from these reported amounts.
**Reported collateral posted for the benefit of the Fund within this table is limited to the net outstanding amount due from an individual counterparty. The collateral posted for the benefit of the Fund may exceed these amounts.
The following table presents by counterparty the Fund’s OTC derivative liabilities net of the related collateral pledged by the Fund at period end:
| Gross Amounts Not Offset in the Consolidated Statement of Assets & Liabilities | ||||||||||||||||||||
| Counterparty | Gross Amounts Not Offset in the Consolidated Statement of Assets & Liabilities* | Financial Instruments Available for Offset | Financial Instruments Collateral Pledged** | Cash Collateral Pledged** | Net Amount | |||||||||||||||
Bank of America NA | $ | (141,548) | $ | 141,548 | $ | – | $ | – | $ | – | ||||||||||
Barclays Bank plc | (951,178) | 310,269 | 530,748 | – | (110,161) | |||||||||||||||
Citibank NA | (1,706,569) | 643,190 | 1,016,648 | – | (46,731) | |||||||||||||||
Deutsche Bank AG | (75,618) | 75,618 | – | – | – | |||||||||||||||
Goldman Sachs Bank | ||||||||||||||||||||
USA | (204,451) | 104,245 | – | – | (100,206) | |||||||||||||||
HSBC Bank USA NA | (139,725) | 139,725 | – | – | – | |||||||||||||||
JPMorgan Chase Bank | ||||||||||||||||||||
NA |
| (666,936)
|
|
| 666,936
|
|
| –
|
|
| –
|
|
| –
|
| |||||
|
| |||||||||||||||||||
$ |
(3,886,025) |
|
$ |
2,081,531 |
|
$ |
1,547,396 |
|
$ |
– |
|
$ |
(257,098) |
| ||||||
|
| |||||||||||||||||||
*OTC derivatives are reported gross on the Consolidated Statement of Assets and Liabilities. Exchange traded options and margin related to centrally cleared swaps and futures, if any, are excluded from these reported amounts.
**Reported collateral pledged within this table is limited to the net outstanding amount due from the Fund. The securities pledged as collateral by the Fund as reported on the Consolidated Statement of Investments may exceed these amounts.
66 OPPENHEIMER GLOBAL ALLOCATION FUND
6. Use of Derivatives (Continued)
The following table presents the valuations of derivative instruments by risk exposure as reported within the Consolidated Statement of Assets and Liabilities at period end:
Asset Derivatives | Liability Derivatives | |||||||||||
Derivatives Not Accounted for as Hedging Instruments
| Consolidated Statement of Assets
| Value
| Consolidated Statement of Assets
| Value
| ||||||||
Equity contracts | Swaps, at value | $ | 420,588 | Swaps, at value | $ | 45,193 | ||||||
Credit contracts | Centrally cleared swaps, | |||||||||||
| at value | 4,222,204 | |||||||||||
Equity contracts | Variation margin receivable | 2,446,968* | Variation margin payable | 3,233,798* | ||||||||
Interest rate contracts | Variation margin payable | 800,825* | ||||||||||
| Unrealized appreciation on | Unrealized depreciation on | |||||||||||
Forward currency | forward currency exchange | forward currency exchange | ||||||||||
exchange contracts | contracts | 10,797,612 | contracts | 3,837,850 | ||||||||
Currency contracts | Options written, at value | 2,982 | ||||||||||
Currency contracts | Investments, at value | 1,279,362** | ||||||||||
|
|
|
| |||||||||
Total | $ | 14,944,530 | $ | 12,142,852 | ||||||||
|
|
|
| |||||||||
*Includes only the current day’s variation margin. Prior variation margin movements have been reflected in cash on the Consolidated Statement of Assets and Liabilities upon receipt or payment.
**Amounts relate to purchased option contracts and purchased swaption contracts, if any.
The effect of derivative instruments on the Consolidated Statement of Operations is as follows:
Amount of Realized Gain or (Loss) Recognized on Derivatives
| ||||||||||||||||
Derivatives Not Accounted for as Hedging Instruments
| Investment
| Swaption
| Option
| Futures
| ||||||||||||
Commodity contracts | $ | — | $ | — | $ | — | $ | 4,568,691 | ||||||||
Credit contracts | — | — | — | — | ||||||||||||
Currency contracts | (261,555) | — | 55,927 | — | ||||||||||||
Equity contracts | (32,606) | — | (159,240) | (2,110,558) | ||||||||||||
Forward currency exchange contracts | — | — | — | — | ||||||||||||
Interest rate contracts | (16,970) | 28,894 | — | (1,353,115) | ||||||||||||
Volatility contracts | — | — | — | (223,340) | ||||||||||||
|
| |||||||||||||||
Total | $ | (311,131) | $ | 28,894 | $ | (103,313) | $ | 881,678 | ||||||||
|
| |||||||||||||||
67 OPPENHEIMER GLOBAL ALLOCATION FUND
NOTES TO CONSOLIDATED
FINANCIAL STATEMENTS Continued
6. Use of Derivatives (Continued)
Amount of Realized Gain or (Loss) Recognized on Derivatives (Continued)
| ||||||||||||
Derivatives Not Accounted for as Hedging Instruments
| Forward
| Swap contracts
| Total
| |||||||||
Commodity contracts | $ | — | $ | — | $ | 4,568,691 | ||||||
Credit contracts | — | (168,566) | (168,566) | |||||||||
Currency contracts | — | — | (205,628) | |||||||||
Equity contracts | — | 674,289 | (1,628,115) | |||||||||
Forward currency exchange contracts | (571,034) | — | (571,034) | |||||||||
Interest rate contracts | — | (3,723,123) | (5,064,314) | |||||||||
Volatility contracts | — | — | (223,340) | |||||||||
|
| |||||||||||
Total | $ | (571,034) | $ | (3,217,400) | $ | (3,292,306) | ||||||
|
| |||||||||||
*Includes purchased option contracts and purchased swaption contracts, if any.
Amount of Change in Unrealized Gain or (Loss) Recognized on Derivatives
| ||||||||||||||||
Derivatives Not Accounted for as Hedging Instruments
| Investment
| Option
| Swaption
| Futures
| ||||||||||||
Credit contracts | $ | — | $ | — | $ | — | $ | — | ||||||||
Currency contracts | 452,688 | 33,618 | — | — | ||||||||||||
Equity contracts | — | — | — | 4,304,640 | ||||||||||||
Forward currency exchange contracts | — | — | — | — | ||||||||||||
Interest rate contracts | — | — | (6) | (2,617,162) | ||||||||||||
|
| |||||||||||||||
Total | $ | 452,688 | $ | 33,618 | $ | (6) | $ | 1,687,478 | ||||||||
|
| |||||||||||||||
Amount of Change in Unrealized Gain or (Loss) Recognized on Derivatives (Continued)
| ||||||||||||
Derivatives Not Accounted for as Hedging Instruments
| Forward
| Swap
| Total
| |||||||||
Credit contracts | $ | — | $ | 455,252 | $ | 455,252 | ||||||
Currency contracts | — | — | 486,306 | |||||||||
Equity contracts | — | 375,395 | 4,680,035 | |||||||||
Forward currency exchange contracts | 7,227,109 | — | 7,227,109 | |||||||||
Interest rate contracts | — | 65,336 | (2,551,832) | |||||||||
|
| |||||||||||
Total | $ | 7,227,109 | $ | 895,983 | $ | 10,296,870 | ||||||
|
| |||||||||||
*Includes purchased option contracts and purchased swaption contracts, if any.
7. Shares of Beneficial Interest
The Fund has authorized an unlimited number of $0.01 par value shares of beneficial interest of each class. Transactions in shares of beneficial interest were as follows:
68 OPPENHEIMER GLOBAL ALLOCATION FUND
7. Shares of Beneficial Interest (Continued)
| Year Ended October 31, 2018 | Year Ended October 31, 2017 | |||||||||||||||||
| Shares | Amount | Shares | Amount | |||||||||||||||
| ||||||||||||||||||
Class A | ||||||||||||||||||
Sold1 | 3,892,757 | $ | 76,793,596 | 5,154,234 | $ | 95,608,718 | ||||||||||||
Dividends and/or distributions reinvested | 7,324 | 144,168 | 1,712,064 | 29,581,846 | ||||||||||||||
Redeemed | (8,326,343 | ) | (163,510,484 | ) | (9,731,041 | ) | (178,623,382) | |||||||||||
| ||||||||||||||||||
Net decrease | (4,426,262 | ) | $ | (86,572,720 | ) | (2,864,743 | ) | $ | (53,432,818) | |||||||||
| ||||||||||||||||||
Class B | ||||||||||||||||||
Sold | 1,476 | $ | 27,898 | 12,873 | $ | 227,380 | ||||||||||||
Dividends and/or distributions reinvested | — | — | 24,311 | 403,325 | ||||||||||||||
Redeemed1 | (391,006 | ) | (7,365,674 | ) | (722,308 | ) | (12,680,465) | |||||||||||
| ||||||||||||||||||
Net decrease | (389,530 | ) | $ | (7,337,776 | ) | (685,124 | ) | $ | (12,049,760) | |||||||||
| ||||||||||||||||||
Class C | ||||||||||||||||||
Sold | 1,785,156 | $ | 33,706,692 | 1,750,056 | $ | 31,150,274 | ||||||||||||
Dividends and/or distributions reinvested | — | — | 333,508 | 5,532,894 | ||||||||||||||
Redeemed | (2,545,096 | ) | (47,759,820 | ) | (3,329,805 | ) | (59,161,400) | |||||||||||
| ||||||||||||||||||
Net decrease | (759,940 | ) | $ | (14,053,128 | ) | (1,246,241 | ) | $ | (22,478,232) | |||||||||
| ||||||||||||||||||
Class I | ||||||||||||||||||
Sold | 717,977 | $ | 14,132,813 | 233,115 | $ | 4,345,192 | ||||||||||||
Dividends and/or distributions reinvested | 3,643 | 71,612 | 42,957 | 744,567 | ||||||||||||||
Redeemed | (368,963 | ) | (7,218,100 | ) | (150,802 | ) | (2,785,678) | |||||||||||
| ||||||||||||||||||
Net increase | 352,657 | $ | 6,986,325 | 125,270 | $ | 2,304,081 | ||||||||||||
| ||||||||||||||||||
Class R | ||||||||||||||||||
Sold | 587,616 | $ | 11,339,184 | 619,381 | $ | 11,315,722 | ||||||||||||
Dividends and/or distributions reinvested | — | — | 57,150 | 968,474 | ||||||||||||||
Redeemed | (623,730 | ) | (12,020,626 | ) | (571,515 | ) | (10,308,851) | |||||||||||
| ||||||||||||||||||
Net increase (decrease) | (36,114 | ) | $ | (681,442 | ) | 105,016 | $ | 1,975,345 | ||||||||||
| ||||||||||||||||||
Class Y | ||||||||||||||||||
Sold | 3,139,073 | $ | 61,765,740 | 4,104,270 | $ | 76,565,697 | ||||||||||||
Dividends and/or distributions reinvested | 8,931 | 175,574 | 103,417 | 1,791,705 | ||||||||||||||
Redeemed | (3,172,571 | ) | (62,081,668 | ) | (1,413,141 | ) | (25,871,144) | |||||||||||
| ||||||||||||||||||
Net increase (decrease) | (24,567 | ) | $ | (140,354 | ) | 2,794,546 | $ | 52,486,258 | ||||||||||
| ||||||||||||||||||
1. All outstanding Class B shares converted to Class A shares on June 1, 2018.
8. Purchases and Sales of Securities
The aggregate cost of purchases and proceeds from sales of securities, other than short-term obligations and investments in IGMMF, for the reporting period were as follows:
69 OPPENHEIMER GLOBAL ALLOCATION FUND
NOTES TO CONSOLIDATED
FINANCIAL STATEMENTS Continued
8. Purchases and Sales of Securities (Continued)
| Purchases | Sales | |||||||
Investment securities | $ | 2,193,063,056 | $ | 2,182,889,269 | ||||
U.S. government and government agency obligations | 67,927,221 | 44,976,200 | ||||||
9. Fees and Other Transactions with Affiliates
Management Fees. Under the investment advisory agreement, the Fund pays the Manager a management fee based on the daily net assets of the Fund at an annual rate as shown in the following table:
Fee Schedule | ||||||||
Up to $1.0 billion | 0.80 | % | ||||||
Next $2.0 billion | 0.76 | |||||||
Next $1.0 billion | 0.71 | |||||||
Next $1.0 billion | 0.66 | |||||||
Next $1.0 billion | 0.60 | |||||||
Next $1.0 billion | 0.55 | |||||||
Next $2.0 billion | 0.50 | |||||||
Over $9.0 billion | 0.48 | |||||||
The Manager also provides investment management related services to the Subsidiary. The Subsidiary pays the Manager a monthly management fee at an annual rate according to the above schedule. The Subsidiary also pays certain other expenses including custody and directors’ fees.
The Fund’s effective management fee for the reporting period was 0.78% of average annual net assets before any Subsidiary management fees or any applicable waivers.
Sub-Adviser Fees. The Manager has retained the Sub-Adviser to provide the day-to-day portfolio management of the Fund and the Subsidiary. Under the Sub-Advisory Agreement, the Manager pays the Sub-Adviser an annual fee in monthly installments, equal to a percentage of the investment management fee collected by the Manager from the Fund and the Subsidiary, which shall be calculated after any investment management fee waivers. The fee paid to the Sub-Adviser is paid by the Manager, not by the Fund.
Transfer Agent Fees. OFI Global (the “Transfer Agent”) serves as the transfer and shareholder servicing agent for the Fund. The Fund pays the Transfer Agent a fee based on annual net assets, which shall be calculated after any applicable fee waivers. Fees incurred and average net assets for each class with respect to these services are detailed in the Consolidated Statement of Operations and Consolidated Financial Highlights, respectively.
Sub-Transfer Agent Fees. The Transfer Agent has retained Shareholder Services, Inc., a wholly-owned subsidiary of OFI (the “Sub-Transfer Agent”), to provide the day-to-day transfer agent and shareholder servicing of the Fund. Under the Sub-Transfer Agency Agreement, the Transfer Agent pays the Sub-Transfer Agent an annual fee in monthly installments, equal to a percentage of the transfer agent fee collected by the Transfer Agent from the Fund, which shall be calculated after any applicable fee waivers. The fee paid to the Sub-Transfer Agent is paid
70 OPPENHEIMER GLOBAL ALLOCATION FUND
9. Fees and Other Transactions with Affiliates (Continued)
by the Transfer Agent, not by the Fund.
Trustees’ Compensation. The Fund has adopted an unfunded retirement plan (the “Plan”) for the Fund’s Independent Trustees. Benefits are based on years of service and fees paid to each Trustee during their period of service. The Plan was frozen with respect to adding new participants effective December 31, 2006 (the “Freeze Date”) and existing Plan Participants as of the Freeze Date will continue to receive accrued benefits under the Plan. Active Independent Trustees as of the Freeze Date have each elected a distribution method with respect to their benefits under the Plan.
During the reporting period, the Fund’s projected benefit obligations, payments to retired
Trustees and accumulated liability were as follows:
Projected Benefit Obligations Increased | $ | 3,144 | ||
Payments Made to Retired Trustees | 93,413 | |||
Accumulated Liability as of October 31, 2018 | 215,715 |
The Fund’s Board of Trustees (“Board”) has adopted a compensation deferral plan for Independent Trustees that enables Trustees to elect to defer receipt of all or a portion of the annual compensation they are entitled to receive from the Fund. For purposes of determining the amount owed to the Trustee under the plan, deferred amounts are treated as though equal dollar amounts had been invested in shares of the Fund or in other Oppenheimer funds selected by the Trustee. The Fund purchases shares of the funds selected for deferral by the Trustee in amounts equal to his or her deemed investment, resulting in a Fund asset equal to the deferred compensation liability. Such assets are included as a component of “Other” within the asset section of the Consolidated Statement of Assets and Liabilities. Deferral of Trustees’ fees under the plan will not affect the net assets of the Fund and will not materially affect the Fund’s assets, liabilities or net investment income per share. Amounts will be deferred until distributed in accordance with the compensation deferral plan.
Distribution and Service Plan (12b-1) Fees. Under its General Distributor’s Agreement with the Fund, OppenheimerFunds Distributor, Inc. (the “Distributor”) acts as the Fund’s principal underwriter in the continuous public offering of the Fund’s classes of shares.
Distribution and Service Plan for Class A Shares. The Fund has adopted a Distribution and Service Plan (the “Plan”) for Class A shares pursuant to Rule 12b-1 under the 1940 Act. Under the Plan, the Fund pays a service fee to the Distributor at an annual rate of 0.25% of the daily net assets of Class A shares. The Distributor currently uses all of those fees to pay dealers, brokers, banks and other financial institutions periodically for providing personal services and maintenance of accounts of their customers that hold Class A shares. Under the Plan, the Fund may also pay an asset-based sales charge to the Distributor. However, the Fund’s Board has currently set the rate at zero. Fees incurred by the Fund under the Plan are detailed in the Consolidated Statement of Operations.
71 OPPENHEIMER GLOBAL ALLOCATION FUND
NOTES TO CONSOLIDATED FINANCIAL STATEMENTS Continued | ||
9. Fees and Other Transactions with Affiliates (Continued)
Distribution and Service Plans for Class B, Class C and Class R Shares. The Fund has adopted Distribution and Service Plans (the “Plans”) for Class C and Class R shares, and had previously adopted a similar plan for Class B shares, pursuant to Rule 12b-1 under the 1940 Act to compensate the Distributor for distributing those share classes, maintaining accounts and providing shareholder services. Under the Plans, the Fund pays the Distributor an annual asset-based sales charge of 0.75% on Class C shares’ daily net assets and 0.25% on Class R shares’ daily net assets. The Fund paid the Distributor an annual asset-based sales charge of 0.75% on Class B shares prior to their Conversion Date. The Fund also pays a service fee under the Plans at an annual rate of 0.25% of daily net assets and previously paid this fee for Class B prior to their Conversion Date. The Plans continue in effect from year to year only if the Fund’s Board of Trustees votes annually to approve their continuance at an in person meeting called for that purpose. Fees incurred by the Fund under the Plans are detailed in the Consolidated Statement of Operations.
Sales Charges. Front-end sales charges and CDSC do not represent expenses of the Fund. They are deducted from the proceeds of sales of Fund shares prior to investment or from redemption proceeds prior to remittance, as applicable. The sales charges retained by the Distributor from the sale of shares and the CDSC retained by the Distributor on the redemption of shares is shown in the following table for the period indicated.
| Class A | Class B1 | Class C | Class R | |||||||||||||||||
| Class A | Contingent | Contingent | Contingent | Contingent | ||||||||||||||||
| Front-End | Deferred | Deferred | Deferred | Deferred | ||||||||||||||||
| Sales Charges | Sales Charges | Sales Charges | Sales Charges | Sales Charges | ||||||||||||||||
| Retained by | Retained by | Retained by | Retained by | Retained by | ||||||||||||||||
| Year Ended | Distributor | Distributor | Distributor | Distributor | Distributor | |||||||||||||||
October 31, 2018 | $216,723 | $— | $1,086 | $23,585 | $— | |||||||||||||||
1. Effective June 1, 2018, all Class B shares converted to Class A shares.
Waivers and Reimbursements of Expenses. The Manager has contractually agreed to waive the management fee it receives from the Fund in an amount equal to the management fee it receives from the Subsidiary. During the reporting period, the Manager waived $219,256. This fee waiver and/or expense reimbursement may not be amended or withdrawn for one year from the date of the Fund’s prospectus, unless approved by the Board.
Effective for the period January 1, 2017 through December 31, 2017, the Transfer Agent voluntarily waived and/or reimbursed Fund expenses in an amount equal to 0.015% of average annual net assets for Classes A, B, C, R and Y.
During the reporting period, the Transfer Agent waived fees and/or reimbursed the Fund for transfer agent and shareholder servicing agent fees as follows:
72 OPPENHEIMER GLOBAL ALLOCATION FUND
9. Fees and Other Transactions with Affiliates (Continued)
Class A | $ | 29,947 | ||
Class B1 | 151 | |||
Class C | 5,984 | |||
Class R | 1,087 | |||
Class Y | 3,191 |
1. Effective June 1, 2018, all Class B shares converted to Class A shares.
The Manager will waive fees and/or reimburse Fund expenses in an amount equal to the indirect management fees incurred through the Fund’s investments in Affiliated Funds. During the reporting period, the Manager waived fees and/or reimbursed the Fund $840,395 for these management fees. This fee waiver and/or expense reimbursement may not be amended or withdrawn for one year from the date of the Fund’s prospectus, unless approved by the Board.
Cross-Trades. The Fund is permitted to purchase and sell securities from and to other Funds managed by the Manager (“cross-trade”) pursuant to “Cross-Trading” Procedures adopted by the Fund’s Board of Trustees. These procedures are designed to ensure that any cross-trade of securities between Funds or between a Fund and another account or private fund that is an affiliate of the Fund solely by virtue of having a common investment adviser, common trustee/ director or common officer complies with Rule 17a-7 under the 1940 Act. Further, as defined under these procedures, each cross-trade is effected at the current market price.
During the period, the Fund had $34,804,131 in purchases and $35,252,509 in sales considered cross-trades, resulting in $(332,842) of realized gain/(loss).
10. Borrowings and Other Financing
Joint Credit Facility. A number of mutual funds managed by the Manager participate in a $1.95 billion revolving credit facility (the “Facility”) intended to provide short-term financing, if necessary, subject to certain restrictions in connection with atypical redemption activity. Expenses and fees related to the Facility are paid by the participating funds and are disclosed separately or as other expenses on the Consolidated Statement of Operations. The Fund did not utilize the Facility during the reporting period.
11. Pending Acquisition
On October 18, 2018, Massachusetts Mutual Life Insurance Company (“MassMutual”), an indirect corporate parent of the Sub-Adviser and the Manager announced that it has entered into a definitive agreement, whereby Invesco Ltd. (“Invesco”), a global investment management company, will acquire the Sub-Adviser. As of the time of the announcement, the transaction is expected to close in the second quarter of 2019, pending necessary regulatory and other third-party approvals. This is subject to change.
73 OPPENHEIMER GLOBAL ALLOCATION FUND
REPORT OF INDEPENDENT REGISTERED PUBLIC ACCOUNTING FIRM
To the Shareholders and Board of Trustees
Oppenheimer Quest for Value Funds:
Opinion on the Consolidated Financial Statements
We have audited the accompanying consolidated statement of assets and liabilities of Oppenheimer Global Allocation Fund (the “Fund”), a series of Oppenheimer Quest for Value Funds, and subsidiary, including the consolidated statement of investments, as of October 31, 2018, the related consolidated statement of operations for the year then ended, the consolidated statements of changes in net assets for each of the years in the two year period then ended, and the related consolidated notes (collectively, the “consolidated financial statements”) and the consolidated financial highlights for each of the years in the five year period then ended. In our opinion, the consolidated financial statements and consolidated financial highlights present fairly, in all material respects, the consolidated financial position of the Fund and subsidiary as of October 31, 2018, the results of their consolidated operations for the year then ended, the changes in their consolidated net assets for each of the years in the two year period then ended, and the consolidated financial highlights for each of the years in the five year period then ended, in conformity with U.S. generally accepted accounting principles.
Basis for Opinion
These consolidated financial statements and consolidated financial highlights are the responsibility of the Fund’s management. Our responsibility is to express an opinion on these consolidated financial statements and consolidated financial highlights based on our audits. We are a public accounting firm registered with the Public Company Accounting Oversight Board (United States) (“PCAOB”) and are required to be independent with respect to the Fund and subsidiary in accordance with the U.S. federal securities laws and the applicable rules and regulations of the Securities and Exchange Commission and the PCAOB.
We conducted our audits in accordance with the standards of the PCAOB. Those standards require that we plan and perform the audit to obtain reasonable assurance about whether the consolidated financial statements and consolidated financial highlights are free of material misstatement, whether due to error or fraud. Our audits included performing procedures to assess the risks of material misstatement of the consolidated financial statements and consolidated financial highlights, whether due to error or fraud, and performing procedures that respond to those risks. Such procedures included examining, on a test basis, evidence regarding the amounts and disclosures in the consolidated financial statements and consolidated financial highlights. Such procedures also included confirmation of securities owned as of October 31, 2018, by correspondence with the custodian, brokers and the transfer agent, or by other appropriate auditing procedures. Our audits also included evaluating the accounting principles used and significant estimates made by management, as well as evaluating the overall presentation of the consolidated financial statements and consolidated financial highlights. We believe that our audits provide a reasonable basis for our opinion.
KPMG LLP
We have not been able to determine the specific year that we began serving as the auditor of one or more Oppenheimer Funds investment companies, however we are aware that we have served as the auditor of one or more Oppenheimer Funds investment companies since at least 1969.
Denver, Colorado
December 21, 2018
74 OPPENHEIMER GLOBAL ALLOCATION FUND
| FEDERAL INCOME TAX INFORMATION Unaudited | ||
In early 2018, if applicable, shareholders of record received information regarding all dividends and distributions paid to them by the Fund during calendar year 2017.
Dividends, if any, paid by the Fund during the reporting period which are not designated as capital gain distributions should be multiplied by the maximum amount allowable but not less than 27.59% to arrive at the amount eligible for the corporate dividend-received deduction.
A portion, if any, of the dividends paid by the Fund during the reporting period which are not designated as capital gain distributions are eligible for lower individual income tax rates to the extent that the Fund has received qualified dividend income as stipulated by recent tax legislation. The maximum amount allowable but not less than $16,879,046 of the Fund’s fiscal year taxable income may be eligible for the lower individual income tax rates. In early 2018, shareholders of record received information regarding the percentage of distributions that are eligible for lower individual income tax rates.
Recent tax legislation allows a regulated investment company to designate distributions not designated as capital gain distributions, as either interest related dividends or short-term capital gain dividends, both of which are exempt from the U.S. withholding tax applicable to non U.S. taxpayers. For the reporting period, the maximum amount allowable but not less than $3,593,735 of the ordinary distributions to be paid by the Fund qualifies as an interest related dividend and the maximum amount allowable but not less than $1,201,173 of the short-term capital gain distribution to be paid by the Fund qualifies as a short-term capital gain dividend.
The foregoing information is presented to assist shareholders in reporting distributions received from the Fund to the Internal Revenue Service. Because of the complexity of the federal regulations which may affect your individual tax return and the many variations in state and local tax regulations, we recommend that you consult your tax advisor for specific guidance.
75 OPPENHEIMER GLOBAL ALLOCATION FUND
| BOARD APPROVAL OF THE FUND’S INVESTMENT ADVISORY AND SUB-ADVISORY AGREEMENTS Unaudited | ||
The Fund has entered into an investment advisory agreement with OFI Global Asset Management, Inc. (“OFI Global” or the “Adviser”), a wholly-owned subsidiary of OppenheimerFunds, Inc. (“OFI” or the “Sub-Adviser”) (“OFI Global” and “OFI” together the “Managers”) and OFI Global has entered into a sub-advisory agreement with OFI whereby OFI provides investment sub-advisory services to the Fund (collectively, the “Agreements”). Each year, the Board of Trustees (the “Board”), including a majority of the independent Trustees, is required to determine whether to approve the terms of the Agreements and the renewal thereof. The Investment Company Act of 1940, as amended, requires that the Board request and evaluate, and that the Managers provide, such information as may be reasonably necessary to evaluate the terms of the Agreements. The Board employs an independent consultant to prepare a report that provides information, including comparative information that the Board requests for that purpose. In addition to in-person meetings focused on this evaluation, the Board receives information throughout the year regarding Fund services, fees, expenses and performance.
The Managers and the independent consultant provided information to the Board on the following factors: (i) the nature, quality and extent of the Managers’ services, (ii) the comparative investment performance of the Fund and the Managers, (iii) the fees and expenses of the Fund, including comparative fee and expense information, (iv) the profitability of the Managers and their affiliates, including an analysis of the cost of providing services, (v) whether economies of scale are realized as the Fund grows and whether fee levels reflect these economies of scale for Fund investors and (vi) other benefits to the Managers from their relationship with the Fund. The Board was aware that there are alternatives to retaining the Managers.
Outlined below is a summary of the principal information considered by the Board as well as the Board’s conclusions.
Nature, Quality and Extent of Services. The Board considered information about the nature, quality and extent of the services provided to the Fund and information regarding the Managers’ key personnel who provide such services. The Managers’ duties include providing the Fund with the services of the Sub-Adviser’s portfolio managers and investment team, who provide research, analysis and other advisory services in regard to the Fund’s investments; and securities trading services. OFI Global is responsible for oversight of third-party service providers; monitoring compliance with applicable Fund policies and procedures and adherence to the Fund’s investment restrictions; risk management; and oversight of the Sub-Adviser. OFI Global is also responsible for providing certain administrative services to the Fund. Those services include providing and supervising all administrative and clerical personnel who are necessary in order to provide effective corporate administration for the Fund; compiling and maintaining records with respect to the Fund’s operations; preparing and filing reports required by the U.S. Securities and Exchange Commission; preparing periodic reports regarding the operations of the Fund for its shareholders; preparing proxy materials for shareholder meetings; and preparing the registration statements required by federal and state securities laws for the sale of the Fund’s shares. OFI Global also provides the Fund with office space, facilities and equipment.
76 OPPENHEIMER GLOBAL ALLOCATION FUND
The Board also considered the quality of the services provided and the quality of the Managers’ resources that are available to the Fund. The Board took account of the fact that the Sub-Adviser has over fifty years of experience as an investment adviser and that its assets under management rank it among the top mutual fund managers in the United States. The Board evaluated the Managers’ advisory, administrative, accounting, legal, compliance and risk management services, among other services, and information the Board has received regarding the experience and professional qualifications of the Managers’ key personnel and the size and functions of their staff. In its evaluation of the quality of the portfolio management services provided, the Board considered the experience of Alessio de Longis, and Benjamin Rockmuller, the portfolio managers for the Fund, and the Sub-Adviser’s investment team and analysts. The Board members also considered the totality of their experiences with the Managers as directors or trustees of the Fund and other funds advised by the Managers. The Board considered information regarding the quality of services provided by affiliates of the Managers, which the Board members have become knowledgeable about through their experiences with the Managers and in connection with the review or renewal of the Fund’s service agreements or service providers. The Board concluded, in light of the Managers’ experience, reputation, personnel, operations and resources that the Fund benefits from the services provided under the Agreements.
Investment Performance of the Managers and the Fund. Throughout the year, the Managers provided information on the investment performance of the Fund, the Adviser and the Sub-Adviser, including comparative performance information. The Board also reviewed information, prepared by the Managers and by the independent consultant, comparing the Fund’s historical performance to relevant benchmarks or market indices and to the performance of other retail funds in the world allocation category. The Board noted that the Fund’s one-year, three-year and five-year performance was better than its category median although its ten-year performance was below its category median.
Fees and Expenses of the Fund. The Board reviewed the fees paid to the Adviser and the other expenses borne by the Fund. The Board noted that the Adviser, not the Fund, pays the Sub-Adviser’s fee under the sub-advisory agreement. The independent consultant provided comparative data in regard to the fees and expenses of the Fund and other retail front-end load world allocation funds with comparable asset levels and distribution features. The Board noted that the Fund’s contractual management fee and total expenses were higher than its peer group median and category median.
Economies of Scale and Profits Realized by the Managers. The Board considered information regarding the Managers’ costs in serving as the Fund’s investment adviser and sub-adviser, including the costs associated with the personnel and systems necessary to manage the Fund, and information regarding the Managers’ profitability from their relationship with the Fund. The Board also considered that the Managers must be able to pay and retain experienced professional personnel at competitive rates to provide quality services to the Fund. The Board reviewed whether the Managers may realize economies of scale in managing and supporting the Fund. The Board noted that the Fund currently has management fee breakpoints, which are intended to share with Fund shareholders economies of scale that may exist as the Fund’s assets grow.
77 OPPENHEIMER GLOBAL ALLOCATION FUND
| BOARD APPROVAL OF THE FUND’S INVESTMENT ADVISORY AND SUB-ADVISORY AGREEMENTS Unaudited / Continued | ||
Other Benefits to the Managers. In addition to considering the profits realized by the Managers, the Board considered information that was provided regarding the direct and indirect benefits the Managers receive as a result of their relationship with the Fund, including compensation paid to the Managers’ affiliates and research provided to the Adviser in connection with permissible brokerage arrangements (soft dollar arrangements).
Conclusions. These factors were also considered by the independent Trustees meeting separately from the full Board, assisted by experienced counsel to the Fund and to the independent Trustees. Fund counsel and the independent Trustees’ counsel are independent of the Managers within the meaning and intent of the Securities and Exchange Commission Rules.
Based on its review of the information it received and its evaluations described above, the Board, including a majority of the independent Trustees, decided to continue the Agreements through September 30, 2019. In arriving at its decision, the Board did not identify any factor or factors as being more important than others, but considered all of the above information, and considered the terms and conditions of the Agreements, including the management fees, in light of all the surrounding circumstances.
78 OPPENHEIMER GLOBAL ALLOCATION FUND
| PORTFOLIO PROXY VOTING POLICIES AND PROCEDURES; UPDATES TO STATEMENT OF INVESTMENTS Unaudited | ||
The Fund has adopted Portfolio Proxy Voting Policies and Guidelines under which the Fund votes proxies relating to securities (“portfolio proxies”) held by the Fund. A description of the Fund’s Portfolio Proxy Voting Policies and Guidelines is available (i) without charge, upon request, by calling the Fund toll-free at 1.800.CALL OPP (225.5677), (ii) on the Fund’s website at www.oppenheimerfunds.com, and (iii) on the SEC’s website at www.sec.gov. In addition, the Fund is required to file Form N-PX, with its complete proxy voting record for the 12 months ended June 30th, no later than August 31st of each year. The Fund’s voting record is available (i) without charge, upon request, by calling the Fund toll-free at 1.800.CALL OPP (225.5677), and (ii) in the Form N-PX filing on the SEC’s website at www.sec.gov.
The Fund files its complete schedule of portfolio holdings with the SEC for the first quarter and the third quarter of each fiscal year on Form N-Q. The Fund’s Form N-Q filings are available on the SEC’s website at www.sec.gov.
Householding—Delivery of Shareholder Documents
This is to inform you about OppenheimerFunds’ “householding” policy. If more than one member of your household maintains an account in a particular fund, OppenheimerFunds will mail only one copy of the fund’s prospectus (or, if available, the fund’s summary prospectus), annual and semiannual report and privacy policy. The consolidation of these mailings, called householding, benefits your fund through reduced mailing expense, and benefits you by reducing the volume of mail you receive from OppenheimerFunds. Householding does not affect the delivery of your account statements.
Please note that we will continue to household these mailings for as long as you remain an OppenheimerFunds shareholder, unless you request otherwise. If you prefer to receive multiple copies of these materials, please call us at 1.800.CALL-OPP (225-5677). You may also notify us in writing or via email. We will begin sending you individual copies of the prospectus (or, if available, the summary prospectus), reports and privacy policy within 30 days of receiving your request to stop householding.
79 OPPENHEIMER GLOBAL ALLOCATION FUND
TRUSTEES AND OFFICERS Unaudited
Name, Position(s) Held with the Fund, Length of Service, Year of Birth | Principal Occupation(s) During the Past 5 Years; Other Trusteeships/ Directorships Held; Number of Portfolios in the Fund Complex Currently Overseen | |
INDEPENDENT TRUSTEES | The address of each Trustee in the chart below is 6803 S. Tucson Way, Centennial, Colorado 80112-3924. Each Trustee serves for an indefinite term, or until his or her resignation, retirement, death or removal. Each of the Trustees in the chart below oversee 47 portfolios in the OppenheimerFunds complex. | |
Brian F. Wruble, Chairman of the Board of Trustees (since 2009), Trustee (since 2001) Year of Birth: 1943 | Governor of Community Foundation of the Florida Keys (non-profit) (since July 2012); Director of TCP Capital, Inc. (registered business development company) (since November 2015); Chairman Emeritus of the Board of Trustees (since August 2011), Chairman of the Board of Trustees (August 2007-August 2011), Trustee of the Board of Trustees (since August 1991) of The Jackson Laboratory (non-profit); Member of Zurich Insurance Group’s Investment Management Advisory Council (insurance) (October 2004-February 2017); Treasurer (since 2007) and Trustee (since May 1992) of the Institute for Advanced Study (non-profit educational institute); Director of Special Value Opportunities Fund, LLC (registered investment company) (affiliate of the Sub-Adviser’s parent company) (September 2004- June 2015); General Partner of Odyssey Partners, L.P. (hedge fund) (September 1995-December 2007); Special Limited Partner of Odyssey Investment Partners, LLC (private equity investment) (January 1999-September 2004). Mr. Wruble has served on the Boards of certain Oppenheimer funds since April 2001, during which time he has become familiar with the Fund’s (and other Oppenheimer funds’) financial, accounting, regulatory and investment matters and has contributed to the Board’s deliberations. | |
Beth Ann Brown, Trustee (since 2016) Year of Birth: 1968 | Director, Board of Directors of Caron Engineering Inc. (since January 2018); Advisor, Board of Advisors of Caron Engineering Inc. (December 2014-December 2017); Independent Consultant (since September 2012); held the following positions at Columbia Management Investment Advisers LLC: Head of Intermediary Distribution (2008-2012), Managing Director, Strategic Relations (2005-2008), Managing Director, Head of National Accounts (2004-2005); Senior Vice President, National Account Manager (2002-2004), Senior Vice President, Key Account Manager (1999-2002) and Vice President, Key Account Manager (1996-1999) of Liberty Funds Distributor, Inc.; President and Director, of Acton Shapleigh Youth Conservation Corps (non -profit) (2012-2015); and Vice President and Director of Grahamtastic Connection (non-profit) (since May 2013). Ms. Brown has served on the Boards of certain Oppenheimer funds since January 2016, during which time she has become familiar with the Fund’s (and other Oppenheimer funds’) financial, accounting, regulatory and investment matters and has contributed to the Board’s deliberations. | |
Edmund P. Giambastiani, Jr., Trustee (since 2013) Year of Birth: 1948 | Director of THL Credit, Inc. (since November 2016) (alternative credit investment manager); Advisory Board Member of the Maxwell School of Citizenship and Public Affairs of Syracuse University (April 2012-September 2016); Director of Mercury Defense Systems Inc. (information technology) (August 2011-February 2013); Trustee of the U.S. Naval Academy Foundation Athletic & Scholarship Program (since November 2010); Advisory Board Member of the Massachusetts Institute of Technology Lincoln Laboratory (federally-funded research development) (since May 2010); Director of The Boeing Company (aerospace and defense) (since October 2009); Trustee of MITRE Corporation (federally-funded research development) (since September 2008); Independent Director of QinetiQ Group Plc (defense technology and security) (February 2008-August 2011); Chairman of Monster | |
80 OPPENHEIMER GLOBAL ALLOCATION FUND
Edmund P. Giambastiani, Jr., Continued | Worldwide, Inc. (career services) (March 2015-November 2016), Director of Monster Worldwide, Inc. (career services) (February 2008-June 2011); Lead Director (June 2011-March 2015); Chairman of Alenia North America, Inc. (military and defense products) (January 2008-October 2009); Director of SRA International, Inc. (information technology and services) (January 2008-July 2011); President of Giambastiani Group LLC (national security and energy consulting) (since October 2007); United States Navy, career nuclear submarine officer (June 1970-October 2007); Seventh Vice Chairman of the Joint Chiefs of Staff (2005-October 2007); Supreme Allied Commander of NATO Allied Command Transformation (2003-2005) and Commander, U.S. Joint Forces Command (2002-2005). Since his retirement from the U.S. Navy in October 2007, Admiral Giambastiani has also served on numerous U.S. Government advisory boards, investigations and task forces for the Secretaries of Defense, State and Interior and the Central Intelligence Agency. He recently completed serving as a federal commissioner on the Military Compensation and Retirement Modernization Commission. Admiral Giambastiani has served on the Boards of certain Oppenheimer funds since February 2013, during which time he has become familiar with the Fund’s (and other Oppenheimer funds’) financial, accounting, regulatory and investment matters and has contributed to the Board’s deliberations. | |
Elizabeth Krentzman, Trustee (since 2014) Year of Birth: 1959 | Trustee of the University of Florida National Board Foundation (since September 2017); Member of the Cartica Funds Board of Directors (private investment funds) (since January 2017); Member of the University of Florida Law Center Association, Inc. Board of Trustees and Audit Committee Member (since April 2016); Member of University of Florida Law Advisory Board, Washington, DC Alumni Group (since 2015); Advisory Board Member of the Securities and Exchange Commission Historical Society (since 2007); held the following positions at Deloitte & Touche LLP: Principal and Chief Regulatory Advisor for Asset Management Services (2007 - 2014) and U.S. Mutual Fund Leader (2011 - 2014); General Counsel of the Investment Company Institute (trade association) (June 2004 - April 2007); held the following positions at Deloitte & Touche LLP: National Director of the Investment Management Regulatory Consulting Practice (1997 - 2004), Principal (2003 - 2004), Director (1998 - 2003) and Senior Manager (1997 - 1998); Assistant Director of the Division of Investment Management - Office of Disclosure and Investment Adviser Regulation of the U.S. Securities and Exchange Commission (1996 - 1997) and various positions with the Division of Investment Management – Office of Regulatory Policy (1991 - 1996) of the U.S. Securities and Exchange Commission; Associate at Ropes & Gray LLP (1987 – 1991). Ms. Krentzman has served on the Boards of certain Oppenheimer funds since August 2014, during which time she has become familiar with the Fund’s (and other Oppenheimer funds’) financial, accounting, regulatory and investment matters and has contributed to the Board’s deliberations. | |
Mary F. Miller, Trustee (since 2009) Year of Birth: 1942 | Trustee of International House (not-for-profit) (since June 2007); Trustee of the American Symphony Orchestra (not-for-profit) (October 1998-November 2011); and Senior Vice President and General Auditor of American Express Company (financial services company) (July 1998-February 2003). Ms. Miller has served on the Boards of certain Oppenheimer funds since August 2004, during which time she has become familiar with the Fund’s (and other Oppenheimer funds’) financial, accounting, regulatory and investment matters and has contributed to the Board’s deliberations. | |
81 OPPENHEIMER GLOBAL ALLOCATION FUND
TRUSTEES AND OFFICERS Unaudited / Continued
| Joel W. Motley , Trustee (since 2009) Year of Birth: 1952 | Director of Office of Finance Federal Home Loan Bank (since September 2016); Director of Greenwall Foundation (since October 2013); Member of Board and Investment Committee of The Greenwall Foundation (since April 2013); Member of the Vestry of Trinity Wall Street (since April 2012); Director of Southern Africa Legal Services Foundation (since March 2012); Board Member and Investment Committee Member of Pulitzer Center for Crisis Reporting (non-profit journalism) (since March 2011); Managing Director of Public Capital Advisors, LLC (privately-held financial advisor) (since January 2006); Managing Director of Carmona Motley, Inc. (privately-held financial advisor) (since January 2002); Director of Columbia Equity Financial Corp. (privately-held financial advisor) (2002-2007); Managing Director of Carmona Motley Hoffman Inc. (privately-held financial advisor) (January 1998-December 2001); Member of the Finance and Budget Committee of the Council on Foreign Relations, Member of the Investment Committee and Board of Human Rights Watch (since July 2000) and Member of the Investment Committee and Board of Historic Hudson Valley (since February 2010). Mr. Motley has served on the Boards of certain Oppenheimer funds since October 2002, during which time he has become familiar with the Fund’s (and other Oppenheimer funds’) financial, accounting, regulatory and investment matters and has contributed to the Board’s deliberations. | |
| Joanne Pace, Trustee (since 2012) Year of Birth: 1958 | Advisory Board Director of Massey Quick Simon & Co. (wealth management), LLC (since October 2014); Board Director of Horizon Blue Cross Blue Shield of New Jersey (healthcare) (since November 2012); Advisory Board Director of The Alberleen Group LLC (investment banking) (since March 2012); Governing Council Member (since 2016) and Chair of Education Committee (since 2017) of Independent Directors Council (IDC) (since 2016); Board Member of 100 Women in Finance (non-profit) (since January 2015); Advisory Council Member of Morgan Stanley Children’s Hospital (non-profit) (since May 2012); Director of The Komera Project (non-profit) (April 2012-2016); New York Advisory Board Director of Peace First (non-profit) (March 2010-2013); Senior Advisor of SECOR Asset Management, LP (2010-2011); Managing Director and Chief Operating Officer of Morgan Stanley Investment Management (2006-2010); Partner and Chief Operating Officer of FrontPoint Partners, LLC (hedge fund) (2005-2006); held the following positions at Credit Suisse (investment banking): Managing Director (2003-2005); Global Head of Human Resources and member of Executive Board and Operating Committee (2004-2005), Global Head of Operations and Product Control (2003-2004); held the following positions at Morgan Stanley: Managing Director (1997-2003), Controller and Principal Accounting Officer (1999-2003); Chief Financial Officer (temporary assignment) for the Oversight Committee, Long Term Capital Management (1998-1999). Lead Independent Director and Chair of the Audit and Nominating Committee of The Global Chartist Fund, LLC of Oppenheimer Asset Management (2011-2012); Board Director of Managed Funds Association (2008-2010); Board Director of Morgan Stanley Foundation (2007-2010) and Investment Committee Chair (2008-2010). Ms. Pace has served on the Boards of certain Oppenheimer funds since November 2012, during which time she has become familiar with the Fund’s (and other Oppenheimer funds’) financial, accounting, regulatory and investment matters and has contributed to the Board’s deliberations. | |
82 OPPENHEIMER GLOBAL ALLOCATION FUND
Daniel Vandivort, Year of Birth: 1954 | Chairman and Lead Independent Director/Trustee (March 2010-September 2014), Chairman of the Audit Committee (March 2009-September 2014) and Director/Trustee (December 2008-September 2014) of the Board of Directors/ Trustees of Value Line Funds; Trustee (since January 2015) and Treasurer and Chairman of the Audit Committee and Finance Committee (since January 2016) of Board of Trustees of Huntington Disease Foundation of America; Trustee, Board of Trustees, RIM Retirement Savings Plan (2005-2007); President and Chief Investment Officer, Robeco Investment Management, formerly known as Weiss Peck and Greer (January 2005-June 2007); Member, Management Committee of Robeco Investment Management (2001-2007); Chairman and Trustee of the Board of Trustees of Weiss, Peck and Greer Funds (2004-2005); Managing Director and Head of Fixed Income, Weiss, Peck and Greer (November 1994-January 2005); Managing Director and Head of Fixed Income, CS First Boston Investment Management (January 1992-November 1994); Director, Global Product Development, First Boston Asset Management (November 1989-January 1992); Vice President, Fixed Income Sales, First Boston Corp. (May 1984-November 1989). Mr. Vandivort has served on the Boards of certain Oppenheimer funds since 2014, during which time he has become familiar with the Fund’s (and other Oppenheimer funds’) financial, accounting, regulatory and investment matters and has contributed to the Board’s deliberations.
| |
| INTERESTED TRUSTEE AND OFFICER | Mr. Steinmetz is an “Interested Trustee” because he is affiliated with the Manager and the Sub-Adviser by virtue of his positions as Chairman and director of the Sub-Adviser and officer and director of the Manager. Both as a Trustee and as an officer, Mr. Steinmetz serves for an indefinite term, or until his resignation, retirement, death or removal. Mr. Steinmetz’s address is 225 Liberty Street, New York, New York 10281-1008. Mr. Steinmetz is an officer of 105 portfolios in the OppenheimerFunds complex. | |
Arthur P. Steinmetz, Trustee (since 2015), President and Principal Executive Officer (since 2014) Year of Birth: 1958 | Chairman of OppenheimerFunds, Inc. (since January 2015); CEO and Chairman of OFI Global Asset Management, Inc. (since July 2014), President of OFI Global Asset Management, Inc. (since May 2013), a Director of OFI Global Asset Management, Inc. (since January 2013), Director of OppenheimerFunds, Inc. (since July 2014), President, Management Director and CEO of Oppenheimer Acquisition Corp. (OppenheimerFunds, Inc.‘s parent holding company) (since July 2014), and President and Director of OFI SteelPath, Inc. (since January 2013). Chief Investment Officer of the OppenheimerFunds advisory entities (January 2013-December 2013); Executive Vice President of OFI Global Asset Management, Inc. (January 2013-May 2013); Chief Investment Officer of OppenheimerFunds, Inc. (October 2010-December 2012); Chief Investment Officer, Fixed-Income, of OppenheimerFunds, Inc. (April 2009-October 2010); Executive Vice President of OppenheimerFunds, Inc. (October 2009-December 2012); Director of Fixed Income of OppenheimerFunds, Inc. (January 2009-April 2009); and a Senior Vice President of OppenheimerFunds, Inc. (March 1993-September 2009).
| |
OTHER OFFICERS OF THE FUND | The addresses of the Officers in the chart below are as follows: for Messrs. Rockmuller, de Longis,, Mss. Lo Bessette, Foxson and Picciotto, 225 Liberty Street, New York, New York 10281-1008, for Mr. Petersen, 6803 S. Tucson Way, Centennial, Colorado 80112-3924. Each Officer serves for an indefinite term or until his or her resignation, retirement, death or removal.
| |
83 OPPENHEIMER GLOBAL ALLOCATION FUND
TRUSTEES AND OFFICERS Unaudited / Continued
Benjamin H. Rockmuller, Vice President (since 2011) Year of Birth: 1979 | Vice President of the Sub-Adviser (since September 2010); Senior Portfolio Manager of the Sub-Adviser (since January 2014); Portfolio Manager of the Sub-Adviser (July 2010-January 2014); Assistant Vice President of the Sub-Adviser (January 2010-August 2010); Senior Analyst of the Sub-Adviser for the Global Debt Team (January 2010-July 2010); Intermediate Analyst of the Sub-Adviser for the Global Debt Team (January 2007-January 2010); Junior Analyst of the Sub-Adviser for the Global Debt Team (April 2004-January 2007); Junior Analyst of the Sub-Adviser for the High Yield Team (June 2003-April 2004). | |
Alessio de Longis, Year of Birth: 1978 | Vice President of the Sub-Adviser (since June 2010); Assistant Vice President of the Sub-Adviser (May 2009-June 2010); Senior Research Analyst of the Sub-Adviser (January 2008-June 2010); Intermediate Research Analyst of the Sub-Adviser (January 2006-January 2008) Junior Analyst of the Sub-Adviser (February 2004-January 2006). | |
Cynthia Lo Bessette, Secretary and Chief Legal Officer (since 2016) | Executive Vice President, General Counsel and Secretary of the Manager (since February 2016); Senior Vice President and Deputy General Counsel of the Manager (March 2015-February 2016); Chief Legal Officer of the Sub-Adviser and the Distributor (since February 2016); Vice President, General Counsel and Secretary of Oppenheimer Acquisition Corp. (since February 2016); General Counsel of OFI SteelPath, Inc., VTL Associates, LLC and Index Management Solutions, LLC (since February 2016); Chief Legal Officer of OFI Global Institutional, Inc., HarbourView Asset Management Corporation, OFI Global Trust Company, Oppenheimer Real Asset Management, Inc., OFI Private Investments Inc., Shareholder Services, Inc. and Trinity Investment Management Corporation (since February 2016); Corporate Counsel (February 2012-March 2015) and Deputy Chief Legal Officer (April 2013-March 2015) of Jennison Associates LLC; Assistant General Counsel (April 2008-September 2009) and Deputy General Counsel (October 2009-February 2012) of Lord Abbett & Co. LLC. | |
Jennifer Foxson, Vice President and Chief Business Officer (since 2014) Year of Birth: 1969 | Senior Vice President of OppenheimerFunds Distributor, Inc. (since June 2014); Vice President of OppenheimerFunds Distributor, Inc. (April 2006-June 2014); Vice President of the Sub-Adviser (January 1998-March 2006); Assistant Vice President of the Sub-Adviser (October 1991-December 1998). | |
Mary Ann Picciotto, Chief Compliance Officer and Chief Anti-Money Laundering Officer (since 2014) Year of Birth: 1973 | Senior Vice President and Chief Compliance Officer of the Manager (since March 2014); Chief Compliance Officer of the Sub-Adviser, OFI SteelPath, Inc., OFI Global Trust Company, OFI Global Institutional, Inc., Oppenheimer Real Asset Management, Inc., OFI Private Investments, Inc., Harborview Asset Management Corporation, Trinity Investment Management Corporation, and Shareholder Services, Inc. (since March 2014); Managing Director of Morgan Stanley Investment Management Inc. and certain of its various affiliated entities; Chief Compliance Officer of various Morgan Stanley Funds (May 2010-January 2014); Chief Compliance Officer of Morgan Stanley Investment Management Inc. (April 2007-January 2014 | |
Brian S. Petersen, Treasurer and Principal Financial & Accounting Officer (since 2016) Year of Birth: 1970 | Senior Vice President of the Manager (since January 2017); Vice President of the Manager (January 2013-January 2017); Vice President of the Sub-Adviser (February 2007-December 2012); Assistant Vice President of the Sub-Adviser (August 2002-2007). | |
The Fund’s Statement of Additional Information contains additional information about the Fund’s Trustees and Officers and is available without charge upon request, by calling 1.800.CALL OPP (225.5677).
84 OPPENHEIMER GLOBAL ALLOCATION FUND
OPPENHEIMER GLOBAL ALLOCATION FUND
| Manager | OFI Global Asset Management, Inc. | |
| Sub-Adviser | OppenheimerFunds, Inc. | |
| Distributor | OppenheimerFunds Distributor, Inc. | |
| Transfer and Shareholder Servicing Agent | OFI Global Asset Management, Inc. | |
| Sub-Transfer Agent | Shareholder Services, Inc. DBA OppenheimerFunds Services | |
| Independent Registered Public Accounting Firm | KPMG LLP | |
| Legal Counsel | Kramer Levin Naftalis & Frankel LLP | |
© 2018 OppenheimerFunds, Inc. All rights reserved.
85 OPPENHEIMER GLOBAL ALLOCATION FUND
As an Oppenheimer fund shareholder, you are entitled to know how we protect your personal information and how we limit its disclosure.
Information Sources
We obtain non-public personal information about our shareholders from the following sources:
| ● | Applications or other forms. |
| ● | When you create a user ID and password for online account access. |
| ● | When you enroll in eDocs Direct,SM our electronic document delivery service. |
| ● | Your transactions with us, our affiliates or others. |
| ● | Technologies on our website, including: “cookies” and web beacons, which are used to collect data on the pages you visit and the features you use. |
If you visit oppenheimerfunds.com and do not log on to the secure account information areas, we do not obtain any personal information about you. When you do log on to a secure area, we do obtain your user ID and password to identify you. We also use this information to provide you with products and services you have requested, to inform you about products and services that you may be interested in and assist you in other ways.
We do not collect personal information through our website unless you willingly provide it to us, either directly by email or in those areas of the website that request information. In order to update your personal information (including your mailing address, email address and phone number) you must first log on and visit your user profile.
If you have set your browser to warn you before accepting cookies, you will receive the warning message with each cookie. You can refuse cookies by turning them off in your browser. However, doing so may limit your access to certain sections of our website.
We use cookies to help us improve and manage our website. For example, cookies help us recognize new versus repeat visitors to the site, track the pages visited, and enable some special features on the website. This data helps us provide better service for our website visitors.
Protection of Information
We do not disclose any non-public personal information (such as names on a customer list) about current or former customers to anyone, except as permitted by law.
Disclosure of Information
Copies of confirmations, account statements and other documents reporting activity in your fund accounts are made available to your financial advisor (as designated by you). We may also use details about you and your investments to help us, our financial service affiliates, or firms that jointly market their financial products and services with ours, to better serve your investment needs or suggest educational material that may be of interest to you. If this requires us to provide you with an opportunity to “opt in” or “opt out” of such information sharing with a firm not affiliated with us, you will receive notification on how to do so, before any such sharing takes place.
Right of Refusal
We will not disclose your personal information to unaffiliated third parties (except as permitted by law), unless we first offer you a reasonable opportunity to refuse or “opt out” of such disclosure.
86 OPPENHEIMER GLOBAL ALLOCATION FUND
Internet Security and Encryption
In general, the email services provided by our website are encrypted and provide a secure and private means of communication with us. To protect your own privacy, confidential and/ or personal information should only be communicated via email when you are advised that you are using a secure website.
As a security measure, we do not include personal or account information in non-secure emails, and we advise you not to send such information to us in non-secure emails. Instead, you may take advantage of the secure features of our website to encrypt your email correspondence. To do this, you will need to use a browser that supports Secure Sockets Layer (SSL) protocol.
| ● | All transactions conducted via our websites, including redemptions, exchanges and purchases, are secured by the highest encryption standards available. SSL is used to establish a secure connection between your PC and OppenheimerFunds’ server. It transmits information in an encrypted and scrambled format. |
| ● | Encryption is achieved through an electronic scrambling technology that uses a “key” to code and then decode the data. Encryption acts like the cable converter box you may have on your television set. It scrambles data with a secret code so that no one can make sense of it while it is being transmitted. When the data reaches its destination, the same software unscrambles the data. |
| ● | You can exit the secure area by closing your browser or, for added security, you can use the Log Out button before you close your browser. |
Other Security Measures
We maintain physical, electronic and procedural safeguards to protect your personal account information. Our employees and agents have access to that information only so that they may offer you products or provide services, for example, when responding to your account questions.
How You Can Help
You can also do your part to keep your account information private and to prevent unauthorized transactions. If you obtain a user ID and password for your account, safeguard that information. Strengthening your online credentials–your online security profile–typically your user name, password, and security questions and answers, can be one of your most important lines of defense on the Internet. For additional information on how you can help prevent identity theft, visit https://www. oppenheimerfunds.com/security.
Who We Are
This joint notice describes the privacy policies of the Oppenheimer funds, OppenheimerFunds, Inc., each of its investment adviser subsidiaries, OppenheimerFunds Distributor, Inc. and OFI Global Trust Co. It applies to all Oppenheimer fund accounts you presently have, or may open in the future, using your Social Security number—whether or not you remain a shareholder of our funds. This notice was last updated as of November 2017. In the event it is updated or changed, we will post an updated notice on our website at oppenheimerfunds.com. If you have any questions about this privacy policy, email us by clicking on the Contact Us section of our website at oppenheimerfunds.com, write to us at P.O. Box 5270, Denver, CO 80217-5270, or call us at 800 CALL OPP (225 5677).
87 OPPENHEIMER GLOBAL ALLOCATION FUND
 | ||||
| Visit us at oppenheimerfunds.com for 24-hr access to account information and transactions or call us at 800.CALL OPP (800.225.5677) for 24-hr automated information and automated transactions. Representatives also available Mon–Fri 8am-8pm ET. | ||||
| Visit Us | ||||
| oppenheimerfunds.com | ||||
| Call Us | ||||
| 800 225 5677 | ||||
| Follow Us | ||||
 | Oppenheimer funds are distributed by OppenheimerFunds Distributor, Inc. © 2018 OppenheimerFunds Distributor, Inc. All rights reserved. | |||
RA0257.001.1018 December 21, 2018 | ||||
| Annual Report | 10/31/2018 | |||||
| ||||||
An Important Update
On October 18, 2018, Massachusetts Mutual Life Insurance Company, an indirect corporate parent of OppenheimerFunds, Inc. and its subsidiaries OFI Global Asset Management, Inc., OFI SteelPath, Inc. and OFI Advisors, LLC, announced that it has entered into an agreement whereby Invesco Ltd., a global investment management company, will acquire OppenheimerFunds, Inc. As of the date of this report, the transaction is expected to close in the second quarter of 2019, pending necessary regulatory and other third-party approvals. This is subject to change.
Class A Shares
AVERAGE ANNUAL TOTAL RETURNS AT 10/31/18
Class A Shares of the Fund | ||||||
Without Sales Charge
|
With Sales Charge
|
HFRX Global Hedge Fund Index
| ||||
1-Year
| 2.34% | -3.55% | -3.53% | |||
5-Year
| 3.15 | 1.93 | 0.14 | |||
10-Year
| 3.67 | 3.05 | 1.37 | |||
Performance data quoted represents past performance, which does not guarantee future results. The investment return and principal value of an investment in the Fund will fluctuate so that an investor’s shares, when redeemed, may be worth more or less than their original cost. Fund returns include changes in share price, reinvested distributions, and a 5.75% maximum applicable sales charge except where “without sales charge” is indicated. Current performance may be lower or higher than the performance quoted. Returns do not consider capital gains or income taxes on an individual’s investment. Returns for periods of less than one year are cumulative and not annualized. For performance data current to the most recent month-end, visit oppenheimerfunds.com or call 1.800.CALL OPP (225.5677). See Fund prospectuses and summary prospectuses for more information on share classes and sales charges.
3 OPPENHEIMER FUNDAMENTAL ALTERNATIVES FUND
The Fund’s Class A shares (without sales charge) produced a total return of 2.34% for the 12-month reporting period ending 10/31/18. The Fund outperformed its benchmark, the HFRX Global Hedge Fund Index (Index), which returned -3.53% during the same period, by 587 basis points (bps). The Fund also outperformed the Morningstar Multialternative Fund category average, which produced a return of -1.98%, by 432 bps. Moreover, the Fund outperformed the Bloomberg Barclays U.S. Aggregate Bond Index (Bloomberg Barclays Index) by 439 bps during the same period. Our Long/Short Equity and Long/Short Credit strategies generated strong positive returns while the Long/Short Macro strategy generated modest positive returns.
The Fund offers the flexibility often associated with alternatives while providing the daily liquidity and transparency benefits of a mutual fund. It seeks to provide investors with strong risk-adjusted returns that have low sensitivity to traditional market factors over the long term. The investment team’s process has an underlying value philosophy that combines bottom-up and
top-down fundamental analysis for security selection and portfolio construction. The Fund can invest both long and short across distinct alternative investment strategies including Long/Short Equity, Long/Short Credit and Long/Short Macro (including currencies, interest rates, sovereign debt and commodities), making the Fund truly flexible.
COMPARISON OF CHANGE IN VALUE OF $10,000 HYPOTHETICAL INVESTMENTS IN:
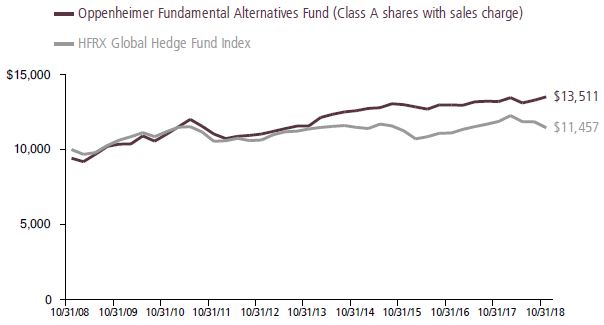
4 OPPENHEIMER FUNDAMENTAL ALTERNATIVES FUND
Although many investors focus on the short-term outlook when considering potential investments, the Fund utilizes a longer-term approach. We look at changing dynamics on both a macroeconomic and microeconomic basis over a multi-year time horizon to uncover investment opportunities that emerge from change.
The Fund continues to deliver on its value proposition of effective diversification combined with low volatility (3.49% standard deviation during the reporting period, which was meaningfully lower than the 12.19% volatility of the S&P 500), good downside risk mitigation and high risk-adjusted returns. Two key measures of these risk-adjusted returns are the Sharpe ratio (which penalizes both upside and downside volatility) and the Sortino ratio (which penalizes only downside volatility). For the period from April 2012 to October 2018 (the time that Michelle Borré has managed the strategy), the Fund has been ranked in the 3rd percentile of the Morningstar Multialternative peer group for Sharpe ratio and the 3rd percentile for Sortino ratio. The Fund’s standard deviation ranks in the 9th percentile of its peer group and its maximum drawdown ranks in the 2nd percentile for the same period. Moreover, we believe that upside/downside capture ratios provide a good measure of the Fund’s downside protection. The upside capture ratio is the cumulative performance of the Fund in all up months of positive return divided by the cumulative performance of an index in those months. The downside capture ratio is the cumulative performance of the Fund in
all down months of negative return divided by the cumulative performance of the index in those months. For the period from April 2012 to October 2018, the Fund’s upside capture has been 74% of the Index and its downside capture has been just 18%. This level of asymmetry means that the Fund has delivered significantly more upside than downside during that period. In contrast, the Morningstar Multialternative peer group average captured 79% of the upside of the Index but also 75% of the downside over the same period. In our view, these risk-adjusted returns and upside/downside capture ratios are a testament to the Fund’s intelligent blending of multiple strategies across multiple asset classes.
MARKET OVERVIEW
Regarding the macro environment, risk assets around the world rallied from the date of Trump’s election victory in November 2016 through 12/31/17, pushing valuations close to all-time highs for a variety of asset classes. During the first ten months of 2018, however, many of these asset classes have reversed course and posted losses. As a result, although the S&P 500 generated a positive total return of 7.35% during the reporting period, the Nikkei 225 Index has declined 0.33% in the same period, the DAX Index (German equities) has fallen 14.99%, the MSCI Emerging Markets Index has fallen 12.52% and the Shanghai Composite Index has fallen 21.49%. In addition, the performance difference between growth and value equities has continued to be unusually
5 OPPENHEIMER FUNDAMENTAL ALTERNATIVES FUND
wide, with the Russell 1000 Growth Index generating a 10.71% return during the reporting period compared to the 2.72% return for the Russell 1000 Value Index. Against this backdrop, interest rates have continued to climb higher, with the yield on the 10-year Treasury note rising from 1.85% on election day to 3.14% by the end of the reporting period for an increase of 129 bps. Fixed income has come under pressure as rates have continued to back up, with the Bloomberg Barclays Index falling 2.05% during the reporting period. In our view, Treasuries could become less helpful to investors during market selloffs, in part because they offer low yields, making the risk/reward tradeoff unattractive. This is especially true as the Federal Reserve (Fed) continues along its well-telegraphed path of raising rates while simultaneously shrinking its balance sheet.
The Trump administration has injected a level of policy uncertainty into the markets that investors have not seen in quite a while. At the same time, structural flaws in both Europe and Japan remain unresolved. China and other emerging markets will likely eventually face slower long-term growth because the current growth is overly reliant, in our view, on excessive credit expansion. Meanwhile, we believe that in a number of countries there has been a meaningful change in the relationship between elected representatives and voters, or stated differently, between those who make policies and those who actually pay for those policies. We have discussed in previous commentaries the
impact of Brexit along with the rise of populist parties in Europe. In March 2018, Italian voters shunned center left parties and instead voted for populist and center right candidates, resulting in a hung parliament. Although the Euro-skeptic/populist Five Star party and the anti-immigrant League party have subsequently formed a ruling coalition, it remains to be seen how effectively they can govern and for how long. The new government is currently testing the existing budget constraints in the EU. More recently, in September 2018, Sweden held elections but no single party won enough votes to form a government. The nationalist Sweden Democrats (SD) won 18% of the vote although the center-left ruling coalition and the center-right alliance (both with approximately 40% of the vote) have refused to govern with SD. Shortly after that election, Prime Minister Stefan Lofven lost a no-confidence vote and will be forced to step down. A major issue in the election was Sweden’s immigration policy. In October, German Chancellor Angela Merkel’s party, the Christian Democratic Union (CDU), posted weak showings in regional elections, causing Chancellor Merkel to announce that she would not run for re-election either as Chancellor of Germany or as head of the CDU. Joining the EU opened the door to new problems like immigration and the need to bail out peripheral nations. However, the EU does not seem capable of solving these issues, which has caused significant internal tension. We believe the EU in its current form is unsustainable, although we do not know what specific catalysts might cause changes
6 OPPENHEIMER FUNDAMENTAL ALTERNATIVES FUND
in its structure or when those changes might occur.
Moreover, we believe investors now face rising geopolitical risks both in the U.S. and around the world. Simultaneous trade disputes between the U.S. and China, Europe, Japan, Canada and Mexico have the potential to escalate meaningfully. At the same time, the Trump administration faces challenges at home including Democratic control of the House of Representatives starting in January and the ongoing investigation by special counsel Robert Mueller. Under these circumstances, we believe investors could benefit from a broader toolkit than was needed during the risk-on, quantitative easing-supported market of the past several years and a different toolkit than has been effective in the past because of the unfavorable risk/reward in conservative fixed income. Part of this broader toolkit could include the Fund’s ability to take short positions that can profit from market declines.
FUND REVIEW
Long/Short Equity Strategy. This strategy generated strong positive returns during the reporting period. The top contributors were our call options on the S&P 500 as well as our long positions in Apple and Cisco. In contrast, the biggest detractors were our long positions in General Electric and Chubb and our short position in Ahold.
Top Contributors
Our call options on the S&P 500 contributed to performance as the index climbed 7.35% in the reporting period on the back of strong earnings acceleration, solid quarterly results and continued economic growth in the U.S. We like the asymmetry of the call options, which have limited downside and considerably more potential upside.
Our position in Apple Inc. (AAPL), a technology company that designs and sells consumer electronics and online services, contributed to performance with strong quarterly results driven by solid price increases on newer product models. In addition, investors have gained a better appreciation of the benefit of Apple’s recurring revenue stream from services as well as its aggressive plans to return capital to shareholders. In this regard, in May 2018, management announced a new $100 billion share repurchase program and increased the dividend by 16%. The new buyback program commenced in June 2018 and the increase in the dividend is the largest since the company re-introduced the dividend in 2012.
Our position in Cisco Systems (CSCO), a manufacturer of networking hardware and telecommunications equipment, also contributed to performance. The company’s shares have benefitted from a variety of
7 OPPENHEIMER FUNDAMENTAL ALTERNATIVES FUND
factors. First, Cisco is showing tangible evidence of its ability to transition to a higher mix of recurring revenue through a subscription model. Second, the company has been a major beneficiary of capital repatriation enabled by the recently enacted tax reforms. Management has made clear that it will use these funds to improve its shareholder capital allocation program. Finally, Cisco has benefitted from overall improvement in the enterprise spending environment on the back of improved economic conditions, higher corporate cash flows (resulting from lower taxes) and accelerated depreciation available under the new tax laws.
Largest Detractors
Our long position in General Electric (GE), an industrial conglomerate focused on aviation, power, energy, and healthcare, underperformed during the period in part due to investors’ concerns about the magnitude of revisions to the earnings outlook for 2017-2018. The concerns stem from a weaker global gas power generation outlook, a longer recovery period for the Oil & Gas business and a slowing wide-body aerospace cycle. The market has also been penalizing GE’s lower free cash flow conversion rate of 65% versus its historical rate of 80%. The announced dividend cuts in November 2017 and October 2018 were negatives that hurt the stock, but they give the company needed flexibility to fund future capital expenditures. The January 2018 announcement of a reinsurance charge and required cash contribution for GE Capital
compounded the problem. Larry Culp, the former CEO of Danaher, was named as the new CEO of the company on October 1, 2018 to help turn GE around. We believe Mr. Culp’s strategic vision and track record for operating excellence (as evidenced by his successful tenure at Danaher) should help right the ship. GE remains a small position in the portfolio at 0.56% as of 10/31/18.
Our long position in Chubb Ltd. (CB), a global insurance provider, also detracted from performance. During the reporting period, the stock retraced the strong gains it registered in the aftermath of the hurricanes in 2017. This retracement occurred because industry-wide pricing in response to the massive storm-related losses fell short of investor expectations. Importantly, pricing for commercial property and casualty insurance turned positive in the fourth quarter of 2017 and has remained positive through the third quarter of 2018. Previously, pricing for commercial property and casualty insurance had been declining for several years. Finally, Chubb was a relative loser in the wake of recently enacted tax reforms because the company’s already low tax rate meant that it benefitted significantly less than other firms from the reduction in the statutory rate.
Our short position in Koninklijke Ahold Delhaize (AD NA), an international retailer, detracted from performance as well. The shares troughed while the merger of Amazon and Whole Foods was pending. Several factors have helped support the stock price, negatively impacting our position. First,
8 OPPENHEIMER FUNDAMENTAL ALTERNATIVES FUND
overall consumer demand in the U.S. has been constructive as we have seen through the results of Walmart and Target. Second, although the company is facing competitive pressure domestically in terms of sales and margins, it did get something of a short-term reprieve. Competitor LIDL has taken longer to ramp up than expected due to execution issues such as site selection and re-stocking, and it has made some changes at the local manager level. However, LIDL is once again expanding its footprint in the U.S., having acquired 27 new stores in New York and New Jersey in November 2018. In response to the competitive environment, Ahold is attempting to reposition its Stop & Shop brand and is investing incremental capex in that business.
Long/Short Credit and Long/Short Macro Strategies. The Fund’s Long/Short Credit strategy generated strong returns during the reporting period while the Long/ Short Macro strategy generated modestly positive returns. In terms of individual holdings, the top performers were our long/ short position in European sovereign debt, our options position that benefits from rising U.S. interest rates and our relative value position in Neiman Marcus. The top detractors were our long position in gold, our short position in the Australian dollar and our long position in junior subordinated debt issued by Wells Fargo.
Top Contributors
Our long/short position in European credit spreads contributed to performance in the
period. This position benefits from wider spreads between Germany and less credit worthy European sovereigns (i.e., Italy, Spain and France). In March, Italian voters shunned center left parties and instead voted for populist and center right candidates, resulting in a hung parliament. Since then, the Euro-skeptic/populist Five Star party and the anti-immigrant League party have formed a ruling coalition. The government’s plans call for a larger fiscal deficit, which detracts from Italy’s credit profile. Furthermore, a larger deficit increases the strain on Italy’s relationship with the EU. Both of these factors have caused Italian credit spreads to widen, benefitting our position.
Similarly, our options position that benefits from higher U.S. interest rates contributed to performance. The Trump administration’s expansionary fiscal policies have increased the government’s funding needs and stimulated economic growth. At the same time, the Fed has continued to raise interest rates while shrinking its balance sheet, thereby tightening monetary policy. This combination of factors has pushed U.S. rates higher, benefitting our position.
Our relative value position in Neiman Marcus, a multi-line department store operator, also contributed to performance. This is a long position in a term loan offset by a short position in a secured corporate bond expressed through a credit default swap. This relative value position should benefit from a capital restructuring at the company. During the reporting period, Neiman Marcus’s
9 OPPENHEIMER FUNDAMENTAL ALTERNATIVES FUND
operating performance stabilized marginally, although not enough to address adequately the company’s leverage issues. As debt maturities approach, these leverage issues have become more pressing, which has benefitted our position.
Largest Detractors
In contrast, our position in gold (GLD) detracted from performance as the yellow metal declined by 4.48% to $1,214 per troy ounce in the period. Gold bullion, which began the period at $1,271, oscillated in a $206 range before ending the period with a loss of $56 per ounce. The precious metals complex fell on the back of a stronger dollar (the U.S. Dollar Index climbed 2.72% in the period), continued solid economic growth, rising U.S. interest rates and moderate inflation expectations. We believe some investors are increasingly viewing gold and other precious metals as warrants (i.e., long-dated options) on monetary policy going off the rails or a potential hedge against competitive currency debasement or adverse geopolitical events.
Our short position in the Australian dollar detracted from performance. We were short several different currencies relative to the U.S. dollar, including the Australian dollar. Australia is a major exporter of commodities and other goods to China. Solid economic growth in China has resulted in steady demand for exports from Australia, which supported the value of the Australian dollar and hurt our short position. We exited this
currency position in January 2018.
Finally, our position in junior subordinated bonds issued by Wells Fargo detracted from performance as well. We exited this position in June. These bonds were fixed to floating rate securities that were paying a fixed rate of 5.9%. If these securities were not called (redeemed) in June of 2024, they would pay a floating rate of 3-month Libor plus 311 bps. The bonds were negatively impacted in the period by rising yields on longer-dated Treasuries as well as by widening credit spreads. Wider spreads reduced the probability that these bonds would be called, which in turn negatively impacted performance.
STRATEGY AND OUTLOOK
After a nearly two-year hiatus, volatility and drawdowns have returned. In our view, the sudden spike in volatility and 10% drop in the S&P 500 in January were overdue. The actual outlier was 2017 with its 50-year lows in equity volatility, 30-year lows in Treasury volatility, and a maximum drawdown of 2.8% on the S&P 500—well below the annual average of more than 10%. In particular, by the end of 2017, it had been more than 380 days since the last 5% draw down on the S&P 500, far longer than the 90-day average of the last nine decades. The market was due for a spike in volatility and a meaningful drawdown, both of which occurred in late January as the CBOE Volatility Index (VIX Index) jumped more than 250% and the S&P 500 fell 10.1%. The bumpiness
10 OPPENHEIMER FUNDAMENTAL ALTERNATIVES FUND
continued as the VIX Index spiked 65% in late March and the S&P 500 sold off 7.5%. In October, the VIX Index spiked 115% and the S&P 500 sold off 9.8%. Prolonged periods of low volatility breed complacency and a lack of mindfulness about downside risk. We believe many investors are starting to pay attention again.
The combination of tax cuts, fiscal stimulus and a tight labor market could lead to higher inflation and higher rates than many investors expect. The Trump administration is pursuing a triple play of tax cuts, higher federal spending and a major proposed infrastructure plan. Significantly, these efforts are taking place as the economy has accelerated and during a tight labor market. The fact that the administration is pursuing these policies in the absence of a recession makes them unusual. The fact that it is pursuing them all at the same time and so late in the economic cycle makes them highly unusual. We believe this stimulus increases the dual risks of higher inflation and tighter monetary policy.
U.S. Equities are Outperforming International Equities for a Reason this Year. The S&P 500 is meaningfully outperforming most developed and emerging market equity indices thus far in 2018—and there is a reason why. In the fourth quarter of 2017, the Fed was raising interest rates and starting to shrink its balance sheet. Simply put, quantitative easing was morphing into quantitative tightening. By the end of the reporting period, Congress had enacted tax
reforms, it had agreed to two years of fiscal stimulus and the Trump administration had drafted an infrastructure program. As a result, the federal government was borrowing more at a time when the U.S. Treasury was selling assets. This combination of factors effectively pulled U.S. dollars out of the rest of the world, making it more expensive to borrow in dollars. The good news for U.S. companies is that they have enjoyed the benefits of several offsets in the form of lower tax rates, increased fiscal stimulus, consistent deregulation by the Trump administration and accelerating economic growth. In contrast, companies in other developed markets as well as those in the emerging markets have enjoyed few (if any) such offsets. This is part of the reason why economic growth in the U.S. and earnings growth for the S&P 500 have been so robust relative to other markets through the first three quarters of 2018.
The trade winds are shifting but by how much remains to be seen. In the wake of Trump’s election victory, we wrote in our fourth quarter commentary for 2016 that international trade was one area of public policy where Trump did not need the approval of Congress to effect meaningful change. That view has proved to be correct so far as the U.S. has engaged in simultaneous trade disputes with China, Europe, Japan, Mexico and Canada. The disputes with Mexico and Canada may be heading toward resolution but the other disputes remain outstanding and how or when they are resolved remains uncertain. We do know, however, that trade barriers tend to make goods and services
11 OPPENHEIMER FUNDAMENTAL ALTERNATIVES FUND
more expensive, and on a longer-term basis, they tend to slow economic growth, although the impact may not be apparent for some time.
There is a changing of the guard at the Fed. Jerome Powell became the new Chairman of the Fed when Janet Yellen’s term expired in February. Randy Quarles joined the Fed in early 2018, Richard Clarida joined the Fed as Vice Chairman in August and Michelle Bowman joined the Fed in November 2018. Trump has also nominated Professor Marvin Goodfriend and Fed staff member Nellie Liang to positions as Fed Governors. If a newly reconstituted Fed is more hawkish than investors currently expect, then the Trump administration could ultimately shift the tide away from the current easy money policies of central banks around the world. The Fed has raised the Fed Funds rates by 25 bps eight times since December 2015, including three times 2018, and indicated that it plans an additional hike in December 2018, three in 2019 and one in 2020. It also started to normalize its $4.5 trillion balance sheet in October 2017, which is effectively additional monetary policy tightening. At the Fed’s stated pace, that balance sheet should shrink below $4.0 trillion by the end of 2018.
The Fed is not alone—other central banks are moving in the same direction. Almost a dozen central banks around the world have started hiking rates this year in response to rising inflation and a falling local currency. Among the G-4 central banks, the European Central Bank is currently tapering
its QE program (which is expected to end in December), the Bank of Japan has signaled that it could let the yield on 10-year Japanese government bonds start to rise next year, and the Bank of England recently hiked rates for the second time in a decade. All of this is a notable regime shift after years of coordinated monetary policy easing on a global basis. We could possibly see the first reduction of QE on a global basis in a while in 2019 as other central banks follow the U.S. in reducing stimulus. In fact, the rate at which G-4 central bank balance sheets are expanding has already slowed dramatically since the Fed started shrinking its balance sheet in 2017. The next step is for the collective size of those balance sheets to start contracting. Today, only the Fed’s balance sheet is contracting. This change could be significant because central bank buying of assets globally has impacted interest rates around the world. We have constructed the portfolio with an eye toward delivering low volatility, effective diversification, strong downside risk mitigation and high risk-adjusted returns in a variety of market conditions.
U.S. stocks and bonds remain expensive. Valuations for stocks and bonds in the U.S. are near their highest deciles going back 100 years. The fact that both asset classes are so expensive at the same time is unusual. Regarding equities, there has been an earnings boost coming from tax reform but in the long term, buying stocks at high valuations means lower expected future returns for investors. At the same time, U.S. fixed income is expensive relative to historical
12 OPPENHEIMER FUNDAMENTAL ALTERNATIVES FUND
valuations and the Fed has repeatedly warned of additional rate hikes through 2020. Moreover, the Trump administration’s fiscal and economic policies have caused a meaningful change in the outlook for fixed income. Treasury rates had been range bound for some time, with yields oscillating between 1.25% to 3.0%. In the longer run, however, we did not believe rates this low were sustainable. Trump’s election victory sent rates higher as the 10-year yield jumped from 1.85% on election day to 3.14% by 10/31/18. We have become more bearish on fixed income after the election. In our view, a strong focus on valuations is critical at this point in the economic, equity and credit cycles.
Seeking attractive investment opportunities later in the cycle. We believe the U.S. economy still has attractive growth potential in certain areas, and are waiting to see what additional pro-growth policies the Trump administration can actually implement. We recognize that there are pockets of innovation and disruption in different industries including consumer packaged goods, pharmaceuticals, consumer discretionary, real estate and technology. Nonetheless, we are mindful that the U.S. equity bull market became the longest on record since World War II as of 8/22/18, eclipsing the prior record that ran from October 1990 to March 2000. We also recognize that extended periods of low equity volatility historically have not been sustainable, and they typically resolve with a period of meaningfully higher volatility. In
part because of the Fed’s multiple rounds of quantitative easing in the wake of the global financial crisis, the U.S. equity market entered an extended period of low volatility that began in early 2012 and continues through today. Over the last 30 years, the average maximum drawdown for the S&P 500 during periods of low volatility has been just under 10%. In sharp contrast, the average maximum drawdown for the S&P 500 during periods of high volatility has been just over 40%. The dual risks for investors are that volatility moves meaningfully higher and drawdowns become much more severe.
Moreover, we recognize that U.S. equity valuations are pushing up against the edge of bubble territory after several years when S&P 500 Index performance ran well ahead of earnings growth, leading to significant multiple expansion. (Since the S&P 500 bottomed in March 2009, it has climbed by more than 300% through 10/31/18 while S&P earnings have grown by less than one third of that figure.) In fact, the only time in the last four decades when the S&P 500 Index has traded at a higher price-earnings multiple on next 12 months’ consensus earnings was during the Tech Bubble in 1997-2000.
Accordingly, we continue to pick our spots, selecting securities that we believe offer attractive risk-adjusted returns. We remain focused, as always, on controlling volatility and mitigating downside risk. We expect to be in a cross-current heavy world for a while. We believe that the ability to generate attractive returns efficiently and without
13 OPPENHEIMER FUNDAMENTAL ALTERNATIVES FUND
taking on undue risk, controlling volatility and limiting drawdowns will be of greater value to investors in this kind of environment, and
that is where our investment team’s efforts are focused.
|  | |||
| Michelle Borré, CFA | ||||
| Portfolio Manager |

14 OPPENHEIMER FUNDAMENTAL ALTERNATIVES FUND
LONG/SHORT CREDIT
| ||||||
| Long | Short | Net | ||||
| Corporate Bonds & Hybrid Securities | 6.7% | -% | 6.7% | |||
| Asset Backed Securities | 9.1 | - | 9.1 | |||
| Bank Loans | 11.2 | - | 11.2 | |||
| Catastrophe Bonds | 1.3 | -0.1 | 1.2 | |||
| Relative Value | 8.2 | -9.3 | -1.1 | |||
| Total | 36.5% | -9.4% | 27.1% | |||
LONG/SHORT EQUITY
| ||||||
| Long | Short | Net | ||||
| Common Stocks | 56.1% | -33.4% | 22.7% | |||
| Other Equity Derivatives | 2.6 | -1.8 | 0.8 | |||
| Equity Options | 1.2 | - | 1.2 | |||
| Total | 59.9% | -35.2% | 24.7% | |||
LONG/SHORT MACRO
| ||||||
| Long | Short | Net | ||||
| Commodities | 3.5% | -% | 3.5% | |||
| Rates | - | -7.2 | -7.2 | |||
| Sovereign Debt | 5.0 | -9.0 | -4.0 | |||
| Currency | - | -3.8 | -3.8 | |||
| Total | 8.5% | -20.0% | -11.5% | |||
CASH
| ||||||
| Long | Short | Net | ||||
| Collateral Cash | 35.4% | -% | 35.4% | |||
| Cash & Cash-Like Net of Collateral Cash | 7.4 | - | 7.4 | |||
| Total | 42.8% | -% | 42.8% | |||
HEDGES
| ||||||
| Long | Short | Net | ||||
| FX Hedges for Equities | -1.3% | -% | -1.3% | |||
| Duration Hedges (Bond Futures) | -1.1 | - | -1.1 | |||
| Total | -2.4% | -% | -2.4% | |||
15 OPPENHEIMER FUNDAMENTAL ALTERNATIVES FUND
TOTAL PORTFOLIO
| Long | Short | Net | ||||
| Long/Short Credit | 36.5% | -9.4% | 27.1% | |||
| Long/Short Equity | 59.9 | -35.2 | 24.7 | |||
| Long/Short Macro | 8.5 | -20.0 | -11.5 | |||
| Cash | 42.8 | - | 42.8 | |||
| Hedges | -2.4 | - | -2.4 |
Portfolio holdings are subject to change, and are dollar weighted based on total net assets. Percentages are as of October 31, 2018. Negative weightings may result from the use of leverage. Leverage involves the use of various financial instruments or borrowed capital in an attempt to increase investment return. Leverage risks include potential for higher volatility, greater decline of the Fund’s net asset value and fluctuations of dividends and distributions paid by the Fund.
16 OPPENHEIMER FUNDAMENTAL ALTERNATIVES FUND
Share Class Performance
AVERAGE ANNUAL TOTAL RETURNS WITHOUT SALES CHARGE AS OF 10/31/18
| Inception Date | 1-Year | 5-Year | 10-Year | |||||||||||||
| Class A (QVOPX) | 1/3/89 | 2.34 | % | 3.15 | % | 3.67 | % | |||||||||
| Class C (QOPCX) | 9/1/93 | 1.59 | 2.36 | 2.88 | ||||||||||||
| Class I (QOPIX) | 2/28/13 | 2.77 | 3.58 | 3.72 | * | |||||||||||
| Class R (QOPNX) | 3/1/01 | 2.07 | 2.88 | 3.36 | ||||||||||||
| Class Y (QOPYX) | 12/16/96 | 2.59 | 3.38 | 3.94 | ||||||||||||
| AVERAGE ANNUAL TOTAL RETURNS WITH SALES CHARGE AS OF 10/31/18 |
| |||||||||||||||
| Inception Date | 1-Year | 5-Year | 10-Year | |||||||||||||
| Class A (QVOPX) | 1/3/89 | -3.55 | % | 1.93 | % | 3.05 | % | |||||||||
| Class C (QOPCX) | 9/1/93 | 0.59 | 2.36 | 2.88 | ||||||||||||
| Class I (QOPIX) | 2/28/13 | 2.77 | 3.58 | 3.72 | * | |||||||||||
| Class R (QOPNX) | 3/1/01 | 2.07 | 2.88 | 3.36 | ||||||||||||
| Class Y (QOPYX) | 12/16/96 | 2.59 | 3.38 | 3.94 | ||||||||||||
* Shows performance since inception.
Performance data quoted represents past performance, which does not guarantee future results. The investment return and principal value of an investment in the Fund will fluctuate so that an investor’s shares, when redeemed, may be worth more or less than their original cost. Current performance may be lower or higher than the performance quoted. Returns do not consider capital gains or income taxes on an individual’s investment. For performance data current to the most recent month-end, visit oppenheimerfunds.com or call 1.800. CALL OPP (225.5677). Fund returns include changes in share price, reinvested distributions, and the applicable sales charge: for Class A shares, the current maximum initial sales charge of 5.75% and for Class C shares, the contingent deferred sales charge of 1% for the 1-year period. There is no sales charge for Class I, Class R and Class Y shares. Returns for periods of less than one year are cumulative and not annualized. See Fund prospectuses and summary prospectuses for more information on share classes and sales charges.
The Fund’s performance is compared to the performance of the HFRX Global Hedge Fund Index. The HFRX Global Hedge Fund Index is designed to be representative of the overall composition of the hedge fund universe. It is comprised of all eligible hedge fund strategies; including but not limited to convertible arbitrage, distressed securities, equity hedge, equity market neutral, event driven, macro, merger arbitrage, and relative value arbitrage. The strategies are asset weighted based on the distribution of assets in the hedge fund industry. The Index is unmanaged and cannot be purchased directly by investors. While index comparisons may be useful to provide a benchmark for the Fund’s performance, it must be noted that the Fund’s investments are not limited to the investments comprising the Index. Index performance includes reinvestment of income, but does not reflect transaction costs, fees, expenses or taxes. Index performance is shown for illustrative purposes only as a benchmark for the Fund’s performance, and does not predict or depict performance of
17 OPPENHEIMER FUNDAMENTAL ALTERNATIVES FUND
the Fund. The Fund’s performance reflects the effects of the Fund’s business and operating expenses.
Morningstar ranking is for Class A shares and ranking may include more than one share class of funds in the category, including other share classes of this Fund. Ranking is based on total return as of 10/31/18, without considering sales charges. Different share classes may have different expenses and performance characteristics. Fund rankings are subject to change monthly. The Fund’s total-return percentile rank is relative to all funds that are in the Small Growth Funds category. The highest (or most favorable) percentile rank is 1 and the lowest (or least favorable) percentile rank is 100. The top-performing fund in a category will always receive a rank of 1.
The views in the Fund Performance Discussion represent the opinions of this Fund’s portfolio manager(s) and are not intended as investment advice or to predict or depict the performance of any investment. These views are as of the close of business on October 31, 2018, and are subject to change based on subsequent developments. The Fund’s portfolio and strategies are subject to change.
Before investing in any of the Oppenheimer funds, investors should carefully consider a fund’s investment objectives, risks, charges and expenses. Fund prospectuses and summary prospectuses contain this and other information about the funds, and may be obtained by asking your financial advisor, visiting oppenheimerfunds.com, or calling 1.800.CALL OPP (225.5677). Read prospectuses and summary prospectuses carefully before investing.
Shares of Oppenheimer funds are not deposits or obligations of any bank, are not guaranteed by any bank, are not insured by the FDIC or any other agency, and involve investment risks, including the possible loss of the principal amount invested.
18 OPPENHEIMER FUNDAMENTAL ALTERNATIVES FUND
Fund Expenses. As a shareholder of the Fund, you incur two types of costs: (1) transaction costs, which may include sales charges (loads) on purchase payments and/or contingent deferred sales charges on redemptions; and (2) ongoing costs, including management fees; distribution and service fees; and other Fund expenses. These examples are intended to help you understand your ongoing costs (in dollars) of investing in the Fund and to compare these costs with the ongoing costs of investing in other mutual funds.
The examples are based on an investment of $1,000.00 invested at the beginning of the period and held for the entire 6-month period ended October 31, 2018.
Actual Expenses. The first section of the table provides information about actual account values and actual expenses. You may use the information in this section for the class of shares you hold, together with the amount you invested, to estimate the expense that you paid over the period. Simply divide your account value by $1,000.00 (for example, an $8,600.00 account value divided by $1,000.00 = 8.60), then multiply the result by the number in the first section under the heading entitled “Expenses Paid During 6 Months Ended October 31, 2018” to estimate the expenses you paid on your account during this period.
Hypothetical Example for Comparison Purposes. The second section of the table provides information about hypothetical account values and hypothetical expenses based on the Fund’s actual expense ratio for each class of shares, and an assumed rate of return of 5% per year for each class before expenses, which is not the Fund’s actual return. The hypothetical account values and expenses may not be used to estimate the actual ending account balance or expenses you paid for the period. You may use this information to compare the ongoing costs of investing in the Fund and other funds. To do so, compare this 5% hypothetical example for the class of shares you hold with the 5% hypothetical examples that appear in the shareholder reports of the other funds.
Please note that the expenses shown in the table are meant to highlight your ongoing costs only and do not reflect any transactional costs, such as front-end or contingent deferred sales charges (loads). Therefore, the “hypothetical” section of the table is useful in comparing ongoing costs only, and will not help you determine the relative total costs of owning different funds. In addition, if these transactional costs were included, your costs would have been higher.
19 OPPENHEIMER FUNDAMENTAL ALTERNATIVES FUND
| Actual | Beginning Account Value May 1, 2018 |
| Ending Account Value October 31, 2018 |
| Expenses Paid During 6 Months Ended October 31, 2018 |
| ||||||||||||||||||
| Class A | $ | 1,000.00 | $ | 1,031.20 | $ | 9.88 | ||||||||||||||||||
| Class C | 1,000.00 | 1,027.20 | 13.79 | |||||||||||||||||||||
| Class I | 1,000.00 | 1,033.30 | 7.97 | |||||||||||||||||||||
| Class R | 1,000.00 | 1,029.50 | 11.26 | |||||||||||||||||||||
| Class Y | 1,000.00 | 1,032.40 | 8.69 | |||||||||||||||||||||
Hypothetical |
| |||||||||||||||||||||||
| (5% return before expenses) |
| |||||||||||||||||||||||
| Class A | 1,000.00 | 1,015.53 | 9.80 | |||||||||||||||||||||
| Class C | 1,000.00 | 1,011.70 | 13.68 | |||||||||||||||||||||
| Class I | 1,000.00 | 1,017.39 | 7.91 | |||||||||||||||||||||
| Class R | 1,000.00 | 1,014.17 | 11.18 | |||||||||||||||||||||
| Class Y | 1,000.00 | 1,016.69 | 8.63 | |||||||||||||||||||||
Expenses are equal to the Fund’s annualized expense ratio for that class, multiplied by the average account value over the period, multiplied by 184/365 (to reflect the one-half year period). Those annualized expense ratios, excluding indirect expenses from affiliated funds, based on the 6-month period ended October 31, 2018 are as follows:
| Class | Expense Ratios | |||||||
| Class A | 1.92% | |||||||
| Class C | 2.68 | |||||||
| Class I | 1.55 | |||||||
| Class R | 2.19 | |||||||
| Class Y | 1.69 | |||||||
The expense ratios reflect voluntary and/or contractual waivers and/or reimbursements of expenses by the Fund’s Manager and Transfer Agent. Some of these undertakings may be modified or terminated at any time, as indicated in the Fund’s prospectus. The “Consolidated Financial Highlights” tables in the Fund’s financial statements, included in this report, also show the gross expense ratios, without such waivers or reimbursements and reduction to custodian expenses, if applicable.
20 OPPENHEIMER FUNDAMENTAL ALTERNATIVES FUND
CONSOLIDATED STATEMENT OF INVESTMENTS October 31, 2018
| Shares | Value | |||||||
| Common Stocks—55.3% | ||||||||
| Consumer Discretionary—3.9% | ||||||||
| Entertainment—0.6% | ||||||||
| Live Nation Entertainment, Inc.1 | 141,200 | $ | 7,384,760 | |||||
| Household Durables—0.3% | ||||||||
| Everyware Global, Inc.1 | 8,735 | 13,103 | ||||||
| Mohawk Industries, Inc.1 | 24,100 | 3,005,993 | ||||||
| 3,019,096 | ||||||||
| Interactive Media & Services—1.7% | ||||||||
| Alphabet, Inc., Cl. A1 | 17,630 | 19,226,925 | ||||||
| Media—0.5% | ||||||||
| DISH Network Corp., Cl. A1 | 189,845 | 5,835,835 | ||||||
| Specialty Retail—0.8% | ||||||||
| Gymboree Corp. (The)1,3 | 4,118 | 23,421 | ||||||
| Gymboree Holding Corp.1,3 | 11,737 | 66,754 | ||||||
| Lowe’s Cos., Inc. | 101,920 | 9,704,823 | ||||||
| 9,794,998 | ||||||||
| Consumer Staples—4.0% | ||||||||
| Beverages—1.1% | ||||||||
| Coca-Cola Co. (The) | 266,190 | 12,745,177 | ||||||
| Tobacco—2.9% | ||||||||
| Altria Group, Inc.2 | 186,671 | 12,141,082 | ||||||
| Philip Morris International, Inc.2 | 240,250 | 21,158,818 | ||||||
| 33,299,900 | ||||||||
| Energy—4.4% | ||||||||
| Energy Equipment & Services—0.6% | ||||||||
| Halliburton Co. | 69,132 | 2,397,498 | ||||||
| Schlumberger Ltd. | 77,010 | 3,951,383 | ||||||
| 6,348,881 | ||||||||
| Oil, Gas & Consumable Fuels—3.8% | ||||||||
| Arch Coal, Inc., Cl. A | 436 | 41,812 | ||||||
| Ascent Resources - Marcellus LLC, Cl. A1 | 30,363 | 97,420 | ||||||
| Chevron Corp. | 55,271 | 6,171,007 | ||||||
| ConocoPhillips | 102,584 | 7,170,622 | ||||||
| EOG Resources, Inc. | 27,643 | 2,911,914 | ||||||
| Noble Energy, Inc. | 126,891 | 3,153,241 | ||||||
| Occidental Petroleum Corp. | 100,402 | 6,733,962 | ||||||
| Pioneer Natural Resources Co. | 19,630 | 2,890,910 | ||||||
| Sabine Oil1,4 | 113 | 5,085 | ||||||
| Templar Energy, Cl. A1,4 | 9,620 | 9,620 | ||||||
| TOTAL SA, Sponsored ADR | 149,409 | 8,755,367 | ||||||
21 OPPENHEIMER FUNDAMENTAL ALTERNATIVES FUND
CONSOLIDATED STATEMENT OF INVESTMENTS Continued
| Shares | Value | |||||||
| Oil, Gas & Consumable Fuels (Continued) | ||||||||
| Valero Energy Corp. | 68,706 | $ | 6,258,430 | |||||
| 44,199,390 | ||||||||
| Financials—9.6% | ||||||||
| Capital Markets—1.9% | ||||||||
| Goldman Sachs Group, Inc. (The) | 53,570 | 12,073,071 | ||||||
| Raymond James Financial, Inc. | 53,730 | 4,120,554 | ||||||
| State Street Corp. | 76,300 | 5,245,625 | ||||||
| 21,439,250 | ||||||||
| Commercial Banks—2.6% | ||||||||
| M&T Bank Corp.2 | 94,150 | 15,573,351 | ||||||
| PNC Financial Services Group, Inc. (The) | 34,100 | 4,381,509 | ||||||
| Wells Fargo & Co. | 192,160 | 10,228,677 | ||||||
| 30,183,537 | ||||||||
| Consumer Finance—0.0% | ||||||||
| J.G. Wentworth Co., Cl. A1 | 22,344 | 217,854 | ||||||
| Insurance—3.1% | ||||||||
| Allstate Corp. (The) | 58,800 | 5,628,336 | ||||||
| Chubb Ltd. | 212,880 | 26,590,841 | ||||||
| Travelers Cos., Inc. (The) | 25,400 | 3,178,302 | ||||||
| 35,397,479 | ||||||||
| Real Estate Investment Trusts (REITs)—1.8% | ||||||||
| Blackstone Mortgage Trust, Inc., Cl. A | 427,722 | 14,431,340 | ||||||
| Starwood Property Trust, Inc. | 284,020 | 6,168,915 | ||||||
| 20,600,255 | ||||||||
| Thrifts & Mortgage Finance—0.2% | ||||||||
| WSFS Financial Corp. | 65,110 | 2,769,128 | ||||||
| Health Care—12.0% | ||||||||
| Biotechnology—0.9% | ||||||||
| Shire plc, ADR | 59,483 | 10,814,009 | ||||||
| Health Care Equipment & Supplies—1.5% | ||||||||
| Abbott Laboratories | 82,080 | 5,658,595 | ||||||
| Medtronic plc | 125,438 | 11,266,841 | ||||||
| New Millennium Holdco, Inc.1 | 7,733 | 890 | ||||||
| 16,926,326 | ||||||||
| Health Care Providers & Services—4.7% | ||||||||
| AMN Healthcare Services, Inc.1 | 55,560 | 2,812,447 | ||||||
| Cigna Corp. | 55,830 | 11,937,012 | ||||||
| HCA Healthcare, Inc. | 24,930 | 3,328,903 | ||||||
| Millennium Corporate Claim Litigation Trust1,4 | 441 | — | ||||||
| Millennium Lender Claim Litigation Trust1,4 | 882 | — | ||||||
22 OPPENHEIMER FUNDAMENTAL ALTERNATIVES FUND
| Shares | Value | |||||||
| Health Care Providers & Services (Continued) | ||||||||
| Premier, Inc., Cl. A1 | 193,670 | $ | 8,715,150 | |||||
| Quest Diagnostics, Inc. | 51,490 | 4,845,724 | ||||||
| UnitedHealth Group, Inc.2 | 85,670 | 22,389,855 | ||||||
| 54,029,091 | ||||||||
| Pharmaceuticals—4.9% | ||||||||
| Allergan plc | 30,020 | 4,743,460 | ||||||
| Johnson & Johnson | 58,020 | 8,122,220 | ||||||
| Merck & Co., Inc.2 | 233,680 | 17,201,185 | ||||||
| Mylan NV1 | 190,850 | 5,964,063 | ||||||
| Novartis AG, Sponsored ADR | 111,792 | 9,777,328 | ||||||
| Roche Holding AG | 42,113 | 10,218,641 | ||||||
| 56,026,897 | ||||||||
| Industrials—7.2% | ||||||||
| Aerospace & Defense—3.7% | ||||||||
| L3 Technologies, Inc. | 32,520 | 6,161,564 | ||||||
| Lockheed Martin Corp.2 | 50,140 | 14,733,639 | ||||||
| Northrop Grumman Corp. | 43,470 | 11,386,967 | ||||||
| Raytheon Co. | 59,980 | 10,498,899 | ||||||
| 42,781,069 | ||||||||
| Air Freight & Couriers—0.3% | ||||||||
| FedEx Corp. | 15,740 | 3,468,151 | ||||||
| Commercial Services & Supplies—0.9% | ||||||||
| Republic Services, Inc., Cl. A | 146,420 | 10,641,806 | ||||||
| Construction & Engineering—0.3% | ||||||||
| Granite Construction, Inc.2 | 60,640 | 2,772,461 | ||||||
| Industrial Conglomerates—1.5% | ||||||||
| General Electric Co.2 | 641,800 | 6,482,180 | ||||||
| Honeywell International, Inc. | 77,340 | 11,200,379 | ||||||
| 17,682,559 | ||||||||
| Machinery—0.5% | ||||||||
| Stanley Black & Decker, Inc. | 50,130 | 5,841,147 | ||||||
| Transportation Infrastructure—0.0% | ||||||||
| Harvey Gulf International Marine LLC1 | 731 | 39,474 | ||||||
| Information Technology—6.9% | ||||||||
| Communications Equipment—1.9% | ||||||||
| Cisco Systems, Inc.2 | 396,250 | 18,128,438 | ||||||
| CommScope Holding Co., Inc.1 | 162,520 | 3,910,231 | ||||||
| 22,038,669 | ||||||||
23 OPPENHEIMER FUNDAMENTAL ALTERNATIVES FUND
CONSOLIDATED STATEMENT OF INVESTMENTS Continued
| Shares | Value | |||||||
| Semiconductors & Semiconductor Equipment—3.1% | ||||||||
| QUALCOMM, Inc. | 128,420 | $ | 8,076,334 | |||||
| Taiwan Semiconductor Manufacturing Co. Ltd., Sponsored ADR | 133,252 | 5,076,901 | ||||||
| Xilinx, Inc.2 | 261,320 | 22,308,888 | ||||||
| 35,462,123 | ||||||||
| Software—0.0% | ||||||||
| Avaya Holdings Corp.1,2 | 16,772 | 275,396 | ||||||
| Technology Hardware, Storage & Peripherals—1.9% | ||||||||
| Apple, Inc. | 96,796 | 21,184,773 | ||||||
| Materials—2.7% | ||||||||
| Chemicals—0.9% | ||||||||
| Celanese Corp., Cl. A | 104,490 | 10,129,260 | ||||||
| Containers & Packaging—1.6% | ||||||||
| Packaging Corp. of America | 61,780 | 5,672,022 | ||||||
| Sonoco Products Co. | 236,200 | 12,891,796 | ||||||
| 18,563,818 | ||||||||
| Metals & Mining—0.2% | ||||||||
| Steel Dynamics, Inc. | 71,550 | 2,833,380 | ||||||
| Telecommunication Services—1.8% | ||||||||
| Diversified Telecommunication Services—1.8% | ||||||||
| BCE, Inc. | 285,110 | 11,085,077 | ||||||
| Verizon Communications, Inc. | 160,350 | 9,154,381 | ||||||
| 20,239,458 | ||||||||
| Utilities—2.8% | ||||||||
| Electric Utilities—2.1% | ||||||||
| American Electric Power Co., Inc. | 169,580 | 12,440,389 | ||||||
| Edison International | 76,350 | 5,297,927 | ||||||
| PG&E Corp.1 | 145,220 | 6,797,748 | ||||||
| 24,536,064 | ||||||||
| Multi-Utilities—0.7% | ||||||||
| CMS Energy Corp. | 159,770 | 7,911,810 | ||||||
| Total Common Stocks (Cost $514,833,484) | 636,660,206 | |||||||
| Preferred Stocks—2.1% | ||||||||
| Citigroup Capital XIII, 7.75% Cum., Non-Vtg. [US0003M+637]5 | 447,545 | 11,846,516 | ||||||
| M&T Bank Corp., 6.375% Cum., Series A, Non-Vtg. | 5,167 | 5,185,162 | ||||||
| M&T Bank Corp., 6.375% Cum., Series C, Non-Vtg. | 7,500 | 7,575,000 | ||||||
| Total Preferred Stocks (Cost $24,730,637) | 24,606,678 | |||||||
| Units | ||||||||
| Rights, Warrants and Certificates—0.0% | ||||||||
| Ascent Resources - Marcellus LLC Wts., Strike Price $1, Exp. 12/31/491,4 | 7,861 | 236 | ||||||
24 OPPENHEIMER FUNDAMENTAL ALTERNATIVES FUND
| Units | Value | |||||||
| Rights, Warrants and Certificates (Continued) | ||||||||
| Sabine Oil Tranche 1 Wts., Strike Price $4.49, Exp. 8/11/261,4 | 361 | $ | 2,256 | |||||
| Sabine Oil Tranche 2 Wts., Strike Price $2.72, Exp. 8/11/261,4 | 64 | 336 | ||||||
| Total Rights, Warrants and Certificates (Cost $49,071) | 2,828 | |||||||
| Principal Amount | ||||||||
| Asset-Backed Securities—4.4% | ||||||||
| Accredited Mortgage Loan Trust, Series 2005-3, Cl. M3, 2.96% [US0001M+48], 9/25/355 | $ | 3,398,720 | 3,293,271 | |||||
| GSAMP Trust: | ||||||||
| Series 2005-HE4, Cl. M3, 3.061% [US0001M+78], 7/25/455 | 3,300,000 | 3,301,528 | ||||||
| Series 2005-HE5, Cl. M3, 2.741% [US0001M+46], 11/25/355 | 8,121,777 | 8,044,887 | ||||||
| Series 2007-HS1, Cl. M4, 4.531% [US0001M+225], 2/25/475 | 6,600,000 | 6,720,266 | ||||||
| JP Morgan Mortgage Acquisition Corp., Series 2005-OPT2, Cl. M2, 2.731% [US0001M+45], 12/25/355 | 1,836,000 | 1,835,500 | ||||||
| New Century Home Equity Loan Trust, Series 2005-2, Cl. M3, 3.016% [US0001M+73.5], 6/25/355 | 5,500,000 | 5,520,196 | ||||||
| RASC Series Trust: | ||||||||
| Series 2005-KS8, Cl. M5, 2.921% [US0001M+64], 8/25/355 | 2,993,634 | 2,950,122 | ||||||
| Series 2006-KS2, Cl. M2, 2.671% [US0001M+39], 3/25/365 | 14,625,000 | 14,329,075 | ||||||
| Raspro Trust, Series 2005-1A, Cl. G, 2.738% [LIBOR03M+40], 3/23/245,6 | 4,772,851 | 4,807,102 | ||||||
| Total Asset-Backed Securities (Cost $44,744,360) | 50,801,947 | |||||||
| Mortgage-Backed Obligations—4.7% | ||||||||
| Ameriquest Mortgage Securities, Inc., Series 2004-R2, Cl. M1, 2.926% [US0001M+64.5], 4/25/345 | 3,558,338 | 3,504,833 | ||||||
| Asset-Backed Funding Certificates Trust, Series 2005-HE2, Cl. M3, 3.061% [US0001M+78], 6/25/355 | 3,425,898 | 3,453,700 | ||||||
| Citigroup Mortgage Loan Trust, Inc., Series 2004-OPT1, Cl. M3, 3.226% [US0001M+94.5], 10/25/345 | 1,250,000 | 1,263,710 | ||||||
| First NLC Trust, Series 2005-4, Cl. A4, 2.671% [US0001M+39], 2/25/365 | 9,354,525 | 9,336,219 | ||||||
| Home Equity Asset Trust, Series 2005-5, Cl. M2, 3.046% [US0001M+76.5], 11/25/355 | 981,497 | 986,368 | ||||||
| Home Equity Mortgage Loan Asset-Backed Trust, Series 2005-B, Cl. M3, 3.016% [US0001M+73.5], 8/25/355 | 1,298,061 | 1,300,461 | ||||||
| MASTR Adjustable Rate Mortgages Trust, Series 2004-13, Cl. 2A2, 4.462%, 4/21/347 | 212,912 | 218,797 | ||||||
| Park Place Securities, Inc., Series 2005-WCW3, Cl. M1, 2.761% [US0001M+48], 8/25/355 | 3,396,544 | 3,407,059 | ||||||
| RAMP Trust: | ||||||||
| Series 2005-RS2, Cl. M4, 3.001% [US0001M+72], 2/25/355 | 4,469,000 | 4,478,009 | ||||||
| Series 2005-RS6, Cl. M2, 3.046% [US0001M+76.5], 6/25/355 | 14,146 | 14,182 | ||||||
| Series 2006-EFC1, Cl. M2, 2.681% [US0001M+40], 2/25/365 | 5,490,000 | 5,461,659 | ||||||
| Series 2006-NC3, Cl. A3, 2.551% [US0001M+27], 3/25/365 | 16,698,000 | 16,557,787 | ||||||
| Structured Asset Securities Corp. Mortgage Loan Trust, Series 2007-GEL2, Cl. A2, 2.601% [US0001M+32], 5/25/375,6 | 3,775,361 | 3,761,386 | ||||||
| Total Mortgage-Backed Obligations (Cost $41,787,835) | 53,744,170 | |||||||
| Non-Convertible Corporate Bonds and Notes—5.3% | ||||||||
| American Express Co.: | ||||||||
| 2.20% Sr. Unsec. Nts., 10/30/20 | 500,000 | 488,467 | ||||||
25 OPPENHEIMER FUNDAMENTAL ALTERNATIVES FUND
CONSOLIDATED STATEMENT OF INVESTMENTS Continued
| Principal Amount | Value | |||||||
| Non-Convertible Corporate Bonds and Notes (Continued) | ||||||||
| American Express Co.: (Continued) | ||||||||
| 2.85% [US0003M+33] Sr. Unsec. Nts., 10/30/205 | $ | 500,000 | $ | 500,135 | ||||
| American Honda Finance Corp., 2.488% [US0003M+15] Sr. Unsec. Nts., 11/13/195 | 200,000 | 200,058 | ||||||
| Bank of America Corp., 6.25% [US0003M+370.5] Jr. Sub. Perpetual Bonds5,8 | 12,425,000 | 12,813,281 | ||||||
| Bank of Montreal, 2.934% [US0003M+60] Sr. Unsec. Nts., 12/12/195 | 800,000 | 804,506 | ||||||
| Berry Global, Inc., 4.50% Sec. Nts., 2/15/266 | 25,000 | 23,437 | ||||||
| BMW US Capital LLC: | ||||||||
| 2.689% [US0003M+37] Sr. Unsec. Nts., 8/14/205,6 | 500,000 | 501,192 | ||||||
| 3.25% Sr. Unsec. Nts., 8/14/206 | 500,000 | 499,360 | ||||||
| Daimler Finance North America LLC, 2.891% [US0003M+55] Sr. Unsec. Nts., 5/4/215,6 | 1,100,000 | 1,100,924 | ||||||
| Goldman Sachs Capital II, 4.00% [US0003M+76.75] Jr. Sub. Perpetual Bonds5,8 | 54,000 | 43,335 | ||||||
| Goldman Sachs Group, Inc. (The): | ||||||||
| 5.375% [US0003M+392.2] Jr. Sub. Perpetual Bonds5,8 | 9,191,000 | 9,305,888 | ||||||
| 5.70% [US0003M+388.4] Jr. Sub. Perpetual Bonds, Series L5,8 | 5,678,000 | 5,699,292 | ||||||
| Lukoil International Finance BV, 6.125% Sr. Unsec. Nts., 11/9/206 | 12,375,000 | 12,831,019 | ||||||
| Nutrien Ltd., 6.75%, 1/15/19 | 1,175,000 | 1,183,697 | ||||||
| Resolute Energy Corp., 8.50% Sr. Unsec. Nts., 5/1/20 | 6,190,000 | 6,197,738 | ||||||
| Schlumberger Holdings Corp., 2.35% Sr. Unsec. Nts., 12/21/186 | 1,400,000 | 1,399,386 | ||||||
| Skandinaviska Enskilda Banken AB, 2.904% [US0003M+57] Sr. Unsec. Nts., 9/13/195,6 | 1,300,000 | 1,304,800 | ||||||
| Tesla, Inc., 5.30% Sr. Unsec. Nts., 8/15/256 | 500,000 | 446,250 | ||||||
| Toronto-Dominion Bank (The), 2.865% [US0003M+42] Sr. Unsec. Nts., 1/18/195 | 1,200,000 | 1,200,883 | ||||||
| United States Cellular Corp., 6.70% Sr. Unsec. Nts., 12/15/33 | 599,000 | 611,729 | ||||||
| United States Steel Corp., 6.25% Sr. Unsec. Nts., 3/15/26 | 225,000 | 212,625 | ||||||
| Wells Fargo Bank NA, 2.987% [US0003M+51] Sr. Unsec. Nts., 10/22/215 | 3,728,000 | 3,731,207 | ||||||
| Total Non-Convertible Corporate Bonds and Notes (Cost $62,046,373) | 61,099,209 | |||||||
| Corporate Loans—13.5% | ||||||||
| Consumer Discretionary—5.2% | ||||||||
| Auto Components—0.0% | ||||||||
| Tower Automotive Holdings USA LLC, Sr. Sec. Credit Facilities 1st Lien Term Loan, Tranche B, 5.063%, [LIBOR12+275], 3/7/245 | 113,316 | 113,316 | ||||||
| Distributors—0.2% | ||||||||
| Albertson’s LLC, Sr. Sec. Credit Facilities 1st Lien Term Loan: | ||||||||
| Tranche B4, 5.052%, [LIBOR12+275], 8/25/215 | 192,945 | 192,902 | ||||||
| Tranche B6, 5.311%, [LIBOR4+300], 6/22/235 | 123,824 | 123,487 | ||||||
| Tranche B7, 5.487%, 10/26/257,9 | 62,879 | 62,473 | ||||||
| Alphabet Holdings Co., Inc., Sr. Sec. Credit Facilities 1st Lien Term Loan, 5.802%, [LIBOR4+350], 9/26/245 | 262,748 | 252,333 | ||||||
| Ascena Retail Group, Inc., Sr. Sec. Credit Facilities 1st Lien Term Loan, Tranche B, 6.813%, [LIBOR12+450], 8/21/225 | 165,389 | 160,882 | ||||||
| Bass Pro Group LLC, Sr. Sec. Credit Facilities 1st Lien Term Loan, 7.242%, [LIBOR12+500], 9/25/245 | 361,326 | 361,810 | ||||||
26 OPPENHEIMER FUNDAMENTAL ALTERNATIVES FUND
| Principal Amount | Value | |||||||
| Distributors (Continued) | ||||||||
| Bass Pro Group LLC, Sr. Sec. Credit Facilities 1st Lien Term Loan, 7.449%, 9/25/247,9 | $ | 97,000 | $ | 97,130 | ||||
| Belk, Inc., Sr. Sec. Credit Facilities 1st Lien Term Loan, Tranche B, 7.034%, [LIBOR4+475], 12/12/225,9 | 84,693 | 71,401 | ||||||
| Harbor Freight Tools USA, Inc., Sr. Sec. Credit Facilities 1st Lien Term Loan, 4.802%, [LIBOR12+250], 8/18/235 | 69,630 | 68,621 | ||||||
| JC Penney Corp., Inc., Sr. Sec. Credit Facilities 1st Lien Term Loan, Tranche B, 6.567%, [LIBOR4+425], 6/23/235 | 91,256 | 82,130 | ||||||
| Jo-Ann Stores LLC, Sr. Sec. Credit Facilities 1st Lien Term Loan, Tranche B, 7.477%, [LIBOR4+500], 10/20/235 | 34,819 | 34,960 | ||||||
| Michaels Stores, Inc., Sr. Sec. Credit Facilities 1st Lien Term Loan, 4.742%-4.797%, [LIBOR12+250], 1/30/235 | 162,122 | 161,338 | ||||||
| Party City Holding, Inc., Sr. Sec. Credit Facilities 1st Lien Term Loan, 5.00%-5.06%, [LIBOR12+275], 8/19/225 | 81,378 | 81,756 | ||||||
| Petco Animal Supplies, Inc., Sr. Sec. Credit Facilities 1st Lien Term Loan, Tranche B1, 5.777%, [LIBOR4+300], 1/26/235 | 268,539 | 209,057 | ||||||
| PetSmart, Inc., Sr. Sec. Credit Facilities 1st Lien Term Loan, Tranche B, 5.28%, [LIBOR12+300], 3/11/225 | 530,911 | 451,577 | ||||||
| United Natural Foods, Inc., Sr. Sec. Credit Facilities 1st Lien Term Loan, Tranche B, 6.199%, [LIBOR12+425], 10/15/255 | 275,000 | 258,844 | ||||||
| 2,670,701 | ||||||||
| Diversified Consumer Services—0.1% | ||||||||
| 4L Technologies, Inc., Sr. Sec. Credit Facilities 1st Lien Term Loan, Tranche B, 6.795%, [LIBOR4+450], 5/8/205 | 378,173 | 370,492 | ||||||
| IQOR US, Inc., Sr. Sec. Credit Facilities 1st Lien Term Loan, Tranche B, 7.398%, [LIBOR4+500], 4/1/215 | 360,166 | 336,605 | ||||||
| IQOR US, Inc., Sr. Sec. Credit Facilities 2nd Lien Term Loan, 11.148%, [LIBOR4+875], 4/1/225 | 44,964 | 35,803 | ||||||
| 742,900 | ||||||||
| Hotels, Restaurants & Leisure—1.9% | ||||||||
| 24 Hour Fitness Worldwide, Inc., Sr. Sec. Credit Facilities 1st Lien Term Loan, Tranche B, 5.802%, [LIBOR12+350], 5/30/255 | 179,550 | 180,111 | ||||||
| Boyd Gaming Corp., Sr. Sec. Credit Facilities 1st Lien Term Loan, Tranche B, 4.467%, [LIBOR52+250], 9/15/235 | 154,967 | 155,355 | ||||||
| Caesars Growth Properties Holdings LLC, Sr. Sec. Credit Facilities 1st Lien Term Loan, 5.052%, [LIBOR4+275], 12/23/245,9 | 1,349,275 | 1,351,245 | ||||||
| CDS US Intermediate Holdings, Inc., Sr. Sec. Credit Facilities 1st Lien Term Loan, 6.136%, [LIBOR4+375], 7/8/225 | 94,685 | 93,738 | ||||||
| CEOC LLC, Sr. Sec. Credit Facilities 1st Lien Exit Term Loan, Tranche B, 4.302%, [LIBOR12+200], 10/7/245 | 245,264 | 244,345 | ||||||
| Churchill Downs, Inc., Sr. Sec. Credit Facilities 1st Lien Term Loan, Tranche B, 4.31%, [LIBOR12+200], 12/27/245 | 89,325 | 89,604 | ||||||
| CityCenter Holdings LLC, Sr. Sec. Credit Facilities 1st Lien Term Loan, Tranche B, 4.552%, [LIBOR12+225], 4/18/245 | 307,207 | 306,967 | ||||||
| Delta 2 Lux Sarl, Sr. Sec. Credit Facilities 1st Lien Term Loan, Tranche B3, 4.802%, [LIBOR12+250], 2/1/245 | 432,140 | 428,180 | ||||||
| Eldorado Resorts, Inc., Sr. Sec. Credit Facilities 1st Lien Term Loan, 4.563%, [LIBOR4+225], 4/17/245 | 285,504 | 286,130 | ||||||
27 OPPENHEIMER FUNDAMENTAL ALTERNATIVES FUND
CONSOLIDATED STATEMENT OF INVESTMENTS Continued
| Principal Amount | Value | |||||||
| Hotels, Restaurants & Leisure (Continued) | ||||||||
| Everi Payments, Inc., Sr. Sec. Credit Facilities 1st Lien Term Loan, Tranche B, 5.302%, [LIBOR12+300], 5/9/245 | $ | 267,073 | $ | 268,325 | ||||
| Fitness & Sports Clubs LLC, Sr. Sec. Credit Facilities 1st Lien Term Loan, 5.492%, [LIBOR4+325], 4/18/255 | 54,862 | 55,045 | ||||||
| Four Seasons Hotels Ltd., Sr. Sec. Credit Facilities 1st Lien Term Loan, 4.302%, [LIBOR12+200], 11/30/235 | 78,600 | 78,712 | ||||||
| Gateway Casinos & Entertainment Ltd., Sr. Sec. Credit Facilities 1st Lien Term Loan, Tranche B, 5.386%, [LIBOR4+300], 12/1/235 | 74,813 | 75,116 | ||||||
| GVC Holdings plc, Sr. Sec. Credit Facilities 1st Lien Term Loan, Tranche B2, 4.742%, [LIBOR4+275], 3/29/245 | 174,125 | 174,887 | ||||||
| Hilton Worldwide Finance LLC, Sr. Sec. Credit Facilities 1st Lien Term Loan, Tranche B2, 4.031%, [LIBOR12+175], 10/25/235,9 | 11,122,674 | 11,147,033 | ||||||
| Live Nation Entertainment, Inc., Sr. Sec. Credit Facilities 1st Lien Term Loan, Tranche B3, 4.151%, 10/31/237,9 | 3,095,000 | 3,103,898 | ||||||
| LTI Holdings, Inc., Sr. Sec. Credit Facilities 1st Lien Term Loan, 5.802%, [LIBOR12+350], 9/6/255,9 | 250,000 | 250,079 | ||||||
| Scientific Games International, Inc., Sr. Sec. Credit Facilities 1st Lien Term Loan, 4.449%, [LIBOR6+275], 8/14/245,9 | 85,000 | 84,294 | ||||||
| Scientific Games International, Inc., Sr. Sec. Credit Facilities 1st Lien Term Loan, 5.044%-5.052%, [LIBOR6+275], 8/14/245 | 616,218 | 611,100 | ||||||
| SeaWorld Parks & Entertainment, Inc., Sr. Sec. Credit Facilities 1st Lien Term Loan, Tranche B5, 5.398%, [LIBOR12+300], 3/31/245,9 | 230,000 | 229,897 | ||||||
| Stars Group Holdings BV, Sr. Sec. Credit Facilities 1st Lien Term Loan, Tranche B, 5.896%, [LIBOR4+350], 7/10/255 | 698,250 | 702,129 | ||||||
| Station Casinos LLC, Sr. Sec. Credit Facilities 1st Lien Term Loan, Tranche B, 4.81%, [LIBOR12+250], 6/8/235 | 518,260 | 518,607 | ||||||
| Town Sports International LLC, Sr. Sec. Credit Facilities 1st Lien Term Loan, Tranche B, 5.802%, [LIBOR12+350], 11/15/205 | 138,580 | 136,674 | ||||||
| VICI Properties 1 LLC, Sr. Sec. Credit Facilities 1st Lien Term Loan, 4.28%, [LIBOR12+350], 12/20/245 | 24,889 | 24,862 | ||||||
| Weight Watchers International, Inc., Sr. Sec. Credit Facilities 1st Lien Term Loan, 6.86%-7.15%, [LIBOR12+475], 11/29/245 | 661,932 | 666,794 | ||||||
| Wyndham Hotels & Resorts, Inc., Sr. Sec. Credit Facilities 1st Lien Term Loan, Tranche B, 4.052%, [LIBOR4+200], 5/30/255 | 85,000 | 85,071 | ||||||
| Wynn Resorts Ltd., Sr. Sec. Credit Facilities 1st Lien Term Loan, Tranche B, 4.67%, [LIBOR4+225], 10/18/245,9 | 104,000 | 103,692 | ||||||
| 21,451,890 | ||||||||
| Household Durables—1.2% | ||||||||
| ABG Intermediate Holdings 2 LLC, Sr. Sec. Credit Facilities 1st Lien Term Loan, 5.742%, [LIBOR4+350], 9/27/245,9 | 204,585 | 204,010 | ||||||
| American Greetings Corp., Sr. Sec. Credit Facilities 1st Lien Term Loan, Tranche B, 6.804%, [LIBOR12+450], 4/6/245 | 159,600 | 160,099 | ||||||
| Anastasia Parent LLC, Sr. Sec. Credit Facilities 1st Lien Term Loan, Tranche B, 6.027%, [LIBOR12+375], 8/11/255,9 | 50,000 | 49,906 | ||||||
| Axalta Coating Systems US Holdings, Inc., Sr. Sec. Credit Facilities 1st Lien Term Loan, 4.136%, [LIBOR4+175], 6/1/245,9 | 11,105,826 | 11,093,498 | ||||||
| Coty, Inc., Sr. Sec. Credit Facilities 1st Lien Term Loan, Tranche B, 4.531%, [LIBOR4+225], 4/7/255 | 324,188 | 318,378 | ||||||
28 OPPENHEIMER FUNDAMENTAL ALTERNATIVES FUND
| Principal Amount | Value | |||||||
| Household Durables (Continued) | ||||||||
| HLF Financing Sarl, Sr. Sec. Credit Facilities 1st Lien Term Loan, Tranche B, 5.326%, [LIBOR12+325], 8/18/255 | $ | 115,000 | $ | 115,671 | ||||
| International Textile Group, Inc., Sr. Sec. Credit Facilities 1st Lien Term Loan, 7.256%, [LIBOR4+500], 5/1/245 | 114,281 | 114,853 | ||||||
| Lifetime Brands, Inc., Sr. Sec. Credit Facilities 1st Lien Term Loan, 5.802%, [LIBOR12+350], 2/28/255 | 49,750 | 49,626 | ||||||
| Revlon Consumer Products Corp., Sr. Sec. Credit Facilities 1st Lien Term Loan, 5.476%, [LIBOR12+350], 9/7/235 | 426,775 | 314,036 | ||||||
| Rodan & Fields LLC, Sr. Sec. Credit Facilities 1st Lien Term Loan, Tranche B, 6.28%, [LIBOR12+400], 6/16/255 | 234,413 | 236,024 | ||||||
| Serta Simmons Bedding LLC, Sr. Sec. Credit Facilities 1st Lien Term Loan, 5.774%-5.777%, [LIBOR4+350], 11/8/235 | 749,959 | 678,312 | ||||||
| SIWF Holdings, Inc., Sr. Sec. Credit Facilities 1st Lien Term Loan, 6.54%, [LIBOR12+425], 6/15/255 | 139,650 | 140,086 | ||||||
| Varsity Brands Holdings Co., Inc., Sr. Sec. Credit Facilities 1st Lien Term Loan, 5.802%, [LIBOR12+350], 12/16/245,9 | 34,850 | 34,953 | ||||||
| 13,509,452 | ||||||||
| Media—1.3% | ||||||||
| Acosta, Inc., Sr. Sec. Credit Facilities 1st Lien Term Loan, Tranche B, 5.492%, [LIBOR4+325], 9/26/215 | 25,599 | 19,083 | ||||||
| Advantage Sales & Marketing, Inc., Sr. Sec. Credit Facilities 1st Lien Term Loan, Tranche B, 5.552%, [LIBOR4+325], 7/23/215 | 59,535 | 54,400 | ||||||
| Altice Financing SA, Sr. Sec. Credit Facilities 1st Lien Term Loan: | ||||||||
| Tranche B, 5.04%, [LIBOR4+275], 7/15/255,9 | 261,449 | 255,773 | ||||||
| Tranche B, 5.04%, [LIBOR4+275], 1/31/265 | 9,925 | 9,720 | ||||||
| Tranche B13, 6.28%, [LIBOR4+400], 8/14/265 | 290,000 | 284,805 | ||||||
| Altice US Finance I Corp., Sr. Sec. Credit Facilities 1st Lien Term Loan, Tranche B, 4.492%, [LIBOR12+225], 7/28/255 | 257,446 | 257,366 | ||||||
| Camelot Finance LP, Sr. Sec. Credit Facilities 1st Lien Term Loan, Tranche B, 5.552%, [LIBOR12+325], 10/3/235 | 109,517 | 109,654 | ||||||
| CBS Radio, Inc., Sr. Sec. Credit Facilities 1st Lien Term Loan, Tranche B1, 5.037%, [LIBOR4+275], 11/18/245 | 262,122 | 261,336 | ||||||
| Checkout Holdings, Inc., Sr. Sec. Credit Facilities 1st Lien Term Loan, Tranche B, 5.813%, [LIBOR12+350], 4/9/215 | 540,834 | 205,517 | ||||||
| Clear Channel Communications, Inc., Extended Sr. Sec. Credit Facilities 1st Lien Term Loan, Tranche D, 9.052%, [LIBOR4+675], 1/30/195,10 | 2,846,691 | 2,066,228 | ||||||
| Clear Channel Communications, Inc., Sr. Sec. Credit Facilities 1st Lien Term Loan, Tranche E, 9.802%, [LIBOR4+750], 7/30/195,10 | 57,055 | 41,349 | ||||||
| Cogeco Communications USA II LP, Sr. Sec. Credit Facilities 1st Lien Term Loan, Tranche B, 4.677%, [LIBOR12+237.5], 1/3/255 | 154,613 | 154,164 | ||||||
| CSC Holdings LLC, Sr. Sec. Credit Facilities 1st Lien Term Loan: | ||||||||
| Tranche B, 4.323%, [LIBOR12+225], 7/17/255 | 325,856 | 325,566 | ||||||
| Tranche B, 4.658%, 1/15/267,9 | 220,000 | 219,898 | ||||||
| Tranche B, 4.78%, [LIBOR4+250], 1/25/265 | 39,800 | 39,831 | ||||||
| Deluxe Entertainment Services Group, Inc., Sr. Sec. Credit Facilities 1st Lien Term Loan, Tranche B, 8.027%, [LIBOR4+550], 2/28/205 | 259,660 | 231,856 | ||||||
| Endemol, Sr. Sec. Credit Facilities 1st Lien Term Loan, 8.148%, [LIBOR4+575], 8/13/215 | 39 | 39 | ||||||
29 OPPENHEIMER FUNDAMENTAL ALTERNATIVES FUND
CONSOLIDATED STATEMENT OF INVESTMENTS Continued
| Principal Amount | Value | |||||||
| Media (Continued) | ||||||||
| Gray Television, Inc., Sr. Sec. Credit Facilities 1st Lien Term Loan, Tranche B, 4.515%, [LIBOR12+250], 2/7/245 | $ | 172,713 | $ | 172,991 | ||||
| Harland Clarke Holdings Corp., Sr. Sec. Credit Facilities 1st Lien Term Loan, Tranche B7, 7.084%, [LIBOR4+475], 11/3/235 | 275,476 | 258,948 | ||||||
| Intelsat Jackson Holdings SA, Sr. Sec. Credit Facilities 1st Lien Term Loan: | ||||||||
| Tranche B3, 6.045%, [LIBOR4+375], 11/27/235 | 345,000 | 345,809 | ||||||
| Tranche B4, 6.795%, [LIBOR4+450], 1/2/245 | 60,000 | 62,550 | ||||||
| ION Media Networks, Inc., Sr. Sec. Credit Facilities 1st Lien Term Loan, Tranche B, 5.05%, [LIBOR6+275], 12/18/205,9 | 466,165 | 467,477 | ||||||
| Liberty Cablevision of Puerto Rico LLC, Sr. Sec. Credit Facilities 1st Lien Term Loan, 5.936%, [LIBOR4+350], 1/7/225 | 345,000 | 339,702 | ||||||
| Lions Gate Capital Holdings LLC, Sr. Sec. Credit Facilities 1st Lien Term Loan, Tranche B, 4.552%, [LIBOR4+225], 3/24/255 | 248,750 | 248,285 | ||||||
| MacDonald Dettwiler & Associates Ltd., Sr. Sec. Credit Facilities 1st Lien Term Loan, Tranche B, 5.148%, [LIBOR4+250], 10/4/245,9 | 142,600 | 138,750 | ||||||
| MediArena Acquisition BV, Sr. Sec. Credit Facilities 1st Lien Term Loan, 8.087%, [LIBOR4+575], 8/13/215 | 336,240 | 336,346 | ||||||
| Meredith Corp., Sr. Sec. Credit Facilities 1st Lien Term Loan, Tranche B, 5.052%, [LIBOR6+300], 1/31/255 | 150,686 | 150,663 | ||||||
| Metro-Goldwyn-Mayer, Inc., Sr. Sec. Credit Facilities 2st Lien Term Loan, Tranche B, 6.81%, [LIBOR4+450], 7/3/265 | 120,000 | 120,413 | ||||||
| Mission Broadcasting, Inc., Sr. Sec. Credit Facilities 1st Lien Term Loan, Tranche B3, 4.67%, 1/17/247,9 | 95,151 | 95,210 | ||||||
| Monarchy Enterprises Holdings BV, Sr. Sec. Credit Facilities 1st Lien Term Loan, 8.797%, [LIBOR4+650], 10/13/224,5 | 700,000 | 696,500 | ||||||
| NEP Group, Inc., Sr. Sec. Credit Facilities 1st Lien Term Loan, Tranche B, 5.474%, [LIBOR4+325], 10/20/255,9 | 425,000 | 427,337 | ||||||
| Nexstar Broadcasting, Inc., Sr. Sec. Credit Facilities 1st Lien Term Loan, Tranche B, 4.67%, 7/19/247,9 | 594,813 | 595,184 | ||||||
| Radiate Holdco LLC, Sr. Sec. Credit Facilities 1st Lien Term Loan, 5.302%, [LIBOR12+300], 2/1/245 | 576,806 | 573,201 | ||||||
| Red Ventures LLC, Sr. Sec. Credit Facilities 1st Lien Term Loan, 5.408%, 11/8/247,9 | 30,000 | 30,187 | ||||||
| Red Ventures LLC, Sr. Sec. Credit Facilities 1st Lien Term Loan, 6.242%, [LIBOR4+400], 11/8/245 | 274,120 | 275,833 | ||||||
| Rovi Solutions Corp., Sr. Sec. Credit Facilities 1st Lien Term Loan, Tranche B, 4.81%, [LIBOR12+250], 7/2/215,9 | 128,553 | 128,489 | ||||||
| Sable International Finance Ltd., Sr. Sec. Credit Facilities 1st Lien Term Loan, Tranche B4, 5.552%, [LIBOR12+325], 1/30/265 | 205,000 | 205,218 | ||||||
| SFR Group SA, Sr. Sec. Credit Facilities 1st Lien Term Loan: | ||||||||
| Tranche B, 5.052%, [LIBOR4+275], 7/31/255 | 93,697 | 90,652 | ||||||
| Tranche B12, 5.967%, [LIBOR4+300], 1/31/265 | 408,811 | 400,040 | ||||||
| Sinclair Television Group, Inc., Sr. Sec. Credit Facilities 1st Lien Term Loan, Tranche B2, 4.56%, [LIBOR12+225], 1/3/245 | 439,134 | 440,643 | ||||||
| SpeedCast International Ltd., Sr. Sec. Credit Facilities 1st Lien Term Loan: | ||||||||
| Tranche B, 4.886%, [LIBOR4+250], 5/3/255 | 144,638 | 143,372 | ||||||
| Tranche B, 5.065%, [LIBOR4+275], 5/15/255,9 | 50,000 | 49,562 | ||||||
| Technicolor SA, Sr. Sec. Credit Facilities 1st Lien Term Loan, Tranche B, 5.063%, [LIBOR4+275], 12/6/235 | 157,898 | 150,398 | ||||||
30 OPPENHEIMER FUNDAMENTAL ALTERNATIVES FUND
| Principal Amount | Value | |||||||
| Media (Continued) | ||||||||
| Telenet Financing USD LLC, Sr. Sec. Credit Facilities 1st Lien Term Loan, Tranche B, 4.53%, [LIBOR12+225], 8/15/265 | $ | 325,000 | $ | 324,353 | ||||
| Tribune Media Co., Sr. Sec. Credit Facilities 1st Lien Term Loan, Tranche B, 5.302%, [LIBOR12+300], 1/26/245 | 354,132 | 355,516 | ||||||
| Unitymedia Finance LLC, Sr. Sec. Credit Facilities 1st Lien Term Loan, Tranche D, 4.53%, [LIBOR4+225], 1/15/265 | 95,000 | 94,974 | ||||||
| Univision Communications, Inc., Sr. Sec. Credit Facilities 1st Lien Term Loan, Tranche C5, 5.052%, [LIBOR12+275], 3/15/245 | 959,356 | 922,929 | ||||||
| UPC Financing Partnership, Sr. Sec. Credit Facilities 1st Lien Term Loan, Tranche AR, 4.78%, [LIBOR4+250], 1/15/265 | 377,339 | 376,419 | ||||||
| Virgin Media Bristol LLC, Sr. Sec. Credit Facilities 1st Lien Term Loan, Tranche K, 4.78%, [LIBOR12+250], 1/15/265 | 490,000 | 490,152 | ||||||
| WideOpenWest Finance LLC, Sr. Sec. Credit Facilities 1st Lien Term Loan, Tranche B, 5.54%, [LIBOR12+325], 8/18/235 | 475,275 | 460,225 | ||||||
| William Morris Endeavor Entertainment LLC, Sr. Sec. Credit Facilities 1st Lien Term Loan, Tranche B1, 5.15%, [LIBOR6+275], 5/18/255 | 133,922 | 133,922 | ||||||
| WMG Acquisition Corp., Sr. Sec. Credit Facilities 1st Lien Term Loan, 4.427%, [LIBOR12+212.5], 11/1/235,9 | 143,623 | 143,282 | ||||||
| Ziggo Secured Finance Partnership, Sr. Sec. Credit Facilities 1st Lien Term Loan, Tranche E, 4.78%, [LIBOR12+250], 4/15/255 | 545,000 | 535,152 | ||||||
| 15,317,269 | ||||||||
| Multiline Retail—0.5% | ||||||||
| Neiman Marcus Group Ltd. LLC, Sr. Sec. Credit Facilities 1st Lien Term Loan, 5.531%, [LIBOR12+325], 10/25/205 | 6,766,950 | 6,179,511 | ||||||
| Consumer Staples—0.3% | ||||||||
| Beverages—0.3% | ||||||||
| 1011778 BC ULC, Sr. Sec. Credit Facilities 1st Lien Term Loan, 4.552%, [LIBOR12+225], 2/16/245 | 529,497 | 528,107 | ||||||
| Dole Food Co., Inc., Sr. Sec. Credit Facilities 1st Lien Term Loan, 4.78%-7.00%, [LIBOR12+275], 4/6/245 | 295,839 | 295,399 | ||||||
| Golden Nugget, Inc., Sr. Sec. Credit Facilities 1st Lien Term Loan, 5.052%-5.186%, [LIBOR12+275], 10/4/235 | 627,811 | 629,334 | ||||||
| Hearthside Group Holdings LLC, Sr. Sec. Credit Facilities 1st Lien Term Loan, 5.302%, [LIBOR12+300], 5/17/255,9 | 304,238 | 299,484 | ||||||
| Hostess Brands LLC, Sr. Sec. Credit Facilities 1st Lien Term Loan, 4.552%, [LIBOR12+225], 8/3/225 | 178,886 | 178,299 | ||||||
| IRB Holding Corp., Sr. Sec. Credit Facilities 1st Lien Term Loan, 5.128%, [LIBOR12+325], 2/5/255,9 | 105,000 | 104,913 | ||||||
| IRB Holding Corp., Sr. Sec. Credit Facilities 1st Lien Term Loan, 5.255%-5.28%, [LIBOR12+325], 2/5/255 | 114,425 | 114,329 | ||||||
| JBS USA LUX SA, Sr. Sec. Credit Facilities 1st Lien Term Loan, 4.886%, [LIBOR4+250], 10/30/225 | 114,419 | 114,591 | ||||||
| KFC Holding Co., Sr. Sec. Credit Facilities 1st Lien Term Loan, Tranche B, 4.037%, [LIBOR12+175], 4/3/255 | 82,696 | 82,791 | ||||||
| Mastronardi Produce Ltd., Sr. Sec. Credit Facilities 1st Lien Term Loan, 5.506%, [LIBOR12+325], 5/1/255 | 44,888 | 45,224 | ||||||
| Nomad Foods Europe Midco Ltd., Sr. Sec. Credit Facilities 1st Lien Term Loan, 4.53%, [LIBOR12+225], 5/15/245 | 283,070 | 282,398 | ||||||
31 OPPENHEIMER FUNDAMENTAL ALTERNATIVES FUND
CONSOLIDATED STATEMENT OF INVESTMENTS Continued
| Principal Amount | Value | |||||||
| Beverages (Continued) | ||||||||
| NPC International, Inc., Sr. Sec. Credit Facilities 1st Lien Term Loan, 5.802%, [LIBOR12+350], 4/19/245 | $ | 69,262 | $ | 69,617 | ||||
| Sigma US Corp., Sr. Sec. Credit Facilities 1st Lien Term Loan, Tranche B, 5.398%, [LIBOR4+325], 7/2/255 | 300,000 | 299,625 | ||||||
| Sunshine Investments BV, Sr. Sec. Credit Facilities 1st Lien Term Loan, Tranche B3, 5.564%, [LIBOR4+325], 3/28/255 | 100,000 | 100,000 | ||||||
| Tacala Investment Corp., Sr. Sec. Credit Facilities 1st Lien Term Loan, 5.552%, [LIBOR4+325], 1/31/255 | 74,625 | 74,830 | ||||||
| 3,218,941 | ||||||||
| Energy—0.4% | ||||||||
| Energy Equipment & Services—0.4% | ||||||||
| AL Midcoast Holdings LLC, Sr. Sec. Credit Facilities 1st Lien Term Loan, Tranche B, 7.891%, [LIBOR4+550], 8/1/255,9 | 215,000 | 215,314 | ||||||
| Apergy Corp., Sr. Sec. Credit Facilities 1st Lien Term Loan, Tranche B, 4.813%, [LIBOR12+250], 5/9/255,9 | 40,255 | 40,419 | ||||||
| Ascent Resources - Marcellus LLC, Sr. Sec. Credit Facilities 1st Lien Term Loan, 8.781%, [LIBOR12+650], 3/30/235 | 42,264 | 42,475 | ||||||
| BCP Renaissance Parent LLC, Sr. Sec. Credit Facilities 1st Lien Term Loan, Tranche B, 5.842%, [LIBOR4+350], 10/31/245 | 269,325 | 270,672 | ||||||
| Bison Midstream Holdings LLC, Sr. Sec. Credit Facilities 1st Lien Term Loan, Tranche B, 6.282%, [LIBOR12+400], 5/21/255 | 134,575 | 133,953 | ||||||
| California Resources Corp., Sr. Sec. Credit Facilities 1st Lien Term Loan, 12.67%, [LIBOR12+1,037.5], 12/31/215 | 115,000 | 128,321 | ||||||
| California Resources Corp., Sr. Sec. Credit Facilities 1st Lien Term Loan, 7.037%, [LIBOR12+475], 12/31/225 | 145,000 | 147,537 | ||||||
| Delek US Holdings, Inc., Sr. Sec. Credit Facilities 1st Lien Term Loan, Tranche B, 4.552%, [LIBOR4+250], 3/31/255 | 139,300 | 139,446 | ||||||
| Drillship Kithira Owners, Inc., Sr. Sec. Credit Facilities 1st Lien Exit Term Loan, 8.00%, 9/20/247 | 298,396 | 314,062 | ||||||
| Eastern Power LLC, Sr. Sec. Credit Facilities 1st Lien Term Loan, 5.826%, [LIBOR12+375], 10/2/235,9 | 266,978 | 266,873 | ||||||
| Eastern Power LLC, Sr. Sec. Credit Facilities 1st Lien Term Loan, 6.052%, [LIBOR12+375], 10/2/235 | 56,341 | 56,319 | ||||||
| Fieldwood Energy LLC, Sr. Sec. Credit Facilities 1st Lien Term Loan, 7.552%, [LIBOR12+525], 4/11/225 | 360,013 | 362,940 | ||||||
| GIP III Stetson I LP, Sr. Sec. Credit Facilities 1st Lien Term Loan, Tranche B, 6.598%, [LIBOR4+425], 7/18/255,9 | 140,000 | 140,525 | ||||||
| Gulf Finance LLC, Sr. Sec. Credit Facilities 1st Lien Term Loan, Tranche B, 7.64%, [LIBOR4+525], 8/25/235 | 20,613 | 17,031 | ||||||
| HFOTCO LLC, Sr. Sec. Credit Facilities 1st Lien Term Loan, Tranche B, 5.06%, [LIBOR4+275], 6/26/255 | 89,775 | 90,205 | ||||||
| HGIM Corp., Sr. Sec. Credit Facilities 1st Lien Term Loan, Tranche B, 8.508%, [PRIME4+500], 7/2/235 | 56,849 | 57,417 | ||||||
| Limetree Bay Terminals LLC, Sr. Sec. Credit Facilities 1st Lien Term Loan, 6.242%, [LIBOR12+400], 2/15/245 | 231,774 | 226,559 | ||||||
| Lucid Energy Group II Borrower LLC, Sr. Sec. Credit Facilities 1st Lien Term Loan, 5.28%, [LIBOR12+300], 2/17/255 | 64,600 | 63,631 | ||||||
| McDermott Technology Americas, Inc., Sr. Sec. Credit Facilities 1st Lien Term Loan, Tranche B, 7.302%, [LIBOR12+500], 5/12/255 | 214,062 | 211,868 | ||||||
32 OPPENHEIMER FUNDAMENTAL ALTERNATIVES FUND
| Principal Amount | Value | |||||||
| Energy Equipment & Services (Continued) | ||||||||
| MEG Energy Corp., Sr. Sec. Credit Facilities 1st Lien Term Loan, 5.75%, [LIBOR4+350], 12/31/235 | $ | 33,858 | $ | 33,999 | ||||
| Northriver Midstream Finance LP, Sr. Sec. Credit Facilities 1st Lien Term Loan, Tranche B, 5.646%, [LIBOR4+325], 9/21/255 | 160,000 | 160,984 | ||||||
| Seadrill Operating LP, Sr. Sec. Credit Facilities 1st Lien Term Loan, Tranche B, 8.386%, [LIBOR4+600], 2/21/215 | 428,601 | 398,837 | ||||||
| Sheridan Production Partners II-A LP, Sr. Sec. Credit Facilities 1st Lien Term Loan, Tranche B, 5.81%, [LIBOR4+350], 12/16/205 | 40,194 | 36,476 | ||||||
| Sheridan Production Partners II-M LP, Sr. Sec. Credit Facilities 1st Lien Term Loan, Tranche B, 5.82%, [LIBOR4+350], 12/16/205 | 24,219 | 21,978 | ||||||
| Traverse Midstream Partners LLC, Sr. Sec. Credit Facilities 1st Lien Term Loan, 6.34%, [LIBOR4+400], 9/27/245 | 160,788 | 162,070 | ||||||
| Ultra Resources, Inc., Sr. Sec. Credit Facilities 1st Lien Exit Term Loan, 4.00%, [LIBOR4+300], 4/12/245,9 | 55,000 | 51,720 | ||||||
| Ultra Resources, Inc., Sr. Sec. Credit Facilities 1st Lien Exit Term Loan, 5.469%, [LIBOR4+300], 4/12/245 | 250,000 | 235,088 | ||||||
| 4,026,719 | ||||||||
| Oil, Gas & Consumable Fuels—0.0% | ||||||||
| Sheridan Investment Partners II LP, Sr. Sec. Credit Facilities 1st Lien Term Loan, Tranche B, 5.82%, [LIBOR4+350], 12/16/205 | 245,464 | 222,759 | ||||||
| Southcross Energy Partners LP, Sr. Sec. Credit Facilities 1st Lien Term Loan, Tranche B, 6.636%, [LIBOR4+425], 8/4/215,9 | 242,148 | 217,227 | ||||||
| 439,986 | ||||||||
| Financials—0.5% | ||||||||
| Commercial Banks—0.4% | ||||||||
| Acrisure LLC, Sr. Sec. Credit Facilities 1st Lien Term Loan, 5.992%- 6.592%, [LIBOR4+375], 11/22/235 | 398,583 | 399,731 | ||||||
| Advisor Group, Inc., Sr. Sec. Credit Facilities 1st Lien Term Loan, 6.04%, [LIBOR12+375], 8/15/255 | 40,000 | 40,358 | ||||||
| Alliant Holdings Intermediate LLC, Sr. Sec. Credit Facilities 1st Lien Term Loan, Tranche B, 5.046%, [LIBOR12+300], 5/9/255,9 | 339,602 | 339,814 | ||||||
| AmWINS Group, Inc., Sr. Sec. Credit Facilities 1st Lien Term Loan, 5.031%-5.052%, [LIBOR12+275], 1/25/245 | 198,340 | 198,935 | ||||||
| Aretec Group, Inc., Sr. Sec. Credit Facilities 1st Lien Term Loan, 6.506%, [LIBOR4+425], 10/1/255 | 460,000 | 463,595 | ||||||
| Blucora, Inc., Sr. Sec. Credit Facilities 1st Lien Term Loan, 5.302%, [LIBOR4+300], 5/22/245 | 89,090 | 89,425 | ||||||
| Capital Automotive LP, Sr. Sec. Credit Facilities 1st Lien Term Loan, Tranche B, 4.81%, [LIBOR12+250], 3/25/245 | 82,120 | 82,243 | ||||||
| DTZ US Borrower LLC, Sr. Sec. Credit Facilities 1st Lien Term Loan, Tranche B, 5.552%, [LIBOR12+325], 8/21/255 | 330,000 | 330,413 | ||||||
| Focus Financial Partners LLC, Sr. Sec. Credit Facilities 1st Lien Term Loan, 4.802%, [LIBOR4+275], 7/3/245 | 67,910 | 68,058 | ||||||
| Forest City Enterprises LP, Sr. Sec. Credit Facilities 1st Lien Term Loan, Tranche B, 6.199%, 10/26/257,9 | 115,000 | 115,623 | ||||||
| GGP Nimbus LP, Sr. Sec. Credit Facilities 1st Lien Term Loan, 4.795%, [LIBOR12+250], 8/27/255 | 355,000 | 349,929 | ||||||
33 OPPENHEIMER FUNDAMENTAL ALTERNATIVES FUND
CONSOLIDATED STATEMENT OF INVESTMENTS Continued
| Principal Amount | Value | |||||||
| Commercial Banks (Continued) | ||||||||
| HUB International Ltd., Sr. Sec. Credit Facilities 1st Lien Term Loan, Tranche B, 5.49%, [LIBOR4+300], 4/25/255,9 | $ | 478,988 | $ | 478,238 | ||||
| Hudson River Trading LLC, Sr. Sec. Credit Facilities 1st Lien Term Loan, Tranche B, 5.67%, [LIBOR12+350], 4/3/255 | 25,000 | 25,156 | ||||||
| Hyperion Insurance Group Ltd., Sr. Sec. Credit Facilities 1st Lien Term Loan, Tranche B, 5.813%, [LIBOR12+350], 12/20/245 | 178,974 | 179,981 | ||||||
| iStar, Inc., Sr. Sec. Credit Facilities 1st Lien Term Loan: | ||||||||
| Tranche B, 5.032%, [LIBOR4+300], 10/1/215 | 75,156 | 75,297 | ||||||
| Tranche B, 5.024%, [LIBOR4+300], 6/28/235 | 74,780 | 74,921 | ||||||
| Jane Street Group LLC, Sr. Sec. Credit Facilities 1st Lien Term Loan, Tranche B, 5.992%, [LIBOR12+300], 8/25/225 | 53,997 | 54,244 | ||||||
| Mayfield Agency Borrower, Inc., Sr. Sec. Credit Facilities 1st Lien Term Loan, 6.302%, [LIBOR4+450], 2/28/255 | 109,725 | 109,999 | ||||||
| NFP Corp., Sr. Sec. Credit Facilities 1st Lien Term Loan, Tranche B, 5.302%, [LIBOR12+300], 1/8/245,9 | 339,267 | 338,673 | ||||||
| Uniti Group, Inc., Sr. Sec. Credit Facilities 1st Lien Term Loan, 5.302%, [LIBOR12+300], 10/24/225 | 725,392 | 687,853 | ||||||
| USI, Inc., Sr. Sec. Credit Facilities 1st Lien Term Loan, Tranche B, 5.386%, [LIBOR4+300], 5/16/245 | 441,183 | 439,308 | ||||||
| 4,941,794 | ||||||||
| Consumer Finance—0.0% | ||||||||
| PGX Holdings, Inc., Sr. Sec. Credit Facilities 1st Lien Term Loan, 7.56%, [LIBOR12+525], 9/29/205 | 151,534 | 148,408 | ||||||
| PGX Holdings, Inc., Sr. Sec. Credit Facilities 2nd Lien Term Loan, 11.08%, [LIBOR12+900], 9/29/214,5 | 62,543 | 61,918 | ||||||
| 210,326 | ||||||||
| Insurance—0.1% | ||||||||
| AssuredPartners, Inc., Sr. Sec. Credit Facilities 1st Lien Term Loan, Tranche B, 5.552%, [LIBOR12+325], 10/22/245 | 298,500 | 298,164 | ||||||
| Sedgwick Claims Management Services, Inc., Sr. Sec. Credit Facilities 1st Lien Term Loan, 5.052%, [LIBOR4+275], 3/1/215 | 353,156 | 353,516 | ||||||
| 651,680 | ||||||||
| Health Care—0.7% | ||||||||
| Health Care Equipment & Supplies—0.7% | ||||||||
| 21st Century Oncology, Inc., Sr. Sec. Credit Facilities 1st Lien Exit Term Loan, Tranche B, 8.565%, [LIBOR4+612.5], 1/16/235 | 64,252 | 60,096 | ||||||
| Acadia Healthcare Co., Inc., Sr. Sec. Credit Facilities 1st Lien Term Loan: | ||||||||
| Tranche B, 4.742%, [LIBOR12+250], 2/11/225 | 14,962 | 15,015 | ||||||
| Tranche B4, 4.742%, [LIBOR12+250], 2/16/235 | 124,547 | 124,992 | ||||||
| Air Medical Group Holdings, Inc., Sr. Sec. Credit Facilities 1st Lien Term Loan, Tranche B, 5.534%, [LIBOR12+325], 4/28/225 | 16,319 | 15,885 | ||||||
| Alliance HealthCare Services, Inc., Sr. Sec. Credit Facilities 1st Lien Term Loan, 6.742%, [LIBOR4+450], 10/24/235 | 132,779 | 133,692 | ||||||
| Amneal Pharmaceuticals LLC, Sr. Sec. Credit Facilities 1st Lien Term Loan, Tranche B, 5.75%, [LIBOR4+300], 5/4/255 | 309,172 | 311,529 | ||||||
| Ardent Health Partners LLC, Sr. Sec. Credit Facilities 1st Lien Term Loan, Tranche B, 6.802%, [LIBOR12+450], 6/30/255 | 239,400 | 240,859 | ||||||
34 OPPENHEIMER FUNDAMENTAL ALTERNATIVES FUND
| Principal Amount | Value | |||||||
| Health Care Equipment & Supplies (Continued) | ||||||||
| Bausch Health Cos., Inc., Sr. Sec. Credit Facilities 1st Lien Term Loan, Tranche B, 5.274%, [LIBOR4+300], 6/2/255 | $ | 147,657 | $ | 147,917 | ||||
| Carestream Dental Equipment, Inc., Sr. Sec. Credit Facilities 1st Lien Term Loan, 5.636%, [LIBOR4+325], 9/1/245 | 44,550 | 44,480 | ||||||
| Carestream Health, Inc., Sr. Sec. Credit Facilities 1st Lien Term Loan, Tranche B, 6.302%, [LIBOR4+400], 6/7/195 | 58,967 | 58,915 | ||||||
| Change Healthcare Holdings LLC, Sr. Sec. Credit Facilities 1st Lien Term Loan, 5.052%, [LIBOR12+275], 3/1/245 | 702,000 | 702,046 | ||||||
| CHS/Community Health Systems, Inc., Sr. Sec. Credit Facilities 1st Lien Term Loan, Tranche H, 5.557%, [LIBOR4+300], 1/27/215 | 324,137 | 317,986 | ||||||
| Concentra, Inc., Sr. Sec. Credit Facilities 1st Lien Term Loan, 5.03%, [LIBOR4+275], 6/1/225,9 | 105,000 | 105,372 | ||||||
| CVS Holdings I LP, Sr. Sec. Credit Facilities 1st Lien Term Loan, 5.31%, [LIBOR4+300], 2/6/255 | 203,975 | 203,551 | ||||||
| DJO Finance LLC, Sr. Sec. Credit Facilities 1st Lien Term Loan, 5.552%-5.646%, [LIBOR12+325], 6/8/205 | 380,209 | 380,051 | ||||||
| Endo International plc, Sr. Sec. Credit Facilities 1st Lien Term Loan, Tranche B, 6.563%, [LIBOR12+425], 4/29/245 | 287,143 | 288,847 | ||||||
| Enterprise Merger Sub, Inc., Sr. Sec. Credit Facilities 1st Lien Term Loan, 6.052%, [LIBOR4+375], 10/10/255 | 615,000 | 603,324 | ||||||
| Equian Buyer Corp., Sr. Sec. Credit Facilities 1st Lien Term Loan, Tranche B, 5.537%, [LIBOR12+325], 5/20/245 | 29,924 | 29,990 | ||||||
| Gentiva Health Services, Inc., Sr. Sec. Credit Facilities 1st Lien Term Loan, 6.063%, [LIBOR4+375], 7/2/255 | 452,342 | 454,887 | ||||||
| GoodRX, Inc., Sr. Sec. Credit Facilities 1st Lien Term Loan, 5.283%, [LIBOR4+300], 10/10/255,9 | 160,000 | 161,034 | ||||||
| Heartland Dental LLC, Sr. Sec. Credit Facilities 1st Lien Term Loan, 6.052%, [LIBOR12+375], 4/30/255 | 73,076 | 72,951 | ||||||
| Heartland Dental LLC, Sr. Sec. Credit Facilities 1st Lien Term Loan Delayed Draw, 3.75%, 4/30/257 | 8,067 | 8,053 | ||||||
| Jaguar Holding Co. II, Sr. Sec. Credit Facilities 1st Lien Term Loan, 4.802%, [LIBOR4+250], 8/18/225 | 224,677 | 224,284 | ||||||
| Kinetic Concepts, Inc., Sr. Sec. Credit Facilities 1st Lien Term Loan, Tranche B, 5.636%, [LIBOR4+325], 2/2/245 | 103,688 | 104,195 | ||||||
| LifeCare Holdings LLC, Sr. Sec. Credit Facilities 1st Lien Exit Term Loan, Tranche A, 10.386%, [LIBOR4+525], 11/30/185,11 | 131,176 | 74,115 | ||||||
| LifeScan Global Corp., Sr. Sec. Credit Facilities 1st Lien Term Loan, 8.396%, [LIBOR4+600], 10/1/245 | 225,000 | 220,219 | ||||||
| Mallinckrodt International Finance SA, Sr. Sec. Credit Facilities 1st Lien Term Loan: |
| |||||||
| Tranche B, 5.136%, [LIBOR4+275], 9/24/245 | 73,732 | 72,874 | ||||||
| Tranche B, 5.517%, [LIBOR4+300], 2/24/255 | 248,750 | 247,466 | ||||||
| MPH Acquisition Holdings LLC, Sr. Sec. Credit Facilities 1st Lien Term Loan, Tranche B, 5.136%, [LIBOR4+300], 6/7/235 | 387,792 | 387,280 | ||||||
| National Mentor Holdings, Inc., Sr. Sec. Credit Facilities 1st Lien Term Loan, Tranche B, 5.386%, [LIBOR4+300], 1/31/215 | 344,103 | 344,426 | ||||||
| New Trident Holdcorp, Inc., Sr. Sec. Credit Facilities 1st Lien Term Loan, Tranche B, 5.527%, [LIBOR4+575], 7/31/195,11 | 84,881 | 25,464 | ||||||
| One Call Corp., Sr. Sec. Credit Facilities 1st Lien Term Loan, Tranche B, 7.53%, [LIBOR12+525], 11/27/225 | 203,022 | 191,639 | ||||||
35 OPPENHEIMER FUNDAMENTAL ALTERNATIVES FUND
CONSOLIDATED STATEMENT OF INVESTMENTS Continued
| Principal Amount | Value | |||||||
| Health Care Equipment & Supplies (Continued) | ||||||||
| Ortho-Clinical Diagnostics SA, Sr. Sec. Credit Facilities 1st Lien Term Loan, 5.544%, [LIBOR4+325], 6/30/255 | $ | 332,871 | $ | 332,205 | ||||
| PAREXEL International Corp., Sr. Sec. Credit Facilities 1st Lien Term Loan, Tranche B, 5.052%, [LIBOR4+300], 9/27/245 | 74,549 | 73,628 | ||||||
| Select Medical Corp., Sr. Sec. Credit Facilities 1st Lien Term Loan, 5.03%-7.00%, [PRIME4+175], 3/1/215 | 83,725 | 83,969 | ||||||
| Select Medical Corp., Sr. Sec. Credit Facilities 1st Lien Term Loan, 5.21%, 3/1/217,9 | 80,000 | 80,234 | ||||||
| Sotera Health Holdings LLC, Sr. Sec. Credit Facilities 1st Lien Term Loan, Tranche B, 5.302%, [LIBOR12+300], 5/15/225 | 14,849 | 14,885 | ||||||
| Surgery Center Holdings, Inc., Sr. Sec. Credit Facilities 1st Lien Term Loan, 5.57%, [LIBOR4+325], 9/2/245 | 253,074 | 252,947 | ||||||
| Team Health Holdings, Inc., Sr. Sec. Credit Facilities 1st Lien Term Loan, Tranche B, 5.052%, [LIBOR12+275], 2/6/245 | 330,445 | 313,510 | ||||||
| US Anesthesia Partners, Inc., Sr. Sec. Credit Facilities 1st Lien Term Loan, 5.302%, [LIBOR12+300], 6/23/245 | 9,925 | 9,940 | ||||||
| Vizient, Inc., Sr. Sec. Credit Facilities 1st Lien Term Loan, Tranche B3, 5.052%, [LIBOR12+275], 2/13/235 | 15,527 | 15,614 | ||||||
| VVC Holdings Corp., Sr. Sec. Credit Facilities 1st Lien Term Loan, 6.686%, [LIBOR12+425], 7/9/255 | 220,000 | 218,900 | ||||||
| Wink Holdco, Inc., Sr. Sec. Credit Facilities 1st Lien Term Loan, 5.302%, [LIBOR4+300], 12/2/245 | 138,950 | 138,742 | ||||||
| 7,908,008 | ||||||||
| Industrials—3.2% | ||||||||
| Aerospace & Defense—0.0% | ||||||||
| Doncasters US Finance LLC, Sr. Sec. Credit Facilities 1st Lien Term Loan, 5.886%, [LIBOR4+350], 4/9/205 | 82,170 | 76,246 | ||||||
| Genuine Financial Holdings LLC, Sr. Sec. Credit Facilities 1st Lien Term Loan, 6.136%, [LIBOR4+375], 7/11/255 | 225,000 | 225,915 | ||||||
| 302,161 | ||||||||
| Commercial Services & Supplies—0.7% | ||||||||
| Access CIG LLC, Sr. Sec. Credit Facilities 1st Lien Term Loan, 6.052%, [LIBOR12+375], 2/27/255 | 88,646 | 89,056 | ||||||
| Access CIG LLC, Sr. Sec. Credit Facilities 1st Lien Term Loan, Delayed Draw, 3.75%, 2/27/257 | 10,908 | 10,959 | ||||||
| AI Aqua Merger Sub, Inc., Sr. Sec. Credit Facilities 1st Lien Term Loan, Tranche B1, 5.552%, [LIBOR12+325], 12/13/235 | 189,341 | 188,928 | ||||||
| AI Aqua ZIP Bidco Pty Ltd., Sr. Sec. Credit Facilities 1st Lien Term Loan, Tranche B, 5.552%, [LIBOR12+325], 12/13/235 | 77,414 | 77,244 | ||||||
| Allied Universal Holdco LLC, Sr. Sec. Credit Facilities 1st Lien Term Loan, 6.136%, [LIBOR4+375], 7/28/225,9 | 549,655 | 546,049 | ||||||
| Asurion LLC, Sr. Sec. Credit Facilities 1st Lien Term Loan: | ||||||||
| Tranche B4, 5.242%, [LIBOR12+300], 8/4/225 | 685,071 | 687,089 | ||||||
| Tranche B6, 5.302%, [LIBOR12+300], 11/3/235 | 202,984 | 203,449 | ||||||
| Tranche B7, 5.302%, [LIBOR12+300], 11/3/245 | 69,825 | 70,006 | ||||||
| Asurion LLC, Sr. Sec. Credit Facilities 2st Lien Term Loan, 8.802%, [LIBOR12+650], 8/4/255 | 170,000 | 174,781 | ||||||
36 OPPENHEIMER FUNDAMENTAL ALTERNATIVES FUND
| Principal Amount | Value | |||||||
| Commercial Services & Supplies (Continued) | ||||||||
| ATS Consolidated, Inc., Sr. Sec. Credit Facilities 1st Lien Term Loan, Tranche B, 6.045%, [LIBOR12+375], 2/28/255,9 | $ | 248,875 | $ | 250,742 | ||||
| Belron Finance US LLC, Sr. Sec. Credit Facilities 1st Lien Term Loan, Tranche B, 4.843%, [LIBOR4+250], 11/7/245 | 163,763 | 164,411 | ||||||
| Blackhawk Network Holdings, Inc., Sr. Sec. Credit Facilities 1st Lien Term Loan, 5.386%, [LIBOR4+300], 6/15/255 | 254,363 | 255,198 | ||||||
| Boing US Holdco, Inc., Sr. Sec. Credit Facilities 1st Lien Term Loan, 5.593%, [LIBOR4+325], 10/3/245 | 271,863 | 272,968 | ||||||
| Casmar Australia Pty Ltd., Sr. Sec. Credit Facilities 1st Lien Term Loan, 6.742%, [LIBOR4+450], 12/8/235 | 182,813 | 171,615 | ||||||
| Ceridian HCM Holding, Inc., Sr. Sec. Credit Facilities 1st Lien Term Loan, Tranche B, 5.552%, [LIBOR12+325], 4/30/255 | 220,000 | 221,100 | ||||||
| Ceva Logistics Finance BV, Sr. Sec. Credit Facilities 1st Lien Term Loan, 6.098%, [LIBOR4+375], 8/4/255 | 165,000 | 165,516 | ||||||
| Crossmark Holdings, Inc., Sr. Sec. Credit Facilities 1st Lien Term Loan, 5.886%, [LIBOR4+350], 12/20/195 | 324,273 | 143,694 | ||||||
| Engility Corp., Sr. Sec. Credit Facilities 1st Lien Term Loan, Tranche B2, 5.052%, [LIBOR12+275], 8/14/235 | 167,340 | 167,851 | ||||||
| First Advantage, Sr. Sec. Credit Facilities 1st Lien Term Loan, Tranche B, 7.777%, [LIBOR4+525], 6/30/225 | 97,904 | 97,986 | ||||||
| First American Payment Systems LP, Sr. Sec. Credit Facilities 1st Lien Term Loan, 7.029%, [LIBOR12+475], 1/5/245 | 98,708 | 99,202 | ||||||
| Frontdoor, Inc., Sr. Sec. Credit Facilities 1st Lien Term Loan, Tranche B, 4.813%, [LIBOR12+250], 8/16/255 | 27,000 | 27,067 | ||||||
| Garda World Security Corp., Sr. Sec. Credit Facilities 1st Lien Term Loan, Tranche B, 5.821%, [LIBOR4+350], 5/24/245 | 370,072 | 372,000 | ||||||
| IG Investments Holdings LLC, Sr. Sec. Credit Facilities 1st Lien Term Loan, 5.802%-5.886%, [LIBOR12+350], 5/23/255 | 386,843 | 389,100 | ||||||
| Inmar, Inc., Sr. Sec. Credit Facilities 1st Lien Term Loan, 5.802%, [LIBOR6+350], 5/1/245 | 311,063 | 312,618 | ||||||
| KUEHG Corp., Sr. Sec. Credit Facilities 1st Lien Term Loan, 6.136%, [LIBOR4+375], 2/21/255,9 | 286,820 | 288,554 | ||||||
| Laureate Education, Inc., Sr. Sec. Credit Facilities 1st Lien Term Loan, Tranche B, 6.027%, [LIBOR12+350], 4/26/245 | 224,329 | 225,058 | ||||||
| Learning Care Group US No. 2, Inc., Sr. Sec. Credit Facilities 1st Lien Term Loan, 5.53%-5.552%, [LIBOR4+325], 3/13/255 | 34,825 | 34,861 | ||||||
| Legalzoom.com, Inc., Sr. Sec. Credit Facilities 1st Lien Term Loan, Tranche B, 6.537%, [LIBOR4+450], 11/21/245 | 158,783 | 160,172 | ||||||
| Livingston International, Inc., Sr. Sec. Credit Facilities 1st Lien Term Loan, 8.136%, [LIBOR4+575], 3/20/205 | 100,319 | 100,319 | ||||||
| Livingston International, Inc., Sr. Sec. Credit Facilities 2nd Lien Term Loan, 10.636%, [LIBOR4+825], 4/17/205 | 45,073 | 42,820 | ||||||
| LS Deco LLC, Sr. Sec. Credit Facilities 1st Lien Term Loan, 5.886%, [LIBOR4+350], 5/21/225 | 181,177 | 181,404 | ||||||
| Monitronics International, Inc., Sr. Sec. Credit Facilities 1st Lien Term Loan, Tranche B2, 7.886%, [LIBOR4+550], 9/30/225 | 218,343 | 214,454 | ||||||
| Sarbacane Bidco, Inc., Sr. Sec. Credit Facilities 1st Lien Term Loan, 5.25%, [LIBOR4+300], 1/29/255 | 34,825 | 34,963 | ||||||
| Savage Enterprises LLC, Sr. Sec. Credit Facilities 1st Lien Term Loan, Tranche B, 6.77%, [LIBOR12+450], 8/1/255 | 340,852 | 344,261 | ||||||
37 OPPENHEIMER FUNDAMENTAL ALTERNATIVES FUND
CONSOLIDATED STATEMENT OF INVESTMENTS Continued
| Principal Amount | Value | |||||||
| Commercial Services & Supplies (Continued) | ||||||||
| Securus Technologies Holdings LLC, Sr. Sec. Credit Facilities 1st Lien Term Loan, 5.832%, [LIBOR4+450], 11/1/245,9 | $ | 145,000 | $ | 145,363 | ||||
| Securus Technologies Holdings LLC, Sr. Sec. Credit Facilities 1st Lien Term Loan, 6.802%, [LIBOR12+450], 11/1/245 | 119,623 | 120,122 | ||||||
| SMG US Midco 2, Inc., Sr. Sec. Credit Facilities 1st Lien Term Loan, 5.302%, [LIBOR6+325], 1/23/255 | 29,850 | 29,869 | ||||||
| Staples, Inc., Sr. Sec. Credit Facilities 1st Lien Term Loan, 6.343%, [LIBOR4+400], 9/12/245,9 | 511,088 | 510,873 | ||||||
| Travelport Finance Luxembourg Sarl, Sr. Sec. Credit Facilities 1st Lien Term Loan, Tranche B, 4.814%, [LIBOR4+275], 3/17/255 | 552,027 | 552,085 | ||||||
| Trident LS Merger Sub Corp., Sr. Sec. Credit Facilities 1st Lien Term Loan, 5.552%, [LIBOR4+325], 5/1/255 | 105,513 | 106,198 | ||||||
| USIC Holdings, Inc., Sr. Sec. Credit Facilities 1st Lien Term Loan, 5.552%, [LIBOR12+325], 12/8/235 | 43,784 | 43,935 | ||||||
| 8,293,940 | ||||||||
| Industrial Conglomerates—1.2% | ||||||||
| Apex Tool Group LLC, Sr. Sec. Credit Facilities 1st Lien Term Loan, Tranche B, 6.052%, [LIBOR12+375], 2/1/225,9 | 216,556 | 214,029 | ||||||
| Energy Acquisition Co., Inc., Sr. Sec. Credit Facilities 1st Lien Term Loan, 6.636%, [LIBOR4+425], 6/22/255 | 129,675 | 129,351 | ||||||
| Gardner Denver, Inc., Sr. Sec. Credit Facilities 1st Lien Term Loan, Tranche B, 5.052%, [LIBOR12+275], 7/30/245 | 123,015 | 123,438 | ||||||
| Gates Global LLC, Sr. Sec. Credit Facilities 1st Lien Term Loan, Tranche B, 5.052%, [LIBOR4+300], 4/1/245 | 278,712 | 279,472 | ||||||
| GrafTech Finance, Inc., Sr. Sec. Credit Facilities 1st Lien Term Loan, Tranche B, 5.802%, [LIBOR12+350], 2/12/255 | 162,938 | 163,345 | ||||||
| Harsco Corp., Sr. Sec. Credit Facilities 1st Lien Term Loan, 4.563%, [LIBOR12+225], 12/6/245 | 103,742 | 104,212 | ||||||
| MACOM Technology Solutions Holdings, Inc., Sr. Sec. Credit Facilities 1st Lien Term Loan, Tranche B, 4.552%, [LIBOR12+225], 5/17/245 | 162,999 | 158,191 | ||||||
| Robertshaw US Holdings Corp., Sr. Sec. Credit Facilities 1st Lien Term Loan, 5.813%, [LIBOR12+350], 2/28/255 | 94,525 | 93,698 | ||||||
| Titan Acquisition Ltd., Sr. Sec. Credit Facilities 1st Lien Term Loan, 5.302%, [LIBOR12+300], 3/28/255 | 223,875 | 211,641 | ||||||
| TransDigm, Inc., Sr. Sec. Credit Facilities 1st Lien Term Loan: | ||||||||
| Tranche E, 4.802%, [LIBOR12+250], 5/30/255 | 193,888 | 193,239 | ||||||
| Tranche F, 4.802%, [LIBOR12+250], 6/9/235 | 11,415,294 | 11,379,108 | ||||||
| Tranche G, 4.802%, [LIBOR4+250], 8/22/245 | 77,415 | 77,181 | ||||||
| Vectra Co., Sr. Sec. Credit Facilities 1st Lien Term Loan, 5.552%, [LIBOR12+325], 3/8/255,9 | 159,638 | 159,504 | ||||||
| Vertiv Intermediate Holding II Corp., Sr. Sec. Credit Facilities 1st Lien Term Loan, Tranche B, 6.313%, [LIBOR12+400], 11/30/235 | 352,058 | 348,978 | ||||||
| Welbilt, Inc., Sr. Sec. Credit Facilities 1st Lien Term Loan, Tranche B, 4.782%, [LIBOR4+250], 10/23/255 | 30,000 | 30,000 | ||||||
| Wencor Group, Sr. Sec. Credit Facilities 1st Lien Term Loan, 5.886%, [LIBOR4+350], 6/19/215 | 59,381 | 57,896 | ||||||
| WP CPP Holdings LLC, Sr. Sec. Credit Facilities 1st Lien Term Loan, 6.28%, [LIBOR4+375], 4/30/255 | 160,000 | 160,834 | ||||||
38 OPPENHEIMER FUNDAMENTAL ALTERNATIVES FUND
| Principal Amount | Value | |||||||
| Industrial Conglomerates (Continued) | ||||||||
| Zodiac Pool Solutions LLC, Sr. Sec. Credit Facilities 1st Lien Term Loan, Tranche B, 4.552%, [LIBOR4+225], 7/2/255 | $ | 29,925 | $ | 29,986 | ||||
| 13,914,103 | ||||||||
| Professional Services—0.0% | ||||||||
| AVSC Holding Corp., Sr. Sec. Credit Facilities 1st Lien Term Loan, 5.233%-5.636%, [LIBOR6+325], 3/3/255 | 257,755 | 256,466 | ||||||
| 256,466 | ||||||||
| Road & Rail—1.1% | ||||||||
| American Airlines, Inc., Sr. Sec. Credit Facilities 1st Lien Term Loan, Tranche B, 4.045%, [LIBOR12+175], 6/27/255 | 115,000 | 112,790 | ||||||
| Arctic LNG Carriers Ltd., Sr. Sec. Credit Facilities 1st Lien Term Loan, Tranche B, 6.802%, [LIBOR12+450], 5/18/235 | 172,862 | 173,457 | ||||||
| CH Hold Corp., Sr. Sec. Credit Facilities 1st Lien Term Loan, Tranche B, 5.302%, [LIBOR12+300], 2/1/245 | 138,564 | 138,910 | ||||||
| Daseke Cos., Inc., Sr. Sec. Credit Facilities 1st Lien Term Loan, 7.242%, [LIBOR12+500], 2/27/245 | 83,114 | 83,582 | ||||||
| Delos Finance Sarl, Sr. Sec. Credit Facilities 1st Lien Term Loan, Tranche B, 4.136%, [LIBOR4+175], 10/6/235 | 11,120,000 | 10,974,076 | ||||||
| Kenan Advantage Group, Inc. (The), Sr. Sec. Credit Facilities 1st Lien Term Loan: | ||||||||
| Tranche B1, 5.302%, [LIBOR12+300], 7/29/225 | 96,274 | 96,304 | ||||||
| Tranche B2, 5.302%, [LIBOR12+300], 7/29/225 | 10,667 | 10,670 | ||||||
| Western Express, Inc., Sr. Sec. Credit Facilities 2nd Lien Term Loan, 10.563%, [LIBOR4+825], 2/23/224,5 | 982,800 | 1,027,026 | ||||||
| 12,616,815 | ||||||||
| Transportation Infrastructure—0.2% | ||||||||
| American Axle & Manufacturing, Inc., Sr. Sec. Credit Facilities 1st Lien Term Loan, 4.54%-4.74%, [LIBOR12+225], 4/6/245 | 209,254 | 208,633 | ||||||
| Dayco Products LLC, Sr. Sec. Credit Facilities 1st Lien Term Loan, Tranche B, 6.563%, [LIBOR4+500], 5/19/235 | 117,537 | 117,831 | ||||||
| Mavis Tire Express Services Corp., Sr. Sec. Credit Facilities 1st Lien Term Loan, 5.53%, [LIBOR4+325], 3/20/255 | 149,608 | 148,486 | ||||||
| Mavis Tire Express Services Corp., Sr. Sec. Credit Facilities 1st Lien Term Loan, 5.53%, [LIBOR12+325], 3/20/255 | 1,331 | 1,321 | ||||||
| Mavis Tire Express Services Corp., Sr. Sec. Credit Facilities 1st Lien Term Loan, Delayed Draw, 1.00%, 3/20/257 | 22,935 | 22,763 | ||||||
| Navistar, Inc., Sr. Sec. Credit Facilities 1st Lien Term Loan, 5.64%- 5.78%, [LIBOR12+350], 11/6/245 | 238,362 | 239,156 | ||||||
| Superior Industries International, Inc., Sr. Sec. Credit Facilities 1st Lien Term Loan, Tranche B, 6.302%, [LIBOR12+400], 5/22/245 | 182,621 | 182,164 | ||||||
| Tenneco, Inc., Sr. Sec. Credit Facilities 1st Lien Term Loan, Tranche B, 5.052%, [LIBOR4+275], 10/1/255 | 280,000 | 279,650 | ||||||
| TI Group Automotive Systems LLC, Sr. Sec. Credit Facilities 1st Lien Term Loan, Tranche B, 4.802%, [LIBOR12+275], 6/30/225 | 458,306 | 457,351 | ||||||
| 1,657,355 | ||||||||
39 OPPENHEIMER FUNDAMENTAL ALTERNATIVES FUND
CONSOLIDATED STATEMENT OF INVESTMENTS Continued
| Principal Amount | Value | |||||||
| Information Technology—0.9% | ||||||||
| Internet Software & Services—0.8% | ||||||||
| Almonde, Inc., Sr. Sec. Credit Facilities 1st Lien Term Loan, 5.886%, [LIBOR4+350], 6/13/245 | $ | 145,439 | $ | 144,813 | ||||
| Almonde, Inc., Sr. Sec. Credit Facilities 1st Lien Term Loan, 5.886%, [LIBOR4+350], 6/13/245,9 | 408,166 | 406,409 | ||||||
| Avaya, Inc., Sr. Sec. Credit Facilities 1st Lien Exit Term Loan, Tranche B, 6.53%, [LIBOR12+425], 12/15/245 | 1,054,035 | 1,059,553 | ||||||
| Banff Merger Sub, Inc., Sr. Sec. Credit Facilities 1st Lien Term Loan, Tranche B, 6.648%, [LIBOR4+425], 10/2/255 | 445,000 | 447,087 | ||||||
| Blackboard, Inc., Sr. Sec. Credit Facilities 1st Lien Term Loan, Tranche B4, 7.445%, [LIBOR4+500], 6/30/215 | 237,991 | 227,851 | ||||||
| Colorado Buyer, Inc., Sr. Sec. Credit Facilities 1st Lien Term Loan, 5.28%, [LIBOR4+300], 5/1/245 | 176,388 | 176,195 | ||||||
| EagleView Technology Corp., Sr. Sec. Credit Facilities 1st Lien Term Loan, Tranche B, 5.78%, [LIBOR12+350], 8/14/255 | 55,000 | 54,949 | ||||||
| Ensono LP, Sr. Sec. Credit Facilities 1st Lien Term Loan, 7.492%, [LIBOR4+525], 6/27/255 | 139,650 | 141,017 | ||||||
| Epicor Software Corp., Sr. Sec. Credit Facilities 1st Lien Term Loan, Tranche B, 5.56%, [LIBOR12+325], 6/1/225 | 135,613 | 136,133 | ||||||
| First Data Corp., Sr. Sec. Credit Facilities 1st Lien Term Loan, Tranche B, 4.287%, [LIBOR12+225], 4/26/245 | 129,782 | 129,227 | ||||||
| Greeneden US Holdings II LLC, Sr. Sec. Credit Facilities 1st Lien Term Loan, Tranche B3, 5.742%, [LIBOR4+350], 12/1/235 | 158,208 | 158,999 | ||||||
| Hyland Software, Inc., Sr. Sec. Credit Facilities 1st Lien Term Loan, 5.925%, [LIBOR12+325], 7/1/245,9 | 10,000 | 10,072 | ||||||
| Infor US, Inc., Sr. Sec. Credit Facilities 1st Lien Term Loan, Tranche B, 5.136%, [LIBOR4+275], 2/1/225 | 443,846 | 442,792 | ||||||
| Informatica LLC, Sr. Sec. Credit Facilities 1st Lien Term Loan, Tranche B, 5.552%, [LIBOR4+325], 8/5/225 | 208,804 | 209,914 | ||||||
| Internap Corp., Sr. Sec. Credit Facilities 1st Lien Term Loan, 8.04%, [LIBOR12+575], 4/6/225 | 118,699 | 119,638 | ||||||
| Ivanti Software, Inc., Sr. Sec. Credit Facilities 1st Lien Term Loan, Tranche B, 6.51%, [LIBOR12+425], 1/20/245 | 108,394 | 108,529 | ||||||
| Kronos, Inc., Sr. Sec. Credit Facilities 1st Lien Term Loan, Tranche B, 5.358%, [LIBOR12+300], 11/1/235 | 14,925 | 14,968 | ||||||
| Lighthouse Network LLC, Sr. Sec. Credit Facilities 1st Lien Term Loan, 6.891%, [LIBOR4+450], 11/29/245 | 99,250 | 99,994 | ||||||
| MA FinanceCo LLC, Sr. Sec. Credit Facilities 1st Lien Term Loan: | ||||||||
| Tranche B, 4.802%, [LIBOR12+275], 6/21/245 | 71,720 | 71,642 | ||||||
| Tranche B2, 4.552%, [LIBOR4+250], 11/19/215 | 54,588 | 54,303 | ||||||
| MaxLinear, Inc., Sr. Sec. Credit Facilities 1st Lien Term Loan, Tranche B, 4.78%, [LIBOR12+250], 5/13/245 | 63,529 | 63,371 | ||||||
| McAfee LLC, Sr. Sec. Credit Facilities 1st Lien Term Loan, Tranche B, 6.795%, [LIBOR12+450], 9/30/245 | 351,524 | 353,126 | ||||||
| Mitchell International, Inc., Sr. Sec. Credit Facilities 1st Lien Term Loan, Tranche B, 5.552%, [LIBOR12+325], 11/29/245,9 | 199,475 | 198,929 | ||||||
| Parker Private Merger Sub, Inc., Sr. Sec. Credit Facilities 1st Lien Term Loan, Tranche B, 6.17%, [LIBOR4+375], 10/10/255 | 107,000 | 107,017 | ||||||
| Plantronics, Inc., Sr. Sec. Credit Facilities 1st Lien Term Loan, 4.802%, [LIBOR12+250], 7/2/255 | 360,000 | 359,550 | ||||||
40 OPPENHEIMER FUNDAMENTAL ALTERNATIVES FUND
| Principal Amount | Value | |||||||
| Internet Software & Services (Continued) | ||||||||
| Premiere Global Services, Inc., Sr. Sec. Credit Facilities 1st Lien Term Loan, 8.843%, [LIBOR6+650], 12/8/215 | $ | 64,219 | $ | 59,751 | ||||
| Project Deep Blue Holdings LLC, Sr. Sec. Credit Facilities 1st Lien Term Loan, 5.54%, [LIBOR4+325], 2/12/255 | 59,850 | 59,925 | ||||||
| Quest Software US Holdings, Inc., Sr. Sec. Credit Facilities 1st Lien Term Loan, 6.777%, [LIBOR4+425], 5/16/255 | 225,000 | 226,335 | ||||||
| Riverbed Technology, Inc., Sr. Sec. Credit Facilities 1st Lien Term Loan, Tranche B, 5.56%, [LIBOR12+325], 4/24/225 | 421,166 | 419,325 | ||||||
| Seattle SpinCo, Inc., Sr. Sec. Credit Facilities 1st Lien Term Loan, Tranche B, 4.802%, [LIBOR12+275], 6/21/245 | 484,096 | 483,566 | ||||||
| Shutterfly, Inc.,Sr. Sec. Credit Facilities 1st Lien Term Loan, Tranche B2, 5.00%, [LIBOR12+275], 8/17/245 | 144,638 | 144,981 | ||||||
| SolarWinds Holdings, Inc., Sr. Sec. Credit Facilities 1st Lien Term Loan, 5.302%, [LIBOR12+300], 2/5/245 | 129,025 | 129,473 | ||||||
| Solera LLC, Sr. Sec. Credit Facilities 1st Lien Term Loan, Tranche B, 5.052%, [LIBOR12+275], 3/3/235,9 | 212,952 | 213,035 | ||||||
| Sophia LP, Sr. Sec. Credit Facilities 1st Lien Term Loan, Tranche B, 5.636%, [LIBOR4+325], 9/30/225,9 | 90,000 | 90,300 | ||||||
| SS&C Technologies Holdings Europe Sarl, Sr. Sec. Credit Facilities 1st Lien Term Loan, Tranche B4, 4.552%, [LIBOR4+250], 4/16/255 | 203,046 | 202,270 | ||||||
| SS&C Technologies, Inc., Sr. Sec. Credit Facilities 1st Lien Term Loan, Tranche B1, 4.552%, [LIBOR4+250], 4/16/255 | 524,662 | 522,658 | ||||||
| Sungard Availability Services Capital, Inc., Extended Sr. Sec. Credit Facilities 1st Lien Term Loan, Tranche B, 9.274%, [LIBOR12+700], 9/30/215 | 53,965 | 49,019 | ||||||
| Sybil Software LLC, Sr. Sec. Credit Facilities 1st Lien Term Loan, Tranche B, 4.886%, [LIBOR4+250], 9/29/235 | 21,928 | 22,043 | ||||||
| Tempo Acquisition LLC, Sr. Sec. Credit Facilities 1st Lien Term Loan, 5.242%, [LIBOR12+300], 5/1/245 | 483,235 | 484,201 | ||||||
| TTM Technologies, Inc., Sr. Sec. Credit Facilities 1st Lien Term Loan, 4.756%, [LIBOR4+250], 9/28/245 | 202,373 | 202,753 | ||||||
| Veritas US, Inc., Sr. Sec. Credit Facilities 1st Lien Term Loan, 6.576%-6.802%, [LIBOR12+450], 1/27/235 | 517,393 | 494,829 | ||||||
| Vertafore, Inc., Sr. Sec. Credit Facilities 1st Lien Term Loan, Tranche B, 5.623%, [LIBOR4+325], 7/2/255,9 | 54,000 | 53,899 | ||||||
| Xperi Corp., Sr. Sec. Credit Facilities 1st Lien Term Loan, Tranche B, 4.742%, [LIBOR12+250], 12/1/235,9 | 262,000 | 258,848 | ||||||
| 9,413,289 | ||||||||
| IT Services—0.1% | ||||||||
| Pi US Mergerco, Inc., Sr. Sec. Credit Facilities 1st Lien Term Loan, 5.802%, [LIBOR12+350], 1/3/255 | 487,750 | 486,989 | ||||||
| 486,989 | ||||||||
| Materials—0.7% | ||||||||
| Chemicals—0.3% | ||||||||
| Alpha 3 BV, Sr. Sec. Credit Facilities 1st Lien Term Loan, 5.386%, [LIBOR4+300], 1/31/245 | 228,375 | 228,768 | ||||||
| Consolidated Energy Finance SA, Sr. Sec. Credit Facilities 1st Lien Term Loan, Tranche B, 4.784%, [LIBOR12+250], 5/7/255,9 | 139,650 | 139,301 | ||||||
41 OPPENHEIMER FUNDAMENTAL ALTERNATIVES FUND
CONSOLIDATED STATEMENT OF INVESTMENTS Continued
| Principal Amount | Value | |||||||
| Chemicals (Continued) | ||||||||
| Cyanco Intermediate Corp., Sr. Sec. Credit Facilities 1st Lien Term Loan, 5.545%, [LIBOR4+350], 3/17/255 | $ | 144,362 | $ | 144,795 | ||||
| Emerald Performance Materials LLC, Sr. Sec. Credit Facilities 1st Lien Term Loan, 5.802%, [LIBOR12+350], 7/30/215 | 187,589 | 188,800 | ||||||
| Encapsys LLC, Sr. Sec. Credit Facilities 1st Lien Term Loan, Tranche B, 5.552%, [LIBOR4+325], 11/7/245,9 | 184,075 | 184,880 | ||||||
| Ferro Corp., Sr. Sec. Credit Facilities 1st Lien Term Loan, Tranche B, 4.636%, [LIBOR4+225], 2/14/245 | 83,729 | 83,816 | ||||||
| LUX HOLDCO III, Sr. Sec. Credit Facilities 1st Lien Term Loan, 5.302%, [LIBOR4+300], 3/28/255 | 44,775 | 45,027 | ||||||
| MacDermid, Inc., Sr. Sec. Credit Facilities 1st Lien Term Loan: | ||||||||
| Tranche B6, 5.302%, [LIBOR12+300], 6/7/235 | 87,672 | 87,891 | ||||||
| Tranche B7, 4.742%, [LIBOR4+275], 6/7/205 | 88,054 | 88,236 | ||||||
| Messer Industries USA, Inc., Sr. Sec. Credit Facilities 1st Lien Term Loan, Tranche B, 4.834%, 9/28/257,9 | 110,000 | 110,165 | ||||||
| New Arclin US Holding Corp., Sr. Sec. Credit Facilities 1st Lien Term Loan, 5.886%, [LIBOR4+350], 2/14/245 | 107,182 | 107,048 | ||||||
| OCI Partners LP, Sr. Sec. Credit Facilities 1st Lien Term Loan, Tranche B, 6.386%, [LIBOR4+425], 3/13/255 | 139,362 | 141,279 | ||||||
| Polar US Borrower LLC, Sr. Sec. Credit Facilities 1st Lien Term Loan, 7.186%, [LIBOR4+475], 10/15/255 | 2,492 | 2,484 | ||||||
| Polar US Borrower LLC, Sr. Sec. Credit Facilities 1st Lien Term Loan, 7.186%, [LIBOR4+475], 10/15/255,9 | 112,508 | 112,157 | ||||||
| PQ Corp., Sr. Sec. Credit Facilities 1st Lien Term Loan, 5.027%, [LIBOR4+250], 2/8/255 | 57,419 | 57,434 | ||||||
| Road Infrastructure Investment LLC, Sr. Sec. Credit Facilities 1st Lien Term Loan, Tranche B, 5.802%, [LIBOR12+350], 6/13/235 | 118,331 | 116,556 | ||||||
| Starfruit US Holdco LLC, Sr. Sec. Credit Facilities 1st Lien Term Loan, Tranche B, 5.506%, [LIBOR12+325], 10/1/255 | 280,000 | 279,500 | ||||||
| Tronox Blocked Borrower LLC, Sr. Sec. Credit Facilities 1st Lien Term Loan, Tranche B, 5.302%, [LIBOR4+300], 9/23/245,9 | 154,068 | 154,116 | ||||||
| Tronox Finance LLC, Sr. Sec. Credit Facilities 1st Lien Term Loan, Tranche B, 5.302%, [LIBOR4+300], 9/23/245,9 | 355,534 | 355,644 | ||||||
| Univar USA, Inc., Sr. Sec. Credit Facilities 1st Lien Term Loan, Tranche B, 4.552%, [LIBOR12+250], 7/1/245 | 195,177 | 195,385 | ||||||
| 2,823,282 | ||||||||
| Construction Materials—0.1% | ||||||||
| Continental Building Products Operating Co. LLC, Sr. Sec. Credit Facilities 1st Lien Term Loan, 4.492%-4.552%, [LIBOR12+225], 8/18/235 | 139,663 | 139,816 | ||||||
| Pisces Midco, Inc., Sr. Sec. Credit Facilities 1st Lien Term Loan, Tranche B, 6.175%, [LIBOR4+300], 4/12/255 | 224,438 | 223,994 | ||||||
| Quikrete Holdings, Inc., Sr. Sec. Credit Facilities 1st Lien Term Loan, 5.052%, [LIBOR12+275], 11/15/235 | 561,779 | 560,375 | ||||||
| Realogy Group LLC, Sr. Sec. Credit Facilities 1st Lien Term Loan, Tranche B, 4.53%, [LIBOR12+225], 2/8/255 | 91,212 | 91,084 | ||||||
42 OPPENHEIMER FUNDAMENTAL ALTERNATIVES FUND
| Principal Amount | Value | |||||||
| Construction Materials (Continued) | ||||||||
| VC GB Holdings, Inc., Sr. Sec. Credit Facilities 1st Lien Term Loan, 5.302%, [LIBOR12+325], 2/28/245 | $ | 137,969 | $ | 137,107 | ||||
| 1,152,376 | ||||||||
| Containers & Packaging—0.1% | ||||||||
| Ball Metalpack Finco LLC, Sr. Sec. Credit Facilities 1st Lien Term Loan, Tranche B, 6.802%, [LIBOR12+450], 7/31/255 | 64,838 | 65,405 | ||||||
| BWAY Corp., Sr. Sec. Credit Facilities 1st Lien Term Loan, 5.658%, [LIBOR12+325], 4/3/245,9 | 476,145 | 474,061 | ||||||
| Flex Acquisition Co., Inc., Sr. Sec. Credit Facilities 1st Lien Term Loan, 5.506%, [LIBOR4+325], 6/29/255,9 | 289,300 | 290,075 | ||||||
| Plastipak Holdings, Inc., Sr. Sec. Credit Facilities 1st Lien Term Loan, Tranche B, 4.81%, [LIBOR12+250], 10/14/245 | 163,624 | 163,560 | ||||||
| Pro Mach Group, Inc., Sr. Sec. Credit Facilities 1st Lien Term Loan, Tranche B, 5.277%, [LIBOR4+300], 3/7/255 | 233,975 | 233,595 | ||||||
| Reynolds Group Holdings, Inc., Sr. Sec. Credit Facilities 1st Lien Term Loan, 5.052%, [LIBOR12+300], 2/5/235 | 303,716 | 304,301 | ||||||
| 1,530,997 | ||||||||
| Metals & Mining—0.2% | ||||||||
| Covia Holdings Corp., Sr. Sec. Credit Facilities 1st Lien Term Loan, 6.05%, [LIBOR4+375], 6/1/255 | 249,375 | 210,177 | ||||||
| Murray Energy Corp., Sr. Sec. Credit Facilities 1st Lien Term Loan: | ||||||||
| Tranche B2, 9.326%, [LIBOR12+725], 10/17/225 | 1,590,419 | 1,433,698 | ||||||
| Tranche B3, 9.992%, [LIBOR12+775], 10/17/225 | 466,259 | 420,566 | ||||||
| Oxbow Carbon LLC, Sr. Sec. Credit Facilities 1st Lien Term Loan, Tranche B, 5.802%, [LIBOR12+375], 1/4/235 | 24,063 | 24,283 | ||||||
| Peabody Energy Corp., Sr. Sec. Credit Facilities 1st Lien Term Loan, Tranche B, 5.052%, [LIBOR12+275], 3/31/255 | 107,440 | 107,389 | ||||||
| TMS International Corp., Sr. Sec. Credit Facilities 1st Lien Term Loan, Tranche B, 5.052%, [LIBOR4+275], 8/14/245 | 90,227 | 90,340 | ||||||
| 2,286,453 | ||||||||
| Telecommunication Services—0.4% | ||||||||
| Diversified Telecommunication Services—0.4% | ||||||||
| CenturyLink, Inc., Sr. Sec. Credit Facilities 1st Lien Term Loan, Tranche B, 5.052%, [LIBOR4+275], 1/31/255 | 1,240,625 | 1,228,994 | ||||||
| Cincinnati Bell, Inc., Sr. Sec. Credit Facilities 1st Lien Term Loan, Tranche B, 5.552%, [LIBOR4+375], 10/2/245 | 235,000 | 235,336 | ||||||
| Consolidated Communications, Inc., Sr. Sec. Credit Facilities 1st Lien Term Loan, Tranche B, 5.08%, [LIBOR12+300], 10/5/235 | 350,426 | 345,533 | ||||||
| Digicel International Finance Ltd, Sr. Sec. Credit Facilities 1st Lien Term Loan, Tranche B, 5.57%, [LIBOR4+325], 5/27/245 | 312,460 | 300,352 | ||||||
| Frontier Communications Corp., Sr. Sec. Credit Facilities 1st Lien Term Loan, Tranche B, 6.06%, [LIBOR12+375], 6/15/245 | 411,096 | 399,174 | ||||||
| Fusion Connect, Inc., Sr. Sec. Credit Facilities 1st Lien Term Loan, 9.841%, [LIBOR4+750], 5/4/235 | 360,750 | 340,909 | ||||||
| Global Tel*Link Corp., Sr. Sec. Credit Facilities 1st Lien Term Loan, 6.386%, [LIBOR4+400], 5/23/205 | 252,535 | 253,166 | ||||||
43 OPPENHEIMER FUNDAMENTAL ALTERNATIVES FUND
CONSOLIDATED STATEMENT OF INVESTMENTS Continued
| Principal Amount | Value | |||||||
| Diversified Telecommunication Services (Continued) | ||||||||
| GTT Communications, Inc., Sr. Sec. Credit Facilities 1st Lien Term Loan, Tranche B, 5.05%, [LIBOR12+275], 5/31/255,9 | $ | 194,850 | $ | 192,514 | ||||
| IPC Corp., Sr. Sec. Credit Facilities 1st Lien Term Loan, Tranche B, 6.85%, [LIBOR4+450], 8/6/215 | 272,953 | 263,400 | ||||||
| IPC Corp., Sr. Sec. Credit Facilities 2nd Lien Term Loan, 11.85%, [LIBOR4+950], 2/4/225 | 161,028 | 141,705 | ||||||
| NeuStar, Inc., Sr. Sec. Credit Facilities 1st Lien Term Loan, Tranche B4, 5.802%, [LIBOR12+350], 8/8/245 | 164,584 | 165,227 | ||||||
| Sprint Communications, Inc., Sr. Sec. Credit Facilities 1st Lien Term Loan, Tranche B, 4.813%, [LIBOR12+250], 2/2/245 | 906,291 | 906,998 | ||||||
| Windstream Services LLC, Sr. Sec. Credit Facilities 1st Lien Term Loan, Tranche B6, 6.29%, [LIBOR12+400], 3/29/215 | 408,029 | 383,984 | ||||||
| 5,157,292 | ||||||||
| Utilities—1.2% | ||||||||
| Electric Utilities—1.2% | ||||||||
| Brookfield WEC Holdings, Inc., Sr. Sec. Credit Facilities 1st Lien Term Loan, 6.052%, [LIBOR4+375], 8/1/255 | 215,000 | 216,628 | ||||||
| Calpine Construction Finance Co. LP, Sr. Sec. Credit Facilities 1st Lien Term Loan, 4.802%, [LIBOR12+250], 1/15/255 | 84,574 | 84,574 | ||||||
| Calpine Corp., Sr. Sec. Credit Facilities 1st Lien Term Loan: | ||||||||
| Tranche B5, 4.89%, [LIBOR4+250], 1/15/245 | 306,722 | 306,067 | ||||||
| Tranche B7, 4.84%, [LIBOR4+275], 5/31/235 | 34,298 | 34,240 | ||||||
| Compass Power Generation LLC, Sr. Sec. Credit Facilities 1st Lien Term Loan, Tranche B, 5.802%, [LIBOR12+350], 12/20/245 | 123,713 | 124,733 | ||||||
| EFS Cogen Holdings I LLC, Sr. Sec. Credit Facilities 1st Lien Term Loan, Tranche B, 5.64%, [LIBOR4+325], 6/28/235 | 220,198 | 220,218 | ||||||
| Exgen Renewables IV LLC, Sr. Sec. Credit Facilities 1st Lien Term Loan, Tranche B, 5.32%, [LIBOR4+300], 11/28/245 | 29,421 | 29,715 | ||||||
| Frontera Generation Holdings LLC, Sr. Sec. Credit Facilities 1st Lien Term Loan, Tranche B, 6.524%, [LIBOR12+425], 5/2/255 | 264,450 | 265,772 | ||||||
| Kestrel Acquisition LLC., Sr. Sec. Credit Facilities 1st Lien Term Loan, Tranche B, 6.56%, [LIBOR12+425], 6/2/255 | 144,638 | 145,963 | ||||||
| Lightstone Holdco LLC, Sr. Sec. Credit Facilities 1st Lien Term Loan: | ||||||||
| Tranche B, 5.992%, [LIBOR12+375], 1/30/245,9 | 202,086 | 199,668 | ||||||
| Tranche C, 5.992%, [LIBOR12+375], 1/30/245,9 | 3,787 | 3,742 | ||||||
| Tranche C, 5.992%, [LIBOR12+375], 1/30/245 | 10,598 | 10,472 | ||||||
| MRP Generation Holdings LLC, Sr. Sec. Credit Facilities 1st Lien Term Loan, Tranche B, 9.386%, [LIBOR4+700], 10/18/225 | 73,500 | 70,927 | ||||||
| Sandy Creek Energy Associates LP, Sr. Sec. Credit Facilities 1st Lien Term Loan, Tranche B, 6.386%, [LIBOR4+400], 11/9/205 | 419,552 | 374,713 | ||||||
| Talen Energy Supply LLC, Sr. Sec. Credit Facilities 1st Lien Term Loan: | ||||||||
| Tranche B, 6.302%, [LIBOR12+400], 7/15/235,9 | 329,449 | 330,736 | ||||||
| Tranche B2, 6.302%, [LIBOR12+400], 4/15/245,9 | 76,728 | 77,028 | ||||||
| Vistra Operations Co. LLC, Sr. Sec. Credit Facilities 1st Lien Term Loan: | ||||||||
| Tranche B1, 4.552%, 8/4/237 | 1,566,015 | 1,564,379 | ||||||
| Tranche B2, 4.326%, [LIBOR12+225], 12/14/235 | 9,549,828 | 9,570,743 | ||||||
| 13,630,318 | ||||||||
| Total Corporate Loans (Cost $156,798,461) | 154,904,329 | |||||||
44 OPPENHEIMER FUNDAMENTAL ALTERNATIVES FUND
| Principal Amount | Value | |||||||
| Event-Linked Bonds—1.3% | ||||||||
| Acorn Re Ltd. Catastrophe Linked Nts., 4.986% [US0003M+275], 11/10/215,12 | $ | 1,000,000 | $ | 1,002,250 | ||||
| Akibare Re Ltd. Catastrophe Linked Nts., 4.781% [US0006M+234], 4/7/205,6 | 1,000,000 | 1,001,250 | ||||||
| Alamo Re Ltd. Catastrophe Linked Nts., 5.58% [T-BILL 1MO+325], 6/7/215,6 | 625,000 | 625,594 | ||||||
| Aozora Re Ltd. Catastrophe Linked Nts., 4.323% [US0006M+200], 4/7/215,6 | 1,000,000 | 999,250 | ||||||
| Azzurro RE I DAC Catastrophe Linked Nts., 2.15% [EUR003M+215], 1/16/195,6 | 1,000,000 | 1,133,131 | ||||||
| Cranberry Re Ltd. Catastrophe Linked Nts., 4.235% [US0006M+200], 7/13/205,6 | 1,000,000 | 1,016,050 | ||||||
| Golden State Re II Ltd. Catastrophe Linked Nts., 4.53% [T-BILL 3MO+220], 1/8/195,6 | 1,000,000 | 1,000,750 | ||||||
| International Bank for Reconstruction & Development: | ||||||||
| 4.614% [US0003M+250], 2/15/215,12,13 | 1,250,000 | 1,247,813 | ||||||
| 5.114% [US0003M+300], 2/15/215,6,13 | 1,000,000 | 1,007,650 | ||||||
| Kizuna Re II Ltd. Catastrophe Linked Nts., 4.203% [T-BILL 3MO+187.5], 4/11/235,12 | 250,000 | 252,712 | ||||||
| Long Point Re III Ltd. Catastrophe Linked Nts., 5.075% [T-BILL 3MO+275], 6/1/225,6 | 1,000,000 | 1,010,750 | ||||||
| Manatee Re II Ltd. Catastrophe Linked Nts., 6.575% [T-BILL 3MO+425], 6/7/215,6 | 1,000,000 | 1,006,250 | ||||||
| Merna Re Ltd.: | ||||||||
| 4.325% [T-BILL 3MO+200], 4/8/205,6 | 500,000 | 501,475 | ||||||
| 4.325% [T-BILL 3MO+200], 4/8/215,12 | 250,000 | 251,162 | ||||||
| 4.575% [T-BILL 3MO+225], 4/8/195,6 | 250,000 | 250,762 | ||||||
| Nakama Re Ltd. Catastrophe Linked Nts., 4.429% [US0006M+220], 10/13/215,12 | 750,000 | 760,988 | ||||||
| Pelican IV Re Ltd. Catastrophe Linked Nts., 4.358% [US0003M+225], 5/7/215,6 | 1,000,000 | 1,000,850 | ||||||
| SD Re Ltd. Catastrophe Linked Nts., 6.276% [US0003M+400], 10/19/215,6 | 750,000 | 753,263 | ||||||
| Total Event-Linked Bonds (Cost $14,832,672) | 14,821,950 | |||||||
| Shares | ||||||||
| Structured Securities—1.0% | ||||||||
| Africa Telecommunications Media & Technology Fund 1 LLC1,12 | 9,542,930 | — | ||||||
| Toronto-Dominion Bank (The), Enterprise Products Partners LP Equity Linked Nts., 6/6/19-11/20/196 | 11,374,000 | 11,496,498 | ||||||
| Total Structured Securities (Cost $21,384,472) | 11,496,498 | |||||||
Exercise Price | Expiration Date | Notional Amount (000’s) | Contracts (000’s) | |||||||||||||||||||||
| Exchange-Traded Options Purchased—0.0% | ||||||||||||||||||||||||
| S&P 500 Index Call1 | USD | 2,960.000 | 12/21/18 | USD 42,032 | USD 0 | 14 | 39,990 | |||||||||||||||||
| S&P 500 Index Call1 | USD | 2,795.000 | 1/18/19 | USD 19,253 | USD 0 | 14 | 342,575 | |||||||||||||||||
| S&P 500 Index Call1 | USD | 3,000.000 | 1/18/19 | USD 32,812 | USD 0 | 14 | 62,920 | |||||||||||||||||
| S&P 500 Index Call1 | USD | 2,970.000 | 12/21/18 | USD 49,082 | USD 0 | 14 | 45,974 | |||||||||||||||||
| Total Exchange-Traded Options Purchased (Cost $1,989,636) |
| 491,459 | ||||||||||||||||||||||
45 OPPENHEIMER FUNDAMENTAL ALTERNATIVES FUND
CONSOLIDATED STATEMENT OF INVESTMENTS Continued
Counter- party | Exercise Price | Expiration Date | Notional Amount (000’s) | Contracts (000’s) | Value | |||||||||||||||||||
| Over-the-Counter Option Purchased—0.1% |
| |||||||||||||||||||||||
| CNH Currency Put1 (Cost $417,914) | GSCO-OT | CNH6.869 | �� | 8/27/19 | CNH 200,000 | CNH 110,000 | $ | 586,630 | ||||||||||||||||
Pay/Receive Floating Rate | Floating Rate | Fixed Rate | Expiration Date | Notional Amount (000’s) | ||||||||||||||||||||||||||
| Over-the-Counter Interest Rate Swaptions Purchased—0.5% |
| |||||||||||||||||||||||||||||
| Interest Rate Swap maturing 1/24/29 Put1 | GSCOI | Receive | Six-Month JPY BBA LIBOR | 0.708% | 1/22/19 | JPY | 795,000 | 1,543 | ||||||||||||||||||||||
| Interest Rate Swap maturing 1/28/31 Put1 | GSCOI | Receive | Six-Month JPY BBA LIBOR | 0.523 | 1/26/21 | JPY | 1,744,000 | 191,955 | ||||||||||||||||||||||
| Interest Rate Swap maturing 11/21/28 Put1 | GSCOI | Receive | Six-Month JPY BBA LIBOR | 0.850 | 11/19/18 | JPY | 749,000 | 1 | ||||||||||||||||||||||
| Interest Rate Swap maturing 4/30/31 Put1 | GSCOI | Receive | Six-Month JPY BBA LIBOR | 0.485 | 4/27/21 | JPY | 5,250,000 | 739,266 | ||||||||||||||||||||||
| Interest Rate Swap maturing 9/29/31 Put1 | MSCO | Receive | Three- Month USD BBA LIBOR | 3.253 | 10/21/21 | USD | 100,250 | 4,236,841 | ||||||||||||||||||||||
| Interest Rate Swap maturing 9/29/31 Put1 | MSCO | Receive | Three- Month USD BBA LIBOR | 3.178 | 9/27/21 | USD | 4,100 | 184,474 | ||||||||||||||||||||||
| Total Over-the-Counter Interest Rate Swaptions Purchased (Cost $5,469,804) |
| 5,354,080 | ||||||||||||||||||||||||||||
| Principal Amount | ||||||||
| Short-Term Notes—4.6% | ||||||||
| Air Liquide US LLC, 2.566%, 12/31/186,15,16 | $ | 1,400,000 | 1,394,432 | |||||
| Albemarle Corp., 2.455%, 11/13/186,15,16 | 1,200,000 | 1,198,839 | ||||||
| AT&T, Inc., 2.902%, 5/28/196,15,16 | 250,000 | 245,726 | ||||||
| AT&T, Inc., 3.093%, 5/30/196,15,16 | 1,200,000 | 1,179,273 | ||||||
| Avery Dennison, 2.511%, 12/6/1815,16 | 1,300,000 | 1,296,746 | ||||||
| BAT International Finance plc, 2.627%, 12/10/1815,16 | 1,500,000 | 1,495,787 | ||||||
| Bell Canada, Inc., 2.596%, 1/4/1915,16 | 600,000 | 597,154 | ||||||
| Bell Canada, Inc., 2.704%, 2/4/1915,16 | 1,000,000 | 992,797 | ||||||
| Cabot Corp., 2.463%, 11/13/186,15,16 | 1,400,000 | 1,398,770 | ||||||
| CenterPoint Energy Resources Corp., 2.456%, 11/13/186,15,16 | 1,600,000 | 1,598,615 | ||||||
| Duke Energy Corp., 2.423%, 11/14/186,15,16 | 1,400,000 | 1,398,667 | ||||||
| Eastman Chemical, 2.434%, 11/6/1815,16 | 1,300,000 | 1,299,480 | ||||||
46 OPPENHEIMER FUNDAMENTAL ALTERNATIVES FUND
| Principal Amount | Value | |||||||
| Short-Term Notes (Continued) | ||||||||
| Eni Finance USA, Inc., 2.491%, 12/10/1815,16 | $ | 1,600,000 | $ | 1,595,445 | ||||
| Glencore Funding, 2.779%, 1/7/1915,16 | 2,000,000 | 1,989,883 | ||||||
| Harley-Davidson Financial Services, Inc., 2.545%, 1/7/1915,16 | 1,200,000 | 1,194,034 | ||||||
| Hitachi Capital America Corp., 2.586%, 11/29/1816 | 1,400,000 | 1,397,188 | ||||||
| HP, Inc., 2.503%, 11/13/1816 | 1,300,000 | 1,298,948 | ||||||
| International Paper Co., 2.441%, 11/7/186,15,16 | 1,200,000 | 1,199,439 | ||||||
| Johnson & Johnson, 2.505%, 11/28/186,15,16 | 1,400,000 | 1,397,288 | ||||||
| Magna International, Inc., 2.515%, 11/13/186,15,16 | �� | 1,200,000 | 1,199,763 | |||||
| Marriott International, Inc., 2.511%, 11/27/186,15,16 | 1,600,000 | 1,597,013 | ||||||
| McKesson Corp., 2.515%, 11/26/186,15,16 | 1,400,000 | 1,397,485 | ||||||
| Mondelez International, Inc., 2.576%, 12/19/1815,16 | 1,600,000 | 1,594,423 | ||||||
| NetApp, Inc., 2.454%, 11/6/186,15,16 | 1,200,000 | 1,199,520 | ||||||
| NextEra Energy Capital Holdings, 2.55%, 12/7/186,15,16 | 900,000 | 897,671 | ||||||
| NextEra Energy Capital Holdings, 2.592%, 12/20/186,15,16 | 500,000 | 498,219 | ||||||
| Northrop Grumman Corp., 2.688%, 1/16/196,15,16 | 1,500,000 | 1,491,479 | ||||||
| Puget Sound Energy, Inc., 2.415%, 11/9/1816 | 1,400,000 | 1,399,154 | ||||||
| Qualcomm, Inc., 2.393%, 11/7/186,15,16 | 2,000,000 | 1,999,111 | ||||||
| Reckitt Benckiser Treasury Services plc, 2.39%, 11/13/1815,16 | 1,900,000 | 1,898,456 | ||||||
| Relx, Inc., 2.443%, 11/8/186,15,16 | 1,500,000 | 1,499,196 | ||||||
| Rockwell Collins, Inc., 2.473%, 11/1/186,15,16 | 1,200,000 | 1,199,921 | ||||||
| Rockwell Collins, Inc., 2.503%, 11/6/186,15,16 | 300,000 | 299,880 | ||||||
| Ryder System, Inc., 2.445%, 11/19/1816 | 1,500,000 | 1,498,045 | ||||||
| Sempra Energy, 2.485%, 11/26/1815,16 | 1,400,000 | 1,397,485 | ||||||
| Telus Corp., 2.637%, 12/27/186,16 | 1,600,000 | 1,593,431 | ||||||
| United Technologies Corp., 2.55%, 11/28/186,15,16 | 1,200,000 | 1,197,675 | ||||||
| UnitedHealth Group, Inc., 2.505%, 12/31/186,15,16 | 1,200,000 | 1,194,780 | ||||||
| Walgreens Boots Alliance, Inc., 2.759%, 1/29/1916 | 1,300,000 | 1,291,209 | ||||||
| Waste Management, Inc., 2.424%, 11/8/186,15,16 | 1,200,000 | 1,199,360 | ||||||
| Whirlpool Corp., 2.433%, 11/7/1816 | 1,200,000 | 1,199,439 | ||||||
| Total Short-Term Notes (Cost $52,912,933) | 52,911,226 | |||||||
| Shares | ||||||||
| Investment Companies—5.7% | ||||||||
| Oppenheimer Institutional Government Money Market Fund, Cl. E, 2.12%3,17 | 25,288,291 | 25,288,291 | ||||||
| SPDR Gold Trust Exchange Traded Fund1,18 | 351,515 | 40,476,953 | ||||||
| Total Investment Companies (Cost $67,241,152) | 65,765,244 | |||||||
| Total Investments, at Value (Cost $1,009,238,804) | 98.5% | 1,133,246,454 | ||||||
| Net Other Assets (Liabilities) | 1.5 | 17,644,847 | ||||||
| Net Assets | 100.0% | $ | 1,150,891,301 | |||||
Footnotes to Consolidated Statement of Investments
1. Non-income producing security.
2. All or portion of the security position is held in segregated accounts and pledged to cover margin requirements with respect to securities sold short. The aggregate market value of such securities is $61,666,603. See Note 10 of accompanying Consolidated Notes.
3. Is or was an affiliate, as defined in the Investment Company Act of 1940, as amended, at or during the reporting period, by virtue of the Fund owning at least 5% of the voting securities of the issuer or as a result of the Fund and the issuer having the same investment adviser. Transactions during the reporting period in which the issuer was an affiliate are as follows:
47 OPPENHEIMER FUNDAMENTAL ALTERNATIVES FUND
CONSOLIDATED STATEMENT OF INVESTMENTS Continued
Footnotes to Consolidated Statement of Investments (Continued)
Shares October 31, 2017 | Gross Additions | Gross Reductions | Shares October 31, 2018 | |||||||||||
| ||||||||||||||
| Common Stock | ||||||||||||||
| Specialty Retail | ||||||||||||||
| Gymboree Corp. (The) | 4,118 | — | — | 4,118 | ||||||||||
| Gymboree Holding Corp. | 11,737 | — | — | 11,737 | ||||||||||
| Investment Company | ||||||||||||||
| Oppenheimer Institutional Government Money Market Fund, Cl. E | 25,711,488 | 613,929,289 | 614,352,486 | 25,288,291 | ||||||||||
| Value | Income | Realized Gain (Loss) | Change in Unrealized Gain (Loss) | |||||||||||
| ||||||||||||||
| Common Stock | ||||||||||||||
| Specialty Retail | ||||||||||||||
| Gymboree Corp. (The) | $ | 23,421 | $ | 113 | $ | — | $ (82,103) | |||||||
| Gymboree Holding Corp. | 66,754 | 321 | — | (234,007) | ||||||||||
| Investment Company | ||||||||||||||
| Oppenheimer Institutional Government Money Market Fund, Cl. E | 25,288,291 | 406,194 | — | — | ||||||||||
|
| |||||||||||||
| Total | $ | 25,378,466 | $ | 406,628 | $ | — | $ (316,110) | |||||||
|
| |||||||||||||
4. The value of this security was determined using significant unobservable inputs. See Note 3 of the accompanying Consolidated Notes.
5. Represents the current interest rate for a variable or increasing rate security, determined as [Referenced Rate + Basis-point spread].
6. Represents securities sold under Rule 144A, which are exempt from registration under the Securities Act of 1933, as amended. These securities have been determined to be liquid under guidelines established by the Board of Trustees. These securities amount to $78,953,932 or 6.86% of the Fund’s net assets at period end.
7. This interest rate resets periodically. Interest rate shown reflects the rate in effect at period end. The rate on this variable rate security is not based on a published reference rate and spread but is determined by the issuer or agent based on current market conditions.
8. This bond has no contractual maturity date, is not redeemable and contractually pays an indefinite stream of interest.
9. All or a portion of the security position is when-issued or delayed delivery to be delivered and settled after period end. See Note 4 of the accompanying Consolidated Notes.
10. This security is not accruing income because its issuer has missed or is expected to miss interest and/or principal payments. The rate shown is the contractual interest rate. See Note 4 of the accompanying Consolidated Notes.
11. Interest or dividend is paid-in-kind, when applicable.
12. Restricted security. The aggregate value of restricted securities at period end was $3,514,925, which represents 0.31% of the Fund’s net assets. See Note 4 of the accompanying Consolidated Notes. Information concerning restricted securities is as follows:
| Security | Acquisition Dates | Cost | Value | Unrealized Appreciation/ (Depreciation) | ||||||||||||
| Acorn Re Ltd. Catastrophe Linked Nts., 4.986% [US0003M+275], 11/10/21 | 7/3/18-8/15/18 | $ | 1,000,118 | $ | 1,002,250 | $ | 2,132 | |||||||||
| Africa Telecommunications Media & Technology Fund 1 LLC | 4/20/11 | 10,000,000 | — | (10,000,000 | ) | |||||||||||
48 OPPENHEIMER FUNDAMENTAL ALTERNATIVES FUND
Footnotes to Consolidated Statement of Investments (Continued)
| Security | Acquisition Dates | Cost | Value | Unrealized Appreciation/ (Depreciation) | ||||||||||||
| International Bank for Reconstruction & Development Catastrophe Linked Nts., 4.614% [US0003M+250], 2/15/21 | 5/29/18 | $ | 1,253,731 | $ | 1,247,813 | $ | (5,918 | ) | ||||||||
| Kizuna Re II Ltd. Catastrophe Linked Nts., 4.203% [T-BILL 3MO+187.5], 4/11/23 | 6/20/18 | 250,466 | 252,712 | 2,246 | ||||||||||||
| Merna Re Ltd. Catastrophe Linked Nts., 4.325% [T-BILL 3MO+200], 4/8/21 | 6/18/18 | 251,100 | 251,162 | 62 | ||||||||||||
| Nakama Re Ltd. Catastrophe Linked Nts., 4.429% [US0006M+220], 10/13/21 | 7/19/18 | 761,376 | 760,988 | (388 | ) | |||||||||||
| $ | 13,516,791 | $ | 3,514,925 | $ | (10,001,866 | ) | ||||||||||
13. Represents securities sold under Regulation S, which are exempt from registration under the Securities Act of 1933, as amended. These securities may not be offered or sold in the United States without and exemption from, or in a transaction not subject to, the registration requirements of the Securities Act of 1933. These securities amount to $2,255,463 or 0.20% of the Fund’s net assets at period end.
14. Number of contracts are less than 500.
15. Security issued in an exempt transaction without registration under the Securities Act of 1933. Such securities amount to $43,233,812 or 3.76% of the Fund’s net assets, and have been determined to be liquid pursuant to guidelines adopted by the Board of Trustees.
16. Current yield as of period end.
17. Rate shown is the 7-day yield at period end.
18. All or a portion of this security is owned by the subsidiary. See Note 2 of the accompanying Consolidated Notes.
Shares Sold Short | Value | |||||||
| Securities Sold Short—(33.4)% | ||||||||
| Common Stock Securities Sold Short—(33.4)% | ||||||||
| AbbVie, Inc. | (104,416 | ) | $ | (8,128,786 | ) | |||
| AGCO Corp. | (114,830 | ) | (6,435,073 | ) | ||||
| Air Lease Corp., Cl. A | (130,892 | ) | (4,986,985 | ) | ||||
| Aircastle Ltd. | (319,790 | ) | (6,213,520 | ) | ||||
| Ally Financial, Inc. | (554,960 | ) | (14,101,534 | ) | ||||
| Apache Corp. | (174,010 | ) | (6,582,798 | ) | ||||
| AvalonBay Communities, Inc. | (55,960 | ) | (9,814,265 | ) | ||||
| Boeing Co. (The) | (24,308 | ) | (8,625,937 | ) | ||||
| Camden Property Trust | (54,520 | ) | (4,921,520 | ) | ||||
| Caterpillar, Inc. | (46,700 | ) | (5,665,644 | ) | ||||
| Church & Dwight Co., Inc. | (239,960 | ) | (14,246,425 | ) | ||||
| Cie Financiere Richemont SA | (128,129 | ) | (9,343,787 | ) | ||||
| CNH Industrial NV | (362,460 | ) | (3,765,959 | ) | ||||
| Colgate-Palmolive Co. | (164,150 | ) | (9,775,132 | ) | ||||
| Corning, Inc. | (197,971 | ) | (6,325,173 | ) | ||||
| Darden Restaurants, Inc. | (56,540 | ) | (6,024,337 | ) | ||||
| Diamondback Energy, Inc. | (47,330 | ) | (5,317,999 | ) | ||||
| Digital Realty Trust, Inc. | (46,500 | ) | (4,801,590 | ) | ||||
49 OPPENHEIMER FUNDAMENTAL ALTERNATIVES FUND
CONSOLIDATED STATEMENT OF INVESTMENTS Continued
Shares Sold Short | Value | |||||||
| Common Stock Securities Sold Short (Continued) | ||||||||
| Dril-Quip, Inc.1 | (129,960 | ) | $ | (5,531,098 | ) | |||
| Equity Residential | (154,780 | ) | (10,054,509 | ) | ||||
| Fastenal Co. | (110,190 | ) | (5,664,868 | ) | ||||
| Federal Realty Investment Trust | (45,270 | ) | (5,615,744 | ) | ||||
| Franklin Resources, Inc. | (173,180 | ) | (5,281,990 | ) | ||||
| General Mills, Inc. | (270,910 | ) | (11,865,858 | ) | ||||
| GlaxoSmithKline plc, Sponsored ADR | (73,586 | ) | (2,874,269 | ) | ||||
| HP, Inc. | (342,330 | ) | (8,263,846 | ) | ||||
| Intel Corp. | (232,989 | ) | (10,922,524 | ) | ||||
| International Business Machines Corp. | (63,960 | ) | (7,382,903 | ) | ||||
| Ipsen SA | (13,780 | ) | (1,911,185 | ) | ||||
| Jones Lang LaSalle, Inc. | (102,810 | ) | (13,597,651 | ) | ||||
| Kirby Corp.1 | (77,180 | ) | (5,552,329 | ) | ||||
| Koninklijke Ahold Delhaize NV | (457,233 | ) | (10,475,094 | ) | ||||
| Louisiana-Pacific Corp. | (146,890 | ) | (3,197,795 | ) | ||||
| Nokia OYJ, Sponsored ADR | (2,138,767 | ) | (12,019,871 | ) | ||||
| Novo Nordisk AS, Sponsored ADR | (235,558 | ) | (10,171,394 | ) | ||||
| Oceaneering International, Inc.1 | (256,240 | ) | (4,853,186 | ) | ||||
| Oil States International, Inc.1 | (207,040 | ) | (4,610,781 | ) | ||||
| Pennsylvania Real Estate Investment Trust | (1,151,812 | ) | (10,308,717 | ) | ||||
| Procter & Gamble Co. (The) | (61,440 | ) | (5,448,499 | ) | ||||
| ResMed, Inc. | (112,610 | ) | (11,927,651 | ) | ||||
| Rio Tinto plc, Sponsored ADR | (79,245 | ) | (3,905,986 | ) | ||||
| RLJ Lodging Trust | (242,550 | ) | (4,715,172 | ) | ||||
| SAP SE, Sponsored ADR | (129,715 | ) | (13,913,231 | ) | ||||
| Southern Copper Corp. | (95,100 | ) | (3,646,134 | ) | ||||
| Starbucks Corp. | (96,720 | ) | (5,635,874 | ) | ||||
| Target Corp. | (76,822 | ) | (6,424,624 | ) | ||||
| W.W. Grainger, Inc. | (24,405 | ) | (6,930,288 | ) | ||||
| Wacker Chemie AG | (29,021 | ) | (2,597,791 | ) | ||||
| Weingarten Realty Investors | (323,560 | ) | (9,098,507 | ) | ||||
| West Fraser Timber Co. Ltd. | (104,129 | ) | (5,231,564 | ) | ||||
| Western Union Co. (The) | (595,160 | ) | (10,736,685 | ) | ||||
| William Demant Holding AS1 | (293,281 | ) | (9,640,370 | ) | ||||
| Total Securities Sold Short (Proceeds $404,823,238) | $ | (385,084,452 | ) | |||||
| Forward Currency Exchange Contracts as of October 31, 2018 |
| |||||||||||||||||||||||||||
Counter -party |
Settlement Month(s) | Currency Purchased (000’s) | Currency Sold (000’s) | Unrealized Appreciation | Unrealized Depreciation | |||||||||||||||||||||||
| BAC | 11/2018 | USD | 485 | CNH | 3,300 | $ | 11,893 | $ | — | |||||||||||||||||||
| BAC | 01/2019 | USD | 12,312 | THB | 398,000 | 271,342 | — | |||||||||||||||||||||
| BOA | 01/2019 | USD | 371 | THB | 12,000 | 8,203 | — | |||||||||||||||||||||
| CITNA-B | 11/2018 | USD | 15,251 | CNH | 103,120 | 477,689 | — | |||||||||||||||||||||
| CITNA-B | 01/2019 | USD | 6,132 | COP | 18,500,000 | 403,389 | — | |||||||||||||||||||||
| DEU | 01/2019 | USD | 15,632 | CAD | 20,150 | 300,845 | — | |||||||||||||||||||||
| GSCO-OT | 11/2018 | USD | 725 | CNH | 5,000 | 8,660 | — | |||||||||||||||||||||
| JPM | 01/2019 | USD | 186 | COP | 560,000 | 12,893 | — | |||||||||||||||||||||
50 OPPENHEIMER FUNDAMENTAL ALTERNATIVES FUND
| Forward Currency Exchange Contracts (Continued) | ||||||||||||||||||||||||||||
Counter -party | Settlement Month(s) | Currency Purchased (000’s) | Currency Sold (000’s) | Unrealized Appreciation | Unrealized Depreciation | |||||||||||||||||||||||
| JPM | 01/2019 | USD | 1,160 | EUR | 1,000 | $ | 18,949 | $ | — | |||||||||||||||||||
| Total Unrealized Appreciation and Depreciation |
| $ | 1,513,863 | $ | — | |||||||||||||||||||||||
| Futures Contracts as of October 31, 2018 | ||||||||||||||||||
| Description | Buy/Sell | Expiration Date | Number of Contracts | Notional Amount (000’s) | Value | Unrealized Appreciation/ (Depreciation) | ||||||||||||
| Euro-BONO | Sell | 12/6/18 | 91 | EUR 14,978 | $ | 14,868,013 | $ | 109,521 | ||||||||||
| Euro-BTP | Sell | 12/6/18 | 228 | EUR 32,105 | 31,412,823 | 691,790 | ||||||||||||
| Euro-BUND | Buy | 12/6/18 | 315 | EUR 57,008 | 57,178,321 | 170,054 | ||||||||||||
| Euro-OAT | Sell | 12/6/18 | 90 | EUR 15,497 | 15,490,574 | 6,015 | ||||||||||||
| S&P MID 400 E-Mini Index | Buy | 12/21/18 | 167 | USD 34,285 | 30,474,160 | (3,810,359 | ) | |||||||||||
| United States Treasury Nts., 2 yr. | Sell | 12/31/18 | 63 | USD 13,309 | 13,271,344 | 37,889 | ||||||||||||
| $ | (2,795,090 | ) | ||||||||||||||||
| Centrally Cleared Credit Default Swaps at October 31, 2018 |
| |||||||||||||||||||||||||||
| Reference Asset | Buy/Sell Protection | Fixed Rate | Maturity Date | Notional Amount (000’s) | Premiums Received/ (Paid) | Value | Unrealized Appreciation/ (Depreciation) | |||||||||||||||||||||
| CDX.HY 30 | Buy | 5.000% | 6/20/23 | USD 850 | $ | 64,680 | $ | (56,704 | ) | $ | 7,976 | |||||||||||||||||
| CDX.HY.29 | Buy | 5.000 | 12/20/22 | USD 900 | 61,065 | (61,588 | ) | (523 | ) | |||||||||||||||||||
| CDX.HY.30 | Buy | 5.000 | 6/20/23 | USD 18,700 | 1,272,016 | (1,247,481 | ) | 24,535 | ||||||||||||||||||||
| CDX.IG.30 | Sell | 1.000 | 6/20/23 | USD 53,750 | (955,869 | ) | 927,400 | (28,469 | ) | |||||||||||||||||||
| CDX.IG.30 | Sell | 1.000 | 6/20/23 | USD 5,250 | (93,792 | ) | 90,583 | (3,209 | ) | |||||||||||||||||||
| CDX.IG.31 | Sell | 1.000 | 12/20/23 | USD 2,200 | (42,299 | ) | 35,551 | (6,748 | ) | |||||||||||||||||||
| Federation of Malaysia | Buy | 1.000 | 6/20/23 | USD 1,600 | 22,355 | (84 | ) | 22,271 | ||||||||||||||||||||
| Federation of Malaysia | Buy | 1.000 | 12/20/22 | USD 1,020 | 20,661 | (5,358 | ) | 15,303 | ||||||||||||||||||||
| Federation of Malaysia | Buy | 1.000 | 12/20/23 | USD 1,200 | 3,533 | 5,997 | 9,530 | |||||||||||||||||||||
| iTraxx.Main.27 | Buy | 1.000 | 6/20/22 | EUR 890 | 21,902 | (21,040 | ) | 862 | ||||||||||||||||||||
| iTraxx.Main.27 | Buy | 1.000 | 6/20/22 | EUR 46,010 | 979,105 | (1,087,672 | ) | (108,567 | ) | |||||||||||||||||||
| iTraxx.Main.28 | Buy | 1.000 | 12/20/22 | EUR 1,800 | 52,533 | (39,703 | ) | 12,830 | ||||||||||||||||||||
| iTraxx.Main.29 | Buy | 1.000 | 6/20/23 | EUR 3,100 | 59,083 | (61,549 | ) | (2,466 | ) | |||||||||||||||||||
| iTraxx.Main.30 | Buy | 1.000 | 12/20/23 | EUR 1,450 | 22,281 | (23,417 | ) | (1,136 | ) | |||||||||||||||||||
| The Neiman Marcus Group LLC | Buy | 5.000 | 12/20/20 | USD 6,190 | 358,683 | 1,086,362 | 1,445,045 | |||||||||||||||||||||
| Total Centrally Cleared Credit Default Swaps |
| $ | 1,845,937 | $ | (458,703 | ) | $ | 1,387,234 | ||||||||||||||||||||
| Over-the-Counter Credit Default Swaps at October 31, 2018 |
| |||||||||||||||||||||||||||||||
Reference Asset | Counter- party | Buy/Sell Protection | Fixed Rate | Maturity Date | Notional Amount (000’s) | Premiums Received/ (Paid) | Value | Unrealized Appreciation/ (Depreciation) | ||||||||||||||||||||||||
| CDX.NA.HY.21 | CITNA-B | Buy | 5.000 | 12/20/18 | USD 1,407 | $ | 74,649 | $ | (17,635 | ) | $ | 57,014 | ||||||||||||||||||||
51 OPPENHEIMER FUNDAMENTAL ALTERNATIVES FUND
CONSOLIDATED STATEMENT OF INVESTMENTS Continued
| Over-the-Counter Credit Default Swaps (Continued) |
| |||||||||||||||||||||||||||||||
Reference Asset | Counter- party | Buy/Sell Protection | Fixed Rate | Maturity Date | Notional Amount (000’s) | Premiums Received/ (Paid) | Value | Unrealized Appreciation/ (Depreciation) | ||||||||||||||||||||||||
| CDX.HY.25 | CITNA-B | Buy | 5.000% | 12/20/20 | USD 936 | $ | (109,330 | ) | $ | (90,566 | ) | $ | (199,896 | ) | ||||||||||||||||||
| CDX.HY.25 | CITNA-B | Buy | 5.000 | 12/20/20 | USD 471 | (48,278 | ) | (45,574 | ) | (93,852 | ) | |||||||||||||||||||||
| CDX.HY.25 | CITNA-B | Sell | 5.000 | 12/20/20 | USD 124 | 76,899 | (25,794 | ) | 51,105 | |||||||||||||||||||||||
| CDX.HY.25 | CITNA-B | Sell | 5.000 | 12/20/18 | USD 378 | 143,791 | 991 | 144,782 | ||||||||||||||||||||||||
| CDX.HY.25 | CITNA-B | Sell | 5.000 | 12/20/20 | USD 246 | 160,041 | (51,261 | ) | 108,780 | |||||||||||||||||||||||
| CDX.NA.HY.21 | CITNA-B | Buy | 5.000 | 12/20/18 | USD 7,500 | (230,208 | ) | (94,000 | ) | (324,208 | ) | |||||||||||||||||||||
| CDX.NA.HY.21 | CITNA-B | Sell | 5.000 | 12/20/18 | USD 1,543 | 861,248 | 4,048 | 865,296 | ||||||||||||||||||||||||
| CDX.NA.HY.21 | GSCOI | Sell | 5.000 | 12/20/18 | USD 469 | 256,347 | 1,230 | 257,577 | ||||||||||||||||||||||||
| CDX.NA.HY.25 | GSCOI | Buy | 5.000 | 12/20/20 | USD 7,500 | (1,297,917 | ) | (725,690 | ) | (2,023,607 | ) | |||||||||||||||||||||
| CDX.NA.HY.25 | GSCOI | Sell | 5.000 | 12/20/20 | USD 1,975 | 1,310,769 | (410,742 | ) | 900,027 | |||||||||||||||||||||||
| Federation of Malaysia | BAC | Buy | 1.000 | 12/20/20 | USD 2,900 | (136,197 | ) | (38,279 | ) | (174,476 | ) | |||||||||||||||||||||
| Federation of Malaysia | BAC | Buy | 1.000 | 12/20/20 | USD 854 | (35,262 | ) | (11,273 | ) | (46,535 | ) | |||||||||||||||||||||
| Federation of Malaysia | BNP | Buy | 1.000 | 12/20/20 | USD 761 | (26,351 | ) | (10,045 | ) | (36,396 | ) | |||||||||||||||||||||
| Federation of Malaysia | BNP | Buy | 1.000 | 6/20/21 | USD 3,820 | (112,656 | ) | (47,147 | ) | (159,803 | ) | |||||||||||||||||||||
| Federation of Malaysia | BNP | Buy | 1.000 | 6/20/21 | USD 3,000 | (85,450 | ) | (37,026 | ) | (122,476 | ) | |||||||||||||||||||||
| Federation of Malaysia | BNP | Buy | 1.000 | 12/20/20 | USD 10,000 | (651,135 | ) | (131,996 | ) | (783,131 | ) | |||||||||||||||||||||
| Federation of Malaysia | BNP | Buy | 1.000 | 12/20/20 | USD 1,811 | (51,082 | ) | (23,904 | ) | (74,986 | ) | |||||||||||||||||||||
| Federation of Malaysia | CITNA-B | Buy | 1.000 | 12/20/20 | USD 4,295 | (209,624 | ) | (56,692 | ) | (266,316 | ) | |||||||||||||||||||||
| Federation of Malaysia | MOS-A | Buy | 1.000 | 12/20/20 | USD 10,000 | (502,319 | ) | (131,996 | ) | (634,315 | ) | |||||||||||||||||||||
|
|
| ||||||||||||||||||||||||||||||
| Total Over-the-Counter Credit Default Swaps |
| $ | (612,065 | ) | $ | (1,943,351 | ) | $ | (2,555,416 | ) | ||||||||||||||||||||||
|
|
| ||||||||||||||||||||||||||||||
Type of Reference Asset on which the Fund Sold Protection | Total Maximum Potential Payments for Selling Credit Protection (Undiscounted) | Amount Recoverable* | Reference Asset Rating Range** | |||||||||
| Investment Grade Corporate Debt | $61,200,000 | $— | BBB+ | |||||||||
| Indexes | ||||||||||||
| Non-Investment Grade Corporate Debt | 4,735,179 | 17,814,000 | BB | |||||||||
| Indexes | ||||||||||||
|
|
| ||||||||||
| Total | $65,935,179 | $17,814,000 | ||||||||||
|
|
| ||||||||||
*Amounts recoverable includes potential payments from related purchased protection for instances where the Fund is the seller of protection. In addition, the Fund has no recourse provisions under the credit derivatives and holds no collateral which can offset or reduce potential payments under a triggering event.
** The period end reference asset security ratings, as rated by any rating organization, are included in the equivalent Standard & Poor’s rating category. The reference asset rating represents the likelihood of a potential credit event on the reference asset which would result in a related payment by the Fund.
52 OPPENHEIMER FUNDAMENTAL ALTERNATIVES FUND
| Over-the-Counter Total Return Swaps at October 31, 2018 |
| |||||||||||||||||||||||||||
| Reference Asset | Counter- party | Pay/Receive Total Return* | Floating Rate | Maturity Date | Notional Amount (000’s) | Value | Unrealized Appreciation/ (Depreciation) | |||||||||||||||||||||
| 0998.HK-China Citic Bank Corp. | GSCOI | Pay | | One-Month HKD-HIBOR-HKAB minus 50 basis points |
| 5/24/19 | HKD 955 | $ | 2,538 | $ | 2,538 | |||||||||||||||||
| 0998.HK-China Citic Bank Corp. | GSCOI | Pay | | One-Month HKD-HIBOR-HKAB minus 50 basis points |
| 5/24/19 | HKD 38,855 | 493,616 | 493,616 | |||||||||||||||||||
| 1988.HK China Minsheng Banking Corp. Ltd. | GSCOI | Pay | | One-Month HKD-HIBOR-HKAB minus 50 basis points |
| 5/24/19 | HKD 957 | (1,670 | ) | (1,670 | ) | |||||||||||||||||
| 1988.HK China Minsheng Banking Corp. Ltd. | GSCOI | Pay | | One-Month HKD-HIBOR-HKAB minus 50 basis points |
| 5/24/19 | HKD 39,530 | 284,765 | 284,765 | |||||||||||||||||||
| 3328.HK Bank of Communications- HK BR | GSCOI | Pay | | One-Month HKD-HIBOR-HKAB minus 50 basis points |
| 5/24/19 | HKD 39,432 | 150,608 | 150,608 | |||||||||||||||||||
| 3328.HK Bank of Communications- HK BR | GSCOI | Pay | | One-Month HKD-HIBOR-HKAB minus 50 basis |
| 5/24/19 | HKD 952 | (2,922 | ) | (2,922 | ) | |||||||||||||||||
| 3968.HK China Merchants Bank | GSCOI | Pay | | One-Month HKD-HIBOR-HKAB minus 50 basis points |
| 5/24/19 | HKD 950 | 5,761 | 5,761 | |||||||||||||||||||
| 3968.HK China Merchants Bank | GSCOI | Pay | | One-Month HKD-HIBOR-HKAB minus 50 basis points |
| 5/24/19 | HKD 39,829 | 495,890 | 495,890 | |||||||||||||||||||
| 6818.HK China Everbriight Bank | GSCOI | Pay | | One-Month HKD-HIBOR-HKAB minus 50 basis points |
| 5/24/19 | HKD 19,640 | 200,763 | 200,763 | |||||||||||||||||||
| 6818.HK China Everbriight Bank | GSCOI | Pay | | One-Month HKD-HIBOR-HKAB minus 50 basis points |
| 5/24/19 | HKD 956 | 526 | 526 | |||||||||||||||||||
| Total Over-the-Counter Total Return Swaps |
| $ | 1,629,875 | $ | 1,629,875 | |||||||||||||||||||||||
* Fund will pay or receive the total return of the reference asset depending on whether the return is positive or negative. For contracts where the Fund has elected to receive the total return of the reference asset if positive, it will be responsible for paying the floating rate and the total return of the reference asset if negative. If the Fund has elected to pay the total return of the reference asset if positive, it will receive the floating rate and the total return of the reference asset if negative.
53 OPPENHEIMER FUNDAMENTAL ALTERNATIVES FUND
CONSOLIDATED STATEMENT OF INVESTMENTS Continued
| Glossary: | ||
Counterparty Abbreviations | ||
BAC | Barclays Bank plc | |
| BNP | BNP Paribas | |
| BOA | Bank of America NA | |
| CITNA-B | Citibank NA | |
| DEU | Deutsche Bank AG | |
| GSCOI | Goldman Sachs International | |
| GSCO-OT | Goldman Sachs Bank USA | |
| JPM | JPMorgan Chase Bank NA | |
| MOS-A | Morgan Stanley | |
| MSCO | Morgan Stanley Capital Services, Inc. | |
Currency abbreviations indicate amounts reporting in currencies | ||
CAD | Canadian Dollar | |
| CNH | Offshore Chinese Renminbi | |
| COP | Colombian Peso | |
| EUR | Euro | |
| HKD | Hong Kong Dollar | |
| JPY | Japanese Yen | |
| THB | Thailand Baht | |
Definitions | ||
BBA LIBOR | British Bankers’ Association London - Interbank Offered Rate | |
| BONO | Spanish Government Bonds | |
| BTP | Italian Treasury Bonds | |
| BUND | German Federal Obligation | |
| CDX.HY.25 | Markit CDX High Yield Index | |
| CDX.HY.29 | Markit CDX High Yield Index | |
| CDX.HY.30 | Markit CDX High Yield Index | |
| CDX.HY.31 | Markit CDX High Yield Index | |
| CDX.NA.HY.21 | Markit CDX North American High Yield | |
| CDX.NA.HY.25 | Markit CDX North American High Yield | |
| EUR003M | EURIBOR 3 Month ACT/360 | |
| HIBOR | Hong Kong Interbank Offered Rate | |
| HKAB | Hong Kong Association of Banks | |
| ICE LIBOR | Intercontinental Exchange Benchmark Administration-London Interbank Offered Rate | |
| iTraxx.Main.27 | Credit Default Swap Trading Index for a Specific Basket of Securities | |
| iTraxx.Main.28 | Credit Default Swap Trading Index for a Specific Basket of Securities | |
| iTraxx.Main.29 | Credit Default Swap Trading Index for a Specific Basket of Securities | |
| iTraxx.Main.30 | Credit Default Swap Trading Index for a Specific Basket of Securities | |
| LIBOR03M | ICE LIBOR USD 3 Month | |
| LIBOR4 | London Interbank Offered Rate-Quarterly | |
| LIBOR6 | London Interbank Offered Rate-Bi-Monthly | |
| LIBOR12 | London Interbank Offered Rate-Monthly | |
| LIBOR52 | London Interbank Offered Rate-Weekly | |
| OAT | French Government Bonds | |
| S&P | Standard & Poor’s | |
| T-BILL 3MO | US Treasury Bill 3 Month | |
| US0001M | ICE LIBOR USD 1 Month | |
| US0003M | ICE LIBOR USD 3 Month | |
54 OPPENHEIMER FUNDAMENTAL ALTERNATIVES FUND
| Definitions (Continued) | ||
US0006M | ICE LIBOR USD 6 Month | |
See accompanying Notes to Consolidated Financial Statements.
55 OPPENHEIMER FUNDAMENTAL ALTERNATIVES FUND
ASSETS AND LIABILITIES October 31, 2018
| Assets |
| |||
| Investments, at value—see accompanying consolidated statement of investments: | ||||
| Unaffiliated companies (cost $983,609,313) | $ | 1,107,867,988 | ||
| Affiliated companies (cost $25,629,491) | 25,378,466 | |||
|
|
| ||
| 1,133,246,454 | ||||
| Cash | 1,487,926 | |||
| Cash used for collateral on futures | 2,838,800 | |||
| Cash used for collateral on OTC derivatives | 520,000 | |||
| Cash used for collateral on centrally cleared swaps | 2,511,623 | |||
| Deposits with broker for securities sold short | 361,730,791 | |||
| Deposits with broker for foreign securities sold short (cost 46,387,385) | 44,842,195 | |||
| Unrealized appreciation on forward currency exchange contracts | 1,513,863 | |||
| Swaps, at value (premiums received $1,261,386) | 1,640,736 | |||
| Centrally cleared swaps, at value (net premiums paid $729,744) | 2,145,893 | |||
| Receivables and other assets: | ||||
| Interest and dividends | 2,900,591 | |||
| Investments sold (including $936,912 sold on a when-issued or delayed delivery basis) | 1,189,195 | |||
| Shares of beneficial interest sold | 1,083,850 | |||
| Variation margin receivable | 105,186 | |||
| Other | 148,980 | |||
|
|
| ||
| Total assets | 1,557,906,083 | |||
| Liabilities |
| |||
| Securities sold short, at value (proceeds $404,823,238)—see accompanying consolidated statement of investments | 385,084,452 | |||
| Swaps, at value (net premiums paid $1,873,451) | 1,954,212 | |||
| Centrally cleared swaps, at value (premiums received $2,575,681) | 2,604,596 | |||
| Payables and other liabilities: | ||||
| Investments purchased on a when-issued or delayed delivery basis | 11,421,425 | |||
| Shares of beneficial interest redeemed | 4,293,552 | |||
| Dividends | 608,463 | |||
| Variation margin payable | 194,192 | |||
| Trustees’ compensation | 164,144 | |||
| Distribution and service plan fees | 125,834 | |||
| Shareholder communications | 28,149 | |||
| Other | 535,763 | |||
|
|
| ||
| Total liabilities | 407,014,782 | |||
| Net Assets | $ | 1,150,891,301 | ||
|
|
| ||
| Composition of Net Assets |
| |||
| Par value of shares of beneficial interest | $ | 419,286 | ||
| Additional paid-in capital | 1,077,231,745 | |||
| Total distributable earnings | 73,240,270 | |||
|
|
| ||
| Net Assets | $ | 1,150,891,301 | ||
|
|
| ||
56 OPPENHEIMER FUNDAMENTAL ALTERNATIVES FUND
| Net Asset Value Per Share | ||
| Class A Shares: | ||
| Net asset value and redemption price per share (based on net assets of $477,683,126 and 17,420,247 shares of beneficial interest outstanding) | $27.42 | |
| Maximum offering price per share (net asset value plus sales charge of 5.75% of offering price) | $29.09 | |
| Class C Shares: | ||
| Net asset value, redemption price (excludes applicable contingent deferred sales charge) and offering price per share (based on net assets of $89,319,146 and 3,695,133 shares of beneficial interest outstanding) | $24.17 | |
| Class I Shares: | ||
| Net asset value, redemption price and offering price per share (based on net assets of $211,904,278 and 7,512,136 shares of beneficial interest outstanding) | $28.21 | |
| Class R Shares: | ||
| Net asset value, redemption price (excludes applicable contingent deferred sales charge) and offering price per share (based on net assets of $19,426,185 and 741,920 shares of beneficial interest outstanding) | $26.18 | |
| Class Y Shares: | ||
| Net asset value, redemption price and offering price per share (based on net assets of $352,558,566 and 12,559,150 shares of beneficial interest outstanding) | $28.07 | |
See accompanying Notes to Consolidated Financial Statements.
57 OPPENHEIMER FUNDAMENTAL ALTERNATIVES FUND
OPERATIONS For the Year Ended October 31, 2018
| Investment Income |
| |||
| Interest | $ | 26,139,155 | ||
| Dividends: | ||||
| Unaffiliated companies (net of foreign withholding taxes of $296,988) | 17,549,617 | |||
| Affiliated companies | 406,194 | |||
| Other income affiliated companies | 434 | |||
|
|
| ||
| Total investment income | 44,095,400 | |||
| Expenses |
| |||
| Management fees | 10,597,108 | |||
| Distribution and service plan fees: | ||||
| Class A | 1,228,674 | |||
| Class B1 | 6,973 | |||
| Class C | 991,650 | |||
| Class R | 100,448 | |||
| Transfer and shareholder servicing agent fees: | ||||
| Class A | 1,028,085 | |||
| Class B1 | 1,468 | |||
| Class C | 198,901 | |||
| Class I | 62,843 | |||
| Class R | 40,518 | |||
| Class Y | 744,384 | |||
| Shareholder communications: | ||||
| Class A | 4,684 | |||
| Class B1 | 609 | |||
| Class C | 13,066 | |||
| Class I | 10,401 | |||
| Class R | 3,088 | |||
| Class Y | 39,412 | |||
| Dividends on short sales | 6,660,702 | |||
| Financing expense from short sales | 1,051,592 | |||
| Custodian fees and expenses | 209,220 | |||
| Borrowing fees | 41,805 | |||
| Trustees’ compensation | 31,311 | |||
| Other | 283,004 | |||
|
|
| ||
| Total expenses | 23,349,946 | |||
| Less reduction to custodian expenses | (1,881 | ) | ||
| Less waivers and reimbursements of expenses | (399,618 | ) | ||
|
|
| ||
| Net expenses | 22,948,447 | |||
| Net Investment Income | 21,146,953 | |||
58 OPPENHEIMER FUNDAMENTAL ALTERNATIVES FUND
| Realized and Unrealized Gain (Loss) | ||||
| Net realized gain (loss) on: | ||||
| Investment transactions in unaffiliated companies | $ | 54,246,301 | ||
| Option contracts written | 693,680 | |||
| Futures contracts | 2,671,263 | |||
| Foreign currency transactions | 2,523,270 | |||
| Forward currency exchange contracts | (865,639 | ) | ||
| Short positions | (43,812,790 | ) | ||
| Swap contracts | (6,799,430 | ) | ||
|
|
| ||
| Net realized gain | 8,656,655 | |||
| Net change in unrealized appreciation/(depreciation) on: | ||||
| Investment transactions in: | ||||
| Unaffiliated companies | (45,365,579 | ) | ||
| Affiliated companies | (316,110 | ) | ||
| Translation of assets and liabilities denominated in foreign currencies | (3,109,142 | ) | ||
| Forward currency exchange contracts | 473,975 | |||
| Futures contracts | (1,903,533 | ) | ||
| Option contracts written | (693,680 | ) | ||
| Short positions | 44,103,814 | |||
| Swap contracts | 5,546,516 | |||
|
|
| ||
| Net change in unrealized appreciation/(depreciation) | (1,263,739 | ) | ||
Net Increase in Net Assets Resulting from Operations | $ | 28,539,869 | ||
|
|
|
1. Effective June 1, 2018, all Class B shares converted to Class A shares.
See accompanying Notes to Consolidated Financial Statements.
59 OPPENHEIMER FUNDAMENTAL ALTERNATIVES FUND
CONSOLIDATED STATEMENTS OF CHANGES IN NET ASSETS
Year Ended October 31, 2018 | Year Ended October 31, 20171 | |||||||
| Operations | ||||||||
| Net investment income | $ | 21,146,953 | $ | 18,601,526 | ||||
| Net realized gain (loss) | 8,656,655 | (73,902,086 | ) | |||||
| Net change in unrealized appreciation/(depreciation) | (1,263,739 | ) | 79,014,846 | |||||
|
|
| ||||||
| Net increase in net assets resulting from operations | 28,539,869 | 23,714,286 | ||||||
| Dividends and/or Distributions to Shareholders | ||||||||
| Dividends and distributions declared: | ||||||||
| Class A | (8,619,504 | ) | (1,722,321 | ) | ||||
| Class B2 | — | (12,416 | ) | |||||
| Class C | (1,068,693 | ) | (273,777 | ) | ||||
| Class I | (3,035,922 | ) | (985,054 | ) | ||||
| Class R | (295,899 | ) | (44,000 | ) | ||||
| Class Y | (6,980,245 | ) | (2,169,190 | ) | ||||
|
|
| ||||||
| Total dividends and distributions declared | (20,000,263 | ) | (5,206,758 | ) | ||||
| Beneficial Interest Transactions | ||||||||
| Net increase (decrease) in net assets resulting from beneficial interest transactions: | ||||||||
| Class A | (85,618,998 | ) | (125,165,191 | ) | ||||
| Class B2 | (2,572,522 | ) | (4,833,789 | ) | ||||
| Class C | (21,720,741 | ) | (29,837,699 | ) | ||||
| Class I | 57,843,679 | 18,932,679 | ||||||
| Class R | (1,748,886 | ) | 235,487 | |||||
| Class Y | (55,369,454 | ) | 1,358,274 | |||||
|
|
| ||||||
| Total beneficial interest transactions | (109,186,922 | ) | (139,310,239 | ) | ||||
| Net Assets | ||||||||
| Total decrease | (100,647,316 | ) | (120,802,711 | ) | ||||
| Beginning of period | 1,251,538,617 | 1,372,341,328 | ||||||
|
|
| ||||||
| End of period | $ | 1,150,891,301 | $ | 1,251,538,617 | ||||
|
|
| ||||||
1. Prior period amounts have been conformed to current year presentation. See Notes to Consolidated Financial Statements, Note 2– New Accounting Pronouncements for further details.
2. Effective June 1, 2018, all Class B shares converted to Class A shares.
See accompanying Notes to Consolidated Financial Statements.
60 OPPENHEIMER FUNDAMENTAL ALTERNATIVES FUND
CONSOLIDATED FINANCIAL HIGHLIGHTS
| Class A | Year Ended October 31, 2018 | Year Ended October 31, 2017 | Year Ended October 31, 2016 | Year Ended October 30, 20151 | Year Ended October 31, 2014 | |||||||||||||||
| Per Share Operating Data | ||||||||||||||||||||
| Net asset value, beginning of period | $27.21 | $26.81 | $27.00 | $26.64 | $24.48 | |||||||||||||||
| Income (loss) from investment operations: | ||||||||||||||||||||
| Net investment income2 | 0.45 | 0.38 | 0.27 | 0.30 | 0.29 | |||||||||||||||
| Net realized and unrealized gain (loss) | 0.19 | 0.09 | (0.32) | 0.53 | 1.87 | |||||||||||||||
| Total from investment operations | 0.64 | 0.47 | (0.05) | 0.83 | 2.16 | |||||||||||||||
| Dividends and/or distributions to shareholders: | ||||||||||||||||||||
| Dividends from net investment income | (0.43) | (0.07) | (0.14) | (0.47) | 0.00 | |||||||||||||||
| Net asset value, end of period | $27.42 | $27.21 | $26.81 | $27.00 | $26.64 | |||||||||||||||
| Total Return, at Net Asset Value3 | 2.34 | % | 1.79 | % | (0.18 | )% | 3.18 | % | 8.82 | % | ||||||||||
| Ratios/Supplemental Data |
| |||||||||||||||||||
| Net assets, end of period (in thousands) | $477,683 | $560,359 | $675,558 | $642,670 | $642,789 | |||||||||||||||
| Average net assets (in thousands) | $515,118 | $620,775 | $679,471 | $636,510 | $662,351 | |||||||||||||||
| Ratios to average net assets:4 | ||||||||||||||||||||
| Net investment income | 1.67% | 1.39% | 1.02%5 | 1.14%5 | 1.12%5 | |||||||||||||||
| Expenses excluding specific expenses listed below | 1.35% | 1.36% | 1.35%5 | 1.39%5 | 1.42%5 | |||||||||||||||
| Dividends and/or interest expense on securities sold short | 0.55% | 0.39% | 0.59% | 0.60% | 0.55% | |||||||||||||||
| Borrowing expenses on securities sold short | 0.09% | 0.01% | 0.09% | 0.18% | 0.42% | |||||||||||||||
| Interest and fees from borrowings | 0.00%6 | 0.00%6 | 0.00%6 | 0.00%6 | 0.00% | |||||||||||||||
| Total expenses7 | 1.99% | 1.76% | 2.03%5 | 2.17%5 | 2.39%5 | |||||||||||||||
| Expenses after payments, waivers and/or reimbursements and reduction to custodian expenses | 1.96% | 1.72% | 1.99%5 | 2.12%5 | 2.25%5 | |||||||||||||||
| Portfolio turnover rate | 155% | 168% | 131% | 62% | 44% | |||||||||||||||
61 OPPENHEIMER FUNDAMENTAL ALTERNATIVES FUND
CONSOLIDATED FINANCIAL HIGHLIGHTS Continued
1. Represents the last business day of the Fund’s reporting period.
2. Per share amounts calculated based on the average shares outstanding during the period.
3. Assumes an initial investment on the business day before the first day of the fiscal period, with all dividends and distributions reinvested in additional shares on the reinvestment date, and redemption at the net asset value calculated on the last business day of the fiscal period. Sales charges are not reflected in the total returns. Total returns are not annualized for periods less than one full year. Returns do not reflect the deduction of taxes that a shareholder would pay on fund distributions or the redemption of fund shares.
4. Annualized for periods less than one full year.
5. Includes the Fund’s share of the allocated expenses and/or net investment income from Oppenheimer Master Loan Fund, LLC.
6. Less than 0.005%.
7. Total expenses including indirect expenses from affiliated fund fees and expenses were as follows:
| Year Ended October 31, 2018 | 1.99 | % | ||||
| Year Ended October 31, 2017 | 1.76 | % | ||||
| Year Ended October 31, 2016 | 2.05 | % | ||||
| Year Ended October 30, 2015 | 2.18 | % | ||||
| Year Ended October 31, 2014 | 2.40 | % |
See accompanying Notes to Consolidated Financial Statements.
62 OPPENHEIMER FUNDAMENTAL ALTERNATIVES FUND
| Class C | Year Ended October 31, 2018 | Year Ended October 31, 2017 | Year Ended October 31, 2016 | Year Ended October 30, 20151 | Year Ended October 31, 2014 | |||||||||||||||
| Per Share Operating Data |
| |||||||||||||||||||
| Net asset value, beginning of period | $24.03 | $23.85 | $24.15 | $23.89 | $22.12 | |||||||||||||||
| Income (loss) from investment operations: | ||||||||||||||||||||
| Net investment income2 | 0.22 | 0.15 | 0.06 | 0.09 | 0.08 | |||||||||||||||
| Net realized and unrealized gain (loss) | 0.16 | 0.08 | (0.28) | 0.47 | 1.69 | |||||||||||||||
| Total from investment operations | 0.38 | 0.23 | (0.22) | 0.56 | 1.77 | |||||||||||||||
| Dividends and/or distributions to shareholders: | ||||||||||||||||||||
| Dividends from net investment income | (0.24) | (0.05) | (0.08) | (0.30) | 0.00 | |||||||||||||||
| Net asset value, end of period | $24.17 | $24.03 | $23.85 | $24.15 | $23.89 | |||||||||||||||
| Total Return, at Net Asset Value3 | 1.59 | % | 0.96 | % | (0.91 | )% | 2.39 | % | 8.00 | % | ||||||||||
| Ratios/Supplemental Data | ||||||||||||||||||||
| Net assets, end of period (in thousands) | $89,319 | $110,630 | $139,374 | $117,152 | $110,383 | |||||||||||||||
| Average net assets (in thousands) | $99,593 | $123,884 | $136,400 | $111,050 | $112,984 | |||||||||||||||
| Ratios to average net assets:4 | ||||||||||||||||||||
| Net investment income | 0.90% | 0.62% | 0.25%5 | 0.38%5 | 0.36%5 | |||||||||||||||
| Expenses excluding specific expenses listed below | 2.11% | 2.13% | 2.11%5 | 2.14%5 | 2.19%5 | |||||||||||||||
| Dividends and/or interest expense on securities sold short | 0.55% | 0.39% | 0.59% | 0.60% | 0.55% | |||||||||||||||
| Borrowing expenses on securities sold short | 0.09% | 0.01% | 0.09% | 0.18% | 0.42% | |||||||||||||||
| Interest and fees from borrowings | | 0.00%6 | | 0.00%6 | 0.00%6 | 0.00%6 | 0.00% | |||||||||||||
| Total expenses7 | 2.75% | 2.53% | 2.79%5 | 2.92%5 | 3.16%5 | |||||||||||||||
| Expenses after payments, waivers and/or reimbursements and reduction to custodian expenses | 2.72% | 2.49% | 2.75%5 | 2.87%5 | 3.02%5 | |||||||||||||||
| Portfolio turnover rate | 155% | 168% | 131% | 62% | 44% | |||||||||||||||
63 OPPENHEIMER FUNDAMENTAL ALTERNATIVES FUND
CONSOLIDATED FINANCIAL HIGHLIGHTS Continued
1. Represents the last business day of the Fund’s reporting period.
2. Per share amounts calculated based on the average shares outstanding during the period.
3. Assumes an initial investment on the business day before the first day of the fiscal period, with all dividends and distributions reinvested in additional shares on the reinvestment date, and redemption at the net asset value calculated on the last business day of the fiscal period. Sales charges are not reflected in the total returns. Total returns are not annualized for periods less than one full year. Returns do not reflect the deduction of taxes that a shareholder would pay on fund distributions or the redemption of fund shares.
4. Annualized for periods less than one full year.
5. Includes the Fund’s share of the allocated expenses and/or net investment income from Oppenheimer Master Loan Fund, LLC.
6. Less than 0.005%.
7. Total expenses including indirect expenses from affiliated fund fees and expenses were as follows:
| Year Ended October 31, 2018 | 2.75 | % | ||||
| Year Ended October 31, 2017 | 2.53 | % | ||||
| Year Ended October 31, 2016 | 2.81 | % | ||||
| Year Ended October 30, 2015 | 2.93 | % | ||||
| Year Ended October 31, 2014 | 3.17 | % |
See accompanying Notes to Consolidated Financial Statements.
64 OPPENHEIMER FUNDAMENTAL ALTERNATIVES FUND
| Class I | Year Ended October 31, 2018 | Year Ended October 31, 2017 | Year Ended October 31, 2016 | Year Ended October 30, 20151 | Year Ended October 31, 2014 | |||||
| Per Share Operating Data | ||||||||||
| Net asset value, beginning of period | $28.00 | $27.60 | $27.79 | $27.41 | $25.09 | |||||
| Income (loss) from investment operations: | ||||||||||
| Net investment income2 | 0.57 | 0.50 | 0.37 | 0.28 | 0.42 | |||||
| Net realized and unrealized gain (loss) | 0.19 | 0.10 | (0.29) | 0.69 | 1.90 | |||||
| Total from investment operations | 0.76 | 0.60 | 0.08 | 0.97 | 2.32 | |||||
| Dividends and/or distributions to shareholders: | ||||||||||
| Dividends from net investment income | (0.55) | (0.20) | (0.27) | (0.59) | 0.00 | |||||
| Net asset value, end of period | $28.21 | $28.00 | $27.60 | $27.79 | $27.41 | |||||
| Total Return, at Net Asset Value3 | 2.77% | 2.18% | 0.29% | 3.62% | 9.25% | |||||
| Ratios/Supplemental Data | ||||||||||
| Net assets, end of period (in thousands) | $211,904 | $151,697 | $130,790 | $59,214 | $11 | |||||
| Average net assets (in thousands) | $209,624 | $143,209 | $96,611 | $8,550 | $11 | |||||
| Ratios to average net assets:4 | ||||||||||
| Net investment income | 2.05% | 1.80% | 1.35%5 | 1.06%5 | 1.57%5 | |||||
| Expenses excluding specific expenses listed below | 0.97% | 0.92% | 0.97%5 | 0.82%5 | 0.95%5 | |||||
| Dividends and/or interest expense on securities sold short | 0.55% | 0.39% | 0.59% | 0.60% | 0.55% | |||||
| Borrowing expenses on securities sold short | 0.09% | 0.01% | 0.09% | 0.18% | 0.42% | |||||
| Interest and fees from borrowings | 0.00%6 | 0.00%6 | 0.00%6 | 0.00%6 | 0.00% | |||||
| Total expenses7 | 1.61% | 1.32% | 1.65%5 | 1.60%5 | 1.92%5 | |||||
| Expenses after payments, waivers and/or reimbursements and reduction to custodian expenses | 1.58% | 1.29% | 1.61%5 | 1.55%5 | 1.79%5 | |||||
| Portfolio turnover rate | 155% | 168% | 131% | 62% | 44% | |||||
65 OPPENHEIMER FUNDAMENTAL ALTERNATIVES FUND
CONSOLIDATED FINANCIAL HIGHLIGHTS Continued
1. Represents the last business day of the Fund’s reporting period.
2. Per share amounts calculated based on the average shares outstanding during the period.
3. Assumes an initial investment on the business day before the first day of the fiscal period, with all dividends and distributions reinvested in additional shares on the reinvestment date, and redemption at the net asset value calculated on the last business day of the fiscal period. Sales charges are not reflected in the total returns. Total returns are not annualized for periods less than one full year. Returns do not reflect the deduction of taxes that a shareholder would pay on fund distributions or the redemption of fund shares.
4. Annualized for periods less than one full year.
5. Includes the Fund’s share of the allocated expenses and/or net investment income from Oppenheimer Master Loan Fund, LLC.
6. Less than 0.005%.
7. Total expenses including indirect expenses from affiliated fund fees and expenses were as follows:
| Year Ended October 31, 2018 | 1.61 | % | ||||
| Year Ended October 31, 2017 | 1.32 | % | ||||
| Year Ended October 31, 2016 | 1.67 | % | ||||
| Year Ended October 30, 2015 | 1.61 | % | ||||
| Year Ended October 31, 2014 | 1.93 | % |
See accompanying Notes to Consolidated Financial Statements.
66 OPPENHEIMER FUNDAMENTAL ALTERNATIVES FUND
| Class R | Year Ended October 31, 2018 | Year Ended October 31, 2017 | Year Ended October 31, 2016 | Year Ended October 30, 20151 | Year Ended October 31, 2014 | |||||||||||||||
| Per Share Operating Data | ||||||||||||||||||||
| Net asset value, beginning of period | $26.02 | $25.69 | $25.89 | $25.55 | $23.54 | |||||||||||||||
| Income (loss) from investment operations: | ||||||||||||||||||||
| Net investment income2 | 0.36 | 0.29 | 0.19 | 0.22 | 0.21 | |||||||||||||||
| Net realized and unrealized gain (loss) | 0.17 | 0.10 | (0.30) | 0.52 | 1.80 | |||||||||||||||
| Total from investment operations | 0.53 | 0.39 | (0.11) | 0.74 | 2.01 | |||||||||||||||
| Dividends and/or distributions to shareholders: | ||||||||||||||||||||
| Dividends from net investment income | (0.37) | (0.06) | (0.09) | (0.40) | 0.00 | |||||||||||||||
| Net asset value, end of period | $26.18 | $26.02 | $25.69 | $25.89 | $25.55 | |||||||||||||||
| Total Return, at Net Asset Value3 | 2.07% | 1.51% | (0.44)% | 2.92% | 8.54% | |||||||||||||||
| Ratios/Supplemental Data | ||||||||||||||||||||
| Net assets, end of period (in thousands) | $19,426 | $21,058 | $20,567 | $17,141 | $17,302 | |||||||||||||||
| Average net assets (in thousands) | $20,325 | $21,118 | $18,565 | $16,942 | $19,224 | |||||||||||||||
| Ratios to average net assets:4 | ||||||||||||||||||||
| Net investment income | 1.40% | 1.12% | 0.75%5 | 0.85%5 | 0.85%5 | |||||||||||||||
| Expenses excluding specific expenses listed below | 1.62% | 1.62% | 1.62%5 | 1.64%5 | 1.72%5 | |||||||||||||||
| Dividends and/or interest expense on securities sold short | 0.55% | 0.39% | 0.59% | 0.60% | 0.55% | |||||||||||||||
| Borrowing expenses on securities sold short | 0.09% | 0.01% | 0.09% | 0.18% | 0.42% | |||||||||||||||
| Interest and fees from borrowings | 0.00%6 | 0.00%6 | 0.00%6 | 0.00%6 | 0.00% | |||||||||||||||
| Total expenses7 | 2.26% | 2.02% | 2.30%5 | 2.42%5 | 2.69%5 | |||||||||||||||
| Expenses after payments, waivers and/or reimbursements and reduction to custodian expenses | 2.23% | 1.98% | 2.26%5 | 2.37%5 | 2.54%5 | |||||||||||||||
| Portfolio turnover rate | 155% | 168% | 131% | 62% | 44% | |||||||||||||||
67 OPPENHEIMER FUNDAMENTAL ALTERNATIVES FUND
CONSOLIDATED FINANCIAL HIGHLIGHTS Continued
1. Represents the last business day of the Fund’s reporting period.
2. Per share amounts calculated based on the average shares outstanding during the period.
3. Assumes an initial investment on the business day before the first day of the fiscal period, with all dividends and distributions reinvested in additional shares on the reinvestment date, and redemption at the net asset value calculated on the last business day of the fiscal period. Sales charges are not reflected in the total returns. Total returns are not annualized for periods less than one full year. Returns do not reflect the deduction of taxes that a shareholder would pay on fund distributions or the redemption of fund shares.
4. Annualized for periods less than one full year.
5. Includes the Fund’s share of the allocated expenses and/or net investment income from Oppenheimer Master Loan Fund, LLC.
6. Less than 0.005%.
7. Total expenses including indirect expenses from affiliated fund fees and expenses were as follows:
| Year Ended October 31, 2018 | 2.26 | % | ||||
| Year Ended October 31, 2017 | 2.02 | % | ||||
| Year Ended October 31, 2016 | 2.32 | % | ||||
| Year Ended October 30, 2015 | 2.43 | % | ||||
| Year Ended October 31, 2014 | 2.70 | % |
See accompanying Notes to Consolidated Financial Statements.
68 OPPENHEIMER FUNDAMENTAL ALTERNATIVES FUND
| Class Y | Year Ended October 31, 2018 | Year Ended October 31, 2017 | Year Ended October 31, 2016 | Year Ended October 30, 20151 | Year Ended October 31, 2014 | |||||||||||||||
| Per Share Operating Data | ||||||||||||||||||||
| Net asset value, beginning of period | $27.86 | $27.47 | $27.68 | $27.32 | $25.05 | |||||||||||||||
| Income (loss) from investment operations: | ||||||||||||||||||||
| Net investment income2 | 0.52 | 0.45 | 0.32 | 0.31 | 0.34 | |||||||||||||||
| Net realized and unrealized gain (loss) | 0.19 | 0.09 | (0.29) | 0.60 | 1.93 | |||||||||||||||
| Total from investment operations | 0.71 | 0.54 | 0.03 | 0.91 | 2.27 | |||||||||||||||
| Dividends and/or distributions to shareholders: | ||||||||||||||||||||
| Dividends from net investment income | (0.50) | (0.15) | (0.24) | (0.55) | 0.00 | |||||||||||||||
| Net asset value, end of period | $28.07 | $27.86 | $27.47 | $27.68 | $27.32 | |||||||||||||||
| Total Return, at Net Asset Value3 | 2.59% | 1.98% | 0.08% | 3.43% | 9.06% | |||||||||||||||
| Ratios/Supplemental Data | ||||||||||||||||||||
| Net assets, end of period (in thousands) | $352,559 | $405,224 | $398,708 | $87,249 | $19,378 | |||||||||||||||
| Average net assets (in thousands) | $373,135 | $397,699 | $278,002 | $34,589 | $14,096 | |||||||||||||||
| Ratios to average net assets:4 | ||||||||||||||||||||
| Net investment income | 1.90% | 1.61% | 1.16%5 | 1.13%5 | 1.27%5 | |||||||||||||||
| Expenses excluding specific expenses listed below | 1.12% | 1.13% | 1.17%5 | 1.10%5 | 1.78%5 | |||||||||||||||
| Dividends and/or interest expense on securities sold short | 0.55% | 0.39% | 0.59% | 0.60% | 0.55% | |||||||||||||||
| Borrowing expenses on securities sold short | 0.09% | 0.01% | 0.09% | 0.18% | 0.42% | |||||||||||||||
| Interest and fees from borrowings | 0.00%6 | 0.00%6 | 0.00%6 | 0.00%6 | 0.00% | |||||||||||||||
| Total expenses7 | 1.76% | 1.53% | 1.85%5 | 1.88%5 | 2.75%5 | |||||||||||||||
| Expenses after payments, waivers and/or reimbursements and reduction to custodian expenses | 1.73% | 1.49% | 1.81%5 | | 1.83%5 | | | 2.04%5 | | |||||||||||
| Portfolio turnover rate | 155% | 168% | 131% | 62% | 44% | |||||||||||||||
69 OPPENHEIMER FUNDAMENTAL ALTERNATIVES FUND
CONSOLIDATED FINANCIAL HIGHLIGHTS Continued
1. Represents the last business day of the Fund’s reporting period.
2. Per share amounts calculated based on the average shares outstanding during the period.
3. Assumes an initial investment on the business day before the first day of the fiscal period, with all dividends and distributions reinvested in additional shares on the reinvestment date, and redemption at the net asset value calculated on the last business day of the fiscal period. Sales charges are not reflected in the total returns. Total returns are not annualized for periods less than one full year. Returns do not reflect the deduction of taxes that a shareholder would pay on fund distributions or the redemption of fund shares.
4. Annualized for periods less than one full year.
5. Includes the Fund’s share of the allocated expenses and/or net investment income from Oppenheimer Master Loan Fund, LLC.
6. Less than 0.005%.
7. Total expenses including indirect expenses from affiliated fund fees and expenses were as follows:
| Year Ended October 31, 2018 | 1.76 | % | ||||
| Year Ended October 31, 2017 | 1.53 | % | ||||
| Year Ended October 31, 2016 | 1.87 | % | ||||
| Year Ended October 30, 2015 | 1.89 | % | ||||
| Year Ended October 31, 2014 | 2.76 | % |
See accompanying Notes to Consolidated Financial Statements.
70 OPPENHEIMER FUNDAMENTAL ALTERNATIVES FUND
CONSOLIDATED FINANCIAL STATEMENTS October 31, 2018
1. Organization
Oppenheimer Fundamental Alternatives Fund (the “Fund”), a series of Oppenheimer Quest for Value Funds, is registered under the Investment Company Act of 1940 (“1940 Act”), as amended, as a diversified open-end management investment company. The Fund’s investment objective is to seek total return. The Fund’s investment adviser is OFI Global Asset Management, Inc. (“OFI Global” or the “Manager”), a wholly-owned subsidiary of OppenheimerFunds, Inc. (“OFI” or the “Sub-Adviser”). The Manager has entered into a sub-advisory agreement with OFI.
The Fund offers Class A, Class C, Class I, Class R and Class Y shares, and previously offered Class B shares for new purchase through June 29, 2012. Subsequent to that date, no new purchases of Class B shares were permitted. Reinvestment of dividend and/or capital gain distributions and exchanges of Class B shares into and from other Oppenheimer funds were permitted through May 31, 2018. Effective June 1, 2018 (the “Conversion Date”), all Class B shares converted to Class A shares. Class A shares are sold at their offering price, which is normally net asset value plus a front-end sales charge. Class C and Class R shares are sold, and Class B shares were sold, without a front-end sales charge but may be subject to a contingent deferred sales charge (“CDSC”). Class R shares are sold only through retirement plans. Retirement plans that offer Class R shares may impose charges on those accounts. Class I and Class Y shares are sold to certain institutional investors or intermediaries without either a front-end sales charge or a CDSC, however, the intermediaries may impose charges on their accountholders who beneficially own Class I and Class Y shares. All classes of shares have identical rights and voting privileges with respect to the Fund in general and exclusive voting rights on matters that affect that class alone. Earnings, net assets and net asset value per share may differ due to each class having its own expenses, such as transfer and shareholder servicing agent fees and shareholder communications, directly attributable to that class. Class A, C and R shares have, and Class B shares had, separate distribution and/or service plans under which they pay, and Class B shares paid, fees. Class I and Class Y shares do not pay such fees. Previously issued Class B shares automatically converted to Class A shares 72 months after the date of purchase.
The following is a summary of significant accounting policies followed in the Fund’s preparation of financial statements in accordance with accounting principles generally accepted in the United States (“U.S. GAAP”).
2. Significant Accounting Policies
Security Valuation. All investments in securities are recorded at their estimated fair value, as described in Note 3.
Basis for Consolidation. The Fund has established a Cayman Islands exempted company, Oppenheimer Fundamental Alternatives Fund (Cayman) Ltd. (the “Subsidiary”), which is wholly-owned and controlled by the Fund. The Fund and Subsidiary are both managed by the Manager. The Fund may invest up to 25% of its total assets in the Subsidiary. The Subsidiary invests primarily in commodity-linked derivatives (including commodity futures, financial
71 OPPENHEIMER FUNDAMENTAL ALTERNATIVES FUND
NOTES TO
CONSOLIDATED FINANCIAL STATEMENTS Continued
2. Significant Accounting Policies (Continued)
futures, options and swap contracts) and certain fixed-income securities and other investments that may serve as margin or collateral for its derivatives positions. The Fund applies its investment restrictions and compliance policies and procedures, on a look-through basis, to the Subsidiary.
The financial statements have been consolidated and include accounts of the Fund and the Subsidiary. Accordingly, all inter-company transactions and balances have been eliminated. At period end, the Fund owned 14,616 shares with net assets of $40,682,991 in the Subsidiary.
Other financial information at period end:
| Total market value of investments | $ | 40,476,953 | ||
| Net assets | $ | 40,682,991 | ||
| Net income (loss) | $ | (370,958) | ||
| Net realized gain (loss) | $ | — | ||
| Net change in unrealized appreciation/depreciation | $ | (1,963,5714) |
Foreign Currency Translation. The books and records of the Fund are maintained in U.S. dollars. Any foreign currency amounts are translated into U.S. dollars on the following basis:
(1) Value of investment securities, other assets and liabilities — at the exchange rates prevailing at market close as described in Note 3.
(2) Purchases and sales of investment securities, income and expenses — at the rates of exchange prevailing on the respective dates of such transactions.
Although the net assets and the values are presented at the foreign exchange rates at market close, the Fund does not isolate the portion of the results of operations resulting from changes in foreign exchange rates on investments from the fluctuations arising from changes in prices of securities held. Such fluctuations are included with the net realized and unrealized gains or losses from investments shown in the Consolidated Statement of Operations.
For securities, which are subject to foreign withholding tax upon disposition, realized and unrealized gains or losses on such securities are recorded net of foreign withholding tax.
Reported net realized foreign exchange gains or losses arise from sales of foreign currencies, currency gains or losses realized between the trade and settlement dates on securities transactions, the difference between the amounts of dividends, interest, and foreign withholding tax reclaims recorded on the Fund’s books, and the U.S. dollar equivalent of the amounts actually received or paid. Net unrealized foreign exchange gains and losses arise from changes in the value of assets and liabilities other than investments in securities, resulting from changes in the exchange rate.
Allocation of Income, Expenses, Gains and Losses. Income, expenses (other than those attributable to a specific class), gains and losses are allocated on a daily basis to each class of shares based upon the relative proportion of net assets represented by such class. Operating expenses directly attributable to a specific class are charged against the operations of that class.
72 OPPENHEIMER FUNDAMENTAL ALTERNATIVES FUND
2. Significant Accounting Policies (Continued)
Dividends and Distributions to Shareholders. Dividends and distributions to shareholders, which are determined in accordance with income tax regulations and may differ from U.S. GAAP, are recorded on the ex-dividend date. Income and capital gain distributions, if any, are declared and paid annually or at other times as determined necessary by the Manager.
Investment Income. Dividend income is recorded on the ex-dividend date or upon ex-dividend notification in the case of certain foreign dividends where the ex-dividend date may have passed. Non-cash dividends included in dividend income, if any, are recorded at the fair value of the securities received. Withholding taxes on foreign dividends, if any, and capital gains taxes on foreign investments, if any, have been provided for in accordance with the Fund’s understanding of the applicable tax rules and regulations. Interest income, if any, is recognized on an accrual basis. Discount and premium, which are included in interest income on the Consolidated Statement of Operations, are amortized or accreted daily.
Return of Capital Estimates. Distributions received from the Fund’s investments in Real Estate Investments Trusts (REITs), generally are comprised of income and return of capital. The Fund records investment income and return of capital based on estimates. Such estimates are based on historical information available from each REIT and other industry sources. These estimates may subsequently be revised based on information received from REITs after their tax reporting periods are concluded.
Custodian Fees. “Custodian fees and expenses” in the Consolidated Statement of Operations may include interest expense incurred by the Fund on any cash overdrafts of its custodian account during the period. Such cash overdrafts may result from the effects of failed trades in portfolio securities and from cash outflows resulting from unanticipated shareholder redemption activity. The Fund pays interest to its custodian on such cash overdrafts, to the extent they are not offset by positive cash balances maintained by the Fund, at a rate equal to the Federal Funds Rate plus 2.00%. The “Reduction to custodian expenses” line item, if applicable, represents earnings on cash balances maintained by the Fund during the period. Such interest expense and other custodian fees may be paid with these earnings.
Security Transactions. Security transactions are recorded on the trade date. Realized gains and losses on securities sold are determined on the basis of identified cost.
Indemnifications. The Fund’s organizational documents provide current and former Trustees and officers with a limited indemnification against liabilities arising in connection with the performance of their duties to the Fund. In the normal course of business, the Fund may also enter into contracts that provide general indemnifications. The Fund’s maximum exposure under these arrangements is unknown as this would be dependent on future claims that may be made against the Fund. The risk of material loss from such claims is considered remote.
73 OPPENHEIMER FUNDAMENTAL ALTERNATIVES FUND
NOTES TO
CONSOLIDATED FINANCIAL STATEMENTS Continued
2. Significant Accounting Policies (Continued)
Federal Taxes. The Fund intends to comply with provisions of the Internal Revenue Code applicable to regulated investment companies and to distribute substantially all of its investment company taxable income, including any net realized gain on investments not offset by capital loss carryforwards, if any, to shareholders. Therefore, no federal income or excise tax provision is required. The Fund files income tax returns in U.S. federal and applicable state jurisdictions. The statute of limitations on the Fund’s tax return filings generally remains open for the three preceding fiscal reporting period ends. The Fund has analyzed its tax positions for the fiscal year ended October 31, 2018, including open tax years, and does not believe there are any uncertain tax positions requiring recognition in the Fund’s financial statements.
Subchapter M requires, among other things, that at least 90% of the Fund’s gross income be derived from securities or derived with respect to its business of investing in securities (typically referred to as “qualifying income”). Income from commodity-linked derivatives may not be treated as “qualifying income” for purposes of the 90% gross income requirement. The Internal Revenue Service (IRS) has previously issued a number of private letter rulings which conclude that income derived from commodity index-linked notes and investments in a wholly-owned subsidiary will be “qualifying income.” As a result, the Fund will gain exposure to commodities through commodity-linked notes and its wholly-owned subsidiary.
The IRS has suspended the granting of private letter rulings pending further review. As a result, there can be no assurance that the IRS will not change its position with respect to commodity-linked notes and wholly-owned subsidiaries. In addition, future legislation and guidance from the Treasury and the IRS may adversely affect the Fund’s ability to gain exposure to commodities through commodity-linked notes and its wholly-owned subsidiary.
The Fund is required to include in income for federal income tax purposes all of the subsidiary’s net income and gains whether or not such income is distributed by the subsidiary. Net income and gains from the subsidiary are generally treated as ordinary income by the Fund, regardless of the character of the subsidiary’s underlying income. Net losses from the subsidiary do not pass through to the Fund for federal income tax purposes.
The tax components of capital shown in the following table represent distribution requirements the Fund must satisfy under the income tax regulations, losses the Fund may be able to offset against income and gains realized in future years and unrealized appreciation or depreciation of securities and other investments for federal income tax purposes.
Total Distributable Earnings | Accumulated Loss Carryforward1,2,3 | Net Unrealized Appreciation Based on cost of Securities and Other Investments | ||||||
| $16,398,326 | $ | 51,045,201 | $ | 108,180,134 | ||||
1. At period end, the Fund had $51,045,201 of net capital loss carryforward available to offset future realized capital
74 OPPENHEIMER FUNDAMENTAL ALTERNATIVES FUND
2. Significant Accounting Policies (Continued)
gains, if any, and thereby reduce future taxable gain distributions.
2. During the reporting period, the Fund utilized $17,115,812 of capital loss carryforward to offset capital gains realized in that fiscal year.
3. During the previous reporting period, the Fund did not utilize any capital loss carryforward.
Net investment income (loss) and net realized gain (loss) may differ for financial statement and tax purposes. The character of dividends and distributions made during the fiscal year from net investment income or net realized gains are determined in accordance with federal income tax requirements, which may differ from the character of net investment income or net realized gains presented in those financial statements in accordance with U.S. GAAP. Also, due to timing of dividends and distributions, the fiscal year in which amounts are distributed may differ from the fiscal year in which the income or net realized gain was recorded by the Fund.
Accordingly, the following amounts have been reclassified for the reporting period. Net assets of the Fund were unaffected by the reclassifications.
Increase to Paid-in Capital | Reduction to Accumulated Net Earnings | |||
| $1,382,995 | $1,382,995 | |||
The tax character of distributions paid during the reporting periods:
| Year Ended October 31, 2018 | Year Ended October 31, 2017 | |||||||
| Distributions paid from: | ||||||||
Ordinary income | $ | 20,000,263 | $ | 5,206,758 | ||||
The aggregate cost of securities and other investments and the composition of unrealized appreciation and depreciation of securities and other investments for federal income tax purposes at period end are noted in the following table. The primary difference between book and tax appreciation or depreciation of securities and other investments, if applicable, is attributable to the tax deferral of losses or tax realization of financial statement unrealized gain or loss.
| Federal tax cost of securities | $ | 1,046,637,480 | ||
| Federal tax cost of other investments | (348,558,703) | |||
|
| |||
| Total federal tax cost | $ | 698,078,777 | ||
|
| |||
Gross unrealized appreciation | $ | 189,126,927 | ||
| Gross unrealized depreciation | (80,946,793) | |||
|
| |||
| Net unrealized appreciation | $ | 108,180,134 | ||
|
|
Use of Estimates. The preparation of financial statements in conformity with U.S. GAAP requires management to make estimates and assumptions that affect the reported amounts of assets and liabilities and disclosure of contingent assets and liabilities at the date of the financial statements and the reported amounts of increases and decreases in net assets from
75 OPPENHEIMER FUNDAMENTAL ALTERNATIVES FUND
NOTES TO
CONSOLIDATED FINANCIAL STATEMENTS Continued
2. Significant Accounting Policies (Continued)
operations during the reporting period. Actual results could differ from those estimates.
New Accounting Pronouncements. In March 2017, Financial Accounting Standards Board (“FASB”) issued Accounting Standards Update (“ASU”), ASU 2017-08. This provides guidance related to the amortization period for certain purchased callable debt securities held at a premium. The ASU is effective for annual periods beginning after December 15, 2018, and interim periods within those annual periods. The Manager is evaluating the impacts of these changes on the financial statements.
During August 2018, the Securities and Exchange Commission (the “SEC”) issued Final Rule Release No. 33-10532 (the “Rule”), Disclosure Update and Simplification. The rule amends certain financial statement disclosure requirements to conform to U.S. GAAP. The amendments to Rule 6-04.17 of Regulation S-X (balance sheet) remove the requirement to separately state the book basis components of net assets: undistributed (over-distribution of) net investment income (“UNII”), accumulated undistributed net realized gains (losses), and net unrealized appreciation (depreciation) at the balance sheet date. Instead, consistent with U.S. GAAP, funds will be required to disclose total distributable earnings. The amendments to Rule 6-09 of Regulation S-X (statement of changes in net assets) remove the requirement to separately state the sources of distributions paid. Instead, consistent with U.S. GAAP, funds will be required to disclose the total amount of distributions paid, except that any tax return of capital must be separately disclosed. The amendments also remove the requirement to parenthetically state the book basis amount of UNII on the statement of changes in net assets. The requirements of the Rule are effective November 5, 2018, and the Funds’ Statement of Assets and Liabilities and Statement of Changes in Net Assets for the current reporting period have been modified accordingly. In addition, certain amounts within each Fund’s Statement of Changes in Net Assets for the prior fiscal period have been modified to conform to the Rule.
3. Securities Valuation
The Fund calculates the net asset value of its shares as of 4:00 P.M. Eastern Time, on each day the New York Stock Exchange (the “Exchange”) is open for trading, except in the case of a scheduled early closing of the Exchange, in which case the Fund will calculate net asset value of the shares as of the scheduled early closing time of the Exchange.
The Fund’s Board has adopted procedures for the valuation of the Fund’s securities and has delegated the day-to-day responsibility for valuation determinations under those procedures to the Manager. The Manager has established a Valuation Committee which is responsible for determining a fair valuation for any security for which market quotations are not readily available. The Valuation Committee’s fair valuation determinations are subject to review, approval and ratification by the Fund’s Board at least quarterly or more frequently, if necessary.
Valuation Methods and Inputs
Securities are valued primarily using unadjusted quoted market prices, when available, as
76 OPPENHEIMER FUNDAMENTAL ALTERNATIVES FUND
3. Securities Valuation (Continued)
supplied by third party pricing services or broker-dealers.
The following methodologies are used to determine the market value or the fair value of the types of securities described below:
Equity securities traded on a securities exchange (including exchange-traded derivatives other than futures and futures options) are valued based on the official closing price on the principal exchange on which the security is traded, as identified by the Manager, prior to the time when the Fund’s assets are valued. If the official closing price is unavailable, the security is valued at the last sale price on the principal exchange on which it is traded, or if no sales occurred, the security is valued at the mean between the quoted bid and asked prices. Over-the-counter equity securities are valued at the last published sale price, or if no sales occurred, at the mean between the quoted bid and asked prices. Events occurring after the close of trading on foreign exchanges may result in adjustments to the valuation of foreign securities to more accurately reflect their fair value as of the time when the Fund’s assets are valued.
Shares of a registered investment company that are not traded on an exchange are valued at that investment company’s net asset value per share.
Corporate and government debt securities (of U.S. or foreign issuers) and municipal debt securities, short-term notes, mortgage-backed securities, collateralized mortgage obligations, and asset-backed securities are valued at the mean between the bid and asked prices utilizing evaluated prices obtained from third party pricing services or broker-dealers who may use matrix pricing methods to determine the evaluated prices. Pricing services generally price debt securities assuming orderly transactions of an institutional “round lot” size, but some trades may occur in smaller, “odd lot” sizes, sometimes at lower prices than institutional round lot trades. Standard inputs generally considered by third-party pricing vendors include reported trade data, broker-dealer price quotations, benchmark yields, issuer spreads on comparable securities, the credit quality, yield, maturity, as well as other appropriate factors.
Event-linked bonds, are valued at the mean between the bid and asked prices utilizing evaluated prices obtained from third party pricing services or broker-dealers. Standard inputs generally considered by third-party pricing vendors include reported trade data and broker-dealer price quotations.
Loans are valued at the mean between the bid and asked prices utilizing evaluated prices obtained from third party pricing services or broker-dealers. Standard inputs generally considered by third-party pricing vendors include information obtained from market participants regarding broker-dealer price quotations.
Structured securities, swaps, swaptions, and other over-the-counter derivatives are valued utilizing evaluated prices obtained from third party pricing services or broker-dealers. Standard inputs generally considered by third-party pricing vendors include market information relevant to the underlying reference asset such as the price of financial instruments, stock market indices, foreign currencies, interest rate spreads, commodities, credit spreads, credit event probabilities, index values, individual security values, forward interest rates, variable interest rates, volatility measures, and forward currency rates, or the occurrence of other specific events.
Forward foreign currency exchange contracts are valued utilizing current and forward
77 OPPENHEIMER FUNDAMENTAL ALTERNATIVES FUND
NOTES TO
CONSOLIDATED FINANCIAL STATEMENTS Continued
3. Securities Valuation (Continued)
currency rates obtained from third party pricing services. When the settlement date of a contract is an interim date for which a quotation is not available, interpolated values are derived using the nearest dated forward currency rate.
Futures contracts and futures options traded on a commodities or futures exchange will be valued at the final settlement price or official closing price on the principal exchange as reported by such principal exchange at its trading session ending at, or most recently prior to, the time when the Fund’s assets are valued.
Securities for which market quotations are not readily available, or when a significant event has occurred that would materially affect the value of the security, are fair valued either (i) by a standardized fair valuation methodology applicable to the security type or the significant event as previously approved by the Valuation Committee and the Fund’s Board or (ii) as determined in good faith by the Manager’s Valuation Committee. The Valuation Committee considers all relevant facts that are reasonably available, through either public information or information available to the Manager, when determining the fair value of a security. Those standardized fair valuation methodologies include, but are not limited to, valuing securities at the last sale price or initially at cost and subsequently adjusting the value based on: changes in company specific fundamentals, changes in an appropriate securities index, or changes in the value of similar securities which may be further adjusted for any discounts related to security-specific resale restrictions. When possible, such methodologies use observable market inputs such as unadjusted quoted prices of similar securities, observable interest rates, currency rates and yield curves. The methodologies used for valuing securities are not necessarily an indication of the risks associated with investing in those securities nor can it be assured that the Fund can obtain the fair value assigned to a security if it were to sell the security.
To assess the continuing appropriateness of security valuations, the Manager regularly compares prior day prices and sale prices to the current day prices and challenges those prices exceeding certain tolerance levels with the third party pricing service or broker source. For those securities valued by fair valuations, whether through a standardized fair valuation methodology or a fair valuation determination, the Valuation Committee reviews and affirms the reasonableness of the valuations based on such methodologies and fair valuation determinations on a regular basis after considering all relevant information that is reasonably available.
Classifications
Each investment asset or liability of the Fund is assigned a level at measurement date based on the significance and source of the inputs to its valuation. Various data inputs may be used in determining the value of each of the Fund’s investments as of the reporting period end.
These data inputs are categorized in the following hierarchy under applicable financial accounting standards:
1) Level 1-unadjusted quoted prices in active markets for identical assets or liabilities (including securities actively traded on a securities exchange)
2) Level 2-inputs other than unadjusted quoted prices that are observable for the asset or
78 OPPENHEIMER FUNDAMENTAL ALTERNATIVES FUND
3. Securities Valuation (Continued)
liability (such as unadjusted quoted prices for similar assets and market corroborated inputs such as interest rates, prepayment speeds, credit risks, etc.)
3) Level 3-significant unobservable inputs (including the Manager’s own judgments about assumptions that market participants would use in pricing the asset or liability).
The inputs used for valuing securities are not necessarily an indication of the risks associated with investing in those securities.
The Fund classifies each of its investments in investment companies which are publicly offered as Level 1. Investment companies that are not publicly offered, if any, are classified as
Level 2 in the fair value hierarchy.
The table below categorizes amounts that are included in the Fund’s Consolidated Statement of Assets and Liabilities at period end based on valuation input level:
Level 1— Unadjusted Quoted Prices | Level 2— Other Significant Observable Inputs | Level 3— Unobservable Inputs | Value | |||||||||||||
| Assets Table | ||||||||||||||||
| Investments, at Value: | ||||||||||||||||
| Common Stocks | ||||||||||||||||
Consumer Discretionary | $ | 45,158,336 | $ | 103,278 | $ | — | $ | 45,261,614 | ||||||||
Consumer Staples | 46,045,077 | — | — | 46,045,077 | ||||||||||||
Energy | 50,436,146 | 97,420 | 14,705 | 50,548,271 | ||||||||||||
Financials | 110,389,649 | 217,854 | — | 110,607,503 | ||||||||||||
Health Care | 127,576,792 | 10,219,531 | — | 137,796,323 | ||||||||||||
Industrials | 83,187,193 | 39,474 | — | 83,226,667 | ||||||||||||
Information Technology | 78,960,961 | — | — | 78,960,961 | ||||||||||||
Materials | 31,526,458 | — | — | 31,526,458 | ||||||||||||
Telecommunication Services | 20,239,458 | — | — | 20,239,458 | ||||||||||||
Utilities | 32,447,874 | — | — | 32,447,874 | ||||||||||||
| Preferred Stocks | 11,846,516 | 12,760,162 | — | 24,606,678 | ||||||||||||
| Rights, Warrants and Certificates | — | — | 2,828 | 2,828 | ||||||||||||
| Asset-Backed Securities | — | 50,801,947 | — | 50,801,947 | ||||||||||||
| Mortgage-Backed Obligations | — | 53,744,170 | — | 53,744,170 | ||||||||||||
| Non-Convertible Corporate Bonds and Notes | — | 61,099,209 | — | 61,099,209 | ||||||||||||
| Corporate Loans | — | 153,118,885 | 1,785,444 | 154,904,329 | ||||||||||||
| Event-Linked Bonds | — | 14,821,950 | — | 14,821,950 | ||||||||||||
| Structured Securities | — | 11,496,498 | — | 11,496,498 | ||||||||||||
| Exchange-Traded Options Purchased | 491,459 | — | — | 491,459 | ||||||||||||
| Over-the-Counter Option Purchased | — | 586,630 | — | 586,630 | ||||||||||||
| Over-the-Counter Interest Rate | ||||||||||||||||
| Swaptions Purchased | — | 5,354,080 | — | 5,354,080 | ||||||||||||
| Short-Term Notes | — | 52,911,226 | — | 52,911,226 | ||||||||||||
| Investment Companies | 65,765,244 | — | — | 65,765,244 | ||||||||||||
| Total Investments, at Value | 704,071,163 | 427,372,314 | 1,802,977 | 1,133,246,454 | ||||||||||||
| Other Financial Instruments: | ||||||||||||||||
| Swaps, at value | — | 1,640,736 | — | 1,640,736 | ||||||||||||
79 OPPENHEIMER FUNDAMENTAL ALTERNATIVES FUND
NOTES TO
CONSOLIDATED FINANCIAL STATEMENTS Continued
3. Securities Valuation (Continued)
Level 1— Quoted Prices | Level 2— Other Significant Observable Inputs | Level 3— Significant Unobservable Inputs | Value | |||||||||||||
| Other Financial Instruments: (Continued) |
| |||||||||||||||
| Centrally cleared swaps, at value | $ | — | $ | 2,145,893 | $ | — | $ | 2,145,893 | ||||||||
| Futures contracts | 1,015,269 | — | — | 1,015,269 | ||||||||||||
| Forward currency exchange contracts | — | 1,513,863 | — | 1,513,863 | ||||||||||||
| Total Assets | $ | 705,086,432 | $ | 432,672,806 | $ | 1,802,977 | $ | 1,139,562,215 | ||||||||
| Liabilities Table | ||||||||||||||||
| Other Financial Instruments: | ||||||||||||||||
| Common Stock Securities Sold Short | $ | (351,116,226 | ) | $ | (33,968,226 | ) | $ | — | $ | (385,084,452 | ) | |||||
| Swaps, at value | — | (1,954,212 | ) | — | (1,954,212 | ) | ||||||||||
| Centrally cleared swaps, at value | — | (2,604,596 | ) | — | (2,604,596 | ) | ||||||||||
| Futures contracts | (3,810,359 | ) | — | — | (3,810,359 | ) | ||||||||||
| Total Liabilities | $ | (354,926,585 | ) | $ | (38,527,034 | ) | $ | — | $ | (393,453,619 | ) | |||||
Forward currency exchange contracts and futures contracts, if any, are reported at their unrealized appreciation/depreciation at measurement date, which represents the change in the contract’s value from trade date. All additional assets and liabilities included in the above table are reported at their market value at measurement date.
The table below shows the transfers between Level 2 and Level 3. The Fund’s policy is to recognize transfers in and transfers out as of the beginning of the reporting period.
| Transfers into Level 2* | Transfers out of Level 2** | Transfers into Level 3** | Transfers out of Level 3* | |||||||||||||
| Assets Table Investments, at Value: | ||||||||||||||||
| Rights, Warrants and Certificates | ||||||||||||||||
Fixed Income | $ | – | $ | (2,805 | ) | $ | 2,805 | $ | – | |||||||
| Common Stocks | ||||||||||||||||
Consumer Discretionary | 63,875 | – | – | (63,875 | ) | |||||||||||
Energy | – | (31,652 | ) | 31,652 | – | |||||||||||
Health Care | 77 | – | – | (77 | ) | |||||||||||
| Total Assets | $ | 63,952 | $ | (34,457 | ) | $ | 34,457 | $ | (63,952 | ) | ||||||
* Transferred from Level 3 to Level 2 due to the availability of market data for this security.
** Transferred from Level 2 to Level 3 because of the lack of observable market data due to a decrease in market activity for these securities.
4. Investments and Risks
Investments in Affiliated Funds. The Fund is permitted to invest in other mutual funds advised by the Manager (“Affiliated Funds”). Affiliated Funds are open-end management investment companies registered under the 1940 Act, as amended. The Manager is the
80 OPPENHEIMER FUNDAMENTAL ALTERNATIVES FUND
4. Investments and Risks (Continued)
investment adviser of, and the Sub-Adviser provides investment and related advisory services to, the Affiliated Funds. When applicable, the Fund’s investments in Affiliated Funds are included in the Consolidated Statement of Investments. Shares of Affiliated Funds are valued at their net asset value per share. As a shareholder, the Fund is subject to its proportional share of the Affiliated Funds’ expenses, including their management fee. The Manager will waive fees and/or reimburse Fund expenses in an amount equal to the indirect management fees incurred through the Fund’s investment in the Affiliated Funds.
Each of the Affiliated Funds in which the Fund invests has its own investment risks, and those risks can affect the value of the Fund’s investments and therefore the value of the Fund’s shares. To the extent that the Fund invests more of its assets in one Affiliated Fund than in another, the Fund will have greater exposure to the risks of that Affiliated Fund.
Investments in Money Market Instruments. The Fund is permitted to invest its free cash balances in money market instruments to provide liquidity or for defensive purposes. The Fund may invest in money market instruments by investing in Class E shares of Oppenheimer Institutional Government Money Market Fund (“IGMMF”), which is an Affiliated Fund. IGMMF is regulated as a money market fund under the 1940 Act, as amended. The Fund may also invest in money market instruments directly or in other affiliated or unaffiliated money market funds.
Structured Securities. The Fund invests in structured securities whose market values, interest rates and/or redemption prices are linked to the performance of underlying foreign currencies, interest rate spreads, stock market indices, prices of individual securities, commodities or other financial instruments or the occurrence of other specific events. The structured securities are often leveraged, increasing the volatility of each note’s market value relative to the change in the underlying linked financial element or event. Fluctuations in value of these securities are recorded as unrealized gains and losses in the accompanying Statement of Operations in the annual and semiannual reports. The Fund records a realized gain or loss when a structured security is sold or matures.
Event-Linked Bonds. The Fund may invest in “event-linked” bonds. Event-linked bonds, which are sometimes referred to as “catastrophe” bonds, are fixed income securities for which the return of principal and payment of interest is contingent on the non-occurrence of a specific trigger event, such as a hurricane, earthquake, or other occurrence that leads to physical or economic loss. If the trigger event occurs prior to maturity, the Fund may lose all or a portion of its principal in addition to interest otherwise due from the security. Event-linked bonds may expose the Fund to certain other risks, including issuer default, adverse regulatory or jurisdictional interpretations, liquidity risk and adverse tax consequences. The Fund records the net change in market value of event-linked bonds on the Consolidated Statement of Operations as a change in unrealized appreciation or depreciation on investments. The Fund records a realized gain or loss on the Consolidated Statement of Operations upon the sale or maturity of such securities.
81 OPPENHEIMER FUNDAMENTAL ALTERNATIVES FUND
NOTES TO
CONSOLIDATED FINANCIAL STATEMENTS Continued
4. Investments and Risks (Continued)
Loans. The Fund invests in loans made to U.S. and foreign borrowers that are corporations, partnerships or other business entities. The Fund will do so directly as an original lender or by assignment or indirectly through participation agreements or certain derivative instruments. While many of these loans will be collateralized, the Fund can also invest in uncollateralized loans. Loans are often issued in connection with recapitalizations, acquisitions, leveraged buyouts, and refinancing of borrowers. The loans often pay interest at rates that float above (or are adjusted periodically based on) a benchmark that reflects current interest rates although the Fund can also invest in loans with fixed interest rates.
When investing in loans, the Fund generally will have a contractual relationship only with the lender, not with the relevant borrower. As a result, the Fund generally will have the right to receive payments of principal, interest, and any fees to which it is entitled only from the lender selling the participation and only upon receipt by the lender of the payments from the relevant borrower. The Fund may not directly benefit from the collateral supporting the debt obligation in which it has purchased the participation. As a result, the Fund will assume the credit risk of both the borrower and the institution selling the participation to the Fund.
Securities on a When-Issued or Delayed Delivery Basis. The Fund may purchase securities on a “when-issued” basis, and may purchase or sell securities on a “delayed delivery” basis. “When-issued” or “delayed delivery” refers to securities whose terms and indenture are available and for which a market exists, but which are not available for immediate delivery. Delivery and payment for securities that have been purchased by the Fund on a when-issued basis normally takes place within six months and possibly as long as two years or more after the trade date. During this period, such securities do not earn interest, are subject to market fluctuation and may increase or decrease in value prior to their delivery. The purchase of securities on a when-issued basis may increase the volatility of the Fund’s net asset value to the extent the Fund executes such transactions while remaining substantially fully invested. When the Fund engages in when-issued or delayed delivery transactions, it relies on the buyer or seller, as the case may be, to complete the transaction. Their failure to do so may cause the Fund to lose the opportunity to obtain or dispose of the security at a price and yield it considers advantageous. The Fund may also sell securities that it purchased on a when-issued basis or forward commitment prior to settlement of the original purchase.
At period end, the Fund had purchased securities issued on a when-issued or delayed delivery basis and sold securities issued on a delayed delivery basis as follows:
When-Issued or Delayed Delivery Basis Transactions | ||||
| Purchased securities | $11,421,425 | |||
Sold securities | 936,912 | |||
Restricted Securities. At period end, investments in securities included issues that are restricted. A restricted security may have a contractual restriction on its resale and is valued
82 OPPENHEIMER FUNDAMENTAL ALTERNATIVES FUND
4. Investments and Risks (Continued)
under methods approved by the Board of Trustees as reflecting fair value. Securities that are restricted are marked with an applicable footnote on the Consolidated Statement of Investments. Restricted securities are reported on a schedule following the Consolidated Statement of Investments.
Equity Security Risk. Stocks and other equity securities fluctuate in price. The value of the Fund’s portfolio may be affected by changes in the equity markets generally. Equity markets may experience significant short-term volatility and may fall sharply at times. Different markets may behave differently from each other and U.S. equity markets may move in the opposite direction from one or more foreign stock markets. Adverse events in any part of the equity or fixed-income markets may have unexpected negative effects on other market segments.
The prices of individual equity securities generally do not all move in the same direction at the same time and a variety of factors can affect the price of a particular company’s securities. These factors may include, but are not limited to, poor earnings reports, a loss of customers, litigation against the company, general unfavorable performance of the company’s sector or industry, or changes in government regulations affecting the company or its industry.
Credit Risk. Loans and debt securities are subject to credit risk. Credit risk relates to the ability of the borrower under a loan or issuer of a debt to meet interest or principal payments or both as they become due. The Fund may acquire securities that have missed an interest payment, and is not obligated to dispose of securities whose issuers subsequently miss an interest and/or principal payment.
Information concerning securities not accruing income at period end is as follows:
| Cost | $ | 2,707,282 | ||
| Market Value | $ | 2,107,577 | ||
| Market Value as % of Net Assets | 0.18% |
5. Market Risk Factors
The Fund’s investments in securities and/or financial derivatives may expose the Fund to various market risk factors:
Commodity Risk. Commodity risk relates to the change in value of commodities or commodity indexes as they relate to increases or decreases in the commodities market. Commodities are physical assets that have tangible properties. Examples of these types of assets are crude oil, heating oil, metals, livestock, and agricultural products.
Credit Risk. Credit risk relates to the ability of the issuer of debt to meet interest and principal payments, or both, as they come due. In general, lower-grade, higher-yield debt securities are subject to credit risk to a greater extent than lower-yield, higher-quality securities.
Equity Risk. Equity risk relates to the change in value of equity securities as they relate to increases or decreases in the general market.
Foreign Exchange Rate Risk. Foreign exchange rate risk relates to the change in the
83 OPPENHEIMER FUNDAMENTAL ALTERNATIVES FUND
NOTES TO
CONSOLIDATED FINANCIAL STATEMENTS Continued
5. Market Risk Factors (Continued)
U.S. dollar value of a security held that is denominated in a foreign currency. The U.S. dollar value of a foreign currency denominated security will decrease as the dollar appreciates against the currency, while the U.S. dollar value will increase as the dollar depreciates against the currency.
Interest Rate Risk. Interest rate risk refers to the fluctuations in value of fixed-income securities resulting from the inverse relationship between price and yield. For example, an increase in general interest rates will tend to reduce the market value of already issued fixed-income investments, and a decline in general interest rates will tend to increase their value. In addition, debt securities with longer maturities, which tend to have higher yields, are subject to potentially greater fluctuations in value from changes in interest rates than obligations with shorter maturities.
Volatility Risk. Volatility risk refers to the magnitude of the movement, but not the direction of the movement, in a financial instrument’s price over a defined time period. Large increases or decreases in a financial instrument’s price over a relative time period typically indicate greater volatility risk, while small increases or decreases in its price typically indicate lower volatility risk.
6. Use of Derivatives
The Fund’s investment objective not only permits the Fund to purchase investment securities, it also allows the Fund to enter into various types of derivatives contracts, including, but not limited to, futures contracts, forward currency exchange contracts, credit default swaps, interest rate swaps, total return swaps, variance swaps and purchased and written options. In doing so, the Fund will employ strategies in differing combinations to permit it to increase, decrease, or change the level or types of exposure to market risk factors. These instruments may allow the Fund to pursue its objectives more quickly and efficiently than if it were to make direct purchases or sales of securities capable of effecting a similar response to market factors. Such contracts may be entered into through a bilateral over-the-counter (“OTC”) transaction, or through a securities or futures exchange and cleared through a clearinghouse.
Derivatives may have little or no initial cash investment relative to their market value exposure and therefore can produce significant gains or losses in excess of their cost due to changes in the market risk factors and the overall market. This use of embedded leverage allows the Fund to increase its market value exposure relative to its net assets and can substantially increase the volatility of the Fund’s performance. In instances where the Fund is using derivatives to decrease, or hedge, exposures to market risk factors for securities held by the Fund, there are also risks that those derivatives may not perform as expected resulting in losses for the combined or hedged positions. Some derivatives have the potential for unlimited loss, regardless of the size of the Fund’s initial investment.
Additional associated risks from investing in derivatives also exist and potentially could have significant effects on the valuation of the derivative and the Fund. Typically, the associated risks are not the risks that the Fund is attempting to increase or decrease exposure to, per its investment objectives, but are the additional risks from investing in derivatives.
84 OPPENHEIMER FUNDAMENTAL ALTERNATIVES FUND
6. Use of Derivatives (Continued)
Examples of these associated risks are liquidity risk, which is the risk that the Fund will not be able to sell the derivative in the open market in a timely manner, and counterparty credit risk, which is the risk that the counterparty will not fulfill its obligation to the Fund.
The Fund’s actual exposures to these market risk factors and associated risks during the period are discussed in further detail, by derivative type, below.
Forward Currency Exchange Contracts
The Fund may enter into forward currency exchange contracts (“forward contracts”) for the purchase or sale of a foreign currency at a negotiated rate at a future date. Such contracts are traded in the OTC inter-bank currency dealer market.
Forward contracts are reported on a schedule following the Consolidated Statement of Investments. The unrealized appreciation (depreciation) is reported in the Consolidated Statement of Assets and Liabilities as a receivable (or payable) and in the Consolidated Statement of Operations within the change in unrealized appreciation (depreciation). At contract close, the difference between the original cost of the contract and the value at the close date is recorded as a realized gain (loss) in the Consolidated Statement of Operations.
The Fund may enter into forward foreign currency exchange contracts in order to decrease exposure to foreign exchange rate risk associated with either specific transactions or portfolio instruments or to increase exposure to foreign exchange rate risk.
During the reporting period, the Fund had daily average contract amounts on forward contracts to buy and sell of $10,706,789 and $68,286,301, respectively.
Additional associated risk to the Fund includes counterparty credit risk. Counterparty credit risk arises from the possibility that the counterparty to a forward contract will default and fail to perform its obligations to the Fund.
Futures Contracts
A futures contract is a commitment to buy or sell a specific amount of a commodity, financial instrument or currency at a negotiated price on a stipulated future date. The Fund may buy and sell futures contracts and may also buy or write put or call options on these futures contracts. Futures contracts and options thereon are generally entered into on a regulated futures exchange and cleared through a clearinghouse associated with the exchange.
Upon entering into a futures contract, the Fund is required to deposit either cash or securities (initial margin) in an amount equal to a certain percentage of the contract value in an account registered in the futures commission merchant’s name. Subsequent payments (variation margin) are paid to or from the futures commission merchant each day equal to the daily changes in the contract value. Such payments are recorded as unrealized gains and losses. Should the Fund fail to make requested variation margin payments, the futures commission merchant can gain access to the initial margin to satisfy the Fund’s payment obligations.
Futures contracts are reported on a schedule following the Consolidated Statement of Investments. Securities held by a futures commission merchant to cover initial margin requirements on open futures contracts are noted in the Consolidated Statement of
85 OPPENHEIMER FUNDAMENTAL ALTERNATIVES FUND
NOTES TO
CONSOLIDATED FINANCIAL STATEMENTS Continued
6. Use of Derivatives (Continued)
Investments. Cash held by a futures commission merchant to cover initial margin requirements on open futures contracts and the receivable and/or payable for the daily mark to market for the variation margin are noted in the Consolidated Statement of Assets and Liabilities. The net change in unrealized appreciation and depreciation is reported in the Consolidated Statement of Operations. Realized gains (losses) are reported in the Consolidated Statement of Operations at the closing or expiration of futures contracts.
The Fund may purchase and/or sell financial futures contracts and options on futures contracts to gain exposure to, or decrease exposure to interest rate risk, equity risk, foreign exchange rate risk, volatility risk, or commodity risk.
During the reporting period, the Fund had an ending monthly average market value of $77,173,120 and $80,602,698 on futures contracts purchased and sold, respectively.
Additional associated risks of entering into futures contracts (and related options) include the possibility that there may be an illiquid market where the Fund is unable to liquidate the contract or enter into an offsetting position and, if used for hedging purposes, the risk that the price of the contract will correlate imperfectly with the prices of the Fund’s securities.
Option Activity
The Fund may buy and sell put and call options, or write put and call options. When an option is written, the Fund receives a premium and becomes obligated to sell or purchase the underlying security, currency or other underlying financial instrument at a fixed price, upon exercise of the option.
Options can be traded through an exchange or through a privately negotiated arrangement with a dealer in an OTC transaction. Options traded through an exchange are generally cleared through a clearinghouse (such as The Options Clearing Corporation). The difference between the premium received or paid, and market value of the option, is recorded as unrealized appreciation or depreciation. The net change in unrealized appreciation or depreciation is reported in the Consolidated Statement of Operations. When an option is exercised, the cost of the security purchased or the proceeds of the security sale are adjusted by the amount of premium received or paid. Upon the expiration or closing of the option transaction, a gain or loss is reported in the Consolidated Statement of Operations.
Foreign Currency Options. The Fund may purchase or write call and put options on currencies to increase or decrease exposure to foreign exchange rate risk. A purchased call, or written put option becomes more valuable as the price of the underlying financial instrument appreciates relative to the strike price. A purchased put, or written call option becomes more valuable as the price of the underlying financial instrument depreciates relative to the strike price.
Interest Rate Options. The Fund may purchase or write call and put options on treasury and/or euro futures to increase or decrease exposure to interest rate risk. A purchased call or written put option becomes more valuable as the price of the underlying financial instrument appreciates relative to the strike price. A purchased put or written call option becomes more valuable as the price of the underlying financial instrument depreciates relative to the strike price.
86 OPPENHEIMER FUNDAMENTAL ALTERNATIVES FUND
6. Use of Derivatives (Continued)
Index/Security Options. The Fund may purchase or write call and put options on individual equity securities and/or equity indexes to increase or decrease exposure to equity risk. A purchased call or written put option becomes more valuable as the price of the underlying financial instrument appreciates relative to the strike price. A purchased put or written call option becomes more valuable as the price of the underlying financial instrument depreciates relative to the strike price.
During the reporting period, the Fund had an ending monthly average market value of $1,570,549 and $322,003 on purchased call options and purchased put options, respectively.
Options written, if any, are reported in a schedule following the Consolidated Statement of Investments and as a liability in the Consolidated Statement of Assets and Liabilities. Securities held in collateral accounts to cover potential obligations with respect to outstanding written options are noted in the Consolidated Statement of Investments.
The risk in writing a call option is the market price of the underlying security increasing above the strike price and the option being exercised. The Fund must then purchase the underlying security at the higher market price and deliver it for the strike price or, if it owns the underlying security, deliver it at the strike price and forego any benefit from the increase in the price of the underlying security above the strike price. The risk in writing a put option is the market price of the underlying security decreasing below the strike price and the option being exercised. The Fund must then purchase the underlying security at the strike price when the market price of the underlying security is below the strike price. Alternatively, the Fund could also close out a written option position, in which case the risk is that the closing transaction will require a premium to be paid by the Fund that is greater than the premium the Fund received. When writing options, the Fund has the additional risk that there may be an illiquid market where the Fund is unable to close the contract. The risk in buying an option is that the Fund pays a premium for the option, and the option may be worth less than the premium paid or expire worthless.
Additional associated risks to the Fund include counterparty credit risk and liquidity risk.
During the reporting period, the Fund had no written options outstanding.
Swap Contracts
The Fund may enter into swap contract agreements with a counterparty to exchange a series of cash flows based on either specified reference rates, the price or volatility of asset or non-asset references, or the occurrence of a credit event, over a specified period. Swaps can be executed in a bi-lateral privately negotiated arrangement with a dealer in an OTC transaction (“OTC swaps”) or executed on a regulated market. Certain swaps, regardless of the venue of their execution, are required to be cleared through a clearinghouse (“centrally cleared swaps”). Swap contracts may include interest rate, equity, debt, index, total return, credit default, currency, and volatility swaps.
Swap contracts are reported on a schedule following the Consolidated Statement of Investments. The values of centrally cleared swap and OTC swap contracts are aggregated by positive and negative values and disclosed separately on the Consolidated Statement of Assets and Liabilities. The unrealized appreciation (depreciation) related to the change in the
87 OPPENHEIMER FUNDAMENTAL ALTERNATIVES FUND
NOTES TO
CONSOLIDATED FINANCIAL STATEMENTS Continued
6. Use of Derivatives (Continued)
valuation of the notional amount of the swap is combined with the accrued interest due to (owed by) the Fund, if any, at termination or settlement. The net change in this amount during the period is included on the Consolidated Statement of Operations. The Fund also records any periodic payments received from (paid to) the counterparty, including at termination, under such contracts as realized gain (loss) on the Consolidated Statement of Operations.
Swap contract agreements are exposed to the market risk factor of the specific underlying reference rate or asset. Swap contracts are typically more attractively priced compared to similar investments in related cash securities because they isolate the risk to one market risk factor and eliminate the other market risk factors. Investments in cash securities (for instance bonds) have exposure to multiple risk factors (credit and interest rate risk). Because swaps have embedded leverage, they can expose the Fund to substantial risk in the isolated market risk factor.
Credit Default Swap Contracts. A credit default swap is a contract that enables an investor to buy or sell protection against a defined-issuer credit event, such as the issuer’s failure to make timely payments of interest or principal on a debt security, bankruptcy or restructuring. The Fund may enter into credit default swaps either by buying or selling protection on a corporate issuer, sovereign issuer, or a basket or index of issuers (the “reference asset”).
The buyer of protection pays a periodic fee to the seller of protection based on the notional amount of the swap contract. The seller of protection agrees to compensate the buyer of protection for future potential losses as a result of a credit event on the reference asset. The contract effectively transfers the credit event risk of the reference asset from the buyer of protection to the seller of protection.
The ongoing value of the contract will fluctuate throughout the term of the contract based primarily on the credit risk of the reference asset. If the credit quality of the reference asset improves relative to the credit quality at contract initiation, the buyer of protection may have an unrealized loss greater than the anticipated periodic fee owed. This unrealized loss would be the result of current credit protection being cheaper than the cost of credit protection at contract initiation. If the buyer elects to terminate the contract prior to its maturity, and there has been no credit event, this unrealized loss will become realized. If the contract is held to maturity, and there has been no credit event, the realized loss will be equal to the periodic fee paid over the life of the contract.
If there is a credit event, the buyer of protection can exercise its rights under the contract and receive a payment from the seller of protection equal to the notional amount of the swap less the market value of specified debt securities issued by the reference asset. Upon exercise of the contract the difference between such value and the notional amount is recorded as realized gain (loss) and is included on the Consolidated Statement of Operations.
The Fund may purchase or sell credit protection through credit default swaps to increase or decrease exposure to the credit risk of individual issuers and/or indexes of issuers that are either unavailable or considered to be less attractive in the bond market.
The Fund has engaged in spread curve trades by simultaneously purchasing and selling
88 OPPENHEIMER FUNDAMENTAL ALTERNATIVES FUND
6. Use of Derivatives (Continued)
protection through credit default swaps referenced to the same reference asset but with different maturities. Spread curve trades attempt to gain exposure to credit risk on a forward basis by realizing gains on the expected differences in spreads.
The Fund has purchased credit protection through credit default swaps to take an outright negative investment perspective on the credit risk of an individual issuer or basket or index of issuers as opposed to decreasing its credit risk exposure related to debt securities of such issuer(s) held by the Fund.
For the reporting period, the Fund had ending monthly average notional amounts of $141,411,987 and $63,896,283 on credit default swaps to buy protection and credit default swaps to sell protection, respectively.
Additional associated risks to the Fund include counterparty credit risk and liquidity risk.
Total Return Swap Contracts. A total return swap is an agreement between counterparties to exchange periodic payments based on the value of asset or non-asset references. One cash flow is typically based on a non-asset reference (such as an interest rate) and the other on the total return of a reference asset (such as a security or a basket of securities or securities index). The total return of the reference asset typically includes appreciation or depreciation on the reference asset, plus any interest or dividend payments.
Total return swap contracts are exposed to the market risk factor of the specific underlying financial instrument or index. Total return swaps are less standard in structure than other types of swaps and can isolate and/or include multiple types of market risk factors including equity risk, credit risk, and interest rate risk.
The Fund may enter into total return swaps on various equity securities or indexes to increase or decrease exposure to equity risk. These equity risk related total return swaps require the Fund to pay or receive a floating reference interest rate, and an amount equal to the opposite price movement of securities or an index (expressed as a percentage) multiplied by the notional amount of the contract. Equity leg payments equal to the positive price movement of the same securities or index (expressed as a percentage) multiplied by the notional amount of the contract and, in some cases, dividends paid on the securities. Reference leg payments equal a floating reference interest rate and an amount equal to the negative price movement of the same securities or index (expressed as a percentage) multiplied by the notional amount of the contract.
The Fund may enter into total return swaps on various commodity indexes to increase or decrease exposure to commodity risk. These commodity risk related total return swaps require the Fund to pay or receive a fixed or a floating reference interest rate, and an amount equal to the opposite price movement of an index (expressed as a percentage) multiplied by the notional amount of the contract. The Fund will receive payments equal to the positive price movement of the same index (expressed as a percentage) multiplied by the notional amount of the contract. The Fund will receive payments of a fixed or a floating reference interest rate and an amount equal to the negative price movement of the same index (expressed as a percentage) multiplied by the notional amount of the contract.
For the reporting period, the Fund had ending monthly average notional amounts of
89 OPPENHEIMER FUNDAMENTAL ALTERNATIVES FUND
NOTES TO
CONSOLIDATED FINANCIAL STATEMENTS Continued
6. Use of Derivatives (Continued)
$20,461,718 which are short the reference asset.
Additional associated risks to the Fund include counterparty credit risk and liquidity risk.
Swaption Transactions
The Fund may enter into a swaption contract which grants the purchaser the right, but not the obligation, to enter into a swap transaction at preset terms detailed in the underlying agreement within a specified period of time. The purchaser pays a premium to the swaption writer who bears the risk of unfavorable changes in the preset terms on the underlying swap.
Purchased swaptions are reported as a component of investments in the Consolidated Statement of Investments and the Consolidated Statement of Assets and Liabilities. Written swaptions are reported on a schedule following the Consolidated Statement of Investments and their value is reported as a separate asset or liability line item in the Consolidated Statement of Assets and Liabilities. The net change in unrealized appreciation or depreciation on written swaptions is separately reported in the Consolidated Statement of Operations. When a swaption is exercised, the cost of the swap is adjusted by the amount of premium paid or received. Upon the expiration or closing of an unexercised swaption contract, a gain or loss is reported in the Consolidated Statement of Operations for the amount of the premium paid or received.
The Fund generally will incur a greater risk when it writes a swaption than when it purchases a swaption. When the Fund writes a swaption it will become obligated, upon exercise of the swaption, according to the terms of the underlying agreement. Swaption contracts written by the Fund do not give rise to counterparty credit risk prior to exercise as they obligate the Fund, not its counterparty, to perform. When the Fund purchases a swaption it only risks losing the amount of the premium it paid if the swaption expires unexercised. However, when the Fund exercises a purchased swaption there is a risk that the counterparty will fail to perform or otherwise default on its obligations under the swaption contract.
The Fund may purchase swaptions which give it the option to enter into an interest rate swap in which it pays a floating or fixed interest rate and receives a fixed or floating interest rate in order to increase or decrease exposure to interest rate risk. Purchasing the fixed portion of this swaption becomes more valuable as the reference interest rate decreases relative to the preset interest rate. Purchasing the floating portion of this swaption becomes more valuable as the reference interest rate increases relative to the preset interest rate.
The Fund may write swaptions which give it the obligation, if exercised by the purchaser, to enter into an interest rate swap in which it pays a fixed or floating interest rate and receives a floating or fixed interest rate in order to increase or decrease exposure to interest rate risk. A written swaption paying a fixed rate becomes more valuable as the reference interest rate increases relative to the preset interest rate. A written swaption paying a floating rate becomes more valuable as the reference interest rate decreases relative to the preset interest rate.
During the reporting period, the Fund had an ending monthly average market value of $3,544,607 on purchased swaptions.
90 OPPENHEIMER FUNDAMENTAL ALTERNATIVES FUND
6. Use of Derivatives (Continued)
Counterparty Credit Risk. Derivative positions are subject to the risk that the counterparty will not fulfill its obligation to the Fund. The Fund intends to enter into derivative transactions with counterparties that the Manager believes to be creditworthy at the time of the transaction.
The Fund’s risk of loss from counterparty credit risk on OTC derivatives is generally limited to the aggregate unrealized gain netted against any collateral held by the Fund. For OTC options purchased, the Fund bears the risk of loss of the amount of the premiums paid plus the positive change in market values net of any collateral held by the Fund should the counterparty fail to perform under the contracts. Options written by the Fund do not typically give rise to counterparty credit risk, as options written generally obligate the Fund and not the counterparty to perform.
To reduce counterparty risk with respect to OTC transactions, the Fund has entered into master netting arrangements, established within the Fund’s International Swap and Derivatives Association, Inc. (“ISDA”) master agreements, which allow the Fund to make (or to have an entitlement to receive) a single net payment in the event of default (close-out netting) for outstanding payables and receivables with respect to certain OTC positions in swaps, options, swaptions, and forward currency exchange contracts for each individual counterparty. In addition, the Fund may require that certain counterparties post cash and/or securities in collateral accounts to cover their net payment obligations for those derivative contracts subject to ISDA master agreements. If the counterparty fails to perform under these contracts and agreements, the cash and/or securities will be made available to the Fund.
At period end, the Fund has required certain counterparties to post collateral of $8,359,975.
ISDA master agreements include credit related contingent features which allow counterparties to OTC derivatives to terminate derivative contracts prior to maturity in the event that, for example, the Fund’s net assets decline by a stated percentage or the Fund fails to meet the terms of its ISDA master agreements, which would cause the Fund to accelerate payment of any net liability owed to the counterparty.
For financial reporting purposes, the Fund does not offset derivative assets and derivative liabilities that are subject to netting arrangements in the Consolidated Statement of Assets and Liabilities. Bankruptcy or insolvency laws of a particular jurisdiction may impose restrictions on or prohibitions against the right of offset in bankruptcy, insolvency or other events.
The Fund’s risk of loss from counterparty credit risk on exchange-traded derivatives cleared through a clearinghouse and for centrally cleared swaps is generally considered lower than as compared to OTC derivatives. However, counterparty credit risk exists with respect to initial and variation margin deposited/paid by the Fund that is held in futures commission merchant, broker and/or clearinghouse accounts for such exchange-traded derivatives and for centrally cleared swaps.
With respect to centrally cleared swaps, such transactions will be submitted for clearing, and if cleared, will be held in accounts at futures commission merchants or brokers that are members of clearinghouses. While brokers, futures commission merchants and clearinghouses
91 OPPENHEIMER FUNDAMENTAL ALTERNATIVES FUND
NOTES TO
CONSOLIDATED FINANCIAL STATEMENTS Continued
6. Use of Derivatives (Continued)
are required to segregate customer margin from their own assets, in the event that a broker, futures commission merchant or clearinghouse becomes insolvent or goes into bankruptcy and at that time there is a shortfall in the aggregate amount of margin held by the broker, futures commission merchant or clearinghouse for all its customers, U.S. bankruptcy laws will typically allocate that shortfall on a pro-rata basis across all the broker’s, futures commission merchant’s or clearinghouse’s customers, potentially resulting in losses to the Fund.
There is the risk that a broker, futures commission merchant or clearinghouse will decline to clear a transaction on the Fund’s behalf, and the Fund may be required to pay a termination fee to the executing broker with whom the Fund initially enters into the transaction. Clearinghouses may also be permitted to terminate centrally cleared swaps at any time. The Fund is also subject to the risk that the broker or futures commission merchant will improperly use the Fund’s assets deposited/paid as initial or variation margin to satisfy payment obligations of another customer. In the event of a default by another customer of the broker or futures commission merchant, the Fund might not receive its variation margin payments from the clearinghouse, due to the manner in which variation margin payments are aggregated for all customers of the broker/futures commission merchant.
Collateral and margin requirements differ by type of derivative. Margin requirements are established by the broker, futures commission merchant or clearinghouse for exchange-traded and cleared derivatives, including centrally cleared swaps. Brokers, futures commission merchants and clearinghouses can ask for margin in excess of the regulatory minimum, or increase the margin amount, in certain circumstances.
Collateral terms are contract specific for OTC derivatives. For derivatives traded under an ISDA master agreement, the collateral requirements are typically calculated by netting the mark to market amount for each transaction under such agreement and comparing that amount to the value of any collateral currently pledged by the Fund or the counterparty.
For financial reporting purposes, cash collateral that has been pledged to cover obligations of the Fund, if any, is reported separately on the Consolidated Statement of Assets and Liabilities as cash pledged as collateral. Non-cash collateral pledged by the Fund, if any, is noted in the Consolidated Statement of Investments. Generally, the amount of collateral due from or to a party must exceed a minimum transfer amount threshold (e.g., $250,000) before a transfer has to be made. To the extent amounts due to the Fund from its counterparties are not fully collateralized, contractually or otherwise, the Fund bears the risk of loss from counterparty nonperformance.
The following table presents by counterparty the Fund’s OTC derivative assets net of the related collateral pledged by the Fund at period end:
92 OPPENHEIMER FUNDAMENTAL ALTERNATIVES FUND
6. Use of Derivatives (Continued)
Gross Amounts Not Offset in the Consolidated Statement of Assets & Liabilities | ||||||||||||||||||||
| Counterparty | Gross Amounts Not Offset in the Consolidated Statement of Assets & Liabilities* | Financial Instruments Available for Offset | Financial Instruments Collateral Received** | Cash Collateral Received** | Net Amount | |||||||||||||||
| Bank of America NA | $ | 8,203 | $ | – | $ | – | $ | – | $ | 8,203 | ||||||||||
| Barclays Bank plc | 283,235 | (49,552 | ) | (233,683 | ) | – | – | |||||||||||||
| Citibank NA | 886,117 | (381,522 | ) | – | – | 504,595 | ||||||||||||||
| Deutsche Bank AG | 300,845 | – | – | – | 300,845 | |||||||||||||||
| Goldman Sachs Bank USA | 595,290 | – | – | (595,290 | ) | – | ||||||||||||||
| Goldman Sachs International | 2,568,462 | (1,141,024 | ) | – | – | 1,427,438 | ||||||||||||||
| JPMorgan Chase Bank NA | 31,842 | – | – | – | 31,842 | |||||||||||||||
| Morgan Stanley Capital Services, Inc. | 4,421,315 | – | – | (4,084,151 | ) | 337,164 | ||||||||||||||
| $ | 9,095,309 | $ | (1,572,098 | ) | $ | (233,683 | ) | $ | (4,679,441 | ) | $ | 2,610,087 | ||||||||
*OTC derivatives are reported gross on the Consolidated Statement of Assets and Liabilities. Exchange traded options and margin related to centrally cleared swaps and futures, if any, are excluded from these reported amounts.
**Reported collateral posted for the benefit of the Fund within this table is limited to the net outstanding amount due from an individual counterparty. The collateral posted for the benefit of the Fund may exceed these amounts.
The following table presents by counterparty the Fund’s OTC derivative liabilities net of the related collateral pledged by the Fund at period end:
Gross Amounts Not Offset in the Consolidated Statement of Assets & Liabilities | ||||||||||||||||||||
| Counterparty | Gross Amounts Not Offset in the Consolidated Statement of Assets & Liabilities* | Financial Instruments Available for Offset | Financial Instruments Collateral Pledged** | Cash Collateral Pledged** | Net Amount | |||||||||||||||
| Barclays Bank plc | $ | (49,552 | ) | $ | 49,552 | $ | – | $ | – | $ | – | |||||||||
| BNP Paribas | (250,118 | ) | – | – | 250,118 | – | ||||||||||||||
| Citibank NA | (381,522 | ) | 381,522 | – | – | – | ||||||||||||||
| Goldman Sachs International | (1,141,024 | ) | 1,141,024 | – | – | – | ||||||||||||||
| Morgan Stanley | (131,996 | ) | – | – | – | (131,996 | ) | |||||||||||||
| $ | (1,954,212 | ) | $ | 1,572,098 | $ | – | $ | 250,118 | $ | (131,996 | ) | |||||||||
*OTC derivatives are reported gross on the Consolidated Statement of Assets and Liabilities. Exchange traded options and margin related to centrally cleared swaps and futures, if any, are excluded from these reported amounts.
**Reported collateral pledged within this table is limited to the net outstanding amount due from the Fund. The securities pledged as collateral by the Fund as reported on the Consolidated Statement of Investments may exceed these amounts.
93 OPPENHEIMER FUNDAMENTAL ALTERNATIVES FUND
NOTES TO
CONSOLIDATED FINANCIAL STATEMENTS Continued
6. Use of Derivatives (Continued)
The following table presents the valuations of derivative instruments by risk exposure as reported within the Consolidated Statement of Assets and Liabilities at period end:
| Asset Derivatives | Liability Derivatives | |||||||||||
|
| |||||||||||
Derivatives Not Accounted for as Hedging Instruments | Consolidated Statement of Assets and Liabilities Location | Value | Consolidated Statement of Assets and Liabilities Location | Value | ||||||||
| Credit contracts | Swaps, at value | $ | 6,269 | Swaps, at value | $ | 1,949,620 | ||||||
| Equity contracts | Swaps, at value | 1,634,467 | Swaps, at value | 4,592 | ||||||||
| Interest rate contracts | Centrally cleared swaps, at value | 2,145,893 | Centrally cleared swaps, at value | 2,604,596 | ||||||||
| Equity contracts | Variation margin receivable | 90,180* | ||||||||||
| Interest rate contracts | Variation margin receivable | 15,006 | Variation margin payable | 194,192* | ||||||||
| Forward currency exchange contracts | Unrealized appreciation on foreign currency exchange contracts | 1,513,863 | ||||||||||
| Equity contracts | Investments, at value | 491,459** | ||||||||||
| Currency contracts | Investments, at value | 586,630** | ||||||||||
| Interest rate contracts | Investments, at value | 5,354,080** | ||||||||||
|
|
|
| |||||||||
| Total | $ | 11,837,847 | $ | 4,753,000 | ||||||||
|
|
|
| |||||||||
*Includes only the current day’s variation margin. Prior variation margin movements have been reflected in cash on the Consolidated Statement of Assets and Liabilities upon receipt or payment.
**Amounts relate to purchased option contracts and purchased swaption contracts, if any.
The effect of derivative instruments on the Consolidated Statement of Operations is as follows:
| Amount of Realized Gain or (Loss) Recognized on Derivatives | ||||||||||||
Derivatives Not Accounted for as Hedging Instruments | Investment transactions in unaffiliated companies* | Option contracts written | Futures contracts | |||||||||
| Credit contracts | $ | — | $ | — | $ | — | ||||||
| Currency contracts | (2,091,013 | ) | 693,680 | — | ||||||||
| Equity contracts | 15,028,008 | — | 1,232,342 | |||||||||
| Forward currency exchange contracts | — | — | — | |||||||||
| Interest rate contracts | (2,371,352 | ) | — | 1,438,921 | ||||||||
| Total | $ | 10,565,643 | $ | 693,680 | $ | 2,671,263 | ||||||
94 OPPENHEIMER FUNDAMENTAL ALTERNATIVES FUND
6. Use of Derivatives (Continued)
| Amount of Realized Gain or (Loss) Recognized on Derivatives | ||||||||||||
Derivatives Not Accounted for as Hedging Instruments | Forward currency exchange contracts | Swap contracts | Total | |||||||||
| Credit contracts | $ | — | $ | (2,615,079 | ) | $ | (2,615,079 | ) | ||||
| Currency contracts | — | — | (1,397,333 | ) | ||||||||
| Equity contracts | — | (4,184,351 | ) | 12,075,999 | ||||||||
| Forward currency exchange contracts | (865,639 | ) | — | (865,639 | ) | |||||||
| Interest rate contracts | — | — | (932,431 | ) | ||||||||
|
|
| ||||||||||
| Total | $ | (865,639 | ) | $ | (6,799,430 | ) | $ | 6,265,517 | ||||
|
|
| ||||||||||
| * Includes purchased option contracts and purchased swaption contracts, if any. | ||||||||||||
| Amount of Change in Unrealized Gain or (Loss) Recognized on Derivatives | ||||||||||||
Derivatives Not Accounted for as Hedging Instruments | Investment transactions in unaffiliated companies* | Option contracts written | Futures contracts | |||||||||
| Credit contracts | $ | — | $ | — | $ | — | ||||||
| Currency contracts | 2,054,159 | (693,680 | ) | — | ||||||||
| Equity contracts | (3,872,115 | ) | — | (3,810,359 | ) | |||||||
| Forward currency exchange contracts | — | — | — | |||||||||
| Interest rate contracts | 3,880,954 | — | 1,906,826 | |||||||||
|
|
| ||||||||||
| Total | $ | 2,062,998 | $ | (693,680 | ) | $ | (1,903,533 | ) | ||||
|
|
| ||||||||||
| Amount of Change in Unrealized Gain or (Loss) Recognized on Derivatives | ||||||||||||
Derivatives Not Accounted for as Hedging Instruments | Forward currency exchange contracts | Swap contracts | Total | |||||||||
| Credit contracts | $ | — | $ | 1,703,417 | $ | 1,703,417 | ||||||
| Currency contracts | — | — | 1,360,479 | |||||||||
| Equity contracts | — | 3,843,099 | (3,839,375 | ) | ||||||||
| Forward currency exchange contracts | 473,975 | — | 473,975 | |||||||||
| Interest rate contracts | — | — | 5,787,780 | |||||||||
|
|
| ||||||||||
| Total | $ | 473,975 | $ | 5,546,516 | $ | 5,486,276 | ||||||
|
|
| ||||||||||
* Includes purchased option contracts and purchased swaption contracts, if any.
7. Shares of Beneficial Interest
The Fund has authorized an unlimited number of $0.01 par value shares of beneficial interest of each class. Transactions in shares of beneficial interest were as follows:
95 OPPENHEIMER FUNDAMENTAL ALTERNATIVES FUND
NOTES TO
CONSOLIDATED FINANCIAL STATEMENTS Continued
7. Shares of Beneficial Interest (Continued)
| Year Ended October 31, 2018 | Year Ended October 31, 2017 | |||||||||||||||
| Shares | Amount | Shares | Amount | |||||||||||||
| Class A | ||||||||||||||||
| Sold1 | 1,285,066 | $ | 34,769,839 | 2,271,267 | $ | 61,514,476 | ||||||||||
| Dividends and/or distributions reinvested | 312,964 | 8,396,831 | 61,361 | 1,651,467 | ||||||||||||
| Redeemed | (4,767,943 | ) | (128,785,668 | ) | (6,936,544 | ) | (188,331,134 | ) | ||||||||
|
|
| ||||||||||||||
| Net decrease | (3,169,913 | ) | $ | (85,618,998 | ) | (4,603,916 | ) | $ | (125,165,191 | ) | ||||||
|
|
| ||||||||||||||
| Class B | ||||||||||||||||
| Sold | 15 | $ | 348 | 3,176 | $ | 76,279 | ||||||||||
| Dividends and/or distributions reinvested | — | — | 536 | 12,416 | ||||||||||||
| Redeemed1 | (107,046 | ) | (2,572,870 | ) | (204,657 | ) | (4,922,484 | ) | ||||||||
|
|
| ||||||||||||||
| Net decrease | (107,031 | ) | $ | (2,572,522 | ) | (200,945 | ) | $ | (4,833,789 | ) | ||||||
|
|
| ||||||||||||||
| Class C | ||||||||||||||||
| Sold | 266,809 | $ | 6,382,546 | 415,840 | $ | 9,987,969 | ||||||||||
| Dividends and/or distributions reinvested | 43,628 | 1,038,786 | 10,755 | 257,477 | ||||||||||||
| Redeemed | (1,218,249 | ) | (29,142,073 | ) | (1,667,506 | ) | (40,083,145 | ) | ||||||||
|
|
| ||||||||||||||
| Net decrease | (907,812 | ) | $ | (21,720,741 | ) | (1,240,911 | ) | $ | (29,837,699 | ) | ||||||
|
|
| ||||||||||||||
| Class I | ||||||||||||||||
| Sold | 5,406,281 | $ | 150,490,805 | 1,960,703 | $ | 54,741,876 | ||||||||||
| Dividends and/or distributions reinvested | 104,717 | 2,879,730 | 34,326 | 943,643 | ||||||||||||
| Redeemed | (3,417,127 | ) | (95,526,856 | ) | (1,316,046 | ) | (36,752,840 | ) | ||||||||
|
|
| ||||||||||||||
| Net increase | 2,093,871 | $ | 57,843,679 | 678,983 | $ | 18,932,679 | ||||||||||
|
|
| ||||||||||||||
| Class R | ||||||||||||||||
| Sold | 129,760 | $ | 3,354,163 | 251,739 | $ | 6,538,991 | ||||||||||
| Dividends and/or distributions reinvested | 10,965 | 281,569 | 1,616 | 41,710 | ||||||||||||
| Redeemed | (208,133 | ) | (5,384,618 | ) | (244,512 | ) | (6,345,214 | ) | ||||||||
|
|
| ||||||||||||||
| Net increase (decrease) | (67,408 | ) | $ | (1,748,886 | ) | 8,843 | $ | 235,487 | ||||||||
|
|
| ||||||||||||||
| Class Y | ||||||||||||||||
| Sold | 6,344,567 | $ | 176,011,495 | 9,794,238 | $ | 272,149,034 | ||||||||||
| Dividends and/or distributions reinvested | 231,242 | 6,338,341 | 59,982 | 1,644,210 | ||||||||||||
| Redeemed | (8,561,857 | ) | (237,719,290 | ) | (9,825,658 | ) | (272,434,970 | ) | ||||||||
|
|
| ||||||||||||||
| Net increase (decrease) | (1,986,048 | ) | $ | (55,369,454 | ) | 28,562 | $ | 1,358,274 | ||||||||
|
|
| ||||||||||||||
1. All outstanding Class B shares converted to Class A shares on June 1, 2018.
8. Purchases and Sales of Securities
The aggregate cost of purchases and proceeds from sales of securities, other than short-term obligations and investments in IGMMF, for the reporting period were as follows:
96 OPPENHEIMER FUNDAMENTAL ALTERNATIVES FUND
8. Purchases and Sales of Securities (Continued)
| Purchases | Sales | |||||||||||
| Investment securities | $ | 1,099,132,200 | $ | 1,211,762,504 | ||||||||
9. Fees and Other Transactions with Affiliates
Management Fees. Under the investment advisory agreement, the Fund pays the Manager a management fee based on the daily net assets of the Fund at an annual rate as shown in the following table:
| Fee Schedule | ||||
| Up to $1.0 billion | 0.85 | % | ||
| Next $500 million | 0.80 | |||
| Next $500 million | 0.75 | |||
| Next $500 million | 0.70 | |||
| Next $500 million | 0.65 | |||
| Next $500 million | 0.60 | |||
| Next $500 million | 0.55 | |||
| Over $4.0 billion | 0.50 | |||
The Manager also provides investment management related services to the Subsidiary. The Subsidiary pays the Manager a monthly management fee at an annual rate according to the above schedule. The Subsidiary also pays certain other expenses including custody and directors’ fees.
The Fund’s effective management fee for the reporting period was 0.84% of average annual net assets before any Subsidiary management fees or any applicable waivers.
Sub-Adviser Fees. The Manager has retained the Sub-Adviser to provide the day-to-day portfolio management of the Fund and the Subsidiary. Under the Sub-Advisory Agreement, the Manager pays the Sub-Adviser an annual fee in monthly installments, equal to a percentage of the investment management fee collected by the Manager from the Fund and the Subsidiary, which shall be calculated after any investment management fee waivers. The fee paid to the Sub-Adviser is paid by the Manager, not by the Fund.
Transfer Agent Fees. OFI Global (the “Transfer Agent”) serves as the transfer and shareholder servicing agent for the Fund. The Fund pays the Transfer Agent a fee based on annual net assets, which shall be calculated after any applicable fee waivers. Fees incurred and average net assets for each class with respect to these services are detailed in the Consolidated Statement of Operations and Consolidated Financial Highlights, respectively.
Sub-Transfer Agent Fees. The Transfer Agent has retained Shareholder Services, Inc., a wholly-owned subsidiary of OFI (the “Sub-Transfer Agent”), to provide the day-to-day transfer agent and shareholder servicing of the Fund. Under the Sub-Transfer Agency Agreement, the Transfer Agent pays the Sub-Transfer Agent an annual fee in monthly installments, equal to a percentage of the transfer agent fee collected by the Transfer Agent from the Fund, which shall be calculated after any applicable fee waivers. The fee paid to the Sub-Transfer Agent is paid by the Transfer Agent, not by the Fund.
97 OPPENHEIMER FUNDAMENTAL ALTERNATIVES FUND
NOTES TO
CONSOLIDATED FINANCIAL STATEMENTS Continued
9. Fees and Other Transactions with Affiliates (Continued)
Trustees’ Compensation. The Fund has adopted an unfunded retirement plan (the “Plan”) for the Fund’s Independent Trustees. Benefits are based on years of service and fees paid to each Trustee during their period of service. The Plan was frozen with respect to adding new participants effective December 31, 2006 (the “Freeze Date”) and existing Plan Participants as of the Freeze Date will continue to receive accrued benefits under the Plan. Active Independent Trustees as of the Freeze Date have each elected a distribution method with respect to their benefits under the Plan.
During the reporting period, the Fund’s projected benefit obligations, payments to retired Trustees and accumulated liability were as follows:
| Projected Benefit Obligations Increased | $ | 2,259 | ||
| Payments Made to Retired Trustees | 27,561 | |||
| Accumulated Liability as of October 31, 2018 | 64,978 |
The Fund’s Board of Trustees (“Board”) has adopted a compensation deferral plan for Independent Trustees that enables Trustees to elect to defer receipt of all or a portion of the annual compensation they are entitled to receive from the Fund. For purposes of determining the amount owed to the Trustee under the plan, deferred amounts are treated as though equal dollar amounts had been invested in shares of the Fund or in other Oppenheimer funds selected by the Trustee. The Fund purchases shares of the funds selected for deferral by the Trustee in amounts equal to his or her deemed investment, resulting in a Fund asset equal to the deferred compensation liability. Such assets are included as a component of “Other” within the asset section of the Consolidated Statement of Assets and Liabilities. Deferral of Trustees’ fees under the plan will not affect the net assets of the Fund and will not materially affect the Fund’s assets, liabilities or net investment income per share. Amounts will be deferred until distributed in accordance with the compensation deferral plan.
Distribution and Service Plan (12b-1) Fees. Under its General Distributor’s Agreement with the Fund, OppenheimerFunds Distributor, Inc. (the “Distributor”) acts as the Fund’s principal underwriter in the continuous public offering of the Fund’s classes of shares.
Distribution and Service Plan for Class A Shares. The Fund has adopted a Distribution and Service Plan (the “Plan”) for Class A shares pursuant to Rule 12b-1 under the 1940 Act. Under the Plan, the Fund pays a service fee to the Distributor at an annual rate of 0.25% of the daily net assets of Class A shares. The Distributor currently uses all of those fees to pay dealers, brokers, banks and other financial institutions periodically for providing personal services and maintenance of accounts of their customers that hold Class A shares. Under the Plan, the Fund may also pay an asset-based sales charge to the Distributor. However, the Fund’s Board has currently set the rate at zero. Fees incurred by the Fund under the Plan are detailed in the Consolidated Statement of Operations.
Distribution and Service Plans for Class B, Class C and Class R Shares. The Fund has
98 OPPENHEIMER FUNDAMENTAL ALTERNATIVES FUND
9. Fees and Other Transactions with Affiliates (Continued)
adopted Distribution and Service Plans (the “Plans”) for Class C and Class R shares, and had previously adopted a similar plan for Class B shares, pursuant to Rule 12b-1 under the 1940 Act to compensate the Distributor for distributing those share classes, maintaining accounts and providing shareholder services. Under the Plans, the Fund pays the Distributor an annual asset-based sales charge of 0.75% on Class C shares’ daily net assets and 0.25% on Class R shares’ daily net assets. The Fund paid the Distributor an annual asset-based sales charge of 0.75% on Class B shares prior to their Conversion Date. The Fund also pays a service fee under the Plans at an annual rate of 0.25% of daily net assets and previously paid this fee for Class B prior to their Conversion Date. The Plans continue in effect from year to year only if the Fund’s Board of Trustees votes annually to approve their continuance at an in person meeting called for that purpose. Fees incurred by the Fund under the Plans are detailed in the Consolidated Statement of Operations.
Sales Charges. Front-end sales charges and CDSC do not represent expenses of the Fund. They are deducted from the proceeds of sales of Fund shares prior to investment or from redemption proceeds prior to remittance, as applicable. The sales charges retained by the Distributor from the sale of shares and the CDSC retained by the Distributor on the redemption of shares is shown in the following table for the period indicated.
| Year Ended | Class A Front-End Sales Charges Retained by Distributor | Class A Contingent Deferred Sales Charges Retained by Distributor | Class B Contingent Deferred Sales Charges | Class C Contingent Deferred Sales Charges Retained by Distributor | Class R Contingent Deferred Sales Charges Retained by Distributor | |||||||||||||||
| October 31, 2018 | $72,309 | $2,985 | $2,095 | $4,801 | $— | |||||||||||||||
1. Effective June 1, 2018, all Class B shares converted to Class A shares.
Waivers and Reimbursements of Expenses. The Manager has contractually agreed to waive the management fee it receives from the Fund in an amount equal to the management fee it receives from the Subsidiary. During the reporting period, the Manager waived $346,215. This fee waiver and/or expense reimbursement may not be amended or withdrawn for one year from the date of the Fund’s prospectus, unless approved by the Board.
Effective for the period January 1, 2017 through December 31, 2017, the Transfer Agent voluntarily waived and/or reimbursed Fund expenses in an amount equal to 0.015% of average annual net assets for Classes A, B, C, R and Y.
During the reporting period, the Transfer Agent waived fees and/or reimbursed the Fund for transfer agent and shareholder servicing agent fees as follows:
| Class A | $ | 13,881 | ||
| Class B1 | 53 | |||
| Class C | 2,733 | |||
| Class R | 525 | |||
| Class Y | 9,841 |
99 OPPENHEIMER FUNDAMENTAL ALTERNATIVES FUND
NOTES TO
CONSOLIDATED FINANCIAL STATEMENTS Continued
9. Fees and Other Transactions with Affiliates (Continued)
1. Effective June 1, 2018, all Class B shares converted to Class A shares.
The Manager will waive fees and/or reimburse Fund expenses in an amount equal to the indirect management fees incurred through the Fund’s investment in IGMMF. During the reporting period, the Manager waived fees and/or reimbursed the Fund $26,370 for IGMMF management fees. This fee waiver and/or expense reimbursement may not be amended or withdrawn for one year from the date of the Fund’s prospectus, unless approved by the Board.
10. Borrowings and Other Financing
Securities Sold Short. The Fund sells securities that it does not own, and it will therefore be obligated to purchase such securities at a future date. Upon entering into a short position, the Fund is required to segregate cash or securities at its custodian which are pledged for the benefit of the lending broker and/or to deposit and pledge cash directly at the lending broker, with a value equal to a certain percentage, exceeding 100%, of the value of the securities that it sold short. Cash that has been segregated and pledged for this purpose will be disclosed on the Consolidated Statement of Assets and Liabilities; securities that have been segregated and pledged for this purpose are disclosed as such in the Consolidated Statement of Investments. The aggregate market value of such cash and securities at period end is $468,239,589. The value of the open short position is recorded as a liability, and the Fund records an unrealized gain or loss to the extent of the difference between the proceeds received and the change in value of the open short position. The Fund records a realized gain or loss when the short position is closed out. By entering into short sales, the Fund bears the risk of an unlimited loss, since the price of the security sold short could theoretically increase without limit. Purchasing securities previously sold short to close out a short position can itself cause the price of the securities to rise further, thereby increasing the loss. Further, there is no assurance that a security the Fund needs to buy to cover a short position will be available for purchase at a reasonable price. Until the security is replaced, the Fund is required to pay the lender any dividend or interest earned. Dividend expense on short sales is treated as an expense in the Consolidated Statement of Operations.
Joint Credit Facility. A number of mutual funds managed by the Manager participate in a $1.95 billion revolving credit facility (the “Facility”) intended to provide short-term financing, if necessary, subject to certain restrictions in connection with atypical redemption activity. Expenses and fees related to the Facility are paid by the participating funds and are disclosed separately or as other expenses on the Consolidated Statement of Operations. The Fund did not utilize the Facility during the reporting period.
Loan Commitments. The Fund generally will maintain with its custodian, liquid investments having an aggregate value at least equal to the par value of unfunded loan commitments. At period end, these investments have a market value of $41,775 and have been included as Corporate Loans in the Statement of Investments. These commitments are subject to funding based on the borrower’s discretion. The Fund is obligated to fund these commitments at
100 OPPENHEIMER FUNDAMENTAL ALTERNATIVES FUND
10. Borrowings and Other Financing (Continued)
the time of the request by the borrower. These commitments have been excluded from the Statement of Investments. The unrealized appreciation/depreciation on these commitments is recorded as an asset/liability on the Statement of Assets and Liabilities.
11. Pending Acquisition
On October 18, 2018, Massachusetts Mutual Life Insurance Company (“MassMutual”), an indirect corporate parent of the Sub-Adviser and the Manager announced that it has entered into a definitive agreement, whereby Invesco Ltd. (“Invesco”), a global investment management company, will acquire the Sub-Adviser. As of the time of the announcement, the transaction is expected to close in the second quarter of 2019, pending necessary regulatory and other third-party approvals. This is subject to change.
101 OPPENHEIMER FUNDAMENTAL ALTERNATIVES FUND
REPORT OF INDEPENDENT REGISTERED PUBLIC ACCOUNTING FIRM
To the Shareholders and Board of Trustees
Oppenheimer Quest for Value Funds:
Opinion on the Consolidated Financial Statements
We have audited the accompanying consolidated statement of assets and liabilities of Oppenheimer Fundamental Alternatives Fund (the “Fund”), a series of Oppenheimer Quest for Value Funds, and subsidiary, including the consolidated statement of investments, as of October 31, 2018, the related consolidated statement of operations for the year then ended, the consolidated statements of changes in net assets for each of the years in the two year period then ended, and the related consolidated notes (collectively, the “consolidated financial statements”) and the consolidated financial highlights for each of the years in the five year period then ended. In our opinion, the consolidated financial statements and consolidated financial highlights present fairly, in all material respects, the consolidated financial position of the Fund and subsidiary as of October 31, 2018, the results of their consolidated operations for the year then ended, the changes in their consolidated net assets for each of the years in the two year period then ended, and the consolidated financial highlights for each of the years in the five year period then ended, in conformity with U.S. generally accepted accounting principles.
Basis for Opinion
These consolidated financial statements and consolidated financial highlights are the responsibility of the Fund’s management. Our responsibility is to express an opinion on these consolidated financial statements and consolidated financial highlights based on our audits. We are a public accounting firm registered with the Public Company Accounting Oversight Board (United States) (“PCAOB”) and are required to be independent with respect to the Fund and subsidiary in accordance with the U.S. federal securities laws and the applicable rules and regulations of the Securities and Exchange Commission and the PCAOB.
We conducted our audits in accordance with the standards of the PCAOB. Those standards require that we plan and perform the audit to obtain reasonable assurance about whether the consolidated financial statements and consolidated financial highlights are free of material misstatement, whether due to error or fraud. Our audits included performing procedures to assess the risks of material misstatement of the consolidated financial statements and consolidated financial highlights, whether due to error or fraud, and performing procedures that respond to those risks. Such procedures included examining, on a test basis, evidence regarding the amounts and disclosures in the consolidated financial statements and consolidated financial highlights. Such procedures also included confirmation of securities owned as of October 31, 2018, by correspondence with the custodian, brokers and the transfer agent, or by other appropriate auditing procedures. Our audits also included evaluating the accounting principles used and significant estimates made by management, as well as evaluating the overall presentation of the consolidated financial statements and consolidated financial highlights. We believe that our audits provide a reasonable basis for our opinion.
KPMGLLP
We have not been able to determine the specific year that we began serving as the auditor of one or more Oppenheimer Funds investment companies, however we are aware that we have served as the auditor of one or more Oppenheimer Funds investment companies since at least 1969.
Denver, Colorado
December 21, 2018
102 OPPENHEIMER FUNDAMENTAL ALTERNATIVES FUND
FEDERAL INCOME TAX INFORMATION Unaudited
In early 2018, if applicable, shareholders of record received information regarding all dividends and distributions paid to them by the Fund during calendar year 2017.
Dividends, if any, paid by the Fund during the reporting period which are not designated as capital gain distributions should be multiplied by the maximum amount allowable but not less than 100% to arrive at the amount eligible for the corporate dividend-received deduction.
A portion, if any, of the dividends paid by the Fund during the reporting period which are not designated as capital gain distributions are eligible for lower individual income tax rates to the extent that the Fund has received qualified dividend income as stipulated by recent tax legislation. The maximum amount allowable but not less than $19,080,962 of the Fund’s fiscal year taxable income may be eligible for the lower individual income tax rates. In early 2018, shareholders of record received information regarding the percentage of distributions that are eligible for lower individual income tax rates.
Recent tax legislation allows a regulated investment company to designate distributions not designated as capital gain distributions, as either interest related dividends or short-term capital gain dividends, both of which are exempt from the U.S. withholding tax applicable to non U.S. taxpayers. For the reporting period, the maximum amount allowable but not less than $6,178,130 of the ordinary distributions to be paid by the Fund qualifies as an interest related dividend.
The foregoing information is presented to assist shareholders in reporting distributions received from the Fund to the Internal Revenue Service. Because of the complexity of the federal regulations which may affect your individual tax return and the many variations in state and local tax regulations, we recommend that you consult your tax advisor for specific guidance.
103 OPPENHEIMER FUNDAMENTAL ALTERNATIVES FUND
BOARD APPROVAL OF THE FUND’S INVESTMENT ADVISORY
AND SUB-ADVISORY AGREEMENTS Unaudited
The Fund has entered into an investment advisory agreement with OFI Global Asset Management, Inc. (“OFI Global” or the “Adviser”), a wholly-owned subsidiary of OppenheimerFunds, Inc. (“OFI” or the “Sub-Adviser”) (“OFI Global” and “OFI” together the “Managers”) and OFI Global has entered into a sub-advisory agreement with OFI whereby OFI provides investment sub-advisory services to the Fund (collectively, the “Agreements”). Each year, the Board of Trustees (the “Board”), including a majority of the independent Trustees, is required to determine whether to approve the terms of the Agreements and the renewal thereof. The Investment Company Act of 1940, as amended, requires that the Board request and evaluate, and that the Managers provide, such information as may be reasonably necessary to evaluate the terms of the Agreements. The Board employs an independent consultant to prepare a report that provides information, including comparative information that the Board requests for that purpose. In addition to in-person meetings focused on this evaluation, the Board receives information throughout the year regarding Fund services, fees, expenses and performance.
The Managers and the independent consultant provided information to the Board on the following factors: (i) the nature, quality and extent of the Managers’ services, (ii) the comparative investment performance of the Fund and the Managers, (iii) the fees and expenses of the Fund, including comparative fee and expense information, (iv) the profitability of the Managers and their affiliates, including an analysis of the cost of providing services, (v) whether economies of scale are realized as the Fund grows and whether fee levels reflect these economies of scale for Fund investors and (vi) other benefits to the Managers from their relationship with the Fund. The Board was aware that there are alternatives to retaining the Managers.
Outlined below is a summary of the principal information considered by the Board as well as the Board’s conclusions.
Nature, Quality and Extent of Services. The Board considered information about the nature, quality and extent of the services provided to the Fund and information regarding the Managers’ key personnel who provide such services. The Managers’ duties include providing the Fund with the services of the Sub-Adviser’s portfolio manager and investment team, who provide research, analysis and other advisory services in regard to the Fund’s investments; and securities trading services. OFI Global is responsible for oversight of third-party service providers; monitoring compliance with applicable Fund policies and procedures and adherence to the Fund’s investment restrictions; risk management; and oversight of the Sub-Adviser. OFI Global is also responsible for providing certain administrative services to the Fund. Those services include providing and supervising all administrative and clerical personnel who are necessary in order to provide effective corporate administration for the Fund; compiling and maintaining records with respect to the Fund’s operations; preparing and filing reports required by the U.S. Securities and Exchange Commission; preparing periodic reports regarding the operations of the Fund for its shareholders; preparing proxy materials for shareholder meetings; and preparing the registration statements required by federal and state securities laws for the sale of the Fund’s shares. OFI Global also provides the Fund with office space, facilities and equipment.
104 OPPENHEIMER FUNDAMENTAL ALTERNATIVES FUND
The Board also considered the quality of the services provided and the quality of the Managers’ resources that are available to the Fund. The Board took account of the fact that the Sub-Adviser has over fifty years of experience as an investment adviser and that its assets under management rank it among the top mutual fund managers in the United States. The Board evaluated the Managers’ advisory, administrative, accounting, legal, compliance and risk management services, among other services, and information the Board has received regarding the experience and professional qualifications of the Managers’ key personnel and the size and functions of their staff. In its evaluation of the quality of the portfolio management services provided, the Board considered the experience of Michelle Borré, the portfolio manager for the Fund, and the Sub-Adviser’s investment team and analysts. The Board members also considered the totality of their experiences with the Managers as directors or trustees of the Fund and other funds advised by the Managers. The Board considered information regarding the quality of services provided by affiliates of the Managers, which the Board members have become knowledgeable about through their experiences with the Managers and in connection with the review or renewal of the Fund’s service agreements or service providers. The Board concluded, in light of the Managers’ experience, reputation, personnel, operations and resources that the Fund benefits from the services provided under the Agreements.
Investment Performance of the Managers and the Fund. Throughout the year, the Managers provided information on the investment performance of the Fund, the Adviser and the Sub-Adviser, including comparative performance information. The Board also reviewed information, prepared by the Managers and by the independent consultant, comparing the Fund’s historical performance to relevant benchmarks or market indices and to the performance of other retail funds in the multialternative category. The Board noted that the Fund’s five-year performance was better than its category median although its one-year, three-year and ten-year performance was below its category median.
Fees and Expenses of the Fund. The Board reviewed the fees paid to the Adviser and the other expenses borne by the Fund. The Board noted that the Adviser, not the Fund, pays the Sub-Adviser’s fee under the sub-advisory agreement. The independent consultant provided comparative data in regard to the fees and expenses of the Fund and other retail front-end load multialternative funds with comparable asset levels and distribution features. The Board noted that the Fund’s contractual management fee and total expenses, net of waivers, were lower than its peer group median and category median.
Economies of Scale and Profits Realized by the Managers. The Board considered information regarding the Managers’ costs in serving as the Fund’s investment adviser and sub-adviser, including the costs associated with the personnel and systems necessary to manage the Fund, and information regarding the Managers’ profitability from their relationship with the Fund. The Board also considered that the Managers must be able to pay and retain experienced professional personnel at competitive rates to provide quality services to the Fund. The Board reviewed whether the Managers may realize economies of scale in managing and supporting the Fund. The Board noted that the Fund currently has management fee breakpoints, which are intended to share with Fund shareholders economies of scale that may exist as the Fund’s assets grow.
105 OPPENHEIMER FUNDAMENTAL ALTERNATIVES FUND
BOARD APPROVAL OF THE FUND’S INVESTMENT ADVISORY
AND SUB-ADVISORY AGREEMENTS Unaudited / Continued
Other Benefits to the Managers. In addition to considering the profits realized by the Managers, the Board considered information that was provided regarding the direct and indirect benefits the Managers receive as a result of their relationship with the Fund, including compensation paid to the Managers’ affiliates and research provided to the Adviser in connection with permissible brokerage arrangements (soft dollar arrangements).
Conclusions. These factors were also considered by the independent Trustees meeting separately from the full Board, assisted by experienced counsel to the Fund and to the independent Trustees. Fund counsel and the independent Trustees’ counsel are independent of the Managers within the meaning and intent of the Securities and Exchange Commission Rules.
Based on its review of the information it received and its evaluations described above, the Board, including a majority of the independent Trustees, decided to continue the Agreements through September 30, 2019. In arriving at its decision, the Board did not identify any factor or factors as being more important than others, but considered all of the above information, and considered the terms and conditions of the Agreements, including the management fees, in light of all the surrounding circumstances.
106 OPPENHEIMER FUNDAMENTAL ALTERNATIVES FUND
PORTFOLIO PROXY VOTING POLICIES AND GUIDELINES;
UPDATES TO STATEMENT OF INVESTMENTS Unaudited
The Fund has adopted Portfolio Proxy Voting Policies and Guidelines under which the Fund votes proxies relating to securities (“portfolio proxies”) held by the Fund. A description of the Fund’s Portfolio Proxy Voting Policies and Guidelines is available (i) without charge, upon request, by calling the Fund toll-free at 1.800.CALL OPP (225.5677), (ii) on the Fund’s website at www.oppenheimerfunds.com, and (iii) on the SEC’s website at www.sec.gov. In addition, the Fund is required to file Form N-PX, with its complete proxy voting record for the 12 months ended June 30th, no later than August 31st of each year. The Fund’s voting record is available (i) without charge, upon request, by calling the Fund toll-free at 1.800.CALL OPP (225.5677), and (ii) in the Form N-PX filing on the SEC’s website at www.sec.gov.
The Fund files its complete schedule of portfolio holdings with the SEC for the first quarter and the third quarter of each fiscal year on Form N-Q. The Fund’s Form N-Q filings are available on the SEC’s website at www.sec.gov.
Householding—Delivery of Shareholder Documents
This is to inform you about OppenheimerFunds’ “householding” policy. If more than one member of your household maintains an account in a particular fund, OppenheimerFunds will mail only one copy of the fund’s prospectus (or, if available, the fund’s summary prospectus), annual and semiannual report and privacy policy. The consolidation of these mailings, called householding, benefits your fund through reduced mailing expense, and benefits you by reducing the volume of mail you receive from OppenheimerFunds. Householding does not affect the delivery of your account statements.
Please note that we will continue to household these mailings for as long as you remain an OppenheimerFunds shareholder, unless you request otherwise. If you prefer to receive multiple copies of these materials, please call us at 1.800.CALL-OPP (225-5677). You may also notify us in writing or via email. We will begin sending you individual copies of the prospectus (or, if available, the summary prospectus), reports and privacy policy within 30 days of receiving your request to stop householding.
107 OPPENHEIMER FUNDAMENTAL ALTERNATIVES FUND
TRUSTEES AND OFFICERS Unaudited
Name, Position(s) Held with the Fund, Length of Service, Year of Birth | Principal Occupation(s) During the Past 5 Years; Other Trusteeships/Directorships Held; Number of Portfolios in the Fund Complex Currently Overseen | |
| INDEPENDENT TRUSTEES | The address of each Trustee in the chart below is 6803 S. Tucson Way, Centennial, Colorado 80112-3924. Each Trustee serves for an indefinite term, or until his or her resignation, retirement, death or removal. Each of the Trustees in the chart below oversee 47 portfolios in the OppenheimerFunds complex. | |
Brian F. Wruble, Chairman of the Board of Trustees (since 2009), Trustee (since 2001) Year of Birth: 1943 | Governor of Community Foundation of the Florida Keys (non-profit) (since July 2012); Director of TCP Capital, Inc. (registered business development company) (since November 2015); Chairman Emeritus of the Board of Trustees (since August 2011), Chairman of the Board of Trustees (August 2007-August 2011), Trustee of the Board of Trustees (since August 1991) of The Jackson Laboratory (non-profit); Member of Zurich Insurance Group’s Investment Management Advisory Council (insurance) (October 2004-February 2017); Treasurer (since 2007) and Trustee (since May 1992) of the Institute for Advanced Study (non-profit educational institute); Director of Special Value Opportunities Fund, LLC (registered investment company) (affiliate of the Sub-Adviser’s parent company) (September 2004- June 2015); General Partner of Odyssey Partners, L.P. (hedge fund) (September 1995-December 2007); Special Limited Partner of Odyssey Investment Partners, LLC (private equity investment) (January 1999-September 2004). Mr. Wruble has served on the Boards of certain Oppenheimer funds since April 2001, during which time he has become familiar with the Fund’s (and other Oppenheimer funds’) financial, accounting, regulatory and investment matters and has contributed to the Board’s deliberations. | |
Beth Ann Brown, Trustee (since 2016) Year of Birth: 1968 | Director, Board of Directors of Caron Engineering Inc. (since January 2018); Advisor, Board of Advisors of Caron Engineering Inc. (December 2014-December 2017); Independent Consultant (since September 2012); held the following positions at Columbia Management Investment Advisers LLC: Head of Intermediary Distribution (2008-2012), Managing Director, Strategic Relations (2005-2008), Managing Director, Head of National Accounts (2004-2005); Senior Vice President, National Account Manager (2002-2004), Senior Vice President, Key Account Manager (1999-2002) and Vice President, Key Account Manager (1996-1999) of Liberty Funds Distributor, Inc.; President and Director, of Acton Shapleigh Youth Conservation Corps (non -profit) (2012-2015); and Vice President and Director of Grahamtastic Connection (non-profit) (since May 2013). Ms. Brown has served on the Boards of certain Oppenheimer funds since January 2016, during which time she has become familiar with the Fund’s (and other Oppenheimer funds’) financial, accounting, regulatory and investment matters and has contributed to the Board’s deliberations. | |
Edmund P. Giambastiani, Jr., Trustee (since 2013) Year of Birth: 1948 | Director of THL Credit, Inc. (since November 2016) (alternative credit investment manager); Advisory Board Member of the Maxwell School of Citizenship and Public Affairs of Syracuse University (April 2012-September 2016); Director of Mercury Defense Systems Inc. (information technology) (August 2011-February 2013); Trustee of the U.S. Naval Academy Foundation Athletic & Scholarship Program (since November 2010); Advisory Board Member of the Massachusetts Institute of Technology Lincoln Laboratory (federally-funded research development) | |
108 OPPENHEIMER FUNDAMENTAL ALTERNATIVES FUND
Edmund P. Giambastiani, Jr., Continued | (since May 2010); Director of The Boeing Company (aerospace and defense) (since October 2009); Trustee of MITRE Corporation (federally-funded research development) (since September 2008); Independent Director of QinetiQ Group Plc (defense technology and security) (February 2008-August 2011); Chairman of Monster Worldwide, Inc. (career services) (March 2015-November 2016), Director of Monster Worldwide, Inc. (career services) (February 2008-June 2011); Lead Director (June 2011-March 2015); Chairman of Alenia North America, Inc. (military and defense products) (January 2008-October 2009); Director of SRA International, Inc. (information technology and services) (January 2008-July 2011); President of Giambastiani Group LLC (national security and energy consulting) (since October 2007); United States Navy, career nuclear submarine officer (June 1970-October 2007); Seventh Vice Chairman of the Joint Chiefs of Staff (2005-October 2007); Supreme Allied Commander of NATO Allied Command Transformation (2003- 2005) and Commander, U.S. Joint Forces Command (2002-2005). Since his retirement from the U.S. Navy in October 2007, Admiral Giambastiani has also served on numerous U.S. Government advisory boards, investigations and task forces for the Secretaries of Defense, State and Interior and the Central Intelligence Agency. He recently completed serving as a federal commissioner on the Military Compensation and Retirement Modernization Commission. Admiral Giambastiani has served on the Boards of certain Oppenheimer funds since February 2013, during which time he has become familiar with the Fund’s (and other Oppenheimer funds’) financial, accounting, regulatory and investment matters and has contributed to the Board’s deliberations. | |
Elizabeth Krentzman, Trustee (since 2014) Year of Birth: 1959 | Trustee of the University of Florida National Board Foundation (since September 2017); Member of the Cartica Funds Board of Directors (private investment funds) (since January 2017); Member of the University of Florida Law Center Association, Inc. Board of Trustees and Audit Committee Member (since April 2016); Member of University of Florida Law Advisory Board, Washington, DC Alumni Group (since 2015); Advisory Board Member of the Securities and Exchange Commission Historical Society (since 2007); held the following positions at Deloitte & Touche LLP: Principal and Chief Regulatory Advisor for Asset Management Services (2007 - 2014) and U.S. Mutual Fund Leader (2011 - 2014); General Counsel of the Investment Company Institute (trade association) (June 2004 - April 2007); held the following positions at Deloitte & Touche LLP: National Director of the Investment Management Regulatory Consulting Practice (1997 - 2004), Principal (2003 - 2004), Director (1998 - 2003) and Senior Manager (1997 - 1998); Assistant Director of the Division of Investment Management - Office of Disclosure and Investment Adviser Regulation of the U.S. Securities and Exchange Commission (1996 - 1997) and various positions with the Division of Investment Management – Office of Regulatory Policy (1991 - 1996) of the U.S. Securities and Exchange Commission; Associate at Ropes & Gray LLP (1987 – 1991). Ms. Krentzman has served on the Boards of certain Oppenheimer funds since August 2014, during which time she has become familiar with the Fund’s (and other Oppenheimer funds’) financial, accounting, regulatory and investment matters and has contributed to the Board’s deliberations. | |
109 OPPENHEIMER FUNDAMENTAL ALTERNATIVES FUND
TRUSTEES AND OFFICERS Unaudited / Continued
Mary F. Miller, Trustee (since 2009) Year of Birth: 1942 | Trustee of International House (not-for-profit) (since June 2007); Trustee of the American Symphony Orchestra (not-for-profit) (October 1998-November 2011); and Senior Vice President and General Auditor of American Express Company (financial services company) (July 1998-February 2003). Ms. Miller has served on the Boards of certain Oppenheimer funds since August 2004, during which time she has become familiar with the Fund’s (and other Oppenheimer funds’) financial, accounting, regulatory and investment matters and has contributed to the Board’s deliberations. | |
Joel W. Motley, Trustee (since 2009) Year of Birth: 1952 | Director of Office of Finance Federal Home Loan Bank (since September 2016); Director of Greenwall Foundation (since October 2013); Member of Board and Investment Committee of The Greenwall Foundation (since April 2013); Member of the Vestry of Trinity Wall Street (since April 2012); Director of Southern Africa Legal Services Foundation (since March 2012); Board Member and Investment Committee Member of Pulitzer Center for Crisis Reporting (non-profit journalism) (since March 2011); Managing Director of Public Capital Advisors, LLC (privately- held financial advisor) (since January 2006); Managing Director of Carmona Motley, Inc. (privately-held financial advisor) (since January 2002); Director of Columbia Equity Financial Corp. (privately-held financial advisor) (2002-2007); Managing Director of Carmona Motley Hoffman Inc. (privately-held financial advisor) (January 1998-December 2001); Member of the Finance and Budget Committee of the Council on Foreign Relations, Member of the Investment Committee and Board of Human Rights Watch (since July 2000) and Member of the Investment Committee and Board of Historic Hudson Valley (since February 2010). Mr. Motley has served on the Boards of certain Oppenheimer funds since October 2002, during which time he has become familiar with the Fund’s (and other Oppenheimer funds’) financial, accounting, regulatory and investment matters and has contributed to the Board’s deliberations. | |
Joanne Pace, Trustee (since 2012) Year of Birth: 1958 | Advisory Board Director of Massey Quick Simon & Co. (wealth management), LLC (since October 2014); Board Director of Horizon Blue Cross Blue Shield of New Jersey (healthcare) (since November 2012); Advisory Board Director of The Alberleen Group LLC (investment banking) (since March 2012); Governing Council Member (since 2016) and Chair of Education Committee (since 2017) of Independent Directors Council (IDC) (since 2016); Board Member of 100 Women in Finance (non-profit) (since January 2015); Advisory Council Member of Morgan Stanley Children’s Hospital (non-profit) (since May 2012); Director of The Komera Project (non-profit) (April 2012-2016); New York Advisory Board Director of Peace First (non-profit) (March 2010-2013); Senior Advisor of SECOR Asset Management, LP (2010-2011); Managing Director and Chief Operating Officer of Morgan Stanley Investment Management (2006-2010); Partner and Chief Operating Officer of FrontPoint Partners, LLC (hedge fund) (2005-2006); held the following positions at Credit Suisse (investment banking): Managing Director (2003-2005); Global Head of Human Resources and member of Executive Board and Operating Committee (2004-2005), Global Head of Operations and Product Control (2003-2004); held the following positions at Morgan Stanley: Managing Director (1997-2003), Controller and Principal Accounting Officer (1999-2003); Chief Financial Officer (temporary assignment) for the Oversight Committee, Long Term Capital Management (1998-1999). Lead Independent Director and Chair of the Audit and Nominating Committee of The Global Chartist Fund, LLC of Oppenheimer Asset Management (2011-2012); Board Director of Managed Funds Association (2008-2010); Board Director of Morgan Stanley Foundation (2007- 2010) and Investment Committee Chair (2008-2010). Ms. Pace has served on the | |
110 OPPENHEIMER FUNDAMENTAL ALTERNATIVES FUND
Joanne Pace, Continued | Boards of certain Oppenheimer funds since November 2012, during which time she has become familiar with the Fund’s (and other Oppenheimer funds’) financial, accounting, regulatory and investment matters and has contributed to the Board’s deliberations. | |
Daniel Vandivort, Trustee (since 2014) Year of Birth: 1954 | Chairman and Lead Independent Director/Trustee (March 2010-September 2014), Chairman of the Audit Committee (March 2009-September 2014) and Director/Trustee (December 2008-September 2014) of the Board of Directors/ Trustees of Value Line Funds; Trustee (since January 2015) and Treasurer and Chairman of the Audit Committee and Finance Committee (since January 2016) of Board of Trustees of Huntington Disease Foundation of America; Trustee, Board of Trustees, RIM Retirement Savings Plan (2005-2007); President and Chief Investment Officer, Robeco Investment Management, formerly known as Weiss Peck and Greer (January 2005-June 2007); Member, Management Committee of Robeco Investment Management (2001-2007); Chairman and Trustee of the Board of Trustees of Weiss, Peck and Greer Funds (2004-2005); Managing Director and Head of Fixed Income, Weiss, Peck and Greer (November 1994-January 2005); Managing Director and Head of Fixed Income, CS First Boston Investment Management (January 1992-November 1994); Director, Global Product Development, First Boston Asset Management (November 1989-January 1992); Vice President, Fixed Income Sales, First Boston Corp. (May 1984-November 1989). Mr. Vandivort has served on the Boards of certain Oppenheimer funds since 2014, during which time he has become familiar with the Fund’s (and other Oppenheimer funds’) financial, accounting, regulatory and investment matters and has contributed to the Board’s deliberations.
| |
INTERESTED TRUSTEE AND OFFICER |
Mr. Steinmetz is an “Interested Trustee” because he is affiliated with the Manager and the Sub-Adviser by virtue of his positions as Chairman and director of the Sub-Adviser and officer and director of the Manager. Both as a Trustee and as an officer, Mr. Steinmetz serves for an indefinite term, or until his resignation, retirement, death or removal. Mr. Steinmetz’s address is 225 Liberty Street, New York, New York 10281-1008. Mr. Steinmetz is an officer of 105 portfolios in the OppenheimerFunds complex. | |
Arthur P. Steinmetz, Trustee (since 2015), President and Principal Executive Officer (since 2014) Year of Birth: 1958 | Chairman of OppenheimerFunds, Inc. (since January 2015); CEO and Chairman of OFI Global Asset Management, Inc. (since July 2014), President of OFI Global Asset Management, Inc. (since May 2013), a Director of OFI Global Asset Management, Inc. (since January 2013), Director of OppenheimerFunds, Inc. (since July 2014), President, Management Director and CEO of Oppenheimer Acquisition Corp. (OppenheimerFunds, Inc.’s parent holding company) (since July 2014), and President and Director of OFI SteelPath, Inc. (since January 2013). Chief Investment Officer of the OppenheimerFunds advisory entities (January 2013-December 2013); Executive Vice President of OFI Global Asset Management, Inc. (January 2013-May 2013); Chief Investment Officer of OppenheimerFunds, Inc. (October 2010-December 2012); Chief Investment Officer, Fixed-Income, of OppenheimerFunds, Inc. (April 2009-October 2010); Executive Vice President of OppenheimerFunds, Inc. (October 2009-December 2012); Director of Fixed Income of OppenheimerFunds, Inc. (January 2009-April 2009); and a Senior Vice President of OppenheimerFunds, Inc. (March 1993-September 2009).
| |
OTHER OFFICERS OF THE FUND |
The addresses of the Officers in the chart below are as follows: for Mss. Lo Bessette, Borré, Foxson and Picciotto, 225 Liberty Street, New York, New York 10281-1008, for Mr. Petersen, 6803 S. Tucson Way, Centennial, Colorado 80112-3924. Each Officer serves for an indefinite term or until his or her resignation, retirement, death or removal. | |
111 OPPENHEIMER FUNDAMENTAL ALTERNATIVES FUND
TRUSTEES AND OFFICERS Unaudited / Continued
Michelle Borré, Vice President (since 2011) Year of Birth: 1967 | Senior Vice President of the Sub-Adviser (since January 2016); Senior Portfolio Manager of the Sub-Adviser (since April 2009); Vice President of the Sub-Adviser (April 2003-January 2016); Senior Research Analyst of the Sub-Adviser (February 2003-April 2009). Ms. Borre held various positions, including Managing Director and Partner, at J&W Seligman (July 1996 -January 2003); Adjunct Professor of Finance and Economics at Columbia Business School (2003-2013); Served on the Executive Advisory Board at the Heilbrunn Center for Graham and Dodd Investing at Columbia Business School (from 2004 to 2005). | |
Cynthia Lo Bessette, Secretary and Chief Legal Officer (since 2016) Year of Birth: 1969 | Executive Vice President, General Counsel and Secretary of the Manager (since February 2016); Senior Vice President and Deputy General Counsel of the Manager (March 2015-February 2016); Chief Legal Officer of the Sub-Adviser and the Distributor (since February 2016); Vice President, General Counsel and Secretary of Oppenheimer Acquisition Corp. (since February 2016); General Counsel of OFI SteelPath, Inc., VTL Associates, LLC and Index Management Solutions, LLC (since February 2016); Chief Legal Officer of OFI Global Institutional, Inc., HarbourView Asset Management Corporation, OFI Global Trust Company, Oppenheimer Real Asset Management, Inc., OFI Private Investments Inc., Shareholder Services, Inc. and Trinity Investment Management Corporation (since February 2016); Corporate Counsel (February 2012-March 2015) and Deputy Chief Legal Officer (April 2013-March 2015) of Jennison Associates LLC; Assistant General Counsel (April 2008-September 2009) and Deputy General Counsel (October 2009-February 2012) of Lord Abbett & Co. LLC. | |
Jennifer Foxson, Vice President and Chief Business Officer (since 2014) Year of Birth: 1969 | Senior Vice President of OppenheimerFunds Distributor, Inc. (since June 2014); Vice President of OppenheimerFunds Distributor, Inc. (April 2006-June 2014); Vice President of the Sub-Adviser (January 1998-March 2006); Assistant Vice President of the Sub-Adviser (October 1991-December 1998). | |
Mary Ann Picciotto, Chief Compliance Officer and Chief Anti-Money Laundering Officer (since 2014) Year of Birth: 1973 | Senior Vice President and Chief Compliance Officer of the Manager (since March 2014); Chief Compliance Officer of the Sub-Adviser, OFI SteelPath, Inc., OFI Global Trust Company, OFI Global Institutional, Inc., Oppenheimer Real Asset Management, Inc., OFI Private Investments, Inc., Harborview Asset Management Corporation, Trinity Investment Management Corporation, and Shareholder Services, Inc. (since March 2014); Managing Director of Morgan Stanley Investment Management Inc. and certain of its various affiliated entities; Chief Compliance Officer of various Morgan Stanley Funds (May 2010-January 2014); Chief Compliance Officer of Morgan Stanley Investment Management Inc. (April 2007-January 2014). | |
Brian S. Petersen, Treasurer and Principal Financial & Accounting Officer (since 2016) Year of Birth: 1970 | Senior Vice President of the Manager (since January 2017); Vice President of the Manager (January 2013-January 2017); Vice President of the Sub-Adviser (February 2007-December 2012); Assistant Vice President of the Sub-Adviser (August 2002- 2007). | |
The Fund’s Statement of Additional Information contains additional information about the Fund’s Trustees and Officers and is available without charge upon request, by calling 1.800.CALL OPP (225.5677).
112 OPPENHEIMER FUNDAMENTAL ALTERNATIVES FUND
OPPENHEIMER FUNDAMENTAL ALTERNATIVES FUND
| Manager | OFI Global Asset Management, Inc. | |
| Sub-Adviser | OppenheimerFunds, Inc. | |
| Distributor | OppenheimerFunds Distributor, Inc. | |
| Transfer and Shareholder Servicing Agent | OFI Global Asset Management, Inc. | |
| Sub-Transfer Agent | Shareholder Services, Inc. DBA OppenheimerFunds Services | |
| Independent Registered Public Accounting Firm | KPMG LLP | |
| Legal Counsel | Kramer Levin Naftalis & Frankel LLP | |
© 2018 OppenheimerFunds, Inc. All rights reserved.
113 OPPENHEIMER FUNDAMENTAL ALTERNATIVES FUND
As an Oppenheimer fund shareholder, you are entitled to know how we protect your personal information and how we limit its disclosure.
Information Sources
We obtain non-public personal information about our shareholders from the following sources:
| · | Applications or other forms. |
| · | When you create a user ID and password for online account access. |
| · | When you enroll in eDocs Direct,SM our electronic document delivery service. |
| · | Your transactions with us, our affiliates or others. |
| · | Technologies on our website, including: “cookies” and web beacons, which are used to collect data on the pages you visit and the features you use. |
If you visit oppenheimerfunds.com and do not log on to the secure account information areas, we do not obtain any personal information about you. When you do log on to a secure area, we do obtain your user ID and password to identify you. We also use this information to provide you with products and services you have requested, to inform you about products and services that you may be interested in and assist you in other ways.
We do not collect personal information through our website unless you willingly provide it to us, either directly by email or in those areas of the website that request information. In order to update your personal information (including your mailing address, email address and phone number) you must first log on and visit your user profile.
If you have set your browser to warn you before accepting cookies, you will receive the warning message with each cookie. You can refuse cookies by turning them off in your browser. However, doing so may limit your access to certain sections of our website.
We use cookies to help us improve and manage our website. For example, cookies help us recognize new versus repeat visitors to the site, track the pages visited, and enable some special features on the website. This data helps us provide better service for our website visitors.
Protection of Information
We do not disclose any non-public personal information (such as names on a customer list) about current or former customers to anyone, except as permitted by law.
Disclosure of Information
Copies of confirmations, account statements and other documents reporting activity in your fund accounts are made available to your financial advisor (as designated by you). We may also use details about you and your investments to help us, our financial service affiliates, or firms that jointly market their financial products and services with ours, to better serve your investment needs or suggest educational material that may be of interest to you. If this requires us to provide you with an opportunity to “opt in” or “opt out” of such information sharing with a firm not affiliated with us, you will receive notification on how to do so, before any such sharing takes place.
Right of Refusal
We will not disclose your personal information to unaffiliated third parties (except as permitted by law), unless we first offer you a reasonable opportunity to refuse or “opt out” of such disclosure.
114 OPPENHEIMER FUNDAMENTAL ALTERNATIVES FUND
Internet Security and Encryption
In general, the email services provided by our website are encrypted and provide a secure and private means of communication with us. To protect your own privacy, confidential and/ or personal information should only be communicated via email when you are advised that you are using a secure website.
As a security measure, we do not include personal or account information in non-secure emails, and we advise you not to send such information to us in non-secure emails. Instead, you may take advantage of the secure features of our website to encrypt your email correspondence. To do this, you will need to use a browser that supports Secure Sockets Layer (SSL) protocol.
| · | All transactions conducted via our websites, including redemptions, exchanges and purchases, are secured by the highest encryption standards available. SSL is used to establish a secure connection between your PC and OppenheimerFunds’ server. It transmits information in an encrypted and scrambled format. |
| · | Encryption is achieved through an electronic scrambling technology that uses a “key” to code and then decode the data. Encryption acts like the cable converter box you may have on your television set. It scrambles data with a secret code so that no one can make sense of it while it is being transmitted. When the data reaches its destination, the same software unscrambles the data. |
| · | You can exit the secure area by closing your browser or, for added security, you can use the Log Out button before you close your browser. |
Other Security Measures
We maintain physical, electronic and procedural safeguards to protect your personal account information. Our employees and agents have access to that information only so that they may offer you products or provide services, for example, when responding to your account questions.
How You Can Help
You can also do your part to keep your account information private and to prevent unauthorized transactions. If you obtain a user ID and password for your account, safeguard that information. Strengthening your online credentials–your online security profile–typically your user name, password, and security questions and answers, can be one of your most important lines of defense on the Internet. For additional information on how you can help prevent identity theft, visit https://www. oppenheimerfunds.com/security.
Who We Are
This joint notice describes the privacy policies of the Oppenheimer funds, OppenheimerFunds, Inc., each of its investment adviser subsidiaries, OppenheimerFunds Distributor, Inc. and OFI Global Trust Co. It applies to all Oppenheimer fund accounts you presently have, or may open in the future, using your Social Security number—whether or not you remain a shareholder of our funds. This notice was last updated as of November 2017. In the event it is updated or changed, we will post an updated notice on our website at oppenheimerfunds.com. If you have any questions about this privacy policy, email us by clicking on the Contact Us section of our website at oppenheimerfunds.com, write to us at P.O. Box 5270, Denver, CO 80217-5270, or call us at 800 CALL OPP (225 5677).
115 OPPENHEIMER FUNDAMENTAL ALTERNATIVES FUND
THIS PAGE INTENTIONALLY LEFT BLANK.
116 OPPENHEIMER FUNDAMENTAL ALTERNATIVES FUND
THIS PAGE INTENTIONALLY LEFT BLANK.
117 OPPENHEIMER FUNDAMENTAL ALTERNATIVES FUND
THIS PAGE INTENTIONALLY LEFT BLANK.
118 OPPENHEIMER FUNDAMENTAL ALTERNATIVES FUND
THIS PAGE INTENTIONALLY LEFT BLANK.
119 OPPENHEIMER FUNDAMENTAL ALTERNATIVES FUND
| ||||||
| Visit us at oppenheimerfunds.com for 24-hr access to account information and transactions or call us at 800.CALL OPP (800.225.5677) for 24-hr automated information and automated transactions. Representatives also available Mon–Fri 8am-8pm ET. | ||||||
| Visit Us oppenheimerfunds.com | ||||||
Call Us 800 225 5677 | ||||||
Follow Us
| Oppenheimer funds are distributed by OppenheimerFunds Distributor, Inc. 225 Liberty Street, New York, NY 10281-1008 © 2018 OppenheimerFunds Distributor, Inc. All rights reserved.
RA0236.001.1018 December 21, 2018 | |||||


Annual Report
|
| 10/31/2018
|
| |||||||
| ||||||||||
| ||||||||||

An Important Update
On October 18, 2018, Massachusetts Mutual Life Insurance Company, an indirect corporate parent of OppenheimerFunds, Inc. and its subsidiaries OFI Global Asset Management, Inc., OFI SteelPath, Inc. and OFI Advisors, LLC, announced that it has entered into an agreement whereby Invesco Ltd., a global investment management company, will acquire OppenheimerFunds, Inc. As of the date of this report, the transaction is expected to close in the second quarter of 2019, pending necessary regulatory and other third-party approvals. This is subject to change.
Class A Shares
AVERAGE ANNUAL TOTAL RETURNS AT 10/31/18
Class A Shares of the Fund | ||||||||||
| Without Sales Charge | With Sales Charge | Russell MidCap Value Index | ||||||||
| 1-Year | -5.00% | -10.46% | 0.16% | |||||||
| 5-Year | 6.17 | 4.92 | 8.11 | |||||||
| 10-Year | 11.21 | 10.55 | 13.35 | |||||||
Performance data quoted represents past performance, which does not guarantee future results. The investment return and principal value of an investment in the Fund will fluctuate so that an investor’s shares, when redeemed, may be worth more or less than their original cost. Fund returns include changes in share price, reinvested distributions, and a 5.75% maximum applicable sales charge except where “without sales charge” is indicated. Current performance may be lower or higher than the performance quoted. Returns do not consider capital gains or income taxes on an individual’s investment. Returns for periods of less than one year are cumulative and not annualized. For performance data current to the most recent month-end, visit oppenheimerfunds.com or call 1.800.CALL OPP (225.5677). See Fund prospectuses and summary prospectuses for more information on share classes and sales charges.
3 OPPENHEIMER MID CAP VALUE FUND
The Fund’s Class A shares (without sales charge) returned -5.00% during the reporting period, underperforming the Russell Midcap Value Index (the “Index”), which returned 0.16%. The Fund’s underperformance stemmed largely from stock selection in the Energy sector. Other detractors included stock selection in the Communication Services and Materials sectors. The Fund outperformed the Index within the Health Care and Real Estate sectors due to stock selection.
MARKET OVERVIEW
The U.S. equity market continued to climb for most of the reporting period. After markets closed 2017 with strong performance, 2018 has been choppy so far, with volatility making a comeback due to a combination of the U.S. Administration’s trade wars with neighboring nations, a rise in geopolitical tensions, and the prospect of rising interest rates interrupting the upward march of the equity markets. In October 2018, the last month of the reporting period, equity market volatility spiked to its highest levels in six months and
all major equity indices across the world had substantially negative performance. The sell-off was sparked by concerns about rising interest rates in the U.S., continued trade and tariff related tensions, and a contentious U.S. election. Despite the elevated volatility, the Index posted muted positive results for the one-year period.
Throughout the reporting period, the market was led by growth stocks, although the
COMPARISON OF CHANGE IN VALUE OF $10,000 HYPOTHETICAL INVESTMENTS IN:
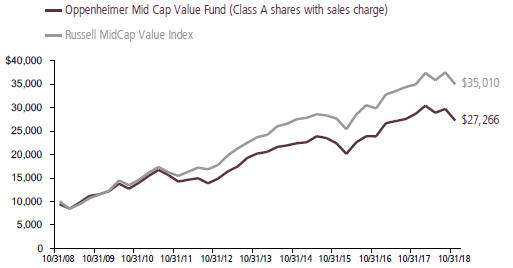
4 OPPENHEIMER MID CAP VALUE FUND
outperformance of growth was centered on a handful of mega-cap growth stocks. We witnessed Apple, Inc. become the first company to breach the $1 trillion market cap level, and Amazon.com, Inc. quickly followed by briefly eclipsing that level before eventually settling at a market cap of just over $950 billion. We also saw both Microsoft, and Alphabet, the parent company of Google, end the quarter at values exceeding $800 billion.
In our view, the business models of many of these growth stocks are attractive, however, we believe that attractiveness is well recognized by the equity market and positioning is crowded, even in the smaller stocks of the mid-cap universe. As contrarian investors, we are drawn to the less concentrated areas of the market.
FUND REVIEW
Top performing stocks for the Fund this reporting period included Ross Stores, Inc., Hess Corporation, and XPO Logistics, Inc.
Ross operates off price retail stores primarily under the Dress for Less brand name. Ross’s unique business model of focusing on suppliers’ excess inventory to offer significant discounts on brand name merchandise has helped the firm generate attractive growth in an otherwise difficult competitive retail environment.
Shares of Hess Corporation, a global exploration and production company, were strong as a result of higher oil prices.
XPO is a vertically integrated trucking and logistics company focused on “last mile” delivery. The company raised its free cash flow guidance amid a strengthening domestic freight market.
Detractors from performance this reporting period included Energy stocks Weatherford International plc and Newfield Exploration Company, along with Health Care holding Mylan N.V.
Shares of Weatherford International, which provides drilling and related services to oil producers, were weak as a result of lower oil prices, but the company continued to show progress on its restructuring program.
Newfield Exploration is an exploration and production company. Expectations of higher capital expenditures than expected drove fears of lower incremental well returns.
Mylan, a pharmaceutical company, reported a quarterly profit that fell well short of analysts’ expectations. The company’s Board of Directors also announced a plan to explore strategic alternatives for the company.
STRATEGY & OUTLOOK
As we discussed above, the U.S. equity market in 2018 has been characterized by the increasing levels of concentration among the largest growth stocks, which has impacted the performance of mid-cap growth stocks as well. While the fundamental outlook for growth stocks may be favorable, we believe
5 OPPENHEIMER MID CAP VALUE FUND
that is well recognized in current stock prices. As contrarian investors, we prefer to look elsewhere to find overlooked opportunities.
As always, while many investors focus on a short-term view when considering potential investments, the strategy utilizes in-depth fundamental research to seek to identify companies that are poised for an unanticipated acceleration in return
|
| |
Laton Spahr, CFA Portfolio Manager |


on invested capital over a multi-year time horizon. We believe this longer-term approach provides a more comprehensive outlook of potential investments by focusing on all three financial statements – income statement, balance sheet and statement of cash flows – and helps us uncover companies whose generation and use of free cash flow we deem as yet to be fully reflected in the current stock price.
|
| |
Eric Hewitt Portfolio Manager |


6 OPPENHEIMER MID CAP VALUE FUND
TOP TEN COMMON STOCK HOLDINGS
| ||
| Reinsurance Group of America, Inc., Cl. A | 2.6% | |
| Ross Stores, Inc. | 2.6 | |
| Zions Bancorp NA | 2.4 | |
| Coca-Cola European Partners plc | 2.1 | |
| SunTrust Banks, Inc. | 2.1 | |
| Kansas City Southern | 2.1 | |
| Hess Corp. | 2.0 | |
| Brunswick Corp. | 2.0 | |
| Parker-Hannifin Corp. | 2.0 | |
| Voya Financial, Inc. | 1.9 | |
Portfolio holdings and allocations are subject to change. Percentages are as of October 31, 2018, and are based on net assets.
TOP TEN COMMON STOCK INDUSTRIES
| ||
| Commercial Banks | 9.2% | |
| Real Estate Investment Trusts (REITs) | 9.0 | |
| Oil, Gas & Consumable Fuels | 7.7 | |
| Machinery | 5.4 | |
| Insurance | 5.3 | |
| Electric Utilities | 4.9 | |
| Health Care Providers & Services | 4.4 | |
| Food Products | 3.1 | |
| Pharmaceuticals | 3.0 | |
| Health Care Equipment & Supplies | 2.6 | |
Portfolio holdings and allocations are subject to change. Percentages are as of October 31, 2018, and are based on net assets.
SECTOR ALLOCATION
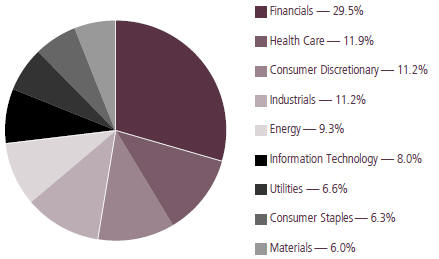
Portfolio holdings and allocations are subject to change. Percentages are as of October 31, 2018, and are based on the total market value of common stocks.
For more current Fund holdings, please visit oppenheimerfunds.com.
7 OPPENHEIMER MID CAP VALUE FUND
Share Class Performance
AVERAGE ANNUAL TOTAL RETURNS WITHOUT SALES CHARGE AS OF 10/31/18
|
| |||||||||||||||||||
| Inception Date | 1-Year | 5-Year | 10-Year | |||||||||||||||||
| Class A (QVSCX) | 1/3/89 | -5.00 | % | 6.17 | % | 11.21 | % | |||||||||||||
| Class C (QSCCX) | 9/1/93 | -5.72 | 5.37 | 10.36 | ||||||||||||||||
| Class I (QSCIX) | 2/28/12 | -4.61 | 6.61 | 9.45 | * | |||||||||||||||
| Class R (QSCNX) | 3/1/01 | -5.26 | 5.89 | 10.92 | ||||||||||||||||
| Class Y (QSCYX) | 10/24/05 | -4.77 | 6.45 | 11.54 | ||||||||||||||||
AVERAGE ANNUAL TOTAL RETURNS WITH SALES CHARGE AS OF 10/31/18
|
| |||||||||||||||||||
| Inception Date | 1-Year | 5-Year | 10-Year | |||||||||||||||||
| Class A (QVSCX) | 1/3/89 | -10.46 | % | 4.92 | % | 10.55 | % | |||||||||||||
| Class C (QSCCX) | 9/1/93 | -6.60 | 5.37 | 10.36 | ||||||||||||||||
| Class I (QSCIX) | 2/28/12 | -4.61 | 6.61 | 9.45 | * | |||||||||||||||
| Class R (QSCNX) | 3/1/01 | -5.26 | 5.89 | 10.92 | ||||||||||||||||
| Class Y (QSCYX) | 10/24/05 | -4.77 | 6.45 | 11.54 | ||||||||||||||||
*Shows performance since inception.
Performance data quoted represents past performance, which does not guarantee future results. The investment return and principal value of an investment in the Fund will fluctuate so that an investor’s shares, when redeemed, may be worth more or less than their original cost. Current performance may be lower or higher than the performance quoted. Returns do not consider capital gains or income taxes on an individual’s investment. For performance data current to the most recent month-end, visit oppenheimerfunds.com or call 1.800. CALL OPP (225.5677). Fund returns include changes in share price, reinvested distributions, and the applicable sales charge: for Class A shares, the current maximum initial sales charge of 5.75% and for Class C shares, the contingent deferred sales charge of 1% for the 1-year period. There is no sales charge for Class I, Class R and Class Y shares. Returns for periods of less than one year are cumulative and not annualized. See Fund prospectuses and summary prospectuses for more information on share classes and sales charges.
The Fund’s performance is compared to that of the Russell MidCap Value Index. The Russell MidCap Value Index measures the performance of the mid-cap value segment of the U.S. equity universe. It includes those Russell MidCap Index companies with lower price-to-book ratios and lower forecasted growth values. The Index is unmanaged and cannot be purchased directly by investors. While index comparisons may be useful to provide a benchmark for the Fund’s performance, it must be noted that the Fund’s investments are not limited to the investments comprising the Index. Index performance includes reinvestment of income, but does not reflect transaction costs, fees, expenses or taxes. Index performance is shown for illustrative purposes only as a benchmark for the Fund’s performance, and does not predict or depict performance of the Fund. The Fund’s performance reflects the effects of the Fund’s business and operating expenses.
8 OPPENHEIMER MID CAP VALUE FUND
The views in the Fund Performance Discussion represent the opinions of this Fund’s portfolio manager(s) and are not intended as investment advice or to predict or depict the performance of any investment. These views are as of the close of business on October 31, 2018, and are subject to change based on subsequent developments. The Fund’s portfolio and strategies are subject to change.
Before investing in any of the Oppenheimer funds, investors should carefully consider a fund’s investment objectives, risks, charges and expenses. Fund prospectuses and summary prospectuses contain this and other information about the funds, and may be obtained by asking your financial advisor, visiting oppenheimerfunds.com, or calling 1.800.CALL OPP (225.5677). Read prospectuses and summary prospectuses carefully before investing.
Shares of Oppenheimer funds are not deposits or obligations of any bank, are not guaranteed by any bank, are not insured by the FDIC or any other agency, and involve investment risks, including the possible loss of the principal amount invested.
9 OPPENHEIMER MID CAP VALUE FUND
Fund Expenses. As a shareholder of the Fund, you incur two types of costs: (1) transaction costs, which may include sales charges (loads) on purchase payments and/or contingent deferred sales charges on redemptions; and (2) ongoing costs, including management fees; distribution and service fees; and other Fund expenses. These examples are intended to help you understand your ongoing costs (in dollars) of investing in the Fund and to compare these costs with the ongoing costs of investing in other mutual funds.
The examples are based on an investment of $1,000.00 invested at the beginning of the period and held for the entire 6-month period ended October 31, 2018.
Actual Expenses. The first section of the table provides information about actual account values and actual expenses. You may use the information in this section for the class of shares you hold, together with the amount you invested, to estimate the expense that you paid over the period. Simply divide your account value by $1,000.00 (for example, an $8,600.00 account value divided by $1,000.00 = 8.60), then multiply the result by the number in the first section under the heading entitled “Expenses Paid During 6 Months Ended October 31, 2018” to estimate the expenses you paid on your account during this period.
Hypothetical Example for Comparison Purposes. The second section of the table provides information about hypothetical account values and hypothetical expenses based on the Fund’s actual expense ratio for each class of shares, and an assumed rate of return of 5% per year for each class before expenses, which is not the Fund’s actual return. The hypothetical account values and expenses may not be used to estimate the actual ending account balance or expenses you paid for the period. You may use this information to compare the ongoing costs of investing in the Fund and other funds. To do so, compare this 5% hypothetical example for the class of shares you hold with the 5% hypothetical examples that appear in the shareholder reports of the other funds.
Please note that the expenses shown in the table are meant to highlight your ongoing costs only and do not reflect any transactional costs, such as front-end or contingent deferred sales charges (loads). Therefore, the “hypothetical” section of the table is useful in comparing ongoing costs only, and will not help you determine the relative total costs of owning different funds. In addition, if these transactional costs were included, your costs would have been higher.
10 OPPENHEIMER MID CAP VALUE FUND
| Actual | Beginning Account Value May 1, 2018 | Ending Account Value October 31, 2018 | Expenses Paid During 6 Months Ended October 31, 2018 | |||||||||
| Class A | $ | 1,000.00 | $ | 943.00 | $ | 5.75 | ||||||
| Class C | 1,000.00 | 939.30 | 9.43 | |||||||||
| Class I | 1,000.00 | 944.90 | 3.73 | |||||||||
| Class R | 1,000.00 | 941.60 | 6.97 | |||||||||
| Class Y | 1,000.00 | 944.10 | 4.57 | |||||||||
| Hypothetical | ||||||||||||
| (5% return before expenses) | ||||||||||||
| Class A | 1,000.00 | 1,019.31 | 5.97 | |||||||||
| Class C | 1,000.00 | 1,015.53 | 9.80 | |||||||||
| Class I | 1,000.00 | 1,021.37 | 3.88 | |||||||||
| Class R | 1,000.00 | 1,018.05 | 7.25 | |||||||||
| Class Y | 1,000.00 | 1,020.52 | 4.75 | |||||||||
Expenses are equal to the Fund’s annualized expense ratio for that class, multiplied by the average account value over the period, multiplied by 184/365 (to reflect the one-half year period). Those annualized expense ratios, excluding indirect expenses from affiliated funds, based on the 6-month period ended October 31, 2018 are as follows:
| Class | Expense Ratios | |||
| Class A | 1.17 | % | ||
| Class C | 1.92 | |||
| Class I | 0.76 | |||
| Class R | 1.42 | |||
| Class Y | 0.93 | |||
The expense ratios reflect voluntary and/or contractual waivers and/or reimbursements of expenses by the Fund’s Manager and Transfer Agent. Some of these undertakings may be modified or terminated at any time, as indicated in the Fund’s prospectus. The “Financial Highlights” tables in the Fund’s financial statements, included in this report, also show the gross expense ratios, without such waivers or reimbursements and reduction to custodian expenses, if applicable.
11 OPPENHEIMER MID CAP VALUE FUND
STATEMENT OF INVESTMENTS October 31, 2018
| Shares | Value | |||||||
| Common Stocks—95.8% |
| |||||||
| Consumer Discretionary—10.8% |
| |||||||
| Auto Components—1.9% |
| |||||||
| BorgWarner, Inc. | 537,840 | $ | 21,196,275 | |||||
| Household Durables—0.9% | ||||||||
| Lennar Corp., Cl. A | 253,230 | 10,883,825 | ||||||
| Leisure Products—2.0% | ||||||||
| Brunswick Corp. | 434,920 | 22,611,491 | ||||||
| Media—1.8% | ||||||||
| CBS Corp., Cl. B | 235,230 | 13,490,440 | ||||||
| Madison Square Garden Co. (The), Cl. A1 | 26,040 | 7,203,185 | ||||||
| 20,693,625 | ||||||||
| Multiline Retail—1.0% | ||||||||
| Nordstrom, Inc. | 169,570 | 11,152,619 | ||||||
| Specialty Retail—2.6% | ||||||||
| Ross Stores, Inc. | 298,090 | 29,510,910 | ||||||
| Textiles, Apparel & Luxury Goods—0.6% |
| |||||||
| Carter’s, Inc. | 73,560 | 7,060,289 | ||||||
| Consumer Staples—6.0% | ||||||||
| Beverages—2.1% | ||||||||
| Coca-Cola European Partners plc | 544,020 | 24,747,470 | ||||||
| Food & Staples Retailing—0.8% | ||||||||
| Kroger Co. (The) | 297,820 | 8,863,123 | ||||||
| Food Products—3.1% | ||||||||
| Conagra Brands, Inc. | 476,483 | 16,962,795 | ||||||
| McCormick & Co., Inc. | 58,640 | 8,444,160 | ||||||
| Nomad Foods Ltd.1 | 223,200 | 4,263,120 | ||||||
| Tyson Foods, Inc., Cl. A | 96,810 | 5,800,855 | ||||||
| 35,470,930 | ||||||||
| Energy—8.9% | ||||||||
| Energy Equipment & Services—1.2% | ||||||||
| Transocean Ltd.1 | 285,220 | 3,140,272 | ||||||
| Weatherford International plc1 | 8,107,990 | 10,945,787 | ||||||
| 14,086,059 | ||||||||
| Oil, Gas & Consumable Fuels—7.7% | ||||||||
| Callon Petroleum Co.1 | 612,110 | 6,102,737 | ||||||
| Shares | Value | |||||||
| Oil, Gas & Consumable Fuels (Continued) |
| |||||||
| Concho Resources, Inc.1 | 119,190 | $ | 16,578,137 | |||||
| Delek US Holdings, Inc. | 162,170 | 5,954,882 | ||||||
| Devon Energy Corp. | 438,950 | 14,221,980 | ||||||
| Hess Corp. | 398,630 | 22,881,362 | ||||||
| Newfield Exploration Co.1 | 578,070 | 11,677,014 | ||||||
| WPX Energy, Inc.1 | 628,680 | 10,084,027 | ||||||
| 87,500,139 | ||||||||
| Financials—28.3% | ||||||||
| Capital Markets—2.4% | ||||||||
| Ameriprise Financial, Inc. | 39,670 | 5,047,611 | ||||||
| Ares Management LP2 | 825,034 | 16,178,917 | ||||||
| Nasdaq, Inc. | 72,840 | 6,315,956 | ||||||
| 27,542,484 | ||||||||
| Commercial Banks—9.2% | ||||||||
| CIT Group, Inc. | 325,350 | 15,415,083 | ||||||
| Glacier Bancorp, Inc. | 252,620 | 10,711,088 | ||||||
| KeyCorp | 596,710 | 10,836,254 | ||||||
| SunTrust Banks, Inc. | 384,420 | 24,087,757 | ||||||
| Synovus Financial Corp. | 416,740 | 15,652,754 | ||||||
| Zions Bancorp NA | 593,560 | 27,926,998 | ||||||
| 104,629,934 | ||||||||
| Diversified Financial Services—1.9% | ||||||||
| Voya Financial, Inc. | 490,500 | 21,464,280 | ||||||
| Insurance—5.3% | ||||||||
| Arthur J. Gallagher & Co. | 164,240 | 12,155,402 | ||||||
| Assurant, Inc. | 113,240 | 11,008,061 | ||||||
| Lincoln National Corp. | 130,780 | 7,871,648 | ||||||
| Reinsurance Group of America, Inc., Cl. A | 209,860 | 29,877,768 | ||||||
| 60,912,879 | ||||||||
| Real Estate Investment Trusts (REITs)—9.0% |
| |||||||
| Alexandria Real Estate Equities, Inc. | 104,106 | 12,724,877 | ||||||
| CubeSmart | 414,660 | 12,016,847 | ||||||
| Digital Realty Trust, Inc. | 97,400 | 10,057,524 | ||||||
| Equity LifeStyle Properties, Inc. | 130,670 | 12,373,142 | ||||||
12 OPPENHEIMER MID CAP VALUE FUND
_
| Shares | Value | |||||||
| Real Estate Investment Trusts (REITs) (Continued) |
| |||||||
| Equity Residential | 177,720 | $ | 11,544,691 | |||||
| Highwoods Properties, Inc. | 214,680 | 9,153,955 | ||||||
| Park Hotels & Resorts, Inc. | 497,930 | 14,474,825 | ||||||
| Prologis, Inc. | 167,098 | 10,772,808 | ||||||
| Uniti Group, Inc. | 503,890 | 9,644,455 | ||||||
| 102,763,124 | ||||||||
| Thrifts & Mortgage Finance—0.5% | ||||||||
| Radian Group, Inc. | 320,300 | 6,146,557 | ||||||
| Health Care—11.4% | ||||||||
| Health Care Equipment & Supplies—2.6% |
| |||||||
| Boston Scientific Corp.1 | 505,107 | 18,254,567 | ||||||
| Zimmer Biomet Holdings, Inc. | 105,680 | 12,004,191 | ||||||
| 30,258,758 | ||||||||
| Health Care Providers & Services—4.4% |
| |||||||
| Encompass Health Corp. | 246,530 | 16,591,469 | ||||||
| Molina Healthcare, Inc.1 | 130,338 | 16,522,948 | ||||||
| WellCare Health Plans, Inc.1 | 60,340 | 16,653,237 | ||||||
| 49,767,654 | ||||||||
| Life Sciences Tools & Services—1.4% | ||||||||
| IQVIA Holdings, Inc.1 | 129,801 | 15,956,437 | ||||||
| Pharmaceuticals—3.0% | ||||||||
| Jazz Pharmaceuticals plc1 | 117,060 | 18,591,469 | ||||||
| Mylan NV1 | 496,580 | 15,518,125 | ||||||
| 34,109,594 | ||||||||
| Industrials—10.7% | ||||||||
| Aerospace & Defense—0.4% | ||||||||
| Huntington Ingalls Industries, Inc. | 22,150 | 4,839,332 | ||||||
| Air Freight & Couriers—0.9% | ||||||||
| XPO Logistics, Inc.1 | 119,240 | 10,657,671 | ||||||
| Construction & Engineering—1.0% | ||||||||
| Fluor Corp. | 255,500 | 11,206,230 | ||||||
| Machinery—5.4% | ||||||||
| Gates Industrial Corp. plc1 | 905,000 | 13,620,250 | ||||||
| ITT, Inc. | 359,880 | 18,173,940 | ||||||
| Shares | Value | |||||||
| Machinery (Continued) | ||||||||
| Parker-Hannifin Corp. | 147,380 | $ | 22,347,229 | |||||
| Stanley Black & Decker, Inc. | 60,450 | 7,043,634 | ||||||
| 61,185,053 | ||||||||
| Marine—0.9% | ||||||||
| Kirby Corp.1 | 147,690 | 10,624,819 | ||||||
| Road & Rail—2.1% | ||||||||
| Kansas City Southern | 234,650 | 23,924,914 | ||||||
| Information Technology—7.7% | ||||||||
| Communications Equipment—1.3% | ||||||||
| Motorola Solutions, Inc. | 119,230 | 14,612,829 | ||||||
| Electronic Equipment, Instruments, & | ||||||||
| Components—1.0% | ||||||||
| FLIR Systems, Inc. | 117,110 | 5,423,364 | ||||||
| Zebra Technologies Corp., Cl. A1 | 38,640 | 6,425,832 | ||||||
| 11,849,196 | ||||||||
| IT Services—2.0% | ||||||||
| Black Knight, Inc.1 | 250,330 | 12,208,594 | ||||||
| Fidelity National Information Services, Inc. | 102,260 | 10,645,266 | ||||||
| 22,853,860 | ||||||||
| Semiconductors & Semiconductor | ||||||||
| Equipment—1.2% | ||||||||
| Lam Research Corp. | 27,050 | 3,833,796 | ||||||
| Marvell Technology Group Ltd. | 382,281 | 6,273,231 | ||||||
| Tower Semiconductor Ltd.1 | 228,430 | 3,584,067 | ||||||
| 13,691,094 | ||||||||
| Software—1.8% | ||||||||
| Synopsys, Inc.1 | 233,370 | 20,893,616 | ||||||
| Technology Hardware, Storage & | ||||||||
| Peripherals—0.4% | ||||||||
| NCR Corp.1 | 156,280 | 4,196,118 | ||||||
| Materials—5.7% | ||||||||
| Chemicals—1.8% | ||||||||
| Celanese Corp., Cl. A | 153,750 | 14,904,525 | ||||||
| Huntsman Corp. | 265,380 | 5,806,515 | ||||||
| 20,711,040 | ||||||||
13 OPPENHEIMER MID CAP VALUE FUND
STATEMENT OF INVESTMENTS Continued
| Shares | Value | |||||||
| Containers & Packaging—2.0% |
| |||||||
| Ball Corp. | 284,800 | $ | 12,759,040 | |||||
| WestRock Co. | 236,790 | 10,174,866 | ||||||
| 22,933,906 | ||||||||
| Metals & Mining—1.9% | ||||||||
| Alcoa Corp.1 | 490,530 | 17,163,645 | ||||||
| Freeport-McMoRan, Inc. | 434,630 | 5,063,439 | ||||||
| 22,227,084 | ||||||||
| Utilities—6.3% | ||||||||
| Electric Utilities—4.9% | ||||||||
| Alliant Energy Corp. | 248,330 | 10,673,223 | ||||||
| Avangrid, Inc. | 216,880 | 10,195,529 | ||||||
| Entergy Corp. | 126,650 | 10,632,268 | ||||||
| Exelon Corp. | 247,060 | 10,823,699 | ||||||
| FirstEnergy Corp. | 379,090 | 14,132,475 | ||||||
| 56,457,194 | ||||||||
| Multi-Utilities—0.9% | ||||||||
| Ameren Corp. | 166,640 | 10,761,611 | ||||||
| Shares | Value | |||||||
| Water Utilities—0.5% |
| |||||||
| American Water Works Co., Inc. | 62,640 | $ | 5,545,519 | |||||
Total Common Stocks
|
| 1,096,499,542
|
| |||||
| Investment Company—4.7% |
| |||||||
Oppenheimer Institutional Government Money Market Fund, Cl. E, 2.12%3,4 (Cost $53,346,899)
|
| 53,346,899
|
|
| 53,346,899
|
| ||
| Total Investments, at Value (Cost $1,038,018,480) | 100.5% | 1,149,846,441 | ||||||
| Net Other Assets (Liabilities) | (0.5) | (6,168,411 | ) | |||||
| Net Assets | 100.0% | $ | 1,143,678,030 | |||||
Footnotes to Statement of Investments
1. Non-income producing security.
2. Security was a Master Limited Partnership during the period.
3. Rate shown is the 7-day yield at period end.
4. Is or was an affiliate, as defined in the Investment Company Act of 1940, as amended, at or during the reporting period, by virtue of the Fund owning at least 5% of the voting securities of the issuer or as a result of the Fund and the issuer having the same investment adviser. Transactions during the reporting period in which the issuer was an affiliate are as follows:
Shares October 31, 2017 | Gross Additions | Gross Reductions | Shares October 31, 2018 | |||||||||||||
| Investment Company | ||||||||||||||||
| Oppenheimer Institutional Government Money Market Fund, Cl. E | 199,690 | 388,750,242 | 335,603,033 | 53,346,899 | ||||||||||||
| Value | Income | Realized Gain (Loss) | Change in Unrealized Gain (Loss) | |||||||||||||
| Investment Company | ||||||||||||||||
| Oppenheimer Institutional Government Money Market Fund, Cl. E | $ | 53,346,899 | $ | 504,219 | $ | — | $ | — | ||||||||
See accompanying Notes to Financial Statements.
14 OPPENHEIMER MID CAP VALUE FUND
STATEMENT OF ASSETS AND LIABILITIES October 31, 2018
| Assets | ||||
| Investments, at value—see accompanying statement of investments: | ||||
| Unaffiliated companies (cost $984,671,581) | $ | 1,096,499,542 | ||
| Affiliated companies (cost $53,346,899) | 53,346,899 | |||
|
|
| ||
| 1,149,846,441 | ||||
| Cash | 2,003,007 | |||
| Receivables and other assets: | ||||
| Investments sold | 2,427,458 | |||
| Dividends | 363,315 | |||
| Shares of beneficial interest sold | 216,964 | |||
| Other | 203,287 | |||
|
|
| ||
| Total assets | 1,155,060,472 | |||
| Liabilities | ||||
| Payables and other liabilities: | ||||
| Investments purchased | 9,777,662 | |||
| Shares of beneficial interest redeemed | 1,025,013 | |||
| Trustees’ compensation | 300,576 | |||
| Distribution and service plan fees | 232,253 | |||
| Shareholder communications | 13,770 | |||
| Other | 33,168 | |||
|
|
| ||
| Total liabilities | 11,382,442 | |||
Net Assets |
$ |
1,143,678,030 |
| |
|
|
| ||
| Composition of Net Assets | ||||
| Par value of shares of beneficial interest | $ | 224,625 | ||
| Additional paid-in capital | 939,082,988 | |||
| Total distributable earnings | 204,370,417 | |||
|
|
| ||
| Net Assets | $ | 1,143,678,030 | ||
|
|
|
15 OPPENHEIMER MID CAP VALUE FUND
STATEMENT OF ASSETS AND LIABILITIES Continued
| Net Asset Value Per Share | ||||
| Class A Shares: | ||||
| Net asset value and redemption price per share (based on net assets of $801,596,850 and 15,241,236 shares of beneficial interest outstanding) | $ | 52.59 | ||
| Maximum offering price per share (net asset value plus sales charge of 5.75% of offering price) | $ | 55.80 | ||
| Class C Shares: | ||||
| Net asset value, redemption price (excludes applicable contingent deferred sales charge) and offering price per share (based on net assets of $172,168,271 and 3,989,913 shares of beneficial interest outstanding) | $ | 43.15 | ||
| Class I Shares: | ||||
| Net asset value, redemption price and offering price per share (based on net assets of $4,302,245 and 80,365 shares of beneficial interest outstanding) | $ | 53.53 | ||
| Class R Shares: | ||||
| Net asset value, redemption price (excludes applicable contingent deferred sales charge) and offering price per share (based on net assets of $62,088,377 and 1,234,349 shares of beneficial interest outstanding) | $ | 50.30 | ||
| Class Y Shares: | ||||
| Net asset value, redemption price and offering price per share (based on net assets of $103,522,287 and 1,916,666 shares of beneficial interest outstanding) | $ | 54.01 | ||
See accompanying Notes to Financial Statements.
16 OPPENHEIMER MID CAP VALUE FUND
OF OPERATIONS For the Year Ended October 31, 2018
Investment Income | ||||
| Dividends: | ||||
| Unaffiliated companies | $ | 21,345,820 | ||
| Affiliated companies | 504,219 | |||
| Interest | 93,475 | |||
|
|
| ||
| Total investment income |
| 21,943,514
|
| |
Expenses | ||||
| Management fees | 9,315,103 | |||
| Distribution and service plan fees: | ||||
| Class A | 2,245,421 | |||
| Class B1 | 13,032 | |||
| Class C | 2,044,017 | |||
| Class R | 370,841 | |||
| Transfer and shareholder servicing agent fees: | ||||
| Class A | 1,848,896 | |||
| Class B1 | 2,714 | |||
| Class C | 409,109 | |||
| Class I | 1,218 | |||
| Class R | 149,098 | |||
| Class Y | 212,337 | |||
| Shareholder communications: | ||||
| Class A | 20,897 | |||
| Class B1 | 472 | |||
| Class C | 5,264 | |||
| Class I | 78 | |||
| Class R | 1,047 | |||
| Class Y | 1,927 | |||
| Borrowing fees | 44,870 | |||
| Custodian fees and expenses | 26,221 | |||
| Trustees’ compensation | 20,642 | |||
| Other | 161,274 | |||
|
|
| ||
| Total expenses | 16,894,478 | |||
| Less waivers and reimbursements of expenses | (63,581 | ) | ||
|
|
| ||
| Net expenses | 16,830,897 | |||
| Net Investment Income | 5,112,617 |
17 OPPENHEIMER MID CAP VALUE FUND
STATEMENT
OF OPERATIONS Continued
| Realized and Unrealized Gain (Loss) | ||||
| Net realized gain on: | ||||
| Investment transactions in unaffiliated companies | $ | 104,270,883 | ||
| Foreign currency transactions | 36,112 | |||
|
|
| ||
| Net realized gain | 104,306,995 | |||
| Net change in unrealized appreciation/(depreciation) on: | ||||
| Investment transactions in unaffiliated companies | (166,166,478 | ) | ||
| Translation of assets and liabilities denominated in foreign currencies | 105 | |||
|
|
| ||
| Net change in unrealized appreciation/(depreciation) | (166,166,373 | ) | ||
Net Decrease in Net Assets Resulting from Operations |
$ |
(56,746,761 |
) | |
|
|
|
1. Effective June 1, 2018, all Class B shares converted to Class A shares.
See accompanying Notes to Financial Statements.
18 OPPENHEIMER MID CAP VALUE FUND
STATEMENTS OF CHANGES IN NET ASSETS
| Year Ended October 31, 2018 | Year Ended October 31, 20171 | |||||||
Operations | ||||||||
| Net investment income | $ | 5,112,617 | $ | 2,569,954 | ||||
| Net realized gain | 104,306,995 | 158,004,076 | ||||||
| Net change in unrealized appreciation/(depreciation) | (166,166,373 | ) | 91,002,164 | |||||
| Net increase (decrease) in net assets resulting from operations | (56,746,761 | ) | 251,576,194 | |||||
Dividends and/or Distributions to Shareholders | ||||||||
| Dividends and distributions declared: | ||||||||
| Class A | (59,400,111 | ) | (3,971,241 | ) | ||||
| Class B2 | (238,230 | ) | — | |||||
| Class C | (15,307,725 | ) | (53,393 | ) | ||||
| Class I | (175,383 | ) | (10,505 | ) | ||||
| Class R | (5,055,286 | ) | (160,512 | ) | ||||
| Class Y | (6,842,010 | ) | (566,163 | ) | ||||
| Total dividends and distributions declared | (87,018,745 | ) | (4,761,814 | ) | ||||
Beneficial Interest Transactions | ||||||||
| Net increase (decrease) in net assets resulting from beneficial interest transactions: | ||||||||
| Class A | (65,922,651 | ) | (129,209,683 | ) | ||||
| Class B2 | (4,321,439 | ) | (8,498,380 | ) | ||||
| Class C | (23,337,632 | ) | (47,007,458 | ) | ||||
| Class I | 2,298,581 | 1,350,862 | ||||||
| Class R | (11,121,462 | ) | (16,559,746 | ) | ||||
| Class Y | 6,199,881 | 33,091,139 | ||||||
| Total beneficial interest transactions | (96,204,722 | ) | (166,833,266 | ) | ||||
| Net Assets | ||||||||
| Total increase (decrease) | (239,970,228 | ) | 79,981,114 | |||||
| Beginning of period | 1,383,648,258 | 1,303,667,144 | ||||||
| End of period | $ | 1,143,678,030 | $ | 1,383,648,258 | ||||
1. Prior period amounts have been conformed to current year presentation. See Notes to Financial Statements, Note 2– New Accounting Pronouncements for further details.
2. Effective June 1, 2018, all Class B shares converted to Class A shares.
See accompanying Notes to Financial Statements.
19 OPPENHEIMER MID CAP VALUE FUND
| Class A | Year Ended October 31, 2018 | Year Ended October 31, 2017 | Year Ended October 31, 2016 | Year Ended October 30, 20151 | Year Ended October 31, 2014 | |||||||||||||
Per Share Operating Data | ||||||||||||||||||
| Net asset value, beginning of period | $58.99 | $49.28 | $46.44 | $46.72 | $42.63 | |||||||||||||
| Income (loss) from investment operations: | ||||||||||||||||||
| Net investment income2 | 0.29 | 0.17 | 0.24 | 0.24 | 0.36 | |||||||||||||
| Net realized and unrealized gain (loss) | (3.02) | 9.76 | 2.83 | (0.29) | 4.25 | |||||||||||||
| Total from investment operations | (2.73) | 9.93 | 3.07 | (0.05) | 4.61 | |||||||||||||
| Dividends and/or distributions to shareholders: | ||||||||||||||||||
| Dividends from net investment income | (0.21) | (0.22) | (0.23) | (0.23) | (0.52) | |||||||||||||
| Distributions from net realized gain | (3.46) | 0.00 | 0.00 | 0.00 | 0.00 | |||||||||||||
| Total dividends and/or distributions to shareholders | (3.67) | (0.22) | (0.23) | (0.23) | (0.52) | |||||||||||||
| Net asset value, end of period | $52.59 | $58.99 | $49.28 | $46.44 | $46.72 | |||||||||||||
| Total Return, at Net Asset Value3 | (5.00)% | 20.20% | 6.62% | (0.13)% | 10.91% | |||||||||||||
Ratios/Supplemental Data | ||||||||||||||||||
| Net assets, end of period (in thousands) | $801,597 | $965,887 | $920,277 | $966,842 | $1,104,252 | |||||||||||||
| Average net assets (in thousands) | $927,026 | $986,140 | $916,503 | $1,085,463 | $1,151,106 | |||||||||||||
| Ratios to average net assets:4 | ||||||||||||||||||
| Net investment income | 0.50% | 0.31% | 0.53% | 0.49% | 0.80% | |||||||||||||
| Expenses excluding specific expenses listed below | 1.17% | 1.18% | 1.19% | 1.17% | 1.18% | |||||||||||||
| Interest and fees from borrowings | 0.00%5 | 0.00%5 | 0.00%5 | 0.00%5 | 0.00% | |||||||||||||
| Total expenses6 | 1.17% | 1.18% | 1.19% | 1.17% | 1.18% | |||||||||||||
| Expenses after payments, waivers and/or reimbursements and reduction to custodian expenses | 1.17%7 | 1.17% | 1.19%7 | 1.17%7 | 1.18%7 | |||||||||||||
| Portfolio turnover rate | 71% | 63% | 34% | 47% | 51% | |||||||||||||
1. Represents the last business day of the Fund’s reporting period.
2. Per share amounts calculated based on the average shares outstanding during the period.
3. Assumes an initial investment on the business day before the first day of the fiscal period, with all dividends and distributions reinvested in additional shares on the reinvestment date, and redemption at the net asset value calculated on the last business day of the fiscal period. Sales charges are not reflected in the total returns. Total returns are not annualized for periods less than one full year. Returns do not reflect the deduction of taxes that a shareholder would pay on fund distributions or the redemption of fund shares.
4. Annualized for periods less than one full year.
5. Less than 0.005%.
6. Total expenses including indirect expenses from affiliated fund fees and expenses were as follows:
| Year Ended October 31, 2018 | 1.17 | % | ||||
| Year Ended October 31, 2017 | 1.18 | % | ||||
| Year Ended October 31, 2016 | 1.19 | % | ||||
| Year Ended October 30, 2015 | 1.17 | % | ||||
| Year Ended October 31, 2014 | 1.18 | % |
7. Waiver was less than 0.005%.
See accompanying Notes to Financial Statements.
20 OPPENHEIMER MID CAP VALUE FUND
| Class C | Year Ended October 31, 2018 | Year Ended October 31, 2017 | Year Ended October 31, 2016 | Year Ended October 30, 20151 | Year Ended October 31, 2014 | |||||||||||||
Per Share Operating Data | ||||||||||||||||||
| Net asset value, beginning of period | $49.20 | $41.26 | $39.00 | $39.35 | $35.83 | |||||||||||||
| Income (loss) from investment operations: | ||||||||||||||||||
| Net investment income (loss)2 | (0.12) | (0.20) | (0.09) | (0.11) | 0.02 | |||||||||||||
| Net realized and unrealized gain (loss) | (2.46) | 8.15 | 2.37 | (0.24) | 3.59 | |||||||||||||
| Total from investment operations | (2.58) | 7.95 | 2.28 | (0.35) | 3.61 | |||||||||||||
| Dividends and/or distributions to shareholders: | ||||||||||||||||||
| Dividends from net investment income | (0.01) | (0.01) | (0.02) | 0.00 | (0.09) | |||||||||||||
| Distributions from net realized gain | (3.46) | 0.00 | 0.00 | 0.00 | 0.00 | |||||||||||||
| Total dividends and/or distributions to shareholders | (3.47) | (0.01) | (0.02) | 0.00 | (0.09) | |||||||||||||
| Net asset value, end of period | $43.15 | $49.20 | $41.26 | $39.00 | $39.35 | |||||||||||||
| Total Return, at Net Asset Value3 | (5.72)% | 19.30% | 5.84% | (0.87)% | 10.05% | |||||||||||||
Ratios/Supplemental Data | ||||||||||||||||||
| Net assets, end of period (in thousands) | $172,168 | $220,394 | $226,455 | $253,446 | $279,925 | |||||||||||||
| Average net assets (in thousands) | $204,959 | $233,758 | $233,067 | $278,916 | $283,792 | |||||||||||||
| Ratios to average net assets:4 | ||||||||||||||||||
| Net investment income (loss) | (0.26)% | (0.44)% | (0.23)% | (0.26)% | 0.05% | |||||||||||||
| Expenses excluding specific expenses listed below | 1.93% | 1.93% | 1.95% | 1.92% | 1.93% | |||||||||||||
| Interest and fees from borrowings | 0.00%5 | 0.00%5 | 0.00%5 | 0.00%5 | 0.00% | |||||||||||||
| Total expenses6 | 1.93% | 1.93% | 1.95% | 1.92% | 1.93% | |||||||||||||
| Expenses after payments, waivers and/or reimbursements and reduction to custodian expenses | 1.93%7 | 1.92% | 1.95%7 | 1.92%7 | 1.93%7 | |||||||||||||
| Portfolio turnover rate | 71% | 63% | 34% | 47% | 51% | |||||||||||||
1. Represents the last business day of the Fund’s reporting period.
2. Per share amounts calculated based on the average shares outstanding during the period.
3. Assumes an initial investment on the business day before the first day of the fiscal period, with all dividends and distributions reinvested in additional shares on the reinvestment date, and redemption at the net asset value calculated on the last business day of the fiscal period. Sales charges are not reflected in the total returns. Total returns are not annualized for periods less than one full year. Returns do not reflect the deduction of taxes that a shareholder would pay on fund distributions or the redemption of fund shares.
4. Annualized for periods less than one full year.
5. Less than 0.005%.
6. Total expenses including indirect expenses from affiliated fund fees and expenses were as follows:
| Year Ended October 31, 2018 | 1.93 | % | ||||
| Year Ended October 31, 2017 | 1.93 | % | ||||
| Year Ended October 31, 2016 | 1.95 | % | ||||
| Year Ended October 30, 2015 | 1.92 | % | ||||
| Year Ended October 31, 2014 | 1.93 | % |
7. Waiver was less than 0.005%.
See accompanying Notes to Financial Statements.
21 OPPENHEIMER MID CAP VALUE FUND
FINANCIAL HIGHLIGHTS Continued
| Class I | Year Ended October 31, 2018 | Year Ended October 31, 2017 | Year Ended October 31, 2016 | Year Ended October 30, 20151 | Year Ended October 31, 2014 | |||||||||||||||
Per Share Operating Data | ||||||||||||||||||||
| Net asset value, beginning of period | $59.97 | $50.10 | $47.20 | $47.49 | $43.64 | |||||||||||||||
| Income (loss) from investment operations: | ||||||||||||||||||||
| Net investment income2 | 0.53 | 0.39 | 0.44 | 0.43 | 0.47 | |||||||||||||||
| Net realized and unrealized gain (loss) | (3.06) | 9.94 | 2.89 | (0.27) | 4.42 | |||||||||||||||
| Total from investment operations | (2.53) | 10.33 | 3.33 | 0.16 | 4.89 | |||||||||||||||
| Dividends and/or distributions to shareholders: | ||||||||||||||||||||
| Dividends from net investment income | (0.45) | (0.46) | (0.43) | (0.45) | (1.04) | |||||||||||||||
| Distributions from net realized gain | (3.46) | 0.00 | 0.00 | 0.00 | 0.00 | |||||||||||||||
| Total dividends and/or distributions to shareholders | (3.91) | (0.46) | (0.43) | (0.45) | (1.04) | |||||||||||||||
| Net asset value, end of period | $53.53 | $59.97 | $50.10 | $47.20 | $47.49 | |||||||||||||||
| Total Return, at Net Asset Value3 | (4.61)% | 20.69% | 7.10% | 0.31% | 11.36% | |||||||||||||||
Ratios/Supplemental Data | ||||||||||||||||||||
| Net assets, end of period (in thousands) | $4,302 | $2,522 | $950 | $788 | $427 | |||||||||||||||
| Average net assets (in thousands) | $4,067 | $1,375 | $803 | $621 | $178 | |||||||||||||||
| Ratios to average net assets:4 | ||||||||||||||||||||
| Net investment income | 0.91% | 0.69% | 0.93% | 0.88% | 1.02% | |||||||||||||||
| Expenses excluding specific expenses listed below | 0.76% | 0.75% | 0.76% | 0.73% | 0.76% | |||||||||||||||
| Interest and fees from borrowings | 0.00%5 | 0.00%5 | 0.00%5 | 0.00%5 | 0.00% | |||||||||||||||
| Total expenses6 | 0.76% | 0.75% | 0.76% | 0.73% | 0.76% | |||||||||||||||
| Expenses after payments, waivers and/or reimbursements and reduction to custodian expenses | 0.76%7 | 0.75%7 | 0.76%7 | 0.73%7 | 0.76%7 | |||||||||||||||
| Portfolio turnover rate | 71% | 63% | 34% | 47% | 51% | |||||||||||||||
1. Represents the last business day of the Fund’s reporting period.
2. Per share amounts calculated based on the average shares outstanding during the period.
3. Assumes an initial investment on the business day before the first day of the fiscal period, with all dividends and distributions reinvested in additional shares on the reinvestment date, and redemption at the net asset value calculated on the last business day of the fiscal period. Sales charges are not reflected in the total returns. Total returns are not annualized for periods less than one full year. Returns do not reflect the deduction of taxes that a shareholder would pay on fund distributions or the redemption of fund shares.
4. Annualized for periods less than one full year.
5. Less than 0.005%.
6. Total expenses including indirect expenses from affiliated fund fees and expenses were as follows:
| Year Ended October 31, 2018 | 0.76 | % | ||||
| Year Ended October 31, 2017 | 0.75 | % | ||||
| Year Ended October 31, 2016 | 0.76 | % | ||||
| Year Ended October 30, 2015 | 0.73 | % | ||||
| Year Ended October 31, 2014 | 0.76 | % |
7. Waiver was less than 0.005%.
See accompanying Notes to Financial Statements.
22 OPPENHEIMER MID CAP VALUE FUND
| Class R | Year Ended October 31, 2018 | Year Ended October 31, 2017 | Year Ended October 31, 2016 | Year Ended October 30, 20151 | Year Ended October 31, 2014 | |||||||||||||||
Per Share Operating Data | ||||||||||||||||||||
| Net asset value, beginning of period | $56.61 | $47.31 | $44.59 | $44.88 | $40.87 | |||||||||||||||
| Income (loss) from investment operations: | ||||||||||||||||||||
| Net investment income2 | 0.13 | 0.04 | 0.13 | 0.12 | 0.23 | |||||||||||||||
| Net realized and unrealized gain (loss) | (2.87) | 9.36 | 2.71 | (0.30) | 4.09 | |||||||||||||||
| Total from investment operations | (2.74) | 9.40 | 2.84 | (0.18) | 4.32 | |||||||||||||||
| Dividends and/or distributions to shareholders: | ||||||||||||||||||||
| Dividends from net investment income | (0.11) | (0.10) | (0.12) | (0.11) | (0.31) | |||||||||||||||
| Distributions from net realized gain | (3.46) | 0.00 | 0.00 | 0.00 | 0.00 | |||||||||||||||
| Total dividends and/or distributions to shareholders | (3.57) | (0.10) | (0.12) | (0.11) | (0.31) | |||||||||||||||
| Net asset value, end of period | $50.30 | $56.61 | $47.31 | $44.59 | $44.88 | |||||||||||||||
| Total Return, at Net Asset Value3 | (5.26)% | 19.90% | 6.38% | (0.38)% | 10.61% | |||||||||||||||
Ratios/Supplemental Data | ||||||||||||||||||||
| Net assets, end of period (in thousands) | $62,089 | $81,351 | $82,661 | $97,983 | $125,703 | |||||||||||||||
| Average net assets (in thousands) | $74,653 | $84,193 | $85,721 | $114,811 | $129,580 | |||||||||||||||
| Ratios to average net assets:4 | ||||||||||||||||||||
| Net investment income | 0.25% | 0.07% | 0.28% | 0.25% | 0.53% | |||||||||||||||
| Expenses excluding specific expenses listed below | 1.42% | 1.43% | 1.45% | 1.42% | 1.45% | |||||||||||||||
| Interest and fees from borrowings | 0.00%5 | 0.00%5 | 0.00%5 | 0.00%5 | 0.00% | |||||||||||||||
| Total expenses6 | 1.42% | 1.43% | 1.45% | 1.42% | 1.45% | |||||||||||||||
| Expenses after payments, waivers and/or reimbursements and reduction to custodian expenses | 1.42%7 | 1.42% | 1.45%7 | 1.42%7 | 1.45%7 | |||||||||||||||
| Portfolio turnover rate | 71% | 63% | 34% | 47% | 51% | |||||||||||||||
1. Represents the last business day of the Fund’s reporting period.
2. Per share amounts calculated based on the average shares outstanding during the period.
3. Assumes an initial investment on the business day before the first day of the fiscal period, with all dividends and distributions reinvested in additional shares on the reinvestment date, and redemption at the net asset value calculated on the last business day of the fiscal period. Sales charges are not reflected in the total returns. Total returns are not annualized for periods less than one full year. Returns do not reflect the deduction of taxes that a shareholder would pay on fund distributions or the redemption of fund shares.
4. Annualized for periods less than one full year.
5. Less than 0.005%.
6. Total expenses including indirect expenses from affiliated fund fees and expenses were as follows:
| Year Ended October 31, 2018 | 1.42 | % | ||||
| Year Ended October 31, 2017 | 1.43 | % | ||||
| Year Ended October 31, 2016 | 1.45 | % | ||||
| Year Ended October 30, 2015 | 1.42 | % | ||||
| Year Ended October 31, 2014 | 1.45 | % |
7. Waiver was less than 0.005%.
See accompanying Notes to Financial Statements.
23 OPPENHEIMER MID CAP VALUE FUND
FINANCIAL HIGHLIGHTS Continued
| Class Y | Year Ended October 31, 2018 | Year Ended October 31, 2017 | Year Ended October 31, 2016 | Year Ended October 30, 20151 | Year Ended October 31, 2014 | |||||||||||||||
Per Share Operating Data | ||||||||||||||||||||
| Net asset value, beginning of period | $60.47 | $50.52 | $47.59 | $47.88 | $43.81 | |||||||||||||||
| Income (loss) from investment operations: | ||||||||||||||||||||
| Net investment income2 | 0.44 | 0.30 | 0.36 | 0.36 | 0.52 | |||||||||||||||
| Net realized and unrealized gain (loss) | (3.09) | 10.01 | 2.91 | (0.30) | 4.37 | |||||||||||||||
| Total from investment operations | (2.65) | 10.31 | 3.27 | 0.06 | 4.89 | |||||||||||||||
| Dividends and/or distributions to shareholders: | ||||||||||||||||||||
| Dividends from net investment income | (0.35) | (0.36) | (0.34) | (0.35) | (0.82) | |||||||||||||||
| Distributions from net realized gain | (3.46) | 0.00 | 0.00 | 0.00 | 0.00 | |||||||||||||||
| Total dividends and/or distributions to shareholders | (3.81) | (0.36) | (0.34) | (0.35) | (0.82) | |||||||||||||||
| Net asset value, end of period | $54.01 | $60.47 | $50.52 | $47.59 | $47.88 | |||||||||||||||
| Total Return, at Net Asset Value3 | (4.77)% | 20.47% | 6.92% | 0.12% | 11.30% | |||||||||||||||
Ratios/Supplemental Data | ||||||||||||||||||||
| Net assets, end of period (in thousands) | $103,522 | $108,996 | $61,964 | $49,241 | $50,323 | |||||||||||||||
| Average net assets (in thousands) | $106,563 | $91,745 | $49,957 | $51,876 | $50,290 | |||||||||||||||
| Ratios to average net assets:4 | ||||||||||||||||||||
| Net investment income | 0.74% | 0.53% | 0.74% | 0.73% | 1.13% | |||||||||||||||
| Expenses excluding specific expenses listed below | 0.93% | 0.94% | 0.95% | 0.92% | 0.84% | |||||||||||||||
| Interest and fees from borrowings | 0.00%5 | 0.00%5 | 0.00%5 | 0.00%5 | 0.00% | |||||||||||||||
| Total expenses6 | 0.93% | 0.94% | 0.95% | 0.92% | 0.84% | |||||||||||||||
| Expenses after payments, waivers and/or reimbursements and reduction to custodian expenses | 0.93%7 | 0.93% | 0.95%7 | 0.92%7 | 0.83% | |||||||||||||||
| Portfolio turnover rate | 71% | 63% | 34% | 47% | 51% | |||||||||||||||
1. Represents the last business day of the Fund’s reporting period.
2. Per share amounts calculated based on the average shares outstanding during the period.
3. Assumes an initial investment on the business day before the first day of the fiscal period, with all dividends and distributions reinvested in additional shares on the reinvestment date, and redemption at the net asset value calculated on the last business day of the fiscal period. Sales charges are not reflected in the total returns. Total returns are not annualized for periods less than one full year. Returns do not reflect the deduction of taxes that a shareholder would pay on fund distributions or the redemption of fund shares.
4. Annualized for periods less than one full year.
5. Less than 0.005%.
6. Total expenses including indirect expenses from affiliated fund fees and expenses were as follows:
| Year Ended October 31, 2018 | 0.93 | % | ||||
| Year Ended October 31, 2017 | 0.94 | % | ||||
| Year Ended October 31, 2016 | 0.95 | % | ||||
| Year Ended October 30, 2015 | 0.92 | % | ||||
| Year Ended October 31, 2014 | 0.84 | % |
7. Waiver was less than 0.005%.
See accompanying Notes to Financial Statements.
24 OPPENHEIMER MID CAP VALUE FUND
NOTES TO FINANCIAL STATEMENTS October 31, 2018
1. Organization
Oppenheimer Mid Cap Value Fund (the “Fund”), a series of Oppenheimer Quest for Value Funds, is registered under the Investment Company Act of 1940 (“1940 Act”), as amended, as a diversified open-end management investment company. The Fund’s investment objective is to seek capital appreciation. The Fund’s investment adviser is OFI Global Asset Management, Inc. (“OFI Global” or the “Manager”), a wholly-owned subsidiary of OppenheimerFunds, Inc. (“OFI” or the “Sub-Adviser”). The Manager has entered into a sub-advisory agreement with OFI.
The Fund offers Class A, Class C, Class I, Class R and Class Y shares, and previously offered Class B shares for new purchase through June 29, 2012. Subsequent to that date, no new purchases of Class B shares were permitted. Reinvestment of dividend and/or capital gain distributions and exchanges of Class B shares into and from other Oppenheimer funds were permitted through May 31, 2018. Effective June 1, 2018 (the “Conversion Date”), all Class B shares converted to Class A shares. Class A shares are sold at their offering price, which is normally net asset value plus a front-end sales charge. Class C and Class R shares are sold, and Class B shares were sold, without a front-end sales charge but may be subject to a contingent deferred sales charge (“CDSC”). Class R shares are sold only through retirement plans. Retirement plans that offer Class R shares may impose charges on those accounts. Class I and Class Y shares are sold to certain institutional investors or intermediaries without either a front-end sales charge or a CDSC, however, the intermediaries may impose charges on their accountholders who beneficially own Class I and Class Y shares. All classes of shares have identical rights and voting privileges with respect to the Fund in general and exclusive voting rights on matters that affect that class alone. Earnings, net assets and net asset value per share may differ due to each class having its own expenses, such as transfer and shareholder servicing agent fees and shareholder communications, directly attributable to that class. Class A, C and R shares have, and Class B shares had, separate distribution and/or service plans under which they pay, and Class B shares paid, fees. Class I and Class Y shares do not pay such fees. Previously issued Class B shares automatically converted to Class A shares 72 months after the date of purchase.
The following is a summary of significant accounting policies followed in the Fund’s preparation of financial statements in accordance with accounting principles generally accepted in the United States (“U.S. GAAP”).
2. Significant Accounting Policies
Security Valuation. All investments in securities are recorded at their estimated fair value, as described in Note 3.
Foreign Currency Translation. The books and records of the Fund are maintained in U.S. dollars. Any foreign currency amounts are translated into U.S. dollars on the following basis:
(1) Value of investment securities, other assets and liabilities — at the exchange rates prevailing at market close as described in Note 3.
(2) Purchases and sales of investment securities, income and expenses — at the rates of
25 OPPENHEIMER MID CAP VALUE FUND
NOTES TO FINANCIAL STATEMENTS Continued
2. Significant Accounting Policies (Continued)
exchange prevailing on the respective dates of such transactions.
Although the net assets and the values are presented at the foreign exchange rates at market close, the Fund does not isolate the portion of the results of operations resulting from changes in foreign exchange rates on investments from the fluctuations arising from changes in prices of securities held. Such fluctuations are included with the net realized and unrealized gains or losses from investments shown in the Statement of Operations.
For securities, which are subject to foreign withholding tax upon disposition, realized and unrealized gains or losses on such securities are recorded net of foreign withholding tax.
Reported net realized foreign exchange gains or losses arise from sales of foreign currencies, currency gains or losses realized between the trade and settlement dates on securities transactions, the difference between the amounts of dividends, interest, and foreign withholding tax reclaims recorded on the Fund’s books, and the U.S. dollar equivalent of the amounts actually received or paid. Net unrealized foreign exchange gains and losses arise from changes in the value of assets and liabilities other than investments in securities, resulting from changes in the exchange rate.
Allocation of Income, Expenses, Gains and Losses. Income, expenses (other than those attributable to a specific class), gains and losses are allocated on a daily basis to each class of shares based upon the relative proportion of net assets represented by such class. Operating expenses directly attributable to a specific class are charged against the operations of that class.
Dividends and Distributions to Shareholders. Dividends and distributions to shareholders, which are determined in accordance with income tax regulations and may differ from U.S. GAAP, are recorded on the ex-dividend date. Income distributions, if any, are declared and paid quarterly. Capital gain distributions, if any, are declared and paid annually or at other times as determined necessary by the Manager.
Investment Income. Dividend income is recorded on the ex-dividend date or upon ex-dividend notification in the case of certain foreign dividends where the ex-dividend date may have passed. Non-cash dividends included in dividend income, if any, are recorded at the fair value of the securities received. Withholding taxes on foreign dividends, if any, and capital gains taxes on foreign investments, if any, have been provided for in accordance with the Fund’s understanding of the applicable tax rules and regulations. Interest income, if any, is recognized on an accrual basis. Discount and premium, which are included in interest income on the Statement of Operations, are amortized or accreted daily.
Return of Capital Estimates. Distributions received from the Fund’s investments in Master Limited Partnerships (MLPs) and Real Estate Investments Trusts (REITs), generally are comprised of income and return of capital. The Fund records investment income and return of capital based on estimates. Such estimates are based on historical information available from each MLP, REIT and other industry sources. These estimates may subsequently be revised
26 OPPENHEIMER MID CAP VALUE FUND
2. Significant Accounting Policies (Continued)
based on information received from MLPs and REITs after their tax reporting periods are concluded.
Custodian Fees. “Custodian fees and expenses” in the Statement of Operations may include interest expense incurred by the Fund on any cash overdrafts of its custodian account during the period. Such cash overdrafts may result from the effects of failed trades in portfolio securities and from cash outflows resulting from unanticipated shareholder redemption activity. The Fund pays interest to its custodian on such cash overdraft at a rate equal to the Prime Rate plus 0.35%. The “Reduction to custodian expenses” line item, if applicable, represents earnings on cash balances maintained by the Fund during the period. Such interest expense and other custodian fees may be paid with these earnings.
Security Transactions. Security transactions are recorded on the trade date. Realized gains and losses on securities sold are determined on the basis of identified cost.
Indemnifications. The Fund’s organizational documents provide current and former Trustees and officers with a limited indemnification against liabilities arising in connection with the performance of their duties to the Fund. In the normal course of business, the Fund may also enter into contracts that provide general indemnifications. The Fund’s maximum exposure under these arrangements is unknown as this would be dependent on future claims that may be made against the Fund. The risk of material loss from such claims is considered remote.
Federal Taxes. The Fund intends to comply with provisions of the Internal Revenue Code applicable to regulated investment companies and to distribute substantially all of its investment company taxable income, including any net realized gain on investments not offset by capital loss carryforwards, if any, to shareholders. Therefore, no federal income or excise tax provision is required. The Fund files income tax returns in U.S. federal and applicable state jurisdictions. The statute of limitations on the Fund’s tax return filings generally remains open for the three preceding fiscal reporting period ends. The Fund has analyzed its tax positions for the fiscal year ended October 31, 2018, including open tax years, and does not believe there are any uncertain tax positions requiring recognition in the Fund’s financial statements.
The tax components of capital shown in the following table represent distribution requirements the Fund must satisfy under the income tax regulations, losses the Fund may be able to offset against income and gains realized in future years and unrealized appreciation or depreciation of securities and other investments for federal income tax purposes.
27 OPPENHEIMER MID CAP VALUE FUND
NOTES TO FINANCIAL STATEMENTS Continued
2. Significant Accounting Policies (Continued)
Total Distributable Earnings | Accumulated Loss Carryforward1,2 | Net Unrealized Other Investments | ||||||
| $100,974,647 | $— | $104,154,134 | ||||||
1. During the reporting period, the Fund did not utilize any capital loss carryforward.
2. During the previous reporting period, the Fund utilized $64,627,129 of capital loss carryforward to offset capital gains realized in that fiscal year.
Net investment income (loss) and net realized gain (loss) may differ for financial statement and tax purposes. The character of dividends and distributions made during the fiscal year from net investment income or net realized gains are determined in accordance with federal income tax requirements, which may differ from the character of net investment income or net realized gains presented in those financial statements in accordance with U.S. GAAP. Also, due to timing of dividends and distributions, the fiscal year in which amounts are distributed may differ from the fiscal year in which the income or net realized gain was recorded by the Fund.
Accordingly, the following amounts have been reclassified for the reporting period. Net assets of the Fund were unaffected by the reclassifications.
Increase to Paid-in Capital | Reduction to Accumulated Net | |||
| $9,977,071 | $9,977,071 | |||
3. $9,924,716, including $9,375,903 of long-term capital gain, was distributed in connection with Fund share redemptions.
The tax character of distributions paid during the reporting periods:
| Year Ended October 31, 2018 | Year Ended October 31, 2017 | |||||||
| Distributions paid from: | ||||||||
| Ordinary income | $ | 4,241,441 | $ | 4,444,010 | ||||
| Long-term capital gain | 82,777,304 | 317,804 | ||||||
| Total | $ | 87,018,745 | $ | 4,761,814 | ||||
The aggregate cost of securities and other investments and the composition of unrealized appreciation and depreciation of securities and other investments for federal income tax purposes at period end are noted in the following table. The primary difference between book and tax appreciation or depreciation of securities and other investments, if applicable, is attributable to the tax deferral of losses or tax realization of financial statement unrealized gain or loss.
28 OPPENHEIMER MID CAP VALUE FUND
2. Significant Accounting Policies (Continued)
| Federal tax cost of securities | $ | 1,045,692,307 | ||
|
|
| ||
| Gross unrealized appreciation | $ | 182,699,779 | ||
| Gross unrealized depreciation | (78,545,645 | ) | ||
|
|
| ||
| Net unrealized appreciation | $ | 104,154,134 | ||
|
|
|
Use of Estimates. The preparation of financial statements in conformity with U.S. GAAP requires management to make estimates and assumptions that affect the reported amounts of assets and liabilities and disclosure of contingent assets and liabilities at the date of the financial statements and the reported amounts of increases and decreases in net assets from operations during the reporting period. Actual results could differ from those estimates.
New Accounting Pronouncements. In March 2017, Financial Accounting Standards Board (“FASB”) issued Accounting Standards Update (“ASU”), ASU 2017-08. This provides guidance related to the amortization period for certain purchased callable debt securities held at a premium. The ASU is effective for annual periods beginning after December 15, 2018, and interim periods within those annual periods. The Manager is evaluating the impacts of these changes on the financial statements.
During August 2018, the Securities and Exchange Commission (the “SEC”) issued Final Rule Release No. 33-10532 (the “Rule”), Disclosure Update and Simplification. The rule amends certain financial statement disclosure requirements to conform to U.S. GAAP. The amendments to Rule 6-04.17 of Regulation S-X (balance sheet) remove the requirement to separately state the book basis components of net assets: undistributed (over-distribution of) net investment income (“UNII”), accumulated undistributed net realized gains (losses), and net unrealized appreciation (depreciation) at the balance sheet date. Instead, consistent with U.S. GAAP, funds will be required to disclose total distributable earnings. The amendments to Rule 6-09 of Regulation S-X (statement of changes in net assets) remove the requirement to separately state the sources of distributions paid. Instead, consistent with U.S. GAAP, funds will be required to disclose the total amount of distributions paid, except that any tax return of capital must be separately disclosed. The amendments also remove the requirement to parenthetically state the book basis amount of UNII on the statement of changes in net assets. The requirements of the Rule are effective November 5, 2018, and the Funds’ Statement of Assets and Liabilities and Statement of Changes in Net Assets for the current reporting period have been modified accordingly. In addition, certain amounts within each Fund’s Statement of Changes in Net Assets for the prior fiscal period have been modified to conform to the Rule.
3. Securities Valuation
The Fund calculates the net asset value of its shares as of 4:00 P.M. Eastern Time, on each day the New York Stock Exchange (the “Exchange”) is open for trading, except in the case of a scheduled early closing of the Exchange, in which case the Fund will calculate net asset value of the shares as of the scheduled early closing time of the Exchange.
The Fund’s Board has adopted procedures for the valuation of the Fund’s securities
29 OPPENHEIMER MID CAP VALUE FUND
NOTES TO FINANCIAL STATEMENTS Continued
3. Securities Valuation (Continued)
and has delegated the day-to-day responsibility for valuation determinations under those procedures to the Manager. The Manager has established a Valuation Committee which is responsible for determining a fair valuation for any security for which market quotations are not readily available. The Valuation Committee’s fair valuation determinations are subject to review, approval and ratification by the Fund’s Board at least quarterly or more frequently, if necessary.
Valuation Methods and Inputs
Securities are valued primarily using unadjusted quoted market prices, when available, as supplied by third party pricing services or broker-dealers.
The following methodologies are used to determine the market value or the fair value of the types of securities described below:
Equity securities traded on a securities exchange (including exchange-traded derivatives other than futures and futures options) are valued based on the official closing price on the principal exchange on which the security is traded, as identified by the Manager, prior to the time when the Fund’s assets are valued. If the official closing price is unavailable, the security is valued at the last sale price on the principal exchange on which it is traded, or if no sales occurred, the security is valued at the mean between the quoted bid and asked prices. Over-the-counter equity securities are valued at the last published sale price, or if no sales occurred, at the mean between the quoted bid and asked prices. Events occurring after the close of trading on foreign exchanges may result in adjustments to the valuation of foreign securities to more accurately reflect their fair value as of the time when the Fund’s assets are valued.
Shares of a registered investment company that are not traded on an exchange are valued at that investment company’s net asset value per share.
Securities for which market quotations are not readily available, or when a significant event has occurred that would materially affect the value of the security, are fair valued either (i) by a standardized fair valuation methodology applicable to the security type or the significant event as previously approved by the Valuation Committee and the Fund’s Board or (ii) as determined in good faith by the Manager’s Valuation Committee. The Valuation Committee considers all relevant facts that are reasonably available, through either public information or information available to the Manager, when determining the fair value of a security. Those standardized fair valuation methodologies include, but are not limited to, valuing securities at the last sale price or initially at cost and subsequently adjusting the value based on: changes in company specific fundamentals, changes in an appropriate securities index, or changes in the value of similar securities which may be further adjusted for any discounts related to security-specific resale restrictions. When possible, such methodologies use observable market inputs such as unadjusted quoted prices of similar securities, observable interest rates, currency rates and yield curves. The methodologies used for valuing securities are not necessarily an indication of the risks associated with investing in those securities nor can it be assured that the Fund can obtain the fair value assigned to a security if it were to sell the security.
30 OPPENHEIMER MID CAP VALUE FUND
3. Securities Valuation (Continued)
Classifications
Each investment asset or liability of the Fund is assigned a level at measurement date based on the significance and source of the inputs to its valuation. Various data inputs may be used in determining the value of each of the Fund’s investments as of the reporting period end.
These data inputs are categorized in the following hierarchy under applicable financial accounting standards:
1) Level 1-unadjusted quoted prices in active markets for identical assets or liabilities (including securities actively traded on a securities exchange)
2) Level 2-inputs other than unadjusted quoted prices that are observable for the asset or liability (such as unadjusted quoted prices for similar assets and market corroborated inputs such as interest rates, prepayment speeds, credit risks, etc.)
3) Level 3-significant unobservable inputs (including the Manager’s own judgments about assumptions that market participants would use in pricing the asset or liability).
The inputs used for valuing securities are not necessarily an indication of the risks associated with investing in those securities.
The Fund classifies each of its investments in investment companies which are publicly offered as Level 1. Investment companies that are not publicly offered, if any, are classified as Level 2 in the fair value hierarchy.
The table below categorizes amounts that are included in the Fund’s Statement of Assets and Liabilities at period end based on valuation input level:
Level 1— Unadjusted Quoted Prices | Level 2— Other Significant Observable Inputs | Level 3— Significant Unobservable Inputs | Value | |||||||||||||
| Assets Table | ||||||||||||||||
| Investments, at Value: | ||||||||||||||||
| Common Stocks | ||||||||||||||||
Consumer Discretionary | $ | 123,109,034 | $ | — | $ | — | $ | 123,109,034 | ||||||||
Consumer Staples | 69,081,523 | — | — | 69,081,523 | ||||||||||||
Energy | 101,586,198 | — | — | 101,586,198 | ||||||||||||
Financials | 323,459,258 | — | — | 323,459,258 | ||||||||||||
Health Care | 130,092,443 | — | — | 130,092,443 | ||||||||||||
Industrials | 122,438,019 | — | — | 122,438,019 | ||||||||||||
Information Technology | 88,096,713 | — | — | 88,096,713 | ||||||||||||
Materials | 65,872,030 | — | — | 65,872,030 | ||||||||||||
Utilities | 72,764,324 | — | — | 72,764,324 | ||||||||||||
| Investment Company | 53,346,899 | — | — | 53,346,899 | ||||||||||||
| Total Assets | $ | 1,149,846,441 | $ | — | $ | — | $ | 1,149,846,441 | ||||||||
Forward currency exchange contracts and futures contracts, if any, are reported at their unrealized appreciation/depreciation at measurement date, which represents the change in the contract’s value from trade date. All additional assets and liabilities included in the above
31 OPPENHEIMER MID CAP VALUE FUND
NOTES TO FINANCIAL STATEMENTS Continued
3. Securities Valuation (Continued)
table are reported at their market value at measurement date.
For the reporting period, there were no transfers between levels.
4. Investments and Risks
Investments in Affiliated Funds. The Fund is permitted to invest in other mutual funds advised by the Manager (“Affiliated Funds”). Affiliated Funds are open-end management investment companies registered under the 1940 Act, as amended. The Manager is the investment adviser of, and the Sub-Adviser provides investment and related advisory services to, the Affiliated Funds. When applicable, the Fund’s investments in Affiliated Funds are included in the Statement of Investments. Shares of Affiliated Funds are valued at their net asset value per share. As a shareholder, the Fund is subject to its proportional share of the Affiliated Funds’ expenses, including their management fee. The Manager will waive fees and/ or reimburse Fund expenses in an amount equal to the indirect management fees incurred through the Fund’s investment in the Affiliated Funds.
Each of the Affiliated Funds in which the Fund invests has its own investment risks, and those risks can affect the value of the Fund’s investments and therefore the value of the Fund’s shares. To the extent that the Fund invests more of its assets in one Affiliated Fund than in another, the Fund will have greater exposure to the risks of that Affiliated Fund.
Investments in Money Market Instruments. The Fund is permitted to invest its free cash balances in money market instruments to provide liquidity or for defensive purposes. The Fund may invest in money market instruments by investing in Class E shares of Oppenheimer Institutional Government Money Market Fund (“IGMMF”), which is an Affiliated Fund. IGMMF is regulated as a money market fund under the 1940 Act, as amended. The Fund may also invest in money market instruments directly or in other affiliated or unaffiliated money market funds.
Master Limited Partnerships (“MLPs”). MLPs issue common units that represent an equity ownership interest in a partnership and provide limited voting rights. MLP common units are registered with the Securities and Exchange Commission (“SEC”), and are freely tradable on securities exchanges such as the NYSE and the NASDAQ Stock Market (“NASDAQ”), or in the over-the-counter (“OTC”) market. An MLP consists of one or more general partners, who conduct the business, and one or more limited partners, who contribute capital. MLP common unit holders have a limited role in the partnership’s operations and management. The Fund, as a limited partner, normally would not be liable for the debts of the MLP beyond the amounts the Fund has contributed, but would not be shielded to the same extent that a shareholder of a corporation would be. In certain circumstances creditors of an MLP would have the right to seek return of capital distributed to a limited partner. This right of an MLP’s creditors would continue after the Fund sold its investment in the MLP.
Equity Security Risk. Stocks and other equity securities fluctuate in price. The value of the
32 OPPENHEIMER MID CAP VALUE FUND
4. Investments and Risks (Continued)
Fund’s portfolio may be affected by changes in the equity markets generally. Equity markets may experience significant short-term volatility and may fall sharply at times. Different markets may behave differently from each other and U.S. equity markets may move in the opposite direction from one or more foreign stock markets. Adverse events in any part of the equity or fixed-income markets may have unexpected negative effects on other market segments.
The prices of individual equity securities generally do not all move in the same direction at the same time and a variety of factors can affect the price of a particular company’s securities. These factors may include, but are not limited to, poor earnings reports, a loss of customers, litigation against the company, general unfavorable performance of the company’s sector or industry, or changes in government regulations affecting the company or its industry.
5. Market Risk Factors
The Fund’s investments in securities and/or financial derivatives may expose the Fund to various market risk factors:
Commodity Risk. Commodity risk relates to the change in value of commodities or commodity indexes as they relate to increases or decreases in the commodities market. Commodities are physical assets that have tangible properties. Examples of these types of assets are crude oil, heating oil, metals, livestock, and agricultural products.
Credit Risk. Credit risk relates to the ability of the issuer of debt to meet interest and principal payments, or both, as they come due. In general, lower-grade, higher-yield debt securities are subject to credit risk to a greater extent than lower-yield, higher-quality securities.
Equity Risk. Equity risk relates to the change in value of equity securities as they relate to increases or decreases in the general market.
Foreign Exchange Rate Risk. Foreign exchange rate risk relates to the change in the U.S. dollar value of a security held that is denominated in a foreign currency. The U.S. dollar value of a foreign currency denominated security will decrease as the dollar appreciates against the currency, while the U.S. dollar value will increase as the dollar depreciates against the currency.
Interest Rate Risk. Interest rate risk refers to the fluctuations in value of fixed-income securities resulting from the inverse relationship between price and yield. For example, an increase in general interest rates will tend to reduce the market value of already issued fixed-income investments, and a decline in general interest rates will tend to increase their value. In addition, debt securities with longer maturities, which tend to have higher yields, are subject to potentially greater fluctuations in value from changes in interest rates than obligations with shorter maturities.
Volatility Risk. Volatility risk refers to the magnitude of the movement, but not the direction of the movement, in a financial instrument’s price over a defined time period. Large increases or decreases in a financial instrument’s price over a relative time period typically indicate greater volatility risk, while small increases or decreases in its price typically indicate lower volatility risk.
33 OPPENHEIMER MID CAP VALUE FUND
NOTES TO FINANCIAL STATEMENTS Continued
6. Shares of Beneficial Interest
The Fund has authorized an unlimited number of $0.01 par value shares of beneficial interest of each class. Transactions in shares of beneficial interest were as follows:
| Year Ended October 31, 2018 | Year Ended October 31, 2017 | |||||||||||||||||
| Shares | Amount | Shares | Amount | |||||||||||||||
| Class A | ||||||||||||||||||
| Sold1 | 861,372 | $ | 49,240,094 | 2,085,580 | $ | 114,516,764 | ||||||||||||
| Dividends and/or distributions reinvested | 1,013,226 | 56,892,054 | 68,093 | 3,780,709 | ||||||||||||||
| Redeemed | (3,007,499 | ) | (172,054,799 | ) | (4,452,720 | ) | (247,507,156 | ) | ||||||||||
| Net decrease | (1,132,901 | ) | $ | (65,922,651 | ) | (2,299,047 | ) | $ | (129,209,683 | ) | ||||||||
| Class B | ||||||||||||||||||
| Sold | 818 | $ | 38,190 | 14,889 | $ | 672,298 | ||||||||||||
| Dividends and/or distributions reinvested | 5,148 | 237,590 | — | — | ||||||||||||||
| Redeemed1 | (97,486 | ) | (4,597,219 | ) | (199,037 | ) | (9,170,678 | ) | ||||||||||
| Net decrease | (91,520 | ) | $ | (4,321,439 | ) | (184,148 | ) | $ | (8,498,380 | ) | ||||||||
| Class C | ||||||||||||||||||
| Sold | 287,237 | $ | 13,512,937 | 601,510 | $ | 27,693,457 | ||||||||||||
| Dividends and/or distributions reinvested | 319,101 | 14,747,646 | 1,034 | 47,577 | ||||||||||||||
| Redeemed | (1,095,828 | ) | (51,598,215 | ) | (1,611,515 | ) | (74,748,492 | ) | ||||||||||
| Net decrease | (489,490 | ) | $ | (23,337,632 | ) | (1,008,971 | ) | $ | (47,007,458 | ) | ||||||||
| Class I | ||||||||||||||||||
| Sold | 60,623 | $ | 3,582,562 | 33,192 | $ | 1,907,541 | ||||||||||||
| Dividends and/or distributions reinvested | 3,043 | 174,241 | 183 | 10,366 | ||||||||||||||
| Redeemed | (25,360 | ) | (1,458,222 | ) | (10,287 | ) | (567,045 | ) | ||||||||||
| Net increase | 38,306 | $ | 2,298,581 | 23,088 | $ | 1,350,862 | ||||||||||||
| Class R | ||||||||||||||||||
| Sold | 177,814 | $ | 9,705,445 | 287,317 | $ | 15,267,863 | ||||||||||||
| Dividends and/or distributions reinvested | 84,988 | 4,567,155 | 2,722 | 144,816 | ||||||||||||||
| Redeemed | (465,551 | ) | (25,394,062 | ) | (600,102 | ) | (31,972,425 | ) | ||||||||||
| Net decrease | (202,749 | ) | $ | (11,121,462 | ) | (310,063 | ) | $ | (16,559,746 | ) | ||||||||
| Class Y | ||||||||||||||||||
| Sold | 661,431 | $ | 38,460,410 | 1,436,742 | $ | 82,380,165 | ||||||||||||
| Dividends and/or distributions reinvested | 108,363 | 6,248,542 | 8,647 | 493,970 | ||||||||||||||
| Redeemed | (655,593 | ) | (38,509,071 | ) | (869,522 | ) | (49,782,996 | ) | ||||||||||
| Net increase | 114,201 | $ | 6,199,881 | 575,867 | $ | 33,091,139 | ||||||||||||
1. All outstanding Class B shares converted to Class A shares on June 1, 2018.
7. Purchases and Sales of Securities
The aggregate cost of purchases and proceeds from sales of securities, other than short-term
34 OPPENHEIMER MID CAP VALUE FUND
7. Purchases and Sales of Securities (Continued)
obligations and investments in IGMMF, for the reporting period were as follows:
| Purchases | Sales | |||||||
| Investment securities | $ | 909,633,244 | $1,081,501,268 | |||||
8. Fees and Other Transactions with Affiliates
Management Fees. Under the investment advisory agreement, the Fund pays the Manager a management fee based on the daily net assets of the Fund at an annual rate as shown in the following table:
| Fee Schedule | ||||
| Up to $400 million | 0.80 | % | ||
| Next $400 million | 0.75 | |||
| Next $1.2 billion | 0.60 | |||
| Next $4 billion | 0.58 | |||
| Over $6 billion | 0.56 | |||
The Fund’s effective management fee for the reporting period was 0.71% of average annual net assets before any applicable waivers.
Sub-Adviser Fees. The Manager has retained the Sub-Adviser to provide the day-to-day portfolio management of the Fund. Under the Sub-Advisory Agreement, the Manager pays the Sub-Adviser an annual fee in monthly installments, equal to a percentage of the investment management fee collected by the Manager from the Fund, which shall be calculated after any investment management fee waivers. The fee paid to the Sub-Adviser is paid by the Manager, not by the Fund.
Transfer Agent Fees. OFI Global (the “Transfer Agent”) serves as the transfer and shareholder servicing agent for the Fund. The Fund pays the Transfer Agent a fee based on annual net assets, which shall be calculated after any applicable fee waivers. Fees incurred and average net assets for each class with respect to these services are detailed in the Statement of Operations and Financial Highlights, respectively.
Sub-Transfer Agent Fees. The Transfer Agent has retained Shareholder Services, Inc., a wholly-owned subsidiary of OFI (the “Sub-Transfer Agent”), to provide the day-to-day transfer agent and shareholder servicing of the Fund. Under the Sub-Transfer Agency Agreement, the Transfer Agent pays the Sub-Transfer Agent an annual fee in monthly installments, equal to a percentage of the transfer agent fee collected by the Transfer Agent from the Fund, which shall be calculated after any applicable fee waivers. The fee paid to the Sub-Transfer Agent is paid by the Transfer Agent, not by the Fund.
Trustees’ Compensation. The Fund has adopted an unfunded retirement plan (the “Plan”) for the Fund’s Independent Trustees. Benefits are based on years of service and fees paid to each Trustee during their period of service. The Plan was frozen with respect to adding new participants effective December 31, 2006 (the “Freeze Date”) and existing Plan Participants as of the Freeze Date will continue to receive accrued benefits under the Plan. Active
35 OPPENHEIMER MID CAP VALUE FUND
NOTES TO FINANCIAL STATEMENTS Continued
8. Fees and Other Transactions with Affiliates (Continued)
Independent Trustees as of the Freeze Date have each elected a distribution method with respect to their benefits under the Plan.
During the reporting period, the Fund’s projected benefit obligations, payments to retired Trustees and accumulated liability were as follows:
| Projected Benefit Obligations Increased | $ | 2,626 | ||
| Payments Made to Retired Trustees | 58,793 | |||
| Accumulated Liability as of October 31, 2018 | 136,418 |
The Fund’s Board of Trustees (“Board”) has adopted a compensation deferral plan for Independent Trustees that enables Trustees to elect to defer receipt of all or a portion of the annual compensation they are entitled to receive from the Fund. For purposes of determining the amount owed to the Trustee under the plan, deferred amounts are treated as though equal dollar amounts had been invested in shares of the Fund or in other Oppenheimer funds selected by the Trustee. The Fund purchases shares of the funds selected for deferral by the Trustee in amounts equal to his or her deemed investment, resulting in a Fund asset equal to the deferred compensation liability. Such assets are included as a component of “Other” within the asset section of the Statement of Assets and Liabilities. Deferral of Trustees’ fees under the plan will not affect the net assets of the Fund and will not materially affect the Fund’s assets, liabilities or net investment income per share. Amounts will be deferred until distributed in accordance with the compensation deferral plan.
Distribution and Service Plan (12b-1) Fees. Under its General Distributor’s Agreement with the Fund, OppenheimerFunds Distributor, Inc. (the “Distributor”) acts as the Fund’s principal underwriter in the continuous public offering of the Fund’s classes of shares.
Distribution and Service Plan for Class A Shares. The Fund has adopted a Distribution and Service Plan (the “Plan”) for Class A shares pursuant to Rule 12b-1 under the 1940 Act. Under the Plan, the Fund pays a service fee to the Distributor at an annual rate of 0.25% of the daily net assets of Class A shares. The Distributor currently uses all of those fees to pay dealers, brokers, banks and other financial institutions periodically for providing personal services and maintenance of accounts of their customers that hold Class A shares. Under the Plan, the Fund may also pay an asset-based sales charge to the Distributor. However, the Fund’s Board has currently set the rate at zero. Fees incurred by the Fund under the Plan are detailed in the Statement of Operations.
Distribution and Service Plans for Class B, Class C and Class R Shares. The Fund has adopted Distribution and Service Plans (the “Plans”) for Class C and Class R shares, and had previously adopted a similar plan for Class B shares, pursuant to Rule 12b-1 under the 1940 Act to compensate the Distributor for distributing those share classes, maintaining accounts and providing shareholder services. Under the Plans, the Fund pays the Distributor an annual asset-based sales charge of 0.75% on Class C shares’ daily net assets and 0.25% on Class
36 OPPENHEIMER MID CAP VALUE FUND
8. Fees and Other Transactions with Affiliates (Continued)
R shares’ daily net assets. The Fund paid the Distributor an annual asset-based sales charge of 0.75% on Class B shares prior to their Conversion Date. The Fund also pays a service fee under the Plans at an annual rate of 0.25% of daily net assets and previously paid this fee for Class B prior to their Conversion Date. The Plans continue in effect from year to year only if the Fund’s Board of Trustees votes annually to approve their continuance at an in person meeting called for that purpose. Fees incurred by the Fund under the Plans are detailed in the Statement of Operations.
Sales Charges. Front-end sales charges and CDSC do not represent expenses of the Fund. They are deducted from the proceeds of sales of Fund shares prior to investment or from redemption proceeds prior to remittance, as applicable. The sales charges retained by the Distributor from the sale of shares and the CDSC retained by the Distributor on the redemption of shares is shown in the following table for the period indicated.
| Class A | Class B | Class C | Class R | |||||||||||||||||
| Class A | Contingent | Contingent | Contingent | Contingent | ||||||||||||||||
| Front-End | Deferred | Deferred | Deferred | Deferred | ||||||||||||||||
| Sales Charges | Sales Charges | Sales Charges | Sales Charges | Sales Charges | ||||||||||||||||
| Retained by | Retained by | Retained by | Retained by | Retained by | ||||||||||||||||
| Year Ended | Distributor | Distributor | Distributor1 | Distributor | Distributor | |||||||||||||||
| October 31, 2018 | $143,325 | $3,446 | $706 | $6,428 | $— | |||||||||||||||
1. Effective June 1, 2018, all Class B shares converted to Class A shares.
Waivers and Reimbursements of Expenses. Effective for the period January 1, 2017 through December 31, 2017, the Transfer Agent voluntarily waived and/or reimbursed Fund expenses in an amount equal to 0.015% of average annual net assets for Classes A, C, R and Y.
During the reporting period, the Transfer Agent waived fees and/or reimbursed the Fund for transfer agent and shareholder servicing agent fees as follows:
| Class A | $ | 24,226 | ||
| Class B1 | 93 | |||
| Class C | 5,499 | |||
| Class R | 2,041 | |||
| Class Y | 2,743 |
1. Effective June 1, 2018, all Class B shares converted to Class A shares.
The Manager will waive fees and/or reimburse Fund expenses in an amount equal to the indirect management fees incurred through the Fund’s investment in IGMMF. During the reporting period, the Manager waived fees and/or reimbursed the Fund $28,979 for IGMMF management fees. This fee waiver and/or expense reimbursement may not be amended or withdrawn for one year from the date of the Fund’s prospectus, unless approved by the Board.
37 OPPENHEIMER MID CAP VALUE FUND
NOTES TO FINANCIAL STATEMENTS Continued
9. Borrowings and Other Financing
Joint Credit Facility. A number of mutual funds managed by the Manager participate in a $1.95 billion revolving credit facility (the “Facility”) intended to provide short-term financing, if necessary, subject to certain restrictions in connection with atypical redemption activity. Expenses and fees related to the Facility are paid by the participating funds and are disclosed separately or as other expenses on the Statement of Operations. The Fund did not utilize the Facility during the reporting period.
10. Pending Acquisition
On October 18, 2018, Massachusetts Mutual Life Insurance Company (“MassMutual”), an indirect corporate parent of the Sub-Adviser and the Manager announced that it has entered into a definitive agreement, whereby Invesco Ltd. (“Invesco”), a global investment management company, will acquire the Sub-Adviser. As of the time of the announcement, the transaction is expected to close in the second quarter of 2019, pending necessary regulatory and other third-party approvals. This is subject to change.
38 OPPENHEIMER MID CAP VALUE FUND
REPORT OF INDEPENDENT REGISTERED PUBLIC ACCOUNTING FIRM
To the Shareholders and Board of Trustees
Oppenheimer Quest For Value Funds:
Opinion on the Financial Statements
We have audited the accompanying statement of assets and liabilities of Oppenheimer Mid Cap Value Fund (the “Fund”), a series of Oppenheimer Quest For Value Funds, including the statement of investments, as of October 31, 2018, the related statement of operations for the year then ended, the statements of changes in net assets for each of the years in the two year period then ended, and the related notes (collectively, the “financial statements”) and the financial highlights for each of the years in the five year period then ended. In our opinion, the financial statements and financial highlights present fairly, in all material respects, the financial position of the Fund as of October 31, 2018, the results of its operations for the year then ended, the changes in its net assets for each of the years in the two year period then ended, and the financial highlights for each of the years in the five year period then ended, in conformity with U.S. generally accepted accounting principles.
Basis for Opinion
These financial statements and financial highlights are the responsibility of the Fund’s management. Our responsibility is to express an opinion on these financial statements and financial highlights based on our audits. We are a public accounting firm registered with the Public Company Accounting Oversight Board (United States) (“PCAOB”) and are required to be independent with respect to the Fund in accordance with the U.S. federal securities laws and the applicable rules and regulations of the Securities and Exchange Commission and the PCAOB.
We conducted our audits in accordance with the standards of the PCAOB. Those standards require that we plan and perform the audit to obtain reasonable assurance about whether the financial statements and financial highlights are free of material misstatement, whether due to error or fraud. Our audits included performing procedures to assess the risks of material misstatement of the financial statements and financial highlights, whether due to error or fraud, and performing procedures that respond to those risks. Such procedures included examining, on a test basis, evidence regarding the amounts and disclosures in the financial statements and financial highlights. Such procedures also included confirmation of securities owned as of October 31, 2018, by correspondence with the custodian, brokers and the transfer agent, or by other appropriate auditing procedures. Our audits also included evaluating the accounting principles used and significant estimates made by management, as well as evaluating the overall presentation of the financial statements and financial highlights. We believe that our audits provide a reasonable basis for our opinion.
KPMGLLP
We have not been able to determine the specific year that we began serving as the auditor of one or more Oppenheimer Funds investment companies, however we are aware that we have served as the auditor of one or more Oppenheimer Funds investment companies since at least 1969.
Denver, Colorado
December 21, 2018
39 OPPENHEIMER MID CAP VALUE FUND
FEDERAL INCOME TAX INFORMATION Unaudited
In early 2018, if applicable, shareholders of record received information regarding all dividends and distributions paid to them by the Fund during calendar year 2017.
Capital gain distributions of $3.46045 per share were paid to Class A, Class B, Class C, Class I, Class R and Class Y shareholders, respectively, on December 6, 2017. Whether received in stock or in cash, the capital gain distribution should be treated by shareholders as a gain from the sale of the capital assets held for more than one year (long-term capital gains).
Dividends, if any, paid by the Fund during the reporting period which are not designated as capital gain distributions should be multiplied by the maximum amount allowable but not less than 100% to arrive at the amount eligible for the corporate dividend-received deduction.
A portion, if any, of the dividends paid by the Fund during the reporting period which are not designated as capital gain distributions are eligible for lower individual income tax rates to the extent that the Fund has received qualified dividend income as stipulated by recent tax legislation. The maximum amount allowable but not less than $16,545,055 of the Fund’s fiscal year taxable income may be eligible for the lower individual income tax rates. In early 2018, shareholders of record received information regarding the percentage of distributions that are eligible for lower individual income tax rates.
Recent tax legislation allows a regulated investment company to designate distributions not designated as capital gain distributions, as either interest related dividends or short-term capital gain dividends, both of which are exempt from the U.S. withholding tax applicable to non U.S. taxpayers. For the reporting period, the maximum amount allowable but not less than $133,085 of the ordinary distributions to be paid by the Fund qualifies as an interest related dividend and the maximum amount allowable but not less than $6,096,676 of the short-term capital gain distribution to be paid by the Fund qualifies as a short-term capital gain dividend.
The foregoing information is presented to assist shareholders in reporting distributions received from the Fund to the Internal Revenue Service. Because of the complexity of the federal regulations which may affect your individual tax return and the many variations in state and local tax regulations, we recommend that you consult your tax advisor for specific guidance.
40 OPPENHEIMER MID CAP VALUE FUND
BOARD APPROVAL OF THE FUND’S INVESTMENT ADVISORY
AND SUB-ADVISORY AGREEMENTS Unaudited
The Fund has entered into an investment advisory agreement with OFI Global Asset Management, Inc. (“OFI Global” or the “Adviser”), a wholly-owned subsidiary of OppenheimerFunds, Inc. (“OFI” or the “Sub-Adviser”) (“OFI Global” and “OFI” together the “Managers”) and OFI Global has entered into a sub-advisory agreement with OFI whereby OFI provides investment sub-advisory services to the Fund (collectively, the “Agreements”). Each year, the Board of Trustees (the “Board”), including a majority of the independent Trustees, is required to determine whether to approve the terms of the Agreements and the renewal thereof. The Investment Company Act of 1940, as amended, requires that the Board request and evaluate, and that the Managers provide, such information as may be reasonably necessary to evaluate the terms of the Agreements. The Board employs an independent consultant to prepare a report that provides information, including comparative information that the Board requests for that purpose. In addition to in-person meetings focused on this evaluation, the Board receives information throughout the year regarding Fund services, fees, expenses and performance.
The Managers and the independent consultant provided information to the Board on the following factors: (i) the nature, quality and extent of the Managers’ services, (ii) the comparative investment performance of the Fund and the Managers, (iii) the fees and expenses of the Fund, including comparative fee and expense information, (iv) the profitability of the Managers and their affiliates, including an analysis of the cost of providing services, (v) whether economies of scale are realized as the Fund grows and whether fee levels reflect these economies of scale for Fund investors and (vi) other benefits to the Managers from their relationship with the Fund. The Board was aware that there are alternatives to retaining the Managers.
Outlined below is a summary of the principal information considered by the Board as well as the Board’s conclusions.
Nature, Quality and Extent of Services. The Board considered information about the nature, quality and extent of the services provided to the Fund and information regarding the Managers’ key personnel who provide such services. The Managers’ duties include providing the Fund with the services of the Sub-Adviser’s portfolio managers and investment team, who provide research, analysis and other advisory services in regard to the Fund’s investments; and securities trading services. OFI Global is responsible for oversight of third-party service providers; monitoring compliance with applicable Fund policies and procedures and adherence to the Fund’s investment restrictions; risk management; and oversight of the Sub-Adviser. OFI Global is also responsible for providing certain administrative services to the Fund. Those services include providing and supervising all administrative and clerical personnel who are necessary in order to provide effective corporate administration for the Fund; compiling and maintaining records with respect to the Fund’s operations; preparing and filing reports required by the U.S. Securities and Exchange Commission; preparing periodic reports regarding the operations of the Fund for its shareholders; preparing proxy materials for shareholder meetings; and preparing the registration statements required by federal and state securities laws for the sale of the Fund’s shares. OFI Global also provides the Fund with office space, facilities and equipment.
41 OPPENHEIMER MID CAP VALUE FUND
BOARD APPROVAL OF THE FUND’S INVESTMENT ADVISORY
AND SUB-ADVISORY AGREEMENTS Unaudited / Continued
The Board also considered the quality of the services provided and the quality of the Managers’ resources that are available to the Fund. The Board took account of the fact that the Sub-Adviser has over fifty years of experience as an investment adviser and that its assets under management rank it among the top mutual fund managers in the United States. The Board evaluated the Managers’ advisory, administrative, accounting, legal, compliance and risk management services, among other services, and information the Board has received regarding the experience and professional qualifications of the Managers’ key personnel and the size and functions of their staff. In its evaluation of the quality of the portfolio management services provided, the Board considered the experience of Laton Spahr and Eric Hewitt, the portfolio managers for the Fund, and the Sub-Adviser’s investment team and analysts. The Board members also considered the totality of their experiences with the Managers as directors or trustees of the Fund and other funds advised by the Managers. The Board considered information regarding the quality of services provided by affiliates of the Managers, which the Board members have become knowledgeable about through their experiences with the Managers and in connection with the review or renewal of the Fund’s service agreements or service providers. The Board concluded, in light of the Managers’ experience, reputation, personnel, operations and resources that the Fund benefits from the services provided under the Agreements.
Investment Performance of the Managers and the Fund. Throughout the year, the Managers provided information on the investment performance of the Fund, the Adviser and the Sub-Adviser, including comparative performance information. The Board also reviewed information, prepared by the Managers and by the independent consultant, comparing the Fund’s historical performance to relevant benchmarks or market indices and to the performance of other retail funds in the mid-cap value category. The Board noted that the Fund’s one-year and five-year performance was better than its category median although its three-year and ten-year performance was below its category median.
Fees and Expenses of the Fund. The Board reviewed the fees paid to the Adviser and the other expenses borne by the Fund. The Board noted that the Adviser, not the Fund, pays the Sub-Adviser’s fee under the sub-advisory agreement. The independent consultant provided comparative data in regard to the fees and expenses of the Fund and other retail front-end load mid-cap value funds with comparable asset levels and distribution features. The Board noted that the Fund’s contractual management fee was equal to its peer group median and lower than its category median. The Board also noted that the Fund’s total expenses were higher than its peer group median and lower than its category median.
Economies of Scale and Profits Realized by the Managers. The Board considered information regarding the Managers’ costs in serving as the Fund’s investment adviser and sub-adviser, including the costs associated with the personnel and systems necessary to manage the Fund, and information regarding the Managers’ profitability from their relationship with the Fund. The Board also considered that the Managers must be able to pay and retain experienced professional personnel at competitive rates to provide quality services to the Fund. The Board reviewed whether the Managers may realize economies of scale in managing and supporting the Fund. The Board noted that the Fund currently
42 OPPENHEIMER MID CAP VALUE FUND
has management fee breakpoints, which are intended to share with Fund shareholders economies of scale that may exist as the Fund’s assets grow.
Other Benefits to the Managers. In addition to considering the profits realized by the Managers, the Board considered information that was provided regarding the direct and indirect benefits the Managers receive as a result of their relationship with the Fund, including compensation paid to the Managers’ affiliates and research provided to the Adviser in connection with permissible brokerage arrangements (soft dollar arrangements).
Conclusions. These factors were also considered by the independent Trustees meeting separately from the full Board, assisted by experienced counsel to the Fund and to the independent Trustees. Fund counsel and the independent Trustees’ counsel are independent of the Managers within the meaning and intent of the Securities and Exchange Commission Rules.
Based on its review of the information it received and its evaluations described above, the Board, including a majority of the independent Trustees, decided to continue the Agreements through September 30, 2019. In arriving at its decision, the Board did not identify any factor or factors as being more important than others, but considered all of the above information, and considered the terms and conditions of the Agreements, including the management fees, in light of all the surrounding circumstances.
43 OPPENHEIMER MID CAP VALUE FUND
PORTFOLIO PROXY VOTING POLICIES AND GUIDELINES;
UPDATES TO STATEMENTS OF INVESTMENTS Unaudited
The Fund has adopted Portfolio Proxy Voting Policies and Guidelines under which the Fund votes proxies relating to securities (“portfolio proxies”) held by the Fund. A description of the Fund’s Portfolio Proxy Voting Policies and Guidelines is available (i) without charge, upon request, by calling the Fund toll-free at 1.800. CALL OPP (225.5677), (ii) on the Fund’s website at www.oppenheimerfunds.com, and (iii) on the SEC’s website at www.sec.gov. In addition, the Fund is required to file Form N-PX, with its complete proxy voting record for the 12 months ended June 30th, no later than August 31st of each year. The Fund’s voting record is available (i) without charge, upon request, by calling the Fund toll-free at 1.800. CALL OPP (225.5677), and (ii) in the Form N-PX filing on the SEC’s website at www.sec.gov.
The Fund files its complete schedule of portfolio holdings with the SEC for the first quarter and the third quarter of each fiscal year on Form N-Q. The Fund’s Form N-Q filings are available on the SEC’s website at www.sec.gov.
Householding—Delivery of Shareholder Documents
This is to inform you about OppenheimerFunds’ “householding” policy. If more than one member of your household maintains an account in a particular fund, OppenheimerFunds will mail only one copy of the fund’s prospectus (or, if available, the fund’s summary prospectus), annual and semiannual report and privacy policy. The consolidation of these mailings, called householding, benefits your fund through reduced mailing expense, and benefits you by reducing the volume of mail you receive from OppenheimerFunds. Householding does not affect the delivery of your account statements.
Please note that we will continue to household these mailings for as long as you remain an OppenheimerFunds shareholder, unless you request otherwise. If you prefer to receive multiple copies of these materials, please call us at 1.800. CALL-OPP (225-5677). You may also notify us in writing or via email. We will begin sending you individual copies of the prospectus (or, if available, the summary prospectus), reports and privacy policy within 30 days of receiving your request to stop householding.
44 OPPENHEIMER MID CAP VALUE FUND
TRUSTEES AND OFFICERS Unaudited
| Name, Position(s) Held with the Fund, Length of Service, Year of Birth | Principal Occupation(s) During the Past 5 Years; Other Trusteeships/ Directorships Held; Number of Portfolios in the Fund Complex Currently Overseen | |
| INDEPENDENT TRUSTEES | The address of each Trustee in the chart below is 6803 S. Tucson Way, Centennial, Colorado 80112-3924. Each Trustee serves for an indefinite term, or until his or her resignation, retirement, death or removal. Each of the Trustees in the chart below oversee 47 portfolios in the OppenheimerFunds complex. | |
Brian F. Wruble, Chairman of the Board of Trustees (since 2009), Trustee (since 2001) Year of Birth: 1943 | Governor of Community Foundation of the Florida Keys (non-profit) (since July 2012); Director of TCP Capital, Inc. (registered business development company) (since November 2015); Chairman Emeritus of the Board of Trustees (since August 2011), Chairman of the Board of Trustees (August 2007-August 2011), Trustee of the Board of Trustees (since August 1991) of The Jackson Laboratory (non-profit); Member of Zurich Insurance Group’s Investment Management Advisory Council (insurance) (October 2004-February 2017); Treasurer (since 2007) and Trustee (since May 1992) of the Institute for Advanced Study (non-profit educational institute); Director of Special Value Opportunities Fund, LLC (registered investment company) (affiliate of the Sub-Adviser’s parent company) (September 2004- June 2015); General Partner of Odyssey Partners, L.P. (hedge fund) (September 1995-December 2007); Special Limited Partner of Odyssey Investment Partners, LLC (private equity investment) (January 1999-September 2004). Mr. Wruble has served on the Boards of certain Oppenheimer funds since April 2001, during which time he has become familiar with the Fund’s (and other Oppenheimer funds’) financial, accounting, regulatory and investment matters and has contributed to the Board’s deliberations. | |
Beth Ann Brown, Trustee (since 2016) Year of Birth: 1968 | Director, Board of Directors of Caron Engineering Inc. (since January 2018); Advisor, Board of Advisors of Caron Engineering Inc. (December 2014-December 2017); Independent Consultant (since September 2012); held the following positions at Columbia Management Investment Advisers LLC: Head of Intermediary Distribution (2008-2012), Managing Director, Strategic Relations (2005-2008), Managing Director, Head of National Accounts (2004-2005); Senior Vice President, National Account Manager (2002-2004), Senior Vice President, Key Account Manager (1999-2002) and Vice President, Key Account Manager (1996-1999) of Liberty Funds Distributor, Inc.; President and Director, of Acton Shapleigh Youth Conservation Corps (non -profit) (2012-2015); and Vice President and Director of Grahamtastic Connection (non-profit) (since May 2013). Ms. Brown has served on the Boards of certain Oppenheimer funds since January 2016, during which time she has become familiar with the Fund’s (and other Oppenheimer funds’) financial, accounting, regulatory and investment matters and has contributed to the Board’s deliberations. | |
Edmund P. Giambastiani, Jr., Trustee (since 2013) Year of Birth: 1948 | Director of THL Credit, Inc. (since November 2016) (alternative credit investment manager); Advisory Board Member of the Maxwell School of Citizenship and Public Affairs of Syracuse University (April 2012-September 2016); Director of Mercury Defense Systems Inc. (information technology) (August 2011-February 2013); Trustee of the U.S. Naval Academy Foundation Athletic & Scholarship Program (since November 2010); Advisory Board Member of the Massachusetts Institute of Technology Lincoln Laboratory (federally-funded research development) (since May 2010); Director of The Boeing Company (aerospace and defense) (since October 2009); Trustee of MITRE Corporation (federally-funded research development) (since September 2008); Independent Director of QinetiQ Group Plc (defense technology and security) (February 2008-August 2011); Chairman of Monster Worldwide, Inc. (career services) (March 2015-November 2016), Director of | |
45 OPPENHEIMER MID CAP VALUE FUND
TRUSTEES AND OFFICERS Unaudited / Continued
Edmund P. Giambastiani, Jr., Continued | Monster Worldwide, Inc. (career services) (February 2008-June 2011); Lead Director (June 2011-March 2015); Chairman of Alenia North America, Inc. (military and defense products) (January 2008-October 2009); Director of SRA International, Inc. (information technology and services) (January 2008-July 2011); President of Giambastiani Group LLC (national security and energy consulting) (since October 2007); United States Navy, career nuclear submarine officer (June 1970-October 2007); Seventh Vice Chairman of the Joint Chiefs of Staff (2005-October 2007); Supreme Allied Commander of NATO Allied Command Transformation (2003- 2005) and Commander, U.S. Joint Forces Command (2002-2005). Since his retirement from the U.S. Navy in October 2007, Admiral Giambastiani has also served on numerous U.S. Government advisory boards, investigations and task forces for the Secretaries of Defense, State and Interior and the Central Intelligence Agency. He recently completed serving as a federal commissioner on the Military Compensation and Retirement Modernization Commission. Admiral Giambastiani has served on the Boards of certain Oppenheimer funds since February 2013, during which time he has become familiar with the Fund’s (and other Oppenheimer funds’) financial, accounting, regulatory and investment matters and has contributed to the Board’s deliberations. | |
Elizabeth Krentzman, Trustee (since 2014) Year of Birth: 1959 | Trustee of the University of Florida National Board Foundation (since September 2017); Member of the Cartica Funds Board of Directors (private investment funds) (since January 2017); Member of the University of Florida Law Center Association, Inc. Board of Trustees and Audit Committee Member (since April 2016); Member of University of Florida Law Advisory Board, Washington, DC Alumni Group (since 2015); Advisory Board Member of the Securities and Exchange Commission Historical Society (since 2007); held the following positions at Deloitte & Touche LLP: Principal and Chief Regulatory Advisor for Asset Management Services (2007 - 2014) and U.S. Mutual Fund Leader (2011 - 2014); General Counsel of the Investment Company Institute (trade association) (June 2004 - April 2007); held the following positions at Deloitte & Touche LLP: National Director of the Investment Management Regulatory Consulting Practice (1997 - 2004), Principal (2003 - 2004), Director (1998 - 2003) and Senior Manager (1997 - 1998); Assistant Director of the Division of Investment Management - Office of Disclosure and Investment Adviser Regulation of the U.S. Securities and Exchange Commission (1996 - 1997) and various positions with the Division of Investment Management – Office of Regulatory Policy (1991 - 1996) of the U.S. Securities and Exchange Commission; Associate at Ropes & Gray LLP (1987 – 1991). Ms. Krentzman has served on the Boards of certain Oppenheimer funds since August 2014, during which time she has become familiar with the Fund’s (and other Oppenheimer funds’) financial, accounting, regulatory and investment matters and has contributed to the Board’s deliberations. | |
Mary F. Miller, Trustee (since 2009) Year of Birth: 1942 | Trustee of International House (not-for-profit) (since June 2007); Trustee of the American Symphony Orchestra (not-for-profit) (October 1998-November 2011); and Senior Vice President and General Auditor of American Express Company (financial services company) (July 1998-February 2003). Ms. Miller has served on the Boards of certain Oppenheimer funds since August 2004, during which time she has become familiar with the Fund’s (and other Oppenheimer funds’) financial, accounting, regulatory and investment matters and has contributed to the Board’s deliberations. | |
46 OPPENHEIMER MID CAP VALUE FUND
Joel W. Motley, Trustee (since 2009) Year of Birth: 1952 | Director of Office of Finance Federal Home Loan Bank (since September 2016); Director of Greenwall Foundation (since October 2013); Member of Board and Investment Committee of The Greenwall Foundation (since April 2013); Member of the Vestry of Trinity Wall Street (since April 2012); Director of Southern Africa Legal Services Foundation (since March 2012); Board Member and Investment Committee Member of Pulitzer Center for Crisis Reporting (non-profit journalism) (since March 2011); Managing Director of Public Capital Advisors, LLC (privately- held financial advisor) (since January 2006); Managing Director of Carmona Motley, Inc. (privately-held financial advisor) (since January 2002); Director of Columbia Equity Financial Corp. (privately-held financial advisor) (2002-2007); Managing Director of Carmona Motley Hoffman Inc. (privately-held financial advisor) (January 1998-December 2001); Member of the Finance and Budget Committee of the Council on Foreign Relations, Member of the Investment Committee and Board of Human Rights Watch (since July 2000) and Member of the Investment Committee and Board of Historic Hudson Valley (since February 2010). Mr. Motley has served on the Boards of certain Oppenheimer funds since October 2002, during which time he has become familiar with the Fund’s (and other Oppenheimer funds’) financial, accounting, regulatory and investment matters and has contributed to the Board’s deliberations. | |
Joanne Pace, Trustee (since 2012) Year of Birth: 1958 | Advisory Board Director of Massey Quick Simon & Co. (wealth management), LLC (since October 2014); Board Director of Horizon Blue Cross Blue Shield of New Jersey (healthcare) (since November 2012); Advisory Board Director of The Alberleen Group LLC (investment banking) (since March 2012); Governing Council Member (since 2016) and Chair of Education Committee (since 2017) of Independent Directors Council (IDC) (since 2016); Board Member of 100 Women in Finance (non-profit) (since January 2015); Advisory Council Member of Morgan Stanley Children’s Hospital (non-profit) (since May 2012); Director of The Komera Project (non-profit) (April 2012-2016); New York Advisory Board Director of Peace First (non-profit) (March 2010-2013); Senior Advisor of SECOR Asset Management, LP (2010-2011); Managing Director and Chief Operating Officer of Morgan Stanley Investment Management (2006-2010); Partner and Chief Operating Officer of FrontPoint Partners, LLC (hedge fund) (2005-2006); held the following positions at Credit Suisse (investment banking): Managing Director (2003-2005); Global Head of Human Resources and member of Executive Board and Operating Committee (2004-2005), Global Head of Operations and Product Control (2003-2004); held the following positions at Morgan Stanley: Managing Director (1997-2003), Controller and Principal Accounting Officer (1999-2003); Chief Financial Officer (temporary assignment) for the Oversight Committee, Long Term Capital Management (1998-1999). Lead Independent Director and Chair of the Audit and Nominating Committee of The Global Chartist Fund, LLC of Oppenheimer Asset Management (2011-2012); Board Director of Managed Funds Association (2008-2010); Board Director of Morgan Stanley Foundation (2007- 2010) and Investment Committee Chair (2008-2010). Ms. Pace has served on the Boards of certain Oppenheimer funds since November 2012, during which time she has become familiar with the Fund’s (and other Oppenheimer funds’) financial, accounting, regulatory and investment matters and has contributed to the Board’s deliberations. | |
47 OPPENHEIMER MID CAP VALUE FUND
TRUSTEES AND OFFICERS Unaudited / Continued
Daniel Vandivort, Trustee (since 2014) Year of Birth: 1954 | Chairman and Lead Independent Director/Trustee (March 2010-September 2014), Chairman of the Audit Committee (March 2009-September 2014) and Director/Trustee (December 2008-September 2014) of the Board of Directors/ Trustees of Value Line Funds; Trustee (since January 2015) and Treasurer and Chairman of the Audit Committee and Finance Committee (since January 2016) of Board of Trustees of Huntington Disease Foundation of America; Trustee, Board of Trustees, RIM Retirement Savings Plan (2005-2007); President and Chief Investment Officer, Robeco Investment Management, formerly known as Weiss Peck and Greer (January 2005-June 2007); Member, Management Committee of Robeco Investment Management (2001-2007); Chairman and Trustee of the Board of Trustees of Weiss, Peck and Greer Funds (2004-2005); Managing Director and Head of Fixed Income, Weiss, Peck and Greer (November 1994-January 2005); Managing Director and Head of Fixed Income, CS First Boston Investment Management (January 1992-November 1994); Director, Global Product Development, First Boston Asset Management (November 1989-January 1992); Vice President, Fixed Income Sales, First Boston Corp. (May 1984-November 1989). Mr. Vandivort has served on the Boards of certain Oppenheimer funds since 2014, during which time he has become familiar with the Fund’s (and other Oppenheimer funds’) financial, accounting, regulatory and investment matters and has contributed to the Board’s deliberations.
| |
INTERESTED TRUSTEE AND OFFICER |
Mr. Steinmetz is an “Interested Trustee” because he is affiliated with the Manager and the Sub-Adviser by virtue of his positions as Chairman and director of the Sub-Adviser and officer and director of the Manager. Both as a Trustee and as an officer, Mr. Steinmetz serves for an indefinite term, or until his resignation, retirement, death or removal. Mr. Steinmetz’s address is 225 Liberty Street, New York, New York 10281-1008. Mr. Steinmetz is an officer of 105 portfolios in the OppenheimerFunds complex. | |
Arthur P. Steinmetz, Trustee (since 2015), President and Principal Executive Officer (since 2014) Year of Birth: 1958 | Chairman of OppenheimerFunds, Inc. (since January 2015); CEO and Chairman of OFI Global Asset Management, Inc. (since July 2014), President of OFI Global Asset Management, Inc. (since May 2013), a Director of OFI Global Asset Management, Inc. (since January 2013), Director of OppenheimerFunds, Inc. (since July 2014), President, Management Director and CEO of Oppenheimer Acquisition Corp. (OppenheimerFunds, Inc.’s parent holding company) (since July 2014), and President and Director of OFI SteelPath, Inc. (since January 2013). Chief Investment Officer of the OppenheimerFunds advisory entities (January 2013-December 2013); Executive Vice President of OFI Global Asset Management, Inc. (January 2013-May 2013); Chief Investment Officer of OppenheimerFunds, Inc. (October 2010-December 2012); Chief Investment Officer, Fixed-Income, of OppenheimerFunds, Inc. (April 2009-October 2010); Executive Vice President of OppenheimerFunds, Inc. (October 2009-December 2012); Director of Fixed Income of OppenheimerFunds, Inc. (January 2009-April 2009); and a Senior Vice President of OppenheimerFunds, Inc. (March 1993-September 2009).
| |
OTHER OFFICERS OF THE FUND |
The addresses of the Officers in the chart below are as follows: for Messrs. Spahr, Hewitt, Mss. Lo Bessette, Foxson and Picciotto, 225 Liberty Street, New York, New York 10281-1008, for Mr. Petersen, 6803 S. Tucson Way, Centennial, Colorado 80112-3924. Each Officer serves for an indefinite term or until his or her resignation, retirement, death or removal. | |
Laton Spahr, Vice President (since 2013) Year of Birth: 1975 | Senior Vice President of the Sub-Adviser since March 2013. Senior portfolio manager (2003-2013) and equity analyst (2001-2002) for Columbia Management Investment Advisers, LLC. | |
48 OPPENHEIMER MID CAP VALUE FUND
Eric Hewitt, Vice President (since 2013) Year of Birth: 1971 | Senior Portfolio Manager of the Sub-Adviser (since January 2017); Vice President of the Sub-Adviser (since March 2013). Product Manager for Columbia Management Investment Advisors, LLC (2012–2013); Senior Equity Analyst and Portfolio Manager with Diamondback/Harbor Watch Capital Management, LLC (2009–2012); Senior Equity Analyst and Portfolio Manager with AllianceBernstein LP (1999–2009). | |
Cynthia Lo Bessette, Secretary and Chief Legal Officer (since 2016) Year of Birth: 1969 | Executive Vice President, General Counsel and Secretary of OFI Global Asset Management, Inc. (since February 2016); Senior Vice President and Deputy General Counsel of OFI Global Asset Management, Inc. (March 2015-February 2016); Chief Legal Officer of OppenheimerFunds, Inc. and OppenheimerFunds Distributor, Inc. (since February 2016); Vice President, General Counsel and Secretary of Oppenheimer Acquisition Corp. (since February 2016); General Counsel of OFI SteelPath, Inc., OFI Advisors, LLC and Index Management Solutions, LLC (since February 2016); Chief Legal Officer of OFI Global Institutional, Inc., HarbourView Asset Management Corporation, OFI Global Trust Company, Oppenheimer Real Asset Management, Inc., OFI Private Investments Inc., Shareholder Services, Inc. and Trinity Investment Management Corporation (since February 2016); Corporate Counsel (February 2012-March 2015) and Deputy Chief Legal Officer (April 2013-March 2015) of Jennison Associates LLC; Assistant General Counsel (April 2008-September 2009) and Deputy General Counsel (October 2009-February 2012) of Lord Abbett & Co. LLC. | |
Jennifer Foxson, Vice President and Chief Business Officer (since 2014) Year of Birth: 1969 | Senior Vice President of OppenheimerFunds Distributor, Inc. (since June 2014); Vice President of OppenheimerFunds Distributor, Inc. (April 2006-June 2014); Vice President of OppenheimerFunds, Inc. (January 1998-March 2006); Assistant Vice President of OppenheimerFunds, Inc. (October 1991-December 1998). | |
Mary Ann Picciotto, Chief Compliance Officer and Chief Anti-Money Laundering Officer (since 2014) Year of Birth: 1973 | Senior Vice President and Chief Compliance Officer of OFI Global Asset Management, Inc. (since March 2014); Chief Compliance Officer of OppenheimerFunds, Inc., OFI SteelPath, Inc., OFI Global Institutional, Inc., Oppenheimer Real Asset Management, Inc., OFI Private Investments Inc., Harborview Asset Management Corporation, Trinity Investment Management Corporation, and Shareholder Services, Inc. (since March 2014); Managing Director of Morgan Stanley Investment Management Inc. and certain of its various affiliated entities; Chief Compliance Officer of various Morgan Stanley Funds (May 2010-January 2014); Chief Compliance Officer of Morgan Stanley Investment Management Inc. (April 2007-January 2014). | |
Brian S. Petersen, Treasurer and Principal Financial & Accounting Officer (since 2016) Year of Birth: 1970 | Senior Vice President of OFI Global Asset Management, Inc. (since January 2017); Vice President of OFI Global Asset Management, Inc. (January 2013-January 2017); Vice President of OppenheimerFunds, Inc. (February 2007-December 2012); Assistant Vice President of OppenheimerFunds, Inc. (August 2002-2007). | |
The Fund’s Statement of Additional Information contains additional information about the Fund’s Trustees and Officers and is available without charge upon request, by calling 1.800. CALL OPP (225.5677).
49 OPPENHEIMER MID CAP VALUE FUND
OPPENHEIMER MID CAP VALUE FUND
| Manager | OFI Global Asset Management, Inc. | |
| Sub-Adviser | OppenheimerFunds, Inc. | |
| Distributor | OppenheimerFunds Distributor, Inc. | |
| Transfer and Shareholder Servicing Agent | OFI Global Asset Management, Inc. | |
| Sub-Transfer Agent | Shareholder Services, Inc. DBA OppenheimerFunds Services | |
| Independent Registered Public Accounting Firm | KPMG LLP | |
| Legal Counsel | Kramer Levin Naftalis & Frankel LLP | |
© 2018 OppenheimerFunds, Inc. All rights reserved.
50 OPPENHEIMER MID CAP VALUE FUND
As an Oppenheimer fund shareholder, you are entitled to know how we protect your personal information and how we limit its disclosure.
Information Sources
We obtain non-public personal information about our shareholders from the following sources:
| ● | Applications or other forms. |
| ● | When you create a user ID and password for online account access. |
| ● | When you enroll in eDocs Direct,SM our electronic document delivery service. |
| ● | Your transactions with us, our affiliates or others. |
| ● | Technologies on our website, including: “cookies” and web beacons, which are used to collect data on the pages you visit and the features you use. |
If you visit oppenheimerfunds.com and do not log on to the secure account information areas, we do not obtain any personal information about you. When you do log on to a secure area, we do obtain your user ID and password to identify you. We also use this information to provide you with products and services you have requested, to inform you about products and services that you may be interested in and assist you in other ways.
We do not collect personal information through our website unless you willingly provide it to us, either directly by email or in those areas of the website that request information. In order to update your personal information (including your mailing address, email address and phone number) you must first log on and visit your user profile.
If you have set your browser to warn you before accepting cookies, you will receive the warning message with each cookie. You can refuse cookies by turning them off in your browser. However, doing so may limit your access to certain sections of our website.
We use cookies to help us improve and manage our website. For example, cookies help us recognize new versus repeat visitors to the site, track the pages visited, and enable some special features on the website. This data helps us provide better service for our website visitors.
Protection of Information
We do not disclose any non-public personal information (such as names on a customer list) about current or former customers to anyone, except as permitted by law.
Disclosure of Information
Copies of confirmations, account statements and other documents reporting activity in your fund accounts are made available to your financial advisor (as designated by you). We may also use details about you and your investments to help us, our financial service affiliates, or firms that jointly market their financial products and services with ours, to better serve your investment needs or suggest educational material that may be of interest to you. If this requires us to provide you with an opportunity to “opt in” or “opt out” of such information sharing with a firm not affiliated with us, you will receive notification on how to do so, before any such sharing takes place.
Right of Refusal
We will not disclose your personal information to unaffiliated third parties (except as permitted by law), unless we first offer you a reasonable opportunity to refuse or “opt out” of such disclosure.
51 OPPENHEIMER MID CAP VALUE FUND
PRIVACY NOTICE Continued
Internet Security and Encryption
In general, the email services provided by our website are encrypted and provide a secure and private means of communication with us. To protect your own privacy, confidential and/ or personal information should only be communicated via email when you are advised that you are using a secure website.
As a security measure, we do not include personal or account information in non-secure emails, and we advise you not to send such information to us in non-secure emails. Instead, you may take advantage of the secure features of our website to encrypt your email correspondence. To do this, you will need to use a browser that supports Secure Sockets Layer (SSL) protocol.
| ● | All transactions conducted via our websites, including redemptions, exchanges and purchases, are secured by the highest encryption standards available. SSL is used to establish a secure connection between your PC and OppenheimerFunds’ server. It transmits information in an encrypted and scrambled format. |
| ● | Encryption is achieved through an electronic scrambling technology that uses a “key” to code and then decode the data. Encryption acts like the cable converter box you may have on your television set. It scrambles data with a secret code so that no one can make sense of it while it is being transmitted. When the data reaches its destination, the same software unscrambles the data. |
| ● | You can exit the secure area by closing your browser or, for added security, you can use the Log Out button before you close your browser. |
Other Security Measures
We maintain physical, electronic and procedural safeguards to protect your personal account information. Our employees and agents have access to that information only so that they may offer you products or provide services, for example, when responding to your account questions.
How You Can Help
You can also do your part to keep your account information private and to prevent unauthorized transactions. If you obtain a user ID and password for your account, safeguard that information. Strengthening your online credentials–your online security profile–typically your user name, password, and security questions and answers, can be one of your most important lines of defense on the Internet. For additional information on how you can help prevent identity theft, visit https://www. oppenheimerfunds.com/security.
Who We Are
This joint notice describes the privacy policies of the Oppenheimer funds, OppenheimerFunds, Inc., each of its investment adviser subsidiaries, OppenheimerFunds Distributor, Inc. and OFI Global Trust Co. It applies to all Oppenheimer fund accounts you presently have, or may open in the future, using your Social Security number—whether or not you remain a shareholder of our funds. This notice was last updated as of November 2017. In the event it is updated or changed, we will post an updated notice on our website at oppenheimerfunds.com. If you have any questions about this privacy policy, email us by clicking on the Contact Us section of our website at oppenheimerfunds.com, write to us at P.O. Box 5270, Denver, CO 80217-5270, or call us at 800 CALL OPP (225 5677).
52 OPPENHEIMER MID CAP VALUE FUND
THIS PAGE INTENTIONALLY LEFT BLANK.
53 OPPENHEIMER MID CAP VALUE FUND
THIS PAGE INTENTIONALLY LEFT BLANK.
54 OPPENHEIMER MID CAP VALUE FUND
THIS PAGE INTENTIONALLY LEFT BLANK.
55 OPPENHEIMER MID CAP VALUE FUND
 | ||||||
| Visit us at oppenheimerfunds.com for 24-hr access to account information and transactions or call us at 800.CALL OPP (800.225.5677) for 24-hr automated information and automated transactions. Representatives also available Mon–Fri 8am-8pm ET. | ||||||
Visit Us oppenheimerfunds.com | ||||||
Call Us 800 225 5677 | ||||||
| Follow Us | ||||||
 | Oppenheimer funds are distributed by OppenheimerFunds Distributor, Inc. 225 Liberty Street, New York, NY 10281-1008 © 2018 OppenheimerFunds Distributor, Inc. All rights reserved.
RA0251.001.1018 December 21, 2018 | |||||
Item 2. Code of Ethics.
The registrant has adopted a code of ethics that applies to the registrant’s principal executive officer, principal financial officer, principal accounting officer or controller or persons performing similar functions.
Item 3. Audit Committee Financial Expert.
The Board of Trustees of the registrant has determined that Joanne Pace, the Board’s Audit Committee Chairwoman, is an audit committee financial expert and that Ms. Pace is “independent” for purposes of this Item 3.
Item 4. Principal Accountant Fees and Services.
| (a) | Audit Fees |
The principal accountant for the audit of the registrant’s annual financial statements billed $187,500 in fiscal 2018 and $179,700 in fiscal 2017.
| (b) | Audit-Related Fees |
The principal accountant for the audit of the registrant’s annual financial statements billed $10,500 in fiscal 2018 and $15,500 in fiscal 2017.
The principal accountant for the audit of the registrant’s annual financial statements billed $297,836 in fiscal 2018 and $386,986 in fiscal 2017 to the registrant’s investment adviser or any entity controlling, controlled by, or under common control with the adviser that provides ongoing services to the registrant.
Such services include: Internal control reviews, GIPS attestation procedures, incremental and additional audit services
| (c) | Tax Fees |
The principal accountant for the audit of the registrant’s annual financial statements billed $46,800 in fiscal 2018 and $33,000 in fiscal 2017.
The principal accountant for the audit of the registrant’s annual financial statements billed $534,826 in fiscal 2018 and $286,402 in fiscal 2017 to the registrant’s investment adviser or any entity controlling, controlled by, or under common control with the adviser that provides ongoing services to the registrant.
Such services include: tax compliance, tax planning and tax advice. Tax compliance generally involves preparation of original and amended tax returns, claims for a refund and tax payment-planning services. Tax planning and tax advice includes assistance with tax audits and appeals,
tax advice related to mergers and acquisitions and requests for rulings or technical advice from taxing authorities.
| (d) | All Other Fees |
The principal accountant for the audit of the registrant’s annual financial statements billed no such fees in fiscal 2018 and no such fees in fiscal 2017.
The principal accountant for the audit of the registrant’s annual financial statements billed no such fees in fiscal 2018 and no such fees in fiscal 2017 to the registrant’s investment adviser or any entity controlling, controlled by, or under common control with the adviser that provides ongoing services to the registrant.
Such fees would include the cost to the principal accountant of attending audit committee meetings and consultations regarding the registrant’s retirement plan with respect to its Trustees.
| (e) | (1) During its regularly scheduled periodic meetings, the registrant’s audit committee will pre-approve all audit, audit-related, tax and other services to be provided by the principal accountants of the registrant. |
The audit committee has delegated pre-approval authority to its Chairwoman for any subsequent new engagements that arise between regularly scheduled meeting dates provided that any fees such pre-approved are presented to the audit committee at its next regularly scheduled meeting.
Under applicable laws, pre-approval of non-audit services may be waived provided that: 1) the aggregate amount of all such services provided constitutes no more than five percent of the total amount of fees paid by the registrant to its principal accountant during the fiscal year in which services are provided 2) such services were not recognized by the registrant at the time of engagement as non-audit services and 3) such services are promptly brought to the attention of the audit committee of the registrant and approved prior to the completion of the audit.
(2) 0%
| (f) | Not applicable as less than 50%. |
| (g) | The principal accountant for the audit of the registrant’s annual financial statements billed $889,962 in fiscal 2018 and $721,888 in fiscal 2017 to the registrant and the registrant’s investment adviser or any entity controlling, controlled by, or under common control with the adviser that provides ongoing services to the registrant related to non-audit fees. Those billings did not include any prohibited non-audit services as defined by the Securities Exchange Act of 1934. |
| (h) | The registrant’s audit committee of the board of Trustees has considered whether the provision of non-audit services that were rendered to the registrant’s investment adviser, |
and any entity controlling, controlled by, or under common control with the investment adviser that provides ongoing services to the registrant that were not pre-approved pursuant to paragraph (c)(7)(ii) of Rule 2-01 of Regulation S-X is compatible with maintaining the principal accountant’s independence. No such services were rendered. |
Item 5. Audit Committee of Listed Registrants
Not applicable.
Item 6. Schedule of Investments.
a) Not applicable. The complete schedule of investments is included in Item 1 of this Form N-CSR.
b) Not applicable.
Item 7. Disclosure of Proxy Voting Policies and Procedures for Closed-End Management Investment Companies.
Not applicable.
Item 8. Portfolio Managers of Closed-End Management Investment Companies.
Not applicable.
Item 9. Purchases of Equity Securities by Closed-End Management Investment Company and Affiliated Purchasers.
Not applicable.
Item 10. Submission of Matters to a Vote of Security Holders.
The Fund’s Governance Committee Provisions with Respect to Nominations of Directors/Trustees to the Respective Boards
None
Item 11. Controls and Procedures.
Based on their evaluation of the registrant’s disclosure controls and procedures (as defined in rule 30a-3(c) under the Investment Company Act of 1940 (17 CFR 270.30a-3(c)) as of 10/31/2018, the registrant’s principal executive officer and principal financial officer found the registrant’s disclosure controls and procedures to provide reasonable assurances that information required to be disclosed by the registrant in the reports that it files under the Securities Exchange Act of 1934 (a) is accumulated and communicated to registrant’s management, including its principal executive officer and principal financial officer, to allow timely decisions regarding required disclosure, and (b) is recorded, processed, summarized and reported, within the time periods specified in the rules and forms adopted by the U.S. Securities and Exchange Commission.
There have been no changes in the registrant’s internal controls over financial reporting that occurred during the registrant’s second fiscal quarter of the period covered by this report that have materially affected, or are reasonably likely to materially affect, the registrant’s internal control over financial reporting.
Item 12. Disclosure of Securities Lending Activities for Closed-End Management Investment Companies.
Not applicable.
Item 13. Exhibits.
| (a) | (1) Exhibit attached hereto. |
(2) Exhibits attached hereto. |
SIGNATURES
Pursuant to the requirements of the Securities Exchange Act of 1934 and the Investment Company Act of 1940, the registrant has duly caused this report to be signed on its behalf by the undersigned, thereunto duly authorized.
| Oppenheimer Quest for Value Funds | ||
| By: | /s/ Arthur P. Steinmetz | |
| Arthur P. Steinmetz | ||
| Principal Executive Officer | ||
| Date: | 12/21/2018 | |
Pursuant to the requirements of the Securities Exchange Act of 1934 and the Investment Company Act of 1940, this report has been signed below by the following persons on behalf of the registrant and in the capacities and on the dates indicated.
| By: | /s/ Arthur P. Steinmetz | |
| Arthur P. Steinmetz | ||
| Principal Executive Officer | ||
| Date: | 12/21/2018 |
| By: | /s/ Brian S. Petersen | |
| Brian S. Petersen | ||
| Principal Financial Officer | ||
| Date: | 12/21/2018 |